Longitudinal analysis of gray and white matter loss in patients with systemic lupus erythematosus
8
Longitudinal analysis of gray and white matter loss in patients with systemic lupus erythematosus Simone Appenzeller, a,b Leonardo Bonilha, c Pablo A. Rio, b Li Min Li, b,d Lilan Tereza Lavras Costallat, a and Fernando Cendes b,d, ⁎ a Rheumatology Unit, State University of Campinas, Brazil b Neuroimaging Laboratory, State University of Campinas, Brazil c Departments of Neuropsychiatry and Communication Sciences and Disorders University of South Carolina, USA d Department of Neurology, State University of Campinas, Brazil Received 18 May 2006; revised 22 September 2006; accepted 25 September 2006 Cerebral atrophy has been described to occur in systemic lupus erythematosus (SLE) with variable frequency. The aim of this study was to determine white and gray matter abnormalities in brain magnetic resonance imaging (MRI) of patients with SLE and to determine if these abnormalities progress over a one-year period. Seventy-five patients with SLE and 44 healthy age and sex-matched controls were enrolled in this study. T1-weighted volumetric images were used for voxel based morphometry (VBM) analyses. SLE patients exhibited a significant reduction in white matter and gray matter volume compared to controls (p = 0.001). Follow-up images, after an average interval of 19 months, revealed a progressive white matter and gray matter atrophy (p = 0.001). Reduced white and gray matter volume was associated with disease duration and the presence of antiphospholipid antibodies. Patients with severe cognitive impairment had a more pronounced white and gray matter reduction than patients with moderate cognitive impairment. Total corticosteroid dose was associated with gray matter reduction and not with white matter loss in SLE patients. We concluded that brain tissue loss associated with SLE is significant and progresses over a relatively short period of time. Disease duration, the presence of antiphospholipid antibodies and cognitive impairment were associated with white and gray matter loss. Corticosteroid was associated only with gray matter atrophy. © 2006 Elsevier Inc. All rights reserved. Keywords: White matter; Gray matter; VBM; SLE; MRI Introduction Systemic lupus erythematosus (SLE) is a chronic inflamma- tory, immune-mediated disease with diverse clinical manifesta- tions (Feinglass et al., 1976; Denburg and Denburg, 2003; Adelmann et al., 1986), affecting 0.1% of general population. Central nervous system (CNS) involvement in SLE has been more frequently recognized and reported in recent years, occurring in up to 50% of the patients during the disease course (Waterloo et al., 1999; Omdal et al., 1989; Weisberg, 1986; Carette et al., 1982; Sibbitt et al., 1989; Cotton et al., 2004; Csepany et al., 2003; Zanardi et al., 2001). Neuropsychiatric symptoms vary from overt neurologic and psychiatric disorders to more subtle signs and symptoms such as headache, mood disorders and impairment of cognitive function (Feinglass et al., 1976; Adelmann et al., 1986; Omdal et al., 1989). Although clinical assessment is still the cornerstone of the diagnosis of neuropsychiatric SLE, the diagnosis is often difficult and remains presumptive in some patients (Feinglass et al., 1976; Adelmann et al., 1986; Omdal et al., 1989). Several methods, including computer tomography (CT) (Water- loo et al., 1999; Omdal et al., 1989; Weisberg, 1986; Carette et al., 1982) and magnetic resonance imaging (MRI) (Sibbitt et al., 1989; Cotton et al., 2004; Csepany et al., 2003; Zanardi et al., 2001; Appenzeller et al., 2005), have been applied to analyze structural abnormalities and cerebral atrophy in SLE. MRI is known to be more sensitive and accurate than CT for the detection of anatomic brain abnormalities in patients with neuropsychiatric SLE (Sibbitt et al., 1989; Huizinga et al., 2001). Cerebral atrophy has been described to occur in SLE with variable frequency (Waterloo et al., 1999; Omdal et al., 1989; Weisberg, 1986; Carette et al., 1982; Sibbitt et al., 1989; Cotton et al., 2004; Csepany et al., 2003; Zanardi et al., 2001, Hachulla et al., 1998; Chinn et al., 1997; Baum et al., 1993), but its exact cause remains unclear. For instance, brain pathology in SLE may be due to axonal damage secondary to axonal injury. Axonal injury is associated with neuronal dystrophy through both anterograde and retrograde changes. Altogether, direct cortical pathology or cortical neuronal changes related to white matter pathology can contribute to the brain atrophy in SLE, as previously described in MS www.elsevier.com/locate/ynimg NeuroImage 34 (2007) 694 – 701 ⁎ Corresponding author. Department of Neurology, State University of Campinas (UNICAMP), Cidade Universitária Zeferino Vaz, CEP 13083970 Campinas-SP-Brazil. Fax: +55 1937887483. E-mail address: [email protected] (F. Cendes). Available online on ScienceDirect (www.sciencedirect.com). 1053-8119/$ - see front matter © 2006 Elsevier Inc. All rights reserved. doi:10.1016/j.neuroimage.2006.09.029
-
Upload
independent -
Category
Documents
-
view
2 -
download
0
Transcript of Longitudinal analysis of gray and white matter loss in patients with systemic lupus erythematosus

www.elsevier.com/locate/ynimg
NeuroImage 34 (2007) 694–701Longitudinal analysis of gray and white matter loss in patients withsystemic lupus erythematosus
Simone Appenzeller,a,b Leonardo Bonilha,c Pablo A. Rio,b Li Min Li,b,d
Lilan Tereza Lavras Costallat,a and Fernando Cendesb,d,⁎
aRheumatology Unit, State University of Campinas, BrazilbNeuroimaging Laboratory, State University of Campinas, BrazilcDepartments of Neuropsychiatry and Communication Sciences and Disorders University of South Carolina, USAdDepartment of Neurology, State University of Campinas, Brazil
Received 18 May 2006; revised 22 September 2006; accepted 25 September 2006
Cerebral atrophy has been described to occur in systemic lupuserythematosus (SLE) with variable frequency. The aim of this studywas to determine white and gray matter abnormalities in brainmagnetic resonance imaging (MRI) of patients with SLE and todetermine if these abnormalities progress over a one-year period.Seventy-five patients with SLE and 44 healthy age and sex-matchedcontrols were enrolled in this study. T1-weighted volumetric imageswere used for voxel based morphometry (VBM) analyses. SLE patientsexhibited a significant reduction in white matter and gray mattervolume compared to controls (p=0.001). Follow-up images, after anaverage interval of 19 months, revealed a progressive white matter andgray matter atrophy (p=0.001). Reduced white and gray mattervolume was associated with disease duration and the presence ofantiphospholipid antibodies. Patients with severe cognitive impairmenthad a more pronounced white and gray matter reduction than patientswith moderate cognitive impairment. Total corticosteroid dose wasassociated with gray matter reduction and not with white matter loss inSLE patients. We concluded that brain tissue loss associated with SLEis significant and progresses over a relatively short period of time.Disease duration, the presence of antiphospholipid antibodies andcognitive impairment were associated with white and gray matter loss.Corticosteroid was associated only with gray matter atrophy.© 2006 Elsevier Inc. All rights reserved.
Keywords: White matter; Gray matter; VBM; SLE; MRI
Introduction
Systemic lupus erythematosus (SLE) is a chronic inflamma-tory, immune-mediated disease with diverse clinical manifesta-
⁎ Corresponding author. Department of Neurology, State University ofCampinas (UNICAMP), Cidade Universitária Zeferino Vaz, CEP 13083970Campinas-SP-Brazil. Fax: +55 1937887483.
E-mail address: [email protected] (F. Cendes).Available online on ScienceDirect (www.sciencedirect.com).
1053-8119/$ - see front matter © 2006 Elsevier Inc. All rights reserved.doi:10.1016/j.neuroimage.2006.09.029
tions (Feinglass et al., 1976; Denburg and Denburg, 2003;Adelmann et al., 1986), affecting 0.1% of general population.Central nervous system (CNS) involvement in SLE has beenmore frequently recognized and reported in recent years,occurring in up to 50% of the patients during the disease course(Waterloo et al., 1999; Omdal et al., 1989; Weisberg, 1986;Carette et al., 1982; Sibbitt et al., 1989; Cotton et al., 2004;Csepany et al., 2003; Zanardi et al., 2001). Neuropsychiatricsymptoms vary from overt neurologic and psychiatric disorders tomore subtle signs and symptoms such as headache, mooddisorders and impairment of cognitive function (Feinglass et al.,1976; Adelmann et al., 1986; Omdal et al., 1989). Althoughclinical assessment is still the cornerstone of the diagnosis ofneuropsychiatric SLE, the diagnosis is often difficult and remainspresumptive in some patients (Feinglass et al., 1976; Adelmann etal., 1986; Omdal et al., 1989).
Several methods, including computer tomography (CT) (Water-loo et al., 1999; Omdal et al., 1989; Weisberg, 1986; Carette et al.,1982) and magnetic resonance imaging (MRI) (Sibbitt et al., 1989;Cotton et al., 2004; Csepany et al., 2003; Zanardi et al., 2001;Appenzeller et al., 2005), have been applied to analyze structuralabnormalities and cerebral atrophy in SLE. MRI is known to bemore sensitive and accurate than CT for the detection of anatomicbrain abnormalities in patients with neuropsychiatric SLE (Sibbittet al., 1989; Huizinga et al., 2001).
Cerebral atrophy has been described to occur in SLE withvariable frequency (Waterloo et al., 1999; Omdal et al., 1989;Weisberg, 1986; Carette et al., 1982; Sibbitt et al., 1989; Cotton etal., 2004; Csepany et al., 2003; Zanardi et al., 2001, Hachulla et al.,1998; Chinn et al., 1997; Baum et al., 1993), but its exact causeremains unclear. For instance, brain pathology in SLE may be dueto axonal damage secondary to axonal injury. Axonal injury isassociated with neuronal dystrophy through both anterograde andretrograde changes. Altogether, direct cortical pathology or corticalneuronal changes related to white matter pathology can contributeto the brain atrophy in SLE, as previously described in MS

695S. Appenzeller et al. / NeuroImage 34 (2007) 694–701
(Losseff et al., 1996; Evangelou et al., 2000; Bjartmar and Trapp,2001).
Several studies have analyzed the frequency of cerebral atrophyin SLE (Waterloo et al., 1999; Omdal et al., 1989; Weisberg, 1986;Carette et al., 1982; Sibbitt et al., 1989; Cotton et al., 2004;Csepany et al., 2003; Zanardi et al., 2001; Hachulla et al., 1998;Chinn et al., 1997; Baum et al., 1993). In a previous study(Appenzeller et al., 2005), we have shown that there is a differentpattern of white matter atrophy when compared to whole brainatrophy, including different clinical implications. Measurements ofbrain volume are sensitive to both neuronal and axonal loss. Totaland regional brain atrophy can be accurately assessed fromconventional T1-weighted images by means of computationalmethods allowing automatic or semiautomatic measurements ofcerebral volumes (Losseff et al., 1996; Rudick et al., 1999; Fox etal., 2000; Smith et al., 2002). Voxel-based morphometry (VBM) isan automated method used for characterizing regional cerebralvolume and tissue volumes differences in structural MRI(Ashburner and Friston, 1997, 2000; Ashburner et al., 2001;Friston et al., 1995; Genovese et al., 2002).
The purpose of this study is to investigate abnormalities involume of white and gray matter in SLE patients using VBM. Wealso aim to determine clinical factors associated with SLE that maycontribute to regional and white matter atrophy. Furthermore, weaim to investigate, using a longitudinal design, if there is asignificant progression of regional brain abnormalities in SLE.
Methods
Patients
Eighty-nine consecutive patients with SLE, with four or morecriteria for SLE (Tan et al., 1982), seen regularly at ourRheumatology Unit, were screened prospectively to participatein the study. All SLE patients were followed using a standardizedprotocol and followed by the same investigators in theRheumatology Unit (LTLC, SA). We excluded patients that werenot able to undergo MRI, such as patients with claustrophobia (2patients) and pacemaker (1 patients), as well as patients withprevious clinical conditions that could influence cerebral atrophy,such as history of stroke (2 patients), arterial hypertension (2patients), diabetes mellitus (1 patients), alcohol and drug abuse (0patient) and malignancy (0 patient). Patients who fulfilled theAmerican College of Rheumatology (ACR) criteria for rheuma-toid arthritis, systemic sclerosis, Sjögren syndrome (primary orsecondary) (8 patients, 6 associated with other exclusion criteria)or other connective tissue disease and with drug-induced SLEwere also excluded. There were no patients with renalinsufficiency, or other pathologies that could influence cerebralatrophy. The remaining 79 patients (71 women) were included inthis study.
We used the classification proposed by the ACR to analyzeneuropsychiatric involvement (ACR, 1999). We consideredsolemnly primary central nervous system (CNS) involvement.
Controls
The control group consisted of 44 healthy controls with nohistory of neurological or psychiatric illness. They were recruitedfrom local community and had similar age and gender distributionthan the patients' group.
All patients and controls agreed in participate in the study andsigned a written informed consent form, approved by our localethics committee.
Clinical, serologic and treatment features of SLE patients
Data on gender, age at disease onset and disease duration werecollected for each patient. Disease duration was defined as theinitial manifestation clearly attributable to SLE until the day ofMRI acquisition. All clinical manifestations and laboratory testfindings were recorded according to the ACR criteria (Tan et al.,1982). CNS manifestations were recorded following ACR casedefinitions (ACR, 1999) and divided into present (active or pasthistory of CNS involvement) or absent (never presented CNSinvolvement). A complete neurological examination, as well ascognitive and psychiatric charts, was prospectively applied to allpatients in order to identify CNS involvement. Mini Mental StateExamination (Folstein et al., 1975) was applied to all participants.
All patients and controls were submitted to a battery ofstandardized neuropsychological tests in order to screen forpossible impairment in one or more of the subsequent cognitivedomains: simple attention, complex attention, memory, visuospa-tial processing, language, reasoning/problem solving, psychomotorspeed and executive functions (Spranoel, 1992; Wechsler, 1986;Dellis et al., 1987; Lezak, 1995). The individual test results wereconverted into standard scores, which were compared with theavailable normative data (Spranoel, 1992; Wechsler, 1986; Dellis etal., 1987; Lezak, 1995). Regarding any of the eight cognitivedomains, subjects with a total score of two or more standarddeviations (SD) below the normative value were considered to beimpaired. Cognitive dysfunction was classified as mild if therewere deficits in less than three dimensions, as moderate if therewere deficits in three or four dimensions and as severe if there weredeficits in at least five dimensions (Heaton et al., 1993).
Assessment of depression was based on clinical interview andthe Beck Depression Inventory (BDI) (Beck and Beamesderfer,1993; Beck et al., 1974). On BDI, scores from 10 to 17 wereconsidered to indicate mild depression, from 18 to 24 moderatedepression and greater than 24 severe depression. Anxiety wasevaluated by anxiety through the Hospital Anxiety and DepressionScale (Herrmann, 1997). The presence of psychosis wasdetermined through the Brief Psychiatry Rating Scale (BPRS)(Overall and Beller, 1984).
We reviewed the medical charts of patients to determine pasthistory of CNS involvement.
Disease activity was measured by systemic lupus diseaseactivity index (SLEDAI) and considered active with scores higherthan eight (Bombardier et al., 1992). Cumulative SLE-relateddamage was determined by Systemic Lupus International Colla-borating Clinics/American College of Rheumatology DamageIndex (SLICC/ACR DI) (Gladman et al., 1997) in all SLE patientsat time of MRI.
Total dose of corticosteroids and other immunosuppressantmedications used since the onset of disease were calculated by dataobtained by careful review of the medical charts. Four patients withincomplete charts were excluded from the analysis. Doses of oraland parenteral corticosteroids were analyzed and the dosesconverted to the equivalent doses of prednisone to homogenizethe data. The cumulative dose of corticosteroids used wascalculated by the sum of daily dosages versus time (days) oftreatment. Therefore, 75 patients (70 women) were eligible for this
696 S. Appenzeller et al. / NeuroImage 34 (2007) 694–701
study. MRIs were repeated in these 75 patients after a mean follow-up time of a minimum of 12 months.
Structural MRI scanning protocol
MRI was performed on a 2-T scanner (Elscint Prestige). Avolumetric structural MRI was acquired on each subject using aT1-weighted gradient-echo sequence, with slice thickness of 1 mm(TR=22 ms, TE=9 ms, flip angle=35°, matrix=256×22).
Data pre-processing and analysis
Data were analyzed using SPM 2 (http://www.fil.ion.ucl.ac.uk/spm/). Before processing, all the structural images were checkedfor artifacts, and when present, these images were excluded.Images were then transformed from Dicom to analyze format usingMRIcro (http://www.mricro.com). VBM of MRI data involvesseveral fully automated pre-processing steps, including spatialnormalization of all images to the same stereotactic space,segmentation into white and gray matter and cerebrospinal fluidcompartments, correction for volume changes induced by spatialnormalization (modulation) and smoothing. Spatial normalizationwas performed by matching the individual's image to a standardtemplate by estimating the optimum 12-parameter affine transfor-mation (Smith et al., 2002; Ashburner and Friston, 2000) to correctfor global brain shape differences (Ashburner and Friston, 1997).The spatially normalized images were then partitioned into graymatter (GM), white matter (WM) and cerebrospinal fluid (CSF) byusing segmentation in-built SPM2 routines. Images were modu-lated to correct for spatial deformation induced by spacednormalization (Good et al., 2001). Segmented white and graymatter modulated images were smoothed with a 10-mm full widthat half maximum (FWHM) Isotropic Gaussian Kernel, renderingthe data more normally distributed.
VBM statistical analysis
We used T1-weighted images composed of 1 mm isotropicvoxels, acquired in a 2-T scanner (Elscint Prestige®) with a spoiledgradient-echo sequence (GRE) (TR=22 ms, TE=9 ms, flipangle=35°, matrix=256×220). Images underwent optimizedVBM analysis that was performed using SPM2 (http://www.fil.ion.ucl.ac.uk).
DICOM images were transformed into ANALYZE formatusing MRIcro (Rorden and Brett, 2000). We created a T1 templatein the standard MNI stereotaxic space from the images of ourcontrol group. Prior maps of gray matter, white matter and CSFwere also generated from our sample of controls. The prior imagesand the template were convolved with an Isotropic GaussianKernel (IGK) of 8 mm, which were used for optimizing the non-linear normalization. We decided to employ a custom homemadetemplate based on our own population of controls in order toimprove normalization and tissues segmentation. A template basedon our control population better represents the contrast from ourimages, compared to the contrast present in the MNI 152 braintemplate. It is also more authentic to represent the non-uniformitiesin image intensity and inhomogeneities in B0 field crated by ourscanner. Finally, a template from our controls also better representsthe demographics of our population.
Spatial normalization was performed using 16 non-lineariterations and a 25-mm cutoff. Spatially normalized images were
“modulated” in order to preserve the total amount of signal in theimages (Good et al., 2001). Hence, areas that are expanded duringwarping are correspondingly reduced in intensity.
Spatially normalized images were re-sliced to an isotropic1 mm voxel size. Images underwent segmentation to estimate theprobability of each voxel being gray matter, white matter or CSFof gray and white matter using SPM2's built-in routines. Imageswere then convolved with an Isotropic Gaussian Kernel (IGK) of10 mm in order to minimize gyral inter-individual variability.Smoothing renders grey matter concentration normally distributed,enabling the application of standard statistical parametric mappingtechniques.
Normalized, segmented and smoothed images were submittedto voxel-wise statistical analyses. We investigated differences ingray and white matter volume between patients controls. We havealso investigated the relationship between clinical and neuropsy-chological variables and the regional gray and white matter.Statistical voxel-wise analyses were performed in SPM2. Contrastswere defined in order to estimate the probability of each voxelbeing gray matter. This analysis included proportional thresholdmasking (set to 0.8) and implicit masking. The results from theanalysis are given in a parametric map of t-statistic (SPM(t)), andthe SPMt is corrected for normal distribution (SPM(z)). Voxel-wiseanalyses were corrected for multiple comparisons through falsediscovery rate threshold (Genovese et al., 2002). Statisticalthreshold was set at p<0.05.
Stereotaxic coordinates were visually confirmed and furtherre-assessed using the Talairach Daemon client (http://www.ric.uthscsa.edu/projects/talairachdaemon.html).
Results
Demographic data
Seventy-five patients with SLE with mean age of 32.3 years(range 18–60 years, SD=12.5) met inclusion and exclusion criteriaand were included in the analysis. Seventy patients were womenand 5 were men. The control group consisted of 44 healthyvolunteers (40 women) with mean age 33.8 (range 18–63,SD=13.7 years).
Clinical, laboratory and treatment features
The disease duration ranged between 1 and 340 months [mean64.5 (SD=53.5)]. Active SLE disease at the time of MRI scan wasobserved in 36 of 75 (48%) patients with mean SLEDAI score of15.3 (range 9–24; SD=8.3). At the dates of MRI, all patients wereon steroid use. Antiphospholipid antibodies were positive in 28patients. Seventy-eight episodes of CNS manifestations wereobserved in 36 patients. Active CNS disease at the time of MRIscan was observed in 15 of 36 patients with CNS involvement.Mean SLICC/ACR DI scores were 2.0 (range 0–7; SD=2.1).
White and gray matter abnormalities
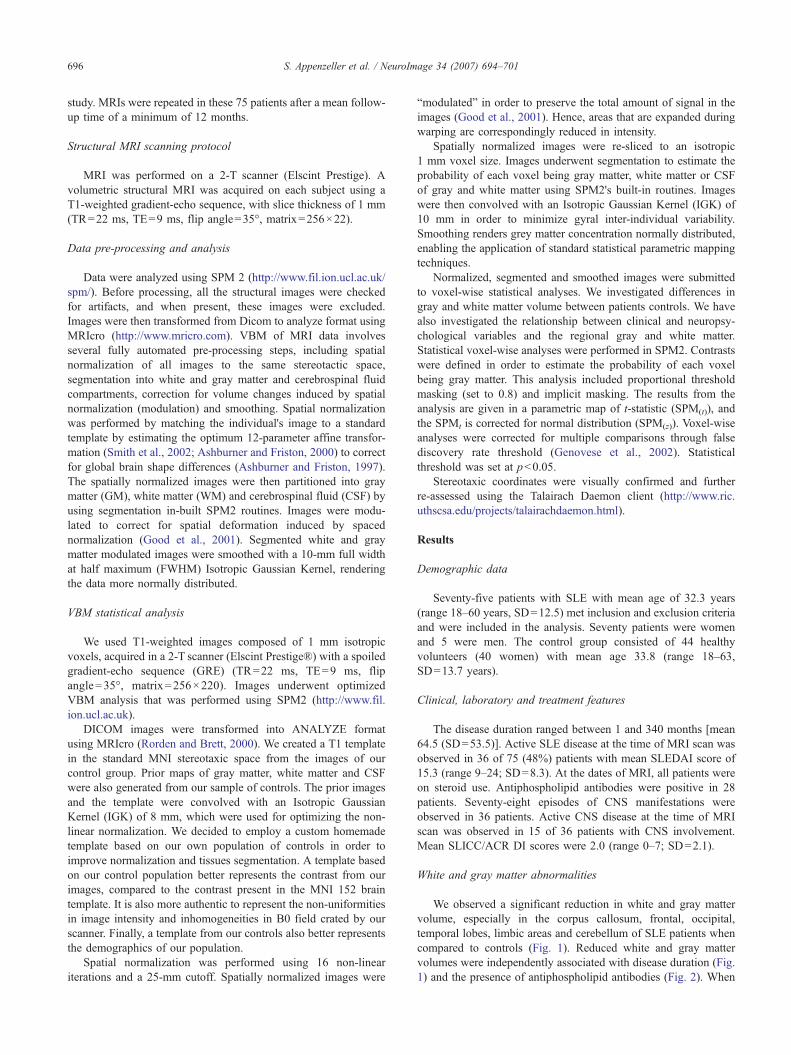
We observed a significant reduction in white and gray mattervolume, especially in the corpus callosum, frontal, occipital,temporal lobes, limbic areas and cerebellum of SLE patients whencompared to controls (Fig. 1). Reduced white and gray mattervolumes were independently associated with disease duration (Fig.1) and the presence of antiphospholipid antibodies (Fig. 2). When
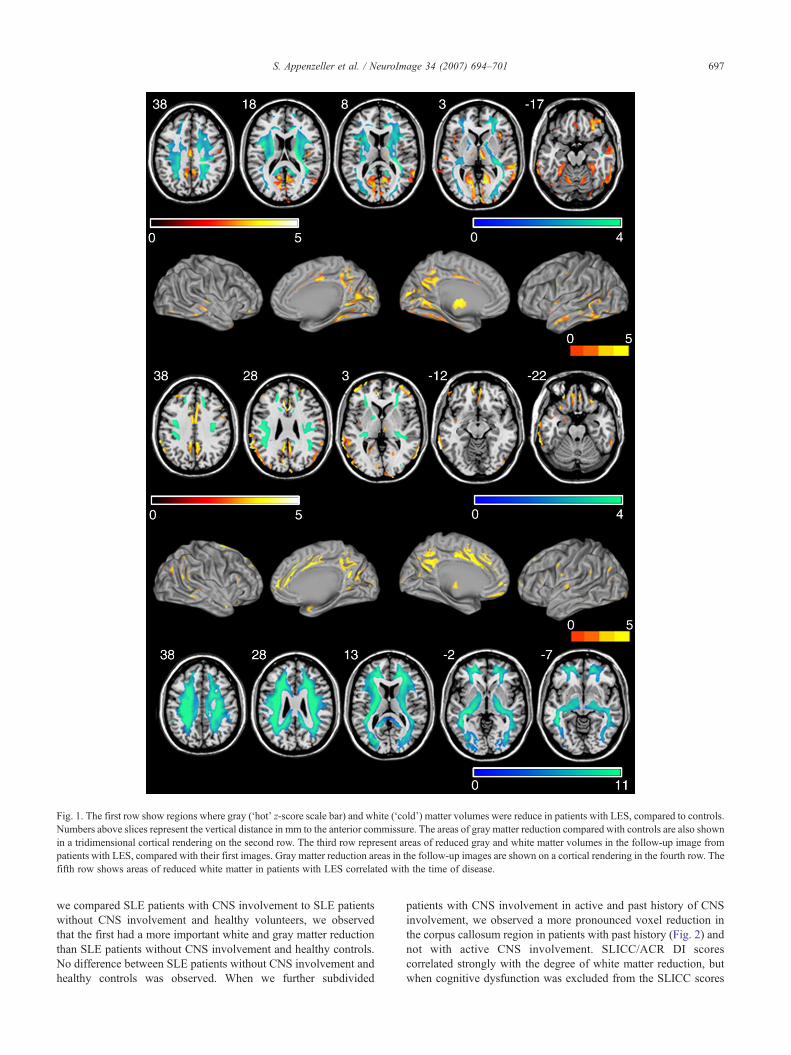
Fig. 1. The first row show regions where gray (‘hot’ z-score scale bar) and white (‘cold’) matter volumes were reduce in patients with LES, compared to controls.Numbers above slices represent the vertical distance in mm to the anterior commissure. The areas of gray matter reduction compared with controls are also shownin a tridimensional cortical rendering on the second row. The third row represent areas of reduced gray and white matter volumes in the follow-up image frompatients with LES, compared with their first images. Gray matter reduction areas in the follow-up images are shown on a cortical rendering in the fourth row. Thefifth row shows areas of reduced white matter in patients with LES correlated with the time of disease.
697S. Appenzeller et al. / NeuroImage 34 (2007) 694–701
we compared SLE patients with CNS involvement to SLE patientswithout CNS involvement and healthy volunteers, we observedthat the first had a more important white and gray matter reductionthan SLE patients without CNS involvement and healthy controls.No difference between SLE patients without CNS involvement andhealthy controls was observed. When we further subdivided
patients with CNS involvement in active and past history of CNSinvolvement, we observed a more pronounced voxel reduction inthe corpus callosum region in patients with past history (Fig. 2) andnot with active CNS involvement. SLICC/ACR DI scorescorrelated strongly with the degree of white matter reduction, butwhen cognitive dysfunction was excluded from the SLICC scores

Fig. 2. The first row show regions where gray (‘hot’ z-score scale bar) and white (‘cold’) matter volumes were more reduced in patients with LES and severecognitive disturbance. Numbers above slices represent the vertical distance in mm to the anterior commissure. These areas of gray matter reduction are alsoshown in a tridimensional cortical rendering on the second row. The third and fourth rows demonstrate regions where gray matter volume was more reduced inpatients with LES with history of central nervous system disease and severe cognitive disturbance. The fifth and sixth rows show regions where gray and whitematter volumes were more reduced in patients with LES who tested positive for antiphospholipid antibodies.
698 S. Appenzeller et al. / NeuroImage 34 (2007) 694–701
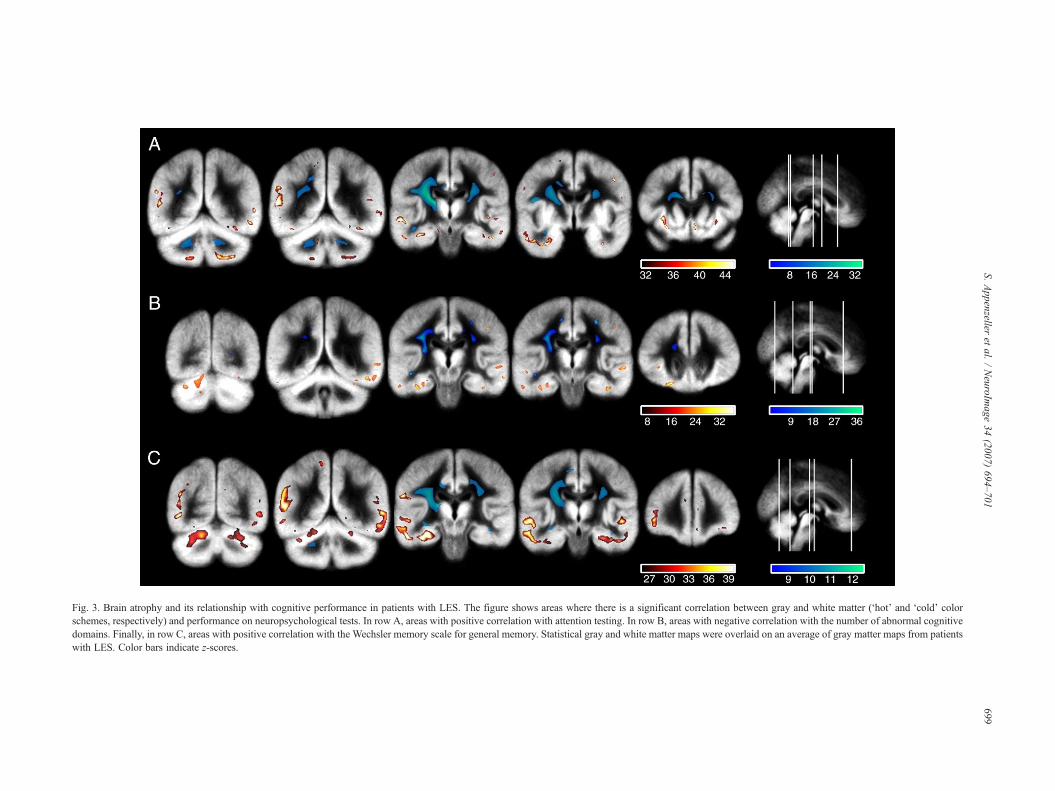
Fig. 3. Brain atrophy and its relationship with cognitive performance in patients with LES. The figure shows areas where there is a significant correla between gray and white matter (‘hot’ and ‘cold’ colorschemes, respectively) and performance on neuropsychological tests. In row A, areas with positive correlation with attention testing. In row B, areas with ative correlation with the number of abnormal cognitivedomains. Finally, in row C, areas with positive correlation with the Wechsler memory scale for general memory. Statistical gray and white matter maps we verlaid on an average of gray matter maps from patientswith LES. Color bars indicate z-scores.
699S.
Appenzeller
etal.
/NeuroIm
age34
(2007)694–701
tionnegre o

700 S. Appenzeller et al. / NeuroImage 34 (2007) 694–701
no difference in white and gray matter reduction of SLE patientswas observed. Patients with severe cognitive impairment had amore pronounced white and gray matter reduction than patientswith moderate and no cognitive impairment (Fig. 2). We alsoobserved a negative correlation between white and gray matterreduction and the number of cognitive domains impaired (Fig. 3);therefore, the number of domains was associated with the intensityand the extent of gray and white matter atrophy observed. The z-scores of general memory correlated positively with the extent ofatrophy, especially of medial temporal lobe structures and frontallobes (Fig. 3). When we analyzed attention, we also observed apositive correlation between the test results and atrophy, especiallyin parietal lobes (Fig. 3). These findings were more pronounced inpatients with longer disease duration, suggesting that diseaseduration independently of other clinical variables, influences whiteand gray matter reduction and may therefore worsen cognitiveimpairment.
Total corticosteroid dose was associated with gray matterreduction and not with white matter loss in SLE patients.
No relation to disease activity and other clinical or laboratorymanifestations was observed. We also did not observe anassociation between age and white matter volume in patients andcontrols.
Follow-up study
MRI were repeated after a mean follow-up time of 19 months(SD=1.2; range 12–24 months) in all patients included in thisstudy. Analyzing the first and second MRI scan of SLE patients,we observed a significant reduction in white matter, especially inthe frontal and posterior part of the corpus callosum (p=0.001).When we analyzed gray matter, we observed a more widespreadreduction in gray matter in the frontal, dorsolateral and medialtemporal lobe (Fig. 1).
Discussion
In agreement with several studies (Waterloo et al., 1999; Omdalet al., 1989; Weisberg, 1986; Carette et al., 1982; Sibbitt et al.,1989; Cotton et al., 2004; Csepany et al., 2003; Zanardi et al.,2001, Hachulla et al., 1998; Chinn et al., 1997; Baum et al., 1993,Appenzeller et al., 2005), we found cerebral atrophy in patientswith SLE when compared to healthy volunteers with similar andgender distribution. We observed that this atrophy was related toboth white and gray matter atrophy.
MRI of healthy elderly adults frequently reveals corpus callosumatrophy (Black et al., 2000; Hampel et al., 1998; Janowsky et al.,1996). The largest numbers of neurons projected into corpuscallosum are those found in the large pyramidal cells of corticallayers III–IV of the contralateral hemisphere (Leys et al., 1991).Cerebral ischemia may result in damage to neurons in layer III (Leyset al., 1991), thus leading to Wallerian degeneration of the corpuscallosum. Therefore, corpus callosum atrophy may be considered amarker of neuronal loss (Yamanoushi et al., 1993). In our study, amore pronounced white matter reduction was observed in the corpuscallosum and frontal cortex in patients with CNS involvement ofSLE. This finding can be explained by locally producedinflammatory mediators may cause axonal injury. Furthermore,we demonstrated that atrophy is progressive in follow-up MRIs.
We also observed a substantial reduction of gray matter inSLE patients when compared to controls. Gray matter atrophy
was widespread and more diffuse that white matter loss. Graymatter atrophy was significant in the frontal, dorsolateral andmedial temporal lobe regions. In addition, gray matter loss wasassociated with disease duration, number of CNS manifestationsand total corticosteroid dose. Longitudinally, gray matter atrophyin these areas was also progressive and associated withcumulative corticosteroid dose.
When we analyzed the presence of cognitive impairment, weobserve that patients with severe cognitive involvement had agreater white and gray matter reduction than patients withmoderate and no cognitive impairment. The number of cognitivedomains correlated negatively with the severity of white and graymatter atrophy, as well as individual test results of general memoryand attention that correlated positively with white and gray matterreduction.
Although we observed that the severity of cognitive impairmentand the individual test results correlated with the severity andextent of white and gray matter atrophy, we hypothesize that thesefindings are consequence of atrophy. Considering the pathology ofSLE, disease duration, the presence of antiphospholipid antibodies,total corticosteroid dose and the past history of CNS involvementmay via a direct mechanism or autoantibodies induce cerebraldamage, which will lead to cerebral atrophy. Cognitive impairmentmay therefore be the clinical expression of this atrophy.
We previously demonstrated corpus callosum and cerebralatrophy in SLE patients using a semi-automated method(Appenzeller et al., 2005). In this present study using VBM, weconfirm our previous findings, but we also demonstrated that thepattern of white and gray matter in patients with SLE is associatedwith different clinical profiles and varies in intensity acrosspatients.
The observation that cerebral atrophy is not uniform in all SLEpatients and that some cerebral structure may be more affectedthan others may help determining the etiology of CNSinvolvement in SLE. We determined that brain tissue lossassociated with SLE is not only significant but progresses overa relatively short period of time. The fact that some clinicalvariables associated with SLE further increase brain atrophy canhelp elucidate the mechanisms underlying brain damage in SLE.In particular, the understanding of which mechanisms areprimarily involved with brain atrophy may dictate emphasis ontheir clinical control.
References
ACR Ad Hoc Committee on Neuropsychiatric Lupus, 1999. TheAmerican College of Rheumatology nomenclature and casedefinitions for neuropsychiatric lupus syndromes. Arthritis Rheum.42, 599–608.
Adelmann, D.C., Saltiel, E., Klinenberg, J.R., 1986. The neuropsychiatricmanifestations of SLE: an overview. Semin. Arthr. Rheum. 15,185–199.
Appenzeller, S., Rondina, J.M., Li, L.M., Costallat, L.T., Cendes, F., 2005.Cerebral and corpus callosum atrophy in systemic lupus erythematosus.Arthritis Rheum. 52, 2783–2789.
Ashburner, J., Friston, K.J., 1997. Voxel-based morphometry—The method.NeuroImage 11, 805–821.
Ashburner, J., Friston, K.J., 2000. Multimodal image coregistration andpartitioning—A unified framework. NeuroImage 6, 209–217.
Ashburner, J., Neelin, P., Collins, D.L., Evans, A.C., Friston, K., 2001.Incorporating prior knowledge into imaging registration. NeuroImage344–352.

701S. Appenzeller et al. / NeuroImage 34 (2007) 694–701
Baum, K.A., Hopf, U., Nehrig, C., Stover, M., Schorner, W., 1993. Systemiclupus erythematosus: neuropsychiatric signs and symptoms related tocerebral MRI findings. Clin. Neurol. Neurosurg. 95, 29–34.
Beck, A.T., Beamesderfer, A., 1993. Assessment of depression: thedepression inventory. Mod. Probl. Pharmacopsychiatry 7, 151–169.
Beck, A.T., Rial, W.Y., Rickels, K., 1974. Short form of depressioninventory: cross-validation. Psychol. Rep. 34, 1184–1186.
Bjartmar, C., Trapp, B.D., 2001. Axonal and neuronal degeneration inmultiple sclerosis: mechanism and functional consequences. Curr. Opin.Neurol. 14, 271–278.
Black, S.E., Moffat, S.D., Yu, D.C., et al., 2000. Callosal atrophy correlateswith temporal lobe volume and mental status in Alzheimer's disease.Can. J. Neurol. Sci. 27, 204–209.
Bombardier, C., Gladman, D.D., Urowitz, M., Caron, D., Chang, C., 1992.Derivation of the SLEDAI: a disease activity index for lupus patients.Arthritis Rheum. 35, 630–640.
Carette, S., Urowitz, M.B., Grosman, H., St Louis, E.L., 1982.Cranial computerized tomography in systemic lupus erythematosus.J. Rheumatol. 9, 855–859.
Chinn, R.J., Wilkinson, I.D., Hall-Craggs, M.A., et al., 1997. Magneticresonance imaging of the brain and cerebral proton spectroscopy inpatients with systemic lupus erythematosus. Arthritis Rheum. 40, 36–46.
Cotton, F., Bouffard-Vercelli, J., Hermier, M., et al., 2004. MRI of centralnervous system in a series of 58 systemic lupus erythematosus (SLE)patients with or without overt neuropsychiatric manifestations. Rev.Med. Interne 25, 8–15.
Csepany, T., Bereczki, D., Kollar, J., et al., 2003. MRI findings in centralnervous system systemic lupus erythematosus are associated withimmunoserological parameters and hypertension. J. Neurol. 250,1348–1354.
Delis, D.C., Kramer, J.H., Kaplan, E., et al., 1987. California VerbalLearning Test Research Edition Manual. The PsychologicalCorporation, San Antonio.
Denburg, S.D., Denburg, J.A., 2003. Cognitive dysfunction andantiphospholipid antibodies in systemic lupus erythematosus. Lupus12, 883–890.
Evangelou, N., Esiri, M.M., Smith, S., Palace, J., Matthews, P.M., 2000.Quantitative pathological evidence for axonal loss in normal appearingwhite matter in multiple sclerosis. Ann. Neurol. 47, 391–395.
Feinglass, E.J., Arnett, F.C., Dorsh, C.A., Zizic, T.M., Stevens, M.B., 1976.Neuropsychiatric manifestations of systemic lupus erythematosus:diagnosis, clinical spectrum and relationship to the other features ofthe disease. Medicine 55, 323–339.
Folstein, M.F., Folstein, S.E., Folstein, P.R., 1975. “Mini mental state”: apractical method for grading the cognitive state of patient for theclinician. J. Psychiatr. Res. 12, 189–198.
Fox, N.C., Jenkins, R., Leary, S.M., Stevenson, V.L., et al., 2000.Progressive cerebral atrophy in MS: a serial study using registered,volumetric MRI. Neurology 54, 807–812.
Friston, K.J., Holmes, A.P., Worsley, K.P., et al., 1995. Statistical parametricmaps in functional imaging: a general linear approach. Hum. BrainMapp. 2, 189–210.
Genovese, C.R., Lazar, N.A., Nichols, T., 2002. Thresholding of statisticalmaps in functional neuroimaging using the false discovery rate.NeuroImage 15, 870–878.
Gladman, D.D., Urowitz, M.B., Goldsmith, C.H., et al., 1997. The reliabilityof the Systemic Lupus International Collaborating Clinics/AmericanCollege of Rheumatology Damage Index in patients with systemic lupuserythematosus. Arthritis Rheum. 40, 809–813.
Good, C.D., Johnsrude, I.S., Ashburner, J., 2001. A voxel-basedmorphometric study of ageing in 465 normal adult human brains.NeuroImage 14, 21–36.
Hachulla, E., Michon-Pasturel, U., Leys, D., Pruvo, J.P., 1998. Cerebralmagnetic resonance imaging in patients with or without antiphospholipidantibodies. Lupus 7, 24–31.
Hampel, H., Teipel, S.J., Alexander, G.E., et al., 1998. Corpus callosumatrophy is a possible indicator of region-and cell type-specific neuronaldegeneration in Alzheimer disease: a magnetic resonance imaginganalysis. Arch. Neurol. 55, 193–198.
Heaton, R.K., Chelune, G.J., Talley, J.L., et al., 1993. Wisconsin CardSorting Test Manual, Revised and Expanded. Psychological AssessmentResources, Inc., Odessa.
Herrmann, C., 1997. International experiences with the Hospital Anxietyand Depression Scale—A review of validation data and clinical results.J. Psychosom. Res. 42, 17–41.
Huizinga, T.W., Steens, S.C., van Buchem, M.A., 2001. Imaging modalitiesin central nervous system systemic lupus erythematosus. Curr. Opin.Rheumatol. 13, 383–388.
Janowsky, J.S., Kaye, J.A., Carper, R.A., 1996. Atrophy of the corpuscallosum in Alzheimer's disease versus healthy aging. J. Am. Geriatr.Soc. 44, 798–803.
Leys, D., Pruvo, J.P., Parent, M., et al., 1991. Could Walleriandegeneration contribute to “leuko-araiosis” in subjects free of anyvascular disorder? J. Neurol., Neurosurg. Psychiatry 54, 46–50.
Lezak, M.D., 1995. Neuropsychological Assessment. Oxford Univ. Press,New York.
Losseff, N.A., Wang, L., Lai, H.M., et al., 1996. Progressive cerebralatrophy in multiple sclerosis. A serial MRI study. Brain 119,2009–2019.
Omdal, R., Selseth, B., Klow, N.E., Husby, G., Mellgren, S.I., 1989.Clinical neurological, electrophysiological, and cerebral CT scanfindings in systemic lupus erythematosus. Scand. J. Rheumatol. 18,283–289.
Overall, J.E., Beller, S.A., 1984. The Brief Psychiatric Rating Scale(BPRS) in geropsychiatric research: I. Factor structure on an inpatientunit. J. Gerontol. 39, 187–193.
Rorden, C., Brett, M., 2000. Stereotaxic display of brain lesions. Behav.Neurol. 12, 191–200.
Rudick, R.A., Fischer, E., Lee, J.C., Simon, J., Jacobs, L., 1999. Use of thebrain parenchymal fraction to measure whole brain atrophy in relapsing-remitting MS. Neurology 53, 1698–1704.
Sibbitt, Jr. W.L., Sibbitt, R.R., Griffey, R.H., Eckel, C., Bankhurst, A.D.,1989. Magnetic resonance and computed tomographic imaging in theevaluation of acute neuropsychiatric disease in systemic lupuserythematosus. Ann. Rheum. Dis. 48, 1014–1022.
Smith, S.M., Zhang, Y., Jenkinson, M., et al., 2002. Accurate, robust andautomated longitudinal and cross-sectional brain changes analysis.NeuroImage 17, 479–489.
Spranoel, H.Z., 1992. The Psychoeducational Use and Interpretation ofthe Wechsler Adult Intelligence Scale—Revised. CC Thomas,Springfield.
Tan, E.M., Cohen, A.S., Fries, J.F., et al., 1982. The 1982 revised criteria forthe classification of systemic lupus erythematosus. Arthritis Rheum. 25,1271–1277.
Waterloo, K., Omdal, R., Jacobsen, E.A., Klow, N.E., Husby, G.,Torbergsen, T., et al., 1999. Cerebral computed tomography andelectroencephalography compared with neuropsychological findingsin systemic lupus erythematosus. J. Neurol. 246, 706–711.
Wechsler, 1986. Muistiasteikko, Suom. Anja Manner. PsykologienKustannus, Helsinki.
Weisberg, L.A., 1986. The cranial computed tomographic findings in patientswith neurologic manifestations of systemic lupus erythematosus.Comput. Radiol. 10, 63–68.
Yamanoushi, H., Fukuyama, H., Harada, K., et al., 1993. Callosalatrophy parallels decreased cortical oxygen metabolism andneuropsychological impairment in Alzheimer's disease. Arch.Neurol. 50, 1070–1074.
Zanardi, V.A., Magna, L.A., Costallat, L.T., 2001. Cerebral atrophy relatedto corticotherapy in systemic lupus erythematosus (SLE). Clin.Rheumatol. 20, 245–250.