
Long-run performance of IPO-Switzerland-2005
24
Schmalenbach Business Review w Vol. 57 w July 2005 w pp. 253 – 275 sbr 57 (3/2005) 253 Wolfgang Drobetz/Matthias Kammermann/Urs Wälchli* LONG-RUN PERFORMANCE OF INITIAL PUBLIC OFFERINGS: THE EVIDENCE FOR SWITZERLAND** ABSTRACT We estimate the underpricing and long-run performance of Swiss initial public offer- ings (IPOs) from 1983 to 2000. The average market adjusted initial return is 34.97%. To examine the long-run performance of Swiss IPOs, we compute buy-and-hold abnormal returns, skewness-adjusted wealth ratios, and cumulative abnormal returns using 120 months of secondary market returns. In contrast to previous findings for the U.S. and Germany, we do not find strong evidence for a distinct IPO effect. We attribute long-run underperformance to the fact that IPO firms tend to be small firms. It virtually vanishes when we use a small capitalization index as a benchmark. In spite of distinct economic implications and statistical properties, our basic results are similar for all performance measures applied. JEL-Classification: G12, G14, G24. Keywords: Initial Public Offerings; Long-Run Stock Performance; Market Efficiency; Swiss Stock Market; Underpricing. 1 INTRODUCTION A large number of studies examine the performance of initial public offerings (IPOs). However, although there is a growing empirical literature for countries outside the U.S., most studies still analyze U.S. data. The typical patterns doc- umented in these studies are underpricing and long-run underperformance. For example, using U.S. data from 1980 to 2001, Welch and Ritter (2002) report that at the end of the first day of trading, the stocks of the average IPO trade at 18.6% above the price at which the company sold them. Nevertheless, over three years, the average IPO underperforms the CRSP value-weighted index by 23.4%. * Wolfgang Drobetz, Department of Corporate Finance, Wirtschaftswissenschaftliches Zentrum (WWZ), University of Basel, Petersgraben 51, 4003 Basel, Switzerland, Phone: +41-61-260 12 62, e- mail: [email protected]. Matthias Kammermann, XL Insurance, Mythenquai 10, P.O. Box 3032, 8022 Zurich, Switzerland, e-mail: [email protected]. Urs Wälchli, Institute of Financial Management, University of Bern, Engehaldenstrasse 4, 3012 Bern, Switzerland, Phone: +41-31-631 34 78, e-mail: [email protected]. ** We thank two anonymous referees, Wolfgang Ballwieser (the editor), Stefan Beiner, Dusan Isakov, Claudio Loderer, Heinz Zimmermann and the participants of the 2003 Annual Conference of the Swiss Society of Economics and Statistics in Bern for valuable comments. Financial support from the National Center of Competence in Research “Financial Valuation and Risk Management” (NCCR FINRISK) is gratefully acknowledged. The NCCR FINRISK is a research program supported by the Swiss National Science Foundation.
-
Upload
independent -
Category
Documents
-
view
0 -
download
0
Transcript of Long-run performance of IPO-Switzerland-2005
Schmalenbach Business Review w Vol. 57 w July 2005 w pp. 253 – 275
sbr 57 (3/2005) 253
Wolfgang Drobetz/Matthias Kammermann/Urs Wälchli*
LONG-RUN PERFORMANCE OF INITIAL PUBLIC OFFERINGS: THE EVIDENCE FOR SWITZERLAND**
ABSTRACT
We estimate the underpricing and long-run performance of Swiss initial public offer-ings (IPOs) from 1983 to 2000. The average market adjusted initial return is 34.97%. To examine the long-run performance of Swiss IPOs, we compute buy-and-hold abnormal returns, skewness-adjusted wealth ratios, and cumulative abnormal returns using 120 months of secondary market returns. In contrast to previous findings for the U.S. and Germany, we do not find strong evidence for a distinct IPO effect. We attribute long-run underperformance to the fact that IPO firms tend to be small firms. It virtually vanishes when we use a small capitalization index as a benchmark. In spite of distinct economic implications and statistical properties, our basic results are similar for all performance measures applied.
JEL-Classification: G12, G14, G24.
Keywords: Initial Public Offerings; Long-Run Stock Performance; Market Efficiency; Swiss Stock Market; Underpricing.
1 INTRODUCTION
A large number of studies examine the performance of initial public offerings (IPOs). However, although there is a growing empirical literature for countries outside the U.S., most studies still analyze U.S. data. The typical patterns doc-umented in these studies are underpricing and long-run underperformance. For example, using U.S. data from 1980 to 2001, Welch and Ritter (2002) report that at the end of the first day of trading, the stocks of the average IPO trade at 18.6% above the price at which the company sold them. Nevertheless, over three years, the average IPO underperforms the CRSP value-weighted index by 23.4%.
* Wolfgang Drobetz, Department of Corporate Finance, Wirtschaftswissenschaftliches Zentrum (WWZ), University of Basel, Petersgraben 51, 4003 Basel, Switzerland, Phone: +41-61-260 12 62, e-mail: [email protected]. Matthias Kammermann, XL Insurance, Mythenquai 10, P.O. Box 3032, 8022 Zurich, Switzerland, e-mail: [email protected]. Urs Wälchli, Institute of Financial Management, University of Bern, Engehaldenstrasse 4, 3012 Bern, Switzerland, Phone: +41-31-631 34 78, e-mail: [email protected].
** We thank two anonymous referees, Wolfgang Ballwieser (the editor), Stefan Beiner, Dusan Isakov, Claudio Loderer, Heinz Zimmermann and the participants of the 2003 Annual Conference of the Swiss Society of Economics and Statistics in Bern for valuable comments. Financial support from the National Center of Competence in Research “Financial Valuation and Risk Management” (NCCR FINRISK) is gratefully acknowledged. The NCCR FINRISK is a research program supported by the Swiss National Science Foundation.

W. Drobetz/M. Kammermann/U. Wälchli
254 sbr 57 (3/2005)
In this paper we present fresh evidence for the Swiss IPO market. Similar to pre-vious studies, we document that there is significant short-run underpricing. How-ever, in contrast to the U.S. evidence, this initial underpricing persists for quite a long time. If there is any evidence at all for underperformance, Swiss IPOs show poor returns only in the very long-run. Our results are even more pronounced than those in Stehle, Erhardt, and Przyborowsky (2000), who report that the underperformance of German IPOs is also much smaller than previous estimates for the U.S. market.
Ritter (2003) claims that little academic research focuses on valuation issues of IPOs, and that most studies only look at first-day returns. In this paper we fol-low the standard approach to measure long-run returns, which can be interpreted as changes in valuation over time 1. We use secondary market returns for Swiss IPOs up to 120 months and examine whether these firms were valued appropri-ately at the time of issue. In fact, long-run performance studies require large sam-ples over long time periods if they are to find statistically significant abnormal per-formance. The problem of separating out bad luck from ex ante overvaluation if subsequent returns are low is further complicated by the phenomenon that IPOs tend to go public in waves. Although our sample is relatively small, our long time-series of secondary market returns for Swiss IPOs allows us to shed light on valu-ation issues in a major market outside the U.S.
Empirical evidence for the Swiss stock market is generally scarce. Bill (1991) finds significant underpricing for a sample of 53 Swiss IPOs during the period from 1983 to 1989. He reports an average first-day initial return of 56.8%. Using 42 IPOs over the same period, Kunz and Aggarwal (1994) also report significant underpric-ing. In contrast to previous findings for the U.S., they find no evidence for long-run underperformance for up to three years in the aftermarket. More recently, Schuster (2001) and Giudici and Roosenboom (2002) include limited samples of Swiss IPOs in extensive studies of pan-European IPOs. Schuster (2001) also finds that his sample of 973 European IPOs did not underperform in the long-run.
In this paper we show that there is initial underpricing for Swiss IPOs, and we also present comprehensive results on the long-run performance of Swiss IPOs 2. We also shed light on the difficulties of measuring long-run abnormal returns from an asset pricing standpoint, as described in Fama (1998), Mitchell and Stafford (2000), and Loughran and Ritter (2000). Most importantly, we measure second-ary market returns up to 120 months of trading after going public. This is a much longer sample period than is usually applied in the literature, but at the same time makes statistical inference even more challenging. In the light of extreme skewness and severe ‘bad-model’ problems, we report buy-and-hold abnormal returns (BHARs) as well as skewness-adjusted wealth relatives (WRs). Gompers and Lerner (2003) report divergent long-run performance results depending on the empirical methodology applied. Therefore, to double-check our results, we
1 An alternative approach to valuation is to examine the level of firm valuation directly, using discounted cash flows or comparable firm multiples (e.g., see Knauff, Roosenboom, and van der Goot, 2003).
2 In a companion paper Drobetz, Kammermann, and Wälchli (2003) examine five possible hypotheses for underpricing. Following the classification in Schuster (2001), two of the theories assume a passive role of the underwriter (winner’s curse and signaling), and the other three theories consider an active role of the underwriter (cycles in IPO activity, underwriter reputation, and investment banker’s monopsony power).

Long-Run Performance
sbr 57 (3/2005) 255
also compute cumulative abnormal returns (CARs) and run intercept tests using time series regressions. Although all these methodologies have distinct economic implications and statistical properties, our basic results remain unchanged.
Our analysis also strongly supports the proposition by Dimson and Marsh (1986) that the size effect can lead to significant distortions in long-run performance mea-sures. Although the underperformance of Swiss IPOs is large, albeit statistically insignificant, when we use a broad value-weighted market index, it virtually van-ishes when a small capitalization index is applied. This result is consistent with Brav and Gompers (1997) and Brav, Geczy, and Gompers (2000), who report that IPO firms have returns that are comparable to similar, non-issuing (small) size and (low) book-to-market firms. They argue that the stock returns following IPOs reflect more systematic return patterns in the broader set of traded companies. We adopt their interpretation, but we also argue that the long-run performance of Swiss IPOs may be driven by the specific sample characteristics. For example, our sample consists of several large carve-outs in growing industries (e.g., Clariant and Syngenta) with substantial positive long-run abnormal returns.
The remainder of this paper is organized as follows. Section 2 contains a data description of our sample of Swiss IPOs and documents the short-run underpric-ing. Section 3 contains an in-depth analysis of the long-run performance of Swiss IPOs up to 120 months in the aftermarket. Section 4 concludes.
2 DATA DESCRIPTION AND INITIAL RETURNS
Our sample targets all Swiss IPOs from 1983 to 2000. Because of their special pur-pose as investment vehicles, we exclude investment companies, which concen-trate on specific sectors and themes (e.g., venture capital and hedge funds). For the 1983 to 1989 period we combine the data from Mettler (1990), Bill (1991), and Kunz (1991). We obtain the data for 1990 to 1993 from Thommen (1996), and the data for 1994 to 2000 from the various publications of Bank Vontobel. From this sample of 150 IPOs we exclude 31 firms due to insufficient data or other firm-spe-cific reasons. One firm, Kardex AG, issued both bearer shares and participation notes in their IPO. Hence, it shows up twice in our sample. This results in a final data set of 120 new issues for our analysis of short-run performance. To exam-ine the long-run performance of Swiss IPOs, we exclude another 11 firms due to a lack of reliable secondary market return data, reducing our sample to 109 new issues.
Our sample contains all the 17 firms listed on the SWX New Market. Our exten-sive data set allows us to analyse the long-run performance on secondary mar-kets up to ten years. Since our sample starts as early as 1983, we examine the long-run performance over both IPO waves since then 3. Finally, we are careful to avoid potential biases in measuring long-run returns. To avoid any survivorship bias, we include in our sample the five IPO firms that go bankrupt during the 120 months aftermarket period. In all cases we assume that investors suffer a complete loss of their claims. In addition, 11 firms were delisted due to mergers or acquisi-
3 The first IPO wave was from 1985 to 1988, and the second one from 1995 to 2000. The record year was 1986, when the Swiss stock market experienced 32 IPOs.
W. Drobetz/M. Kammermann/U. Wälchli
256 sbr 57 (3/2005)
tions during the sample period. In the case of a cash offer, we assume that share-holders invest their proceeds in the respective benchmark index. If a firm offers an exchange of shares, we assume that shareholders accept the offer and become shareholders in the new venture 4.
Taken together, the 120 issues bring to the market shares worth 32bn Swiss francs. In contrast, the combined value at the end of the first trading day is 36.1bn Swiss francs. Hence, issuing firms leave roughly 4.1bn Swiss francs on the table. The issuing size varies strongly across the sample. The smallest IPO is Intersport Hold-ing AG, with an issuing volume of merely 5.66m Swiss francs. In contrast, the issu-ing volume of Swisscom is 8.6bn Swiss francs, accounting for almost 25% of the total sample IPO volume. The four largest IPOs have an issuing volume of 17.2bn Swiss francs, which accounts for more than 50% of all IPOs.
Following previous research, our initial return period covers the first day of trad-ing, i.e., it relates the first closing price to the offering price of an issue. We cal-culate benchmark-adjusted returns as the raw return on a stock minus the bench-mark return over the first day of trading. We use daily returns on the Swiss total market index provided by Datastream as the benchmark. The underlying trading strategy is ex ante implementable and follows a simple rule: Each IPO is bought at the offering price and sold at the closing price of the first trading day. Because there is no ex ante information about a specific weighting scheme, the initial returns are equally weighted, i.e., the same amount of money is invested in every IPO.
Table 1 shows the distribution of initial returns for Swiss IPOs 5. Benchmark-adjusted initial returns range from -7.81% to +287.85%, and they exhibit strong positive skewness. To measure whether abnormal initial returns are statistically significant, it is therefore inappropriate to apply a simple t-statistic. Barber and Lyon (1997) document that positive skewness leads to negatively biased t-statis-tics. We apply the skewness-adjusted t-statistic suggested by Johnson (1978). In addition, Lyon, Barber, and Tsai (1999) argue that only a bootstrapped application of this skewness-adjusted test statistic is well specified. We follow their approach and report the adjusted t-statistics on the basis of the distribution of bootstrapped resamples. Alternatively, we also present the results of a nonparametric sign test. In this case, the null hypothesis is that the number of observed positive initial returns equals the number of negative returns.
Column (1) in table 1 shows that the mean market-adjusted initial return over the whole sample period from 1983 to 2000 is 34.97%. Both the skew-adjusted t-test and the nonparametric sign test indicate that it is highly significant. Thus, a trading strategy that invests a fixed amount in each IPO to be sold at the end of the first day of trading earns a significant positive return. Since we have no data on the actual allocations, we cannot determine whether the average investor can actually
4 Four firms abolished the duality between their bearer and registered shares and introduced unitary shares. In these cases we link the series of historical share prices with that of the new unitary share.
5 For previous German evidence on the underpricing phenomenon see Schmidt et al. (1988); Uhlir (1989); Göppl and Saurer (1990); Kaserer and Kempf (1995) and Ljungqvist (1994, 1997), among others.

Long-Run Performance
sbr 57 (3/2005) 257
capture this return. However, recent evidence from Amihud, Hauser, and Kirsh (2003), who use allocation-weighted returns from the Israeli IPO market, sheds doubt on this proposition. Table 1 also shows that only 13 Swiss IPOs are over-priced. All other 107 IPO stocks in our sample are underpriced. This observation is also reflected in the high significance of the sign test statistic.
Table 1: Distribution of initial returns (1983-2000)
(1) (2) (3)
1983 –2000 1983 –1990 1994 –2000
Mean 34.97% 53.61% 18.66%
Volatility 57.65% 69.14% 39.05%
tsa-value 10.23 8.32 7.12
p-value 0.000 0.000 0.000
Median 13.24% 24.57% 7.11%
z-value 8.58 6.68 5.50
p-value 0.000 0.000 0.000
# positive 107 53 54
# zeros 0 0 0
# negative 13 3 10
Minimum -7.81% -2.22% -7.81%
Maximum 287.85% 285.36% 287.85%
The tsa-value is the skewness-adjusted t-statistic suggested by Johnson (1978). We report the bootstrapped application of this test statistic, following the procedure by Lyon, Barber, and Tsai (1999). The z-value is the test statistic of a sign test; the null hypothesis is that the numbers of positive and negative initial returns are equal.
Since there were two major IPO waves on the Swiss market, we look at two sub-sample periods. The first one ranges from 1983 to 1990, and the second from 1994 to 2000. Columns (2) and (3) in table 1 show that the market-adjusted mean returns are 53.61% and 18.66%, respectively. Again, both values are highly signifi-cant.
Interestingly, the amount of underpricing is much larger during the early sam-ple years. A Wilcoxon-Mann-Whitney test delivers a p-value of zero for the null hypothesis that the median initial return is equal in both subperiods, indicating that the amount of underpricing of Swiss IPOs has become smaller over time.
3 SECONDARY MARKET PERFORMANCE
3.1 METHODOLOGICAL ISSUES
Using a large data set, Ritter (1991) presents impressive evidence for the poor long-run performance of U.S. initial public offerings. Loughran and Ritter (1995), using an even larger sample of U.S. IPOs and applying different benchmark port-folios to measure abnormal returns, come to the same result. They conclude that

W. Drobetz/M. Kammermann/U. Wälchli
258 sbr 57 (3/2005)
“investing in firms issuing stock is hazardous to your wealth”. Brav and Gompers (1997) report that the underperformance comes primarily from small, non-venture backed IPOs.
In a recent study for the long-run performance of German IPOs Stehle, Erhardt, and Przyborowsky (2000) show that size portfolios and matching stocks are bet-ter benchmarks than market portfolios. Using buy-and-hold abnormal returns and accounting for the size effect, they report a long-run underperformance for Ger-man IPOs of roughly 6% over three years. This underperformance is substan-tially smaller than the corresponding numbers found for the U.S. For example, also using buy-and-hold abnormal returns, Loughran and Ritter (1995) calculate a 26.9% underperformance against matched firms in three years.
We use several different methods to measure the long-run performance of Swiss IPOs. In all cases we apply standard event-study methods. Previous studies by Brav and Gompers (1997), Sapusek (2000), Brav, Geczy, and Gompers (2000) and Schuster (2001), among others, show that long-run IPO performance is sensitive to the benchmark used. Therefore, throughout the empirical analysis we apply two different benchmarks. We use the Swiss Performance Index (SPI), a value-weighted index that contains all quoted stocks of domestic companies 6. We also use the Vontobel Small Companies Index (VSCI), a widely recognized benchmark index for Swiss small-cap stocks throughout the industry. The VSCI comprises listed companies with market capitalizations of no more than 0.2% of total market capitalization. Due to the limited number of comparable firms we cannot apply the matching-firm and matching-portfolio technique suggested by Brav and Gom-pers (1997), among others.
Before we present our empirical results, we briefly discuss some important gen-eral issues associated with determining long-run stock performance. Fama (1998) forcefully argues that it is notoriously hard to measure long-run abnormal returns and that long-run return anomalies are sensitive to the method used. Following the terminology by De Bondt and Thaler (1985) and the more recent theoreti-cal models by Barberis, Shleifer, and Vishny (1998) and Daniel, Hirshleifer, and Subrahmanyam (1998), among others in the growing behavioral finance literature, Fama (1998) classifies the IPO ‘anomaly’ in the overreaction camp. He argues that it is safe to presume that IPOs have strong past earnings to display when they go public. If the market does not understand that earnings growth tends to mean revert, stock prices at the time of the IPO are too high. If the market gradually recognizes its mistakes, the overreaction to past earnings growth is corrected only slowly in the future.
Fama’s (1998) proposition is strengthened by his convincing evidence that, even viewed individually, most anomalies are at best weak. Most important, long-run performance studies are always contaminated by a bad-model problem, which results from the empirical observation that all models for expected returns are only incomplete descriptions of the underlying cross-sectional risk-return rela-tionship. This is a crucial problem, because market efficiency can only be tested
6 The SPI was first calculated on June 1, 1987. For the observation period prior to this date, we approximated the market index with the SBC General Total Return Index.

Long-Run Performance
sbr 57 (3/2005) 259
jointly with a model for expected returns. The bad-model problem is negligible for event studies with short observation periods, but grows with the measurement horizon. Looking at cumulative monthly abnormal returns (CARs), this effect is easy to see. A spurious abnormal average return in a single month becomes statis-tically significant in CARs measured over multiple periods because the average of the CAR grows linearly in the measurement horizon, but the standard error only grows with the square root of the measurement horizon. The problem is even more severe with long-run buy-and-hold abnormal returns (BHARs). In this case, the average abnormal return grows exponentially instead of linearly.
Barber and Lyon (1997) show that average monthly abnormal returns (CARs) and buy-and-hold abnormal returns (BHARs) can produce different inferences on the same set of data. One problem with CARs is that they do not represent an ex ante applicable investment (trading) strategy, i.e., they do not accurately measure the return to an investor who holds a security for a long post-event period. Since investor experience is important, most empirical studies report long-run buy-and-hold returns (BHARs). However, a problem with BHARs is that by compounding (multiplying) monthly returns, long-run BHARs are severely skewed. As described in section 2, Lyon, Barber, and Tsai (1999) suggest a skewness-adjusted test sta-tistic, but even then one fails to fully correct for the correlation of returns across events not absorbed by the model used to adjust for expected returns. Clearly, this problem also grows with the measurement horizon. In contrast, using CARs the mean and the variance of the time series of average abnormal returns can be used to test the average monthly price responses of event stocks in the usual way even for a long measurement period.
A final methodological issue to be considered is that CARs require monthly rebal-ancing, which may lead to an inflated long-horizon return on the reference port-folio. This effect is likely to be attributed to bid-ask bounce and nonsynchronous trading. Blume and Stambaugh (1983) refer to this as a ‘rebalancing bias’ 7.
To give a complete picture of the long-run performance of Swiss IPOs, we test a variety of different methods and compare their results. We put the emphasis on buy-and-hold abnormal returns and wealth relatives. Given that wealth relatives tend to be strongly upward biased, we compute volatility-adjusted wealth relatives using the technique proposed by Jakobson and Voetman (2001). Loughran and Ritter (1995) and Brav and Gompers (1997) do not present direct statistical infer-ences from long-run buy-and-hold returns. In this paper, using again the boot-strap procedure proposed by Lyon, Barber, and Tsai (1999), we compute skew-ness-adjusted test statistics for the null hypothesis of zero abnormal returns. To double-check the consistency of our results, we also present CARs and briefly discuss the magnitude of intercepts from simple factor model regressions. These approaches have the statistical advantage that we base our long-run inferences on monthly average returns. To avoid any biases, we exclude the initial IPO returns from the first day of trading throughout the long-run analysis.
7 See also Roll (1983) and Conrad and Kaul (1993). As of November 1998, Swiss Exchange (SWX) introduced an auction procedure to determine official closing prices. Hence, the bid-ask bounce is not a problem for this later sample period.

W. Drobetz/M. Kammermann/U. Wälchli
260 sbr 57 (3/2005)
3.2 BUY-AND-HOLD ABNORMAL RETURNS (BHARS)
In this section we examine the impact on investors’ wealth if the same amount of money is invested passively in each IPO after the first day of trading. In other words, we calculate buy-and-hold returns for the sample of IPOs and compare them with the buy-and-hold returns achieved by investing in two different bench-marks. The reasons for using equally-weighted portfolios are twofold. On the one hand, severe data limitation in the 1980s and the early 1990s makes it impos-sible to calculate value-weighted portfolios for Swiss IPOs. On the other hand, when investing according to the market capitalization after the first day of trading, the sample is dominated by very few big issuers. In fact, the ten biggest issuers account for more than two thirds of the issued capital.
We calculate the T period buy-and-hold abnormal return (BHAR) as the difference between the holding-period return of IPO i and the benchmark return:
(1) BHARi,T = ∏ t=1
T
(1+Ri,t) – ∏ t=1
T
(1+RB,t),
where Ri,t denotes the rate of return (including dividends and all other financial benefits stockholders receive) on stock i in month t after its IPO, and RB,t is the corresponding benchmark return. We interpret a positive buy-and-hold abnormal return as a better performance of the respective IPO compared to the benchmark. The mean buy-and-hold abnormal return is computed as the arithmetic average of abnormal returns on all IPOs in the sample of size N:
(2) BHARIPO,T = 1 __ N ∑
i = 1
N
BHARi,T .
Noting that the distribution of long-run abnormal stock returns is positively skewed, we also report the median buy-and-hold abnormal return. Furthermore, the simulation results in Kothari and Warner (1997), and Barber, Lyon, and Tsai (1999) show that standard tests of long-run performance are often misspecified. Therefore, we again test for the significance of the BHARs using the bootsrapped application of the skewness-adjusted t-test 8.
8 Shumway (1997) notes that the U.S. IPO data from the Center for Research in Security Prices (CRSP) exhibit a survivorship bias due to delistings. Since we explicitly account for non-surviving firms, we do not expect this problem in our sample.

Long-Run Performance
sbr 57 (3/2005) 261
Table 2: Buy-and-hold abnormal returns (BHARs)
BHAR compared to SPI BHAR compared to VSCI
Month N Mean Median tsa -value p-value Mean Median tsa -value p-value
(1) (2) (3) (4) (5) (6) (7) (8) (9) (10)
1 109 -1.79% -1.77% -1.682 0.097°° -1.14% -1.73% -1.0820 0.332
2 109 0.98% -1.60% 0.553 0.594 1.91% 0.16% 1.1710 0.285
3 109 3.96% -2.80% 1.596 0.138 4.33% -2.14% 1.9609 0.082
6 109 2.38% -3.41% 0.804 0.443 2.28% -3.29% 0.8237 0.425
12 109 -2.12% -7.95% -0.413 0.714 -1.51% -4.12% -0.2947 0.781
18 106 -4.80% -12.79% -0.740 0.531 -2.23% -12.66% -0.3248 0.797
24 97 0.89% -15.62% 0.148 0.887 2.33% -13.27% 0.3348 0.768
36 87 -1.69% -20.49% -0.125 0.902 5.12% -7.31% 0.5565 0.632
48 75 -12.20% -35.28% -0.993 0.346 6.31% -1.65% 0.6070 0.559
60 66 -26.17% -52.36% -1.819 0.135aa 11.56% -2.81% 1.0466 0.378
72 60 -36.15% -71.02% -1.079 0.486aa 17.74% -10.65% 1.0440 0.561
84 57 -59.01% -92.73% -1.606 0.340aaa 9.83% -14.93% 0.5369 0.714
96 54 -85.62% -115.67% -1.074 0.375*** -5.23% -20.18% -0.1601 0.917
108 54 -127.80% -145.28% -0.262 0.859*** -13.40% -32.42% -0.4191 0.766°°
120 53 -173.46% -199.92% -1.235 0.303*** -17.30% -34.97% -0.4993 0.735°
The tsa -value is the skewness-adjusted t-statistic suggested by Johnson (1978). We report the bootstrapped application of this test statistic, following the procedure by Lyon, Barber, and Tsai (1999). */**/*** denotes the significance at the 10%/5%/1% levels, respectively, excluding the best and the worst performing IPOs. Similarly, °/°°/°°° and a/aa/aaa denote the statistical significance at the 10%/5%/1% levels, respectively, excluding the two and three extreme performers from the sample. N denotes the sample size.
Table 2 shows the buy-and-hold abnormal returns for up to 120 months of sec-ondary market trading. Relative to the Swiss Performance Index (SPI), which is a broad value-weighted market index, we find a significant underperformance (at the 10% level) for the first month of trading. After two and three years of trading, on average, IPOs show almost exactly the same performance as the broad market index. In this respect, our results are even more pronounced than those in Stehle, Erhard, and Przyborowsky (2000), who find that German IPOs show a moder-ate degree of underperformance after 36 months of trading. Their results are only marginally statistically significant at best. However, when we increase the obser-vation period, the performance of IPO stocks in our Swiss sample sharply deterio-rates. For example, after five years the average BHAR is -26.17%, which is similar in magnitude to the results in Ritter (1991), Loughran and Ritter (1995), and Brav and Gompers (1997) for U.S. data, among others. After 120 months of secondary market trading, the average underperformance even increases, rising to -173.46%.
Table 2 also shows that long-run BHARs are severely right-skewed, as indicated by the fact that the median BHARs are much lower than the respective means. Therefore, to test for the statistical significance of long-run performance, we again apply a skewness-adjusted test statistic and combine it with the bootstrap procedure as suggested by Lyon, Barber, and Tsai (1999).
W. Drobetz/M. Kammermann/U. Wälchli
262 sbr 57 (3/2005)
Column 6 shows that the underperformance for the first month of trading is significant at the 10% level. However, beyond the first month, bootstraps of the whole sample do not reveal any statistically significant underperformance for Swiss IPOs, as compared to the broad SPI index. However, with respect to sta-tistical significance these results are heavily driven by a few extreme perform-ers in our sample. When we exclude the best (Phoenix Mecano, +752%) and the worst (Omni Holding, -571%) performers from the sample, we find highly signif-icant underperformance for a holding period of 96 months and beyond. When we exclude the three best and worst performers, the underperformance is signif-icant for holding periods of 60 months and thereafter 9. Therefore, our results fall between those previously reported for other countries. Similar to Stehle, Erhard, and Przyborowsky (2000) for German IPOs, but in contrast to studies using U.S. data, we find only modest and mostly insignificant underperformance of Swiss IPOs up to four years after the first day of trading. In the very long-run we find evidence that Swiss IPOs severely underperform the market. However, in this case the bad-model problem might impose inference problems.
Previous studies for the U.S. suggest that long-run underperformance is not an IPO-specific phenomenon, but rather affects small companies with a low book-to-market ratio (e.g., Brav and Gompers (1997)). Therefore, in a second step we use an alternative benchmark to measure abnormal returns 10. Given that IPOs tend to be smaller firms, we use the Vontobel Small Companies Index (VSCI) to account for the differences in market capitalization. Similar to previous U.S. evidence by Brav, Geczy, and Gompers (2000), hardly any evidence for under-performance remains. Column 7 in table 6 shows that after 60 months the average BHAR is actually a positive 11.56%. Again, it becomes negative only in the very long-run. The median BHAR is much lower than the mean, indicating that the distribution is again skewed to the right. Using the VSCI as the benchmark, the boot-strap procedure for the skewness-adjusted test statistic shows no evidence of either significant under- or outperformance, even for very long time horizons. Only after excluding the two best and worst performers we find weak evidence for underperformance in the very long-run.
Overall, these results provide little support for a distinct IPO effect. The poor performance of IPOs is not due to sample firms being IPO firms, but rather is the result of the fact that they tend to be small firms. This finding is also consistent with the observation that there was a reverse size-effect on the Swiss stock market 11. From a broader perspective, and as stressed by Brav, Geczy and Gompers (2000), this evidence suggests that many of the long-run stock return anomalies found in the finance literature are merely manifestations of more systematic return patterns in the broader set of traded companies.
9 This result might be due to the fact that the cross-sectional volatility of abnormal returns becomes much smaller, which in turn leads to narrower confidence intervals. See the discussion in section 3.3.
10 See Sapusek (2000) for a discussion on the choice of an appropriate market index as a benchmark.11 See Kammermann (1997) for an analysis of the size-effect on the Swiss capital market.

Long-Run Performance
sbr 57 (3/2005) 263
Due to severe data limitations for the IPO stocks in the early sample period, we are unable to cluster the sample stocks by their book-to-market ratios. Neverthe-less, we can analyze whether there are differences in the performance of Swiss IPOs on the basis of the size of an issue. In figure 1 we group all sample stocks into size quartiles depending on the issuing volume. Figure 1a shows the corre-sponding mean BHARs, and figure 1b shows the median BHARs relative to the Swiss Performance Index (SPI). Confirming the results by Schuster (2001) for a sample of pan-European IPOs, but in contrast to the findings by Brav and Gom-pers (1997) for U.S. data, we cannot detect a pronounced size-effect within our sample. We conclude that the underperformance of Swiss IPOs is not driven by the smallest quartiles of sample firms. Rather, it comes from the fact that Swiss IPOs are generally those of small firms, as discussed in Brav, Geczy, and Gompers (2003). The crucial result is that it is not the smallest quartile of firms within our sample of IPOs that performed worst. In fact, small issues show even a slightly better performance than do the big ones 12.
Figure 1: BHARs of size quartiles
Figure 1a: Mean BHARs
�����
�����
�����
�����
����
��
���
� �� �� �� �� ��� ���
�������������������������������������
��
�����
����
12 This result is consistent with Schuster (2001). It is also consistent with the findings of Kammermann (1997), who reports that there was no significant size premium on the Swiss stock market for the 1985 to 1996 period. If anything, there was even a negative size premium in up-markets, where large firms outperformed small firms.
Months since the IPO

W. Drobetz/M. Kammermann/U. Wälchli
264 sbr 57 (3/2005)
3.3 WEALTH RELATIVES
Following Ritter (1991) and Loughran and Ritter (1995), we also measure the sec-ondary market performance using wealth relatives. We compute the security-to-market wealth relative of IPO i, denoted as WR M i,T , as follows:
(3) WR M i,T = ∏ t=1
T
(1+Ri,t) __________
∏ t=1
T
(1+RB,t)
.
Our first step is to explore how the sample of IPOs performs relative to the two benchmarks applied above. A wealth ratio greater than one is generally inter-preted as the specific IPO outperforming the market, whereas a wealth ratio less than one indicates underperformance 13.
Our second step is to explore how the benchmark performs relative to the sample of IPOs. We make this comparison by computing the market-to-security wealth relative, denoted by WR i M,T . This wealth ratio is the reciprocal of the expression in equation (3). At first, the two approaches seem to be the same. However, to
13 We note that this is an accumulated wealth ratio, i.e., the wealth relative between two accumulated values is the ratio between the wealth Wi,T of investing in security i and the wealth WM,T of investing in the benchmark after T periods. In contrast, Ritter (1991) and Loughran and Ritter (1995) use averages in both the numerator and the denominator. Jakobsen and Voetmann (2001) argue that this is not appropriate, because the wealth relative is log-normally distributed.
Figure 1b: Median BHARs
Note: The Swiss Performance Index (SPI) is used as the benchmark.
��
�����
����
��
�����
�����
�����
�����
����
��
���
� �� �� �� �� ��� ���
�������������������������������������
Months since the IPO
Long-Run Performance
sbr 57 (3/2005) 265
illustrate the problem, we give the following example. After 60 months the aver-age security-to-market wealth relative of our sample stocks is 0.7763, indicating that, on average, IPO stocks underperform the SPI by 22.37%. Instead of asking how much IPOs underperform the market, an equivalent approach is to inves-tigate how much the market outperforms IPOs. A first guess is 28.8%, i.e., one minus the reciprocal of the average security-to-market wealth relative. How-ever, our results show that after five years of trading the SPI, on average, outper-formed IPOs by almost 100%. This huge difference between the security-to-market wealth relative and the market-to-security wealth relative is attributable to Jensen’s inequality. Because the transformation between the two wealth relatives implies a convex function, the average market-to-security wealth relative will always exceed the reciprocal of the average security-to-market wealth relative. A higher cross-sectional volatility of the wealth relatives leads to more dispersion between the two values, which in turn reduces the usefulness of this approach to assess the performance of IPOs.
To draw reliable conclusions from wealth relatives, we must adjust them for their cross-sectional volatility. Following Jakobsen and Voetmann (2001), we start with the assumption that the security-to-market wealth relative follows a log-normal distribution. Hence, the logarithm of the wealth relative is normally distributed with transformed mean αT .T and variance σ 2 T · T. The expected mean of the wealth relative is then given as:
(4) E (WRT) = exp( µTT ) = exp(αTT + 1 __ 2
σ 2 T T ) = exp(αTT ) . exp( 1 _ 2 σ 2 T T ) {
Transformedmean component
{Volatility
component
with µT ≡ αT + 0.5.σ 2 T . The expression in equation (4) shows that the volatility com-ponent implies an upward bias on the average wealth ratio, which is always posi-tive and identical irrespective of the wealth-relative measure (security-to-market or market-to-security). To assess the unbiased long-run security performance, Jakob-sen and Voetmann (2001) suggest adjusting the expected average cross-sectional wealth relative for the volatility component. Since the volatility component imposes an upward bias on the expected average buy-and-hold return, the cross-sectional mean of the wealth ratio can be decomposed into its transformed mean component, exp (αT . T), and its volatility component, exp (0.5 . σ 2 T .T ) . Clearly, this decomposition is just another way to adjust for skewness. Given that the logarithm of the wealth relative is normally distributed, the mean and variance parameters can be estimated from the cross-section of wealth relatives using maximum likelihood:
(5) ̂ αT = 1 ____ T.N ∑ i=1
N
log( WR M i,T ) and
(6) ̂ σ 2 T = 1 _______ T.(N-1) ∑ i=1
N
( log( WR M i,T ) – ^ αT .T )2.
The parameter estimates for ̂ αT and ̂ σ 2 T are marginal parameter estimates at any point in time, i.e., they are based only on the expected cross-sectional wealth rela-

W. Drobetz/M. Kammermann/U. Wälchli
266 sbr 57 (3/2005)
tive at time T. At time T, the transformed mean and standard deviation of log (WR M i,T ) are ̂ αT .T and ̂ σT .
√
__ T respectively. The marginal confidence interval of the mar-
ginal estimate ̂ αT .T is t-distributed at time T, and the marginal confidence interval of the marginal estimate ̂ σT .
√
__ T is χ2-distributed at time T (both with N -1 degrees
of freedom). We can transform the marginal estimates back to levels through the exponential function and compare the resulting expected mean buy-and-hold returns to the wealth relatives. For example, the estimated transformed mean com-ponent expressed as a rate is exp ( ̂ αT .T ) – 1. A negative sign of this expression indicates negative buy-and-hold abnormal returns14.
Figure 2 shows the decomposition of the wealth relatives. In panel A we compare the observed security-to-market relative with its expected value, where we use the SPI as the benchmark index. The small differences indicate that the volatility-adjust-ment model is sufficiently accurate. For example, after 120 months the expected underperformance is 52.4%, but the actual underperformance of IPOs on the basis of the security-to-market ratio is 55.5% (=0.4448-1). More important, the positive volatility component is large in magnitude and implies that the unadjusted secu-rity-to-market relative severely underestimates the true underperformance of IPOs. In the very long-run, after 120 months of secondary market trading, the transformed component of the mean indicates an adjusted underperformance of 70.14%.
Figure 2: Volatility-adjusted performance: Graphical decomposition of the mean expected wealth relative
14 A problem with the volatility-adjusted approach is that the marginal parameters at time T are treated independently of marginal parameters estimated in any other period. With event-windows of several years the parameter estimates will be influenced by serial correlation and other time-series dependencies.
����
����
����
����
��
���
���
���
���
� �� �� �� �� ��� �������
Panel A: Security-to-market wealth relative (SPI)
Component of the transformed mean
Volatility component
Expected WR
Observed WR
Months since the IPO
WR-1
Long-Run Performance
sbr 57 (3/2005) 267
Panel B: Market-to-security wealth relative (SPI)
�����
��
����
����
����
����
����
� �� �� �� �� ��� ���
����
Component of the transformed mean
Volatility component
Expected WR
Observed WR
Panel D: Market-to-security wealth relative (VSCI)
��
����
����
����
��
���
���
���
���
����
����
� �� �� �� ��� ���
����
Panel C: security-to-market wealth relative (VSCI)
����
����
��
���
����
����
����
����
� �� �� �� �� ��� ���
Months since the IPO
Months since the IPO
Months since the IPO
WR-1
WR-1
WR-1

W. Drobetz/M. Kammermann/U. Wälchli
268 sbr 57 (3/2005)
����
����
����
����
����
����
����
����
��
���
� �� ���� �� �� �� �� �� �� ��� ��� ���
�����������
����������������
�����������
����
Panel B: Market-to-security wealth relative (SPI)
Panel A: Security-to-market wealth relative (SPI)
����
����
��
���
����
����
����
����
����
����
� ���� ���� ���� ���� �� ��� ������
�����������
����������������
�����������
15 We compute the confidence intervals using the volatility estimates from equation (6) and assuming that the marginal estimate of ̂ αT .T is t-distributed at time T.
Panel A, figure 3, explores the statistical significance of the transformed mean com-ponent in equation (4). The solid line depicts the transformed mean component on a rate basis, which we compute as exp ( αT .T )–1, for the security-to-market wealth rel-ative, and the dotted lines indicate the upper and lower bounds of 95% confidence intervals15. In both cases the benchmark is the Swiss Performance Index. Our ear-lier results show that there is no underperformance of IPOs on the basis of security-to-market wealth relatives up to 30 months of trading, and underperformance is only present after 60 months of trading (and beyond) on the basis of buy-and-hold abnor-mal returns. In contrast, using the volatility-adjusted performance measure shows that IPOs underperform dramatically. For holding periods of eight months and lon-ger, the underperformance of Swiss IPOs is statistically significant at the 5% level.
Figure 3: Test for statistical significance of volatility-adjusted performance
Months since the IPO
Months since the IPO
WR-1
WR-1

Long-Run Performance
sbr 57 (3/2005) 269
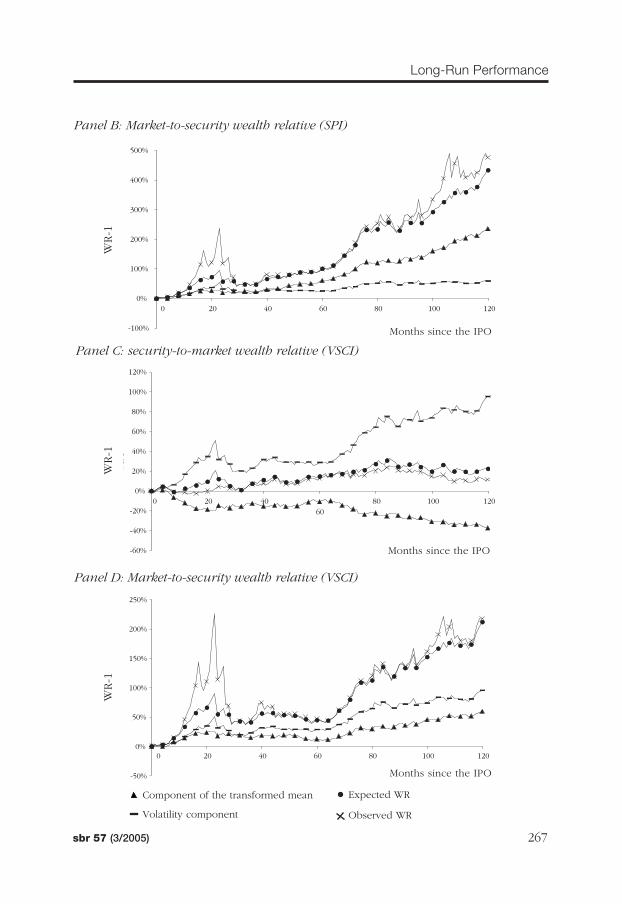
Panel B, figure 2, presents the same volatility decomposition analysis for the mar-ket-to-security wealth relative. By construction, the volatility component is the same as in panel A for the security-to-market wealth relative (but the y-axis is dif-ferently scaled). In this case, the (positive) volatility component implies that the market-to-security wealth relative overestimates the true outperformance of the market. Using the SPI index as the benchmark, after 120 months of secondary market trading the expected value indicates an outperformance of 433.1%. Adjust-ing for the cross-sectional volatility reduces the outperformance to 234.9%. Again, the actual market-to-security wealth relative closely matches its expected value.
Panel B of figure 3 analyzes the statistical significance of the outperformance of the market relative to the sample of IPOs. The results correspond to those in panel A for the security-to-market wealth relative. Using a 95% confidence inter-val, IPOs significantly outperform the market in the first month of secondary mar-
����
����
����
����
����
����
����
����
��
���
� ���� ���� �� �� �� �� �� ��� ��� ���
�����������
����������������
�����������
����
Panel C: Security-to-market wealth relative (VSCI)
����
��
���
���
���
���
����
����
����
� �� ���� �� �� ���� �� �� ��� ��� ���
�����������
����������������
�����������
����
Panel D: Market-to-security wealth relative (VSCI)
Months since the IPO
Months since the IPO
WR-1
WR-1
W. Drobetz/M. Kammermann/U. Wälchli
270 sbr 57 (3/2005)
ket trading, but after eight months and beyond the market significantly outper-forms IPO firms.
We can easily check the results for consistency. For example, the underperfor-mance of 70.14% after 120 months implies that the security-to-market wealth rel-ative decreased from one to 0.2986. The reciprocal of this value is 3.349, which is exactly one plus the 234.9% (=1+2.349) volatility-adjusted outperformance of the benchmark against our sample of IPOs.
Finally, panels C and D of figure 2 show the decomposition of the security-to-mar-ket wealth relative and the market-to-security wealth relative, respectively, using the VSCI index as the benchmark. Again, the volatility adjustment shows that the usual wealth relatives exaggerate the performance of IPOs. Panels C and D of fig-ure 3 assess the statistical significance. Using the small-cap index as the bench-mark, the underperformance of IPOs is only significant for the very long time horizons. At a 5% level, the underperformance is significant only after holding periods of 90 months and beyond.
3.4 CUMULATIVE ABNORMAL RETURNS (CARS)
Gompers and Lerner (2003) report that long-run performance results differ de- pending on the empirical methodology. Therefore, to double-check the stability of our results on the long-run dynamics of IPOs, we also use cumulative average abnormal returns, as suggested by Fama (1998) and Ritter (1991), among others. We calculate monthly benchmark-adjusted returns as the monthly raw return on an IPO stock (Ri,t) minus the benchmark return (RB,t). Following Ritter (1991), the T period cumulative abnormal return for stock i is:
(7) CARi,T = ∑ t=1
T
(Ri,t – RB,t) .
Again, we use both the SPI and the VSCI as alternative benchmarks. Ikenberry, Lakonishok, and Vermaelen (1995) argue that CARs do not represent realistic strat-egies and therefore should only be viewed as indicative. However, as discussed in section 3.1, the statistical properties of CARs are more favorable than those of BHARs.
Column 3, table 3, displays the cumulative abnormal returns relative to the SPI. After 36 months of secondary market trading the CAR is -7.45%, which is much smaller in magnitude than the -29.13% for the U.S. data reported in Ritter (1991). Given that the long-run CARs are negatively skewed (i.e., the median is larger than the corresponding average), a standard t -test overesti-mates the performance of IPOs. We again use skewness-adjusted t -statistics combined with the bootstrap procedure proposed by Lyon, Barber, and Tsai (1999). The analysis shows that the underperformance of IPOs is more pro-nounced when measured with CARs as compared to BHARs. Specifically, we find a significant underperformance after 18 month of trading in the secondary market. For sample periods of 48 months and longer the underperformance is also highly significant.

Long-Run Performance
sbr 57 (3/2005) 271
Table 3: Cumulative abnormal returns (CARs)
CAR compared to SPI CAR compared to VSCI
Month N Mean Median tsa -value p-value Mean Median tsa -value p-value
(1) (2) (3) (4) (5) (6) (7) (8) (9) (10)
1 109 -1.79% -1.77% -1.6821 0.088°° -1.09% -1.73% -1.0363 0.341
2 109 0.78% -1.65% 0.4440 0.678 1.76% -0.25% 1.0818 0.318
3 109 2.80% -2.55% 1.1878 0.257 3.35% -1.81% 1.5894 0.150
6 109 1.64% 0.17% 0.5829 0.593 2.23% -1.11% 0.8644 0.417
12 109 -8.50% -5.47% -1.8159 0.097 -7.61% -1.62% -1.6478 0.154
18 106 -13.72% -6.99% -2.3549 0.049 -11.65% -7.89% -2.003 0.098
24 97 -8.26% -5.91% -1.2286 0.278 -7.68% -7.38% -1.1494 0.298
36 87 -7.45% -7.22% -1.1021 0.304 -1.02% 4.75% -0.1493 0.876
48 75 -21.71% -18.80% -2.7723 0.017 -1.99% 4.85% -0.2528 0.830
60 66 -31.15% -37.30% -3.8605 0.002 7.58% 13.20% 0.7101 0.518
72 60 -52.30% -52.98% -5.6103 0.000 3.71% 8.45% 0.2914 0.808
84 57 -62.56% -57.76% -5.3171 0.000 1.88% 9.61% 0.1081 0.928
96 54 -62.50% -66.48% -5.6284 0.000 7.28% 14.42% 0.4543 0.704
108 54 -84.42% -75.86% -7.3025 0.000 -3.47% 9.96% -0.2489 0.819
120 53 -101.33% -92.60% -7.2329 0.000 -9.51% -4.19% -0.5411 0.652
The tsa -value is the skewness-adjusted t-statistic suggested by Johnson (1978). We report the bootstrapped application of this test statistic, following the procedure by Lyon, Barber, and Tsai (1999). */**/*** denotes the significance at the 10%/5%/1% levels, respectively, excluding the best and the worst performing IPOs. Similarly, °/°°/°°° and a/aa/aaa denote the statistical significance at the 10%/5%/1% levels, respectively, excluding the two and three extreme performers from the sample. N denotes the sample size.
Column 7 of table 3 presents the resulting average cumulative abnormal returns when we use the VSCI index as the benchmark. Consistent with our findings for the BHARs, there is no longer any evidence for a distinct IPO effect. After three years of secondary market trading the underperformance is a mere 1%, and after five years the IPOs actually outperform the small-cap index by a little more than 7%. The underperformance (if any) is small in absolute numbers and never statis-tically significant.
Overall, we interpret these results as qualitatively similar to those for buy-and-hold returns. In fact, our basic results remain unchanged. The poor performance of IPOs compared with the broad market index is not due to sample firms being initial public offering firms, but rather results from the fact that they tend to be small firms. Our results contrast with the results by Gompers and Lerner (2003) for U.S. data, who report that the relative performance of IPOs depends heavily on the method applied. Therefore, we are confident that our results are not solely attributable to measurement problems, but that they depend on the characteristics of our sample of Swiss IPOs.

W. Drobetz/M. Kammermann/U. Wälchli
272 sbr 57 (3/2005)
Our sample consists of several successful IPOs in dynamic industries. For exam-ple, both Synthes-Stratec (a leading medical device company) and SEZ Holding (a leading supplier of wet wafer surface preparation equipment) have five-year abnormal returns above 100%. In addition, our sample contains several success-ful carve-outs from well-established, older firms, e.g., Syngenta (a carve-out from Novartis) and Clariant (a carve-out from former Sandoz). We suspect that they have promising and transparent stand-alone business models and are relatively easy to value from an investor’s perspective. This explanation is also consistent with the observation by Pagano, Panetta, and Zingales (1998) that the average age of European IPOs is much higher than the corresponding values for U.S. new public companies.
3.5 ROBUSTNESS TESTS
Our results are strongly confirmed when we use yet alternative methods to assess the long-run performance of Swiss IPOs. We allow for differences in systematic risk by using a simple market model and running intercept tests on the basis of excess returns. In results not presented here, we again find that IPO stocks under-perform only in the very long-run. Following Espenlaub, Gregory, and Tonks (2000), we also extend our market model by adding another risk factor to con-trol for the size-effect. As expected, the results are qualitatively the same as for the BHARs and CARs in section 3.2 and 3.4. Underperformance is small at best and never statistically significant. Finally, even when we assess the long-run per-formance of the IPOs in actual calendar-time (instead of event time), as recom-mended by Schultz (2003), we reach the same conclusions.
There is one remaining caveat: Tables 2 and 3 indicate that the sample size shrinks significantly with the measurement horizon. Looking at 120 months of secondary market trading, there are only 53 firms with the full history of returns. We rep-licate our results with this reduced sample of firms and again find that they are robust16.
4 CONCLUSION
We present fresh evidence for underpricing and long-run performance of a broad set of Swiss IPOs from 1983 to 2000. We report that the average market adjusted initial return is 34.97%. The main contribution of our paper is to examine long-run returns, which can be interpreted as changes in valuations over time, for a major market outside the U.S. Previous findings for U.S. data indicate dramati-cally poor long-run performance of IPOs. This observation has been interpreted as IPO investments being hazardous to investors’ wealth. Our results suggest that this warning may be exaggerated, at least for Swiss IPOs. In fact, we report some evidence for underperformance when we use a broad market index as the bench-mark. However, underperformance tends to be significant (both in absolute val-ues and in statistical terms) only in the long-run, i.e., after four years of secondary market trading and beyond.
16 All results are available from the authors on request.

Long-Run Performance
sbr 57 (3/2005) 273
Even more important, underperformance virtually vanishes when we use a small capitalization index as an alternative benchmark. We interpret this result as indi-cating that underperformance is not an IPO effect. IPO firms tend to be small, and firms of similar size that have not issued equity perform just as poorly as IPO firms.
We measure the long-run performance of Swiss IPOs up to 120 months after going public and use several different measurement techniques with very dis-tinct economic implications and statistical properties. In contrast to Gompers and Lerner (2003), our basic results are similar for all performance measures applied and robust for a variety of possible biases (e.g., survivorship bias). From a broader perspective, our results confirm the notion in Brav, Geczy, and Gompers (2000) that many of the long-run stock returns anomalies found in the finance literature are merely manifestations of more systematic return patterns in the broader set of traded companies.
REFERENCES
Amihud, Yakov, Shmuel Hauser, and Amir Kirsh (2003), Allocations, Adverse Selection, and Cascades: Evidence from Israel, Journal of Financial Economics 68, 137–158.
Barber, Brad M., and John D. Lyon (1997), Detecting Long-Run Abnormal Stock Returns: The Empirical Power and Specification of Test Statistics, Journal of Financial Economics 43, 341–372.
Barberis, Nicholas, Andrei Shleifer, and Robert Vishny (1998), A Model of Investor Sentiment, Journal of Financial Economics 49, 307–345.
Bill, Markus (1991), Bestimmungsgründe der Emissionspreisfestsetzung bei Going Publics in der Schweiz, Bern: Verlag Paul Haupt.
Blume, Marshall E., and Robert F. Stambaugh (1983), Biases in Computed Returns: An Application to the Size Effect, Journal of Financial Economics 12, 387– 404.
Brav, Alon, and Paul A. Gompers (1997), Myth or Reality? The Long-Run Underperformance of Initial Public Offerings: Evidence from Venture and Non-Venture Capital-Backed Companies, Journal of Finance 52, 1791–1821.
Brav, Alon, Christopher Geczy, and Paul A. Gompers (2000), Is the Abnormal Return Following Equity Issuances Anomalous ?, Journal of Financial Economics 56, 209 – 269.
Conrad, Jennifer, and Gautam Kaul (1993), Long-Term Market Overreaction or Biases in Computed Re-turns, Journal of Finance 48, 39-64.
Daniel, Kent D., David Hirshleifer, and Avanidhar Subrahmanyam (1998), Investor Psychology and Se-curity Market Under- and Overreactions, Journal of Finance 53, 1839 –1885.
De Bondt, Werner, and Richard H. Thaler (1985), Does the Stock Market Overreact?, Journal of Fi-nance 40, 793 – 808.
Dimson, Elroy, and Paul Marsh (1986), Event Study Methodologies and Size Effect: The Case of UK Press Recommendations, Journal of Financial Economics 17, 113 –143.
Drobetz, Wolfgang, Matthias Kammermann, and Urs Wälchli (2003), Pricing Initial Public Offerings in Switzerland, Working paper, University of Basel and University of Bern.
Espenlaub, Susanne, Alan Gregory, and Ian Tonks (2000), Re-assessing the Long-Term Underperfor-mance of UK Initial Public Offerings, European Financial Management 6, 319 – 342.
Fama, Eugene F. (1998), Market Efficiency, Long-Term Returns, and Behavioural Finance, Journal of Fi-nancial Economics 49, 283 – 307.
Giudici, Giancarlo, and Peter Roosenboom (2002), Pricing Initial Public Offerings in Europe: What Has Changed?, Working paper, Erasmus University.

W. Drobetz/M. Kammermann/U. Wälchli
274 sbr 57 (3/2005)
Gompers, Paul A., and Josh Lerner (2003), The Really Long-run Performance of Initial Public Offerings: The Pre-NASDAQ Evidence, Journal of Finance 63, 1355 –1392.
Göppl, Hermann, and Andreas Saurer (1990), Die Bewertung von Börsenneulingen: Eine empirische Untersuchung, in: Ahlert, B., K.P. Franz, and H. Göppl (eds.), Finanz- und Rechnungswesen als Führungsinstrument, Wiesbaden: Gabler, 159 –178.
Ikenberry, David, Josef Lakonishok, and Theo Vermaelen (1995), Market Underreaction to Open Mar-ket Share Repurchases, Journal of Financial Economics 39, 181–208.
Jakobson, Jan, and Torben Voetman (2001), Volatility-Adjusted Performance, Working paper, Copen-hagen Business School and Wharton School.
Johnson, Norman J. (1978), Modified t Tests and Confidence Intervals for Asymmetrical Populations, Journal of the American Statistical Association 73, 536 – 544.
Kammermann, Matthias (1997), Size-Effekt am schweizerischen Aktienmarkt: Informations- vs. Liquidi-tätseffekt, Master Thesis, University of St. Gallen.
Kaserer, Christoph, and Volker Kempf (1995), Das Underpricing Phänomen am deutschen Kapitalmarkt und seine Ursachen, Zeitschrift für Bankrecht und Bankwirtschaft 7, 45 – 68.
Knauff, Pieter, Peter Roosenboom, and Tjalling van der Goot (2003), Is Accounting Information Rele-vant to Valuing European Internet IPOs?, forthcoming in: Hasan, I., and A. Grunsven (eds.), New Venture Financing, North Holland.
Kunz, Roger (1991), Going Public in der Schweiz: Preisbildung und Erfolgsfaktoren, Bern: Verlag Paul Haupt.
Kunz, Roger, and Reena Aggarwal (1994), Why Initial Offerings are Underpriced: Evidence from Swit-zerland, Journal of Banking and Finance 18, 702 –723.
Kothari, S.P., and Jerold B. Warner (1997), Measuring Long-Horizon Security Price Performance, Jour-nal of Financial Economics 43, 301 –339.
Ljungqvist, Alexander P. (1994), Underpricing and Long-Term Performance of German Initial Public Offerings, 1970-1997, Working paper, University of Oxford.
Ljungqvist, Alexander P. (1997), Pricing Initial Public Offerings: Further Evidence from Germany, Euro-pean Economic Review 41, 1309 –1320.
Loughran, Tim, and Jay R. Ritter (1995), The New Issues Puzzle, Journal of Finance 50, 249-268.Loughran, Tim, and Jay R. Ritter (2000), Uniformly Least Powerful Tests of Market Efficiency, Journal of
Financial Economics 55, 361–389.Lyon, John D., Brad M. Barber, and Chih-Ling Tsai (1999), Improved Methods for Tests of Long-Run
Abnormal Stock Returns, Journal of Finance 54, 165 –201.Mettler, Alfred (1990), Going Public: Eine betriebswirtschaftliche Untersuchung Schweizer Börsenein-
führungen, Bern: Verlag Paul Haupt.Mitchell, Mark, and Erik Stafford (2000), Managerial Decisions and Long-Term Stock Price Performance,
Journal of Business 73, 287–330.Pagano, Marco, Fabio Panetta, and Luigi Zingales (1998), Why Do Companies Go Public? An Empirical
Analysis, Journal of Finance 53, 27– 64.Ritter, Jay R. (1991), The Long-Run Performance of Initial Public Offerings, Journal of Finance 46, 3-27.Ritter, Jay R. (2003), Differences between European and American IPO Markets, European Financial
Management 9, 421– 434.Roll, Richard (1983), On Computing Mean Returns and the Small Firm Premium, Journal of Financial
Economics 12, 371–386.Sapusek, Annemarie (2000), Benchmark-Sensitivity of IPO Long-Run Performance: An Empirical Study
for Germany, Schmalenbach Business Review 52, 374 – 405.Schmidt, Reinhard H., Friedhelm Dietz, Stefan Fellermann, Norbert Hellmann, Klaus-Peter Som-
mer, Marcel Tyrell, and Gerhard Wilwerding (1988), Underpricing bei deutschen Erstemissionen 1984/1985, Zeitschrift für Betriebswirtschaft 58, 1193 –1203.
Schultz, Paul H. (2003), Pseudo Market Timing and the Long-Run Performance of IPOs, Journal of Fi-nance 58, 483 –527.

Long-Run Performance
sbr 57 (3/2005) 275
Schuster, Josef A. (2001), The Cross-Section of European IPO Returns, Working paper, London School of Economics.
Shumway, Tyler (1997), The Delisting Bias in CRSP Data, Journal of Finance 50, 327–340.Stehle, Richard, Olaf Erhardt, and Renè Przyborowsky (2000), Long-Run Stock Performance of German
Initial Public Offerings and Seasoned Equity Issues, European Financial Management 6, 173 –196.Thommen, Jean-Paul (1996), Managementorientierte Betriebswirtschaftslehre, Schriftenreihe der Treu-
händerkammer, Band 82, Zürich: Versus Verlag.Uhlir, Helmut (1989), Der Gang an die Börse und das Underpricing Phänomen: Eine empirische Unter-
suchung (1977-1987), Zeitschrift für Bankrecht und Betriebswirtschaft, 2 –16.Welch, Ivo, and Jay R. Ritter (2002), A Review of IPO Activity, Pricing and Allocation, Journal of Fi-
nance 57, 1795 –1828.

Order form –Order now!
Order form –Order now!
Verlagsgruppe Handelsblatt GmbH
Abo-Service Ausland
Postfach 10 27 53
40018 Düsseldorf
Germany
Fon: 0049 211 887 1730Fax: 0049 211 887 1738e-mail: [email protected]: www.sbr-online.com
Use this form to order your free sample copy and to subscribe to sbr!
Free sample copy
Please send me a free sample copy of sbrPB-ZFSBRPH1
Subscription
Open ended subscription*
One-Year subscriptionPB-ZFSBRO15
* In case of open-ended subscription an invoice will beissued at the end of each subscription year to cover the nextyear. Cancellation within a period of at least 21 days beforethe new subscription year begins.
Subscription rates**Schmalenbach Business Review (sbr),ISSN: 1439-2917, Quaterly
Institutions: $ 95.00 £ 60.00 € 91.00
Individuals: $ 48.00 £ 30.00 € 45.00
Students*: $ 24.00 £ 50.00 € 21.00
* Student rate only accepted with copy of validated ID.** Postage rates are – depending on the currency you wantto be charged in – $ 14, £ 8, € 12.
PaymentPayment is due within 14 days on receipt of invoice. You willreceive the invoice directly from Verlagsgruppe HandelsblattGmbH in Düsseldorf.
Address
Institute/Company
Position/Department
First and Surname
Street and Number
Zip Code City
State Country
Fon
Fax
Signature Date✘
sbrsimply the best research.