The Effect of Post-IPO Private Equity Ownership
82
The Effect of Post-IPO Private Equity Ownership An empirical study of how post-IPO private equity ownership affects the stock market- and accounting performance of private equity-backed IPOs in the US Haakon Dalseth and Jonatan Larsen Supervisor: Aksel Mjøs Master thesis in Financial Economics NORWEGIAN SCHOOL OF ECONOMICS This thesis was written as a part of the Master of Science in Economics and Business Administration at NHH. Please note that neither the institution nor the examiners are responsible − through the approval of this thesis − for the theories and methods used, or results and conclusions drawn in this work. Norwegian School of Economics Bergen, Fall 2018
-
Upload
khangminh22 -
Category
Documents
-
view
4 -
download
0
Transcript of The Effect of Post-IPO Private Equity Ownership
The Effect of Post-IPO Private Equity Ownership
An empirical study of how post-IPO private equity ownership affects the stock market- and accounting performance of private
equity-backed IPOs in the US
Haakon Dalseth and Jonatan Larsen
Supervisor: Aksel Mjøs
Master thesis in Financial Economics
NORWEGIAN SCHOOL OF ECONOMICS
This thesis was written as a part of the Master of Science in Economics and Business
Administration at NHH. Please note that neither the institution nor the examiners are
responsible − through the approval of this thesis − for the theories and methods used, or results
and conclusions drawn in this work.
Norwegian School of Economics
Bergen, Fall 2018

Abstract
Private equity firms stay invested in their portfolio companies for up to several years after an
initial public offering. Despite private equity firms having incentives and opportunities to
continue influencing the companies, the effects of the retained ownership are uncertain. This
study contributes to the understanding of how the long-run stock market- and accounting
performance of portfolio companies is affected by private equity ownership post initial public
offering. Panel data of publicly listed private equity-backed companies in the United States
provides the basis for the analysis. Fixed effects, instrumental variable estimation, and
simultaneous equations models are among the econometric methods used in this study, with a
focus on dealing with the endogeneity of private equity ownership. We find that private equity
ownership post initial public offering has a significant positive effect on the stock market return
for the portfolio companies. We find no effect on return on assets or Tobin’s Q. These findings
contribute to broadening existing literature by investigating an, to our knowledge, previously
unexplored relationship.

Table of Contents
1. INTRODUCTION ........................................................................................................... 1
2. PRIVATE EQUITY VALUE CREATION AND DIVESTMENT .............................. 4
2.1 INTRODUCTION TO PRIVATE EQUITY ............................................................................. 4
2.2 VALUE CREATION ......................................................................................................... 6
2.3 IPO: NOT AN IMMEDIATE EXIT ...................................................................................... 7
3. RELATED RESEARCH ................................................................................................. 9
3.1 PRIVATE EQUITY-BACKED IPOS AND LONG-RUN PERFORMANCE .................................. 9
3.2 OWNERSHIP STRUCTURE AND PERFORMANCE ............................................................. 10
4. PREDICTIONS FOR POST-IPO PE OWNERSHIP AND PERFORMANCE....... 12
4.1 RELEVANT THEORIES AND MECHANISMS..................................................................... 12
4.1.1 Shareholder activism ......................................................................................... 12
4.1.2 Signaling theory ................................................................................................ 14
4.1.3 Price pressure ................................................................................................... 14
4.1.4 Private benefits of control ................................................................................. 15
4.1.5 Reputational concerns ....................................................................................... 16
4.2 HYPOTHESES ............................................................................................................... 16
4.2.1 Hypothesis 1: Stock market performance .......................................................... 17
4.2.2 Hypothesis 2: Accounting performance ............................................................ 17
4.2.3 Hypothesis 3: General company performance .................................................. 18
4.3 CONTRIBUTION TO EXISTING RESEARCH ..................................................................... 19
5. DATA .............................................................................................................................. 20
5.1 SAMPLE ....................................................................................................................... 20
5.2 COLLECTION AND PROCESSING ................................................................................... 22
5.3 VARIABLE DEFINITIONS .............................................................................................. 23
5.4 DESCRIPTIVE STATISTICS ............................................................................................ 25
6. METHODOLOGY ........................................................................................................ 28
6.1 ENDOGENEITY AND CAUSATION OF OWNERSHIP AND PERFORMANCE .......................... 28
6.1.1 In the case of PE ownership .............................................................................. 29
6.2 DEALING WITH THE ENDOGENEITY OF PE OWNERSHIP ................................................ 29
6.2.1 Panel data and fixed effects .............................................................................. 31
6.2.2 Lagged variables ............................................................................................... 32
6.2.3 Simultaneous equations models ........................................................................ 32
6.3 MODEL SPECIFICATION ............................................................................................... 33
6.3.1 Single equations models .................................................................................... 33

6.3.1.1 Stock market return ...................................................................................................... 34
6.3.1.2 Return on assets ........................................................................................................... 34
6.3.1.3 Tobin’s Q ..................................................................................................................... 35
6.3.1.4 Lagged variables as proxies and instruments ............................................................... 35
6.3.2 Simultaneous equations models ........................................................................ 35
6.4 RATIONALE FOR VARIABLE INCLUSION AND EXPECTATIONS ....................................... 36
6.4.1 Performance equations ..................................................................................... 37
6.4.2 Ownership equations ......................................................................................... 40
7. ANALYSIS ..................................................................................................................... 41
7.1 MODEL PREFERENCES ................................................................................................. 41
7.2 RESULTS ..................................................................................................................... 43
7.2.1 Stock market return ........................................................................................... 43
7.2.2 Return on assets ................................................................................................ 45
7.2.3 Tobin’s Q........................................................................................................... 46
7.3 DISCUSSION OF RESULTS ............................................................................................. 47
7.3.1 Relationships and causation .............................................................................. 47
7.3.2 Explanations of results ...................................................................................... 48
7.4 ROBUSTNESS ASSESSMENT .......................................................................................... 50
7.4.1 ROA as a measure of accounting performance ................................................. 50
7.4.2 Winsorizing ....................................................................................................... 51
7.4.3 Robustness of instruments ................................................................................. 52
7.4.3.1 Instrumental variable estimation .................................................................................. 52
7.4.3.2 Simultaneous equations models ................................................................................... 53
7.5 LIMITATIONS OF ANALYSIS ......................................................................................... 54
7.5.1 Econometric limitations .................................................................................... 54
7.5.2 Data and sample limitations ............................................................................. 55
7.5.3 Limitations due to PE firms’ disposal of shares ................................................ 56
8. CONCLUSION .............................................................................................................. 58
8.1 IMPLICATION OF RESULTS AND FURTHER RESEARCH ................................................... 59
9. REFERENCES .............................................................................................................. 61
10. APPENDIX .................................................................................................................... 67
A.1 ECONOMETRIC ASSUMPTIONS ........................................................................................ 67
A.2 TESTS FOR FIXED EFFECTS, RANDOM EFFECTS, AND POOLED OLS ................................. 68
A.3 T-TEST OF LOCK-UP PERIOD EXPIRATION ....................................................................... 69
A.4 RELEVANCE OF INSTRUMENTS ....................................................................................... 69
A.5 PORTFOLIO COMPANIES AND PE FIRMS IN THE SAMPLE ................................................. 70

1
1. Introduction
“We care about the performance of the portfolio companies after taking
them public because we want to achieve a high return for our investors.
Although it is more challenging to influence the companies after the IPO, we are
often able to, and do so whenever beneficial.”
- Managing director and global head of communications at a major PE firm1
Private equity (PE) plays a vital role in the economy, and private equity firms back a substantial
part of initial public offerings (IPO) in the US. The role of these financial sponsors while
companies are under their private ownership is thoroughly covered by academic literature.
However, there is little knowledge about the extent to which PE investors affect the companies
after bringing them to the stock market.
Exit strategy is vital for the life cycle of PE investments, and one of the most common
exit routes is IPO (Kaplan & Stromberg, 2009). However, only a limited share of existing
literature considers the fact that PE investors usually do not completely exit their investments
at the IPO. Studies by Chao (2011), Visnjic (2013) and Fürth (2014) find that most PE firms
use several years to exit the company entirely after an IPO, gradually disposing of their shares.
The few studies that acknowledge this fact mainly focus on the reasons why PE firms stay
invested for so long, and which factors determine their divestment strategy post flotation.
Several studies examine the long-run performance of PE-backed IPOs vs. non-backed
IPOs, and find that PE-backed companies outperform non-backed companies on both stock
market performance and accounting performance (Degeorge & Zeckhauser 1993; Cao &
Lerner, 2009; Levis, 2011). These studies do not account for the fact that PE firms usually do
not exit at the time of the IPO, but propose it as interesting for further research. They suggest
that the continued involvement of the PE firms may be a factor leading to better performance
(Levis, 2011), and that tracking buyout groups’ involvement more carefully can enhance the
understanding of the buyout process (Cao & Lerner, 2009).
This motivates our research question: How does post-IPO private equity ownership affect
the performance of portfolio companies?
Because PE firms retain substantial holdings for a long time after the IPO, they still have
incentives and opportunities to continue influencing the performance of the portfolio
1 Source: Self-conducted telephone interview with a representative from a global private equity firm.
2
companies. As PE firms dispose of their shares, their incentives and opportunities are reduced
because their control of the company and proportion of wealth gains decrease. We do not focus
on why the PE firms stay invested post IPO, because their incentives and opportunities to
improve performance exist regardless of the reason for retaining shares. The focus is on how
stock market- and accounting performance changes as the PE ownership stakes decrease in the
time following the IPO. There are reasons to suspect a significant relationship between PE
ownership and performance, as PE firms in general are capable of converging interests of
shareholders and managers, and add expertise to their portfolio companies through shareholder
activism. Moreover, signaling suggests that investors may interpret PE firms’ disposal of shares
as negative information about the state of the portfolio companies.
Statements made by representatives from two global private equity firms further support
the relevance of this study2. They state that one of the reasons PE firms stay invested after the
IPO is that they try to time the market, in order to deliver a high return for their investors. This
supports the fact that the PE firms indeed have incentives to affect the performance of the
companies, as it has an impact on their ability to achieve the desired returns. Moreover, they
both state that the PE firms still can influence the companies after the IPO, even though it
requires more persuasion of the management due to decreased control of the company. One of
the representatives says that this happens more informally than formally, compared to before
the IPO. These statements support the fact that PE firms also have the opportunity to affect
portfolio companies post IPO.
We estimate the effect that post-IPO PE ownership has on stock market return, return on
assets, and Tobin’s Q. We utilize panel data of 343 buyout-backed companies listed on the US
stock market, with monthly data for PE ownership, performance and various control variables
for 36 months following each IPO. By combining econometric techniques inspired by studies
of ownership structure and performance, we build five different models using various methods
to deal with the possible endogeneity of PE ownership. These methods are pooled OLS, fixed
effects models, the use of lagged variables as proxies for possible endogenous variables, using
lagged variables as instruments in IV estimation, and using simultaneous equations models.
We find evidence that post-IPO PE ownership affects stock market return for the portfolio
company positively. That is, the companies perform worse as the PE firm gradually exits the
company, ceteris paribus. We do not find a significant effect of PE ownership on return on
assets or Tobin’s Q. Possible reasons for the differing results are discussed later in the thesis,
2 Source: Self-conducted telephone interviews with representatives from two global private equity firms.

3
and include the fact that stock market return is more informative than accounting measures and
is observed more frequently. We also provide further evidence to the fact that the PE firms stay
invested a long time after the IPO, on average reducing holdings from 50% to 19% during the
36 months following the IPO. We find that the PE firms, on average, do not sell more at the
expiration of the lock-up agreement than in periods after the expiration, implying that the
lockup agreement is not the sole reason for them to retain shares post IPO. Besides, we show
that PE firms often conduct joint investments, where 52% of the IPOs in our sample are backed
by more than one PE firm. Lastly, we find that PE ownership is negatively determined by
company performance, in line with statements from the interviews.
This thesis contributes to expanding existing literature through studying a research
question that, to our knowledge, has not previously been addressed. Although there are some
limitations to the analysis, the findings improve the understanding of post-IPO performance for
PE-backed companies. Moreover, we add knowledge to the research of performance and
ownership structure in general, by examining the effect of a specific type of owner.
The thesis is structured in the following way. We start with an introduction of private
equity and explain how an IPO is far from an immediate exit for the PE firm. We introduce two
related fields of research that have implications for our thesis. Based on related research and
theoretical predictions, we present the three main hypotheses of interest, before we discuss the
sample and dataset used to address the hypotheses. Then, follows a detailed explanation of the
methodology utilized in the thesis, with a particular focus on methods for dealing with the
possible endogeneity of PE ownership. The results from the analysis are presented and
explained before we discuss the robustness and limitations of the analysis. Finally, we present
our conclusion, discuss implications of the results and make suggestions for further research.

4
2. Private Equity value creation and divestment
This chapter provides an introduction to private equity that the reader should have knowledge
of before reading the remaining parts of the thesis. Furthermore, we discuss empirical evidence
of value creation in private equity and explain how private equity firms retain substantial
holdings post IPO, which is the basis of our research question.
2.1 Introduction to Private Equity
Private equity is a broad term used to describe capital investments in equity securities of
unlisted companies. The majority of these investments are made by financial intermediaries
referred to as private equity funds. These funds are usually limited partnerships with a finite
lifetime, managed by private equity firms and funded by institutional investors.
There are different types of private equity investments, and a commonly used
categorization is venture capital (VC) and buyout/leveraged buyout (BO/LBO). Venture capital
funds usually invest in startups and early stage companies, often in high-growth sectors. Buyout
funds invest in more mature, stable and bigger companies, usually seeking controlling stakes.
These investments are often highly leveraged. The capital invested is typically used to buy
shares, or “buy out” the old owners, rather than investing funds into the company. The venture
capital investments typically include more risk than investments in established companies.
In this study, we solely focus on buyouts, due to several reasons. The business models of
the two categories differ substantially. Whereas BO firms aim to control more than 50% of the
portfolio company in order to get control, VC firms tend to diversify their investments more,
resulting in smaller equity stakes. Given our interest in understanding how ownership affects
long-run performance, it is of more interest to look at the investors with the highest possibility
to make an impact. Moreover, buyouts dominate the market concerning funds raised and capital
invested (Døskeland & Strömberg, 2018). In the following, we refer to buyout as private equity
(PE).
Most PE funds are organized as limited partnerships, as depicted in Figure 1, where the
fund managers are referred to as general partners (GP), and the investors are called limited
partners (LP). The GP raise funds from LPs, which typically include institutional investors such
as pension funds, insurance companies, and endowments. The GP has to invest a minimum of
1% of the committed capital in the fund in order to achieve the limited partnership status. The
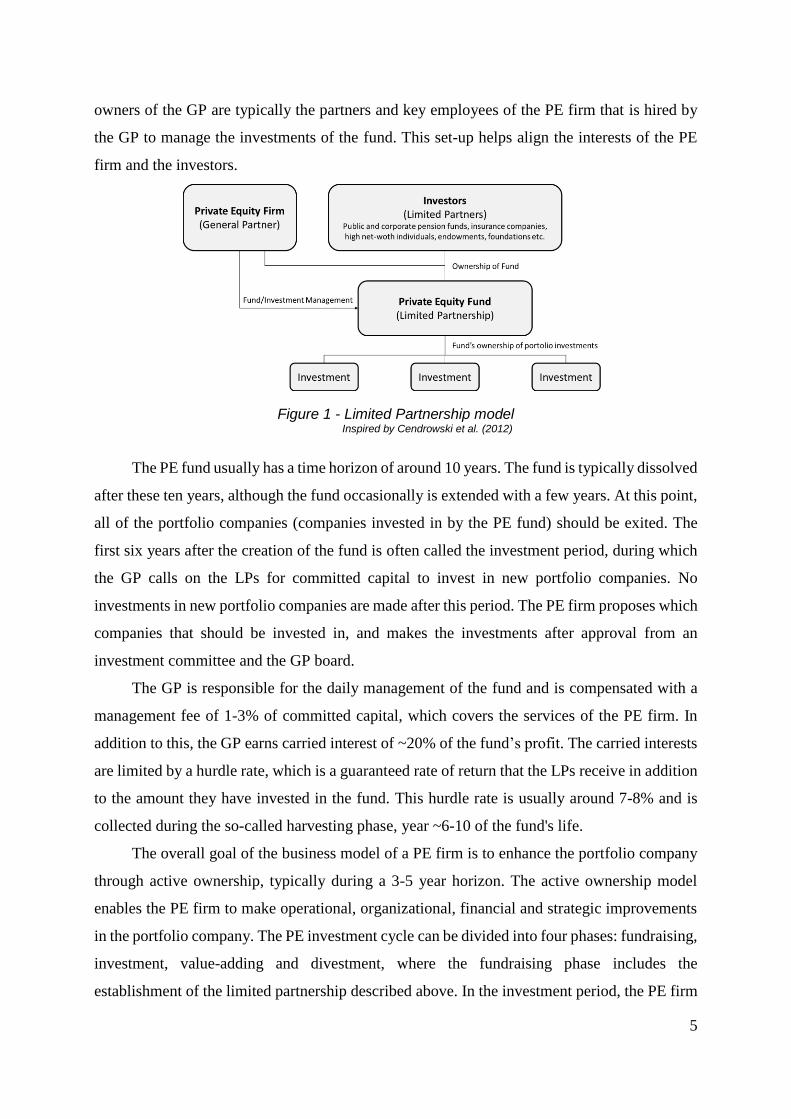
5
Figure 1 - Limited Partnership model Inspired by Cendrowski et al. (2012)
owners of the GP are typically the partners and key employees of the PE firm that is hired by
the GP to manage the investments of the fund. This set-up helps align the interests of the PE
firm and the investors.
The PE fund usually has a time horizon of around 10 years. The fund is typically dissolved
after these ten years, although the fund occasionally is extended with a few years. At this point,
all of the portfolio companies (companies invested in by the PE fund) should be exited. The
first six years after the creation of the fund is often called the investment period, during which
the GP calls on the LPs for committed capital to invest in new portfolio companies. No
investments in new portfolio companies are made after this period. The PE firm proposes which
companies that should be invested in, and makes the investments after approval from an
investment committee and the GP board.
The GP is responsible for the daily management of the fund and is compensated with a
management fee of 1-3% of committed capital, which covers the services of the PE firm. In
addition to this, the GP earns carried interest of ~20% of the fund’s profit. The carried interests
are limited by a hurdle rate, which is a guaranteed rate of return that the LPs receive in addition
to the amount they have invested in the fund. This hurdle rate is usually around 7-8% and is
collected during the so-called harvesting phase, year ~6-10 of the fund's life.
The overall goal of the business model of a PE firm is to enhance the portfolio company
through active ownership, typically during a 3-5 year horizon. The active ownership model
enables the PE firm to make operational, organizational, financial and strategic improvements
in the portfolio company. The PE investment cycle can be divided into four phases: fundraising,
investment, value-adding and divestment, where the fundraising phase includes the
establishment of the limited partnership described above. In the investment period, the PE firm

6
looks for potential investments in the market and conducts due diligence and valuations of
possible targets. When a final target is decided and approved upon, the firm tries to acquire the
target through competitive bidding. After the bidding rounds, investments are made, and the PE
firm takes control of the portfolio company in the value-adding phase. During this period, the
PE firm typically places representatives in the portfolio company’s management and board and
improves the company through active ownership and expertise. After the holding period, they
choose an exit strategy based on the company characteristics and market conditions. One
possible exit strategy is taking the portfolio company public in an IPO, which is the focus of
this thesis.
2.2 Value creation
There is a lot of research and discussion on how, and to what extent, PE firms add value in the
portfolio companies. Jensen (1989), Kaplan (1989) and Kaplan and Strömberg (2009) suggest
three significant changes PE firms apply in their portfolio companies to add value; governance
engineering, financial engineering, and operational engineering. Governance engineering
involves designing the portfolio companies’ corporate governance structure, which is possible
due to the majority stake owned by the PE firm. PE firms typically require management to make
a significant investment. Financial engineering is the implementation of the capital structure in
the portfolio company and often involves the substantial leverage used to finance the
acquisition. Operational engineering refers to the value added through the industry and
operating expertise of the PE firm and is an essential differentiator for PE firms because it is
difficult to copy. The professionals from PE firms typically possess unique knowledge and
skills when it comes to increasing profits, and have extensive experience in taking advantage
of market opportunities.
PE ownership is proved to improve profit margins (Smith, 1990), provide productivity
gains (Davis, et al., 2014), increase sales growth (Acharya, Gottschalg, Hahn, & Kehoe, 2013)
and reduce financial distress (Hotchkiss, Smith, & Strömberg, 2016). In sum, the majority of
empirical studies support the fact that PE firms improve the performance of the portfolio
companies during the holding period, before exit.
These studies have documented that PE firms improve the performance of PE-backed
companies, but it is in general hard to identify and separate the main causes. For instance, it
could be due to aligned interests through governance engineering or beneficial strategic

7
decisions through the professional expertise of the PE firms’ professionals. Another component
could be the PE firms’ ability to select the most promising companies and buy them at a
favorable price. The implication of this to our analysis is that we do not attempt to isolate the
responsible factors, but rather determine whether post-IPO PE ownership affects performance.
2.3 IPO: Not an immediate exit
The exit is a crucial stage for the PE firm, as it partly determines the financial success of the
investment (Metrick & Yasuda, 2011). There is a variety of possible exit routes, and the most
common ones are sale to a strategic buyer, sale to another PE-fund and IPO (Kaplan &
Stromberg, 2009). In a secondary sale, the portfolio is kept privately held. In an initial public
offering, the company is offered to the public and the PE firm can sell their shares on the stock
market.
An IPO is often described as the most favorable exit route because when the proper
market conditions are available, this method is likely to enable the investors to realize the
highest return on their investment. The return depends largely on the exit channel, with initial
public offerings reported to deliver the highest returns on average (Schmidt, Steffen, & Szabó,
2009). Giot and Schwienbacher (2007) argue that there is a pecking order of exits, where
investors prefer an IPO followed by a trade sale. Moreover, an IPO could be viewed as
beneficial because it increases the liquidity of the shares. This allows PE firms to begin exiting
their positions gradually instead of depending on a strategic buyer to acquire the entire equity
stake. An additional benefit of IPO is the continuous market pricing, likely leading to fewer
resources required to negotiate the terms of transactions.
During an IPO, shares are offered to the public, giving the PE firms the opportunity to
realize their investment and exit the company. However, lock-up agreements restrict the PE
firms’ opportunity to sell their shares. A typical lock-up period in the US is 180 days but can
vary between 60-360 days (Cendrowski, Petro, Martin, & Wadecki, 2012). During this period,
the shareholders that the agreement concerns are not allowed to sell their shares unless they
receive special permissions from the lead underwriter.3
Even though IPO is a common exit route, it is not as quick of an exit as it is often
considered. Research documents that investors stay invested for a long time after the IPO (Chao,
3 In some circumstances, the lead underwriter allows locked investors to sell some or all of their shares prior to the
lockup expiration; this is referred to as an 'early sell' transaction (Hoque & Lasfer, 2013).

8
Figure 2 - PE firms’ stepwise disposal of shares. Illustrative
example: individual divestment patterns varies more and are less predictable
2011). Fürth and Rauch (2014) conclude that PE firms stay invested for several years post IPO,
gradually reducing their stake in the portfolio company. This period also extends far beyond
the restrictions of the lock-up period. Visnjic (2013) finds that the PE firm on average sells
minor stakes of their holdings at the IPO. Even though their stake declines due to dilution
effects, they hardly sell more than 1% of their shares at the IPO. He also finds that selling
activity accelerates somewhat after the end lock-up period. After two years, PE firms have on
average sold around 30% of their initial holdings, and selling activity softens thereafter. Five
years after the IPO, PE firms have only sold roughly 40% of their shares (Visnjic, 2013). These
aforementioned studies find that the divestment period after an IPO can be described as a
stepwise decrease of equity ownership over a long period, as illustrated in Figure 2.
These findings are essential for the basis of this thesis, as there is, to our knowledge, no
empirical explanation of how this divestment pattern affects the performance of portfolio
companies. Because PE firms retain substantial holdings post IPO, the performance of their
portfolio companies has significant wealth implications. As we argue in chapter 4, PE firms
still have incentives and opportunities to influence their portfolio companies post IPO, despite
the central part of their business model consists of doing so pre IPO. These incentives and
opportunities will decrease as their equity stake gradually decreases.
9
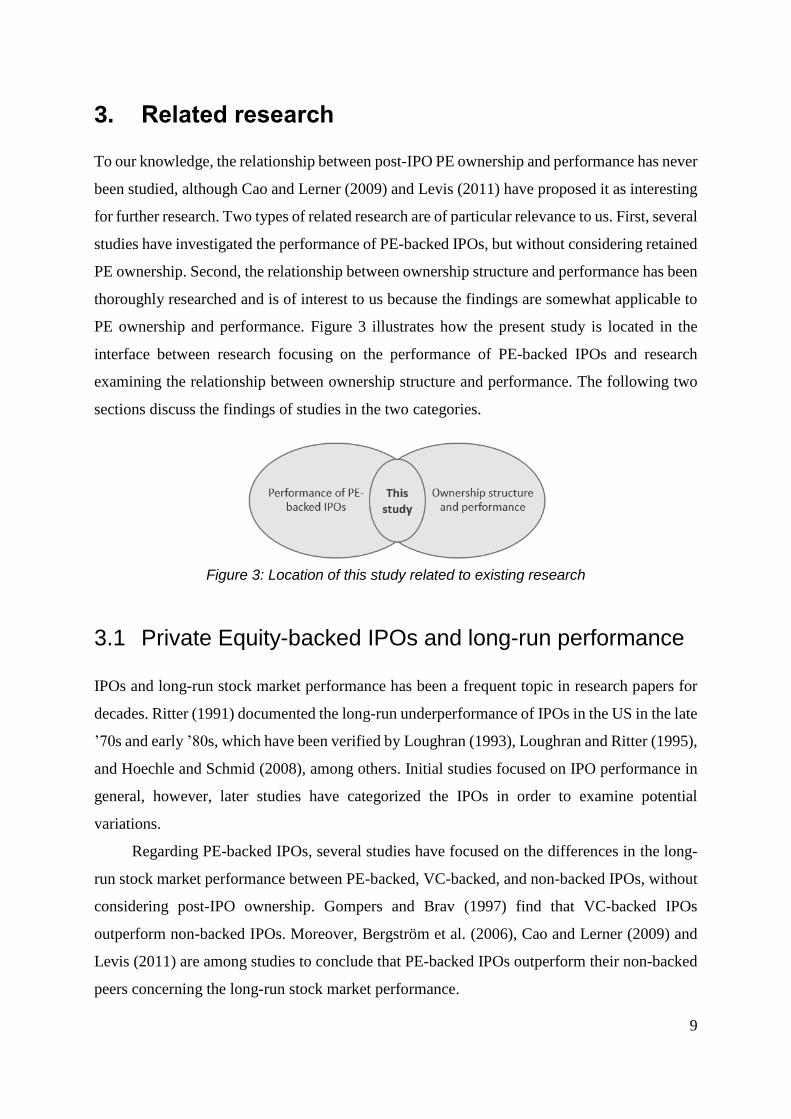
3. Related research
To our knowledge, the relationship between post-IPO PE ownership and performance has never
been studied, although Cao and Lerner (2009) and Levis (2011) have proposed it as interesting
for further research. Two types of related research are of particular relevance to us. First, several
studies have investigated the performance of PE-backed IPOs, but without considering retained
PE ownership. Second, the relationship between ownership structure and performance has been
thoroughly researched and is of interest to us because the findings are somewhat applicable to
PE ownership and performance. Figure 3 illustrates how the present study is located in the
interface between research focusing on the performance of PE-backed IPOs and research
examining the relationship between ownership structure and performance. The following two
sections discuss the findings of studies in the two categories.
3.1 Private Equity-backed IPOs and long-run performance
IPOs and long-run stock market performance has been a frequent topic in research papers for
decades. Ritter (1991) documented the long-run underperformance of IPOs in the US in the late
’70s and early ’80s, which have been verified by Loughran (1993), Loughran and Ritter (1995),
and Hoechle and Schmid (2008), among others. Initial studies focused on IPO performance in
general, however, later studies have categorized the IPOs in order to examine potential
variations.
Regarding PE-backed IPOs, several studies have focused on the differences in the long-
run stock market performance between PE-backed, VC-backed, and non-backed IPOs, without
considering post-IPO ownership. Gompers and Brav (1997) find that VC-backed IPOs
outperform non-backed IPOs. Moreover, Bergström et al. (2006), Cao and Lerner (2009) and
Levis (2011) are among studies to conclude that PE-backed IPOs outperform their non-backed
peers concerning the long-run stock market performance.
Figure 3: Location of this study related to existing research literature literature

10
It is important to consider underpricing when examining the long-run stock market
performance. Underpricing is the listing of an IPO below market value, and is commonly
measured by the first-day return. Ritter (2018) documents the presence of underpricing
throughout the years, which has been between 10-20% for most years after the dot-com bubble.
Whether underpricing is reduced in PE-backed IPOs is open for discussion, as Bergström et al.
(2006) find no significant difference, whereas Hopkins and Ross (2013) finds significantly
reduced underpricing for PE-backed IPOs. Being aware of underpricing is crucial due to our
interest in long-run performance. We are interested in how the market evaluates the
development of the value of the portfolio company. As underpricing is a result of the IPO being
priced lower than the market value rather than value creation immediately after the IPO, we
neglect the abnormal returns resulting from underpricing. We further discuss this decision when
presenting our dataset in chapter 5.
There are also studies investigating the long-run accounting performance of PE-backed
IPOs in the US, and IPOs in general. Bharat and Kini (1994) conclude that firms going public
exhibit a substantial decline in performance post IPO, measured by ROA. Furthermore, Bharat
and Kini (1995) find that the post-IPO accounting performance of VC-backed firms is superior
to that of non-backed firms. Degeorge and Zeckhauser (1993) and Holthausen and Larcker
(1996) find that PE-backed IPOs outperform non-backed IPOs, measured by ROA. However,
like the studies examining stock market performance, these studies do not account for the
development of PE ownership post IPO.
3.2 Ownership structure and performance
Even though previous literature does not cover long-run performance dependent on PE
ownership, several studies look at long-run performance dependent on other kinds of ownership
structures. We primarily find the studies focusing on managerial ownership and performance
interesting because the conclusions in these studies have implications for what we should expect
in our analysis. Firms with a high degree of managerial ownership might perform better than
others because there is an alignment of interest between managers and shareholders. Both have
incentives to maximize shareholder value if the equity stake of managers is big enough. As we
have touched upon and will elaborate on later, one of the consequences of PE ownership is
aligned interests between managers and shareholders. Thus, the studies focusing on managerial

11
ownership can indicate whether the convergence of interests could be a source of superior
performance.
However, previous studies differ in their conclusions about the relationship between
managerial ownership and performance. Mørck et al. (1987) find a significant relationship that
is positive between 0% and 5% of managerial holdings, negative between 5% and 25% and
increasing beyond 25%. McConnel and Servaes (1990) find a quadratic relationship between
managerial ownership and Tobin’s Q using cross-sectional results. Other researchers have
questioned the econometrical approach of these studies, and Loderer and Martin (1997) and
Himmelberg et al. (1999) find no significant relationship with Tobin’s Q using a fixed effects
approach. Nevertheless, these studies are criticized as well. Zhou (2001) states that the within-
firm variation in managerial ownership is too modest, arguing that the approach may lack the
statistical power to document a significant effect, even if it exists.
These studies are interesting for two main reasons. First, they signify the econometric
challenges in dealing with ownership and performance, primarily caused by endogeneity.
Second, there is no definite answer to whether managerial ownership affects performance, as
various econometric approaches produce various answers, and there could exist a relationship
even if current research fails to conclude so. The quadratic relationships some studies find are
explained by the entrenchment effect, stating that managers use their power to prioritize their
vested interests rather than the interests of all shareholders. This is slightly less relevant in the
case of PE ownership, as PE firms are repeated players in the IPO market, and will likely suffer
from gaining such a reputation.

12
4. Predictions for post-IPO PE ownership and performance
Due to the lack of previous studies that are directly related, we are dependent on combining the
findings from the studies discussed in the previous chapter with financial theories to make
predictions for the relationship between post-IPO PE ownership and performance. Before we
introduce our hypotheses in section 4.2, we present relevant theories and mechanisms with
possible implication for our analysis.
4.1 Relevant theories and mechanisms
Section 2.2 introduced activities that PE firms typically perform to add value pre IPO. Active
ownership is the common categorization for these activities, and in the following, we discuss
their implication post IPO. Four additional mechanisms we consider relevant to explain the
relationship between post-IPO PE ownership and performance are also presented. Some of the
mechanisms are relevant for explaining both accounting and stock market performance,
whereas some are only relevant for market performance.
4.1.1 Shareholder activism
Shareholder activism is when owners intentionally influence a company to undergo certain
beneficial changes, and in the case of PE firms, it can be summed up in governance-, financial-
and operational engineering. Even though the IPO is a part of the divestment phase, we argue
that PE firms still have incentives to try to influence portfolio companies positively. They retain
large equity stakes, implying that the performance of portfolio companies has a significant
impact on their wealth.
Governance engineering involves how PE firms control the boards of their portfolio
companies and are actively involved in governance. Principal-agent theory suggests that the
separation of managers and shareholders leads to a conflict of interest (Meckling, 1976). When
facing decisions, managers can experience that the optimal decision for them personally does
not maximize shareholder value. In order to make managers maximize shareholder value,
interests need to be aligned. PE firms often have representatives in the management and on the
board of directors (Cao & Lerner, 2009), and Fürth and Rauch (2014) find that this also is valid
post IPO, as PE firms retain their positions on the board and in the top management even longer

13
than their shares. This implies a convergence of interest between management and shareholders,
as both parties have incentives to maximize shareholder value. Moreover, Kaplan and
Stromberg (2009) find that management in PE-backed companies have a more substantial
equity stake than management in other companies, which is a way PE firms aim to align their
interests. It is reasonable to assume that this also holds post IPO, because PE firms still have
incentives to align the interests of managers, and because management often is restricted by
even longer lock-up periods than other beneficial shareholders (Ball & Gefter, 2016). A
consequence of PE firms being actively involved on the board is that they can monitor other
managers closely, which reduces asymmetric information and thus reduces the Principal-agent
problem. Monitoring requires a substantial amount of effort and creates a free-rider problem
among small shareholders. However, due to the PE firms’ substantial holdings, they have
incentives to take responsibility for monitoring the managers. When managers know they are
being monitored, they are forced to act in the interest of shareholders in order to keep their
position. This is especially true due to PE firms’ reputation of being impatient regarding weak
performing managers (Acharya, Franks, & Servaes, 2007).
Financial engineering is another way PE firms create value before IPO, and it primarily
refers to how substantial leverage is used to finance the acquisition. As this happens years
before the floatation, there is limited reason to believe that financial engineering is essential in
explaining how important shareholder activism is post IPO. Thus, it will not be adressed
further.
Operational engineering refers to how the industry and operational expertise PE firms
are adding value to their portfolio companies. This is relevant also in the post-IPO period
because PE firms still have incentives to contribute with their operational expertise. The PE
professionals can contribute because they typically have extensive experience and knowledge
required to improve the performance of the portfolio company.
Governance- and operational engineering are viewed as essential value creators in the
period before floatation, and we argue that PE firms have incentives to continue with these
efforts post IPO. Nonetheless, we also need to consider whether being publicly listed changes
the possibility of a PE firm being able to influence their portfolio companies. There are
obstacles to having control of how the portfolio company is managed when going public. Even
as a majority shareholder, the minority has a say in how the company is managed. However, it
still happens that PE firms behave actively post IPO. Anker and Stärk-Johansen (2015)
interview private equity professionals stating that the degree of control they have and how

14
active they are following an IPO depends on the cooperation between the PE firm and other
major owners. Moreover, they state that LPs occasionally view IPOs as a way to return some
of their investment, while still being able to benefit from future growth potential, making active
ownership post IPO likely. However, when PE firms reduce their holdings, performing active
ownership is less likely due to reduced control.
In conclusion, we expect activism through governance- and operational engineering to
positively affect both accounting and stock market performance post IPO. Findings from the
interviews we have conducted also support the fact that PE firms both have incentives and
opportunities to affect performance post IPO. As PE firms gradually dispose of their shares, the
incentives and opportunities of PE firms to influence their portfolio companies are reduced,
because the proportion of wealth gains they have to share with other shareholders increases and
their control of the company decreases.
4.1.2 Signaling theory
Signaling theory is useful for describing behavior when two parties have different access to
information (Connelly, Certo, Ireland, & Reutzel, 2011). PE firms have worked with their
portfolio companies for years and know their shape well, making the presence of asymmetric
information between PE firms and potential investors substantial. Thus, when PE firms dispose
of shares, investors can view it as a signal that the PE firm believes the market overvalues the
company. However, there may of course be other reasons for the PE firm to sell their shares.
Still, PE firms are typically experienced professionals who have the prerequisites required to
be able to time the market. Investors have reason to believe that the probability of the PE firms
exiting is smaller if they view the portfolio company as undervalued. Hence, PE firms selling
shares can be an indication of the shape of the portfolio company and might make investors
value the company less than before, which leads to a weaker stock market return.4
4.1.3 Price pressure
Price pressure occurs when there is a change in the share price due to large quantities of the
shares being traded (Harris & Gurel, 1986). PE firms aim to exit their position in the portfolio
companies in the years post IPO, meaning that large number of shares will be sold. The price
would typically experience a drop due to the large quantities offered on the sell side of the
4 Note that since the portfolio companies are publicly listed, beneficial owners such as PE firms are obligated to file
their transactions, so that other shareholders have access to this information.
15
order book, making it challenging for PE firms to exit at a satisfactory price. However, in the
case of PE-backed IPOs, investors are aware of the planned exit of the PE firms at the time of
the IPO, because the IPO is recognized as a way for PE firms to exit their investments.
Based on this, we argue that there could be an alternative price pressure effect. Since
investors know that disposal of large quantities will cause a decrease in the share price, the
effect PE firms’ disposal of shares has on the share price could be reflected in the initial
trading price. Thus, the initial price might be lower than it would be if the IPO were not PE-
backed, i.e., there exists a discount. This discount will gradually decrease as the PE firms
dispose of their shares, causing the price to increase, ceteris paribus. The discount is removed
when the exit is complete. The alternative price pressure mechanism will positively affect the
stock market return of periods with low PE ownership stakes, indicating poor performance
when PE firms still hold a substantial number of shares as compared to when the PE firms
have disposed of a considerable number of their shares.
Note that the discussion of the alternative price pressure effect is based on a hypothesis,
and is to our knowledge not yet supported by empirical evidence. Thus, price pressure can
affect the relationship in both the ordinary and the alternative way, and we consider it important
to be aware of both possibilities.
4.1.4 Private benefits of control
Private benefits of control suggest that major shareholders may result in drawing out the
company’s resources at the expense of smaller shareholders (Barclay & Holderness, 1989). This
can for instance happen by paying excessive salaries and bonuses to their own board members
or transferring assets to other companies under their control. This leads to value destruction in
the company, but controlling owners are still motivated to do so, as long as their private gains
are greater than the loss of their equity stake. In the case of PE firms, they can achieve a greater
IRR on their investments even though the performance of their portfolio companies weakens.
Private benefits of control suggest that PE firms have incentives to not put as much effort into
strengthening the stock market performance of their portfolio companies as they otherwise
would, and the effect might even reduce company value. However, the private benefits of
control effect might not be as strong for PE firms, as they are repeated players in the IPO market
and will suffer if they get a reputation of suppressing minor shareholders.

16
4.1.5 Reputational concerns
Cao and Lerner (2009) state that there are reasons to believe reputation in the stock market is
vital to PE firms. PE firms are repeated players in the IPO market, as they bring portfolio
companies to the market regularly. If it becomes clear to investors that PE-backed IPOs only
perform well while the PE firm is still invested, it might become less attractive to invest in PE-
backed IPOs. This may lead to future IPOs pricing lower as the reputation depreciates. As a
result, PE firms might see that future investments suffer from weaker exits, leading to weaker
IRR on their investments.
Without considering corporate reputation, PE firms are incentivized to do quick fixes
on portfolio companies in order to make it attractive to investors. These quick fixes might not
actually add value, but if investors perceive it as value addition, PE firms can still benefit.
However, when considering the future consequences of such actions, these incentives will
weaken. The reputation of PE firms can discipline the PE firms, suggesting no considerable
differences in performance depending on retained PE ownership.
4.2 Hypotheses
There is, to our knowledge, no existing research of the effect that post-IPO PE ownership has
on performance. Given the unique ownership structure of PE-backed IPOs, we believe that
addressing this may increase the understanding of post-IPO performance of portfolio
companies. Our guiding empirical research question of the thesis is as follows:
How does post-IPO private equity ownership affect the performance of portfolio
companies?
We develop three hypotheses as we measure performance in three ways; by the portfolio
companies’ stock market return, return on assets (ROA), and Tobin’s Q. Bøhren and Ødegaard
(2005) underline how the choice of performance measure in research of ownership and
performance can be decisive. We use various measurements for three main reasons. First, it
allows us to see an overall tendency and provides robustness to the discussion of our results.
Second, the three measures explain different types of performance, and we aim to capture the
full effect. Lastly, it facilitates for comparing our results with former and future studies.
We emphasize that we do not intend to draw any conclusions about which of the presented
mechanisms that cause a significant relationship, as it would require a different type of study.

17
4.2.1 Hypothesis 1: Stock market performance
A significant part of the PE business model is to maximize their investors’ return. PE firms
have incentives to make improvements in their portfolio companies that the market recognizes,
which leads to positive stock return, as pointed out by Cao (2009). PE firms do not only have
the incentives for trying to influence stock market performance, we have suggested that they
also have the opportunity, as shareholder activism depicts well. Together with signaling, these
mechanisms underline the possibility of observing a positive effect of PE ownership on
performance. Private benefits of control argue that the relationship could be negative, whereas
price pressure and reputational concerns are ambiguous. However, the mechanisms arguing
for a positive relationship are to a more considerable extent based on established financial
theory and previous studies, which is why we expect the relationship to be positive.
Hypothesis 1: Post-IPO private equity ownership in portfolio companies positively affects
their stock market return.
Given that PE firms primarily are interested in maximizing shareholder value, we view
this as our primary and most important hypothesis. By testing this hypothesis, we aim to
understand whether the performance of PE-backed IPOs is significantly affected by how PE
firms dispose of shares post IPO.
4.2.2 Hypothesis 2: Accounting performance
By including an accounting performance measure, we aim to see if PE ownership improves the
actual operations of the portfolio companies. We expect a stronger relationship between PE
ownership and stock return than on accounting performance measures such as ROA, due to the
nature of the PE business model. PE firms are mostly incentivized to improve the accounting
performance of their portfolio companies if it results in a better return when they sell shares.
Nonetheless, most ways of securing a satisfying price at exit involve improving the stock return
through improving accounting performance. Thus, shareholder activism indicates that there
might be a positive relationship also in the case of ROA. Another reason for expecting a slightly
less significant relationship when considering accounting measures instead of market
performance is that signaling is only relevant in the case of stock market performance.
However, previous studies have concluded that PE-backed IPOs outperformance of non-
backed IPOs holds for both stock market return and accounting performance measures. This

18
outperformance is likely partly due to the continued ownership of PE firms post IPO. Therefore,
we expect to see a positive relationship when considering accounting measures as well.
Hypothesis 2: Post-IPO private equity ownership in portfolio companies positively affects
their return on assets.
ROA is a common measure for accounting performance and has been frequently used in
former studies examining the accounting performance of PE-backed IPOs, e.g., in Bharat and
Kini (1995), Degeorge and Zeckhauser (1993), and Holthausen and Larcker (1996). It shows
how profitable a company is relative to its total assets, and indicates how efficient a company's
management is at using its assets to generate earnings. We acknowledge the possible drawbacks
of ROA as a way of measuring accounting performance, e.g., how it disregards intangible assets
and borrowed capital, and how it can be biased by earnings management. However, the
alternatives also have disadvantages. We use ROA because it is frequently used in existing
literature and is the most accurate measurement for accounting performance in our dataset. To
provide a fair picture of accounting performance, we address how our results would change if
we used alternative accounting performance measures in section 7.4.1.
4.2.3 Hypothesis 3: General company performance
With the above hypotheses, we have covered both stock market performance and accounting
performance. According to Loderer (1997), Tobin’s Q is customarily interpreted as a proxy for
general company performance. Although stock market return and ROA are frequently used in
studies looking at the performance of PE-backed IPOs, studies regarding ownership structure
and company performance tend to use Tobin’s Q as their performance measure.
Whereas ROA is concerned with backward-looking accounting data, Tobin’s Q is the
market view of the company’s future prospects and is the ratio of the market value of the
company to the replacement cost of its assets. By using Tobin’s Q as a performance measure,
we facilitate for better comparison of results with other studies, and we can examine consistency
in our results. Although other studies regarding ownership structure and performance find
conflicting results, we argue that the reasons for expecting a significant positive relationship
are stronger in the case of PE ownership, partly due to larger variation in PE ownership than in,
e.g., managerial ownership. Moreover, the nominator in Tobin’s Q is directly affected by the
stock return of the firm. Thus, we also expect PE ownership to have a positive effect on Tobin’s
Q.
19
Hypothesis 3: Post-IPO private equity ownership in portfolio companies positively affects
their Tobin’s Q.
Although Tobin’s Q is commonly used to measure company performance, there are
disagreements among scholars whether it is an accurate proxy. Whited and Erickson (2000)
point out how Tobin’s Q likely contains a great deal of measurement error because of a
conceptual gap between true investment opportunities and observable measures of Tobin’s Q.
They also argue that its popularity persists because of its intuitive appeal and simplicity, not
because of its accuracy as a performance proxy. Following this, Kose and Litov (2010) argue
how underinvestment increases the ratio rather than decreasing it, which is not a beneficial
characteristic of a performance measure. We acknowledge the criticism towards Tobin’s Q, but
our analysis includes other performance measures as well, making it less exposed to the
criticism. Moreover, when using Tobin’s Q, we follow a large number of scholars, including
Lindenberg and Ross (1981), Mørck, Schleifer and Vishny (1987), McConnell and Servaes
(1990), and Hermalin and Weisbach (1991).
4.3 Contribution to existing research
This thesis attempts, in all modesty, to contribute to existing literature in two main ways. First,
we provide empirical evidence of a relationship that has, to our knowledge, not been previously
studied. The focus on PE-backed IPOs in existing literature proves the interest for the topic,
and prior studies suggest that continued ownership post IPO may be an essential reason for the
superior performance documented of PE-backed IPOs. Our thesis assists in understanding
whether the outperformance of backed vs. non-backed IPOs is solely due to pre-IPO activities
by the PE firms, or whether continued ownership may have an effect.
Second, the relationship between ownership structure and performance has been
thoroughly examined in previous studies. We add to this literature by examining the relationship
between ownership structure and performance of a specific group of companies, namely PE-
backed, and a specific type of owner, PE firms.
Moreover, by contributing to research into a field with limited empirical attention, we do
so with (i) a comprehensive dataset with extensive use of sources, (ii) various use of
performance measures to capture the full effect, (iii) use of several econometric approaches,
making results more robust.

20
5. Data
In order to answer the research question, we have constructed a dataset in the form of a balanced
panel. This was done through extensive and time-consuming data gathering and processing,
combining data from multiple sources. The use of multiple databases allowed for constructing
and quality assuring a unique combination of different variables. In the following sections, we
present the sample and the procedures used to construct it, define variables and present
descriptive statistics.
5.1 Sample
The sample consists of PE-backed IPOs floated on the US stock market between 01.01.2000
and 01.10.2015. The end date is chosen to have performance data 36 months after the IPO, to
be able to study long-run performance. For each listed company, we have monthly data for 36
months following the IPO. The sample consists of 343 companies, after trimmings according
to Table 1. The complete sample of portfolio companies and PE firms is presented Appendix
A.5.
Table 1 - Sample construction
Description Reduction Sample Size
PE-backed IPOs in the relevant period - 586
Companies delisted within three years after IPO 73 513
No available ownership data 132 381
Poor quality of ownership and performance data 38 343
Final sample - 343
The final sample of 343 PE-backed IPOs with 36 monthly observations, gives us a total
of 12 348 unique observations. The original 586 IPOs were identified using SDC platinum’s
buyout flag. We choose to exclude the companies that are listed for less than three years, to
obtain a balanced panel of a sample with an equal basis for comparison among the companies.
Figure 4 shows the distribution of IPOs across the years in our sample. The IPO activity
is lower around the recessions, especially during the financial crisis of 2008. The reason why
2015 is relatively low is that the last months are not included, due to the abovementioned cut.
In Figure 5 we see the aggregated distribution of the sectors that the companies in our sample
operate in, which shows that the sample is spread over a wide variety of different sectors. The
dominating sector is manufacturing, which represents ~30% of the companies in our sample.

21
Figure 4 - Distribution of IPOs across years
Figure 5 - Distribution of IPOs across sectors
14
8 710
24
40
33
21
4
9
23 22
26
37
44
21
2000 2001 2002 2003 2004 2005 2006 2007 2008 2009 2010 2011 2012 2013 2014 2015
Number of IPOs per year
103
34
32
31
24
20
20
12
11
10
9
9
7
5
5
5
3
2
1
Manufacturing
Finance and Insurance
Information
Retail Trade
Accommodation and Food Services
Scientific and Technical Services
Oil and Gas Extraction
Transportation and Warehousing
Wholesale Trade
Health Care and Social Assistance
Administrative and Support
Real Estate and Rental and Leasing
Construction
Educational Services
Utilities
Arts, Entertainment, and Recreation
Other Services
Management of Companies and…
Public Administration
Number of IPOs per sector
22
5.2 Collection and processing
The process of collecting and processing the data was challenging. After using the SDC
database to identify the PE-backed IPOs in the relevant period, we gathered monthly stock
prices and indices from Datastream. We exclude the effects of underpricing by using the
observation at the start of the month following the IPO as the first observation. The reason for
this is that our interest is whether PE ownership affects the long-run performance through active
ownership and other mechanisms. Periods of underpricing and abnormal returns directly after
the IPO, when the PE ownership usually is at its highest, would distort the analysis.
Company characteristics and financial data were collected from several different sources,
including Datastream, SDC platinum, Bloomberg, Compustat, and financial statements. The
use of different data sources allowed for quality checking the data across the different databases,
utilizing the sources with the most reliable data. By manually looking at a sample of financial
statements, we concluded which source was most accurate for the various variables. It also
enabled for filling gaps and complimenting the data, to obtain as few missing values as possible.
We believe this to have significantly increased the data quality in our dataset. However, the
different databases use different names and identifiers for the same companies, so we were
required to use combinations of name, ticker, isin, cuisip, and listing date, as well as manual
crosschecking to match the data from the different sources.
Historical ownership data is complicated to access, with limited providers. We use
FactSet to gather ownership data, which has available historical monthly ownership data for
listed companies. After identifying the correct companies and manually retrieving ownership
data for each company in our sample, we possessed a collection of ownership stakes for each
stockholder in each company, at the start of every month. We used this data both to calculate
ownership concentration and to construct a variable for PE ownership. Because the stockholder
names are based on different filings, it was a challenge to identify the PE firms amongst all of
the other stockholders. From FactSet, we managed to retrieve a list of all PE deals in the relevant
period, giving us an overview of which PE firms backed the different companies. Using this as
a starting point, we were able to identify most of the PE firms in the ownership data. However,
the names used for the PE firms varies for the different companies, making the matching process
demanding. Also, directors of the PE firms, or a different holding firm, are occasionally listed
as stockholders in the ownership data instead of the PE firm, making the identifying process
even more challenging. We solved this by manually browsing through the “principal

23
stockholders” sections in the IPO prospectuses, where there often is a footnote clarifying the
ultimate owner.
After constructing the dataset, it required more processing. The ownership data have cases
where the ownership stake of a PE firm suddenly drops to zero for up to three consecutive
months and then bounces back up to its original level. Because PE firms usually reduce their
holdings gradually, and do not conduct heavy trading, the missing values should not be
interpreted as zero ownership, but rather a consequence of missing data. We filled these gaps
using two approaches. When possible, we filled the gaps with data from the ownership section
of company reports. When not possible, we filled the gaps with the ownership stake reported
immediately after the gaps. We also used IPO prospectuses to ensure that our first ownership
observation was roughly the same as the post-IPO ownership stake listed in the “principal
stockholders” section, to increase the data quality.
5.3 Variable definitions
Table 2 provides a brief definition of the variables included in our analysis, as well as the source
and frequency of the observations. The table also explains how the variables are calculated.
To calculate stock market return, market return and GDP growth, we use a logarithmic
approach. Logarithmic return is often referred to as continuously compounded return and has
several advantages over simple return. It is often assumed to be normally distributed, which is
a requirement for most econometric models. Logarithmic returns also enable additivity, as two-
period log return is identical to the sum of each period’s log return, and is mathematically more
convenient. By using this method, we are following Sias et al. (2006).

24
Table 2 - Variable definitions and calculations
Variable Definition Frequency Source
Dependent
StockReturn
Monthly stock market return calculated as ln(𝑅𝐼𝑡) − ln(𝑅𝐼𝑡−1), where RI is the total
return index. RI shows theoretical value growth, assuming re-invested dividends
and adjustments for stock splits.
M 1
ROA Return on assets calculated as net income divided by opening balance of total
assets. Q 3, 4, 5
TobinsQ
Calculated as the equity and liabilities market value, divided by the equity and
liabilities book value, under the assumption that liabilities market value is equal
to its book value.
Q 3, 4, 5
Independent5
PE_Ownership
The percentage share of equity ownership held by PE firms backing the IPO at the
start of every month. In the case of syndicates, the shares of the PE firms are
added together.
M 2, 6
Concentration The ownership concentration is measured by the Herfindahl-Hirschman Index,
calculated as the sum of the squared equity positions above 1%. M 2
Concentration_sq Squared Herfindahl-Hirschman Index. M 2
DebtRatio Debt divided by opening balance total assets. Q 3, 4, 5
AssetTurnover Asset turnover, given by revenue divided by the opening balance of total assets. Q 3, 4, 5
TotalAssets Opening balance of total assets. Q 3, 4, 5
Volatility A measure of the risk of price moves, given as the annualized standard deviation
of the relative price change of the closing price for the 30 last trading days.
.
M 3
MB Market to book ratio, market capitalization divided by common shareholders’
equity. Q 3, 4, 5
Liquidity Share turnover given by the average daily trading volume of the stock for the past
month divided by outstanding shares. M 1
MKT_Return
Monthly return for the S&P 500 index6, calculated as ln(𝑆&𝑃𝑡) − ln(𝑆&𝑃𝑡−1). S&P
500 consists of the 500 largest corporations in the US, and is a commonly used
index for stock market performance.
M 1
GDP The monthly increase in US GDP, calculated by ln(𝐺𝐷𝑃𝑡) − ln(𝐺𝐷𝑃𝑡−1). M 1
CashRatio Cash divided by total liabilities.7 M 3, 4, 5
DividendPR Dividend Payout Ratio, dividends divided by net income. Q 3
Revenue Total sales. Q 3, 4, 5
ROS Return on sales, net profit divided by revenue. Q 3, 4, 5
ROE Return on equity, net income divided by shareholders’ equity. Q 3, 4, 5
Period Number of months after IPO for each company. - -
Month Dummy variable for month. - -
Year Dummy variable for year. - -
Where 1 = Datastream, 2 = FactSet, 3 = Bloomberg, 4 = Compustat, 5 = Financial statements, 6 = IPO prospectuses, M =
Monthly, Q = Quarterly
5 PE_Ownership and Concentration are dependent variables when performing simultaneous equations methods. 6 We have tested also tried using Wilshire 5000 as an alternative index, but the differences are negligible. 7 We would prefer to include readily convertible investments as well, but are unable to do so due to data limitations.

25
5.4 Descriptive statistics
Table 3 presents summary statistics for the variables in our analysis.
Table 3 - Descriptive statistics
Variables Mean Median SD Min Max Count
StockReturn 0.002 0.007 0.135 -0.409 0.301 12348
ROA 0.016 0.014 0.068 -0.252 0.211 4116
TobinsQ 1.986 1.640 1.177 0.763 6.619 4116
PE_Ownership 0.330 0.328 0.239 0.000 0.986 12348
Concentration 0.180 0.121 0.162 0.000 0.980 12348
DebtRatio 0.353 0.359 0.256 0.000 1.053 4116
AssetTurnover 0.250 0.208 0.192 0.011 0.850 4116
TotalAssets 2122 831.2 3142 94.72 15715 4116
Volatility 0.457 0.383 0.269 0.160 1.499 12348
MB 2.912 2.611 6.615 -24.54 24.32 4116
CashRatio 0.206 0.067 0.370 0.000 1.923 4116
Liquidity 0.009 0.006 0.009 0.001 0.045 12348
MKT_Return 0.004 0.009 0.039 -0.100 0.090 12348
GDP 0.005 0.005 0.005 -0.011 0.013 12348
DividendPR 0.251 0.000 0.634 0.000 0.650 4116
Revenue 346.9 147.6 488.9 14.69 2431 4116
ROS 0.036 0.047 0.185 -0.769 0.481 4116
ROE 0.024 0.027 0.133 -0.484 0.501 4116
This table provides summary statistics for all variables used in the analysis. ROS and ROE are not included in our
main analysis but are used in robustness discussion in section 7.4.1. The variables are winsorized at the 1st to 99th
percentile. Some accounting variables are observed quarterly. How this is handled and possible effects are
discussed in section 7.5.2. Ratios, indices and return variables are displayed in decimal fractions, and monetary
values are displayed in million USD.
The average PE ownership stake of all 36 months for all companies is 33%, with a
maximum of 99% and a minimum of 0%. The mean of Concentration, calculated as the
Herfindahl index, is 0.18. Average monthly logarithmic stock market return for the companies
in our sample is 0.2% while the average for the market is 0.4%. However, using simple return,
the sample return is 0.9%, and the market return is 0.5%. These differ partly because logarithmic
return handles extreme values differently. Return on assets and Tobin’s Q has averages of 0.016
and 1.986, respectively.

26
It is interesting to know more about the development of PE_ownership because it is our
variable of interest. Figure 6 depicts how average PE ownership develops over the 36 months
post IPO. On average, PE ownership starts at 50% right after the IPO and decreases gradually
towards 19% after 36 months. This indicates that PE firms stay invested in the portfolio with
relatively large positions for more than three years, supporting that IPO is not an immediate
exit for the PE firm.
Another interesting observation is that there does not seem to be any major reductions in
PE ownership on the expiration of the lock-up agreement, usually after six months. There is a
minor increase in the number of shares sold around month six compared to the previous months,
but this stays about the same thereafter. We have conducted a t-test comparing the mean
reduction in ownership in the 6th month post IPO to the following months. The test results are
presented in A.3 and display a high p-value. We fail to reject the null hypothesis of the means
being equal, suggesting that the PE firms stay invested for other reasons than the lock-up
agreement. The graph is falling slightly also before the six months mark because some IPOs
has a shorter lock-up period, and sometimes the PE firm is permitted by the lead underwriter to
sell shares before the lock-up period has expired.8
8 In some circumstances, the lead underwriter allows locked investors to sell some or all of their shares prior to the
lockup expiration; this is referred to as an 'early sell' transaction (Hoque & Lasfer, 2013).
Figure 6 - PE firms’ divestment development

27
As defined in section 5.3, PE_Ownership is calculated by adding the positions of different
PE firms in the cases where several PE firms back the same IPO9. How often this happens is an
interesting finding in itself. In our sample, 52% of the IPOs are backed by more than one single
PE firm. This implies that PE firms often form syndicates to carry out joint investments, sharing
both risks and potential gains. Figure 7 illustrates that 48% of IPOs are backed by a single PE
firm. There is a downward trend, ending with 5% of IPOs being backed by more than four PE
firms.
9 Possible limitations of this are discussed in section 7.5.2.
Figure 7 - IPOs backed by different number of PE firms

28
6. Methodology
This chapter introduces the methodology used in the analysis. An important consideration for
the choice of methodology is the possible endogeneity between PE ownership and company
performance. We start by presenting this issue and the techniques used to handle it. After a
detailed explanation of these techniques, we specify the equations used to answer the research
question and discuss the reasons for including the different variables and our expectations for
their effect.
6.1 Endogeneity and causation of ownership and performance
The relationship between ownership structure and performance causes discrepancies between
earlier studies. The different methodologies used in existing research are based on the views
summarized in Table 4.
Table 4 - Mechanisms and causation of ownership and performance
One-way causation Two-way causation
Exogenous mechanisms Category 1 Infeasible
Endogenous mechanisms Category 2 Category 3
Most prior research belong in the first category, where one-way causation runs from
ownership to performance, and the mechanisms are assumed to be externally given. Studies by,
i.e., McConnel and Servaes (1990) and Mørck et al. (1987) belong in this category. The second
category also assumes one-way causation but consider ownership to be endogenous. Demsetz
and Himmelberg belong in this category, and the initial argument was made by Demsetz (1983),
who argued that ownership structure is an endogenous outcome of decisions that should be
influenced by the profit-maximizing interests of shareholders. This implies that the optimal
level of ownership likely varies with firm characteristics, which also affects performance.
Himmelberg et al. (1999) also find that a large share of cross-sectional variation in ownership
can be explained by unobserved time-invariant firm heterogeneity, i.e., company
characteristics. The third category views ownership and performance as a system of
simultaneous equations, where the causality runs both ways. This creates endogeneity in the

29
form of simultaneity bias. Researchers in this category includes Agrawal and Knoeber (1996),
Cho (1998), Bøhren and Ødegaard (2005) and Demsetz and Villalonga (2001).
6.1.1 In the case of PE ownership
The abovementioned methodologies are based on ownership structure and performance but not
specifically on PE ownership. Although no assumptions have been made about the relationship
between PE ownership and performance, we believe endogeneity may also be present with PE
ownership. Fürth and Rauch (2014) conclude that PE ownership to an extent is determined by
both fund-specific factors and company-specific factors such as size and profitability. It is likely
that these factors also could affect the performance of the portfolio companies.
PE firms also have incentives to change their holdings based on performance in order to
deliver a fair return on LPs capital. They may also adapt to the expectation of future
performance, and might continue to hold their stakes in expectations of future performance
improvements in order to meet requirements.
6.2 Dealing with the endogeneity of PE ownership
The models we present in this thesis use methodology from both the first, second and third
category. We acknowledge that there might be endogeneity issues caused by both unobservable
company characteristics and possible reverse-causality/simultaneity.
The first source of endogeneity is that unobservable individual heterogeneity among the
companies disturbs the relationship between PE ownership and performance. A way to solve
this problem is to use a fixed effects model, as applied by Himmelberg (1999), in which within-
groups transformation eliminates the time-invariant company-specific characteristics. Pinadado
and De La Torre (2004) also argued that the use of panel data allows controlling for
heterogeneity through the individual effects, in which the common determinants for ownership
and performance will be included. Therefore, we utilize panel data and fixed effects models in
our analysis.
The second source of endogeneity is the possibility that performance also determines PE
ownership, creating a simultaneity bias. There are two typical ways of dealing with this. The
first and simplest way is to utilize lagged values of the suspected endogenous variable, either
as a proxy for the endogenous variable or as an instrument in instrumental variable estimation.
Vergara (2010) argues that including lagged variables avoids possible simultaneity problems.

30
Clemens et al. (2012) also address potential bias by using lagged variables and argue that it is
beneficial because they avoid using poor quality instrumental variables. Other studies that
utilize this technique include Aschhoff and Schmidt (2008) and MacKay and Phillips (2005).
We use lagged variables by replacing and instrumenting our endogenous variables PE
ownership, ownership concentration and the different performance measurements with their
lagged values.
The other way of dealing with the simultaneity problem is to use simultaneous equations
models. This method is frequently used in research that is more cited, and Becht et al. (2003)
refer to this method as vastly improved econometrics because it differs markedly from the single
equation methods. Farooque et al. (2005) argue that this approach is the most appropriate
methodology to control for the potential endogenous relationship between ownership and
performance. Examples of other researchers who have used this method are Demsetz and
Villalonga (2001) and Bøhren and Ødegaard (2005). A simultaneous equations model assuming
PE ownership, concentration and the different performance measurements as endogenous
interdependent variables allows for separation of their effects and can reduce the endogeneity
issue. In our analysis, we estimate simultaneous equations models using two-stage least squares
(2SLS) on systems of three structural equations. We combine this with controlling for fixed
effects.
Table 5 depicts the five models that we estimate in our analysis, based on combinations
of methods to deal with endogeneity. Each of these methods will be explained in detail in the
next sections before we specify the regression equations in section 6.3. In section 7.2, the
equations will be estimated using the five models.
Table 5 - Five models combining methods for dealing with endogeneity
Model 1 Model 2 Model 3 Model 4 Model 5
Pooled OLS Fixed effects
Fixed effects
with lags as
proxies
FEIV with lags
as instruments
Simultaneous
equations
with fixed effects
Category 1 Category 2 Category 3 Category 3 Category 3

31
6.2.1 Panel data and fixed effects
Because our dataset is a balanced panel, we can use panel data methods in our analysis. In panel
data, we measure the same companies (N=343) over multiple periods (T=36). This has several
advantages, including increased sample size, reduction of multicollinearity problems, and to
control for unobserved effects. Panel data methods allow us to control for unobservables, which
can be correlated with the regressors and are time-invariant and individual-specific
(Wooldridge J. M., 2016). Based on econometric tests, presented in Appendix A.2, and the
arguments in the previous section regarding endogeneity, we use the fixed effects method in
our analysis.
The general form of panel data can be explained by the following simple example,
inspired by Wooldridge (2016):
𝑦𝑖𝑡 = 𝛽1𝑥𝑖𝑡 + 𝑎𝑖 + 𝑢𝑖𝑡 , 𝑡 = 1,2 … 𝑇
In this equation, 𝑦𝑖𝑡is the dependent variable, 𝑥𝑖𝑡 is the explanatory variable, 𝑢𝑖𝑡 is the
idiosyncratic error term, and 𝑎𝑖 is the unobserved individual-specific effect. If the unobserved
individual-specific effects are correlated with the explanatory variables, OLS estimations will
be biased and inconsistent.
Fixed effects transformation solves this problem and allows for a correlation between 𝑎𝑖
and 𝑥𝑖𝑡. The fixed effects method assumes that the individual-specific effects are constant over
time, and the average of the above equation yields:
𝑦𝑖
= 𝛽1𝑥𝑖 + 𝑎𝑖 + 𝑢𝑖
If we subtract this equation from the first one, we get:
�̈�𝑖𝑡 = 𝛽1�̈�𝑖𝑡 + �̈�𝑖𝑡 , 𝑡 = 1,2 … 𝑇
Where �̈�𝑖𝑡 = 𝑦𝑖𝑡 − 𝑦𝑖 is the time-demeaned data on 𝑦𝑖𝑡. Because we assume 𝑎𝑖 is constant
over time, it is removed from the regression equation, and can no longer create problems in the
estimation. Thus, we can estimate the within group transformed equation by OLS. As argued
in the previous section, the fixed effects transformation will remove the problem of endogeneity
in line with the views of category 2. We use this method in our analysis, and include time
dummies, making it a two-way effect model.
We should also mention some possible drawbacks with the fixed effects method. One
drawback is that variables that are constant for all periods will not be estimated. For example,
it would be interesting for us to include some investor-specific variables, but since these do not
vary over the period, we are unable to estimate them. Besides, if there is not sufficient variation,
the quality of the estimates might decrease.

32
6.2.2 Lagged variables
A common practice for dealing with endogeneity is to use lagged explanatory variables instead
of the endogenous variables, as either a proxy or an instrument. The idea is that the simultaneous
relationship depicted in Figure 8 will create biased estimates. To overcome this, 𝑋𝑡−1 can be
used as in place of 𝑋𝑡. Assuming no unobservables, we have that if 𝑌𝑡 causes 𝑋𝑡, then 𝑌𝑡−1 also
causes 𝑋𝑡−1. The argument is that 𝑋𝑡−1will have an effect on 𝑌𝑡 through its effect on 𝑋𝑡, but 𝑌𝑡
will not affect 𝑋𝑡−1. This implies that 𝐶𝑜𝑣(𝑥𝑡, 𝑢𝑡) ≠ 0 but 𝐶𝑜𝑣(𝑥𝑡−1, 𝑢𝑡) = 0. It makes sense
that performance today does not affect PE ownership in earlier periods, especially if PE
ownership is lagged by several periods. However, in order for this method to solve the whole
problem, the identification assumption is that there is no relationship between 𝑌𝑡 and 𝑌𝑡−1.
Despite being widely used, these methods have received criticism as well. This is
especially true for the method using lagged variable as a proxy. Reed (2015), for instance,
argues that using lagged variable as a proxy does not avoid the inconsistency problems
associated with simultaneity. He also states that using lagged values of endogenous variable as
an instrument can provide an effective estimation strategy, but it requires that (i) the lagged
values do not themselves belong in the corresponding estimating equation, and (ii) they are
sufficiently correlated with the simultaneously determined explanatory variable.
6.2.3 Simultaneous equations models
Simultaneous equations models (SEM) are often used to deal with endogeneity caused by
simultaneity. The usual way to estimate these models is through using an instrumental variable
approach, usually with two-stage least squares (2SLS) estimation. This method estimates a
system of structural equations, where the endogenous explanatory variables typically, but not
always, are the dependent variables from other equations in the system:
𝑋 = 𝑌 + 𝑍 + 𝑒𝑥𝑜𝑔𝑒𝑛𝑜𝑢𝑠 𝑣𝑎𝑟𝑖𝑎𝑏𝑙𝑒𝑠 + 𝑢
𝑌 = 𝑋 + 𝑍 + 𝑒𝑥𝑜𝑔𝑒𝑛𝑜𝑢𝑠 𝑣𝑎𝑟𝑖𝑎𝑏𝑙𝑒𝑠 + 𝑢
𝑍 = 𝑌 + 𝑋 + 𝑒𝑥𝑜𝑔𝑒𝑛𝑜𝑢𝑠 𝑣𝑎𝑟𝑖𝑎𝑏𝑙𝑒𝑠 + 𝑢
Figure 8 - Simultaneous relationship assuming no unobservables

33
A structural equation is identified as one of the equations in the system. All left-hand-side
variables are explicitly taken to be endogenous to the system and are treated as correlated with
the disturbances in the system’s equations. The other variables are treated as exogenous to the
system. These exogenous variables are used as instruments for the endogenous variables.
The 2SLS estimation can be thought of as producing estimates from a 2-step process. The
first step involves developing instrumented values for all endogenous variables by regressing
the endogenous variables on the exogenous variables in the system. In the second step, the
instrumented values are then used in place of the actual endogenous variables in an OLS
regression. This is done for each of the structural equations.
Even though this method, in theory, may be the best way to deal with the simultaneity
problem, there are several drawbacks to this method as well. It is difficult to find suitable
instruments, which will be discussed in detail in section 7.4.3 specifically to our situation.
Moreover, most relationships are sensitive to the choice of instruments and simultaneous
estimation models are not necessarily better than the single equation models (Bøhren &
Ødegaard, 2005).
6.3 Model specification
In the following, we present each of the three regression equations used to answer the
hypotheses. These equations are determined parsimoniously, based on both theory and existing
research. As depicted in Table 5, we use five different models in our analysis. Each of the three
regression equations introduced in this section will be estimated using all five models. We first
specify the equations that will be solved with single equations models, before we specify a
system that will be estimated using simultaneous equation models (SEM). Definitions of all
included variables are found in section 5.3, and the rationale behind their inclusion is in section
6.4.
6.3.1 Single equations models
Using single equations models, we specify one regression equation for stock market return, one
for return on assets and one for Tobin’s Q. Each of these equations will be estimated with pooled
OLS and the panel data method fixed effects (model 1 and 2). Also, the same equations will be
estimated using lagged suspected endogenous variables, both as proxies in the fixed effects
model (model 3), and as instruments in an instrumental variable estimation (model 4).

34
We estimate equations that include the variable of interest, PE_Ownership, and the other
ownership structure variable, Concentration. Besides, several time-variant company-specific
control variables are included, as well as some time variables.
6.3.1.1 Stock market return
The first hypothesis and the primary objective of this study is to determine whether PE
ownership matters for company stock market performance. To investigate this, we define the
following regression equation:
𝑺𝒕𝒐𝒄𝒌𝑹𝒆𝒕𝒖𝒓𝒏𝒊𝒕 = 𝛽0 + 𝛽1𝑃𝐸_𝑂𝑤𝑛𝑒𝑟𝑠ℎ𝑖𝑝𝑖𝑡 + 𝛽2𝐶𝑜𝑛𝑐𝑒𝑛𝑡𝑟𝑎𝑡𝑖𝑜𝑛𝑖𝑡 + 𝛽3𝐶𝑜𝑛𝑐𝑒𝑛𝑡𝑟𝑎𝑡𝑖𝑜𝑛_𝑠𝑞𝑖𝑡
+ 𝛽4𝐷𝑒𝑏𝑡𝑅𝑎𝑡𝑖𝑜𝑖𝑡 + 𝛽5𝐴𝑠𝑠𝑒𝑡𝑇𝑢𝑟𝑛𝑜𝑣𝑒𝑟𝑖𝑡 + 𝛽6𝐿𝑁_𝑇𝑜𝑡𝑎𝑙𝐴𝑠𝑠𝑒𝑡𝑠𝑖𝑡 + 𝛽7𝑉𝑜𝑙𝑎𝑡𝑖𝑙𝑖𝑡𝑦𝑖𝑡
+ 𝛽8𝑀𝐵𝑖𝑡 + 𝛽9𝐿𝑖𝑞𝑢𝑖𝑑𝑖𝑡𝑦𝑖𝑡+ 𝛽10𝑀𝐾𝑇_𝑅𝑒𝑡𝑢𝑟𝑛𝑡 + 𝛽11𝑃𝑒𝑟𝑖𝑜𝑑𝑖𝑡 + 𝐷1𝑌𝑒𝑎𝑟𝑡
+ 𝐷2𝑀𝑜𝑛𝑡ℎ𝑡 + 𝑢𝑖𝑡
(1)
When specifying this equation, we rely on financial theory and previous research. We
use a firm-characteristics approach, which allows for a larger number of risk factors/firm
characteristics that impact stock returns than a standard portfolio approach. This approach, and
the included control variables, are inspired by, e.g., Eugster and Isakov (2018), Lilienfied-Toal
and Ruenzi (2013) and Brennan et al. (1998), who report several individual firm characteristics
that can drive returns and whose influence is not captured by the factor models building on
work by, i.a., Fama and French (1993). Although we do not calculate abnormal return, some of
the right-hand side variables proxy the usual Fama-French factors, like the size and value of the
company. By using panel data and normal return as dependent variable, we are following
researchers like El-Masry (2017) and Eugster and Isakov (2018).
6.3.1.2 Return on assets
The second hypothesis is that PE ownership positively affects return on assets, indicating an
effect on accounting performance. We specify the following equation:
𝑹𝑶𝑨𝒊𝒕 = 𝛽0 + 𝛽1𝑃𝐸_𝑂𝑤𝑛𝑒𝑟𝑠ℎ𝑖𝑝𝑖𝑡 + 𝛽2𝐶𝑜𝑛𝑐𝑒𝑛𝑡𝑟𝑎𝑡𝑖𝑜𝑛𝑖𝑡 + 𝛽3𝐶𝑜𝑛𝑐𝑒𝑛𝑡𝑟𝑎𝑡𝑖𝑜𝑛_𝑠𝑞𝑖𝑡 + 𝛽4𝐷𝑒𝑏𝑡𝑅𝑎𝑡𝑖𝑜𝑖𝑡
+ 𝛽5𝐴𝑠𝑠𝑒𝑡𝑇𝑢𝑟𝑛𝑜𝑣𝑒𝑟𝑖𝑡 + 𝛽6𝐿𝑁_𝑇𝑜𝑡𝑎𝑙𝐴𝑠𝑠𝑒𝑡𝑠𝑖𝑡 + 𝛽7𝐺𝐷𝑃𝑡 + 𝛽8𝐶𝑎𝑠ℎ𝑅𝑎𝑡𝑖𝑜𝑖𝑡
+ 𝛽9𝑃𝑒𝑟𝑖𝑜𝑑𝑖𝑡 + 𝐷1𝑌𝑒𝑎𝑟𝑡 + 𝐷2𝑀𝑜𝑛𝑡ℎ𝑡 + 𝑢𝑖𝑡
(2)

35
6.3.1.3 Tobin’s Q
To test the third hypothesis, we estimate an equation with Tobin’s Q as the dependent variable.
The equation is specified as:
𝑻𝒐𝒃𝒊𝒏𝒔𝑸𝒊𝒕 = 𝛽0 + 𝛽1𝑃𝐸_𝑂𝑤𝑛𝑒𝑟𝑠ℎ𝑖𝑝𝑖𝑡 + 𝛽2𝐶𝑜𝑛𝑐𝑒𝑛𝑡𝑟𝑎𝑡𝑖𝑜𝑛𝑖𝑡 + 𝛽3𝐶𝑜𝑛𝑐𝑒𝑛𝑡𝑟𝑎𝑡𝑖𝑜𝑛_𝑠𝑞𝑖𝑡
+ 𝛽4𝐷𝑒𝑏𝑡𝑅𝑎𝑡𝑖𝑜𝑖𝑡 + 𝛽5𝐴𝑠𝑠𝑒𝑡𝑇𝑢𝑟𝑛𝑜𝑣𝑒𝑟𝑖𝑡 + 𝛽6𝐿𝑁_𝑇𝑜𝑡𝑎𝑙𝐴𝑠𝑠𝑒𝑡𝑠𝑖𝑡 + 𝛽7𝑉𝑜𝑙𝑎𝑡𝑖𝑙𝑖𝑡𝑦𝑖𝑡
+ 𝛽8𝑀𝐵𝑖𝑡 + 𝛽9𝐿𝑖𝑞𝑢𝑖𝑑𝑖𝑡𝑦𝑖𝑡 + 𝛽10𝑃𝑒𝑟𝑖𝑜𝑑 + 𝐷1𝑌𝑒𝑎𝑟𝑡 + 𝐷2𝑀𝑜𝑛𝑡ℎ𝑡 + 𝑢𝑖𝑡
(3)
6.3.1.4 Lagged variables as proxies and instruments
Because we suspect that some of the variables in the equations specified above might be
endogenous, we estimate them again using the lagged values of these variables. In model 3, we
simply replace the variables with their lagged values as proxies in the fixed effects model. Then,
using model 4, we estimate the equations using instrumental variable estimation and 2SLS. The
equations are specified exactly as in (1), (2) and (3), except that the possible endogenous
variables, PE_Ownership, Concentration, and Concentration_sq are instrumented using lagged
values of the variables. We use three months lagged values as proxies and instruments, trying
to balance a trade-off between relevance and exogeneity.10
6.3.2 Simultaneous equations models
Because there might be simultaneity between PE ownership, concentration, and the different
performance measurements, we specify systems of three structural equations to be able to
separate the effects (model 5). We do this by using 2SLS estimation with fixed effects, where
the assumed exogenous variables are used as instruments for the endogenous ones. The
dependent variable in each equation also represents the endogenous variables. Following
Bøhren and Ødegaard (2005) we choose only to endogenize three variables, as we cannot hope
to validly restrict a system of equations including all possible endogenous variables from the
equations specified in the previous section.
The systems consist of the following three structural equations:
10 Three months are chosen based on relevance and endogeneity tests for the instruments, using varying number of
lagged periods.

36
I. Equation (1), (2) or (3)
II. 𝑷𝑬_𝑶𝒘𝒏𝒆𝒓𝒔𝒉𝒊𝒑𝒊𝒕 = 𝛽0 + 𝛽1𝑃𝑒𝑟𝑓𝑜𝑟𝑚𝑎𝑛𝑐𝑒𝑖𝑡 + 𝛽2𝐶𝑜𝑛𝑐𝑒𝑛𝑡𝑟𝑎𝑡𝑖𝑜𝑛𝑖𝑡 +
𝛽3𝐿𝑁_𝑇𝑜𝑡𝑎𝑙𝐴𝑠𝑠𝑒𝑡𝑠𝑡 + 𝛽4𝐿𝑖𝑞𝑢𝑖𝑑𝑖𝑡𝑦𝑖𝑡 + 𝛽5𝐷𝑒𝑏𝑡𝑅𝑎𝑡𝑖𝑜𝑖𝑡 + 𝛽6𝑉𝑜𝑙𝑎𝑡𝑖𝑙𝑖𝑡𝑦𝑖𝑡 +
𝛽7𝑅𝑒𝑣𝑒𝑛𝑢𝑒𝑖𝑡 + 𝛽8𝐷𝑖𝑣𝑖𝑑𝑒𝑛𝑑𝑃𝑅𝑖𝑡 + 𝛽9𝑃𝑒𝑟𝑖𝑜𝑑𝑖𝑡 + 𝐷1𝑌𝑒𝑎𝑟𝑡 + 𝐷2𝑀𝑜𝑛𝑡ℎ𝑡 + 𝑢𝑖𝑡
(4)
III. 𝑪𝒐𝒏𝒄𝒆𝒏𝒕𝒓𝒂𝒕𝒊𝒐𝒏𝒊𝒕 = 𝛽0 + 𝛽1𝑃𝑒𝑟𝑓𝑜𝑟𝑚𝑎𝑛𝑐𝑒𝑖𝑡 + 𝛽2𝑃𝐸_𝑂𝑤𝑛𝑒𝑟𝑠ℎ𝑖𝑝𝑖𝑡 +
𝛽3𝐿𝑁_𝑇𝑜𝑡𝑎𝑙𝐴𝑠𝑠𝑒𝑡𝑠𝑡 + 𝛽4𝐿𝑖𝑞𝑢𝑖𝑑𝑖𝑡𝑦𝑖𝑡 + 𝛽5𝐷𝑒𝑏𝑡𝑅𝑎𝑡𝑖𝑜𝑖𝑡 +
𝛽6𝑉𝑜𝑙𝑎𝑡𝑖𝑙𝑖𝑡𝑦𝑖𝑡+ 𝛽7𝑅𝑒𝑣𝑒𝑛𝑢𝑒𝑖𝑡 + 𝛽8𝐷𝑖𝑣𝑖𝑑𝑒𝑛𝑑𝑃𝑅𝑖𝑡 + 𝛽9𝑃𝑒𝑟𝑖𝑜𝑑𝑖𝑡 + 𝐷1𝑌𝑒𝑎𝑟𝑡 +
𝐷2𝑀𝑜𝑛𝑡ℎ𝑡 + 𝑢𝑖𝑡
(5)
Where the first equation is either equation (1), (2) or (3), specified in the previous
section, except that Concentration_sq is excluded to limit the number of endogenous variables.
The variable Performance in the second and third equation of the system is either StockReturn,
ROA or TobinsQ, from the first equation. The dependent variables of each structural equation
are also included as explanatory variables in the other equations. We believe that Performance,
PE_ownership, and Concentration might all affect each other, and be determined
simultaneously. This is the reason why simultaneous equations models (SEM) are required. All
of the structural equations are identified, passing the order and rank conditions, which is
discussed in more detail in section 7.4.3.
6.4 Rationale for variable inclusion and expectations
In this section, we attempt to justify the included control variables in the performance equations
(1-3) and the ownership equations (4-5). We also explain our expectation for the sign of the
coefficients. The majority of the control variables are included regardless of the chosen
performance measure. However, certain variables are included for a specific measure. Some of
the variables that affect stock market return specifically are also included in the Tobin’s Q
equation since the numerator in Tobin’s Q is directly affected by the stock return.
In addition to our interest variable, PE_Ownership, we include a set of control variables
that might be correlated with both PE_Ownership and Performance, aiming to prevent omitted
variable bias. Thus, we provide models including several of the most critical determinants of
performance. This methodology is following the motivation by Heracleous (2001) who urges
scholars to develop methodologies that account for multiple and multi-directional influences on

37
performance, rather than using models that attempt to utilize only one element, like
PE_Ownership.
6.4.1 Performance equations
Our variable of interest, PE_Ownership, is included in order to examine the effect it has on
performance. We believe there are two main reasons to expect PE_Ownership to affect
performance positively. First, the more ownership PE firms have retained in the portfolio
companies, the stronger are their incentives to influence the performance positively. Second,
financial theories and mechanisms suggest that PE firms are able to affect performance
positively, as discussed in section 4.1.
Concentration is included for two reasons. The first is that several governance theories
argue that ownership concentration can influence the company and its performance. The second
reason, and in our case more important, is to be able to separate the effect of ownership
Concentration and PE_Ownership. The concentration of ownership may have some effect
regardless of whether it is caused by a large PE firm or other large shareholders, but we want
to see if PE ownership has an effect beyond this. If Concentration were excluded from the
regression, it would end up in the error term, and part of its effect would be picked up by PE
ownership. We have also included the squared version of this variable, as previous studies have
suggested that a quadratic relationship might exist. Thomsen and Pedersen (2000) and Demsetz
and Villalong (2001) are among studies to investigate the relationship between concentration
and performance. As their results are conflicting, we have no clear expectations for the
coefficient of Concentration.
DebtRatio indicates how much of the assets that are financed by debt. By using it to
explain variation in company performance, we follow i.a. Lee (1992) and Chen (2006). Based
on their findings and that it might mitigate the free cash flow problem described by Jensen
(1986), we expect it to have a positive coefficient. In certain countries, like the US, leverage
could also potentially increase company value due to tax deductibility of interest. On the other
hand, it can increase the probability of costly financial distress.
AssetTurnover controls for firm efficiency and productivity, and improvement of this is
expected to affect performance positively. Other researchers who have included AssetTurnover
when explaining the performance of PE-backed IPOs include Levis (2011) and Meles et al.
(2014).

38
We want to control for company size due to the possibility of it affecting return, and we
want to allow for a non-linear relationship. We use LN_TotalAssets as a proxy for size,
following, among others, Belghitar et al. (2011) and Dushnitsky and Lenox (2006). To ensure
robustness, we have also tried other proxies for size, which gave concurring results11. Previous
research has suggested small companies to outperform large companies for both stock market
return (F.Fama & R.French, 1993) and accounting performance (Dushnitsky & Lenox, 2006),
which is why we expect a negative coefficient.
Volatility is our risk measure, and it is given as the standard deviation of the stock. We
use this risk measure because we want to control for total risk. While beta is a common risk
measure for portfolios, many consider standard deviation of a security’s return a good predictor
for its risk premium, and regards standard deviation as the best measure of risk for individual
securities.12 Financial theory and asset pricing models suggest that investors should be
compensated for increased volatility. However, it is a common finding that there is a negative
relationship between volatility and stock market return when looking at single stocks. One
theory for this is that if expected risk premiums are positively related to expected volatility,
then an unexpected positive change in volatility increases future expected risk premiums and
lowers current stock prices (French, Schwert, & Stambaugh, 1987). Therefore, we expect a
negative relationship.
MB is commonly used to predict stock market performance, as research has demonstrated
that value stocks (low MB) tend to outperform growth stocks (high MB) in the long run (F.Fama
& R.French, 1993). Thus, we expect the coefficient for MB to be negative.
Liquidity is included as a proxy for the liquidity of the stock, and it indicates to what
degree the stock can be bought or sold in the market without affecting the price. A high level
of trading activity characterizes a liquid stock, whereas low activity may lead to changes in the
price when the stock is traded. By including it as a variable to determine stock return, we are
following Gompers and Metrick (1997) and Bøhren and Ødegaard (2005). Although we expect
a significant coefficient, the direction is not clear.
MKT_Return is included as logarithmic returns. Most stocks covariate with the market,
making it a useful explanatory variable for stock market return. Because few stocks are
defensive (counter-cyclical), we expect MKT_Return to affect stock market return positively.
11 Alternative proxies for size: logarithm of revenue, market capitalization and the sum of market value of equity and
book value of debt. 12 See for example Hirschleifer (1958) or Gordon (1962).

39
Like Meles et al. (2014), we include GDP to take into account the effect a general change
of the American economy has on accounting performance. As GDP increases, the economy
improves, which we believe to have a positive impact on the accounting performance of the
companies in our sample.
CashRatio is included in order to have a proxy for a firm’s capacity to meet its short-term
financial obligations. In general, the higher the level of liquidity the better. Therefore, we expect
a positive effect on return on assets.
Period is included to account for a potential difference in performance across the years
following the IPO. IPO underperformance is a well-known phenomenon. Hoechle and Schmid
(2008) find that the underperformance is more pronounced the first year post IPO. Therefore,
we have included Period as a dummy variable to account for this effect, and expect period to
affect performance positively, at least for stock market performance.
Year dummies are included to account for potential unobserved year-specific factors that
influence performance. During our sample period, the economy has experienced vast
fluctuations, especially due to the Dot-com bubble and the 2008 financial crisis. As shown in
Figure 4, IPO activity is very low in recessions, implying that our data is modestly affected by
this. Nonetheless, it might be that the sample of firms going public in the recessions is skewed;
only managers knowing their firm is superior would list the firm knowing the access to capital
is limited. Because company performance may be affected by the economy in general and the
economic downturns in particular, it makes sense to include Year as a dummy variable.
Month dummies are included with the same rationale, to control for possible month-
specific factors affecting performance, caused by, e.g., the January effect. Although we include
Year and Month, we need to acknowledge that these dummies are unlikely to account for all
unobserved time-specific factors that influence performance. In addition to economic
recessions, our sample period covers the introduction of the Sarbanes-Oxley Act, and variation
in PE funding might be substantial, for instance, due to varying opportunity cost of investing.
This might indicate that time-specific factors to some extent affect our analysis, but we believe
that time dummies account for this in a adequate manner.

40
6.4.2 Ownership equations
Since the ownership equations are not our primary interest, and we only specify them to be able
to run simultaneous equations models, we will only briefly discuss these equations. Given that
previous chapters have discussed a potential reverse causality between performance and PE
ownership, we include the performance measurements StockReturn, ROA and TobinsQ in the
equation with PE_Ownership as the dependent variable. We expect there to be a negative
relationship between the different performance measures and PE_Ownership, as the PE firm
will sell their shares in periods with high performance, in order to achieve a return on their
investments. This effect is probably strongest with stock market return, but it is generally
familiar that stock market return is higher when accounting performance is strong. In addition
to these variables of interest, different control variables are included, based on studies from
Fürth & Rauch (2014), Chao (2011), and Visnjic (2013). Because PE firms exit gradually post
IPO, Period is an essential explanatory variable and should have a negative relationship with
PE_Ownership.
The Concentration equation is almost identical to the one of PE_Ownership, as many of
the same variables are relevant. Because there might exist reverse causation also from
Performance to Concentration, the different performance measurements are included as
explanatory variables. Although we expect a significant relationship, the direction is unclear.
Large owners may want to increase their holdings further when the return is high and the
company is doing well, but they also have incentives to cash out on their investments for a high
return. This is in line with the findings of previous studies, who find varying results (Bøhren &
Ødegaard, 2005). We also include several control variables to explain variation in
Concentration, inspired by, among others, Pedersen and Thomsen (2000), Demsetz and
Villalonga (2001), Richter and Weiss (2013) and Shyu (2013).

41
7. Analysis
In this chapter, we present the findings of our analysis. First, we discuss which of the five
regression models are expected to be the most reliable, before we present and discuss the
regression results. We then summarize and explain the findings and deliberate on the robustness
and limitations of the analysis.
7.1 Model preferences
Before showing and interpreting the results from our analysis, we find it useful first to discuss
how we will weigh the different models in the interpretation of the results. As specified in
section 6.2, we use the five models in Table 6 for each of the three specified equations of
interest.
Table 6 – Five models used in analysis
Model 1 Model 2 Model 3 Model 4 Model 5
Pooled OLS Fixed effects
Fixed effects
with lags as
proxies
FEIV with lags
as instruments
Simultaneous
equations
with fixed effects
The first model ignores both the possible two-way causation and endogeneity of PE
ownership. Model 1 is included mostly for comparison and will not be emphasized in
conclusions. The second model takes care of the unobserved company-specific heterogeneity,
making it more reliable than the first. Many researchers studying ownership structure and
performance use this approach and assumes that it provides the correct picture of reality because
much of the cross-company variation in ownership can be explained by unobserved company-
specific characteristics (Himmelberg, Palia, & Hubbard, 1999). However, there are some
reasons to believe that there might be two-way causation between PE ownership and
performance. If that is the case, model 3-5 will provide better estimates for the true
relationships, because they try to deal with the possible simultaneity/reverse causation in
addition to utilizing fixed effects transformations. Model 3 and 4 use lagged endogenous
variables as proxies and instruments, respectively. These methods are widely used, but they
also receive criticism for not necessarily solving the endogeneity problem. Nonetheless, they
are likely improvements from model 2. Finally, model 5 is estimated using simultaneous
equations models, and is in theory probably best model to solve the simultaneity bias, if it exists.

42
It is, however, difficult to know if we have found the best possible instruments and specified
the system correctly, as the estimates are sensitive to the choice of instruments.
Because there is no agreement among scholars as to what kind of endogeneity
mechanisms are present in the case of PE ownership and performance, as well as the fact that
there are no perfectly correct econometric models to solve the accompanying problems, our
interpretations and conclusions will primarily be based on the full range of models. That is, we
will emphasize whether or not the different models show similar results regarding the direction
and magnitude of the coefficients, and not base our conclusions on a single model. We believe
this will provide us with a solid basis for interpreting the relationships.

43
7.2 Results
In this section, we present and discuss the results concerning our three hypotheses introduced
in section 4.2. The main focus in these discussions is on the variable of interest, PE_ownership,
rather than on the remaining control variables.
7.2.1 Stock market return
The primary objective and hypothesis in this thesis were to determine whether post-IPO PE
ownership affects the stock market return for the PE-backed companies. Using the five models
previously discussed provides the regression results presented in Table 7.
Table 7 - Regression results for StockReturn
StockReturn Model 1 Model 2 Model 3 Model 4 Model 5
Pooled OLS Fixed
effects
FE with
lags
FEIV SEM
PE_Ownership -0.011 0.063*** 0.093*** 0.067***
L3.PE_Ownership 0.047***
Concentration 0.052** 0.064 0.005 -0.051
L3.Concentration 0.078
Concentration_sq -0.055** -0.094 -0.050
L3.Concentration_sq -0.109*
DebtRatio -0.012** 0.006 0.006 0.004 0.013***
AssetTurnover 0.018*** 0.081*** 0.080*** 0.079*** 0.094**
LN_TotalAssets 0.156 -1.693** -1.865*** -1.771** -0.940*
Volatility -0.069*** -0.039*** -0.039*** -0.040*** 0.105***
MB 0.000 0.000 -0.000 0.000 -0.001
Liquidity -0.482** -2.321*** -2.524*** -2.290*** -2.818***
MKT_Return 1.299*** 1.249*** 1.254*** 1.251*** 1.361***
Period -0.000** -0.002*** -0.001** 0.001*** -0.008***
Years Yes Yes Yes Yes Yes
Months Yes Yes Yes Yes Yes
_cons -0.048* -0.723*** -0.728*** -0.502*** 0.144***
N 12348 12348 11319 11319 12348
R2 0.212 0.230 0.233
adj. R2 0.209 0.227 0.230
This table displays regression results for equation (1) with StockReturn as the dependent variable. PE_Ownership
is the variable of interest, and the rest are included as control variables. Significance levels of 1%, 5%, and 10%
are denoted as ***, **, and *, respectively. Models are estimated with robust standard errors and clustered on
company level. The regressions use monthly observations. The variables are winsorized at the 1st to 99th
percentile. Because there are both advantages and disadvantages to this method, we provide regression outputs
with non-winsorized data in the robustness section 7.4.2. R2 is not reported for model 4 and 5 as it is not helpful.13
13 R2 from IV estimation is not useful for comparison and does not have natural interpretation. (Wooldridge J. M.,
2016). It is also excluded from all following models.

44
Starting with the most important variable, we see that PE_Ownership is statistically
significantly positive in model 2-5. Even if none of the models are perfect, the fact that they all
show similar results provides strong indications that the true relationship is in fact positive. The
estimated coefficients lie between 0.047 and 0.0932. This implies that if the PE firm increases
its equity ownership share by one percentage point, the stock market return will increase by
~0.048-0.098 percentage points, ceteris paribus. This will be the opposite way in practice,
because the PE firm rarely increases holdings post IPO, but instead decreases ownership share
over time. This decrease will according to the results reduce stock market return for the PE-
backed company. These results confirm our first hypothesis, providing evidence for the fact
that post-IPO PE ownership positively affects the portfolio companies long-run stock market
performance.
Concentration is positively significant in model 1 but insignificant in all the other models.
The coefficient for Concentration_sq is negative in all models, implying a possible inflection
point after a certain level. Nonetheless, due to the lack of significant results, we cannot conclude
that concentration affects stock market return.
MKT_Return significantly affects stock market return, which is highly expected. The
coefficients are positive and above 1. This implies that on average, one percentage point
increase in the stock market index leads to, all else equal, ~1.3 percentage points increase in
stock market return for the company.
LN_TotalAssets is included as a proxy for size and is expected to be negative. In the
present case, the coefficients are significant and negative in most models, implying that an
increase in the size of the company will lead to a reduction in its stock market return, ceteris
paribus.
AssetTurnover is positive and significant in all models. This is also in line with
expectations, as productivity can be a driver for stock market performance. MB is, however, not
significant in any of the models and does not seem to affect stock market return. DebtRatio is
also inconclusive, while Liquidity is negative and significant in most models, implying that
higher daily trading volume decreases return. Volatility also has a negative effect on stock
market return in most models, which is a common finding, as previously discussed.

45
7.2.2 Return on assets
Table 8 shows the regression results for the return on assets equation, to determine whether PE
ownership also affects accounting performance.
Table 8 - Regression results for ROA
ROA Model 1 Model 2 Model 3 Model 4 Model 5
Pooled OLS Fixed
effects
FE with
lags
FEIV SEM
PE_Ownership -0.052*** -0.049 -0.040 -0.030
L3.PE_Ownership -0.033
Concentration 0.027 0.052 0.028 0.047
L3.Concentration 0.034
Concentration_sq 0.001 -0.031 -0.016 -0.0346
L3.Concentration_sq -0.029
DebtRatio -0.036*** -0.049*** -0.054*** -0.052*** -0.006
AssetTurnover 0.083*** 0.111*** 0.111*** 0.110*** 0.076***
LN_TotalAssets 0.004* 0.016* 0.020** 0.019** 0.006***
GDP 0.279 0.213 0.205 0.215 0.337
CashRatio -0.004 -0.006 -0.003 -0.004 -0.001
Period -0.001*** -0.001** -0.001** -0.001*** -0.002***
Years Yes Yes Yes Yes Yes
Months Yes Yes Yes Yes Yes
_cons 0.003 -0.026 -0.026 -0.058 0.018
N 4116 4116 3087 3087 4116
R2 0.129 0.063 0.063
adj. R2 0.123 0.056 0.056
This table displays regression results for equation (2) with ROA as the dependent variable. PE_Ownership is the
variable of interest, and the rest are included as control variables. Significance levels of 1%, 5%, and 10% are
denoted as ***, **, and *, respectively. Models are estimated with robust standard errors and clustered on company
level. The regressions use quarterly observations. How this is handled and possible effects are discussed in section
7.5.2. The variables are winsorized at the 1st to 99th percentile. Because there are both advantages and
disadvantages to this method, we provide regression outputs with non-winsorized data in the robustness section
7.4.2. Regressions using alternative accounting measures instead of ROA are presented in section 7.4.1.
PE_Ownership is to our surprise not significant in any of the models we emphasize, which
disproves our second hypothesis. In fact, the coefficient is negative in all models, although none
of these are significant, and should not be emphasized. Based on these results, we are unable to
conclude that PE ownership has a significant effect on return on assets.
Concentration has positive coefficients in most models with a possible inflection point
but does not seem to have a significant effect on ROA, which is no surprise given the conflicting
results from previous studies.
GDP was expected to positively affect ROA, as GDP growth is an indicator of how well
the overall economy is doing. The lack of significance may be a result of the inclusion of
dummies for years and months, which may remove some of these effects. AssetTurnover is

46
positive and significant, in line with expectations, while DebtRatio is significantly negative.
Size seems to have a positive effect on return on assets, as LN_TotalAssets is significant in most
models. CashRatio is not significant in any model, and we cannot conclude on its effect.
7.2.3 Tobin’s Q
To test the third hypothesis, we estimate the five models with Tobin’s Q as the dependent
variable. This provides the output in Table 9.
Table 9 - Regression results for Tobin's Q
TobinsQ Model 1 Model 2 Model 3 Model 4 Model 5
Pooled OLS Fixed
effects
FE with
lags
FEIV SEM
PE_Ownership -0.296 0.289 0.457* 0.238***
L3.PE_Ownership 0.342*
Concentration 0.612 -1.087* -1.529** -2.482
L3.Concentration -0.927
Concentration_sq -1.445 0.792 1.141** 1.825*
L3.Concentration_sq 0.581
DebtRatio -0.811*** 0.693*** 0.625*** 0.628*** 1.078***
AssetTurnover 1.787*** 2.354*** 2.222*** 2.209*** 2.956**
LN_TotalAssets -0.485*** -0.847*** -0.893*** -0.893*** -0.812***
Volatility 0.265** 0.201*** 0.207*** 0.211*** 0.249***
MB 0.021* 0.010*** 0.011*** 0.011*** -0.223**
Liquidity 22.521*** -5.107*** -8.333*** -8.913*** -7.609***
Period -0.016*** -0.014*** -0.012*** -0.010*** -0.072***
Years Yes Yes Yes Yes Yes
Months Yes Yes Yes Yes Yes
_cons 0.295 -4.492*** -4.538*** -4.182*** 4.439**
N 4116 4116 3087 3087 4116
R2 0.274 0.503 0.499
adj. R2 0.272 0.502 0.497
This table displays regression results for equation (3) with TobinsQ as the dependent variable. PE_Ownership is
the variable of interest, and the rest are included as control variables. Significance levels of 1%, 5%, and 10% are
denoted as ***, **, and *, respectively. Models are estimated with robust standard errors and clustered on company
level. The regressions use quarterly observations. How this is handled and possible effects are discussed in section
7.5.2. The variables are winsorized at the 1st to 99th percentile. Because there are both advantages and
disadvantages to this method, we provide regression outputs with non-winsorized data in the robustness section
7.4.2
PE_Ownership has positive coefficients in model 2-5 but is only significant at the 5%
level in model 5, and the 10% level in model 3 and 4. This gives indications that the true
relationship between PE ownership and Tobin’s Q is positive. However, we cannot comfortably
affirm our third hypothesis stating that PE ownership positively affects Tobin’s Q.
Concentration seems to have a negative effect on Tobin’s Q, reducing performance as
concentration increases. Despite that, these coefficients are not significant, and we cannot
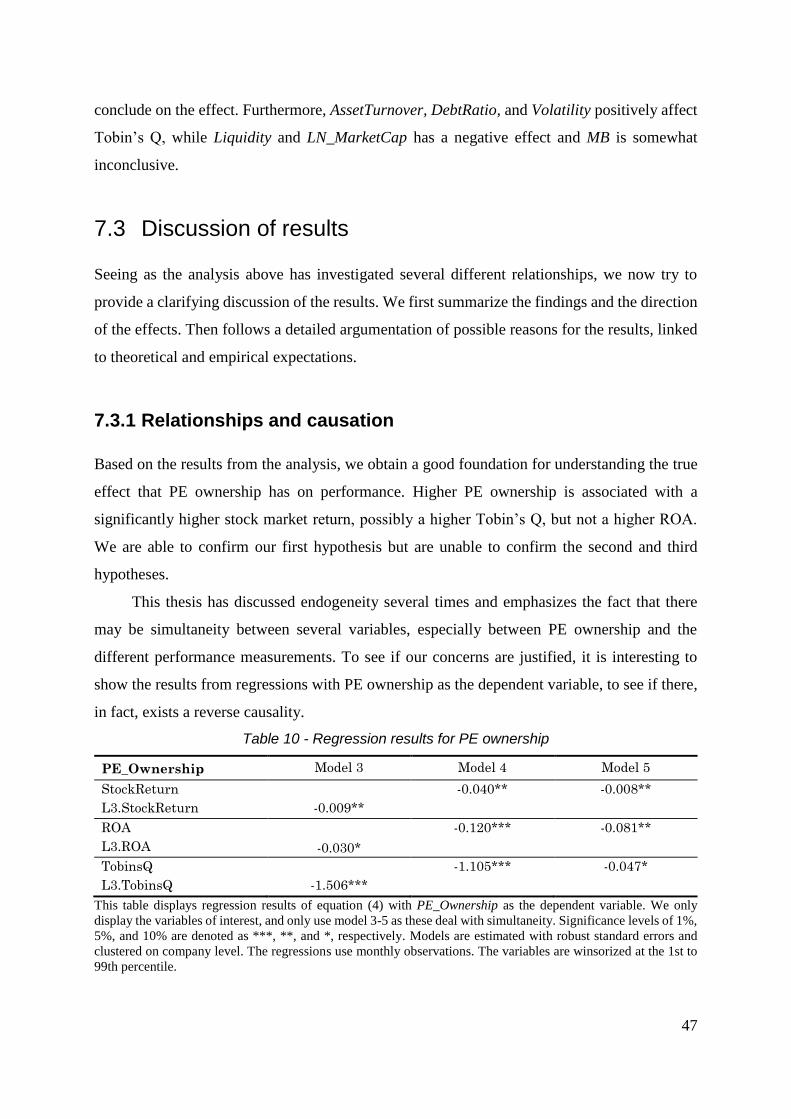
47
conclude on the effect. Furthermore, AssetTurnover, DebtRatio, and Volatility positively affect
Tobin’s Q, while Liquidity and LN_MarketCap has a negative effect and MB is somewhat
inconclusive.
7.3 Discussion of results
Seeing as the analysis above has investigated several different relationships, we now try to
provide a clarifying discussion of the results. We first summarize the findings and the direction
of the effects. Then follows a detailed argumentation of possible reasons for the results, linked
to theoretical and empirical expectations.
7.3.1 Relationships and causation
Based on the results from the analysis, we obtain a good foundation for understanding the true
effect that PE ownership has on performance. Higher PE ownership is associated with a
significantly higher stock market return, possibly a higher Tobin’s Q, but not a higher ROA.
We are able to confirm our first hypothesis but are unable to confirm the second and third
hypotheses.
This thesis has discussed endogeneity several times and emphasizes the fact that there
may be simultaneity between several variables, especially between PE ownership and the
different performance measurements. To see if our concerns are justified, it is interesting to
show the results from regressions with PE ownership as the dependent variable, to see if there,
in fact, exists a reverse causality.
Table 10 - Regression results for PE ownership
PE_Ownership Model 3 Model 4 Model 5
StockReturn -0.040** -0.008**
L3.StockReturn -0.009**
ROA -0.120*** -0.081**
L3.ROA -0.030*
TobinsQ -1.105*** -0.047*
L3.TobinsQ -1.506***
This table displays regression results of equation (4) with PE_Ownership as the dependent variable. We only
display the variables of interest, and only use model 3-5 as these deal with simultaneity. Significance levels of 1%,
5%, and 10% are denoted as ***, **, and *, respectively. Models are estimated with robust standard errors and
clustered on company level. The regressions use monthly observations. The variables are winsorized at the 1st to
99th percentile.

48
In Table 10, we see extracts from regressions with PE_Ownership as the response
variable, using the three regression models used throughout the analysis to deal with
simultaneity. Both StockReturn, ROA, and TobinsQ have significant coefficients, indicating that
they might affect the level of PE ownership. The fact that the estimated coefficients are negative
is in line with the expectations explained in section 6.4.2, implying that PE firms liquidate their
shares in periods of high performance, presumably to maximize return on the investments of
the fund. This provide indications of possible causation going both from performance to PE
ownership and vice versa, supporting the choice to utilize several methods in the analysis. This
is further supported by the interviews we have conducted, where the PE firms’ representatives
state that PE firms are highly aware of the companies’ return and try to time the market to
maximize return.
7.3.2 Explanations of results
We have stated how PE ownership affects three performance measures, and we now intend to
explain possible reasons for our findings. Before doing so, we emphasize that the goal of this
study has not been to isolate the effects of, i.a., activism and signaling, but instead analyze the
total effect of retained PE ownership. Thus, we are not concluding about which mechanisms
that are underlying for the relationship, but we still aim to discuss how these mechanisms might
explain our results.
In general, we can conclude with a positive relationship between PE ownership and
stock market performance because the mechanisms that predict this, dominate the mechanisms
indicating a negative relationship or no relationship at all. Shareholder activism and signaling
theory suggested a positive relationship, whereas price pressure, private benefits of control and
reputational concerns were ambiguous.
Shareholder activism can improve performance through governance and operational
engineering. The fact that we observe a positive relationship between PE ownership and
performance indicates that shareholder activism is also important in the period post IPO, but
that it is of less importance as time goes by and PE firms dispose of their shares. This is in line
with our expectation that when PE firms dispose of their shares, their incentives and
opportunities to influence the portfolio companies are reduced.
Signaling might affect the stock market performance in periods with high PE ownership
relative to periods with low PE ownership. Signaling predicts a positive relationship between

49
PE ownership and stock market performance, but with limited effect on accounting
performance. Thus, it is reasonable to view signaling as a likely reason for our findings.
Note that we are not stating that price pressure, private benefits of control and
reputational concerns do not have any effect. For instance, it might be that the positive effect
of PE ownership on stock market performance would be even stronger if the firms neglected
their need of keeping a favorable reputation among investors in the long run.
Furthermore, it is interesting that we can conclude that PE ownership affects stock
market performance significantly but are unable to draw similar conclusions for accounting
performance. We present four alternative explanations for this to occur.
First, stock market performance is based on expectations of future performance, ROA
is backward looking, and Tobin’s Q is somewhere in between. A reduction in PE ownership
might have an immediate effect on stock market performance since the market adjusts its belief
immediately. However, for accounting measures, the effect will not necessarily show
immediately. Imagine that a reduction of PE firms’ involvement was to weaken accounting
performance. It is unreasonable to think that all of this effect would happen immediately
because the portfolio company would operate as before even without the expertise of PE firms.
After a while, the lack of assistance from PE professionals could start to show, and managers
could start acting in their vested interest as they are less closely monitored. When these effects
are spread over some time, it likely becomes harder to capture a potentially significant effect.
These explanations are in line with the fact that Tobin’s Q is showing results in between stock
market performance and ROA because Tobin’s Q is a measure that combines future
expectations and backward-looking accounting measures.
Second, PE ownership might affect the accounting performance of the company in ways
that are not picked up by the chosen proxy for accounting performance. However, in the
robustness assessment in section 7.4.1, we discuss the choice of ROA as a measurement for
accounting performance, reducing the possibility of this being a problem.
Third, our accounting figures are reported quarterly, whereas the stock return is reported
monthly. This makes it easier to draw an inference regarding the stock market return, as there
is more variation in our observations. This applies to both ROA and Tobin’s Q.
The fourth possible explanation is that PE ownership only affects stock market
performance. This could be a consequence of PE firms affecting stock market return in ways
that do not improve the operations of the company, e.g., they could be able to create a buzz
about the stock. It could also be that the significant positive relationship is only due to

50
mechanisms that solely influence market performance. If the positive relationship between PE
ownership and stock market performance were entirely a consequence of investors interpreting
a reduction in PE ownership as a signal of the shape of the portfolio company, we would only
observe an effect on stock market performance.
When comparing our results to previous studies, we find it particularly relevant to
discuss studies focusing on the performance PE-backed IPOs. Although these studies lack
corporate governance mechanisms, they have some suggestions for how the relationship
between PE ownership and performance could be. Bergström et al. (2006), Cao and Lerner
(2009) and Levis (2011) are among several researchers to conclude that PE-backed IPOs
outperform non-backed IPOs. These studies tend to suggest that a reason for the outperformance
could be that PE-backed IPOs receives the benefits of being backed by a large, professional
shareholder also in the time post IPO. These benefits diminish as PE firms reduce their holdings,
and the studies imply that PE ownership is positive for performance. Thus, we can state that
our results are in line with these researchers’ discussions.
7.4 Robustness assessment
This section considers the robustness of our results. The focus is on the choice of ROA as a
measure of accounting performance, the use of winsorized variables and the choice of
instruments for model 4 and 5. More straightforward econometric assumptions are discussed in
Appendix A.1.
7.4.1 ROA as a measure of accounting performance
Our initial argument for why we measured accounting performance was that we aimed to
capture the full effect of PE ownership on performance. We selected ROA as a proxy, and our
results and conclusions depend on the chosen measure. As there is no clear answer to which
measure one should use, we believe that a comparison with other dependent variables
strengthens our discussions and the robustness of our results. Table 11 shows the regression
results when comparing the results of ROA with return on equity (ROE) and return on sales
(ROS).

51
Table 11 – Regression results with alternative accounting measures
ROA Model 1 Model 2 Model 3 Model 4 Model 5
PE_Ownership -0.052*** -0.049 -0.040 -0.030
L3.PE_Ownership -0.033
N 4116 4116 3087 3087 4116
adj. R2 0.123 0.056 0.056
ROE
PE_Ownership -0.039* -0.054 0.004 -0.061
L3.PE_Ownership -0.031
N 4116 4116 3087 3087 4116
adj. R2 0.023 0.006 0.007
ROS
PE_Ownership -0.132*** -0.111 -0.109 -0.095
L3.PE_Ownership -0.060
N 4116 4116 3087 3087 4116
adj. R2 0.075 0.034 0.041
This table displays the regression results for equation (2). The equation is specified in the same way as before, but
we replace ROA with ROE and ROS, respectively. Only variables of interest are displayed. Significance levels of
1%, 5%, and 10% are denoted as ***, **, and *, respectively. The models used are the same as in the main analysis.
Models are estimated with robust standard errors and clustered on company level. The regressions use quarterly
observations. The variables are winsorized at the 1st to 99th percentile.
The effect of PE_Ownership on accounting performance is not significant, regardless of
whether the measure for performance is ROA, ROE or ROS. The fact that our results are
relatively consistent have implications for our results discussion. It becomes less likely that
ROA as the chosen proxy is the reason why we did not observe a significant effect of PE
ownership on accounting performance. Nonetheless, we do not state the relationship is non-
existent. There are still explanations for why we did not find a significant relationship other
than assuming there is none.
7.4.2 Winsorizing
In our main analysis, we use winsorized data. Whether it is preferable to winsorize or not is
dubious, and the conclusion of this paper should not rely on such a decision. Table 12 shows
the results for our interest variable, PE_Ownership, when using unprocessed data. The
coefficients differ modestly, but the decision of winsorizing or not does not affect the
significance of the relationships, nor our conclusions.

52
Table 12 – Non-winsorized regression results
StockReturn Model 1 Model 2 Model 3 Model 4 Model 5
PE_Ownership -0.014 0.078** 0.097** 0.048***
L3.PE_Ownership 0.059*
N 12384 12384 11319 11319 12384
adj. R2 0.123 0.056 0.056
ROA
PE_Ownership -0.086*** -0.113 -0.107 -0.087
L3.PE_Ownership -0.109
N 4116 4116 3087 3087 4116
adj. R2 0.023 0.006 0.007
TobinsQ
PE_Ownership -0.829 0.395** 0.374* 0.230**
L3.PE_Ownership 0.291*
N 4116 4116 3087 3087 4116
adj. R2 0.075 0.034 0.041
This table displays the regression results for equation (1), (2) and (3), but only display the variables of interest.
The variables in this regression are not winsorized, as opposed to the other regressions. Significance levels of 1%,
5%, and 10% are denoted as ***, **, and *, respectively. The models used are the same as in the main analysis.
Models are estimated with robust standard errors and clustered on company level. The regression for StockReturn
uses monthly observations, while ROA and TobinsQ use quarterly.
7.4.3 Robustness of instruments
An essential condition for both the instrumental variable regression and simultaneous equations
models is to have good instruments. That is, they have to be both correlated with the endogenous
variable, and uncorrelated with the dependent variable. Poor instruments may cause even worse
results than OLS in the presence of endogeneity (Wooldridge J. M., 2016). For simultaneous
equations models, the identification problem is also important to consider.
7.4.3.1 Instrumental variable estimation
In model 4, we use three months lagged values of the suspected endogenous variables as
instruments for the contemporary values. The variables are PE_Ownership, Concentration, and
Concentration_sq. In order for these to be good instruments, they have to be both relevant and
exogenous. The relevance condition can be tested, and the results are showed in the appendix
A.4, where we see that the F-statistic from the first stage in the 2SLS is far above 10, which is
a rule of thumb. This is also quite intuitive. As previously discussed, PE firms sell their shares
in a gradual downward sloping fashion. They almost never increase their holdings of shares,
causing today's holding of shares to be quite dependent on the shares they held three months
ago. This is also true for concentration, although it probably is not as dependent on past values
as PE ownership. Nevertheless, it is reasonable to believe that there will not be too large changes

53
in concentration throughout three months. The reason for using three months lagged values is
to allow enough time to achieve the second condition, exogeneity. The intention is to eliminate
the reverse causation from performance to PE ownership and concentration. The further we go
back in time, the harder it is for the large shareholders, and PE firms, to predict the performance
of the companies and decide their holding of shares based on this. There is a trade-off when
choosing how many periods to lag, between relevance and exogeneity.
There are reasons to believe that the simultaneity issue does not entirely disappear with
these instruments. To some degree, the PE firms will still be able to predict performance and
adjust their equity share based on the predictions. In addition, if performance is also determined
to some degree by its own lagged values, then the instrument could still be correlated with the
error term. This may not be a major problem with the stock market return, as suggested by the
random walk hypothesis (Malkiel, 1973), but might be a more significant problem for
accounting performance. The use of lagged variables as instruments have been criticized in
existing research, and they are likely not perfect instruments (Reed, 2015).
7.4.3.2 Simultaneous equations models
In the simultaneous equations models (model 5), all variables except the dependent
variables are used as instruments in the estimation. Therefore, the relevance discussion is to a
large degree based on whether we have been able to specify the correct structural equations and
the connection between them. We have specified the system based on financial theory and
existing research. There is, however, little theory of the relationship between PE ownership,
concentration and performance, and corporate governance theory does not rank alternative
instruments. This can lead to imperfect instruments, although the F-statistics from the first stage
regressions are well above the requirements for relevance (Appendix A.4).
Another possible problem is that some of the assumed exogenous explanatory variables
may also be endogenous, and thereby failing the exogeneity condition. An example is the
variable Liquidity, which we believe to affect PE ownership, as it is difficult for PE firms to sell
their large positions in periods with low stock liquidity. However, the effect might also go the
other way, where sales from the PE firm increases the liquidity of the stock. Despite that, it
would be both difficult and highly impractical to specify equations for all possible endogenous
variables, and we believe that our specified systems of three structural equations still can
provide helpful insight.
54
An assumption to be able to estimate the structural equations in a simultaneous equations
model is that they have to be identified. The critical element is to have sufficient IV’s to estimate
the equations. Two conditions are required for the identification of a structural equation, the
order condition, and the rank condition. The order condition is necessary for the rank condition,
and a structural equation in an SEM system satisfies the order condition if the number of
excluded exogenous variables from the equation is at least as large as the number of right-hand
side endogenous variables. Assuming that the only endogenous variables in our system
specified in section 6.2.3 are PE_Ownership, Concentration and the various Performance
measurements, all three structural equations meet the requirements of the order condition. There
are two endogenous right-hand side variables in each equation, and 12, 12 and 11 variables that
are exogenous to the system when using StockReturn, ROA, and TobinsQ as the performance
equation, respectively. At least two of these are excluded from each equation, fulfilling the
order condition for identification.
The rank condition requires more because it depends on the values of the parameters in
the other equations, which we can never know for sure. In most applications, one assumes that
unless there is obvious failure of identification, an equation is identified as long as it passes the
order condition (Wooldridge J. M., 2016).
7.5 Limitations of analysis
7.5.1 Econometric limitations
Analyzing the relationship between general ownership structure and performance is
challenging, as no perfect econometric approaches or theory describes the relationships.
Existing research use different methodologies, based on different views on the relationship. The
disagreement between scholars proves how challenging this task can be. When our thesis
examines the relationship between performance and PE ownership, it is even more demanding.
There is no previous directly related literature or theories to lean on, which makes it difficult to
choose the correct methodology. Our analysis has utilized several different methods, combining
views from different papers studying ownership structure and performance. Thus, we believe
that we have presented valuable results considering the current knowledge and theory available.
However, there are drawbacks to the methodology used, especially regarding the choice of
instruments, and the analysis is not entirely without limitations.

55
7.5.2 Data and sample limitations
Another potential limitation to our analysis is the fact that we may experience some selection
bias. There are several sources for this. The first, and in our case the most important one, is the
fact that we only analyze companies that have been listed on the stock market for at least 36
months. By excluding the ones that are delisted within three years, we might exclude companies
with other characteristics than the ones we include. A possible reason for this is if the majority
of delisted companies are inferior to the ones that stay listed. Another source of selection bias
is that the companies that are taken public may be better performing than the ones that are not.
That is, by only studying publicly listed companies, we may have a skewed sample. A third
source is that PE firms only invest in companies with good prospects, while inferior companies
do not receive backing from PE firms. The final possible source is the fact that we have
excluded several companies for which we could not find satisfactory ownership data. If there
are common features among these companies compared to the remaining sample, it will skew
the sample. Thus, there may be multiple selection bias in our analysis, which means that the
results may not apply to the whole population. Nonetheless, our interest is understanding the
effect of PE ownership for backed companies while they are publicly traded, and not the effect
that PE ownership maybe would have had on poor performing companies that would not receive
PE-backing or be listed in the first place. Therefore, we do not believe that the selection bias
distorts the analysis to a large extent.
Our dataset consists of monthly data, preventing us from studying the immediate effect
of changes in PE ownership. However, to study more frequent ownership data would require
programming and extensive manual work by registering every single filing of every trade in the
Edgar database, which is not possible in this thesis. Also, we only have quarterly accounting
data. This makes it even harder to see the direct effects of changes in PE ownership. There is,
however, no way to obtain more frequent accounting data because it is usually only reported
quarterly.
The fact that we have quarterly data for accounting variables and monthly data for the
remaining variables may create some limitations. We have solved this by estimating with
monthly data when we have StockReturn as the dependent variable. The alternative solution is
to use quarterly data for all variables. This would reduce observations and observed variation.
Because the variable of interest is PE_Ownership, for which we have monthly data, and
accounting variables are included as control variables, we choose to use monthly data when

56
possible. While this may reduce the quality of estimates for the accounting variables, the
estimates for the most important variables are not affected. In the regression with ROA and
TobinsQ as the dependent variable, we use quarterly data for all variables. This reduces
observations and variation, and the estimates will not be as robust as when using monthly data.
Reduced variation particularly affects fixed effects estimations, as discussed in section 6.2.1.
We use opening balance figures for accounting data, which is matched with the level of PE
ownership on the first day of the corresponding quarter.
The variable for PE ownership is calculated as the sum of all positions held by PE firms
when there are more than one PE firm backing a company. The basis for this is that we believe
the mechanisms discussed in section 4.1 still applies when there are several PE firms as owners,
and the incentives and opportunities to affect performance still will be present. Some of the
effects may be weaker when there are several owners rather than one major owner, and this is
a possible limitation in our analysis. We are also not able to investigate the effect of different
funds being involved and possibly exiting at different times.
It could be interesting to include fund-specific control variables in our analysis, to see
how different PE-funds may affect performance differently. Nevertheless, because these
characteristics are constant over the period for each company, we are not able to estimate these
when using fixed effects. This is one of the drawbacks of using fixed effects models, as
discussed in section 6.2.1. There is a trade-off between estimating these time-invariant
characteristics and using models to deal with endogeneity.
We only consider one type of PE types, i.e., buyout, and only the American market. This
prevents us from assessing whether our results are applicable for venture capital investors or
other PE types, and other markets. It is possible that countries to some degree differ in
institutional frameworks, the level of PE ownership and various level of activism for corporate
control.
7.5.3 Limitations due to PE firms’ disposal of shares
There are two aspects of how PE firms exit their positions that might have consequences for
our analysis. First, PE firms occasionally exit through block trades outside of the open market.
Our analysis is based on the assumption that PE firms have incentives to improve performance,
making it crucial that trade prices are affected by performance. Barclay and Holderness (1989)
and Dyck & Zingales (2004) find that block transactions trade at a premium of the market price.
Given that the market price is the basis for the block trade, it is reasonable to believe that PE

57
firms still have some incentives to try to affect stock market performance, regardless of whether
they dispose of their shares in the open market or not. Although it might affect the incentives
moderately, we do not view this as a significant concern.
Second, we should be aware of the consequences of Seasoned Equity Offerings (SEO).
An SEO is an issue of additional securities of an already publicly listed firm, which dilutes the
holdings of existing shareholders (Wadhwa, Reddy, & Goyal, 2016). Our dataset consists of
percentage holdings, which makes it difficult to separate the effects of dilution and share sales
in the event of SEOs. In the situations where a change of PE ownership is caused by an dillution
rather than an actual sale by the PE firm, the consequences might be different. However, we
argue that both the incentives and opportunities to improve the company are not only dependent
on the absolute size of the position, but also by the percent of shares that the PE firm holds.
Thus, it is reasonable to believe that the presence of SEOs might disturb our analysis modestly,
but not critically.

58
8. Conclusion
The objective of this paper has been to contribute to a better understanding of the consequences
of retained PE ownership post IPO. Because previous studies find that PE firms use up to several
years to entirely exit the portfolio companies, it is interesting to understand the implications of
this long and gradual divestment period. This interest is supported by statements retrieved from
the interviews we have conducted, where PE representatives state that they both have incentives
and opportunities to affect performance post IPO. We attempted to answer the research question
“How does post-IPO private equity ownership affect the performance of portfolio companies?”
With panel data of 343 PE-backed IPOs floated in the US market between 2000 and
2015, we observe performance and PE ownership for the first 36 months after the IPO. By using
various econometric approaches and considering that PE ownership might be endogenous in
explaining performance, we estimate models using pooled OLS, fixed effects, IV estimation,
as well as simultaneous equations models. We find evidence that PE ownership positively
affects stock market return. However, we are unable to draw the same conclusions for
accounting performance (measured by ROA) or general company performance (measured by
Tobin’s Q), although there is some indication of a positive effect on the latter. We accept our
first hypothesis but are unable to accept the second and third hypotheses.
The purpose of this study was not to isolate the effects causing our results, but we still
aimed to discuss it. We suggest that shareholder activism and signaling dominate other
mechanisms in the case of stock market performance, in which shareholder activism primarily
refers to how PE firms converge interests of managers and shareholders and add expertise to
their portfolio companies. We suggest four explanations for why we do find a significant
relationship for accounting performance. First, the inference is dependent on how informative
the measurement is, and stock market return can be viewed as the most informative. Second,
the proxies for accounting performance could be weak, although the results do not differ when
using alternative accounting measures. Third, less frequent observations reduce variation in the
measurement, and inference becomes less likely. Lastly, it could be that the mechanisms only
affecting stock market performance are solely explaining the relationship. Even though we do
not find a significant relationship for other performance measures than stock market return,
there are plausible arguments for why it still may exist.
This study also supports previous findings of the fact that PE firms stay invested in the
portfolio companies for a long time after the IPO, showing that our sample on average reduces

59
holdings from 50% to 19% during the 36 months following an IPO. A test of the reduction of
PE ownership in this period shows that the PE firms do not only stay invested because of the
lock-up agreement, as the pace of ownership reduction is not different on the expiration of the
agreement than in the following months. We also provide insight into how often IPOs are
backed by more than one PE firm, finding that this is the case for 52% of the IPOs in our sample.
Finally, we conclude that PE ownership is negatively determined by company performance, in
line with statements from self-conducted interviews and previous research.
There are several limitations to our results, the most important being the econometric
challenges in analyzing the effect of ownership on performance. The lack of proper
methodologies and disagreement among scholars make it challenging to estimate causal
relationships. Despite using multiple different econometric techniques, there are still drawbacks
to all the estimated models, including the difficulty of choosing good instruments when no
existing theory provides answers.
Our study has combined insights from separate research fields, utilized a comprehensive
dataset, used several econometric techniques to deal with possible endogeneity, analyzed
multiple performance measurements, and used self-conducted interviews. Despite the
limitations and weaknesses of the analysis, we believe to have presented conclusions that can
contribute to existing and future research.
8.1 Implication of results and further research
Although our study differs from previous studies focusing on the stock market performance of
PE-backed IPOs as we account for post-IPO PE ownership, we believe that it has implications
for previous studies. Bergström et al. (2006), Cao and Lerner (2009) and Levis (2011) are
among several researchers to conclude PE-backed IPOs to outperform non-backed IPOs, and
these studies tend to suggest that benefits of being backed by a large, professional shareholder
can be an explanation for the outperformance. This implies that PE-backed IPOs should perform
better when PE firms still hold large stakes as opposed to when they have already sold a
considerable number of shares, ceteris paribus, which is precisely the conclusion of our study.
Our results also contribute to research investigating the relationship between ownership
structure and performance. We add to this literature by examining the relationship between
performance and a new type of owners, PE firms, as well as focusing on a specific group of
companies, PE-backed companies.

60
Given that our study does not identify the exact reasons for the relationships, it would be
interesting for further research to try to separate the effects. However, there are significant
challenges in isolating the effects.
In addition to the models used in our analysis, a supplementary way to estimate a causal
effect of PE ownership is to use a diff-in-diff estimation, by exploiting an external shock as a
natural experiment. The Sarbanes–Oxley Act of 2002 is a possible shock for such an analysis.
Even though we could not conduct this analysis ourselves due to limited sample in the relevant
period, we encourage others to consider this approach.
Future research should further examine this relationship, and we suggest utilizing even
more performance measures and examining other types of private equity funds, e.g., VC, other
countries and markets, as well as using more frequent data. It may also be interesting to take
the remaining owner types into account, and the owners that take over the PE firms’ positions.
Studying more than three years will also enable examination of the complete divestment period,
which is often longer than three years. Including more information about the PE fund can also
uncover exciting results.

61
9. References
Acharya, V., Franks, J., & Servaes, H. (2007). Private Equity - Boom or Bust. Journal of
Applied Corporate Finance, 44-53.
Acharya, V., Gottschalg, O. F., Hahn, M., & Kehoe, a. C. (2013). Corporate governance and
value creation: Evidence from private equity. Review of Financial Studies 26(2), 368-
402.
Agrawal, A., & Knoeber, C. R. (1996). Firm Performance and Mechanisms to Control Agency
Problems between Managers and Shareholders. The Journal of Financial and
Quantitative Analysis, 31(03) , 377-397.
Anker, C. N., & Stärk-Johansen, J. (2015). Exit Strategies by Private Equity Firms in the Nordic
Regio.
Aschhoff, B., & Schmidt, T. (2008). Empirical evidence on the success of R&D. Review of
Industrial Organization, 33, 41-62.
Ball, J. H., & Gefter, A. (2016). The IPO Exit: A Practical Legal Guide for Financial Sponsors.
The Journal of Private Equity.
Barclay, M., & Holderness, C. (1989). Private benefits from control of public corporations.
Journal of Financial Economics, 371-395.
Becht, M., Bolton, P., & Roell, A. (2003). Corporate governance and control. In G. M.
Constantinides, M. Harris, & R. M. Stulz, Handbook of the Economics of Finance,
volume 21 (pp. 1-109). Elsevier.
Belghitar, Y., Clark, E., & Kassimatis, K. (2011). The prudential effect of strategic institutional
ownership on stock performance. International Review of Financial Analysis, 191-199.
Bergström, C., Nilsson, D., & Wahlberg, M. (2006). Underpricing and Long-Run Performance
Patterns of European Private-Equity-Backed and Non-Private-Equity-Backed IPOs. The
Journal of Private Equity, 16-47.
Bernstein, S., Giroud, X., & Townsend, R. (2015). The Impact of Venture Capital Monitoring.
The Journal of Finance.
Bertrand, M. E., Duflo, E., & Mullainathan, S. (2004). How much shoulw we trust differences-
in-differences estimates? The Quarterly Journal of Economics, 249-275.
Bharat, J., & Kini, O. (1994). The Post-Issue Operating Performance of IPO Firms. The Journal
of Finance, 1699-1726.

62
Bharat, J., & Kini, O. (1995). Venture Capitalist Participation and the Post-issue Operating
Performance of IPO Firms. Managerial and Decision Economics.
Brennan, M. J., Chordia, T., & Subrahmanyam, A. (1998). Alternative factor specifications.
Journal of Financial Economics, 49, 345-375.
Bøhren, Ø., & Ødegaard, B. A. (2005). Governance and performance revisited. In P. Ali, & G.
N. Gregoriou, International Corporate Governance After Sarbanes-Oxley. John Wiley
& Sons.
Cao, J., & Lerner, J. (2009). The performance of reverse leveraged buyouts. Journal of
Financial Economics, 139-157.
Cendrowski, H., Petro, L. W., Martin, J. P., & Wadecki, A. A. (2012). Private Equity: History,
Governance, and Operations. Hoboken, New Jersey: John Wiley & Sons.
Chao, J. (2011). IPO Timing, Buyout Sponsors’ Exit Strategies, and Firm Performance of
RLBOs. Journal of Financial and Quantitative Analysis 46(4), 1001‐1024.
Chen, M.-Y. (2006). Managerial ownership and firm performance: an analysis using switching
simultaneous-equations models. Applied Economics, 161-181.
Cho, M.-H. (1998). Ownership structure, investment, and the corporate value: an empirical
analysis. Journal of Financial Economics, 47(1), 103-121.
Clemens, M., Radelet, S., Bhavnani, R., & Bazzi, S. (2012). Counting Chickens when they
Hatch: Timing and the Effects of Aid on Growth. Economic Journal, 122(561), 590-
617.
Connelly, B., Certo, T., Ireland, D., & Reutzel, C. (2011). Signaling Theory: A Review and
Assessment. Journal of Management, 39-67.
Davis, S. J., Haltiwanger, J., Handley, K., Jarmin, R., Lerner, J., & Miranda, a. J. (2014). Private
equity, jobs, and productivity. American Economic Review 104(12), 3956-3990.
Degeorge, F., & Zeckhauser, R. (1993). The Reverse LBO Decision and Firm Perofrmance:
Theory and Evidence. Journal of Finance, 1323-1348.
Demsetz, H. (1983). The Structure of Ownership and the Theory of the Firm. Journal of Law
and Economics, vol. 26.
Demsetz, H., & Villalonga, B. (2001). Ownership Structure and Corporate Performance.
Journal of Corporate Finance, 7(3), 209-233.
Dushnitsky, G., & Lenox, M. (2006). When does corporate venture capital investment create
firm value? Journal of Business Venturing, 753-772.

63
Dyck, A., & Zingales, L. (2004). Private Benefits of Control: An Internation Comparison. The
Journal of Finance, 537-600.
Døskeland, T. M., & Strömberg, P. (2018). Evaluating Investments in Unlisted Equity for the
Norwegian Government Pension Fund Global (GPFG). Regjeringen.no.
El-Masry, A. A. (2017). Effect of Ownership Structure on Firm Stock Return Performance:
Evidence from the Egyptian Stock Market. International Research Journal of Finance
and Economics.
Eugster, N., & Isakov, D. (2018). Founding Family Ownership, Stock Market Returns, and
Agency Problems. SSRN Electronic Journal.
F.Fama, E., & R.French, K. (1993). Common risk factors in the returns on stocks and bond.
Journal of Financial Economics.
Farooque, O. A., Zijl, T. V., Dunstan, K., & Karim, W. (2005). A Simultaneous Equations
Approach to Analysing the Relationship between Ownership Structure and Performance
in Bangladesh. Working Paper Series; Working Paper no. 35.
French, K. R., Schwert, G. W., & Stambaugh, R. F. (1987). Expected Stock Returns and
Volatility. Journal of Financial Economics, 19(1), 3-30.
Fürth, S., & Rauch, C. (2014). Fare Thee well? An analysis of Buyout funds’ Exit Strategies.
Financial Management 44(4), 811-489.
Giot, P., & Schwienbacher, A. (2007). IPOs, trade sales and liquidations: Modelling venture
capital exits using survival analysis. Journal of Banking & Finance, 31(3) , 679-702.
Gompers, P. A., & Brav, A. (1997). Myth or Reality? The Long-Run Underperformance of
Initial Public Offerings: Evidence from Venture and Nonventure Capital-Backed
Companies. The Journal of Finance.
Gordon, M. J. (1962). The Investment, Financing and Valuation of the Corporation.
Homewood, Illinois: Richard D. Irwin.
Harris, L., & Gurel, E. (1986). Price and Volume Effects Associated with Changes in the S&P
500 List: New Evidence for the Existence of Price Pressures. The Journal of Finance,
815-829.
Heracleous, L. T. (2001). What is the Impact of Corporate Governance on Organisational
Performance? Corporate Governance: An International Review.
Hermalin, B. E., & Weisbach, M. S. (1991). The effect of board composition and direct
incentives on firm performance. Financial Management, 101-112.

64
Himmelberg, C., Palia, D., & Hubbard, R. (1999). Understanding the Determinants of
Managerial Ownership and Link Between Ownership and Performance. Journal of
Financial Economics 53(3).
Hirschleifer, J. (1958). On the Theory of Optimal Investment Decision. Journal of Political
Economy, 329-352.
Hoechle, D., & Schmid, M. (2008). Which, why, and for how long. Unpublished doctoral
thesis; University of St. Gallen & University of Basel.
Holthausen, R. W., & Larcker, D. (1996). The Financial Performance of Reverse Leveraged
Buyouts. Journal of Financial Economics, 293-332.
Hopkins, M., & Ross, D. (2013). Key Drives of Private Equity Firm Certification at Initial
Public Offering. The Journal of Private Equity, 69-89.
Hoque, H., & Lasfer, M. (2013). Directors' Dealing and Post-IPO Performance. European
Financial Management, 1-27.
Hotchkiss, E., Smith, D., & Strömberg, P. (2016). Private equity and the resolution of financial
distress. working paper, Stockholm School of Economics.
Jensen, M. (1986). Agency Costs of Free Cash Flow, Corporate Finance and Takeovers.
American Economic Review, 323-329.
Jensen, M. (1989). Eclipse of the Public Corporation. Harvard Business Review, 61-74.
Kaplan, S. N. (1989). The Effect of Management Buyouts on Operating Performance and
Value. Journal of Financial Economics, 217-254.
Kaplan, S. N., & Stromberg, P. (2009). Leveraged Buyouts and Private Equity. Journal of
Economic Perspectives, 23(1), 121-146.
Kose, J., & Litov, L. (2010). Managerial entrenchment and capital structure: new evidence.
Journal of Empirical Legal Studies, 693-742.
Lee, C. M. (1992). Earnings news and small traders: An intraday analysis. Journal of
Accounting and Economics, 15(2-3), 265-302.
Levis, M. (2011). The Performance of Private Equity Backed IPOs. Financial Management,
253-277.
Lilienfeld-Toal, U. v., & Ruenzi, S. (2013). CEO Ownership and Stock Market Performance,
and Managerial Discretion. Journal of Finance, Forthcoming.
Lindenberg, B., E., & Ross, S. A. (1981). Tobin's q Ratio and Industrial Organization. The
Journal of Business, 1-32.

65
Loderer, C., & Martin, K. (1997). Executive stock ownership and performance. Journal of
Financial Economics, 223-255.
Loughran, T. (1993). NYSE vs NASDAQ returns: Market microstructure or the poor
performance of initial public offerings. Journal of Financial Economics, 241-260.
Loughran, T., & Ritter, J. (1995). The new issues puzzle. Journal of Finance, 23-51.
MacKay, P., & Phillips., G. (2005). How does industry affect firm financial structure? Review
of Financial Studies, 18, 1433-1466.
Malkiel, B. (1973). A Random Walk Down Wall Street. United States: W. W. Norton &
Company, Inc.
McConnell, J., & Servaes, H. (1990). Additional evidence on equity ownership and corporate
value. Journal of Financial Economics, 595-612.
Meckling, J. M. (1976). Theory of the Firm: Managerial behavior, agency costs and ownership
structure. Journal of Financial Economics, 305-360.
Meles, A., Monferra, S., & Verdoliva, V. (2014). Do the effects of private equity investments
on firm performance persist over time? Applied Financial Economics, 203-218.
Metrick, A., & Yasuda, A. (2011). Venture Capital & the Finance of Inovation. New York:
John Wiley & Sons.
Mørck, R., Sheifer, A., & Vishny, R. W. (1987). Management Ownership and Market
Valuation: An Empirical Analysis. Journal of Financial Economics 20(1-2), 293-315.
Pedersen, T., & Thomsen, S. (2000). Ownership structure and economic performance in the
largest european companies. Strategic Management Journal, 689-705.
Pindado, J., & Torre, C. d. (2004). Why is ownership endogenous? Applied Economics Letters,
11(14), 901-904.
Reed, W. R. (2015). On the Practice of Lagging Variables to Avoid Simultaneity. Oxford
Bulletin of Economics and Statistics, 77(6), 0305–9049.
Richter, A., & Weiss, C. (2013). Determinants of ownership concentration in public firms: The
importance of firm-, industry- and country-level factors. International Review of Law
and Economics, 33, 1-14.
Ritter, J. (2018). Initial Public Offerings: Underpricing. Retrieved from
https://site.warrington.ufl.edu/ritter/files/2018/07/IPOs2017Underpricing.pdf
Ritter, J. R. (1991). The Long‐Run Performance of initial Public Offerings. The Journal of
Finance.

66
Schmidt, D., Steffen, S., & Szabó, F. (2009). Exit Strategies of Buyout Investments - An
Empirical Analysis. The Journal of Alternative Investments, 12(4), 58–84.
Shyu, J. (2013). Ownership structure, capital structure, and performance of group affiliation:
Evidence from Taiwanese group-affiliated firms. Managerial Finance, 39, 404-420.
Sias, R. W., & Starks, L. T. (2006). Changes in Institutional Ownership and Stock Returns:
Assessment and Methodology. The Journal of Business, 79(6), 2869-2910.
Smith, A. J. (1990). “Corporate ownership and performance: The case of management buyouts.
Journal of Financial Economics 27, 143-164.
Vergara, R. (2010). Taxation and private investment: Evidence for Chile. Applied Economics,
42, 717-725.
Visnjic, N. (2013). The Real Exit: Selling Strategies subsequent to Private Equity Backed IPOs.
Goethe University Frankfurt.
Wadhwa, K., Reddy, N., & Goyal, A. (2016). IPOs and SEOs, real investments, and market
timing: Emerging market evidence. Journal of International Financial Markets, 21-41.
Whited, T., & Erickson, T. (2000). Measurement Error and the Relationship Between
Investment and q. Journal of Political Economy, 1027-1057.
Wooldridge, J. M. (2002). Econometric Analysis of Cross Section and Panel Data, Second
Edition. Cambridge, MA: MIT Press.
Wooldridge, J. M. (2016). Introductory Econometrics: A modern approach, 6th edition. Mason,
OH, United States: Cengage Learning.
Xianming, Z. (2001). Understanding the determinants of managerial ownership and the link
between ownership and performance: comment. Journal of Financial Economics, 559-
571.

67
10. Appendix
A.1 Econometric assumptions
Normal distribution is perhaps the most common econometric assumption and is essential for
most estimation methods. After inspecting and testing our variables, we conclude that they are
normally distributed. We use logarithmic returns in order to fulfill this criterion better.
Heteroscedasticity occurs when the variance of the error term is not constant conditional
on the explanatory variable, making the usual standard errors and test statistics are invalid
(Wooldridge J. M., 2016). We use a modified Wald test for groupwise heteroscedasticity to test
this, which is a test for panel data and fixed effects. Table 13 shows that there is
heteroscedasticity in our dataset. Serial correlation is the relationship between a given variable
and a lagged version of itself over various time intervals, and its presence can bias the standard
errors and causes the results to be less efficient. In Table 13 is a test for serial correlation in the
idiosyncratic errors of a linear panel-data model developed by Wooldridge (2002). The test
shows no rejection of the null hypothesis, indicating that serial correlation is not a problem our
dataset. It is common practice in the econometric field to use robust standard errors and
clustering to deal with both heteroscedasticity and serial correlation. Following Bertrand et al.
(2004), we use cluster-robust standard errors at company level to allow for heteroscedasticity
across firms and within-firm serial correlation of error terms. This solves the potential issues
from heteroscedasticity.
Table 13 - Test for heteroscedasticity and autocorrelation14
Test Property Null hypothesis Significance Test value Rejection of H0
Modified Wald Heteroscedasticity 𝐻0: 𝜎(𝑖)2 = 𝜎2 𝑓𝑜𝑟 𝑎𝑙𝑙 𝑖 𝑃𝑟𝑜𝑏 > 𝜒2 = 0.000 𝜒2(343) = 1450.25 Yes
Wooldridge Autocorrelation 𝐻0: 𝑛𝑜 𝑎𝑢𝑡𝑜𝑐𝑜𝑟𝑟𝑒𝑙𝑎𝑡𝑖𝑜𝑛 𝑃𝑟𝑜𝑏 > 𝐹 = 0.059 𝐹(1,342) = 3.60 No
One advantage of using panel data is reduced issues with multicollinearity. Nevertheless,
we should be aware of possible collinearity issues between PE_Ownership and Concentration,
as the shareholdings of the PE firm partly determine the concentration among owners of
portfolio companies. There is no universal agreement to how high VIF values need to be in
order to cause issues. However, researchers tend to suggest that one need to be concerned with
14 This test shows results using specifications from equation (1) but results are concurring for all equations.

68
VIF values of 5-10 and higher (Menard, 1995; Neter, 1989). From Table 14, we conclude that
this is not a serious issue in our analysis.
Table 14 - VIF test15
Variable VIF
PE_Ownership 2.60
Concentration 2.14
LN_TotalAssets 1.36
Volatility 1.32
Liquidity 1.29
Period 1.22
DebtRatio 1.11
AssetTurnover 1.07
MB 1.07
MKT_Return 1,02
Mean VIF 1.42
Stationarity refers to situations in which the statistical properties of a variable are constant
over time. Our variable of interest, PE_Ownership, has a stepwise form, resulting in the mean
changing over time. This could indicate that the variable is non-stationary, which might lead to
spurious regression. There are panel unit root tests we could conduct, but as Professor Øivind
A. Nilsen at NHH points out,16 there is a general understanding in the field that these tests have
very low power, and stationarity is viewed as unproblematic in panel data with a large N and a
small T (Baltagi, 2013; Pesaran, 2015). Given our N=343 and T=36, we disregard stationarity
issues in our data.
A.2 Tests for fixed effects, random effects, and pooled OLS
We have previously argued how the use of fixed effects can assist in reducing the endogeneity
issues in our estimations. Nonetheless, we have still conducted a formal test in order to choose
between fixed effects and random effects. The null hypothesis of the Hausman test is that
random effects are the preferred estimation method, i.e., that there is no correlation between
explanatory variables and the unobserved effects (Wooldridge J. M., 2016), which we argue is
unlikely. The Hausman test does not permit the presence of cluster-robust standard errors,
making the alternative approach of Mundlak is more appropriate in our case, which has the
same null hypothesis. Table 15 shows that fixed effects are appropriate in our analysis.
15 This test shows results using specifications from equation (1) but results are concurring for all equations. 16 Information received from meeting with Øivind Anti Nilsen, professor at Norwegian School of
Economics with econometric expertise.

69
Table 15 – Hausman test for fixed effects vs. random effects17
Test Property Null hypothesis Significance Test value s Rejection of H0
Hausman (Mundlak) RE or FE 𝐻0: 𝐸(𝜂𝑖|𝑋) = 0 𝑃𝑟𝑜𝑏 > 𝜒2 = 0.000 𝜒2(38) =305.07 Yes
We also used an F-test to ensure that fixed effects are preferred over pooled OLS. The
null hypothesis is that observed and unobserved fixed effects ui are equal to zero, i.e., they are
equal across all units. The rejection of H0 in Table 16 confirms that the sample contains fixed
effects.
Table 16 - F-test for fixed effects vs. pooled OLS17
Test Property Null hypothesis Significance Test value Rejection of H0
F-test FE or POLS 𝐻0: 𝑎𝑙𝑙 𝑢𝑖 = 0 𝑃𝑟𝑜𝑏 > 𝐹 = 0.000 𝐹(342,11968) =210.85 Yes
A.3 T-test of lock-up period expiration
To test whether the reduction in PE ownership at the end of the lock-up date is different from
the months after the expiration of the agreement, we use a two-sided t-test to determine if the
population means are equal. In Table 17, we fail to reject the null hypothesis, and cannot state
that the reduction at the expiration of the lock-up agreement is different from the later months.
Table 17 - Two-sample t-test for equal means
Test Property Null hypothesis Significance Test value Rejection of H0
Two-sample t-test Equal means 𝐻0: 𝜇1 = 𝜇2 𝑃𝑟𝑜𝑏(|𝑇| > |𝑡| = 0.653 𝑡 = −0.4495 No
A.4 Relevance of instruments
The relevance of instruments is tested from the first stage in the 2SLS regressions. As a rule of
thumb, the F-statistic of a joint test of whether all excluded instruments are significantly
different from zero should be larger than 10. Table 18 shows the results for the models using
lagged variables as instruments (model 4), and the rows represent the different regression
equations for StockReturn, ROA and TobinsQ, respectively. All instruments pass the relevance
test. Table 19 displays the same test for the simultaneous equations models (model 5), with
StockReturn, ROA and TobinsQ as the dependent variable, respectively. These instruments are
17 This test shows results using specifications from equation (1) but results are concurring for all equations.

70
also relevant. We do not show tests for equation (4) and (5), as these are not of interest to our
research question.
Table 18 - F-test for the relevance of instruments in model 4
Test Property Null hypothesis Significance Test value Rejection of H0
F-test Relevance 𝐻0: 𝑎𝑙𝑙 𝛽𝑖 = 0 𝑃𝑟𝑜𝑏 > 𝐹 = 0.000 𝐹 = 231.74 Yes
F-test Relevance 𝐻0: 𝑎𝑙𝑙 𝛽𝑖 = 0 𝑃𝑟𝑜𝑏 > 𝐹 = 0.000 𝐹 = 232.22 Yes
F-test Relevance 𝐻0: 𝑎𝑙𝑙 𝛽𝑖 = 0 𝑃𝑟𝑜𝑏 > 𝐹 = 0.000 𝐹 = 237.93 Yes
Table 19 - F-test for the relevance of instruments in model 5
Test Property Null hypothesis Significance Test value Rejection of H0
F-test Relevance 𝐻0: 𝑎𝑙𝑙 𝛽𝑖 = 0 𝑃𝑟𝑜𝑏 > 𝐹 = 0.000 𝐹 = 84.22 Yes
F-test Relevance 𝐻0: 𝑎𝑙𝑙 𝛽𝑖 = 0 𝑃𝑟𝑜𝑏 > 𝐹 = 0.000 𝐹 = 50.59 Yes
F-test Relevance 𝐻0: 𝑎𝑙𝑙 𝛽𝑖 = 0 𝑃𝑟𝑜𝑏 > 𝐹 = 0.000 𝐹 = 771.29 Yes
A.5 Portfolio companies and PE firms in the sample
Table 20 - Total sample of PE firms and backed companies
Portfolio company Backing private equity firm IPO date
Packaging Corp of America Madison Dearborn Partners LLC 27.01.2000
Therma-Wave Inc Sutter Hill Ventures LLC, Bain Capital Private Equity LP 03.02.2000
Fargo Electronics Inc TA Associates Management LP, Split Rock Partners LLC 10.02.2000
Digitas Inc Hellman & Friedman LLC 13.03.2000
Manufacturers Services Ltd Portfolio Advisors LLC 22.06.2000
Charles River Labs Intl Inc aPriori Capital Partners LP 23.06.2000
California Pizza Kitchen Inc Bruckmann, Rosser, Sherrill & Co., Inc. 02.08.2000
Entravision Commun Corp TSG Capital Group LLC 02.08.2000
ChipPAC Inc Bain Capital Private Equity LP, Court Square Capital Partners 08.08.2000
American Med Sys Holdings Inc Warburg Pincus LLC 10.08.2000
Viasource Communications Inc BancBoston Capital, Inc., Crest Communications Holdings LLC, PNC Equity
Management Corp. 18.08.2000
TTM Technologies Inc HCI Equity Partners LLC, Brockway Moran & Partners, Inc., Crescent Capital Group 20.09.2000
Wilson Greatbatch Tech Inc aPriori Capital Partners LP 29.09.2000
W-H Energy Services Inc aPriori Capital Partners LP 10.10.2000
Resources Connection Inc Evercore Capital Partners 14.12.2000
AFC Enterprises Inc Freeman Spogli Management Co. LP, Pennington Partners & Co. 01.03.2001
Select Medical Corp Welsh, Carson, Anderson & Stowe, GTCR LLC 04.04.2001
Alliance Data Systems Corp Welsh, Carson, Anderson & Stowe 07.06.2001
Galyan's Trading Co Inc Freeman Spogli Management Co. LP, Benchmark Capital Management Co. LLC 26.06.2001
MedCath Corp Kohlberg Kravis Roberts & Co. LP, Welsh, Carson, Anderson & Stowe 23.07.2001
Cross Country Inc Charterhouse Group, Inc., Metalmark Capital LLC 24.10.2001
AMN Healthcare Services Inc Haas Wheat & Partners LP 12.11.2001

71
Asbury Automotive Group Inc Freeman Spogli Management Co. LP 13.03.2002
JetBlue Airways Corp Weston Presidio Service Co. LLC, BancBoston Ventures, Inc., CCMP Capital Advisors
LP 11.04.2002
Premcor Inc Blackstone Corporate Private Equity 29.04.2002
Regal Entertainment Group Oaktree Capital Management 08.05.2002
Kirkland's Inc Advent International Corp., Capital Resource Partners, SSM Partners, Robinson
Humphrey Ventures 10.07.2002
Red Robin Gourmet Burgers Inc Quad-C Management, Inc. 18.07.2002
Safety Insurance Group Inc The Jordan Co. LP, Crescent Capital Group 21.11.2002
Seagate Technology LLC Silver Lake Management Co. LLC 10.12.2002
Accredited Home Lenders Hldg Crosspoint Venture Partners, Enterprise Partners Venture Capital 14.02.2003
Citadel Broadcasting Corp Forstmann Little & Co. 31.07.2003
CapitalSource Inc Rosewood Capital LLC, Pamlico Capital Management LP, FFL Partners LLC,
Madison Dearborn Partners LLC, OZ Management LP, Farallon Capital Management 06.08.2003
AMIS Holdings Inc Francisco Partners Management LP 23.09.2003
Carter's Inc Berkshire Partners LLC 23.10.2003
Quality Distribution Inc Apollo Global Management LLC 06.11.2003
LECG Corp GTCR LLC 13.11.2003
Nexstar Broadcasting Group Inc ABRY Partners LLC 24.11.2003
SIRVA Inc Clayton Dubilier & Rice LLC 24.11.2003
United National Group Ltd Fox Paine & Co. LLC 15.12.2003
Universal Technical Institute Charlesbank Capital Partners LLC, The Jordan Co. LP 16.12.2003
Tempur-Pedic International Inc TA Associates Management LP, FFL Partners LLC 17.12.2003
TRW Automotive Holdings Corp Blackstone Corporate Private Equity 02.02.2004
Asset Acceptance Capital Corp Quad-C Management, Inc. 04.02.2004
Bristol West Holdings Inc Kohlberg Kravis Roberts & Co. LP 11.02.2004
Cherokee International Corp G3W Ventures LLC, Oaktree Capital Management, RIT Capital Partners Plc 19.02.2004
Kinetic Concepts Inc Calera Capital Advisors LP, aPriori Capital Partners LP 23.02.2004
Ultra Clean Holdings Inc Francisco Partners Management LP 24.03.2004
Hornbeck Offshore Services Inc Rock Creek Capital Group, Inc., SCF Partners LLC 25.03.2004
Intersections Inc Loeb Holding Corp., CCP Equity Partners 29.04.2004
InfraSource Services Inc Oaktree Capital Management 06.05.2004
Wellcare Group Inc TowerBrook Capital Partners LP 30.06.2004
Domino's Pizza Inc J.P. Morgan Partners LLC, Bain Capital Private Equity LP 12.07.2004
Greenfield Online Inc MSD Capital LP, Insight Venture Management LLC, UBS Capital Americas LLC 15.07.2004
Blackbaud Inc JMI Management, Inc., Hellman & Friedman LLC 21.07.2004
Bucyrus International Inc AIP LLC 22.07.2004
StoneMor Partners LP McCown De Leeuw & Co., Inc. 14.09.2004
Beacon Roofing Supply Inc CHS Capital LLC 22.09.2004
New York & Co Inc Irving Place Capital Management LP 06.10.2004
B&G Foods Holdings Corp Bruckmann, Rosser, Sherrill & Co., Inc. 07.10.2004
Copano Energy LLC EnCap Investments LP, aPriori Capital Partners LP 09.11.2004
Nalco Holding Co Blackstone Corporate Private Equity, Goldman Sachs Capital Partners 10.11.2004
PRA International Genstar Capital LLC 17.11.2004
Foundation Coal Holdings Inc First Reserve Management LP, Blackstone Corporate Private Equity 08.12.2004
Symmetry Medical Inc Olympus Advisors LLC, Windjammer Capital Investors LLC 08.12.2004
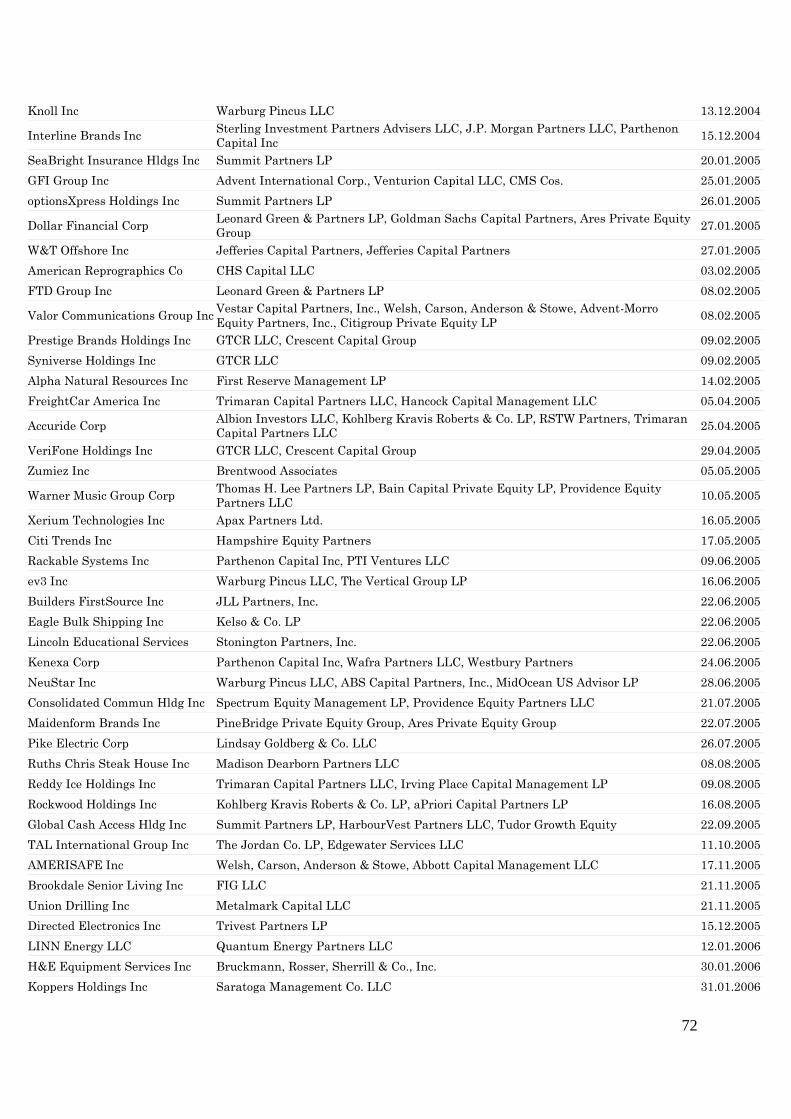
72
Knoll Inc Warburg Pincus LLC 13.12.2004
Interline Brands Inc Sterling Investment Partners Advisers LLC, J.P. Morgan Partners LLC, Parthenon
Capital Inc 15.12.2004
SeaBright Insurance Hldgs Inc Summit Partners LP 20.01.2005
GFI Group Inc Advent International Corp., Venturion Capital LLC, CMS Cos. 25.01.2005
optionsXpress Holdings Inc Summit Partners LP 26.01.2005
Dollar Financial Corp Leonard Green & Partners LP, Goldman Sachs Capital Partners, Ares Private Equity
Group 27.01.2005
W&T Offshore Inc Jefferies Capital Partners, Jefferies Capital Partners 27.01.2005
American Reprographics Co CHS Capital LLC 03.02.2005
FTD Group Inc Leonard Green & Partners LP 08.02.2005
Valor Communications Group Inc Vestar Capital Partners, Inc., Welsh, Carson, Anderson & Stowe, Advent-Morro
Equity Partners, Inc., Citigroup Private Equity LP 08.02.2005
Prestige Brands Holdings Inc GTCR LLC, Crescent Capital Group 09.02.2005
Syniverse Holdings Inc GTCR LLC 09.02.2005
Alpha Natural Resources Inc First Reserve Management LP 14.02.2005
FreightCar America Inc Trimaran Capital Partners LLC, Hancock Capital Management LLC 05.04.2005
Accuride Corp Albion Investors LLC, Kohlberg Kravis Roberts & Co. LP, RSTW Partners, Trimaran
Capital Partners LLC 25.04.2005
VeriFone Holdings Inc GTCR LLC, Crescent Capital Group 29.04.2005
Zumiez Inc Brentwood Associates 05.05.2005
Warner Music Group Corp Thomas H. Lee Partners LP, Bain Capital Private Equity LP, Providence Equity
Partners LLC 10.05.2005
Xerium Technologies Inc Apax Partners Ltd. 16.05.2005
Citi Trends Inc Hampshire Equity Partners 17.05.2005
Rackable Systems Inc Parthenon Capital Inc, PTI Ventures LLC 09.06.2005
ev3 Inc Warburg Pincus LLC, The Vertical Group LP 16.06.2005
Builders FirstSource Inc JLL Partners, Inc. 22.06.2005
Eagle Bulk Shipping Inc Kelso & Co. LP 22.06.2005
Lincoln Educational Services Stonington Partners, Inc. 22.06.2005
Kenexa Corp Parthenon Capital Inc, Wafra Partners LLC, Westbury Partners 24.06.2005
NeuStar Inc Warburg Pincus LLC, ABS Capital Partners, Inc., MidOcean US Advisor LP 28.06.2005
Consolidated Commun Hldg Inc Spectrum Equity Management LP, Providence Equity Partners LLC 21.07.2005
Maidenform Brands Inc PineBridge Private Equity Group, Ares Private Equity Group 22.07.2005
Pike Electric Corp Lindsay Goldberg & Co. LLC 26.07.2005
Ruths Chris Steak House Inc Madison Dearborn Partners LLC 08.08.2005
Reddy Ice Holdings Inc Trimaran Capital Partners LLC, Irving Place Capital Management LP 09.08.2005
Rockwood Holdings Inc Kohlberg Kravis Roberts & Co. LP, aPriori Capital Partners LP 16.08.2005
Global Cash Access Hldg Inc Summit Partners LP, HarbourVest Partners LLC, Tudor Growth Equity 22.09.2005
TAL International Group Inc The Jordan Co. LP, Edgewater Services LLC 11.10.2005
AMERISAFE Inc Welsh, Carson, Anderson & Stowe, Abbott Capital Management LLC 17.11.2005
Brookdale Senior Living Inc FIG LLC 21.11.2005
Union Drilling Inc Metalmark Capital LLC 21.11.2005
Directed Electronics Inc Trivest Partners LP 15.12.2005
LINN Energy LLC Quantum Energy Partners LLC 12.01.2006
H&E Equipment Services Inc Bruckmann, Rosser, Sherrill & Co., Inc. 30.01.2006
Koppers Holdings Inc Saratoga Management Co. LLC 31.01.2006

73
Smart Modular Technologies Shah Management LLC, Francisco Partners Management LP 02.02.2006
EXCO Resources Inc GCP Capital Partners LLC, Ares Private Equity Group 08.02.2006
Morton's Restaurant Group Inc Castle Harlan, Inc., Laurel Crown Capital LLC 08.02.2006
TransDigm Group Inc Warburg Pincus LLC, Portfolio Advisors LLC, Banc of America Capital Investors 14.03.2006
Sealy Corp BancBoston Capital, Inc., Kohlberg Kravis Roberts & Co. LP, J.P. Morgan Partners
LLC, Bain Capital Private Equity LP 06.04.2006
Complete Production Svcs Inc SCF Partners LLC 20.04.2006
CPI International Inc The Cypress Group LLC 24.04.2006
DynCorp International LLC Veritas Capital Fund Management LLC 03.05.2006
Burger King Holdings Inc TPG Capital LLC, Bain Capital Private Equity LP, Goldman Sachs Capital Partners 17.05.2006
Town Sports Int Holdings Inc Bruckmann, Rosser, Sherrill & Co., Inc., Crescent Capital Group, Farallon Capital
Management 01.06.2006
Alphatec Holdings Inc HealthpointCapital LLC 02.06.2006
Golfsmith Intl Hldg Inc First Atlantic Capital Ltd. 14.06.2006
Houston Wire & Cable Co CHS Capital LLC 14.06.2006
PGT Inc JLL Partners, Inc. 27.06.2006
J Crew Group Inc TPG Capital LLC 27.06.2006
Chart Industries Inc First Reserve Management LP 25.07.2006
Geomet Inc Yorktown Partners LLC 27.07.2006
Aircastle Ltd FIG LLC 07.08.2006
ICF International Inc CM Equity Partners 27.09.2006
First Mercury Financial Corp Glencoe Capital LLC 17.10.2006
Susser Holdings Corp Wellspring Capital Management LLC 18.10.2006
ExlService Holdings Inc Oak Hill Capital Management LLC, Financial Technology Ventures Management Co.
LLC 19.10.2006
Eagle Rock Energy Partners LP Natural Gas Partners LLC 24.10.2006
GateHouse Media Inc FIG LLC 24.10.2006
Globalstar Inc Thermo Capital Partners LLC, QUALCOMM Ventures, Columbia Ventures Corp. 01.11.2006
Innophos Holdings Inc Bain Capital Private Equity LP 02.11.2006
Physicians Formula Holdings Summit Partners LP 08.11.2006
Hertz Global Holdings Inc The Carlyle Group LP, Clayton Dubilier & Rice LLC 15.11.2006
Spirit AeroSystems Holdings Onex Partners 20.11.2006
Altra Holdings Inc Genstar Capital LLC, CDP Capital Private Equity 14.12.2006
Carrols Restaurant Group Inc Madison Dearborn Partners LLC 14.12.2006
Opnext Inc Clarity Partners 14.02.2007
Clearwire Corp Motorola Solutions Venture Capital 07.03.2007
Veraz Networks Inc Levensohn Venture Partners LLC, Battery Ventures, Argonaut Partners LLC,
Norwest Venture Partners 04.04.2007
Cinemark Holdings Inc Madison Dearborn Partners LLC 23.04.2007
Solera Holdings Inc GTCR LLC 10.05.2007
TriMas Corp The Heartland Industrial Group LLC, Masco Capital Corp. 17.05.2007
Jazz Pharmaceuticals Inc
Kohlberg Kravis Roberts & Co. LP, Thoma Cressey Bravo, Inc., Adams Street Partners
LLC, Beecken Petty O'Keefe & Co. LP, Prospect Venture Partners, Versant Venture
Management LLC
31.05.2007
Bway Holding Co Kelso & Co. LP 12.06.2007
Polypore International Inc Warburg Pincus LLC 27.06.2007
Dice Holdings Inc General Atlantic LLC 17.07.2007
hhgregg Inc Freeman Spogli Management Co. LP 19.07.2007

74
Monotype Imaging Holdings Inc TA Associates Management LP 24.07.2007
Genpact Ltd General Atlantic LLC 01.08.2007
Concho Resources Inc Yorktown Partners LLC 02.08.2007
Deltek Inc New Mountain Capital LLC 01.11.2007
SandRidge Energy Inc Ares Private Equity Group 05.11.2007
Approach Resources Inc Yorktown Partners LLC 07.11.2007
Lumber Liquidators Inc TA Associates Management LP 08.11.2007
EnergySolutions Inc Lindsay Goldberg & Co. LLC 14.11.2007
Cardtronics Inc TA Associates Management LP, The CapStreet Group LLC 10.12.2007
MedAssets Inc Parthenon Capital Inc, Grotech Ventures, Galen Collaborative Capital 12.12.2007
Heritage-Crystal Clean Inc Bruckmann, Rosser, Sherrill & Co., Inc. 11.03.2008
Grand Canyon Education Inc DVSM LLC 19.11.2008
Rosetta Stone Inc ABS Capital Partners, Inc., Norwest Equity Partners 15.04.2009
Avago Technologies Ltd Kohlberg Kravis Roberts & Co. LP, Silver Lake Management Co. LLC 05.08.2009
Education Management Corp Leeds Equity Partners LLC, AlpInvest Partners BV, Providence Equity Partners LLC,
Goldman Sachs Capital Partners 01.10.2009
Mistras Group Inc Altus Capital Partners, Inc., HCI Equity Partners LLC 07.10.2009
Addus HomeCare Corp Eos Management LLC 27.10.2009
Vitamin Shoppe Inc CCMP Capital Advisors LP, Irving Place Capital Management LP 27.10.2009
Ancestry.com Inc
Spectrum Equity Management LP, Adams Street Partners LLC, Sorenson Capital, W
Capital Management LLC, Crosslink Capital, Inc., Industry Ventures LLC, Hercules
Capital
04.11.2009
STR Holdings Inc aPriori Capital Partners LP 06.11.2009
Dollar General Corp Kohlberg Kravis Roberts & Co. LP 12.11.2009
KAR Auction Services Inc Kelso & Co. LP, Parthenon Capital Inc, Goldman Sachs Capital Partners 10.12.2009
Cobalt Intl Energy Inc First Reserve Management LP, ACM Ltd., Riverstone Investment Group LLC 15.12.2009
TeamHealth Inc Blackstone Corporate Private Equity 15.12.2009
Kraton Performance Polymers TPG Capital LLC 16.12.2009
Symetra Financial Corp Vestar Capital Partners, Inc., aPriori Capital Partners LP, Rho Ventures, OZ
Management LP 21.01.2010
Generac Holdings Inc CCMP Capital Advisors LP, Unitas Capital Pte Ltd. 10.02.2010
SS&C Technologies Hold The Carlyle Group LP 30.03.2010
Douglas Dynamics Inc Aurora Capital Group LP 04.05.2010
Express Inc Golden Gate Private Equity, Inc. 12.05.2010
Roadrunner Transp Sys Inc HCI Equity Partners LLC, Bain Capital Credit, Eos Management LLC 12.05.2010
Noranda Aluminum Holding Corp Apollo Global Management LLC 13.05.2010
Higher One Holdings Inc North Hill Ventures, Lightyear Capital LLC 16.06.2010
Oasis Petroleum Inc EnCap Investments LP 16.06.2010
RealD Inc Shamrock Capital Advisors LLC 15.07.2010
Chesapeake Midstream Partners Global Infrastructure Management LLC 28.07.2010
Gordmans Stores Inc Sun Capital Partners, Inc. 04.08.2010
IntraLinks Holdings Inc TA Associates Management LP, Rho Ventures 05.08.2010
NXP Semiconductors NV Apax Partners Ltd., Kohlberg Kravis Roberts & Co. LP, Bain Capital Private Equity
LP, AlpInvest Partners BV, Silver Lake Management Co. LLC 05.08.2010
Tower International Inc Cerberus Capital Management LP 14.10.2010
Bravo Brio Restaurant Grp Inc Castle Harlan, Inc., Bruckmann, Rosser, Sherrill & Co., Inc. 21.10.2010
Booz Allen Hamilton Hldg Corp The Carlyle Group LP 16.11.2010

75
LPL Investment Holdings Inc TPG Capital LLC, Hellman & Friedman LLC 17.11.2010
Aeroflex Holding Corp Golden Gate Private Equity, Inc., Veritas Capital Fund Management LLC, Goldman
Sachs Capital Partners 18.11.2010
Targa Resources Corp Warburg Pincus LLC 06.12.2010
First Republic Bank,California General Atlantic LLC, Colony Capital LLC 08.12.2010
RigNet Inc Altira Group LLC, Cubera Private Equity AS, Houston Ventures 14.12.2010
Fortegra Financial Corp Summit Partners LP 16.12.2010
Demand Media Inc Spectrum Equity Management LP, St. Cloud Capital LLC, Oak Investment Partners,
Generation Partners Management LLC, W Capital Management LLC 25.01.2011
Nielsen Holdings NV
Thomas H. Lee Partners LP, Blackstone Corporate Private Equity, The Carlyle Group
LP, Kohlberg Kravis Roberts & Co. LP, Hellman & Friedman LLC, AlpInvest Partners
BV, Centerview Partners Holdings LLC
26.01.2011
BankUnited Inc W.L. Ross & Co. LLC, Blackstone Corporate Private Equity, The Carlyle Group LP,
Centerbridge Partners LP 27.01.2011
Kinder Morgan Inc Highstar Capital LP 10.02.2011
HCA Holdings Inc Kohlberg Kravis Roberts & Co. LP, Bain Capital Private Equity LP 09.03.2011
GNC Holdings Inc Ares Private Equity Group 31.03.2011
Air Lease Corp W.L. Ross & Co. LLC, Leonard Green & Partners LP, Ares Private Equity Group 18.04.2011
Thermon Group Holdings Inc CHS Capital LLC, Thompson Street Capital Managers LLC 04.05.2011
Spirit Airlines Inc Indigo Partners LLC, Oaktree Capital Management 25.05.2011
Bankrate Inc Apax Partners 16.06.2011
HomeAway Inc Institutional Venture Partners, Redpoint Ventures, TCMI, Inc., Austin Ventures 28.06.2011
Skullcandy Inc Battery Ventures, Goode Partners LLC, Mercato Partners 19.07.2011
Francesca's Holdings Corp CCMP Capital Advisors LP 21.07.2011
Dunkin Brands Group Inc Thomas H. Lee Partners LP, The Carlyle Group LP, Bain Capital Private Equity LP 26.07.2011
Wesco Aircraft Holdings Inc The Carlyle Group LP 27.07.2011
C&J Energy Services Inc Citigroup Private Equity LP, StepStone Group LP, Energy Spectrum Capital 28.07.2011
Mattress Firm Holding Corp J.W. Childs Associates LP 17.11.2011
Digital Domain Media Group Inc Palm Beach Capital Partners LLC 18.11.2011
Laredo Petroleum Holdings Inc Warburg Pincus LLC 14.12.2011
US Silica Holdings Inc Golden Gate Private Equity, Inc. 31.01.2012
EPAM Systems Inc Russia Partners Management LLC, VTB Capital, Da Vinci Capital Llc 07.02.2012
Roundy's Inc AlpInvest Partners BV, Willis Stein & Partners, Norwest Equity Partners 07.02.2012
Yelp Inc Benchmark Capital Management Co. LLC, Deer Management Co. LLC, Elevation
Management LLC 01.03.2012
Nationstar Mortgage Hldg Inc FIG LLC 07.03.2012
Allison Transmission Hldg Inc The Carlyle Group LP, Onex Partners 14.03.2012
M/A-COM Technology Hldg Summit Partners LP 14.03.2012
Regional Management Corp Palladium Equity Partners Advisor LLC, Parallel Investment Partners 27.03.2012
Rexnord Corp Apollo Global Management LLC 28.03.2012
Erickson Air-Crane Inc Q&U Investments LLC 10.04.2012
Forum Energy Technologies Inc SCF Partners LLC, B-29 Investments LP 11.04.2012
MRC Global Inc Goldman Sachs Capital Partners 11.04.2012
Tumi Holdings Inc DH Private Equity Partners LLP 18.04.2012
Ignite Restaurant Group Inc J. H. Whitney Capital Partners LLC 10.05.2012
Five Below Inc Advent International Corp., LLR Partners, Inc., blue 9 capital LLC 18.07.2012
Chuy's Holdings Inc Goode Partners LLC 23.07.2012
Northern Tier Energy LP TPG Capital LLC 25.07.2012

76
Del Frisco's Restaurant Grp LL Lone Star Americas Acquisitions LLC 26.07.2012
Bloomin' Brands Inc Catterton Management Co. LLC, Bain Capital Private Equity LP 07.08.2012
Performant Financial Corp Parthenon Capital Inc, Madison Capital Funding LLC, Ares Capital Management LLC 09.08.2012
Berry Plastics Group Inc Graham Partners, Inc., Apollo Global Management LLC 03.10.2012
Realogy Holdings Corp Apollo Global Management LLC 10.10.2012
Shutterstock Inc Insight Venture Management LLC 10.10.2012
Diamondback Energy Inc Wexford Capital Private Equity 11.10.2012
Restoration Hardware Hldg Inc Catterton Management Co. LLC, Tower Three Partners LLC 01.11.2012
USA Compression Partners LP Riverstone Investment Group LLC 14.01.2013
Norwegian Cruise Line Hldg Ltd TPG Capital LLC, Apollo Global Management LLC 17.01.2013
Bright Horizons Family Bain Capital Private Equity LP 24.01.2013
TRI Pointe Homes Inc Starwood Capital Group Global LLC 30.01.2013
Boise Cascade Co Madison Dearborn Partners LLC 05.02.2013
Pinnacle Foods Inc Blackstone Corporate Private Equity 27.03.2013
Fairway Group Holdings Corp Sterling Investment Partners Advisers LLC 16.04.2013
Hannon Armstrong MissionPoint Capital Partners LLC 17.04.2013
SeaWorld Entertainment Inc Blackstone Corporate Private Equity, Goldman Sachs Capital Partners 18.04.2013
Emerge Energy Services LP KA Fund Advisors LLC, Insight Equity Holdings LLC, LBC Credit Partners 08.05.2013
Quintiles Transnational Aisling Capital LLC, TPG Capital LLC, Bain Capital Private Equity LP, 3i Private
Equity 08.05.2013
TriState Capital Holdings Inc Lovell Minnick Partners LLC, BankCap Partners 08.05.2013
First NBC Bank Holding Co Castle Creek Capital LLC, Blue Pine Partners LLC 09.05.2013
Global Brass & Copper Holdings KPS Capital Partners LP 22.05.2013
Ply Gem Holdings Inc CI Capital Partners LLC 22.05.2013
Coty Inc Berkshire Partners LLC, Rhône Capital LLC 12.06.2013
CDW Corp Providence Equity Partners LLC, Madison Dearborn Partners LLC 26.06.2013
HD Supply Holdings Inc The Carlyle Group LP, Clayton Dubilier & Rice LLC, Bain Capital Private Equity LP 26.06.2013
Noodles & Co Catterton Management Co. LLC 27.06.2013
Fox Factory Holding Corp Compass Group Management LLC, Madison Capital Funding LLC 07.08.2013
Stock Building Supply Holdings The Gores Group LLC 08.08.2013
Envision Healthcare Holdings Clayton Dubilier & Rice LLC 13.08.2013
Benefitfocus Inc Oak Investment Partners, Goldman Sachs Capital Partners 17.09.2013
ClubCorp Holdings Inc KSL Advisors LLC 19.09.2013
Burlington Stores Inc Bain Capital Private Equity LP 01.10.2013
QTS Realty Trust Inc General Atlantic LLC 08.10.2013
Antero Resources Corp Warburg Pincus LLC 09.10.2013
Stonegate Mortgage Corp Long Ridge Equity Partners LLC, Second Curve Partners LLC 09.10.2013
Springleaf Holdings Inc FIG LLC 15.10.2013
CommScope Holding Co Inc The Carlyle Group LP 24.10.2013
Endurance Intl Grp Hldg Inc Warburg Pincus LLC, Goldman Sachs Capital Partners, Tregaron Capital Co. LLC 24.10.2013
Surgical Care Affiliates Inc TPG Capital LLC, Oaktree Capital Management 29.10.2013
The Container Store Group Inc Leonard Green & Partners LP 31.10.2013
Barracuda Networks Inc Sequoia Capital, Francisco Partners Management LP 05.11.2013
Extended Stay America Inc Blackstone Corporate Private Equity, Centerbridge Partners LP 12.11.2013
Houghton Mifflin Harcourt Co ABRY Partners LLC, Apollo Capital Management LP, Avenue Capital Management
LLC, Anchorage Capital Group 13.11.2013
77
Vince Holding Corp Sun Capital Partners, Inc. 21.11.2013
ARAMARK Holdings Corp Thomas H. Lee Partners LP, Warburg Pincus LLC, Goldman Sachs Capital Partners,
CCMP Capital Advisors LP 11.12.2013
Hilton Worldwide Holdings Inc Blackstone Corporate Private Equity, GIC Real Estate Pte Ltd. 11.12.2013
EP Energy Corp Access Industries, Inc., Apollo Global Management LLC, Riverstone Investment Group
LLC 16.01.2014
RSP Permian Inc Natural Gas Partners LLC 16.01.2014
Rice Energy Natural Gas Partners LLC 23.01.2014
Malibu Boats Inc Black Canyon Capital LLC 30.01.2014
Continental Building Products Lone Star Americas Acquisitions LLC 04.02.2014
Ladder Capital Corp GI Manager LP, OMERS Private Equity, Inc., TowerBrook Capital Partners LP,
Alberta Investment Management Corp. 05.02.2014
Installed Building Products Littlejohn & Co. LLC 12.02.2014
TriNet Group Inc General Atlantic LLC 26.03.2014
Enable Midstream Partners LP ArcLight Capital Holdings LLC 10.04.2014
Zoe's Kitchen Inc Jemison Investment Co., Inc., Brentwood Associates 10.04.2014
Paycom Software Inc Welsh, Carson, Anderson & Stowe 14.04.2014
Sabre Corp TPG Capital LLC, Silver Lake Management Co. LLC 16.04.2014
Sportsman's Warehouse Hldg Inc The Seidler Co. LLC 16.04.2014
Papa Murphy's Holdings Inc Access Industries, Inc., Ares Capital Management LLC, Lee Equity Partners LLC,
Arrowhead Mezzanine LLC 01.05.2014
K2M Group Holdings Inc Ferrer Freeman & Co. LLC, Welsh, Carson, Anderson & Stowe 07.05.2014
Parsley Energy Inc Natural Gas Partners LLC 22.05.2014
Trinseo SA Bain Capital Private Equity LP 11.06.2014
Adeptus Health Inc Sterling Fund Management LLC 24.06.2014
Servicemaster Global Holdings Clayton Dubilier & Rice LLC, StepStone Group LP, Ridgemont Partners Management
LLC 26.06.2014
The Michaels Companies Inc Blackstone Corporate Private Equity, Bain Capital Private Equity LP 26.06.2014
Minerva Neurosciences Inc Johnson & Johnson Innovation JJDC, Inc., Care Capital LLC, Medicxi Ventures Ltd. 30.06.2014
Advanced Drainage Systems Inc American Securities LLC 24.07.2014
El Pollo Loco Holdings Inc Trimaran Capital Partners LLC 24.07.2014
Catalent Inc Genstar Capital LLC, Aisling Capital LLC, Blackstone Corporate Private Equity 30.07.2014
Green Bancorp Inc Harvest Partners LP, FFL Partners LLC, Pine Brook Road Partners LLC 07.08.2014
Independence Contract Drilling Lime Rock Management LP, 4D Global Energy Advisors SAS, Northwestern Mutual
Capital LLC 07.08.2014
Ryerson Holding Corp Platinum Equity LLC 08.08.2014
Civitas Solutions Inc Vestar Capital Partners, Inc. 16.09.2014
Smart & Final Stores Inc Ares Private Equity Group 23.09.2014
Vivint Solar Inc Blackstone Corporate Private Equity 30.09.2014
VWR Corp Madison Dearborn Partners LLC 01.10.2014
FMSA Holdings Inc American Securities LLC 02.10.2014
Veritex Holdings Inc SunTx Capital Partners LP 08.10.2014
Dave & Buster's Ent Inc Oak Hill Capital Management LLC 09.10.2014
Zayo Group Holdings Inc
HarbourVest Partners LLC, Charlesbank Capital Partners LLC, Columbia Capital
LLC, Oak Investment Partners, GTCR LLC, Battery Ventures, TAC Partners, Inc.,
AlpInvest Partners BV, Centennial Ventures, Inc.
16.10.2014
Boot Barn Holdings Inc Freeman Spogli Management Co. LP, CapitalSouth Corp., Brookside Capital Partners
Management LLC, Hartford Mezzanine & Private Equity Group 29.10.2014
Upland Software Inc Austin Ventures, ESW Capital LLC, Activant Capital Group LLC 05.11.2014

78
Freshpet Inc MidOcean US Advisor LP 06.11.2014
INC Research Holdings Inc Avista Capital Holdings LP 06.11.2014
Axalta Coating Systems Ltd The Carlyle Group LP, Franklin Square Holdings LP 11.11.2014
PRA Health Sciences Inc Kohlberg Kravis Roberts & Co. LP 12.11.2014
The Habit Restaurants Inc KarpReilly LLC, BlackRock Private Equity Partners 19.11.2014
Connecture Inc Live Oak Equity Partners LLC, SSM Partners, Chrysalis Ventures, Inc., Great Point
Partners Private Equity 11.12.2014
Metaldyne Performance Group American Securities LLC 11.12.2014
Bellerophon Therapeutics LLC Venrock Associates, ARCH Venture Partners LLC, New Mountain Capital LLC 13.02.2015
GoDaddy Inc Kohlberg Kravis Roberts & Co. LP, TCMI, Inc., Silver Lake Management Co. LLC 31.03.2015
Party City Holdco Inc Advent International Corp., Thomas H. Lee Partners LP 15.04.2015
Virtu Financial Inc Silver Lake Management Co. LLC 15.04.2015
Enviva Partners LP Riverstone Investment Group LLC 28.04.2015
Tallgrass Energy GP LP EMG Fund II Management LP 06.05.2015
Bojangles' Inc Advent International Corp., Brooke Private Equity Associates 07.05.2015
Black Knight Financial Svcs Thomas H. Lee Partners LP 19.05.2015
Wingstop Inc Roark Capital Group, Inc., Arrowhead Mezzanine LLC 11.06.2015
Univar Inc Clayton Dubilier & Rice LLC, CVC Advisers Ltd., Goldman Sachs Capital Partners,
Apollo Capital Management LP 17.06.2015
Gener8 Maritime Inc Aurora Capital Group LP, Oaktree Capital Management, BlueMountain Capital
Management 24.06.2015
Lantheus Holdings Inc Avista Capital Holdings LP 24.06.2015
Milacron Holdings Corp CCMP Capital Advisors LP, Alberta Investment Management Corp. 24.06.2015
TransUnion Advent International Corp., Goldman Sachs Capital Partners 24.06.2015
Alarm.com Holdings Inc ABS Capital Partners, Inc., TCMI, Inc. 25.06.2015
Unique Fabricating Inc Peninsula Capital Partners LLC, Taglich Private Equity LLC, Taglich Private Equity
LLC 30.06.2015
Ollie's Bargain Outlet Hldg CCMP Capital Advisors LP 15.07.2015
Planet Fitness Inc TSG Consumer Partners LLC 05.08.2015
Conifer Holdings Inc Strength Capital Partners LLC 12.08.2015