Long-range transport of North African dust to the eastern United States
14
JOURNAL OF GEOPHYSICAL RESEARCH, VOL. 102, NO. D10, PAGES 11,225-11,238, MAY 27, 1997 Long-range transport of North African dust to the eastern United States Kevin D. Perry, Thomas A. Cahill, RobertA. Eldred, and Dabrina D. Dutcher Air Quality Group, Crocker NuclearLaboratory, University of California, Davis Thomas E. Gill Wind Erosion andWaterConservation Research Unit, USDA Agricultural Research Service, Lubbock, Texas Abstract. The long-range transport of NorthAfricandust to theMiddle East, Europe, South America, and the Caribbean has been well documented during the past 25 years. With the advent of routine collection andanalysis of fine aerosols at national parks, monuments, andwilderness areas in the continental United States, these North African dust incursions cannow be tracked, characterized, and quantified across muchof the eastern half of the United States. Identification of theNorth African source of these dust episodes is confirmed by mass distribution measure- ments, a characteristic A1/Ca ratio,isentropic backward air mass trajectories, andsequential plots of the spatial distribution of the dust plumes. North African dust incursions into the continental UnitedStates persist for-10 days andoccurred, on average, 3 times per year from 1992to 1995. Fine soil mass usually exceeds 10 •tg m -3 during these dust episodes and dominates local finesoil dust by an orderof magnitude or more, even in the so-called "dust bowl" states of the central United States. Size-resolved measurements of elemental composition taken during July 1995in- dicate that themass mean diameter of thetransported NorthAfrican dust is < 1 •tm. Thehigh mass scattering efficiency andabundant particle surface areaassociated with these submicron soil aerosols could haveimportant consequences for both the radiative balance of the region and the chemistry of the localaerosols during summer when the long-range transport of NorthAfrican dust to the United States is most common. 1. Introduction The arid regionsof North Africa are a prodigioussourceof soil dust. Every year, vast quantities of soil are lofted from the Earth's surface duringduststorms and transported away from the continent on the prevailingwinds [Chester et al., 1971; Carlson and Prospero, 1972; Parkin et al., 1972; Prospero and Carlson, 1972]. These dust plumesare plainly visible in satellitephoto- graphs, extend for thousands of kilometers, and can persistfor many days. They have extremelydeleterious effects on the air quality near the African continent but are also importanton a global scale. For example,the North African dust reduces visi- bility, modifies the temperaturestructure of the atmosphere [Carlson and Cavefly, 1977; Karyampudi and Carlson, 1988], provides important nutrients to and influences the biGgeochemis- try of oceanic ecosystems [Savoieand Prospero, 1980; Graham and Duce, 1982; Carder et al., 1986; Talbot et al., 1986; Duce et al., 1991; Kremling and Streu, 1993; Gelado-Caballero et al., 1995;Swap et al., 1996] and terrestrial ecosystems [Graham and Duce, 1982; Reichholf, 1986; McDowell et al., 1990], acts to neutralize the acidity of precipitation [Prodi and Fea, 1979; Loj)e-Pilot et al., 1986; McDowell et al., 1990; Talbot et al., 1990; Sequeira,1991; Rod5 et al., 1993], and altersthe albedo Copyright ! 997by the American Geophysical Union. Paper number 97JD00260. 0148-0227/97/97JD-00260509.00 over large regionsof the northern hemisphere [Fraser, 1976; Carlson, 1979; Coakley and Cess,1985; Jankowiak and Tanre, 1992; Li et al., 1996; Swap et al., 1996;Sokolik and Toon,1996; Tegen et al., 1996]. The frequency andseverity of theNorthAf- ricandust events is also thought to be a sensitive indicator of de- sertification of the Sahel region of Africa [Prospero and Nees, 1977, 1986;Tegen andFung, 1995; Swap et al., 1996]. Although gravitational settling quicklyremoves the largest soilparticles fromthedust plumes [Westphal et al., 1987], North Africandustis regularly transported to places as far away as Europe[Pitty, 1968; Chester et al., 1984; Prodi and Fea, 1979; Reiff et al., 1986; Alpeft and Ganor, 1993], the Middle East [Ganor, 1991 ], South America[Prospero et al., 1981; Talbotet al., 1990;Swapet al., 1992], and the Caribbean [Carlson and Prospero, 1972; Glaccum and Prospero, 1980; Morales, 1986], where dust concentrations have reached 500 gg m-3[Talbot et al., 1986]. In fact,North Africandust hasbeen deposited in suffi- cient quantities to become the parent materialof somesoils in Bermuda [Muhs et al., 1990] and mountainous islandsin the Caribbean [Herwitz et al., 1996]. Although North African dust has also been observedon the southeastern coastof the United States (e.g., Miami, Florida) [Prospero and Carlson, 1972; Savoie and Prospero, 1977; Carder et al., 1986], and in the midwestern United States (Illinois)[Gatzand Prospero, 1996],the frequency, spatial ex- tent, and mass concentrations of these dust incursions have not previously been characterized. This paper uses datafrom the In- teragency Monitoring of Protected Visual Environments 11,225
Transcript of Long-range transport of North African dust to the eastern United States
JOURNAL OF GEOPHYSICAL RESEARCH, VOL. 102, NO. D10, PAGES 11,225-11,238, MAY 27, 1997
Long-range transport of North African dust to the eastern United States
Kevin D. Perry, Thomas A. Cahill, Robert A. Eldred, and Dabrina D. Dutcher
Air Quality Group, Crocker Nuclear Laboratory, University of California, Davis
Thomas E. Gill
Wind Erosion and Water Conservation Research Unit, USDA Agricultural Research Service, Lubbock, Texas
Abstract. The long-range transport of North African dust to the Middle East, Europe, South America, and the Caribbean has been well documented during the past 25 years. With the advent of routine collection and analysis of fine aerosols at national parks, monuments, and wilderness areas in the continental United States, these North African dust incursions can now be tracked, characterized, and quantified across much of the eastern half of the United States. Identification of the North African source of these dust episodes is confirmed by mass distribution measure- ments, a characteristic A1/Ca ratio, isentropic backward air mass trajectories, and sequential plots of the spatial distribution of the dust plumes. North African dust incursions into the continental United States persist for-10 days and occurred, on average, 3 times per year from 1992 to 1995. Fine soil mass usually exceeds 10 •tg m -3 during these dust episodes and dominates local fine soil dust by an order of magnitude or more, even in the so-called "dust bowl" states of the central United States. Size-resolved measurements of elemental composition taken during July 1995 in- dicate that the mass mean diameter of the transported North African dust is < 1 •tm. The high mass scattering efficiency and abundant particle surface area associated with these submicron soil aerosols could have important consequences for both the radiative balance of the region and the chemistry of the local aerosols during summer when the long-range transport of North African dust to the United States is most common.
1. Introduction
The arid regions of North Africa are a prodigious source of soil dust. Every year, vast quantities of soil are lofted from the Earth's surface during dust storms and transported away from the continent on the prevailing winds [Chester et al., 1971; Carlson and Prospero, 1972; Parkin et al., 1972; Prospero and Carlson, 1972]. These dust plumes are plainly visible in satellite photo- graphs, extend for thousands of kilometers, and can persist for many days. They have extremely deleterious effects on the air quality near the African continent but are also important on a global scale. For example, the North African dust reduces visi- bility, modifies the temperature structure of the atmosphere [Carlson and Cavefly, 1977; Karyampudi and Carlson, 1988], provides important nutrients to and influences the biGgeochemis- try of oceanic ecosystems [Savoie and Prospero, 1980; Graham and Duce, 1982; Carder et al., 1986; Talbot et al., 1986; Duce et al., 1991; Kremling and Streu, 1993; Gelado-Caballero et al., 1995; Swap et al., 1996] and terrestrial ecosystems [Graham and Duce, 1982; Reichholf, 1986; McDowell et al., 1990], acts to neutralize the acidity of precipitation [Prodi and Fea, 1979; Loj)e-Pilot et al., 1986; McDowell et al., 1990; Talbot et al., 1990; Sequeira, 1991; Rod5 et al., 1993], and alters the albedo
Copyright ! 997 by the American Geophysical Union.
Paper number 97JD00260. 0148-0227/97/97JD-00260509.00
over large regions of the northern hemisphere [Fraser, 1976; Carlson, 1979; Coakley and Cess, 1985; Jankowiak and Tanre, 1992; Li et al., 1996; Swap et al., 1996; Sokolik and Toon, 1996; Tegen et al., 1996]. The frequency and severity of the North Af- rican dust events is also thought to be a sensitive indicator of de- sertification of the Sahel region of Africa [Prospero and Nees, 1977, 1986; Tegen and Fung, 1995; Swap et al., 1996].
Although gravitational settling quickly removes the largest soil particles from the dust plumes [Westphal et al., 1987], North African dust is regularly transported to places as far away as Europe [Pitty, 1968; Chester et al., 1984; Prodi and Fea, 1979; Reiff et al., 1986; Alpeft and Ganor, 1993], the Middle East [Ganor, 1991 ], South America [Prospero et al., 1981; Talbot et al., 1990; Swap et al., 1992], and the Caribbean [Carlson and Prospero, 1972; Glaccum and Prospero, 1980; Morales, 1986], where dust concentrations have reached 500 gg m-3 [Talbot et al., 1986]. In fact, North African dust has been deposited in suffi- cient quantities to become the parent material of some soils in Bermuda [Muhs et al., 1990] and mountainous islands in the Caribbean [Herwitz et al., 1996].
Although North African dust has also been observed on the southeastern coast of the United States (e.g., Miami, Florida) [Prospero and Carlson, 1972; Savoie and Prospero, 1977; Carder et al., 1986], and in the midwestern United States (Illinois) [Gatz and Prospero, 1996], the frequency, spatial ex- tent, and mass concentrations of these dust incursions have not
previously been characterized. This paper uses data from the In- teragency Monitoring of Protected Visual Environments
11,225

11,226 PERRY ET AL.: LONG-RANGE TRANSPORT OF NORTH AFRICAN DUST
(IMPROVE) fine aerosol monitoring network [Eldred et al., 1990; Malm et al., 1994] to show that significant concentrations of Noah African dust are regularly transported to the eastern United States during the summer months. A brief overview of the instrumentation and IMPROVE network is followed by a de- tailed case study of a particularly large dust episode to establish its provenance. The frequency, typical spatial extent, mass con- centration, and mass distribution of the Noah African dust epi- sodes in the eastern United States are then estimated. Some po- tential consequences of the large dust episodes are mentioned in the last section of this paper.
2. Instrumentation and Data Set Description
Most of the data presented in this paper were collected as part of the normal operation of the IMPROVE fine aerosol monitoring network. This network has -70 sites in the contiguous United States, Alaska, Hawaii, and U.S. Virgin Islands (Figure 1). A detailed description of the standard IMPROVE aerosol sampling system, protocols, and analysis techniques is given by Eldred et al. [1990] and Malm et al. [1994, 1996]. Thus only a brief de- scription of the sampling and analysis techniques relevant to this paper are provided.
The air samplers of the IMPROVE network operate two times per week (Wednesday and Saturday) for a 24-hour period starting at midnight and collect particles with diameters < 2.5 gm (i.e., PM2.5) and < 10 gm (i.e., PM10) on chemically inert, 25-mm stretched Teflon filters. The PM2.5 Teflon filters are analyzed gravimetrically, by Particle-Induced X ray Emission (PIXE), and by X ray Fluorescence to provide measurements of particle mass
and elemental composition [Cahill et al., 1984; Malm et al., 1994, 1996]. The PMi0 aerosols collected on the Teflon filters, however, are typically analyzed for gravimetric mass only. The IMPROVE network also collects PM2.5 aerosols on Nylon filters that are analyzed by ion chromatography to provide measure- ments of particulate nitrate and sulfate ions. To prevent the un- wanted collection of gaseous nitric acid (HNO3) and sulfur di- oxide (SO2) on the Nylon filters, potassium carbonate (K2CO3) coated denuders are placed within the sampling inlets of these modules.
Estimates of the soil dust concentration are made by combin- ing the masses of the elements predominantly associated with the Earth's crust (i.e., A1, Ca, Fe, Si, and Ti) [Flocchini et al., 1981; Cahill et al., 1981]. These crustal elements are assumed to be in the form of their normal oxides [Seinfeld, 1986] and must, there- fore, be multiplied by their corresponding molar correction fac- tors [Mahn et al., 1994] before they are combined to calculate the mass of the soil. A 16% correction is then made to account for
the presence of other soil elements, such as K, Na, Mn, Mg, and V that are not included in the linear combination. Justification
for this procedure and the formula that is used to estimate the soil dust concentrations are given by Malm et al. [ 1994, 1996].
An 8-stage Davis rotating drum unit for monitoring (DRUM) impactor [Cahill et al., 1985] was used to make size-resolved measurements of elemental composition during the Southeastern Aerosol Visibility Study (SEAVS) that took place at Great Smoky Mountains National Park (Tennessee) from July 15 to August 31, 1995 (Figure 1). The DRUM is a Lundgren-type, rotating drum, cascade impactor that uses a series of single round jets to separate aerosols based on their aerodynamic diameters. It
Abbottsford ;hi
(/C Salmon 2 rate,r Lake Sawtooth ß Scoville t
Redwood Craters of ßYellowstone Badlands the ß
ß Bridger
Jarbidge So Lake Tahoe
Point Great Basin ß Mr. Zirkel ß ß Rocky Mountain Reyes Yosemite ' ] Arches / Pinnacl.e.s ß •Death Canyonlands ß• ß White River
•'.. ..... V.alley Bry;:e Canyon ' / ...... ..I..,• o.•quv,• ß ß \ / ß W•.rninlmhe •ia• o•a,,u • .. _ •lndian•Gardens .•.•-'j'•-;--- ' Dunes
•...,•me La •e ad'•ie• , •3ar•?odn--TM e s a Verde ,.,x ,., -onio •e - • Bar•delier •an borg ß
\ . . Petrified Forest
Joshua Tree
Tontoß / ßGila tguaro. Chiricahua
oundary Waters Canoe Area ß Isle Royale
oth
Dolly Sods
M•ooßs,.• orn Great Gulf Acadia
Underhill • Whiteface Mtn Bridgton
• ß Sunapee Mtn Lye Broo )bin
Reservoir
Shining Rock
Cape Romain
Guadalupe Mountains )kefenokee
3rigantine
[ton
Shenandoah
Ch
Bend
Everglades
Virgin Islands
Figure 1. Map showing the location of all the IMPROVE fine aerosol monitoring sites in the United States that operated for at least 1 year between March 1988 and May 1995.

PERRY ET AL.' LONG-RANGE TRANSPORT OF NORTH AFRICAN DUST 11,227
O 20•
oJ 10 ,
a) [1991[
1 4 81115182225291 5 81215192226293 6101317202427313 710131721242831 4 7111418212528
May June July August Sept.
20.
10.
0
b) 11992[
2 6 9 131620232730 3 6 101317202427 1 4 8 11 1518222529 1 5 8 121519222629 2 5 9 121619232630
May June July August Sept.
40-
E 30
• 20 o
oJ lO.
c) 11993l
1 5 81215192226292 5 91216192326303 7101417212428314 71114182125281 4 8111518222529
May June July August Sept.
Figure 2. Time series of PM2.5 soil concentrations at Virgin Islands National Park from May to September for (a) 1991, (b) 1992, and (c) 1993. ND indicates that no data are available.
operates at a flow of 1.1 L min-1 and separates aerosols into the following size ranges:-15 - 10, 10 - 5.0, 5.0 - 2.5, 2.5 - 1.15, 1.15 - 0.56, 0.56 - 0.34, 0.34 - 0.24, and 0.24 - 0.069 pm [Raabe et al., 1988]. Aerosols were collected on 480-pg cm-2 mylar strips that had been coated with a 5-pg cm-2 layer of Apiezon type L grease to minimize particle bounce-off. This grease coat- ing reduces the mass of incorrectly sized soil particles in the smaller stages of the DRUM impactor by a factor of 1000 [Cahill et al., 1985]. A 25-mm stretched Teflon after-filter collects aero- sols with aerodynamic diameters < 0.069 gm. The DRUM stages were set to rotate 2 mm every 4 hours and were analyzed by PIXE to provide size-resolved measurements of elemental com- position with 4-hour resolution.
3. Case Study of a Regional Dust Episode in the Eastern United States
Several extremely large soil dust episodes have been observed in the eastern half of the United States during the last 5 years. In this section, one of these events is described in detail to provide
evidence that the dust originated from North Africa. The long- range transport of North African dust into the interior of the con- tinental United States is plausible given that copious quantities of North African dust are regularly transported to the Caribbean (Figure 2) [Carlson and Prospero, 1972; Glaccurn and Prospero, 1980; Morales, 1986; Swap et al., 1996]. The soil concentrations associated with the these dust episodes are so large that the an- nual mean PM2.5 soil concentration is much higher at Virgin Is- lands National Park (3.25 gg m-3) which is in the Caribbean Sea than at any of the sites shown in Figure 1 (Table 1). This re- markable fact makes Virgin Islands National Park the dustiest of all the IMPROVE sites.
The dust episode that this section describes took place from June 23 to July 7, 1993. The first indication of the dust episode occurred when PM2.5 soil concentrations began to increase sharply at Virgin Islands National Park on June 19 (Figure 2c). Within 4 days of the arrival of this dust-laden air mass to the Caribbean, the PM2.5 soil concentration at Everglades National Park in southern Florida also began to increase (Figure 3a). By June 30, the soil dust had progressed northwest to Upper Buffalo Wilderness Area (Arkansas) where PM2.5 soil concentrations ex-

11,228 PERRY ET AL.' LONG-RANGE TRANSPORT OF NORTH AFRICAN DUST
Table 1. Mean PM2.5 Soil Concentration as a Function of Season for the 15 Dustiest IMPROVE Sites (1988 through 1995)
Total
Site Rank Mean
Spring Summer Fall (March, April, May) (June, July, Aug.) (Sept., Oct., Nov.)
Mean Mean Mean
Rank Median Rank Median Rank Median Maximum Maximum Maximum
Winter
(Dec., Jan., Feb.)
Mean
Rank Median
Maximum
Virgin Islands National Park 1 3.25 1
(Caribbean)
Guadalupe Mountains National Park 2 1.22 2
(Texas)
Big Bend National Park (Texas) 3 1.16 6
Saguaro National Monument (Arizona) 4 1.08 3
Upper Buffalo Wilderness Area 5 1.07 > 15
(Arkansas)
Everglades National Park (Florida) 6 1.05 >15
San Gorgonio Wilderness Area 7 0.99 10
(California)
Okefenokee National
Wildlife Refuge 8 0.98 > 15 (Georgia)
Tonto National
Monument (Arizona) 9 0.93 5
Jarbidge Wilderness Area (Nevada) 10 0.92 15
Great Sand Dunes
National Monument 11 0.91 4
(Colorado)
Sipsey Wilderness Area (Alabama) 12 0.90 >15
Yellowstone National
Park (Wyoming) 13 0.79 >15
Petrified Forest National
Park (Arizona) 14 0.78 8
Chiricahua National
Monument (Arizona) 15 0.76 7
2.27 7.58 2.49 0.67
0.31 1 6.12 1 0.39 1 0.11
40.8 30.9 31.0 10.2
1.80 1.62 0.90 0.55
1.37 8 1.04 4 0.57 2 0.39
15.3 18.5 11.5 4.31
1.35 2.28 0.58 0.43
0.92 5 1.40 12 0.43 4 0.30
22.8 21.8 3.70 2.21
1.68 1.09 0.98 0.55
1.43 13 0.88 3 0.81 3 0.33
6.92 6.63 5.19 3.46
0.55 3.02 0.47 0.22
0.50 2 0.92 >15 0.32 >15 0.18
1.96 25.5 2.02 0.79
0.53 2.96 0.55 0.17
0.34 3 1.36 15 0.17 >15 0.12
7.16 21.4 7.59 0.84
1.09 1.27 1.32 0.28
0.79 12 1.01 2 0.85 13 0.17
6.98 4.27 7.21 5.96
0.54 2.84 0.34 0.20
0.47 4 1.10 >15 0.27 >15 0.20
1.26 25.4 1.63 0.53
1.36 1.28 0.72 0.35
1.15 11 1.11 8 0.60 6 0.23
8.53 4.37 3.04 3.28
0.92 1.73 0.85 0.17
0.64 7 1.66 5 0.51 >15 0.09
5.23 5.62 3.64 5.72
1.60 1.04 0.65 0.34
0.97 14 0.81 10 0.48 9 0.21
19.0 5.47 3.02 4.33
0.62 2.19 0.45 0.35
0.53 6 0.72 >15 0.42 7 0.30
1.91 32.3 1.22 1.42
0.92 1.33 0.73 0.18
0.71 10 1.04 7 0.50 >15 0.13
5.92 5.34 4.91 1.62
1.26 0.95 0.56 0.35
0.99 >15 0.76 13 0.51 8 0.27
6.59 5.13 1.96 1.72
1.31 0.95 0.49 0.27
1.11 >15 0.74 >15 0.42 14 0.20
6.65 6.01 2.83 1.03
Units in gg m -3. Only sites that had at least three complete years of data (i.e., > 312 observations) during the period of 1988 through 1995 were included in this table.
ceeded 11 gg m-3 (Figure 3c). In addition, PM2.5 soil concentra- tions were > 2 gg m-3 at sites as far west as Big Bend National Park (Texas) and Rocky Mountain National Park (Colorado) on this date (Figure 3c). The maximum PM2.5 soil concentrations in the continental United States during this episode (19.9 gg m-3) occurred on July 3 at Sipsey Wilderness Area (Alabama) and
Upper Buffalo Wilderness Area (Figure 3d) and were equivalent to the PM2.5 soil concentration measured at Virgin Islands Na- tional Park on June 30. The dust plume's maximum spatial extent occurred on July 7 (Figure 3e) when nearly all of the eastern United States, including the state of Maine (Acadia National Park), had soil concentrations > 3 gg m-3.
PERRY ET AL.' LONG-RANGE TRANSPORT OF NORTH AFRICAN DUST 11,229
a)
• I '\, V1=17.2 c)
2.5 •' .' " .4 ;
d) .
:
V1=13.9 e)
200 -
o3 150-
E (0 100-
0
=tl= 50-
Median
..-:• '•:•t[• M(•an 98% of these samples •.•'• .. ,], ---> were collected •.•i,•,•ii•."'.'•::] ...... in the Eastern U.S.
...... ;:1 ....... l 1; PM2. s Soil (gg m '•)
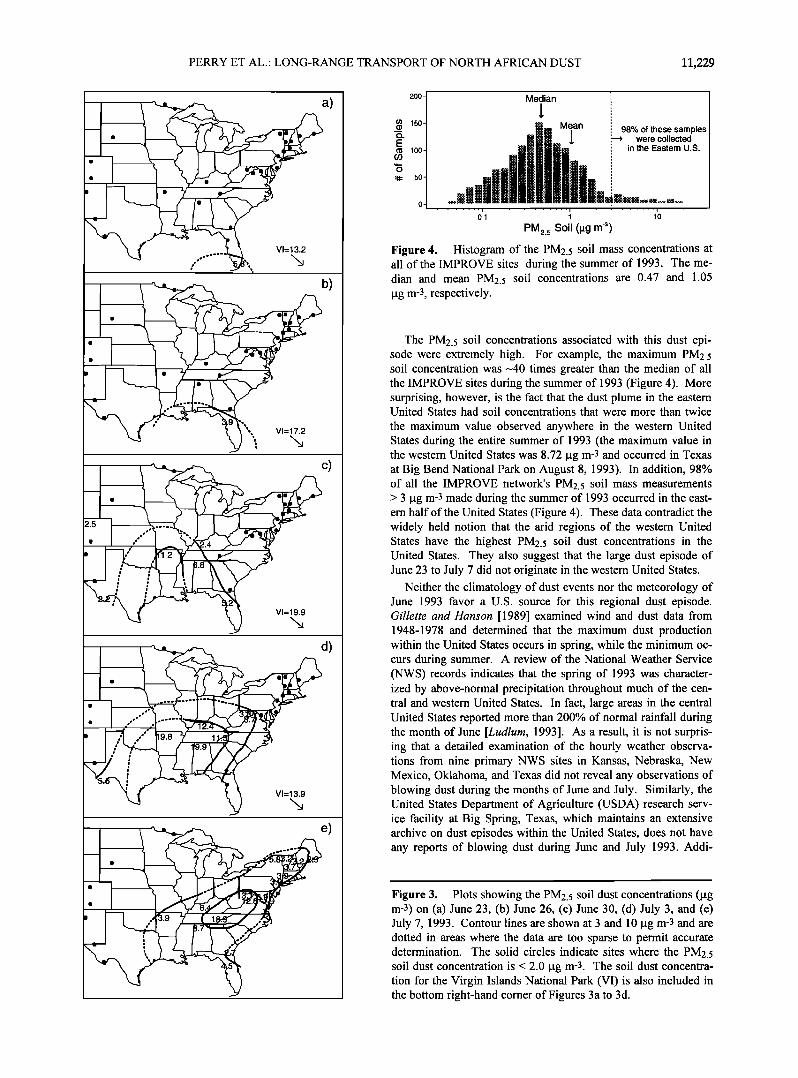
Figure 4. Histogram of the PM2.5 soil mass concentrations at all of the IMPROVE sites during the summer of 1993. The me- dian and mean PM2.5 soil concentrations are 0.47 and 1.05 pg m-3, respectively.
The PM2.5 soil concentrations associated with this dust epi- sode were extremely high. For example, the maximum PM2.5 soil concentration was -40 times greater than the median of all the IMPROVE sites during the summer of 1993 (Figure 4). More surprising, however, is the fact that the dust plume in the eastern United States had soil concentrations that were more than twice
the maximum value observed anywhere in the western United States during the entire summer of 1993 (the maximum value in the western United States was 8.72 lag m-3 and occurred in Texas at Big Bend National Park on August 8, 1993). In addition, 98% of all the IMPROVE network's PM2.5 soil mass measurements > 3 lag m-3 made during the summer of 1993 occurred in the east- ern half of the United States (Figure 4). These data contradict the widely held notion that the arid regions of the western United States have the highest PM2.5 soil dust concentrations in the United States. They also suggest that the large dust episode of June 23 to July 7 did not originate in the western United States.
Neither the climatology of dust events nor the meteorology of June 1993 favor a U.S. source for this regional dust episode. Gillette and Hanson [1989] examined wind and dust data from 1948-1978 and determined that the maximum dust production within the United States occurs in spring, while the minimum oc- curs during summer. A review of the National Weather Service (NWS) records indicates that the spring of 1993 was character- ized by above-normal precipitation throughout much of the cen- tral and western United States. In fact, large areas in the central United States reported more than 200% of normal rainfall during the month of June [Ludlum, 1993]. As a result, it is not surpris- ing that a detailed examination of the hourly weather observa- tions from nine primary NWS sites in Kansas, Nebraska, New Mexico, Oklahoma, and Texas did not reveal any observations of blowing dust during the months of June and July. Similarly, the United States Department of Agriculture (USDA) research serv- ice facility at Big Spring, Texas, which maintains an extensive archive on dust episodes within the United States, does not have any reports of blowing dust during June and July 1993. Addi-
Figure 3. Plots showing the PM2.5 soil dust concentrations (lag m-3) on (a) June 23, (b) June 26, (c) June 30, (d) July 3, and (e) July 7, 1993. Contour lines are shown at 3 and 10 lag m-3 and are dotted in areas where the data are too sparse to permit accurate determination. The solid circles indicate sites where the PM2.5 soil dust concentration is < 2.0 lag m-3. The soil dust concentra- tion for the Virgin Islands National Park (VI) is also included in the bottom right-hand corner of Figures 3a to 3d.

11,230 PERRY ET AL.: LONG-RANGE TRANSPORT OF NORTH AFRICAN DUST
60 a) i i '
40
20
o
- 120 - 1 O0 -80 -60 -40
Longitude (deg) •-. 2 E b)
,'- 1
0
0 2 4 6 8 10
Days From Shenandoah N. P. Figure 5. (a) Plot of 10-day isentropic, backward air mass tra- jectory (solid line with arrows) originming at Shenandoah Na- tional Park at 0000 UT on July 7, 1993. The arrows indicate the direction that the air parcel actually traveled and are separated by 2 days. (b) The altitude of the air parcel on each day of the isen- tropic, backward air mass trajectory. (Trajectory provided by Joyce Harris at National Oceanic and Atmospheric Administra- tion/Climate Modeling Diagnostic Laboratory.)
tional weather observations, maintained at Texas Tech Univer- sity, indicate that several localized dust events observed in the Southern High Plains resulted from outflow winds of convective storms and not synoptic-scale dust outbreaks. Thus it is very un- likely that the regional dust event from June 23 to July 7 origi- nated in the western United States.
A 1 O-day backward, isentropic, air mass trajectory originating at Shenandoah National Park (Virginia) on July 7, 1993, indi- cates that the dust-laden air mass in the Caribbean (Figure 2) was transported through the Gulf of Mexico and then into the south- eastern United States (Figure 5). This type of air mass trajectory is very common during the summer months when a semiperma- nent high pressure zone, known as the "Bermuda" high, estab- lishes itself off the east coast of Florida. Since North African
dust usually takes -1 week to traverse the Atlantic Ocean [Carlson and Prospero, 1972], the soil particles would need to have an atmospheric lifetime of at least two and a half weeks to be transported from North Africa to the United States. Although most of the particles with diameters > 2.5 gm will not survive this journey, it is possible that a significant fraction of the PM2.5 soil particles could remain in the atmosphere for this length of time if they were not removed by precipitation processes.
A comparison of average elemental ratios (Table 2) indicates that the composition of the soil within the dust plume in the east- ern half of the United States was very similar to that measured at Virgin Islands National Park between June 23 and July 7, 1993. For example, the average soil elemental ratios at sites in the east- ern U.S. dust plume (i.e., sites with PM2.5 soil concentrations _> 3 gg m-3) were highly correlated (R2 - 0.98) with those at Virgin Islands National Park (Figure 6a). In addition, the least squares linear regression of the elemental ratios (dotted line in Fig. 6a) had a slope of 0.95. This high correlation indicates that the ele- mental composition of the soil dust during the regional dust epi- sode was nearly identical at these two locations. By contrast,
Table 2. Comparison of PM2.5 Elemental Ratios in the Eastern United States and Virgin Islands National Park
Location Dates Soil Parameters Si/AI Si/Ca Si/Fe AI/Ca AI/Fe Fe/Ca Concentration
Eastern United June 23 to July 7, High* Mean 1.84 12.2 3.84 6.69 2.11 3.19 States* 1993 s.d. 0.15 1.70 0.46 1.27 0.37 0.40
Observations 27 27 27 27 27 27
Eastern United June 23 to July 7, Lows Mean 1.88 4.27 3.25 2.35 1.74 1.44 States* 1993 s.d. 0.41 2.04 1.29 1.17 0.57 0.68
Observations 105 105 105 105 105 105
Virgin Islands June 23 to July 7, Hight Mean 1.62 12.5 4.53 7.71 2.80 2.76 National Park 1993 Observations 4 4 4 4 4 4
Virgin Islands Nov. 1990 through High* Mean 1.74 8.47 3.97 4.97 2.33 2.15 National Park Aug. 1995õ s.d. 0.19 2.05 0.49 1.42 0.49 0.60
Observations 127 127 127 127 127 127
Virgin Islands Nov. 1990 through LowS; Mean 2.16 4.42 3.45 2.14 1.64 1.27 National Park Aug. 1995õ s.d. 0.42 1.88 0.46 1.02 0.34 0.47
Observations 118 118 118 118 118 118
Elemental ratios using Ti were not included in this table because -30% of the data points for low soil concentration conditions were < 3 times the minimum detectable limit.
* Eastern U.S. sites are defined as all sites shown in Figure 3 excluding Virgin Islands National Park * PM25 soil concentration > 3 p.g m-• •; PM25 soil concentration < 3 p.g m "•. õ The PM• 5 aerosol composition data set from Virgin Islands National Park began in November 1990 and ended in August 1995.

PERRY ET AL.' LONG-RANGE TRANSPORT OF NORTH AFRICAN DUST 11,231
u) 15 c- o
lO
T 0
O Si/AI ß AI/Ca • ß Si/Ca V AI/Fe /•,,,'" + Si/Fe ß Fe/Ca ,•,, ,-' R2= 0.98 .•,,'"'
Slope = 0.95 ,,,,•,,,,,,."
a)
0 5 10 15
Virgin Islands N. P.
u) 15 c- o
ß 03
. c'- lO
(/)-- 5
o
o
o Si/AI ß AI/Ca •' ß Si/Ca V AI/Fe •
+ Si/Fe ß Fe/Ca / R2= 0.71 • Slope =
0 5 10 15
Virgin Islands N. P. Figure 6. (a) Plot of the average elemental ratios at Virgin Islands National Park (Table 2) versus the average elemental ratios measured at sites in the eastern half of the United States with high soil concentrations (Table 2) during the regional dust episode from June 23 to July 7, 1993. The solid line is the 1:1 line, while the dotted line is the least squares linear regression. The correlation coefficient (R2) and slope of the linear regression (dashed line) are also included on the left side of the figure. (b) Same as Figure 6a except that the elemental ratios from the low soil concentration sites in the eastern half of the United States (Table 2) are plotted on the vertical ordinate.
some of the average elemental ratios at sites in the eastern United States with low soil concentrations (i.e., PM2.5 soil concentra- tions < 3 gg m-3) were very different than those measured at Vir- gin Islands National Park (Figure 6b and Table 2). The largest differences were observed in the Si/Ca and A1/Ca ratios. The
comparatively low Si/Ca and A1/Ca ratios of the sites in the east- ern United States that were not influenced by the dust plume re- sulted in a least squares linear regression slope of only 0.22. The
fine (i.e., PM2.5) soil mass concentrations are available at Shenandoah National Park from March 1993 to March 1994.
Figure 7 shows that the ratio of fine to coarse soil is significantly elevated during this dust episode. The dearth of coarse soil is consistent with long-range transport during which the largest soil particles are preferentially removed by gravitational settling or precipitation processes.
The spatial and temporal patterns (Figure 3), the air mass tra- differences in soil composition are used in section 4.1 to differ- jectory (Figure 5), the elemental ratios (Table 2 and Figure 6), entiate between U.S. soils and those that are transported from a distant source.
Although no detailed aerosol mass distribution measurements were made during this dust episode, measurements of both the coarse (i.e., particles with diameters > 2.5 gm and < 10 pm) and
15 July 7
ß
ß ß
ß
., ß
.ß ß
ß ß
ß ß
. ß
ß
July 3 ,,," ß
Ju!y 14 ,,'-'• August 25 & 28•,..------"'""'•
0 5 10 15 20
Coarse Soil (pg m '3) Figure 7. Plot of fine soil mass (PM2.5) versus coarse soil mass at Shenandoah National Park (Figure 1) from March 1993 to March 1994. The concentration of coarse soil was determined from the difference between the 24-hour averaged PM2.5 and PM10 soil concentrations. Data collected during two regional dust episodes are denoted by solid squares. Linear regressions are included for both normal conditions (solid line) and regional dust events (dotted line).
and the relatively small size of the soil particles (Figure 7) are all consistent with transport from the Caribbean. When these factors are combined with the known transport of North African dust to the Caribbean (Figure 2) and the lack of evidence of dust events within the United States, it becomes clear that this dust episode originated from North Africa. The large-scale impact of North African dust on the aerosol burden of the eastern United States is
strongly supported by advanced very high resolution radiometer (AVHRR) satellite measurements. The AVHRR measurements often show a plume of enhanced aerosol optical thickness ex- tending from the west coast of Africa, across the Atlantic and into the Gulf of Mexico and along the southeastern coast of the United States during the summer months [Husar et al., 1997].
4. Characterization of North African Dust
Transport to the United States
The large dust episode highlighted by the previous case study was not an isolated event. Dust episodes of various size and du- ration are quite common in the eastern half of the United States during the summer months. For example, five of the top six sites with the highest mean PM2.5 soil concentrations during summer are located in the eastern half of the United States (Table 1). This spatial distribution contrasts sharply to the spring when 14 of the top 15 sites with the highest mean PM2.5 soil concentrations are located in the southwestern United States. The high soil concen- trations in this region, during spring, are consistent with known spatial and seasonal patterns of dust generation within the United States [Gillette and Hanson, 1989].
Although the summertime dust episodes in the eastern United States have a large impact on the mean soil concentrations, their impact on the radiative balance of the region will primarily be

11,232 PERRY ET AL.' LONG-RANGE TRANSPORT OF NORTH AFRICAN DUST
10- Average Soil a) Average AI/Ca Ratio
• ;• '• • • • • •)1'01'1 1'2 Month of the Year
lO 60-
0 50' 8 •
_.• 40-
6
• o3 30
24 10
o o
Background I
b)
North African Dust I I
0.1 10
PM2.5 Soil (gg rn -3)
o
c)
PM2.5 Soil (lag rn'3) Figure 8. (a) Monthly averaged PM2.5 soil concentration (gg m-3) (open circles) and A1/Ca ratio (solid squares) at Virgin Islands National Park from October 1990 through August 1995. (b) Histogram of the PM2.5 soil concen- tration (gg m-3) at Virgin Islands National Park for the same time period as Figure 8a. (c) Plot of the A1/Ca ratio versus the PM2.5 soil concentration (gg m-3) at Virgin Islands National Park for the same time period as (a). The two solid lines are drawn at a PM2.5 soil concentration of 3 gg m-3 and an A1/Ca ratio of 3.8. Data points above and to the right of these two lines are considered to be of North African origin.
determined by the frequency of the dust episodes, their spatial extent, the mass concentration of soil particles in the dust plume, and the mass distribution of those particles. The next four sec- tions summarize the available data to provide estimates of these important quantities.
4.1. Frequency of North African Dust Transport to the United States
To determine how frequently individual sites are impacted by North African dust, it is necessary to devise a criterion that dis- tinguishes between North African dust episodes and those of U.S. origin. Since the dust episodes at Virgin Islands National Park are known to be of North African origin, data from this site (1990 through 1995) are used to develop a two-part criterion that will be applied to sites in the continental United States to identify the presence of North African dust. Since the North African dust episodes are characterized by extremely high PM2.5 soil concentrations, the first part of our criterion is based on soil mass. The second part of the criterion is based on the A1/Ca ratio which is significantly elevated for transported North African dust (Table 2).
The first criteria used to identify the presence of North African dust is a PM2.5 soil concentration > 3 gg m-3. A histogram of PM2.5 soil concentrations at Virgin Islands National Park shows a bimodal distribution with one peak at •- 0.075 gg m-3 and the other at -• 5 gg m-3 (Figure 8b). This type of distribution occurs because soil concentrations are generally very low at this site ex- cept when North African dust is transported to the Caribbean (Figure 8a). A threshold value of 3 gg m-3 was chosen because it is the 25th percentile of the portion of the distribution dominated by North African dust. Thus this criteria alone could exclude up to -•25% of the North African dust events that occur at this site.
The second criteria used to identify the presence of North Af- rican dust is an A1/Ca ratio > 3.8. The A1/Ca ratio was chosen
because it exhibited the largest difference between high and low dust conditions at Virgin Islands National Park from 1990 through 1995. For example, during this period the A1/Ca ratio was -•2.3 times higher, on average, when soil concentrations exceeded 3 gg m-3 (Table 2). In addition, the monthly averaged soil concentrations and A1/Ca ratios are highly correlated (R2 =
0.96) and peak during the summer months when vast quantities of North African dust are transported to the Caribbean (Figure 8a) [Prospero and Nees, 1977, 1986; Prospero et al., 1987]. Both of these factors indicate that a high A1/Ca ratio is an effective tracer of North African dust. A threshold value of 3.8
was chosen because it is the 25th percentile of all the A1/Ca ratios at Virgin Islands National Park when PM2.5 soil concentrations exceed 3 pg m-3. Since nearly all of the soil measurements > 3 pg m-3 at Virgin Islands National Park are due to transported North African dust, the A1/Ca ratio criterion could exclude up to 25% of the North African dust events at this site.
The two-part, North African dust criterion is designed to pro- vide a conservative estimate of how often North African dust im-
pacts individual sites. Figure 8c provides a graphical display of the two-part criterion using data from Virgin Islands National Park. Only those data points above and to the right of the two lines are considered to be of North African origin. This criterion was applied to the 28 IMPROVE sites shown in Figure 3 to de- termine what percent of the observations each month were af- fected by North African dust. The results of this analysis are shown in Table 3. This table clearly demonstrates that the two- part criterion is very effective at distinguishing between dust epi- sodes of U.S. and North African origin. For example, although dust episodes originating in the United States are common during the spring, none of the sites listed in Table 3 had a PM2.5 soil concentration > 3 gg m-3 and an A1/Ca ratio > 3.8 during the spring.
North African dust transport to the United States is primarily a summertime phenomenon with a maximum frequency during the month of July (Table 3). The frequency of North African dust events is greatest in the southeastern United States and generally decreases to the north. Table 3 also shows that significant con- centrations of North African dust are present in the eastern half of the United States at least 15-20% of the time during the month of July. More surprising, however, is the evidence showing that North African dust is regularly transported as far west as Texas (Table 3). For example, Figure 9 shows two distinct peaks in the monthly averaged soil concentration at Big Bend and Guadalupe Mountains National Parks (Texas): one in April/May and the other in July. However, the A1/Ca ratio has only one peak that occurs during July. The fact that the summertime dust episodes

PERRY ET AL.' LONG-RANGE TRANSPORT OF NORTH AFRICAN DUST 11,233
Table 3. Percent of All the Observations Each Month that Meet the North African Dust Criterion
Site Name State Observations Feb. March April May June July Aug. Sept. Oct.
Brigantine* New Jersey 430 6 6 Washington, D.C. 679 7 Dolly Sods* West Virginia 422 14 Shenandoah•; Virginia 761 8 Mammoth Cave½ Kentucky 404 4 23 Upper Buffalo* Arkansas 396 7 37 Gmat Smoky Mountain½ Tennessee 754 2 16 Sipsey* Alabama 310 8 16 Guadalupe Mountain½ Texas 753 9 Okefenokee* Georgia 408 9 27 Big BendS; Texas 783 1 19 Chassahowitzka* Florida 272 27 19
Everglade½ Florida 581 5 19 57 Virgin Island½ 427 9 6 8 19 64 76
3
9
8
8
14
35
4
4
27
Meeting the criterion means having a PM 25 soil concentration _> 3 pg m '• and an AI/Ca ratio > 3.8. The sites are arranged from north to south. Blanks indicate that 0% of the observations met the North African dust criterion. November, December, and January are not shown because no observations at any of the listed sites matched the North African dust criterion. Sites were only included in this table if they had at least three complete years of data for the summer months during the period of 1988 through 1995.
* National Wildlife Refuge• * Wilderness Area.
•; National Park.
at these national parks are calcium deficient is particularly im- portant because the Guadalupe Mountains massif is composed of limestone, and the minerals precipitated on the surface playa near the park are primarily calcium salts [Boyd and Kreitler, 1986]. Thus the high A1/Ca ratio associated with these dust episodes could not have been generated locally. In addition, the summer- time dust episodes at Big Bend and Guadalupe Mountains Na- tional Parks usually coincide with North African dust events in the eastern half of the United States (e.g., Figure 3d).
It should be noted that most of the sites in the northeastern
United States were excluded from Table 3 because they did not have three complete years of data for the summer months. The exclusion of these data should not be interpreted to mean that this region is devoid of North African dust. For example, Figure 3 illustrates North African dust being transported all the way to the state of Maine. Similarly, the lack of IMPROVE sites in the central United States does not indicate that North African dust is
infrequent in this region. In fact, the high frequency of North Af-
rican dust at Upper Buffalo Wilderness Area (Arkansas) indicates that the central United States could be significantly affected by North African dust during much of the summer. This contention is strengthened by Gatz and Prospero [ 1996] who presented data showing a large silicon-aluminum aerosol plume in the midwest- ern United States (Illinois) during July of 1979. Although they could not conclusively demonstrate that the soil dust originated from North Africa, the soil concentration was > 3 gg m-3, and the A1/Ca ratio was - 4. Thus the soil dust incursion documented by Gatz and Prospero [ 1996] meets the two-part North African dust criterion developed in this section.
4.2. Typical Spatial Extent of North African Dust Episodes in the United States
The potential impact of the North African dust on the radiative balance in the eastern United States will depend, to a large de- gree, on the spatial extent of the dust episodes. Table 4 lists the
o Average Soil a) = Average AI/Ca Ratio
Month of the Year
0 0
o Average Soil b) = Average AI/Ca Ratio
Month of the Year
3
Figure 9. (a) Monthly averaged PM2.5 soil concentration (gg m-3) (open circles) and A1/Ca ratio (solid squares) at Big Bend National Park (Texas) from March 1988 through November 1995. (b)As for Figure 9a except for Gua- dalupe Mountains National Park (Texas).

11,234 PERRY ET AL.: LONG-RANGE TRANSPORT OF NORTH AFRICAN DUST
Table 4. List of the North African Dust Episodes that Occurred in the United States
from 1992 through 1995
Date of Date of Estimated PM2 5 Soil Concentration North African Dust Maximum Maximum Spatial Maximum Mean
Episodes Spatial Extent Extent, km 2 gg m '• gg m '•
June 24 to July 15, 1992 July 8 2.4 x 10 6 32.3 12.2 July 15 to July 18, 1992 July 18 Florida only 8.3 NA July 29, 1992 July 29 Florida only 6.7 NA Aug. 8, 1992 Aug. 8 Florida only 5.2 NA
June 12, 1993 June 12 Florida only 3.6 NA June 23 to July 7, 1993 July 7 2.0 x 10 6 19.9 7.9 July 10 to July 17, 1993 July 10 1.6 x 10⁶ 25.5 7.4 July 21 to July 31, 1993 July 28 1.4 X 10 6 14.1 7.5 Aug. 4 to Aug. 11, 1993 Aug. 4 1.3 X 10 6 21.1 12.1 Aug. 14 to Aug. 25, 1993 Aug. 21 1.2 x 10⁶ 9.3 6.0
June 8 to June 18, 1994 June 15 0.5 x 10 6 8.6 4.6 June 25 to June 29, 1994 June 29 1.5 x 10 6 29.6 11.9 July 2 to July 6, 1994 July 6 1.1 X 10 6 12.6 8.8 July 9 to July 20, 1994 July 16 1.2 x 10⁶ 25.4 9.9 July 30, 1994 July 30 Florida only 4.5 NA Aug. 17, 1994 Aug. 17 Florida only 7.1 NA Sept. 7, 1994 Sept. 7 Florida only 3.6 NA Sept. 17, 1994 Sept. 17 Florida only 7.6 NA
June 24 to July 5, 1995 July 5 1.3 x 10⁶ 29.0 9.4 July 8, 1995 July 8 Florida only 5.7 NA July 22 to July 26, 1995 July 26 0.4 x 10 • 9.0 7.3 Sept. 27, 1995 Sept. 27 Florida only 5.6 NA
This list was compiled from all the sites shown in Figure 1 and is based upon the two-part North African dust criterion developed in section 4.1. NA, not applicable.
dates, estimated maximum spatial extent, and maximum PM2.5 soil concentrations of all the dust episodes that occurred in the United States (1992 through 1995) that met the two-part North African dust criterion. Unfortunately, the spatial coverage of the fine aerosol monitoring network was not sufficient to permit this type of analysis prior to 1992. The maximum spatial extent of the dust episodes was estimated by determining how much land area in the continental United States had a PM2.5 soil concentra- tion >_ 3 gg m-3 and an A1/Ca ratio > 3.8.
Almost half of the dust episodes (10 out of 22) were observed only within the state of Florida. These episodes were short-lived (i.e., < 3 days) and had maximum PM2.5 soil concentrations < 10 gg m-3. By contrast, the larger regional dust episodes generally persisted for more than a week and had an average maximum soil concentration of 19.7 gg m-3 (c• = 8.36). These dust episodes persisted for -10 days and covered -15% of the continental United States (i.e., 1.3 x 10⁶ km2) on average. However, the largest dust event in 1992 extended over -30% of the United States.
It is important to note that the seasonal modulation, frequency, and spatial extent of North African dust episodes in the United States are all critically dependent upon meteorology. For exam- ple, the seasonal pattern of dust transport to the Caribbean is controlled, to a large extent, by the location of the Inter-Tropical Convergence Zone (ITCZ). As the ITCZ migrates northward during the northern hemispheric summer, it forces the airflow
patterns in the tropical North Atlantic Ocean to become more easterly (Figure 10), increasing the frequency of North African dust transport to the Caribbean from May to September (Figure 2) [Prospero et al., 1981]. During the northern hemispheric winter, the ITCZ migrates southward and the airflow in the tropi- cal North Atlantic becomes northeasterly resulting in the trans- port of North African dust to South America [Prospero et al., 1981]. This alternate transport pathway explains why North Af- rican dust transport to the Caribbean is relatively infrequent from October to April.
The transport of North African dust from the Caribbean to the interior of the continental United States could depend, to a large extent, on the strength and location of the semipermanent "Bermuda" high-pressure zone (Figure 10). If the "Bermuda" high is located far off the eastern coast of Florida, the clockwise circulation around the high-pressure zone could transport the North African dust to the east of the U.S. coast. In this scenario,
North African dust would not be transported to the interior of the continental United States but might be observed at coastal sites along the Atlantic seaboard or at offshore islands such as Ber- muda and the Bahamas. The large percent of the continental U.S. North African dust episodes that are observed only in Florida (Table 4) could indicate that this scenario is quite common. This contention is supported by the significantly elevated aluminum concentrations that are frequently measured at the Atmos- phere/Ocean Chemistry Experiment site located on the island of

PERRY ET AL.' LONG-RANGE TRANSPORT OF NORTH AFRICAN DUST 11,235
6O
20 .m
.... : .... !i!ii?' H ............
Pacific
-2O
-120 -1 O0 -80 -60 -40 -20 0 20
Longitude (deg)
Figure 10. Conceptual model showing how North African dust can be transported into the continental United States as it circulates clockwise around the semipermanent "Bermuda" high-pressure zone (H). A westward shifted "Bermuda" high will increase the likelihood of transport into the central United States. (This figure is a direct ex- tension of Rapp [ 1976].)
Bermuda [Arimoto et al., 1992, 1995]. If the "Bermuda" high is shifted to the west, the circulation around the high pressure zone could transport the North African dust into the southeastern United States (e.g., Figure 3). The transport of North African dust into the central United States and Texas would be facilitated
by a westward shifted "Bermuda" high (Figure 10).
4.3. Typical PM2.5 Soil Mass Concentrations
Although the maximum PM2.5 soil concentrations are corre- lated with the maximum spatial extent of the dust events (R2 = 0.77), the highest soil concentrations are not necessarily repre- sentative of the dust episode as a whole. To overcome this po- tential problem, the mean PM2.5 soil concentration was calculated
during each of the regional dust events by averaging the soil con- centrations measured at all of the sites that met the two-part, North African dust criterion (Table 4). The results of these cal- culations are also included in Table 4. The mean PM2.5 soil con- centration for the regional dust episodes was 8.75 gg in-3 (c• = 2.34).
4.4. Soil Mass Distribution of the July 22-26, 1995,
North African Dust Episode
In this section, size-resolved measurements from the DRUM impactor are used to provide a detailed description of the soil mass distribution at Great Smoky Mountains National Park dur- ing the July 22-26, 1995, North African dust episode. The 12-
10
a) North African Dust I I
7/15 7/17 7/19 7/21 7/23 7/25 7/27 7/29
(Month/Day)
8 b)
++
-I- +
i i i i i
0 2 4 6 8 10
PM2.5 Soil (!.tg rn '3) Figure 11. (a) Time series showing the 12-hour averaged PM2.5 soil mass concentration (gg m-3) at Great Smoky Mountains National Park during the last 2 weeks of July 1995. These data were collected with a standard IMPROVE sampler that was operated daily from 1100 to 2300 and 2300 to 1100 UT. (b) Plot of the A1/Ca ratio versus PM2.5 soil concentrations (gg m-3) for the 12-hour averaged data shown in Figure 1 la. The two solid lines are drawn at a PM2.5 soil concentration of 3 gg m-3 and an A1/Ca ratio of 3.8. The four data points above and to the right of these lines occurred on July 25 and 26 and met the two-part North African dust criterion.
11,236 PERRY ET AL.' LONG-RANGE TRANSPORT OF NORTH AFRICAN DUST
25-
20-
No Data
..... (•',1 ........ i ....... i'O ....... 1'•)0 Diameter (gm)
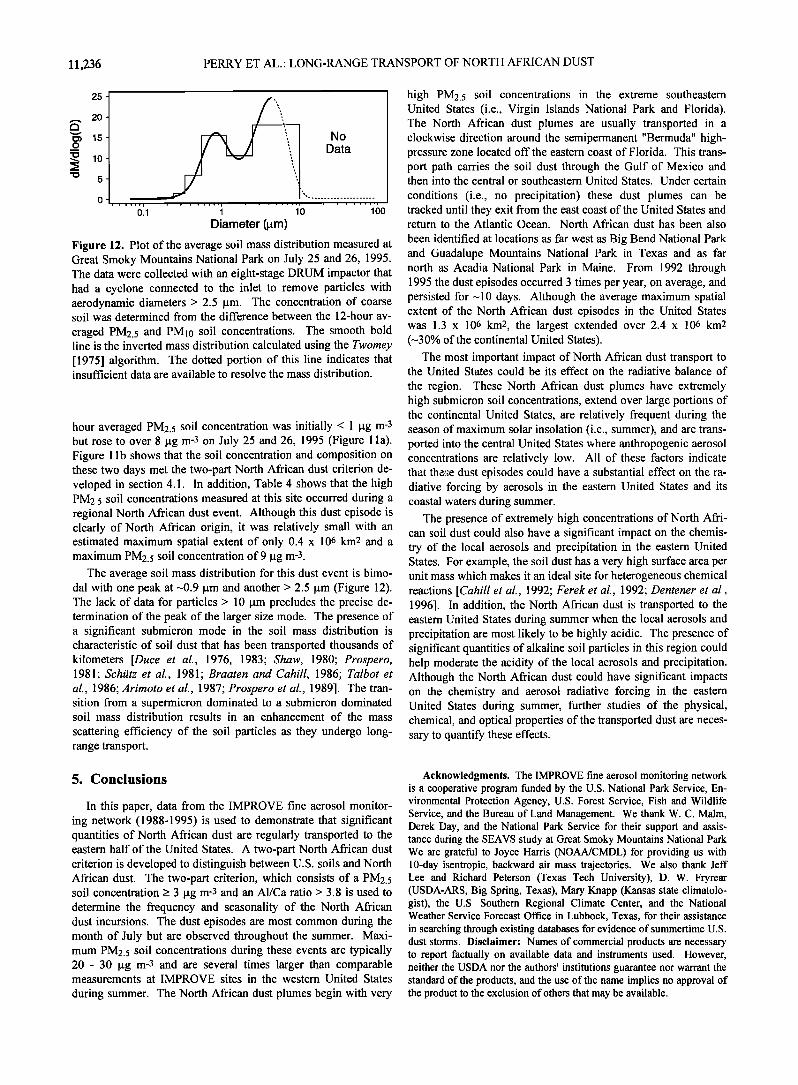
Figure 12. Plot of the average soil mass distribution measured at Great Smoky Mountains National Park on July 25 and 26, 1995. The data were collected with an eight-stage DRUM impactor that had a cyclone connected to the inlet to remove particles with aerodynamic diameters > 2.5 gm. The concentration of coarse soil was determined from the difference between the 12-hour av-
eraged PM2.5 and PM10 soil concentrations. The smooth bold line is the inverted mass distribution calculated using the Twomey [1975] algorithm. The dotted portion of this line indicates that insufficient data are available to resolve the mass distribution.
hour averaged PM2.5 soil concentration was initially < 1 gg m-3 but rose to over 8 pg m-3 on July 25 and 26, 1995 (Figure 1 la). Figure 1 lb shows that the soil concentration and composition on these two days met the two-part North African dust criterion de- veloped in section 4.1. In addition, Table 4 shows that the high PM2.5 soil concentrations measured at this site occurred during a regional North African dust event. Although this dust episode is clearly of North African origin, it was relatively small with an estimated maximum spatial extent of only 0.4 x 10⁶ km2 and a maximum PM2.5 soil concentration of 9 I. tg m-3.
The average soil mass distribution for this dust event is bimo- dal with one peak at-0.9 gm and another > 2.5 gm (Figure 12). The lack of data for particles > 10 gm precludes the precise de- termination of the peak of the larger size mode. The presence of a significant submicron mode in the soil mass distribution is characteristic of soil dust that has been transported thousands of kilometers [Duce et al., 1976, 1983; Shaw, 1980; Prospero, 1981; Schiitz et al., 1981; Braaten and Cahill, 1986; Talbot et al., 1986; Arimoto et al., 1987; Prospero et al., 1989]. The tran- sition from a supermicron dominated to a submicron dominated soil mass distribution results in an enhancement of the mass
scattering efficiency of the soil particles as they undergo long- range transport.
high PM2.5 soil concentrations in the extreme southeastern United States (i.e., Virgin Islands National Park and Florida). The North African dust plumes are usually transported in a clockwise direction around the semipermanent "Bermuda" high- pressure zone located off the eastern coast of Florida. This trans- port path carries the soil dust through the Gulf of Mexico and then into the central or southeastern United States. Under certain
conditions (i.e., no precipitation) these dust plumes can be tracked until they exit from the east coast of the United States and return to the Atlantic Ocean. North African dust has been also
been identified at locations as far west as Big Bend National Park and Guadalupe Mountains National Park in Texas and as far north as Acadia National Park in Maine. From 1992 through 1995 the dust episodes occurred 3 times per year, on average, and persisted for-10 days. Although the average maximum spatial extent of the North African dust episodes in the United States was 1.3 x 10 6 km2, the largest extended over 2.4 x 10 6 km2 (-30% of the continental United States).
The most important impact of North African dust transport to the United States could be its effect on the radiative balance of
the region. These North African dust plumes have extremely high submicron soil concentrations, extend over large portions of the continental United States, are relatively frequent during the season of maximum solar insolation (i.e., summer), and are trans- ported into the central United States where anthropogenic aerosol concentrations are relatively low. All of these factors indicate that the:se dust episodes could have a substantial effect on the ra- diative forcing by aerosols in the eastern United States and its coastal waters during summer.
The presence of extremely high concentrations of North Afri- can soil dust could also have a significant impact on the chemis- try of the local aerosols and precipitation in the eastern United States. For example, the soil dust has a very high surface area per unit mass which makes it an ideal site for heterogeneous chemical reactions [Cahill et al., 1992; Ferek et al., 1992; Dentenet et al., 1996]. In addition, the North African dust is transported to the eastern United States during summer when the local aerosols and precipitation are most likely to be highly acidic. The presence of significant quantities of alkaline soil particles in this region could help moderate the acidity of the local aerosols and precipitation. Although the North African dust could have significant impacts on the chemistry and aerosol radiative forcing in the eastern United States during summer, further studies of the physical, chemical, and optical properties of the transported dust are neces- sary to quantify these effects.
5. Conclusions
In this paper, data from the IMPROVE fine aerosol monitor- ing network (1988-1995) is used to demonstrate that significant quantities of North African dust are regularly transported to the eastern half of the United States. A two-part North African dust criterion is developed to distinguish between U.S. soils and North African dust. The two-part criterion, which consists of a PM2.5 soil concentration > 3 gg m-3 and an A1/Ca ratio > 3.8 is used to determine the frequency and seasonality of the North African dust incursions. The dust episodes are most common during the month of July but are observed throughout the summer. Maxi- mum PM2.5 soil concentrations during these events are typically 20 - 30 gg m-3 and are several times larger than comparable measurements at IMPROVE sites in the western United States
during summer. The North African dust plumes begin with very
Acknowledgments. The IMPROVE fine aerosol monitoring network is a cooperative program funded by the U.S. National Park Service, En- vironmental Protection Agency, U.S. Forest Service, Fish and Wildlife Service, and the Bureau of Land Management. We thank W. C. Maim, Derek Day, and the National Park Service for their support and assis- tance during the SEAVS study at Great Smoky Mountains National Park We are grateful to Joyce Harris (NOAA/CMDL) for providing us with 10-day isentropic, backward air mass trajectories. We also thank Jeff Lee and Richard Peterson (Texas Tech University), D. W. Fryrear (USDA-ARS, Big Spring, Texas), Mary Knapp (Kansas state climatolo- gist), the U.S. Southern Regional Climate Center, and the National Weather Service Forecast Office in Lubbock, Texas, for their assistance in searching through existing databases for evidence of summertime U.S. dust storms. Disclaimer: Names of commercial products are necessary to report factually on available data and instruments used. However, neither the USDA nor the authors' institutions guarantee nor warrant the standard of the products, and the use of the name implies no approval of the product to the exclusion of others that may be available.
PERRY ET AL.: LONG-RANGE TRANSPORT OF NORTH AFRICAN DUST 11,237
References
Alpeft, P., and E. Ganor, A jet stream associated heavy dust storm in the western Mediterranean, J. Geophys. Res., 98, 7339-7349, 1993.
Arimoto, R., R. A. Duce, B. J. Ray, A.D. Hewitt, and J. Williams, Trace elements in the atmosphere of American Samoa: Concentrations and deposition to the tropical South Pacific, J. Geophys. Res., 92, 8465- 8479, 1987.
Arimoto, R., R. A. Duce, D. L. Savoie, and J. M. Prospero, Trace ele- ments in aerosol particles from Bermuda and Barbados: Concentra- tions, sources, and relationships to aerosol sulfate, •. Atmos. Chem., 14, 439-457, 1992.
Arimoto, R., R. A. Duce, B. J. Ray, W. G. Ellis Jr., J. D. Cullen, and J. T. Merrill, Trace elements in the atmosphere over the North Atlantic, •1. Geophys. Res., 100, 1199-1214, 1995.
Boyd, F. M., and C. W. Kreitler, Hydrogeology of a gypsum playa, Northern Salt Basin, Texas, Rep. 158, Tex. Bur. of Econ. Geol., 37 pp., Univ. of Tex., Austin, 1986.
Braaten, D. A., and T. A. Cahill, Size and composition of Asian dust transported to Hawaii, Atmos. Environ., 20, 1105-1109, 1986.
Cahill, T. A., L. L. Ashbaugh, R. A. Eldred, Po J. Feeney, B. H. Kusko, and R. G. Flocchini, Comparisons between size-segregated resus- pended soil samples and ambient aerosols in the western United States, in Atmospheric Aerosol: Source/Air Quality Relationships, Am. Chem. Soc. Symp. Set., vol. 167, edited by E. Macias, pp. 269- 285, Am. -Chem. Soc., Washington, D.C., 1981.
Cahill, T. A., R. A. Eldred, D. Shadoan, P. J. Feeney, B. H. Kusko, and Y. Matsuda, Complete elemental analysis of aerosols: PIXE, FAST, LIPM, and Mass, Nuclear Instrum. Methods Phys. Res., Sect. B, 3, 291-295, 1984.
Cahill, T. A., C. Goodart, J. W. Nelson, R. A. Eldred, J. S. Nasstrom, and P. J. Feeney, Design and evaluation of the DRUM impactor, in Pro- ceedings of the International Symposium on Particulate and Multi- phase Processes, vol. 2, Contamination Analysis and Control, edited by T. Ariman and T. Nejat Veziroglu, pp. 319-325, Hemisphere, Washington, D.C., 1985.
Cahill, T. A., K. Wilkinson, and R. Schnell, Composition analyses of size-resolved aerosol samples taken from aircraft downwind of Ku- wait, spring 1991, J Geophys. Res., 97, 14513-14520, 1992.
Carder, K. L., R. G. Steward, and P. R. Betzer, Dynamics and composi- tion of particles from an aeolian input event to the Sargasso Sea, J. Geophys. Res., 91, 1055-1066, 1986.
Carlson, T. N., Atmospheric turbidity in Saharan dust outbreaks as de- termined by analyses of satellite brightness data, Mon. Weather Rev., 107, 322-335, 1979.
Carlson, T. N., and R. S. Cavefly, Radiative characteristics of Saharan dust at solar wavelengths, J. Geophys. Res., 82, 3141-3152, 1977.
Carlson, T. N., and J. M. Prospero, The large-scale movement of Saharan air outbreaks over the northern equatorial Atlantic, •. Appl. Meteorol., 11,283-297, 1972.
Chester, R., H. Elderfield, and J. J. Griffin, Dust transported in the north- east and south-east trade winds in the Atlantic Ocean, Nature, 233, 474-476, 1971.
Chester, R., E. J. Sharples, G. S. Sanders, and A. C. Saydam, Saharan dust incursion over the Tyrrhenian Sea, Atmos. Environ., 18, 929- 935, 1984.
Coakley, J. A., and R. D. Cess, Response of the NCAR Community Cli- mate Model to the radiative forcing by the naturally occurring tro- pospheric aerosol, •. Atmos. Sci., 42, 1677-1692, 1985.
Dentenet, F. J., G. R. Carmichael, Y. Zhang, J. Lelieveld, and P. J. Crutzen, The role of mineral aerosol as a reactive surface in the global troposphere, o[. Geophys. Res., 101, 22869-22890, 1996.
Duce, R. A., et al., Trace metals in the marine atmosphere: Sources and fluxes, in Marine Pollutant Transfer, edited by H. L. Windom and R. A. Duce, pp. 77-119, Lexington Books, Lexington, Mass., 1976.
Duce, R. A., R. Arimoto, B. J. Ray, C. K. Unni, and P. L. Harder, At- mospheric trace elements at Enewetak Atoll, I, Concentrations, sources, and temporal variability, •. Geophys. Res., 88, 5321-5342, 1983.
Duce, R. A., et al., The atmospheric input of trace species to the world ocean, Global Biogeochem. Cycles, 5, 193-259, 1991.
Eldred, R. A., T. A. Cahill, K. Wilkinson, P. J. Feeney, J. C. Chow, and W. C. Maim, Measurement of fine particles and their chemical com- ponents in the IMPROVE/NPS networks, in Visibility and Fine Par- ticles, vol. 17, A&WMA Transactions Ser., edited by C. V. Mathai, pp. 187-196, A&WMA, Pittsburgh, Pa., 1990.
Ferek, R. J., P. V. Hobbs, J. A. Herring, K. K. Laursen, R. E. Weiss, and R. A. Rasmussen, Chemical composition of emissions from the Ku- wait oil fires, d. Geophys. Res., 97, 14483-14490, 1992.
Flocchini, R. G., T. A. Cahill, M. L. Pitchford, R. A. Eldred, P. J. Feeney, and L. L. Ashbaugh, Characterization of particles in the arid West, Atmos. Environ., 15, 2017-2030, 1981.
Fraser, R. S., Satellite measurement of mass of Saharan dust in the at- mosphere, Appl. Opt., 15, 2471-2479, 1976.
Ganor, E., The composition of clay minerals transported to Israel as indi- cators of Saharan dust emission, Atmos• Environ.• 25A• 2657-2664, 1991•
Gatz, D. F., and J. M. Prospero, A large silicon-aluminum aerosol plume in central Illinois: North African desert dust?, •4tmos. Environ., 30, 3789-3799, 1996.
Gelado-Caballero, M.D., M. E. Torres-Padron, J. J. Hernandez-Brito, J. A. Herrera-Melian, and J. Perez-Pena, Aluminum distributions in central East Atlantic waters (Canary Islands), Mar. Chem., 51, 359- 372, 1995.
Gillette, D. A., and K. J. Hanson, Spatial and temporal variability of dust production caused by wind erosion in the United States, J. Geophys. Res., 94, 2197-2206, 1989.
Glaccum, R. A., and J. M. Prospero, Saharan aerosols over the tropical North Atlantic: Mineralogy, Mar. Geol., 37, 295-321, 1980.
Graham, W. F., and R. A. Duce, Atmospheric pathways of the phospho- rus cycle, Geochem. Cosmochim. Acta, 43, 1195-1208, 1982.
Herwitz, S. R., D. R. Muhs, J. M. Prospero, S. Mahan, and B. Vaughn, Origin of Bermuda's clay-rich Quaternary paleosols and their paleo- climatic significance, o[ Geophys. Res., 101, 23389-23400, 1996.
Husar, R. B., J. M. Prospero, and L. L. Stowe, Characterization of tro- pospheric aerosols over the oceans with the NOAA AVHRR optical thickness operational product, J Geophys. Res., in press, 1997.
Jankowiak, I., and D. Tanre, Satellite climatology of Saharan dust out- breaks: Method and preliminary results, •. Clim., 5, 646-656, 1992.
Karyampudi, V. M., and T. N. Carlson, Analysis and numerical simula- tions of the Saharan air layer and its effect on easterly wave distur- bances, J. Atmos. Sci., 45, 3102-3136, 1988.
Kremling, K., and P. Streu, Saharan dust influenced trace element fluxes in deep North Atlantic subtropical waters, Deep Sea Res. I, 40, 1155- 1168, 1993.
Li, X., H. Mating, D. Savoie, K. Voss, and J. M. Prospero, Dominance of mineral dust in aerosol light scattering in the North Atlantic trade winds, Nature, 380, 416-419, 1996.
Lo•e-Pilot, M.D., J. M. Martin, and J. Morelli, Influence of Saharan dust on the rain acidity and atmospheric input to the Mediterranean, Nature, 321,427-428, 1986.
Ludlum, D., Weatherwatch, Weatherwise, vol. 46, no. 4, 61-63, 1993. Maim, W. C., J. F. Sislet, D. Huffman, R. A. Eldred, and T. A. Cahill,
Spatial and seasonal trends in particle concentration and optical ex- tinction in the United States, o[ Geophys. Res., 99, 1347-1370, 1994.
Maim, W. C., J. V. Molenat, R. A. Eldred, and J. F. Sislet, Examining the relationship among atmospheric aerosols and light scattering and extinction in the Grand Canyon area, o[ Geophys. Res., 101, 19251- 19265, 1996.
McDowell, W. H., C. G. Sfinchez, C. E. Asbury, and C. R. R. P6rez, In- fluence of sea salt aerosols and long range transport on precipitation chemistry at El Verde, Puerto Rico, Atmos. Environ., 24A, 2813- 2821, 1990.
Morales, C., The airborne transport of Saharan dust: A review, Clim. Change, 9, 219-241, 1986.
Muhs, D. R., I. A. Bush, and K. C. Stewart, Geochemical evidence of Saharan dust parent materials for soils developed on Quaternary lime-
stones of Caribbean and western Atlantic islands, Quat. Res., 33, 157- 177, 1990.

11,238 PERRY ET AL.: LONG-RANGE TRANSPORT OF NORTH AFRICAN DUST
Parkin, D. W., D. R. Phillips, R. A. L. Sullivan, and L. R. Johnson, Air- borne dust collections down the Atlantic, Q. J. R. Meteorol. Soc., 98, 798-808, 1972.
Pitty, A. F., Particle size of the Saharan dust which fell in Britain in July 1968, Nature, 220, 364, 1968.
Prodi, F., and G. Fea, A case of transport and deposition of Saharan dust over the Italian peninsula and southern Europe, J. Geophys. Res., 84, 6951-6960, 1979.
Prospero, J. M., Eolian transport to the world ocean, in The Sea, vol. 7, The Oceanic Lithosphere, edited by C. Emiliani, pp. 801-874, Wiley Interscience, New York, 1981o
Prospero, J. M., and T. N. Carlson, Vertical and areal distribution of Sa- haran dust over the western equatorial North Atlantic Ocean, J. Geophys. Res., 77, 5255-5265q 1972.
Prospero, J. M., and R. T. Nees, Dust concentration in the atmosphere of the equatorial North Atlantic: Possible relationship to the Sahelian drought, Science, 196, 1196-1198, 1977.
Prospero, J. M., and R. T. Nees, Impact of the North African drought and El Nifio on mineral dust in the Barbados trade winds, Nature, 320, 735-738, 1986.
Prospero, J. M., R. A. Glaccum, and R. T. Nees, Atmospheric transport of soil dust from Africa to South America, Nature, 289, 570-572, 1981.
Prospero, J. M., R. T. Nees, and M. Uematsu, Deposition rate of par- ticulate and dissolved aluminum derived from Saharan dust in pre- cipitation at Miami, Florida, J. Geophys. Res., 92, 14723-14731, 1987.
Prospero, J. M., M. Uematsu, and D. L. Savoie, Mineral aerosol transport to the Pacific Ocean, in Chemical Oceanography, vol. 10, edited by J.P. Riley, R. Chester, and R. A. Duce, pp. 188-218, Academic, San Diego, Calif., 1989.
Raabe, O. G., D. A. Braaten, R. L. Axelbaum, S. V. Teague, and T. A. Cahill, Calibration studies of the DRUM impactor, J. Aerosol Sci., 19, 183-195, 1988.
Rapp, A., Can desert encroachment be stopped?: A study with emphasis on Africa, edited by A. Rapp, H. N. Le Houerou and B. Lundholm, p. 17, Ecol. Bull., 24, Stockholm, 1976.
Reichholf, J. H., Is Saharan dust a major source of nutrients for the Ama- zonian rainforest?, Stud. Neotrop. Fauna Environ., 21, 251-255, 1986.
Reiff, J., F. T. M. Spieksma, and J. J. Reynders, African dust reaching northwestern Europe: A case study to verify trajectory calculations, J. Clim. Appl. Meteorol., 25, 1543-1567, 1986.
Rod/t, F., J. Bellot, A. Avila, A. Escarr6, J. Pifiol, and J. Terradas, Saha- ran dust and the atmospheric inputs of elements and alkalinity to Mediterranean ecosystems, Water Air Soil Pollut., 66, 277-288, 1993.
Savoie, D. L., and J. M. Prospero, Aerosol concentration statistics for the northern tropical Atlantic, J. Geophys. Res., 82, 5954-5964, 1977.
Savoie, D. L., and J. M. Prospero, Water-soluble potassimn, calcium, and
magnesium in the aerosols over the tropical North Atlantic, J. Geophys. Res., 85, 385-392, 1980.
Schtitz, L., R. Jaenicke, and H. Pietrek, Saharan dust transport over the North Atlantic Ocean, Spec. Pap., Geol. Soc. Am., 186, 87-100, 1981.
Seinfeld, J. H., Atmospheric Chemistry and Physics of Air Pollution, p. 296, John Wiley, New York, 1986.
Sequeira, R., A note on the consumption of acid through cation exchange with clay minerals in atmospheric precipitation, Atmos. Environ., 25A, 487-490, 1991.
Shaw, G. E., Transport of Asian desert aerosol to the Hawaiian Islands, J. Appl. Meteorol., 19, 1254-1259, 1980.
Sokolik, I. N., and O. B. Toon, Direct radiative forcing by anthropogenic airborne mineral aerosols, Nature, 381, 681-683, 1996.
Swap, R., M. Garstang, S. Greco, R. Talbot, and P. Kfillberg, Saharan dust in the Amazon Basin, Tellus, 44B, 133-149, 1992.
Swap, R., S. Ulanski, M. Cobbett, and M. Garstang, Temporal and spa- tial characteristics of Saharan dust outbreaks, J. Geophys. Res., 101, 4205-4220, 1996.
Talbot, R. W., R. C. Harris, E. V. Browell, G. L. Gregory, D. I. Sebacher, and S. M. Beck, Distribution and geochemistry of aerosols in the tropical North Atlantic troposphere: Relationship to Saharan dust, J. Geophys. Res., 91, 5173-5182, 1986.
Talbot, R. W., M. O. Andreae, H. Berresheim, P. Artaxo, M. Garstang, R. C. Harriss, K. M. Beechef, and S. M. Li, Aerosol chemistry during the wet season in central Amazonia: The influence of long-range transport, J. Geophys. Res., 95, 16955-16969, 1990.
Tegen, I., and I. Fung, Contribution to the atmospheric mineral aerosol load from land surface modification, J. Geophys. Res., 100, 18707- 18726, 1995.
Tegen, I., A. A. Lacis, and I. Fung, The influence on climate forcing of mineral aerosols from disturbed soils, Nature, 380, 419-422, 1996.
Twomey, S., Comparison of constrained linear inversion and an interac- tive non-linear algorithm applied to the indirect estimation of particle size distributions, J. Cornput. Phys., 18, 188-200, 1975.
Westphal, D. L., O. B. Toon, and T. N. Carlson, A two-dimensional nu- merical investigation of the dynamics and microphysics of Saharan dust storms, J. Geophys. Res., 92, 3027-3049, 1987.
T. A. Cahill, D. D Dutcher, R. A. Eldred, and K. D. Perry, Air Qual- ity Group, Crocker Nuclear Laboratory, University of California, Davis, CA 95616.(e-mail: tacahill•ucdavis.edu; dutcher•crocker.ucdavis.edu; eldred•crocker.ucdavis.edu; perry•crocker.ucdavis.edu)
T. E. Gill, Wind Erosion and Water Conservation Research Unit, USDA Agricultural Research Service, Route 3, Box 215, Lubbock, TX 79401. (e-mail: tgill•mail.csrl.ars.usda.gov)
(Received September 18, 1996; revised December 30, 1996; accepted December 31, 1996.)