Lone Star National Bancshares - Texas Inc. - Federal Reserve ...
101
AMENDED
-
Upload
khangminh22 -
Category
Documents
-
view
5 -
download
0
Transcript of Lone Star National Bancshares - Texas Inc. - Federal Reserve ...

AMENDED

Report Item
Lone Star National Bancshares-Texas, Inc.
McAllen, TexasIncorporated in Texas
100.00% 100.00%
Lone Star National BankPharr, Texas
Incorporated in Texas
Lone Star National Capital Trust IV
Wilmington, DelewareBusiness trust for
$10million trust preferred offering completed 6-21-07Incorporated in Delaware
100.00%
Lone Star Insurance Services, Inc.
McAllen, TexasIncorporated in Texas
100.00%
Lone Star Investment Sub-Nevada, Inc.Las Vegas, NV
Incorporated in Nevada
Form FR Y-6
Lone Star National Bancshares-Texas, Inc.
2b: Domestic branch verification listing enclosed.
Note: No entity in the organization has an LEI, including Lone Star National Bancshares-Texas, Inc.
McAllen, TexasFiscal Year Ending December 31, 2016
1: (a) The Bank Holding Company prepares an annual report for its shareholders and is not registered with the SEC. Enclosed is the unbound copy of the annual report, which includes all its major components. (b) Audited financial statements at year ended December 31, 2016 are included in the unbound copy of the annual report.
2a: Organizational Chart
AMENDED

Results: A list of branches for your holding company: LONE STAR NATIONAL BANCSHARES‐‐TEXAS, INC. (2325350) of MCALLEN, TX.The data are as of 12/31/2016. Data reflects information that was received and processed through 01/10/2017.
Reconciliation and Verification Steps1. In the Data Action column of each branch row, enter one or more of the actions specified below2. If required, enter the date in the Effective Date column
ActionsOK: If the branch information is correct, enter 'OK' in the Data Action column.Change: If the branch information is incorrect or incomplete, revise the data, enter 'Change' in the Data Action column and the date when this information first became valid in the Effective Date column.Close: If a branch listed was sold or closed, enter 'Close' in the Data Action column and the sale or closure date in the Effective Date column.Delete: If a branch listed was never owned by this depository institution, enter 'Delete' in the Data Action column.Add: If a reportable branch is missing, insert a row, add the branch data, and enter 'Add' in the Data Action column and the opening or acquisition date in the Effective Date column.
If printing this list, you may need to adjust your page setup in MS Excel. Try using landscape orientation, page scaling, and/or legal sized paper
Submission ProcedureWhen you are finished, send a saved copy to your FRB contact. See the detailed instructions on this site for more information.If you are e‐mailing this to your FRB contact, put your institution name, city and state in the subject line of the e‐mail
Note:To satisfy the FR Y‐10 reporting requirements, you must also submit FR Y‐10 Domestic Branch Schedules for each branch with a Data Action of Change, Close, Delete, or Add.The FR Y‐10 report may be submitted in a hardcopy format or via the FR Y‐10 Online application ‐ https://y10online.federalreserve.gov.
* FDIC UNINUM, Office Number, and ID_RSSD columns are for reference only. Verification of these values is not required.
Data Action Effective Date Branch Service Type Branch ID_RSSD* Popular Name Street Address City State Zip Code County Country FDIC UNINUM* Office Number* Head Office Head Office ID_RSSD* CommentsOK Full Service (Head Office) 842460 LONE STAR NATIONAL BANK 206 WEST FERGUSON PHARR TX 78577 HIDALGO UNITED STATES 16940 0 LONE STAR NATIONAL BANK 842460OK Full Service 3450325 BROWNSVILLE BOCA CHICA TOWER BRANCH 2100 BOCA CHICA BLVD BROWNSVILLE TX 78521 CAMERON UNITED STATES 442243 13 LONE STAR NATIONAL BANK 842460OK Full Service 3506053 BROWNSVILLE BRANCH 3300 NORTH EXPRESSWAY 83 BROWNSVILLE TX 78521 CAMERON UNITED STATES 360740 5 LONE STAR NATIONAL BANK 842460OK Full Service 3506204 EDINBURG BRANCH 117 SOUTH 10TH EDINBURG TX 78539 HIDALGO UNITED STATES 420393 6 LONE STAR NATIONAL BANK 842460OK Full Service 3506231 HARLINGEN BRANCH 1901 NORTH ED CAREY DRIVE HARLINGEN TX 78550 CAMERON UNITED STATES 420394 7 LONE STAR NATIONAL BANK 842460OK Limited Service 3506437 HARLINGEN MOTOR BANK BRANCH 918 WEST HARRISON AVE HARLINGEN TX 78550 CAMERON UNITED STATES Not Required Not Required LONE STAR NATIONAL BANK 842460OK Full Service 3252622 HIDALGO BRANCH 633 SOUTH INTERNATIONAL BLVD HIDALGO TX 78557‐2933 HIDALGO UNITED STATES 430051 11 LONE STAR NATIONAL BANK 842460OK Full Service 4054832 CORPORATE OFFICE BRANCH 520 EAST NOLANA AVENUE MCALLEN TX 78504 HIDALGO UNITED STATES 521882 25 LONE STAR NATIONAL BANK 842460OK Full Service 3922699 DHR MEDICAL BRANCH 5537 NORTH MCCOLL ROAD MCALLEN TX 78504 HIDALGO UNITED STATES 493425 21 LONE STAR NATIONAL BANK 842460OK Full Service 4351595 LA PLACITA BRANCH 2109 SOUTH 10TH STREET MCALLEN TX 78503 HIDALGO UNITED STATES 527033 30 LONE STAR NATIONAL BANK 842460OK Limited Service 4054823 MAIN STREET BRANCH 800 NORTH MAIN STREET, SUITE 600 MCALLEN TX 78501 HIDALGO UNITED STATES 495439 22 LONE STAR NATIONAL BANK 842460OK Full Service 3506240 MED‐POINT BRANCH 1300 EAST RIDGE ROAD MCALLEN TX 78503 HIDALGO UNITED STATES 430013 9 LONE STAR NATIONAL BANK 842460OK Full Service 3794690 NOLANA BRANCH 600 EAST NOLANA AVENUE MCALLEN TX 78504 HIDALGO UNITED STATES 479931 20 LONE STAR NATIONAL BANK 842460OK Full Service 2449911 NORTH MCALLEN BRANCH 5515 NORTH 10TH STREET MCALLEN TX 78504 HIDALGO UNITED STATES 257288 2 LONE STAR NATIONAL BANK 842460OK Full Service 2246718 SOUTH MCALLEN BRANCH 200 LINDBERG AVENUE MCALLEN TX 78501 HIDALGO UNITED STATES 257287 1 LONE STAR NATIONAL BANK 842460OK Full Service 2994774 MISSION BRANCH 2003 EAST GRIFFIN PARKWAY MISSION TX 78572 HIDALGO UNITED STATES 257289 3 LONE STAR NATIONAL BANK 842460OK Full Service 3365607 MISSION MEDICAL BRANCH 1100 SOUTH BRYAN ROAD MISSION TX 78572 HIDALGO UNITED STATES 442477 14 LONE STAR NATIONAL BANK 842460OK Full Service 3295311 PALMVIEW BRANCH 720 EAST VETERANS BOULEVARD PALMVIEW TX 78572‐7068 HIDALGO UNITED STATES 429616 8 LONE STAR NATIONAL BANK 842460OK Limited Service 3506398 PHARR MOTOR BANK 1201 SOUTH CAGE BLVD PHARR TX 78577 HIDALGO UNITED STATES Not Required Not Required LONE STAR NATIONAL BANK 842460OK Full Service 4195230 PHARR SOUTH CAGE BRANCH 118 SOUTH CAGE BOULEVARD PHARR TX 78577 HIDALGO UNITED STATES 521884 27 LONE STAR NATIONAL BANK 842460OK Limited Service 3450343 PORT ISABEL MOTOR BANK 202 EAST QUEEN ISABELLA BLVD PORT ISABEL TX 78578 CAMERON UNITED STATES Not Required Not Required LONE STAR NATIONAL BANK 842460OK Full Service 2994783 RIO GRANDE CITY BRANCH 2300 EAST HIGHWAY 83 RIO GRANDE CITY TX 78582 STARR UNITED STATES 357470 4 LONE STAR NATIONAL BANK 842460OK Full Service 4236188 RIO GRANDE CITY WEST BRANCH 201 NORTH TEXAS STREET RIO GRANDE CITY TX 78582 STARR UNITED STATES 519110 24 LONE STAR NATIONAL BANK 842460OK Full Service 3336689 ROMA BRANCH 305 EAST GRANT ROMA TX 78584 STARR UNITED STATES 438914 12 LONE STAR NATIONAL BANK 842460OK Full Service 4503741 HUEBNER BANKING CENTER 15236 HUEBNER ROAD SAN ANTONIO TX 78231 BEXAR UNITED STATES 538556 32 LONE STAR NATIONAL BANK 842460OK Full Service 4195221 SAN ANTONIO MEDICAL BRANCH 7954 FREDERICKSBURG ROAD SAN ANTONIO TX 78229 BEXAR UNITED STATES 521883 26 LONE STAR NATIONAL BANK 842460OK Full Service 4326593 SAN ANTONIO SAN PEDRO BRANCH 10000 SAN PEDRO AVENUE SAN ANTONIO TX 78216 BEXAR UNITED STATES 521885 28 LONE STAR NATIONAL BANK 842460OK Full Service 4540045 STONE OAK BANKING CENTER 381 NORTH LOOP 1604 W SAN ANTONIO TX 78232 BEXAR UNITED STATES Not Required Not Required LONE STAR NATIONAL BANK 842460OK Full Service 4366870 ZARZAMORA BRANCH 6986 SOUTH ZARZAMOR STREET SAN ANTONIO TX 78224 BEXAR UNITED STATES 532255 31 LONE STAR NATIONAL BANK 842460OK Full Service 3450334 SOUTH PADRE ISLAND BRANCH 601 PADRE BLVD SOUTH PADRE ISLAND TX 78597 CAMERON UNITED STATES 452213 16 LONE STAR NATIONAL BANK 842460OK Full Service 3302527 WESLACO BRANCH 214 SOUTH TEXAS BLVD WESLACO TX 78596 HIDALGO UNITED STATES 430050 10 LONE STAR NATIONAL BANK 842460OK Full Service 4351607 WESLACO NORTH BRANCH 620 WEST EXPRESSWAY 83 WESLACO TX 78596 HIDALGO UNITED STATES 526986 29 LONE STAR NATIONAL BANK 842460
gonzalezs
Typewritten Text
Branch Verification

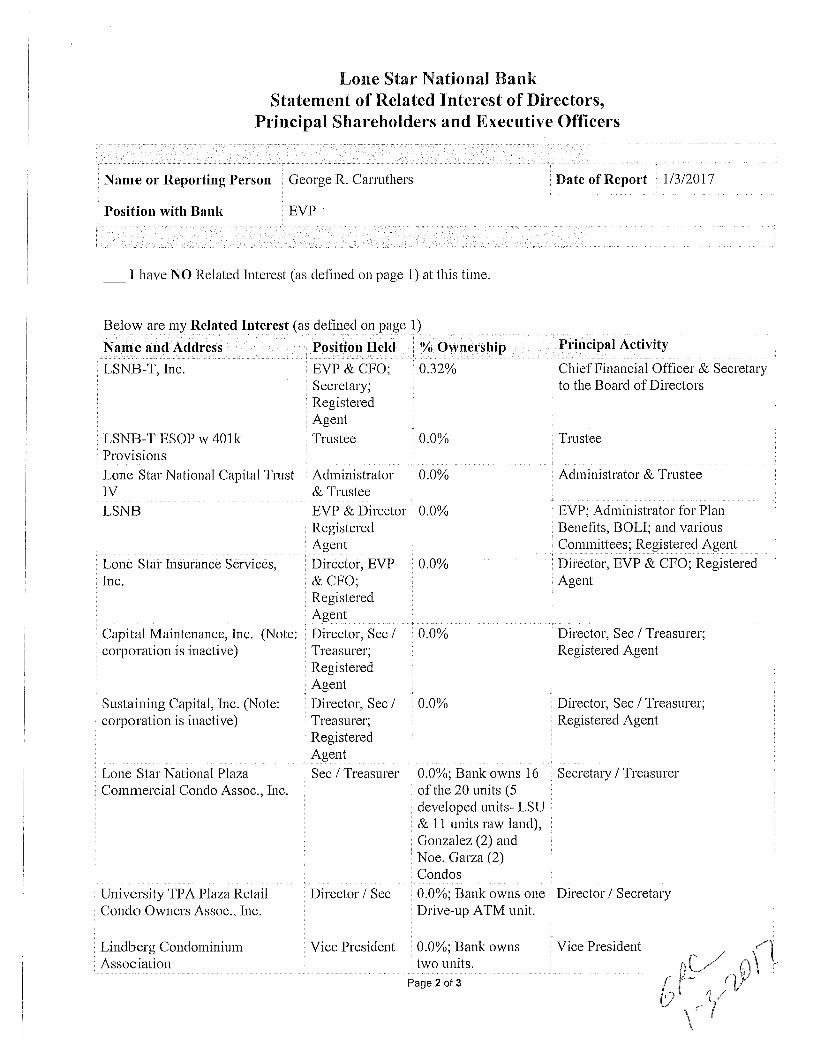
Report Item 3: Shareholders(1)(a)(b)(c) and (2)(a)(b)(c)
(1) (a) (1) (b) (1)(c) (2) (a) (2) (b) (2) (c)Name & Address Country of Citizenship Number and Percentage Name & Address Country of Citizenship Number and Percentage(City, State & Country) or Incorporation of Each Class of (City, State & Country) or Incorporation of Each Class of
Voting Securities Voting SecuritiesAlonzo Cantu USA 1,069,248 - 17.49%McAllen, TX, USA Common Stock None
Victor Haddad USA 636,659 - 10.41%McAllen, TX, USA Common Stock
Cruz Cantu III USA 575,200 - 9.41%Pharr, TX, USA Common Stock
Elvia Saenz USA 592,132 - 9.69%McAllen, TX, USA Common Stock
S. David Deanda USA 531,382 - 8.69%Mission, TX, USA Common Stock
91,311 - 1.49%options on commonstock
Juan M. Pena USA 378,330 - 6.19%Pharr, TX, USA Common Stock
to vote during the fiscal year ending December 31, 2013.
Form FR Y-6Lone Star National Bancshares-Texas, Inc.
Fiscal Year Ending December 31, 2016
Current shareholders with ownership, control of holdings of 5% or more Shareholders not listed in (3)(1)(a) through (3)(1)(c) that with the power to vote as of fiscal year ending December 31, 2014. had ownership, control of holdings of 5% or more with power
AMENDED

(1) (2) (3)(a) (3)(b) (3)(c) (4)(a) (4)(b) (4)(c) Names & Address Principal Title & Position Title & Position Title & Position with Percentage of Voting Percentage of List names of(City, State,Country) Occupation if other with Bank Holding with Subsidiaries Other Businesses Shares in Bank Holding Voting Shares in other companies
than with Bank Company (include names (include names of Company Subsidiaries (includes partnerships)Holding Company of subsidiaries) other businesses) (include names if 25% or more of
of subsidiaries) voting securities areheld (List names of companies and percentage of votingsecurities held)
Alonzo Cantu Construction Director & Director & Chairman See Exhibit #1 17.49% None See Exhibit #1Pharr, TX / USA and Land Chairman of of the Board of
Development the Board each BHC subsidiary
Victor Haddad Physician Principal Securities N/A See Exhibit #2 10.41% None See Exhibit #2McAllen, TX / USA Holder
Cruz Cantu, III Investments, Director Director of each See Exhibit #3 9.41% None See Exhibit #3Pharr, TX / USA construction and BHC subsidiary
land development
Oscar R. Gonzalez Certified Director & Director of each See Exhibit #4 3.71% None See Exhibit #4Pharr, TX / USA Public Vice Chairman of BHC subsidiary
Accountant the Board
Abdala Kalifa Retail Apparel Director Director of each See Exhibit #5 2.44% None See Exhibit #5Pharr, TX / USA and Commercial BHC subsidiary
Development
S. David Deanda Banker Director & Director & President See Exhibit #6 10.18% None See Exhibit #6Pharr, TX / USA President for each BHC subsidiary
except Lone Star InsuranceServices, Inc.
Joe D. Zayas Dentist Director Director of each See Exhibit #7 0.53% None See Exhibit #7Brownsville, TX / USA BHC subsidiary
Form FR Y-6Lone Star National Bancshares-Texas, Inc.
Fiscal Year Ending December 31, 2016
Report Item 4: Insiders(1), (2), (3)(a)(b)(c) and (4)(a)(b)(c)
AMENDED

(1) (2) (3)(a) (3)(b) (3)(c) (4)(a) (4)(b) (4)(c) Names & Address Principal Title & Position Title & Position Title & Position with Percentage of Voting Percentage of List names of(City, State,Country) Occupation if other with Bank Holding with Subsidiaries Other Businesses Shares in Bank Holding Voting Shares in other companies
than with Bank Company (include names (include names of Company Subsidiaries (includes partnerships)Holding Company of subsidiaries) other businesses) (include names if 25% or more of
of subsidiaries) voting securities areheld (List names of companies and percentage of votingsecurities held)
Form FR Y-6Lone Star National Bancshares-Texas, Inc.
Fiscal Year Ending December 31, 2016
Report Item 4: Insiders(1), (2), (3)(a)(b)(c) and (4)(a)(b)(c)
Nolan E. Perez Physician Director Director of each See Exhibit #8 0.23% None See Exhibit #8Harlingen, TX / USA BHC subsidiary
George R. Carruthers, Jr. Banker EVP & Chief Secretary, Treasurer, See Exhibit #9 0.30% None See Exhibit #9Pharr, TX / USA Financial Officer EVP & CFO for Lone
Star Insurance Services, Inc.
Manny M. Vela Attorney Director Director of each See Exhibit #10 0.16% None See Exhibit #10Pharr, TX / USA BHC subsidiary
Ruben M. Torres Physician Director Director of each See Exhibit #11 0.11% None See Exhibit #11Harlingen, TX / USA BHC subsidiary
AMENDED

gonzalezs
Typewritten Text
EXHIBIT #1

gonzalezs
Typewritten Text
EXHIBIT #1

gonzalezs
Typewritten Text
EXHIBIT #1

gonzalezs
Typewritten Text
EXHIBIT #1

gonzalezs
Typewritten Text
EXHIBIT #1

gonzalezs
Typewritten Text
EXHIBIT #1

gonzalezs
Typewritten Text
EXHIBIT #1

gonzalezs
Typewritten Text
EXHIBIT #1

gonzalezs
Typewritten Text
EXHIBIT #1

gonzalezs
Typewritten Text
EXHIBIT #1

gonzalezs
Typewritten Text
EXHIBIT #1

gonzalezs
Typewritten Text
EXHIBIT #2

gonzalezs
Typewritten Text
EXHIBIT #2

gonzalezs
Typewritten Text
EXHIBIT #2

gonzalezs
Typewritten Text
EXHIBIT #3

gonzalezs
Typewritten Text
EXHIBIT #4

gonzalezs
Typewritten Text
EXHIBIT #4

gonzalezs
Typewritten Text
EXHIBIT #5

gonzalezs
Typewritten Text
EXHIBIT #6

gonzalezs
Typewritten Text
EXHIBIT #7

gonzalezs
Typewritten Text
EXHIBIT #7

gonzalezs
Typewritten Text
EXHIBIT #8

gonzalezs
Typewritten Text
EXHIBIT #8
gonzalezs
Typewritten Text
EXHIBIT #9

gonzalezs
Typewritten Text
EXHIBIT #9

gonzalezs
Typewritten Text
EXHIBIT #10

gonzalezs
Typewritten Text
EXHIBIT #10

gonzalezs
Typewritten Text
EXHIBIT #11

gonzalezs
Typewritten Text
EXHIBIT #11

1
MANAGEMENT’S DISCUSSION AND ANALYSIS OF FINANCIAL
CONDITION AND RESULTS OF OPERATIONS
The following discussion addresses information pertaining to the financial condition and results of operation of Lone Star National Bancshares-Texas, Inc. and subsidiaries (the “Company”) that may not be otherwise apparent from a review of the audited consolidated financial statements and related footnotes. It should be read in conjunction with those statements, as well as other information presented throughout the report. In addition to historical information, this discussion and other sections contained in this Annual Report include certain forward-looking statements regarding events and trends which may affect the Company’s future results. Such statements are subject to risk and uncertainties that could cause the Company’s actual results to differ materially. Such factors include, but are not limited to, those described in this discussion and analysis. The Company is a privately held bank holding company headquartered in McAllen, Texas, offering a broad array of financial services through its wholly-owned banking subsidiary, Lone Star National Bank (the “Bank”). The Bank operates from thirty-two banking locations: twenty-seven (27) banking locations in the Rio Grande Valley and five (5) banking locations in San Antonio, Texas. The Bank engages in a wide range of commercial and personal banking activities including the usual acceptance of deposits for checking, savings and time deposit accounts; extension of secured and unsecured loans to corporations, individuals and others; issuance of letters of credit; rental of safe deposit boxes; brokerage services and insurance services. The Bank’s lending services include commercial, industrial, real estate, installment and credit card loans and participation in loans with other banks. The members of the Bank’s management team have significant experience and contacts from their service at the Bank and their prior service with other successful community banks that have operated in the same market. The Bank seeks to provide its products and services through a high quality, experienced staff and local decision making. Year 2016 has proven to be a successful year for the Company reporting earnings of $13.814 million reflecting a net increase of $2.188 million over the prior year. At December 31, 2016, the Company had total assets of $2.184 billion, loans of $1.194 billion, deposits of $1.821 billion and shareholders’ equity of $251.962 million. The Company’s primary goal is to provide a higher quality service for its customers in the South Texas market by providing personal service, relationship banking and innovative technological solutions. In order to broaden the customer base, primarily through expanding the Company’s network of full-service banking offices, the Board of Directors is continuing its efforts to expand our banking organization in the Rio Grande Valley and San Antonio markets by selecting sites for future branches.
gonzalezs
Typewritten Text
Annual Report

2
The Company’s profitability is dependent on managing interest rate spreads, other operating income and expenses, and credit risk. Net interest income is the largest component of revenue for the Company. The Company manages interest rate risks through a funds management strategy which involves offering deposit and / or loan structures that tend to counter the natural rate risk profile of the Company. The Company addresses loan and deposit pricing, the asset and liability mix and interest rate sensitivity on a periodic basis. Yields on earning assets and rates paid on interest-bearing deposits within the Company declined during 2016. Through management’s efforts, the net interest margin of 3.38% for 2016 reflects a 5 basis points decline when compared to the net interest margin of 3.43% for 2015. The Company manages its credit risk by establishing underwriting guidelines, which address the characteristics of borrowers, industries, geographic locations and risk products. The credit process is controlled by continuous review and credit analysis. The Company evaluates its management of operating expenses through the efficiency ratio, which is approximately 79.6% for 2016. The efficiency ratio equates to the cost of recording one dollar’s worth of revenue. Analysis of Financial Condition Overview: Total assets of $2.184 billion at December 31, 2016 decreased by 0.9% or $19.0 million compared to $2.203 billion at December 31, 2015. Total deposits of $1.821 billion at December 31, 2016 decreased by 1.3% or $23.5 million compared to $1.845 billion at December 31, 2015. A more detailed description of changes to the balance sheet follows.
Due from Banks-interest bearing: Due from banks-interest bearing accounts of
$104.8 million at December 31, 2016 decreased $101.1 million or 49.1% compared to $205.8 million at December 31, 2015. These funds represent excess funds deposited with correspondent banks in interest bearing accounts, primarily the Federal Reserve Bank. These funds were reinvested in higher yielding earning assets.
Investment Securities: Total investment securities of $692.2 million at December 31, 2016 increased $700,000 or 0.1% compared to $691.5 million at December 31, 2015. Included in investment securities are municipal tax exempt bonds (“Tax Exempt Munis”). Tax Exempt Munis of $167.5 million at December 31, 2016 increased $17.2 million or 11.4% compared to $150.3 million at December 31, 2015. The strategy for investment securities during 2016 was to remain conservative on reinvesting of cash flows to avoid taking on additional interest rate / extension risk and to increase yield. Included in the Tax Exempt Munis are bonds primarily from school districts within the State of Texas that are guaranteed by the Texas Permanent School Fund and as such, well secured. The investment securities portfolio yield of 2.55% for 2016 increase 0.06% compared to 2.49% for 2015.
Loans: Loans held for sale and held for investment of $1.194 billion at December
31, 2016 increased $51.6 million or 4.5% compared to $1.142 billion at December 31, 2015. At December 31, 2016, the loan portfolio consisted primarily of $2.5 million of
gonzalezs
Typewritten Text
Annual Report

3
real estate loans held for sale, $112.4 million of commercial loans, $1.4 million of agriculture loans, $996.0 million of real estate loans and $81.8 million of consumer and other loans. These loans were primarily originated within our market area of the Rio Grande Valley and San Antonio, Texas and are generally secured by residential real estate, commercial real estate, business property or personal property. Despite the unprecedented contraction in the credit markets, we continued to lend to credit-worthy customers.
The Company manages credit risk by establishing and implementing strategies
and guidelines appropriate to the characteristics of borrowers, industries, geographic locations and products. Diversification of risk within each of these areas is a primary objective. Policies and procedures are developed to ensure that loan commitments conform to current strategies and guidelines. Management continues to refine the Company’s credit policies and procedures to address risks in the current and prospective environment and to reflect management’s current strategic focus. The credit process is controlled with continuous credit review and analysis, as well as reviewed by internal and external auditors and regulatory authorities. The Company’s loans are widely diversified by borrower and industry group.
The Company has lending policies in effect so that lending of all types is approached, to the extent possible, including low-to-moderate income neighborhoods and small business, on a basis consistent with safe and sound standards. Stress testing is utilized to take into consideration the potentially adverse economic conditions under which liquidation of the loan could occur. Generally, collateral accepted to secure the commercial loan portfolio is real estate, accounts receivable, inventory, marketable securities and equipment. However, for the consumer loan portfolio, autos, deeds of trust, life insurance and marketable securities are accepted as collateral.
The Company’s policy on maturity extensions and rollovers is based on
management’s assessment of individual loans. Approvals for the extension or renewal of loans without reduction of principal for more than one twelve-month period are generally avoided, unless the loans are fully secured and properly margined by cash or marketable securities, or are revolving lines subject to annual analysis and renewal.
Nonperforming Assets: The Company has procedures in place to assist in
maintaining the overall quality of its loan portfolio. Furthermore, the Company has established underwriting guidelines to be followed by its officers and monitors its delinquency levels for any negative or adverse trends, particularly with respect to credits which have total exposures of $10,000 or more.
Nonperforming assets consists of nonaccrual loans, loans for which the interest
rate has been renegotiated below originally contracted rates and real estate or other assets that have been acquired in partial or full satisfaction of loan obligations. At December 31, 2016, nonperforming assets totaled $76.1 million or 6.4% of loans plus repossessed assets. Nonperforming assets reflects a decrease of $6.2 million or 7.5% when compared to $82.3 million at December 31, 2015. Management has seasoned personnel to assist in
gonzalezs
Typewritten Text
Annual Report
4
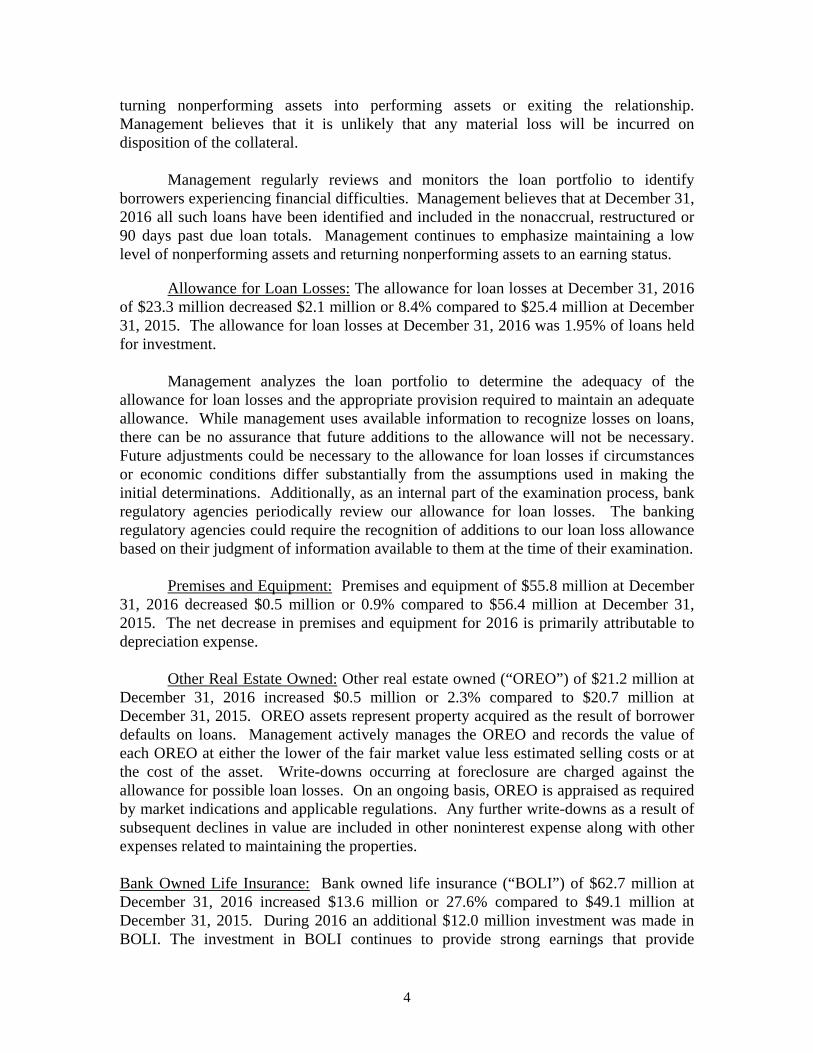
turning nonperforming assets into performing assets or exiting the relationship. Management believes that it is unlikely that any material loss will be incurred on disposition of the collateral.
Management regularly reviews and monitors the loan portfolio to identify borrowers experiencing financial difficulties. Management believes that at December 31, 2016 all such loans have been identified and included in the nonaccrual, restructured or 90 days past due loan totals. Management continues to emphasize maintaining a low level of nonperforming assets and returning nonperforming assets to an earning status.
Allowance for Loan Losses: The allowance for loan losses at December 31, 2016
of $23.3 million decreased $2.1 million or 8.4% compared to $25.4 million at December 31, 2015. The allowance for loan losses at December 31, 2016 was 1.95% of loans held for investment.
Management analyzes the loan portfolio to determine the adequacy of the
allowance for loan losses and the appropriate provision required to maintain an adequate allowance. While management uses available information to recognize losses on loans, there can be no assurance that future additions to the allowance will not be necessary. Future adjustments could be necessary to the allowance for loan losses if circumstances or economic conditions differ substantially from the assumptions used in making the initial determinations. Additionally, as an internal part of the examination process, bank regulatory agencies periodically review our allowance for loan losses. The banking regulatory agencies could require the recognition of additions to our loan loss allowance based on their judgment of information available to them at the time of their examination.
Premises and Equipment: Premises and equipment of $55.8 million at December
31, 2016 decreased $0.5 million or 0.9% compared to $56.4 million at December 31, 2015. The net decrease in premises and equipment for 2016 is primarily attributable to depreciation expense.
Other Real Estate Owned: Other real estate owned (“OREO”) of $21.2 million at
December 31, 2016 increased $0.5 million or 2.3% compared to $20.7 million at December 31, 2015. OREO assets represent property acquired as the result of borrower defaults on loans. Management actively manages the OREO and records the value of each OREO at either the lower of the fair market value less estimated selling costs or at the cost of the asset. Write-downs occurring at foreclosure are charged against the allowance for possible loan losses. On an ongoing basis, OREO is appraised as required by market indications and applicable regulations. Any further write-downs as a result of subsequent declines in value are included in other noninterest expense along with other expenses related to maintaining the properties.
Bank Owned Life Insurance: Bank owned life insurance (“BOLI”) of $62.7 million at December 31, 2016 increased $13.6 million or 27.6% compared to $49.1 million at December 31, 2015. During 2016 an additional $12.0 million investment was made in BOLI. The investment in BOLI continues to provide strong earnings that provide
gonzalezs
Typewritten Text
Annual Report

5
financing for employee compensation and benefit plans. A split dollar benefit is provided for selected management and will be paid to the estate of the participant provided the participant is employed by the Company at date of death.
Deposits: Deposits at December 31, 2016 of $1.821 billion decreased $23.5
million or 1.3% compared to $1.845 billion at December 31, 2015. The decrease in deposits was attributable to a decrease in foreign, public funds and core deposits. Foreign deposits of $184.1 million decreased $9.0 million, public fund deposits of $627.3 million decreased $6.1 million and all other core deposit accounts of $1.010 billion decreased $8.4 million at December 31, 2016 compared to the prior year. Deposits are the Company’s primary source of funds. The Company offers a variety of products designed to attract and retain deposit customers, such as checking accounts, regular savings deposits, NOW accounts, money market accounts, select certificates of deposit savings, an interest-bearing club account and certificates of deposits. Deposits are obtained primarily from individuals, partnerships and corporations in our market areas. In addition, we obtain deposits from state and local public entities, commonly referred to as public fund deposits. The Company’s policies also permit the acceptance of brokered deposits. Generally, both brokered certificates of deposit and public funds are less expensive than retail deposits, and are easily managed.
The interest rates paid are competitively priced for each particular deposit product
and structured to meet our funding requirements. The Company’s management will continue to manage interest expense through deposit pricing. The Company’s management believes that additional funds, if needed, can be attracted and deposit growth can be accelerated through deposit pricing as the Company experiences increased loan demand or other liquidity needs. Capital Resources: Shareholders’ equity of $252.0 million at December 31, 2016 increased $4.7 million or 2.2% compared to $247.3 million at December 31, 2015. The increase was primarily attributable to: $13.8 million of earnings, partially reduced by $5.9 million decrease in accumulated other comprehensive income, and further reduced by $3.4 million of net Treasury Stock purchases. The Company has actively engaged in a buyback program of its stock during years 2012 to the present. During 2015, the Board of Directors retired $10.0 million of Treasury Stock. During 2016, the Board of Directors retired $10.4 million of Treasury Stock. Bank holding companies are required to maintain capital ratios in accordance with guidelines adopted by the Federal Reserve Board. The guidelines are commonly known as Risk-Based Capital Guidelines. The minimum Total Risk-Based Capital, Tier 1 Risk-Based Capital, Common Equity Tier 1 Capital, and Tier 1 Leverage Capital ratios which include an additional 2.5% Capital Conservation Buffer are 10.5%, 8.5%, 7.0% and 4.0%, respectively. At December 31, 2016, the Company’s Total Risk-Based Capital, Tier 1 Risk-Based Capital, Common Equity Tier 1 Capital, and Tier 1 Leverage Capital ratios were 18.7%, 17.4%, 17.4%, and 11.7%, respectively. Shareholders’ equity as a percentage of total year-end assets was 11.53% in 2016 and 11.23% in 2015.
gonzalezs
Typewritten Text
Annual Report

6
At December 31, 2016, the Company and the Bank met the criteria for classification as a “well-capitalized” institution under the prompt corrective action rules promulgated under the Federal Deposit Insurance Act. Designation as a well-capitalized institution under these regulations does not constitute a recommendation or endorsement of the Company or the Bank by federal bank regulators. Analysis of Results of Operations
Earnings Summary: Net income for 2016 was $13.814 million or $2.33 per fully diluted share, reflecting an increase of $2.188 million or $0.33 per fully diluted share, compared to the net income of $11.626 million or $1.94 per fully diluted share for the year 2015. A more detailed description of the results of operations is included in the material that follows.
Net Interest Income: Net interest income represents the largest source of income
for the Company. Net interest income is the difference between interest earned on assets and interest expense incurred for the funds supporting those assets. The largest category of earning assets consists of loans. The second largest category of earning assets is investments, followed by due from banks-interest bearing deposits.
Earning assets are funded by consumer and commercial deposits and short-term
borrowings. In addition to these interest-bearing funds, assets are also supported by interest-free funds, primarily demand deposits and shareholder’s equity. Variations in the volume and mix of assets and liabilities and their relative sensitivity to interest rate movements determine changes in net interest income.
Net interest income (see table below) of $65.6 million for 2016, reflects a
decrease of $1.8 million or 2.6% compared to the prior year of $67.4 million. The decrease in net interest income was attributable primarily to a decrease in loan volume and partially due to a decline in interest earned. The decline in loan volume is primarily attributable to sluggish economic growth, low interest rates and intense competitive pressures. Management’s efforts to control the cost of funds by reducing the rate paid on deposits helped offset the decline in noninterest income. The net yield on total interest-earning assets (see table below), also referred to as net interest margin, represents net interest income, on a tax equivalent basis, divided by average interest-earning assets. Since a significant portion of the Company’s funding is derived from interest-free sources, primarily demand deposits and shareholders’ equity, the effective rate paid for all funds is lower than the rate paid on interest-bearing liabilities alone. The net interest margin of 3.38% for 2016 decreased 5 basis points compared to 3.43% for the prior year. The Company continued to experience intense market competition for both loans and deposits during 2016. The yield on interest-earning assets of 3.96% for 2016 decreased 10 basis points compared to 4.06% for the
gonzalezs
Typewritten Text
Annual Report

7
prior year. The rates paid on interest-bearing liabilities of 0.80% for 2016 decreased 6 basis points compared to 0.86% for the prior year. The following table presents for the last three calendar years the total dollar amount of interest income from average interest-earning assets and the resultant yields, reported on a tax-equivalent basis, as well as the average interest-bearing liabilities, expressed both in dollars and rates. Average balances are derived from average daily balances and the yields and costs are established by dividing income or expense by the average balance of the asset or liability. Income and yield on interest-earning assets include amounts to convert tax-exempt income to a taxable-equivalent basis, assuming a 35% effective tax rate for 2016, 2015 and 2014. NOTE: INSERT NEW EXCEL WORKSHEET FOR NET INTEREST MARGIN
Provision for Loan Losses: The amount of provision for loan losses is based on periodic (not less than quarterly) evaluations of the loan portfolio, especially nonperforming and other potential problem loans. During these evaluations, management considers various factors. For additional information concerning the factors in these evaluations, see the “Allowance for Loan Losses” section of this Report.
The provision for loan losses is charged to earnings to bring the allowance for
loan losses to a level deemed appropriate by management based on factors such as historical experience, the volume and type of lending conducted by the Company, the amount of nonperforming assets, regulatory policies, generally accepted accounting principles, general economic conditions, particularly as they relate to the Company’s lending area, and other factors related to the collectibility of the Company’s loan portfolio. The provision for loan losses for the year 2016 and 2015 was zero. A zero provision for loan losses for year 2016 and 2015 was partially due the allowance for loan losses being at a level deemed appropriate by management based on various factors discussed in the “Allowance for Loan Loss” section of this Report.
Noninterest Income: Noninterest income for 2016 of $25.2 million increased $1.8
million or 7.7% compared to $23.4 million for prior year. The net increase in noninterest income for 2016 compared to the prior year was primarily attributable to increases in Other service charges and fee income; Gain on securities, Bank Owned Life Insurance cash value, and Other noninterest income partially offset by decreases in Service charges on deposit accounts.
Service charges on deposit accounts for 2016 of $6.6 million decreased $512,000
or 7.2% compared to $7.1 million for the prior year. Non-sufficient check income more commonly referred to as net overdraft charges for 2016 of $5.0 million decreased $229,000 or 4.4% compared to $5.2 million for the prior year. Account analysis charges for 2016 of $377,000 decreased $209,000 or 35.7% compared to $585,000 for the prior year and was primarily attributable to an increase in earnings credit for said accounts.
gonzalezs
Typewritten Text
(attached)
gonzalezs
Typewritten Text
Annual Report

8
Other service charge and fee income for 2016 of $8.2 million increased $511,000 or 6.6% as compared to $7.7 million for the prior year. The net increase in other service charge and fee income for 2016 was primarily attributable to increases in: Debit card interchange fee income, Merchant services fees and ATM surcharge fees, partially offset by a net decrease in Foreign currency fees. Debit card interchange fee income of $4.9 million for 2016 increased $304,000 or 6.7% compared to $4.6 million for the prior year. The increase in debit card fee income is attributable to volume of activity and production bonuses. Merchant services income of $818,000 for 2016 increased $119,000 or 17.1% compared to $699,000 for the prior year and was attributable to an increased volume of business conducted by Bank customer merchants. ATM surcharge fees of $941,000 for 2016 increased $210,000 or 28.8% compared to $731,000 for the prior year and was attributable to an increased volume of business. Foreign currency fees for 2016 of $256,000 decreased $70,000 or 21.3% as compared to $326,000 for the prior year. The decline in Foreign currency fees was due to a decline in currency exchange activity.
Gain on securities for 2016 of $1.8 million increased $51,000 or 2.8% compared
to $1.8 million for the prior year. Securities were sold out of the Available for Sale portfolio to accomplish investment portfolio objectives aimed at maximizing the total return of the investment portfolio and to manage the Bank’s liquidity.
Bank Owned Life Insurance (BOLI) for 2016 of $1.6 million increased $200,000
or 14.7% compared to $1.4 million for the prior year. The investment in BOLI continues to provide strong earnings that provide financing for employee compensation and benefit plans.
Other noninterest income for 2016 of $6.9 million increased $1.6 million or
29.2% compared to $5.4 million for the prior year. The net increase in Other noninterest income for 2016 was primarily attributable to increases in: Gains on sale of loans held for sale of $348,000; Insurance services commission income of $232,000; Lawsuit settlement of $1.9 million; partially offset by a net decrease in brokerage services – commission income of $886,000.
Noninterest Expense: Noninterest expense for 2016 of $72.3 million decreased $2.7 million or 3.6% compared to $75.0 million for prior year. The decrease in noninterest expense was primarily attributable to a decrease in four subcategories: Legal and professional fees; FDIC insurance; Advertising expense; and Other real estate, net. The decrease in noninterest expense was partially offset by an increase in employee compensation and employee benefit expense and telephone expense. The largest category of noninterest expense is personnel expense of $41.8 million, which is comprised of employee compensation of $35.0 million and employee benefits of $6.9 million, for 2016 these categories increased $1.5 million or 3.7% compared to $40.3 million for the prior year. Personnel expense increase was primarily a result of increases for merit, promotions, taxes and medical benefit expenses. The Company group medical benefits are primarily provided through a self-funded plan which is supplemented by employee premiums. The funding for the self-funded is adjusted each year for
gonzalezs
Typewritten Text
Annual Report

9
anticipated claims. Net employee group insurance expense of $3.1 million for 2016 increased $30,000 or 1.0% compared to $3.0 million for the prior year. As of year-end 2016, the self-funded group medical plan had excess reserves of $501,000 for future medical claims. Legal and professional expense of $4.8 million for 2016 decreased $1.0 million or 16.8% compared to $5.8 million for the prior year. The decrease is primarily due to a decrease in consulting fees incurred to review and enhance compliance with the Bank Secrecy Act.
FDIC insurance expense of $2.0 million for 2016 decreased $832,000 or 29.3% compared to $2.8 million for the prior year. The FDIC Insurance Fund has reached a reserve ratio of 1.15% with a result that future premiums from all banks would be reduced. The net decrease is primarily attributable to the FDIC changing the methodology for the computation of the premium for the insurance.
Advertising expense of $1.7 million for 2016 decreased $171,000 or 9.0%
compared to $1.9 million for the prior year. The net decrease is primarily attributable to television and radio production / broadcast (down $97,000) and sports marketing (down $159,000) with all other categories reflecting a net increase in expense. The marketing focus is to continue to promote the bank in the communities that we serve and to promote product awareness.
The other real estate owned net expense of $198,000 for 2016 decreased $2.2
million or 91.9% compared to $2.4 million for the prior year. This category includes direct expenses for foreclosed real estate including property taxes, maintenance costs, write-downs, less rent income and net gains on the sale of properties. Net gains of $982,000 from the sale of OREO for years 2016 increased $1.6 million or 259.7% when compared to a net loss of $615,000 for the prior year. OREO expenses of $1.2 million for 2016 decreased $642,000 or 35.0% compared to $1.8 million for the prior year. The decline in expenses is also reflective of the decline in OREO holdings for 2016. Management is aggressively working to reduce total OREO holdings to return the investment in said properties to earning assets.
Telephone expense of $1.6 million for 2016 increased $201,000 or 14.2%
compared to $1.4 million for the prior year. The net increase is primarily attributable to data communication expenses (up $339,000), mobile phone / device expenses (down $60,000), and all other expenses (down $78,000). The increase in data communication expenses were a result of restructuring bandwidth and number of data lines to all locations.
Federal and State Income Taxes: Federal and state income taxes of $4.7 million for the year 2016 increased $600,000 compared to $4.1 million for the prior year. The increase in federal and state income taxes is attributable to an increased level of pretax income during 2016. The increased level of pretax income was partially achieved by the increase in noninterest income and the decrease in noninterest expenses.
gonzalezs
Typewritten Text
Annual Report

10
Net Income: Net income for 2016 was $13.8 million or $2.33 per fully diluted share, reflecting an increase of $2.2 million or $0.39 per fully diluted share, compared to the net income of $11.6 million or $1.94 per fully diluted share for the prior year.
gonzalezs
Typewritten Text
Annual Report

Taxable-Equivalent Basis Average Yield/ Average Yield/ Average Yield/(Dollars in Thousands) Balance Interest Rate Balance Interest Rate Balance Interest RateAssetsInterest-Earning Assets Loans Held for Sale* 1,316$ 50$ 3.79% 1,000$ 42$ 4.20% 6,862$ 270$ 3.94% Loans Held for Investment Commercial 164,320 7,767 4.73% 191,383 9,193 4.80% 236,375 11,516 4.87% Real Estate 949,649 50,450 5.31% 967,860 54,001 5.58% 979,037 56,961 5.82% Consumer 28,974 1,337 4.62% 28,519 1,242 4.36% 30,101 1,269 4.21% Total Loans Held for Investment 1,142,943 59,554 5.21% 1,187,762 64,437 5.43% 1,245,512 69,746 5.60% Securities Taxable 565,167 12,950 2.29% 525,059 11,798 2.25% 567,077 12,887 2.27% Tax-Exempt 165,948 5,686 3.43% 125,821 4,433 3.52% 65,434 2,570 3.93% Total Securities 731,114 18,635 2.55% 650,880 16,231 2.49% 632,511 15,457 2.44% Due from Banks-interest bearing 118,848 614 0.52% 164,038 430 0.26% 148,090 372 0.25% Total Interest- Earning Assets 1,994,221 78,853 3.95% 2,003,680 81,139 4.05% 2,032,975 85,845 4.22%Cash and Due from Banks 36,270 34,378 33,212 Premises and Equipment, Net 57,088 58,334 62,212 Other Real Estate Owned 19,766 26,539 37,282 Bank Owned Life Insurance 54,960 48,390 36,450 Other Assets 21,880 20,261 21,782 Allowance for Loan Losses (24,968) (26,957) (29,467) Total Assets 2,159,217$ 2,164,624$ 2,194,446$ LiabilitiesInterest-Bearing Liabilities Saving Accounts & Select CDs 135,533$ 328$ 0.24% 126,029$ 298$ 0.24% 150,037$ 393$ 0.26% NOW & Money Market Checking 588,193 1,772 0.30% 557,764 2,052 0.37% 556,135 2,725 0.49% Time Deposits 606,875 6,012 0.99% 676,547 6,661 0.98% 713,613 7,666 1.07% Total Savings and Time Deposits 1,330,601 8,112 0.61% 1,360,340 9,011 0.66% 1,419,784 10,784 0.76% Federal Funds Purchased and Securities Sold Under Repurchase Agreements 2,643 22 0.84% 2,328 22 0.95% 8,082 58 0.72% FHLB Borrowings 88,333 2,851 3.23% 75,137 2,744 3.65% 85,562 3,190 3.73% Notes Payable- Trust Debentures 21,237 611 2.88% 27,837 755 2.71% 27,837 740 2.66% Total Interest-Bearing Liabilities 1,442,814 11,596 0.80% 1,465,642 12,532 0.86% 1,541,265 14,773 0.96%Demand Deposits 445,930 440,933 411,327 Other Liabilities 11,973 12,815 10,751 Shareholders' Equity 258,500 245,234 231,103 Total Liabilities and Shareholders' Equity 2,159,217$ 2,164,624$ 2,194,446$ Net Interest Income 67,257$ 68,607$ 71,072$ Net Yield on Total Interest- Earning Assets 3.37% 3.42% 3.50%
*Interest on loans held for sale exclude fees in effort to represent more accurate yields. Fees include: origination fees, late charges, processing fees, underwriting fees, document handling fee and lender credit fees.
For analytical purposes, income from tax-exempt assets, primarily securities issued by state and local governments orauthorities, is adjusted by an increment which equates tax-exempt income to interest from taxable assets (assuming a35% effective federal income tax rate for 2016, 2015 and 2014).
2015 20142016
gonzalezs
Typewritten Text
Net Interest Margin
gonzalezs
Typewritten Text
Annual Report

Consolidated Financial Statements
and Independent Auditor’s Report
Years Ended December 31, 2016 and 2015
gonzalezs
Typewritten Text
Annual Report
Ill ~~ SMITH
FANKHAUSER VOIGT&
WATSON, PLLC
INDEPENDENT AUDITOR'S REPORT
The Board of Directors and Audit Committee Lone Star National Bancshares-Texas, Inc.
We have audited the accompanying consolidated financial statements of Lone Star National BancsharesTexas, Inc. (the Company) and its subsidiaries, which comprise the consolidated balance sheets as of December 31, 2016 and 2015, and the related consolidated statements of income, comprehensive income, changes in stockholders' equity and cash flows for the years then ended, and the related notes to the consolidated fmancial statements.
Management's Responsibility for the Financial Statements
Management is responsible for the preparation and fair presentation of these consolidated financial statements in accordance with accounting principles generally accepted in the United States of America; this includes the design, implementation and maintenance of internal control relevant to the preparation and fair presentation of financial statements that are free of material misstatement, whether due to fraud or error.
Auditor's Responsibility
Our responsibility is to express an opinion on these consolidated financial statements based on our audits. We conducted our audits in accordance with auditing standards generally accepted in the United States of America. Those standards require that we plan and perform the audits to obtain reasonable assurance about whether the consolidated fmancial statements are free of material misstatement.
An audit involves performing procedures to obtain audit evidence about the amounts and disclosures in the consolidated fmancial statements. The procedures selected depend on the auditor's judgment, including the assessment of the risks of material misstatement of the consolidated financial statements, whether due to fraud or error. In making those risk assessments, the auditor considers internal control relevant to the entity's preparation and fair presentation of the consolidated financial statements in order to design audit procedures that are appropriate in the circumstances, but not for the purpose of expressing an opinion on the effectiveness of the entity's internal control. Accordingly, we express no such opinion. An audit also includes evaluating the appropriateness of accounting policies used and the reasonableness of significant accounting estimates made by management, as well as evaluating the overall presentation of the consolidated financial statements.
We believe that the audit evidence we have obtained is sufficient and appropriate to provide a basis for our audit opinion.
Opinion
In our opinion, the consolidated financial statements referred to above present fairly, in all material respects, the financial position of Lone Star National Bancshares-Texas, Inc. and Subsidiaries as of December 31, 2016 and 2015, and the results of their operations and their cash flows for the years then ended in accordance with accounting principles generally accepted in the United States of America.
Certified Public Accountants
801 QUINCE AVENUE • P.O. BOX 3125 • McALLEN, TEXAS 78502~3125 (956) 682~6365 FAX {956) 682~2995
gonzalezs
Typewritten Text
Annual Report

Report on Other Legal and Regulatory Requirements
We have also examined, in accordance with attestation standards established by the American Institute of Certified Public Accountants, management's assertion that Lone Star National Bancshares-Texas, Inc. maintained effective internal control over financial reporting, including internal control over the preparation of regulatory financial statements, in accordance with the instructions for the Call Report, as of December 31, 2016, based on criteria established in Internal Control-Integrated Framework issued by the Committee of Sponsoring Organizations of the Treadway Commission ("2013 framework") and our report dated March 30, 201 7 expressed an unqualified opinion thereon.
March 30, 2017
gonzalezs
Typewritten Text
Annual Report

2016 2015Assets
Cash and due from banks 38,917$ 30,420$ Due from banks-interest bearing 104,755 205,815
Total cash and cash equivalents 143,672 236,235 Securities available for sale 692,199 691,499 Loans held for sale 2,728 1,174 Loans, less allowance for loan losses
of $23,272 and $25,405, respectively 1,168,010 1,115,860 Properties and equipment, net 55,827 56,351 Net deferred tax asset 13,684 10,454 Overpayment of federal income tax 586 235 Accrued interest receivable 7,940 7,356 Other real estate 21,213 20,727 Bank owned life insurance 62,674 49,112 Other assets 15,883 13,993
Total assets 2,184,416$ 2,202,996$
LiabilitiesDeposits
Demand 482,845$ 490,226$ NOW accounts 558,814 583,462 Savings and money market deposit accounts 176,411 161,205 Time $250 and over 352,202 339,829 Other time 250,868 269,942
Total deposits 1,821,140 1,844,664 Accrued interest payable 920 952 Allowance for off-balance-sheet losses 685 885 Other liabilities 5,649 5,113 Federal funds purchased and securities sold
under repurchase agreements 3,750 1,250 Guaranteed preferred beneficial interest in Company's
subordinated debentures 10,310 27,837 Other borrowed money 90,000 75,000
Total liabilities 1,932,454 1,955,701
Stockholders' equityCommon stock, par value $5; authorized 50,000,000
shares; 5,863,634 and 6,107,833 shares issued and 5,863,634 and 5,941,654 shares outstanding 29,318 30,539
Paid-in capital 54,976 57,221 Retained earnings 166,900 159,947 Accumulated other comprehensive income 768 6,668 Treasury Stock 0 and 166,179 shares - (7,080)
Total stockholders' equity 251,962 247,295 Total liabilities and stockholders' equity 2,184,416$ 2,202,996$
LONE STAR NATIONAL BANCSHARES-TEXAS, INC. AND SUBSIDIARIESConsolidated Balance Sheets
(Dollars in Thousands, Except Share Data)
December 31,
The accompanying notes are an integral part of the consolidated financial statements.- 3 -
gonzalezs
Typewritten Text
Annual Report

2016 2015Interest income
Loans, including fees 59,696$ 64,605$ Securities available for sale 16,743 14,748 Due from banks and other earning assets 800 583
77,239 79,936 Interest expense
Deposits 8,112 9,011 Federal funds purchased and repurchase agreements 22 21 Subordinated debentures 611 755 Other borrowed money 2,851 2,745
11,596 12,532 Net interest income 65,643 67,404
Provision for loan losses - - Net interest income after provision for loan losses 65,643 67,404
Noninterest incomeService charges on deposit accounts 6,634 7,146 Other service charge and fee income 8,248 7,737 Gain on securities 1,849 1,798 Bank owned life insurance 1,562 1,362 Other noninterest income 6,914 5,352
25,207 23,395 Noninterest expense
Employee compensation 34,973 33,526 Employee benefits 6,856 6,788
41,829 40,314 Net occupancy and equipment expense 9,073 9,213 Data processing expense 5,580 5,610 Legal and professional 4,796 5,763 FDIC insurance 2,009 2,841 Advertising expense 1,733 1,904 Telephone expense 1,617 1,416 Supplies 517 533 Business development 410 353 Other real estate, net 198 2,431 Other noninterest expense 4,551 4,657
72,313 75,035 Income before income tax expense 18,537 15,764 Income tax expense 4,723 4,138 Net income 13,814$ 11,626$
LONE STAR NATIONAL BANCSHARES-TEXAS, INC. AND SUBSIDIARIESConsolidated Statements of Income
(Dollars in Thousands)
Year Ended December 31,
The accompanying notes are an integral part of the consolidated financial statements.- 4 -
gonzalezs
Typewritten Text
Annual Report

2016 2015
Net income 13,814$ 11,626$
Other comprehensive income, before federal income tax
Securities available for sale
Unrealized holding losses arising during year (6,580) (1,724)
Reclassification adjustment for gains included in net income (1,849) (1,798)
(8,429) (3,522)
Federal income tax benefit related to other comprehensive income 2,529 1,709
Other comprehensive loss, net of federal income tax (5,900) (1,813)
Comprehensive income 7,914$ 9,813$
Year Ended December 31,
LONE STAR NATIONAL BANCSHARES-TEXAS, INC. AND SUBSIDIARIESConsolidated Statements of Comprehensive Income
(Dollars in Thousands)
The accompanying notes are an integral part of the consolidated financial statements.- 5 -
gonzalezs
Typewritten Text
Annual Report

Common Paid-in Retainedstock capital earnings
Balance at December 31, 2014 31,828$ 59,579$ 154,668$
Comprehensive incomeNet income - - 11,626 Other comprehensive loss, net of tax - - -
Purchase of treasury stock, 113,561 shares - - - Sale of treasury stock, 44,802 shares - - (20) Retirement of treasury stock, 257,685 shares (1,289) (2,412) (6,299) Share-based compensation - 45 - Tax benefit from stock options exercised - 9 (28)
Balance at December 31, 2015 30,539 57,221 159,947
Comprehensive incomeNet income - - 13,814 Other comprehensive loss, net of tax - - -
Purchase of treasury stock, 125,880 shares - - - Sale of treasury stock, 47,860 shares - - (87) Retirement of treasury stock, 244,199 shares (1,221) (2,448) (6,774) Share-based compensation - 170 - Tax benefit from stock options exercised - 33 -
Balance at December 31, 2016 29,318$ 54,976$ 166,900$
LONE STAR NATIONAL BANCSHARES-TEXAS, INC. AND SUBSIDIARIESConsolidated Statements of Changes in Stockholders' Equity
(Dollars in Thousands)
The accompanying notes are an integral part of the consolidated financial statements.- 6 -
gonzalezs
Typewritten Text
Annual Report

Accumulatedother Total
comprehensive Treasury stockholders'income (loss) stock equity
8,481$ (14,213)$ 240,343$
- - 11,626 (1,813) - (1,813)
- (4,797) (4,797) - 1,930 1,910 - 10,000 - - - 45 - - (19)
6,668 (7,080) 247,295
- - 13,814 (5,900) - (5,900)
- (5,406) (5,406) - 2,043 1,956 - 10,443 - - - 170 - - 33
768$ -$ 251,962$
- 7 -
gonzalezs
Typewritten Text
Annual Report

2016 2015Operating activities
Net income 13,814$ 11,626$ Adjustments to reconcile net income to net
cash provided by operating activitiesDepreciation and amortization 3,717 4,141 Amortization/accretion of investment
security premiums and discounts, net 5,040 4,516 Share-based compensation 1,066 26 Loss (gain) on sale of other real estate 318 (970) Gain on sale of investment securities (1,847) (1,798) Gain on foreclosure of real estate (1,758) (244) Loss on retired property and equipment 20 18 Donation of real estate 80 - Dividend from Federal Reserve Bank (49) - Income from bank owned life insurance (1,562) (1,363) Addition to other real estate owned valuation reserve 226 78 Writedown of other real estate owned 320 1,641 Provision for off-balance-sheet losses (200) (81) (Increase) decrease in overpayment of federal income tax (351) 143 Increase in deferred income tax benefit (700) (2,484) Increase in accrued interest receivable (584) (154) Increase in loans held for sale (1,554) (103) Decrease (increase) in other assets 282 (80) Decrease in accrued interest payable (32) (81) Decrease in other liabilities (327) (2,587)
Net cash provided by operating activities 15,919 12,244
Year Ended December 31,
LONE STAR NATIONAL BANCSHARES-TEXAS, INC. AND SUBSIDIARIESConsolidated Statements of Cash Flows
(Dollars in Thousands)
The accompanying notes are an integral part of the consolidated financial statements.- 8 -
gonzalezs
Typewritten Text
Annual Report

2016 2015
Investing activitiesSecurities available for sale
Purchases (431,570) (750,305) Maturities, calls and principal repayments 51,568 565,237 Proceeds from sale 367,679 110,027
Proceeds from sale of properties and equipment 25 5 Purchase of bank owned life insurance (12,000) - Purchase of FHLB stock (2,300) (15) Purchase of FRB stock (1) - Purchase of properties and equipment (3,060) (835) Net (increase) decrease in loans (58,366) 78,723 Net proceeds from sale of other real estate 6,544 12,060
Net cash (used) provided by investing activities (81,481) 14,897
Financing activitiesNet (decrease) increase in demand deposits,
NOW accounts, savings and money market accounts (16,823) 112,313 Proceeds from sale of treasury stock 1,956 1,910 Proceeds of other borrowed money 110,000 - Repayment of other borrowed money (95,000) - Repayment of guaranteed preferred beneficial interest
in Company's subordinate debentures (17,527) - Net increase (decrease) in federal funds purchased and
securities sold under repurchase agreements 2,500 (6,400) Net decrease in time deposits (6,701) (78,381) Purchase of treasury stock (5,406) (4,797)
Net cash (used) provided by financing activities (27,001) 24,645
(Decrease) increase in cash and cash equivalents (92,563) 51,786 Cash and cash equivalents at beginning of year 236,235 184,449 Cash and cash equivalents at end of year 143,672$ 236,235$
LONE STAR NATIONAL BANCSHARES-TEXAS, INC. AND SUBSIDIARIESConsolidated Statements of Cash Flows (Continued)
(Dollars in Thousands)
Year Ended December 31,
The accompanying notes are an integral part of the consolidated financial statements.- 9 -
gonzalezs
Typewritten Text
Annual Report

LONE STAR NATIONAL BANCSHARES-TEXAS, INC. AND SUBSIDIARIES Notes to Consolidated Financial Statements
December 31, 2016 and 2015
- 10 -
Note 1 - Summary of Significant Accounting Policies Lone Star National Bancshares-Texas, Inc. (the “Parent” or “Company”), its primary subsidiary, Lone Star National Bank (the “Bank”) and its other subsidiaries (collectively the “Company”) are headquartered in McAllen, Texas. The Company provides a broad array of customary banking services and operates 32 regulatory banking locations throughout the Rio Grande Valley of Texas and San Antonio, Texas. The accounting principles and reporting policies conform to accounting principles generally accepted in the United States of America and to general practices within the banking industry. A summary of the more significant accounting policies follows:
Basis of Presentation. The consolidated financial statements include the accounts of Lone Star National Bancshares-Texas, Inc. and its wholly-owned subsidiaries. The Company eliminates all significant intercompany transactions and balances in consolidation. The accounting and financial reporting policies the Company follows conform, in all material respects, to accounting principles generally accepted in the United States of America. The Company determines whether it has a controlling financial interest in an entity by first evaluating whether the entity is a voting interest entity or a variable interest entity under accounting principles generally accepted in the United States of America. Voting interest entities are entities in which the total equity investment at risk is sufficient to enable the entity to finance itself independently and provides the equity holders with the obligation to absorb losses, the right to receive residual returns and the right to make decisions about the entity’s activities. The Company consolidates voting interest entities in which it has all, or at least a majority of, the voting interest. As defined in applicable accounting standards, variable interest entities (“VIE”) are entities that lack one or more of the characteristics of a voting interest entity. A controlling financial interest in an entity is present when an enterprise has a variable interest, or a combination of variable interests, that will absorb a majority of the entity’s expected losses, receive a majority of the entity’s expected residual returns, or both. The enterprise with a controlling financial interest, known as the primary beneficiary, consolidates the VIE. The Company’s wholly-owned subsidiary, Star National Capital Trust IV is a VIE for which the Company is not the primary beneficiary. Accordingly, the accounts of this entity are not included in the Company’s consolidated financial statements.
Use of Estimates. The preparation of financial statements in conformity with accounting principles generally accepted in the United States of America requires management to make estimates and assumptions that affect the reported amounts of assets and liabilities and disclosure of contingent assets and liabilities at the date of the financial statements and the reported amounts of revenues and expenses during the reporting period. Actual results could differ from these estimates. The allowance for possible loan losses, the fair value of financial instruments and the status of contingencies are particularly subject to change.
Cash and Cash Equivalents. For the purpose of reporting cash flows, the Company considers cash on hand, amounts due from banks, deposits with other financial institutions that have an initial maturity less than 90 days when acquired by the Company and federal funds sold to be cash and cash equivalents. Generally, federal funds sold are purchased and sold for one-day periods. The Company has maintained balances in various operating and money market accounts in excess of federally insured limits.
Repurchase/Resell Agreements. The Company purchases certain securities under agreements to resell.
The amounts advanced under these agreements represent short-term loans and are reflected as assets in the accompanying consolidated balance sheets. The securities underlying these agreements are book entry securities. The Company also sells certain securities under agreements to repurchase. The agreements are
gonzalezs
Typewritten Text
Annual Report

- 11 -
treated as collateralized financing transactions and the obligations to repurchase securities sold are reflected as a liability in the accompanying consolidated balance sheets. The dollar amount of the securities underlying the agreements remain in the asset accounts.
Investments in Securities. Securities that management has both the positive intent and ability to hold to
maturity are classified as securities held to maturity and are carried at cost, adjusted for amortization of premium or accretion of discount, using the level-yield method. Amortization and accretion on mortgage-backed securities are adjusted for prepayments. Securities that may be sold prior to maturity for asset/liability management purposes, or that may be sold in response to changes in interest rates, to changes in prepayment risk, to increase regulatory capital or other similar factors, are classified as securities available for sale and carried at fair value with any adjustments to fair value reported in stockholders’ equity as a component of accumulated other comprehensive income (loss), net of tax. Declines in the fair value of individual held to maturity and available for sale securities below their cost that are other than temporary result in write-downs of the individual securities to their fair value. The related write-downs are included in net income as realized losses. Securities purchased for trading purposes are held in the trading portfolio at fair value, with changes in fair value included in noninterest income. Interest and dividends on securities, including the amortization of premiums and the accretion of discounts, are reported in interest income on securities using the level-yield method. Gains and losses on the sale of securities are recorded on the settlement date and are calculated using the specific identification method.
Loans. Loans that management has the intent and ability to hold for the foreseeable future or until maturity or pay-off generally are reported at their outstanding unpaid principal balances adjusted for charge-offs, the allowance for loan losses, any deferred fees or costs on originated loans and unamortized premiums or discounts on purchased loans. Interest accruals are generally discontinued when management has determined that the borrower may be unable to meet contractual obligations and/or when loans are 90 days or more in arrears, unless management believes that collateral held by the Company is clearly sufficient and full satisfaction of both principal and interest is highly probable, or the loan is accounted for as a purchased credit-impaired loan. When a loan is placed on nonaccrual, all interest previously accrued but not collected is reversed against current period income and amortization of deferred loan fees is discontinued. Interest received on nonaccrual loans is either applied against principal or reported as income according to management’s judgment as to the collectability of principal. Nonaccrual loans may be returned to an accrual status when principal and interest payments are no longer delinquent, and the risk characteristics of the loan have improved to the extent that there no longer exists a concern as to the collectability of principal. Loans are considered past due based upon their contractual terms. Loans are considered impaired when, based on current information and events, it is probable the Company will be unable to collect all amounts due in accordance with the original contractual terms of the loan agreement, including scheduled principal and interest payments. Impairment is evaluated on an individual loan basis. If a loan is impaired, a specific valuation allowance is allocated, if necessary, so that the loan is reported net, at the present value of estimated future cash flows using the loan's existing rate or at the fair value of collateral if repayment is expected solely from the collateral. Interest payments on impaired loans are typically applied to principal unless collectability of the principal amount is reasonably assured, in which case interest is recognized on a cash basis. Impaired loans, or portions thereof, are charged off when deemed uncollectible.
Allowance for Possible Loan Losses. The allowance for possible loan losses is a reserve established
through a provision for possible loan losses charged to expense, which represents management’s best estimate of probable losses that have been incurred within the existing portfolio of loans. The allowance,
gonzalezs
Typewritten Text
Annual Report
- 12 -
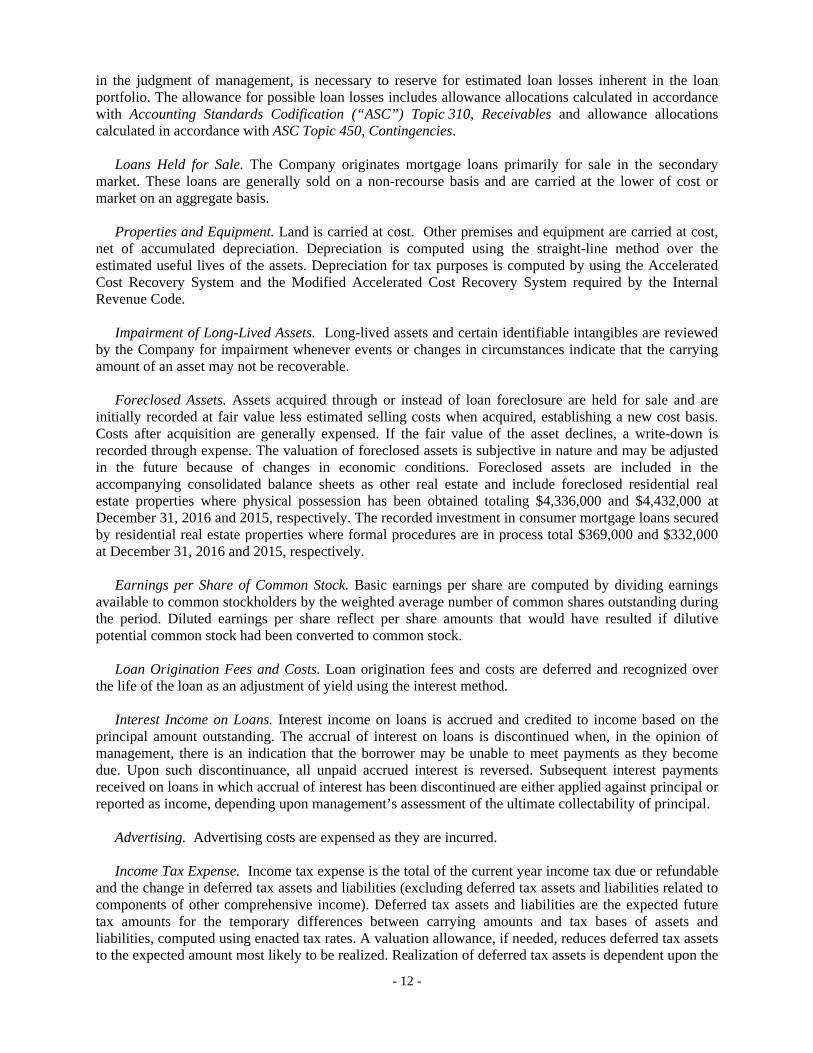
in the judgment of management, is necessary to reserve for estimated loan losses inherent in the loan portfolio. The allowance for possible loan losses includes allowance allocations calculated in accordance with Accounting Standards Codification (“ASC”) Topic 310, Receivables and allowance allocations calculated in accordance with ASC Topic 450, Contingencies.
Loans Held for Sale. The Company originates mortgage loans primarily for sale in the secondary
market. These loans are generally sold on a non-recourse basis and are carried at the lower of cost or market on an aggregate basis.
Properties and Equipment. Land is carried at cost. Other premises and equipment are carried at cost, net of accumulated depreciation. Depreciation is computed using the straight-line method over the estimated useful lives of the assets. Depreciation for tax purposes is computed by using the Accelerated Cost Recovery System and the Modified Accelerated Cost Recovery System required by the Internal Revenue Code.
Impairment of Long-Lived Assets. Long-lived assets and certain identifiable intangibles are reviewed by the Company for impairment whenever events or changes in circumstances indicate that the carrying amount of an asset may not be recoverable.
Foreclosed Assets. Assets acquired through or instead of loan foreclosure are held for sale and are
initially recorded at fair value less estimated selling costs when acquired, establishing a new cost basis. Costs after acquisition are generally expensed. If the fair value of the asset declines, a write-down is recorded through expense. The valuation of foreclosed assets is subjective in nature and may be adjusted in the future because of changes in economic conditions. Foreclosed assets are included in the accompanying consolidated balance sheets as other real estate and include foreclosed residential real estate properties where physical possession has been obtained totaling $4,336,000 and $4,432,000 at December 31, 2016 and 2015, respectively. The recorded investment in consumer mortgage loans secured by residential real estate properties where formal procedures are in process total $369,000 and $332,000 at December 31, 2016 and 2015, respectively.
Earnings per Share of Common Stock. Basic earnings per share are computed by dividing earnings
available to common stockholders by the weighted average number of common shares outstanding during the period. Diluted earnings per share reflect per share amounts that would have resulted if dilutive potential common stock had been converted to common stock.
Loan Origination Fees and Costs. Loan origination fees and costs are deferred and recognized over
the life of the loan as an adjustment of yield using the interest method.
Interest Income on Loans. Interest income on loans is accrued and credited to income based on the principal amount outstanding. The accrual of interest on loans is discontinued when, in the opinion of management, there is an indication that the borrower may be unable to meet payments as they become due. Upon such discontinuance, all unpaid accrued interest is reversed. Subsequent interest payments received on loans in which accrual of interest has been discontinued are either applied against principal or reported as income, depending upon management’s assessment of the ultimate collectability of principal.
Advertising. Advertising costs are expensed as they are incurred.
Income Tax Expense. Income tax expense is the total of the current year income tax due or refundable and the change in deferred tax assets and liabilities (excluding deferred tax assets and liabilities related to components of other comprehensive income). Deferred tax assets and liabilities are the expected future tax amounts for the temporary differences between carrying amounts and tax bases of assets and liabilities, computed using enacted tax rates. A valuation allowance, if needed, reduces deferred tax assets to the expected amount most likely to be realized. Realization of deferred tax assets is dependent upon the
gonzalezs
Typewritten Text
Annual Report

- 13 -
generation of a sufficient level of future taxable income and recoverable taxes paid in prior years. Although realization is not assured, management believes it is more likely than not that all of the deferred tax assets will be realized.
Off-Balance-Sheet Instruments. In the ordinary course of business, the Company has entered into off-balance-sheet financial instruments consisting of commitments to extend credit, commitments under credit card arrangements, commercial letters of credit and standby letters of credit. Such financial instruments are recorded in the financial statements when they are funded or related fees are incurred or received.
Derivative Financial Instruments. FASB ASC Topic 815 Derivatives and Hedging requires companies
to recognize all derivatives as either assets or liabilities in the statement of financial position and measure those instruments at fair value. Changes in fair value of a derivative must be recognized currently in earnings unless specific hedge accounting criteria are met. The Company’s risk management activities do not presently include entering into derivative contracts to manage interest rate risk.
Share-Based Payments. The Company accounts for all stock-based compensation transactions in accordance with ASC Topic 718, Compensation — Stock Compensation, which requires that stock compensation transactions be recognized as compensation expense in the statement of operations based on their fair values on the measurement date, which is the date of the grant. Cost of the unvested portion of options issued is recognized using the Black-Scholes-Merton option pricing model.
Subsequent Events. The Company has evaluated subsequent events for potential recognition and/or
disclosure through March 30, 2017, the date which these consolidated financial statements were available to be issued.
Reclassifications. Certain amounts in the prior year’s presentation have been reclassified to conform
to the current year’s presentation. These reclassifications have no effect on previously reported net income. Note 2 - Restriction on Cash and Due From Banks The Company is required to maintain reserve funds in cash or on deposit with the Federal Reserve Bank. The required reserve balance at December 31, 2016 and 2015 was $16,637,000 and $16,345,000, respectively. Note 3 - Investment Securities An analysis of securities available for sale as of December 31, 2016 follows: Gross Gross Estimated Amortized Unrealized Unrealized Fair (Dollars in Thousands) Cost Gains Losses Value U.S. government agency $ 45,740 $ 21 $ 294 $ 45,467U.S. treasury 47,702 314 113 47,903State and local government securities 189,891 1,166 2,525 188,532Mortgage-backed 143,725 4,223 563 147,385 Collateralized mortgage obligations 263,869 1,179 2,311 262,737Other 175 - - 175 Total $ 691,102 $ 6,903 $ 5,806 $ 692,199
gonzalezs
Typewritten Text
Annual Report
- 14 -
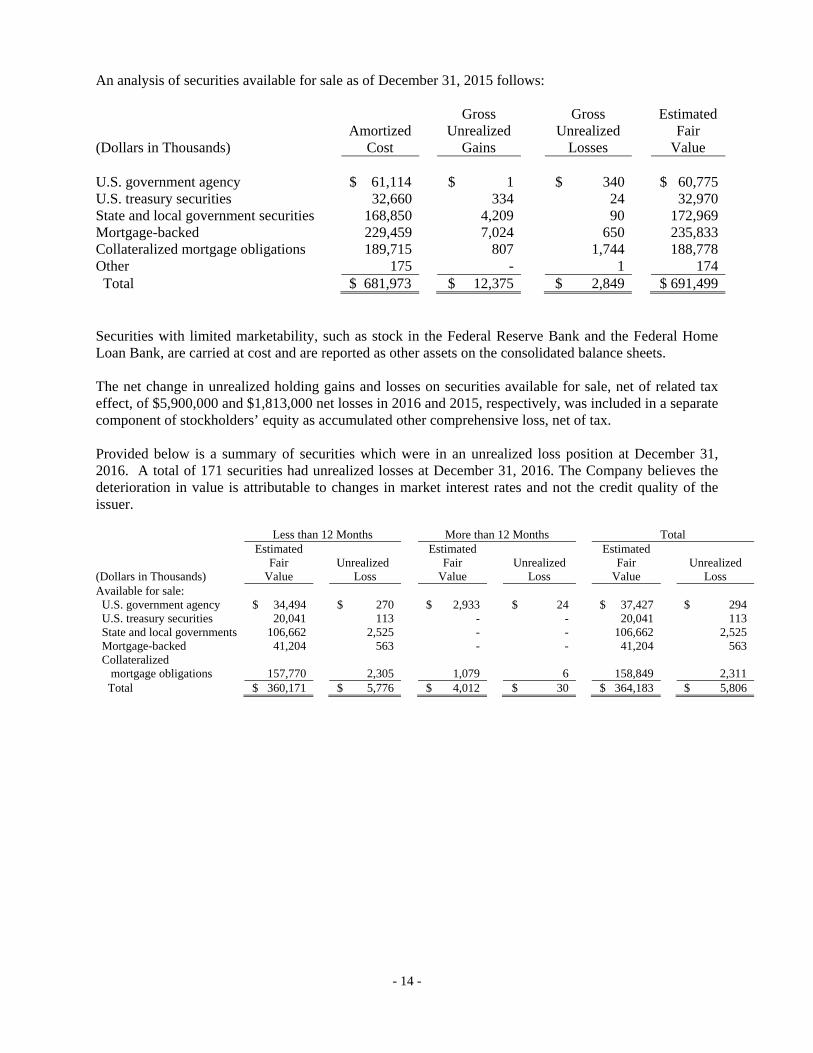
An analysis of securities available for sale as of December 31, 2015 follows: Gross Gross Estimated Amortized Unrealized Unrealized Fair (Dollars in Thousands) Cost Gains Losses Value U.S. government agency $ 61,114 $ 1 $ 340 $ 60,775U.S. treasury securities 32,660 334 24 32,970State and local government securities 168,850 4,209 90 172,969Mortgage-backed 229,459 7,024 650 235,833Collateralized mortgage obligations 189,715 807 1,744 188,778Other 175 - 1 174 Total $ 681,973 $ 12,375 $ 2,849 $ 691,499 Securities with limited marketability, such as stock in the Federal Reserve Bank and the Federal Home Loan Bank, are carried at cost and are reported as other assets on the consolidated balance sheets. The net change in unrealized holding gains and losses on securities available for sale, net of related tax effect, of $5,900,000 and $1,813,000 net losses in 2016 and 2015, respectively, was included in a separate component of stockholders’ equity as accumulated other comprehensive loss, net of tax. Provided below is a summary of securities which were in an unrealized loss position at December 31, 2016. A total of 171 securities had unrealized losses at December 31, 2016. The Company believes the deterioration in value is attributable to changes in market interest rates and not the credit quality of the issuer. Less than 12 Months More than 12 Months Total Estimated Estimated Estimated Fair Unrealized Fair Unrealized Fair Unrealized (Dollars in Thousands) Value Loss Value Loss Value Loss Available for sale: U.S. government agency $ 34,494 $ 270 $ 2,933 $ 24 $ 37,427 $ 294 U.S. treasury securities 20,041 113 - - 20,041 113 State and local governments 106,662 2,525 - - 106,662 2,525 Mortgage-backed 41,204 563 - - 41,204 563 Collateralized mortgage obligations 157,770 2,305 1,079 6 158,849 2,311 Total $ 360,171 $ 5,776 $ 4,012 $ 30 $ 364,183 $ 5,806
gonzalezs
Typewritten Text
Annual Report

- 15 -
The amortized cost and estimated market value of securities available for sale at December 31, 2016, by contractual maturity, is shown below. Expected maturities will differ from contractual maturities because borrowers may have the right to call or prepay obligations with or without call or prepayment penalties.
Securities Available for Sale Estimated Amortized Fair
(Dollars in Thousands) Cost Value Due within one year $ 3,940 $ 3,942 Due one to five years 119,173 119,067 Due five to ten years 54,695 54,402 Due after ten years 102,567 101,558 Subtotal 280,375 278,969 Mortgage-backed and collateralized mortgage obligations 407,594 410,122 U.S. Small Business Administration guaranteed loan pool 2,958 2,933 Other 175 175 Total $ 691,102 $ 692,199
Securities not due at a single maturity date are included in scheduled maturities on the basis of coupon maturity. Proceeds from sales of securities available for sale were $367,669,000 and $110,027,000, respectively, for the years ended December 31, 2016 and 2015. Gross realized gains on sales of securities available for sale were $1,847,000 in 2016 and $1,819,000 in 2015. Gross realized losses on sales of securities available for sale were $29 in 2016 and $21,000 in 2015. Declines in the fair value of held to maturity and available for sale securities below their cost that are deemed to be other than temporary are reflected in earnings as realized losses. In estimating other-than-temporary impairment losses, management considers, among other things, (i) the length of time and the extent to which the fair value has been less than cost, (ii) the financial condition and near-term prospects of the issuer and (iii) the intent and ability of the Company to retain its investment in the issuer for a period of time sufficient to allow for any anticipated recovery in cost. There are no realized losses included in earnings for 2016 and 2015 for other-than-temporary declines in the fair value of securities. Investment securities with a carrying amount of $652,130,000 and $680,718,000 at December 31, 2016 and 2015, respectively, were pledged to secure public funds and for other purposes required or permitted by law. Note 4 - Loans Held for Sale Net gains realized on the sale of loans held for sale totaled $1,148,000 and $850,000 for the years ended December 31, 2016 and 2015, respectively.
gonzalezs
Typewritten Text
Annual Report

- 16 -
Note 5 - Loans Loans consist of the following: December 31, (Dollars in Thousands) 2016 2015 Commercial: Commercial $ 111,946 $ 139,001 Commercial tax-exempt 18,421 6,354 Overdrafts 164 212 Total commercial 130,531 145,567 Agricultural 1,372 1,479 Real estate: Construction 140,616 112,740 Agricultural mortgage 45,902 48,619 1-4 family mortgage 231,981 242,182 Multifamily mortgage 70,560 64,272 Commercial mortgage 509,585 471,003 Total real estate 998,644 938,816 Consumer:
Consumer 62,735 56,867 Overdrafts 358 289 Total consumer 63,093 57,156 Total principal amount of loans 1,193,640 1,143,018 Unamortized fees and costs ( 2,358 )( 1,753 ) Allowance for loan losses ( 23,272 )( 25,405 )
Total loans $ 1,168,010 $ 1,115,860 The Company has certain lending policies and procedures in place that are designed to maximize loan income within an acceptable level of risk. Management reviews and approves these policies and procedures on a regular basis. A reporting system supplements the review process by providing management with frequent reports related to loan production, loan quality, concentrations of credit, loan delinquencies and non-performing and potential problem loans. Diversification in the loan portfolio is a means of managing risk associated with fluctuations in economic conditions.
Commercial loans are underwritten after evaluating and understanding the borrower’s ability to operate profitably and prudently expand its business. Underwriting standards are designed to promote relationship banking rather than transactional banking. Once it is determined that the borrower’s management possesses sound ethics and solid business judgment, the Company’s management examines current and projected cash flows to determine the ability of the borrower to repay their obligations as agreed. Commercial loans are primarily made based on the identified cash flows of the borrower and secondarily on the underlying collateral provided by the borrower. The cash flows of borrowers, however, may not be as expected and the collateral securing these loans may fluctuate in value. Most commercial loans are secured by the assets being financed or other business assets such as accounts receivable or inventory and may incorporate a personal guarantee; however, some short-term loans may be made on an unsecured basis. In the case of loans secured by accounts receivable, the availability of funds for the repayment of these loans may be substantially dependent on the ability of the borrower to collect amounts due from its customers. Real estate loans are viewed primarily as cash flow loans and secondarily as loans secured by real estate. Real estate lending typically involves higher loan principal amounts and the repayment of these loans is generally largely dependent on the cash flows of the borrower. Real estate loans may be more adversely affected by conditions in the real estate markets or in the general economy. The properties securing the Company’s real estate portfolio are diverse in terms of type and location. This diversity helps reduce the Company’s exposure to adverse economic events that affect any single market or industry. Management
gonzalezs
Typewritten Text
Annual Report

- 17 -
monitors and evaluates real estate loans based on collateral and risk grade criteria. The Company tracks the level of owner-occupied real estate loans versus non-owner-occupied loans. At December 31, 2016, approximately 41 percent of the outstanding principal balances of the Company’s commercial real estate loans were secured by owner-occupied properties. The Company originates consumer loans utilizing a computer-based credit scoring analysis to supplement the underwriting process. To monitor and manage consumer loan risk, policies and procedures are developed and modified. This activity, coupled with relatively small loan amounts that are spread across many individual borrowers, minimizes risk. Underwriting standards for home equity loans are heavily influenced by statutory requirements, which include, but are not limited to, a maximum loan-to-value percentage of 85 percent, collection remedies, the number of such loans a borrower can have at one time and documentation requirements.
The Company utilizes independent loan review consultants that review and validate the credit risk program on a periodic basis. Results of these reviews are presented to management. The loan review process complements and reinforces the risk identification and assessment decisions made by lenders and credit personnel, as well as the Company’s policies and procedures.
Loans are considered past due if the required principal and interest payments have not been received as of the date such payments were due. Loans are placed on non-accrual status when, in management’s opinion, the borrower may be unable to meet payment obligations as they become due, as well as when required by regulatory provisions. In determining whether or not a borrower may be unable to meet payment obligations for each class of loans, the Company considers the borrower’s debt service capacity through the analysis of current financial information, if available, and/or current information with regards to the Company’s collateral position. Regulatory provisions would typically require the placement of a loan on non-accrual status if (i) principal or interest has been in default for a period of 90 days or more unless the loan is both well secured and in the process of collection or (ii) full payment of principal and interest is not expected. Loans may be placed on non-accrual status regardless of whether or not such loans are considered past due. When interest accrual is discontinued, all unpaid accrued interest is reversed. Interest income on non-accrual loans is recognized only to the extent that cash payments are received in excess of principal due. A loan may be returned to accrual status when all the principal and interest amounts contractually due are brought current and future principal and interest amounts contractually due are reasonably assured, which is typically evidenced by a sustained period (at least six months) of repayment performance by the borrower.
Year-end non-accrual loans, segregated by class of loans, were as follows: (Dollars in Thousands) 2016 2015 Commercial $ 3,357 $ 3,894Agricultural - -Consumer 134 182Real estate 45,455 53,323 Total $ 48,946 $ 57,399 As of December 31, 2016, non-accrual loans reported in the table above included $4,423,000 related to loans that were restructured as “troubled debt restructurings” during 2016. Had non-accrual loans performed in accordance with their original contractual terms, interest income would have increased by $3,241,000 and $2,531,000 for the years ended December 31, 2016 and 2015, respectively.
gonzalezs
Typewritten Text
Annual Report

- 18 -
An age analysis of past due loans (including both accruing and non-accruing loans), segregated by class of loans, as of December 31, 2016 follows:
(Dollars in Thousands)
Loans 30-89 Days Past
Due
Loans 90 or More Days Past Due
Total Past Due Loans Current Loans Total Loans
Accruing Loans 90 or More
Days Past Due
Commercial
$ 1,793 $ 48 $ 1,841 $ 128,690 $ 130,531
$ -
Agricultural 13 - 13 1,359 1,372 - Consumer 528 275 803 62,290 63,093 275 Real estate 10,366 5,325 15,691 982,953 998,644 20
Total $ 12,700 $ 5,648 $ 18,348 $ 1,175,292 $ 1,193,640 $ 295
Accruing loans 90 or more days past due totaled $868,000 at December 31, 2015. Loans are considered impaired when, based on current information and events, it is probable the Company will be unable to collect all amounts due in accordance with the original contractual terms of the loan agreement, including scheduled principal and interest payments. Impairment is evaluated in total for smaller-balance loans of a similar nature and on an individual loan basis for other loans. If a loan is impaired, a specific valuation allowance is allocated, if necessary, so that the loan is reported net, at the present value of the estimated future cash flows using the loan’s existing rate or at the fair value of collateral if repayment is expected solely from the collateral. Interest payments on impaired loans are typically applied to principal unless collectability of the principal amount is reasonably assured, in which case interest is recognized on a cash basis. Impaired loans, or portions thereof, are charged off when deemed uncollectible. Regulatory guidelines require the Company to reevaluate the fair value of collateral supporting impaired collateral dependent loans on at least an annual basis. While the Company’s policy is to comply with the regulatory guidelines, the Company’s general practice is to reevaluate the fair value of collateral supporting impaired collateral dependent loans on a quarterly basis. Year-end impaired loans are set forth in the following table. Interest income recognized on impaired loans for the time they were impaired was $1,680,000 and $1,952,000 during 2016 and 2015, respectively. (Dollars in Thousands) 2016
Unpaid Contractual
Principal Balance
Recorded Investment With No
Allowance
Recorded Investment
With Allowance
Total Recorded
Investment Related
Allowance
Average Recorded
Investment Commercial $ 4,169 $ 3,156 $ 201 $ 3,357 $ 151 $ 3,354 Agricultural - - - - - - Consumer 146 134 - 134 - 158 Real Estate 61,410 51,366 - 51,366 - 56,210 Total $ 65,725 $ 54,656 $ 201 $ 54,857 $ 151 $ 59,722 2015 Commercial $ 4,459 $ 3,894 $ - $ 3,894 $ - $ 1,401 Agricultural - - - - - - Consumer 182 182 - 182 - 109 Real Estate 65,238 57,067 - 57,067 - 40,551 Total $ 69,879 $ 61,143 $ - $ 61,143 $ - $ 42,061
gonzalezs
Typewritten Text
Annual Report

- 19 -
Troubled Debt Restructurings - The restructuring of a loan is considered a “troubled debt restructuring” if both (i) the borrower is experiencing financial difficulties and (ii) the creditor has granted a concession. Concessions may include interest rate reductions or below market interest rates, principal forgiveness, restructuring amortization schedules and other actions intended to minimize potential losses. Troubled debt restructurings during 2016 and 2015 are set forth in the following tables.
2016 (Dollars in Thousands)
Balance at Restructuring
Date
Balance at December 31,
2016 Commercial $ - $ - Agricultural - - Consumer - - Real estate 4,889 4,339
Total $ 4,889 $ 4,339
2015 (Dollars in Thousands)
Balance at Restructuring
Date
Balance at December 31,
2015 Commercial $ - $ - Agricultural - - Consumer - - Real estate 6,141 5,824
Total $ 6,141 $ 5,824 Typically loans identified as troubled debt restructurings by the Company are previously on non-accrual status and reported as impaired loans prior to restructuring. The modifications primarily related to extending the amortization periods of the loans and the granting of interest-rate concessions. Eight loans restructured during 2016 that remain outstanding are on non-accrual status as of December 31, 2016. Two loans that were restructured during 2016 that remain outstanding are on accrual status and have an outstanding balance of $100,000 as of December 31, 2016. The modifications did not impact the Company’s determination of the allowance for loan losses. As of December 31, 2016, there were six loans restructured in 2016 with an outstanding balance of $3,725,000 that were in default of their modified terms. Credit Quality Indicators - As part of the on-going monitoring of the credit quality of the Company’s loan portfolio, management tracks certain credit quality indicators including trends related to (i) the weighted-average risk grade of loans, (ii) the level of classified loans, (iii) the delinquency status of the loans, (iv) net charge-offs, (v) non-performing loans and (vi) the general economic conditions of South Texas. The Company utilized a risk grading matrix to assign a risk grade to each of its loans. Loans are graded on a scale of 1 to 11. A description of the general characteristics of the 11 risk grades is as follows: Risk Grade 1 – This category includes any loan that is 100% secured by the Company or CD
deposits, US Government agencies and any publicly traded stock that is properly margined – usually at least 120%. It also may include any obligors whose balance sheet, current position, capitalization, profitability and cash flow have been demonstrated to be consistently of such high quality that the potential for significant disruption in their financial performance is virtually nonexistent. Only financially strong and publicly traded companies would be rated in this category but all loans secured by the Company’s certificates of deposit would qualify for such an internal risk rating.
gonzalezs
Typewritten Text
Annual Report

- 20 -
Risk Grade 2 – This internal risk rating is assigned to borrowers having a stable record of strong earnings, a substantial current position, sound capitalization, and solid cash flow, and whose management team has experience and depth within a sound and stable industry.
Risk Grade 3 – Borrowers assigned this internal rating are considered above average with higher
than average credit standards based on leverage, liquidity and debt coverage ratios as well as having excellent management in critical areas.
Risk Grade 4 – This internal risk rating includes borrowers that have average leverage, liquidity
and debt service coverage ratios that compare favorably with industry standards. Risk Grade 5 – This internal risk rating includes borrowers that have average leverage, liquidity
and debt service coverage ratios and management that may be relatively inexperienced or untested. Overall financial ratios are considered acceptable.
Risk Grade 6 – This internal risk rating exhibits the same characteristics as Risk Grade 5, but
requiring added attention due to added factors such as (1) average or unfavorable earnings and cash flow coverage, (2) average or unfavorable debt service coverage ratio, (3) repayment is slow or repayment history is marginal, (4) reliant on liquidation of collateralized assets to repay debt, (5) substantial credit, collateral, or loan policy exceptions exist, and (6) no secondary sources of repayment are evident.
Risk Grade 7 – This risk grading includes borrowers that exhibit potential weaknesses/early
warning signals that deserve close attention. If left uncorrected, these potential weaknesses may result in the borrower being unable to meet its financial obligations at some future date.
Risk Grade 8 – This risk grading indicates that loans are in the category of performing loans
which are classified substandard. A substandard credit is inadequately protected by the current sound worthiness and paying capacity of the obligor or of the collateral pledged, if any. Loans so classified must have a well-defined weakness or weaknesses that jeopardize the liquidation of the debt. These credits are characterized by the distinct possibility that the Company will sustain some loss if deficiencies are not corrected. However, the distinct possibility of loss in these credits, while existing in the aggregate amount of substandard assets, does not necessarily exist in individual assets classified substandard.
Risk Grade 9 – Assets falling in this category bear all of the characteristics of those in the “8”
Substandard/Performing category with the added characteristic of meeting the criteria for being placed on a non-accrual status: the loan or extension of credit is 90 or more days past due; it becomes evident that the borrower cannot or will not make payments or meet the terms for the renewal of matured loan; anytime full repayment of principal and interest is not expected; if the borrower files bankruptcy and an approved plan of reorganization or liquidation of collateral is not anticipated to occur in the immediate future; and when foreclosure is initiated.
Risk Grade 10 – This risk grading includes loans that have all the weaknesses inherent in a
substandard classification with the added factor that the weaknesses are pronounced to the point where, on the basis of current facts, conditions and values, collection or liquidation in full is highly questionable or improbable. While the possibility of loss is extremely high, the existence of specific pending factors, which may work to the obligor’s advantage, warrants that the estimated loss be deferred until a more exact status is determined.
Risk Grade 11 – This risk grading is reserved for charge-offs. A loan in this category is
considered uncollectible and of such little value that its continuance as an active asset of the Company is not warranted. This classification does not mean that an asset has absolutely no
gonzalezs
Typewritten Text
Annual Report

- 21 -
recovery or salvage value, but simply that it is not practical or desirable to defer writing off all (or sometimes a portion) of a basically worthless asset, even though partial recovery may be effected in the future. Losses should be taken in the period in which they surface as uncollectible.
In monitoring credit quality trends in the context of assessing the appropriate level of the allowance for loan losses, the Company monitors portfolio credit quality by the weighted-average risk grade of each class of loan. Individual relationship managers review updated financial information for all loans risk graded 1 through 6 to recalculate the risk grade on at least an annual basis. When a loan has a calculated risk grade of 7, it is considered to be on management’s “watch list,” where a significant risk-modifying action is anticipated in the near term. When a loan has a calculated risk grade of 7 or higher, the loan is monitored on an on-going basis. The following table presents weighted average risk grades for all loans by class.
December 31, 2016 December 31, 2015 (Dollars in Thousands)
Weighted Average
Risk Grade Loans
Weighted Average Risk
Grade Loans Commercial Risk grades 1-6 3.51 $ 124,531 3.54 $ 133,426 Risk grade 7 7.00 97 7.00 536 Risk grade 8 8.00 2,398 8.00 7,580 Risk grade 9 9.00 3,301 9.00 4,025 Risk grade 10 10.00 201 10.00 - Risk grade 11 11.00 3 11.00 -
Total commercial $ 130,531 $ 145,567Agricultural Risk grades 1-6 1.48 $ 1,372
1.67 $ 1,479
Risk grade 7 7.00 - 7.00 - Risk grade 8 8.00 - 8.00 - Risk grade 9 9.00 - 9.00 - Risk grade 10 10.00 - 10.00 - Risk grade 11 11.00 - 11.00 -
Total agricultural $ 1,372 $ 1,479Consumer Risk grades 1-6 2.85 $ 61,903
2.71 $ 56,520
Risk grade 7 7.00 679 7.00 40 Risk grade 8 8.00 19 8.00 126 Risk grade 9 9.00 492 9.00 470 Risk grade 10 10.00 - 10.00 - Risk grade 11 11.00 - 11.00 -
Total consumer $ 63,093 $ 57,156Real estate Risk grades 1-6 4.50 $ 931,776
4.36 $ 828,412
Risk grade 7 7.00 2,468 7.00 36,689 Risk grade 8 8.00 19,128 8.00 21,987 Risk grade 9 9.00 45,272 9.00 51,728 Risk grade 10 10.00 - 10.00 - Risk grade 11 11.00 - 11.00 -
Total real estate $ 998,644 $ 938,816
gonzalezs
Typewritten Text
Annual Report

- 22 -
In assessing the general economic conditions in the State of Texas, management monitors and tracks the Texas Leading Index (“TLI”), which is produced by the Federal Reserve Bank of Dallas. The TLI is a single summary statistic that is designed to signal the likelihood of the Texas economy’s transition from expansion to recession and vice versa. Management believes this index provides a reliable indication of the direction of overall credit quality. The TLI is a composite of the following eight leading indicators: (i) Texas Value of the Dollar, (ii) U.S. Leading Index, (iii) real oil prices (iv) well permits, (v) initial claims for unemployment insurance, (vi) Texas Stock Index, (vii) Help-Wanted Index and (viii) average weekly hours worked in manufacturing. The TLI was 123.2 at December 31, 2016 and 123.1 at December 31, 2015. A higher TLI value implies more favorable economic conditions. Allowance for Loan Losses - The allowance for loan losses is a reserve established through a provision for loan losses charged to expense, which represents management’s best estimate of probable losses that have been incurred within the existing portfolio of loans. The allowance, in the judgment of management, is necessary to reserve for estimated loan losses and risks inherent in the loan portfolio. The Company’s allowance for loan loss methodology follows the accounting guidance set forth in U.S. generally accepted accounting principles and the Interagency Policy Statement on the Allowance for Loan and Lease Losses, which was jointly issued by the Company’s regulatory agencies. In that regard, the Company’s allowance for loan losses includes allowance allocations calculated in accordance with ASC Topic 310 Receivables and allowance allocations calculated in accordance with ASC Topic 450 Contingencies. Accordingly, the methodology is based on historical loss experience by type of credit and internal risk grade, specific homogeneous risk pools and specific loss allocations, with adjustments for current events and conditions. The Company’s process for determining the appropriate level of the allowance for loan losses is designed to account for credit deterioration as it occurs. The provision for loan losses reflects loan quality trends, including the levels of and trends related to non-accrual loans, past due loans, potential problem loans, criticized loans and net charge-offs or recoveries, among other factors. The provision for loan losses also reflects the totality of actions taken on all loans for a particular period. In other words, the amount of the provision reflects not only the necessary increases in the allowance for loan losses related to newly identified criticized loans, but it also reflects actions taken related to other loans including, among other things, any necessary increases or decreases in required allowances for specific loans or loan pools. The level of the allowance reflects management’s continuing evaluation of industry concentrations, specific credit risks, loan loss and recovery experience, current loan portfolio quality, present economic, political and regulatory conditions and unidentified losses inherent in the current loan portfolio. Portions of the allowance may be allocated for specific credits; however, the entire allowance is available for any credit that, in management’s judgment, should be charged off. While management utilizes its best judgment and information available, the ultimate determination of the appropriate level of the allowance is dependent upon a variety of factors beyond the Company’s control, including, among other things, the performance of the Company’s loan portfolio, the economy, changes in interest rates and the view of the regulatory authorities toward loan classifications. The Company monitors whether or not the allowance for loan loss allocation model, as a whole, calculates an appropriate level of allowance for loan losses that moves in direct correlation to the general macroeconomic and loan portfolio conditions the Company experiences over time.
The Company’s allowance for loan losses consists of three elements: (i) specific valuation allowances determined in accordance with ASC Topic 310 based on probable losses on specific loans; (ii) historical valuation allowances determined in accordance with ASC Topic 450 based on historical loan loss experience for similar loans with similar characteristics and trends, adjusted, as necessary, to reflect the impact of current conditions; and (iii) general valuation allowances determined in accordance with ASC Topic 450 based on general economic conditions and other risk factors both internal and external to the Company.
The allowances established for probable losses on specific loans are based on a regular analysis and evaluation of problem loans. Loans are classified based on an internal credit risk grading process that evaluates, among other things: (i) the obligor’s ability to repay; (ii) the underlying collateral, if any; and
gonzalezs
Typewritten Text
Annual Report

- 23 -
(iii) the economic environment and industry in which the borrower operates. When a loan has a calculated grade of 7 or higher, the loan is analyzed to determine whether the loan is impaired and, if impaired, the need to specifically allocate a portion of the allowance for loan losses to the loan. Specific valuation allowances are determined by analyzing the borrower’s ability to repay amounts owed, collateral deficiencies, the relative risk grade of the loan and economic conditions.
Historical valuation allowances are calculated based on the historical gross loss experience of specific types of loans and the internal risk grade of such loans at the time they were charged-off. The Company calculates historical gross loss ratios for pools of similar loans with similar characteristics based on the proportion of actual charge-offs experienced to the total population of loans in the pool. The historical gross loss ratios are periodically updated based on actual charge-off experience. A historical valuation allowance is established for each pool of similar loans based upon the product of the historical gross loss ratio and the total dollar amount of the loans in the pool. The Company’s pools of similar loans include similarly risk-graded groups of commercial loans, commercial real estate loans, consumer real estate loans and consumer and other loans.
The components of the general valuation allowance include the additional reserves allocated to specific loan portfolio segments as a result of applying an environmental risk adjustment factor to the base historical loss allocation. The environmental adjustment factor is based upon a more qualitative analysis of risk. The various risks that may be considered in the determination of the environmental adjustment factor include, among other things, (i) the effects of the national and local economy; (ii) the change in the nature and volume of the loan portfolio; (iii) changes in lending policies and underwriting compliance risk; (iv) management risk; (v) existence and change in credit concentrations; (vi) credit risk management; (vii) change in residential construction; and (viii) international risk.
The following table presents details of the allowance for loan losses, segregated by loan portfolio segment for the years ended December 31, 2016 and 2015. (Dollars in Thousands) Commercial Agricultural Real Estate Consumer/other Unallocated Total 2016 Historical Valuation Allowances $ 1,495 $ - $ 3,669 $ 1,472 $ - $ 6,636 Specific Valuation Allowances - - - - - - General Valuation Allowances: Effects of economy 85 - 915 10 7,890 8,900 Change in nature/volume loan portfolio 87 - 939 10 - 1,036 Change in lending policies/underwriting 96 - 1,033 11 - 1,140 Management risk 82 - 883 9 - 974 Existence/change in credit concentrations 83 - 892 9 - 984 Credit risk management 79 - 845 9 - 933 Change in residential construction/development 96 - 1,033 11 - 1,140 International risk 129 - 1,385 15 - 1,529
Total $ 2,232 $ - $ 11,594 $ 1,556 $ 7,890 $ 23,272 2015 Historical Valuation Allowances $ 2,428 $ - $ 5,967 $ 818 $ - $ 9,213 Specific Valuation Allowances - - - - - - General Valuation Allowances: Effects of economy 106 - 937 33 5,516 6,592 Change in nature/volume loan portfolio 119 - 1,051 37 - 1,207 Change in lending policies/underwriting 135 - 1,191 42 - 1,368 Management risk 178 - 1,577 56 - 1,811 Change in credit concentrations 109 - 964 34 - 1,107 Credit risk management 188 - 1,664 59 - 1,911 Change in residential construction/development 112 - 993 35 - 1,140 International risk 104 - 920 32 - 1,056
Total $ 3,479 $ - $ 15,264 $ 1,146 $ 5,516 $ 25,405
The Company monitors whether or not the allowance for loan loss allocation model, as a whole, calculates an appropriate level of allowance for loan losses that moves in direct correlation to the general macroeconomic and loan portfolio conditions the Company experiences over time. The Company analyzes trends in the components of the TLI, as well as any available information related to regional,
gonzalezs
Typewritten Text
Annual Report

- 24 -
national and international economic conditions and events and the impact such conditions and events may have on the Company and its customers. With regard to assessing loan portfolio conditions, the Company analyzes trends in weighted-average portfolio risk-grades, classified and non-performing loans and charge-off activity. In periods where general macroeconomic and loan portfolio conditions are in a deteriorating trend or remain at deteriorated levels, based on historical trends, the Company would expect to see the allowance for loan loss allocation model, as a whole, calculate higher levels of required allowances than in periods where general macroeconomic and loan portfolio conditions are in an improving trend or remain at an elevated level, based on historical trends. The following table details activity in the allowance for loan losses by portfolio segment for the years ended December 31, 2016 and 2015. Allocation of a portion of the allowance to one category of loans does not preclude its availability to absorb losses in other categories. (Dollars in Thousands) Commercial Agricultural Consumer Real Estate Unallocated Total 2016 Beginning balance $ 3,479 $ - $ 1,146 $ 15,264 $ 5,516 $ 25,405 Provision for loan losses 891 - 588 (3,853) 2,374 - Charge-offs (3,180) - (251) (1,022) - (4,453)Recoveries 1,042 - 73 1,205 - 2,320 Net charge-offs (2,138) - (178) 183 - (2,133)Ending balance $ 2,232 $ - $ 1,556 $ 11,594 $ 7,890 $ 23,272 Year-end amount allocated to: Loans individually evaluated for impairment $ 276 $ - $ - $ 1,519 $ - $ 1,795 Loans collectively evaluated for impairment 1,956 - 1,556 10,075 7,890 21,477 Ending balance $ 2,232 $ - $ 1,556 $ 11,594 $ 7,890 $ 23,272 2015
Beginning balance $ 2,612 $ 1 $ 997 $ 11,551 $ 13,276 $ 28,437 Provision for loan losses 2,572 (1) 239 4,950 (7,760) - Charge-offs (3,113) - (160) (1,525) - (4,798)Recoveries 1,408 - 70 288 - 1,766 Net charge-offs (1,705) - (90) (1,237) - (3,032)Ending balance $ 3,479 $ - $ 1,146 $ 15,264 $ 5,516 $ 25,405 Year-end amount allocated to: Loans individually evaluated for impairment $ 198 $ - $ - $ 2,654 $ - $ 2,852 Loans collectively evaluated for impairment 3,281 - 1,146 12,610 5,516 22,553 Ending balance $ 3,479 $ - $ 1,146 $ 15,264 $ 5,516 $ 25,405
The Company’s recorded investment in loans as of December 31, 2016 and 2015 related to each balance in the allowance for loan losses by portfolio segment and disaggregated on the basis of the Company’s impairment methodology follows:
(Dollars in Thousands) Commercial Agricultural Consumer Real Estate Total 2016 Loans individually evaluated for impairment $ 2,100 $ - $ - $ 38,654 $ 40,754 Loans collectively evaluated for impairment 128,431 1,372 63,093 959,990 1,152,886 Ending balance $ 130,531 $ 1,372 $ 63,093 $ 998,644 $ 1,193,640 2015 Loans individually evaluated for impairment $ 3,221 $ - $ - $ 43,082 $ 46,303 Loans collectively evaluated for impairment 142,346 1,479 57,156 895,734 1,096,715 Ending balance $ 145,567 $ 1,479 $ 57,156 $ 938,816 $ 1,143,018
gonzalezs
Typewritten Text
Annual Report
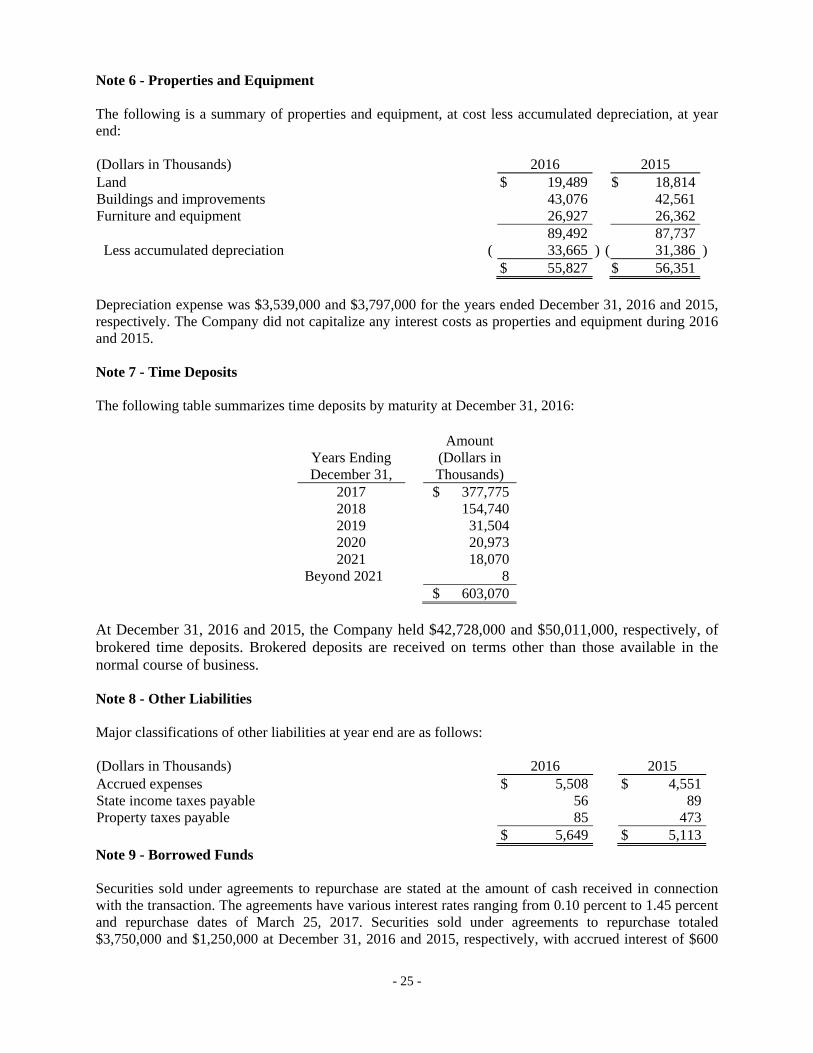
- 25 -
Note 6 - Properties and Equipment The following is a summary of properties and equipment, at cost less accumulated depreciation, at year end: (Dollars in Thousands) 2016 2015 Land $ 19,489 $ 18,814 Buildings and improvements 43,076 42,561 Furniture and equipment 26,927 26,362 89,492 87,737 Less accumulated depreciation ( 33,665 ) ( 31,386 ) $ 55,827 $ 56,351 Depreciation expense was $3,539,000 and $3,797,000 for the years ended December 31, 2016 and 2015, respectively. The Company did not capitalize any interest costs as properties and equipment during 2016 and 2015. Note 7 - Time Deposits The following table summarizes time deposits by maturity at December 31, 2016:
Years Ending December 31,
Amount (Dollars in Thousands)
2017 $ 377,7752018 154,7402019 31,5042020 20,9732021 18,070
Beyond 2021 8 $ 603,070
At December 31, 2016 and 2015, the Company held $42,728,000 and $50,011,000, respectively, of brokered time deposits. Brokered deposits are received on terms other than those available in the normal course of business. Note 8 - Other Liabilities Major classifications of other liabilities at year end are as follows: (Dollars in Thousands) 2016 2015 Accrued expenses $ 5,508 $ 4,551 State income taxes payable 56 89 Property taxes payable 85 473 $ 5,649 $ 5,113 Note 9 - Borrowed Funds Securities sold under agreements to repurchase are stated at the amount of cash received in connection with the transaction. The agreements have various interest rates ranging from 0.10 percent to 1.45 percent and repurchase dates of March 25, 2017. Securities sold under agreements to repurchase totaled $3,750,000 and $1,250,000 at December 31, 2016 and 2015, respectively, with accrued interest of $600
gonzalezs
Typewritten Text
Annual Report

- 26 -
and $300, during 2016 and 2015, respectively. The securities sold under the agreements are collateralized by a security interest in securities available for sale. The following are available lines of credit the Company has with other financial institutions:
Financial Institution
(Dollars in Thousands)
Line of Credit
Amount
Amount
Available
Interest
Rate
Expiration
Date Federal Home Loan Bank of Dallas $ 474,354 $ 384,354 Variable None The Independent Bankers Bank 15,000 15,000 Variable None Federal Reserve Bank 118,829 118,829 Variable None $ 608,183 $ 518,183 The Company has received advances in the amount of $90,000,000 from Federal Home Loan Bank of Dallas (“FHLB”) under provisions of its line of credit facility. The advances mature September 12, 2017 through October 14, 2020 with interest due quarterly at rates of 1.331 percent through 3.891 percent. The line of credit with FHLB is collateralized by a blanket floating lien on certain mortgage loans. The line of credit with The Independent Bankers Bank is unsecured. The line of credit with Federal Reserve Bank (“FRB”) is collateralized by a blanket floating lien on certain commercial and agriculture loans. The Company, through a private placement, has issued a total of $10 million (10,000 shares with a liquidation amount of $1,000 per security) of Floating Rate Cumulative Trust Preferred Securities (the “Trust Preferred Securities”). The Trust Preferred Securities were issued through newly-formed, wholly-owned subsidiaries, Lone Star National Capital Trust II (redeemed June 2016), Lone Star National Capital Trust III (redeemed October 2016) and Lone Star National Capital Trust IV, which are special purpose Delaware statutory business trusts (“Trusts”). Unamortized debt issuance costs related to the Trusts, which are included in other assets, totaled $310,000 and $837,000 at December 31, 2016 and 2015, respectively. The Trusts invested the total proceeds from the equity contributions and the securities sale in the Floating Rate Junior Subordinated Deferrable Interest Debentures (the “Debentures”) issued by the Company. The net proceeds from the sale of the Debentures were used for general corporate purposes, including capital investments in the Bank. The Trust Preferred Securities issued by the Trusts rank senior to the common securities. The obligation of the Company under the trust agreements and the guarantees relating to the Trusts constitute the full and unconditional guarantee by the Company of the obligations of the Trusts with respect to the Trust Preferred Securities and rank subordinate and junior in right to payment to all other liabilities. The Debentures are subject to mandatory redemption pursuant to the terms of the trust agreements. The Company has the option to redeem the Debentures, in whole or in part, on or after any interest payment date after September 30, 2008 for the 2003 issue, April 7, 2009 for the 2004 issue and June 30, 2012 for the 2007 issue. In the event the Debentures are redeemed, a like amount of Trust Preferred Securities will be redeemed at the redemption price of $1,000 per security, plus accrued interest to the date of redemption. The table below summarizes the outstanding preferred securities issued by the Trusts as of December 31, 2016 and 2015.
gonzalezs
Typewritten Text
Annual Report

- 27 -
Trust name: Lone Star National Capital Trust II Issuance date: September 26, 2003 Amount: $10,000,000 Stated maturity: September 30, 2033 Floating interest rate: 2.95% per annum over the Three-Month LIBOR Rate
Interest payable/Distribution dates: Redemption date:
Quarterly/March 30, June 30, September 30, and December 30 June 30, 2016
Trust name: Lone Star National Capital Trust III Issuance date: March 25, 2004 Amount: $7,000,000 Stated maturity: April 6, 2034 Floating interest rate: 2.75% per annum over the Three-Month LIBOR Rate
Interest payable/Distribution dates: Redemption date:
Quarterly/January 7, April 7, July 7, and October 7 October 7, 2016
Trust name: Lone Star National Capital Trust IV Issuance date: June 21, 2007 Amount: $10,000,000 Stated maturity: September 15, 2037 Floating interest rate: 1.57% per annum over the Three-Month LIBOR Rate
Interest payable/Distribution dates: Quarterly/March 15, June 15, September 15, and December 15
Despite the fact that the accounts of the capital trusts are not included in the Company's consolidated financial statements, the Trust Preferred Securities issued by this these subsidiary trusts are included in the Tier 1 capital of Lone Star National Bancshares-Texas, Inc. for regulatory capital purposes. Federal Reserve Board rules limit the aggregate amount of restricted core capital elements (which includes trust preferred securities, among other things) that may be included in the Tier 1 capital of most bank holding companies to 25 percent of all core capital elements, including restricted core capital elements, net of goodwill less any associated deferred tax liability. The scheduled maturities of borrowings at December 31, 2016, were as follows:
Within After One After Two After Three After Four After One But Within But Within But Within But Within Five
(Dollars in Thousands) Year Two Years Three Years Four Years Five Years Years Total Federal Home Loan Bank borrowings $ 65,000 $ 10,000 $ - $ 15,000 $ - $ - $ 90,000Securities sold under agreements to repurchase 3,750 - - - - - 3,750 Trust preferred subordinated debentures - - - - - 10,310 10,310Total borrowings $ 68,750 $ 10,000 $ - $ 15,000 $ - $ 10,310 $ 104,060
gonzalezs
Typewritten Text
Annual Report

- 28 -
Note 10 - Federal and State Income Taxes The components of the provision for income taxes consist of the following:
(Dollars in Thousands) 2016 2015 Current income tax expense Federal $ 5,381 $ 6,527 State 42 96 Total current income tax expense 5,423 6,623Federal deferred income tax benefit ( 700 ) ( 2,485 ) Total income tax expense $ 4,723 $ 4,138
The following is a reconciliation between the amount of reported income tax expense and the amount computed by multiplying the income before income tax expense by the federal statutory rate: (Dollars in Thousands) 2016 2015 Tax at federal statutory rate $ 6,473 $ 5,484Additions (reductions) Tax-exempt income ( 1,983 ) ( 1,585 ) Non-deductible expenses 191 140 State income tax, net of federal income tax effect 27 62 Other, net 15 37 Total income tax expense $ 4,723 $ 4,138 The net deferred tax asset included in the accompanying consolidated balance sheets is comprised of the following deferred tax assets and liabilities: (Dollars in Thousands) 2016 2015 Deferred tax liability Properties and equipment Mortgage servicing rights Net unrealized gain on securities available for sale
$ 1,029 193
328
$ 1,407 125 2,858
Total deferred tax liability 1,550 4,390 Deferred tax asset Deferred loan fees 823 613 Loans held for sale 70 79 Allowance for loan losses 8,145 8,892 Allowance for off balance sheet losses 228 301 LHFS repurchase reserve 12 9 Interest applied to principal 3,587 2,840 Deferred compensation 605 246 Other real estate 1,764 1,864 Total deferred tax asset before valuation allowance 15,234 14,844 Valuation allowance - - Total deferred tax asset 15,234 14,844 Net deferred tax asset $ 13,684 $ 10,454 No valuation allowance for deferred tax assets was recorded at December 31, 2016 and 2015 as management believes it is more likely than not that all of the deferred tax assets will be realized because
gonzalezs
Typewritten Text
Annual Report
- 29 -
they were supported by recoverable taxes paid in prior years. There were no unrecognized tax benefits during any of the reported periods. The Company files income tax returns in the U.S. federal jurisdiction. The Company is no longer subject to U.S. federal income tax examinations by tax authorities for years before 2013. The Company also files an income tax return with the Texas Comptroller of Public Accounts and is no longer subject to state tax examination by tax authorities for years before 2012. Note 11 - Concentrations of Credit Risk Concentrations of credit risk arise when a number of customers are engaged in similar business activities or activities in the same geographic region, or have similar economic features that would cause their ability to meet contractual obligations to be affected similarly by changes in economic conditions. A significant portion of the Company’s investments are in securities of the U.S. Government and its agencies and corporations. The Company’s lending activities are conducted primarily with customers in the Rio Grande Valley of Texas and San Antonio, Texas. The concentrations of credit by type of loan are set forth in Note 5. Based on the nature of the banking business, management does not consider any of these concentrations unusual. Note 12 - Supplemental Disclosures Supplemental disclosures of cash flow information Year Ended December 31, 2016 2015 (Dollars in Thousands) Federal and State income taxes paid $ 5,774 $ 6,385 Interest paid $ 11,628 $ 12,613 Supplemental schedule of non-cash investing and financing activities (Dollars in Thousands) Foreclosures and repossession in satisfaction of loans receivable $ 6,233 $ 3,689 Financing provided for sales of foreclosed and repossessed assets $ 2,010 $ 2,330 Note 13 - Fair Value Measurement ASC Topic 820 Fair Value Measurement defines fair value, establishes a framework for measuring fair value under GAAP and enhances disclosures about fair value measurements. Fair value is defined under ASC Topic 820 as the price that would be received for an asset or paid to transfer a liability (an exit price) in the principal market for the asset or liability in an orderly transaction between market participants on the measurement date. In estimating fair value, the Company utilizes valuation techniques that are consistent with the market approach, the income approach and/or the cost approach. Such valuation techniques are consistently applied. Inputs to valuation techniques include the assumptions that market participants would use in pricing an asset or liability. ASC Topic 820 establishes a fair value hierarchy for valuation inputs that gives the highest priority to quoted prices in active markets for identical assets or liabilities and the lowest priority to unobservable inputs. The fair value hierarchy is as follows: Level 1 Inputs - Unadjusted quoted prices in active markets for identical assets or liabilities that the reporting entity has the ability to access at the measurement date.
gonzalezs
Typewritten Text
Annual Report

- 30 -
Level 2 Inputs - Inputs other than quoted prices included in Level 1 that are observable for the asset or liability, either directly or indirectly. These might include quoted prices for similar assets or liabilities in active markets, quoted prices for identical or similar assets or liabilities in markets that are not active, inputs other than quoted prices that are observable for the asset or liability (such as interest rates, volatilities, prepayment speeds, credit risks, etc.) or inputs that are derived principally from or corroborated by market data by correlation or other means. Level 3 Inputs - Unobservable inputs for determining the fair values of assets or liabilities that reflect an entity’s own assumptions about the assumptions that market participants would use in pricing the assets or liabilities. In general, fair value is based upon quoted market prices, where available. If such quoted market prices are not available, fair value is based upon internally developed models that primarily use, as inputs, observable market-based parameters. Valuation adjustments may be made to ensure that financial instruments are recorded at fair value. These adjustments may include amounts to reflect counterparty credit quality and the Company’s creditworthiness, among other things, as well as unobservable parameters. Any such valuation adjustments are applied consistently over time. The Company’s valuation methodologies may produce a fair value calculation that may not be indicative of net realizable value or reflective of future fair values. While management believes the Company's valuation methodologies are appropriate and consistent with other market participants, the use of different methodologies or assumptions to determine the fair value of certain financial instruments could result in a different estimate of fair value at the reporting date. Furthermore, the reported fair value amounts have not been comprehensively revalued since the presentation dates, and therefore, estimates of fair value after the balance sheet date may differ significantly from the amounts presented herein. A more detailed description of the valuation methodologies used for assets and liabilities measured at fair value is set forth below. Transfers between levels of the fair value hierarchy are recognized on the actual date of the event or circumstances that caused the transfer, which generally coincides with the Company's monthly and/or quarterly valuation process. Financial assets and financial liabilities measured at fair value on a recurring basis include the following:
Securities Available for Sale. U.S. Treasury securities are reported at fair value utilizing Level 1 inputs. Other securities classified as available for sale are reported at fair value utilizing Level 2 inputs. For these securities, the Company obtains fair value measurements from an independent pricing service. The fair value measurements consider observable data that may include dealer quotes, market spreads, cash flows, the U.S. Treasury yield curve, live trading levels, trade execution data, market consensus prepayment speeds, credit information and the bond’s terms and conditions, among other things.
Trading Securities. U.S. Treasury securities and exchange-listed common stock are reported at fair value utilizing Level 1 inputs. Other securities classified as trading are reported at fair value utilizing Level 2 inputs in the same manner as described above for securities available for sale.
Derivatives. Derivatives are reported at fair value utilizing Level 2 inputs. The Company’s risk management activities do not presently include entering into derivative contracts to manage interest rate risk. In connection with single family mortgage loan originations, the Company enters into commitments with customers to extend mortgage loans and forward sales commitments for individual loans. The Company has identified these as derivative financial instruments and accordingly records these loan origination and sales commitments at estimated fair market value. As of December 31, 2016, the Company has not identified any other financial instruments as derivatives.
gonzalezs
Typewritten Text
Annual Report
- 31 -
The following table summarizes the securities available for sale which were the financial assets measured at fair value on a recurring basis at December 31, 2016, segregated by the level of valuation inputs within the fair value hierarchy utilized to measure fair value: (Dollars in Thousands)
Level 1 Inputs $ 47,902Level 2 Inputs 644,297Level 3 Inputs -Total fair value $ 692,199
Certain financial assets and financial liabilities are measured at fair value on a nonrecurring basis; that is, the instruments are not measured at fair value on an ongoing basis but are subject to fair value adjustments in certain circumstances (for example, when there is evidence of impairment). Financial assets and liabilities measured at fair value on a non-recurring basis include the following:
Impaired Loans. Certain impaired loans are reported at the fair value of the underlying collateral if repayment is expected solely from the collateral. Collateral values are estimated using Level 2 inputs based on observable market data or Level 3 inputs based on customized discounting criteria. During 2016, one impaired loan was remeasured and reported at fair value through a specific valuation allowance allocation of the allowance for possible loan losses based upon the fair value of the underlying collateral. Impaired loan with a carrying value of $201,000 was reduced by specific valuation allowance allocation totaling $201,000 to a total reported fair value of $0 based on collateral valuations utilizing Level 2 valuation inputs.
ASC Topic 825, Financial Instruments, requires disclosure of the fair value of financial assets and financial liabilities, including those financial assets and financial liabilities that are not measured and reported at fair value on a recurring basis or non-recurring basis. The methodologies for estimating the fair value of financial assets and financial liabilities that are measured at fair value on a recurring or non-recurring basis are discussed above. The estimated fair value approximates carrying value for cash and cash equivalents, accrued interest and the cash surrender value of life insurance policies. The methodologies for other financial assets and financial liabilities are discussed below.
Loans. The estimated fair value approximates carrying value for variable-rate loans that reprice frequently and with no significant change in credit risk. The fair value of fixed-rate loans and variable-rate loans which reprice on an infrequent basis is estimated by discounting future cash flows using the current interest rates at which similar loans with similar terms would be made to borrowers of similar credit quality. An overall valuation adjustment is made for specific credit risks as well as general portfolio credit risk.
Deposits. The estimated fair value approximates carrying value for demand deposits. The fair value of fixed-rate deposit liabilities with defined maturities is estimated by discounting future cash flows using the interest rates currently offered for deposits of similar remaining maturities. The estimated fair value of deposits does not take into account the value of the Company’s long-term relationships with depositors, commonly known as core deposit intangibles, which are separate intangible assets, and not considered financial instruments. Nonetheless, the Company would likely realize a core deposit premium if its deposit portfolio were sold in the principal market for such deposits.
Borrowed Funds. The estimated fair value approximates carrying value for short-term borrowings. The fair value of long-term fixed-rate borrowings is estimated using quoted market prices, if available, or by discounting future cash flows using current interest rates for similar financial instruments. The estimated fair value approximates carrying value for variable-rate junior subordinated deferrable interest debentures that reprice quarterly.
gonzalezs
Typewritten Text
Annual Report

- 32 -
Loan Commitments, Standby and Commercial Letters of Credit. The Company’s lending commitments have variable interest rates and “escape” clauses if the customer’s credit quality deteriorates. Therefore, the fair values of these items are not significant and are not included in the following table. The estimated fair values of the Company’s financial instruments at December 31, 2016 are as follows: Carrying Fair
(Dollars in Thousands) Amount Value
Financial assets Cash and due from banks $ 38,917 $ 38,917 Due from banks-interest bearing 104,755 104,755 Investment securities 692,199 692,199 Loans Accrued interest receivable Loans held for sale
1,168,010 7,940 2,728
1,176,7957,9402,477
Financial liabilities Deposits 1,821,140 1,568,667 Repurchase agreements/borrowed funds Subordinated debentures Accrued interest payable
93,750 10,310
920
94,90510,310
920 ASC Topic 825 permits the Company to choose to measure eligible items at fair value at specified election dates. Unrealized gains and losses on items for which the fair value measurement option has been elected are reported in earnings at each subsequent reporting date. The fair value option (i) may be applied instrument by instrument, with certain exceptions, thus the Company may record identical financial assets and liabilities at fair value or by another measurement basis permitted under generally accepted accounting principles, (ii) is irrevocable (unless a new election date occurs) and (iii) is applied only to entire instruments and not to portions of instruments. Unrealized gains and losses on items for which the fair value measurement option has been elected must be reported in earnings at each subsequent reporting date. During the reported periods, the Company had no financial instruments measured at fair value under the fair value measurement option. Note 14 - Related-Party Transactions The Company has entered into transactions with its officers, directors and significant stockholders. Such transactions were made in the ordinary course of business on substantially the same terms and conditions, including interest rates and collateral, as those prevailing at the same time for comparable transactions with other customers and did not, in the opinion of management, involve more than normal credit risk or present unfavorable features. Activity in related party loans is presented in the following table: (Dollars in Thousands) 2016 2015 Balance at beginning of year $ 26,010 $ 29,182 Additions Advances 1,445 5,775 Changes to related status 307 25 Reductions Collections ( 9,091 ) ( 8,972 )Balance at end of year $ 18,671 $ 26,010
gonzalezs
Typewritten Text
Annual Report

- 33 -
As of December 31, 2016 and 2015, the total amount of deposits of the Company’s officers, directors and significant stockholders were $62,822,000 and $43,396,000, respectively. During 2016, the Company entered into construction contracts, totaling $249,000 with one of its principal stockholders. The contracts are for the construction and improvements of branch facilities. All payments made for construction contracts during 2016 were contracted during the year. Payments in 2015 totaled $89,000. The Company leases various facilities under operating leases with related parties that expire at various dates through July 2020 with some containing provisions that allow renewal at similar terms. Total rental expense in 2016 and 2015 for all operating leases with related parties was approximately $471,000 and $454,000, respectively. The following is a schedule, by year, of future minimum lease payments under operating leases with related parties as of December 31, 2016 that have initial or remaining lease terms in excess of one year:
Year ended December 31,
2017 $ 119,0002018 102,0002019 89,0002020 43,000
The Company engaged in other related party transactions with an aggregate amount of $650,000 during 2016. These transactions included payments to related parties for office supplies, printing, travel, maintenance and repair of other real estate owned property and the Company’s marketing program. Note 15 - Employee Benefits The Company has an employee stock ownership plan containing Internal Revenue Code Section 401(k) provisions in effect for substantially all employees. An employee becomes a participant after completing three months of service provided he or she has attained age 18. The Company makes a discretionary matching contribution up to a certain percentage of contributions made by the participant. Additional contributions are made at the discretion of the Board of Directors. Employee benefits include $565,000 and $527,000 for the employee stock ownership plan for 2016 and 2015, respectively.
Note 16 - Share-Based Payments The Company has granted stock options providing for the purchase of common stock by certain key employees and directors under option plans approved by the stockholders. During 2015, the Company authorized the issuance of a Stock Option Plan for 500,000 shares of common stock at an option price not lower than the fair value at day of grant. Any forfeiture will be terminated. The options have a vesting period of five years.
gonzalezs
Typewritten Text
Annual Report

- 34 -
A summary of the status of the Company’s stock option plan as of December 31, 2016 and 2015, and changes during the years ended on those dates are presented below:
Year Ended December 31, 2016 2015 Weighted Weighted Shares Average Shares Average Underlying Exercise Underlying Exercise Options Price Options Price
Outstanding at beginning of year 268,311 $ 41.53 116,811 $ 36.69Granted - - 161,000 45.00Exercised ( 14,500 ) 36.00 ( 4,500 ) 36.00Expired/forfeited ( 4,000 ) 45.00 ( 5,000 ) 45.00Outstanding at end of year 249,811 $ 41.82 268,311 $ 41.53Options exercisable at end of year 97,811 $ 36.82 112,311 $ 36.72 Range of exercise prices $35.50 - $45.00 $35.50 - $45.00Weighted average remaining contractual life 6.88 years 7.51 years
The following table summarizes information about stock options outstanding at December 31, 2016 and 2015:
Year Ended December 31,
2016 2015 Weighted Average Exercise
Price
Shares
Underlying Options
Shares
Underlying Options
$35.50 $36.00 $45.00
84,188 -
165,623
84,188 14,500
169,623
249,811 268,311 The Company recognizes the cost of the unvested portion of options issued in prior years using the Black-Scholes-Merton option pricing model. This option pricing model relies on highly subjective and variable assumptions, including the expected life of the options; the price volatility of the underlying stock; and the rate of return a prudent investor could expect in a stable market. This fair value is then amortized on a straight-line basis over the requisite service periods of the awards, which is generally the vesting period. The forfeiture rate utilized is based on the Company’s historical experience with respect to stock options issued in prior periods. During 2008, the Stock Appreciation Right Bonus Plan was established to provide a means through which the Company can attract and retain able individual to serve as employees, directors or consultants of the Company and to provide a means whereby employees may be awarded for their contributions to the Company. The right shall vest in a series of five equal yearly installments on each anniversary of the date of grant, however an award shall not be vested and/or exercisable prior to the date on which the holder has completed two continuous years of service.
gonzalezs
Typewritten Text
Annual Report

- 35 -
Outstanding rights at December 31, 2016:
Date of Award
Number of Appreciation
Rights
Stock Value On Grant
Date
Value at December 31,
2016 2009 1,938 $ 40.00 $ 28,578 2011 65,812 35.50 1,266,881 2013 7,500 38.25 123,750 2014 17,500 43.25 201,250 2015 21,000 43.25 241,500
113,750 $ 1,861,959 Total share-based compensation cost was $973,000 in 2016 and ($17,000) in 2015, net of tax benefit (expense) of $524,000 and ($9,000), respectively. Note 17 - Commitments and Contingent Liabilities In the normal course of business, the Company makes various commitments and incurs certain contingent liabilities that are not presented in the accompanying financial statements. These commitments and contingent liabilities include commitments to extend credit, standby letters of credit and credit card guarantees. Commitments under standby letters of credit totaled $5,631,000 and $5,398,000 at December 31, 2016 and 2015, respectively. Commitments to fund loans were approximately $115,764,000 and $110,176,000 at December 31, 2016 and 2015, respectively. At December 31, 2016 and 2015, the Company had guarantees on credit cards to its customers totaling $819,000 and $713,000, respectively. Commitments to extend credit are agreements to lend to a customer as long as there is no violation of any condition established in the contract. Commitments generally have fixed expiration dates or other termination clauses and may require payment of a fee. The Company evaluates each customer’s creditworthiness on a case by case basis. The amount of the collateral obtained, if it is deemed necessary by the Company upon extension of credit, is based on management’s credit evaluation of the counterparty. Collateral held varies but may include certificates of deposit, accounts receivable, inventory, equipment and real estate. Standby letters of credit and financial guarantees written are a conditional commitment issued by the Company to guarantee the performance of a customer to a third party. The credit risk involved in issuing letters of credit is essentially the same as that involved in extending loan facilities to customers. The Company holds various types of collateral supporting those commitments for which collateral is deemed necessary, which may include certificates of deposit, accounts receivable, inventory, equipment and real estate. The Company did not incur any loss on its commitments in 2016 or 2015. Management does not anticipate any material losses as a result of its commitments and contingent liabilities. The Company has entered into long-term agreements for certain data processing and computer software products and services. The data processing and computer software contracts provide for minimum monthly payments and additional charges based upon volume. These agreements expire in various years through 2020 and contain provisions that allow renewal at similar terms. Total expense from these agreements amounted to $2,671,000 and $2,694,000 in 2016 and 2015, respectively.
gonzalezs
Typewritten Text
Annual Report

- 36 -
The following is a schedule by year of future minimum payments required under these agreements:
Year ended December 31,
2017 $ 2,759,0002018 1,580,0002019 976,0002020 403,000
The Company leases various facilities under operating leases expiring at various dates through October 2023 with some containing provisions that allow renewal at similar terms. Total rental expense in 2016 and 2015 for all operating leases was approximately $950,000 and $1,020,000, respectively. The following is a schedule by year of future minimum lease payments for each of the next five years under operating leases as of December 31, 2016 that have initial or remaining lease terms in excess of one year:
Year ended December 31,
2017 $ 534,0002018 591,0002019 505,0002020 330,0002021 250,000
The Company is a defendant in legal actions arising in connection with its ordinary course of business that are in various stages of litigation and investigation by the Company and its legal counsel. After reviewing with counsel the actions pending involving the Company, management believes that the ultimate resolution of these matters will not materially affect the Company’s financial position. Note 18 - Earnings Per Share Basic net income per share (“EPS”) was computed by dividing net income available to common stockholders by the weighted average number of common shares outstanding during the year. Diluted net income per share was computed by dividing net income by the weighted average number of common shares and common stock equivalents outstanding during the year. The diluted net income per share computations include the effects of common stock equivalents applicable to stock option contracts and are determined using the treasury stock method. The table below presents a reconciliation of basic and diluted net income per share computations.
Year ended December 31, (Dollars in Thousands, Except Per Share Data) 2016 2015 Net income available to common shareholders $ 13,814 $ 11,626Weighted average number of common shares outstanding used in basic EPS calculation 5,905,280 5,984,255Add assumed exercise of dilutive securities outstanding - stock options 29,600 17,492Weighted average number of common shares outstanding used in diluted basic EPS calculation 5,934,880 6,001,747Basic EPS $ 2.34 $ 1.94Diluted EPS $ 2.33 $ 1.94
gonzalezs
Typewritten Text
Annual Report

- 37 -
Note 19 - Regulatory Matters The Bank, as a National Bank, is subject to the dividend restrictions set forth by the Office of the Comptroller of the Currency (the “OCC”). Under such restrictions, the Bank may not, without the prior approval of the OCC, declare dividends in excess of the current year’s earnings (as defined) plus the retained earnings (as defined) from the prior two years or pay any dividend which would cause the Bank to become undercapitalized. The Company is subject to various regulatory capital requirements administered by federal banking agencies. Failure to meet the minimum regulatory capital requirements can initiate certain mandatory and possible additional discretionary actions by regulators that if undertaken, could have a direct material effect on the Company and the consolidated financial statements. Under the regulatory capital adequacy guidelines and the regulatory framework for prompt corrective action, the Company must meet specific capital guidelines involving quantitative measures of the Company’s assets, liabilities, and certain off-balance-sheet items as calculated under regulatory accounting practices. The Company’s capital amounts and classifications under the prompt corrective action guidelines are also subject to qualitative judgments by the regulators about components, risk weightings and other factors. Quantitative measures established by regulation to ensure capital adequacy require the Company to maintain minimum amounts and ratios of total risk-based capital and Tier I capital to risk-weighted assets (as defined in the regulations), and Tier I capital to adjusted total assets (as defined). Management believes, as of December 31, 2016, that the Company meets all the capital adequacy requirements to which it is subject. As of December 31, 2016, the most recent notification from the regulators categorized the Company and the Bank as well capitalized under the regulatory framework for prompt corrective action. To be categorized as well capitalized, the Company and the Bank have to maintain minimum or greater total risk-based, Tier I risk-based, and Tier I leverage ratios as disclosed in the table below. There are no conditions or events since the most recent notification that management believes have changed the Bank’s prompt corrective action category.
gonzalezs
Typewritten Text
Annual Report

- 38 -
To Be Well Capitalized For Capital Under Prompt Actual Adequacy Purposes Action Provisions (Dollars in Thousands) Amount Ratio Amount Ratio Amount Ratio Lone Star National Bancshares-Texas, Inc. December 31, 2016 Total Capital (to Risk-Weighted Assets) $ 269,266 18.70% $ 115,196 8.0% $ 143,995 10.0% Tier 1 Capital (to Risk-Weighted Assets) $ 251,194 17.44% $ 86,397 6.0% $ 115,196 8.0% Tier 1 Capital (to Average Assets) $ 251,194 11.71% $ 85,798 4.0% $ 107,247 5.0% December 31, 2015 Total Capital (to Risk-Weighted Assets) $ 284,580 21.13% $ 80,814 6.0% $ 107,752 8.0% Tier 1 Capital (to Risk-Weighted Assets) $ 267,627 19.87% $ 60,610 4.5% $ 87,548 6.5% Tier 1 Capital (to Average Assets) $ 267,627 12.42% $ 86,190 4.0% $ 107,738 5.0% Lone Star National Bank December 31, 2016 Total Capital (to Risk-Weighted Assets) $ 266,540 18.62% $ 114,507 8.0% $ 143,133 10.0% Tier 1 Capital (to Risk-Weighted Assets) $ 248,574 17.37% $ 85,880 6.0% $ 114,507 8.0% Tier 1 Capital (to Average Assets) $ 248,574 11.67% $ 85,207 4.0% $ 106,509 5.0% December 31, 2015 Total Capital (to Risk-Weighted Assets) $ 260,409 19.48% $ 80,206 6.0% $ 106,941 8.0% Tier 1 Capital (to Risk-Weighted Assets) $ 243,582 18.22% $ 60,154 4.5% $ 86,889 6.5% Tier 1 Capital (to Average Assets) $ 243,582 11.37% $ 85,698 4.0% $ 107,122 5.0%
During 2012 the Bank agreed to the issuance of a Consent Order by the OCC. The primary focus of the order is to strengthen the Bank’s controls and procedures over compliance with the Bank Secrecy Act. Compliance with the order requires enhanced due diligence in managing risk inherent with the Bank’s customer base and with foreign correspondent relationships. The Bank is reviewing and revising, where appropriate, its controls to ensure compliance with reporting required under the act. Management believes the Bank is on track to be in full compliance with the order. The United States Department of the Treasury Financial Crimes Enforcement Network (“FinCEN”) staff has been conducting a non-public investigation, which is focused principally on the Bank’s compliance with the Bank Secrecy Act and the Bank’s foreign correspondent banking relationship with Banco Azteca, which terminated in 2012. The Bank has fully cooperated with FinCEN, and agreed to a tolling agreement with FINCEN in order for the agency to complete its investigation. Currently, there has been no ongoing dialogue by staff with FinCEN concerning these issues. The Bank does not believe that the issues raised by FinCEN affect the material adequacy of the Bank’s consolidated financial statements. At this time, the Bank cannot predict the outcome of this investigation, nor can it predict the timing associated with any such conclusion or resolution. Note 20 - Recent Accounting Pronouncements
ASU 2015-01, “Income Statement – Extraordinary and Unusual Items (Subtopic 225-20) – Simplifying Income Statement Presentation by Eliminating the Concept of Extraordinary Items.” ASU 2015-01 eliminates from U.S. GAAP the concept of extraordinary items, which, among other things, required an entity to segregate extraordinary items considered to be unusual and infrequent from the results of ordinary operations and show the item separately in the income statement, net of tax, after income from continuing operations. ASU 2015-01 became effective for us on January 1, 2016 and did not have a significant impact on our financial statements.
gonzalezs
Typewritten Text
Annual Report
- 39 -
ASU 2015-03, “Interest-Imputation of Interest (Subtopic 835-30): Simplifying the Presentation of Debt Issuance Cost.” ASU 2015-03 requires that debt issuance cost related to a recognized debt liability be presented in the balance sheet as a direct deduction from the carrying amount of that debt liability, consistent with debt discounts. The recognition and measurement guidance for debt issuance cost are not affected by the amendments in ASU 2015-03. ASU 2015-03 was effective for the Company on January 1, 2016 and did not have a significant impact on the Company’s financial statements.
ASU 2016-02,“Leases (Topic 842).” ASU 2016-02 will, among other things, require lessees to
recognize a lease liability, which is a lessee's obligation to make lease payments arising from a lease, measured on a discounted basis; and a right-of-use asset, which is an asset that represents the lessee’s right to use, or control the use of, a specified asset for the lease term. ASU 2016-02 does not significantly change lease accounting requirements applicable to lessors; however, certain changes were made to align, where necessary, lessor accounting with the lessee accounting model and ASC Topic 606, “Revenue from Contracts with Customers.” ASU 2016-02 will be effective for us on January 1, 2020 and will require transition using a modified retrospective approach for leases existing at, or entered into after, the beginning of the earliest comparative period presented in the financial statements. We are currently evaluating the potential impact of ASU 2016-02 on our financial statements.
ASU 2016-09, “Compensation - Stock Compensation (Topic 718): Improvements to Employee Share-
Based Payment Accounting.” Under ASU 2016-09 all excess tax benefits and tax deficiencies related to share-based payment awards should be recognized as income tax expense or benefit in the income statement during the period in which they occur. Previously, such amounts were recorded in the pool of excess tax benefits included in additional paid-in capital, if such pool was available. Because excess tax benefits are no longer recognized in additional paid-in capital, the assumed proceeds from applying the treasury stock method when computing earnings per share should exclude the amount of excess tax benefits that would have previously been recognized in additional paid-in capital. Additionally, excess tax benefits should be classified along with other income tax cash flows as an operating activity rather than a financing activity, as was previously the case. ASU 2016-09 also provides that an entity can make an entity-wide accounting policy election to either estimate the number of awards that are expected to vest (current GAAP) or account for forfeitures when they occur. ASU 2016-09 changes the threshold to qualify for equity classification (rather than as a liability) to permit withholding up to the maximum statutory tax rates (rather than the minimum as was previously the case) in the applicable jurisdictions. ASU 2016-09, “Compensation - Stock Compensation (Topic 718): Improvements to Employee Share-Based Payment Accounting.” will be effective for us on January 1, 2018.
ASU 2016-13, “Financial Instruments - Credit Losses (Topic 326): Measurement of Credit Losses on
Financial Instruments.” ASU 2016-13 requires the measurement of all expected credit losses for financial assets held at the reporting date based on historical experience, current conditions, and reasonable and supportable forecasts and requires enhanced disclosures related to the significant estimates and judgments used in estimating credit losses, as well as the credit quality and underwriting standards of an organization’s portfolio. In addition, ASU 2016-13 amends the accounting for credit losses on available-for-sale debt securities and purchased financial assets with credit deterioration. ASU 2016-13 will be effective on January 1, 2021. We are currently evaluating the potential impact of ASU 2016-13 on our financial statements.
ASU 2016-15, “Statement of Cash Flows (Topic 230) - Classification of Certain Cash Receipts and
Cash Payments.” ASU 2016-15 provides guidance related to certain cash flow issues in order to reduce the current and potential future diversity in practice. ASU 2016-15 will be effective for us on January 1, 2019 and is not expected to have a significant impact on our financial statements.
ASU 2016-16, “Income Taxes (Topic 740) - Intra-Entity Transfers of Assets Other Than
Inventory.” ASU 2016-16 provides guidance stating that an entity should recognize the income tax consequences of an intra-entity transfer of an asset other than inventory when the transfer occurs.
gonzalezs
Typewritten Text
Annual Report

- 40 -
ASU 2016-16 will be effective for us on January 1, 2019 and is not expected to have a significant impact on our financial statements.
ASU 2016-18, “Statement of Cash Flows (Topic 230) - Restricted Cash.” ASU 2016-18 requires that a
statement of cash flows explain the change during the period in the total of cash, cash equivalents, and amounts generally described as restricted cash or restricted cash equivalents. Therefore, amounts generally described as restricted cash and restricted cash equivalents should be included with cash and cash equivalents when reconciling the beginning-of-period and end-of-period total amounts shown on the statement of cash flows. ASU 2016-18 will be effective for us on January 1, 2019 and is not expected to have a significant impact on our financial statements.
gonzalezs
Typewritten Text
Annual Report

Financial Highlights(Dollars in Thousands, Except Per Share Data) 2016 2015 Change %ChangeFor The Year Total Interest Income- less TEA (Do not print shaded area 77,239 79,936 (2,697)$ -3.37% Total Interest Expense 11,596 12,532 (936) -7.47% Net Interest Income 65,643 67,404 (1,761) -2.61% Provision for Loan Losses - - - #DIV/0! Net Interest Income After Provision for Loan Losses 65,643 67,404 (1,761) -2.61% Noninterest income: Service Charges 6,634 7,146 (512) -7.16% Other service charge and fee income 8,248 7,737 511 6.60% Real estate package fee income 1,154 806 348 43.18% Gain on sale of securities 1,849 1,798 51 2.84% Increase in BOLI cash values 1,562 1,362 200 14.68% Brokerage services - commission income 1,547 2,433 (886) -36.42% Insurance services - commission income 2,221 2,065 156 7.55% Other noninterest income 1,992 48 1,944 4050.00% Total Noninterest Income 25,207 23,395 1,812 7.75% Noninterest expense: Employee compensation 34,973 33,526 1,447 4.32% Employee benefits 6,856 6,788 68 1.00%
41,829 40,314 1,515 3.76% Net occupancy and equipment expense 9,073 9,213 (140) -1.52% Data processing fees 5,580 5,610 (30) -0.53% Legal and professional 4,796 5,763 (967) -16.78% FDIC insurance 2,009 2,841 (832) -29.29% Advertising expense 1,733 1,904 (171) -8.98% Other real estate, net 198 2,431 (2,233) -91.86% Telephone expense 1,617 1,416 201 14.19% Business development 410 353 57 16.15% Supplies 517 533 (16) -3.00% Other noninterest expense 4,551 4,657 (106) -2.28% Total Noninterest Expense 72,313 75,035 (2,722) -3.63% Income Before Income Taxes- less TEA 18,537 15,764 2,773 17.59% Income Tax Expense 4,723 4,138 585 14.14% Net income 13,814$ 11,626$ 2,188$ 18.82% Return on average assets 0.64% 0.54% 0.10% 18.52% Return on average shareholders' equity 5.34% 4.74% 0.60% 12.66% Net interest margin 3.38% 3.43% -0.05% -1.46% Efficiency ratio 79.60% 82.64% -3.04% -3.68% Per share data: Net income - basic 2.34$ 1.94$ 0.40$ 20.62% Net income - diluted 2.33$ 1.94$ 0.39$ 20.10% Book value at end of period 42.97$ 41.62$ 1.35$ 3.24% Cash dividends declared - - - Weighted average shares outstanding (in thousands) - Basic 5,905 5,984 (79) -1.32% - Diluted 5,935 6,002 (67) -1.11% Shares outstanding at end of period (in thousands) 5,864 5,942 (78) -1.31%
Capital Ratios Common Equity Tier 1 risk-based capital ratio 17.44% 17.87% -0.43% -2.41% Tier 1 risk-based capital ratio 17.44% 19.87% -2.43% -12.23% Total risk-based capital ratio 18.70% 21.13% -2.43% -11.50% Leverage capital ratio 11.71% 12.42% -0.71% -5.72% Shareholders' equity to total assets 11.53% 11.23% 0.30% 2.67%
S:\Pharr\Corporate Office\Bancshares-Texas\carruthers\Annual Report\2016\Annual Report 12-31-2016Annual Report 12-31-2016
gonzalezs
Line
gonzalezs
Typewritten Text
Annual Report

Financial Highlights(Dollars in Thousands, Except Per Share Data) 2016 2015 Change %ChangeFor The Year
Balance Sheet Data Total assets $2,184,416 $2,202,996 (18,580)$ -0.84% Loans 1,194,010 1,142,439 51,571 4.51% Allowance for loan losses 23,272 25,405 (2,133) -8.40% Investment securities 692,199 691,499 700 0.10% Deposits 1,821,140 1,844,664 (23,524) -1.28% Shareholders' equity 251,962 247,295 4,667 1.89%
Asset Quality Ratios Allowance for Loan Losses to Loans 1.95% 2.22% -0.27% -12.16% Net Loan Charge-offs $2,133 $3,032 (899)$ -29.65% Net Loan Charge-offs to Average Loans 0.19% 0.26% -0.07% -26.92% Nonperforming Assets to Loans and Repossessed Assets 5.77% 7.07% -1.30% -18.39% Allowance for Loan Losses to Nonperforming Assets 33.17% 30.89% 2.28% 7.38% Provision for Loan Loss to Net Loan Charge-offs 0.00% 0.00% 0.00% #DIV/0!
S:\Pharr\Corporate Office\Bancshares-Texas\carruthers\Annual Report\2016\Annual Report 12-31-2016Annual Report 12-31-2016
gonzalezs
Typewritten Text
Annual Report
Management’s Report on Responsibility for Financial Reporting To our Shareholders Financial Statements The management of Lone Star National Bancshares-Texas, Inc. and its subsidiaries (the “Company”) has the responsibility for preparing the consolidated financial statements and for their integrity and objectivity. The consolidated financial statements were prepared in conformity with accounting principles generally accepted in the United States of America. The consolidated financial statements include amounts that are based on management’s best estimates and judgments. Internal Control Over Financial Reporting Management is responsible for establishing and maintaining effective internal controls over financial reporting presented in conformity with both accounting principles generally accepted in the United States of America and the instructions of the Board of Governors of the Federal Reserve System for preparation of Consolidated Financial Statements for Bank Holding Companies (Reporting Form FR Y-9C). This internal control contains monitoring mechanisms, and actions to correct deficiencies identified. There are inherent limitations in any internal control, including the possibility of human error and the circumvention or overriding of controls. Accordingly, even effective internal control can provide only reasonable assurance with respect to financial statement preparation. Further, because of changes in conditions, the effectiveness of internal control may vary over time. Management assessed the Company’s internal control over financial reporting presented in conformity with both accounting principles generally accepted in the United States of America and call report instructions as of December 31, 2016. This assessment was based on criteria for effective internal control over financial reporting described in Internal Control-Integrated Framework issued by the Committee of Sponsoring Organizations of the Treadway Commission. Based on this assessment, management concludes that, as of December 31, 2016, Lone Star National Bancshares-Texas, Inc. and subsidiaries maintained effective internal control over financial reporting presented in conformity with accounting principles generally accepted in the United States of America and call report instructions.
gonzalezs
Typewritten Text
Annual Report

Compliance with Laws and Regulations Management is responsible for compliance with the federal and state laws and regulations concerning dividend restriction and federal laws and regulations concerning loans to insiders designated by the Federal Deposit Insurance Corporation as safety and soundness laws and regulations. Management assessed compliance by the Bank with the designated laws and regulations relating to safety and soundness. Based on this assessment, management concludes that the Bank complied with the designated laws and regulations related to safety and soundness for the year ended December 31, 2016. ___________________________ ______________________ S. David Deanda, Jr. David M. Penoli President Executive Vice President & Chief Financial Officer March 30, 2017
gonzalezs
Typewritten Text
Annual Report

$35.37 $36.35
$39.99 $41.62
$42.97
2012 2013 2014 2015 2016
Per Share Data:Book Value
gonzalezs
Typewritten Text
ANNUAL REPORT

$221 $223
$240
$247
$252
$205
$210
$215
$220
$225
$230
$235
$240
$245
$250
$255
2012 2013 2014 2015 2016
Shareholders' Equity (Dollars in Millions)
gonzalezs
Typewritten Text
ANNUAL REPORT

7.23%
6.53%
4.65% 4.74%
5.34%
2012 2013 2014 2015 2016
Return on Average Stockholders' Equity
gonzalezs
Typewritten Text
ANNUAL REPORT

Assets0.00%
Shareholders' Equity3.90%
Loans‐1.00%
Deposits0.17%
5 Year Compound Annual Growth Rate
gonzalezs
Typewritten Text
ANNUAL REPORT

$38.25
$43.25 $42.00 $43.00
$54.75
2012 2013 2014 2015 2016
Stock PricePer Share
gonzalezs
Typewritten Text
ANNUAL REPORT

$2,060
$2,080
$2,100
$2,120
$2,140
$2,160
$2,180
$2,200
$2,220
2012 2013 2014 2015 2016
$2,124
$2,213
$2,171
$2,203
$2,184
Total Assets (in millions)
gonzalezs
Typewritten Text
ANNUAL REPORT

$15,564
$14,448
$10,745
$11,626
$13,814
2012 2013 2014 2015 2016
Net Income(Dollars in Thousands)
gonzalezs
Typewritten Text
ANNUAL REPORT

$2.45 $2.33
$1.76
$1.94
$2.33
2012 2013 2014 2015 2016
Per Share Data: Net Income-Diluted
gonzalezs
Typewritten Text
ANNUAL REPORT

0.73%
0.68%
0.49%
0.54%
0.64%
2012 2013 2014 2015 2016
Return on Average Assets
gonzalezs
Typewritten Text
ANNUAL REPORT

67.11%
75.16%
83.01% 82.64%79.60%
2012 2013 2014 2015 2016
Efficiency Ratio
gonzalezs
Typewritten Text
ANNUAL REPORT


![Star (with Answers)[1]](https://static.fdokumen.com/doc/165x107/631e9db04c5c8fb3a00e4680/star-with-answers1.jpg)