Logistics Technology Forecasting Framework Using Patent ...
30
Citation: Kwon, K.; Jun, S.; Lee, Y.-J.; Choi, S.; Lee, C. Logistics Technology Forecasting Framework Using Patent Analysis for Technology Roadmap. Sustainability 2022, 14, 5430. https:// doi.org/10.3390/su14095430 Academic Editor: Sungyong Choi Received: 16 April 2022 Accepted: 27 April 2022 Published: 30 April 2022 Publisher’s Note: MDPI stays neutral with regard to jurisdictional claims in published maps and institutional affil- iations. Copyright: © 2022 by the authors. Licensee MDPI, Basel, Switzerland. This article is an open access article distributed under the terms and conditions of the Creative Commons Attribution (CC BY) license (https:// creativecommons.org/licenses/by/ 4.0/). sustainability Article Logistics Technology Forecasting Framework Using Patent Analysis for Technology Roadmap Koopo Kwon 1,2 , Sungchan Jun 1 , Yong-Jae Lee 1 , Sanghei Choi 3, * and Chulung Lee 4, * 1 Department of Industrial and Management Engineering, Korea University, 145 Anam-ro, Seongbuk, Seoul 02841, Korea; [email protected] (K.K.); [email protected] (S.J.); [email protected] (Y.-J.L.) 2 Department of Shipping and Air Cargo & Drone Logistics, Youngsan University, 142 Bansongsunhwan-ro, Haeundae-gu, Busan 48015, Korea 3 Vice President for Research, Korea Maritime Institute, 26, Haeyang-ro 301 beon-gil, Yeongdo-gu, Busan 49111, Korea 4 School of Industrial and Management Engineering, Korea University, 145 Anam-ro, Seongbuk-gu, Seoul 02841, Korea * Correspondence: [email protected] (S.C.); [email protected] (C.L.); Tel.: +82-51-2797-4302 (S.C.); +82-2-3290-3395 (C.L.) Abstract: The rapid advancement of digital technologies has fundamentally changed the competitive dynamics of the logistics industry. For players in the logistics industry, digitization has become an unavoidable situation to achieve survival and sustainable competitiveness. A technology strategy is essential for digitization, and identifying opportunities and threats of technology development through technology trend exploration is important for technology strategy. In addition, to enable the implementation of the technology strategy, it is necessary to detect the change in technology and search for the technology that is expected to have a practical development effect. The purpose of this study is to identify opportunities and areas for technology development through patent data in establishing technology strategies. Previous research mainly relied on the expert interview method, and there was also a patent analysis study based on topic modeling, but only to grasp technology trends. This paper aims to propose a new framework for the extension to the stage for establishing a technology roadmap. By using the Word2Vec algorithm, we will investigate the patent search formula that reflects the trend, the prediction of changes in logistics technology through LDA (Latent Dirichlet Allocation) clustering of patent data, and the derivation of vacant technology by experimental methods. The proposed framework is expected to be utilized for predicting technological change and deriving promising technologies for establishing technology roadmaps in logistics companies. Keywords: retail logistics; technology roadmap; patent analysis; time series; clustering; latent dirichlet allocation 1. Introduction In recent years, the logistics industry has been increasingly challenged by new disrup- tive business models and digital technologies [1,2]. For example, Uber Freight is a digital logistics startup acting as an intermediary [3,4]. These platforms enable cost-effective, real-time, on-demand transportation arrangements for logistics services [5]. IT-based play- ers such as Amazon and Alibaba, which are e-retailers [6,7] that invest in robot-based automated warehouses and transportation, are providing their own logistics services. In addition, as the coronavirus crisis prolonged, logistics services became one of the most important core areas of the retail market due to the spread of “untact” [8] services and the growth of the e-commerce market [9]. Offline retailers such as Walmart are also trying to internalize logistics while investing in robot-based automated warehouses [10]. As such, digital technology is fundamentally changing the competitive dynamics of the retail and logistics industry [11]. Sustainability 2022, 14, 5430. https://doi.org/10.3390/su14095430 https://www.mdpi.com/journal/sustainability
-
Upload
khangminh22 -
Category
Documents
-
view
0 -
download
0
Transcript of Logistics Technology Forecasting Framework Using Patent ...

Citation: Kwon, K.; Jun, S.; Lee, Y.-J.;
Choi, S.; Lee, C. Logistics Technology
Forecasting Framework Using Patent
Analysis for Technology Roadmap.
Sustainability 2022, 14, 5430. https://
doi.org/10.3390/su14095430
Academic Editor: Sungyong Choi
Received: 16 April 2022
Accepted: 27 April 2022
Published: 30 April 2022
Publisher’s Note: MDPI stays neutral
with regard to jurisdictional claims in
published maps and institutional affil-
iations.
Copyright: © 2022 by the authors.
Licensee MDPI, Basel, Switzerland.
This article is an open access article
distributed under the terms and
conditions of the Creative Commons
Attribution (CC BY) license (https://
creativecommons.org/licenses/by/
4.0/).
sustainability
Article
Logistics Technology Forecasting Framework Using PatentAnalysis for Technology RoadmapKoopo Kwon 1,2 , Sungchan Jun 1 , Yong-Jae Lee 1, Sanghei Choi 3,* and Chulung Lee 4,*
1 Department of Industrial and Management Engineering, Korea University, 145 Anam-ro, Seongbuk,Seoul 02841, Korea; [email protected] (K.K.); [email protected] (S.J.); [email protected] (Y.-J.L.)
2 Department of Shipping and Air Cargo & Drone Logistics, Youngsan University, 142 Bansongsunhwan-ro,Haeundae-gu, Busan 48015, Korea
3 Vice President for Research, Korea Maritime Institute, 26, Haeyang-ro 301 beon-gil, Yeongdo-gu,Busan 49111, Korea
4 School of Industrial and Management Engineering, Korea University, 145 Anam-ro, Seongbuk-gu,Seoul 02841, Korea
* Correspondence: [email protected] (S.C.); [email protected] (C.L.); Tel.: +82-51-2797-4302 (S.C.);+82-2-3290-3395 (C.L.)
Abstract: The rapid advancement of digital technologies has fundamentally changed the competitivedynamics of the logistics industry. For players in the logistics industry, digitization has become anunavoidable situation to achieve survival and sustainable competitiveness. A technology strategyis essential for digitization, and identifying opportunities and threats of technology developmentthrough technology trend exploration is important for technology strategy. In addition, to enablethe implementation of the technology strategy, it is necessary to detect the change in technology andsearch for the technology that is expected to have a practical development effect. The purpose ofthis study is to identify opportunities and areas for technology development through patent data inestablishing technology strategies. Previous research mainly relied on the expert interview method,and there was also a patent analysis study based on topic modeling, but only to grasp technologytrends. This paper aims to propose a new framework for the extension to the stage for establishing atechnology roadmap. By using the Word2Vec algorithm, we will investigate the patent search formulathat reflects the trend, the prediction of changes in logistics technology through LDA (Latent DirichletAllocation) clustering of patent data, and the derivation of vacant technology by experimentalmethods. The proposed framework is expected to be utilized for predicting technological change andderiving promising technologies for establishing technology roadmaps in logistics companies.
Keywords: retail logistics; technology roadmap; patent analysis; time series; clustering; latentdirichlet allocation
1. Introduction
In recent years, the logistics industry has been increasingly challenged by new disrup-tive business models and digital technologies [1,2]. For example, Uber Freight is a digitallogistics startup acting as an intermediary [3,4]. These platforms enable cost-effective,real-time, on-demand transportation arrangements for logistics services [5]. IT-based play-ers such as Amazon and Alibaba, which are e-retailers [6,7] that invest in robot-basedautomated warehouses and transportation, are providing their own logistics services. Inaddition, as the coronavirus crisis prolonged, logistics services became one of the mostimportant core areas of the retail market due to the spread of “untact” [8] services and thegrowth of the e-commerce market [9]. Offline retailers such as Walmart are also trying tointernalize logistics while investing in robot-based automated warehouses [10]. As such,digital technology is fundamentally changing the competitive dynamics of the retail andlogistics industry [11].
Sustainability 2022, 14, 5430. https://doi.org/10.3390/su14095430 https://www.mdpi.com/journal/sustainability

Sustainability 2022, 14, 5430 2 of 30
The penetration of IT-based e-commerce companies into the logistics industry is chang-ing the logistics industry from a labor-intensive industry to a technology-oriented industry.Robotics, AI (Artificial Intelligence), automation, and autonomous driving technologieswill enable not only existing IT companies but also other players in the industrial valuechain such as logistics real estate companies, automobile manufacturers, and robot manu-facturers to enter the logistics industry with new technology-based business models [12]. Ithas become a situation that can change at any time to a competitive relationship betweencompanies that were previously in a cooperative relationship. Existing traditional logisticsservice providers are facing such new challenges and competition situations [13]. To staycompetitive and grow, logistics service providers must improve their value propositionfor shippers and customers [11,14]. Technology is an important factor in differentiatingthe value of logistics and sparking and enabling innovation [15,16]. In particular, digitaltechnologies such as Robots and AI are introduced into logistics, and this brings positiveeffects such as a new technology-based business models and the reduction of logisticscosts [12,17,18]. In line with this trend, traditional logistics service providers need businessinnovation through technology [16].
DHL (Dalsey, Hillblom and Lynn), the world’s largest logistics company, announced‘Strategy 2025’ in 2019, selecting Globalization, E-Commerce, Digitalization, and Sustain-ability as future key trends in the logistics industry, and declared differentiation throughpositioning by trend. Among them, digitalization is the most important growth engine forimproving customer/employee satisfaction and efficiency, and systematic digital transfor-mation is being pursued throughout the business [19]. Alibaba, China’s largest e-commercecompany, is actively promoting the introduction of robots and autonomous driving tech-nologies while presenting a new concept that combines distribution and logistics by an-nouncing new retail [20]. CJ Logistics, a representative logistics company in Korea, definesTES-Technology, Engineering, and System/Solutions as its core competencies and is ac-tively introducing digital technologies such as robot-based unmanned warehouses [21]. Atthe national level, logistics innovation is supported by developing policies to support thespread of digital technologies to strengthen the competitiveness of logistics companies andby establishing a roadmap for related technology development [22].
As such, with support from the government level and logistics companies, strategiesand roadmaps for the digitalization of logistics are being established, and technology de-velopment is being pursued. With the strategic importance of identifying the opportunitiesand threats of technology development for logistics enterprises to achieve sustainablecompetitiveness, exploring the technological evolution trend is important for the successfultechnology development strategy of logistics [23–25]. To this end, predicting the directionof evolution and technology development in the rapidly changing [26] distribution andlogistics industry is a very important prerequisite. Research on trends in future logisticstechnology and the discovery of vacant technologies [27,28] can provide implications forindustry, government, and academia when developing new logistics-related businessesand R&D policies.
Until now, research on trends in logistics technology has been conducted using theDelphi and AHP methods, in which the contents of logistics technology forecasting in-stitutions or literature are investigated, and related persons are interviewed [29,30]. Assuch, setting a technology strategy direction and creating a technology roadmap throughinterviews with experts and related persons requires a relatively large amount of time andmoney [31,32]. Additionally, since companies receive strategic services through the sameexpert group, similar technology development cases are found rather than differentiatedtechnologies between companies. This can be said to be insufficient to secure differentiationthrough technology preemption and service superiority competitiveness.
The life cycle of technological innovation is getting very short [33]. In order to solvethis challenge of technological innovation, short-term and periodic research on technologytrends should be possible. In addition, in order to overcome the similarity in technologydevelopment due to the use of the same experts, quantitative research is needed to find

Sustainability 2022, 14, 5430 3 of 30
promising technologies that can be used by companies based on currently available data.Patents are data that are currently available and are constantly being updated. Patents alsocontain a large amount of technical information [34]. In other words, it can be seen as thebest source for the analysis of technological change [35]. In addition, quantitative analysisis possible by providing information on a globally unified classification system such as theInternational Patent Classification (IPC). In relation to the analysis of technological change,in recent years, technology prediction research using patent information as a quantitativeapproach is being actively conducted [36]. However, most of the technology predictionresearch using patent information was conducted in a very detailed specific technology unit,and there were case studies such as the barriers to the digital innovation of logistics serviceproviders and success factors in the digital technology-related research in the logisticsindustry. Although there have been studies on the impact and role of the digitizationof logistics service providers, there has been insufficient research to derive differentiatedtechnologies for predicting changes in the overall technology of the distribution andlogistics industry and for establishing a technology development roadmap [37].
Against this background, the main purpose of this study is to propose a framework thatcan predict quantitative technological change and derive vacant technologies in the logisticsfield that can be implemented periodically in the short term to establish a technologyroadmap necessary for the digitization of players in the logistics service industry. For thispurpose, the following five research questions were derived.
First, is it possible to derive a patent search formula that reflects the latest trends,rather than a human-written patent search formula? Second, is it possible to classifydetailed fields of the logistics industry through patent data and to predict quantitativetechnological change in the field? Third, can you discover technology areas with thepotential for development in the logistics field through patent data? Fourth, is it possible toconstruct a technology roadmap by deriving a vacant technology with development valuein a technology area with the potential for development? Fifth, if a technology roadmap isderived, will it have any meaningful value for players in the logistics industry?
To solve these research questions, first, the proposed research framework is reviewedby examining the status of technology development by major countries and companiesthrough literature review on similar studies in the first stage. In the second stage, astructured research framework for this work is provided. The results of the application ofthe framework presented in Step 3 are deduced through the experimental research method.In four stages, the contribution of this study is explained, and the limitations and futureresearch directions are explained.
2. Literature Review2.1. Technology Innocations in Logistics Industry2.1.1. Country Level Logistics Industry Technology Roadmap
Looking at the logistics technology policy trends of major countries, in the case of theUnited States, data-intensive computing including AI, big data, and CPS (Cyber PhysicalSystem), which are the core technologies of the 4th industrial revolution [38], IT andlogistics systems, cyber-human systems, and high-performance computing are expandinginvestments in various areas. In addition, we have reduced traffic accidents, secured cargotransportation safety, established intermodal transportation infrastructure, and promotedeco-friendly technology development (Transportation for a New Generation (’14~’18));PUDU(Pick-up/Drop-off) zone program is being promoted [39].
In the case of Germany, tasks necessary for logistics digitization were promotedthrough the High-Tech Strategy 2020 (’10) and the New High-Tech Strategy (’14). Intelligentzero-emission mobility strategy such as digitalization, new technology, and movementculture change were presented. The ‘2030 Logistics Innovation Plan’ was announcedin 10 areas including digital infrastructure expansion and platform development, newenergy-using transportation development, and last-mile technology jointly planned withthe industry [40].

Sustainability 2022, 14, 5430 4 of 30
Through ‘Horizon 2020 (’14~’20)’, the EU is promoting R&D investment plans for thedevelopment of science and technology with the goal of strengthening scientific competi-tiveness, strengthening industrial leadership, and solving social problems. EU is promotingthe ALICE(Alliance for Logistics Innovation through Collaboration in Europe) project,which aims to improve efficiency by 30% in the entire logistics supply chain by 2030 byimplementing the Physical Internet, a concept that interconnects all logistics and transporta-tion activities based on IoT(Internet of Things) technology. ALICE presented a research andinnovation roadmap that pursues ‘Physical Ethernet’ to build an interconnected logisticssystem as a European logistics technology platform. In this roadmap, it is suggested that fu-ture logistics technology will develop centering on ‘information system for interconnectedlogistics’, ‘sustainable and safe supply chain’, ‘supply chain synchronization’, ‘supply chaincoordination and cooperation’, and ‘urban logistics’ [41].
Japan announced a plan to significantly improve logistics productivity and realize‘strong logistics’ in order to respond to environmental changes such as the complexity oflogistics needs and the 4th industrial revolution through the ‘Comprehensive LogisticsPolicy Outline (’17–’20)’ In order to solve the problem of labor shortage in the logisticsindustry and improve productivity, a plan for collecting big data-based information andsharing real-time information (‘18) was announced. In addition, we are trying to preparesolutions to problems such as the practical use of delivery using drones and the shortageof young truck drivers due to the low birth rate and aging population, and a logisticsrevolution strategy using new technologies such as IoT and AI to increase the efficiencyand sustainability of inter-regional logistics transportation was presented [42].
China presented business innovations applying new technologies such as AI, big data,and cloud computing in the Chinese government work report (13th class in 2019) andannounced the ‘13th Five-Year Plan (’16~’20) for logistics infrastructure The key promotiondirections in the logistics sector were presented, such as construction and “intelligentiza-tion”, in addition to changes in the logistics industry fostering policy. The State Councilof China has confirmed the logistics industry as a national base and strategic industrythrough the ‘Mid and Long-Term Plan for Logistics Industry Development (’14~’20)” andis supporting innovation. Infrastructure construction, technological innovation, servicelevel improvement, safety and efficiency improvement, and eco-friendly service systemconstruction have been promoted since 2017 [43].
In the ‘5th National Logistics Basic Plan’, Korea presented six strategies under the vi-sion of ‘Leap as a global logistics leader through smart logistics industry, digital innovativegrowth and creation of a sustainable ecosystem’. The main contents are to promote thedigitalization of the logistics system through the advancement of delivery equipment, suchas robots, the innovation of the urban logistics system such as the digital undergroundlogistics system, and the preparation of the foundation for autonomous cargo transporta-tion, and to build an integrated platform for the accumulation, management, processing,and provision of logistics information; they are promoting a logistics information platformto disseminate ‘National Logistics Map’ through the establishment of national logisticsbig data [22].
As a result of reviewing the logistics policies of major countries, we recognize theimportance of logistics innovation in the digital age and support policy support for thedevelopment of digital logistics and R&D for technology development at the national level.It can also be said that it plays a very important role.
2.1.2. Company Level Logistics Technology Development Status
Technology is becoming the basic condition for logistics innovation [44]. Through dig-itization, even hardware solutions are being “technologicalized” and gradually becominghigh-tech products. Hardware and software solutions, whether standardized or customized,do not have to be new to the market to be considered a technological innovation [45].
Looking at the status of the technology development of logistics service providers,DHL, a global logistics company, uses the AI-based ‘Resilience 360’ system to reproduce

Sustainability 2022, 14, 5430 5 of 30
the supply chain flow at each logistics stage in a virtual space to diagnose and evaluate thepossibility of supply chain disruption [46]. UPS, a large American courier company, hasimproved and improved WES (Warehouse Execution System) jointly with the technologycompany Softeon to build an automatic system for prompt order reception and fulfillmentso that customers can receive orders in a timely manner, even if they change orders, andAMR (Autonomous Investment in Mobile Robot) is increasing. In addition, it is trying tocommercialize drone delivery by signing a contract to deliver commercial drugs from thedrugstore chain CVS by drone.
Looking at the technology development status of the retailer, Wakefern Food, a grocerydistributor, partnered with the technology company Takeoff Technology to establish aHyerlocal Fulfillment Center that fully automates the picking and delivery of orders usingrobots. Walmart, a large American offline company, is implementing warehouse automationby introducing a GTP (Goods to Person)-type platform ‘Alapabot’ according to its MicroFulfillment strategy. JD Logistics of China is working on building a supply chain in whichAI technology is applied to the fulfillment solution of Blue Yonder [47].
Toyota Motor Corporation of Japan established ‘MONET Technology’, a self-drivingcar service provider, jointly with SoftBank to develop MaaS (Mobility as a Service) withcommercial vehicles and logistics companies, and Yamato Holdings launched an unmannedcourier service with autonomous driving technology, the Robo NeKo Yamato’ project. Uber,a US company, developed the freight brokerage app ‘Uber Freight’, and the truckingcompany C.H. Robinson is using it [48].
Examining the status of technology in the logistics industry shows that technology isan essential condition for innovation in retail and logistics. The field of retail and logisticsis in the stage of changing from a labor-intensive industry in the past to a technology-basedindustry [49]. Logistics operators must improve their value propositions for shippers andcustomers in order to face these future challenges and create opportunities by new tech-nologies, maintain competitiveness, and grow [11]. Smarter, faster, and more sustainablelogistics should provide a better customer experience [14]. Therefore, if you look at the cur-rent status of players in the logistics industry for improving customer value propositions,you can see that the logistics technology roadmap is a key issue that plays a very importantrole at the national and industrial levels.
2.2. Patent-Based Logistics Technology Prediction
One of the key components of the technology roadmap is technology that aligns withthe strategic goals of the company and it plays a critical role in logistics value differenti-ation [11,14,50]. In order to select the technology to be developed, the prediction of thetechnology must be preceded. The forecasting of technology plays an important role inthe decision-making of the technology strategy of countries and companies. Previously,morphological analysis, logistic growth model, Delphi, bibliometircs, and scenario ap-proaches were widely used to predict technology [51]. However, this method is subjectiveand unstable [52]. To overcome this limitation, patents were analyzed along with detailedinformation on patented technologies in numerous studies on forecasting future promisingtechnologies. This is because patents provide sufficient data to draw reliable conclusionsfrom studies investigating technological change and innovation [53].
For example, research is underway to predict future technologies using a growthcurve based on the number of patent applications filed. The logistic growth curve wasapplied to the nano-sized ceramic powder technology patent [54] and the integrated solartechnology patent establishment [55], respectively. The logistic growth curve and Bassmodel were then applied to patents for information and communication technology (ICT)applications [56,57]. In addition, the growth curve of future citations for TFT and LCD, theflash memory system, and personal digital assistants (PDA) were applied as criteria forpredicting future technologies [57].
There was a study in which technology forecasting was made by applying datamining techniques to patents. Promising techniques were identified using association

Sustainability 2022, 14, 5430 6 of 30
rule mining of the International Patent Classification for Patent Documents (IPC) [58]. Inaddition, we determined promising aspects of the technology by applying associationrule mining to changes in patent index values over time for each IPC [59]. In addition,(Park et al., 2015) network analysis was applied to IPC to visually express the relationshipbetween technologies and to judge whether the technology was promising based on thecentrality between IPCs and the distance between nodes [60].
Research was also conducted to forecast future promising technologies by applyingtext mining techniques to patents. Apple Inc. Text mining for patents was applied to iden-tify promising vacant technologies [61]. In addition, a study was conducted to forecast thevacant technology by applying the generation probability model of the Dirichlet potentialallocation to the renewable energy technology patent [62]. In another study, after obtainingpatented keywords, generative topographic mapping was applied as a probabilistic recon-struction of self-organizing maps to investigate vacant technological areas and promisingaspects [63]. For the prediction of blockchain technology, there have been studies throughtext mining, clustering, and life cycle prediction of technology [64]. Patent matrix map andk-medois clustering were used for technical prediction [52]. Unlike previous algorithms thatclustered by measuring simple distances, the ensemble method and Bayesian learning werecombined. A new clustering method was proposed, and research was conducted to derivethe future technology of humanoid robot system technology through this method [65].
To understand trends in logistics technology, patent data was identified through LDA,and the subject was identified through patent share and growth rate [66]. In order todevelop an IoT roadmap for the provision of logistics services and to understand theIoT patent trends in the logistics field [67], text mining technique was used for patentabstracts to understand IoT patent trends in the logistics field [68]. There was also a studyof technological opportunity and evolutionary exploration [69].
These studies are meaningful in objectively deriving promising data-based technolo-gies. However, it still requires the qualitative judgment of the researcher [70]. In addition,there have been studies in the existing literature that predict promising technologies ofspecific technical units or grasp technology trends in the logistics field, but research onthe overall framework that minimizes the derivation of vacant technologies for the tech-nology roadmap and the qualitative judgment of researchers was lacking. Therefore, inthis study, we try to predict future technologies for future technology roadmaps through anew approach to patent analysis so that players in the real logistics field can strengthentheir technological competitiveness and overcome the shortcomings of existing promisingtechnology forecasting.
2.3. Patent Analysis2.3.1. Patent Map
Patent maps describe the relationships between patents through visual elements suchas charts, graphs, bars, and tables [71,72]. Since the patent map provides practical andintuitive information, it is an effective technique for establishing a technology developmentstrategy [73]. Although various types of patent maps have been developed, most ofthem analyzed the technical fields through author, technical field, citation, etc., which areinformation of patent documents, in order to provide simple statistical results. While thismethod is simple and intuitive to develop, it is limited to specific technical fields becauseit does not use the description of the patent document that contains the definition of thetechnology [74]. As keyword extraction became possible with the development of textmining techniques, patent maps using unstructured data developed [75]. PCA (PrimaryComponent Analysis), SOM (Self-Organizing Map), and GTM (Generative TopographicMapping) are representative technologies for finding patents in the patent map.
PCA is a dimensionality reduction and feature extraction technique and is performedby converting multiple variables into several linear combinations [76]. PCA can extractlatent dimensions by extracting primary variables and define latent dimensions as primarydimensions. However, there is a limitation in that it is difficult to interpret the meaning

Sustainability 2022, 14, 5430 7 of 30
because too much dimensional data is included in one variable. SOM is an artificial neuralnetwork that maps multidimensional data to a two-dimensional topological grid [77].The SOM-based patent map can cluster similar patents on individual nodes and visualizethe similarities and differences of nodes with color contrast [78,79]. However, since patentsare not included in blank nodes, there is a limitation in that the characteristics of blanknodes cannot be identified. These limitations make it difficult to interpret the potentialand implications of technological opportunities. To overcome the limitations of PCA andSOM, GTM was applied to the patent map. GTM is a mathematical model for densitymodeling and visualization [80]. Unlike PCA and SOM, which must be interpreted basedon experience and knowledge, GTM can reduce and re-project multidimensional data tolower dimensions. GTM can identify empty nodes and resolve them through an inversemapping algorithm. As a result of comparing the characteristics of the PCA, SOM, andGTM-based patent maps, the GTM-based patent map was easy to interpret, unlike PCAand SOM, which require manual analysis of the patent map results [81].
In this study, we aim to identify vacant technologies by applying a GTM-based patentmap that can interpret the results with an inverse mapping algorithm. In previous studies,the map size was qualitatively designed through various sensitivity analysis in derivingthe patent map, but this study derives a vacant technology in a huge industry calledthe logistics industry. The identified vacant technology will help develop a technologyroadmap for logistics services providers.
2.3.2. Patent Network
Network analysis is a method of measuring and visualizing the relationships andinteractions of actors, such as people, groups, and organizations [82]. The visual represen-tation of the network provides an overall understanding of the structure of relationshipsbetween actors and the location of individual nodes in the network [83,84]. In addition,in-depth analysis of the network is possible through various analysis indices such as thecentrality and density of the role of nodes in the network [85,86]. Network analysis can beapplied to various fields. In particular, the patent network is a network analysis based onpatent data, and the relationship between patents is visualized and analyzed [87]. In-depthanalysis of the patent network allows you to explore technology trends and technicalcooperation in specific technical fields. Patent network analysis provides important infor-mation to the person in charge of technology development by dividing it into a citationnetwork based on patent citation information and a keyword-based network extractedfrom patent documents [88].
Citation network analysis treats patent documents as nodes and visualizes the net-work as links between patent documents. Citation networks can contribute to the gener-ation/dissemination of ideas for the R&D of new technologies because they intuitivelyshow the links between patent diffusion and patents [89,90]. However, since the citationnetwork only considers the frequency of citations, there is a limitation in that the relationalanalysis of details is not performed [91]. To overcome the limitations, an IPC-based networkanalysis was developed using the international patent classification (IPC) developed bythe World Intellectual Property Organization (WIPO) [92]. Since all patents are given IPCcodes classified into specific technical fields, technical contents can be analyzed throughthe IPC-based network. As the analysis of unstructured data has recently become moresophisticated, network analysis is possible through keywords, which can be applied to adetailed roadmap. Keyword-based network analysis aims to understand the core techni-cal information of the document content included in the patent [93]. Patent documentscontain unstructured text information, and the network is analyzed by extracting keykeywords through text mining techniques. Since the keywords extracted through the textmining technique mean the main technical elements of the patent, the technology can beanalyzed effectively [94].
In the process of deriving a technology roadmap for the logistics industry, a keyword-based network is applied to the identified vacant technology field to identify major technol-

Sustainability 2022, 14, 5430 8 of 30
ogy elements, surrounding technology elements, and related technology elements and tobuild a technology roadmap clearly from a detailed technical point of view.
3. Methodology3.1. Research Framework
The research framework consists of a total of three steps as shown in Figure 1 and aimsto finally develop a technology roadmap for the logistics industry through patent analysis.
Sustainability 2022, 14, x FOR PEER REVIEW 8 of 31
by the World Intellectual Property Organization (WIPO) [92]. Since all patents are given IPC codes classified into specific technical fields, technical contents can be analyzed through the IPC-based network. As the analysis of unstructured data has recently become more sophisticated, network analysis is possible through keywords, which can be applied to a detailed roadmap. Keyword-based network analysis aims to understand the core technical information of the document content included in the patent [93]. Patent docu-ments contain unstructured text information, and the network is analyzed by extracting key keywords through text mining techniques. Since the keywords extracted through the text mining technique mean the main technical elements of the patent, the technology can be analyzed effectively [94].
In the process of deriving a technology roadmap for the logistics industry, a key-word-based network is applied to the identified vacant technology field to identify major technology elements, surrounding technology elements, and related technology elements and to build a technology roadmap clearly from a detailed technical point of view.
3. Methodology 3.1. Research Framework
The research framework consists of a total of three steps as shown in Figure 1 and aims to finally develop a technology roadmap for the logistics industry through patent analysis.
Figure 1. Research framework.
Step 1: In the first step, keywords for writing a patent search formula are derived. It can be done with human insight, but for a more systematic method, we use news data to derive key keywords for the logistics industry and generate a patent search formula to derive input data for analysis.
Step 2: In the second step, it is necessary to classify and determine what kind of tech-nology area the logistics technologies existing in the collected patent data are in. Technol-ogy clusters are derived through patent analysis, and promising technology clusters are identified. Technology clustering proceeds based on the keywords of the patent text. Then, three analyses are applied to derive a cluster of promising technologies. The three analyses are divided into qualitative evaluation and quantitative evaluation to derive promising technologies. Qualitative assessment analyzes network analysis and technol-ogy level maps, which analyze the associations between technology and current technol-ogy positions. Quantitative evaluation is a trend analysis that evaluates future prospects through future trends by technology cluster.
Step 3: The final step is to draw a technology roadmap for promising technology fields, identify vacant technologies in the field of technology through the GTM algorithm, and establish a technology development roadmap through network analysis and patent analysis.
3.2. Detailed Methodology 3.2.1. Unstructured Data
Figure 1. Research framework.
Step 1: In the first step, keywords for writing a patent search formula are derived. Itcan be done with human insight, but for a more systematic method, we use news data toderive key keywords for the logistics industry and generate a patent search formula toderive input data for analysis.
Step 2: In the second step, it is necessary to classify and determine what kind oftechnology area the logistics technologies existing in the collected patent data are in.Technology clusters are derived through patent analysis, and promising technology clustersare identified. Technology clustering proceeds based on the keywords of the patent text.Then, three analyses are applied to derive a cluster of promising technologies. The threeanalyses are divided into qualitative evaluation and quantitative evaluation to derivepromising technologies. Qualitative assessment analyzes network analysis and technologylevel maps, which analyze the associations between technology and current technologypositions. Quantitative evaluation is a trend analysis that evaluates future prospectsthrough future trends by technology cluster.
Step 3: The final step is to draw a technology roadmap for promising technology fields,identify vacant technologies in the field of technology through the GTM algorithm, and es-tablish a technology development roadmap through network analysis and patent analysis.
3.2. Detailed Methodology3.2.1. Unstructured Data
Unstructured data require a preprocessing step to structure the unstructured databy cleaning and filtering the text data. In particular, patent documents aim to create aPatent-IPC matrix through a pre-processing step. Text data cleanup should remove punc-tuation marks, abbreviations, and unnecessary words [95]. This process can be convertedto the appropriate analysis format [96]. Additional cleanup can be performed throughdata tokenization and the deletion of stopwords [97]. There are stemming techniquesand Lemmatization techniques as methods of processing stopwords. Although the twotechniques have different characteristics, the stemming technique that can identify syn-onyms in terms of the interpretation of terms was applied to this study. It includes only thewords essential to describe the patent document through text cleanup, which is unstruc-tured data [98]. In this study, keywords were derived by applying the TF-IDF algorithmfor detailed technical explanation. The TF-IDF algorithm can select essential words byconsidering the frequency of words and the frequency of specific words for each docu-

Sustainability 2022, 14, 5430 9 of 30
ment by weighting the importance of each word [99]. The TF-IDF algorithm develops thePatent-Keyword matrix based on high-order words.
3.2.2. Technology Clustering
To subdivide the technical field, the topic modeling technique, LDA (Latent DirichletAllocation) algorithm, is applied. The LDA algorithm is the process of finding a topic in a setof documents [100]. Patent documents consist of documents on various topics. The LDAalgorithm assumes that topics generate words based on a probability distribution andtraces back the way documents were created [101]. The LDA algorithm needs to determinethe number of topic clusters K. The number of clusters is determined through K-crossvalidation. K-cross validation evaluates the complexity of the language model. Therefore,it is possible to derive the optimal K [102]. In general, lower complexity values mean thatthe topic model better reflects the results of the actual literature. However, since overfittingproblems can arise, we vary K and make decisions based on qualitative evaluations.
3.2.3. Technology Level Assessment
For technology level evaluation, qualitative evaluation and quantitative evaluationare applied. Qualitative evaluation is a method of evaluating the level of technologybased on the information in the patent document, and it identifies the location and currentstatus of the technology field by applying network analysis and a technology level map.Quantitative evaluation confirms future prospects by applying trend analysis based on thequantitative criterion of the number of patents.
Applying network analysis takes into account the linkages between technology dis-ciplines. Patent network analysis analyzes the interactions between technologies by mea-suring and visualizing them. The Patent-Keyword matrix is a co-occurrence matrix, and ithas information on whether words appear in each patent document. Network analysis isperformed based on the Patent-Keyword matrix. Network analysis quantitatively analyzesthe location and role of actors in the network through various indicators [103,104]. Toanalyze the role of nodes, various indicators exist such as degree centrality, closenesscentrality, and betweenness centrality [105]. Degree centrality is an indicator that quantifiesthe number of connections between a node and other nodes connected to it. ClosenessCentrality is an index that considers indirect connections within the network by developingDegree Centrality, which can only be interpreted locally. In order to consider the indirectconnection, it is defined as the distance between nodes. In other words, it is expressed asthe sum of the shortest path lengths between one node and all other nodes.
Betweenness Centrality is an indicator of the degree of controlling or mediatingthe relationship between nodes that are not directly connected. A node with a largeBetweenness Centrality can be interpreted as a threatening node that has the potentialto disrupt network activity because it can distort or filter information when transmittinginformation within the network.
Through the above various indicators, the relationship between the detailed technolo-gies of vacant technologies and detailed technologies linking vacant technologies can beidentified, which can be used for R&D and the development of a technology roadmap forcompanies and research institutes to establish business plans.
For practical technology development, technology trends and characteristics wereidentified, and areas with potential for technology development were derived [28,34,106].Therefore, in this study, an importance analysis was performed through a technology levelmap that evaluates the current technology level in order to derive technology developmentpriorities by topic, and trend analysis was performed through time series analysis to predictfuture prospects. The importance analysis aims to evaluate the current technology level,and in this analysis, the technology level map was used to evaluate the relative level of thetechnology. As shown in Figure 2, the technology level map uses the number of patentapplications as a quantitative evaluation criterion and applies the number of IPCs which ispatent citations as a qualitative evaluation criterion. Define the X-axis as the Technological

Sustainability 2022, 14, 5430 10 of 30
Activity Index (TAI) for the quantitative assessment of a technique. As more patentsare filed, it is indicated that the technology is growing rapidly. The Y-axis implies theTechnology Impact Index (TII) for the qualitative evaluation of a technology. It is suitable asan evaluation index because it cites previous patents in developing new technologies [107].Therefore, in order to evaluate the current level of the blank technology field, we conducta materiality analysis through the technology level map. Through the technology levelmap, technology fields can be located in the 1st, 2nd, 3rd, and 4th quadrants. 1© In thefirst quadrant, both TAI and TII indicators are high, which is defined as high level, and2© in the second and 3© third quadrants, one of the TAI and TII indicators is high and is
defined as medium level. Finally, 4© the fourth quadrant is defined as the low level whereall indicators are low [108,109].
Sustainability 2022, 14, x FOR PEER REVIEW 10 of 31
network activity because it can distort or filter information when transmitting information within the network.
Through the above various indicators, the relationship between the detailed technol-ogies of vacant technologies and detailed technologies linking vacant technologies can be identified, which can be used for R&D and the development of a technology roadmap for companies and research institutes to establish business plans.
For practical technology development, technology trends and characteristics were identified, and areas with potential for technology development were derived [28,34,106]. Therefore, in this study, an importance analysis was performed through a technology level map that evaluates the current technology level in order to derive technology devel-opment priorities by topic, and trend analysis was performed through time series analysis to predict future prospects. The importance analysis aims to evaluate the current technol-ogy level, and in this analysis, the technology level map was used to evaluate the relative level of the technology. As shown in Figure 2, the technology level map uses the number of patent applications as a quantitative evaluation criterion and applies the number of IPCs which is patent citations as a qualitative evaluation criterion. Define the X-axis as the Technological Activity Index (TAI) for the quantitative assessment of a technique. As more patents are filed, it is indicated that the technology is growing rapidly. The Y-axis implies the Technology Impact Index (TII) for the qualitative evaluation of a technology. It is suitable as an evaluation index because it cites previous patents in developing new technologies [107]. Therefore, in order to evaluate the current level of the blank technology field, we conduct a materiality analysis through the technology level map. Through the technology level map, technology fields can be located in the 1st, 2nd, 3rd, and 4th quad-rants. ○1 In the first quadrant, both TAI and TII indicators are high, which is defined as high level, and ○2 in the second and ○3 third quadrants, one of the TAI and TII indica-tors is high and is defined as medium level. Finally, ○4 the fourth quadrant is defined as the low level where all indicators are low [108,109].
Figure 2. Technology level map.
Trend analysis aims to predict the future of technology. We apply the Time series method for predicting future trends, which are historical data. Time series data consist of time point and frequency, and time point becomes an independent variable and frequency becomes a dependent variable to predict the future through statistical methods [110]. Alt-hough various predictive analysis models exist in time series analysis. In this study, we apply the ARIMA model, which reflects the autocorrelation of previous values. As shown
Figure 2. Technology level map.
Trend analysis aims to predict the future of technology. We apply the Time seriesmethod for predicting future trends, which are historical data. Time series data consist oftime point and frequency, and time point becomes an independent variable and frequencybecomes a dependent variable to predict the future through statistical methods [110].Although various predictive analysis models exist in time series analysis. In this study,we apply the ARIMA model, which reflects the autocorrelation of previous values. Asshown in the figure example in Figure 3, based on the derived trend results of thetechnological field, the fields of increasing interest are defined as hot fields, the fields ofdecreasing interest are defined as cold fields, and if there is a certain trend, it is analyzedas an active field [111].

Sustainability 2022, 14, 5430 11 of 30
Sustainability 2022, 14, x FOR PEER REVIEW 11 of 31
in the figure example in Figure 3, based on the derived trend results of the technological field, the fields of increasing interest are defined as hot fields, the fields of decreasing in-terest are defined as cold fields, and if there is a certain trend, it is analyzed as an active field [111].
Figure 3. Trend analysis example.
3.2.4. Identification of Vacant Technology We develop a GTM-based patent map by using the Patent-Keyword matrix to iden-
tify vacant technologies. In the GTM-based patent map, patents are mapped in two di-mensions according to the distribution of words for each patent document. The GTM-based patent map consists of a grid of map size N × N. There are no rules for determining map size. If the map size is too small, vacant nodes cannot be identified, and if the map size is too large, there are too many blank nodes to analyze. Therefore, this study deter-mines the map size at which the initial blanking technique is identified by starting with a small size and gradually increasing the map size to derive a developable blanking tech-nique. The GTM-based patent map developed in this way is divided into two nodes as shown in Figure 4; a node where a patent exists and a blank node where a patent does not exist. Vacant technology identifies by connecting blank nodes for which no patents exist. Patents belonging to the surrounding nodes must be analyzed to define the corresponding Vacant technology. Since various patents exist in the nodes around, we define a space technique based on the distribution of words belonging to those patents.
(a) (b)
Figure 4. GTM-based patent map: (a) Schematic of GTM-based patent map: The dark blue and light blue area is where the patent exists in the node, which can be interpreted as a situation where tech-nology development has taken place.; (b) Description of GTM-based patent map: Red area for va-cant technologies, yellow area for analysis area.
Figure 3. Trend analysis example.
3.2.4. Identification of Vacant Technology
We develop a GTM-based patent map by using the Patent-Keyword matrix to identifyvacant technologies. In the GTM-based patent map, patents are mapped in two dimensionsaccording to the distribution of words for each patent document. The GTM-based patentmap consists of a grid of map size N × N. There are no rules for determining map size.If the map size is too small, vacant nodes cannot be identified, and if the map size is toolarge, there are too many blank nodes to analyze. Therefore, this study determines themap size at which the initial blanking technique is identified by starting with a smallsize and gradually increasing the map size to derive a developable blanking technique.The GTM-based patent map developed in this way is divided into two nodes as shownin Figure 4; a node where a patent exists and a blank node where a patent does not exist.Vacant technology identifies by connecting blank nodes for which no patents exist. Patentsbelonging to the surrounding nodes must be analyzed to define the corresponding Vacanttechnology. Since various patents exist in the nodes around, we define a space techniquebased on the distribution of words belonging to those patents.
Sustainability 2022, 14, x FOR PEER REVIEW 11 of 31
in the figure example in Figure 3, based on the derived trend results of the technological field, the fields of increasing interest are defined as hot fields, the fields of decreasing in-terest are defined as cold fields, and if there is a certain trend, it is analyzed as an active field [111].
Figure 3. Trend analysis example.
3.2.4. Identification of Vacant Technology We develop a GTM-based patent map by using the Patent-Keyword matrix to iden-
tify vacant technologies. In the GTM-based patent map, patents are mapped in two di-mensions according to the distribution of words for each patent document. The GTM-based patent map consists of a grid of map size N × N. There are no rules for determining map size. If the map size is too small, vacant nodes cannot be identified, and if the map size is too large, there are too many blank nodes to analyze. Therefore, this study deter-mines the map size at which the initial blanking technique is identified by starting with a small size and gradually increasing the map size to derive a developable blanking tech-nique. The GTM-based patent map developed in this way is divided into two nodes as shown in Figure 4; a node where a patent exists and a blank node where a patent does not exist. Vacant technology identifies by connecting blank nodes for which no patents exist. Patents belonging to the surrounding nodes must be analyzed to define the corresponding Vacant technology. Since various patents exist in the nodes around, we define a space technique based on the distribution of words belonging to those patents.
(a) (b)
Figure 4. GTM-based patent map: (a) Schematic of GTM-based patent map: The dark blue and light blue area is where the patent exists in the node, which can be interpreted as a situation where tech-nology development has taken place.; (b) Description of GTM-based patent map: Red area for va-cant technologies, yellow area for analysis area.
Figure 4. GTM-based patent map: (a) Schematic of GTM-based patent map: The dark blue andlight blue area is where the patent exists in the node, which can be interpreted as a situation wheretechnology development has taken place.; (b) Description of GTM-based patent map: Red area forvacant technologies, yellow area for analysis area.

Sustainability 2022, 14, 5430 12 of 30
4. Result4.1. Step 1: Patent Search Using News Data4.1.1. News Data Crawling and Patent Search Formula Derivation
In order to collect issues in the distribution and logistics industry, using the R’rvestpackage, as shown in Table 1, 18 websites of representative economic newspapers andlogistics magazines with industry-related news searched for logistics and retail as keywordsin Google were searched. From January 2016 to August 2021, 1132 documents were searchedand collected.
Table 1. Crawling Sites.
News Sites
Supply Chain Digital, Business Standard, Yahoo Finance, Freightwaves, Logistics Management, Bloomberg,The Business Times, Supply Chain Quarterly, The Business Journals, China.org, Hellenic Shipping News Worldwide, Business Wire,
The Wall Street Journal, Financial Express, Air Cargo News, Forbes, Supply Chain Management Review, The Economic Times,Inbound Logistics
First, data preprocessing was performed to remove unnecessary words from thecollected data. In data preprocessing, stopwords and special characters were removed.Before the frequency calculation and topic modeling of the extracted morpheme words,words that are not of high semantic value were removed.
The frequency of the occurrence of words was calculated for the data to which pre-processing was applied, and a topic modeling algorithm was applied. After vectorizingthe words extracted from the crawled data into a word-document matrix, the top 20 high-frequency words were output as graphs using Python’s matpplot visualization librarymodule as Figure 5.
Sustainability 2022, 14, x FOR PEER REVIEW 12 of 31
4. Result 4.1. Step 1: Patent Search Using News Data 4.1.1. News Data Crawling and Patent Search Formula Derivation
In order to collect issues in the distribution and logistics industry, using the R’rvest package, as shown in Table 1, 18 websites of representative economic newspapers and logistics magazines with industry-related news searched for logistics and retail as key-words in Google were searched. From January 2016 to August 2021, 1132 documents were searched and collected.
Table 1. Crawling Sites.
News Sites Supply Chain Digital, Business Standard, Yahoo Finance, Freightwaves, Logistics Management, Bloomberg,
The Business Times, Supply Chain Quarterly, The Business Journals, China.org, Hellenic Shipping News World-wide, Business Wire, The Wall Street Journal, Financial Express, Air Cargo News, Forbes, Supply Chain Manage-
ment Review, The Economic Times, Inbound Logistics
First, data preprocessing was performed to remove unnecessary words from the col-lected data. In data preprocessing, stopwords and special characters were removed. Be-fore the frequency calculation and topic modeling of the extracted morpheme words, words that are not of high semantic value were removed.
The frequency of the occurrence of words was calculated for the data to which pre-processing was applied, and a topic modeling algorithm was applied. After vectorizing the words extracted from the crawled data into a word-document matrix, the top 20 high-frequency words were output as graphs using Python’s matpplot visualization library module as Figure 5.
Figure 5. Top 20 high-frequency words.
The Word Embedding model, which is a Skip-gram model based on Word2Vec, was applied to classify the significant similarity between the vectors of each occurrence word. This model is an unsupervised learning-based model that learns by inferring contexts that appear from words.
The K-means algorithm was used to obtain an appropriate number of clusters from the data. A state with a small value of cohesion while classifying into not too many cluster can be said to be an appropriate number of clusters. The degree of aggregation is con-firmed by the inertia value. To determine the K value, we drew a ‘Cohesion according to
Figure 5. Top 20 high-frequency words.
The Word Embedding model, which is a Skip-gram model based on Word2Vec, wasapplied to classify the significant similarity between the vectors of each occurrence word.This model is an unsupervised learning-based model that learns by inferring contexts thatappear from words.
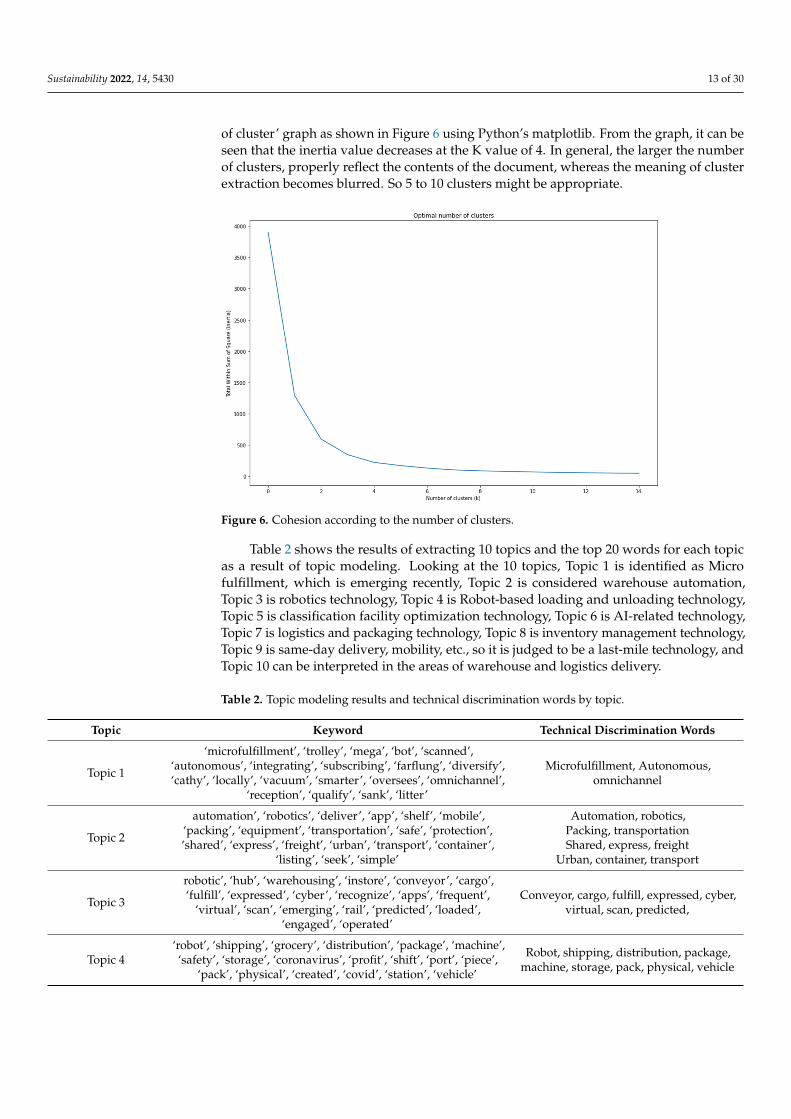
The K-means algorithm was used to obtain an appropriate number of clusters from thedata. A state with a small value of cohesion while classifying into not too many cluster canbe said to be an appropriate number of clusters. The degree of aggregation is confirmed bythe inertia value. To determine the K value, we drew a ‘Cohesion according to the number
Sustainability 2022, 14, 5430 13 of 30
of cluster’ graph as shown in Figure 6 using Python’s matplotlib. From the graph, it can beseen that the inertia value decreases at the K value of 4. In general, the larger the numberof clusters, properly reflect the contents of the document, whereas the meaning of clusterextraction becomes blurred. So 5 to 10 clusters might be appropriate.
Sustainability 2022, 14, x FOR PEER REVIEW 13 of 31
the number of cluster’ graph as shown in Figure 6 using Python’s matplotlib. From the graph, it can be seen that the inertia value decreases at the K value of 4. In general, the larger the number of clusters, properly reflect the contents of the document, whereas the meaning of cluster extraction becomes blurred. So 5 to 10 clusters might be appropriate.
Figure 6. Cohesion according to the number of clusters.
Table 2 shows the results of extracting 10 topics and the top 20 words for each topic as a result of topic modeling. Looking at the 10 topics, Topic 1 is identified as Micro ful-fillment, which is emerging recently, Topic 2 is considered warehouse automation, Topic 3 is robotics technology, Topic 4 is Robot-based loading and unloading technology, Topic 5 is classification facility optimization technology, Topic 6 is AI-related technology, Topic 7 is logistics and packaging technology, Topic 8 is inventory management technology, Topic 9 is same-day delivery, mobility, etc., so it is judged to be a last-mile technology, and Topic 10 can be interpreted in the areas of warehouse and logistics delivery.
Table 2. Topic modeling results and technical discrimination words by topic.
Topic Keyword Technical Discrimination Words
Topic 1
‘microfulfillment’, ‘trolley’, ‘mega’, ‘bot’, ‘scanned’, ‘autonomous’, ‘integrating’, ‘subscribing’, ‘farflung’, ‘diversify’, ‘cathy’, ‘locally’, ‘vacuum’, ‘smarter’, ‘oversees’, ‘omnichannel’, ‘reception’, ‘qual-
ify’, ‘sank’, ‘litter’
Microfulfillment, Autonomous, omnichannel
Topic 2
automation’, ‘robotics’, ‘deliver’, ‘app’, ‘shelf’, ‘mobile’, ‘packing’, ‘equipment’, ‘transportation’, ‘safe’, ‘protection’, ‘shared’, ‘ex-press’, ‘freight’, ‘urban’, ‘transport’, ‘container’, ‘listing’, ‘seek’,
‘simple’
Automation, robotics, Packing, transportation Shared, express, freight
Urban, container, transport
Topic 3 robotic’, ‘hub’, ‘warehousing’, ‘instore’, ‘conveyor’, ‘cargo’, ‘fulfill’, ‘expressed’, ‘cyber’, ‘recognize’, ‘apps’, ‘frequent’, ‘virtual’, ‘scan’,
‘emerging’, ‘rail’, ‘predicted’, ‘loaded’, ‘engaged’, ‘operated’
Conveyor, cargo, fulfill, expressed, cyber, virtual, scan, predicted,
Topic 4 ‘robot’, ‘shipping’, ‘grocery’, ‘distribution’, ‘package’, ‘machine’,
‘safety’, ‘storage’, ‘coronavirus’, ‘profit’, ‘shift’, ‘port’, ‘piece’, ‘pack’, ‘physical’, ‘created’, ‘covid’, ‘station’, ‘vehicle’]
Robot, shipping, distribution, pack-age, machine, storage, pack, physi-
cal, vehicle
Figure 6. Cohesion according to the number of clusters.
Table 2 shows the results of extracting 10 topics and the top 20 words for each topicas a result of topic modeling. Looking at the 10 topics, Topic 1 is identified as Microfulfillment, which is emerging recently, Topic 2 is considered warehouse automation,Topic 3 is robotics technology, Topic 4 is Robot-based loading and unloading technology,Topic 5 is classification facility optimization technology, Topic 6 is AI-related technology,Topic 7 is logistics and packaging technology, Topic 8 is inventory management technology,Topic 9 is same-day delivery, mobility, etc., so it is judged to be a last-mile technology, andTopic 10 can be interpreted in the areas of warehouse and logistics delivery.
Table 2. Topic modeling results and technical discrimination words by topic.
Topic Keyword Technical Discrimination Words
Topic 1
‘microfulfillment’, ‘trolley’, ‘mega’, ‘bot’, ‘scanned’,‘autonomous’, ‘integrating’, ‘subscribing’, ‘farflung’, ‘diversify’,‘cathy’, ‘locally’, ‘vacuum’, ‘smarter’, ‘oversees’, ‘omnichannel’,
‘reception’, ‘qualify’, ‘sank’, ‘litter’
Microfulfillment, Autonomous,omnichannel
Topic 2
automation’, ‘robotics’, ‘deliver’, ‘app’, ‘shelf’, ‘mobile’,‘packing’, ‘equipment’, ‘transportation’, ‘safe’, ‘protection’,‘shared’, ‘express’, ‘freight’, ‘urban’, ‘transport’, ‘container’,
‘listing’, ‘seek’, ‘simple’
Automation, robotics,Packing, transportationShared, express, freight
Urban, container, transport
Topic 3
robotic’, ‘hub’, ‘warehousing’, ‘instore’, ‘conveyor’, ‘cargo’,‘fulfill’, ‘expressed’, ‘cyber’, ‘recognize’, ‘apps’, ‘frequent’,
‘virtual’, ‘scan’, ‘emerging’, ‘rail’, ‘predicted’, ‘loaded’,‘engaged’, ‘operated’
Conveyor, cargo, fulfill, expressed, cyber,virtual, scan, predicted,
Topic 4‘robot’, ‘shipping’, ‘grocery’, ‘distribution’, ‘package’, ‘machine’,‘safety’, ‘storage’, ‘coronavirus’, ‘profit’, ‘shift’, ‘port’, ‘piece’,
‘pack’, ‘physical’, ‘created’, ‘covid’, ‘station’, ‘vehicle’
Robot, shipping, distribution, package,machine, storage, pack, physical, vehicle

Sustainability 2022, 14, 5430 14 of 30
Table 2. Cont.
Topic Keyword Technical Discrimination Words
Topic 5
‘automate’, ‘disruption’, ‘algorithm’, ‘profitability’, ‘receiving’,‘fulfilled’, ‘robust’, ‘parcel’, ‘repair’, ‘map’, ‘capability’,
‘distributor’, ‘corridor’, ‘outdoor’, ‘packaging’, ‘intelligent’,‘scanner’, ‘monitored’, ‘crowded’, ‘offline’
Receiving, fulfilled, robust, parcel, repair,distributor, packaging, intelligent,
scanner, crowed
Topic 6
‘automated’, ‘electronics’, ‘convenience’, ‘maintain’,‘productivity’, ‘protect’, ‘artificial’, ‘emerged’, ‘unloading’,‘drone’, ‘secure’, ‘route’, ‘responsible’, ‘supplier’, ‘cloud’,
‘quick’, ‘pickup’, ‘broker’, ‘dealing’, ‘cool’
Automated, electronics, artificial,unloading, drone, secure, route, cloud,
pickup, cool
Topic 7
‘packer’, ‘sorting’, ‘loading’, ‘courier’, ‘transformation’,‘shelving’, ‘bigbox’, ‘maritime’, ‘pricing’, ‘consolidation’,
‘brokerage’, ‘forwarding’, ‘trunk’, ‘uber’, ‘supplement’, ‘lifting’,‘panic’, ‘crossborder’, ‘visible’, ‘unload’
Packer, sorting, loading, transformation,shelving, maritime, consolidation,
forwarding, trunk, crossborder, visible
Topic 8
‘inventory’, ‘ship’, ‘article’, ‘search’, ‘energy’, ‘particularly’,‘fresh’, ‘approach’, ‘measure’, ‘picked’, ‘factory’, ‘considered’,‘leading’, ‘investigation’, ‘complex’, ‘forecast’, ‘intelligence’,
‘traffic’, ‘picker’, ‘arm’
Inventory, ship, fresh, picked, forecast,intelligence, traffic, picker, arm
Topic 9
‘sameday’, ‘forklift’, ‘automating’, ‘shipper’, ‘emission’,‘subscription’, ‘lastmile’, ‘mobility’, ‘optimize’, ‘indoor’,
‘sustainable’, ‘recycling’, ‘arbitrator’, ‘fireplace’, ‘secretly’,‘varied’, ‘reliable’, ‘iconic’, ‘subscriber’, ‘flex’
Automating, forklift, emission, lastmile,mobility, recycling,
Topic 10
‘warehouse’, ‘ecommerce’, ‘share’, ‘big’, ‘put’, ‘delivery’,‘fulfillment’, ‘facility’, ‘sort’, ‘stock’, ‘international’, ‘pick’,‘sense’, ‘picking’, ‘labor’, ‘security’, ‘pandemic’, ‘decision’,
‘platform’, ‘location’
Warehouse, share, big, put, delivery,fulfillment, facility, sort, stock, pick, sense,
picking, labor, security, platform
The redundancy was removed from the 200 words, and 30 terms related to logisticstechnology were extracted. The results are shown in Table 3. The extracted keywords weremainly composed of words frequently seen in news or on the Internet and terms used inthe domain of the logistics industry.
Table 3. Logistics technology related term keywords for patent search.
Keyword
Warehouse, fulfillment, ecommerce, lastmile, omnichannel, autonomous, automation, share, robot, platform, express, cyber,physical, virtual, pick, pack, storage, artificial, intelligent, loading, drone, secure, cool, sort, visible, mobility, recycling, big, crowed,
predict, cloud, delivery, shipping, freight, vehicle, electric
4.1.2. Valid Patent Collection
In this analysis, Korean, Chinese, American, and European published/registeredpatents were extracted from January 2000 to June 2021 through the WIPSON database.The patent search formula was prepared based on the issue keywords obtained throughthe keyword extraction of news data related to the distribution and logistics industry, andpatents in related fields were searched. In addition, for the convenience of searching, wesearched and collected data by combining issue keywords based on the industry standardprocess of distribution and logistics. When preparing the patent search formula, sampledata were checked by dictionary keyword search, and when the amount of valid data wereinsufficient and there were a lot of unnecessary data, the IPC code was partially used forthe convenience of the classification of validity. A total of 13,382 patent data were extractedthrough the patent search formula for each process in Table 4, and 6985 patent data werefinally analyzed through the valid patent selection process.

Sustainability 2022, 14, 5430 15 of 30
Table 4. Patent search formula by process.
Logistics High Level Process Search Expression Number ofData
Number ofValid Data
Customs
(logistics or customs) and (Freight or transport* or warehouse orfulfillment or retail or ecommerce or last or delivery or shipping or
robot or automate* or tech* or order or online or mobile or truck or portor marine or vehicle or “supply chain” or SCM or pick* or pack* or
electric or big)) AND (G06*) IPC.
362 99
International transport
(logistics or international or overseas) and (Freight or transport* ormarketplace or warehouse or fulfillment or retail or ecommerce or lastor delivery or shipping or robot or automate* or tech* or order or online
or mobile or truck or port or marine or vehicle or “supply chain” orSCM or pick* or pack* or electric or green or big)
1256 181
Transport
(logistics or transportation or “line-haul”) and (Freight or transport* ormarketplace or warehouse or fulfillment or retail or ecommerce or lastor delivery or shipping or robot or automate* or tech* or order or online
or mobile or truck or port or marine or vehicle or “supply chain” orSCM or pick* or pack* or electric or green or big)
702 475
Distribution
(logistics or distribution) and (Freight or transport* or marketplace orwarehouse or fulfillment or retail or ecommerce or last or delivery or
shipping or robot or automate* or tech* or order or online or mobile ortruck or port or marine or vehicle or “supply chain” or SCM or pick* or
pack* or electric or green or big)
1885 1382
sorting
(logistics or sorting or sort*) and (Freight or transport* or marketplaceor warehouse or fulfillment or retail or ecommerce or last or delivery orshipping or robot or automate* or tech* or order or online or mobile ortruck or port or marine or vehicle or “supply chain” or SCM or pick* or
pack* or electric or green or big)
2318 2187
order
(logistics or order) and (Freight or transport* or marketplace orwarehouse or fulfillment or retail or ecommerce or last or delivery or
shipping or robot or automate* or tech * or online or mobile or truck orport or marine or vehicle or “supply chain” or SCM or pick* or pack* or
electric or big)
1324 473
Warehouse
(logistics or fulfillment or warehouse) and (Freight or transport* ormarketplace or retail or ecommerce or last or delivery or shipping or
robot or automate* or tech* or order or online or mobile or truck or portor marine or vehicle or “supply chain” or SCM or pick* or pack* or
electric or green or big)
1396 1330
delivery
(logistics or delivery or deliver*) and (Freight or transport* ormarketplace or warehouse or fulfillment or retail or ecommerce or lastor shipping or robot or automate* or tech* or order or online or mobileor truck or port or marine or vehicle or “supply chain” or SCM or pick*
or pack* or electric or green or big)
533 487
Return
(logistics or return or reverse) and (Freight or transport* or marketplaceor warehouse or fulfillment or retail or ecommerce or last or shipping orrobot or automate* or tech* or order or online or mobile or truck or port
or marine or vehicle or “supply chain” or SCM or pick* or pack* orelectric or green or big)
544 39
Customer service
(logistics or customer or “customer service” or “help desk” or “callcenter” or “after service”) and (Freight or transport* or marketplace orwarehouse or fulfillment or retail or ecommerce or last or shipping orrobot or automate* or online or mobile or truck or port or marine or
vehicle or “supply chain” or SCM or pick* or pack* or electric or big)
561 332
Total 10,901 6985
*: The * mark is a search operator, and all documents with a word of any length after * are searched.

Sustainability 2022, 14, 5430 16 of 30
4.2. Step 2: Technology Clustering through Patent Analysis4.2.1. Clustering of Technical Fields
Cluster analysis is necessary to classify the collected patent data into technicalfields. For cluster analysis, the number of clusters (K) must be determined in advance.The number of clusters (K) is possible through the complexity algorithm and silhouetteanalysis of the language model. The complexity algorithm of the language modelindicates that the lower the complexity value, the better the result of the data isreflected. Silhouette analysis is evaluated numerically based on clustering betweendata. When the complexity value is the lowest, an overfitting problem occurs in whichthe model over-learns the data. Therefore, in this study, the number of clusters (K)is at the point when the complexity value sharply decreases and the time when thesilhouette number is minimized. The optimal number of clusters was determined.The figure below shows the complexity graph of the data according to the number ofdifferent clusters (K) and the graph of the silhouette analysis result. In the complexitygraph, the final number of clusters (K) was determined by deriving 15 points at whichthe number of silhouettes was the minimum and the point at which the number ofsilhouettes was the minimum as shown in Figure 7.
Sustainability 2022, 14, x FOR PEER REVIEW 16 of 31
marine or vehicle or “supply chain” or SCM or pick* or pack* or electric or big)
Total 10,901 6985 *: The * mark is a search operator, and all documents with a word of any length after * are searched.
4.2. Step 2: Technology Clustering through Patent Analysis 4.2.1. Clustering of Technical Fields
Cluster analysis is necessary to classify the collected patent data into technical fields. For cluster analysis, the number of clusters (K) must be determined in advance. The num-ber of clusters (K) is possible through the complexity algorithm and silhouette analysis of the language model. The complexity algorithm of the language model indicates that the lower the complexity value, the better the result of the data is reflected. Silhouette analysis is evaluated numerically based on clustering between data. When the complexity value is the lowest, an overfitting problem occurs in which the model over-learns the data. There-fore, in this study, the number of clusters (K) is at the point when the complexity value sharply decreases and the time when the silhouette number is minimized. The optimal number of clusters was determined. The figure below shows the complexity graph of the data according to the number of different clusters (K) and the graph of the silhouette anal-ysis result. In the complexity graph, the final number of clusters (K) was determined by deriving 15 points at which the number of silhouettes was the minimum and the point at which the number of silhouettes was the minimum as shown in Figure 7.
(a) (b)
Figure 7. Optimal number of clusters (K): (a) Complexity results graph; (b) silhouette result graph.
Table 5 shows the results of extracting major patents included in 15 clusters and iden-tifying topics through patent content analysis. Five major patents were selected for the topic in the cluster, and the topic name was defined. Topic 1, Topic 3, and Topic 8 were classified into clustering, but similarity exists in the content of the patent and was identi-fied as a sorting-related technology. In addition, Topic 2 and Topic 9 were identified as distribution areas, but Topic 2 was closer to the SW area, and Topic 9 tended to be closer to HW or tool, but the overall patent content had a common tendency. Topic 4 and topic 13 were related to the logistics information management area, and Topic 5 was related to packaging equipment and sorting equipment. Topic 6 has patents for simulation and eval-uation methods, so it was judged as an intelligent logistics management area. Topic 7 was identified as the Delivery area because there were patents for delivery and related systems and delivery methods. In the case of Topics 10 and 11, there are similar patents in terms of warehouse management. Topic 10 had warehouse control system related patents for facility or AGV operation. Topic 12 had equipment-oriented patents for material handling. Topic 13 had patents related to the display and acquisition devices of logistics infor-mation. Topic 14 had sensor and cold chain related patents. Finally, Topic 15 was occupied by Robot in Warehouse Relevant patents, so it was identified as the Robot area.
Figure 7. Optimal number of clusters (K): (a) Complexity results graph; (b) silhouette result graph.
Table 5 shows the results of extracting major patents included in 15 clusters andidentifying topics through patent content analysis. Five major patents were selected forthe topic in the cluster, and the topic name was defined. Topic 1, Topic 3, and Topic 8were classified into clustering, but similarity exists in the content of the patent andwas identified as a sorting-related technology. In addition, Topic 2 and Topic 9 wereidentified as distribution areas, but Topic 2 was closer to the SW area, and Topic 9tended to be closer to HW or tool, but the overall patent content had a commontendency. Topic 4 and topic 13 were related to the logistics information managementarea, and Topic 5 was related to packaging equipment and sorting equipment. Topic 6has patents for simulation and evaluation methods, so it was judged as an intelligentlogistics management area. Topic 7 was identified as the Delivery area because therewere patents for delivery and related systems and delivery methods. In the case ofTopics 10 and 11, there are similar patents in terms of warehouse management. Topic 10had warehouse control system related patents for facility or AGV operation. Topic 12had equipment-oriented patents for material handling. Topic 13 had patents relatedto the display and acquisition devices of logistics information. Topic 14 had sensorand cold chain related patents. Finally, Topic 15 was occupied by Robot in WarehouseRelevant patents, so it was identified as the Robot area.

Sustainability 2022, 14, 5430 17 of 30
Table 5. 15 Major Patents by Topic.
Cluster 5 Major Patents in Cluster
Topic 1(sorting)
- Express sorting and conveying device- Express delivery letter sorting loading and unloading conveyor- Automatic sorting system for logistics- Express parcel sorting machine for logistics transportation- Logistics piece sorting equipment
Topic 2(distribution)
- Warehouse logistics distribution automatic control management system- User-based logistics distribution information feedback system and method- Unmanned logistics storage goods shelf general assembly and warehouse automatic soring,
taking and distributing system- Logistics warehouse management system based on mobile internet of things- Logistics distribution terminal device
Topic 3(sorting)
- Logistics automatic sorting equipment- Rapid sorting device for express packages- Transportation device for logistics centralized sorting- Intelligent carrying robot with convenient and fast use function for logistics distribution- Conveying device special for automatic logistics sorting system
Topic 4(logistics
information management)
- Collecting -distributing logistics management platform based on app- Intelligent logistics management system- Remote communication cabinet opening driving device for e-commerce logistics delivery box- Dynamic scheduling method for processing newly added express pickup demands during
express distribution process- Delivery logistics management method and device based on block chain, terminal, and
storage medium
Topic 5(packaging)
- Vacuum packaging machine for logistics warehouse- Intelligent robot is patrolled and examined in commodity circulation express
delivery warehouse- Sorting and packaging table for logistics- Feeding and sorting integrated logistics packaging platform- Packaging robot facilitating logistics distribution
Topic 6(intelligent
logistics management)
- Intelligent logistics window and delivery method and collection method thereof- Cloud computing-based logistics express commodity distribution evaluation database
establishment analysis method- Simulation method for sorting line of logistics distribution center- Logistics warehouse device and unmanned logistics distribution equipment comprising same- Stock calculation method of distributed type integrated-project storage logistics system
Topic 7(Delivery)
- Intelligent express cabinet system and distribution method thereof- Unmanned logistics vehicle distribution method and system based on motion analysis- Automatic logistics goods allocation truck- Unmanned express vehicle, unmanned express distribution system, and automatic distribution
method of unmanned express distribution system- Logistics management method capable of monitoring cargo operation state and judging
driving route
Topic 8(sorting)
- Logistics sorting device with horizontal pushing device- Sorting device for logistics storage- Sorting structure of narrow-band type logistics sorting machine- Intelligent sorting logistics robot- Express item sorting belt conveying line

Sustainability 2022, 14, 5430 18 of 30
Table 5. Cont.
Cluster 5 Major Patents in Cluster
Topic 9(distribution)
- Buffer apparatus for stereo logistics warehouse shelf- Logistics distribution point addressing method and device, electronic equipment, and
storage medium- Logistics order optimal distribution system and method with privacy protection function- Logistics mobile electronic delivery system- Logistics distribution service system, logistics distribution terminal device, and logistics
distribution method
Topic 10(warehouse control)
- Novel automobile logistics rotation goods shelf that delivers- Novel AGV logistics distribution dolly- Integrated logistics warehousing control system- Automated guide vehicle (AGV) for express delivery logistics warehouse and control system
of AGV- Cloud-warehouse order processing system used for omni-channel retailing
Topic 11(warehouse management)
- System of warehouse and logistic services- Logistics intelligent sorting evaluation system- Warehousing logistics door system based on UHF RFID technology- Movable goods shelf for warehouse logistics management- Order management system based on third-party logistical business
Topic 12(material handling)
- Warehouse logistics transporting tray- Carrying robot and warehouse logistics system- Warehouse logistics pallet stack arrangement device- Shuttle vehicle assembly of logistics sorting carriage based on urban public transportation type
freight transport- Warehouse logistics goods loading and unloading automatic carrying and conveying
intelligent equipment
Topic 13(Logistics information)
- Code spraying device for logistics management warehouse- Method for purchasing new retail warehouse logistics delivery internet commodities via
two-dimensional codes- Rapid information acquisition device for logistics sorting- Control scheduling method of multi-Agent regional logistics distribution system- Image acquisition device and express item sorting device
Topic 14(cold chain)
- Cold-chain logistics real-time environment monitoring and positioning system- Total asset visibility management system based on Internet of Things technology- Cold-chain logistics transportation truck temperature control system- Cold-chain logistics profit distribution system based on block chain- Cold-chain logistics express delivery distribution device
Topic 15(Robot)
- Inspection robot for logistics warehouse- Warehouse logistics robot and article identification method and chip thereof- Walking robot lamplight indication system, method and device, terminal, and storage medium- Warehousing logistics robot control system based on MSP430- Loading robot for logistics distribution
4.2.2. Technical Field Assessment
Logistics technology was divided into 15 detailed technical fields through the LDAalgorithm. In order to derive a technology development roadmap for the logistics industry,it is necessary to identify promising fields of technology. In order to confirm the potential ofthe technology field, we conducted qualitative evaluation of network analysis, technologylevel map analysis, and quantitative evaluation of trend analysis.
Network analysis, one of the qualitative evaluations analyses, converts the patent-keyword matrix into a topic-keyword matrix and confirms the linkage between topics.The network analysis result is shown in Table 6. We analyzed mediation centrality, proximal

Sustainability 2022, 14, 5430 19 of 30
centrality, and connection centrality indicators, which are indicators that can be confirmedthrough network analysis, and the main indicators confirmed mediation centrality asthe most important in order to consider the linkage between topics. As a result, it wasconfirmed that the mediation centrality index of Topic 1 and Topic 7 recorded the highestvalue, and other indices recorded high values and were identified as a major topic.
Table 6. Network analysis results.
Topic Betweenness Closeness Connected Priority
Topic 1 7.139755 0.029412 7 2Topic 2 9.067965 0.030303 8 14Topic 3 5.955988 0.028571 6 10Topic 4 2.376623 0.027027 4 6Topic 5 1.639394 0.027778 6 3Topic 6 1.888889 0.027027 5 5Topic 7 0 0.004762 0 1Topic 8 1.5 0.026316 5 10Topic 9 1.142857 0.025641 3 8Topic 10 1.843362 0.029412 7 4Topic 11 3.452381 0.027778 5 7Topic 12 6.71912 0.030303 8 12Topic 13 5.208081 0.030303 8 9Topic 14 1.843362 0.029412 7 15Topic 15 2.222222 0.027027 5 13
Each of the 15 technical areas of logistics technology has a different current skill level.This creates uncertainty in developing the technology. Therefore, in the importance analysis,the technology level for each topic is checked through the technology level map using thenumber of claims, which means the scope of technology and the number of IPC fields.The Technology level map shows the relative level of each technology field and shows theresults, as shown in the Figure 8. Logistics technology is classified into three levels.
Sustainability 2022, 14, x FOR PEER REVIEW 20 of 31
Figure 8. Result of Technology level map.
Trend analysis, which is a quantitative analysis, is an analysis to check not only the skill level but also the future promise. Trend analysis is performed through time series analysis to confirm the potential of future technology fields. This study applies the ARIMA method to 15 logistics industry technology fields during time series analysis to identify trends. The ARIMA algorithm requires the definition of p, d, and q parameters, which are variables related to the order, difference, and moving average of the auto re-gression model. For this variable, the “auto.arima” function of the R programming pack-age is applied. In addition, since patents are published 18 months after filing, we analyzed based on the number of patent applications up to 2020. The trends in logistics technology are categorized into hot, active, and cold. As a result of the trend analysis of 15 technology fields, Topic 11 was identified as an active field continuously developed by technology, and all other topics were identified as a steadily increasing hot field. Looking at Figure 9, (a) is an ARIMA graph output for topic 11, showing an upward trend, and (b) is an AIRMA graph output for the remaining topics, which is confirmed as an active field.
(a) (b)
Figure 9. Trend Analysis Results: (a) Hot Field; (b) Active Field.
4.2.3. Identify Promising Technology Areas The results of the above integrated analysis are summarized in Table 7 below. As can
be seen from the table, the results of all analyses are absolutely inconsistent. This means that it is very important to derive promising technology fields through various analysis applications, as each analysis has a different meaning. The network analysis focused on identifying the linkages between topics, and the technology level map analyzed the tech-nology level based on the number of patent claims and the number of IPCs. Finally, trend
Figure 8. Result of Technology level map.

Sustainability 2022, 14, 5430 20 of 30
Looking at the results, Topics 1, 4, 7, 9, and 14 were identified as high level becauseall indicators had positive values, and Topics 5, 6, 8, and 12 were identified as low levelbecause all indicators had negative values.
Trend analysis, which is a quantitative analysis, is an analysis to check not only theskill level but also the future promise. Trend analysis is performed through time seriesanalysis to confirm the potential of future technology fields. This study applies the ARIMAmethod to 15 logistics industry technology fields during time series analysis to identifytrends. The ARIMA algorithm requires the definition of p, d, and q parameters, which arevariables related to the order, difference, and moving average of the auto regression model.For this variable, the “auto.arima” function of the R programming package is applied. Inaddition, since patents are published 18 months after filing, we analyzed based on thenumber of patent applications up to 2020. The trends in logistics technology are categorizedinto hot, active, and cold. As a result of the trend analysis of 15 technology fields, Topic 11was identified as an active field continuously developed by technology, and all other topicswere identified as a steadily increasing hot field. Looking at Figure 9, (a) is an ARIMAgraph output for topic 11, showing an upward trend, and (b) is an AIRMA graph outputfor the remaining topics, which is confirmed as an active field.
Sustainability 2022, 14, x FOR PEER REVIEW 20 of 31
Figure 8. Result of Technology level map.
Trend analysis, which is a quantitative analysis, is an analysis to check not only the skill level but also the future promise. Trend analysis is performed through time series analysis to confirm the potential of future technology fields. This study applies the ARIMA method to 15 logistics industry technology fields during time series analysis to identify trends. The ARIMA algorithm requires the definition of p, d, and q parameters, which are variables related to the order, difference, and moving average of the auto re-gression model. For this variable, the “auto.arima” function of the R programming pack-age is applied. In addition, since patents are published 18 months after filing, we analyzed based on the number of patent applications up to 2020. The trends in logistics technology are categorized into hot, active, and cold. As a result of the trend analysis of 15 technology fields, Topic 11 was identified as an active field continuously developed by technology, and all other topics were identified as a steadily increasing hot field. Looking at Figure 9, (a) is an ARIMA graph output for topic 11, showing an upward trend, and (b) is an AIRMA graph output for the remaining topics, which is confirmed as an active field.
(a) (b)
Figure 9. Trend Analysis Results: (a) Hot Field; (b) Active Field.
4.2.3. Identify Promising Technology Areas The results of the above integrated analysis are summarized in Table 7 below. As can
be seen from the table, the results of all analyses are absolutely inconsistent. This means that it is very important to derive promising technology fields through various analysis applications, as each analysis has a different meaning. The network analysis focused on identifying the linkages between topics, and the technology level map analyzed the tech-nology level based on the number of patent claims and the number of IPCs. Finally, trend
Figure 9. Trend Analysis Results: (a) Hot Field; (b) Active Field.
4.2.3. Identify Promising Technology Areas
The results of the above integrated analysis are summarized in Table 7 below. Ascan be seen from the table, the results of all analyses are absolutely inconsistent. Thismeans that it is very important to derive promising technology fields through variousanalysis applications, as each analysis has a different meaning. The network analysisfocused on identifying the linkages between topics, and the technology level mapanalyzed the technology level based on the number of patent claims and the number ofIPCs. Finally, trend analysis is because future trends are analyzed based on data overtime. Of course, if all three of these analyses are satisfied, it is necessary to preempt themarket by developing technology in the vacant technology field. Therefore, Topic 1 andTopic 7 are technology fields with technological promise, and countries and companiesneed to take the lead. Additionally, technology development has a high priority. Thetopic is very important, and it is judged that steady technology development will bemade. Therefore, it is necessary to intensively analyze the relevant technology field inestablishing the technology development roadmap.

Sustainability 2022, 14, 5430 21 of 30
Table 7. Integrated network analysis results.
TopicQualitative Evaluation Quantitative Evaluation
PriorityNetwork Analysis Technology Level Map Trend Analysis
Topic 1 2 High High HighTopic 2 14 Medium High LowTopic 3 10 Medium High LowTopic 4 6 High High MediumTopic 5 3 Low High MediumTopic 6 5 Low High MediumTopic 7 1 High High HighTopic 8 10 Low High MediumTopic 9 8 Medium High Medium
Topic 10 4 Medium High MediumTopic 11 7 Medium Active MediumTopic 12 12 Low High LowTopic 13 9 Medium High MediumTopic 14 15 High High LowTopic 15 13 Medium High Low
4.3. Step 3: Promising Technology Development and Technology Roadmap Development4.3.1. Identification of Vacant Technologies by Topic: GTM-Based Patent Map
To detect vacant patents in promising technology fields, a GTM-based patent mapwas designed using the patent-keyword matrix. Before developing a GTM based patentmap, we need to define a parameter called map size. There is no rule to determine the mapsize parameter, but since there is a need to develop skills for the initially identified Vacanttechnology, we started with a small map size and gradually removed the size to establishthe map size at which the vacant technology was identified. We applied a 9 × 9 sized mapfor Topic 1 and a 7 × 7 sized map for Topic 7. The Figure 10 is a visualization of the GTMresults. As can be seen in the figure below, patent vacuums can be discovered more clearlyand automatically because all patent documents are mapped to each latent grid point onthe map.
Looking at the GTM-based patent map, in Topic 1, two vacant technology fields wereidentified, and in Topic 7, three vacant technology fields were identified.
Sustainability 2022, 14, x FOR PEER REVIEW 22 of 31
(a) (b)
Figure 10. Results of GTM-based patent map: (a) Topic 1’s patent map; (b) Topic 7’s patent map.
4.3.2. Vacant Technical Analysis by Topic By examining the patents included in the vacant technology field identified through
the GTM-based patent map, the technology names that can be represented were identified as shown in Table 8. Two vacant technologies were identified.
Table 8. Patent of vacant technology identified through GTM-based patent map.
Topic 1 Group 5 Major Patents
Topic 1
1 Distribution device
technology for the de-livery and transport of
goods
- Unmanned aerial vehicle system applied to warehouse logistics of con-tainers
- Goods moving device for logistics warehousing - Logistics automatic goods distribution vehicle - Sorting-free system and method for warehouse logistics - Foldable warehouse logistics vehicle
2 Unmanned delivery
technology
- Unmanned logistics vehicle distribution method and system based onmotion analysis
- Adaptive network-centric online autonomic supply chain managementsystem
- Unmanned aerial vehicle with logistics flight-throw system - Unmanned aerial vehicle intelligent logistics distribution terminal - Unmanned aerial vehicle for logistics transportation
3 Distribution route opti-mization and monitor-
ing technology
- A logistics distribution route planning method with a time windowbased on a cuckoo algorithm
- Logistics distribution vehicle route optimization method - Logistics crowdsourcing distribution order screening method and de-
vice - Express delivery intelligent distribution system based on urban public
transportation system - Real-time reporting system for logistic dist.
Topic 7 1
Intelligent sorting de-vice technology
- Logistics sorting device and warehouse logistics sorting system - Intelligent logistics sorting device
Figure 10. Results of GTM-based patent map: (a) Topic 1’s patent map; (b) Topic 7’s patent map.

Sustainability 2022, 14, 5430 22 of 30
4.3.2. Vacant Technical Analysis by Topic
By examining the patents included in the vacant technology field identified throughthe GTM-based patent map, the technology names that can be represented were identifiedas shown in Table 8. Two vacant technologies were identified.
Table 8. Patent of vacant technology identified through GTM-based patent map.
Topic 1 Group 5 Major Patents
Topic 1
1Distribution device technology for the
delivery and transport of goods
- Unmanned aerial vehicle system applied to warehouse logisticsof containers
- Goods moving device for logistics warehousing- Logistics automatic goods distribution vehicle- Sorting-free system and method for warehouse logistics- Foldable warehouse logistics vehicle
2Unmanned delivery technology
- Unmanned logistics vehicle distribution method and systembased on motion analysis
- Adaptive network-centric online autonomic supply chainmanagement system
- Unmanned aerial vehicle with logistics flight-throw system- Unmanned aerial vehicle intelligent logistics
distribution terminal- Unmanned aerial vehicle for logistics transportation
3Distribution route optimization and
monitoring technology
- A logistics distribution route planning method with a timewindow based on a cuckoo algorithm
- Logistics distribution vehicle route optimization method- Logistics crowdsourcing distribution order screening method
and device- Express delivery intelligent distribution system based on urban
public transportation system- Real-time reporting system for logistic dist.
Topic 7
1Intelligent sorting device technology
- Logistics sorting device and warehouse logistics sorting system- Intelligent logistics sorting device- Express delivery distribution and receiving system and method
based on classification algorithm- Double-RFID logistics combined transportation flat tray- Automatic auxiliary sorting equipment for logistics storage
2Mobile based classification
device technology
- Convenient and quick express package delivery anddistribution vehicle
- Coordinate platform of logistics flying delivery system- Vehicle-mounted portable intelligent express sorting and
filling system- Automatic feeding and discharging robot for
logistics warehouse- Position distribution method for express cabinet
Topic 1 was identified as a classification technology, and as a result of searchingfor vacant patent documents for classification technology, two vacant technologies wereidentified as an intelligent classification device technology and a moving object-basedclassification device technology. This means that classification technology is an area thatstill requires a lot of labor, it is necessary to increase productivity and work efficiency,and the identification of patents for mobility response is also meaningful as a futuretechnology area.
Topic 7 was identified as a delivery system technology, and as a vacant technol-ogy in this field, distribution device technology for product delivery and transfer, un-

Sustainability 2022, 14, 5430 23 of 30
manned delivery technology, and distribution route optimization and monitoring technol-ogy were identified.
It is meaningful as a technology in the last mile area, and unmanned delivery, dis-tribution device technology for delivery suitable for product characteristics, and routeoptimization technology to monitor and control unmanned delivery are extracted asvacant technologies.
5. Conclusions5.1. Conclusions5.1.1. Deriving a Patent Search Formula Reflecting the Latest SNS Trends for LogisticsTechnology Research
This study used a keyword approach to find the data to be analyzed rather than aclassification code and company-based approach [112]. This was not to be a patent searchformula written by humans but a derived patent search that reflected the latest trends inSNS for future systemization.
Since logistics includes both intangible and tangible elements according to the defini-tion and scope of logistics, logistics-related technologies are likely to include both softwaretechnology and hardware technology [23]. Therefore, for comprehensive analysis, key-words, not business method patents, were used for all utility patents in the ‘WIPSON’database. However, although this method can reduce the probability of missing logistics-related patents, on the other hand, there is a disadvantage in that patents whose searchkeyword is not related to logistics, such as those in the medical field, are also searched.When there is a lot of irrelevant data, it takes a lot of time to manually validate the data. Inorder to improve this and, at the same time, for the convenience of search, the result of usingSNS keywords as a unit of high level process of logistics as showed in Table 9 6985 validselected patents out of 10,901 cases of total collected data, which was 64% effective.
Table 9. Patent effective ratio.
High Level Process Collected Selected Effective Ratio
Customs 362 99 27%Overseas 1256 181 14%Transport 702 475 68%
Distribution 1885 1382 73%Sorting 2318 2187 94%Order 1324 473 36%
Fulfillment/Warehouse 1396 1330 95%Delivery 553 487 88%Return 544 332 59%
Customer Service 561 332 59%Total 10,901 6985 64%
In order to reduce the time and effort of the valid selection process, which is currentlybeing handled manually, additional research is needed on a patent search formula that canincrease the effectiveness hit rate. We were able to draw conclusions, and we were able toconfirm the possibility of systematization.
5.1.2. Usefulness as a Tool for Predicting Changes in Logistics Technology and ExploringVacant Technologies
Logistics service providers were generally application-oriented as technology con-sumers rather than technology developers [113]. In an industry where the competitivedynamics due to digitalization have changed, logistics service providers no longer simplyapply technology but must create a convergence business model while developing it them-selves. The entry of logistics startups that invest in digital technology as a core competencyand the investment in logistics technology by e-commerce companies such as Amazon and

Sustainability 2022, 14, 5430 24 of 30
Alibaba mean that logistics technology should no longer be applied as a core competencybut should be viewed as a development investment.
In this situation, logistics service providers must preemptively search for developmentopportunities as well as trends in logistics technology. In addition, according to the rapidlychanging technology, the work on this needs to be thoroughly and regularly performedby the technology-related department, which requires more resources and time. In thisstudy, by classifying patent data in this regard, an overall framework for quantitativetechnological change prediction and the exploration of potential technological areas wasproposed. Through the proposed framework, representative keywords of the logisticsindustry were extracted from SNS, and patent data were collected using them. Technologytopics were identified through pre-processing and topic modeling of the collected patentdata. Based on the qualitative evaluation of the network analysis, the number of claims, andthe number of IPCs, the technology level analysis was conducted through the TechnologyLevel Map. In addition, future trend analysis according to time series analysis, which isa quantitative evaluation, was combined to confirm the promise of the technology field.Even vacant technologies of detailed technologies in the technological field with confirmedpromise were derived. Through this, it was confirmed that detailed fields of the logisticsindustry were classified as patent data, and quantitative technological change prediction inthe relevant field was possible. This method can effectively support a wide range of taskssuch as exploring the technology trends of players in the logistics industry and exploringtechnology development opportunities for establishing logistics technology roadmaps.This will soon help not only players in the logistics industry but also the government’swork to support industrial development.
5.1.3. Patent-Based Approach to Exploring Potential Technology Areas in Logistics
Technological output can appear in various forms, but most of it is expressed as apatent, and a patent can be an indicator representing technology [114]. In addition, becausepatent data meets explicit criteria for originality, technical feasibility, and commercialvalue, it includes both technical and market attributes, which can be used to identify newopportunities and plan future R&D activities. Therefore, it can be said that it is possibleto discover logistics technology opportunities by utilizing the technical information ofpatent data [115].
Several approaches can be taken to explore the technological areas with potential fordevelopment, and the number of patents included in a Cluster over time can be separatedinto phases of introduction, growth, maturity, and decline according to an S-curve. Accord-ingly, it is possible to determine which stage of the technology life cycle the patent groupis in. Another method is to measure the market share by dividing the number of patentapplications for a clustered subject by the total number of patent applications collected,and it can be judged based on two criteria that quantify the change in the subject shareby CAGR (compound annual growth rate). Subjects with a low patent share and negativeGAGR may be in the introduction stage [23]. Another view measures the radicality ofinnovation at the patent level using a citation-based index and invention content, assumingthat individual patents should have different levels of novelty and impact even if they areapplied at a similar time.
Logistics patents discovered through LDA may vary depending on the time zoneselection of the target patent. By limiting the period to only recent patents, only thosepatents related to the latest technology in logistics can be considered. However, theamount of information collected is small in the recent period. In order to see the change intechnology, we need data over a wider range of time. However, the disadvantage of datacollected over too wide a timeframe may be to consider outdated topics and risk judgingtheir importance. Therefore, this study used the entire patent data set to explore technologysubject identification and change. The derived technology is a classification technologydomain, and by confirming the correlation with the keywords positioned high in SNS, itwas possible to conclude that the results were acceptable to some extent.

Sustainability 2022, 14, 5430 25 of 30
5.2. Contribution
This study contributes to closing the gap in technological innovation research throughthe use of patent data. In addition, it demonstrates the use of the Word2Vec algorithmto derive a patent search formula for patent search, a topic modeling approach to patentdata using LDA of patent data, network analysis, technology level map, and Arima-timeseries analysis to predict technological change and derive promising technologies. Byproposing a framework, it is contributing to logistics innovation research from a researchmethodological point of view. In addition, it provides a basis for systematizing the proposedmethodology by applying a clustering algorithm based on the black box mechanism.
As a result of the proposed framework, which technology areas are emerging andimportant in the logistics industry and the derivation of detailed vacant technologies canhelp to enhance the understanding of technological change and make a technology roadmap.As a result of this study, the distribution and sorting areas for product distribution in theexisting logistics field were classified as consistently promising. In the distribution area,especially, distribution device and inventory management technology for delivery andgoods transfer, intelligent delivery method and unmanned delivery equipment technology,and route optimization and distribution monitoring technology were analyzed as still worthchallenging. In the classification area, intelligent classification algorithms and classificationdevice technology and mobile-mounted classification devices and distribution technologywere derived as vacant technologies. It can be confirmed that this coincides with thetrend of delivery, distribution, and mobility diffusion in the last mile, which is currentlywidely mentioned in the logistics field. Additionally, by predicting the importance andopportunity fields of the logistics technology field, it suggests the need for a patent strategyand technology strategy tailored to this.
Although this study explored technological change trends and technology develop-ment opportunities for the logistics industry, it can be applied to other industries as well. Ifwe crawl the news on SNS using key keywords for each industry to derive key keywordsfor the industry and apply the proposed framework by grafting the high level processwith industry characteristics, we will find technological change trends and technologydevelopment opportunities in the industry.
5.3. Discussion
Major implications of this study are to be found in the methodological aspect and themanagement aspect of logistics service providers.
In this study, a more diverse and systematic analysis process was applied in compari-son with previous studies for the purpose of improving the accuracy of the research resultsand increasing the usability of the research results. There have been previous studies topredict the innovative trends in logistics technologies and to identify promising future tech-nologies using topic modeling, but they only searched for the gaps in specific technologiesor looked at the overall technology trends. There was no framework study premised onthe systematization of the entire process from predicting the technological changes in thelogistics industry to discovering promising technologies. To bridge this gap, we combinedvarious analytical techniques on this subject.
The methodological differentiation of this study is that, first, the patent search keywordextraction process through news data crawling is added so that expert intervention is notrequired. Second, patent search of classification-based and company-based approachesmay be limited with a limited data range, and if a keyword-based approach is used tocompensate for this, there is no missing data, but patent data in an area too far from thesubject is also extracted. As a result, a lot of time and effort is required in the process ofselecting valid data. To improve that case, in this study, the quality of patent search wasimproved by combining the keywords extracted from SNS with the mega-process words ofthe logistics industry. Third, in identifying promising areas through LDA-based clustering,a multidimensional analysis technique was applied by combining not only time seriesanalysis, which is the existing quantitative trend evaluation technique, but also network

Sustainability 2022, 14, 5430 26 of 30
analysis and technology level map analysis, which are qualitative evaluations. This allowedfor clearer targeting of promising technology areas. In addition, it is meaningful that theprocess from the beginning of the search for promising technology to the selection oftechnology for the final roadmap is consistent by combining GTM analysis to search for thereality of specific promising technology rather than just exploring the promising technologyarea. It forms the basis for our contribution to the research of future logistics technologies.
Finally, the management implications of this study for logistics service providers can behelpful in providing a reference point for roadmap development and guiding technologymanagement tasks to actual logistics company practitioners in the implementation ofdigitalization. Because it provides a standardized process of technical research for thedigitalization of logistics companies, it can be carried out with less time and cost. Inaddition, by making learning data in areas such as the processing of unstructured data,a procedure that was carried out through the intervention of researchers in the researchprocess, it created a basis for development as an automated tool for predicting futuretechnological changes and deriving blank technologies. For the development of this study,it is necessary to further subdivide the overall process in the future and pay attention andeffort for standardization.
5.4. Limits
This study has limitations that require future research. First, there is a disadvantagethat the quality and quantity of data can be affected by keywords and search terms whensearching for a patent. For this study, two keywords, logistics and distribution, were usedin combination with the process terms of logistics and keywords representative of SNS.Nevertheless, it would not have included all patents involving logistics and state-of-the-arttechnology, and many patents not related to logistics were also included. Therefore, it isnecessary to improve the patent collection policy through a more refined patent searchformula for collecting patents in the relevant industry field. In other words, in this study,the search was conducted by a logistics process unit, but it can be used in the patentsearch formula by replacing it with a logistics business model component or a valuechain component.
Second, if the integrated analysis that combines the network analysis, technology levelmap, and time series analysis used in this study and the methods used in the previousstudies, such as technology life cycle, patent share, and CAGR method, are additionallycombined, it will be possible to analyze in more various dimensions. It will be possible tosuggest a more rational and useful form analysis method, and it will be possible to make iteasier to understand technology in real companies and to lay a practical foundation.
Third, patent data is the best source of data including technical information, but theremay be limitations in predicting future logistics technology. This is because, in the patentregistration process, it takes a considerable amount of time for an actual patent to beregistered, so even data collected with the latest time can be an opportunity for technologydevelopment two years ago. In other words, it can be said that patent data contains past andpresent technologies. As a way to supplement this, it is proposed to apply the frameworkproposed in this study to the thesis data. The thesis data have many characteristics thatare closer to the future than patents, so it will be possible to increase the probability ofpredicting future technologies. Through this, a more practical technology roadmap can bedeveloped if an empty technology with development potential and valuable developmentis derived.
Author Contributions: K.K. performed data curation, formal analysis, investigation, methodology,validation, and the writing of the original manuscript; S.C. contributed to conceptualization, investi-gation, and project administration; S.J. and Y.-J.L. contributed to data curation, methodology, andformal analysis; C.L. contributed to conceptualization, funding acquisition, investigation, supervision,and the editing of the manuscript. All authors have read and agreed to the published version ofthe manuscript.

Sustainability 2022, 14, 5430 27 of 30
Funding: This work was supported by Jungseok Logistics Foundation. This work was supported bythe National Research Foundation of Korea (NRF) grant funded by the Korea government (MSIT)(NRF-2020R1F1A1076812). This research was supported by Brain Korea 21 FOUR.
Institutional Review Board Statement: Not applicable.
Informed Consent Statement: Not applicable.
Data Availability Statement: All the data for this study is available in public domain (the sourcesare provided in the relevant sections).
Conflicts of Interest: The authors declare no conflict of interest.
References1. Urbach, N.; Röglinger, M. Introduction to digitalization cases: How organizations rethink their business for the digital age. In
Digitalization Cases; Springer: Cham, Switzerland, 2019; pp. 1–12.2. Hofmann, E.; Osterwalder, F. Third-party logistics providers in the digital age: Towards a new competitive arena? Logistics 2017,
1, 9. [CrossRef]3. Elbert, R.; Gleser, M. Digital Forwarders. In Logistics Management; Springer: Cham, Switzerland, 2019; pp. 19–31.4. Sullivan, M. Demystifying the Impacts of the Fourth Industrial Revolution on Logistics: An Introduction. In The Digital
Transformation of Logistics: Demystifying Impacts of the Fourth Industrial Revolution; Wiley Online Library: Hoboken, NJ, USA, 2021;pp. 1–19.
5. Le, T.V.; Stathopoulos, A.; Woensel, T.V.; Ukkusuri, S.V. Supply, demand, operations, and management of crowd-shipping services:A review and empirical evidence. Transp. Res. Part C Emerg. Technol. 2019, 103, 83–103. [CrossRef]
6. Chiu, W.; Cho, H. E-commerce brand: The effect of perceived brand leadership on consumers’ satisfaction and repurchaseintention on e-commerce websites. Asia Pac. J. Mark. Logist. 2019, 33, 1339–1362. [CrossRef]
7. Wu, X.; Gereffi, G. Amazon and Alibaba: Internet governance, business models, and internationalization strategies. In InternationalBusiness in the Information and Digital Age; Emerald Publishing Limited: Bingley, UK, 2018.
8. Lee, S.M.; Lee, D. “Untact”: A new customer service strategy in the digital age. Serv. Bus. 2020, 14, 1–22. [CrossRef]9. Feindt, S.; Jeffcoate, J.; Chappell, C. Identifying success factors for rapid growth in SME e-commerce. Small Bus. Econ. 2002,
19, 51–62. [CrossRef]10. Bayarçelik, E.B.; Bumin Doyduk, H.B. Digitalization of business logistics activities and future directions. In Digital Business
Strategies in Blockchain Ecosystems; Springer: Cham, Switzerland, 2020; pp. 201–238.11. Cichosz, M.; Wallenburg, C.M.; Knemeyer, A.M. Digital transformation at logistics service providers: Barriers, success factors and
leading practices. Int. J. Logist. Manag. 2020, 31, 209–238. [CrossRef]12. Ulas, D. Digital transformation process and SMEs. Procedia Comput. Sci. 2019, 158, 662–671. [CrossRef]13. Liu, X.; McKinnon, A.C.; Grant, D.B.; Feng, Y. Sources of competitiveness for logistics service providers: A UK industry
perspective. Logist. Res. 2010, 2, 23–32. [CrossRef]14. Zacharia, Z.G.; Sanders, N.R.; Nix, N.W. The emerging role of the third-party logistics provider (3PL) as an orchestrator.
J. Bus. Logist. 2011, 32, 40–54. [CrossRef]15. Kahn, K.B. Understanding innovation. Bus. Horiz. 2018, 61, 453–460. [CrossRef]16. Chapman, R.L.; Soosay, C.; Kandampully, J. Innovation in logistic services and the new business model: A conceptual framework.
Manag. Serv. Qual. Int. J. 2002, 12, 358–371. [CrossRef]17. Ivanov, D.; Dolgui, A.; Sokolov, B. The impact of digital technology and Industry 4.0 on the ripple effect and supply chain risk
analytics. Int. J. Prod. Res. 2019, 57, 829–846. [CrossRef]18. Holubcík, M.; Koman, G.; Soviar, J. Industry 4.0 in logistics operations. Transp. Res. Procedia 2021, 53, 282–288. [CrossRef]19. Kern, J. The Digital Transformation of Logistics: A Review About Technologies and Their Implementation Status. In The Digital
Transformation of Logistics: Demystifying Impacts of the Fourth Industrial Revolution; Wiley Online Library: Hoboken, NJ, USA, 2021;pp. 361–403.
20. Zhang, D.; Pee, L.G.; Cui, L. Artificial intelligence in E-commerce fulfillment: A case study of resource orchestration at Alibaba’sSmart Warehouse. Int. J. Inf. Manag. 2021, 57, 102304. [CrossRef]
21. Jin, D.H.; Kim, H.J. Integrated understanding of big data, big data analysis, and business intelligence: A case study of logistics.Sustainability 2018, 10, 3778. [CrossRef]
22. Jeong, J.Y.; Cho, G.; Yoon, J. Trend analysis on Korea’s National R&D in logistics. J. Ocean. Eng. Technol. 2020, 34, 461–468.23. Choi, D.; Song, B. Exploring technological trends in logistics: Topic modeling-based patent analysis. Sustainability 2018, 10, 2810.
[CrossRef]24. Teece, D.J. Competition, cooperation, and innovation: Organizational arrangements for regimes of rapid technological progress.
J. Econ. Behav. Organ. 1992, 18, 1–25. [CrossRef]25. Wang, J.; Hsu, C.C. A topic-based patent analytics approach for exploring technological trends in smart manufacturing. J. Manuf.
Technol. Manag. 2020, 32, 110–135. [CrossRef]

Sustainability 2022, 14, 5430 28 of 30
26. Coccia, M. The theory of technological parasitism for the measurement of the evolution of technology and technologicalforecasting. Technol. Forecast. Soc. Chang. 2019, 141, 289–304. [CrossRef]
27. Wang, C.; Geng, H.; Sun, R.; Song, H. Technological potential analysis and vacant technology forecasting in the graphene fieldbased on the patent data mining. Resour. Policy 2022, 77, 102636. [CrossRef]
28. Yoon, B.; Park, I.; Yun, D.; Park, G. Exploring promising vacant technology areas in a technology-oriented company based onbibliometric analysis and visualisation. Technol. Anal. Strateg. Manag. 2019, 31, 388–405. [CrossRef]
29. Bouzon, M.; Govindan, K.; Rodriguez, C.M.T.; Campos, L.M. Identification and analysis of reverse logistics barriers using fuzzyDelphi method and AHP. Resour. Conserv. Recycl. 2016, 108, 182–197. [CrossRef]
30. Joshi, R.; Banwet, D.K.; Shankar, R. A Delphi-AHP-TOPSIS based benchmarking framework for performance improvement of acold chain. Expert Syst. Appl. 2011, 38, 10170–10182. [CrossRef]
31. Phaal, R.; Farrukh, C.J.; Mills, J.F.; Probert, D.R. Customizing the technology roadmapping approach. In Proceedings of thePICMET’03: Portland International Conference on Management of Engineering and Technology Technology Management forReshaping the World, Portland, OR, USA, 24 July 2003; pp. 361–369.
32. Lu, H.P.; Chen, C.S.; Yu, H. Technology roadmap for building a smart city: An exploring study on methodology. Future Gener.Comput. Syst. 2019, 97, 727–742. [CrossRef]
33. Byun, J.; Sung, T.E.; Park, H.W. Technological innovation strategy: How do technology life cycles change by technological area.Technol. Anal. Strateg. Manag. 2018, 30, 98–112. [CrossRef]
34. Ernst, H. Patent information for strategic technology management. World Pat. Inf. 2003, 25, 233–242. [CrossRef]35. Rip, A.; Kemp, R. Technological change. Hum. Choice Clim. Chang. 1998, 2, 327–399.36. Abbas, A.; Zhang, L.; Khan, S.U. A literature review on the state-of-the-art in patent analysis. World Pat. Inf. 2014, 37, 3–13.
[CrossRef]37. Sarvari, P.A.; Ustundag, A.; Cevikcan, E.; Kaya, I.; Cebi, S. Technology roadmap for Industry 4.0. In Industry 4.0: Managing the
Digital Transformation; Springer: Cham, Switzerland, 2018; pp. 95–103.38. Xu, M.; David, J.M.; Kim, S.H. The fourth industrial revolution: Opportunities and challenges. Int. J. Financ. Res. 2018, 9, 90–95.
[CrossRef]39. Alonso-Mora, J.; Samaranayake, S.; Wallar, A.; Frazzoli, E.; Rus, D. On-demand high-capacity ride-sharing via dynamic trip-
vehicle assignment. Proc. Natl. Acad. Sci. USA 2017, 114, 462–467. [CrossRef] [PubMed]40. Kunze, O. Replicators, ground drones and crowd logistics a vision of urban logistics in the year 2030. Transp. Res. Procedia 2016,
19, 286–299. [CrossRef]41. Kim, J.; Yoo, J. Science and technology policy research in the EU: From Framework Programme to HORIZON 2020. Soc. Sci. 2019,
8, 153. [CrossRef]42. Hwang, D.W.; Hong, P.C.; Lee, D.Y. Critical factors that affect logistics performance: A comparison of China, Japan and Korea.
Int. J. Shipp. Transp. Logist. 2017, 9, 107–129. [CrossRef]43. Zhang, C. Research on the economical influence of the difference of regional logistics developing level in China. J. Ind.
Integr. Manag. 2020, 5, 205–223. [CrossRef]44. Sauvage, T. The relationship between technology and logistics third-party providers. Int. J. Phys. Distrib. Logist. Manag. 2003, 33,
236–253. [CrossRef]45. Dzwigol, H.; Dzwigol-Barosz, M.; Kwilinski, A. Formation of global competitive enterprise environment based on industry
4.0 concept. Int. J. Entrep. 2020, 24, 1–5.46. Zapke, M. Artificial Intelligence in Supply Chains. Ph.D. Thesis, NOVA School of Business and Economics, Carcavelos, Portugal,
4 January 2019.47. Pandey, R.; Dillip, D.; Jayant, J.; Vashishth, K.; Nikhil, N.; Qi, T.J.; Kee, D.M.H.; Mei, T.C.; Xin, R.Y.K.; Qhi, L.Y. Factors Influencing
Organization Success: A Case Study of Walmart. Int. J. Tour. Hosp. Asia Pasific 2021, 4, 112–123. [CrossRef]48. Greimel, H. Toyota deal gives SoftBank a robocar plan; Company would deliver on-demand services. Automot. News 2018, 93, 56.49. Li, L.; Qian, G.; Gaber, B. The Chinese enterprise secret: Sustained advantage in labor-intensive industries. J. Bus. Strategy 2007,
28, 26–33. [CrossRef]50. Phaal, R.; Farrukh, C.J.; Probert, D.R. Developing a technology roadmapping system. In Proceedings of the A Unifying Discipline
for Melting the Boundaries Technology Management, Portland, OR, USA, 31 July–4 August 2005; pp. 99–111.51. Trappey, C.V.; Wu, H.Y.; Taghaboni-Dutta, F.; Trappey, A.J. Using patent data for technology forecasting: China RFID patent
analysis. Adv. Eng. Inform. 2011, 25, 53–64. [CrossRef]52. Jun, S.; Park, S.S.; Jang, D.S. Technology forecasting using matrix map and patent clustering. Ind. Manag. Data Syst. 2012, 112,
786–807. [CrossRef]53. Chang, S.B. Using patent analysis to establish technological position: Two different strategic approaches. Technol. Forecast.
Soc. Chang. 2012, 79, 3–15. [CrossRef]54. Cheng, A.C.; Chen, C.Y. The technology forecasting of new materials: The example of nanosized ceramic powders. Rom. J.
Econ. Forecast. 2008, 4, 88–110.55. Chiu, Y.J.; Ying, T.M. A novel method for technology forecasting and developing R&D strategy of building integrated photovoltaic
technology industry. Math. Probl. Eng. 2012, 2012, 24.56. Meade, N.; Islam, T. Forecasting in telecommunications and ICT—A review. Int. J. Forecast. 2015, 31, 1105–1126. [CrossRef]
Sustainability 2022, 14, 5430 29 of 30
57. Altuntas, S.; Dereli, T.; Kusiak, A. Forecasting technology success based on patent data. Technol. Forecast. Soc. Chang. 2015, 96,202–214. [CrossRef]
58. Jun, S.; Park, S.; Jang, D. A technology valuation model using quantitative patent analysis: A case study of technology transfer inbig data marketing. Emerg. Mark. Financ. Trade 2015, 51, 963–974. [CrossRef]
59. Shih, M.J.; Liu, D.R.; Hsu, M.L. Discovering competitive intelligence by mining changes in patent trends. Expert Syst. Appl. 2010,37, 2882–2890. [CrossRef]
60. Bagula, A.; Castelli, L.; Zennaro, M. On the design of smart parking networks in the smart cities: An optimal sensor placementmodel. Sensors 2015, 15, 15443–15467. [CrossRef]
61. Jun, S.; Park, S.S. Examining technological innovation of Apple using patent analysis. Ind. Manag. Data Syst. 2013, 113, 890–907.[CrossRef]
62. Kim, G.J.; Park, S.S.; Jang, D.S. Technology forecasting using topic-based patent analysis. J. Sci. Ind. Res. 2015, 74, 265–270.63. Nguyen, T.T.; Kawamura, A.; Tong, T.N.; Nakagawa, N.; Amaguchi, H.; Gilbuena, R., Jr. Clustering spatio–seasonal hydrogeo-
chemical data using self-organizing maps for groundwater quality assessment in the Red River Delta, Vietnam. J. Hydrol. 2015,522, 661–673. [CrossRef]
64. Bamakan, S.M.H.; Bondarti, A.B.; Bondarti, P.B.; Qu, Q. Blockchain technology forecasting by patent analytics and text mining.Blockchain Res. Appl. 2021, 2, 100019. [CrossRef]
65. Choi, D.; Wolfe, P.J. Co-clustering separately exchangeable network data. Ann. Stat. 2014, 42, 29–63. [CrossRef]66. Wang, B.; Liu, S.; Ding, K.; Liu, Z.; Xu, J. Identifying technological topics and institution-topic distribution probability for patent
competitive intelligence analysis: A case study in LTE technology. Scientometrics 2014, 101, 685–704. [CrossRef]67. Trappey, A.J.; Trappey, C.V.; Fan, C.Y.; Hsu, A.P.; Li, X.K.; Lee, I.J. IoT patent roadmap for smart logistic service provision in the
context of Industry 4.0. J. Chin. Inst. Eng. 2017, 40, 593–602. [CrossRef]68. Jung, J.U.; Kim, H.S.; Choi, H.R. Patent trend mining for internet of things in logistics. In Proceedings of the International
Conference on Intelligent Data Engineering and Automated Learning, Yangzhou, China, 12–14 October 2016; pp. 624–634.69. Chen, M.C.; Ho, P.H. Exploring technology opportunities and evolution of IoT-related logistics services with text mining. Complex
Intell. Syst. 2021, 7, 2577–2595. [CrossRef]70. Kim, G.; Bae, J. A novel approach to forecast promising technology through patent analysis. Technol. Forecast. Soc. Chang. 2017,
117, 228–237. [CrossRef]71. Xianjin, Z.; Minghong, C. Study on early warning of competitive technical intelligence based on the patent map. J. Comput. 2010,
5, 274–281.72. Cheng, T.Y. A new method of creating technology/function matrix for systematic innovation without expert. J. Technol.
Manag. Innov. 2012, 7, 118–127. [CrossRef]73. Kostoff, R.N.; Schaller, R.R. Science and technology roadmaps. IEEE Trans. Eng. Manag. 2001, 48, 132–143. [CrossRef]74. Lee, S.; Yoon, B.; Park, Y. An approach to discovering new technology opportunities: Keyword-based patent map approach.
Technovation 2009, 29, 481–497. [CrossRef]75. Noh, H.; Jo, Y.; Lee, S. Keyword selection and processing strategy for applying text mining to patent analysis. Expert Syst. Appl.
2015, 42, 4348–4360. [CrossRef]76. Yang, J.; Zhang, D.; Frangi, A.F.; Yang, J.Y. Two-dimensional PCA: A new approach to appearance-based face representation and
recognition. IEEE Trans. Pattern Anal. Mach. Intell. 2004, 26, 131–137. [CrossRef]77. Kohonen, T. Essentials of the self-organizing map. Neural Netw. 2013, 37, 52–65. [CrossRef]78. Segev, A.; Kantola, J. Identification of trends from patents using self-organizing maps. Expert Syst. Appl. 2012, 39, 13235–13242.
[CrossRef]79. Wu, J.L.; Chang, P.C.; Tsao, C.C.; Fan, C.Y. A patent quality analysis and classification system using self-organizing maps with
support vector machine. Appl. Soft Comput. 2016, 41, 305–316. [CrossRef]80. Jeong, S.; Yoon, B. A systemic approach to exploring an essential patent linking standard and patent maps: Application of
generative topographic mapping (GTM). Eng. Manag. J. 2013, 25, 48–57. [CrossRef]81. Dorffner, G. Limitations of the SOM and the GTM; Department of Medical Cybernetics and Artificial Intelligence: Vienna, Austria,
2001.82. Malmberg, J.; Saqr, M.; Järvenoja, H.; Järvelä, S. How the monitoring events of individual students are associated with phases of
regulation: A network analysis approach. J. Learn. Anal. 2022, 9, 77–92. [CrossRef]83. Correa, C.D.; Ma, K.L. Visualizing social networks. In Social Network Data Analytics; Springer: Boston, MA, USA, 2011; pp. 307–326.84. Sathiyanarayanan, M.; Burlutskiy, N. Visualizing social networks using a treemap overlaid with a graph. Procedia Comput. Sci.
2015, 58, 113–120. [CrossRef]85. Hung, S.W.; Wang, A.P. Examining the small world phenomenon in the patent citation network: A case study of the radio
frequency identification (RFID) network. Scientometrics 2010, 82, 121–134. [CrossRef]86. Guresen, E.; Kayakutlu, G.; Daim, T.U. Using artificial neural network models in stock market index prediction. Expert Syst. Appl.
2011, 38, 10389–10397. [CrossRef]87. Lee, W.J.; Lee, W.K.; Sohn, S.Y. Patent network analysis and quadratic assignment procedures to identify the convergence of robot
technologies. PLoS ONE 2016, 11, e0165091. [CrossRef] [PubMed]

Sustainability 2022, 14, 5430 30 of 30
88. Zheng, J.; Zhao, Z.Y.; Zhang, X.; Chen, D.Z.; Huang, M.H. International collaboration development in nanotechnology: Aperspective of patent network analysis. Scientometrics 2014, 98, 683–702. [CrossRef]
89. Chen, P.; Redner, S. Community structure of the physical review citation network. J. Informetr. 2010, 4, 278–290. [CrossRef]90. Gustafsson, H.; Hancock, D.J.; Côté, J. Describing citation structures in sport burnout literature: A citation network analysis.
Psychol. Sport Exerc. 2014, 15, 620–626. [CrossRef]91. Yoon, B.; Park, Y. A text-mining-based patent network: Analytical tool for high-technology trend. J. High Technol. Manag. Res.
2004, 15, 37–50. [CrossRef]92. Chen, Y.L.; Chiu, Y.T. An IPC-based vector space model for patent retrieval. Inf. Process. Manag. 2011, 47, 309–322. [CrossRef]93. Choi, J.; Hwang, Y.S. Patent keyword network analysis for improving technology development efficiency. Technol. Forecast.
Soc. Chang. 2014, 83, 170–182. [CrossRef]94. Madani, F.; Weber, C. The evolution of patent mining: Applying bibliometrics analysis and keyword network analysis. World
Pat. Inf. 2016, 46, 32–48. [CrossRef]95. Eberendu, A.C. Unstructured Data: An overview of the data of Big Data. Int. J. Comput. Trends Technol. 2016, 38, 46–50. [CrossRef]96. Isson, J.P.; Harriott, J. Unstructured Data Analytics. In Win with Advanced Business Analytics; Wiley Online Library: Hoboken, NJ,
USA, 2013; p. 359.97. Singh, T.; Kumari, M. Role of text pre-processing in twitter sentiment analysis. Procedia Comput. Sci. 2016, 89, 549–554. [CrossRef]98. Haddi, E.; Liu, X.; Shi, Y. The role of text pre-processing in sentiment analysis. Procedia Comput. Sci. 2013, 17, 26–32. [CrossRef]99. Aizawa, A. An information-theoretic perspective of tf–idf measures. Inf. Process. Manag. 2003, 39, 45–65. [CrossRef]100. Jelodar, H.; Wang, Y.; Yuan, C.; Feng, X.; Jiang, X.; Li, Y.; Zhao, L. Latent Dirichlet allocation (LDA) and topic modeling: Models,
applications, a survey. Multimed. Tools Appl. 2019, 78, 15169–15211. [CrossRef]101. Kravets, A.G.; Vasiliev, S.S.; Shabanov, D.V. Research of the LDA algorithm results for patents texts processing. In Proceed-
ings of the 9th International Conference on Information, Intelligence, Systems and Applications (IISA), Zakynthos, Greece,23–25 July 2018; pp. 1–6.
102. Browne, M.W. Cross-validation methods. J. Math. Psychol. 2000, 44, 108–132. [CrossRef]103. Butts, C.T. Social network analysis with sna. J. Stat. Softw. 2008, 24, 1–51. [CrossRef]104. Cho, Y.; Hwang, J.; Lee, D. Identification of effective opinion leaders in the diffusion of technological innovation: A social network
approach. Technol. Forecast. Soc. Chang. 2012, 79, 97–106. [CrossRef]105. Gómez, D.; Figueira, J.R.; Eusébio, A. Modeling centrality measures in social network analysis using bi-criteria network flow
optimization problems. Eur. J. Oper. Res. 2013, 226, 354–365. [CrossRef]106. Lee, S.; Lee, S.; Seol, H.; Park, Y. Using patent information for designing new product and technology: Keyword based technology
roadmapping. Rd Manag. 2008, 38, 169–188. [CrossRef]107. Leydesdorff, L.; Kushnir, D.; Rafols, I. Interactive overlay maps for US patent (USPTO) data based on International Patent
Classification (IPC). Scientometrics 2014, 98, 1583–1599. [CrossRef]108. Chun, E.; Jun, S.; Lee, C. Identification of Promising Smart Farm Technologies and Development of Technology Roadmap Using
Patent Map Analysis. Sustainability 2021, 13, 10709. [CrossRef]109. Yu, J.; Hwang, J.G.; Hwang, J.; Jun, S.C.; Kang, S.; Lee, C.; Kim, H. Identification of vacant and emerging technologies in smart
mobility through the GTM-based patent map development. Sustainability 2020, 12, 9310. [CrossRef]110. Fu, T.C. A review on time series data mining. Eng. Appl. Artif. Intell. 2011, 24, 164–181. [CrossRef]111. Daud, A.; Abbas, F.; Amjad, T.; Alshdadi, A.A.; Alowibdi, J.S. Finding rising stars through hot topics detection. Future Gener.
Comput. Syst. 2021, 115, 798–813. [CrossRef]112. Cho, Y.; Han, Y.J.; Hwang, J.; Yu, J.; Kim, S.; Lee, C.; Lee, S.; Yi, K.P. Identifying technology opportunities for electric motors of
railway vehicles with patent analysis. Sustainability 2021, 13, 2424. [CrossRef]113. Hirsch-Kreinsen, H. “Low-technology”: A forgotten sector in innovation policy. J. Technol. Manag. Innov. 2008, 3, 11–20. [CrossRef]114. Cozzens, S.; Gatchair, S.; Kang, J.; Kim, K.S.; Lee, H.J.; Ordóñez, G.; Porter, A. Emerging technologies: Quantitative identification
and measurement. Technol. Anal. Strateg. Manag. 2010, 22, 361–376. [CrossRef]115. Vehtari, S. The Dynamics Involved with Manufacturing Capabilities towards a Competitive Advantage. Ph.D. Thesis, Helsinki
University of Technology, Espoo, Finland, 10 November 2006.


![Ulllted States Patent [19] [11] Patent Number: 6,138,671](https://static.fdokumen.com/doc/165x107/6317fbc571e3f2062906ff7d/ulllted-states-patent-19-11-patent-number-6138671.jpg)