Quaternary isotope stratigraphy and paleoclimate of coral reef terraces
Upload
jacobs-universityCategory
view
0download
0
Location-Specific Responses to Thermal Stress in Larvaeof the Reef-Building Coral Montastraea faveolataNicholas R. Polato1, Christian R. Voolstra2, Julia Schnetzer3, Michael K. DeSalvo4, Carly J. Randall5,
Alina M. Szmant5, Monica Medina4, Iliana B. Baums1*
1 Department of Biology, Pennsylvania State University, University Park, Pennsylvania, United States of America, 2 Red Sea Research Center, King Abdullah University of
Science and Technology, Thuwal, Saudi Arabia, 3 Max Planck Institute for Marine Microbiology, Bremen, Germany, 4 School of Natural Sciences, University of California
Merced, Merced, California, United States of America, 5 Center for Marine Sciences, University of North Carolina Wilmington, Wilmington, North Carolina, United States of
America
Abstract
Background: The potential to adapt to a changing climate depends in part upon the standing genetic variation present inwild populations. In corals, the dispersive larval phase is particularly vulnerable to the effects of environmental stress. Larvalsurvival and response to stress during dispersal and settlement will play a key role in the persistence of coral populations.
Methodology/Principal Findings: To test the hypothesis that larval transcription profiles reflect location-specific responsesto thermal stress, symbiont-free gametes from three to four colonies of the scleractinian coral Montastraea faveolata werecollected from Florida and Mexico, fertilized, and raised under mean and elevated (up 1 to 2uC above summer mean)temperatures. These locations have been shown to exchange larvae frequently enough to prevent significant differentiationof neutral loci. Differences among 1,310 unigenes were simultaneously characterized using custom cDNA microarrays,allowing investigation of gene expression patterns among larvae generated from wild populations under stress. Resultsshow both conserved and location-specific variation in key processes including apoptosis, cell structuring, adhesion anddevelopment, energy and protein metabolism, and response to stress, in embryos of a reef-building coral.
Conclusions/Significance: These results provide first insights into location-specific variation in gene expression in the faceof gene flow, and support the hypothesis that coral host genomes may house adaptive potential needed to deal withchanging environmental conditions.
Citation: Polato NR, Voolstra CR, Schnetzer J, DeSalvo MK, Randall CJ, et al. (2010) Location-Specific Responses to Thermal Stress in Larvae of the Reef-BuildingCoral Montastraea faveolata. PLoS ONE 5(6): e11221. doi:10.1371/journal.pone.0011221
Editor: Dee A. Carter, University of Sydney, Australia
Received February 3, 2010; Accepted May 16, 2010; Published June 23, 2010
Copyright: � 2010 Polato et al. This is an open-access article distributed under the terms of the Creative Commons Attribution License, which permitsunrestricted use, distribution, and reproduction in any medium, provided the original author and source are credited.
Funding: Funding was provided by a National Science Foundation (NSF) Graduate Research Fellowship Program award to N.R.P.; NSF Division of Ocean Sciences(OCE) grant 0825979 to I.B.B.; NSF Division of Intagrative Organismal Systems (IOS) grant 0644438, NSF OCE grant 0313708, and University of California Mexusgrant to M.M.; the NOAA coral reef grant conservation program supporting M. Miller; and the World Bank Coral Reef Targeted Research and University of NorthCarolina Wilmington Academic Affairs grants to A.M.S. The funders had no role in study design, data collection and analysis, decision to publish, or preparation ofthe manuscript.
Competing Interests: The authors have declared that no competing interests exist.
* E-mail: [email protected]
Introduction
Coral populations are declining worldwide due to rising sea
surface temperatures (SSTs), overfishing, coastal development, and
pollution [1]. This population reduction has been exacerbated in
Caribbean reefs by declining juvenile recruitment, reduced
growth, and increased mortality [2,3,4]. Successful sexual
reproduction is necessary for recovery and persistence of these
ecosystems because it maintains genetic diversity within, and
connectivity among, benthic adult populations. Because larvae
have limited energetic reserves, the impact of temperature stress
on these early stages of development may differ significantly from
that seen in adult coral colonies [5,6]. As such, changing
temperature regimes are likely to have profound effects on
larval-mediated ecological processes including dispersal, connec-
tivity, and population dynamics of reef-building corals [5,6,7,8].
These effects will ultimately have consequences on coral
populations’ ability to adapt to a changing climate.
Determining the effects of thermal stress on corals has been a
major focus of research since the observation that elevated
temperatures, such as those caused by El Nino events, can result in
bleaching and subsequent high mortality on affected reefs [9,10].
A complex interplay among the animal host, its symbiotic algae
[11,12,13], and the microbial community inhabiting the mucus
layer [14,15,16] enable the holobiont (the coral animal with its
algal and bacterial symbionts) to respond to changing conditions.
The ability to respond and ultimately adapt to thermal stress will
be vital for the continued survival of corals in the face of global
climate change [1,17].
There has been much debate regarding the adaptive potential of
coral hosts. Because it is widely accepted that corals exist near their
thermal maxima throughout much of their range [18], their ability
to adapt to changing climate conditions has been questioned [1].
However, local adaptation, once thought to be minimal due to
long distance gene flow among marine populations, has since been
reconsidered in light of small scale population structure in multiple
PLoS ONE | www.plosone.org 1 June 2010 | Volume 5 | Issue 6 | e11221

coral species [7]. Recent models of coral survival have incorpo-
rated parameters that consider adaptive potential (such as
increased thermotolerance), resulting in considerably different
outcomes depending on the strength of the adaptive response
[19,20,21]. Past studies have explored the mechanisms by which
corals may acclimate and/or adapt to elevated temperatures
[22,23], but empirical tests of coral performance in response to
thermal stress have been limited to studies of bleaching and
mortality in adult corals [18,24,25,26], until recently [27,28,29].
Each member of the holobiont contributes to the fitness of a
coral colony, and distinguishing among the fitness contributions of
each is vital to our understanding of the adaptive potential
inherent to coral populations. The most direct method for
investigating the host response in isolation is to work with coral
larvae, as many species do not take up algal, and possibly
microbial, symbionts until late in their larval development. Thus,
utilizing aposymbiotic larvae (without symbionts) allows for
isolation of symbiont-free genetic material, so any indicators of
stress can be confidently assigned to the host animal.
Effects of environmental stress on coral larvae include altered
developmental rates, abnormal morphologies, changes in settle-
ment behavior and reduced survival [30,31,32,33,34,35]. Mea-
surements on larvae of the Elkhorn Coral (Acropora palmata) show
that increases in temperature of only 2 degrees can decrease
survivorship, accelerate developmental rates, and increase swim-
ming speed, suggesting a host of accompanying physiological and
metabolic changes with consequences for important ecological
processes including recruitment, dispersal and connectivity [35,
Baums et al., unpublished data]. While larvae are expected to
react to environmental stress differently than adults, an under-
standing of the molecular stress response in this vulnerable and
critically important life stage is warranted. Additionally, identifi-
cation of differentially expressed genes in larvae may offer a first
clue to important stress tolerance genes in adults.
Larval response to stress has previously been measured using the
limited amount of phenotypic characters (morphological, behav-
ioral, survival) currently available for coral larvae. These are
restricted to the few clearly identifiable embryonic developmental
stages, and obvious pathological malformations that are observed
at high temperatures [31,33]. By treating gene expression levels as
molecular phenotypes, microarray technology greatly increases the
number of phenotypic traits available for assessing the effect of
stress on corals because we are able to survey the expression of
thousands of transcripts simultaneously [27,28,36,37]. Addition-
ally, with ever advancing functional annotation of genes and
genomes in many organisms, results can be interpreted to better
understand the mechanisms underlying key processes such as the
thermal stress response.
Examination of the molecular response of cnidarians to high
temperatures has revealed a wide range of variation in molecular
phenotypes. These include changes in expression levels of the
ubiquitous families of heat shock proteins (HSPs) [38], and
multiple genes involved in defense from oxygen radicals
[36,39,40,41]. Gene expression studies on larval and juvenile
corals have identified differential regulation of genes involved in
thermal and oxidative stress response, apoptosis, and cytoskeletal
structuring, among others [27,28,29]. Assessing gene expression
levels can reveal stress prior to the onset of obvious pathologies
and gives an immediate snapshot of the organism’s health faster
than many traditional metrics such as changes in growth rate,
mortality, or fertility [42,43].
In this study we compare gene expression profiles of embryos of
the common Caribbean coral Montastraea faveolata. Adult colonies
of this species are hermaphroditic and reproduce annually during
the late summer when seawater temperatures are maximal, by
spawning gametes into the water column where fertilization occurs
[44]. After fertilization, embryos develop into larvae and drift with
the currents for up to two weeks before settling onto the benthos
where they metamorphose into a primary polyp. Embryos of M.
faveolata raised from spawn collected from Florida and Mexico
were reared under elevated temperatures (1 to 2uC over local
summer means) and less stressful control temperatures based on
the year round means, to test the hypothesis that transcription
profiles reflect location-specific responses to thermal stress. We
expected that the thermal stress response would include differential
expression of genes for previously identified markers of stress, such
as those coding for HSPs, and oxidative stress proteins.
Additionally, we anticipated differential expression of genes
involved in cell structure and development that may play a role
in the irregular morphology observed in embryos reared at high
temperatures [31,35].
The results presented here expand our understanding of the
effect of temperature stress on gene expression during embryonic
development in M. faveolata as described in Voolstra et al. [27], by
extending the analysis from 12 to 24 hours of development. This
enables a more continuous view of embryonic development over
the first two days because the 48 hour samples from Mexico used
here are the same as those used in Voolstra et al. [27].
Materials and Methods
Gametes from multiple parent colonies of M. faveolata were
collected during mass spawning events at two locations: Puerto
Morelos, Mexico (20u52928.770N, 86u51904.530W) and Key
Largo, Florida (25u6942.660N, 80u18918.720W) (Fig. 1). Parent
genotypes were reconstructed using 5 previously published
polymorphic microsatellite loci [45] and estimates of allelic
diversity across all five loci were similar in both sample populations
(Mexico 14 alleles, Florida 19 alleles). This corresponded to three
to four parental genotypes contributing to the gene pool of each
batch and captured around 25% of the local allelic diversity
(unpublished data). STRUCTURE analysis of five polymorphic
microsatellite loci (unpublished) and previous population genetic
analyses [46] showed that these populations exchange larvae
frequently enough to prevent significant differentiation.
Sperm and eggs from multiple parents were pooled and
incubated for one hour to allow for fertilization, resulting in one
batch with multiple parents for each location. Fertilized eggs were
washed and transferred to temperature-controlled aquaria. In
Florida, larvae were raised in 1 L plastic containers with mesh
sides to allow for water exchange, suspended in 6 separate 45 L
polycarbonate bins containing filtered sea water (3 at each
treatment temperature). Water was circulated with an aquarium
pump and changed daily with filtered sea water preheated to the
target temperature. Target temperatures were maintained within
60.6uC with aquarium heaters and chiller units, and were
monitored with HOBO temperature data loggers (Onset Com-
puter Corp., MA) in each bin. The temperature exposure system
used for the Mexico embryos maintained target temperatures
within 60.2uC and is described in detail in [35]. Briefly, embryos
were cultured in three 500 mL plastic containers suspended in
each of two temperature controlled 12 L polycarbonate bins at
treatment and control temperatures. Water in the containers was
changed twice daily with water preheated to the desired
temperature by siphoning out the old sea water through a sieve
made of PVC pipe and 120 um mesh. This removed many of the
smaller particles and dying embryos that were smaller than the
mesh. Respective annual and summer mean temperatures from
Coral Stress Response
PLoS ONE | www.plosone.org 2 June 2010 | Volume 5 | Issue 6 | e11221

2005 to 2008, calculated by averaging monthly means of hourly
data, are 26.4uC and 29.3uC in Florida and 28.3uC and 29.5uC in
Mexico. Control temperatures were near the annual mean for
both locations (27uC Florida and 27.5uC Mexico; ‘‘mean’’). High
treatment temperatures were 1 to 2uC above the summer means
(30uC Florida and 31.5uC Mexico; ‘‘high’’) (Fig. 2).
Embryos for the microarray analysis were preserved in
RNAlater (Ambion, TX) after approximately one full day (22 to
24 hours; ‘‘24 hours’’) and two full days (46 to 48 hours;
‘‘48 hours’’) of development and stored at 280uC until RNA
extraction was performed. Each sample consisted of ca. 1500
genetically diverse embryos. In Florida, one sample was taken
from each of the three replicate bins at each time and temperature
(with the exception of the 48 hour sample at the high temperature
where there were only enough embryos remaining in two of the
three replicates). Biological replicates from Florida were used to
interrogate a single microarray slide each. Sampling in Mexico
was as described in [27], where embryos from each of the three
containers in the two replicate bins at a given temperature were
combined into a single composite biological replicate at both time
points. Three technical replicate arrays were run using RNA from
each composite biological sample from both temperatures and
time points.
Changes in water temperature can modify embryonic develop-
mental rates and thereby alter gene expression patterns. To verify
that expression differences among temperatures for a given
sampling time were not simply due to developmental differences
among samples, embryos from both treatment temperatures were
preserved in formalin or glutaraldehyde after 22 and 46 hours in
Florida, and 21.5, 28, and 50.5 hours in Mexico and viewed under
a dissecting microscope for classification by developmental stage
(Table 1). Visual assignment to any developmental stage is
approximate given that classification is based solely on external
morphology. By the time of blastula formation, the embryos are
too opaque to distinguish gradual internal changes associated with
gastrulation and development into planulae. Embryos reach a
blastula-like stage by ca. 6–8 hours after fertilization, and take ca.
20 more hours to transition from blastulae to full gastrulae
(invagination fully accomplished). It takes a further 40 hours to
reach the planula stage [47]. Since fertilization occurred over a
one hour period, there was often more than one identifiable stage
present at a given time point during early cleavage and
Figure 1. Map of the western Atlantic and northern Caribbean with study locations indicated by black circles.doi:10.1371/journal.pone.0011221.g001
Figure 2. Mean monthly sea surface temperatures from 2005 to2008 for the two study locations (Mexico and Florida).Horizontal lines represent annual means. Area within the vertical linesdelineates the spawning season for M. faveolata. Error bars indicate 61standard deviation. Grey lines represent monthly maxima and minima.Data from NOAA weather buoys MLRF1 and 42056.doi:10.1371/journal.pone.0011221.g002
Coral Stress Response
PLoS ONE | www.plosone.org 3 June 2010 | Volume 5 | Issue 6 | e11221
development, but we were not able to distinguish between subtle
differences during later embryonic stages.
RNA was extracted from approximately 1,500 embryos from each
sample and was used to interrogate a 2,620 feature (1,310 double
spotted unigenes) custom array [36,48]. Microarray protocols were
those of the Center for Advanced Technology at the University of
California, San Francisco (http://cat.ucsf.edu/). Total RNA was
extracted using the RNeasy Mini Kit (QIAGEN, CA). Concentra-
tion and quality of RNA extracts were quantified on a NanoDrop
ND-1000 spectrophotometer, and an Agilent 2100 Bioanalyzer. To
prepare RNA for microarray hybridization 1 mg of total RNA was
amplified with the MessageAmp II aRNA Kit (Ambion, TX). Bias
associated with this process is considered negligible [49]. To prime
the reverse transcription (RT) reaction 3 mg of aRNA was incubated
with 2 mL of 5 mg/mL random nonamers for 10 minutes at 70uC.
RT was carried out for 2 hours at 50uC using a master mix with a
4:1 ratio of aminoallyl-dUTP to TTP. Products of the RT reaction
were hydrolyzed by incubating the cDNA in 10 mL of 0.5M EDTA
and 10 mL of 1M NaOH for 15 minutes at 65uC. Following
hydrolysis, RT products were purified using MinElute columns
(Qiagen, CA), and cDNA synthesis was checked on a NanoDrop
spectrophotometer. Dye coupling reactions were performed using
Cy3 and Cy5 dyes (GE Healthcare, PA) diluted in 18 mL of dimethyl
sulphoxide. The coupling reactions were run in the dark for 2 hours
at room temperature. A final cleanup was performed using the
MinElute Cleanup Kit, and dye coupling was confirmed on a
NanoDrop spectrophotometer. Before hybridization microarray
slides were post-processed by UV crosslinking at 60 mJ; ‘‘shampoo-
ing’’ with 36SSC and 0.2% SDS at 65uC; blocking with 5.5g
succinic anhydride in 335 mL 1-methyl-2-pyrrilildinone and 15ml
sodium borate; and drying via centrifugation. Dye coupled cDNAs
were then mixed together in a hybridization buffer consisting of
0.25% SDS, 25 mM HEPES, and 36SSC. Hybridization mixtures
were boiled at 99uC for 2 minutes then allowed to cool at room
temperature for 5 minutes. Cooled hybridization mixtures were
pipetted under an mSeries Lifterslip (Erie Scientific, NH) and slides
were incubated overnight at 63uC in a custom hybridization
chamber. Hybridized microarray slides were then washed twice in
0.66SSC and 0.01% SDS, rinsed in 0.066SSC, and dried via
centrifugation. Microarrays were scanned using an Axon 4000B slide
scanner (MDS, CA).
As cluster analysis was the major goal of this study the
microarray experiment followed a reference design, where all
samples were hybridized against a common reference sample. The
pooled reference sample consisted of equal amounts of RNA from
all Mexico samples only, due to the fact that the Mexico samples
were processed in advance of the Florida samples. Reference
samples were labeled with Cy3, and temperature treatment
samples were labeled with Cy5. Because multiple factors were
targeted (time, temperature, and location), and the reference
sample was of no biological interest, dye swaps were not
performed [50].Three replicates were run for each temperature
treatment (except for the 48 hour high temperature sample from
Florida). Data from the microarrays are available from the Gene
Expression Omnibus Database (NCBI; GSE19998).
Spot intensities were extracted and background was subtracted
using GenePix Pro 6.0. GPR files were read into the Bioconductor
package LIMMA for further analysis in R [51,52]. Normalization
was performed using print-tip specific LOWESS to normalize
within arrays and the quantile normalization method to normalize
between arrays [53]. LIMMA uses linear regression models to
incorporate the power of replicated experimental design into gene
expression analysis. P-values were adjusted using an empirical
Bayes shrinkage of standard error, and false discovery rate was
corrected using the method of Benjamini and Hochberg [54].
Finally, a log fold change cutoff of 1.5 and a p-value threshold of
0.05 were used to filter significant results.
Significant DEGs were categorized based on cellular function
according to GO (Gene Ontology) and KEGG data (Kyoto
Encyclopedia of Genes and Genomes). Clone sequences are
available at http://sequoia.ucmerced.edu/SymBioSys/index.php.
Lists of differentially expressed genes (DEGs) were generated and
the overlap among the lists was visualized in Venn diagrams
constructed with Limma. Hierarchical clustering of transcriptome
profiles from model fitted results and computation of associated p-
values via bootstrap resampling was performed using the R
package pvclust [55]. The tree was visualized with FigTree 1.2.3
(http://tree.bio.ed.ac.uk/software/figtree/).
Unsupervised dimension reduction via principle components
analysis (PCA) was also carried out in R. PCA was used to identify
basic patterns among the highly dimensional gene expression
profiles. Briefly, PCA transforms possibly correlated variables into
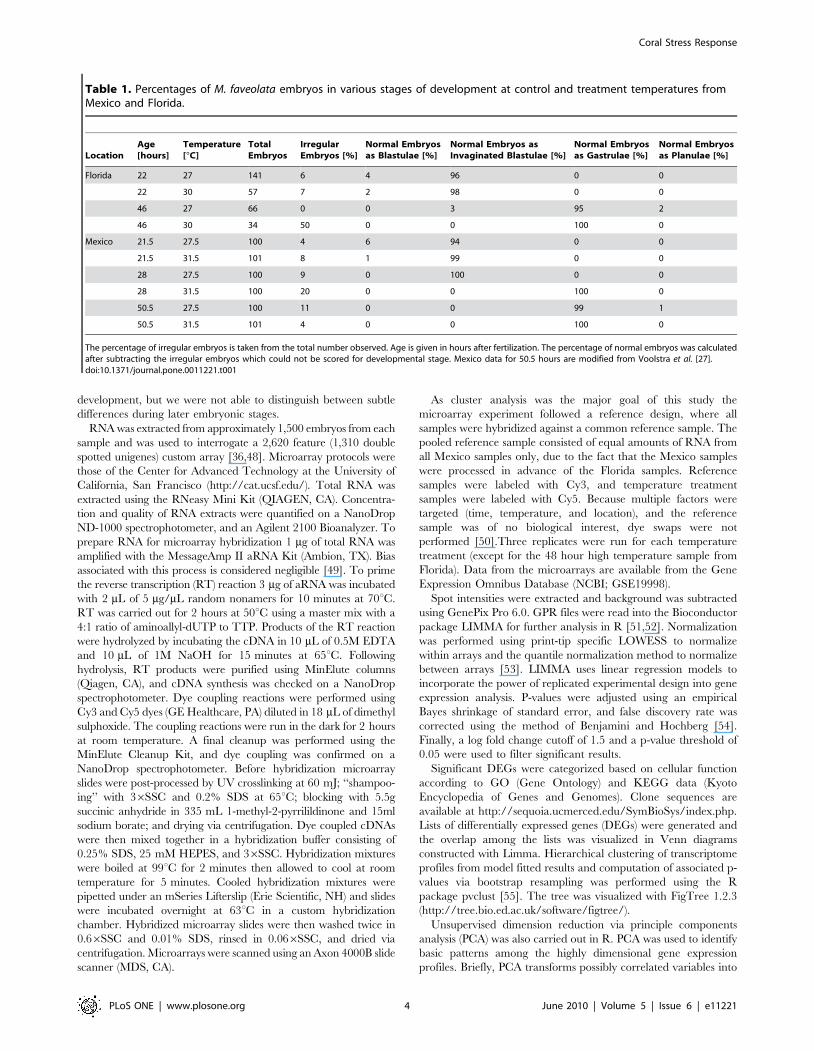
Table 1. Percentages of M. faveolata embryos in various stages of development at control and treatment temperatures fromMexico and Florida.
LocationAge[hours]
Temperature[uC]
TotalEmbryos
IrregularEmbryos [%]
Normal Embryosas Blastulae [%]
Normal Embryos asInvaginated Blastulae [%]
Normal Embryosas Gastrulae [%]
Normal Embryosas Planulae [%]
Florida 22 27 141 6 4 96 0 0
22 30 57 7 2 98 0 0
46 27 66 0 0 3 95 2
46 30 34 50 0 0 100 0
Mexico 21.5 27.5 100 4 6 94 0 0
21.5 31.5 101 8 1 99 0 0
28 27.5 100 9 0 100 0 0
28 31.5 100 20 0 0 100 0
50.5 27.5 100 11 0 0 99 1
50.5 31.5 101 4 0 0 100 0
The percentage of irregular embryos is taken from the total number observed. Age is given in hours after fertilization. The percentage of normal embryos was calculatedafter subtracting the irregular embryos which could not be scored for developmental stage. Mexico data for 50.5 hours are modified from Voolstra et al. [27].doi:10.1371/journal.pone.0011221.t001
Coral Stress Response
PLoS ONE | www.plosone.org 4 June 2010 | Volume 5 | Issue 6 | e11221

a smaller number of uncorrelated variables called principle
components. Expression profile data from each treatment was
transformed to extract the principle components responsible for
the greatest amount of variance. The principle components were
then plotted in order of their contribution to the overall variance.
Results
Larval Development PatternsIn Mexico, developmental samples were collected just before
(21.5 hours) and just after (28 and 50.5 hours) the microarray
samples (24 and 48 hours). At 21.5 hours of development the
embryos were predominantly blastulae in the process of gastrulation.
By 28 hours, all of the embryos at the high temperature were in the
gastrula stage, while those at lower temperature still had large
invaginations. These data suggest that the embryos at 24 hours were
in the process of gastrulation, and that some proportion of the
embryos at the high temperature were more developmentally
advanced than those at the lower temperature (Table 1). By
50.5 hours, embryos at both temperatures were in the late gastrula
stage, but had not begun to swim or elongate into planulae. Florida
embryos collected at 22 hours were also predominantly in the
process of gastrulation. By 46 hours they were fully formed gastrulae,
indicating that embryos used for the microarray experiment from a
single time point were predominantly at the same developmental
stage across temperature treatments and locations.
Interestingly, cultures reared at the higher temperature in Mexico
and Florida included numerous misshapen embryos, confirming
similar observations in other studies of coral development at
elevated temperatures [30,33,35]. In Florida, embryos raised at the
higher temperature were most strongly affected, where 21% and
50% (22 and 46 hours respectively) were malformed.
Gene Expression PatternsHierarchical gene clustering. To visualize the pattern of
relationships among experimental treatments, a radial tree of
hierarchically clustered gene expression profiles was constructed
using 1,310 unigenes. Hierarchical clustering of gene expression
data indicated that all three factors of time, location, and
temperature had an effect on transcription profiles (Fig. 3). For
24 hour samples, the primary driver of gene expression profiles
was geographic location, regardless of the treatment temperature
at which they were raised. By 48 hours, however, the effect of
thermal stress became the dominant factor, leading samples from
Florida and Mexico to cluster together according to the treatment
temperature experienced. Additionally, the cluster of high
temperature samples after 48 hours of development was the
most distant branch of the tree, implying a divergence from
normal development to a signature profile resulting from a
common response to thermal stress.
Principal component analysis. PCA supported the patterns
detected by the hierarchical clustering. The first three principal
components (PC) explained the majority (85%) of the variance
inherent in the data, with PCs one and two already explaining
over 76% (Fig. S1A). Plotting the treatments on the first two
principal components showed that PC1 captured variation due to
developmental time, while PC2 captured variation arising from
geographic origin and water temperature (Fig. S1B).
Differential expression by developmental time. Consis-
tent with Grasso et al. [56], the effect of developmental time drove
the majority of changes in gene expression patterns overall
(Fig. 4A; Time). The list of genes that were differentially expressed
due to changes in developmental time was divided between sites to
identify general and location-specific components (results not
shown). While about 25% of DEGs responding to developmental
time were shared between locations (n = 108), a large number of
genes were differentially regulated in Mexico (n = 245) or Florida
(n = 105) alone, providing a major component of the clear
differentiation between locations observed in the hierarchical
clustering (Fig. 3; left panel).
Differential expression by temperature treatment. DEGs
responding to the temperature treatment were divided by location
and developmental time to identify shared and location-specific
components of stress response. Samples from both time points
showed similar numbers of DEGs responding to the temperature
treatment (Fig. 4C & 4D). Samples from 24 hours showed
numerous DEGs responding to differences in temperature that
are specific to Mexico (n = 108) and Florida (n = 118). However
there was almost no overlap in genes responding to temperature
between the sites. By 48 hours, the proportion of overlapping DEGs
had risen (n = 52; 21% of all DEGs), while the number of location-
specific DEGs remained similar to that observed at 24 hours
(n = 113 in Mexico; n = 81 in Florida). DEGs responding to the
temperature treatment that are common to both Mexico and
Florida represent the component of stress response in M. faveolata
that is shared between locations (Table S1). Temperature sensitive
DEGs observed in only one of the two locations may represent
location-specific strategies for coping with thermal stress (Table S2).
Differential expression by location under control
temperatures. Genes that were differentially expressed
between the locations under mean temperatures were examined
Figure 3. Radial tree of hierarchically clustered gene expres-sion profiles for M. faveolata embryos collected from Floridaand Mexico after 24 and 48 hours of development. All threefactors of time, location, and temperature played a role in shaping geneexpression profiles. Note that clustering of day one samples wasaccording to location (M and F), while clustering of day two sampleswas according to temperature treatment (m and h). Values alongbranches indicate approximately unbiased p-values of Suzuki andShimodaira [55] based on 1000 bootstrap replicates. Abbreviations: M -Mexico; F - Florida, 1 - 24 hours; 2 - 48 hours; m - mean temperature; h -high temperature.doi:10.1371/journal.pone.0011221.g003
Coral Stress Response
PLoS ONE | www.plosone.org 5 June 2010 | Volume 5 | Issue 6 | e11221
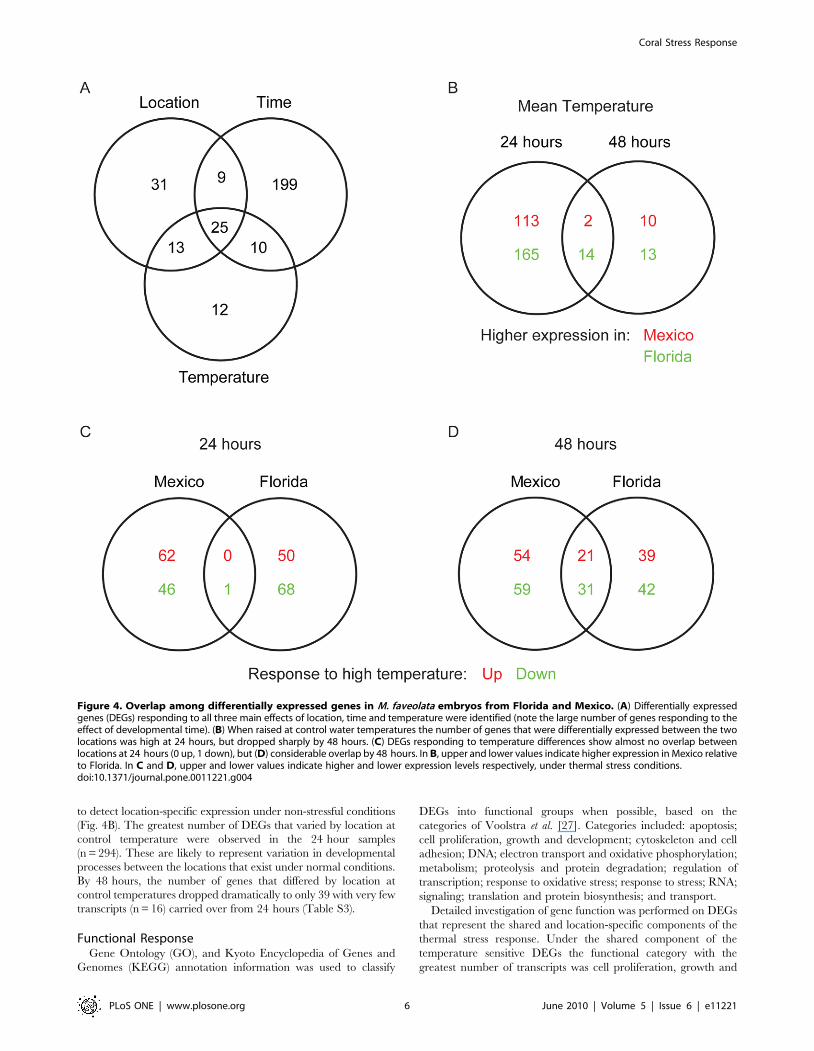
to detect location-specific expression under non-stressful conditions
(Fig. 4B). The greatest number of DEGs that varied by location at
control temperature were observed in the 24 hour samples
(n = 294). These are likely to represent variation in developmental
processes between the locations that exist under normal conditions.
By 48 hours, the number of genes that differed by location at
control temperatures dropped dramatically to only 39 with very few
transcripts (n = 16) carried over from 24 hours (Table S3).
Functional ResponseGene Ontology (GO), and Kyoto Encyclopedia of Genes and
Genomes (KEGG) annotation information was used to classify
DEGs into functional groups when possible, based on the
categories of Voolstra et al. [27]. Categories included: apoptosis;
cell proliferation, growth and development; cytoskeleton and cell
adhesion; DNA; electron transport and oxidative phosphorylation;
metabolism; proteolysis and protein degradation; regulation of
transcription; response to oxidative stress; response to stress; RNA;
signaling; translation and protein biosynthesis; and transport.
Detailed investigation of gene function was performed on DEGs
that represent the shared and location-specific components of the
thermal stress response. Under the shared component of the
temperature sensitive DEGs the functional category with the
greatest number of transcripts was cell proliferation, growth and
Figure 4. Overlap among differentially expressed genes in M. faveolata embryos from Florida and Mexico. (A) Differentially expressedgenes (DEGs) responding to all three main effects of location, time and temperature were identified (note the large number of genes responding to theeffect of developmental time). (B) When raised at control water temperatures the number of genes that were differentially expressed between the twolocations was high at 24 hours, but dropped sharply by 48 hours. (C) DEGs responding to temperature differences show almost no overlap betweenlocations at 24 hours (0 up, 1 down), but (D) considerable overlap by 48 hours. In B, upper and lower values indicate higher expression in Mexico relativeto Florida. In C and D, upper and lower values indicate higher and lower expression levels respectively, under thermal stress conditions.doi:10.1371/journal.pone.0011221.g004
Coral Stress Response
PLoS ONE | www.plosone.org 6 June 2010 | Volume 5 | Issue 6 | e11221

development (n = 5). Multiple transcripts (n$3) were also involved
in the processes of apoptosis; cytoskeleton and cell adhesion; DNA;
proteolysis and protein degradation; and translation and protein
biosynthesis. Location-specific components in Florida included
cytoskeleton and cell adhesion (n = 7); proteolysis and protein
degradation (n = 6); and translation and protein biosynthesis
(n = 8). Other processes with multiple transcripts (n$5) included
apoptosis; cell proliferation, growth and development; cytoskele-
ton; metabolism; regulation of transcription; and transport. In
Mexico, processes that were enriched for transcripts included
translation and protein biosynthesis (n = 27), electron transport
(n = 11), proteolysis and protein degradation (n = 7), transport
(n = 7) and metabolism (n = 6). Enrichment of transcripts (n$5)
was also observed for the processes of cell proliferation, growth
and development and response to oxidative stress.
Discussion
The ability of corals to deal with changing climate conditions
will depend upon the adaptive potential of the host as well as its
symbionts. The results presented here expand upon our
understanding of the effect of temperature stress on embryonic
development in M. faveolata as described in Voolstra et al. [27], by
extending the early developmental analysis from 12 to 24 hours,
and adding a geographic component to the analysis. Variation in
gene expression profiles of coral embryos was evident in the
response to thermal stress at two locations within a species’ range.
We attributed these differences to variation in the host response
alone because only aposymbiotic embryos were studied. The
genetic response of adult corals is likely to differ somewhat from
that of larvae due to symbiont interactions and changes in
metabolic demands, however the observation of variation in these
early life stages points toward the potential presence of adaptively
significant variation upon which selection may be able to act. If
this is the case, post-dispersal adult populations carry the signature
of such early selection. While the limited biological replication in
this study limits the extent to which they can be generalized, our
results provide intriguing first insights into potential spatial
variation in stress response of coral larvae in the absence of
population differentiation.
A comparison of the genes that showed differential expression at
the elevated treatment temperatures at 48 hours in the Voolstra
et al. [27] study with those observed here reveals that multiple
stress response genes including ferredoxin (AOSC403) calmodulin
(AOSF573) and the proapoptotic caspase adapter protein
(AOSF761) behaved consistently at high temperatures in both
locations (Table S1). As did the histone proteins (AOSF1219 and
AOSF622) and several other genes involved in cell proliferation,
growth and development (AOSB596, AOSF1434, AOSF912),
cytoskeleton and cell adhesion (AOSF1012, AOSF634), and
translation and protein biosynthesis (AOSC1120, AOSF620,
CAOO902). Peroxidasin (AOSF997) was also upregulated at both
locations at 48 hours, but not significantly so in Florida. These
genes represent a suite of transcripts that are likely to play an
important role in the thermal stress response of corals from both
locations.
There were also many stress response genes identified in
Voolstra et al. [27] that differed between locations at the control
temperatures in this study (Table S3). The stress response genes
recombination repair protein 1 (AOSB392) and soma ferritin
(CAON1101) showed differences between the two locations at
control temperatures. The same was true for the cytoskeleton
related gene dynein light chain roadblock - type 2 (AOSF651), and
the system maintenance genes GTP-binding nuclear protein
Ran -1 (AOSF912) and Nuclear hormone receptor - 6 (AOSB596),
among several others involved in metabolism (CAON1380),
signaling (AOSC876), DNA (AOSF622), and RNA modification
(AOSF1077). Interestingly both populations showed differential
expression of ribosomal proteins, although the specific protein
homologs that showed differential regulation were not the same
across locations, nor was the direction of change (up in Florida and
down in Mexico). Variation in expression levels between sampling
sites indicates location-specific molecular responses to environ-
mental stress.
Phenotypic Variation across Time and SpaceThe observation of malformed embryos provides a clear
indication of the detrimental effect of elevated temperatures on
larval development, especially in Florida. However, this is only one
measureable phenotype of stress. The power of this study lies in
the thirteen hundred transcripts that were measured simulta-
neously on the microarrays, revealing distinct patterns of gene
expression by time, location and temperature (Fig. 3 & S1). Gene
expression patterns indicated location-specific signatures of gene
expression under average temperatures, as well as location-specific
and conserved components of the response to elevated tempera-
ture as illustrated in the hierarchical tree (Fig. 3).
Gene expression levels measured by microarrays represent
molecular phenotypes and will require additional research to
identify the underlying genetic changes driving variation in
expression levels [57]. Because variation in gene expression can
reflect both heritable variation (i.e. changes in gene sequence or
changes in transcript abundance due to differences in regulatory
elements) and non heritable variation (arising from plasticity in
response to environmental conditions, immune status, stress level,
or physiological acclimatization to native habitats) only a subset of
this variation can be expected to have true adaptive significance
[58,59]. However in studies where taxonomic divergence between
groups has been taken into account, many transcripts exhibit
changes in expression levels beyond what would be expected
under genetic drift alone. This suggests that natural selection can
play a role in changing expression levels in at least some loci [59].
Additionally, when heritability has been assessed, a large
proportion of variation in gene expression is heritable and often
involves changes in regulatory elements [57].
Development. The large number of transcripts that differ
significantly in their expression level according to developmental
time appears to be the primary factor driving the location-specific
clustering observed in the hierarchical tree (Fig. 3; left panel). This
result is in line with the results of Grasso et al. [56] where a large
proportion of transcripts (21% of all surveyed) are differentially
regulated with changing developmental time.
While studies of transcriptome profiles from larval invertebrates
are limited, findings in polychaetes and ascidians suggest extensive
variation in gene expression with development and onset of
metamorphosis [60,61]. Additionally, larval transcription profiles
in abalone show that the expression of many transcripts are
affected by interactions with exogenous cues such as settlement
substrate [62], and in urchins, may be the target of extensive
selective pressure [63].
Location. Distinct clustering of 24 hour embryos by location
provides an indication that M. faveolata might show location-
specific gene expression despite a lack of population differentiation
[46].
Multiple taxa including killifish, yeast, Drosophila and humans
have all shown high levels of intra-population variation in gene
expression ranging from 18 to 83% [58,64,65,66]. Evidence from
the killifish, Fundulus hereroclitus, along a temperature cline suggests
Coral Stress Response
PLoS ONE | www.plosone.org 7 June 2010 | Volume 5 | Issue 6 | e11221

that variation in gene expression among populations is a positive
function of within population variation. Following from neutral
theory, divergence in gene expression patterns is expected to be
proportional to taxonomic divergence between groups [59], and a
large proportion of this variation must be due to genetic drift [67].
Considering the lack of divergence observed using neutral
markers between the study sites in Florida and Mexico [46], it is
unlikely that genetic drift would be strong enough to drive all of
the observed transcriptional differences. Patterns of this sort have
been observed in long lived trees, where low variation among
populations according to neutral markers is accompanied by
strong genetic clines in quantitative trait loci related to local
climate adaptation [68,69]. Alternatively, local acclimatization of
mother colonies to annual mean temperature differences might
affect larval development patterns [70].
Although thousands of larvae were analyzed in this study,
increased replication over time and space will be necessary to
provide confirmation of the patterns observed. This is a
challenging task due to the vagaries of Caribbean coral spawning,
difficult field conditions, and permitting constraints. Often, only
some colonies/genets spawn on a given night. Consequently, the
creation of genetically diverse larval pools with sufficient numbers
of larvae to allow for a well replicated experimental design is
difficult. We did not address the heritability of the putative
location-specific stress response. Appropriate data would require
rearing an F2 generation, a task that might be achievable in the
future with further progress in coral husbandry [71]. Regardless of
the mechanism, if substantiated, location-specific stress responses
would have implications for both restoration planning and the
study of coral evolution. This result supports the growing body of
evidence indicating the potential for local variation in coral
populations despite gene flow [7].
Temperature. The clustering of 48 hour samples into groups
defined by stress treatment (Fig. 3) incorporates both a conserved
response to thermal stress across locations, and location-specific
components (Fig. 4C & 4D, Table S1 & S2). The observation of a
common stress response only after 48 hours of development could
be explained either by a true absence, or a failure to detect
differential regulation in the 24 hour samples. Failure to detect
early differential expression of some genes responding to
temperature stress could be due either to changes in expression
levels of a large number of genes related to development, or
because sampling occurred long enough after the onset of the
stress treatment that differential expression had ceased, as would
be expected based on the results of Rodriguez-Lanetty [28], where
HSPs were upregulated within 3 hours of exposure to thermal
stress but not after 10 hours.
Embryogenesis of coral larvae is dominated by transcription of
genes involved in cell replication and proliferation [56]. This
dominance (see factor Time in Fig. 4A) may mask a functional
response to thermal stress in early stages of development. Also,
because stressful temperatures for this study were chosen based on
local summer maxima and were intended to be permissive enough
to allow for continued development without excessive mortality,
the treatments may reflect expression of genes as a response to
chronic high temperatures rather than a response to acute heat
shock. This seems unlikely however, given the high mortality and
number of misshapen embryos observed at the high temperatures.
The higher proportion of misshapen embryos could be a
confounding factor for some of the location-specific DEGs unique
to Florida at 48 hours, but not at 24 hours (Fig 4D &Table S2).
Morphological anomalies were not apparent at 24 hours and we
identified an even larger number of location-specific DEGs
responding to temperature at this time point (Fig. 4C). Indeed,
differential gene expression in response to temperature stress was
likely the cause rather than the consequence of the abnormal
morphologies observed at 48 hours. Nevertheless, Florida and
Mexico samples from the high temperature treatments clustered
tightly at 48 hours despite the higher proportion of visibly
irregular larvae in Florida.
Previous studies of thermal stress tolerance in adult M. faveolata
have observed expression of HSPs only after short term exposure
to temperatures higher than 33uC [72,73]. Our results provide
additional evidence that the response of coral larvae to stress
depends not only on the degree of stress, but the duration and
timing of onset of the stress exposure [27].
Functional Stress ResponseThe clear effect of thermal stress on embryonic transcription
profiles supports the idea that the host plays an important role in
coral thermotolerance [29,74,75,76], though the fitness implica-
tions of this response are not yet known. Among the DEGs
observed in response to thermal stress in both populations, a large
proportion was categorized into the processes of cell proliferation,
growth and development. Genes in this category were generally
downregulated and it is hypothesized that this downregulation
relates to the mechanisms underlying the abnormal morphology
observed when larvae are grown at high temperatures (Table 1).
Other abundant categories were those of cytoskeleton and cell
adhesion; electron transport and oxidative phosphorylation;
metabolism; protein and proteolysis degradation; translation and
protein biosynthesis; and transport. Genes related to translation
and protein biosynthesis; proteolysis and protein degradation,
electron transport and oxidative phosphorylation, were generally
downregulated, while cytoskeleton and cell adhesion; metabolism;
transport; response to stress; and response to oxidative stress genes
were both up and downregulated. Together these results support
previous models of stress response in corals and other taxa where
an overall change in metabolic activity is associated with reduced
protein biosynthesis, and oxidative phosphorylation [28,36,77].
Although there was substantial overlap in the functional categories
of location-specific genes, many DEGs involved in the response to
stress were unique to each location. This may represent locally
differing strategies for dealing with thermal stress, but a thorough
comparison of differences in molecular function across locations
would require a larger, more representative microarray and a
more complete functional annotation of cnidarian genes than is
currently available.
Heat shock protein (hsp 90a) is downregulated. The
conserved downregulation in both locations of the heat shock
protein hsp90a (AOSC617; Fig. S2) was unexpected in light of its
principle role as a molecular chaperone involved in response to
thermal stress. This result is contrary to expectations based on
previous studies that found HSPs were upregulated at high
temperatures in adult M. faveolata [36,72], 10 day old larval A.
millepora [28], and other adult cnidarians [38]. The analysis of
Voolstra et al. [27] did not show significant differential expression
of hsp90a at 12 or 48 hours, but a slight upregulation was evident
after 12 hours. Slight upregulation was also observed in the
24 hour sample here, but after 48 hours the pattern is strongly
reversed such that the differential expression between mean and
high temperature treatments over samples from both locations was
statistically significant (Fig. S2).
Although the expression of HSPs in response to thermal stress
appears to be universal [78], alternative forms of these proteins
may be utilized in even closely related organisms [79], and a wide
range of HSPs have been observed within the Scleractinia [38].
Since the microarray used here contains only homologs of hsp90a
Coral Stress Response
PLoS ONE | www.plosone.org 8 June 2010 | Volume 5 | Issue 6 | e11221

and hsp97 it is possible that other HSPs were expressed but not
detected.
Investigation of the cellular function of HSPs reveals that their
role in the cell is not limited to protection from thermal stress
however, and that they may be involved in a number of processes
important to development including cell proliferation, cell cycle
control, hormone receptor binding, microtubule formation and
immune response [80,81,82]. Additionally, prolonged expression
of HSPs 70 and 104 result in deleterious effects, representing a
trade-off between thermotolerance and optimal growth and
development in Drosophila and yeast [83,84,85].
The complex role of hsp90a suggests different functions for
HSPs depending on the life stage of the organism and the
environmental conditions experienced. Here, hsp90a was strongly
downregulated in M. faveolata embryos that had been exposed to
high temperatures for 46 to 48 hours, even though adult M.
faveolata show an upregulation of hsp90a in response to stress after
10 days of exposure to high temperatures [36]. Similarly, 10-day
old A. millepora larvae also showed upregulation of hsp70, hsp90aand gp96 after up to 3 hours of exposure to thermal stress [28].
However, after 10 hours of exposure the difference was no longer
significant, suggesting that the upregulation of HSPs may occur
only immediately following exposure to stress. In light of this
functional complexity and the strong downregulation of hsp90aobserved in this experiment, it is proposed that hsp90a plays a
developmental role in early stages of coral embryogenesis, and that
upregulation of this transcript is no longer evident after several
hours of chronic thermal stress.
Oxidative stress response. The response of corals to
elevated temperatures is closely tied to their response to oxidative
stress. Symbiotic cnidarians respond to high temperature with
upregulation of numerous oxidative stress genes [36,42,86,87].
Signals of the oxidative stress response can originate from the
symbiotic algae as well as the animal host as a response to increased
production of radical oxygen species in the mitochondria or
chloroplasts during stress. Thus, the origin of the oxidative stress
response in corals has been debated [88].
Our findings suggest that some of the oxidative stress genes that
show differential regulation in response to temperature are indeed
of animal origin. Two genes involved in the oxidative stress
response; ferredoxin (AOSC403) and peroxidasin (AOSF997) were
found to be significantly differentially regulated at high temper-
atures in both populations (Fig. S2). Other DEGs involved in the
response to oxidative stress, included soma ferritin (CAON1101),
malate dehydrogenase (AOSF1222), glutathione s-transferase m(AOSF1447), and catalase (AOSF550). In contrast, the oxidative
stress response of 10 day old A. millepora larvae was minimal after
3 hours but showed a slight, though statistically insignificant,
increase in some transcripts after 10 hours [28]. This again
suggests that developmental stage and/or timing of the onset of
stress influences regulation of stress response genes. In light of the
complexity of the oxidative stress response, it is difficult to say how
differential regulation of these proteins will affect the cell, but
downregulation of key enzymes, such as glutathione s-transferase
m, can change intracellular conditions leading to an overall
enhancement of the oxidative stress response [89].
ConclusionsCorals’ ability to adapt to climate change depends upon their
capacity to exploit functional genetic variation inherent to
populations. In the current experiment, heritability of the detected
variation was not assessed. While the genes that underlie
differences among transcription profiles may differ in terms of
sequence, copy number, or transcriptional regulators, observed
differences could also be due to maternal effects and as such, gene
expression profiles must be treated only as phenotypic variants.
Further work is needed to establish the fitness consequences and
heritability of observed changes in larval gene expression to
determine the ecological and evolutionary significance this
variation may have on the adaptive potential of corals’ in the
face of environmental change.
Our results add to a growing body of evidence that suggest
considerable plasticity of coral gene expression profiles in the face
of various stressors including high SSTs, predation, and turbidity
[27,36,90,91]. We provide support for location-specific signatures
of gene expression in embryos of a reef-building coral from
different parts of its geographic range. Moreover, we observe both
location-specific and general components of stress response during
later stages of development. Additional testing of the hypotheses
presented in this work in combination with improved larval
rearing techniques will help elucidate functional variation in
natural coral populations and enhance conservation and restora-
tion efforts by allowing managers to consider geographic variation
in traits of importance to coral survival. Should further studies
confirm the existence of ecotypes in corals in the face of gene-flow,
ecological studies and management strategies would need to re-
focus on micro-habitat characterization and conservation [69].
Supporting Information
Table S1 Transcripts of M. faveolata embryos differentially
expressed between the two treatment temperatures at both study
locations. Up and downregulation is in relation to a common
reference sample. Log2 fold change values in bold indicate
significant results. Gene ID: NCBI EST database access number.
Found at: doi:10.1371/journal.pone.0011221.s001 (0.04 MB
XLS)
Table S2 Transcripts of M. faveolata embryos differentially
expressed between the two treatment temperatures at only one
study location. Up and downregulation is in relation to a common
reference sample. Log2 fold change values presented for significant
differences only. Gene ID: NCBI EST database access number.
Found at: doi:10.1371/journal.pone.0011221.s002 (0.08 MB
XLS)
Table S3 Transcripts of M. faveolata embryos differentially
expressed between study locations at the control temperature. Up
and downregulation is in relation to a common reference sample.
Log2 fold change values presented for significant differences only.
Gene ID: NCBI EST database access number.
Found at: doi:10.1371/journal.pone.0011221.s003 (0.07 MB
XLS)
Figure S1 Principal component (PC) analysis by treatment of
transcription profiles from 24 and 48 hour M. faveolata larvae
collected from Florida and Mexico illustrating the high explana-
tory power of the first two PCs (A). Plotting the treatments on the
first two PCs shows that PC1 captures variation due to
developmental time, while PC2 captures variation arising from
both geographic origin in day one samples and temperature
treatment in day two samples (B). Plotting against the 3rd PC (not
shown) does not reveal any additional patterning. Symbols: M -
Mexico (squares); F - Florida (circles), 1 - 24 hours (filled); 2 -
48 hours (open); m - mean temperature; h - high temperature.
Found at: doi:10.1371/journal.pone.0011221.s004 (2.27 MB TIF)
Figure S2 Gene expression levels (log2 fold change) across all 8
treatments for stress response genes (Heat shock protein 90a;
Transcription factor hes-1) and oxidative stress response genes
(Ferredoxin; Peroxidasin) shared between Florida and Mexico.
Coral Stress Response
PLoS ONE | www.plosone.org 9 June 2010 | Volume 5 | Issue 6 | e11221

Abbreviations: M - Mexico; F - Florida; 1 - 24 hours; 2 - 48 hours;
m - mean temperature; h - high temperature.
Found at: doi:10.1371/journal.pone.0011221.s005 (6.64 MB TIF)
Acknowledgments
We thank M. Miller (NOAA), A. Valdivia (NOAA), K. Glunt (PSU), and
the members of the Baums Lab (PSU) for assistance with spawn collection
and rearing in Florida, and the members of the Szmant (UNCW), Medina
(UC Merced) and R. Iglesias-Prieto and A. Banaszak (Instituto de Ciencias
del Mar y Limnologıa of the Universidad Nacional Autonoma de Mexico)
laboratories for similar help with the Mexico spawn collection and rearing.
We also thank N. Altman (PSU) for helpful discussion on statistical
methods for microarray analysis. Members of the Baums and Medina
laboratories contributed comments on the manuscript. D. Xu and A.
Bunce (PSU) assisted with the categorization of embryonic development of
Florida samples, and A. Miller (UNCW) of Mexico samples
Author Contributions
Conceived and designed the experiments: NRP CRV JS AS MM IBB.
Performed the experiments: NRP CRV JS MKD CJR AS. Analyzed the
data: NRP CRV JS IBB. Contributed reagents/materials/analysis tools:
NRP CRV AS MM IBB. Wrote the paper: NRP.
References
1. Hoegh-Guldberg O (1999) Climate change, coral bleaching and the future of the
world’s coral reefs. Marine and Freshwater Research 50: 839–866.
2. Richmond RH, Hunter CL (1990) Reproduction and Recruitment of Corals -
Comparisons among the Caribbean, the Tropical Pacific, and the Red-Sea.
Marine Ecology-Progress Series 60: 185–203.
3. Hughes TP, Tanner JE (2000) Recruitment failure, life histories, and long-term
decline of Caribbean corals. Ecology 81: 2250–2263.
4. Edmunds PJ (2004) Juvenile coral population dynamics track rising seawater
temperature on a Caribbean reef. Marine Ecology Progress Series 269: 111–119.
5. Pechenik JA (1999) On the advantages and disadvantages of larval stages in
benthic marine invertebrate life cycles. Marine Ecology Progress Series 177:
269–297.
6. Graham EM, Baird AH, Connolly SR (2008) Survival dynamics of scleractinian
coral larvae and implications for dispersal. Coral Reefs 27: 529–539.
7. Baums IB (2008) A restoration genetics guide for coral reef conservation.
Molecular ecology 17: 2796–2811.
8. O’Connor MI, Bruno JF, Gaines SD, Halpern BS, Lester SE, et al. (2007)
Temperature control of larval dispersal and the implications for marine ecology,
evolution, and conservation. Proceedings of the National Academy of Sciences
104: 1266.
9. Harriott VJ (1985) Mortality rates of scleractinian corals before and during a
mass bleaching event. Marine ecology progress series Oldendorf 21: 81–88.
10. Glynn PW (1984) Widespread Coral Mortality and the 1982–83 El Nino
Warming Event. Environmental Conservation 11: 133–146.
11. Berkelmans R, Van Oppen MJH (2006) The role of zooxanthellae in the
thermal tolerance of corals: a ‘nugget of hope’for coral reefs in an era of climate
change. Proceedings of the Royal Society B 273: 2305.
12. Buddemeier RW, Baker AC, Fautin DG, Jacobs JR (2004) The adaptive
hypothesis of bleaching. Coral Health and Disease. pp 427–444.
13. Rowan R, Knowlton N, Baker A, Jara J (1997) Landscape ecology of
algal symbionts creates variation in episodes of coral bleaching. Nature 388:
265–269.
14. Rosenberg E, Koren O, Reshef L, Efrony R, Zilber-Rosenberg I (2007) The role
of microorganisms in coral health, disease and evolution. Nature Reviews
Microbiology 5: 355–362.
15. Reshef L, Koren O, Loya Y, Zilber-Rosenberg I, Rosenberg E (2006) The coral
probiotic hypothesis. Environmental Microbiology 8: 2068–2073.
16. Ducklow HW, Mitchell R (1979) Bacterial populations and adaptations in the
mucus layers on living corals. Limnology and Oceanography. pp 715–725.
17. Hughes TP, Baird AH, Bellwood DR, Card M, Connolly SR, et al. (2003)
Climate change, human impacts, and the resilience of coral reefs. Science 301:
929–933.
18. Berkelmans R, Willis BL (1999) Seasonal and local spatial patterns in the upper
thermal limits of corals on the inshore Central Great Barrier Reef. Coral Reefs
18: 219–228.
19. Donner SD, Skirving WJ, Little CM, Oppenheimer M, Hoegh-Guldberg O
(2005) Global assessment of coral bleaching and required rates of adaptation
under climate change. Global Change Biology 11: 2251–2265.
20. Donner SD (2009) Coping with Commitment: Projected Thermal Stress on
Coral Reefs under Different Future Scenarios. PLoS ONE 4: e5712.
21. Done TJ (1999) Coral community adaptability to environmental change at the
scales of regions, reefs and reef zones. Integrative and Comparative Biology 39:
66.
22. Gates RD, Edmunds PJ (1999) The physiological mechanisms of acclimatization
in tropical reef corals. Integrative and Comparative Biology 39: 30.
23. Clausen CD, Roth AA (1975) Effect of temperature and temperature adaptation
on calcification rate in the hermatypic coral Pocillopora damicornis. Marine
Biology 33: 93–100.
24. Coles SL, Jokiel PL, Lewis CR (1976) Thermal Tolerance in Tropical Versus
Subtropical Pacific Reef Corals.
25. Glynn PW, Dcroz L (1990) Experimental-Evidence for High-Temperature
Stress as the Cause of El-Nino-Coincident Coral Mortality. Coral Reefs 8:
181–191.
26. Brown BE (1997) Adaptations of reef corals to physical environmental stress.
Advances in Marine Biology 31: 222–301.
27. Voolstra C, Schnetzer J, Peshkin L, Randall C, Szmant A, et al. (2009) Effects oftemperature on gene expression in embryos of the coral Montastraea faveolata.
BMC Genomics 10: 627.
28. Rodriguez-Lanetty M, Harii S, Hoegh-Guldberg O (2009) Early molecular
responses of coral larvae to hyperthermal stress. Molecular Ecology 18:
5101–5114.
29. Meyer E, Davies S, Wang S, Willis BL, Abrego D, et al. (2009) Genetic variation
in responses to a settlement cue and elevated temperature in the reef-buildingcoral Acropora millepora. Mar Ecol Prog Ser 392: 81–92.
30. Randall CJ, Szmant AM (2009) Elevated temperature reduces survivorship andsettlement of the larvae of the Caribbean scleractinian coral, Favia fragum
(Esper). Coral Reefs 28: 537–545.
31. Bassim K, Sammarco P (2003) Effects of temperature and ammonium on larval
development and survivorship in a scleractinian coral (Diploria strigosa). MarineBiology 142: 241–252.
32. Nozawa Y, Harrison PL (2007) Effects of elevated temperature on larval
settlement and post-settlement survival in scleractinian corals, Acroporasolitaryensis and Favites chinensis. Marine Biology 152: 1181–1185.
33. Negri AP, Marshall PA, Heyward AJ (2007) Differing effects of thermal stress oncoral fertilization and early embryogenesis in four Indo Pacific species. Coral
Reefs 26: 759–763.
34. Vermeij MJA, Fogarty ND, Miller MW (2006) Pelagic conditions affect larval
behavior, survival, and settlement patterns in the Caribbean coral Montastraeafaveolata. Marine Ecology Progress Series 310: 119–128.
35. Randall CJ, Szmant AM (2009) Elevated Temperature Affects Development,
Survivorship, and Settlement of the Elkhorn Coral, Acropora palmata (Lamarck1816). The Biological Bulletin 217: 269.
36. DeSalvo MK, Voolstra CR, Sunagawa S, Schwarz JA, Stillman JH, et al. (2008)Differential gene expression during thermal stress and bleaching in the
Caribbean coral Montastraea faveolata. Mol Ecol 17: 3952–3971.
37. DeSalvo MK, Sunagawa S, Fisher P, Voolstra C, Iglesias-Prieto R, et al. (In
press) Coral host transcriptomic states are correlated with Symbiodiniumgenotypes. Molecular Ecology.
38. Coles SL, Brown BE (2003) Coral bleaching–capacity for acclimatization andadaptation. Advances in marine biology 46: 183.
39. Downs CA, Mueller E, Phillips S, Fauth JE, Woodely CM (2000) A molecular
biomarker system for assessing the health of coral (Montastraea faveolata) duringheat stress. Marine Biotechnology 2: 533–544.
40. Fang L, Huang S, Lin K (1997) High temperature induces the synthesis of heat-shock proteins and the elevation of intracellular calcium in the coral Acropora
grandis. Coral Reefs 16: 127–131.
41. Edge SE, Morgan MB, Gleason DF, Snell TW (2005) Development of a coral
cDNA array to examine gene expression profiles in Montastraea faveolataexposed to environmental stress. Marine Pollution Bulletin 51: 507–523.
42. Downs CA, Fauth JE, Halas JC, Dustan P, Bemiss J, et al. (2002) Oxidative
stress and seasonal coral bleaching. Free Radical Biology and Medicine 33:533–543.
43. Werner I, Nagel R (1997) Stress proteins hsp60 and hsp70 in three species ofamphipods exposed to cadmium, diazinon,dieldrin and fluoranthene. Environ-
mental Toxicology and Chemistry 16.
44. Szmant AM (1991) Sexual reproduction by the Caribbean reef corals
Montastrea annularis and M. cavernosa. Mar Ecol Prog Ser 74: 13–25.
45. Severance EG, Szmant AM, Karl SA (2004) Microsatellite loci isolated from the
Caribbean coral, Montastraea annularis. Mol Ecol Notes 4: 74–76.
46. Severance EG, Karl SA (2006) Contrasting population genetic structures of
sympatric, mass-spawning Caribbean corals. Marine Biology 150: 57–68.
47. Miller MW, Valdivia A, Kramer KL, Mason B, Williams DE, et al. (2009)
Alternate benthic assemblages on reef restoration structures and cascading
effects on coral settlement. Mar Ecol Prog Ser 387: 147–156.
48. Schwarz JA, Brokstein PB, Voolstra C, Terry AY, Manohar CF, et al. (2008)
Coral life history and symbiosis: functional genomic resources for two reefbuilding Caribbean corals, Acropora palmata and Montastraea faveolata. BMC
Genomics 9: 97.
49. Feldman AL, Costouros NG, Wang E, Qian M, Marincola FM, et al. (2002)
Advantages of mRNA amplification for microarray analysis. Biotechniques 33:
906.
Coral Stress Response
PLoS ONE | www.plosone.org 10 June 2010 | Volume 5 | Issue 6 | e11221

50. Knapen D, Vergauwen L, Laukens K, Blust R (2009) Best practices for
hybridization design in two-colour microarray analysis. Trends in biotechnology27: 406–414.
51. Smyth GK (2005) Limma: linear models for microarray data. Bioinformatics and
computational biology solutions using R and bioconductor. New York: Springer.pp 397–420.
52. R_Development_Core_Team (2008) R: A language and environment forstatistical computing. Vienna, Austria: R Foundation for Statistical Computing.
53. Yang YH, Thorne NP (2003) Normalization for two-color cDNA microarray
data. Lecture Notes-Monograph Series 40: 403–418.54. Benjamini Y, Hochberg Y (1995) Controlling the false discovery rate: a practical
and powerful approach to multiple testing. Journal of the Royal StatisticalSociety Series B (Methodological) 57: 289–300.
55. Suzuki R, Shimodaira H (2006) Pvclust: an R package for assessing theuncertainty in hierarchical clustering. Bioinformatics 22: 1540.
56. Grasso LC, Maindonald J, Rudd S, Hayward DC, Saint R, et al. (2008)
Microarray analysis identifies candidate genes for key roles in coraldevelopment. BMC genomics 9: 540.
57. Ranz JM, Machado CA (2006) Uncovering evolutionary patterns of geneexpression using microarrays. Trends in Ecology & Evolution 21: 29–37.
58. Oleksiak MF, Roach JL, Crawford DL (2005) Natural variation in cardiac
metabolism and gene expression in Fundulus heteroclitus. Nature genetics 37:67.
59. Whitehead A, Crawford DL (2006) Variation within and among species in geneexpression: raw material for evolution. Molecular ecology 15: 1197–1211.
60. Jacobs MW, Degnan SM, Woods R, Williams E, Roper KE, et al. (2006) Theeffect of larval age on morphology and gene expression during ascidian
metamorphosis. Integrative and Comparative Biology 46: 760.
61. Marsh AG, Fielman KT (2005) Transcriptome profiling of individual larvae oftwo different developmental modes in the poecilogonous polychaete Streblospio
benedicti (Spionidae). Journal of Experimental Zoology Part B: Molecular andDevelopmental Evolution 304: 238–249.
62. Williams EA, Degnan BM, Gunter H, Jackson DJ, Woodcroft B, et al. (2009)
Widespread transcriptional changes pre-empt the critical pelagic-benthictransition in the vetigastropod Haliotis asinina. Molecular Ecology 18:
1006–1025.63. Wray GA (2006) The evolution of embryonic gene expression in sea urchins.
Integr Comp Biol 46: 233–242.64. Jin W, Riley RM, Wolfinger RD, White KP, Passador-Gurgel G, et al. (2001)
The contributions of sex, genotype and age to transcriptional variance in
Drosophila melanogaster. Nature Genetics 29: 389–395.65. Brem RB, Yvert G, Clinton R, Kruglyak L (2002) Genetic dissection of
transcriptional regulation in budding yeast. Science 296: 752.66. Enard W, Khaitovich P, Klose J, Zollner S, Heissig F, et al. (2002) Intra-and
interspecific variation in primate gene expression patterns. Science 296: 340.
67. Oleksiak MF, Churchill GA, Crawford DL (2002) Variation in gene expressionwithin and among natural populations. nature genetics 32: 261–266.
68. Howe GT, Aitken SN, Neale DB, Jermstad KD, Wheeler NC, et al. (2003) Fromgenotype to phenotype: unraveling the complexities of cold adaptation in forest
trees. Botany 81: 1247–1266.69. Savolainen O, Pyhajarvi T, Knurr T (2007) Gene flow and local adaptation in
trees. Annual Review of Ecology, Evolution and Systematics 38: 595–619.
70. Rasanen K, Kruuk LEB (2007) Maternal effects and evolution at ecologicaltime-scales. Ecology 21: 408–421.
71. Petersen D, Carl M, Borneman E, Brittsan M, Hagedorn M, et al. (2008) Noah’sArk for the threatened Elkhorn coral Acropora palmata. Coral Reefs 27: 715.
72. Sharp VA, Brown BE, Miller D (1997) Heat shock protein (hsp 70) expression in
the tropical reef coral Goniopora djiboutiensis. Journal of Thermal Biology 22:11–19.
73. Black NA, Voellmy R, Szmant AM (1995) Heat shock protein induction in
Montastraea faveolata and Aiptasia pallida exposed to elevated temperatures.
The Biological Bulletin 188: 234.
74. Abrego D, Ulstrup KE, Willis BL, Van Oppen MJH (2008) Species–specific
interactions between algal endosymbionts and coral hosts define their bleaching
response to heat and light stress. Proceedings of the Royal Society B: Biological
Sciences 275: 2273.
75. Brown BE, Downs CA, Dunne RP, Gibb SW (2002) Exploring the basis of
thermotolerance in the reef coral Goniastrea aspera. Marine Ecology Progress
Series 242: 119–129.
76. Baird AH, Gilmour JP, Kamiki TM, Nonaka M, Pratchett MS, et al. (2006)
Temperature tolerance of symbiotic and non-symbiotic coral larvae. Proc 10th
Int Coral Reef Symp 1: 38–42.
77. Kammenga JE, Herman MA, Ouborg NJ, Johnson L, Breitling R (2007)
Microarray challenges in ecology. Trends in Ecology & Evolution 22: 273–279.
78. Feder ME, Hofmann GE (1999) Heat-shock proteins, molecular chaperones,
and the stress response: evolutionary and ecological physiology. Annual Review
of Physiology 61: 243–282.
79. Bosch TC, Krylow SM, Bode HR, Steele RE (1988) Thermotolerance and
synthesis of heat shock proteins: these responses are present in Hydra attenuata
but absent in Hydra oligactis. Proceedings of the National Academy of Sciences
85: 7927.
80. Kaufmann SH (1990) Heat shock proteins and the immune response.
Immunology today 11: 129.
81. Perret E, Moudjou M, Geraud ML, Derancourt J, Soyer-Gobillard MO, et al.
(1995) Identification of an HSP70-related protein associated with the centrosome
from dinoflagellates to human cells. Journal of Cell Science 108: 711.
82. Lindquist S, Craig EA (1988) The heat-shock proteins. Annual Review of
Genetics 22: 631–677.
83. Feder JH, Rossi JM, Solomon J, Solomon N, Lindquist S (1992) The
consequences of expressing hsp70 in Drosophila cells at normal temperatures.
Genes & development 6: 1402.
84. Krebs RA, Feder ME (1997) Natural variation in the expression of the heat-
shock protein Hsp70 in a population of Drosophila melanogaster and its
correlation with tolerance of ecologically relevant thermal stress. Evolution. pp
173–179.
85. Sanchez Y, Taulien J, Borkovich KA, Lindquist S (1992) Hsp104 is required for
tolerance to many forms of stress. The EMBO journal 11: 2357.
86. Sunagawa S, Choi J, Forman HJ, Medina M (2008) Hyperthermic stress-
induced increase in the expression of glutamate-cysteine ligase and glutathione
levels in the symbiotic sea anemone Aiptasia pallida. Comparative Biochemistry
and Physiology, Part B 151: 133–138.
87. Lesser MP (1997) Oxidative stress causes coral bleaching during exposure to
elevated temperatures. Coral Reefs 16: 187–192.
88. Weis VM, Davy SK, Hoegh-Guldberg O, Rodriguez-Lanetty M, Pringle JR
(2008) Cell biology in model systems as the key to understanding corals. Trends
in Ecology & Evolution 23: 369–376.
89. Dorion S, Lambert H, Landry J (2002) Activation of the p38 signaling pathway
by heat shock involves the dissociation of glutathione S-transferase Mu from
Ask1. Journal of Biological Chemistry 277: 30792.
90. Hoover CA, Slattery M, Targett NM, Marsh AG (2008) Transcriptome and
Metabolite Responses to Predation in a South Pacific Soft Coral. The Biological
Bulletin 214: 319.
91. Bay LK, Ulstrup KE, Nielsen H, Jarmer H, Goffard N, et al. (2009) Microarray
analysis reveals transcriptional plasticity in the reef building coral Acropora
millepora. Molecular ecology 18: 3062–3075.
Coral Stress Response
PLoS ONE | www.plosone.org 11 June 2010 | Volume 5 | Issue 6 | e11221
Copyright © 2022 FDOKUMEN