LncRNA:DNA triplex-forming sites are positioned at specific ...
10
RESEARCH Open Access LncRNA:DNA triplex-forming sites are positioned at specific areas of genome organization and are predictors for Topologically Associated Domains Benjamin Soibam * and Ayzhamal Zhamangaraeva Abstract Background: Chromosomes are organized into units called topologically associated domains (TADs). TADs dictate regulatory landscapes and other DNA-dependent processes. Even though various factors that contribute to the specification of TADs have been proposed, the mechanism is not fully understood. Understanding the process for specification and maintenance of these units is essential in dissecting cellular processes and disease mechanisms. Results: In this study, we report a genome-wide study that considers the idea of long noncoding RNAs (lncRNAs) mediating chromatin organization using lncRNA:DNA triplex-forming sites (TFSs). By analyzing the TFSs of expressed lncRNAs in multiple cell lines, we find that they are enriched in TADs, their boundaries, and loop anchors. However, they are evenly distributed across different regions of a TAD showing no preference for any specific portions within TADs. No relationship is observed between the locations of these TFSs and CTCF binding sites. However, TFSs are located not just in promoter regions but also in intronic, intergenic, and 3’UTR regions. We also show these triplex- forming sites can be used as predictors in machine learning models to discriminate TADs from other genomic regions. Finally, we compile a list of important “TAD-lncRNAs” which are top predictors for TADs identification. Conclusions: Our observations advocate the idea that lncRNA:DNA TFSs are positioned at specific areas of the genome organization and are important predictors for TADs. LncRNA:DNA triplex formation most likely is a general mechanism of action exhibited by some lncRNAs, not just for direct gene regulation but also to mediate 3D chromatin organization. Keywords: Long noncoding RNAs, TADs, Triplex structures, TAD-lncRNAs, RNA:DNA triplex, CTCF Background Chromatin conformation capture experiments such as Hi-C have shown that chromosomes are organized into units called topologically associated domains (TADs) which are separated by boundaries enriched in CCCTC- binding factor (CTCF) binding sites and highly tran- scribed genes [1, 2]. TADs are biologically significant because disruption of the boundaries affects the expres- sion of nearby genes and can also be linked to diseases [3–6]. The mechanism for the specification or formation of TADs is not completely understood and is an active area of research. Some recent studies have suggested a linear tracking mechanism called the “loop extrusion model” [7–9], which suggests that the specification of TADs may be a result of an interplay between chromatin, cohesin SMC complex, and CTCF binding sites at © The Author(s). 2021 Open Access This article is licensed under a Creative Commons Attribution 4.0 International License, which permits use, sharing, adaptation, distribution and reproduction in any medium or format, as long as you give appropriate credit to the original author(s) and the source, provide a link to the Creative Commons licence, and indicate if changes were made. The images or other third party material in this article are included in the article's Creative Commons licence, unless indicated otherwise in a credit line to the material. If material is not included in the article's Creative Commons licence and your intended use is not permitted by statutory regulation or exceeds the permitted use, you will need to obtain permission directly from the copyright holder. To view a copy of this licence, visit http://creativecommons.org/licenses/by/4.0/. The Creative Commons Public Domain Dedication waiver (http://creativecommons.org/publicdomain/zero/1.0/) applies to the data made available in this article, unless otherwise stated in a credit line to the data. * Correspondence: [email protected] Computer Science and Engineering Technology, University of Houston-Downtown, One Main St, TX 77002 Houston, USA Soibam and Zhamangaraeva BMC Genomics (2021) 22:397 https://doi.org/10.1186/s12864-021-07727-7
-
Upload
khangminh22 -
Category
Documents
-
view
1 -
download
0
Transcript of LncRNA:DNA triplex-forming sites are positioned at specific ...
RESEARCH Open Access
LncRNA:DNA triplex-forming sites arepositioned at specific areas of genomeorganization and are predictors forTopologically Associated DomainsBenjamin Soibam* and Ayzhamal Zhamangaraeva
Abstract
Background: Chromosomes are organized into units called topologically associated domains (TADs). TADs dictateregulatory landscapes and other DNA-dependent processes. Even though various factors that contribute to thespecification of TADs have been proposed, the mechanism is not fully understood. Understanding the process forspecification and maintenance of these units is essential in dissecting cellular processes and disease mechanisms.
Results: In this study, we report a genome-wide study that considers the idea of long noncoding RNAs (lncRNAs)mediating chromatin organization using lncRNA:DNA triplex-forming sites (TFSs). By analyzing the TFSs of expressedlncRNAs in multiple cell lines, we find that they are enriched in TADs, their boundaries, and loop anchors. However,they are evenly distributed across different regions of a TAD showing no preference for any specific portions withinTADs. No relationship is observed between the locations of these TFSs and CTCF binding sites. However, TFSs arelocated not just in promoter regions but also in intronic, intergenic, and 3’UTR regions. We also show these triplex-forming sites can be used as predictors in machine learning models to discriminate TADs from other genomicregions. Finally, we compile a list of important “TAD-lncRNAs” which are top predictors for TADs identification.
Conclusions: Our observations advocate the idea that lncRNA:DNA TFSs are positioned at specific areas of thegenome organization and are important predictors for TADs. LncRNA:DNA triplex formation most likely is a generalmechanism of action exhibited by some lncRNAs, not just for direct gene regulation but also to mediate 3Dchromatin organization.
Keywords: Long noncoding RNAs, TADs, Triplex structures, TAD-lncRNAs, RNA:DNA triplex, CTCF
BackgroundChromatin conformation capture experiments such asHi-C have shown that chromosomes are organized intounits called topologically associated domains (TADs)which are separated by boundaries enriched in CCCTC-binding factor (CTCF) binding sites and highly tran-scribed genes [1, 2]. TADs are biologically significant
because disruption of the boundaries affects the expres-sion of nearby genes and can also be linked to diseases[3–6].The mechanism for the specification or formation of
TADs is not completely understood and is an active areaof research. Some recent studies have suggested a lineartracking mechanism called the “loop extrusion model”[7–9], which suggests that the specification of TADsmay be a result of an interplay between chromatin,cohesin SMC complex, and CTCF binding sites at
© The Author(s). 2021 Open Access This article is licensed under a Creative Commons Attribution 4.0 International License,which permits use, sharing, adaptation, distribution and reproduction in any medium or format, as long as you giveappropriate credit to the original author(s) and the source, provide a link to the Creative Commons licence, and indicate ifchanges were made. The images or other third party material in this article are included in the article's Creative Commonslicence, unless indicated otherwise in a credit line to the material. If material is not included in the article's Creative Commonslicence and your intended use is not permitted by statutory regulation or exceeds the permitted use, you will need to obtainpermission directly from the copyright holder. To view a copy of this licence, visit http://creativecommons.org/licenses/by/4.0/.The Creative Commons Public Domain Dedication waiver (http://creativecommons.org/publicdomain/zero/1.0/) applies to thedata made available in this article, unless otherwise stated in a credit line to the data.
* Correspondence: [email protected] Science and Engineering Technology, University ofHouston-Downtown, One Main St, TX 77002 Houston, USA
Soibam and Zhamangaraeva BMC Genomics (2021) 22:397 https://doi.org/10.1186/s12864-021-07727-7
boundaries of TADs. However, some boundaries areCTCF independent and are resistant to the loss of CTCF[1, 10, 11]. In recent years, other factors have also beenuncovered that may have a role in the formation ofTADs such as type II DNA topoisomerase [12], YY1,and Mediator (together with cohesin) [13, 14]. SomeTAD boundaries, which are independent of CTCF, maysimply act as transitions between active and repressedchromatin regions or host promoters of newly tran-scribed genes [1, 15]. Therefore, mammalian TADs seemnot to be always the result of CTCF/cohesin loops andcould sometimes rather be defined by chromatin stateand other factors.Long noncoding RNAs (lncRNAs) are RNAs longer
than 200 nucleotides (nt) that do not code for proteins.There is well-documented evidence that a growing num-ber of lncRNAs have important biological functions [16].One of the mechanisms through which lncRNAs exhibittheir functions is by forming lncRNA:DNA triplex struc-tures. For example, lncRNAs as HOTAIR [16, 17], MEG3[18], and Fendrr [19, 20] form triplex helices with DNAat promoter regions to influence gene expression. In thecontext of 3D topological genome organization, there issome indication that the triplex-forming mechanismmay be used by lncRNAs (such as Firre) to mediatechromosomal contacts [17]. In this paper, we considerthe idea that some lncRNAs localize to specific locationsof the genome by forming RNA:DNA triplex structures,which allow lncRNAs to exert their functions to pre-serve, mediate the overall organization of the genomeand hence may lead to specification or maintenance ofTADs.DNA binding factors such as CTCF and the Cohesin
complex are enriched in TAD boundaries and play a rolein the specification of the boundaries and domain loops[1, 2, 8, 18]. The expansion of transposons in the gen-ome may also indirectly mediate TAD specification bycontributing to CTCF binding [18–20]. SINEs transpo-sons are enriched in TAD boundaries while LINEs trans-posons are depleted in those locations [18]. Thesestudies indicate that factors contributing to the medi-ation of chromatin organization have non-random en-richment in specific areas of the chromatin inrelationship to the overall 3D genome organization.Therefore, to investigate any potential role of lncRNA:DNA triplex-forming sites in 3D chromatinorganization, we first set out to perform a genome-wideanalysis of locations of triplex-forming sites of lncRNAs.We employ statistical methods and machine learningtools to test for enrichment of these sites in TADs, theirboundaries, and loop anchors. A non-random enrich-ment cannot directly imply a biological role of the trip-lex sites in TADs specification. However, it will providea compelling reason for further experiments and analysis
to decipher the potential biological roles of lncRNAs inmediating genome chromatin organization via RNA:DNA triplex sites.
ResultsExpressed LncRNAsTo investigate the triplex-forming sites of lncRNAs in acell line of interest, we only considered the expressedlncRNAs in that cell line (Methods). This yielded 2,072lncRNAs which were expressed in at least one of theseven human cell lines. We found 970, 853, 199, 773,760, 322, and 325 lncRNAs which were expressed in celllines GM12878, H1ESC, HMEC, HUVEC, HeLa, IMR90,and NHEK, respectively. To investigate the expressionpatterns of these 2,072 lncRNAs, their TPM valuesacross the cell lines were clustered using HierarchicalOrdered Partitioning and Collapsing Hybrid (HOPACH)algorithm [21] (Fig. 1A). This revealed nine clusters oflncRNAs with distinct expression patterns (Fig. 1A).There were seven clusters, each one exhibited amplifiedexpression in exactly one unique cell line (clusters I, II,III, V, VII, VIII, and IX for IMR90, HUVEC, H1ESC,HeLa, GM12878, HMEC, and NHEK, respectively)(Fig. 1A). There were only two clusters (clusters IV andVI) that showed nonspecific expression patterns(Fig. 1A). These observations resonate with previous re-ports of high cell and tissue specificity of lncRNAs [22,23].
Thousands of LncRNA:DNA triplex-forming sitesTo determine the lncRNA:DNA triplex-forming sites(TFSs) of expressed lncRNAs for each cell line, wealigned the lncRNA sequences to the hg19 genome usingtriplexator tool [24] restricting the length of the triplexstructures to a minimum length of 20 bp. Interestingly,about 54 % (1110 out of 2072) of lncRNAs did not formlncRNA:DNA TFSs (Fig. 1B). The remaining 962lncRNAs which formed at least one lncRNA:DNA TFSfell into two main categories: the first group (17 % or361 lncRNAs) had less than 50 TFSs, and the secondgroup (13 % or 275) had more than 5000 TFSs (Fig. 1B).LncRNAs use short regions within their sequence toform the triplex structures with the double-strandedDNA. We call such regions Triplex forming domains(TFDs). The alignment results by triplexator tool containinformation on the portions of lncRNAs that bind to theDNA. We found that even though lncRNAs have the po-tential to form many triplex sites throughout the gen-ome, they had very few triplexes forming domains(TFDs) within their sequence (Fig. 1C). Out of the 962lncRNAs which have TFDs, 541, 221, and 82 had 1, 2,and 3 TFDs, respectively (Fig. 1C). The majority of theTFDs have a length ranging between 20 nucleotides and
Soibam and Zhamangaraeva BMC Genomics (2021) 22:397 Page 2 of 10
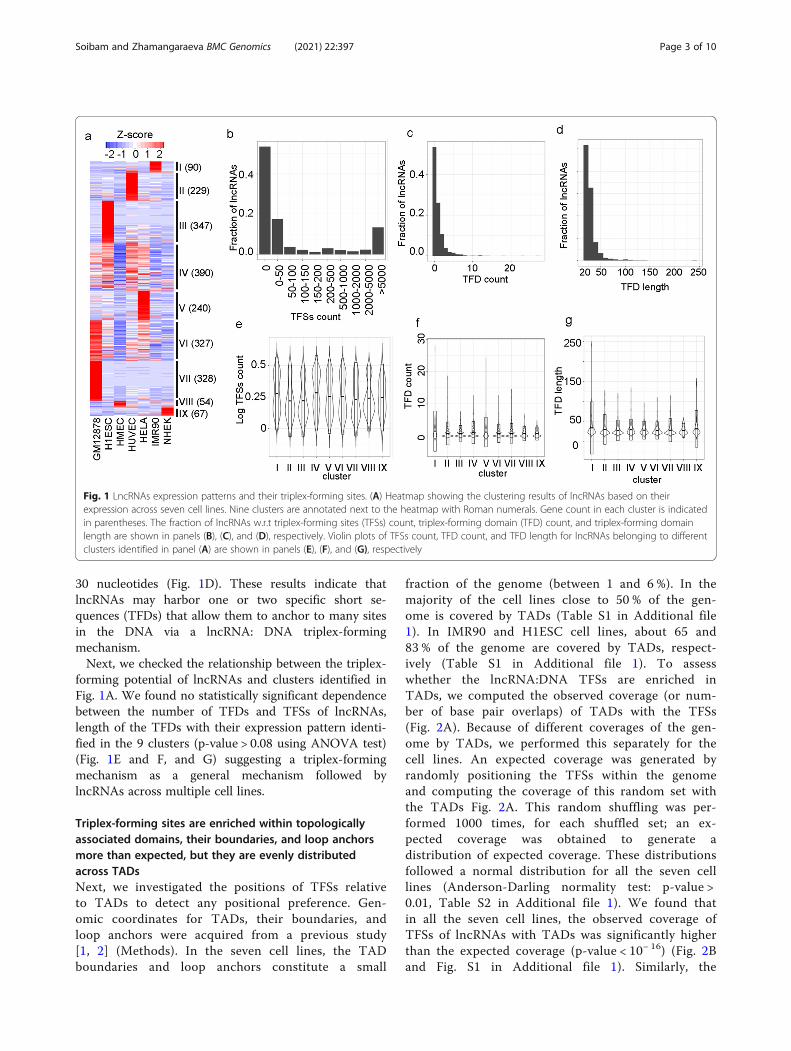
30 nucleotides (Fig. 1D). These results indicate thatlncRNAs may harbor one or two specific short se-quences (TFDs) that allow them to anchor to many sitesin the DNA via a lncRNA: DNA triplex-formingmechanism.Next, we checked the relationship between the triplex-
forming potential of lncRNAs and clusters identified inFig. 1A. We found no statistically significant dependencebetween the number of TFDs and TFSs of lncRNAs,length of the TFDs with their expression pattern identi-fied in the 9 clusters (p-value > 0.08 using ANOVA test)(Fig. 1E and F, and G) suggesting a triplex-formingmechanism as a general mechanism followed bylncRNAs across multiple cell lines.
Triplex-forming sites are enriched within topologicallyassociated domains, their boundaries, and loop anchorsmore than expected, but they are evenly distributedacross TADsNext, we investigated the positions of TFSs relativeto TADs to detect any positional preference. Gen-omic coordinates for TADs, their boundaries, andloop anchors were acquired from a previous study[1, 2] (Methods). In the seven cell lines, the TADboundaries and loop anchors constitute a small
fraction of the genome (between 1 and 6 %). In themajority of the cell lines close to 50 % of the gen-ome is covered by TADs (Table S1 in Additional file1). In IMR90 and H1ESC cell lines, about 65 and83 % of the genome are covered by TADs, respect-ively (Table S1 in Additional file 1). To assesswhether the lncRNA:DNA TFSs are enriched inTADs, we computed the observed coverage (or num-ber of base pair overlaps) of TADs with the TFSs(Fig. 2A). Because of different coverages of the gen-ome by TADs, we performed this separately for thecell lines. An expected coverage was generated byrandomly positioning the TFSs within the genomeand computing the coverage of this random set withthe TADs Fig. 2A. This random shuffling was per-formed 1000 times, for each shuffled set; an ex-pected coverage was obtained to generate adistribution of expected coverage. These distributionsfollowed a normal distribution for all the seven celllines (Anderson-Darling normality test: p-value >0.01, Table S2 in Additional file 1). We found thatin all the seven cell lines, the observed coverage ofTFSs of lncRNAs with TADs was significantly higherthan the expected coverage (p-value < 10− 16) (Fig. 2Band Fig. S1 in Additional file 1). Similarly, the
Fig. 1 LncRNAs expression patterns and their triplex-forming sites. (A) Heatmap showing the clustering results of lncRNAs based on theirexpression across seven cell lines. Nine clusters are annotated next to the heatmap with Roman numerals. Gene count in each cluster is indicatedin parentheses. The fraction of lncRNAs w.r.t triplex-forming sites (TFSs) count, triplex-forming domain (TFD) count, and triplex-forming domainlength are shown in panels (B), (C), and (D), respectively. Violin plots of TFSs count, TFD count, and TFD length for lncRNAs belonging to differentclusters identified in panel (A) are shown in panels (E), (F), and (G), respectively
Soibam and Zhamangaraeva BMC Genomics (2021) 22:397 Page 3 of 10
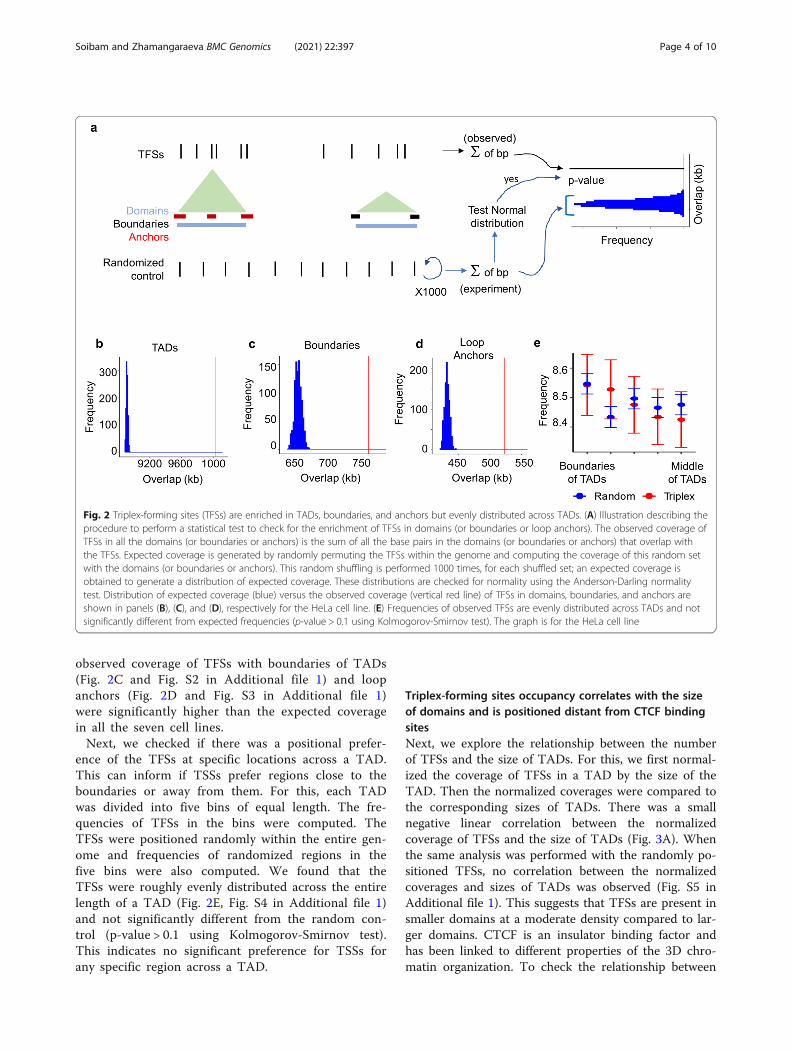
observed coverage of TFSs with boundaries of TADs(Fig. 2C and Fig. S2 in Additional file 1) and loopanchors (Fig. 2D and Fig. S3 in Additional file 1)were significantly higher than the expected coveragein all the seven cell lines.Next, we checked if there was a positional prefer-
ence of the TFSs at specific locations across a TAD.This can inform if TSSs prefer regions close to theboundaries or away from them. For this, each TADwas divided into five bins of equal length. The fre-quencies of TFSs in the bins were computed. TheTFSs were positioned randomly within the entire gen-ome and frequencies of randomized regions in thefive bins were also computed. We found that theTFSs were roughly evenly distributed across the entirelength of a TAD (Fig. 2E, Fig. S4 in Additional file 1)and not significantly different from the random con-trol (p-value > 0.1 using Kolmogorov-Smirnov test).This indicates no significant preference for TSSs forany specific region across a TAD.
Triplex-forming sites occupancy correlates with the sizeof domains and is positioned distant from CTCF bindingsitesNext, we explore the relationship between the numberof TFSs and the size of TADs. For this, we first normal-ized the coverage of TFSs in a TAD by the size of theTAD. Then the normalized coverages were compared tothe corresponding sizes of TADs. There was a smallnegative linear correlation between the normalizedcoverage of TFSs and the size of TADs (Fig. 3A). Whenthe same analysis was performed with the randomly po-sitioned TFSs, no correlation between the normalizedcoverages and sizes of TADs was observed (Fig. S5 inAdditional file 1). This suggests that TFSs are present insmaller domains at a moderate density compared to lar-ger domains. CTCF is an insulator binding factor andhas been linked to different properties of the 3D chro-matin organization. To check the relationship between
Fig. 2 Triplex-forming sites (TFSs) are enriched in TADs, boundaries, and anchors but evenly distributed across TADs. (A) Illustration describing theprocedure to perform a statistical test to check for the enrichment of TFSs in domains (or boundaries or loop anchors). The observed coverage ofTFSs in all the domains (or boundaries or anchors) is the sum of all the base pairs in the domains (or boundaries or anchors) that overlap withthe TFSs. Expected coverage is generated by randomly permuting the TFSs within the genome and computing the coverage of this random setwith the domains (or boundaries or anchors). This random shuffling is performed 1000 times, for each shuffled set; an expected coverage isobtained to generate a distribution of expected coverage. These distributions are checked for normality using the Anderson-Darling normalitytest. Distribution of expected coverage (blue) versus the observed coverage (vertical red line) of TFSs in domains, boundaries, and anchors areshown in panels (B), (C), and (D), respectively for the HeLa cell line. (E) Frequencies of observed TFSs are evenly distributed across TADs and notsignificantly different from expected frequencies (p-value > 0.1 using Kolmogorov-Smirnov test). The graph is for the HeLa cell line
Soibam and Zhamangaraeva BMC Genomics (2021) 22:397 Page 4 of 10
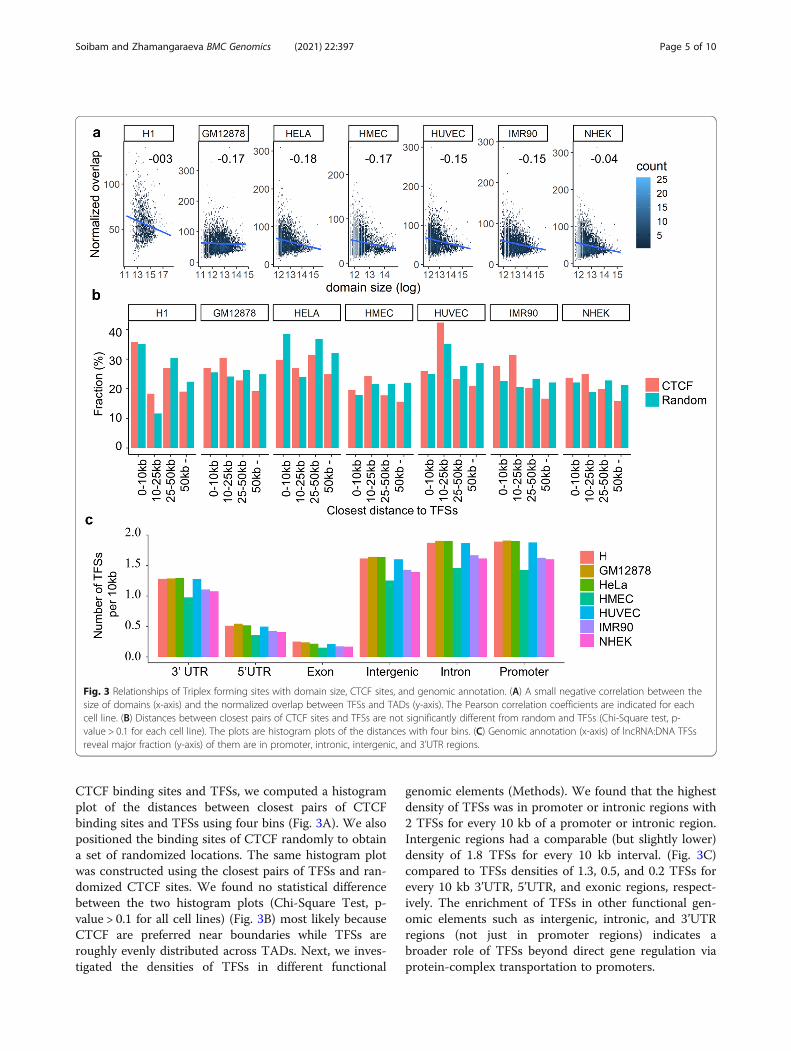
CTCF binding sites and TFSs, we computed a histogramplot of the distances between closest pairs of CTCFbinding sites and TFSs using four bins (Fig. 3A). We alsopositioned the binding sites of CTCF randomly to obtaina set of randomized locations. The same histogram plotwas constructed using the closest pairs of TFSs and ran-domized CTCF sites. We found no statistical differencebetween the two histogram plots (Chi-Square Test, p-value > 0.1 for all cell lines) (Fig. 3B) most likely becauseCTCF are preferred near boundaries while TFSs areroughly evenly distributed across TADs. Next, we inves-tigated the densities of TFSs in different functional
genomic elements (Methods). We found that the highestdensity of TFSs was in promoter or intronic regions with2 TFSs for every 10 kb of a promoter or intronic region.Intergenic regions had a comparable (but slightly lower)density of 1.8 TFSs for every 10 kb interval. (Fig. 3C)compared to TFSs densities of 1.3, 0.5, and 0.2 TFSs forevery 10 kb 3’UTR, 5’UTR, and exonic regions, respect-ively. The enrichment of TFSs in other functional gen-omic elements such as intergenic, intronic, and 3’UTRregions (not just in promoter regions) indicates abroader role of TFSs beyond direct gene regulation viaprotein-complex transportation to promoters.
Fig. 3 Relationships of Triplex forming sites with domain size, CTCF sites, and genomic annotation. (A) A small negative correlation between thesize of domains (x-axis) and the normalized overlap between TFSs and TADs (y-axis). The Pearson correlation coefficients are indicated for eachcell line. (B) Distances between closest pairs of CTCF sites and TFSs are not significantly different from random and TFSs (Chi-Square test, p-value > 0.1 for each cell line). The plots are histogram plots of the distances with four bins. (C) Genomic annotation (x-axis) of lncRNA:DNA TFSsreveal major fraction (y-axis) of them are in promoter, intronic, intergenic, and 3’UTR regions.
Soibam and Zhamangaraeva BMC Genomics (2021) 22:397 Page 5 of 10
Triplex forming sites within TADs that are shared in manycell types are associated with early developmentprocessesNext, we focused on the TFSs, which occur within do-mains present in all the 7 sets of human TADs. We re-quired such TFSs to occur within a domain in each ofthe seven sets of human TADs. Pooling together theTFSs from all the cell lines that overlapped with at leastone domain yielded 571,832 unique sites. Out of this, 17,589, 55,851, 7650, 1150, 8551, 7369, 4055 sites were spe-cific to domains belonging to GM12878, H1, HeLa,HMEC, HUVEC, IMR90, and NHEK cell lines, respect-ively. 81, 864 sites occurred within a domain present ineach of the seven sets of human TADs. One should notethat the domains within which 81, 864 sites occur mighthave different boundaries across two different cell lines.Gene ontology was performed on the genes (5,662) near-est to the 81, 864 sites, revealing associations with devel-opment terms and immune system-related terms such assomatic stem cell maintenance, aorta development, Fcreceptor signaling, blastocyst development, trophecto-dermal cell differentiation (Table S3 in Additional file 1).
“TAD-lncRNAs”: LncRNAs as predictors for topologicallyassociated domainsIf lncRNA:DNA TFSs are important and enriched fea-tures in TADs, they can serve as predictors to differenti-ate between TADs and other regions. For this, abackground set of genomic intervals that were similar insize (a number equal to the number of TADs) was gen-erated by randomly selecting from the genome (exclud-ing the original TAD locations) (Fig. 4A). The TFSs ofexpressed lncRNAs were also identified in this back-ground set separately for each cell line (Fig. 4A). Weused four different feature-based machine learningmodels to predict the class label of a region of interest(“TAD” or “non-TAD”) by using the frequency of TFSsof expressed lncRNAs in the region as features (Fig. 4B).The models were tuned using a 5-fold cross-validationapproach while varying the appropriate model parame-ters on a training set (80 % of the total pool of data)(Fig. 4C and Table S4 in Additional file 1). Using fivedifferent evaluation metrics on the test set, the best per-forming model was selected (Methods) (Fig. 4D). In thisapproach, we excluded the H1 cell line because about83 % of the genomic regions are located within TADs.On average, the Random Forest model performed the
best with an average accuracy of 74 % across the celllines (Fig. 4D and Table S5 in Additional file 1). Thebest accuracy achieved were 71.58 %, 71.48 %, 71.20 %,68.09 %, 70.58 %, and 76.70 % for cell lines GM12878,HeLa, HUVEC, HMEC, NHEK, and IMR90, respectively(Table S5 in Additional file 1 and Fig. 4D). While thebest Area Under the Curve (AUC) achieved was 0.81,
0.77, 0.80, 0.68, 0.77, and 0.84 for cell lines GM12878,HeLa, HUVEC, HMEC, NHEK, and IMR90, respectively(Table S5 in Additional file 1 and Fig. 4D). These resultsshow that TFSs of lncRNAs are important and enrichedfeatures in TADs and can be used as predictors to dis-criminate TADs from other regions.Next, we aimed to identify important “TAD-lncRNAs”
which were top predictors in the model performance.To do so, we assigned an “importance score” to eachlncRNA based on its discriminating power in the Ran-dom Forest model using the “target shuffling” method(Methods). The top 10 “TAD-lncRNAs” for each cellline are shown in Table S6 (Additional file 1). We high-light one particular TAD-lncRNA predictor calledDANCR or ENSG00000226950.6 (Fig. 4E) in cell lineGM12878. The dominant isoform of DANCR with GEN-CODE id ENST00000444958.1 is 709 bp long and has asingle 23 bp long triplex-forming domain at its 3’ end(Fig. 4E). The triplex-forming domain is rich in T basesand has 2,953 TFSs within TADs (Fig. 4E). Most of thetriplex sites of DANCR are either in intergenic (44 %) orintronic regions (53 %) (Fig. 4F). Gene ontology analysisof genes closest to the triplex-forming sites of DANCRshowed top enrichment in the regulation of GTPase ac-tivity (Fig. 4 G) and closely related terms such as JUNkinase activity. Some target genes include Rho GTPaseActivating Proteins such as Arhgap36, and Arhgap40;Fibroblast growth factors such as Fgf3, and Fgf9. Enrich-ment in multiple pathways related to cancer such as Ras,Wnt, ErbB, and MAPK (Fig. 4G) was also observed.Some of the important target genes were Wnt2b, Wnt5b,Wnt5A, Wnt8a from the Wnt pathway, and Fgf9, Mapk1,Pak2, Igf1, Rasa2 from the Ras pathway. If TFSs are usedas anchors by TAD-lncRNAs to mediate chromatinorganization, their deregulation such as DANCR can dis-rupt the formation of TFSs and may alter chromatinorganization. Consequentially, it may contribute to dis-eases including cancer.
DiscussionOur findings reveal that lncRNA:DNA TFSs areenriched in TADs, their boundaries, and loop anchors.However, TFSs are roughly evenly distributed acrossTADs indicating no preference for specific regions ofTADs. The normalized coverage of TFSs is slightly nega-tively correlated to the size of domains. Many previouslyreported TFSs of lncRNAs in vivo such as Fendrr,Khps1, and PARTICLE [25–27] are primarily located inpromoter regions of genes. In such cases, lncRNAs useTFSs as anchors to transport protein complexes to thespecific target regions for direct gene regulation. On theother hand, lncRNA Firre mediates chromosomal con-tacts by interacting with the DNA at non-promoter
Soibam and Zhamangaraeva BMC Genomics (2021) 22:397 Page 6 of 10

regions [17]. Interestingly, these interaction sites of Firrehave high triplex-forming potential [28]. We found thatlncRNA:DNA TFSs are not only located in promoter re-gions, but also positioned in other functional elementssuch as intergenic, intronic, and 3’UTR regions. Inaddition to serving as a “dock” located at promoters forlncRNAs to transport protein complexes, our observa-tions suggest a broader role of TFSs. For instance,lncRNA:DNA TFSs located in intergenic and intronic re-gions may act as anchors to mediate chromosomal con-tacts in TADs. TFSs located in 3’UTR may be involvedin post-transcriptional gene regulation. We also ob-served the absence of correlation between the TFSs andCTCF sites and it is most likely because CTCF areenriched in boundaries compared to internal regions of
TADs, while TFSs showed no preference betweenboundaries compared to internal TAD regions. Eventhough this observation doesn’t prove that TFSs have asecondary role in specification and “protection” of theboundaries, we can provide some speculation of a poten-tial link between the specification of the boundaries andthe TFSs.Not all the lncRNAs but about 46 % of the expressed
lncRNAs were found to form triplex structures with theDNA. A single lncRNA can form triplex structures withmany regions of the DNA via one or two TFDs. Thepresence of only one or two TFDs that can interact withmany regions of the DNA indicates that it is a nonran-dom phenomenon. It may be appropriate to comparethis observation to the mechanism in which a single
Fig. 4 LncRNA:DNA triplex-forming sites as predictors for TADs. (A) Triplex-forming sites (TFSs) in n TADs and in the background set consisting ofn randomly selected genomic regions, which do not overlap with TADs. (B) The frequency of TFSs for lncRNAs is used as features in a predictionproblem, where TADs and the random regions have class labels “1” and “0”, respectively. (C) The predictive models are trained on the training set(80 % of 2n) to determine the appropriate model parameters. The model performances are computed on the test data (20 % of 2n). (D)Prediction accuracies and four other metrics of the predictive models. The values are averaged across the six cell lines (E) TAD-lncRNA DANCRwith its triplex-forming domain (TFD) located from base pair position 679 to 702. (F) Genomic annotation of locations of the TFSs of DANCR inGM12878 cell line. (G) Top gene ontology terms associated with the genes nearest to the TFSs of TAD-lncRNA DANCR in the GM12878 cell line.X-axis indicates -log10 p-value
Soibam and Zhamangaraeva BMC Genomics (2021) 22:397 Page 7 of 10
transcription factor regulates hundreds of genomic re-gions by recognizing and binding a consensus shortmotif located at different regions of the DNA. In thecase of lncRNAs, they may use the triplex sites as an-chors and mediate 3D organization in various ways suchas forming loops, regulating promoter-enhancer interac-tions, defining chromosome contacts. There was no rela-tionship between the expression patterns of lncRNAsacross multiple cell lines and their TFDs and TFSs indi-cating lncRNA:DNA triplex formation as a generalmechanism of action used by lncRNAs across multiplecell lines.Here, we report the first genome-wide study that dem-
onstrates that lncRNA:DNA TFSs are important featuresin the context of 3D chromatin organization. LncRNA:DNA TFSs can be used as predictors in machine-learning models to discriminate TADs from other gen-omic regions. However, it is not certain whether the for-mation of the triplex sites causes the specification ofTADs or the TFSs only plays a role in maintaining theinternal organization of TADs. We suspect the two rolesto be not mutually exclusive. It is important to note thatthe discrimination of TADs in a cell line was done usingthe TFSs of lncRNAs expressed in that cell line only. Weused this approach because even if a lncRNA has the po-tential to form TFSs, it is only relevant if exhibits an ex-pression in the cell line of interest. We also identifiedtop TAD-lncRNAs by scoring the lncRNAs based on thedegree of “contribution” of their TFSs to the discrimin-ating power of the machine-learning model. SeverallncRNAs with annotated names were identified as im-portant TAD-lncRNAs (Table S6 in Additional file 1).We highlighted one such lncRNA called DANCR, whichhas been shown to have roles in multiple types of can-cer. If TFSs are used as anchors by TAD-lncRNAs suchas DANCR to mediate chromatin organization, their de-regulation can disrupt the formation of TFSs and mayalter chromatin organization contributing to diseases in-cluding cancer.Our analysis supports the idea that lncRNA:DNA
triplex formation is an important mechanism throughwhich lncRNA can exert their function of mediating3D chromatin organization. Many instances oflncRNAs involved in chromatin regulation via the for-mation of triple helices with DNA in specific regionshave been validated. For example, HOTAIR binds toDNA and recruits PRC2 and LSD1-CoREST [29],lncRNA MEG3 regulates different pathways by theformation of triple helices [30], Fendrr recruits PRC2via RNA:DNA triplex formation [31]. The predictionof RNA:DNA triplex sites is a challenging task, weused triplexator tool to generate the lncRNA:DNATFSs. We used this approach to be consistent withprevious analyses [28, 32] and found it to be in
agreement with genome-wide ChIRP-Seq peaks ofsome lncRNAs. For example, some TFSs of lncRNAs(TUG1, MEG3, Fendrr, HOTAIR) with DNA havebeen experimentally validated using methods such aselectrophoretic mobility shift assay were consistentwith the prediction by triplexator [28]. Furthermore,significant overlap between sites predicted by triplexa-tor and peaks from ChIRP-Seq of various lncRNAswas found [28]. Convolutional neural networks wereused to predict the DNA binding sites (obtained usingChIRP-Seq) of various lncRNAs [32] with good accur-acies. It was found that 82 % of the DNA sequencemotifs (kernels) learned by the model from lncRNAChIRP-Seq peaks formed triplex structures (predictedusing triplexator) with lncRNAs of interest [32]. Thesame study experimentally validated new triplex-forming sites of lncRNAs HOTAIR and TUG1 [32].
ConclusionsIn summary, we report that lncRNA:DNA TFSs areenriched at specific locations in relationship to TADs,which are the primary units of chromatin organization.LncRNA:DNA TFSs are enriched in TADs, their bound-aries, and loop anchors. However, TFSs are evenly dis-tributed across different regions of a TAD. TFSs and arelocated not just in promoter regions but also in inter-genic, intronic, and 3’UTR regions. This indicates thatTFSs may have a bigger role in mediating chromatinorganization beyond direct gene regulation via promoterinteraction. These TFSs are important and enriched fea-tures of TADs since they can be used as predictors todiscriminate TADs from other genomic regions. Our ob-servations are consistent with the idea that lncRNA:DNA triplex formation is a general mechanism of actionused by some lncRNAs, not just for transportation ofprotein complexes but to mediate 3D chromatinorganization.
MethodsTADs, boundaries, and loop locationsLocations of TADs, boundaries of TADs, and loop an-chors from 6 different human cell lines (GM12878,HeLa, HMEC, HUVEC, IMR90, and NHEK) were ob-tained from a study by Rao et al. [1] and that of H1 celllines was acquired from a study by Dixon et al. [33].There were no loop anchor locations for the H1 cell line.The boundaries and loop anchors in these studies wereidentified from HI-C data with kilobase resolution. How-ever, the downloaded locations were one bp long. Weextended the length of boundaries and loop anchors onboth ends by 10 kb to make each TAD boundary to be20 kb long.
Soibam and Zhamangaraeva BMC Genomics (2021) 22:397 Page 8 of 10
LncRNA sequences and their expressionThe lncRNA sequences were downloaded from theGENCODE project. The expression profiles of long non-coding RNAs (lncRNAs) were collected from ENCODEproject (https://www.encodeproject.org). The expressionprofiles were indicated as TPM (Transcripts per KilobaseMillion). For lncRNAs that have multiple isoforms, weconsidered the one with the highest number of triplex-forming sites with the hg19 genome. Any lncRNA withTPM (Transcripts per Kilobase Million) value > 5 wereconsidered “expressed”.
Clustering analysisTo cluster the lncRNAs based on their expression inseven human cell lines, we computed the z-scores of thelncRNAs across the cell lines. HOPACH hierarchical[21] clustering was performed using R hopach package.
Generation and enrichment analysis of lcnRNA:DNA TFSsThe triplex-forming sites (TFSs) of lncRNAs were deter-mined by aligning the lncRNA sequences to the hg19genome by triplexator tool setting the minimum triplexfeature-length to 20. For lncRNAs with multiple iso-forms, we used the isoform with the maximum numberof TFSs. To assess whether the triplex-forming sites oflncRNAs are enriched in regions of interest (TADs orboundaries or anchors), we computed the observedcoverage (or number of base pair overlaps) of regions ofinterest with the triplex-forming sites using bedtools[34].An expected coverage was generated by randomly per-
muting the real triplex-forming sites (TFSs) within thegenome and computing the coverage of this random setwith the regions of interest. This random shuffling wasperformed 1000 times, for each shuffled set; an expectedcoverage was obtained to generate a distribution of ex-pected coverage. These distributions were tested for anormal distribution for all the seven cell lines using theAnderson-Darling normality test. P-values were com-puted using the observed coverage in the region of inter-est and estimated parameters of the normal distribution.To compare differential positional preference of theTFSs of lncRNAs between the TADs boundaries and re-gions within the TADs, the positions of TFSs that over-lap with boundaries of TADs was randomly permutatedso that they fell only within the TADs (but excluding theboundary regions).
Functional elements annotationThe functional annotation of TFSs was done using the“annotatePeak.pl” module in HOMER tool [35]. Accord-ing to HOMER, the NCBI RefSeq transcript definitionsfrom the UCSC genome browser are used to derive thefunctional annotations of different genomic regions.
HOMER uses promoters from all transcripts of a gene.It defines promoters as genomic intervals that encom-pass 1 kb upstream and 100 bp downstream of TSSs. Tocompare the enrichment of TFSs in different functionalgenome regions, we computed the density of TFSs ineach type of functional element as the number of TFSsin every 10 kb region of that particular functional elem-ent. This was done simply done by multiplying the ratioof overlapping TFSs and summed length of the func-tional element by 1000. This normalization was done tomake appropriate comparisons between different typesof functional elements which differ vastly in size. Over-lapping genomic regions annotated to the same func-tional element were merged before computing thesummed length.
Training machine learning modelsFor a cell line, we considered all the m lncRNAs(lncRNA1, lncRNA2, …, lncRNAm) which had at leastone triplex-forming site in at least one of n TADs(TAD1, TAD2,., TADn). We generated n random gen-omic intervals (non-TAD1, non-TAD2, ., non-TADn)which did not overlap with any of the TADs. TFSs ofthe same m lncRNAs were determined on these n ran-dom genomic intervals. We posed a supervisedmachine-learning problem, where the class labels of 2nsamples (n TADs of the class label “1” and n non-TADswith the class label “0”) can be predicted using the countof TFSs of the m lncRNAs as features. Four differentmodels (Table S5 in Additional file 1) were trained todetermine the best model parameters using a trainingset (80 % of 2n samples) with 5-fold cross-validation.The performances of the models were reported by pre-dicting on the test samples (20 % of 2n samples). The pa-rameters tuned in the models are given in Table S4 inAdditional file 1. All models were implemented usingthe R language, CARET [36], and GLMET [37]packages.In the context of determining “TAD-lncRNAs”, we de-
termined the “importance” of a lncRNA (lncRNAi) inthe machine learning model. To do so, only the countsof TFSs of lncRNAi were randomly shuffled across thesamples in the original test set. We computed the accur-acy on the shuffled test set using the best Random For-est model. The difference between the accuracies on theoriginal test set and shuffled test set was used as the im-portance of the lncRNAi. The higher the difference, thehigher the importance score of the lncRNA.
Supplementary informationThe online version contains supplementary material available at https://doi.org/10.1186/s12864-021-07727-7.
Additional file 1
Soibam and Zhamangaraeva BMC Genomics (2021) 22:397 Page 9 of 10
AcknowledgementsNot applicable.
Authors' contributionsB.S designed and performed the research, analyzed data, and wrote thepaper. A.Z analyzed data.
FundingThis work was supported by funds from the National Institutes of HealthGrant 1R15 GM137254-01 (to B.S).
Availability of data and materialsThe datasets used and/or analyzed during the current study are availablefrom github page https://github.com/lncRNAAddict/Triplex.
Declarations
Ethics approval and consent to participateNot applicable.
Consent for publicationNot applicable.
Competing interestThe authors declare that they have no competing interests.
Received: 17 March 2021 Accepted: 12 May 2021
References1. Rao SSP, Huntley MH, Durand NC, Stamenova EK, Bochkov ID, Robinson JT,
et al. A 3D Map of the Human Genome at Kilobase Resolution RevealsPrinciples of Chromatin Looping. Cell. 2015;162:687–8.
2. Dixon JR, Selvaraj S, Yue F, Kim A, Li Y, Shen Y, et al. Topological domains inmammalian genomes identified by analysis of chromatin interactions.Nature. 2012;485:376–80. doi:https://doi.org/10.1038/nature11082.
3. Lupiáñez DG, Spielmann M, Mundlos S. Breaking TADs: How Alterations ofChromatin Domains Result in Disease. Trends in Genetics. 2016;32:225–37.
4. Lupiáñez DG, Kraft K, Heinrich V, Krawitz P, Brancati F, Klopocki E, et al.Disruptions of topological chromatin domains cause pathogenic rewiring ofgene-enhancer interactions. Cell. 2015;161:1012–25.
5. Valentijn LJ, Koster J, Zwijnenburg DA, Hasselt NE, Van Sluis P, Volckmann R,et al. TERT rearrangements are frequent in neuroblastoma and identifyaggressive tumors. Nat Genet. 2015;47:1411–4.
6. Gröschel S, Sanders MA, Hoogenboezem R, De Wit E, Bouwman BAM,Erpelinck C, et al. A single oncogenic enhancer rearrangement causesconcomitant EVI1 and GATA2 deregulation in Leukemia. Cell. 2014;157:369–81.
7. Vian L, Pękowska A, Rao SSP, Kieffer-Kwon KR, Jung S, Baranello L, et al. TheEnergetics and Physiological Impact of Cohesin Extrusion. Cell. 2018;175(1):292–4
8. Sanborn AL, Rao SSP, Huang SC, Durand NC, Huntley MH, Jewett AI, et al.Chromatin extrusion explains key features of loop and domain formation in wild-type and engineered genomes. Proc Natl Acad Sci U S A. 2015;112(47):E6456–65.
9. Fudenberg G, Imakaev M, Lu C, Goloborodko A, Abdennur N, Mirny LA. Formationof Chromosomal Domains by Loop Extrusion. Cell Rep. 2016;15(9):2038–49.
10. Bonev B, Mendelson Cohen N, Szabo Q, Fritsch L, Papadopoulos GL, LublingY, et al. Multiscale 3D Genome Rewiring during Mouse NeuralDevelopment. Cell. 2017;171(3):557–2.e24.
11. Nora EP, Goloborodko A, Valton AL, Gibcus JH, Uebersohn A, Abdennur N, et al.Targeted Degradation of CTCF Decouples Local Insulation of ChromosomeDomains from Genomic Compartmentalization. Cell. 2017;169(5):930–44.e22
12. Uusküla-Reimand L, Hou H, Samavarchi-Tehrani P, Rudan MV, Liang M,Medina-Rivera A, et al. Topoisomerase II beta interacts with cohesin andCTCF at topological domain borders. Genome Biol. 2016;17(1):182.
13. Weintraub AS, Li CH, Zamudio A V., Sigova AA, Hannett NM, Day DS, et al. YY1 Is aStructural Regulator of Enhancer-Promoter Loops. Cell. 2017;171(7):1573–88.e28.
14. Phillips-Cremins JE, Sauria MEG, Sanyal A, Gerasimova TI, Lajoie BR, Bell JSK,et al. Architectural protein subclasses shape 3D organization of genomesduring lineage commitment. Cell. 2013;153(6):1281–95.
15. Rowley MJ, Nichols MH, Lyu X, Ando-Kuri M, Rivera ISM, Hermetz K, et al.Evolutionarily Conserved Principles Predict 3D Chromatin Organization. MolCell. 2017;67(5):837–52.e7.
16. Statello L, Guo C-J, Chen L-L, Huarte M. Gene regulation by long non-coding RNAs and its biological functions. Nat Rev Mol Cell Biol. 2021;22:96–118. doi:https://doi.org/10.1038/s41580-020-00315-9.
17. Hacisuleyman E, Goff LA, Trapnell C, Williams A, Henao-Mejia J, Sun L, McClanahanP, Hendrickson DG, Sauvageau M, Kelley DR, Morse M, Engreitz J, Lander ES,Guttman M, Lodish HF, Flavell R, Raj A, Rinn JL. Topological organization ofmultichromosomal regions by the long intergenic noncoding RNA Firre. Nat StructMol Biol. 2014;21(2):198–206. https://doi.org/10.1038/nsmb.2764.
18. Kentepozidou E, Aitken SJ, Feig C, Stefflova K, Ibarra-Soria X, Odom DT, et al.Clustered CTCF binding is an evolutionary mechanism to maintaintopologically associating domains. Genome Biol. 2020;21:5. doi:https://doi.org/10.1186/s13059-019-1894-x.
19. Bourque G, Leong B, Vega VB, Chen X, Yen LL, Srinivasan KG, et al. Evolutionof the mammalian transcription factor binding repertoire via transposableelements. Genome Res. 2008;18(11):1752–62.
20. Schmidt D, Schwalie PC, Wilson MD, Ballester B, Gonalves Â, Kutter C, et al.Waves of retrotransposon expansion remodel genome organization andCTCF binding in multiple mammalian lineages. Cell. 2012;148(1-2):335–48.
21. van der Laan MJ, Pollard KS. A new algorithm for hybrid hierarchical clustering withvisualization and the bootstrap. J Stat Plan Inference. 2003;117:275–303.
22. Jiang C, Li Y, Zhao Z, Lu J, Chen H, Ding N, et al. Identifying andfunctionally characterizing tissue-specific and ubiquitously expressed humanlncRNAs. Oncotarget. 2016.
23. Cabili, MN, Trapnell, C, Goff, L, Koziol, M, Tazon-Vega, B, Regev, A, Rinn J.Integrative annotation of human large intergenic noncoding RNAs revealsglobal properties and specific subclasses. Genes Dev. 2010;42:1113–7.
24. Buske FA, Bauer DC, Mattick JS, Bailey TL. Triplexator: Detecting nucleic acid triplehelices in genomic and transcriptomic data. Genome Res. 2012;22:1372–81.
25. Grote P, Wittler L, Hendrix D, Koch F, Währisch S, Beisaw A, et al. The Tissue-Specific lncRNA Fendrr Is an Essential Regulator of Heart and Body WallDevelopment in the Mouse. Dev Cell. 2013;24(2):206–14.
26. Postepska-Igielska A, Giwojna A, Gasri-Plotnitsky L, Schmitt N, Dold A,Ginsberg D, et al. LncRNA Khps1 Regulates Expression of the Proto-oncogene SPHK1 via Triplex-Mediated Changes in Chromatin Structure. MolCell. 2015;60(4):626–36.
27. O’Leary VB, Ovsepian SV, Carrascosa LG, Buske FA, Radulovic V, Niyazi M,et al. PARTICLE, a triplex-forming long ncRNA, regulates locus-specificmethylation in response to low-dose irradiation. Cell Rep. 2015;11(3):474–85.
28. Soibam B. Super-lncRNAs: Identification of lncRNAs that target super-enhancers via RNA:DNA:DNA triplex formation. RNA. 2017;23(11):1729–42.
29. Tsai MC, Manor O, Wan Y, Mosammaparast N, Wang JK, Lan F, et al. Longnoncoding RNA as modular scaffold of histone modification complexes.Science (80-). 2010.
30. Kuo CC, Hänzelmann S, Sentürk Cetin N, Frank S, Zajzon B, Derks JP, et al.Detection of RNA-DNA binding sites in long noncoding RNAs. Nucleic AcidsRes. 2019;47:e32.
31. Grote P, Herrmann BG. The long non-coding RNA Fendrr links epigenetic controlmechanisms to gene regulatory networks in mammalian embryogenesis. RNA Biol.2013;10:1579–85. doi:https://doi.org/10.4161/rna.26165.
32. Wang F, Chainani P, Yang J, White T, Liu Y, Soibam B. Deep LearningIdentifies Genome-Wide DNA Binding Sites Of Long Noncoding RNAs. RNABiol. 2018;15(12):1468–76.
33. Dixon JR, Selvaraj S, Yue F, Kim A, Li Y, Shen Y, et al. Topological domains inmammalian genomes identified by analysis of chromatin interactions.Nature. 2012;485:376–80.
34. Quinlan AR, Hall IM. BEDTools: A flexible suite of utilities for comparinggenomic features. Bioinformatics. 2010;26:841–2.
35. Heinz S, Benner C, Spann N, Bertolino E, Lin YC, Laslo P, et al. SimpleCombinations of Lineage-Determining Transcription Factors Prime cis-Regulatory Elements Required for Macrophage and B Cell Identities. MolCell. 2010;38(4):576–89.
36. Kuhn M. caret Package. J Stat Softw. 2008;28(5):1–26.37. Friedman J, Hastie T, Tibshirani R. Regularization Paths for Generalized Linear
Models via Coordinate Descent. J Stat Softw. 2010;33. doi:https://doi.org/10.18637/jss.v033.i01.
Publisher’s NoteSpringer Nature remains neutral with regard to jurisdictional claims inpublished maps and institutional affiliations.
Soibam and Zhamangaraeva BMC Genomics (2021) 22:397 Page 10 of 10