Linking political and scientifically derived targets for global biodiversity conservation:...
10
DOI: 10.1111/j.1472-4642.2007.00445.x © 2007 The Authors 604 Journal compilation © 2007 Blackwell Publishing Ltd www.blackwellpublishing.com/ddi Diversity and Distributions, (Diversity Distrib.) (2008) 14, 604–613 BIODIVERSITY RESEARCH ABSTRACT Despite the global network of protected areas covers 12% of the world’s land surface, its performance is still unsatisfactory. Although political and scientifically sound conservation targets usually portray different pictures of the task ahead, we show that in terms of priority areas for expanding the global network of reserves, there is much agreement between the political targets of the Convention on Biological Diversity (CBD), and the scientifically derived goals endorsed by international conservation organizations. Here we analyse four global databases to identify priority areas for fulfilling the CBD target of representing 10% of every ecological region within protected areas, and compare the distribution of priority regions for fulfilling that political target, with the distribution of the priority areas for global biodiversity conservation identified by Conservation International, the WWF, and the Wildlife Conservation Society on scientific basis. For 63% (549) of the world’s terrestrial ecoregions the CBD 10% target is still not met; fulfilling it requires protecting another 4.6% of the Earth’s land surface (6,239,894 km 2 ). Yet, at least 78% of the priority regions for fulfilling that target lay within priority regions for the main global conservation strategies. By pursuing the political target set by the CBD much ancillary gains in terms of other global conservation objectives can be obtained. Keywords Biodiversity Hotspots, conservation planning, ecoregions, gap analysis, Global 200, Last of the Wild, reserves. INTRODUCTION The conservation of biological diversity is one of mankind’s greatest challenges to ensure its long-lasting well-being (Costanza et al., 1997; Balmford et al., 2002). The creation of nature reserves is a key, cost-efficient, component of that enterprise (Balmford et al., 2002). Actually, setting aside areas for the preservation of natural values is an ancient and widespread human practice (Margules & Pressey, 2000). For almost two decades one of the main global conservation goals has been the consolidation of an international network of protected areas covering 10% of the world’s surface (IUCN, 1993). The network currently covers 12% of the planet’s land surface (Chape et al., 2005), but its performance is still far from convincing (Brooks et al., 2004; Rodrigues et al., 2004a,b; Hoekstra et al., 2005). One of the reasons for this limited success is the lack of a strong scientific foundation for such fixed percentage targets: despite they are politically appealing, land surface is not a good proxy for biodiversity (Soulé & Sanjayan, 1998; Rodrigues et al., 2004b; Tear et al., 2005). As a matter of fact, most global biodiversity conservation strategies recognize the need to protect a much larger percentage (19.8% ± 11.9) of the Earth’s land surface (Brooks et al., 2006). Clearly, global biodiversity conservation requires expanding the network of protected areas (Brooks et al., 2004). Despite the shortcomings of fixed targets, the agreement of the 190 countries signatories of the Convention on Biological Diversity (CBD) of working together to ensure that 10% of all ecological regions is effectively conserved (e.g. Chape et al., 2005; CoP 7 Decision VII/30: Goal 1. Promote the conservation of the biological diversity of ecosystems, habitats and biomes – Target 1.1: At least 10% of each of the world’s ecological regions effectively conserved) is arguably one of the most significant global conservation achievements (Balmford et al., 2005). Mostly because it means that nations (not only conservation-concerned organizations and individuals) have assumed the legal and political Estación Biológica Terra Natura (CIBIO – Fundación Terra Natura), Universidad de Alicante, Apdo. correos 99, Alicante E-03080, Spain Correspondence: Alvaro Soutullo, Estación Biológica Terra Natura (CIBIO – Fundación Terra Natura), Universidad de Alicante, Apdo. correos 99, Alicante E-03080, Spain. Tel.: +34 965 903400 Ext. 3202; Fax: +34 965 903815; E-mail: [email protected] Blackwell Publishing Ltd Linking political and scientifically derived targets for global biodiversity conservation: implications for the expansion of the global network of protected areas Alvaro Soutullo 1 *, Monica De Castro 2 and Vicente Urios 3
-
Upload
independent -
Category
Documents
-
view
0 -
download
0
Transcript of Linking political and scientifically derived targets for global biodiversity conservation:...
DOI: 10.1111/j.1472-4642.2007.00445.x © 2007 The Authors
604
Journal compilation © 2007 Blackwell Publishing Ltd www.blackwellpublishing.com/ddi
Diversity and Distributions, (Diversity Distrib.)
(2008)
14
, 604–613
BIODIVERSITYRESEARCH
ABSTRACT
Despite the global network of protected areas covers 12% of the world’s land surface,its performance is still unsatisfactory. Although political and scientifically soundconservation targets usually portray different pictures of the task ahead, we showthat in terms of priority areas for expanding the global network of reserves, there ismuch agreement between the political targets of the Convention on BiologicalDiversity (CBD), and the scientifically derived goals endorsed by internationalconservation organizations. Here we analyse four global databases to identify priorityareas for fulfilling the CBD target of representing 10% of every ecological regionwithin protected areas, and compare the distribution of priority regions for fulfillingthat political target, with the distribution of the priority areas for global biodiversityconservation identified by Conservation International, the WWF, and the WildlifeConservation Society on scientific basis. For 63% (549) of the world’s terrestrialecoregions the CBD 10% target is still not met; fulfilling it requires protectinganother 4.6% of the Earth’s land surface (6,239,894 km
2
). Yet, at least 78% of thepriority regions for fulfilling that target lay within priority regions for the mainglobal conservation strategies. By pursuing the political target set by the CBD muchancillary gains in terms of other global conservation objectives can be obtained.
Keywords
Biodiversity Hotspots, conservation planning, ecoregions, gap analysis, Global 200,
Last of the Wild, reserves.
INTRODUCTION
The conservation of biological diversity is one of mankind’s
greatest challenges to ensure its long-lasting well-being (Costanza
et al
., 1997; Balmford
et al
., 2002). The creation of nature
reserves is a key, cost-efficient, component of that enterprise
(Balmford
et al
., 2002). Actually, setting aside areas for the
preservation of natural values is an ancient and widespread
human practice (Margules & Pressey, 2000). For almost two
decades one of the main global conservation goals has been the
consolidation of an international network of protected areas
covering 10% of the world’s surface (IUCN, 1993). The network
currently covers 12% of the planet’s land surface (Chape
et al
.,
2005), but its performance is still far from convincing (Brooks
et al
., 2004; Rodrigues
et al
., 2004a,b; Hoekstra
et al
., 2005). One
of the reasons for this limited success is the lack of a strong
scientific foundation for such fixed percentage targets: despite
they are politically appealing, land surface is not a good proxy for
biodiversity (Soulé & Sanjayan, 1998; Rodrigues
et al
., 2004b;
Tear
et al
., 2005). As a matter of fact, most global biodiversity
conservation strategies recognize the need to protect a much
larger percentage (19.8% ± 11.9) of the Earth’s land surface
(Brooks
et al
., 2006). Clearly, global biodiversity conservation
requires expanding the network of protected areas (Brooks
et al
.,
2004).
Despite the shortcomings of fixed targets, the agreement of
the 190 countries signatories of the Convention on Biological
Diversity (CBD) of working together to ensure that 10% of all
ecological regions is effectively conserved (e.g. Chape
et al
., 2005;
CoP 7 Decision VII/30: Goal 1. Promote the conservation of the
biological diversity of ecosystems, habitats and biomes – Target
1.1: At least 10% of each of the world’s ecological regions
effectively conserved) is arguably one of the most significant
global conservation achievements (Balmford
et al
., 2005). Mostly
because it means that nations (not only conservation-concerned
organizations and individuals) have assumed the legal and political
Estación Biológica Terra Natura
(CIBIO – Fundación Terra Natura),
Universidad de Alicante, Apdo. correos 99,
Alicante E-03080, Spain
Correspondence: Alvaro Soutullo, Estación Biológica Terra Natura (CIBIO – Fundación Terra Natura), Universidad de Alicante, Apdo. correos 99, Alicante E-03080, Spain. Tel.: +34 965 903400 Ext. 3202; Fax: +34 965 903815; E-mail: [email protected]
Blackwell Publishing Ltd
Linking political and scientifically derived targets for global biodiversity conservation: implications for the expansion of the global network of protected areas
Alvaro Soutullo
1
*, Monica De Castro
2
and Vicente Urios
3
Political and scientific targets for global conservation
© 2007 The Authors
Diversity and Distributions
,
14
, 604–613, Journal compilation © 2007 Blackwell Publishing Ltd
605
responsibility of implementing measures to ensure that this
target is met. Hence, despite its limitations, it seems obvious that
a basic criterion to consider when planning the expansion of the
global network of protected areas is to ensure that 10% of all of
the planet’s ecoregions are represented within reserves. Among
other things because nations have already assumed that respon-
sibility, and thus, are bound to enforce the implementation of
actions aimed at meeting that target. This is even more relevant
in the absence of a consensus scientifically sound strategy to
expand the network.
Unfortunately, this is the case. Extant proposals for expanding
the global network of protected areas portray very different
conclusions regarding where new reserves are most needed
(e.g. Rodrigues
et al
., 2004a; Hoekstra
et al
., 2005). This is in part
because scientists and conservation organizations do not have
a unified view of which regions are most relevant for global
biodiversity conservation. This in turn is a consequence of both
the different ways in which the biodiversity value of a site can be
assessed (e.g. Noss, 1990; Maddock & Du Plessis, 1999; Cowling
et al
., 2004), and the different criteria that might be used to
identify priorities for action (e.g. Orme
et al
., 2005; Brooks
et al
.,
2006; Ceballos & Ehrlich, 2006). Thus, extant templates do not
provide a clear guide to inform the expansion of the global
network of protected areas. Together, they identify 79% of the
Earth’s land surface as a conservation priority (Brooks
et al
.,
2006). Thus, the question of where new protected areas have to
be created does not have a simple, unique answer. Clearly,
regions that most of these templates identify as priority are good
candidates. Yet, in the face of the CBD target, another (compatible)
alternative is to expand the network in those ecoregions where
that target has not been met yet, trying in the process to maximize
the ancillary gains in terms of the other conservation targets
ascribed by the extant global conservation strategies.
Here we identify priority regions for the expansion of the
global network of terrestrial protected areas in order to fulfil
the CBD 10% target at a minimum cost in terms of land surface
protected, and evaluate the contribution of these regions to
augment ancillary gains in terms of other global conservation
objectives. To do that we compared the distribution of the global
network of protected areas with the distribution of three of the
nine major global biodiversity conservation templates. These
three templates are representative of the three general approaches
used for conservation prioritization (Brooks
et al
., 2006), prioritiz-
ing (1) highly vulnerable regions (Biodiversity Hotspots), (2)
irreplaceable regions (Global 200 ecoregions and Biodiversity
Hotspots), and (3) regions of low vulnerability (Last of the Wild
places). As there is significant overlap in the priority regions
identified by templates using the same approach, but not in those
identified by templates using different approaches, the three
templates we used incorporate most of the priority regions
identified by all the nine templates (Brooks
et al
., 2006).
Our aim with this analysis was threefold. First, within the
terrestrial domain identify how much more protected area is
required to meet the CBD target of protecting at least 10% of all
terrestrial ecoregions. Second, identify at a global scale regions where
new protected areas are to be created to accomplish that target.
Third, evaluate to what degree expanding the global network of
protected areas in those regions would contribute to gain ancillary
benefits in terms of other global conservation objectives.
METHODS
To identify priority regions for the expansion of the global
network of reserves within the terrestrial domain, we used data
on the global distribution of protected areas obtained from the
2005 World Database on Protected Areas (WDPA, 2005). For
protected areas we only considered areas protected at the
national level that have been assigned an IUCN category, as it is
arguable whether other areas included in the database actually
contribute to biodiversity protection in their current situation:
many are not true nature reserves (e.g. urban parks, military and
indigenous reservations, and forest plantations). Using the
IUCN categories clarifies the aims of the areas identified as
protected areas, provides international standards for accounting
and comparisons, a framework for collection, handling and
dissemination of protected areas data, and is the standard
approach used for analysing the coverage of the global network
of protected areas for planning purposes (e.g. Rodrigues
et al
.,
2004a; Hoekstra
et al
., 2005). Although considering only reserves
that abide to the IUCN criteria leaves outside of the analyses
38,404 protected areas listed in the WDPA (2005) (which cover a
total surface of 4,586,652 km
2
), only 27,951 of these are actually
designated and can be located on a map, covering 2,943,772 km
2
(WDPA, 2005). Moreover, 60% of this surface lay in Brazil, the
Russian Federation, Colombia, Peru, and Venezuela, countries
with strong IUCN presence, suggesting that there are good
reasons not to consider these areas as nature reserves in the IUCN
sense.
Although the WDPA provides both point and polygon data,
for the analyses we initially considered point data, as polygon
data were only available for some reserves (see e.g. Rodrigues
et al
., 2004a,b; Chape
et al
., 2005). Contrary to Hoekstra
et al
.
(2005), protected areas identified as marine at the WDPA were
not
a priori
excluded because many of them encompass large
areas of terrestrial ecoregions like islands and coastal zones.
As the CBD does not specify which classification of the world’s
ecological regions is the most appropriate to assess the progress
towards the 10% target, for this analysis we decided to use the
WWF classification of the world’s terrestrial ecoregions (Olson
et al
., 2001), which is largely used by many national and interna-
tional conservation organizations. Data on terrestrial ecoregions
were thus obtained from the WWF (2005). To be consistent with
Global 200 (G200) ecoregions (Olson & Dinerstein, 1998) and
Biodiversity Hotspots (BH) (Mittermeier
et al
., 2004) classifica-
tions, we used the original ecoregions proposed by the WWF
(Olson
et al
., 2001), not the recently revised version 2, which
recognizes 825, not 867 terrestrial ecoregions. To calculate
ecoregions’ surface we transformed the original database in
degrees to an equal-area cylindrical projection.
Protected areas were assigned to the ecoregions where the
points representing them were located. As many protected areas
encompass more than one ecoregion, we revised the initial
A. Soutullo
et al.
© 2007 The Authors
606
Diversity and Distributions
,
14
, 604–613, Journal compilation © 2007 Blackwell Publishing Ltd
assignation by calculating for each protected area a circular
buffer of the size of the area’s surface (except for those areas for
which boundaries were available as polygon shapefiles in the
WDPA, as in these cases we used the original information), and
assigned the areas to the ecoregion including the largest proportion
of the polygon. For each ecoregion we calculated the number of
protected areas, their mean (± standard deviation) size, and the
percentage of the ecoregion within protected areas. These metrics
were calculated for both all reserves in IUCN categories, and only
those in categories I–IV. We proceeded in this way because
the primary objective of reserves in categories I–IV is nature
conservation, whereas for reserves in categories V and VI the
main objective is sustainable use. Hence, it is arguable which
group of reserves provides the best picture of the actual con-
tribution of reserves networks to biodiversity conservation
(Brooks
et al
., 2004; Rodrigues
et al
., 2004a,b; Hoekstra
et al
.,
2005; Soutullo & Gudynas, 2006).
We then compared the distribution of the ecoregions with
less than 10% of their surface protected (considering IUCN
categories I–VI), with the distribution of the priority regions of
the three global biodiversity conservation templates analysed.
Data on BH were obtained from Conservation International
(2005), data on the ‘Last of the Wild’ (LTW) places (Sanderson
et al
., 2002) from the Wildlife Conservation Society and Colum-
bia University’s CIESIN (2006), and data on G200 ecoregions
from the WWF (2005). To calculate the total land surface covered
by the three global conservation templates we merged the
shapefiles into a single map and projected it into an equal-area
cylindrical projection. Finally, to identify which of the under-
represented ecoregions (i.e. those with < 10% of their surface
within protected areas) were also considered priority regions
by each template, we generated a map of underrepresented
ecoregions and used it to clip each template map. All analyses
were conducted in Arcview 3.2.
With the data provided in the WDPA, 13,033 reserves (covering
2,080,232 km
2
) were not initially assigned to any of the terrestrial
ecoregions. After our correction only 9010 remained unassigned
(covering 325,936 km
2
). The surface assigned includes
1,686,494 km
2
of 1683 reserves indicated as marine in the WDPA
that only marginally encompass terrestrial ecoregions, if any.
These were not considered in further analyses. The remaining
1969 reserves that are indicated as marine in the WDPA (2005)
encompass large portions of terrestrial ecoregions and hence,
were assigned to one of them. Of the remaining 371, only 45
could not be assigned to any terrestrial ecoregion despite having
information on their location. For the rest no geographical
coordinates are provided in the WDPA (2005).
There are, however, some caveats on the accuracy of the figures
that can be obtained from analyses of the coverage of the global
network of protected areas, as data in the WDPA have certain
degree of inaccuracy and incompleteness, and there are limita-
tions on the accuracy with which reserves can be assigned to
ecoregions (Rodrigues
et al
., 2004a; Chape
et al
., 2005). Particularly
relevant for this analysis are inaccuracies on reserves’ size and
boundaries, as they preclude exact evaluations of the extent of
ecoregional representation of the global network of protected
areas. Furthermore, in many countries there is overlap between
protected areas (e.g. Soutullo & Gudynas, 2006), and thus, a
simple summation of their surfaces would produce an inflated
estimate of total coverage (Chape
et al
., 2005).
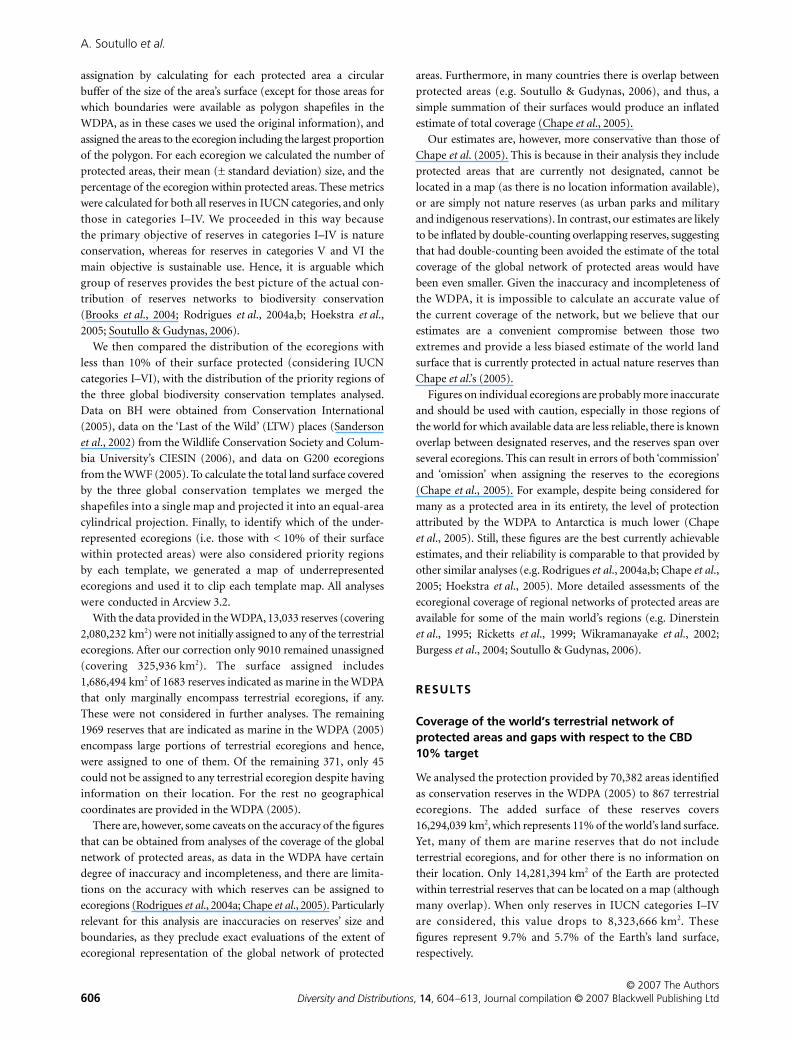
Our estimates are, however, more conservative than those of
Chape
et al
. (2005). This is because in their analysis they include
protected areas that are currently not designated, cannot be
located in a map (as there is no location information available),
or are simply not nature reserves (as urban parks and military
and indigenous reservations). In contrast, our estimates are likely
to be inflated by double-counting overlapping reserves, suggesting
that had double-counting been avoided the estimate of the total
coverage of the global network of protected areas would have
been even smaller. Given the inaccuracy and incompleteness of
the WDPA, it is impossible to calculate an accurate value of
the current coverage of the network, but we believe that our
estimates are a convenient compromise between those two
extremes and provide a less biased estimate of the world land
surface that is currently protected in actual nature reserves than
Chape
et al
.’s (2005).
Figures on individual ecoregions are probably more inaccurate
and should be used with caution, especially in those regions of
the world for which available data are less reliable, there is known
overlap between designated reserves, and the reserves span over
several ecoregions. This can result in errors of both ‘commission’
and ‘omission’ when assigning the reserves to the ecoregions
(Chape
et al
., 2005). For example, despite being considered for
many as a protected area in its entirety, the level of protection
attributed by the WDPA to Antarctica is much lower (Chape
et al
., 2005). Still, these figures are the best currently achievable
estimates, and their reliability is comparable to that provided by
other similar analyses (e.g. Rodrigues
et al
., 2004a,b; Chape
et al
.,
2005; Hoekstra
et al
., 2005). More detailed assessments of the
ecoregional coverage of regional networks of protected areas are
available for some of the main world’s regions (e.g. Dinerstein
et al
., 1995; Ricketts
et al
., 1999; Wikramanayake
et al
., 2002;
Burgess
et al
., 2004; Soutullo & Gudynas, 2006).
RESULTS
Coverage of the world’s terrestrial network of protected areas and gaps with respect to the CBD 10% target
We analysed the protection provided by 70,382 areas identified
as conservation reserves in the WDPA (2005) to 867 terrestrial
ecoregions. The added surface of these reserves covers
16,294,039 km
2
, which represents 11% of the world’s land surface.
Yet, many of them are marine reserves that do not include
terrestrial ecoregions, and for other there is no information on
their location. Only 14,281,394 km
2
of the Earth are protected
within terrestrial reserves that can be located on a map (although
many overlap). When only reserves in IUCN categories I–IV
are considered, this value drops to 8,323,666 km
2
. These
figures represent 9.7% and 5.7% of the Earth’s land surface,
respectively.
Political and scientific targets for global conservation
© 2007 The Authors
Diversity and Distributions
,
14
, 604–613, Journal compilation © 2007 Blackwell Publishing Ltd
607
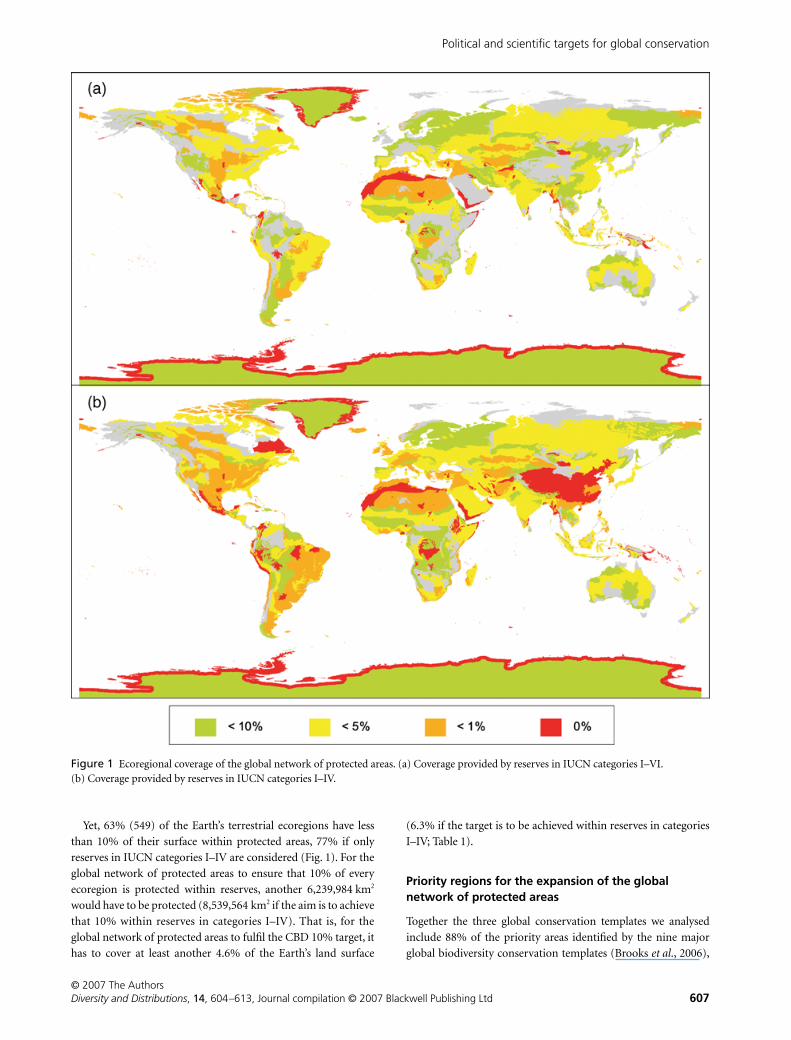
Yet, 63% (549) of the Earth’s terrestrial ecoregions have less
than 10% of their surface within protected areas, 77% if only
reserves in IUCN categories I–IV are considered (Fig. 1). For the
global network of protected areas to ensure that 10% of every
ecoregion is protected within reserves, another 6,239,984 km
2
would have to be protected (8,539,564 km
2
if the aim is to achieve
that 10% within reserves in categories I–IV). That is, for the
global network of protected areas to fulfil the CBD 10% target, it
has to cover at least another 4.6% of the Earth’s land surface
(6.3% if the target is to be achieved within reserves in categories
I–IV; Table 1).
Priority regions for the expansion of the global network of protected areas
Together the three global conservation templates we analysed
include 88% of the priority areas identified by the nine major
global biodiversity conservation templates (Brooks
et al
., 2006),
Figure 1 Ecoregional coverage of the global network of protected areas. (a) Coverage provided by reserves in IUCN categories I–VI. (b) Coverage provided by reserves in IUCN categories I–IV.
A. Soutullo
et al.
© 2007 The Authors
608
Diversity and Distributions
,
14
, 604–613, Journal compilation © 2007 Blackwell Publishing Ltd
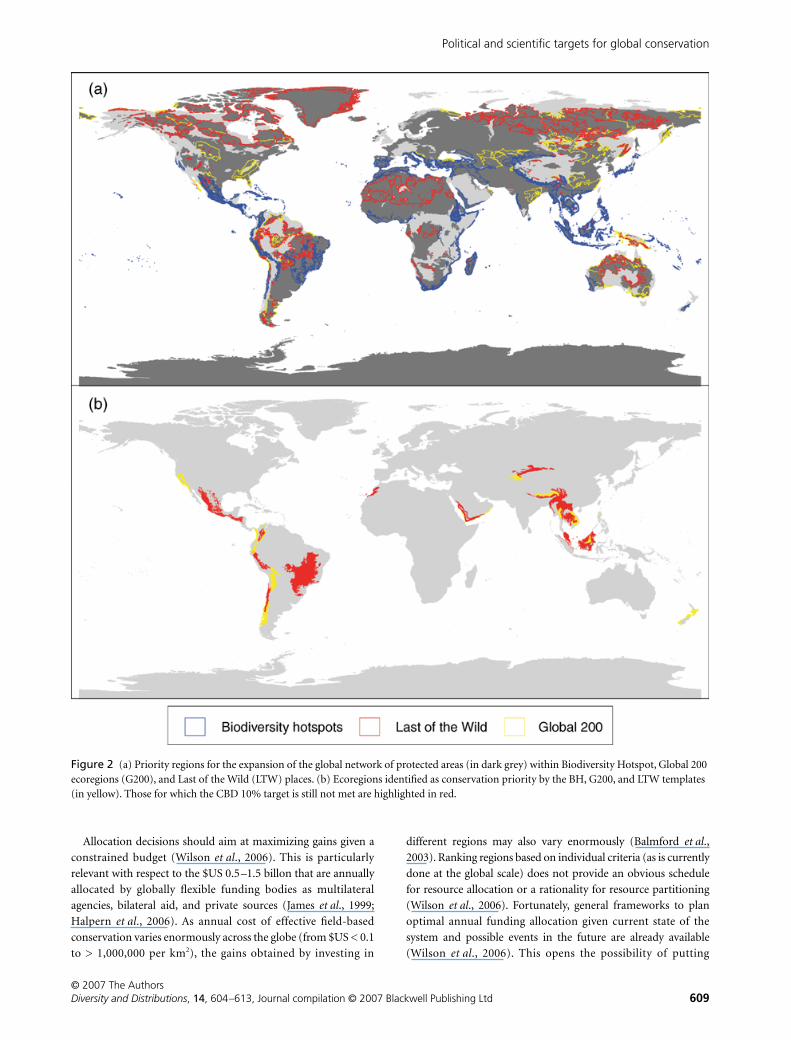
and cover 70% of the Earth’s land surface. Expanding the
network of terrestrial reserves in ecoregions where the 10%
target has not been met yet can provide much ancillary gains in
terms of these global strategies’ conservation objectives. The 549
underrepresented ecoregions (Fig. 2a) include 427 ecoregions
(i.e. 78%) that are considered a priority by at least one of the
global conservation strategies analysed: 254 of the 400 BH
ecoregions, 200 of the 348 G200 ecoregions, and 198 of the 357
ecoregions that include LTW places. Although the remaining 122
underrepresented ecoregions are not priority for any of these
templates, several are considered priority regions by some of the
other six global conservation strategies. Clearly, taking into
account global conservation agreements, future attempts to
improve the coverage of the global network of terrestrial reserves
should regard the 549 underrepresented ecoregions as priority
regions for its expansion.
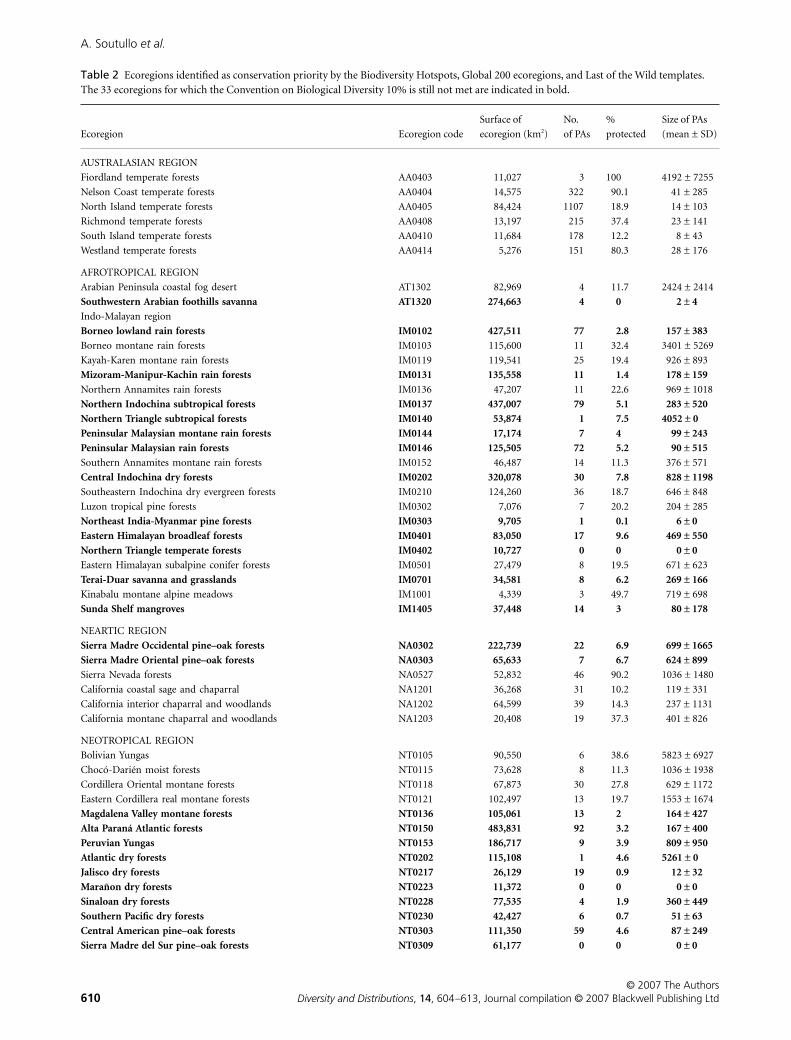
Most interestingly, 62 of the world’s terrestrial ecoregions are
considered priority regions by the three strategies analysed
(Fig. 2b, Table 2). These are areas of high conservation value
irrespective of how biodiversity is measured, highlighting the
need to ensure their protection. However, 33 of these are still
underrepresented in the global network of protected areas
(Table 2). Fulfilling the CBD target for these regions only requires
protecting another 2088 km
2
. Yet, being regions of remarkable
conservation value, conservation targets there should probably
be much more ambitious.
DISCUSSION
Despite the bewildering diversity of criteria and metrics used to
set global conservation priorities, and the discouraging disparity
in the priority regions for global conservation action identified
by the main conservation organizations (Brooks
et al
., 2006),
a substantial improvement in global biodiversity conservation
might be achieved by simply enforcing extant conservation
agreements. Moreover, we have shown that in terms of the
expansion of the global network of protected areas, the most
cost-effective global conservation tool (Balmford
et al
., 2002),
there is much more common ground between political and
scientific targets than usually acknowledged (e.g. Rodrigues
et al
., 2004b). Fulfilling the CBD target of representing 10% of
every ecoregion within reserves implies that the network should
cover at least another 4.6% of the Earth’s land surface. Yet, at least
78% of the ecoregions we identified as priority for the expansion
of the network are also priority regions for the main global
biodiversity conservation strategies.
One of the explicit purposes of international NGO’s global
conservation templates is to guide international conservation
spending (Olson & Dinerstein, 1998; Myers
et al
., 2000; Brooks
et al
., 2006; Halpern
et al
., 2006). Thus, one of the potential
contributions of this analysis is to aid donors in targeting regions
where financial support is most needed to meet the CBD 10%
target. In most cases, these regions have been already identified
as priority for action by the main international conservation
organizations. Thus, by directing a larger share of their conserva-
tion efforts towards underrepresented regions, these conservation
NGOs can make a significant contribution to the fulfilment of
the CBD target while still fulfilling their own targets. This does
not require changes in their objectives, but only changes in
the priority or relative importance they give to their different
targets. In contrast, to meet the CBD target in underrepresented
ecoregions that are not a priority for any global biodiversity
conservation strategy, specific strategies need to be implemented.
Especially taken into account that the amount of money annually
spent in regions that have not been recognized as priority for
action by international conservation organizations is two to 16
time fewer than that spent in regions identified as priority
(Halpern
et al
., 2006). The CBD secretariat should play an active
role in persuading donors of directing conservation efforts
towards these regions.
In any case, biodiversity value and unmet conservation targets
are not the only considerations to take into account when prioritiz-
ing conservation effort. Given the gross mismatch between the
costs of effective biodiversity conservation and current spending,
there is also a need to take into account economic considerations
when planning for action (Balmford
et al
., 2000, 2003; Halpern
et al
., 2006). This is because if the relative cost of investing in
different regions is not taken into account, then there is the risk
of spending resources in regions where only comparatively
modest gains can be obtained.
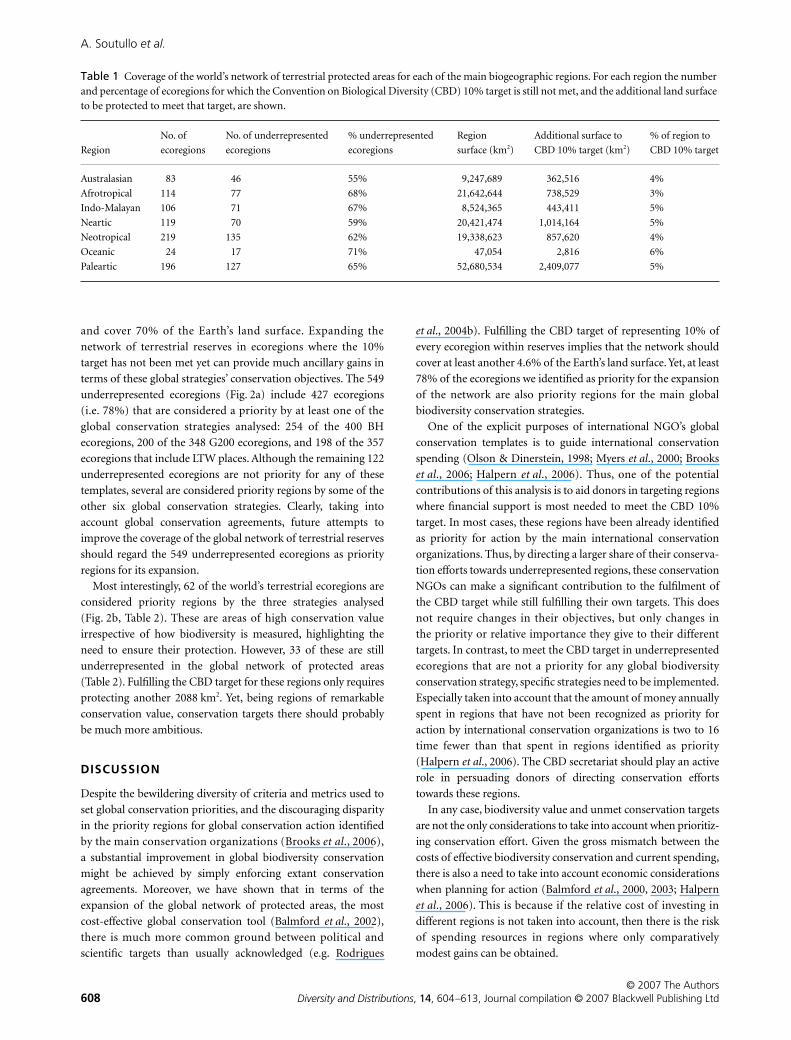
Table 1 Coverage of the world’s network of terrestrial protected areas for each of the main biogeographic regions. For each region the number and percentage of ecoregions for which the Convention on Biological Diversity (CBD) 10% target is still not met, and the additional land surface to be protected to meet that target, are shown.
Region
No. of
ecoregions
No. of underrepresented
ecoregions
% underrepresented
ecoregions
Region
surface (km2)
Additional surface to
CBD 10% target (km2)
% of region to
CBD 10% target
Australasian 83 46 55% 9,247,689 362,516 4%
Afrotropical 114 77 68% 21,642,644 738,529 3%
Indo-Malayan 106 71 67% 8,524,365 443,411 5%
Neartic 119 70 59% 20,421,474 1,014,164 5%
Neotropical 219 135 62% 19,338,623 857,620 4%
Oceanic 24 17 71% 47,054 2,816 6%
Paleartic 196 127 65% 52,680,534 2,409,077 5%
Political and scientific targets for global conservation
© 2007 The Authors
Diversity and Distributions
,
14
, 604–613, Journal compilation © 2007 Blackwell Publishing Ltd
609
Allocation decisions should aim at maximizing gains given a
constrained budget (Wilson
et al
., 2006). This is particularly
relevant with respect to the $US 0.5–1.5 billon that are annually
allocated by globally flexible funding bodies as multilateral
agencies, bilateral aid, and private sources (James
et al
., 1999;
Halpern
et al
., 2006). As annual cost of effective field-based
conservation varies enormously across the globe (from $US < 0.1
to > 1,000,000 per km
2
), the gains obtained by investing in
different regions may also vary enormously (Balmford
et al
.,
2003). Ranking regions based on individual criteria (as is currently
done at the global scale) does not provide an obvious schedule
for resource allocation or a rationality for resource partitioning
(Wilson
et al
., 2006). Fortunately, general frameworks to plan
optimal annual funding allocation given current state of the
system and possible events in the future are already available
(Wilson
et al
., 2006). This opens the possibility of putting
Figure 2 (a) Priority regions for the expansion of the global network of protected areas (in dark grey) within Biodiversity Hotspot, Global 200 ecoregions (G200), and Last of the Wild (LTW) places. (b) Ecoregions identified as conservation priority by the BH, G200, and LTW templates (in yellow). Those for which the CBD 10% target is still not met are highlighted in red.
A. Soutullo
et al.
© 2007 The Authors
610
Diversity and Distributions
,
14
, 604–613, Journal compilation © 2007 Blackwell Publishing Ltd
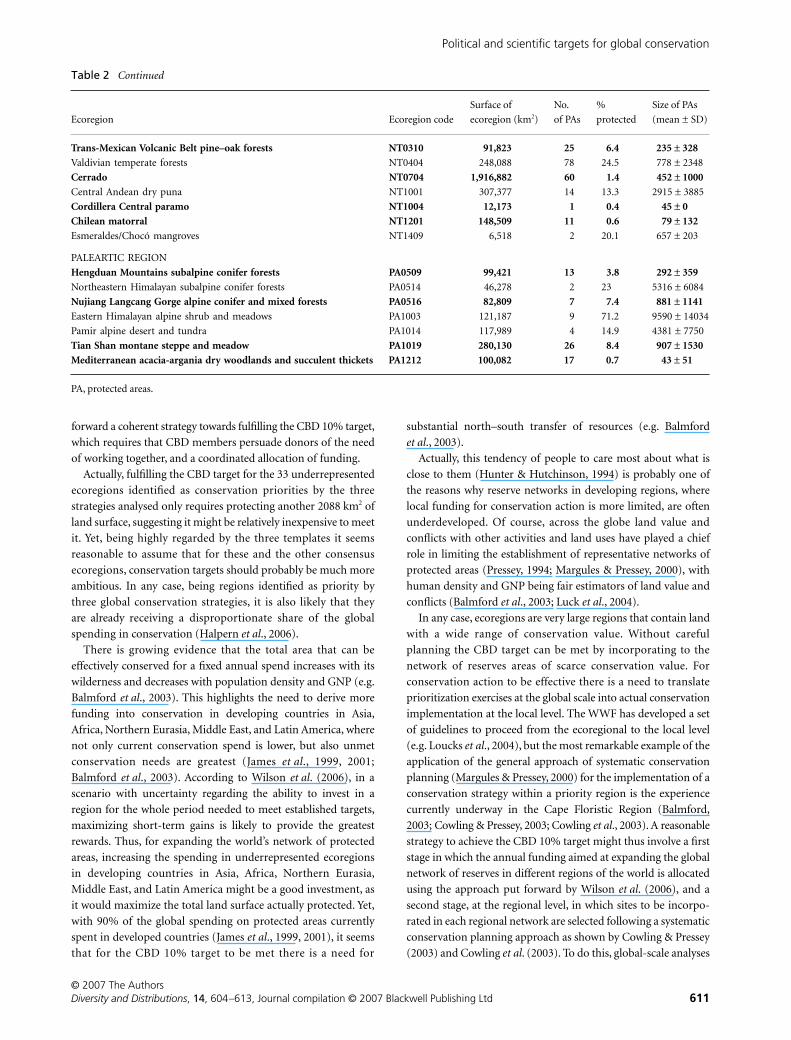
Table 2
Ecoregions identified as conservation priority by the Biodiversity Hotspots, Global 200 ecoregions, and Last of the Wild templates. The 33 ecoregions for which the Convention on Biological Diversity 10% is still not met are indicated in bold.
Ecoregion Ecoregion code
Surface of
ecoregion (km
2
)
No.
of PAs
%
protected
Size of PAs
(mean ± SD)
AUSTRALASIAN REGION
Fiordland temperate forests AA0403 11,027 3 100 4192 ± 7255
Nelson Coast temperate forests AA0404 14,575 322 90.1 41 ± 285
North Island temperate forests AA0405 84,424 1107 18.9 14 ± 103
Richmond temperate forests AA0408 13,197 215 37.4 23 ± 141
South Island temperate forests AA0410 11,684 178 12.2 8 ± 43
Westland temperate forests AA0414 5,276 151 80.3 28 ± 176
AFROTROPICAL REGION
Arabian Peninsula coastal fog desert AT1302 82,969 4 11.7 2424 ± 2414
Southwestern Arabian foothills savanna AT1320 274,663 4 0 2 ± 4
Indo-Malayan region
Borneo lowland rain forests IM0102 427,511 77 2.8 157 ± 383
Borneo montane rain forests IM0103 115,600 11 32.4 3401 ± 5269
Kayah-Karen montane rain forests IM0119 119,541 25 19.4 926 ± 893
Mizoram-Manipur-Kachin rain forests IM0131 135,558 11 1.4 178 ± 159
Northern Annamites rain forests IM0136 47,207 11 22.6 969 ± 1018
Northern Indochina subtropical forests IM0137 437,007 79 5.1 283 ± 520
Northern Triangle subtropical forests IM0140 53,874 1 7.5 4052 ± 0
Peninsular Malaysian montane rain forests IM0144 17,174 7 4 99 ± 243
Peninsular Malaysian rain forests IM0146 125,505 72 5.2 90 ± 515
Southern Annamites montane rain forests IM0152 46,487 14 11.3 376 ± 571
Central Indochina dry forests IM0202 320,078 30 7.8 828 ± 1198
Southeastern Indochina dry evergreen forests IM0210 124,260 36 18.7 646 ± 848
Luzon tropical pine forests IM0302 7,076 7 20.2 204 ± 285
Northeast India-Myanmar pine forests IM0303 9,705 1 0.1 6 ± 0
Eastern Himalayan broadleaf forests IM0401 83,050 17 9.6 469 ± 550
Northern Triangle temperate forests IM0402 10,727 0 0 0 ± 0
Eastern Himalayan subalpine conifer forests IM0501 27,479 8 19.5 671 ± 623
Terai-Duar savanna and grasslands IM0701 34,581 8 6.2 269 ± 166
Kinabalu montane alpine meadows IM1001 4,339 3 49.7 719 ± 698
Sunda Shelf mangroves IM1405 37,448 14 3 80 ± 178
NEARTIC REGION
Sierra Madre Occidental pine–oak forests NA0302 222,739 22 6.9 699 ± 1665
Sierra Madre Oriental pine–oak forests NA0303 65,633 7 6.7 624 ± 899
Sierra Nevada forests NA0527 52,832 46 90.2 1036 ± 1480
California coastal sage and chaparral NA1201 36,268 31 10.2 119 ± 331
California interior chaparral and woodlands NA1202 64,599 39 14.3 237 ± 1131
California montane chaparral and woodlands NA1203 20,408 19 37.3 401 ± 826
NEOTROPICAL REGION
Bolivian Yungas NT0105 90,550 6 38.6 5823 ± 6927
Chocó-Darién moist forests NT0115 73,628 8 11.3 1036 ± 1938
Cordillera Oriental montane forests NT0118 67,873 30 27.8 629 ± 1172
Eastern Cordillera real montane forests NT0121 102,497 13 19.7 1553 ± 1674
Magdalena Valley montane forests NT0136 105,061 13 2 164 ± 427
Alta Paraná Atlantic forests NT0150 483,831 92 3.2 167 ± 400
Peruvian Yungas NT0153 186,717 9 3.9 809 ± 950
Atlantic dry forests NT0202 115,108 1 4.6 5261 ± 0
Jalisco dry forests NT0217 26,129 19 0.9 12 ± 32
Marañon dry forests NT0223 11,372 0 0 0 ± 0
Sinaloan dry forests NT0228 77,535 4 1.9 360 ± 449
Southern Pacific dry forests NT0230 42,427 6 0.7 51 ± 63
Central American pine–oak forests NT0303 111,350 59 4.6 87 ± 249
Sierra Madre del Sur pine–oak forests NT0309 61,177 0 0 0 ± 0
Political and scientific targets for global conservation
© 2007 The Authors
Diversity and Distributions
,
14
, 604–613, Journal compilation © 2007 Blackwell Publishing Ltd
611
Trans-Mexican Volcanic Belt pine–oak forests NT0310 91,823 25 6.4 235 ± 328
Valdivian temperate forests NT0404 248,088 78 24.5 778 ± 2348
Cerrado NT0704 1,916,882 60 1.4 452 ± 1000
Central Andean dry puna NT1001 307,377 14 13.3 2915 ± 3885
Cordillera Central paramo NT1004 12,173 1 0.4 45 ± 0
Chilean matorral NT1201 148,509 11 0.6 79 ± 132
Esmeraldes/Chocó mangroves NT1409 6,518 2 20.1 657 ± 203
PALEARTIC REGION
Hengduan Mountains subalpine conifer forests PA0509 99,421 13 3.8 292 ± 359
Northeastern Himalayan subalpine conifer forests PA0514 46,278 2 23 5316 ± 6084
Nujiang Langcang Gorge alpine conifer and mixed forests PA0516 82,809 7 7.4 881 ± 1141
Eastern Himalayan alpine shrub and meadows PA1003 121,187 9 71.2 9590 ± 14034
Pamir alpine desert and tundra PA1014 117,989 4 14.9 4381 ± 7750
Tian Shan montane steppe and meadow PA1019 280,130 26 8.4 907 ± 1530
Mediterranean acacia-argania dry woodlands and succulent thickets PA1212 100,082 17 0.7 43 ± 51
PA, protected areas.
Ecoregion Ecoregion code
Surface of
ecoregion (km2)
No.
of PAs
%
protected
Size of PAs
(mean ± SD)
Table 2 Continued
forward a coherent strategy towards fulfilling the CBD 10% target,
which requires that CBD members persuade donors of the need
of working together, and a coordinated allocation of funding.
Actually, fulfilling the CBD target for the 33 underrepresented
ecoregions identified as conservation priorities by the three
strategies analysed only requires protecting another 2088 km2 of
land surface, suggesting it might be relatively inexpensive to meet
it. Yet, being highly regarded by the three templates it seems
reasonable to assume that for these and the other consensus
ecoregions, conservation targets should probably be much more
ambitious. In any case, being regions identified as priority by
three global conservation strategies, it is also likely that they
are already receiving a disproportionate share of the global
spending in conservation (Halpern et al., 2006).
There is growing evidence that the total area that can be
effectively conserved for a fixed annual spend increases with its
wilderness and decreases with population density and GNP (e.g.
Balmford et al., 2003). This highlights the need to derive more
funding into conservation in developing countries in Asia,
Africa, Northern Eurasia, Middle East, and Latin America, where
not only current conservation spend is lower, but also unmet
conservation needs are greatest (James et al., 1999, 2001;
Balmford et al., 2003). According to Wilson et al. (2006), in a
scenario with uncertainty regarding the ability to invest in a
region for the whole period needed to meet established targets,
maximizing short-term gains is likely to provide the greatest
rewards. Thus, for expanding the world’s network of protected
areas, increasing the spending in underrepresented ecoregions
in developing countries in Asia, Africa, Northern Eurasia,
Middle East, and Latin America might be a good investment, as
it would maximize the total land surface actually protected. Yet,
with 90% of the global spending on protected areas currently
spent in developed countries (James et al., 1999, 2001), it seems
that for the CBD 10% target to be met there is a need for
substantial north–south transfer of resources (e.g. Balmford
et al., 2003).
Actually, this tendency of people to care most about what is
close to them (Hunter & Hutchinson, 1994) is probably one of
the reasons why reserve networks in developing regions, where
local funding for conservation action is more limited, are often
underdeveloped. Of course, across the globe land value and
conflicts with other activities and land uses have played a chief
role in limiting the establishment of representative networks of
protected areas (Pressey, 1994; Margules & Pressey, 2000), with
human density and GNP being fair estimators of land value and
conflicts (Balmford et al., 2003; Luck et al., 2004).
In any case, ecoregions are very large regions that contain land
with a wide range of conservation value. Without careful
planning the CBD target can be met by incorporating to the
network of reserves areas of scarce conservation value. For
conservation action to be effective there is a need to translate
prioritization exercises at the global scale into actual conservation
implementation at the local level. The WWF has developed a set
of guidelines to proceed from the ecoregional to the local level
(e.g. Loucks et al., 2004), but the most remarkable example of the
application of the general approach of systematic conservation
planning (Margules & Pressey, 2000) for the implementation of a
conservation strategy within a priority region is the experience
currently underway in the Cape Floristic Region (Balmford,
2003; Cowling & Pressey, 2003; Cowling et al., 2003). A reasonable
strategy to achieve the CBD 10% target might thus involve a first
stage in which the annual funding aimed at expanding the global
network of reserves in different regions of the world is allocated
using the approach put forward by Wilson et al. (2006), and a
second stage, at the regional level, in which sites to be incorpo-
rated in each regional network are selected following a systematic
conservation planning approach as shown by Cowling & Pressey
(2003) and Cowling et al. (2003). To do this, global-scale analyses
A. Soutullo et al.
© 2007 The Authors612 Diversity and Distributions, 14, 604–613, Journal compilation © 2007 Blackwell Publishing Ltd
as the one we present here should be fine-tuned to incorporate
more detailed locally available data. Conservation planning
at that level plays the key role in maximizing the ancillary gains of
expanding the global network of protected areas in those
ecoregions where the CBD 10% target has not been met yet.
Thus, a sensible approach to plan the expansion of the global
network of protected areas would involve identifying candidate
sites within the 549 ecoregions for which the CBD 10% target is
still not met, that may maximize ancillary gains in terms of other
global conservation objectives. As many ecoregions will be
shared by two or more countries, it is essential that at the regional
level countries’ actions are properly coordinated (Soutullo &
Gudynas, 2006). The CBD secretariat should play a chief role in
coordinating the actions needed to implement such a strategy,
and in fostering agreements to ensure that the global spending
for conservation is wisely allocated.
ACKNOWLEDGEMENTS
Thanks are due to Lucía Bartesaghi for help in improving the
quality of the figures. This paper was partially funded by Terra
Natura Foundation and project PIMS 3173 (Uruguay NPAS –
MVOTMA/DINAMA and UNDP/GEF).
REFERENCES
Balmford, A. (2003) Conservation planning in the real world:
South Africa shows the way. Trends in Ecology & Evolution, 18,
436–438.
Balmford, A., Gaston, K.J., Rodrigues, A.S.L. & James, A. (2000)
Integrating costs of conservation into international priority
setting. Conservation Biology, 14, 597–605.
Balmford. A., Bruner, A., Cooper, P., Costanza, R., Farber, S.,
Green, R.E., Jenkins, M., Jefferiss, P., Jessamy, V., Madden, J.,
Munro, K., Myers, N., Naeem, S., Paavola, J., Rayment, M.,
Rosendo, S., Roughgarden, J., Trumper, K. & Turner, R.K.
(2002) Economic reasons for conserving wild nature. Science,
297, 950–953.
Balmford, A., Gaston, K.J., Blyth, S., James, A. & Kapos, V. (2003)
Global variation in terrestrial conservation costs, conservation
benefits, and unmet conservation needs. Proceedings of the
National Academy of Sciences USA, 100, 1046–1050.
Balmford, A., Bennun, L., ten Brink, B., Cooper, D., Cote, I.M.,
Crane, P., Dobson, A., Dudley, N., Dutton, I., Green, R.E.,
Gregory, R.D., Harrison, J., Kennedy, E.T., Kremen, C.,
Leader-Williams, N., Lovejoy, T.E., Mace, G., May, R.,
Mayaux, P., Morling, P., Phillips, J., Redford, K., Ricketts, T.H.,
Rodriguez, J.P., Sanjayan, M., Schei, P.J., van Jaarsveld, A.S. &
Walther, B.A. (2005) The convention on biological diversity’s
2010 target. Science, 307, 212–213.
Brooks, T.M., Bakarr, M.I., Boucher, T., da Fonseca, G.A.B.,
Hilton-Taylor, C., Hoekstra, J.M., Moritz, T., Olivieri, S.,
Parrish, J., Pressey, R.L., Rodrigues, A.S.L., Sechrest, W.,
Stattersfield, A., Strahm, W. & Stuart, S.N. (2004) Coverage
provided by the global protected-area system: is it enough?
Bioscience, 54, 1081–1091.
Brooks, T.M., Mittermeier, R.A., da Fonseca, G.A.B., Gerlach, J.,
Hoffmann, M., Lamoreux, J.F., Mittermeier, C.G., Pilgrim, J.D.
& Rodrigues, A.S.L. (2006) Global biodiversity conservation
priorities. Science, 313, 58–61.
Burgess, N., D’Amico Hales, J., Underwood, E., Dinerstein, E.,
Olson, D., Itoua, I., Schipper, J., Ricketts, T. & Newman, K.
(2004) Terrestrial ecoregions of Africa and Madagascar: a
continental assessment. Island Press, Washington D.C.
Ceballos, G. & Ehrlich, P.R. (2006) Global mammal distributions,
biodiversity hotspots, and conservation. Proceedings of the
National Academy of Sciences USA, 103, 19374–19379.
Chape, S., Harrison, J., Spalding, M. & Lysenko, I. (2005)
Measuring the extent and effectiveness of protected areas as an
indicator for meeting global biodiversity targets. Philosophical
Transactions of the Royal Society of London Series B, Biological
Sciences, 360, 443–455.
Center for International Earth Science Information Network
(CIESIN) (2006) Last of the wild project (http://www.ciesin.
columbia.edu/wild_areas/, Accessed on 10 August 2006).
Conservation International (2005) Biodiversity hotspots (http://
www.biodiversityhotspots.org/xp/Hotspots, Accessed on 18
October 2005).
Costanza, R., d’Arge, R., de Groot, R., Farber, S., Grasso, M.,
Hannon, B., Limburg, K., Naeem, S., O’Neill, R.V., Paruelo, J.,
Raskin, R.G., Sutton, P. & van den Belt, M. (1997) The value of
the world’s ecosystem services and capital value. Nature, 387,
253–260.
Cowling, R.M., Knight, A.T., Faith, D.P., Ferrier, S., Lombard,
A.T., Driver, A., Rouget, M., Maze, K. & Desmet, P.G. (2004)
Nature conservation requires more than a passion for species.
Conservation Biology, 18, 1674–1676.
Cowling, R.M. & Pressey, R.L. (2003) Introduction to systematic
conservation planning in the Cape Floristic Region. Biological
Conservation, 112, 1–13.
Cowling, R.M., Pressey, R.L., Rouget, M. & Lombard, A.T. (2003)
A conservation plan for a global biodiversity hotspot – the
Cape Floristic Region, South Africa. Biological Conservation,
112, 191–216.
Dinerstein, E., Olson, D.M., Graham, D.J., Webster, A.L.,
Primm, S.A., Bookbinder, M.P. & Ledec, G. (1995) Conservation
assessment of the terrestrial ecoregions of Latin America and the
Caribbean. World Bank and WWF, Washington D.C.
Halpern, B.S., Pyke, C.R., Fox, H.E., Haney, C., Schlaepfer, M.A. &
Zaradic, P. (2006) Gaps and mismatches between global conserva-
tion priorities and spending. Conservation Biology, 20, 56–64.
Hoekstra, J.M., Boucher, T.M., Ricketts, T.H. & Roberts, C.
(2005) Confronting a biome crisis: global disparities of habitat
loss and protection. Ecology Letters, 8, 23–29.
Hunter, J.M.L. & Hutchinson, A. (1994) The virtues and
shortcomings of parochialism: conserving species that are
locally rare but globally common. Conservation Biology, 8,
1163–1165.
IUCN (1993) Parks for life. Report of the IVth world congress on
national parks and protected areas. IUCN, Gland, Switzerland.
James, A.N., Gaston, K.J. & Balmford, A. (1999) Balancing the
Earth’s accounts. Nature, 401, 323–324.
Political and scientific targets for global conservation
© 2007 The AuthorsDiversity and Distributions, 14, 604–613, Journal compilation © 2007 Blackwell Publishing Ltd 613
James, A.N., Gaston, K.J. & Balmford, A. (2001) Can we afford to
conserve biodiversity? Bioscience, 51, 43–52.
Loucks, C., Springer, J., Palminteri, S., Morrison, J. & Strand, H.
(2004) From vision to the ground: a guide to implementing ecoregion
conservation in priority areas. WWF, Washington D.C.
Luck, G.W., Ricketts, T.H., Daily, G.C. & Imhoff, M. (2004)
Alleviating spatial conflict between people and biodiversity.
Proceedings of the National Academy of Sciences USA, 101, 182–
186.
Maddock, A. & Du Plessis, M.A. (1999) Can species data only be
appropriately used to conserve biodiversity? Biodiversity and
Conservation, 8, 603–615.
Margules, C.R. & Pressey, R.L. (2000) Systematic conservation
planning. Nature, 405, 243–253.
Mittermeier, R.A., Robles-Gil, P., Hoffman, M., Pilgrim, J.,
Brooks, T.M., Mittermeier, C.G., Lamoreux, J. & da Fonseca,
G.A.B. (2004) Hotspots revisited: Earth’s biologically richest and
most endangered terrestrial ecoregions. CEMEX, México.
Myers, N., Mittermeier, R.A., Mittermeier, C.G., da Fonseca,
G.A.B. & Kent, J. (2000) Biodiversity hotspots for conservation
priorities. Nature, 403, 853–858.
Noss, R.F. (1990) Indicators for monitoring biodiversity: a
hierarchical approach. Conservation Biology, 4, 355–364.
Olson, D.M. & Dinerstein, E. (1998) The Global 200: a representa-
tion approach to conserving the Earth’s most biologically
valuable ecoregions. Conservation Biology, 12, 502–515.
Olson, D.M., Dinerstein, E., Wikramanayake, E.D., Burgess, N.D.,
Powell, G.V.N., Underwood, E.C., D’amico, J.A., Itoua, I.,
Strand, H.E., Morrison, J.C., Loucks, C.J., Allnutt, T.F.,
Ricketts, T.H., Kura, Y., Lamoreux, J.F., Wettengel, W.W.,
Hedao, P. & Kassem, K.R. (2001) Terrestrial ecoregions of the
world: a new map of life on Earth. Bioscience, 51, 933–938.
Orme, C.D.L., Davies, R.G., Burgess, M., Eigenbrod, F., Pickup, N.,
Olson, V.A., Webster, A.J., Ding, T.S., Rasmussen, P.C.,
Ridgely, R.S., Stattersfield, A.J., Bennett, P.M., Blackburn,
T.M., Gaston, K.J. & Owens, I.P.F. (2005) Global hotspots of
species richness are not congruent with endemism or threat.
Nature, 436, 1016–1019.
Pressey, R.L. (1994) Ad hoc reservations: forward or backward
steps in developing representative reserve systems? Conservation
Biology, 8, 662–668.
Ricketts, T.H., Dinerstein, E., Olson, D., Loucks, A., Eichbaum, W.,
DellaSala, D., Kavanagh, K., Hedao, P., Hurley, P., Carney,
K.M., Abell, R. & Walters, S. (1999) Terrestrial ecoregions of
North America: a conservation assessment. Island Press,
Washington, D.C.
Rodrigues, A.S.L., Akcakaya, H.R., Andelman, S.J., Bakarr, M.I.,
Boitani, L., Brooks, T.M., Chanson, J.S., Fishpool, L.D.C., da
Fonseca, G.A.B., Gaston, K.J., Hoffmann, M., Marquet, P.A.,
Pilgrim, J.D., Pressey, R.L., Schipper, J., Sechrest, W., Stuart,
S.N., Underhill, L.G., Waller, R.W., Watts, M.E.J. & Yan, X.
(2004a) Global gap analysis: priority regions for expanding the
global protected-area network. Bioscience, 54, 1092–1100.
Rodrigues, A.S.L., Andelman, S.J., Bakarr, M.I., Boitani, L.,
Brooks, T.M., Cowling, R.M., Fishpool, L.D.C., da Fonseca,
G.A.B., Gaston, K.J., Hoffmann, M., Long, J.S., Marquet, P.A.,
Pilgrim, J.D., Pressey, R.L., Schipper, J., Sechrest, W., Stuart,
S.N., Underhill, L.G., Waller, R.W., Watts, M.E.J. & Yan, X.
(2004b) Effectiveness of the global protected area network in
representing species diversity. Nature, 428, 640–643.
Sanderson, E.W., Jaiteh, M., Levy, M.A., Redford, K.H.,
Wannebo, A.V. & Woolmer, G. (2002) The human footprint
and the last of the wild. Bioscience, 52, 891–904.
Soulé, M.E. & Sanjayan, M.A. (1998) Conservation targets: do
they help? Science, 279, 2060–2061.
Soutullo, A. & Gudynas, E. (2006) How effective is the
MERCOSUR’s network of protected areas in representing
South America’s ecoregions? Oryx, 40, 112–116.
Tear, T.H., Kareiva, P., Angermeier, P.L., Comer, P., Czech, B.,
Kautz, R., Landon, L., Mehlman, D., Murphy, K., Ruckelshaus,
M., Scott, J.M. & Wilhere, G. (2005) How much is enough?
The recurrent problem of setting measurable objectives in
conservation. Bioscience, 55, 835–849.
WDPA Consortium (2005) World database on protected areas
2005. IUCN, Gland, Switzerland, and UNEP-WCMC,
Cambridge, UK.
Wikramanayake, E.D., Dinnerstein, E., Loucks, C.J., Olson, D.M.,
Morrison, J., Lamoreux, J., McKnight, M. & Hedao, P. (2002)
Terrestrial ecoregions of the indo-pacific: a conservation
assessment. Island Press, Washington D.C.
Wilson, K.A., McBride, M.F., Bode, M. & Possingham, H.P. (2006)
Prioritizing global conservation efforts. Nature, 440, 337–340.
WWF (2005) Terrestrial ecoregions of the world (http://
www.worldwildlife.org/science/data.cfm, Accessed on 18
October 2005).
Editor: Mathieu Rouget
SUPPLEMENTARY MATERIAL
The following supplementary material is available for this article:
Table S1 Priority ecoregions for the expansion of the global net-
work of protected areas located within priority regions for the
major global biodiversity conservation prioritization templates.
Table S2 Priority ecoregions for the expansion of the global net-
work of protected areas not considered a priority by the major
global biodiversity conservation prioritization templates.
Table S3 Ecoregions for which the CBD 10% target has been
already met.
This material is available as part of the online article from:
http://www.blackwell-synergy.com/doi/abs/10.1111/j.1472-
4642.2007.00445.x
(This link will take you to the article abstract).
Please note: Blackwell Publishing are not responsible for the con-
tent or functionality of any supplementary materials supplied by
the authors. Any queries (other than missing material) should be
directed to the corresponding author for the article.