Sustainable campsite management in protected areas - USDA ...
10
Journal for Nature Conservation 37 (2017) 73–82 Contents lists available at ScienceDirect Journal for Nature Conservation j o ur nal homepage: www.elsevier.de/jnc Sustainable campsite management in protected areas: A study of long-term ecological changes on campsites in the boundary waters canoe area wilderness, Minnesota, USA Holly Eagleston a,∗ , Jeffrey L. Marion b a Virginia Tech, 310 W. Campus Dr., Blacksburg, VA 24061, United States b USDI, U.S. Geological Survey, Virginia Tech, 310 W. Campus Dr., Blacksburg, VA 24061, United States a r t i c l e i n f o Article history: Received 27 September 2016 Received in revised form 23 March 2017 Accepted 24 March 2017 Keywords: Recreation ecology Sustainable recreation management Campsite management Longitudinal ecological change a b s t r a c t Managers of protected natural areas seek to protect their natural conditions while providing opportuni- ties for recreational visitation. Camping is an essential element of backcountry and wilderness recreation for a variety of protected natural areas in the U.S. and internationally. Furthermore, overnight visitors to protected areas spend a substantial portion of their time on campsites so their behaviors determine the nature and extent of resource impacts, and the quality of their recreational experiences can be affected by campsite conditions. The U.S. Forest Service manages nearly 2000 designated campsites in the Boundary Waters Canoe Area Wilderness. This research assessed resource conditions on 81 wilderness campsites and paired undisturbed controls in 1982 and 2014 to quantify long-term ecological changes. A compre- hensive array of physical, vegetative, and soil indicators were measured to identify long-term trends over 32 years of continuous campsite use. Our findings reveal substantial changes in area of vegetation cover, exposed soil, and soil erosion on campsites. Although mean campsite size is unchanged, the proportion of campsite area in the “core” has decreased, shifting some use and impact into peripheral “satellite” tenting areas just beyond campsite borders. The ecology of campsites has been significantly altered by a large reduction in number and cover of campsite trees. The number of campsite trees decreased by 44% from 1982 to 2014. Visitors are cutting both on- and off-site trees for firewood, and tree seedlings are rarely able to germinate and survive due to visitor activity. These findings reveal that older campsites are not stable. Long-term camping impacts that are eco- logically, managerially, and experientially meaningful are occurring; these impacts could be minimized through more sustainable management practices. These include selecting more resistant sites, such as those with resistant rocky shorelines, and sloping terrain that constrains campsite expansion. Construc- tion and maintenance of tenting sites can attract and spatially concentrate camping impact. Actions to halt tree cutting are also critical. Heavy long-term visitation in protected natural areas requires more sustainable and intensive visitor impact management actions. © 2017 Elsevier GmbH. All rights reserved. 1. Introduction Most protected areas internationally are managed to pre- serve natural conditions, biodiversity, and natural processes, often excluding many forms of human development while accommo- dating recreation visitation (Leverington, Costa, Pavese, Lisle, & Hockings, 2010). For example, the U.S. National Wilderness Preser- vation System (P.L. 88–577) charges agencies to administer these ∗ Corresponding author. E-mail addresses: [email protected] (H. Eagleston), [email protected] (J.L. Marion). protected areas: “for the use and enjoyment of the American peo- ple in such manner as will leave them unimpaired for future use and enjoyment as wilderness.” In light of increasing visitation, managers must discover and implement improved visitor use man- agement practices that minimize resource degradation. For this to occur, protected natural area managers need to better under- stand what visitation-related ecological changes occur over time and what factors most strongly influence the extent of change. Such knowledge can then be applied to inform the selection of man- agement actions able to sustain intensive visitation with minimal degradation. http://dx.doi.org/10.1016/j.jnc.2017.03.004 1617-1381/© 2017 Elsevier GmbH. All rights reserved.
-
Upload
khangminh22 -
Category
Documents
-
view
0 -
download
0
Transcript of Sustainable campsite management in protected areas - USDA ...

Slc
Ha
b
a
ARRA
KRSCL
1
sedHv
h1
Journal for Nature Conservation 37 (2017) 73–82
Contents lists available at ScienceDirect
Journal for Nature Conservation
j o ur nal homepage: www.elsev ier .de / jnc
ustainable campsite management in protected areas: A study ofong-term ecological changes on campsites in the boundary watersanoe area wilderness, Minnesota, USA
olly Eaglestona,∗, Jeffrey L. Marionb
Virginia Tech, 310 W. Campus Dr., Blacksburg, VA 24061, United StatesUSDI, U.S. Geological Survey, Virginia Tech, 310 W. Campus Dr., Blacksburg, VA 24061, United States
r t i c l e i n f o
rticle history:eceived 27 September 2016eceived in revised form 23 March 2017ccepted 24 March 2017
eywords:ecreation ecologyustainable recreation managementampsite managementongitudinal ecological change
a b s t r a c t
Managers of protected natural areas seek to protect their natural conditions while providing opportuni-ties for recreational visitation. Camping is an essential element of backcountry and wilderness recreationfor a variety of protected natural areas in the U.S. and internationally. Furthermore, overnight visitors toprotected areas spend a substantial portion of their time on campsites so their behaviors determine thenature and extent of resource impacts, and the quality of their recreational experiences can be affected bycampsite conditions. The U.S. Forest Service manages nearly 2000 designated campsites in the BoundaryWaters Canoe Area Wilderness. This research assessed resource conditions on 81 wilderness campsitesand paired undisturbed controls in 1982 and 2014 to quantify long-term ecological changes. A compre-hensive array of physical, vegetative, and soil indicators were measured to identify long-term trends over32 years of continuous campsite use.
Our findings reveal substantial changes in area of vegetation cover, exposed soil, and soil erosion oncampsites. Although mean campsite size is unchanged, the proportion of campsite area in the “core” hasdecreased, shifting some use and impact into peripheral “satellite” tenting areas just beyond campsiteborders. The ecology of campsites has been significantly altered by a large reduction in number and coverof campsite trees. The number of campsite trees decreased by 44% from 1982 to 2014. Visitors are cuttingboth on- and off-site trees for firewood, and tree seedlings are rarely able to germinate and survive dueto visitor activity.
These findings reveal that older campsites are not stable. Long-term camping impacts that are eco-logically, managerially, and experientially meaningful are occurring; these impacts could be minimized
through more sustainable management practices. These include selecting more resistant sites, such asthose with resistant rocky shorelines, and sloping terrain that constrains campsite expansion. Construc-tion and maintenance of tenting sites can attract and spatially concentrate camping impact. Actions tohalt tree cutting are also critical. Heavy long-term visitation in protected natural areas requires moresustainable and intensive visitor impact management actions.© 2017 Elsevier GmbH. All rights reserved.
. Introduction
Most protected areas internationally are managed to pre-erve natural conditions, biodiversity, and natural processes, oftenxcluding many forms of human development while accommo-
ating recreation visitation (Leverington, Costa, Pavese, Lisle, &ockings, 2010). For example, the U.S. National Wilderness Preser-ation System (P.L. 88–577) charges agencies to administer these∗ Corresponding author.E-mail addresses: [email protected] (H. Eagleston), [email protected] (J.L. Marion).
ttp://dx.doi.org/10.1016/j.jnc.2017.03.004617-1381/© 2017 Elsevier GmbH. All rights reserved.
protected areas: “for the use and enjoyment of the American peo-ple in such manner as will leave them unimpaired for future useand enjoyment as wilderness.” In light of increasing visitation,managers must discover and implement improved visitor use man-agement practices that minimize resource degradation. For thisto occur, protected natural area managers need to better under-stand what visitation-related ecological changes occur over timeand what factors most strongly influence the extent of change. Such
knowledge can then be applied to inform the selection of man-agement actions able to sustain intensive visitation with minimaldegradation.
7 or Nat
tEh&HarNaov2ssctS
dssoao2taDocsgqeasf
dn(oc(1
1
tnii1otMasgcis(y
4 H. Eagleston, J.L. Marion / Journal f
Environmental degradation from visitor activities can con-ribute to a range of resource impacts that vary by type and severity.ven low levels of trampling disturbance can reduce vegetationeight, cover, and biomass (Cole, 1995a; Cole, 1995b; Growcock
Pickering, 2011; Marion, Leung, Eagleston, & Burroughs, 2016).igher levels of trampling lead to more complete vegetation lossnd compositional change as plants are lost or replaced by moreesistant species (Cole, 1995b; Marion & Cole, 1996; Smith &ewsome, 2002). Concentrated traffic also pulverizes soil leaf litternd humus layers, which are either lost through erosional processesr intermixed with underlying mineral soils. Exposed soils are moreulnerable to displacement, compaction, and erosion (Marion et al.,016; Monti & Mackintosh, 1979). Compaction reduces soil porepace and water/air infiltration, increasing water runoff and ero-ion rates. Additional impacts specific to camping activities includeampfire-related impacts such as tree damage, felling, and deple-ion of woody material (Hall & Farrell, 2001; Reid & Marion, 2005;mith & Newsome, 2002).
This study examines long-term resource impacts on agency-esignated campsites in a U.S. wilderness area. Two managementtrategies applied to minimize camping impacts include disper-al, where campers select a pristine site with durable substratesr vegetation, or containment – where campers concentrate theirctivity on a limited number of small, resistant, well-establishedr designated campsites (Hammitt, Cole, & Monz, 2014; Marion,016). Research and management experience have found the con-ainment strategy to be most effective in moderate to high usereas (Leung & Marion, 1999; Marion, 2016; Reid & Marion, 2004).ue to increasing visitation, managers are funding studies like thisne to investigate long-term impacts and improve guidance onampsite sustainability: which we define as the ability of camp-ites to accommodate intensive long-term use while remaining inood condition, with minimal maintenance or restoration. Researchuestions include: 1) How do campsite conditions change over sev-ral decades of continual use, 2) What use-related, environmental,nd managerial factors most strongly influence long-term camp-ite conditions, and 3) What are the implications of these findingsor improving the sustainability of campsite management?
In this study, we seek to answer these questions by analyzingata collected in 1982 and 2014 on a large sample of desig-ated campsites in the Boundary Waters Canoe Area WildernessBWCAW) in northern Minnesota. Specifically, we replicate an arrayf biophysical measurements on 81 BWCAW campsites and pairedontrol sites to document and analyze 32 years of ecological changeMarion, 1984; Marion and Merriam, 1985a; Marion and Merriam,985b).
.1. Longitudinal campsite studies
The BWCAW has served as an important study area for some ofhe earliest recreation ecology research, particularly for longitudi-al studies. A study examining the effect of differing use levels on
mpacts found that even light use (0–30 days use/season) resultedn substantial loss of ground cover (Frissell & Duncan, 1965). A969 study by McCool, Merriam and Cushwa found that campsitesn islands and along main canoe routes showed more substan-ial impacts, which they attributed primarily to higher use levels.
erriam et al. (1973) also reported that campsites are most highlyffected by initial site use. Once an area is selected as a camp-ite, trampling quickly results in loss of organic and vegetativeround cover, while subsequent traffic results in diminishing perapita impact (Merriam & Smith, 1974). However, some impacts do
ncrease over time and with increasing use levels, notably exposedoil. Some of this early work was continued by Merriam & Peterson1983), who examined changes on eight BWCAW campsites over 15ears, finding that higher use sites expanded in size over time andure Conservation 37 (2017) 73–82
that visitors were continuing to cut trees for firewood (Merriam &Peterson, 1983).
Elsewhere, Cole and his co-investigators have reported resultsfrom several long-term studies employing rapid monitoring-levelratings (Cole 2013; Cole & Parsons 2013; Cole et al., 2008). Moni-toring of Grand Canyon National Park backcountry campsites over20 years found campsite sizes to be stable (Cole, Foti, & Brown,2008). While high-use sites were more degraded than low-use sites,within each use level resource impacts were relatively consistentover time.
We note that none of these early BWCAW and later long-termmonitoring studies included detailed ecological measurements ofboth campsite and paired “control” site conditions replicated overtime. There are several important limitations to these studies. First,plant communities vary with respect to plant cover and otherattributes. Analyses designed to examine sustainability are mostvalid when they compare “absolute difference” values, computedby subtracting campsite indicator values from values assessed onadjacent environmentally paired undisturbed “control” areas. Sec-ond, these early studies and nearly all monitoring programs do notcount tree damage and felling indicators both onsite and offsiteand report them as density (#/ha) measures. Longitudinal compar-isons for these indicators become less valid over time as campsitesizes change, and as campsite trees are cut down the number ofdamaged and felled trees reported in subsequent monitoring cyclesmust inevitably decline, indicating improving conditions when theopposite is true. Third, monitoring studies generally employ rapidlyassessed ratings rather than accurate measurements. Ratings area coarse approximation of actual change, particularly when largepercentages of sites fall within a single rating category, or whensubstantial degradation occurs to sites in the “worst” category,which is open-ended (e.g. campsite size > 300m2).
We found no other studies that avoided these limitations, whichwe’ve addressed in this research. In 2014 we returned to reassessecological changes on BWCAW campsites and paired control sitesfirst measured in 1982 (Marion, 1984; Marion & Merriam, 1985a;Marion & Merriam, 1985b). It provides a comprehensive datasetwith longitudinal biophysical measurements and a larger sam-ple size needed to improve understanding of long-term ecologicalchanges and their implications for sustainable campsite manage-ment.
1.2. Campsite sustainability
A number of factors identified in the 1982 study relate tocampsite sustainability and are reviewed here. While vegetativeground cover declined from an average of 94% offsite to 36%onsite, the amount and durability of vegetation cover increasedsignificantly with increasing campsite sunlight exposure (Marion& Merriam, 1985a). Shade-tolerant plants are particularly suscep-tible to trampling while sun-loving plants, primarily grasses andsedges (graminoids), are more trampling-resistant. For example,mean dense vegetation ground cover was only 4% on campsiteswith 75–100% tree cover, but increased to 52% on campsites withless than 25% tree cover (Marion & Merriam, 1985a). Over time,trampling alters campsite plant composition as fragile plants arereplaced by trampling-resistant, often non-native, species (Marion& Merriam, 1985a). Regression modeling found that soil com-paction can be minimized by selecting sites in areas with thickorganic soil horizons, which reduce compactive forces and intermixwith underlying mineral soils (Marion & Merriam, 1985b).
A BWCAW campsite restoration, rehabilitation, and mainte-
nance program seeks to enhance the sustainability of campsiteskept open to use (Marion & Sober, 1987). Actions that enhancecampsite sustainability include a designated camping policy thatrestricts camping to a limited number of durable sites, visitor entry
or Nat
psaistpiNti
1
ccahap
4iDbmfiantTt
Fc
H. Eagleston, J.L. Marion / Journal f
oint quotas to match visitor numbers to site numbers, groupize restrictions to limit campsite expansion, and site managementctions like tent site creation and canoe landing closure and rehabil-tation to concentrate visitor activity, minimize soil loss, and shrinkite size. Cole (1992) noted that the spatial concentration of visi-or activity on campsites enhances sustainability by increasing theroportion of time spent in the central part of the campsite, reduc-
ng trampling to peripheral areas. Campsite research at Isle Royaleational Park found that constructing side-hill campsites in sloping
errain was highly effective in limiting the areal extent of campingmpact (Marion & Farrell, 2002).
.3. Study area
The U.S. Forest Service (USFS) restricts the majority of BWCAWamping to designated campsites, so maintaining their naturalonditions and limiting resource impacts over time are core man-gement objectives. The management of campsites able to sustainigh use while keeping associated resource impacts within accept-ble limits is extremely challenging given the area’s strong resourcerotection mandate and high visitation.
The Boundary Waters Canoe Area Wilderness (BWCAW) is a41,107-ha wilderness area in northeastern Minnesota, admin-
stered by the U.S. Forest Service, Superior National Forest.esignated as wilderness by the 1964 Wilderness Act, it has longeen one of the most visited wilderness areas, with approxi-ately 150,000 overnight and day-use visitors annually (averaged
rom 2009 to 2014 data), unchanged from 1982. With over 1000nterconnected lakes and streams, the area’s primary recreationalctivities include canoeing and fishing. Visitors must obtain wilder-
ess permits from May thru September and group sizes are limitedo 9 (10 in 1982). Most of the area is designated as non-motorized.he Forest Service currently provides 1957 designated campsites inhe area, most of which have a shoreline boat landing, primitive pitig. 1. Layout of a typical campsite (not to scale) with a shoreline canoe landing area, corontrol is shown next to the campsite in an adjacent undisturbed area.
ure Conservation 37 (2017) 73–82 75
toilet, and steel fire grate. A travel zone-based permitting systemmatches the distribution of visitors and campsites.
The soils in the area are derived from glacial deposits, coveringa thin mantle of glacial-till and lacustrine sediments (Prettyman,1987). The area receives between 66 and 78 cm of precipitationper year, with 40% falling as snow. The average summer and wintertemperatures are 20 ◦C and −11 ◦C, respectively. The area’s lakes areinterspersed with northern boreal hardwood-conifer forests com-prised of pines, fir, spruce, cedar, and hardwoods (Moyle & Moyle,1977).
2. Methods
This study replicates Marion’s 1982 doctoral study of 96 wilder-ness campsites and controls (Marion, 1984). A stratified randomsample was employed with sites equally distributed among threeuse levels and five ecological land types. An effort was made torelocate and measure the same sites in the 2014 study. Sites wereomitted if found to be severely affected by wildfire or wind-throw,or had been closed. Eighty-one sites were remeasured in 2014 usingthe 1982 protocols and several new indicators. For each campsite,a circular control plot of 50 m2 (size determined by a species-areacurve, nested-plot technique) was also assessed in an adjacentundisturbed area with similar vegetation (Fig. 1). Control plots wereenvironmentally similar to their paired campsites (e.g., same eco-logical land type, substrates, slope, aspect, and distance to water).
Campsites typically consisted of a core area around a firegrate placed by USFS, a tent pad, and a trail to the latrine, somealso included user-created tent pads away from the main site(Fig. 1). Campsite size was measured within boundaries definedby pronounced changes in ground vegetation height, composition,
or cover, excluding any undisturbed “islands” of vegetation andincluding adjacent off-site visitor-created “satellite” tenting areas.The number and area of satellite sites and shoreline boat landingswere recorded. Campsite soil loss was estimated in 2014 by mea-e area with a steel fire grate, adjacent tent pad and a trail to the latrine. The 50 m2

7 or Nat
sllcoaa
actemicSewsht
wprcSaccf
cawu(in2Urt
u
TC
TE
6 H. Eagleston, J.L. Marion / Journal f
uring the average depth of soil loss on the core site, access trail, andanding area separately and multiplying by the size of each area. Soiloss was evaluated by examining soil loss around tree roots, withomparisons to reference trees of the same species in undisturbedffsite areas. We also examined soil levels around embedded rocksnd bedrock depicted in the 1982 photos and at shorelines we wereble to extrapolate soil heights from adjacent undisturbed areas.
Six categories of mutually exclusive ground cover were assesseds percentages of the campsite or control area: 1) dense vegetationover – areas with 51–100 non-woody plant cover less than 0.5 mall, 2) sparse vegetation cover – areas with 5–50% plant cover, 3)xposed rock, 4) exposed root area – areas where tree roots areoderately to severely exposed, 5) exposed soil – areas where soil
s largely exposed with <5% litter or vegetation cover, and 6) litterover – areas covered by organic litter and less than 5% plant cover.parse and dense vegetation cover is sometimes combined as “veg-tation cover.” Areal measures of vegetation loss and exposed soilere calculated by multiplying percent cover estimates by camp-
ite size. Separate cover estimates were also made for trees, shrubs,erbs, mosses and lichen, and for each plant species relative to theotal campsite or control area.
For campsites, the number of living trees, seedlings, and stumpsere counted and divided by campsite size to obtain standardizeder hectare values. At each site and control, a 4-class ordinal scaleating was used to determine site expansion potential based ononstricting topography and vegetation surrounding the campsite.ites with high expansion potential are surrounded by flat terrainnd sparse vegetation, while steeper terrain and dense vegetationontribute to a low expansion potential rating. To evaluate the effi-acy of this expansion rating we analyzed change in campsite sizerom 1982 to 2014.
Campsite use estimates were acquired from a U.S. Forest Serviceomputerized travel model and knowledgeable wilderness man-gers in 1982 and 2014 (Marion and Merriam, 1985a). Campsitesere divided into the same discontinuous level of use groupingssed in the 1982 study: 1) low use (<12 nights/yr), 2) moderate use20–40 nights/yr), and 3) high use (>60 nights/yr). Campsites withntermediate use estimates (e.g., 12–19, or 41–60 nights/yr) wereot assessed in 1982, and were not used in use level analyses in014. Other characteristics included campsite age (retrieved fromSFS records), site maintenance (e.g., tent pad improvement or
uination, shoreline rock work), and site closure. Campsite photos
aken in 1982 were replicated in 2014.The 1982 and 2014 data were analyzed with paired t-testssing SAS JMP software; data were normally distributed fol-
able 1hanges in the mean sizes of campsite core and satellite areas from 1982 to 2014.
Campsite Size Mean 1982 (m2) Mean 2014 (m2) Mean Diff. 1
Core (n = 74) 191 175 −16 (75)b
Satellite (n = 75) 10 28 18 (27)
Total (n = 75) 201 203 2 (81)
a Paired t-test, N distribution.b Standard Deviations.
able 2ffectiveness of campsite expansion ratings applied to campsites in 1982 evaluated by m
Campsite Size Campsite Expansion Potential
High (n = 8) Moderate (n = 42) Poor
Core (m2) −14 −26 −30Satellite (m2) 68 36 37
Total (m2) 16 0.2 2
a Kruskal-Wallis rank sum test.
ure Conservation 37 (2017) 73–82
lowing transformations and removal of outliers. Campsite andcontrol measurements from both years were analyzed separatelyto evaluate temporal changes. Absolute difference values were alsocomputed by subtracting control values from their paired camp-sites, with paired t-tests to examine camping impacts to vegetationand soil attributes. The Kruskal-Wallis rank sum test was applied toinvestigate the influence of level of use and site expansion rating;this non-parametric test was used due to variable or small samplesizes, or violation of the normality assumption.
3. Results
3.1. Change in campsite conditions
From 1982–2014 the aggregate area of camping disturbancedeclined by 6.8%, though this change was not statistically signif-icant (p-value = 0.150). However, campsite core areas significantlydiminished in size an average of 31 m2, while the areas of adja-cent off-site satellite tenting areas increased significantly by 18 m2
(Table 1).The USFS has sought to discourage use of the satellite tenting
areas by placing woody materials on them and providing 3–5 goodtent pads within the core campsite area (though low staffing limitsthis work). The mean number of tent pads per site in 1982 was 4.0,with an average of 0.56 satellite sites. In 2014, the mean numberof tent pads was 4.4 with 1.4 satellite sites per campsite. While thenumber of tent pads increased by 10% (ns, p > 0.05), the number ofsatellite sites more than doubled (p < 0.001).
In the original selection of designated campsites, USFS managersoften adopted existing visitor-created sites. Over time staff haveclosed campsites on small islands and in areas that had insufficientsoil to support pit toilets, replacing them when possible with lesserodible sites that had bedrock shorelines. A recommendation fromMarion (1984) was to consider shifting use to campsites whoseexpansion would be constrained by sloping topography, rockiness,wet soils, or dense woody vegetation. A campsite expansion poten-tial rating based on these attributes was applied in 1982 (Table 2).A very poor rating reflects a campsite that should resist expansiondue to these attributes while campsites with a high rating couldbe more easily expanded. We evaluated the predictive efficacy ofthis rating by subtracting 1982 from 2014 areal measures for the
core, satellite, and total campsite areas for each rating. While thechanges in these areal measures across ratings do indicate predic-tive success, variability and small sample sizes for the high and verypoor ratings prevent statistically significant differences (p > 0.05).982–2014 (m2) P-valuea Aggregate Measures (m2)
1982 2014 Diff.
0.006 17,351 12,798 −2274<0.001 802 2149 13350.150 16,569 15,447 −1121
edian changes in campsite size (2014–1982 values) over 32 years.
H-valuea P-value
(n = 24) Very Poor (n = 7)
−69 3.24 0.35623 1.0 0.149−60 1.9 0.122

H. Eagleston, J.L. Marion / Journal for Nature Conservation 37 (2017) 73–82 77
Fig. 2. Photo comparison of tree loss and groundcover changes over 32 years on a representative campsite.
Table 3Changes in tree, shrub, herb/grass, and moss cover on campsites and controls from 1982 to 2014 (N = 76).
Indicator Change: 1982–2014 Change: 2014b
Camp−Camp Control−Control Camp−Control
Mean P-value Mean P-value Mean P-value
Trees (%) −10.5 (34.7)a 0.001 6.3 (27.7) 0.044 −28.7 (30.1) <0.001Shrubs (%) −3.9 (9.7) <0.001 0.8 (47.1) 0.876 −42.1 (34.8) <0.001Herb/Grass (%) 10.3 (39.4) 0.004 −42.8 (36.1) <0.001 14.5 (35.7) <0.001Moss (%) 0.2 (7.4) 0.859 11.6 (
a Standard Deviation.b Absolute Difference values, 2014 data.
Table 4Change in the number of trees, tree seedlings, and stumps per hectare on campsitesfrom 1982 to 2014.
Indicator Change: 1982–2014
Camp−Camp
Mean P-value
Trees/ha (n = 78) −64.6 (303.5)a 0.031Seedlings/ha (n = 75) −50.9 (152.8) 0.002
3
sasitnisl(aa
ditb
Stumps/ha (n = 79) −1.7 (190.6) 0.467
a Standard Deviation.
.2. Change in forest structure
Forest structure both on and off BWCAW campsites has changedubstantially in the three decades since the 1982 study. The forestsre more mature in 2014, with greater tree canopy cover and den-ity, resulting in less herb and grass cover and greater moss covern control areas (Table 3). In contrast, the campsites lost trees andree cover and gained ground vegetation over 32 years. All compo-ents of the forest structure are significantly altered on campsites
n 2014 based on paired comparisons to control values. The mostubstantial change is shrub cover, reduced 42.1% on campsites, fol-owed by reductions in tree cover (28.7%) and moss cover (19.5%)Table 3). Due to the high density of woody vegetation in controlreas and greater sunlight on campsites, the amount of herbaceousnd grass cover on campsites is 14.5% greater than on controls.
The number and density of trees on campsites has significantly
eclined over the 32-year study period. On the 81 campsites stud-ed, an average of 64.6 trees per hectare have been lost from 1982o 2014 (Table 4). We attribute this substantial tree loss to a com-ination of factors: felling by visitors for firewood, mortality from
11.8) <0.001 −19.5 (26.5) <0.001
tree damage, root exposure, and natural causes (drought, insects,disease, fire, and lightning), and hazardous tree removal. Withincampsite boundaries 384 tree stumps were counted in 2014; anadditional 1054 stumps were counted in adjacent offsite areas.While the average number of stumps on the campsite proper didnot change from 1982 to 2014, additional offsite stumps werefound indicating that visitors are searching farther off camp to har-vest firewood. A substantial majority of these offsite stumps were<15 cm diameter, indicating they were in fact harvested by visi-tors for firewood, as opposed to removal as hazardous trees. Treecutting has led to a significant decrease in the number of trees onand around campsites, reducing tree canopy cover and increasingthe amount of sunlight reaching the ground (Fig. 2). A significantnumber of tree seedlings have also been lost. In addition, due tovisitor trampling and cutting, tree seedlings are rarely able to estab-lish, grow, and reach maturity on campsites, suggesting that thehistorical deforestation of campsites will continue.
3.3. Change in groundcover
The loss of vegetation cover and exposure of soil are otherimportant components of impact from recreational traffic andcamping activities. Table 5 characterizes percent and areal mea-sures for these indicators by subtracting 1982 values from 2014values for campsites and controls separately to reveal changes overthe 32 years. Exposed soil increased significantly on campsites(8.2%, 16.8 m2), with a slight 0.3% increase in control areas. Vegeta-tion cover also increased significantly on campsites (16.3%, 62 m2),
while vegetation cover in control areas decreased an average of18.3%. Based on absolute difference values in 2014, vegetation coveron campsites is 22.6% higher than in paired control areas, andexposed soil is 18.3% higher (Table 5).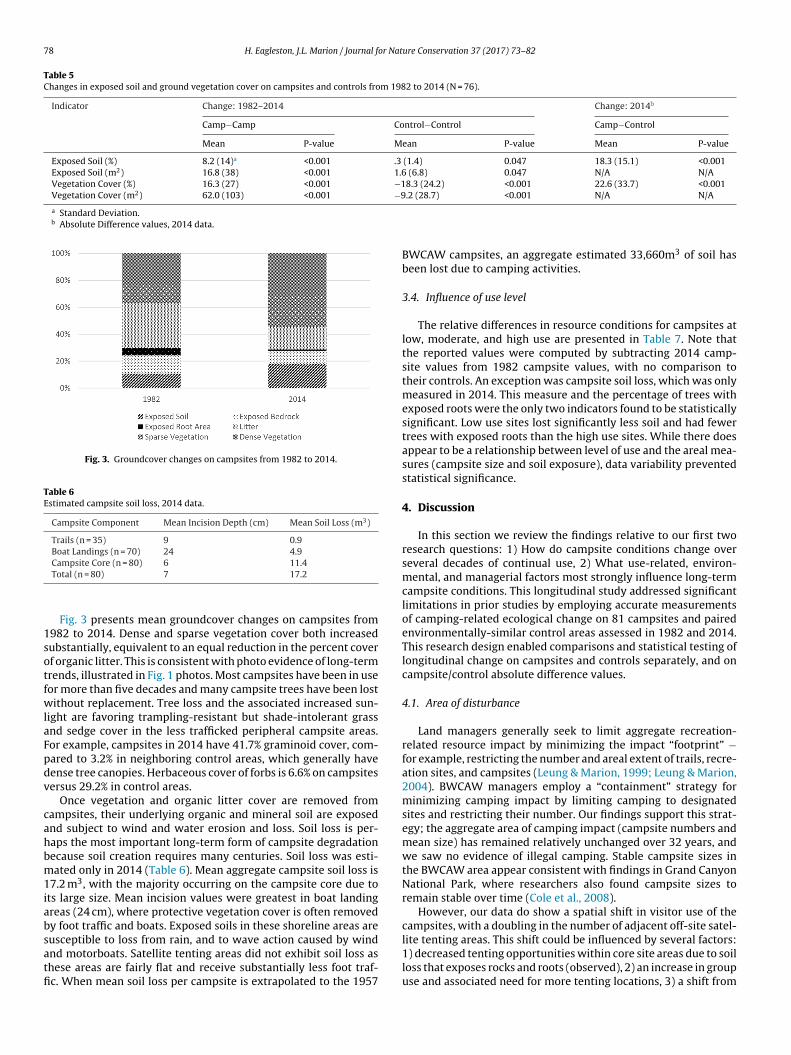
78 H. Eagleston, J.L. Marion / Journal for Nature Conservation 37 (2017) 73–82
Table 5Changes in exposed soil and ground vegetation cover on campsites and controls from 1982 to 2014 (N = 76).
Indicator Change: 1982–2014 Change: 2014b
Camp−Camp Control−Control Camp−Control
Mean P-value Mean P-value Mean P-value
Exposed Soil (%) 8.2 (14)a <0.001 .3 (1.4) 0.047 18.3 (15.1) <0.001Exposed Soil (m2) 16.8 (38) <0.001 1.6 (6.8) 0.047 N/A N/AVegetation Cover (%) 16.3 (27) <0.001 −18.3 (24.2) <0.001 22.6 (33.7) <0.001Vegetation Cover (m2) 62.0 (103) <0.001 −9.2 (28.7) <0.001 N/A N/A
a Standard Deviation.b Absolute Difference values, 2014 data.
Fig. 3. Groundcover changes on campsites from 1982 to 2014.
Table 6Estimated campsite soil loss, 2014 data.
Campsite Component Mean Incision Depth (cm) Mean Soil Loss (m3)
Trails (n = 35) 9 0.9Boat Landings (n = 70) 24 4.9
1sotfwlaFpdv
cahbm1iabsatfi
lite tenting areas. This shift could be influenced by several factors:
Campsite Core (n = 80) 6 11.4Total (n = 80) 7 17.2
Fig. 3 presents mean groundcover changes on campsites from982 to 2014. Dense and sparse vegetation cover both increasedubstantially, equivalent to an equal reduction in the percent coverf organic litter. This is consistent with photo evidence of long-termrends, illustrated in Fig. 1 photos. Most campsites have been in useor more than five decades and many campsite trees have been lostithout replacement. Tree loss and the associated increased sun-
ight are favoring trampling-resistant but shade-intolerant grassnd sedge cover in the less trafficked peripheral campsite areas.or example, campsites in 2014 have 41.7% graminoid cover, com-ared to 3.2% in neighboring control areas, which generally haveense tree canopies. Herbaceous cover of forbs is 6.6% on campsitesersus 29.2% in control areas.
Once vegetation and organic litter cover are removed fromampsites, their underlying organic and mineral soil are exposednd subject to wind and water erosion and loss. Soil loss is per-aps the most important long-term form of campsite degradationecause soil creation requires many centuries. Soil loss was esti-ated only in 2014 (Table 6). Mean aggregate campsite soil loss is
7.2 m3, with the majority occurring on the campsite core due tots large size. Mean incision values were greatest in boat landingreas (24 cm), where protective vegetation cover is often removedy foot traffic and boats. Exposed soils in these shoreline areas areusceptible to loss from rain, and to wave action caused by wind
nd motorboats. Satellite tenting areas did not exhibit soil loss ashese areas are fairly flat and receive substantially less foot traf-c. When mean soil loss per campsite is extrapolated to the 1957BWCAW campsites, an aggregate estimated 33,660m3 of soil hasbeen lost due to camping activities.
3.4. Influence of use level
The relative differences in resource conditions for campsites atlow, moderate, and high use are presented in Table 7. Note thatthe reported values were computed by subtracting 2014 camp-site values from 1982 campsite values, with no comparison totheir controls. An exception was campsite soil loss, which was onlymeasured in 2014. This measure and the percentage of trees withexposed roots were the only two indicators found to be statisticallysignificant. Low use sites lost significantly less soil and had fewertrees with exposed roots than the high use sites. While there doesappear to be a relationship between level of use and the areal mea-sures (campsite size and soil exposure), data variability preventedstatistical significance.
4. Discussion
In this section we review the findings relative to our first tworesearch questions: 1) How do campsite conditions change overseveral decades of continual use, 2) What use-related, environ-mental, and managerial factors most strongly influence long-termcampsite conditions. This longitudinal study addressed significantlimitations in prior studies by employing accurate measurementsof camping-related ecological change on 81 campsites and pairedenvironmentally-similar control areas assessed in 1982 and 2014.This research design enabled comparisons and statistical testing oflongitudinal change on campsites and controls separately, and oncampsite/control absolute difference values.
4.1. Area of disturbance
Land managers generally seek to limit aggregate recreation-related resource impact by minimizing the impact “footprint” −for example, restricting the number and areal extent of trails, recre-ation sites, and campsites (Leung & Marion, 1999; Leung & Marion,2004). BWCAW managers employ a “containment” strategy forminimizing camping impact by limiting camping to designatedsites and restricting their number. Our findings support this strat-egy; the aggregate area of camping impact (campsite numbers andmean size) has remained relatively unchanged over 32 years, andwe saw no evidence of illegal camping. Stable campsite sizes inthe BWCAW area appear consistent with findings in Grand CanyonNational Park, where researchers also found campsite sizes toremain stable over time (Cole et al., 2008).
However, our data do show a spatial shift in visitor use of thecampsites, with a doubling in the number of adjacent off-site satel-
1) decreased tenting opportunities within core site areas due to soilloss that exposes rocks and roots (observed), 2) an increase in groupuse and associated need for more tenting locations, 3) a shift from

H. Eagleston, J.L. Marion / Journal for Nature Conservation 37 (2017) 73–82 79
Table 7Relative changes in resource conditions on campsites from 1982 to 2014 as influenced by level of use.
Indicator Low Use(N = 6)
Medium Use(N = 25)
High Use(N = 27)
H-valuea P-value
Vegetation Cover Median ValuesTree (%) 0 −22.5 −22.5 3.58 0.167Shrub (%) −7.5 −1 −1 4.87 0.087Herb/Grass (%) 0 0 0 1.59 0.450Moss (%) 0 0 −1 0.91 0.633Ground CoverExposed Soil (m2) 3.2 9.5 31.7 2.94 0.229Campsite MetricsCore Campsite Size(m2)
−2.1 −3.1 −59.5 4.14 0.126
Satellite Size (m2) 0 16.7 34.7 3.38 0.184Landings (#/site) 1 1 2 1.16 0.322Satellite (#/site) 0 1 1 4.48 0.106ErosionTotal Soil loss (m3)b 4.2 11.0 22.6 14.66 <0.001
−
liaos
4
mssygoNsyatlac
aBsdiismafiaor
“t2gddt
Exposed Roots (%) 0 −2
a Measured only in 2014.b Kruskal-Wallis rank sum test.
arge to smaller and more numerous tents (observed), and 4) a shiftn visitor preferences to seek shade from the sun, privacy/solitude,nd natural quiet (distance from those who talk or snore). Previ-us studies have not documented or commented on these types ofpatial changes in campsite use.
.2. Forest cover
Sustainable recreation management requires the ability toaintain good resource conditions on recreation sites and camp-
ites over time (Marion & Sober, 1987). Our data documented aubstantial reduction in forest cover on campsites over the 32-ear period. Previous studies show that onsite tree mortality ratesreatly exceed off-site rates and that successful tree regenerationn campsites is rare (Cole, 1986; Marion & Merriam, 1985a; Smith &ewsome, 2002). Our findings mirror these. Comparison of camp-
ite/control data on tree density, cover, and recruitment over 32ears characterize a significant reduction in tree loss, canopy cover,nd seedlings on campsites. We anticipate that this trend will con-inue in absence of effective management actions, resulting in theoss of all campsite trees, followed by those in adjacent off-sitereas. Our data revealed that 21 additional campsites have lost theiranopy cover in 2014 than in 1982.
Loss of trees due to malicious damage and firewood cuttingre entirely “avoidable” recreation impacts (Marion, 2014). TheWCAW has had an excellent Leave No Trace education programince the 1970′s that asks campers to use small-diameter dead andowned firewood. Our data indicate that this program has been
nsufficiently effective in addressing low impact firewood gather-ng practices. Tree-felling is caused largely by the need for firewoodo prohibiting campfires has been an increasingly common U.S.anagement response. However, Reid and Marion, (2005) evalu-
ted campfire-related impacts and polices in seven protected areas,nding that fire bans did not substantially reduce tree damagend cutting due to continued illegal campfire activity. Prohibitionsn axes, hatchets, and saws were identified as a more effectiveesponse.
Visitor use management frameworks direct managers to definedesired resource conditions” and for campsites this should addresshe acceptability of tree-less campsites in forested settings (Marion,016). A substantial limitation of most campsite monitoring pro-
rams conducted to provide data for visitor use managementecision-making is that they generally do not assess tree numbers,ensities, or cover (Cole et al., 2008; Cole, 2013). This study illus-rates the need for incorporating such measures into these systems,6 11.99 0.002
and for long-term studies that evaluate a more comprehensivearray of ecological measurements. Rapid assessment ratings-basedmonitoring programs are more likely to miss documenting poten-tially important long-term ecological changes on campsites andrecreation sites.
4.3. Groundcover and soil
The substantial reductions in campsite tree cover allowshade-intolerant plants like resistant graminoids, to replace shade-tolerant plants, like broad-leafed herbs. These compositionalchanges are contributing to greater campsite sustainability, asresearch shows that graminoids are substantially more trampling-resistant and able to colonize peripheral campsite areas, reducingsoil loss (Cole, 1995a; Cole, 1995b; Marion et al., 2016; Sun & Liddle,1993). Graminoids also have greater resilience to trampling, recov-ering more quickly due to their flexible stems, narrow durableleaves, and fast growth rates (Pickering, 2010; Sun & Liddle, 1993).However, as campsites develop a grassy “lawn-like” appearancethese changes are unnatural both ecologically and aesthetically;visitors may no longer perceive that they are camping within apristine wilderness setting.
Our data reveal that substantial soil loss has occurred on camp-sites. Shoreline boat landing areas have the deepest incision andthe most localized soil loss. While less soil loss occurs across corecampsite areas, aggregate soil loss is substantial due to the largerareas affected. We were unable to locate other studies that hadestimated or measured soil loss on campsites. As sites continue toerode, there will be more exposed rock and roots that will encour-age visitors to shift tenting to adjacent offsite satellite areas. Thoughwe lack comparative data from 1982, we expect that soil loss occurson campsites at a fairly low but steady rate over time. Soil lossis the most significant and irreversible long-term change occur-ring on BWCAW campsites. It is also a cumulative change − soileroded by wind or water does not return unless replaced throughsite management actions.
Only two campsite impact indicators were significantly influ-enced by level of use: soil loss and the percentage of trees withexposed roots, which also reflects soil loss. Other studies havefound that high levels of use contribute to higher impacts, includ-ing reduced vegetation cover, greater soil loss, and larger campsite
sizes (Cole, 1993; Monz et al., 2013). In the BWCAW, campsites doreceive a wide range of use but visitation has been relatively stable,so impacts such as campsite size and vegetation cover tend to reachan equilibrium over time (Cole et al., 2008). As campsite trees con-
8 or Nat
triw
5
iiccochwicltap
aagstuecsHiath
A
twFSa
A
tcr3stfimi(&
0 H. Eagleston, J.L. Marion / Journal f
inue to be removed and graminoid cover expands we expect theate of soil loss to decline. Given our findings, we stress that reduc-ng campsite use in an effort to reduce environmental degradation
ould be an ineffective policy.
. Conclusion
To preserve protected natural areas in perpetuity while provid-ng recreation opportunities, managers need to consider potentialmpacts over not one year or ten years, but over decades andenturies. The results of this study document long-term ecologi-al changes and trends in resource conditions on a large samplef wilderness campsites. Campsite conditions over 32 years havehanged significantly. While the aggregate area of campsite impactas remained similar, expansion into peripheral areas has occurredhile core areas have contracted. The area of exposed soil has
ncreased, substantial numbers of trees have been lost, dramatichanges in plant composition have occurred, and campsites haveost substantial amounts of soil. Results from this study quantifyhese long-term changes and suggest effective sustainable man-gement prescriptions for the BWCAW that are also applicable torotected areas internationally.
By focusing greater attention on sustainable campsite man-gement, agency staff can prolong the ability of campsites toccommodate visitation and remain in good condition. We sug-est that this involve a combination of actions that include: 1)electing resistant locations that hinder site expansion, 2) construc-ion of side-hill campsites that attract and spatially concentratese and impact, 3) maintenance of sites to reduce soil loss, and 4)ducation and regulation of visitors to promote use of low impactamping practices. We note that agency funding and staffing con-traints often limit the ability of field staff to accomplish these tasks.owever, we emphasize that intensive visitor use will demand
ntensive site and visitor management if protected area managersre to accomplish their dual mission of preserving naturally func-ioning ecosystems while accommodating ample opportunities forigh quality recreational visits.
cknowledgements
This study was funded by the USDI U.S. Geological Survey andhe USDA Forest Service, Superior National Forest. The authorsould like to thank field assistants Claire Underwood and Jeff
eldhaus for their dedicated work and USFS BWCAW staff Annchwaller and Steve Cochran for their administrative and logisticalssistance.
ppendix A. Managing for Sustainability
This Appendix A is included to provide an extended presenta-ion of our findings and their implications for improving sustainableamping management in the BWCAW and other protected natu-al areas internationally. This section addresses research question) What are the implications of these findings for improving theustainability of campsite management? These findings, implica-ions, and “Best Management Practice” guidance are presented asve key visitor impact management strategies that protected area
anagers can consider for avoiding and minimizing environmentalmpacts on both campsites and recreation sites. See Hammitt et al.2014), Leung & Marion (2004), and Marion (2003, 2016), and Reid
Marion (2004) for additional guidance.
ure Conservation 37 (2017) 73–82
Manage Use Levels
Numerous recreation ecology studies have reported a curvilin-ear use-impact relationship whereby the majority of impact occursbetween campsite creation and moderate levels of use (20–40nights/yr) (Hammitt et al., 2014; Marion, 2016; Marion et al.,2016). For moderate use campsites, a doubling or tripling of usecontributes little additional impact because many indicators havealready reached high or near-maximum impact levels. For example,organic soils and tree seedlings/saplings have already been lost andsoil compaction is at near-maximum levels (Marion and Merriam,1985a). Reducing use to address campsite impacts would be inef-fectual unless substantial use reductions were applied to achieveextremely low use levels (Kangas et al., 2007; Marion et al., 2016;Monz et al., 2013).
Modify the Location of Use
A key objective for managing campsites sustainably is to ensurethat the mean and aggregate area of impact does not increaseover time (Marion, 2003; Marion, 2016). Selecting and designat-ing impact-resistant campsites limits campsite creation visitorsand allows use of locations that inhibit site expansion. We testedthe predictive efficacy of a site expansion potential rating thatcould be used to select sustainable campsite locations (Table 2).This four-class rating was designed to favor campsites whoseexpansion would be constrained by sloping topography, rocki-ness, wet soils, or dense woody vegetation. Our findings werepromising but non-significant. In the field, we observed that thepresence and density of woody vegetation cover as a deterrent tocampsite expansion was ephemeral, given that forest succession,wildfires, insects/diseases, wind-throw, and tree cutting by visitorscan remove trees and shrubs over time (Fig. 4). Further, we notedthat satellite tenting areas were created even when only a quarterof the adjacent offsite areas were favorable to expansion. Based onthese findings we refined the expansion potential rating as:
A sustainable campsite should stay its designed size in perpe-tuity, bounded by adjacent offsite areas that are not conduciveto tenting or other camping activities due to sloping topography(>20%) or substantial rockiness. Assess the percentage of adjacentoffsite areas within a 30 m buffer around a proposed campsiteboundary that would inhibit all tenting activity. Optimal campsitelocations should score above 85%.
When optimal naturally-occurring locations are unavailable,managers can also construct expansion-resistant “side-hill” camp-sites in sloping terrain ( > 20%) (Marion, 2016). Similar to side-hilltrails, cut-and-fill excavation is employed to construct separatetent pads and a core cooking area (Marion & Farrell, 2002). Hun-dreds of side-hill campsites have been constructed along the U.S.Appalachian Trail and research reveals them to be effective inspatially concentrating camping activity to a small “footprint”of impact, and able to resolve many social problems (Daniels &Marion, 2006).
Increase Resource Resistance
Campsite layout and design attributes can be altered to improvecampsite sustainability (Marion, 2003; Marion, 2016). We sug-gest using visitor interviews or surveys to inform the design ofcampsites that meet visitor’s needs while spatially concentratingcamping activities such as tenting, cooking, eating, and campfires.This study revealed that visitors will readily create new use areas
outside of campsite boundaries when their needs are not being met.Their motives must be known to effectively resolve this problem:are they searching for privacy or natural quiet, smooth well-drainedtent sites, shade, or some combination?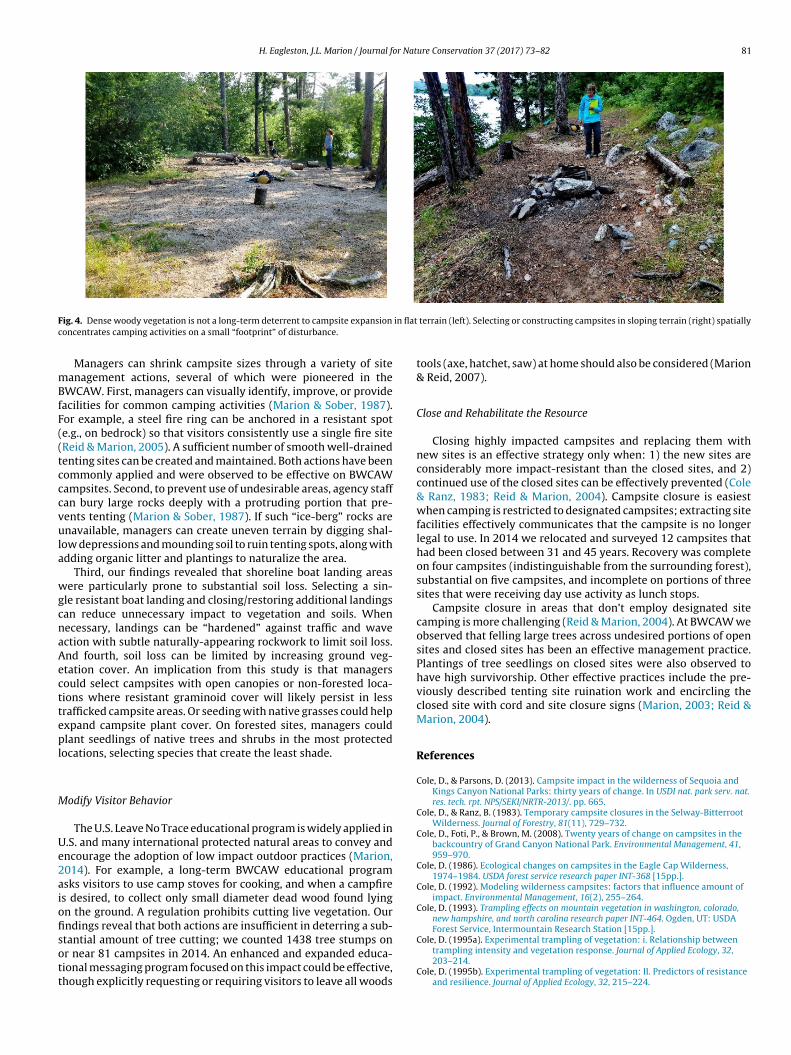
H. Eagleston, J.L. Marion / Journal for Nature Conservation 37 (2017) 73–82 81
F in flatc
mBfF((tcccvula
wgcnaAecttepl
M
Ue2aiofisott
ig. 4. Dense woody vegetation is not a long-term deterrent to campsite expansion
oncentrates camping activities on a small “footprint” of disturbance.
Managers can shrink campsite sizes through a variety of siteanagement actions, several of which were pioneered in the
WCAW. First, managers can visually identify, improve, or provideacilities for common camping activities (Marion & Sober, 1987).or example, a steel fire ring can be anchored in a resistant spote.g., on bedrock) so that visitors consistently use a single fire siteReid & Marion, 2005). A sufficient number of smooth well-drainedenting sites can be created and maintained. Both actions have beenommonly applied and were observed to be effective on BWCAWampsites. Second, to prevent use of undesirable areas, agency staffan bury large rocks deeply with a protruding portion that pre-ents tenting (Marion & Sober, 1987). If such “ice-berg” rocks arenavailable, managers can create uneven terrain by digging shal-
ow depressions and mounding soil to ruin tenting spots, along withdding organic litter and plantings to naturalize the area.
Third, our findings revealed that shoreline boat landing areasere particularly prone to substantial soil loss. Selecting a sin-
le resistant boat landing and closing/restoring additional landingsan reduce unnecessary impact to vegetation and soils. Whenecessary, landings can be “hardened” against traffic and wavection with subtle naturally-appearing rockwork to limit soil loss.nd fourth, soil loss can be limited by increasing ground veg-tation cover. An implication from this study is that managersould select campsites with open canopies or non-forested loca-ions where resistant graminoid cover will likely persist in lessrafficked campsite areas. Or seeding with native grasses could helpxpand campsite plant cover. On forested sites, managers couldlant seedlings of native trees and shrubs in the most protected
ocations, selecting species that create the least shade.
odify Visitor Behavior
The U.S. Leave No Trace educational program is widely applied in.S. and many international protected natural areas to convey andncourage the adoption of low impact outdoor practices (Marion,014). For example, a long-term BWCAW educational programsks visitors to use camp stoves for cooking, and when a campfires desired, to collect only small diameter dead wood found lyingn the ground. A regulation prohibits cutting live vegetation. Ourndings reveal that both actions are insufficient in deterring a sub-
tantial amount of tree cutting; we counted 1438 tree stumps onr near 81 campsites in 2014. An enhanced and expanded educa-ional messaging program focused on this impact could be effective,hough explicitly requesting or requiring visitors to leave all woodsterrain (left). Selecting or constructing campsites in sloping terrain (right) spatially
tools (axe, hatchet, saw) at home should also be considered (Marion& Reid, 2007).
Close and Rehabilitate the Resource
Closing highly impacted campsites and replacing them withnew sites is an effective strategy only when: 1) the new sites areconsiderably more impact-resistant than the closed sites, and 2)continued use of the closed sites can be effectively prevented (Cole& Ranz, 1983; Reid & Marion, 2004). Campsite closure is easiestwhen camping is restricted to designated campsites; extracting sitefacilities effectively communicates that the campsite is no longerlegal to use. In 2014 we relocated and surveyed 12 campsites thathad been closed between 31 and 45 years. Recovery was completeon four campsites (indistinguishable from the surrounding forest),substantial on five campsites, and incomplete on portions of threesites that were receiving day use activity as lunch stops.
Campsite closure in areas that don’t employ designated sitecamping is more challenging (Reid & Marion, 2004). At BWCAW weobserved that felling large trees across undesired portions of opensites and closed sites has been an effective management practice.Plantings of tree seedlings on closed sites were also observed tohave high survivorship. Other effective practices include the pre-viously described tenting site ruination work and encircling theclosed site with cord and site closure signs (Marion, 2003; Reid &Marion, 2004).
References
Cole, D., & Parsons, D. (2013). Campsite impact in the wilderness of Sequoia andKings Canyon National Parks: thirty years of change. In USDI nat. park serv. nat.res. tech. rpt. NPS/SEKI/NRTR-2013/. pp. 665.
Cole, D., & Ranz, B. (1983). Temporary campsite closures in the Selway-BitterrootWilderness. Journal of Forestry, 81(11), 729–732.
Cole, D., Foti, P., & Brown, M. (2008). Twenty years of change on campsites in thebackcountry of Grand Canyon National Park. Environmental Management, 41,959–970.
Cole, D. (1986). Ecological changes on campsites in the Eagle Cap Wilderness,1974–1984. USDA forest service research paper INT-368 [15pp.].
Cole, D. (1992). Modeling wilderness campsites: factors that influence amount ofimpact. Environmental Management, 16(2), 255–264.
Cole, D. (1993). Trampling effects on mountain vegetation in washington, colorado,new hampshire, and north carolina research paper INT-464. Ogden, UT: USDAForest Service, Intermountain Research Station [15pp.].
Cole, D. (1995a). Experimental trampling of vegetation: i. Relationship betweentrampling intensity and vegetation response. Journal of Applied Ecology, 32,203–214.
Cole, D. (1995b). Experimental trampling of vegetation: II. Predictors of resistanceand resilience. Journal of Applied Ecology, 32, 215–224.

8 or Nat
C
D
F
G
H
H
K
L
L
L
M
M
M
M
M
M
M
Smith, A., & Newsome, D. (2002). An integrated approach to assessing, managingand monitoring campsite impacts in Warren National Park, Western Australia.Journal of Sustainable Tourism, 10(4), 343–359.
Sun, D., & Liddle, M. (1993). Trampling resistance, stem flexibility and leaf strengthin nine Australian grasses and herbs. Biological Conservation, 65(1), 35–41.
2 H. Eagleston, J.L. Marion / Journal f
ole, D. (2013). Changing conditions on wilderness campsites: Seven case studiesof trends over 13–32 years. In USDA Forest Service Gen. Tech. Rep.RMRS-GTR-300. [99p.].
aniels, M., & Marion, J. (2006). Visitor evaluations of management actions at ahighly impacted Appalachian Trail camping area. Environmental Management,38(6), 1006–1019.
rissell, S., & Duncan, D. (1965). Campsite preference and deterioration in theQuetico-Superior Canoe Country. Journal of Forestry, 63(4), 256–260.
rowcock, A., & Pickering, C. (2011). A guilt-free roll in the grass: minimalshort-term impacts from short-term camping in the Australian Alps. Journal ofEcotourism, 10(1), 86–100.
all, T., & Farrell, T. (2001). Fuelwood depletion at wilderness campsites: extentand potential ecological significance. Environmental Conservation, 28, 1–7.
ammitt, W., Cole, D., & Monz, C. (2014). Wildland recreation: ecology andmanagement (3rd ed.). New York: John Wiley and Sons.
angas, K., Sulkava, P., Koivuniemi, P., Tolvanen, A., Siikamaki, P., & Norokorpi, Y.(2007). What determines the area of impact around campsites? A case study ina Finnish national park. Forest Snow and Landscape Research, 81(1-2), 139–150.
eung, Y., & Marion, J. (1999). Spatial strategies for managing visitor impacts inNational Parks. Journal of Park and Recreation Administration, 17(4), 20–38.
eung, Y., & Marion, J. (2004). Managing impacts of camping. In R. Buckley (Ed.),Environmental impact of tourism (pp. 245–258). Cambridge, MA: CABIPublishing.
everington, F., Costa, K., Pavese, H., Lisle, A., & Hockings, M. (2010). A globalanalysis of protected area management effectiveness. EnvironmentalManagement, 46(5), 685–698.
arion, J., & Cole, D. (1996). Spatial and temporal variation in soil and vegetationimpacts on campsites: Delaware Water Gap National Recreation Area.Ecological Applications, 6(2), 520–530.
arion, J., & Farrell, T. (2002). Management practices that concentrate visitoractivities: camping impact management isle royale national park, USA. Journalof Environmental Management, 66, 201–212.
arion, J., & Merriam, L. (1985a). Recreational impacts on well-establishedcampsites in the boundary waters canoe area wilderness. In Technical bulletinAD SB 2502. St. Paul, MN: University of Minnesota, Agricultural ExperimentStation.
arion, J., & Merriam, L. (1985b). Predictability of recreational impact on soils. SoilScience Society of America Journal, 49(3), 751–753.
arion, J., & Sober, T. (1987). Environmental impact management in the BoundaryWaters Canoe Area Wilderness. Northern Journal of Applied Forestry, 4(1), 7–10.
arion, J., Leung, Y., Eagleston, H., & Burroughs, K. (2016). A review and synthesisof recreation ecology findings on visitor impacts to wilderness and protected
natural areas. Journal of Forestry, 114(2), 352–362.arion, J. (1984). Ecological changes resulting from recreational use: a study ofbackcountry campsites in the Boundary Waters Canoe Area Wilderness Minnesota.University of Minnesota, Department of Forest Resources [Ph.D. Dissertation279 pp].
ure Conservation 37 (2017) 73–82
Marion, J. (2003). Camping impact management on the appalachian national scenictrail. Appendix B, Camping management practices. In Report published by theappalachian trail conference [109 pp.].
Marion, J. (2014). Leave No trace in the outdoors. pp. 128pp. Stackpole Books.Marion, J. (2016). A review and synthesis of recreation ecology research supporting
carrying capacity and visitor use management decision-making. Journal ofForestry, 114(3), 339–351.
McCool, S., Merriam, L., & Cushwa, C. (1969). The condition of wildernesscampsites in the Boundary Waters Canoe Area. In Minnesota forestry researchnotes 202. School of Forestry, University of Minnesota [4pp.].
Merriam, L., & Peterson, R. (1983). Impact of 15 years of use on some campsites inthe Boundary Waters Canoe Area Minneapolis. In University of Minnesota NoteNo. 282. MN: Minnesota Forestry Research Notes.
Merriam, L., & Smith, C. (1974). Visitor impact on newly developed campsites inthe Boundary Waters Canoe Area. Journal of Forestry, 72, 627–630.
Merriam, L., Smith, C., Miller, D., Huang, C., Tappeiner, J., Goeckermann, K., et al.(1973). Newly developed campsites in the boundary waters canoe area: astudy of 5 year’s use. St. Paul,MN: University of Minnesota, AgriculturalExperiment Station. Bulletin, 511 [27 p].
Monti, P., & Mackintosh, E. (1979). Effect of camping on surface soil properties inthe boreal forest region of northwestern Ontario: canada. Soil Science Society ofAmerica Journal, 43, 1024–1029.
Monz, C., Pickering, C., & Hadwen, W. (2013). Recent advances in recreation ecologyand the implications of different relationships between recreation use andecological impacts. Frontiers in Ecology and the Environment, 11(8), 441–446.
Moyle, J., & Moyle, E. (1977). Northland wildflowers: the comprehensive guide to theMinnesota region. Minneapolis: University of Minnesota Press.
Pickering, C. (2010). Ten factors that affect the severity of environmental impactsof visitors in protected areas. Ambio, 39(1), 70–77.
Prettyman, D. (1987). Soil survey of Kawishiwi area, minnesota: parts of lake and cookcounties in Superior national forest. Washington, D.C: U.S. Department ofAgriculture Soil Conservation Service.
Reid, S., & Marion, J. (2004). Effectiveness of a confinement strategy for reducingcampsite impacts in Shenandoah National Park. Environmental Conservation, 4,1–9.
Reid, S., & Marion, J. (2005). A comparison of campfire impacts and policies inseven protected areas. Environmental Management, 36(1), 48–58.