Linking genomics and ecology to investigate the complex evolution of an invasive Drosophila pest
20
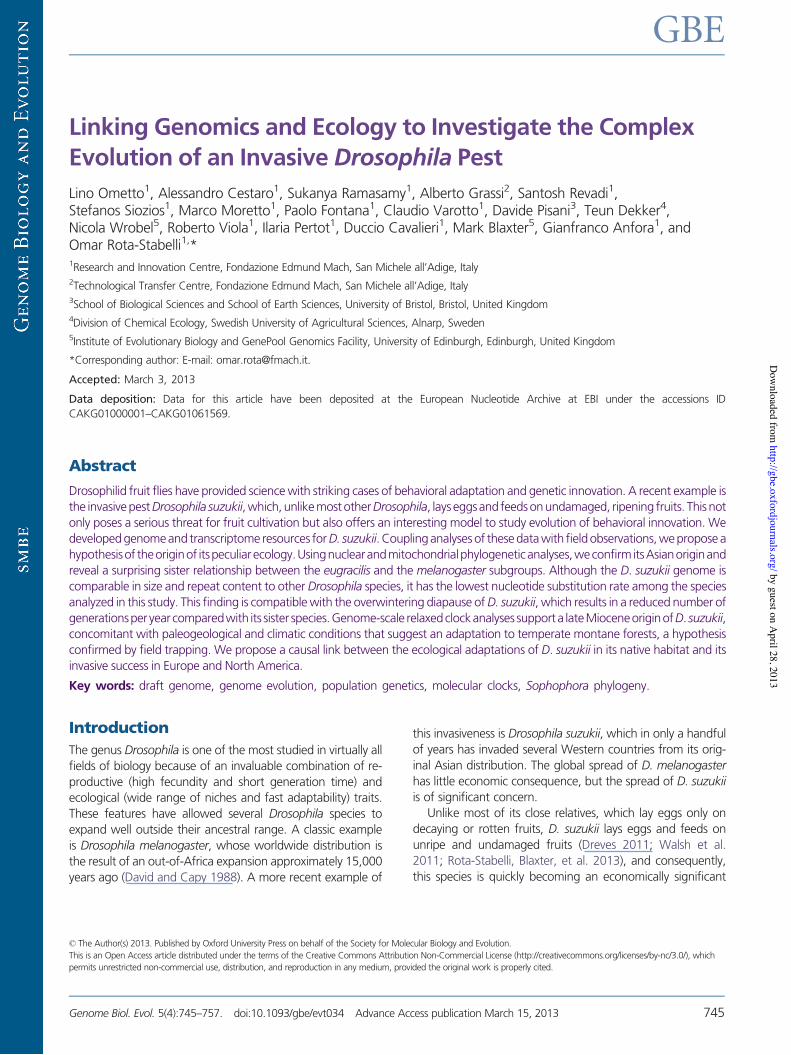
Linking Genomics and Ecology to Investigate the Complex Evolution of an Invasive Drosophila Pest Lino Ometto 1 , Alessandro Cestaro 1 , Sukanya Ramasamy 1 , Alberto Grassi 2 , Santosh Revadi 1 , Stefanos Siozios 1 , Marco Moretto 1 , Paolo Fontana 1 , Claudio Varotto 1 , Davide Pisani 3 , Teun Dekker 4 , Nicola Wrobel 5 , Roberto Viola 1 , Ilaria Pertot 1 , Duccio Cavalieri 1 , Mark Blaxter 5 , Gianfranco Anfora 1 , and Omar Rota-Stabelli 1, * 1 Research and Innovation Centre, Fondazione Edmund Mach, San Michele all’Adige, Italy 2 Technological Transfer Centre, Fondazione Edmund Mach, San Michele all’Adige, Italy 3 School of Biological Sciences and School of Earth Sciences, University of Bristol, Bristol, United Kingdom 4 Division of Chemical Ecology, Swedish University of Agricultural Sciences, Alnarp, Sweden 5 Institute of Evolutionary Biology and GenePool Genomics Facility, University of Edinburgh, Edinburgh, United Kingdom *Corresponding author: E-mail: [email protected]. Accepted: March 3, 2013 Data deposition: Data for this article have been deposited at the European Nucleotide Archive at EBI under the accessions ID CAKG01000001–CAKG01061569. Abstract Drosophilid fruit flies have provided science with striking cases of behavioral adaptation and genetic innovation. A recent example is the invasive pest Drosophila suzukii, which, unlike most other Drosophila, lays eggs and feeds on undamaged, ripening fruits. This not only poses a serious threat for fruit cultivation but also offers an interesting model to study evolution of behavioral innovation. We developed genome and transcriptome resources for D. suzukii. Coupling analyses of these data with field observations, we propose a hypothesis of the origin of its peculiar ecology. Using nuclear and mitochondrial phylogenetic analyses, we confirm its Asian origin and reveal a surprising sister relationship between the eugracilis and the melanogaster subgroups. Although the D. suzukii genome is comparable in size and repeat content to other Drosophila species, it has the lowest nucleotide substitution rate among the species analyzed in this study. This finding is compatible with the overwintering diapause of D. suzukii, which results in a reduced number of generations per year compared with its sister species. Genome-scale relaxed clock analyses support a late Miocene origin of D. suzukii, concomitant with paleogeological and climatic conditions that suggest an adaptation to temperate montane forests, a hypothesis confirmed by field trapping. We propose a causal link between the ecological adaptations of D. suzukii in its native habitat and its invasive success in Europe and North America. Key words: draft genome, genome evolution, population genetics, molecular clocks, Sophophora phylogeny. Introduction The genus Drosophila is one of the most studied in virtually all fields of biology because of an invaluable combination of re- productive (high fecundity and short generation time) and ecological (wide range of niches and fast adaptability) traits. These features have allowed several Drosophila species to expand well outside their ancestral range. A classic example is Drosophila melanogaster, whose worldwide distribution is the result of an out-of-Africa expansion approximately 15,000 years ago (David and Capy 1988). A more recent example of this invasiveness is Drosophila suzukii, which in only a handful of years has invaded several Western countries from its orig- inal Asian distribution. The global spread of D. melanogaster has little economic consequence, but the spread of D. suzukii is of significant concern. Unlike most of its close relatives, which lay eggs only on decaying or rotten fruits, D. suzukii lays eggs and feeds on unripe and undamaged fruits (Dreves 2011; Walsh et al. 2011; Rota-Stabelli, Blaxter, et al. 2013), and consequently, this species is quickly becoming an economically significant GBE ß The Author(s) 2013. Published by Oxford University Press on behalf of the Society for Molecular Biology and Evolution. This is an Open Access article distributed under the terms of the Creative Commons Attribution Non-Commercial License (http://creativecommons.org/licenses/by-nc/3.0/), which permits unrestricted non-commercial use, distribution, and reproduction in any medium, provided the original work is properly cited. Genome Biol. Evol. 5(4):745–757. doi:10.1093/gbe/evt034 Advance Access publication March 15, 2013 745 by guest on April 28, 2013 http://gbe.oxfordjournals.org/ Downloaded from
-
Upload
independent -
Category
Documents
-
view
1 -
download
0
Transcript of Linking genomics and ecology to investigate the complex evolution of an invasive Drosophila pest
Linking Genomics and Ecology to Investigate the ComplexEvolution of an Invasive Drosophila Pest
Lino Ometto1, Alessandro Cestaro1, Sukanya Ramasamy1, Alberto Grassi2, Santosh Revadi1,Stefanos Siozios1, Marco Moretto1, Paolo Fontana1, Claudio Varotto1, Davide Pisani3, Teun Dekker4,Nicola Wrobel5, Roberto Viola1, Ilaria Pertot1, Duccio Cavalieri1, Mark Blaxter5, Gianfranco Anfora1, andOmar Rota-Stabelli1,*1Research and Innovation Centre, Fondazione Edmund Mach, San Michele all’Adige, Italy2Technological Transfer Centre, Fondazione Edmund Mach, San Michele all’Adige, Italy3School of Biological Sciences and School of Earth Sciences, University of Bristol, Bristol, United Kingdom4Division of Chemical Ecology, Swedish University of Agricultural Sciences, Alnarp, Sweden5Institute of Evolutionary Biology and GenePool Genomics Facility, University of Edinburgh, Edinburgh, United Kingdom
*Corresponding author: E-mail: [email protected].
Accepted: March 3, 2013
Data deposition: Data for this article have been deposited at the European Nucleotide Archive at EBI under the accessions IDCAKG01000001–CAKG01061569.
Abstract
Drosophilid fruit flies have provided science with striking cases of behavioral adaptation and genetic innovation. A recent example isthe invasive pest Drosophila suzukii,which,unlikemostother Drosophila, lays eggsand feeds on undamaged, ripening fruits. This notonly poses a serious threat for fruit cultivation but also offers an interesting model to study evolution of behavioral innovation. Wedeveloped genome and transcriptome resources for D. suzukii. Coupling analyses of these data with field observations, we propose ahypothesisof theoriginof itspeculiarecology.Usingnuclearandmitochondrialphylogeneticanalyses,weconfirmitsAsianoriginandreveal a surprising sister relationship between the eugracilis and the melanogaster subgroups. Although the D. suzukii genome iscomparable in size and repeat content to other Drosophila species, it has the lowest nucleotide substitution rate among the speciesanalyzed in this study. This finding is compatible with the overwintering diapause of D. suzukii, which results in a reduced number ofgenerationsperyearcomparedwith its sister species.Genome-scale relaxedclockanalyses supporta lateMioceneoriginofD. suzukii,concomitant with paleogeological and climatic conditions that suggest an adaptation to temperate montane forests, a hypothesisconfirmed by field trapping. We propose a causal link between the ecological adaptations of D. suzukii in its native habitat and itsinvasive success in Europe and North America.
Key words: draft genome, genome evolution, population genetics, molecular clocks, Sophophora phylogeny.
IntroductionThe genus Drosophila is one of the most studied in virtually allfields of biology because of an invaluable combination of re-productive (high fecundity and short generation time) andecological (wide range of niches and fast adaptability) traits.These features have allowed several Drosophila species toexpand well outside their ancestral range. A classic exampleis Drosophila melanogaster, whose worldwide distribution isthe result of an out-of-Africa expansion approximately 15,000years ago (David and Capy 1988). A more recent example of
this invasiveness is Drosophila suzukii, which in only a handfulof years has invaded several Western countries from its orig-inal Asian distribution. The global spread of D. melanogasterhas little economic consequence, but the spread of D. suzukiiis of significant concern.
Unlike most of its close relatives, which lay eggs only ondecaying or rotten fruits, D. suzukii lays eggs and feeds onunripe and undamaged fruits (Dreves 2011; Walsh et al.2011; Rota-Stabelli, Blaxter, et al. 2013), and consequently,this species is quickly becoming an economically significant
GBE
! The Author(s) 2013. Published by Oxford University Press on behalf of the Society for Molecular Biology and Evolution.
This is an Open Access article distributed under the terms of the Creative Commons Attribution Non-Commercial License (http://creativecommons.org/licenses/by-nc/3.0/), which
permits unrestricted non-commercial use, distribution, and reproduction in any medium, provided the original work is properly cited.
Genome Biol. Evol. 5(4):745–757. doi:10.1093/gbe/evt034 Advance Access publication March 15, 2013 745
by guest on April 28, 2013
http://gbe.oxfordjournals.org/D
ownloaded from
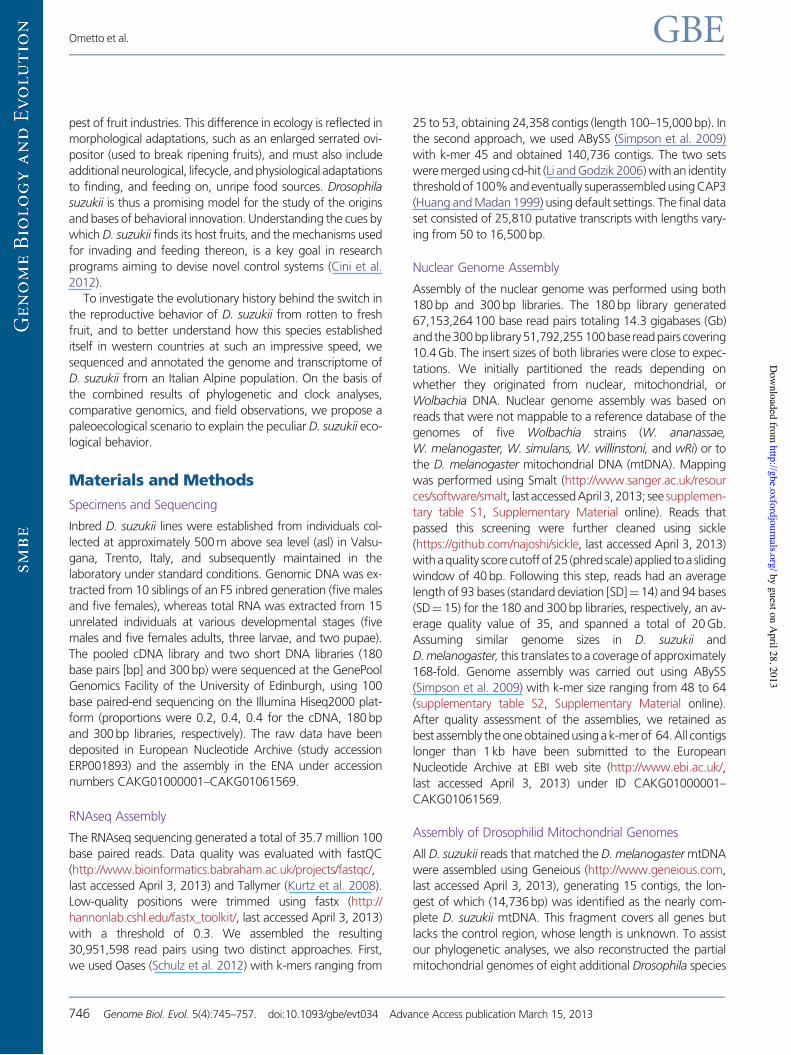
pest of fruit industries. This difference in ecology is reflected inmorphological adaptations, such as an enlarged serrated ovi-positor (used to break ripening fruits), and must also includeadditional neurological, lifecycle, and physiological adaptationsto finding, and feeding on, unripe food sources. Drosophilasuzukii is thus a promising model for the study of the originsand bases of behavioral innovation. Understanding the cues bywhich D. suzukii finds its host fruits, and the mechanisms usedfor invading and feeding thereon, is a key goal in researchprograms aiming to devise novel control systems (Cini et al.2012).
To investigate the evolutionary history behind the switch inthe reproductive behavior of D. suzukii from rotten to freshfruit, and to better understand how this species establisheditself in western countries at such an impressive speed, wesequenced and annotated the genome and transcriptome ofD. suzukii from an Italian Alpine population. On the basis ofthe combined results of phylogenetic and clock analyses,comparative genomics, and field observations, we propose apaleoecological scenario to explain the peculiar D. suzukii eco-logical behavior.
Materials and Methods
Specimens and Sequencing
Inbred D. suzukii lines were established from individuals col-lected at approximately 500 m above sea level (asl) in Valsu-gana, Trento, Italy, and subsequently maintained in thelaboratory under standard conditions. Genomic DNA was ex-tracted from 10 siblings of an F5 inbred generation (five malesand five females), whereas total RNA was extracted from 15unrelated individuals at various developmental stages (fivemales and five females adults, three larvae, and two pupae).The pooled cDNA library and two short DNA libraries (180base pairs [bp] and 300 bp) were sequenced at the GenePoolGenomics Facility of the University of Edinburgh, using 100base paired-end sequencing on the Illumina Hiseq2000 plat-form (proportions were 0.2, 0.4, 0.4 for the cDNA, 180 bpand 300 bp libraries, respectively). The raw data have beendeposited in European Nucleotide Archive (study accessionERP001893) and the assembly in the ENA under accessionnumbers CAKG01000001–CAKG01061569.
RNAseq Assembly
The RNAseq sequencing generated a total of 35.7 million 100base paired reads. Data quality was evaluated with fastQC(http://www.bioinformatics.babraham.ac.uk/projects/fastqc/,last accessed April 3, 2013) and Tallymer (Kurtz et al. 2008).Low-quality positions were trimmed using fastx (http://hannonlab.cshl.edu/fastx_toolkit/, last accessed April 3, 2013)with a threshold of 0.3. We assembled the resulting30,951,598 read pairs using two distinct approaches. First,we used Oases (Schulz et al. 2012) with k-mers ranging from
25 to 53, obtaining 24,358 contigs (length 100–15,000 bp). Inthe second approach, we used ABySS (Simpson et al. 2009)with k-mer 45 and obtained 140,736 contigs. The two setswere merged using cd-hit (Li and Godzik 2006) with an identitythreshold of 100% and eventually superassembled using CAP3(Huang and Madan 1999) using default settings. The final dataset consisted of 25,810 putative transcripts with lengths vary-ing from 50 to 16,500 bp.
Nuclear Genome Assembly
Assembly of the nuclear genome was performed using both180 bp and 300 bp libraries. The 180 bp library generated67,153,264 100 base read pairs totaling 14.3 gigabases (Gb)and the300 bp library51,792,255 100base readpairs covering10.4 Gb. The insert sizes of both libraries were close to expec-tations. We initially partitioned the reads depending onwhether they originated from nuclear, mitochondrial, orWolbachia DNA. Nuclear genome assembly was based onreads that were not mappable to a reference database of thegenomes of five Wolbachia strains (W. ananassae,W. melanogaster, W. simulans, W. willinstoni, and wRi) or tothe D. melanogaster mitochondrial DNA (mtDNA). Mappingwas performed using Smalt (http://www.sanger.ac.uk/resources/software/smalt, last accessedApril 3,2013; see supplemen-tary table S1, Supplementary Material online). Reads thatpassed this screening were further cleaned using sickle(https://github.com/najoshi/sickle, last accessed April 3, 2013)withaquality scorecutoffof25 (phredscale) applied toaslidingwindow of 40 bp. Following this step, reads had an averagelength of 93 bases (standard deviation [SD]!14) and 94 bases(SD!15) for the 180 and 300 bp libraries, respectively, an av-erage quality value of 35, and spanned a total of 20 Gb.Assuming similar genome sizes in D. suzukii andD. melanogaster, this translates to a coverage of approximately168-fold. Genome assembly was carried out using ABySS(Simpson et al. 2009) with k-mer size ranging from 48 to 64(supplementary table S2, Supplementary Material online).After quality assessment of the assemblies, we retained asbest assembly the one obtained using a k-merof 64.All contigslonger than 1 kb have been submitted to the EuropeanNucleotide Archive at EBI web site (http://www.ebi.ac.uk/,last accessed April 3, 2013) under ID CAKG01000001–CAKG01061569.
Assembly of Drosophilid Mitochondrial Genomes
All D. suzukii reads that matched the D. melanogaster mtDNAwere assembled using Geneious (http://www.geneious.com,last accessed April 3, 2013), generating 15 contigs, the lon-gest of which (14,736 bp) was identified as the nearly com-plete D. suzukii mtDNA. This fragment covers all genes butlacks the control region, whose length is unknown. To assistour phylogenetic analyses, we also reconstructed the partialmitochondrial genomes of eight additional Drosophila species
Ometto et al. GBE
746 Genome Biol. Evol. 5(4):745–757. doi:10.1093/gbe/evt034 Advance Access publication March 15, 2013
by guest on April 28, 2013
http://gbe.oxfordjournals.org/D
ownloaded from
(D. biarmipes, D. bipectinata, D. elegans, D. eugracilis,D. ficusphila, D. kikkawai, D. rhopaloa, and D. takahashi).The draft genomes and transcriptomes of these specieswere kindly made available by the Baylor College ofMedicine and modENCODE Consortium (https://www.hgsc.bcm.edu/content/drosophila-modencode-project, last acces-sed April 3, 2013). For each species, we separately comparedthe transcriptome and draft genome against theD. melanogaster mtDNA using Basic Local Alignment SearchTool (BLAST) (Camacho et al. 2009). We used Geneious toassemble each set of contigs identified by BLAST, using theD. melanogaster mtDNA as a reference. We compared by eyethe resulting assemblies to the complete mtDNA genomeavailable for 12 other Drosophila species (Drosophila 12Genomes Consortium et al. 2007), revealing many putativenuclear mitochondrial DNA. Finally, we retained only thetranscriptome-based assemblies. These contained a largenumber of undetermined sites due to the expected intraspe-cific mtDNA polymorphism in the source Drosophilapopulations.
Repeat Identification
To the genome of D. suzukii and the other eight Drosophilaspecies mentioned earlier, we added the (draft) genomes of12 additional Drosophila species (D. melanogaster,D. ananassae, D. sechellia, D. simulans, D. yakuba, D. erecta,D. pseudobscura, D. persimilis, D. willistoni, D. mojavensis,D. virilis, and D. grimshawi; downloaded from http://flybase.org, last accessed April 3, 2013). In each genome, we auto-matically annotated repeats using RepeatMasker (http://www.repeatmasker.org, last accessed April 3, 2013), at default set-tings, and then used the Repbase database (Jurka et al. 2005)as a reference for de novo identification. We analyzed theentire genome without distinguishing between euchromatinand heterochromatin partitions, as these information areeither incomplete or unknown for most of the Drosophilaspecies used in this study. We used all fragments irrespectiveof their length, because the D. suzukii genome assembly andsome of the other draft genomes contained many contigsshorter than the 200 kb limit recommended (Drosophila 12Genomes Consortium et al. 2007). We quantified thepresence and size of repeats as the percentage of repeatedsequences over the draft genome size. This approach hasthe advantage of reducing biases due to the uncertain draftgenome size of the different species, which may vary dueto the different assembly strategies and/or genome qual-ity levels, and may not reflect the actual genome size.To account for this inaccuracy, we further calculated thepercentage of total repeats using two contrasting andconservative estimates of the putative average Drosophilagenome size (a minimum at 130 Mb and a maximum at180 Mb).
Orthologous Gene Set Identification
Forcomparativegenomicanalyses,wecollateddata for21Dro-sophila species. We downloaded the latest coding sequences(CDS) data sets available for D. melanogaster (release 5.43) andD. ananassae (release 1.3) from FlyBase, as well the maskedalignments of all single-copy orthologs used in the 12 Droso-phila project available from ftp://ftp.flybase.net/genomes/12_species_analysis/clark_eisen/alignments/all_species.guide_tree.longest.cds.tar.gz (last accessed April 3, 2013) (Drosophila12GenomesConsortiumetal.2007).Wealsodownloaded theassembled RNA-Seq data of eight modENCODE Drosophilaspecies (https://www.hgsc.bcm.edu/content/drosophila-mod-encode-project, last accessed April 3, 2013). We identifiedbest-hit homologous sequences between the nine RNA-Seqand two CDS data sets using pairwise BLASTn (optimizedusing the parameter “-best_hit_overhang 0.15”).
Rates of molecular evolution and tests of positive selectionwere based on the set of orthologous genes identified inD. melanogaster, D. biarmipes, D. takahashi, D. suzukii, andD. ananassae. To minimize the possibility of spurious matches,we filtered matches to exclude any with less than 60% of thelength of either sequence aligned. We produced two lists ofputative ortholog sets from this five-species set. In the first(“STARorthologues”), we identified as orthologous genes thereciprocal best hits between D. melanogaster and each ofD. biarmipes, D. takahashi, D. suzukii, and D. ananassae (seesupplementary fig. S3, Supplementary Material online). Usingthis approach, we identified a total of 2,336 STARorthologquintuplets.
The second, more conservative list, included only thosegenes found as reciprocal best hits for all pairwise comparisonsbetween the five species (WEBorthologs; see supplementaryfig. S3, Supplementary Material online). This data set included1,021 WEBortholog quintets and by definition is a subset of theSTARorthologs data set. All sequences within each ortholog setwere oriented based on the D. melanogaster sequence andaligned with MUSCLE (Edgar 2004). We then trimmed partialcodons at the 50- and 30-ends based on the D. melanogastersequence.
For the ortholog groups used for molecular evolution anal-yses, we then extracted the portion of the alignments withrepresentation from all taxa. Finally, all alignments wererealigned using Prank (Loytynoja and Goldman 2008) as im-plemented in TranslatorX (Abascal et al. 2010), which alignsprotein-coding nucleotide sequences based on their corre-sponding amino acid translations.
We removed from these two data sets all orthologssets with alignments shorter than 100 bp. The resulting2,263 STARortholog quintuplets had a mean length! standarderror (SE) of 1,335.7!29.0 bp (median! 1,092 bp; mode!942 bp), corresponding to 69.9!29.5% of theD. melanogaster gene length. The 1,007 WEBortholog quintu-plets had a mean length! SE of 1,575.1!29.8 bp
Drosophila suzukii Phylogenomics GBE
Genome Biol. Evol. 5(4):745–757. doi:10.1093/gbe/evt034 Advance Access publication March 15, 2013 747
by guest on April 28, 2013
http://gbe.oxfordjournals.org/D
ownloaded from
(median!1,275 bp; mode! 606 bp), corresponding to76.4!26.0% of the D. melanogaster gene length. Wefound that the results of our analyses did not change qualita-tively when based on STARorthologs or WEBorthologs. Thus, forease of presentation, and unless specified, we have presentedonly those obtained using the STARorthologs data set.
Analyses of the Rate of DNA and Protein Evolution
Rates of molecular evolution were analyzed for bothWEBorthologs and STARorthologs using PAML 4.4 (Yang2007). We estimated the rate of nonsynonymous substitution,dN (leading to amino acid changes), and synonymous substi-tution, dS (which should accumulate neutrally), over allbranches of the phylogenetic tree using the “free-ratio"model (M0’ [Yang 1998]; model! 1 and NSsites!0). Thismodel allows o! dN/dS, that is, the level of selective pressureexperienced by a gene, to vary among branches of the tree.Following the results of the phylogenetic analysis (see later),the input unrooted tree had the structure (D. melanogaster,(D. ananassae,(D. takahashi,(D. biarmipes,D. suzukii)))). Wethen used PAML to test different models of substitutionrates across coding sites (Yang and Nielsen 2000; Yanget al. 2000), with the aim of detecting genes that eitherevolved at a different rate or underwent positive selectionalong the D. suzukii lineage.
In the first test, we compared models that assumed one ormore substitution rates across the phylogeny. The first of suchmodels is the basic “one-ratio” branch model (M0), whichassumes a constant o across the phylogeny (model!0 andNSsites! 0). Following the manual recommendations, thismodel was used to get the branch lengths for each genetree, which were then copied into the tree structure file tobe used with the “branch and site” substitution models. Thelikelihood of the M0 model was compared with that of abranch model that assumed two o values, one for theD. suzukii branch (the so called foreground branch) and onefor the rest of the tree (the background branches; model! 2and NSsites! 0). Subsequently, the value of twice the differ-ence between the two likelihoods (2!l) was tested using a w2
test with 1 degree of freedom.The occurrence of positive selection was tested by the
branch–site test, which aimed at detecting positive selectionaffecting a few sites along the D. suzukii foreground branch.In this test (branch–site model A, test 2 (Yang et al. 2005), ocan vary both among sites in the protein and across brancheson the tree (model!2, NSsites! 2). As for the branch model,we used tree structures with branch lengths estimated bymodel M0. The null model fixed o2! 1 (fix_omega!1,omega! 1), whereas the positive selection model allowedo2>1 (fix_omega! 0, omega!1). The likelihood ratio testhad 1 degree of freedom. To account for multiple testing, wealso estimated the false discovery rate (FDR) of each test usingthe q value approach (Storey 2002) implemented in R
(R Development Core Team 2009). We note that the recipro-cal best-hit approach is prone to miss genes with high se-quence divergence, including those that underwentparticularly intense divergent adaptive evolution. Thus, wecould have missed targets of positive selection among oursequenced genes.
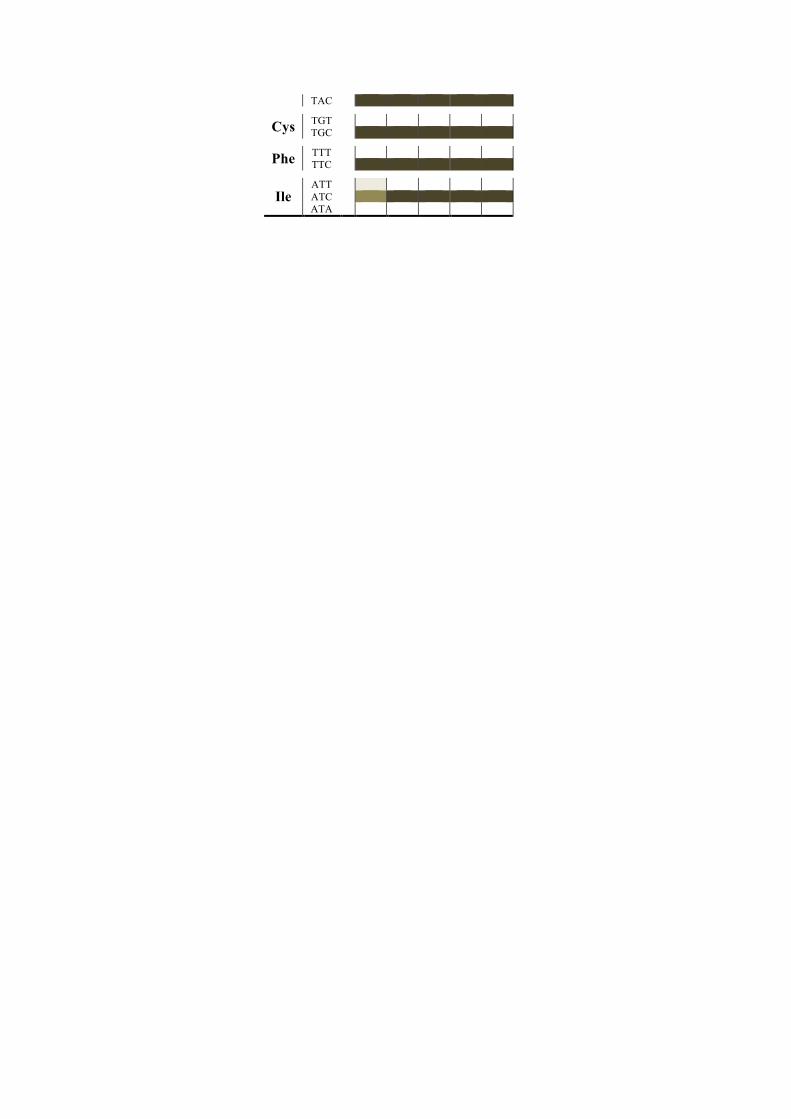
Codon Usage Analysis
We inferred preferred codons and codon usage bias inD. melanogaster, D. ananassae, D. takahashi, D. biarmipes,and D. suzukii in the genes of the STARorthologs groupswith more than 30 codons. We estimated codon bias usingthe effective number of codons, Nc (Wright 1990), and thefrequency of optimal codons, Fop (Ikemura 1981): Strongersynonymous codon usage bias is identified by larger Fopvalues and lower Nc values. Both indices were calculatedusing the program CodonW (http://codonw.sourceforge.net,last accessed April 3, 2013). Putative optimal (preferred)codons were identified as those that were significantly over-represented in the 5% of genes with highest and lowestusage frequencies (supplementary table S3, SupplementaryMaterial online). Base composition affected synonymouscodon usage, as shown by the strong correlation betweenGC and GC3 (GC in the third codon position) content andboth Nc and Fop (Spearman correlation, P< 10–16). Toremove the potential noise due to this correlation, we esti-mated a version of the effective number of codons, Nc0, whichaccounts for background nucleotide composition (Novembre2002). We also used in our analyses the residuals of theregression between GC3 content and Fop and Nc.
Transcriptome and mtDNA Data Sets for PhylogeneticAnalyses
We assembled a data set of 91 orthologous genes from thetranscriptomes of 21 Drosophila species including D. suzukii.Strict orthology within the complete set of D. melanogastergenes (Drosophila 12 Genomes Consortium et al. 2007) andthe other 20 transcriptomes was assessed using the reciprocalbest BLAST hits method. We first identified single copyWEBorthologs between D. melanogaster, D. biarmipes,D. bipectinata, D. elegans, D. eugracislis, D. ficusphila,D. kikkawai, D. rhopaloa, D. takahashi, and D. suzukii. Weidentified the masked alignments of all these WEBorthologsin the 12 Drosophila alignments (Drosophila 12 GenomesConsortium et al. 2007), thus selecting 97 groups of putativeorthologs. A few of these were removed after manual inspec-tion revealed that they contained incomplete, frame-shifted,and/or dubiously assembled sequences, leaving 91 highly re-liable ortholog groups. These were aligned using TranslatorXand concatenated into a superalignment of 200,475 bp,which was further inspected by eye and corrected for thecorrect frame of codons (inclusion of partial stop codons
Ometto et al. GBE
748 Genome Biol. Evol. 5(4):745–757. doi:10.1093/gbe/evt034 Advance Access publication March 15, 2013
by guest on April 28, 2013
http://gbe.oxfordjournals.org/D
ownloaded from
that altered the frame) and minor errors that escaped the firstmanual inspection.
We translated this alignment into amino acids and selectedconserved regions using Gblocks (Castresana 2000) with pa-rameters 1:11, 2:17, 3:8, 4:10, and 5:half). We retained 90%of the sites, totaling 60,757 amino acids. The final nucleotidealignment of 182,271 bp, perfectly corresponding to theamino acid alignment, was used for further sequence analysesexcluding third codon positions.
A mitochondrial genome alignment was constructed byextracting CDS from available and newly assembled (see ear-lier) mtDNA. The 12 CDS genes were checked for their correctcodon frame and concatenated. We also excluded thirdcodon positions from the mtDNA data set for further se-quence analyses.
Phylogenetic Analyses
We performed Bayesian and maximum likelihood (ML) analy-ses on both the transcriptomic and the mitochondrial genomicdata sets. For the Bayesian analyses, we used PhyloBayes3(Lartillot et al. 2009) setting two independent runs until themaxdiff was less than 0.1. We calculated the 50% majorityrule consensus trees by pulling sampled trees after a burn-inthat minimized the maxdiff statistic in PhyloBayes3. ML anal-yses were performed using Phyml (Guindon et al. 2010) on100 nonparametric bootstrapped replicates. In all cases, a dis-crete gamma distribution (with four rate categories) was usedto model among site rate variation. We performed three mainexperiments on both data sets using different data set treat-ments and models of replacement:
1. ML analyses on nucleotide alignments using all the three-codon position and a single nt-general time reversible(GTR) model for all codon positions (nucleotides positions1 + 2 + 3, GTR + G, ML in fig. 1).
2. Bayesian analyses on nucleotide alignments using the CATmodel after exclusion of the third codon position (nucleo-tide positions 1 + 2, CAT + G, Bayesian).
3. Bayesian analyses on the corresponding amino acid align-ments using a six-category Dayhoff recoding and theCAT + GTR model (amino acids-Dayhoff, CAT + GTR + G,Bayesian).
Molecular Clock Analyses
We performed two different molecular clock analyses. Wefirst used PhyloBayes (Lartillot et al. 2009) on both the tran-scriptomic and mitochondrial genomic data sets at the nucle-otide level. We employed a CIR process clock model and aGTR + G model of replacement on both data sets using thefixed tree topology of figure 1A. We constrained four nodesas in Prud’homme et al. (2006) using their suggested biogeo-graphical calibrations. To account for uncertainty in biogeo-graphical constrains, we allowed both minima and maxima tobe soft, thus allowing the posterior dates to be sampled
outside the set bounds (Yang and Rannala 2006). We em-ployed a root prior of 80 Ma with a permissive SD of 40Myr and assumed a birth–death process along all nodes. Wemodeled replacement using CAT and the clock using CIR as inRota-Stabelli, Daley, et al. (2013). In a second approach, weused BEAST (Drummond and Rambaut 2007) without con-straining internal nodes and the random local clock but onlya normally distributed root prior centered at 80 Ma with SD 20Myr. We assumed the initial mutation rate of 0.0346(SD!0.00281) suggested in Obbard et al. (2012). Becausemutation rate refers to unconstrained sites, we used onlythe 4-fold degenerate sites of the genomic data set for theBEAST analysis.
Field Monitoring and Trapping
Field trapping for tests of distribution by altitude were carriedout between 15 April (week 14) and 31 October (week 43)2011. Forty sites across Trento Province were chosen repre-senting both agricultural and natural ecosystems. Traps weredeployed on a large-scale altitudinal gradient and assigned tofour altitudinal ranges (<250 m asl [n! 10], 250–600 m asl[n!10], 600–1,000 m asl [n! 10],>1,000 m asl [n!10]). Ateach trapping site, we placed, in a shady spot, one plastictransparent bottle with multiple small lateral holes (diameterbetween 5 and 10 mm) containing 250 ml of apple cider vin-egar as bait. Weekly, traps were checked, insects collected,and vinegar replaced. Weekly captures of D. suzukii in eachtrap were averaged per altitudinal range.
Results
Genome, Transcriptome, Mitogenome, and WolbachiaSequencing
We sequenced and assembled a draft genome and transcrip-tome of D. suzukii from an Italian Alpine population. The draftgenome was sequenced to high depth (an average of 80"coverage) and comprises 49,558 contigs spanning a total of160 Mb. The draft transcriptome contains 25,810 unique se-quences. Both the size of the genome and its repetitive ele-ment content are comparable with that of D. melanogasterand other sequenced Drosophila (supplementary fig. S1, Sup-plementary Material online). We also assembled the nearlycomplete mitochondrial genome for D. suzukii (#15 kb),whose size and gene content is similar to that of other se-quenced Drosophila. Finally, we extracted and assembled thegenome of a Wolbachia endosymbiont (wSuzi, 1.3 Mb) har-bored by the Italian D. suzukii population. Preliminary analysesbased on several genes identify wSuzi as closely related to wRifrom D. simulans Riverside (Klasson et al. 2009). A more de-tailed characterization of wSuzi is presented in Siozios et al.(2013).
Drosophila suzukii Phylogenomics GBE
Genome Biol. Evol. 5(4):745–757. doi:10.1093/gbe/evt034 Advance Access publication March 15, 2013 749
by guest on April 28, 2013
http://gbe.oxfordjournals.org/D
ownloaded from
Molecular Phylogenetics Using Transcriptomic andmtDNA Data Sets
We used data from the D. suzukii genome to conduct a com-prehensive multi-locus phylogenetic and dating analysis in thecontext of genome data from 20 additional Drosophila spe-cies. We conducted two separate analyses using two distinctdata sets.
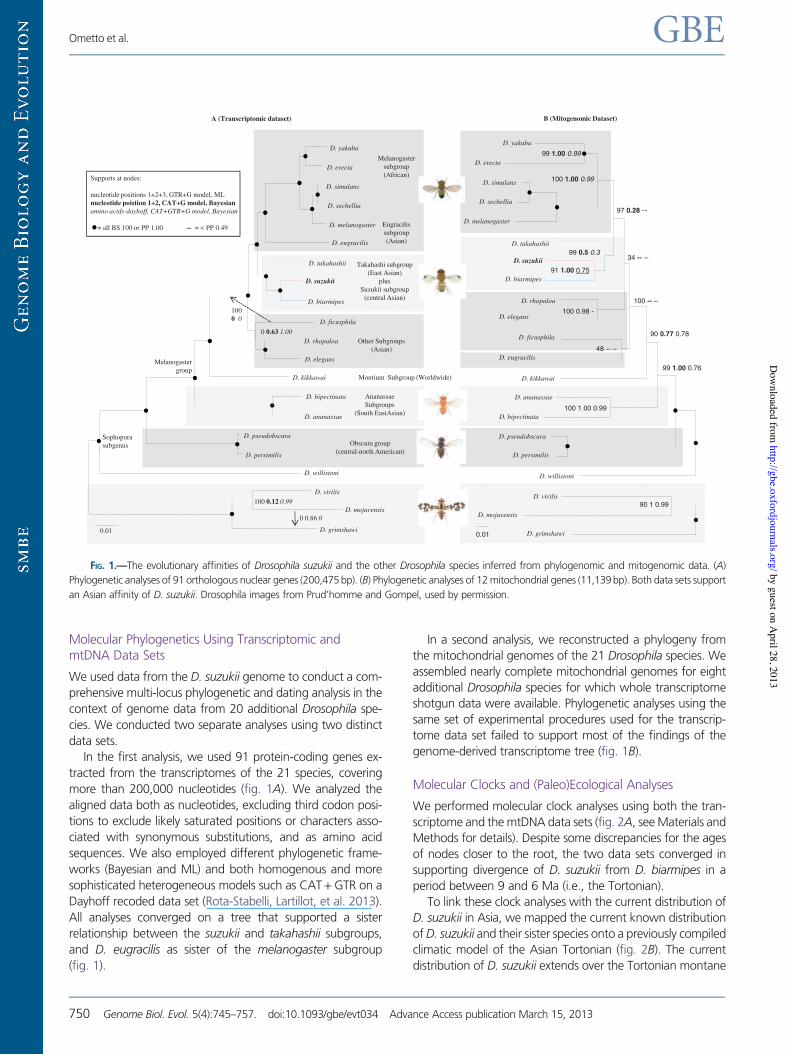
In the first analysis, we used 91 protein-coding genes ex-tracted from the transcriptomes of the 21 species, coveringmore than 200,000 nucleotides (fig. 1A). We analyzed thealigned data both as nucleotides, excluding third codon posi-tions to exclude likely saturated positions or characters asso-ciated with synonymous substitutions, and as amino acidsequences. We also employed different phylogenetic frame-works (Bayesian and ML) and both homogenous and moresophisticated heterogeneous models such as CAT + GTR on aDayhoff recoded data set (Rota-Stabelli, Lartillot, et al. 2013).All analyses converged on a tree that supported a sisterrelationship between the suzukii and takahashii subgroups,and D. eugracilis as sister of the melanogaster subgroup(fig. 1).
In a second analysis, we reconstructed a phylogeny fromthe mitochondrial genomes of the 21 Drosophila species. Weassembled nearly complete mitochondrial genomes for eightadditional Drosophila species for which whole transcriptomeshotgun data were available. Phylogenetic analyses using thesame set of experimental procedures used for the transcrip-tome data set failed to support most of the findings of thegenome-derived transcriptome tree (fig. 1B).
Molecular Clocks and (Paleo)Ecological Analyses
We performed molecular clock analyses using both the tran-scriptome and the mtDNA data sets (fig. 2A, see Materials andMethods for details). Despite some discrepancies for the agesof nodes closer to the root, the two data sets converged insupporting divergence of D. suzukii from D. biarmipes in aperiod between 9 and 6 Ma (i.e., the Tortonian).
To link these clock analyses with the current distribution ofD. suzukii in Asia, we mapped the current known distributionof D. suzukii and their sister species onto a previously compiledclimatic model of the Asian Tortonian (fig. 2B). The currentdistribution of D. suzukii extends over the Tortonian montane
0.01
D. elegans
D. eugracilis
D. mojavensis
D. melanogaster
D. yakuba
D. erecta
D. takahashii
D. kikkawai
D. suzukii
D. ananassae
D. willistoni
D. simulans
D. rhopaloa
D. bipectinata
D. persimilis
D. biarmipes
D. ficusphila
D. virilis
D. grimshawi
D. pseudobscura
D. sechellia
100 0.12 0.99
Supports at nodes:
nucleotide positions 1+2+3, GTR+G model, MLnucleotide poistion 1+2, CAT+G model, Bayesianamino acids-dayhoff, CAT+GTR+G model, Bayesian
= all BS 100 or PP 1.00 -- = < PP 0.49
0 0.63 1.00
0 0.86 0
100 0 0
Melanogaster subgroup (African)
Eugracilissubgroup (Asian)
Takahashi subgroup (East Asian)
plusSuzukii subgroup
(central Asian)
Other Subgroups (Asian)
Obscura group (central-north American)
Melanogaster group
Ananassae Subgroups
(South EastAsian)
Montium Subgroup (Worldwide)
A (Transcriptomic dataset) B (Mitogenomic Dataset)
0.01
99 1.00 0.99
99 0.5 0.3
100 0.98 -
90 1 0.99
90 0.77 0.78
48 -- --
91 1.00 0.75
97 0.28 --
99 1.00 0.76
100 -- --
34 -- --
D. eugracilis
D. melanogaster
D. yakuba
D. erecta
D. simulans
D. sechellia
D. takahashii
D. suzukii
D. biarmipes
D. elegans
D. rhopaloa
D. ficusphila
D. kikkawai
D. ananassae
D. bipectinata
D. persimilis
D. pseudobscura
D. mojavensis
D. willistoni
D. virilis
D. grimshawi
100 1.00 0.99
100 1.00 0.99
Sophoporasubgenus
FIG. 1.—The evolutionary affinities of Drosophila suzukii and the other Drosophila species inferred from phylogenomic and mitogenomic data. (A)
Phylogenetic analyses of 91 orthologous nuclear genes (200,475 bp). (B) Phylogenetic analyses of 12 mitochondrial genes (11,139bp). Both data sets support
an Asian affinity of D. suzukii. Drosophila images from Prud’homme and Gompel, used by permission.
Ometto et al. GBE
750 Genome Biol. Evol. 5(4):745–757. doi:10.1093/gbe/evt034 Advance Access publication March 15, 2013
by guest on April 28, 2013
http://gbe.oxfordjournals.org/D
ownloaded from
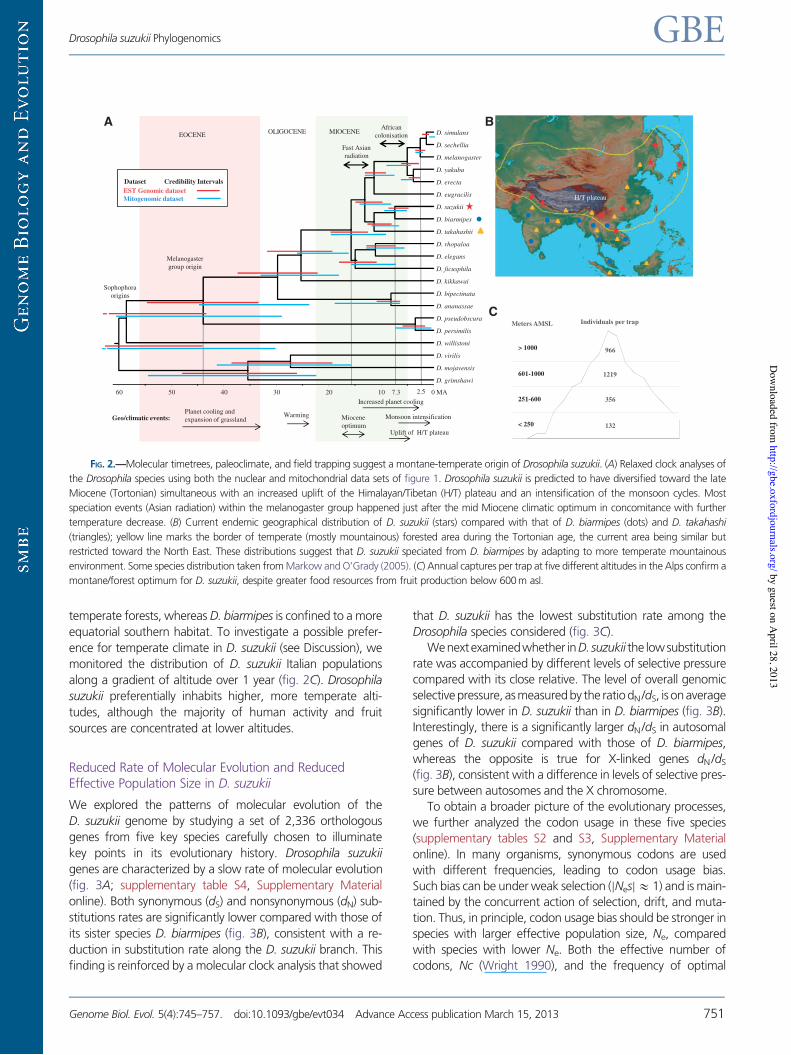
temperate forests, whereas D. biarmipes is confined to a moreequatorial southern habitat. To investigate a possible prefer-ence for temperate climate in D. suzukii (see Discussion), wemonitored the distribution of D. suzukii Italian populationsalong a gradient of altitude over 1 year (fig. 2C). Drosophilasuzukii preferentially inhabits higher, more temperate alti-tudes, although the majority of human activity and fruitsources are concentrated at lower altitudes.
Reduced Rate of Molecular Evolution and ReducedEffective Population Size in D. suzukii
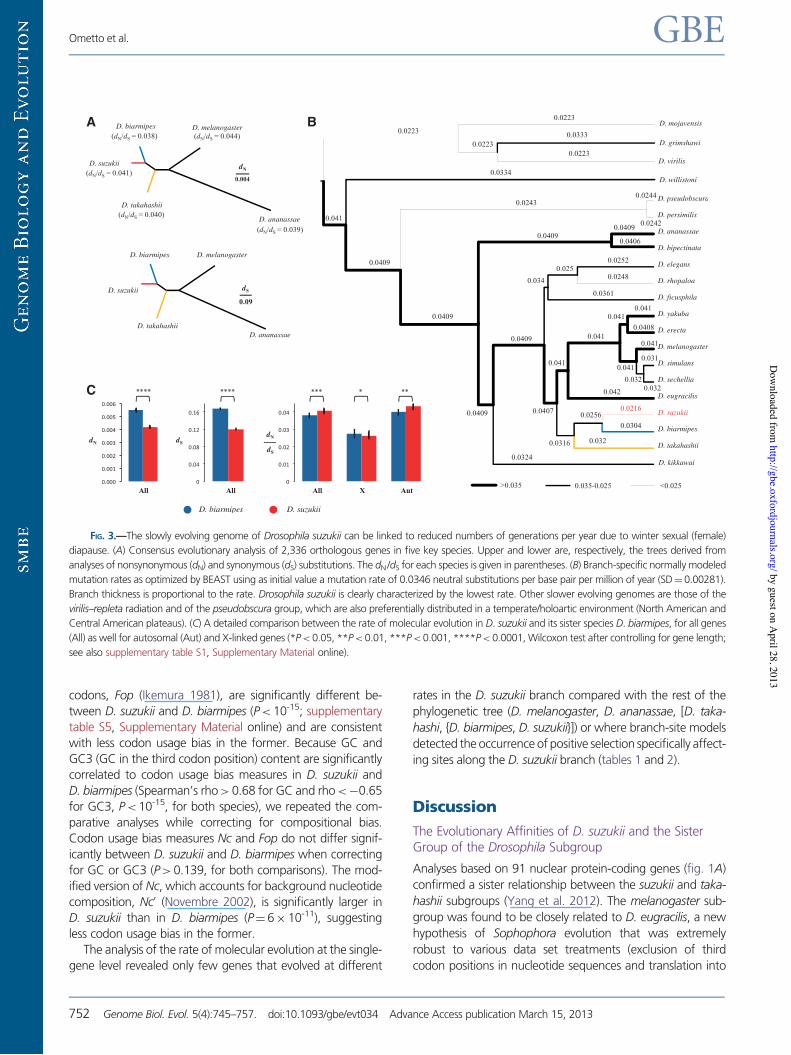
We explored the patterns of molecular evolution of theD. suzukii genome by studying a set of 2,336 orthologousgenes from five key species carefully chosen to illuminatekey points in its evolutionary history. Drosophila suzukiigenes are characterized by a slow rate of molecular evolution(fig. 3A; supplementary table S4, Supplementary Materialonline). Both synonymous (dS) and nonsynonymous (dN) sub-stitutions rates are significantly lower compared with those ofits sister species D. biarmipes (fig. 3B), consistent with a re-duction in substitution rate along the D. suzukii branch. Thisfinding is reinforced by a molecular clock analysis that showed
that D. suzukii has the lowest substitution rate among theDrosophila species considered (fig. 3C).
Wenextexaminedwhether inD. suzukii the lowsubstitutionrate was accompanied by different levels of selective pressurecompared with its close relative. The level of overall genomicselective pressure, asmeasuredby the ratiodN/dS, is onaveragesignificantly lower in D. suzukii than in D. biarmipes (fig. 3B).Interestingly, there is a significantly larger dN/dS in autosomalgenes of D. suzukii compared with those of D. biarmipes,whereas the opposite is true for X-linked genes dN/dS
(fig. 3B), consistent with a difference in levels of selective pres-sure between autosomes and the X chromosome.
To obtain a broader picture of the evolutionary processes,we further analyzed the codon usage in these five species(supplementary tables S2 and S3, Supplementary Materialonline). In many organisms, synonymous codons are usedwith different frequencies, leading to codon usage bias.Such bias can be under weak selection (jNesj& 1) and is main-tained by the concurrent action of selection, drift, and muta-tion. Thus, in principle, codon usage bias should be stronger inspecies with larger effective population size, Ne, comparedwith species with lower Ne. Both the effective number ofcodons, Nc (Wright 1990), and the frequency of optimal
< 250
251-600
601-1000
> 1000
132
356
966
1219
Individuals per trapMeters AMSL
A
C
Sophophora origins
Increased planet coolingPlanet cooling and expansion of grassland
Fast Asian radiation
MIOCENEOLIGOCENEEOCENE
0 MA102030405060
D. bipectinata
D. mojavensis
D. yakuba
D. pseudobscura
D. rhopaloa
D. suzukii
D. biarmipes
D. takahashii
D. melanogaster
D. ananassae
D. sechellia
D. elegans
D. eugracilis
D. kikkawai
D. ficusphila
D. simulans
D. persimilis
D. grimshawi
D. virilis
D. erecta
D. willistoni
Melanogaster group origin
Warming
African colonisation
Monsoon intensificationMiocene optimum
Geo/climatic events:
Uplift of H/T plateau
7.3 2.5
EST Genomic dataset Mitogenomic dataset
Dataset Credibility Intervals
B
H/T plateau
FIG. 2.—Molecular timetrees, paleoclimate, and field trapping suggest a montane-temperate origin of Drosophila suzukii. (A) Relaxed clock analyses of
the Drosophila species using both the nuclear and mitochondrial data sets of figure 1. Drosophila suzukii is predicted to have diversified toward the late
Miocene (Tortonian) simultaneous with an increased uplift of the Himalayan/Tibetan (H/T) plateau and an intensification of the monsoon cycles. Most
speciation events (Asian radiation) within the melanogaster group happened just after the mid Miocene climatic optimum in concomitance with further
temperature decrease. (B) Current endemic geographical distribution of D. suzukii (stars) compared with that of D. biarmipes (dots) and D. takahashi
(triangles); yellow line marks the border of temperate (mostly mountainous) forested area during the Tortonian age, the current area being similar but
restricted toward the North East. These distributions suggest that D. suzukii speciated from D. biarmipes by adapting to more temperate mountainous
environment. Some species distribution taken from Markow and O’Grady (2005). (C) Annual captures per trap at five different altitudes in the Alps confirm a
montane/forest optimum for D. suzukii, despite greater food resources from fruit production below 600 m asl.
Drosophila suzukii Phylogenomics GBE
Genome Biol. Evol. 5(4):745–757. doi:10.1093/gbe/evt034 Advance Access publication March 15, 2013 751
by guest on April 28, 2013
http://gbe.oxfordjournals.org/D
ownloaded from
codons, Fop (Ikemura 1981), are significantly different be-tween D. suzukii and D. biarmipes (P< 10-15; supplementarytable S5, Supplementary Material online) and are consistentwith less codon usage bias in the former. Because GC andGC3 (GC in the third codon position) content are significantlycorrelated to codon usage bias measures in D. suzukii andD. biarmipes (Spearman’s rho> 0.68 for GC and rho<$0.65for GC3, P<10-15, for both species), we repeated the com-parative analyses while correcting for compositional bias.Codon usage bias measures Nc and Fop do not differ signif-icantly between D. suzukii and D. biarmipes when correctingfor GC or GC3 (P>0.139, for both comparisons). The mod-ified version of Nc, which accounts for background nucleotidecomposition, Nc0 (Novembre 2002), is significantly larger inD. suzukii than in D. biarmipes (P! 6"10-11), suggestingless codon usage bias in the former.
The analysis of the rate of molecular evolution at the single-gene level revealed only few genes that evolved at different
rates in the D. suzukii branch compared with the rest of thephylogenetic tree (D. melanogaster, D. ananassae, [D. taka-hashi, {D. biarmipes, D. suzukii}]) or where branch-site modelsdetected the occurrence of positive selection specifically affect-ing sites along the D. suzukii branch (tables 1 and 2).
Discussion
The Evolutionary Affinities of D. suzukii and the SisterGroup of the Drosophila Subgroup
Analyses based on 91 nuclear protein-coding genes (fig. 1A)confirmed a sister relationship between the suzukii and taka-hashii subgroups (Yang et al. 2012). The melanogaster sub-group was found to be closely related to D. eugracilis, a newhypothesis of Sophophora evolution that was extremelyrobust to various data set treatments (exclusion of thirdcodon positions in nucleotide sequences and translation into
A
C
B
FIG. 3.—The slowly evolving genome of Drosophila suzukii can be linked to reduced numbers of generations per year due to winter sexual (female)
diapause. (A) Consensus evolutionary analysis of 2,336 orthologous genes in five key species. Upper and lower are, respectively, the trees derived from
analyses of nonsynonymous (dN) and synonymous (dS) substitutions. The dN/dS for each species is given in parentheses. (B) Branch-specific normally modeled
mutation rates as optimized by BEAST using as initial value a mutation rate of 0.0346 neutral substitutions per base pair per million of year (SD! 0.00281).
Branch thickness is proportional to the rate. Drosophila suzukii is clearly characterized by the lowest rate. Other slower evolving genomes are those of the
virilis–repleta radiation and of the pseudobscura group, which are also preferentially distributed in a temperate/holoartic environment (North American and
Central American plateaus). (C) A detailed comparison between the rate of molecular evolution in D. suzukii and its sister species D. biarmipes, for all genes
(All) as well for autosomal (Aut) and X-linked genes (*P< 0.05, **P< 0.01, ***P< 0.001, ****P< 0.0001, Wilcoxon test after controlling for gene length;
see also supplementary table S1, Supplementary Material online).
Ometto et al. GBE
752 Genome Biol. Evol. 5(4):745–757. doi:10.1093/gbe/evt034 Advance Access publication March 15, 2013
by guest on April 28, 2013
http://gbe.oxfordjournals.org/D
ownloaded from

the corresponding amino acid sequences) and experimentalprocedures (use of homogenous and heterogeneous substi-tution models in both a Bayesian and ML framework; seelegend of fig. 1A). Not all relationships were well resolvedusing this large data set. The placement of D. ficusphila isdata set and model dependent, but the use of the sophisti-cated CAT + GTR model coupled with Dayhoff recoding of theamino acid data set (performed to reduce possible systematicerrors in phylogenomic analyses; Rota-Stabelli, Lartillot, et al.2013) points toward its grouping with D. rhopaloa andD. elegans.
To corroborate our phylogenetic results, we further ana-lyzed an mtDNA data set, which failed to support all the find-ings of the nuclear gene set tree (fig. 2B). This is most likelybecause of a lack of phylogenetic signal in the mtDNA. Thus,the apparently robust bootstrap support (97%) against thesister relationship D. eugracilis-melanogaster subgroupvanishes when highly saturated third codon positions are ex-cluded, or when an amino acid data set was employed, indi-cating that signal contradicting the nuclear phylogeny carriedby mitochondrial genomes is concentrated in unreliable third
codon positions and/or synonymous substitutions. Overall, ourphylogenetic analyses reveal that the African melanogastersubgroup evolved from within a rapid Asian radiation, identi-fying D. eugracilis as a key intermediate species to polarizeevolutionary traits of the melanogaster subgroup. Withrespect to the placement of D. suzukii in the phylogeny, ouranalyses suggest that this species is the sister taxon ofD. biarmipes. Drosophila subpulchrella, another little-studiedfly in the suzukii subgroup, has been reported to have feedingbehavior similar to that of D. suzukii (Mitsui et al. 2010). Thisspecies is, however, thought to be most closely related toD. pulchrella (hence its name), which is sister to the suzu-kii + biarmipes clade (Yang et al. 2012), suggesting indepen-dent acquisition of unripe fruit feeding. It will be important toexplore the relationships of D. subpulchrella using genome-scale data.
Rate of Molecular Evolution Suggests Winter Diapause
Our results indicate that gene sequences evolve at a signifi-cantly lower rate in D. suzukii than in its sister speciesD. biarmpes (fig. 3 and table 1). We hypothesize that the
Table 1
Top 10 Genes Identified as Putative Target of Positive Selection along the Drosophila suzukii Branch
Drosophila
melanogaster
Ortholog
Pa q Valueb p2c u2
d Function and Phenotype (Sexual, Neuronal, Thorax)
Cyp4d20 7" 10$13 8" 10$10 0.0026 15.2 Predicted electron carrier activity. Protein with features of Cytochrome P450.
Expression at moderate levels in the following postembryonic organs or tis-
sues: adult head, adult eye, adult heart, adult spermathecae, and adult car-
cass.
endos 0.00085 0.27948 0.0200 999.0 Predicted sulfonylurea receptor binding activity. Involved in regulation of meiotic
cell cycle, mitotic spindle organization, oogenesis, water homeostasis, and re-
sponse to nutrient. Phenotypically relevant in egg, oocyte, and follicle cell.
Ptp4E 0.00103 0.29554 0.0048 999.0 Predicted transmembrane receptor protein tyrosine phosphatase activity.
Involved in motor axon guidance, central nervous system development, and
open tracheal system development. Phenotypically relevant in ventral nerve
cord.
T48 0.00134 0.33996 0.0084 999.0 Unknown molecular function. Phenotypically relevant in ventral furrow.
CG15626 0.00157 0.36001 0.0030 693.7 Unknown molecular and biological function.
Cyp4aa1 0.00199 0.39060 0.0024 999.0 Predicted electron carrier activity. Involved in insecticide catabolic and hormone
metabolic processes.
Osi20 0.00205 0.39060 0.0078 747.8 Unknown molecular and biological function. Phenotypically relevant in trichogen
cell.
CG13397 0.00271 0.47676 0.0024 200.4 Predicted alpha-N-acetylglucosaminidase activity. Protein domains suggest in-
volvement in carbohydrate metabolic process.
yemalpha 0.00351 0.52651 0.0022 135.4 DNA binding activity. Involved in female meiosis. Phenotypically relevant in
oocyte.
toe 0.00358 0.52651 0.0123 70.3 Predicted molecular function is sequence-specific DNA-binding transcription
factor activity. Involved in compound eye development and negative regula-
tion of transcription from RNA polymerase II promoter. Phenotypically relevant
in scutum and scutellum (mesothoracic tergum).
aLikelihood ratio test probability based on branch–site models of codon evolution, with D. suzukii set as foreground branch.bProportion of false positives (FDR) of the test.cProportion of sites under positive selection estimated in the foreground branch (D. suzukii) by the branch–site model A.do estimated for the sites under positive selection in the foreground branch (D. suzukii) by the branch–site model A.
Drosophila suzukii Phylogenomics GBE
Genome Biol. Evol. 5(4):745–757. doi:10.1093/gbe/evt034 Advance Access publication March 15, 2013 753
by guest on April 28, 2013
http://gbe.oxfordjournals.org/D
ownloaded from
low substitution rate of D. suzukii could be due to an idiosyn-cratic, low mutation rate, and/or because the species has areduced number of generations per year compared with itsrelatives. The reproductive ecology of the species supports thesecond hypothesis, as in its distributional range D. suzukii re-produces only during the warm season and is able to over-winter as sexually immature, cold tolerant females (Mitsuiet al. 2010). Our genomic evidence supports the hypothesisthat D. suzukii has a winter sexual diapause and thus had areduced number of generations since its last common ances-tor with D. biarmipes.
Reduced Effective Population Size Affects the Efficiencyof Positive Selection in D. suzukii
The level of overall genomic selective pressures, as measuredby the ratio dN/dS, is lower in D. suzukii than in D. biarmipes(fig. 2B). This result is consistent with more relaxed selectionalong the D. suzukii lineage, possibly because this species hasa smaller effective population size, Ne, than D. biarmipes. A
reduced Ne would allow the fixation of larger number ofslightly deleterious nonsynonymous mutations (Charlesworth2009), as further supported by the observation that D. suzukiihas a lower frequency of optimal codons and a lower codonusage bias than D. biarmipes (supplementary tables S2 and S3,Supplementary Material online). The alternative possibility thatlarger dN/dS values correspond to pervasive positive selectionin the D. suzukii genome (i.e., increased fixation of beneficialmutations) is not supported by our data. First, the fixation offavorable alleles in multiple genes would lead to a high dis-persion in the distribution of dN across the genome (Presgraves2005), whereas the variance in dN is significantly lower inD. suzukii than in D. biarmipes (2.9"10-5 vs. 4.4"10$5, Ftest P< 10-15). Second, only a few genes were detected assignificant targets of positive selection in D. suzukii (table 1).Thus, the most likely explanation for the low substitution rateof D. suzukii is a reduced number of generations per year anda smaller Ne compared with its relatives. It is unlikely that thereduced Ne is a direct consequence of the bottleneck
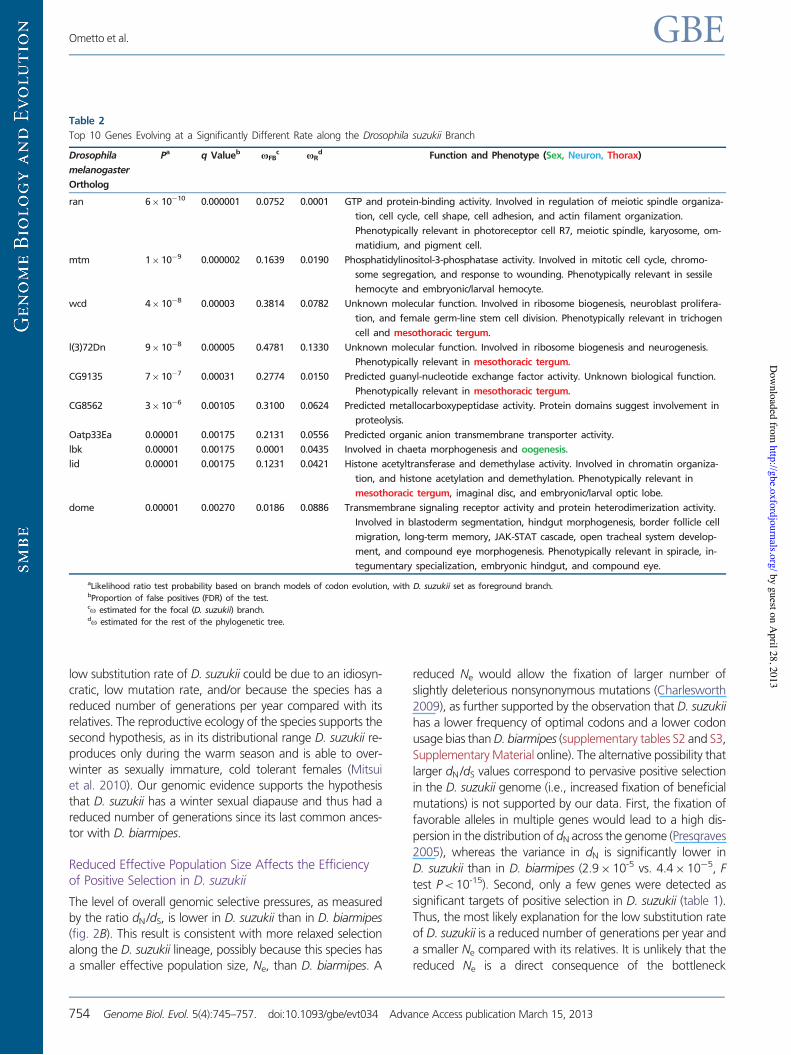
Table 2
Top 10 Genes Evolving at a Significantly Different Rate along the Drosophila suzukii Branch
Drosophila
melanogaster
Ortholog
Pa q Valueb uFBc uR
d Function and Phenotype (Sex, Neuron, Thorax)
ran 6" 10$10 0.000001 0.0752 0.0001 GTP and protein-binding activity. Involved in regulation of meiotic spindle organiza-
tion, cell cycle, cell shape, cell adhesion, and actin filament organization.
Phenotypically relevant in photoreceptor cell R7, meiotic spindle, karyosome, om-
matidium, and pigment cell.
mtm 1" 10$9 0.000002 0.1639 0.0190 Phosphatidylinositol-3-phosphatase activity. Involved in mitotic cell cycle, chromo-
some segregation, and response to wounding. Phenotypically relevant in sessile
hemocyte and embryonic/larval hemocyte.
wcd 4" 10$8 0.00003 0.3814 0.0782 Unknown molecular function. Involved in ribosome biogenesis, neuroblast prolifera-
tion, and female germ-line stem cell division. Phenotypically relevant in trichogen
cell and mesothoracic tergum.
l(3)72Dn 9" 10$8 0.00005 0.4781 0.1330 Unknown molecular function. Involved in ribosome biogenesis and neurogenesis.
Phenotypically relevant in mesothoracic tergum.
CG9135 7" 10$7 0.00031 0.2774 0.0150 Predicted guanyl-nucleotide exchange factor activity. Unknown biological function.
Phenotypically relevant in mesothoracic tergum.
CG8562 3" 10$6 0.00105 0.3100 0.0624 Predicted metallocarboxypeptidase activity. Protein domains suggest involvement in
proteolysis.
Oatp33Ea 0.00001 0.00175 0.2131 0.0556 Predicted organic anion transmembrane transporter activity.
lbk 0.00001 0.00175 0.0001 0.0435 Involved in chaeta morphogenesis and oogenesis.
lid 0.00001 0.00175 0.1231 0.0421 Histone acetyltransferase and demethylase activity. Involved in chromatin organiza-
tion, and histone acetylation and demethylation. Phenotypically relevant in
mesothoracic tergum, imaginal disc, and embryonic/larval optic lobe.
dome 0.00001 0.00270 0.0186 0.0886 Transmembrane signaling receptor activity and protein heterodimerization activity.
Involved in blastoderm segmentation, hindgut morphogenesis, border follicle cell
migration, long-term memory, JAK-STAT cascade, open tracheal system develop-
ment, and compound eye morphogenesis. Phenotypically relevant in spiracle, in-
tegumentary specialization, embryonic hindgut, and compound eye.
aLikelihood ratio test probability based on branch models of codon evolution, with D. suzukii set as foreground branch.bProportion of false positives (FDR) of the test.co estimated for the focal (D. suzukii) branch.do estimated for the rest of the phylogenetic tree.
Ometto et al. GBE
754 Genome Biol. Evol. 5(4):745–757. doi:10.1093/gbe/evt034 Advance Access publication March 15, 2013
by guest on April 28, 2013
http://gbe.oxfordjournals.org/D
ownloaded from

associated with a colonization of Europe, as the invasiontook place only few generations ago (the first recorddates back to 2008, Cini et al. 2012), and thus the genome-wide pattern of substitutions should represent that of the an-cestral population. We propose instead that the low substitu-tion rate reflects the ecology and evolutionary history of thisspecies. The winter diapause, we suggest, explains both thelow substitution rate and the reduced selection efficiency inD. suzukii compared with D. biarmipes. Overwintering dia-pause results in recurrent population size bottlenecks, particu-larly for males, and thus in a lower effective population size Ne,and lower selection efficiency in removing slightly deleteriousnonsynonymous mutations, as indicated by its genome-widehigher dN/dS.
The hypothesis that males undergo more severe bottle-necks than females is supported by the discrepancy in levelsof selective pressure between the autosomes and the X chro-mosome. As males contain only one copy of X (and two of theautosomes), sex-biased population size changes would alterrelative levels of X-linked and autosomal Ne, namely by de-creasing Ne of autosomes 2-fold relative to X chromosome inmales. We indeed observed a significantly larger dN/dS in au-tosomal genes of D. suzukii than of D. biarmipes, whereas inX-linked genes, dN/dS was lower in D. suzukii than inD. biarmipes (fig. 3B). If we assume that levels of dN/dS area proxy for effective population size, the X/autosome ratio ofNe values, NeX/NeA, seems to be higher in D. suzukii than inD. biarmipes, possibly leading to differences in the efficiencyof selection on the X and autosomes between the two species.One hypothesis to explain this observation is a difference inthe efficiency of purifying selection in removing recessive del-eterious mutations in hemizygous males, a phenomenonwhich can often lead to a faster-X effect (Charlesworthet al. 1987; Vicoso and Charlesworth 2009a). Thus, the bot-tlenecks associated with the winter diapause of D. suzukiicould be directly responsible for the relative difference inNeX/NeA between the two species (Pool and Nielsen 2007).Other factors that may have affected the differences in theratio NeX/NeA between D. suzukii and D. biarmipes includedifferent recombination rates (Vicoso and Charlesworth2009b) and variance in male reproductive success due tosexual competition among males (Andersson 1994; seeMank et al. 2010 for a review). Additional genetic and behav-ioral studies will be necessary to disentangle these forces andevaluate their role in the evolution of D. suzukii.
Paleobiology and Adaptation to Temperate Ecology
The presence of a winter diapause in D. suzukii may be anadaptation that is relevant to the switch in ecology of thespecies. Relaxed clock studies of both nuclear and mitochon-drial genomes (fig. 2A) converged on a scenario in whichD. suzukii diverged from D. biarmipes approximately 9–6Ma, toward the end of the Miocene (Tortonian). Climate
modeling has shown that, during the Tortonian, the ecologyof region between North India, Indochina, and the Chinesecoasts (delineated by the yellow line in fig. 2B) was character-ized by extended montane temperate forests. Toward thepresent, forests reduced in extent to the North and East andalternated with scrublands or tropical forests (Pound et al.2011). The present endemic distribution of D. suzukii extendsover this region, whereas D. biarmipes is endemic to a moreequatorial, southern habitat. The distribution of the two spe-cies suggests that speciation of D. suzukii was accompanied byadaptation to temperate habitats, through the increased upliftof the Tibetean plateau and the concomitant intensifi-cation of the monsoon regime in the Tortonian (Zachoset al. 2001).
A strong preference for montane temperate climate in cur-rent invasive populations is supported by the results of trap-ping surveys. Although extensive soft fruit production isconcentrated below 600 m asl in the surveyed TrentinoProvince of North Italy, the majority of the captures wemade were at higher altitudes (fig. 2C). The proposal thatD. suzukii originated in a temperate, montane ecology is con-gruent with its current life habit. In temperate forests, fruitproduction, and thus the availability of rotting fruit, is highlyseasonal, whereas in the tropics fruiting, and thus the produc-tion of rotted food sources, is near-continuous (Willson 1991;Ting et al. 2008). For a species occupying a temperate ecosys-tem, ovipositing in fresh fruit is required to access food.Growing larvae can then accelerate decay and fermentationto provide food for the adult stage. Overwintering diapausebridges the winter months when fruits are scarce if notabsent, and low temperatures limit both fermentation andfly activity.
Preadaptations Suggest Invasive Success
An innate predisposition to temperate climates might also ex-plain why D. suzukii was able to invade European and NorthAmerican regions so rapidly. Drosophila melanogaster has alsoinvaded temperate climates, but the colonization originatedfrom an ancestral tropical African range and was accompa-nied by local adaptation (Ometto et al. 2005), whereas invad-ing populations of D. suzukii are likely to have already hadmany traits adaptive in the newly occupied range. Genesunder positive selection (table 1) and those with fast evolu-tionary rates (table 2) are good candidates for loci involved insuch adaptations. We found no evidence for a significantoverrepresentation of Gene Ontology-defined functional clas-ses in these gene sets, but many of the identified genes arephenotypically linked (through their D. melanogasterorthologs) with biology of the genitalia, the neuronal systemand (particularly and unexpectedly) with the mesothoracictergum.
The genetic and neurological bases of the adaptive beha-vioral and lifecycle traits of D. suzukii may hold the keys to
Drosophila suzukii Phylogenomics GBE
Genome Biol. Evol. 5(4):745–757. doi:10.1093/gbe/evt034 Advance Access publication March 15, 2013 755
by guest on April 28, 2013
http://gbe.oxfordjournals.org/D
ownloaded from
understanding the origin of a novel behavioral repertoire andlead to strategies for control of this pest in western countries.Because the current hypothesis of the phylogeny within thesuzukii subgroup has not yet been confirmed by whole-ge-nome phylogenetics, we cannot exclude the possibility thatD. subpulchrella is sister to D. suzukii rather than D. pulchrella.Under this scenario, some adaptations currently modeled asarising within D. suzukii may in fact be shared withD. subpulchrella. Genome sequencing of D. subpulchrellawill clarify this question. Our evolutionary analyses of theD. suzukii genome suggest an intriguing causal link betweenadaptation to temperate environments and its particular biol-ogy. The genetic bases of adaptation to temperature could bea key factor to develop new pesticides or containment strat-egies for this pest.
Supplementary MaterialSupplementary figures S1–S3 and tables S1–S5 are availableat Genome Biology and Evolution online (http://www.gbe.oxfordjournals.org).
AcknowledgmentsThe authors acknowledge the Baylor College of MedicineHuman Genome Sequencing Center and the NHGRI for pre-publication access to their data and staff of the GenePool fortheir support. They thank Darren Obbard for thorough com-ments on the manuscript. Computational analyses were per-formed using the infrastructures of the Foundation EdmundMach (FEM), Foundation Bruno Kessler (FBK), and the NUIMaynooth High Performance Computing (HPC). O.R.-S. issupported by a Marie Curie/Trento Province Cofound FP7 fel-lowship. The GenePool is supported by the UK MRC (MR/K001744/1) and NERC (R8/H10/56). This project was fundedby Accordo di Porgamma of the Autonomous Province ofTrento.
Literature CitedAbascal F, Zardoya R, Telford MJ. 2010. TranslatorX: multiple alignment of
nucleotide sequences guided by amino acid translations. Nucleic AcidsRes. 38:W7–W13.
Andersson M. 1994. Sexual selection. Princeton (NJ): Princeton UniversityPress.
Camacho C, et al. 2009. BLAST+: architecture and applications. BMCBioinformatics 10:421.
Castresana J. 2000. Selection of conserved blocks from multiple align-ments for their use in phylogenetic analysis. Mol Biol Evol. 17:540–552.
Charlesworth B. 2009. Effective population size and patterns of molecularevolution and variation. Nat Rev Genet. 10:195–205.
Charlesworth B, Coyne JA, Barton NH. 1987. The relative rates of evolu-tion of sex chromosomes and autosomes. Am Nat. 130:113–146.
Cini A, Ioriatti C, Anfora G. 2012. A review of the invasion of Drosophilasuzukii in Europe and a draft research agenda for integrated pestmanagement. Bull Insectol. 65:149–160.
David JR, Capy P. 1988. Genetic variation of Drosophila melanogasternatural populations. Trends Genet. 4:106–111.
Dreves AJ. 2011. IPM program development for an invasive pest: coordi-nation, outreach and evaluation. Pest Manag Sci. 67:1403–1410.
Drosophila 12 Genomes Consortium, et al. 2007. Evolution of genes andgenomes on the Drosophila phylogeny. Nature 450:203–218.
Drummond AJ, Rambaut A. 2007. BEAST: Bayesian evolutionary analysisby sampling trees. BMC Evol Biol. 7:214.
Edgar RC. 2004. MUSCLE: multiple sequence alignment with high accu-racy and high throughput. Nucleic Acids Res. 32:1792–1797.
Guindon S, et al. 2010. New algorithms and methods to estimate maxi-mum-likelihood phylogenies: assessing the performance of PhyML3.0. Syst Biol. 59:307–321.
Huang X, Madan A. 1999. CAP3: a DNA sequence assembly program.Genome Res. 9:868–877.
Ikemura T. 1981. Correlation between the abundance of Escherichia colitransfer RNAs and the occurrence of the respective codons in its pro-tein genes: a proposal for a synonymous codon choice that is optimalfor the E. coli translational system. J Mol Biol. 151:389–409.
Jurka J, et al. 2005. Repbase update, a database of eukaryotic repetitiveelements. Cytogenet Genome Res. 110:462–467.
Klasson L, et al. 2009. The mosaic genome structure of the Wolbachia wRistrain infecting Drosophila simulans. Proc Natl Acad Sci U S A. 106:5725–5730.
Kurtz S, Narechania A, Stein JC, Ware D. 2008. A new method to computeK-mer frequencies and its application to annotate large repetitive plantgenomes. BMC Genomics 9:517.
Lartillot N, Lepage T, Blanquart S. 2009. PhyloBayes 3: a Bayesian softwarepackage for phylogenetic reconstruction and molecular dating.Bioinformatics 25:2286–2288.
Li W, Godzik A. 2006. Cd-hit: a fast program for clustering and comparinglarge sets of protein or nucleotide sequences. Bioinformatics 22:1658–1659.
Loytynoja A, Goldman N. 2008. A model of evolution and structure formultiple sequence alignment. Philos Trans R Soc Lond B Biol Sci. 363:3913–3919.
Mank JE, Vicoso B, Berlin S, Charlesworth B. 2010. Effective populationsize and the Faster-X effect: empirical results and their interpretation.Evolution 64:663–674.
Markow TA, O’Grady P. 2005. Drosophila: a guide to species identificationand use. London: Elsevier.
Mitsui H, Beppu K, Kimura MT. 2010. Seasonal life cycles and resourceuses of flower- and fruit-feeding drosophilid flies (Diptera:Drosophilidae) in central Japan. Entomol Sci. 13:60–67.
Novembre JA. 2002. Accounting for background nucleotide compositionwhen measuring codon usage bias. Mol Biol Evol. 19:1390–1394.
Obbard DJ, et al. 2012. Estimating divergence dates and substitution ratesin the Drosophila phylogeny. Mol Biol Evol. 29:3459–3473.
Ometto L, Glinka S, de Lorenzo D, Stephan W. 2005. Inferring the effectsof demography and selection on Drosophila melanogaster populationsfrom a chromosome-wide scan of DNA variation. Mol Biol Evol. 22:2119–2130.
Pound MJ, et al. 2011. A Tortonian (Late Miocene, 11.61–7.25 Ma) globalvegetation reconstruction. Palaeogeogr Palaeoclimatol Palaeoecol.300:29–45.
Pool JE, Nielsen R. 2007. Population size changes reshape genomic pat-terns of diversity. Evolution 61:3001–3006.
Presgraves DC. 2005. Recombination enhances protein adaptation inDrosophila melanogaster. Curr Biol. 15:1651–1656.
Prud’homme B, et al. 2006. Repeated morphological evolution throughcis-regulatory changes in a pleiotropic gene. Nature 440:1050–1053.
R Development Core Team. 2009. R: a language and environment forstatistical computing. Vienna (Austria): R Foundation for StatisticalComputing.
Ometto et al. GBE
756 Genome Biol. Evol. 5(4):745–757. doi:10.1093/gbe/evt034 Advance Access publication March 15, 2013
by guest on April 28, 2013
http://gbe.oxfordjournals.org/D
ownloaded from
Rota-Stabelli O, Blaxter M, Anfora G. 2013. Quick guide: Drosophilasuzukii. Curr Biol. 23(1):R8–R9.
Rota-Stabelli O, Daley A, Pisani D. 2013. Molecular timetrees reveal aCambrian colonisation of land and a new scenario for ecdysozoanevolution. Curr Biol. 23(5):329–398.
Rota-Stabelli O, Lartillot N, Philippe H, Pisani D. 2013. Serine codon usagebias in deep phylogenomics: pancrustacean relationships as a casestudy. Syst Biol. 62(1):121–133.
Schulz MH, Zerbino DR, Vingron M, Birney E. 2012. Oases: robust de novoRNA-seq assembly across the dynamic range of expression levels.Bioinformatics 28:1086–1092.
Simpson JT, et al. 2009. ABySS: a parallel assembler for short read se-quence data. Genome Res. 19:1117–1123.
Siozios S, et al. Forthcoming 2013. Draft genome of the Wolbachia endo-symbiont of Drosophila suzukii. Genome Announc. 1(1):e00032–13;doi:10.1128/genomeA.00032-13.
Storey J. 2002. A direct approach to false discovery rates. J Roy Stat Soc B.64:479–498.
Ting S, Hartley S, Burns KC. 2008. Global patterns in fruiting seasons.Global Ecol Biogeogr. 17:648–657.
Vicoso B, Charlesworth B. 2009a. Effective population size and the faster-X effect: an extended model. Evolution 63:2413–2426.
Vicoso B, Charlesworth B. 2009b. Recombination rates may affectthe ratio of X to autosomal noncoding polymorphism inAfrican populations of Drosophila melanogaster. Genetics 181:1699–1701.
Walsh DB, et al. 2011. Drosophila suzukii (Diptera: Drosophilidae): invasivepest of ripening soft fruit expanding its geographic range and damagepotential. J Integr Pest Manag. 2:1–7.
Willson MF. 1991. Dispersal of seeds by frugivorous animals in temperateforests. Rev Chil Hist Nat. 64:537–554.
Wright F. 1990. The “effective number of codons” used in a gene. Gene87:23–29.
Yang Y, Hou Z-C, Qian Y-H, Kang H, Zeng Q-T. 2012. Increasing the datasize to accurately reconstruct the phylogenetic relationships betweennine subgroups of the Drosophila melanogaster species group(Drosophilidae, Diptera). Mol Phylogenet Evol. 62:214–223.
Yang Z. 1998. Likelihood ratio tests for detecting positive selection andapplication to primate lysozyme evolution. Mol Biol Evol. 15:568–573.
Yang Z. 2007. PAML 4: phylogenetic analysis by maximum likelihood. MolBiol Evol. 24:1586–1591.
Yang Z, Nielsen R. 2000. Estimating synonymous and nonsynonymoussubstitution rates under realistic evolutionary models. Mol Biol Evol.17:32–43.
Yang Z, Nielsen R, Goldman N, Pedersen A. 2000. Codon-substitutionmodels for heterogeneous selection pressure at amino acid sites.Genetics 155:431–449.
Yang Z, Rannala B. 2006. Bayesian estimation of species divergence timesunder a molecular clock using multiple fossil calibrations with softbounds. Mol Biol Evol. 23:212–226.
Yang Z, Wong WSW, Nielsen R. 2005. Bayes empirical Bayes inferenceof amino acid sites under positive selection. Mol Biol Evol. 22:1107–1118.
Zachos J, Pagani M, Sloan L, Thomas E, Billups K. 2001. Trends, rhythms,and aberrations in global climate 65 Ma to present. Science 292:686–693.
Associate editor: B. Venkatesh
Drosophila suzukii Phylogenomics GBE
Genome Biol. Evol. 5(4):745–757. doi:10.1093/gbe/evt034 Advance Access publication March 15, 2013 757
by guest on April 28, 2013
http://gbe.oxfordjournals.org/D
ownloaded from
0 2 4 6 8 10 12 14 16 18
D. mojavensis
D. grimshawi
D. virilis
D. willistoni
D. persimilis
D. pseudoobscura
D. ananassae
D. bipectinata
D. kikkawai
D. ficusphila
D. elegans
D. rhopaloa
D. biarmipes
D. suzuki
D. takahashii
D. eugracilis
D. melanogaster
D. sechellia
D. simulans
D. erecta
D. yakuba
Lines
LTR
DNA trans
Other transposable elements
14-20%
9-12%4-6%
17-23%
12-17%
9-13%
9-13%
8-11%
9-12%
15-20%
8-11%
6-9%
8-11%
11-15%
18-25%
2-3%
12-17%18-25%
8-11%
5-8%
10-14%
% of the draft genome size
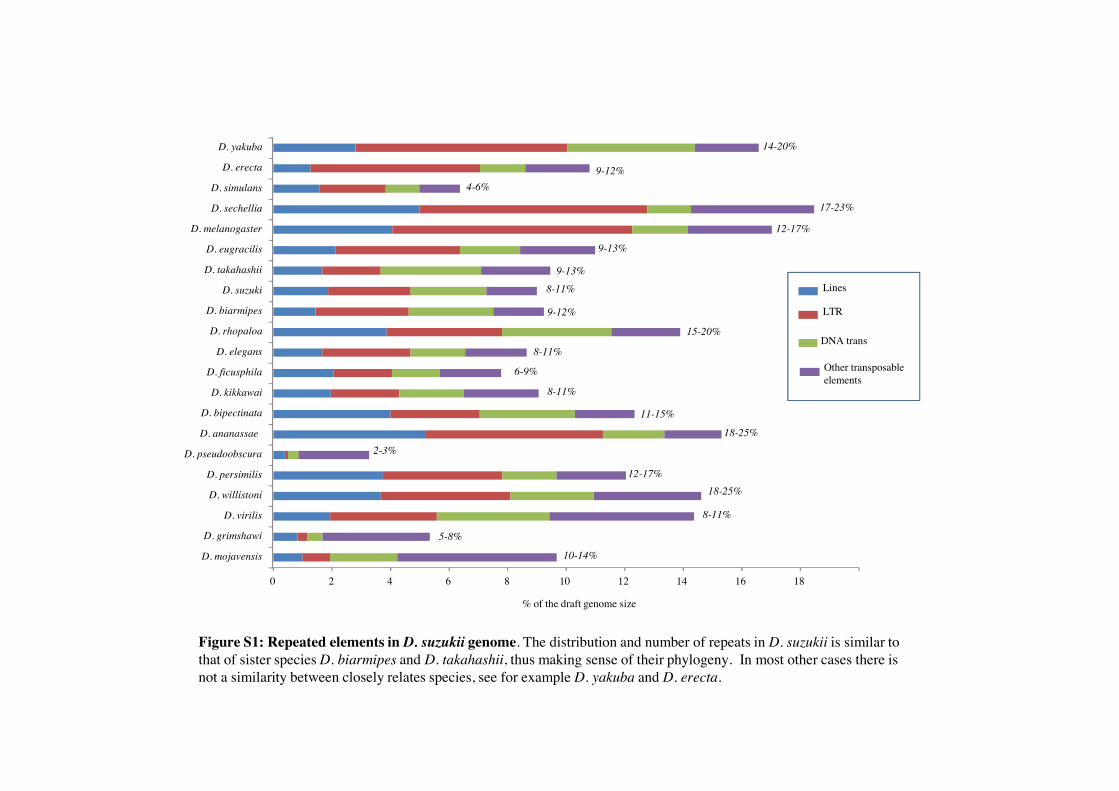
Figure S1: Repeated elements in D. suzukii genome. The distribution and number of repeats in D. suzukii is similar to that of sister species D. biarmipes and D. takahashii, thus making sense of their phylogeny. In most other cases there is not a similarity between closely relates species, see for example D. yakuba and D. erecta.
0
5
10
15
20
25
30
anatomicalstructure
development
cell differentiation cellular nitrogencompound
metabolic process
biosyntheticprocess
transport signal transduction reproduction response to stress cellular proteinmodification
process
cell cycle
% o
f gen
es
1941 1427 1360 1280 1092 926 691 569 558 550
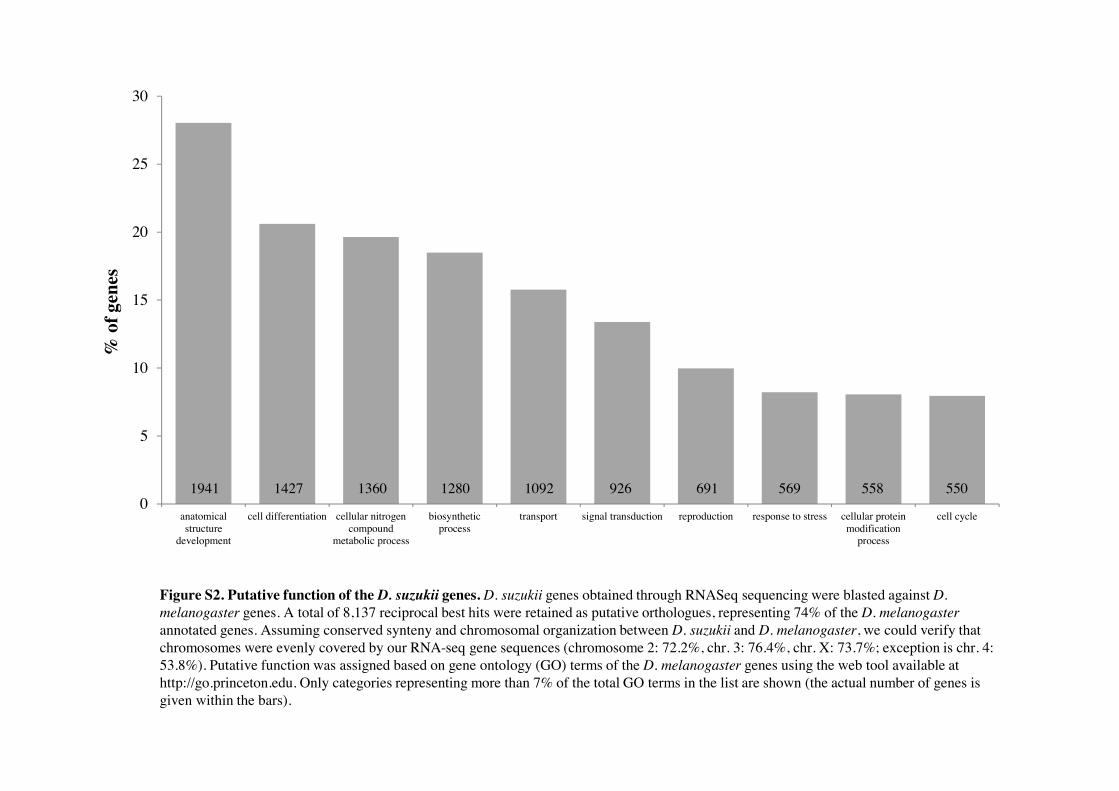
Figure S2. Putative function of the D. suzukii genes. D. suzukii genes obtained through RNASeq sequencing were blasted against D. melanogaster genes. A total of 8,137 reciprocal best hits were retained as putative orthologues, representing 74% of the D. melanogaster annotated genes. Assuming conserved synteny and chromosomal organization between D. suzukii and D. melanogaster, we could verify that chromosomes were evenly covered by our RNA-seq gene sequences (chromosome 2: 72.2%, chr. 3: 76.4%, chr. X: 73.7%; exception is chr. 4: 53.8%). Putative function was assigned based on gene ontology (GO) terms of the D. melanogaster genes using the web tool available at http://go.princeton.edu. Only categories representing more than 7% of the total GO terms in the list are shown (the actual number of genes is given within the bars).
D. eugracislis
D. suzukii
D. kikkawai
D. takahashii
D. rhopaloa
D. bipectinata
D. melanogaster
D. ficusphila
D. elegans
D. biarmipes
D. ananassae
1
2
3
4
5
1
2
3
4
5
1
2
3
4
5
6
7
8
9
10
D. melanogasterD. sechelliaD. simulansD. yakubaD. erectaD. ananassaeD. pseudobscuraD. persimilisD. willistoniD. mojavensisD. virilisD. grimshawi
WEBorthologuesSTARorthologues
WEBorthologuesfor Phylogenetic analyses
12 genomes alignments
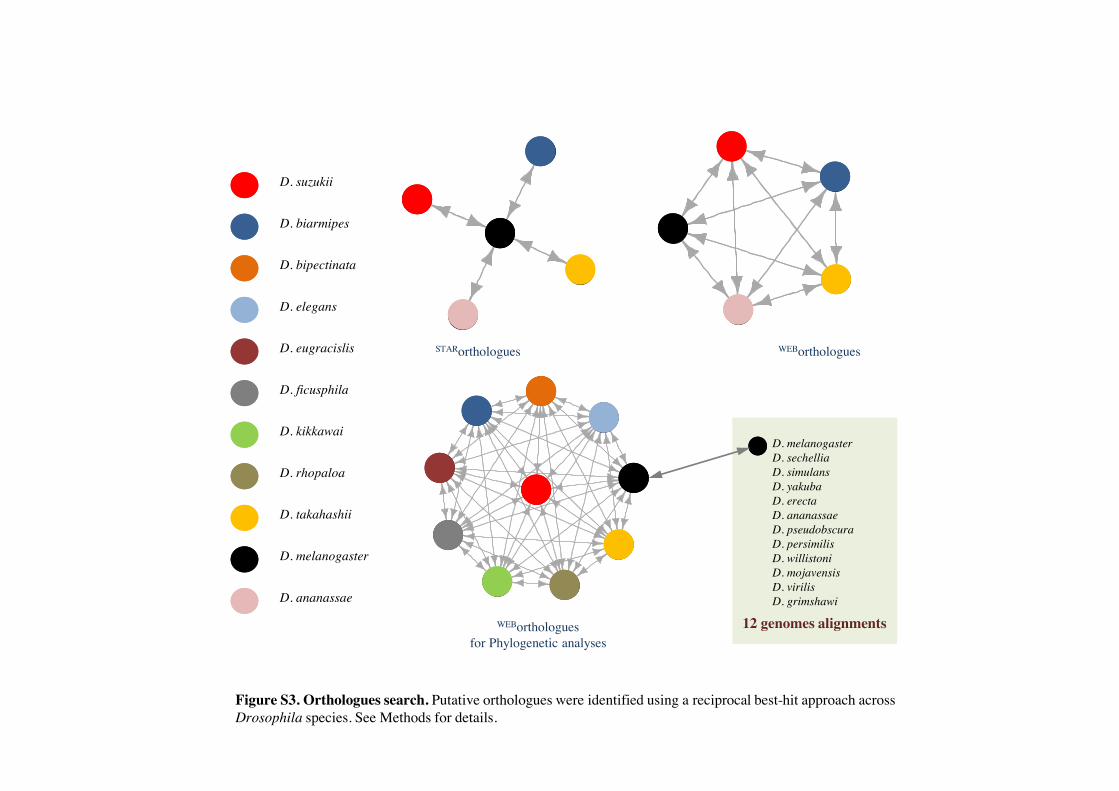
Figure S3. Orthologues search. Putative orthologues were identified using a reciprocal best-hit approach across Drosophila species. See Methods for details.
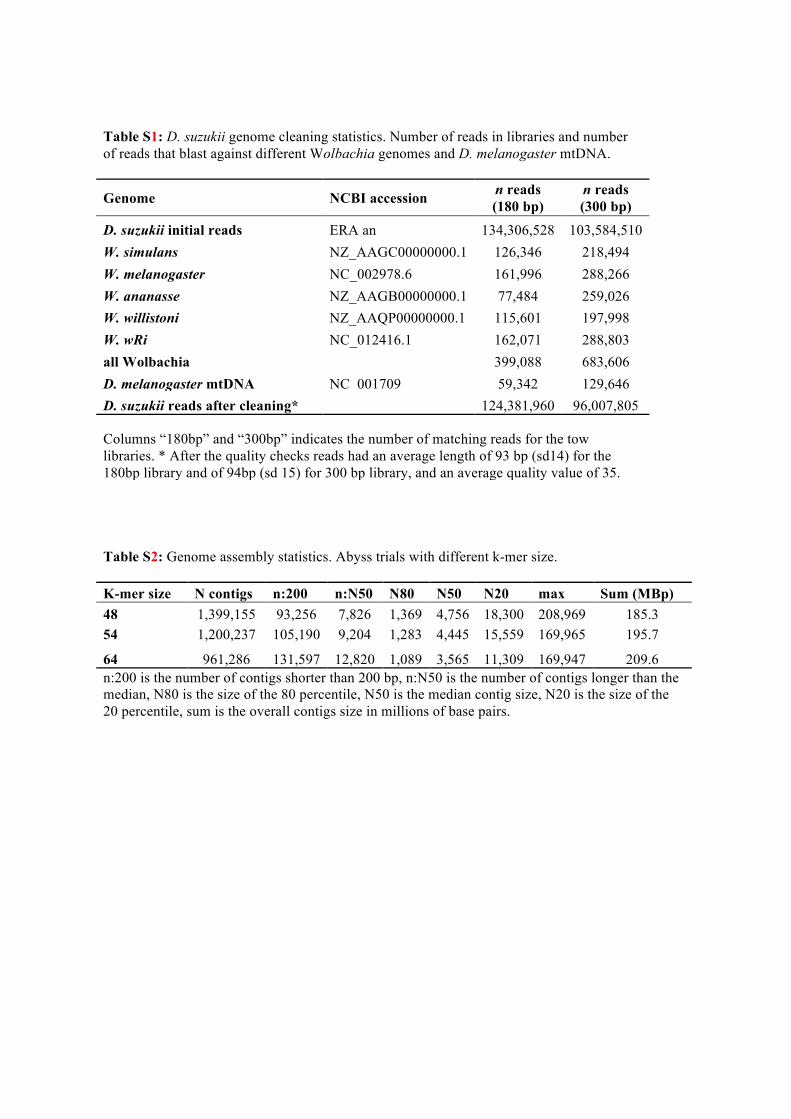
Table S1: D. suzukii genome cleaning statistics. Number of reads in libraries and number of reads that blast against different Wolbachia genomes and D. melanogaster mtDNA.
Genome NCBI accession n reads (180 bp)
n reads (300 bp)
D. suzukii initial reads ERA an 134,306,528 103,584,510 W. simulans NZ_AAGC00000000.1 126,346 218,494 W. melanogaster NC_002978.6 161,996 288,266 W. ananasse NZ_AAGB00000000.1 77,484 259,026 W. willistoni NZ_AAQP00000000.1 115,601 197,998 W. wRi NC_012416.1 162,071 288,803 all Wolbachia
399,088 683,606
D. melanogaster mtDNA NC_001709 59,342 129,646 D. suzukii reads after cleaning* 124,381,960 96,007,805
Columns “180bp” and “300bp” indicates the number of matching reads for the tow libraries. * After the quality checks reads had an average length of 93 bp (sd14) for the 180bp library and of 94bp (sd 15) for 300 bp library, and an average quality value of 35.
Table S2: Genome assembly statistics. Abyss trials with different k-mer size. K-mer size N contigs n:200 n:N50 N80 N50 N20 max Sum (MBp) 48 1,399,155 93,256 7,826 1,369 4,756 18,300 208,969 185.3 54 1,200,237 105,190 9,204 1,283 4,445 15,559 169,965 195.7
64 961,286 131,597 12,820 1,089 3,565 11,309 169,947 209.6 n:200 is the number of contigs shorter than 200 bp, n:N50 is the number of contigs longer than the median, N80 is the size of the 80 percentile, N50 is the median contig size, N20 is the size of the 20 percentile, sum is the overall contigs size in millions of base pairs.
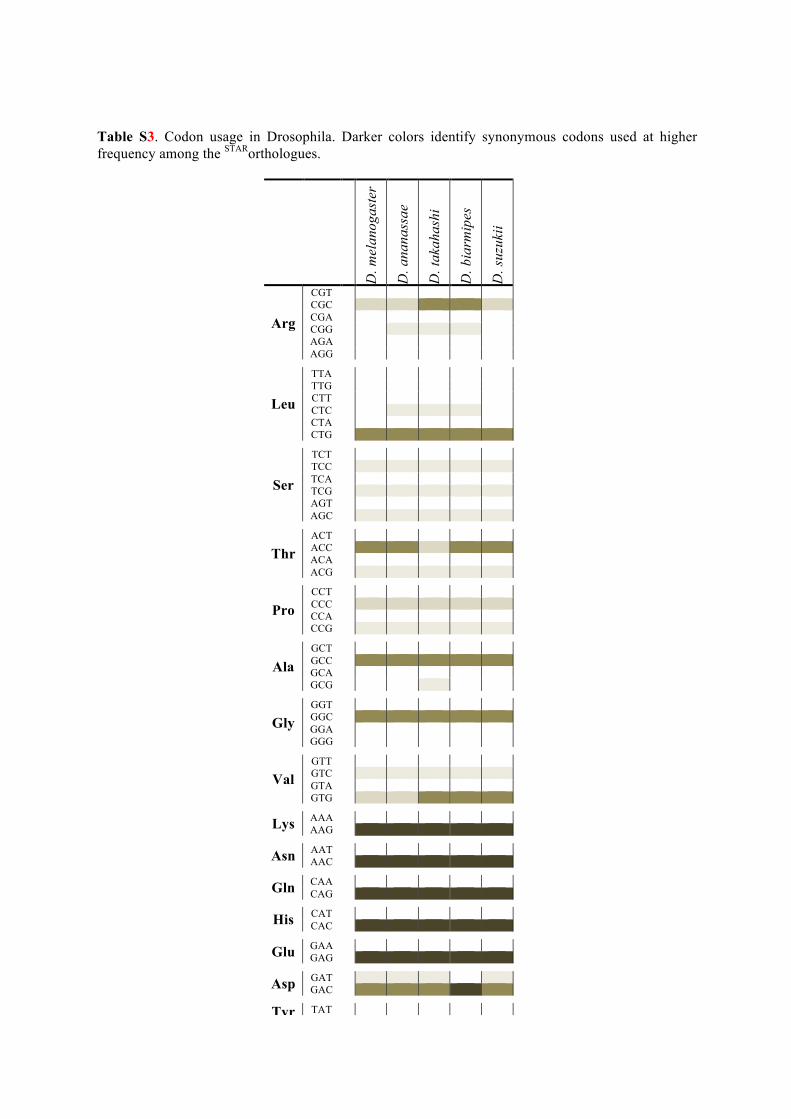
Table S3. Codon usage in Drosophila. Darker colors identify synonymous codons used at higher frequency among the STARorthologues.
D. m
elan
ogas
ter
D. a
nana
ssae
D. t
akah
ashi
D. b
iarm
ipes
D. s
uzuk
ii
Arg
CGT
CGC CGA CGG AGA AGG
Leu
TTA
TTG CTT CTC CTA CTG
Ser
TCT
TCC TCA TCG AGT AGC
Thr ACT
ACC ACA ACG
Pro CCT
CCC CCA CCG
Ala GCT
GCC GCA GCG
Gly GGT
GGC GGA GGG
Val GTT
GTC GTA GTG
Lys AAA AAG
Asn AAT AAC
Gln CAA CAG
His CAT CAC
Glu GAA GAG
Asp GAT GAC
Tyr TAT
TAC
Cys TGT TGC
Phe TTT TTC
Ile
ATT ATC
ATA
!

Table S4. Total branch length (tot) and rate of synonymous (dS) and non-synonymous substitution (dN) across WEBorthologues along the Drosophila biarmipes and D. suzukii lineages.
D. biarmipes D. suzukii P b
n a mean SD n mean SD raw resL tot 1002 0.1092 0.0479 1002 0.0789 0.0372 1×10-49 0.0076 dN 1002 0.0048 0.0056 1002 0.0037 0.0046 3×10⁻⁹ 0.0004 dS 1002 0.1628 0.0765 1002 0.1169 0.0575 6×10-51 0.0376
dN/dS 999 0.0352 0.0662 989 0.0365 0.0648 0.5799 0.0058 a Exceedingly large dN/dS values corresponding to dS = 0 were ignored in the analysis. SD = standard
deviation. b Wilcoxon test probability calculated for the raw data and after correcting for gene length (resL; we used the residuals of the correlation between gene length and the statistic of interest). Table S5. Mean (Standard deviation, SD) codon usage and GC content in STARorthologues..
Fop a
Nc b
Nc’ c GC d
GC3 e
Mean SD
Mean SD
Mean SD Mean SD
Mean SD
D. suzukii 0.668 0.093
43.9 6.7
50.2 4.7 56.6 4.0
72.3 8.9 D. biarmipes 0.745 0.097
41.0 7.1
49.3 4.8 58.3 4.0
76.9 9.1
D. takahashi 0.724 0.094
42.0 6.6
49.5 4.8 57.5 4.0
74.9 8.9 D. melanogaster 0.613 0.086
45.9 6.5
50.9 4.4 55.6 3.7
69.3 8.2
D. ananassae 0.662 0.098
45.6 7.2
50.9 4.4 55.8 4.2
70.0 9.4 a Frequency of the optimal codon. b Number of effective codons. c Number of effective codons when accounting for background nucleotide composition. d Percentage of GC content across genes. e Percentage of GC content in the third codon position across gene