Linked 4-Way Multimodal Brain Differences in ... - Oxford Academic
14
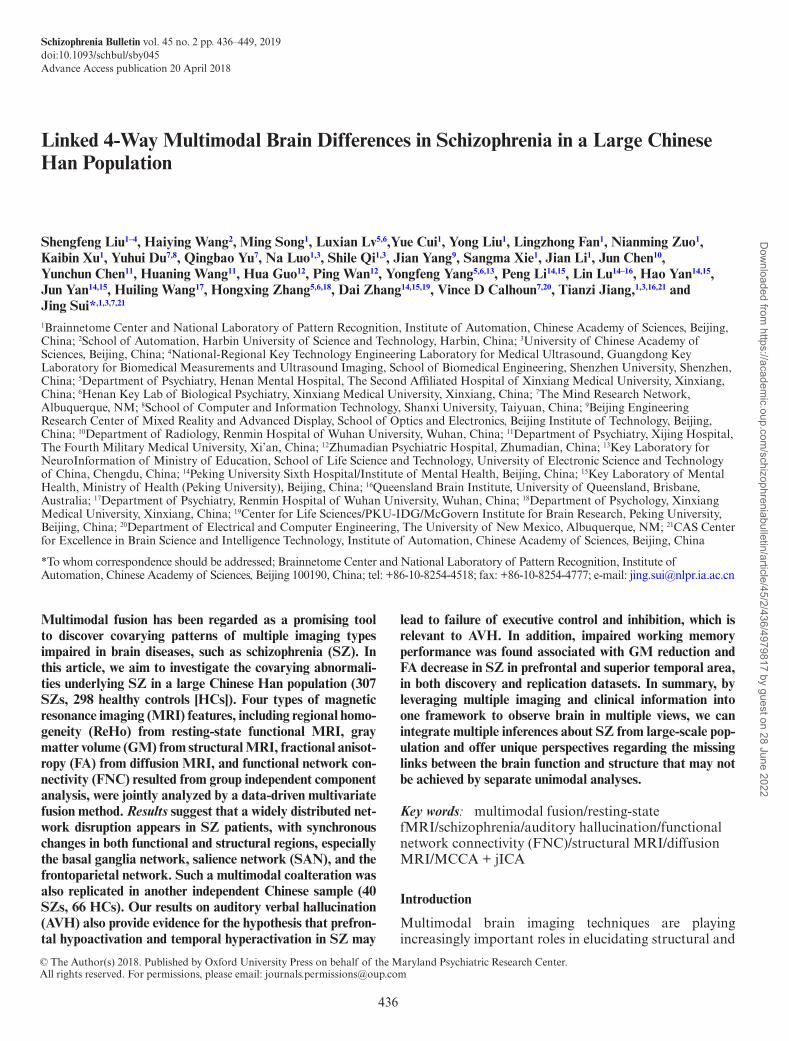
436 Schizophrenia Bulletin vol. 45 no. 2 pp. 436–449, 2019 doi:10.1093/schbul/sby045 Advance Access publication 20 April 2018 © The Author(s) 2018. Published by Oxford University Press on behalf of the Maryland Psychiatric Research Center. All rights reserved. For permissions, please email: [email protected] Linked 4-Way Multimodal Brain Differences in Schizophrenia in a Large Chinese Han Population Shengfeng Liu 1–4 , Haiying Wang 2 , Ming Song 1 , Luxian Lv 5,6 ,Yue Cui 1 , Yong Liu 1 , Lingzhong Fan 1 , Nianming Zuo 1 , Kaibin Xu 1 , Yuhui Du 7,8 , Qingbao Yu 7 , Na Luo 1,3 , Shile Qi 1,3 , Jian Yang 9 , Sangma Xie 1 , Jian Li 1 , Jun Chen 10 , Yunchun Chen 11 , Huaning Wang 11 , Hua Guo 12 , Ping Wan 12 , Yongfeng Yang 5,6,13 , Peng Li 14,15 , Lin Lu 14–16 , Hao Yan 14,15 , Jun Yan 14,15 , Huiling Wang 17 , Hongxing Zhang 5,6,18 , Dai Zhang 14,15,19 , Vince D Calhoun 7,20 , Tianzi Jiang, 1,3,16,21 and Jing Sui* ,1,3,7,21 1 Brainnetome Center and National Laboratory of Pattern Recognition, Institute of Automation, Chinese Academy of Sciences, Beijing, China; 2 School of Automation, Harbin University of Science and Technology, Harbin, China; 3 University of Chinese Academy of Sciences, Beijing, China; 4 National-Regional Key Technology Engineering Laboratory for Medical Ultrasound, Guangdong Key Laboratory for Biomedical Measurements and Ultrasound Imaging, School of Biomedical Engineering, Shenzhen University, Shenzhen, China; 5 Department of Psychiatry, Henan Mental Hospital, The Second Affiliated Hospital of Xinxiang Medical University, Xinxiang, China; 6 Henan Key Lab of Biological Psychiatry, Xinxiang Medical University, Xinxiang, China; 7 The Mind Research Network, Albuquerque, NM; 8 School of Computer and Information Technology, Shanxi University, Taiyuan, China; 9 Beijing Engineering Research Center of Mixed Reality and Advanced Display, School of Optics and Electronics, Beijing Institute of Technology, Beijing, China; 10 Department of Radiology, Renmin Hospital of Wuhan University, Wuhan, China; 11 Department of Psychiatry, Xijing Hospital, The Fourth Military Medical University, Xi’an, China; 12 Zhumadian Psychiatric Hospital, Zhumadian, China; 13 Key Laboratory for NeuroInformation of Ministry of Education, School of Life Science and Technology, University of Electronic Science and Technology of China, Chengdu, China; 14 Peking University Sixth Hospital/Institute of Mental Health, Beijing, China; 15 Key Laboratory of Mental Health, Ministry of Health (Peking University), Beijing, China; 16 Queensland Brain Institute, University of Queensland, Brisbane, Australia; 17 Department of Psychiatry, Renmin Hospital of Wuhan University, Wuhan, China; 18 Department of Psychology, Xinxiang Medical University, Xinxiang, China; 19 Center for Life Sciences/PKU-IDG/McGovern Institute for Brain Research, Peking University, Beijing, China; 20 Department of Electrical and Computer Engineering, The University of New Mexico, Albuquerque, NM; 21 CAS Center for Excellence in Brain Science and Intelligence Technology, Institute of Automation, Chinese Academy of Sciences, Beijing, China *To whom correspondence should be addressed; Brainnetome Center and National Laboratory of Pattern Recognition, Institute of Automation, Chinese Academy of Sciences, Beijing 100190, China; tel: +86-10-8254-4518; fax: +86-10-8254-4777; e-mail: [email protected] Multimodal fusion has been regarded as a promising tool to discover covarying patterns of multiple imaging types impaired in brain diseases, such as schizophrenia (SZ). In this article, we aim to investigate the covarying abnormali- ties underlying SZ in a large Chinese Han population (307 SZs, 298 healthy controls [HCs]). Four types of magnetic resonance imaging (MRI) features, including regional homo- geneity (ReHo) from resting-state functional MRI, gray matter volume (GM) from structural MRI, fractional anisot- ropy (FA) from diffusion MRI, and functional network con- nectivity (FNC) resulted from group independent component analysis, were jointly analyzed by a data-driven multivariate fusion method. Results suggest that a widely distributed net- work disruption appears in SZ patients, with synchronous changes in both functional and structural regions, especially the basal ganglia network, salience network (SAN), and the frontoparietal network. Such a multimodal coalteration was also replicated in another independent Chinese sample (40 SZs, 66 HCs). Our results on auditory verbal hallucination (AVH) also provide evidence for the hypothesis that prefron- tal hypoactivation and temporal hyperactivation in SZ may lead to failure of executive control and inhibition, which is relevant to AVH. In addition, impaired working memory performance was found associated with GM reduction and FA decrease in SZ in prefrontal and superior temporal area, in both discovery and replication datasets. In summary, by leveraging multiple imaging and clinical information into one framework to observe brain in multiple views, we can integrate multiple inferences about SZ from large-scale pop- ulation and offer unique perspectives regarding the missing links between the brain function and structure that may not be achieved by separate unimodal analyses. Key words: multimodal fusion/resting-state fMRI/schizophrenia/auditory hallucination/functional network connectivity (FNC)/structural MRI/diffusion MRI/MCCA + jICA Introduction Multimodal brain imaging techniques are playing increasingly important roles in elucidating structural and Downloaded from https://academic.oup.com/schizophreniabulletin/article/45/2/436/4979817 by guest on 28 June 2022
-
Upload
khangminh22 -
Category
Documents
-
view
1 -
download
0
Transcript of Linked 4-Way Multimodal Brain Differences in ... - Oxford Academic
436
Schizophrenia Bulletin vol. 45 no. 2 pp. 436–449, 2019 doi:10.1093/schbul/sby045Advance Access publication 20 April 2018
© The Author(s) 2018. Published by Oxford University Press on behalf of the Maryland Psychiatric Research Center. All rights reserved. For permissions, please email: [email protected]
Linked 4-Way Multimodal Brain Differences in Schizophrenia in a Large Chinese Han Population
Shengfeng Liu1–4, Haiying Wang2, Ming Song1, Luxian Lv5,6,Yue Cui1, Yong Liu1, Lingzhong Fan1, Nianming Zuo1, Kaibin Xu1, Yuhui Du7,8, Qingbao Yu7, Na Luo1,3, Shile Qi1,3, Jian Yang9, Sangma Xie1, Jian Li1, Jun Chen10, Yunchun Chen11, Huaning Wang11, Hua Guo12, Ping Wan12, Yongfeng Yang5,6,13, Peng Li14,15, Lin Lu14–16, Hao Yan14,15, Jun Yan14,15, Huiling Wang17, Hongxing Zhang5,6,18, Dai Zhang14,15,19, Vince D Calhoun7,20, Tianzi Jiang,1,3,16,21 and Jing Sui*,1,3,7,21
1Brainnetome Center and National Laboratory of Pattern Recognition, Institute of Automation, Chinese Academy of Sciences, Beijing, China; 2School of Automation, Harbin University of Science and Technology, Harbin, China; 3University of Chinese Academy of Sciences, Beijing, China; 4National-Regional Key Technology Engineering Laboratory for Medical Ultrasound, Guangdong Key Laboratory for Biomedical Measurements and Ultrasound Imaging, School of Biomedical Engineering, Shenzhen University, Shenzhen, China; 5Department of Psychiatry, Henan Mental Hospital, The Second Affiliated Hospital of Xinxiang Medical University, Xinxiang, China; 6Henan Key Lab of Biological Psychiatry, Xinxiang Medical University, Xinxiang, China; 7The Mind Research Network, Albuquerque, NM; 8School of Computer and Information Technology, Shanxi University, Taiyuan, China; 9Beijing Engineering Research Center of Mixed Reality and Advanced Display, School of Optics and Electronics, Beijing Institute of Technology, Beijing, China; 10Department of Radiology, Renmin Hospital of Wuhan University, Wuhan, China; 11Department of Psychiatry, Xijing Hospital, The Fourth Military Medical University, Xi’an, China; 12Zhumadian Psychiatric Hospital, Zhumadian, China; 13Key Laboratory for NeuroInformation of Ministry of Education, School of Life Science and Technology, University of Electronic Science and Technology of China, Chengdu, China; 14Peking University Sixth Hospital/Institute of Mental Health, Beijing, China; 15Key Laboratory of Mental Health, Ministry of Health (Peking University), Beijing, China; 16Queensland Brain Institute, University of Queensland, Brisbane, Australia; 17Department of Psychiatry, Renmin Hospital of Wuhan University, Wuhan, China; 18Department of Psychology, Xinxiang Medical University, Xinxiang, China; 19Center for Life Sciences/PKU-IDG/McGovern Institute for Brain Research, Peking University, Beijing, China; 20Department of Electrical and Computer Engineering, The University of New Mexico, Albuquerque, NM; 21CAS Center for Excellence in Brain Science and Intelligence Technology, Institute of Automation, Chinese Academy of Sciences, Beijing, China
*To whom correspondence should be addressed; Brainnetome Center and National Laboratory of Pattern Recognition, Institute of Automation, Chinese Academy of Sciences, Beijing 100190, China; tel: +86-10-8254-4518; fax: +86-10-8254-4777; e-mail: [email protected]
Multimodal fusion has been regarded as a promising tool to discover covarying patterns of multiple imaging types impaired in brain diseases, such as schizophrenia (SZ). In this article, we aim to investigate the covarying abnormali-ties underlying SZ in a large Chinese Han population (307 SZs, 298 healthy controls [HCs]). Four types of magnetic resonance imaging (MRI) features, including regional homo-geneity (ReHo) from resting-state functional MRI, gray matter volume (GM) from structural MRI, fractional anisot-ropy (FA) from diffusion MRI, and functional network con-nectivity (FNC) resulted from group independent component analysis, were jointly analyzed by a data-driven multivariate fusion method. Results suggest that a widely distributed net-work disruption appears in SZ patients, with synchronous changes in both functional and structural regions, especially the basal ganglia network, salience network (SAN), and the frontoparietal network. Such a multimodal coalteration was also replicated in another independent Chinese sample (40 SZs, 66 HCs). Our results on auditory verbal hallucination (AVH) also provide evidence for the hypothesis that prefron-tal hypoactivation and temporal hyperactivation in SZ may
lead to failure of executive control and inhibition, which is relevant to AVH. In addition, impaired working memory performance was found associated with GM reduction and FA decrease in SZ in prefrontal and superior temporal area, in both discovery and replication datasets. In summary, by leveraging multiple imaging and clinical information into one framework to observe brain in multiple views, we can integrate multiple inferences about SZ from large-scale pop-ulation and offer unique perspectives regarding the missing links between the brain function and structure that may not be achieved by separate unimodal analyses.
Key words: multimodal fusion/resting-state fMRI/schizophrenia/auditory hallucination/functional network connectivity (FNC)/structural MRI/diffusion MRI/MCCA + jICA
Introduction
Multimodal brain imaging techniques are playing increasingly important roles in elucidating structural and
Dow
nloaded from https://academ
ic.oup.com/schizophreniabulletin/article/45/2/436/4979817 by guest on 28 June 2022

437
Linked 4-Way Multimodal Brain Differences in Schizophrenia
functional properties in normal and diseased brains, as well as providing the conceptual glue to bind together data from multiple types or levels of analysis. It’s clear that joint analysis of multimodal brain imaging measures is able to capture more views of brain aspects and covaria-tions between modalities, but the merit of fusion methods has not been fully recognized by the community due to the difficulty of theory and data availability.1–3 Most current studies analyze each modality independently,4 which may ignore the multimodal cross-information. Therefore, the complexity of the human brain coupled with incomplete measurements provided by existing imaging technology makes multimodal fusion an essential tool to mitigate against the misdirection,5–7 which hopefully can provide a key to finding the missing link(s) in complex mental ill-ness, such as schizophrenia (SZ).
We have previously successfully developed several mul-tivariate fusion algorithms8,9 and applied them to SZ10–12 and bipolar disorder (BP).13 These approaches have also been adopted by others to study aberrant intermodality differences in major depression14 or obsessive-compulsive disorder.15 Similar methods were also used to investigate covarying multimodal brain patterns in Autism.16,17 Given the fact that data-driven fusion model is able to comple-ment and exploit the richness of multiple neuroimaging features together (for details, see review18), in this study, based on a large, pure Chinese Han population (307 SZ patients and 298 age and gender-matched healthy con-trols [HCs], single ethnicity), we aim to combine 4 types of magnetic resonance imaging (MRI) features together to investigate the linked functional–structural–anatomi-cal alternations in SZ. Besides the basic imaging features used for fusion input such as morphometric measures in structural MRI (sMRI), or fractional anisotropy (FA) maps derived from diffusion MRI (dMRI), here, we uniquely include functional features such as functional network connectivity (FNC)19 and regional homogeneity (ReHo)20 extracted from resting-state fMRI. By combin-ing these 4 measures, we may elucidate the links between brain structural measures and temporal coherence of blood oxygen level dependent (BOLD) signal fluctuations or spontaneous neural activity.21
As a core symptom of psychotic disorders,22 auditory verbal hallucination (AVH) is experienced by 75% of patients diagnosed with SZ23 and is generally acknowl-edged as the first class symptom of SZ. Although there is still not a consistent conclusion on AVH, both struc-tural and functional brain disruptions involved in AVH in SZ are mainly located in the prefrontal cortex (PFC), including dorsolateral prefrontal cortex (DLPFC) and medial prefrontal cortex (mPFC), thalamus, sensorimo-tor cortex, and temporal lobe (especially Heschl’s gyrus).24 Obviously, these brain regions are involved in language and speech monitoring processes, though the role of these regions in AVH is not still clear. Currently, 2 popular infer-ences generating AVHs are the bottom-up and top-down
processes, which are opposed to each other. Based on the existed findings, Hugdahl25 proposed a model that com-bines the 2 processes: hyperactivation of the bottom-up process (neural hyperexcitation in the temporal lobes pro-duces the actual initiation of AVHs) and hypoactivation of the top-down process (impaired frontal lobes fail to inhibit the attentional focus on the voices) together pro-duces AVHs. Therefore, psychotic syndrome ratings such as Auditory Hallucinations Rating Scale (AHRS),26 the Positive and Negative Syndrome Scale (PANSS),27 and cognitive task performance (digit span [DS] tasks to mea-sure working memory ability) were also used to identify the imaging component of interests and to examine how they are impaired in the SZ. Finally, to demonstrate the reliability of our results, we also conducted a validation test in a separate Chinese sample (in total 106 subjects, including 40 SZs and 66 age and gender-matched HCs).
To the best of our knowledge, this is the first attempt to combine 4 diverse MRI features to unravel the coal-tered brain patterns of multiple facets for SZ patients, in particular for a large Chinese Han population. By tak-ing advantage of the 4-way MRI cross-information, we may not only reveal co-occurring functional–structural–anatomical brain features impaired in SZ but also pro-vide a multiview of brain patterns specifically involved in hallucination or working memory impairment, which may deepen our understanding of the schizophrenic pathophysiology.
Methods
Participants
All subjects were within the 18–45 age range, right handed, who were screened for ethical clearance, with only Chinese Han people included in the study. As the discovery cohort, 605 Chinese Han participants (307 SZs and 298 age and gender-matched HCs) were recruited from 4 hospitals in China, with the same enrollment cri-teria, including Peking University Sixth Hospital (Site 1); Beijing Huilongguan Hospital (Site 2); Xijing Hospital (Site 3); and Henan Mental Hospital (Site 4). All of them were scanned by Siemens scanner with same pro-tocols and compatible scanning quality. For validation dataset, 106 Chinese Han participants (40 SZs and 66 demographically matched HCs) scanned by a GE scan-ner were also recruited from the Site 4 from the same research study. Written informed consent was obtained from all study participants under protocols approved by the Institutional Review Boards at each site.
All HCs (298 in the discovery and 66 in validation dataset) were recruited by advertisement from the same geographical areas as patients, with no current or past axis I or II disorders (DSM-IV-TR) as screened by the SCID-nonpatient version. Additional exclusion criteria for all subjects included current or past neurological ill-ness, substance abuse or dependence, pregnancy, and
Dow
nloaded from https://academ
ic.oup.com/schizophreniabulletin/article/45/2/436/4979817 by guest on 28 June 2022

438
S. Liu et al
prior electroconvulsive therapy or head injury resulting in loss of consciousness.
All SZ patients were assessed using the Structured Clinical Interview for DSM disorders (SCID) and diag-nosed by experienced psychiatrists according to the cri-teria of DSM-IV-TR for SZ. About 197 of 307 SZs in the discovery dataset and all 40 SZs in validation dataset received antipsychotic medication using multiple antipsy-chotic drugs before/during the scan. Table 1 lists the dem-ographic and clinical information of all subjects in both cohorts (details for each site in the discovery experiment are listed in supplementary table S2).
Imaging Acquisition
All subjects were scanned by fMRI, dMRI, and sMRI, in which the discovery cohort data were collected on a 3.0 T Siemens Trio Tim Scanner (Siemens; Site 1, 2 & 3) or a 3.0 T Siemens Verio Scanner (Siemens; Site 4) with an 8-channel SENSE head coil, and the validation test data were collected on a 3.0 T Signa HDx GE Scanner (General Electric). To ensure equivalent and high-quality data acquisition, the scanning protocols for all the 4 sites were set up by the same experienced expert to achieve a harmonized imaging quality. The imaging parameters are listed in supplementary file S1.
Psychotic Syndrome Ratings
We used PANSS27 scores to measure the disease severity of SZ on both positive and negative symptoms. In addi-tion, for those SZ patients who have P3 value (subitem in PANSS measuring hallucination) higher than 3 (121 out of 307 SZs in the discovery cohort and 15 out of 40 SZs
in validation cohort), we further performed a descriptive measurement of AVH on them using a 7-item AHRS.26
Working Memory Performance
Digit span tasks are regarded as a mainstay in psycholog-ical assessment and are frequently used to study working memory in both healthy and diseased populations.28 We used both digit forward (DF) and digit backward (DB) scores to identify component that is highly correlated with working memory performance. DB task is thought to be a more complex span task, which relies heavily on work-ing memory processing,28,29 because it requires informa-tion storage as well as concurrent processing essential to mentally reordering the information. All participants completed a DF span task followed by a DB span task (see supplementary file S1 for detailed descriptions).
Data Preprocessing
For fusion purposes, each modality is first reduced to a “feature” for each subject, providing a simpler, more tractable space to link the high-dimensional neuroimag-ing data.30,31 In this study, for each subject, we extracted 4 imaging features, ie, segmented gray matter (GM) image from sMRI, FA map from dMRI, ReHo from resting-state fMRI, and a 50 × 50 FNC matrix that is computed based on correlation of time series of 50 selected components resulted from group independent components analysis (gICA) (supplementary figure S1). Note that although ReHo and FNC both are resulted from fMRI data, they capture differential functional perspectives. ReHo mea-sures local functional homogeneity on a voxel-wise basis and reflects coordination in regional neural activity,32
Table 1. Demographic and Clinical Information
Measure
The Discovery Cohort The Validation Cohort
Healthy Control (HC; n = 298)
Schizophrenia (SZ; n = 307)
Healthy Control (HC; n = 66)
Schizophrenia (SZ; n = 40)
Mean (±SD) Mean (±SD) P-value Mean (±SD) Mean (±SD) P-value
Age 27.77 (±6.74) 27.14 (±7.09) .266 31.36 (±6.96) 28.61 (±7.93) .065Sex (M/F) 157/141 160/147 .889 32/34 25/15 .161Medication (chlorpromazine equivalent)
NA 412.57 (±210.95) NA NA 336.25 (±160.52) NA
First-episode NA 145/307 NA NA 14/40 NAPositive and Negative Syndrome Scale (PANSS) Positive NA 23.91 (±4.20) NA NA 25.03 (±3.70) NA Negative NA 19.44 (±6.01) NA NA 24.10 (±6.28) NA Total NA 82.14 (±12.07) NA NA 89.87 (±11.37) NA Auditory Hallucinations Rating Scale (AHRS)
NA 24.09 (±7.33) NA NA 25.93 (±4.54) NA
Digit span Digit forward (DF) 8.78 (±1.38) 7.94 (±1.55) 9.34E−11 8.14 (±1.51) 6.51 (±1.57) 8.23E−07 Digit backward (DB) 6.52 (±1.90) 5.21 (±1.83) 7.19E−15 5.18 (±1.68) 3.97 (±1.44) 3.00E−04
Note: Chlorpromazine equivalent denotes standardized total dose of antipsychotic drugs.
Dow
nloaded from https://academ
ic.oup.com/schizophreniabulletin/article/45/2/436/4979817 by guest on 28 June 2022

439
Linked 4-Way Multimodal Brain Differences in Schizophrenia
while the FNC is defined as average connectivity among different functional intrinsic networks that even located remotely in the whole brain.19,33 Rigorous quality control is performed for each feature; for more details, please see supplementary file on specific preprocessing steps. For the validation dataset, except for FNC, the other 3 fea-tures are similarly preprocessed as detailed in supplemen-tary file. In the validation data, we used same steps to generate ReHo, FA, and GM maps. For FNC, we used the selected group ICs in discovery dataset as references to back-construct all corresponding ICs and time courses for each subject by using spatially constrained ICA34 via GIG-ICA35 (http://mialab.mrn.org/software/gift), which were then used to calculate the FNC matrix, please see more details in supplementary file.
Normalization and Site Effect Correction
After obtaining 4 types of extracted MRI features, the 3D brain images or 2D FNC matrices of each subject were reshaped into a 1D vector and stacked along subjects, forming a matrix with dimensions of no. subjects × [no. voxels or no. functional connectivity (FC)] for each of the 4 features. Then site label was used as covariate to be regressed out to minimize the site effect for each feature. Next, the 4 feature matrices were normalized to have the same average sum of squares (computed across all sub-jects and all voxels/locus for each feature), to ensure all features to have the same ranges and contribute equally in fusion. Note that the validation data were acquired from one site, so we do not need to regress out the site effect.
Fusion Analysis
The preprocessed multimodal features were jointly ana-lyzed by multiset canonical correlation analysis plus joint independent component analysis (mCCA + jICA),8,9 which had been successfully applied to many clinical cases.1,9,15 The code for the mCCA + jICA algorithm has been released in the Fusion ICA Toolbox (FIT, http://mialab.mrn.org/software/fit), which is available for down-loading and usage by the scientific community. The flow-chart of the 4-way fusion is shown in supplementary figure S2, in which mCCA + jICA takes advantages of the 2 blind source separation (BSS) models: CCA and ICA. First, mCCA was employed to find the connec-tions among features by maximizing correlations among loading parameters, and then, jICA was used to separate spatial maps precisely, all of which have been successfully applied to discriminate psychotic disorders.10,36 In the discovery cohort, the component number was estimated using modified minimum description length37 to be 15, 12, 16, and 12 for ReHo, FA, GM, and FNC, respec-tively. We thus chose an estimated component number of M = 16 for the subsequent analysis because we have found that a slight overestimation of the component
number may improve decomposition accuracy in simu-lation.8 Consequently, a considerable amount of variance is retained when M = 16, ie, 98%, 99%, 98%, and 76% for ReHo, FA, GM, and FNC, respectively. Similarly, we chose M = 13 as estimated component number in the val-idation test, and 98%, 99%, 99%, and 76% variance was retained for ReHo, FA, GM, and FNC, respectively.
Post Hoc Statistical Analysis
After applying the mCCA + jICA framework to the human brain data, independent component (IC) Sk and the mixing matrices Ak for each feature (k = 1, 2, 3, 4) were generated, providing a variety of ways to analyze the intercorrelation between features as well as the group differences.8 In this study, we are most interested in the following:
1. Covarying functional and structural abnormalities: 2-sample t tests were performed on mixing coefficients (loadings) of each IC for each feature between SZs vs HCs for each cohort, resulting in the group-discrim-inative components. If the components of the same index show group differences in all features, they are called joint group-discriminative ICs.
2. Impact of clinical and cognitive measures: The mixing coefficients Ak provide a way to identify components of interests that are specifically correlated with patient symptom severity (PANSS,27 AHRS26) and working memory performance (Digital Span). For DS scores that were recorded for all subjects, we further per-formed a partial correlation to regress out-group effect before calculating its correlation with IC loadings.
Results
Group Differences in Human Brain Data
Figure 1 indicates one joint IC (IC12) in the discovery cohort that shows significant group-different loadings, with P = 7.7e−15*, 1.0e−14*, 0.0019*, and 1.3e−12* for ReHo, GM, FA, and FNC, respectively (* means false discovery rate [FDR] corrected for multiple compari-sons, the same below). In addition, the top 3 pairwise intermodality correlations existed in FA-GM: r = .27, P = 2.6e−11*; FA-ReHo: r = .25, P = 4.1e−10*; and ReHo-GM: r = .18, P = 5.6e−06*.
The identified group-discriminative brain regions in joint IC are listed in supplementary tables S3–S6. Particularly, ReHo and GM components were both impaired in SZ in hippocampus, anterior cingulate cortex (ACC), and fusiform gyrus. SZ patients indicated higher ReHo values in basal ganglia networks (BGNs) including caudate, putamen, and globus pallidus, as well as DLPFC (figure 1A). For GM, SZs had lower GM volume in the salience network (SAN, insular, and ACC), superior tem-poral gyrus (STG), and inferior parietal lobule (IPL)
Dow
nloaded from https://academ
ic.oup.com/schizophreniabulletin/article/45/2/436/4979817 by guest on 28 June 2022

440
S. Liu et al
than HCs (figure 1B). Interestingly, the key nodes of FNC component (for more details see supplementary fig-ures S1 and S3 and supplementary table S6) in figure 1D were highly overlapped with the abnormal regions shown in ReHo component (figure 1A), such as putamen, ACC, fusiform gyrus. For FA, SZ patients expressed lower integrity on white matter (WM) tracts including anterior thalamic radiation (ATR), forceps minor (FMIN)/for-ceps major (FMAJ), right cingulum, and right superior longitudinal fasciculus (SLF) (figure 1C).
A replicable functional and structural covariation was found in a joint IC (with P = 0.0071*, 0.0047*, 0.022, 1.4e−05* on 2-sample t tests between HC and SZ for ReHo, GM, FA, and FNC, respectively, as shown in figure 2) in the validation data, see anatomical details in supplementary tables S7–S10. Results showed SZ patients had higher ReHo values in BGNs, visual areas,
and DLPFC, lower GM volume in the SAN (insular and ACC) and temporal lobe, and lower WM integrity in tracts of ATR, FMIN/FMAJ, right cingulum, and right SLF than HCs. In addition, the key nodes in the identi-fied joint FNC component showed a spatial consistence between 2 cohorts on the basal ganglia-sensory motor network. More importantly, joint functional ICs (ReHo and FNC) indicated high coherence too, ie, the peak regions in ReHo component also serve as the key nodes in the FNC component in both cohorts. The voxel/node-wise spatial correlation of the identified joint group-dis-criminative ICs between discovery and validation cohorts are r = .36, .38, .24, and .5 for ReHo, GM, FA, and FNC, respectively, with P < 1.0e−16, P < 1.0e−17, P < 1.0e−12, and P < 1.0e−20. All the above suggest the relatively high replicability of the identified 4-way functional–structural coalteration in SZ.
Fig. 1. The identified joint group-discriminative components (IC12) in the discovery cohort. (A) Regional homogeneity (ReHo) component; (B) gray matter (GM) component; (C) fractional anisotropy (FA) component; The spatial maps (top) of ReHo, GM, and FA were visualized at |Z| >2.5, with the positive Z scores shown in red. The boxplot and loadings of each component are shown below with schizophrenia (SZ) in red and healthy control (HC) in blue. (D) Functional network connectivity (FNC) component: the FNC matrix (left) was transformed into Z scores and thresholded at |Z| >3 (middle, red nodes), which is displayed through the BrainNet Viewer toolbox (http://www.nitrc.org/projects/bnv/). The red key node size denotes FNC degree.
Dow
nloaded from https://academ
ic.oup.com/schizophreniabulletin/article/45/2/436/4979817 by guest on 28 June 2022

441
Linked 4-Way Multimodal Brain Differences in Schizophrenia
Association With the AHRS and PANSS
Three components were identified to be correlated with AHRS scores (ReHo_IC8_D: r = −.21, P = .02; GM_IC13_D: r = −.25, P = .005*; FNC_IC1_D, r = −.18, P = .0045*), as shown in figure 3. Note that the spatial maps of ReHo, GM, and the key FNC nodes showed high consistence; the coaltered regions include PFC, thalamus, insula, and STG, which were typical regions involved in auditory hallucination.24,38,39 Figure 3C demonstrates overlay of the nodes and edges of the FNC_IC1_D upon the surface mapping of ReHo_IC8_D, in which red nodes were those FNC nodes retained by transforming FNC_IC1_D into z scores and thresholded at |Z| > 3. Red edges mean SZs have lower FC strength than HCs, while blue edges mean SZs have higher FC strength. Red mapping
denotes SZs have lower ReHo values than HC, and blue mapping is otherwise. Namely, the lower ReHo, lower GM volume, and weaker FC in PFC correspond to more severe auditory hallucinations (higher AHRS scores) and vice versa in thalamus and STG. In the validation test, we did not find components significantly correlated with AHRS scores. This is probably due to only 15 out of 40 SZs with severe auditory hallucinations exist in validation cohort, thus hard to result in a significant correlation.
Among the derived joint component (IC12), GM_IC12_D also indicated significant correlation with nega-tive PANSS scores (GM: r = −.17, P = .0032*) as shown in supplementary figure S4. The lower GM volume in SAN,40 STG, and hippocampus, the more severe negative symptom exhibited in SZ patients.
Fig. 2. The identified joint group-discriminative components (IC12) in the validation test. (A) Regional homogeneity (ReHo) component; (B) gray matter (GM) component; (C) fractional anisotropy (FA) component; The spatial maps (top) of ReHo, GM, and FA were visualized at |Z| > 2.5, with the positive Z scores shown in red. The boxplot and loadings of each component are shown below with schizophrenia (SZ) in red and healthy control (HC) in blue. (D) Functional network connectivity (FNC) component: the FNC matrix (left) was transformed into Z scores and thresholded at |Z| >3(middle, red, and black nodes), in which red nodes and red lines are overlapped with those key nodes and lines discriminated in the joint independent component (IC) in the discovery cohort.
Dow
nloaded from https://academ
ic.oup.com/schizophreniabulletin/article/45/2/436/4979817 by guest on 28 June 2022

442
S. Liu et al
Association With Working Memory Performance
Correlation analysis with DS results also indicated that 2 components have positive correlations with DB
scores (GM_IC13_D:r = .14, P = .00096*; FA_IC5_D: r = .15, P = .00062*; as shown in figures 4A and 4B), in which higher DB number represents better working
Fig. 3. Spatial maps and scatter plot of the 3 components significantly correlated with Auditory Hallucinations Rating Scale (AHRS). (A) Regional homogeneity (ReHo) IC8; (B) gray matter (GM) IC13; the spatial maps (top) of ReHo and GM were visualized at |Z| >2.5, with the positive Z scores shown in red. (C) Functional network connectivity (FNC) IC1: the FNC component was also transformed into Z scores and visualized by BrainNet Viewer, in which red nodes are key nodes thresholded at |Z| >3 (the node size denotes FNC degree), and red lines means healthy controls (HCs) have higher functional connectivity (FC) strength than schizophrenia (SZ), while blue lines means HCs have lower FC strength than SZs. These edges and nodes of FNC_IC1 were mapped upon the surface mapping of ReHo IC8 in (C), indicating a high coherence between ReHo and FNC component associated with AHRS, while all 3 components demonstrate high spatial consistence.
Dow
nloaded from https://academ
ic.oup.com/schizophreniabulletin/article/45/2/436/4979817 by guest on 28 June 2022

443
Linked 4-Way Multimodal Brain Differences in Schizophrenia
memory performance. These correlations were still signif-icant after regressing out the diagnosis (group label), ie, GM_IC13_D: r = .13, P = .004*; FA_IC5_D: r = .175,
P = 5.9e−05*. Note that this GM component was the same IC anticorrelated with AHRS, involving DLPFC, mPFC, and thalamus, while the FA component covered
Fig. 4. The identified components associated with working memory ability from 4-way fusion analysis within each cohort separately. All correlations are significant after controlling group effect as shown above. (A, B): gray matter (GM) and fractional anisotropy (FA) component from discovery cohort. (C, D): GM and FA components from validation cohort. Note that (A) and (C), (B) and (D) demonstrate a relatively high spatial consistence (overlap), with significant 3D spatial correlation r = .64 and r = .16 for GM and FA, respectively, P < 1.0e−10.
Dow
nloaded from https://academ
ic.oup.com/schizophreniabulletin/article/45/2/436/4979817 by guest on 28 June 2022

444
S. Liu et al
WM tracts such as corticospinal tract (CST), SLF, and ATR that pass through the regions identified in GM_IC13_D. The higher WM integrity in these tracts corre-sponds to better working memory performance.
In the validation data, we also found 2 components cor-related with DB scores (GM_IC2_V: r = .26, P = .0076*; FA_IC5_V: r = .20, P = .039; as shown in figures 4C and 4D). Similarly, these correlations were still significant after regressing out the diagnosis (group label), ie, GM_IC2_V: r = .24, P = .014; FA_IC5_V: r = .22, P = .04. Interestingly, spatial consistence was achieved between 2 cohorts on the identified brain regions associated with working memory ability. Namely, the voxel-wise spatial correlation between components in figures 4A vs 4C and figures 4B vs 4D are r = .64 (P < 1.0e−20) and r = .16 (P < 1.0e−10), respectively, implicating the functional and structural covariation in SZ was generally replicable.
Discussion
To the best of our knowledge, this is the first attempt to combine 4 aspects of brain features to characterize schiz-ophrenic impairment by using a data-driven, multimodal fusion approach9 for a large pure Chinese Han population (307 SZs/298 HCs). We identified linked changes in func-tional–structural measures spanning multiple imaging modalities, which were further investigated by evaluating their associations with the severity of auditory hallucina-tion and working memory performance.
Functional and Structural Covariation
Consistent with the hypothesis that SZ is a syndrome with a functionally and anatomically widespread brain deficits and disconnectivity,41,42 we identified widely distributed brain networks impaired in SZ that covary in 2 or more of the 4 imaging features. Specifically, subcortical regions including putamen, caudate, and hippocampus indicated severe deficits and were involved in multiple imaging fea-tures. We found increased ReHo in the striatum in SZ, consistent with the meta-analysis reported in Xu et al,43 coaltered with the lower FNC in SZ in the basal ganglia (putamen)-sensorimotor network,44 as well as the lower WM integrity in cortical spinal tract that subserves motor control. This neuronal loop serves as the basis of various functions of the basal ganglia, including motor, cogni-tive control, motivation, and emotional processing,45 of which dysfunction in SZ has been frequently reported.46–48 Similar findings were reported in an adolescent-onset SZ study,49 in which motor cortices and WM CST tracts were simultaneously detected. Furthermore, we also identi-fied abnormal changes of SZ in the frontoparietal net-work (FPN, comprising DLPFC and IPL), co-occurring in both ReHo and FNC features, as well as lower FAs in the dorsal component of SLF,50,51 which originates in the superior and medial parietal cortex, passes around the
cingulate sulcus, and terminates in the dorsal and medial frontal lobe. Recent findings have demonstrated striatal dopamine receptors can mediate information transfer in FPN,52 which plays a central role in cognitive impairment in SZ.53,54 All above multimodal findings shared from both cohorts (supplementary tables S3–S10) together pro-vide indirect support for the inference55 that disruptions in the basal ganglia-prefrontal network are significant in SZ, which may be associated with the corresponding dys-function of SZ in cognitive control/working memory.56,57 Moreover, our study further elucidates this by revealing significant pairwise intermodality correlations between the subject loading parameters (FA-ReHo: r = .25, P = 4.1e−10*; FA-GM: r = .27, P = 2.6e−11*; ReHo-GM: r = .18, P = 5.6e−06* in discovery cohort), which depicts a closely linked functional–anatomical system.
In addition, multimodal hippocampal abnormalities in SZ emerged with the increased hippocampal ReHo and decreased GM volume compared with HCs, which may be associated with impaired memory and emo-tional function in SZ,58 consistent with the meta-analysis results.43,59–61 Higher ReHo in fusiform and visual cortex (V2–V5) combined with lower FA in FMAJ and IFO tracts that passing through these regions were also iden-tified in SZ.62,63 Such hippocampal–prefrontal–occipital coupling in both brain function and structure suggests that they mutually contribute to a wide array of cognitive processes perturbed in SZ.60
Regarding the identified cortical regions, the SAN64 that is associated with cognitive deficit in many psycho-sis studies65,66 was identified in 3 features in both cohorts, indicating lower GM volume,67 higher ReHo in insu-lar,68–71 and hypoconnectivity between the PFC and the anterior insula in SZ, again supported by many unimodal and multimodal studies.65,72 Moreover, the GM volume in the SAN (GM_IC12_D) is also negatively correlated with the negative PANSS score also linked with cognitive impairment (supplementary figure S4).
Covarying Regions Related to Working Memory Impairment
Digit span tasks have been widely used to measure the immediate verbal recall, attentional capacity, and work-ing memory in neuropsychological research and clinical evaluations,73 comprising 2 forms: DF and DB, in which DB requires information storage and concurrent process-ing essential to mentally reordering the information, thus heavily relying on working memory.28,29,74 Several studies have found that DS tasks can activate the phonological loop (verbal memory) and involve the central executive.73,75 Here, we further validated that the higher GM in DLPFC, mPFC, STG, IPL (BA 40), and thalamus, which are key parts of FPN,52 the better working memory performance of the participants.76,77 On the other hand, a FA component including CST, SLF, and ATR has also been identified to
Dow
nloaded from https://academ
ic.oup.com/schizophreniabulletin/article/45/2/436/4979817 by guest on 28 June 2022

445
Linked 4-Way Multimodal Brain Differences in Schizophrenia
be positively correlated with digit backward scores, which is still significant after controlling for group diagnosis. Interestingly, the identified large fiber tracts in the present study connect the frontal cortex to different subcortical and/or cortical regions, eg, ATR connects to the thalamus and SLF connects to the temporal and parietal lobe, sug-gesting that the GM deficits in the frontal lobe might be impacted by the relevant associative WM tracts damage in SZ. Note that all the identified tracts in the present study, with exception of the SLF, have a right-larger or right-lateralized damage78 in SZ, consistent with recent studies on lateralization.79–81 In the validation test, we also found 2 components correlated with DB scores (GM_IC2: r = .24, P = .014; FA_IC5: r = .22, P = .04; as shown in figures 4C and 4D). Interestingly, spatial consistence was achieved between 2 cohorts on the brain regions (spatial correla-tion, P < 1.0e−10) associated with working memory abil-ity. The 3D spatial correlation between figures 4A vs 4C and figures 4B vs 4D is r = .64 and r = .16, respectively, with P < 1.0e−10 for both, implicating the functional and structural covariation in SZ was generally replicable.
Multimodal Covariation Related to Auditory Hallucinations
Many studies have reported both structural and func-tional brain disruptions involved in AVH in SZ sepa-rately,24,82–87 including the PFC (including DLPFC and mPFC), thalamus, sensorimotor cortex, and temporal lobe (mainly located in Heschl’s gyrus). Our results inte-grate the above findings in a multivariate, data-driven manner, demonstrating a high spatial coherence of brain regions correlated with AVH in ReHo, GM, and FNC fea-tures. However, unlike the consistent reductions in GM, in which lower GM volume in the above-mentioned regions associate with more severe AVH symptoms (r = −.25, P = .005*), functional components reflected a reverse ten-dency between frontal and temporal lobe. Namely, lower ReHo and weaker FC strength (red edge) in prefrontal lobe are correlated with higher AHRS scores in SZ patients, whereas higher ReHo in STG/thalamus and the stron-ger FCs (blue edges) of SZ in thalamotemporal network correspond to more severe hallucinations (higher AHRS scores). In sum, figure 3 demonstrated a synchronous change in both functional and anatomical areas impacted by AVH, but it should also be noted that the loading of the ReHo_IC8_D is only moderately correlated with AHRS scores and did not pass FDR multiple compari-son correction. Our results suggest PFC mediate inversely with STG/thalamus on generation of AVH, while all of them are disrupted in structure.88 This is supported by the ERC “VOICE” model as proposed in Hugdahl et al25,89 in which AVH is considered to be resulted from abnormality of 2 cognitive networks/systems: prefrontal hypoactiva-tion that leads to a failure of executive control and inhibi-tion and temporal lobe hyperactivation that contributes
to the process of AVH. The identified regions constitute a thalamocortical perceptual circuit, in which the temporal cortex leads to the perceptual misrepresentations, and the parietal cortex shifts attention on the “voice,” following by the failure of executive inhibition and response sup-pression due to the attenuated FC within the prefrontal cortices, altogether contributing to the generation of hal-lucinations.25,89 Note that no components were found to be correlated with AHRS scores in validation cohort. This is probably due to only 15 out of 40 SZs with severe audi-tory hallucinations are recorded in this dataset; thus, it’s hard to result in a significant correlation.
Limitation and Future Directions
A limitation to the current study is that information on antipsychotic or mood stabilizing medications for part of the patients were unavailable, which makes it difficult to assess the medication effect that may result in certain structural and functional changes,90,91 though some of the patients were in their first episode. Another point worth noting is that we did not collect tobacco or alcohol use for all the participants during the rest fMRI session. Furthermore, with regard to the FNC feature, several brain regions in particular subcortical nuclei, eg, thala-mus, commonly implicated in SZ were not shown in the selected ICs. To address this issue, either a seed-based approach or the atlas-based functional connectivities92–94 could be a choice of features for fusion in future work.
In addition, from the perspective of methodology, sev-eral issues should be mentioned. First, in our article, 4 dif-ferent features were extracted from 3 different modalities as the input of the 4-way mCCA + jICA fusion frame-work, of which the ReHo and FNC maps were filtered within the range of 0.01–0.08 Hz in the preprocessing step. However, real connectivity in the human brain may take place in the subsecond range. To address this issue, integrating MEG or EEG measurements may be an alter-native strategy. Second, our analyses are focusing on the macroscale level, not linking with microscale analyses. In the featured research, the integration of translational research, postmortem analyses, or integration of myelin measurements are the promising trends and direction. Finally, non-neuronal activity, eg, heart rate variabil-ity (HRV),95 microRNAs (miRNAs),96 glucocorticoids,97 and glial cells (including astrocyte, oligodendrocyte, and microglia)98 may play an important role in several psy-chiatric diseases and is not easily monitored. Future methods based on supervised learning96,99 that are able to incorporate such non-neuronal activity as references to guide imaging fusion may provide more insight into the underlying mechanism of psychiatric diseases.
More importantly, the strength of multimodal fusion is its ability to find or validate new discovery that may not be detected by separate unimodal analyses.18,100 For exam-ple, some previous findings24,82 suggested that decreased
Dow
nloaded from https://academ
ic.oup.com/schizophreniabulletin/article/45/2/436/4979817 by guest on 28 June 2022

446
S. Liu et al
N-acetyl-aspartate (NAA)/choline ratios101 and increased activation85,102 in thalamus may be associated with the severity of hallucinations, but no evidence support the inference that the thalamus is directly involved in AVH. By contrast, our data-driven analysis (figure 3) pro-vided proof of concept that reduced GM volume, higher regional synchronous activity, and higher FC within thalamus in SZ were all correlated with higher AVHS (more severe hallucination), supporting that thalamus is actively involved in the regulation process of prefrontal hypoactivation and temporal hyperactivation on auditory hallucinations. This promises a new direction on future analysis of multisite, high-resource data in an integrated manner—capitalizing on the relative strengths of each modality and providing results/prediction synergistically.
In sum, we are just beginning to unlock the potential of multimodal imaging, which offers unprecedented oppor-tunities to further deepen our understanding of brain disorders.4 To the best of our knowledge, this is the first attempt to comprehensively utilize 4 types of MRI fea-tures: ReHo, GM, FA, and FNC, in a joint analysis to investigate multiple impairments of SZ on a large, Chinese Han population. Our results concluded that a widely dis-tributed network disruption is evident in SZ, especially involving the BGN and FPN, which may be associated with their corresponding dysfunction in working memory performance. Moreover, results demonstrate high spatial coherence among ReHo, GM, and FNC features related to auditory hallucination and further provide evidence for the “VOICE” hypothesis25 that prefrontal hypoactivation and temporal hyperactivation in SZ may lead to failure of executive control and inhibition. By providing multiple views within one analysis integrating diverse imaging and clinical information, we may minimize incorrect conclu-sions about mental illness and offer unique perspectives on the links between the brain and mental disorders.103
Supplementary Material
Supplementary data are available at Schizophrenia Bulletin online.
Acknowledgments
This work was supported by the Chinese National Science Foundation (81471367, 61773380, and 61703253), National High-Tech Development Plan (863 program; 2015AA020513), “100 Talents Plan” of Chinese Academy of Sciences, the Strategic Priority Research Program of the Chinese Academy of Sciences (XDB02060005), and Natural Science Foundation of Shanxi (2016021077), and NIH (R01EB005846, 1R01MH094524, and P20GM103472). The data used in this study has not been ready to be shared to the general academic community at this point. The authors report no financial interests or potential conflicts of interest.
References
1. Sui J, He H, Liu J, et al. Three-way FMRI-DTI-methylation data fusion based on mCCA+jICA and its application to schizophrenia. Conf Proc IEEE Eng Med Biol Soc. 2012;2012:2692–2695.
2. Guye M, Bartolomei F, Ranjeva JP. Imaging structural and functional connectivity: towards a unified definition of human brain organization? Curr Opin Neurol. 2008;21:393–403.
3. Pearlson GD, Calhoun V. Structural and functional magnetic resonance imaging in psychiatric disorders. Can J Psychiatry. 2007;52:158–166.
4. Sui J, Yu Q, He H, Pearlson GD, Calhoun VD. A selective review of multimodal fusion methods in schizophrenia. Front Hum Neurosci. 2012;6:27.
5. Calhoun VD, Adali T, Giuliani NR, Pekar JJ, Kiehl KA, Pearlson GD. Method for multimodal analysis of independ-ent source differences in schizophrenia: combining gray mat-ter structural and auditory oddball functional data. Hum Brain Mapp. 2006;27:47–62.
6. Correa NM, Adali T, Li YO, Calhoun VD. Canonical cor-relation analysis for data fusion and group inferences: exam-ining applications of medical imaging data. IEEE Signal Process Mag. 2010;27:39–50.
7. Plis SM, Weisend MP, Damaraju E, et al. Effective connectiv-ity analysis of fMRI and MEG data collected under identical paradigms. Comput Biol Med. 2011;41:1156–1165.
8. Sui J, Pearlson G, Caprihan A, et al. Discriminating schiz-ophrenia and bipolar disorder by fusing fMRI and DTI in a multimodal CCA+ joint ICA model. Neuroimage. 2011;57:839–855.
9. Sui J, He H, Pearlson GD, et al. Three-way (N-way) fusion of brain imaging data based on mCCA+jICA and its application to discriminating schizophrenia. Neuroimage. 2013;66:119–132.
10. Sui J, He H, Yu Q, et al. Combination of resting state fMRI, DTI, and sMRI data to discriminate schizophrenia by N-way MCCA + jICA. Front Hum Neurosci. 2013;7:235.
11. Sui J, Adali T, Pearlson G, et al. A CCA+ICA based model for multi-task brain imaging data fusion and its application to schizophrenia. Neuroimage. 2010;51:123–134.
12. Sui J, Pearlson GD, Du Y, et al. In search of multimodal neu-roimaging biomarkers of cognitive deficits in schizophrenia. Biol Psychiatry. 2015;78:794–804.
13. Oertel-Knöchel V, Reinke B, Feddern R, et al. Episodic memory impairments in bipolar disorder are associated with functional and structural brain changes. Bipolar Disord. 2014;16:830–845.
14. Vasic N, Wolf ND, Grön G, et al. Baseline brain perfusion and brain structure in patients with major depression: a multimodal magnetic resonance imaging study. J Psychiatry Neurosci. 2015;40:412–421.
15. Kim SG, Jung WH, Kim SN, Jang JH, Kwon JS. Alterations of gray and white matter networks in patients with obses-sive-compulsive disorder: a multimodal fusion analysis of structural MRI and DTI Using mCCA+jICA. PLoS One. 2015;10:e0127118.
16. Itahashi T, Yamada T, Nakamura M, et al. Linked alterations in gray and white matter morphology in adults with high-functioning autism spectrum disorder: a multimodal brain imaging study. Neuroimage Clin. 2015;7:155–169.
17. Zhao F, Qiao L, Shi F, Yap P-T, Shen D. Feature fusion via hierarchical supervised local CCA for diagnosis of autism spectrum disorder. Brain Imaging Behav. 2017;11:1050–1060.
Dow
nloaded from https://academ
ic.oup.com/schizophreniabulletin/article/45/2/436/4979817 by guest on 28 June 2022

447
Linked 4-Way Multimodal Brain Differences in Schizophrenia
18. Calhoun VD, Sui J. Multimodal fusion of brain imaging data: a key to finding the missing link(s) in complex men-tal illness. Biol Psychiatry Cogn Neurosci Neuroimaging. 2016;1:230–244.
19. Jafri MJ, Pearlson GD, Stevens M, Calhoun VD. A method for functional network connectivity among spatially independ-ent resting-state components in schizophrenia. Neuroimage. 2008;39:1666–1681.
20. Zang Y, Jiang T, Lu Y, He Y, Tian L. Regional homo-geneity approach to fMRI data analysis. Neuroimage. 2004;22:394–400.
21. Biswal B, Yetkin FZ, Haughton VM, Hyde JS. Functional connectivity in the motor cortex of resting human brain using echo-planar MRI. Magn Reson Med. 1995;34:537–541.
22. Andreasen NC, Flaum M. Schizophrenia: the characteristic symptoms. Schizophr Bull. 1991;17:27–49.
23. Ford JM, Roach BJ, Jorgensen KW, et al.; FBIRN. Tuning in to the voices: a multisite FMRI study of auditory hallucina-tions. Schizophr Bull. 2009;35:58–66.
24. Allen P, Modinos G, Hubl D, et al. Neuroimaging auditory hallucinations in schizophrenia: from neuroanatomy to neu-rochemistry and beyond. Schizophr Bull. 2012;38:695–703.
25. Hugdahl K. Auditory hallucinations: a review of the ERC “VOICE” project. World J Psychiatry. 2015;5:193–209.
26. Hoffman RE, Hawkins KA, Gueorguieva R, et al. Transcranial magnetic stimulation of left temporoparietal cortex and medication-resistant auditory hallucinations. Arch Gen Psychiatry. 2003;60:49–56.
27. Kay SR, Fiszbein A, Opler LA. The Positive and Negative Syndrome Scale (PANSS) for schizophrenia. Schizophr Bull. 1987;13:261–276.
28. Wilde NJ, Strauss E, Tulsky DS. Memory span on the Wechsler scales. J Clin Exp Neuropsychol. 2004;26:539–549.
29. Black FW, Strub RL. Digit repetition performance in patients with focal brain damage. Cortex. 1978;14:12–21.
30. Smith SM, Fox PT, Miller KL, et al. Correspondence of the brain’s functional architecture during activation and rest. Proc Natl Acad Sci USA. 2009;106:13040–13045.
31. Calhoun VD, Adali T. Feature-based fusion of medical imag-ing data. IEEE Trans Inf Technol Biomed. 2009;13:711–720.
32. Liu D, Yan C, Ren J, Yao L, Kiviniemi VJ, Zang Y. Using coherence to measure regional homogeneity of resting-state FMRI signal. Front Syst Neurosci. 2010;4:24.
33. He H, Sui J, Du Y, et al. Co-altered functional networks and brain structure in unmedicated patients with bipo-lar and major depressive disorders. Brain Struct Funct. 2017;222:4051–4064.
34. Erhardt E, Rachakonda S, Bedrick E, Allen E, Adali T, Calhoun VD. Comparison of multi-subject ICA methods for analysis of fMRI data. Hum Brain Mapp. 2011; 32:2075–2095.
35. Du Y, Fan Y. Group information guided ICA for fMRI data analysis. Neuroimage. 2013;69:157–197.
36. Zhu D, Zhang T, Jiang X, et al. Fusing DTI and fMRI data: a survey of methods and applications. Neuroimage. 2014;102(Pt 1):184–191.
37. Li YO, Adali T, Calhoun VD. Estimating the number of independent components for functional magnetic resonance imaging data. Hum Brain Mapp. 2007;28:1251–1266.
38. Alderson-Day B, Diederen K, Fernyhough C, et al. Auditory hallucinations and the brain’s resting-state networks: find-ings and methodological observations. Schizophr Bull. 2016;42:1110–1123.
39. Thoma RJ, Chaze C, Lewine JD, et al. Functional MRI eval-uation of multiple neural networks underlying auditory ver-bal hallucinations in schizophrenia spectrum disorders. Front Psychiatry. 2016;7:39.
40. Menon V, Uddin LQ. Saliency, switching, attention and con-trol: a network model of insula function. Brain Struct Funct. 2010;214:655–667.
41. Friston KJ, Frith CD. Schizophrenia: a disconnection syn-drome? Clin Neurosci. 1995;3:89–97.
42. Liang M, Zhou Y, Jiang T, et al. Widespread functional dis-connectivity in schizophrenia with resting-state functional magnetic resonance imaging. Neuroreport. 2006;17:209–213.
43. Xu Y, Zhuo C, Qin W, Zhu J, Yu C. Altered spontaneous brain activity in schizophrenia: a meta-analysis and a large-sample study. Biomed Res Int. 2015;2015:204628.
44. Cui LB, Liu K, Li C, et al. Putamen-related regional and net-work functional deficits in first-episode schizophrenia with auditory verbal hallucinations. Schizophr Res. 2016;173:13–22.
45. Cropley VL, Fujita M, Innis RB, Nathan PJ. Molecular imaging of the dopaminergic system and its association with human cognitive function. Biol Psychiatry. 2006;59: 898–907.
46. Walther S, Federspiel A, Horn H, et al. Resting state cer-ebral blood flow and objective motor activity reveal basal ganglia dysfunction in schizophrenia. Psychiatry Res. 2011;192:117–124.
47. Sorg C, Manoliu A, Neufang S, et al. Increased intrinsic brain activity in the striatum reflects symptom dimensions in schizophrenia. Schizophr Bull. 2013;39:387–395.
48. Schlagenhauf F, Huys QJ, Deserno L, et al. Striatal dysfunc-tion during reversal learning in unmedicated schizophrenia patients. Neuroimage. 2014;89:171–180.
49. Douaud G, Smith S, Jenkinson M, et al. Anatomically related grey and white matter abnormalities in adolescent-onset schizophrenia. Brain. 2007;130:2375–2386.
50. Kamali A, Flanders AE, Brody J, Hunter JV, Hasan KM. Tracing superior longitudinal fasciculus connectivity in the human brain using high resolution diffusion tensor tractog-raphy. Brain Struct Func. 2014;219(1): 269–281.
51. Makris N, Kennedy DN, McInerney S, et al. Segmentation of subcomponents within the superior longitudinal fascicle in humans: a quantitative, in vivo, DT-MRI study. Cereb Cortex. 2005;15:854–869.
52. Rieckmann A, Karlsson S, Fischer H, Bäckman L. Caudate dopamine D1 receptor density is associated with individual differences in frontoparietal connectivity during working memory. J Neurosci. 2011;31:14284–14290.
53. Cole MW, Reynolds JR, Power JD, Repovs G, Anticevic A, Braver TS. Multi-task connectivity reveals flexible hubs for adaptive task control. Nat Neurosci. 2013;16:1348–1355.
54. Elvevåg B, Goldberg TE. Cognitive impairment in schizo-phrenia is the core of the disorder. Crit Rev Neurobiol. 2000;14:1–21.
55. Ceaser AE, Barch DM. Striatal activity is associated with deficits of cognitive control and aberrant salience for patients with schizophrenia. Front Hum Neurosci. 2015;9:687.
56. Yoon JH, Minzenberg MJ, Raouf S, D’Esposito M, Carter CS. Impaired prefrontal-basal ganglia functional connectiv-ity and substantia nigra hyperactivity in schizophrenia. Biol Psychiatry. 2013;74:122–129.
57. Duan M, Chen X, He H, et al. Altered basal ganglia net-work integration in schizophrenia. Front Hum Neurosci. 2015;9:561.
Dow
nloaded from https://academ
ic.oup.com/schizophreniabulletin/article/45/2/436/4979817 by guest on 28 June 2022

448
S. Liu et al
58. Ragland JD, Layher E, Hannula DE, et al. Impact of schizo-phrenia on anterior and posterior hippocampus during mem-ory for complex scenes. Neuroimage Clin. 2017;13:82–88.
59. Wexler BE, Zhu H, Bell MD, et al. Neuropsychological near normality and brain structure abnormality in schizophrenia. Am J Psychiatry. 2009;166:189–195.
60. Godsil BP, Kiss JP, Spedding M, Jay TM. The hippocampal-prefrontal pathway: the weak link in psychiatric disorders? Eur Neuropsychopharmacol. 2013;23:1165–1181.
61. Zhou Y, Shu N, Liu Y, et al. Altered resting-state functional connectivity and anatomical connectivity of hippocampus in schizophrenia. Schizophr Res. 2008;100:120–132.
62. Grill-Spector K, Weiner KS. The functional architecture of the ventral temporal cortex and its role in categorization. Nat Rev Neurosci. 2014;15:536–548.
63. Weiner KS, Grill-Spector K. The improbable simplicity of the fusiform face area. Trends Cogn Sci. 2012;16:251–254.
64. Williamson PC, Allman JM. A framework for interpreting functional networks in schizophrenia. Front Hum Neurosci. 2012;6:184.
65. Penner J, Ford KA, Taylor R, et al. Medial prefrontal and ante-rior insular connectivity in early schizophrenia and major depres-sive disorder: a resting functional MRI evaluation of large-scale brain network models. Front Hum Neurosci. 2016;10:132.
66. Moran LV, Tagamets MA, Sampath H, et al. Disruption of anterior insula modulation of large-scale brain networks in schizophrenia. Biol Psychiatry. 2013;74:467–474.
67. Yu R, Hsieh MH, Wang HL, et al. Frequency dependent alterations in regional homogeneity of baseline brain activity in schizophrenia. PLoS One. 2013;8:e57516.
68. Spalletta G, Piras F, Alex Rubino I, Caltagirone C, Fagioli S. Fronto-thalamic volumetry markers of somatic delu-sions and hallucinations in schizophrenia. Psychiatry Res. 2013;212:54–64.
69. Takahashi T, Wood SJ, Soulsby B, et al. Follow-up MRI study of the insular cortex in first-episode psychosis and chronic schizophrenia. Schizophr Res. 2009;108:49–56.
70. Palaniyappan L, Liddle PF. Does the salience network play a cardinal role in psychosis? An emerging hypothesis of insular dysfunction. J Psychiatry Neurosci. 2012;37:17–27.
71. Palaniyappan L, White TP, Liddle PF. The concept of sali-ence network dysfunction in schizophrenia: from neuroimag-ing observations to therapeutic opportunities. Curr Top Med Chem. 2012;12:2324–2338.
72. Schultz CC, Koch K, Wagner G, et al. Reduced anterior cingulate cognitive activation is associated with prefrontal-temporal cortical thinning in schizophrenia. Biol Psychiatry. 2012;71:146–153.
73. Ostrosky‐Solís F, Lozano A. Digit span: effect of education and culture. Int J Psychol. 2006;41:333–341.
74. Laures-Gore J, Marshall RS, Verner E. Performance of indi-viduals with left-hemisphere stroke and aphasia and individu-als with right brain damage on forward and backward digit span tasks. Aphasiology. 2011;25:43–56.
75. Baddeley A. The episodic buffer: a new component of work-ing memory? Trends Cogn Sci. 2000;4:417–423.
76. Potkin SG, Turner JA, Brown GG, et al.; FBIRN. Working memory and DLPFC inefficiency in schizophrenia: the FBIRN study. Schizophr Bull. 2009;35:19–31.
77. Cannon TD, van Erp TG, Huttunen M, et al. Regional gray matter, white matter, and cerebrospinal fluid distributions in schizophrenic patients, their siblings, and controls. Arch Gen Psychiatry. 1998;55:1084–1091.
78. Spoletini I, Cherubini A, Di Paola M, et al. Reduced fronto-temporal connectivity is associated with frontal gray matter density reduction and neuropsychological deficit in schizo-phrenia. Schizophr Res. 2009;108:57–68.
79. Yan H, Tian L, Yan J, et al. Functional and anatomical con-nectivity abnormalities in cognitive division of anterior cin-gulate cortex in schizophrenia. PLoS One. 2012;7:e45659.
80. Gong G, Jiang T, Zhu C, et al. Asymmetry analysis of cingu-lum based on scale-invariant parameterization by diffusion tensor imaging. Hum Brain Mapp. 2005;24:92–98.
81. Agcaoglu O, Miller R, Damaraju E, et al. Decreased hemispheric connectivity and decreased intra- and inter- hemisphere asym-metry of resting state functional network connectivity in schiz-ophrenia. Brain Imaging Behav. 2017;1–16.
82. Allen P, Larøi F, McGuire PK, Aleman A. The hallucinat-ing brain: a review of structural and functional neuroim-aging studies of hallucinations. Neurosci Biobehav Rev. 2008;32:175–191.
83. Kühn S, Gallinat J. Quantitative meta-analysis on state and trait aspects of auditory verbal hallucinations in schizophre-nia. Schizophr Bull. 2012;38:779–786.
84. Neckelmann G, Specht K, Lund A, et al. Mr morphometry analysis of grey matter volume reduction in schizophrenia: association with hallucinations. Int J Neurosci. 2006;116:9–23.
85. Shergill SS, Brammer MJ, Williams SC, Murray RM, McGuire PK. Mapping auditory hallucinations in schizo-phrenia using functional magnetic resonance imaging. Arch Gen Psychiatry. 2000;57:1033–1038.
86. Jardri R, Pouchet A, Pins D, Thomas P. Cortical activa-tions during auditory verbal hallucinations in schizophre-nia: a coordinate-based meta-analysis. Am J Psychiatry. 2011;168:73–81.
87. Huang P, Xi Y, Lu ZL, et al. Decreased bilateral thalamic gray matter volume in first-episode schizophrenia with prom-inent hallucinatory symptoms: a volumetric MRI study. Sci Rep. 2015;5:14505.
88. Jardri R, Thomas P, Delmaire C, Delion P, Pins D. The neu-rodynamic organization of modality-dependent hallucina-tions. Cereb Cortex. 2013;23:1108–1117.
89. Hugdahl K, Løberg EM, Nygård M. Left temporal lobe struc-tural and functional abnormality underlying auditory hallu-cinations in schizophrenia. Front Neurosci. 2009;3:34–45.
90. Ho BC, Andreasen NC, Ziebell S, Pierson R, Magnotta V. Long-term antipsychotic treatment and brain volumes: a longitudinal study of first-episode schizophrenia. Arch Gen Psychiatry. 2011;68:128–137.
91. Lui S, Li T, Deng W, et al. Short-term effects of antipsychotic treatment on cerebral function in drug-naive first-episode schizophrenia revealed by “resting state” functional magnetic resonance imaging. Arch Gen Psychiatry. 2010;67:783–792.
92. Fan L, Li H, Zhuo J, et al. The human Brainnetome atlas: a new brain atlas based on connectional architecture. Cereb Cortex. 2016;26:3508–3526.
93. Glasser MF, Coalson TS, Robinson EC, et al. A multi-modal parcellation of human cerebral cortex. Nature. 2016;536:171–178.
94. Yeo BT, Krienen FM, Sepulcre J, et al. The organization of the human cerebral cortex estimated by intrinsic functional connectivity. J Neurophysiol. 2011;106:1125–1165.
95. Abhishekh HA, Kumar NC, Thirthalli J, Chandrashekar H, Gangadhar BN, Sathyaprabha TN. Prolonged reaction to mental arithmetic stress in first-degree relatives of schizophre-nia patients. Clin Schizophr Relat Psychoses. 2014;8:137–142.
Dow
nloaded from https://academ
ic.oup.com/schizophreniabulletin/article/45/2/436/4979817 by guest on 28 June 2022

449
Linked 4-Way Multimodal Brain Differences in Schizophrenia
96. Qi S, Yang X, Zhao L, et al. MicroRNA132 associated multi-modal neuroimaging patterns in unmedicated major depres-sive disorder. Brain. 2018;141:916–926.
97. Yang X, Ewald ER, Huo Y, et al. Glucocorticoid-induced loss of DNA methylation in non-neuronal cells and potential involvement of DNMT1 in epigenetic regulation of Fkbp5. Biochem Biophys Res Commun. 2012;420:570–575.
98. Elsayed M, Magistretti PJ. A new outlook on mental ill-nesses: glial involvement beyond the glue. Front Cell Neurosci. 2015;9:468.
99. Qi S, Calhoun VD, van Erp TGM, et al. Multimodal fusion with reference: searching for joint neuromarkers of working memory deficits in schizophrenia. IEEE Trans Med Imaging. 2018;37:93–105.
100. Meng X, Jiang R, Lin D, et al. Predicting individualized clini-cal measures by a generalized prediction framework and mul-timodal fusion of MRI data. Neuroimage. 2017;145:218–229.
101. Martínez-Granados B, Brotons O, Martínez-Bisbal MC, et al. Spectroscopic metabolomic abnormalities in the thala-mus related to auditory hallucinations in patients with schizo-phrenia. Schizophr Res. 2008;104:13–22.
102. Silbersweig DA, Stern E, Frith C, et al. A functional neu-roanatomy of hallucinations in schizophrenia. Nature. 1995;378:176–179.
103. Sui J, He H, Liu J, et al. Three-way FMRI-DTI-methylation data fusion based on mCCA+jICA and its application to schizophrenia. Conf Proc IEEE Eng Med Biol Soc. 2012;2012:2692–2695.
Dow
nloaded from https://academ
ic.oup.com/schizophreniabulletin/article/45/2/436/4979817 by guest on 28 June 2022