Linear and second-order nonlinear optical properties of ionic organic crystals
11
Linear and second-order nonlinear optical properties of ionic organic crystals Tomasz Seidler, Katarzyna Stadnicka, and Benoît Champagne Citation: The Journal of Chemical Physics 141, 104109 (2014); doi: 10.1063/1.4894483 View online: http://dx.doi.org/10.1063/1.4894483 View Table of Contents: http://scitation.aip.org/content/aip/journal/jcp/141/10?ver=pdfcov Published by the AIP Publishing Articles you may be interested in Investigation of the linear and second-order nonlinear optical properties of molecular crystals within the local field theory J. Chem. Phys. 139, 114105 (2013); 10.1063/1.4819769 Large second-order optical nonlinearity in a ferroelectric molecular crystal of croconic acid with strong intermolecular hydrogen bonds Appl. Phys. Lett. 102, 162901 (2013); 10.1063/1.4802727 Theoretical investigation on the linear and nonlinear susceptibilities of urea crystal J. Chem. Phys. 128, 244713 (2008); 10.1063/1.2938376 First-principles calculations of band structures and dynamic optical properties of CsCdBr 3 and RbCdI 3 H 2 O crystals J. Appl. Phys. 99, 013516 (2006); 10.1063/1.2159086 The mechanism of linear and nonlinear optical effects in fluoride crystals J. Appl. Phys. 98, 033504 (2005); 10.1063/1.1977199 This article is copyrighted as indicated in the article. Reuse of AIP content is subject to the terms at: http://scitation.aip.org/termsconditions. Downloaded to IP: 31.31.132.41 On: Thu, 11 Sep 2014 17:21:32
Transcript of Linear and second-order nonlinear optical properties of ionic organic crystals
Linear and second-order nonlinear optical properties of ionic organic crystalsTomasz Seidler, Katarzyna Stadnicka, and Benoît Champagne
Citation: The Journal of Chemical Physics 141, 104109 (2014); doi: 10.1063/1.4894483 View online: http://dx.doi.org/10.1063/1.4894483 View Table of Contents: http://scitation.aip.org/content/aip/journal/jcp/141/10?ver=pdfcov Published by the AIP Publishing Articles you may be interested in Investigation of the linear and second-order nonlinear optical properties of molecular crystals within the local fieldtheory J. Chem. Phys. 139, 114105 (2013); 10.1063/1.4819769 Large second-order optical nonlinearity in a ferroelectric molecular crystal of croconic acid with strongintermolecular hydrogen bonds Appl. Phys. Lett. 102, 162901 (2013); 10.1063/1.4802727 Theoretical investigation on the linear and nonlinear susceptibilities of urea crystal J. Chem. Phys. 128, 244713 (2008); 10.1063/1.2938376 First-principles calculations of band structures and dynamic optical properties of CsCdBr 3 and RbCdI 3 H 2 Ocrystals J. Appl. Phys. 99, 013516 (2006); 10.1063/1.2159086 The mechanism of linear and nonlinear optical effects in fluoride crystals J. Appl. Phys. 98, 033504 (2005); 10.1063/1.1977199
This article is copyrighted as indicated in the article. Reuse of AIP content is subject to the terms at: http://scitation.aip.org/termsconditions. Downloaded to IP:
31.31.132.41 On: Thu, 11 Sep 2014 17:21:32
THE JOURNAL OF CHEMICAL PHYSICS 141, 104109 (2014)
Linear and second-order nonlinear optical propertiesof ionic organic crystals
Tomasz Seidler,1,2,a) Katarzyna Stadnicka,1 and Benoît Champagne2,a)
1Faculty of Chemistry, Jagiellonian University, ul, Ingardena 3, 30-060 Kraków, Poland2Laboratoire de Chimie Théorique, University of Namur, rue de Bruxelles, 61, B-5000 Namur, Belgium
(Received 7 July 2014; accepted 21 August 2014; published online 11 September 2014)
The linear and second-order nonlinear optical susceptibilities of three ionic organic crys-tals, 4-N,N-dimethylamino-4′-N′-methyl-stilbazolium tosylate (DAST), 4-N,N-dimethylamino-4′-N′-methyl-stilbazolium 2,4,6-trimethylbenzenesulfonate (DSTMS), and 4-N,N-dimethylamino-4′-N′-phenyl-stilbazolium hexafluorophosphate (DAPSH), have been calculated by adopting a two-stepmulti-scale procedure, which consists in calculating: (i) the ion properties using ab initio or den-sity functional theory methods and then (ii) in accounting for the crystal environment effects usingclassical electrostatic models. Provided that the ionic properties are evaluated at the second-orderMøller-Plesset level and that the dressing field effects using point charges are accounted for, theagreement with experiment is excellent and enables to explain the origin of the larger χ (2) responseof DAPSH with respect to DAST and DSTMS. The study has also demonstrated that including thedressing field leads to a decrease of the χ (2) response of ionic crystals whereas its effect is oppositefor molecular crystals. Moreover, the results have also demonstrated that this multi-scale approachcan be used to interpret the impact of the nature and position of the counterion on the linear andnonlinear optical susceptibilities of ionic crystals. Finally, it has been shown that the use of a conven-tional exchange-correlation functional like B3LYP leads to severe overestimations of χ (1) but largeunderestimations of χ (2) whereas the use of homogeneous dipole field is not recommended becauseit usually leads to overestimations of the linear and nonlinear optical susceptibilities. © 2014 AIPPublishing LLC. [http://dx.doi.org/10.1063/1.4894483]
I. INTRODUCTION
Organic nonlinear crystals are subject to extensiveinvestigations because of their potential applications inmodern telecommunication and opto-electronics owing tothe electronic origin of their fast responses.1 One of thegreat advantages of this class of materials is the flexibilityin their design. Following a special set of rules one isable to maximize the molecular second-order nonlinearresponse of the chromophore, the first hyperpolarizabil-ity, β. However, the demand for molecular asymmetryusually leads to large ground state dipole moments of thechromophores, which therefore usually crystallize in acentrosymmetric fashion, thus canceling out the macroscopicsecond-order nonlinearity, χ (2). One of the strategies toovercome this tendency is to make use of the strong Coulombinteractions,2 which has led to the preparation, amongothers, of 4-N,N-dimethylamino-4′-N′-methyl-stilbazoliumtosylate (DAST), 4-N,N-dimethylamino-4′-N′-methyl-stilbazolium 2,4,6-trimethylbenzenesulfonate (DSTMS), and4-N,N-dimethylamino-4′-N′-phenyl-stilbazolium hexafluo-rophosphate (DAPSH). DAST was described for the firsttime by Marder et al.3 in 1989 and it is still considered themost promising organic nonlinear optical (NLO) crystal,especially for electrooptic applications and broadband THzwave generation.4 Still, the experimentally determined
a)Electronic addresses: [email protected] [email protected].
non-resonant SHG susceptibilities of DAPSH were shown tobe even superior to those of DAST.5
The aim of this study is to demonstrate how the LocalField Theory can successfully calculate and interpret the χ (1)
and χ (2) tensors of ionic organic crystals. Indeed, this ap-proach is usually employed to characterize χ (1) and χ (2) ofmolecular crystals, as illustrated by the recent investigation on2-methyl-4-nitroaniline (MNA) and 4-(N,N-dimethylamino)-3-acetamidonitrobenzene (DAN), of which the unit cells arebuilt from one type of neutral molecules.6 Therefore, in thispaper, we concentrate on the aspects of the calculations thatare specific to the ionic crystals.
The work is organized as follows: (i) Sec. II summarizesthe methodology for determining the χ (1) and χ (2) tensors aswell as the properties of the isolated ions, (ii) the results arediscussed in Sec. III; first, on the isolated cations propertiesby emphasizing on the influence of the chromophore confor-mation and of the in-crystal surrounding on the NLO-phoreproperties, (iii) then, the macroscopic electric properties arepresented and analyzed, and (iv) finally the conclusions aredrawn.
II. THEORETICAL METHODS AND COMPUTATIONALDETAILS
Starting from X-ray diffraction data,7–9 the geome-try was optimized with CRYSTAL0910, 11 at the B3LYP/6-31G(d,p) level of theory. Only the fractional coordinates were
0021-9606/2014/141(10)/104109/10/$30.00 © 2014 AIP Publishing LLC141, 104109-1
This article is copyrighted as indicated in the article. Reuse of AIP content is subject to the terms at: http://scitation.aip.org/termsconditions. Downloaded to IP:
31.31.132.41 On: Thu, 11 Sep 2014 17:21:32
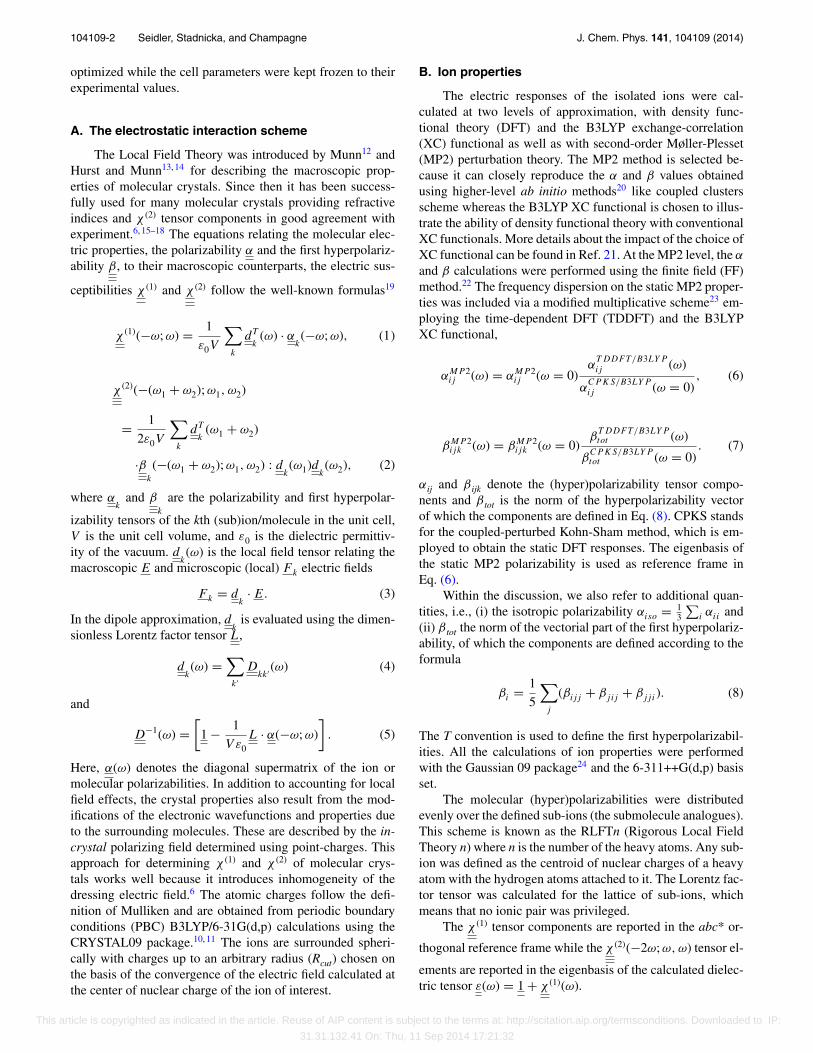
104109-2 Seidler, Stadnicka, and Champagne J. Chem. Phys. 141, 104109 (2014)
optimized while the cell parameters were kept frozen to theirexperimental values.
A. The electrostatic interaction scheme
The Local Field Theory was introduced by Munn12 andHurst and Munn13, 14 for describing the macroscopic prop-erties of molecular crystals. Since then it has been success-fully used for many molecular crystals providing refractiveindices and χ (2) tensor components in good agreement withexperiment.6, 15–18 The equations relating the molecular elec-tric properties, the polarizability α and the first hyperpolariz-ability β, to their macroscopic counterparts, the electric sus-
ceptibilities χ (1) and χ (2) follow the well-known formulas19
χ (1)(−ω; ω) = 1
ε0V
∑k
dT
k(ω) · α
k(−ω; ω), (1)
χ (2)(−(ω1 + ω2); ω1, ω2)
= 1
2ε0V
∑k
dT
k(ω1 + ω2)
·βk
(−(ω1 + ω2); ω1, ω2) : dk(ω1)d
k(ω2), (2)
where αk
and βk
are the polarizability and first hyperpolar-
izability tensors of the kth (sub)ion/molecule in the unit cell,V is the unit cell volume, and ε0 is the dielectric permittiv-ity of the vacuum. d
k(ω) is the local field tensor relating the
macroscopic E and microscopic (local) Fk electric fields
Fk = dk· E. (3)
In the dipole approximation, dk
is evaluated using the dimen-sionless Lorentz factor tensor L,
dk(ω) =
∑k′
Dkk′(ω) (4)
and
D−1(ω) =[
1 − 1
V ε0
L · α(−ω; ω)
]. (5)
Here, α(ω) denotes the diagonal supermatrix of the ion ormolecular polarizabilities. In addition to accounting for localfield effects, the crystal properties also result from the mod-ifications of the electronic wavefunctions and properties dueto the surrounding molecules. These are described by the in-crystal polarizing field determined using point-charges. Thisapproach for determining χ (1) and χ (2) of molecular crys-tals works well because it introduces inhomogeneity of thedressing electric field.6 The atomic charges follow the defi-nition of Mulliken and are obtained from periodic boundaryconditions (PBC) B3LYP/6-31G(d,p) calculations using theCRYSTAL09 package.10, 11 The ions are surrounded spheri-cally with charges up to an arbitrary radius (Rcut) chosen onthe basis of the convergence of the electric field calculated atthe center of nuclear charge of the ion of interest.
B. Ion properties
The electric responses of the isolated ions were cal-culated at two levels of approximation, with density func-tional theory (DFT) and the B3LYP exchange-correlation(XC) functional as well as with second-order Møller-Plesset(MP2) perturbation theory. The MP2 method is selected be-cause it can closely reproduce the α and β values obtainedusing higher-level ab initio methods20 like coupled clustersscheme whereas the B3LYP XC functional is chosen to illus-trate the ability of density functional theory with conventionalXC functionals. More details about the impact of the choice ofXC functional can be found in Ref. 21. At the MP2 level, the α
and β calculations were performed using the finite field (FF)method.22 The frequency dispersion on the static MP2 proper-ties was included via a modified multiplicative scheme23 em-ploying the time-dependent DFT (TDDFT) and the B3LYPXC functional,
αMP 2ij (ω) = αMP 2
ij (ω = 0)α
T DDFT/B3LYP
ij (ω)
αCPKS/B3LYP
ij (ω = 0), (6)
βMP 2ijk (ω) = βMP 2
ijk (ω = 0)β
T DDFT/B3LYPtot (ω)
βCPKS/B3LYPtot (ω = 0)
. (7)
αij and β ijk denote the (hyper)polarizability tensor compo-nents and β tot is the norm of the hyperpolarizability vectorof which the components are defined in Eq. (8). CPKS standsfor the coupled-perturbed Kohn-Sham method, which is em-ployed to obtain the static DFT responses. The eigenbasis ofthe static MP2 polarizability is used as reference frame inEq. (6).
Within the discussion, we also refer to additional quan-tities, i.e., (i) the isotropic polarizability αiso = 1
3
∑i αii and
(ii) β tot the norm of the vectorial part of the first hyperpolariz-ability, of which the components are defined according to theformula
βi = 1
5
∑j
(βijj + βjij + βjji). (8)
The T convention is used to define the first hyperpolarizabil-ities. All the calculations of ion properties were performedwith the Gaussian 09 package24 and the 6-311++G(d,p) basisset.
The molecular (hyper)polarizabilities were distributedevenly over the defined sub-ions (the submolecule analogues).This scheme is known as the RLFTn (Rigorous Local FieldTheory n) where n is the number of the heavy atoms. Any sub-ion was defined as the centroid of nuclear charges of a heavyatom with the hydrogen atoms attached to it. The Lorentz fac-tor tensor was calculated for the lattice of sub-ions, whichmeans that no ionic pair was privileged.
The χ (1) tensor components are reported in the abc* or-
thogonal reference frame while the χ (2)(−2ω; ω,ω) tensor el-
ements are reported in the eigenbasis of the calculated dielec-tric tensor ε(ω) = 1 + χ (1)(ω).
This article is copyrighted as indicated in the article. Reuse of AIP content is subject to the terms at: http://scitation.aip.org/termsconditions. Downloaded to IP:
31.31.132.41 On: Thu, 11 Sep 2014 17:21:32

104109-3 Seidler, Stadnicka, and Champagne J. Chem. Phys. 141, 104109 (2014)
FIG. 1. DAST – schematic drawing of the ionic pair in the abc* reference axes system with the atomic numbering scheme together with the electric dressingfield (left) and its unit cell (right).
III. RESULTS AND DISCUSSION
A. Crystal structures
Since 1989 and the study by Marder et al.,3 DASTcrystal has been the subject of numerous studies about lin-ear and nonlinear optical properties, as reviewed recently byJazbinšek et al.4 DAST crystallizes in the Cc space group withcell parameters a = 10.365 Å, b = 11.322 Å, c = 17.893 Å,β = 92.24◦, Z = 4.7 The ionic pair in the abc* axes systemand the unit cell of DAST is shown in Figure 1. Optimizedfractional coordinates and Mulliken charges are summarizedin Table S1 in the supplementary material.25 DSTMS is verysimilar to DAST and has been first described in 2007.26 Italso crystallizes in the Cc space group with cell parameters a= 10.2665 Å, b = 12.2788 Å, c = 17.9626 Å, β = 93.039◦,Z = 4.8 The ionic pair in the abc* axes system and the unitcell of DSTMS is shown in Figure 2 while optimized frac-tional coordinates and Mulliken charges are summarized inTable S2 in the supplementary material.25 DAPSH is one ofthe DAST analogues. DAPSH in its a polymorphic form crys-tallizes in the Cc space group with cell parameters a = 19.384Å, b = 10.636 Å, c = 11.784 Å, β = 125.93◦, Z = 4.9 Thefirst ion pair of the unit cell (PF−
6 is at x + 1/2, y, z + 1/2with respect to the coordinates found in the crystallographicinformation file (CIF)) and the unit cell are presented in Fig-ure 3. The optimized fractional coordinates together with theMulliken populations are reported in Table S3 in the supple-mentary material.25
Selected bond lengths and torsion angles of the NLO-phore cations are summarized in Table I. The differences be-
tween the DAST and DSTMS are marginal while DAPSH dif-fers slightly more, owing to the substitution of the methylby a phenyl group. So, the bond length alternation (BLA)of the C3–C7–C8–C9 segment goes from 0.077±0.001 Å inDAST and DSTMS to 0.070 Å in DAPSH, evidencing a bet-ter charge-transfer π -conjugation for the latter. Note howeverthat DAPSH is slightly less planar as indicated by the largerdeviations of the torsion angles from 0◦ (or 180◦).
B. Polarizing field effects on the NLO-phore(hyper)polarizabilities
The static (λ = ∞) electric properties of the cations arepresented in Tables S4, S5, and S6 for DAST, DSTMS, andDAPSH, respectively,25 while the dynamic electric proper-ties for λ = 1907 nm in Tables S7 – S9.25 To allow com-parison between their molecular properties, the DSTMS andDAPSH cations orientations were adjusted to fit the core ofthe DAST chromophore in the least square sense. The differ-ences of polarizability and first hyperpolarizability betweenDAST and DSTMS cations attain at most 1% and reflect theirsimilar geometries. As a result of the change of the N-bearingsubstituent and the reduced BLA, the (hyper)polarizabilitiesof DAPSH are larger than those of DAST and DSTMS, by20%–40%.
The dressing electric fields, originating from the sur-rounding point charges are compared in Table II. For simplic-ity, we report the fields averaged over the heavy atoms, afterreorienting the geometries to fit the DAST cation core. Thesurrounding electric fields are similar for DAST and DSTMS,
This article is copyrighted as indicated in the article. Reuse of AIP content is subject to the terms at: http://scitation.aip.org/termsconditions. Downloaded to IP:
31.31.132.41 On: Thu, 11 Sep 2014 17:21:32

104109-4 Seidler, Stadnicka, and Champagne J. Chem. Phys. 141, 104109 (2014)
FIG. 2. DSTMS – schematic drawing of the ionic pair in the abc* reference axes system with the atomic numbering scheme together with the electric dressingfield (left) and its unit cell (right).
and about 20% larger than for DAPSH. The calculated polar-izing electrostatic potentials ( = ϕcrystal − ϕcation) com-pared in Figure 4 reflect the differences of the field strength inthe plane containing the C3C7C8C9 atoms. Note also that thenature and the relative spatial position of the counterion has
an impact on the orientation of the dressing field (Table II),and, as shown below, on the dressed (hyper)polarizabilities.Indeed, the dressing field orientation deviates by 9.3◦ withrespect to the charge transfer direction of DSTMS whereasthis deviation attains 24.6◦ and 40.6◦ for DAST and DAPSH,
FIG. 3. DAPSH – schematic drawing of the ionic pair in the abc* reference axes system with the atomic numbering scheme together with the electric dressingfield (top) and its unit cell (bottom).
This article is copyrighted as indicated in the article. Reuse of AIP content is subject to the terms at: http://scitation.aip.org/termsconditions. Downloaded to IP:
31.31.132.41 On: Thu, 11 Sep 2014 17:21:32

104109-5 Seidler, Stadnicka, and Champagne J. Chem. Phys. 141, 104109 (2014)
TABLE I. Comparison of selected PBC/B3LYP optimized bond lengths (inÅ) and torsion angles (in ◦) of the DAST, DSTMS, and DAPSH cations (seeFigures 1–3 for the atom labels).
DAST DSTMS DAPSH
N1C6 1.469 1.469 1.446N1C1 1.358 1.358 1.364C1C2 1.372 1.374 1.369C2C3 1.418 1.418 1.419C3C4 1.415 1.415 1.421C4C5 1.376 1.373 1.374N1C5 1.357 1.357 1.365C3C7 1.440 1.439 1.437C7C8 1.363 1.364 1.368C8C9 1.442 1.442 1.439C9C10 1.413 1.413 1.413C10C11 1.384 1.384 1.384C11C12 1.421 1.421 1.419C12C13 1.427 1.425 1.423C13C14 1.380 1.380 1.377C9C14 1.414 1.415 1.418C12N2 1.364 1.363 1.365C2C3C7C8 − 1.6 − 1.3 0.6C3C7C8C9 − 178.2 − 177.6 179.9C7C8C9C10 − 176.3 − 177.6 165.1C1N1C6C17 . . . . . . 33.9
respectively. Moreover, the angle between the dressing elec-tric fields for DAST and DAPSH is ∼45◦. The dressing fieldeffects on the cation properties are comparable in the case ofDAST and DSTMS and larger than for DAPSH. For DASTand DSTMS, the decrease of the static polarizability for thedressed cations with respect to the isolated one is of the orderof 6% and 11% for the static αiso at the B3LYP and MP2 levelswhile at λ = 1907 nm it is of the order of 7% and 12%, re-
TABLE II. Dressing electric fields (in GV/m), averaged over the heavy nu-clei, of the DAST, DSTMS, and DAPSH cation cores and the angle betweenthe electric field and the charge-transfer N1N2 axis (the DSTMS and DAPSHvectors are transformed to fit the orientation of the DAST cation core).
Fx Fy Fz |F | � (N1N2, F )
DAST − 1.12 0.02 − 0.06 1.12 155.4DSTMS − 1.03 − 0.32 0.08 1.08 170.7DAPSH − 0.65 0.16 0.52 0.85 139.4
spectively. For DAPSH, these dressing effects are smaller by33% and 3% at the B3LYP and MP2 levels, respectively. Thesituation gets much different for the first hyperpolarizability.So, at the MP2 level, the static β tot of DAST and DSTMSdecrease by about 31% and the effect is slightly amplified atλ = 1907 nm. In the case of DAPSH, as a result of the smallerand differently oriented dressing field, the decrease of β tot isabout 50% smaller at the MP2 level (and only marginally dif-ferent when using B3LYP). Note that the situation is quitedifferent at the B3LYP level, where the β tot decreases are ofthe order of 5%–8% for the two first crystals and where β totof DAPSH is mostly unchanged. In addition, after inclusionof the dressing effects, the MP2 β values remain larger thanthe B3LYP ones by 45%–55%.
The polarizability and first hyperpolarizability of the an-ions in the static limit with and without taking into accountthe in-crystal polarizing electric field are summarized in Ta-ble S10 in the supplementary material.25 The crystal dress-ing field reduces strongly the first hyperpolarizability of thetosylate and 2,4,6-trimethylbenzenesulfonate anions. So, atthe MP2 level, their β tot decrease by 87% and 82%, re-spectively. The small nonzero hyperpolarizability of hexaflu-orophosphate anion results from its geometry, that deviatesslightly from ideal octahedral ones.
FIG. 4. PBC/B3LYP/6-31G(d,p) polarizing electrostatic potential = ϕcrystal − ϕcation in the cationic chromophore plane (the increment is 0.004 a.u.).
This article is copyrighted as indicated in the article. Reuse of AIP content is subject to the terms at: http://scitation.aip.org/termsconditions. Downloaded to IP:
31.31.132.41 On: Thu, 11 Sep 2014 17:21:32
104109-6 Seidler, Stadnicka, and Champagne J. Chem. Phys. 141, 104109 (2014)
C. Electric susceptibilities
1. Linear optical properties
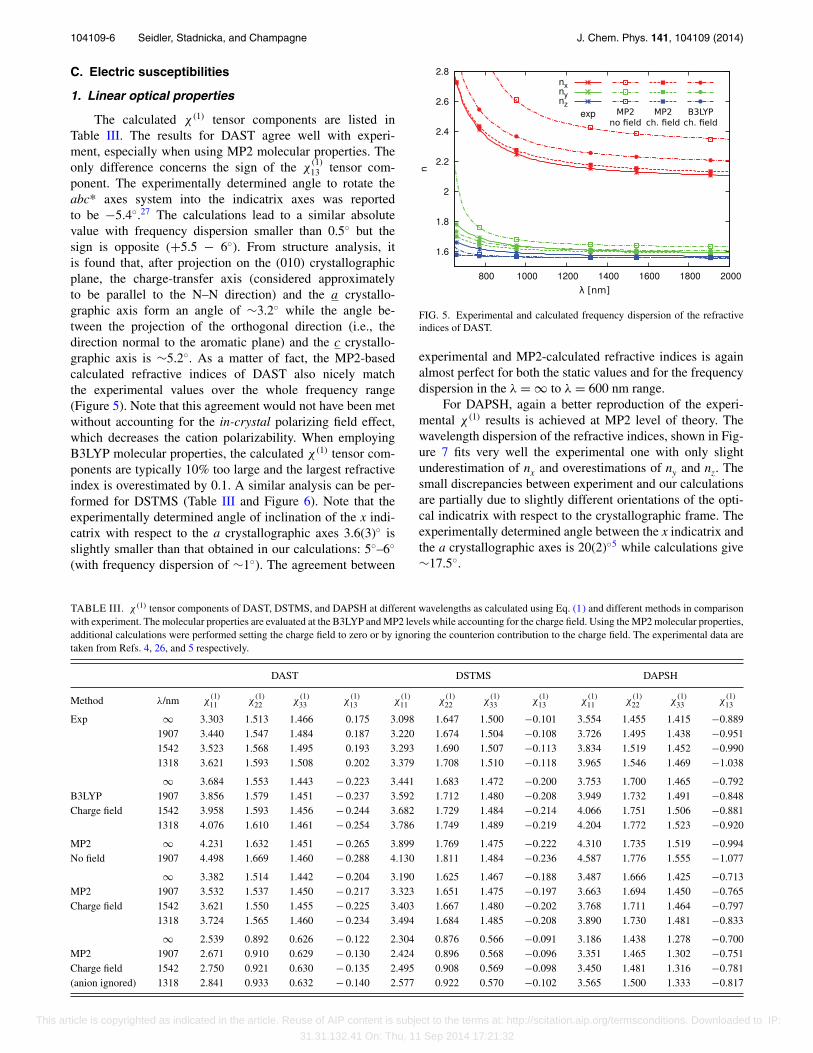
The calculated χ (1) tensor components are listed inTable III. The results for DAST agree well with experi-ment, especially when using MP2 molecular properties. Theonly difference concerns the sign of the χ
(1)13 tensor com-
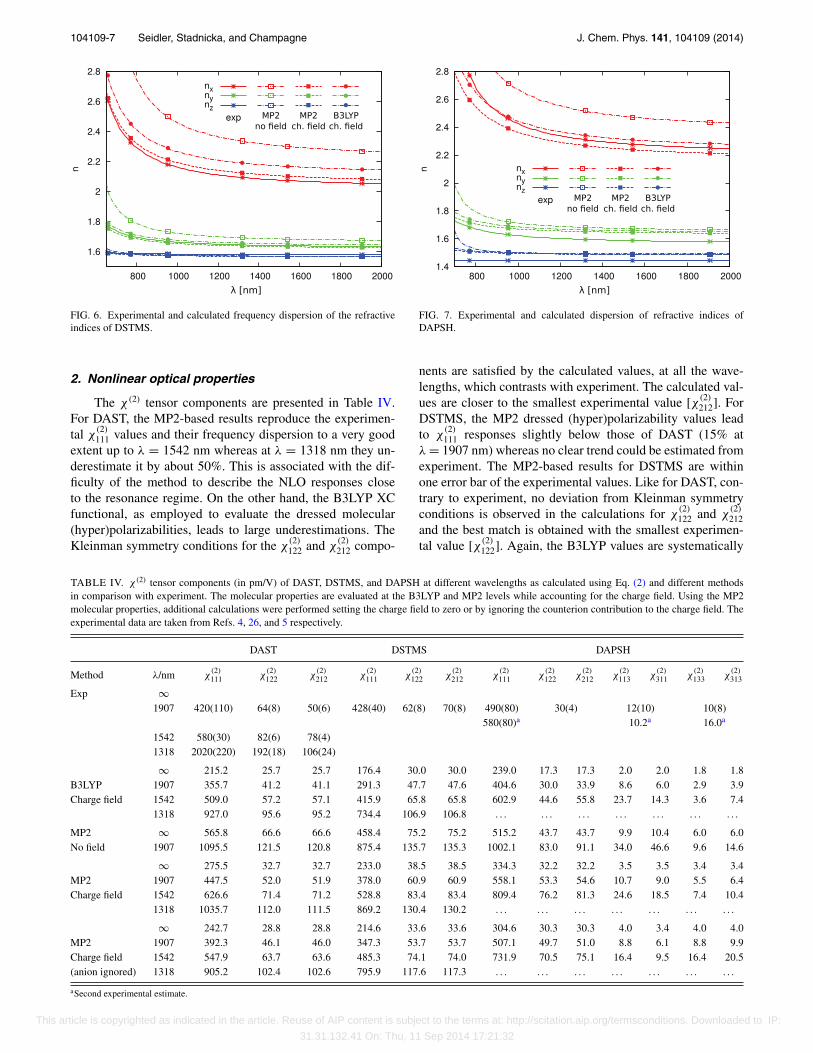
ponent. The experimentally determined angle to rotate theabc* axes system into the indicatrix axes was reportedto be −5.4◦.27 The calculations lead to a similar absolutevalue with frequency dispersion smaller than 0.5◦ but thesign is opposite (+5.5 − 6◦). From structure analysis, itis found that, after projection on the (010) crystallographicplane, the charge-transfer axis (considered approximatelyto be parallel to the N–N direction) and the a crystallo-graphic axis form an angle of ∼3.2◦ while the angle be-tween the projection of the orthogonal direction (i.e., thedirection normal to the aromatic plane) and the c crystallo-graphic axis is ∼5.2◦. As a matter of fact, the MP2-basedcalculated refractive indices of DAST also nicely matchthe experimental values over the whole frequency range(Figure 5). Note that this agreement would not have been metwithout accounting for the in-crystal polarizing field effect,which decreases the cation polarizability. When employingB3LYP molecular properties, the calculated χ (1) tensor com-ponents are typically 10% too large and the largest refractiveindex is overestimated by 0.1. A similar analysis can be per-formed for DSTMS (Table III and Figure 6). Note that theexperimentally determined angle of inclination of the x indi-catrix with respect to the a crystallographic axes 3.6(3)◦ isslightly smaller than that obtained in our calculations: 5◦–6◦
(with frequency dispersion of ∼1◦). The agreement between
FIG. 5. Experimental and calculated frequency dispersion of the refractiveindices of DAST.
experimental and MP2-calculated refractive indices is againalmost perfect for both the static values and for the frequencydispersion in the λ = ∞ to λ = 600 nm range.
For DAPSH, again a better reproduction of the experi-mental χ (1) results is achieved at MP2 level of theory. Thewavelength dispersion of the refractive indices, shown in Fig-ure 7 fits very well the experimental one with only slightunderestimation of nx and overestimations of ny and nz. Thesmall discrepancies between experiment and our calculationsare partially due to slightly different orientations of the opti-cal indicatrix with respect to the crystallographic frame. Theexperimentally determined angle between the x indicatrix andthe a crystallographic axes is 20(2)◦5 while calculations give∼17.5◦.
TABLE III. χ (1) tensor components of DAST, DSTMS, and DAPSH at different wavelengths as calculated using Eq. (1) and different methods in comparisonwith experiment. The molecular properties are evaluated at the B3LYP and MP2 levels while accounting for the charge field. Using the MP2 molecular properties,additional calculations were performed setting the charge field to zero or by ignoring the counterion contribution to the charge field. The experimental data aretaken from Refs. 4, 26, and 5 respectively.
DAST DSTMS DAPSH
Method λ/nm χ(1)11 χ
(1)22 χ
(1)33 χ
(1)13 χ
(1)11 χ
(1)22 χ
(1)33 χ
(1)13 χ
(1)11 χ
(1)22 χ
(1)33 χ
(1)13
Exp ∞ 3.303 1.513 1.466 0.175 3.098 1.647 1.500 −0.101 3.554 1.455 1.415 −0.8891907 3.440 1.547 1.484 0.187 3.220 1.674 1.504 −0.108 3.726 1.495 1.438 −0.9511542 3.523 1.568 1.495 0.193 3.293 1.690 1.507 −0.113 3.834 1.519 1.452 −0.9901318 3.621 1.593 1.508 0.202 3.379 1.708 1.510 −0.118 3.965 1.546 1.469 −1.038
∞ 3.684 1.553 1.443 − 0.223 3.441 1.683 1.472 −0.200 3.753 1.700 1.465 −0.792B3LYP 1907 3.856 1.579 1.451 − 0.237 3.592 1.712 1.480 −0.208 3.949 1.732 1.491 −0.848Charge field 1542 3.958 1.593 1.456 − 0.244 3.682 1.729 1.484 −0.214 4.066 1.751 1.506 −0.881
1318 4.076 1.610 1.461 − 0.254 3.786 1.749 1.489 −0.219 4.204 1.772 1.523 −0.920
MP2 ∞ 4.231 1.632 1.451 − 0.265 3.899 1.769 1.475 −0.222 4.310 1.735 1.519 −0.994No field 1907 4.498 1.669 1.460 − 0.288 4.130 1.811 1.484 −0.236 4.587 1.776 1.555 −1.077
∞ 3.382 1.514 1.442 − 0.204 3.190 1.625 1.467 −0.188 3.487 1.666 1.425 −0.713MP2 1907 3.532 1.537 1.450 − 0.217 3.323 1.651 1.475 −0.197 3.663 1.694 1.450 −0.765Charge field 1542 3.621 1.550 1.455 − 0.225 3.403 1.667 1.480 −0.202 3.768 1.711 1.464 −0.797
1318 3.724 1.565 1.460 − 0.234 3.494 1.684 1.485 −0.208 3.890 1.730 1.481 −0.833
∞ 2.539 0.892 0.626 − 0.122 2.304 0.876 0.566 −0.091 3.186 1.438 1.278 −0.700MP2 1907 2.671 0.910 0.629 − 0.130 2.424 0.896 0.568 −0.096 3.351 1.465 1.302 −0.751Charge field 1542 2.750 0.921 0.630 − 0.135 2.495 0.908 0.569 −0.098 3.450 1.481 1.316 −0.781(anion ignored) 1318 2.841 0.933 0.632 − 0.140 2.577 0.922 0.570 −0.102 3.565 1.500 1.333 −0.817
This article is copyrighted as indicated in the article. Reuse of AIP content is subject to the terms at: http://scitation.aip.org/termsconditions. Downloaded to IP:
31.31.132.41 On: Thu, 11 Sep 2014 17:21:32
104109-7 Seidler, Stadnicka, and Champagne J. Chem. Phys. 141, 104109 (2014)
FIG. 6. Experimental and calculated frequency dispersion of the refractiveindices of DSTMS.
2. Nonlinear optical properties
The χ (2) tensor components are presented in Table IV.For DAST, the MP2-based results reproduce the experimen-tal χ
(2)111 values and their frequency dispersion to a very good
extent up to λ = 1542 nm whereas at λ = 1318 nm they un-derestimate it by about 50%. This is associated with the dif-ficulty of the method to describe the NLO responses closeto the resonance regime. On the other hand, the B3LYP XCfunctional, as employed to evaluate the dressed molecular(hyper)polarizabilities, leads to large underestimations. TheKleinman symmetry conditions for the χ
(2)122 and χ
(2)212 compo-
FIG. 7. Experimental and calculated dispersion of refractive indices ofDAPSH.
nents are satisfied by the calculated values, at all the wave-lengths, which contrasts with experiment. The calculated val-ues are closer to the smallest experimental value [χ (2)
212]. ForDSTMS, the MP2 dressed (hyper)polarizability values leadto χ
(2)111 responses slightly below those of DAST (15% at
λ = 1907 nm) whereas no clear trend could be estimated fromexperiment. The MP2-based results for DSTMS are withinone error bar of the experimental values. Like for DAST, con-trary to experiment, no deviation from Kleinman symmetryconditions is observed in the calculations for χ
(2)122 and χ
(2)212
and the best match is obtained with the smallest experimen-tal value [χ (2)
122]. Again, the B3LYP values are systematically
TABLE IV. χ (2) tensor components (in pm/V) of DAST, DSTMS, and DAPSH at different wavelengths as calculated using Eq. (2) and different methodsin comparison with experiment. The molecular properties are evaluated at the B3LYP and MP2 levels while accounting for the charge field. Using the MP2molecular properties, additional calculations were performed setting the charge field to zero or by ignoring the counterion contribution to the charge field. Theexperimental data are taken from Refs. 4, 26, and 5 respectively.
DAST DSTMS DAPSH
Method λ/nm χ(2)111 χ
(2)122 χ
(2)212 χ
(2)111 χ
(2)122 χ
(2)212 χ
(2)111 χ
(2)122 χ
(2)212 χ
(2)113 χ
(2)311 χ
(2)133 χ
(2)313
Exp ∞1907 420(110) 64(8) 50(6) 428(40) 62(8) 70(8) 490(80) 30(4) 12(10) 10(8)
580(80)a 10.2a 16.0a
1542 580(30) 82(6) 78(4)1318 2020(220) 192(18) 106(24)
∞ 215.2 25.7 25.7 176.4 30.0 30.0 239.0 17.3 17.3 2.0 2.0 1.8 1.8B3LYP 1907 355.7 41.2 41.1 291.3 47.7 47.6 404.6 30.0 33.9 8.6 6.0 2.9 3.9Charge field 1542 509.0 57.2 57.1 415.9 65.8 65.8 602.9 44.6 55.8 23.7 14.3 3.6 7.4
1318 927.0 95.6 95.2 734.4 106.9 106.8 . . . . . . . . . . . . . . . . . . . . .
MP2 ∞ 565.8 66.6 66.6 458.4 75.2 75.2 515.2 43.7 43.7 9.9 10.4 6.0 6.0No field 1907 1095.5 121.5 120.8 875.4 135.7 135.3 1002.1 83.0 91.1 34.0 46.6 9.6 14.6
∞ 275.5 32.7 32.7 233.0 38.5 38.5 334.3 32.2 32.2 3.5 3.5 3.4 3.4MP2 1907 447.5 52.0 51.9 378.0 60.9 60.9 558.1 53.3 54.6 10.7 9.0 5.5 6.4Charge field 1542 626.6 71.4 71.2 528.8 83.4 83.4 809.4 76.2 81.3 24.6 18.5 7.4 10.4
1318 1035.7 112.0 111.5 869.2 130.4 130.2 . . . . . . . . . . . . . . . . . . . . .
∞ 242.7 28.8 28.8 214.6 33.6 33.6 304.6 30.3 30.3 4.0 3.4 4.0 4.0MP2 1907 392.3 46.1 46.0 347.3 53.7 53.7 507.1 49.7 51.0 8.8 6.1 8.8 9.9Charge field 1542 547.9 63.7 63.6 485.3 74.1 74.0 731.9 70.5 75.1 16.4 9.5 16.4 20.5(anion ignored) 1318 905.2 102.4 102.6 795.9 117.6 117.3 . . . . . . . . . . . . . . . . . . . . .
aSecond experimental estimate.
This article is copyrighted as indicated in the article. Reuse of AIP content is subject to the terms at: http://scitation.aip.org/termsconditions. Downloaded to IP:
31.31.132.41 On: Thu, 11 Sep 2014 17:21:32
104109-8 Seidler, Stadnicka, and Champagne J. Chem. Phys. 141, 104109 (2014)
smaller than the MP2 ones and in worse agreement with ex-periment.
In the case of DAPSH, too small coherence length andcrystal surface imperfections made difficult the measurementof the χ (2) tensor components. In fact, two sets are availableand they differ by slightly more than one standard deviation.5
Still, both suggest a stronger NLO activity of DAPSH with re-spect to DAST and DSTMS. This conclusion is supported byboth the MP2 and B3LYP calculations. The MP2 χ
(2)111 value
is in good agreement with the largest experimental value [580
pm/V] whereas the χ(2)111
χ(2)122
ratio (10.5), predicted at the same
level, is in better agreement with the smaller experimental es-timate (13 ± 0.9). The calculated χ
(2)111 value at λ = 1542 nm
attains 809 pm/V, which places DAPSH among the most effi-cient organic NLO crystals. Note that λ = 1318 nm is beyondthe first resonance and the corresponding χ (2) responses aretherefore not reported.
The neglect of the polarizing inhomogeneous electricfield leads to very strong overestimations of the χ (2) tensorcomponents. By considering χ
(2)111 , the largest tensor com-
ponent, this overestimation attains, in the static limit, about100% for DAST and DSTMS and only 55% for DAPSH. At λ
= 1907 nm, this overestimation gets even larger and amountsto 103%–145% and 80%, respectively. So, contrary to MNAand DAN where it enhances the macroscopic nonlinear op-tical susceptibilities,6 the dressing field reduces substantiallythose of ionic crystals and the larger the field, the larger thisreduction as illustrated by comparing DAST and DSTMS toDAPSH.
IV. FURTHER DISCUSSIONS, CONCLUSIONS,AND OUTLOOK
The linear and nonlinear optical susceptibilities of threeionic crystals have been calculated by adopting a two-stepmulti-scale procedure, which consists in calculating first theion/molecular properties using ab initio or DFT methods andthen in accounting for the crystal environment effects usingclassical electrostatic models. Owing to the good performanceof this method to reproduce and analyze experimental re-sults over a large range of wavelengths, this study extendsthe range of applicability of this multi-scale approach frommolecular crystals as discussed in a previous paper6 to ioniccrystals and opens the way for designing organic crystals forNLO applications.28 So, the method confirms the larger χ (2)
response of DAPSH with respect to DAST and DSTMS andattributes the difference to (i) a larger molecular first hyperpo-larizability and to (ii) smaller crystal polarizing field effects.Like in Ref. 6, the present study has also substantiated thekey role played by the crystal dressing field on the linear andnonlinear optical responses and has evidenced a crucial dif-ference between molecular and ionic crystals. Indeed, for theformer, the crystal dressing field enhances the macroscopicresponses whereas for the latter it leads to a strong reduc-tion, typically by factor of 2. This difference between the ionicand molecular crystals originates from the direction of the in-crystal dressing field, which reduces or enhances the chargetransfer between the donor and acceptor groups, respectively.
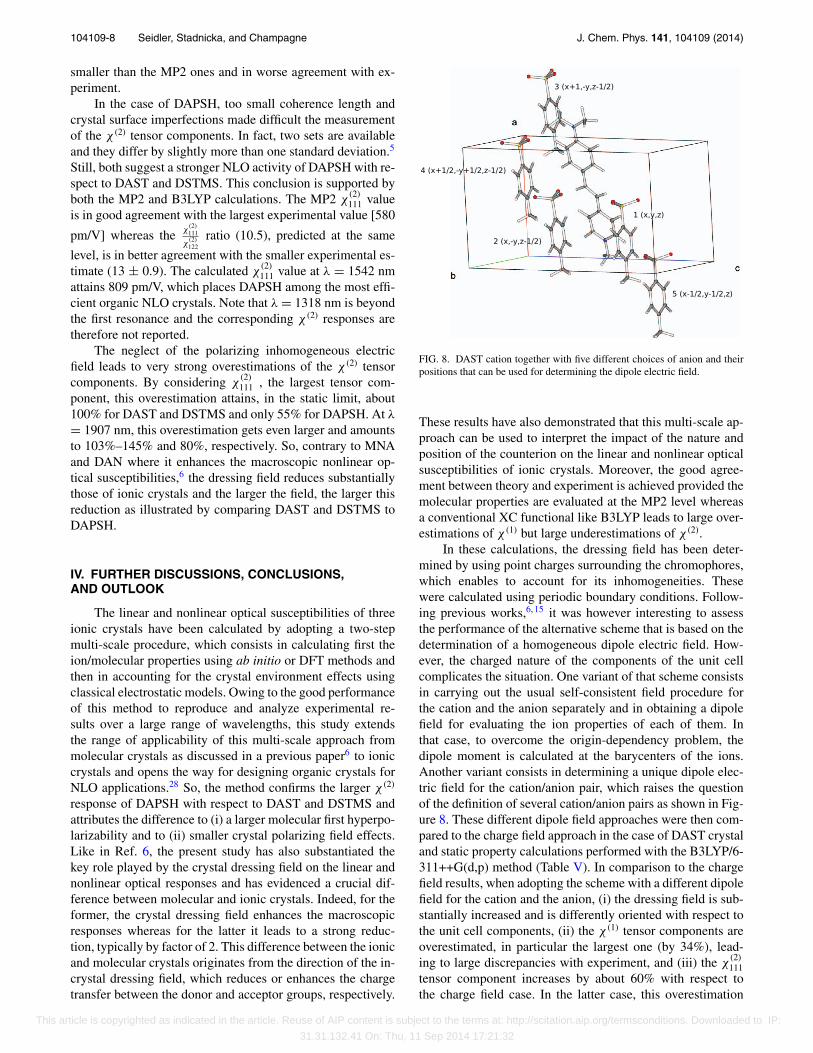
FIG. 8. DAST cation together with five different choices of anion and theirpositions that can be used for determining the dipole electric field.
These results have also demonstrated that this multi-scale ap-proach can be used to interpret the impact of the nature andposition of the counterion on the linear and nonlinear opticalsusceptibilities of ionic crystals. Moreover, the good agree-ment between theory and experiment is achieved provided themolecular properties are evaluated at the MP2 level whereasa conventional XC functional like B3LYP leads to large over-estimations of χ (1) but large underestimations of χ (2).
In these calculations, the dressing field has been deter-mined by using point charges surrounding the chromophores,which enables to account for its inhomogeneities. Thesewere calculated using periodic boundary conditions. Follow-ing previous works,6, 15 it was however interesting to assessthe performance of the alternative scheme that is based on thedetermination of a homogeneous dipole electric field. How-ever, the charged nature of the components of the unit cellcomplicates the situation. One variant of that scheme consistsin carrying out the usual self-consistent field procedure forthe cation and the anion separately and in obtaining a dipolefield for evaluating the ion properties of each of them. Inthat case, to overcome the origin-dependency problem, thedipole moment is calculated at the barycenters of the ions.Another variant consists in determining a unique dipole elec-tric field for the cation/anion pair, which raises the questionof the definition of several cation/anion pairs as shown in Fig-ure 8. These different dipole field approaches were then com-pared to the charge field approach in the case of DAST crystaland static property calculations performed with the B3LYP/6-311++G(d,p) method (Table V). In comparison to the chargefield results, when adopting the scheme with a different dipolefield for the cation and the anion, (i) the dressing field is sub-stantially increased and is differently oriented with respect tothe unit cell components, (ii) the χ (1) tensor components areoverestimated, in particular the largest one (by 34%), lead-ing to large discrepancies with experiment, and (iii) the χ
(2)111
tensor component increases by about 60% with respect tothe charge field case. In the latter case, this overestimation
This article is copyrighted as indicated in the article. Reuse of AIP content is subject to the terms at: http://scitation.aip.org/termsconditions. Downloaded to IP:
31.31.132.41 On: Thu, 11 Sep 2014 17:21:32

104109-9 Seidler, Stadnicka, and Champagne J. Chem. Phys. 141, 104109 (2014)
TABLE V. Results from calculations performed using the uniform lattice dipole polarizing electric field (λ = ∞; the electric field F is given in GV/m whileχ (2) in pm/V) for different ways of defining the electric field in comparison with the charge field approach. Results are provided at the 0th cycle of the self-consistent field procedure as well as for the last cycle corresponding to convergence of the dipole field within 0.05 GV/m. In the case of the procedure with adifferent dressing field for the cation and anion, the electric field components are reported in the format cation
anion.
Cycle χ(1)11 χ
(1)22 χ
(1)33 χ
(1)13 χ
(2)111 χ
(2)122 Fx Fy Fz |F |
Charge field . . . 3.684 1.553 1.443 − 0.223 215.2 25.7 − 1.12 0.02 − 0.06 1.12Cation and anion 0 4.209 1.636 1.449 − 0.255 281.3 34.4 2.0
−3.10.71.1
1.43.0
2.54.5
2 4.941 1.724 1.441 − 0.299 342.3 39.9 2.1−3.1
0.71.1
1.42.9
2.74.4
Ion pair 1 0 4.977 1.915 1.610 − 0.466 554.6 64.3 − 0.1 − 5.1 − 6.1 7.91 4.377 1.918 1.612 − 0.322 412.0 47.0 − 0.1 − 5.2 − 6.1 8.0
Ion pair 2 0 4.240 1.810 1.553 − 0.221 353.5 48.2 − 2.2 2.5 5.7 6.61 3.859 1.752 1.549 − 0.288 234.5 30.5 − 2.2 2.5 5.7 6.6
Ion pair 3 0 − 31.214 0.394 − 6.130 16.285 − 127 205.7 − 358.9 19.8 37.9 − 32.6 53.8Divergence
Ion pair 4 0 6.080 2.145 1.603 − 0.459 1078.1 242.6 − 5.3 − 5.4 6.4 9.92 3.767 1.779 1.596 − 0.287 219.6 28.1 − 3.5 − 4.3 6.3 8.4
Ion pair 5 0 3.890 1.741 1.598 − 0.193 202.8 22.1 0.0 2.9 − 5.3 6.02 4.344 1.807 1.560 − 0.110 337.0 41.5 0.1 2.9 − 5.2 6.0
originating from the dipole field is partially compensated bythe underestimation of the first hyperpolarizability evaluatedat the B3LYP level. The results obtained for the ion pairs areeven more problematic because they exhibit large variationsas a function of the choice of ion pair. Nevertheless, in somecases (anions in positions 2 and 4) the agreement with thecharge field results is better than with the first variant but thereis no justification to prefer a priori one ion pair than another.These results also show that in some cases, the procedure forobtaining the dressing field is not convergent. Without extend-ing this analysis to calculation using MP2 molecular proper-ties, these dipole field results and their comparisons with thecharge field results demonstrate the performance of the latterand the strong limitations of the former.
The impact of the anion properties on the macroscopicelectric properties was also assessed at the MP2 level. This isachieved by setting to zero the (hyper)polarizabilities of theanions in the unit cell. In DAST and DSTMS, the anion ac-counts for 25% (χ (1)
11 )–60% (χ (1)33 ) of the χ (1) tensor compo-
nents, resulting in a decrease of n1 and n2 by 10%–15% andof n3 by 18%–20% (Table III). In DAPSH, the influence of thehexafluorophosphate anion is less prominent because its po-larizability is smaller than for the other counterions. Indeed,removing it impacts χ
(1)11 , χ
(1)22 , and χ
(1)33 by 8%–15% and χ
(1)13
by only 2%, and therefore the refractive indices by less than5%. The anion contributions to the χ (2) tensor components(Table IV) attain 8%–13% for DAST and DSTMS. In the caseof DAPSH, it is responsible for up to 10% of the dominantχ (2) tensor components while the smaller components, χ
(2)133
and χ(2)313, are reduced. The DAPSH case where the anion first
hyperpolarizability is negligible illustrates nicely that the im-pact of the anion on χ (2) mostly originates from the local fieldtensors.
ACKNOWLEDGMENTS
This research was supported in part by PL-Grid Infras-tructure as well as by the Belgium government (IUAP N◦
P7/05, Functional Supramolecular Systems). T.S. acknowl-edges the support from a Project operated within the Foun-dation for Polish Science MPD Programme co-financed bythe European Union’s (EU) European Regional DevelopmentFund as well as the financial support from IUAP N◦ P7/05.The calculations were performed on the Technological Plat-form of High-Performance Computing of the Consortium desEquipements de Calcul Intensif, for which we gratefully ac-knowledge the financial support of the FNRS-FRFC (Conven-tion Nos. 2.4.617.07.F and 2.5020.11), and of the Universityof Namur.
1Non-linear Optical Properties of Matter - From Molecules to CondensedPhases, edited by M. G. Papadopoulos, A. J. Sadlej, and J. Leszczynski(Springer, Dordrecht, 2006).
2M. S. Wong, C. Bosshard, and P. Günter, Adv. Matter 9, 837 (1997).3S. R. Marder, J. W. Perry, and W. P. Schaefer, Science 245, 626(1989).
4M. Jazbinšek, L. Mutter, and P. Günter, IEEE J. Sel. Top. Quantum Elec-tron. 14, 1298 (2008).
5H. Figi, L. Mutter, C. Hunziker, M. Jazbinsek, P. Günter, and B. J. Coe, J.Opt. Soc. Am. B 25, 1786 (2008).
6T. Seidler, K. Stadnicka, and B. Champagne, J. Chem. Phys. 139, 114105(2013).
7S. R. Marder, J. W. Perry, and C. P. Yakymyshyn, Chem. Mater. 6, 1137(1994).
8Z. Yang, M. Jazbinšek, B. Ruiz, S. Aravazhi, V. Gramlich, and P. Günter,Chem. Mater. 19, 3512 (2007).
9B. J. Coe, J. A. Harris, I. Asselberghs, K. Clays, G. Olbrechts, A. Persoons,J. T. Hupp, R. C. Johnson, S. J. Coles, M. B. Hursthouse, and K. Nakatani,Adv. Funct. Mater. 12, 110 (2002).
10R. Dovesi, R. Orlando, B. Civalleri, C. Roetti, V. R. Saunders, and C. M.Zicovich-Wilson, Z. Kristallogr. 220, 571 (2005).
11R. Dovesi, V. R. Saunders, C. Roetti, R. Orlando, C. M. Zicovich-Wilson,F. Pascale, B. Civalleri, K. Doll, N. M. Harrison, I. J. Bush, P. D’Arco,and M. Llunell, CRYSTAL09 User’s Manual (University of Torino, Torino,2009).
12R. W. Munn, Chem. Phys. 50, 119 (1980).13M. Hurst and R. W. Munn, J. Mol. Electron. 2, 35 (1986).14M. Hurst and R. W. Munn, J. Mol. Electron. 2, 43 (1986).15H. Reis, M. G. Papadopoulos, P. Calaminici, K. Jug, and A. M. Köster,
Chem. Phys. 261, 359 (2000).16H. Reis, M. G. Papadopoulos, C. Hattig, J. G. Ángyán, and R. W. Munn, J.
Chem. Phys. 112, 6161 (2000).
This article is copyrighted as indicated in the article. Reuse of AIP content is subject to the terms at: http://scitation.aip.org/termsconditions. Downloaded to IP:
31.31.132.41 On: Thu, 11 Sep 2014 17:21:32

104109-10 Seidler, Stadnicka, and Champagne J. Chem. Phys. 141, 104109 (2014)
17M. B. Kanoun, E. Botek, and B. Champagne, Chem. Phys. Lett. 487, 256(2010).
18A. Ségerie, F. Castet, M. B. Kanoun, A. Plaquet, V. Liégeois, and B. Cham-pagne, Chem. Mater. 23, 3993 (2011).
19R. W. Munn, Mol. Phys. 64, 1 (1988).20M. de Wergifosse and B. Champagne, J. Chem. Phys. 134, 074113
(2011).21T. Seidler, K. Stadnicka, and B. Champagne, J. Chem. Theory Comput. 10,
2114 (2014).22H. D. Cohen and C. C. J. Roothaan, J. Chem. Phys. 43, S34 (1965).23H. Sekino and R. J. Bartlett, J. Chem. Phys. 84, 2726 (1986).24M. J. Frisch, G. W. Trucks, H. B. Schlegel et al., Gaussian 09, Revision
D.01, Gaussian, Inc., Wallingford, CT, 2009.
25See supplementary material at http://dx.doi.org/10.1063/1.4894483 for in-vestigation of linear and second-order nonlinear optical properties of ionicorganic crystals within the local field theory.
26L. Mutter, F. D. J. Brunner, Z. Yang, M. Jazbinšek, and P. Günter, J. Opt.Soc. Am. B 24, 2556 (2007).
27G. Knöpfle, R. Schlesser, R. Ducret, and P. Günter, Nonlinear Opt. 9, 143(1995).
28T. Seidler, K. Stadnicka, and B. Champagne, “Second-order nonlinear op-tical susceptibilities and refractive indices of organic crystals from a mul-tiscale numerical simulation approach,” Adv. Opt. Mater. (published on-line 2014). Note that in the chemical structure of DAPSH in Table I, aN atom has been misplaced. The calculations were performed on the correctstructure.
This article is copyrighted as indicated in the article. Reuse of AIP content is subject to the terms at: http://scitation.aip.org/termsconditions. Downloaded to IP:
31.31.132.41 On: Thu, 11 Sep 2014 17:21:32