Limitations and Potential of Satellite Imagery to Monitor Environmental Response to Coastal Flooding
20
www.cerf-jcr.org Limitations and Potential of Satellite Imagery to Monitor Environmental Response to Coastal Flooding Elijah Ramsey III { , Dirk Werle { , Yukihiro Suzuoki 1 *, Amina Rangoonwala {{ **, and Zhong Lu {{ { U.S. Geological Survey National Wetlands Research Center 700 Cajundome Boulevard Lafayette, LA 70506, U.S.A. [email protected] { AERDE Environmental Research Box 1002, Halifax, NS, Canada, B3J 2X1 1 ASci Corporation, Inc. 700 Cajundome Boulevard Lafayette, LA 70506, U.S.A. {{ IAP World Services, Inc. 700 Cajundome Boulevard Lafayette, LA 70506, U.S.A. {{ U.S. Geological Survey Earth Resources Observation and Science Center & Cascades Volcano Observatory 1300 SE Cardinal Court Vancouver, WA 98683, U.S.A. ABSTRACT RAMSEY, E. III; WERLE, D.; SUZUOKI, Y.; RANGOONWALA, A., and LU, Z., 0000. Limitations and potential of satellite imagery to monitor environmental response to coastal flooding. Journal of Coastal Research, 00(0), 000–000. West Palm Beach (Florida), ISSN 0749-0208. Storm-surge flooding and marsh response throughout the coastal wetlands of Louisiana were mapped using several types of remote sensing data collected before and after Hurricanes Gustav and Ike in 2008. These included synthetic aperture radar (SAR) data obtained from the (1) C-band advance SAR (ASAR) aboard the Environmental Satellite, (2) phased- array type L-band SAR (PALSAR) aboard the Advanced Land Observing Satellite, and (3) optical data obtained from Thematic Mapper (TM) sensor aboard the Land Satellite (Landsat). In estuarine marshes, L-band SAR and C-band ASAR provided accurate flood extent information when depths averaged at least 80 cm, but only L-band SAR provided consistent subcanopy detection when depths averaged 50 cm or less. Low performance of inundation mapping based on C-band ASAR was attributed to an apparent inundation detection limit (.30 cm deep) in tall Spartina alterniflora marshes, a possible canopy collapse of shoreline fresh marsh exposed to repeated storm-surge inundations, wind- roughened water surfaces where water levels reached marsh canopy heights, and relatively high backscatter in the near- range portion of the SAR imagery. A TM-based vegetation index of live biomass indicated that the severity of marsh dieback was linked to differences in dominant species. The severest impacts were not necessarily caused by longer inundation but rather could be caused by repeated exposure of the palustrine marsh to elevated salinity floodwaters. Differential impacts occurred in estuarine marshes. The more brackish marshes on average suffered higher impacts than the more saline marshes, particularly the nearshore coastal marshes occupied by S. alterniflora. www.JCRonline.org ADDITIONAL INDEX WORDS: Environmental Satellite (Envisat) advanced synthetic aperture radar (ASAR), Advanced Land Observing Satellite (ALOS) phased array–type L-band synthetic aperture radar (PALSAR), Land Satellite (Landsat) Thematic Mapper (TM), inundation mapping, coastal marsh dieback. INTRODUCTION Emergency response agencies and environmental resource managers require similar geospatial products. Emergency responders need to monitor coastal flooding of communities, and resource managers need to monitor the status and trends of ecosystems. The former have come to rely on the all-weather mapping capabilities of satellite sensors equipped with synthetic aperture radar (SAR), among other tools, for the rapid detection and monitoring of coastal flooding to minimize loss of lives and property. The latter have used synoptic observations by optical satellite sensors, such as the Land Satellite (Landsat) Thematic Mapper (TM), to assess the status and trends of marsh and wetland forests dominantly respond- ing to the temporal and spatial variation in flood extent, duration, and depth. While the requirements for timely and expedient acquisition of remote sensing data and delivery may differ for emergency response and resource management situations, there is a common need for reliable and consistent access to all types of remote sensing data. Flood extent mapping has become a routine and even operational activity in coastal marsh and forested wetland landscapes (Lu and Kwoun, 2008; Ramsey, 1998, 2005), especially during and after extreme storm events. DOI: 10.2112/JCOASTRES-D-11-00052.1 received 18 March 2011; accepted in revision 23 August 2011. Published Pre-print online 4 November 2011. * Present address: Japan Space Imaging Corporation, Tokyo, Japan. **Present address: Five Rivers Services, LLC, Colorado Springs, CO 80918. ’ Coastal Education & Research Foundation 2011 Journal of Coastal Research 00 0 000–000 West Palm Beach, Florida Month 0000
-
Upload
unitedstatesgeologicalsurvey -
Category
Documents
-
view
2 -
download
0
Transcript of Limitations and Potential of Satellite Imagery to Monitor Environmental Response to Coastal Flooding

www.cerf-jcr.org
Limitations and Potential of Satellite Imagery to MonitorEnvironmental Response to Coastal Flooding
Elijah Ramsey III{, Dirk Werle{, Yukihiro Suzuoki1*, Amina Rangoonwala{{**, andZhong Lu{{
{U.S. Geological SurveyNational Wetlands Research Center700 Cajundome BoulevardLafayette, LA 70506, [email protected]
{AERDE Environmental ResearchBox 1002, Halifax, NS, Canada, B3J 2X1
1ASci Corporation, Inc.700 Cajundome BoulevardLafayette, LA 70506, U.S.A.
{{IAP World Services, Inc.700 Cajundome BoulevardLafayette, LA 70506, U.S.A.
{{U.S. Geological SurveyEarth Resources Observation and Science
Center & Cascades Volcano Observatory1300 SE Cardinal CourtVancouver, WA 98683, U.S.A.
ABSTRACT
RAMSEY, E. III; WERLE, D.; SUZUOKI, Y.; RANGOONWALA, A., and LU, Z., 0000. Limitations and potential ofsatellite imagery to monitor environmental response to coastal flooding. Journal of Coastal Research, 00(0), 000–000.West Palm Beach (Florida), ISSN 0749-0208.
Storm-surge flooding and marsh response throughout the coastal wetlands of Louisiana were mapped using several typesof remote sensing data collected before and after Hurricanes Gustav and Ike in 2008. These included synthetic apertureradar (SAR) data obtained from the (1) C-band advance SAR (ASAR) aboard the Environmental Satellite, (2) phased-array type L-band SAR (PALSAR) aboard the Advanced Land Observing Satellite, and (3) optical data obtained fromThematic Mapper (TM) sensor aboard the Land Satellite (Landsat). In estuarine marshes, L-band SAR and C-bandASAR provided accurate flood extent information when depths averaged at least 80 cm, but only L-band SAR providedconsistent subcanopy detection when depths averaged 50 cm or less. Low performance of inundation mapping based onC-band ASAR was attributed to an apparent inundation detection limit (.30 cm deep) in tall Spartina alternifloramarshes, a possible canopy collapse of shoreline fresh marsh exposed to repeated storm-surge inundations, wind-roughened water surfaces where water levels reached marsh canopy heights, and relatively high backscatter in the near-range portion of the SAR imagery. A TM-based vegetation index of live biomass indicated that the severity of marshdieback was linked to differences in dominant species. The severest impacts were not necessarily caused by longerinundation but rather could be caused by repeated exposure of the palustrine marsh to elevated salinity floodwaters.Differential impacts occurred in estuarine marshes. The more brackish marshes on average suffered higher impacts thanthe more saline marshes, particularly the nearshore coastal marshes occupied by S. alterniflora.
www.JCRonline.org
ADDITIONAL INDEX WORDS: Environmental Satellite (Envisat) advanced synthetic aperture radar (ASAR),Advanced Land Observing Satellite (ALOS) phased array–type L-band synthetic aperture radar (PALSAR), LandSatellite (Landsat) Thematic Mapper (TM), inundation mapping, coastal marsh dieback.
INTRODUCTION
Emergency response agencies and environmental resource
managers require similar geospatial products. Emergency
responders need to monitor coastal flooding of communities,
and resource managers need to monitor the status and trends
of ecosystems. The former have come to rely on the all-weather
mapping capabilities of satellite sensors equipped with
synthetic aperture radar (SAR), among other tools, for the
rapid detection and monitoring of coastal flooding to minimize
loss of lives and property. The latter have used synoptic
observations by optical satellite sensors, such as the Land
Satellite (Landsat) Thematic Mapper (TM), to assess the status
and trends of marsh and wetland forests dominantly respond-
ing to the temporal and spatial variation in flood extent,
duration, and depth. While the requirements for timely and
expedient acquisition of remote sensing data and delivery may
differ for emergency response and resource management
situations, there is a common need for reliable and consistent
access to all types of remote sensing data.
Flood extent mapping has become a routine and even
operational activity in coastal marsh and forested wetland
landscapes (Lu and Kwoun, 2008; Ramsey, 1998, 2005),
especially during and after extreme storm events.
DOI: 10.2112/JCOASTRES-D-11-00052.1 received 18 March 2011;accepted in revision 23 August 2011.Published Pre-print online 4 November 2011.
* Present address: Japan Space Imaging Corporation, Tokyo,Japan.
**Present address: Five Rivers Services, LLC, Colorado Springs,CO 80918.’ Coastal Education & Research Foundation 2011
Journal of Coastal Research 00 0 000–000 West Palm Beach, Florida Month 0000

Satellite-based observations of long-term effects of flooding on
natural vegetations are less common, however, and the
usefulness of such observations requires further study. As
reported in Ramsey et al. (2009b), the combined use of the
Environmental Satellite (Envisat) advanced synthetic aper-
ture radar (ASAR) imagery and Landsat TM optical imagery
provided synergistic observations to document the extent of the
coastal surge accompanying Hurricane Ike (2008) and a
resultant marsh dieback event. The dieback was directly
attributed to prolonged water logging and elevated salinity
levels. This connection illustrated how inundation monitoring
with frequent satellite radar observations, combined with the
first available cloud-free optical data (e.g., from Landsat TM),
can provide direct links between the vegetation condition and
the primary physical forces controlling it.
The Hurricane Ike example (Ramsey et al., 2009b) also
illustrated the reliance of emergency and environmental
responses on frequent data collection. In environmental
response, the necessary collection frequency is determined by
the nature of the causal forces of change and the sensitivity of
the environment. The frequency of the data collection deter-
mines whether the dynamics of the feature of interest are
either captured or missed (Klemas, 2005). Detecting change
brought on by sudden events such as severe storms, floods, and
fire requires timely data collection before and after the events.
Not knowing the timing of severe events requires collection to
be consistent enough to provide relevant baseline data to
enhance change detection. Similarly, detecting and quantify-
ing long-term environmental trends for coastal resource
monitoring requires strategic collection that is consistent and
often enough to capture important changes in the coastal
resource. For example, by the time a marsh dieback event was
identified along the central Gulf of Mexico (GOM) coast, the
affected area was extensive, in effect threatening the viability
of the coastal resources (Ramsey and Rangoonwala, 2006). The
marsh dieback did not happen suddenly, but the lack of a
strategic data collection and mapping program, combined with
the subtle and progressive change, delayed dieback detection
until it became acute and highly visible. Short-term and long-
term environmental responses, both of which can be dramatic,
require ecosystem status indicators, measurable from coupled
SAR and optical satellite data, collected strategically to
promote rapid change detection and early detection of adverse
regional coastal resource impacts.
Our research goal is to improve the strategic observation of
the central GOM coastal regions of Louisiana through the use
of combined satellite-based optical and SAR imagery and
products. The objective of this study is to document the ability
of L-band and C-band satellite SAR data to capture the causal
agent of coastal marsh dieback and the ability of multispectral
optical data to detail the near-immediate impact on palustrine
and estuarine marshes in the central GOM coastal region. A
previous study provided clear evidence that linked marsh
dieback to the flood extent of storm surge from Hurricane Ike in
the SW coastal region of Louisiana (Ramsey et al., 2009b). In
the current study, we apply those techniques over the entire
Louisiana coast. Although both studies are limited to storm-
surge flood events and opportune image collection, we extended
previous results to increase quantification of (1) marsh impact
severity and (2) storm-surge mapping success with respect to
SAR collection timing and wavelength. We attempt to directly
relate the dieback to storm-surge inundation extent and to link
inundation extents and dieback to marsh type.
STUDY AREA
The study area for Hurricanes Gustav and Ike impacts
included coastal wetlands stretching from the western Chenier
to the eastern Deltaic plains of coastal Louisiana, located in the
north-central Gulf of Mexico (GOM; Figure 1). The Deltaic
Plain was formed and is primarily sustained by direct
deposition of Mississippi River sediments, while the Chenier
Plain primarily depends on current-related reworking of
sediments from the Atchafalaya River (USACE, 2006). Rela-
tionships between water and sediment give rise to highly
permeable sand and shell (Chenier) barriers in the west and
barrier islands in the east that protect extensive backbarrier
marshes extending inland 6 to 24 km, commonly at less than
1.5 m above mean sea level, with slopes of less than 0.2 m per
km (Chabreck, 1970).
The Louisiana coastal marsh zone is predominantly under-
lain by frequently saturated soils. In this zone, subsurface
faulting can produce surface subsidence that results in marsh
submergence and fragmentation and ultimately the formation
of permanent water bodies (Kiage et al., 2005; Morton et al.,
2005). In addition, hurricanes scour the marsh, creating small
water bodies (Neyland, 2007) and pushing water with elevated
salinity into fresh marshes, which causes salt burn in those
areas (Neyland, 2007; Ramsey et al., 2009b). Aggravating these
detrimental impacts are channels and levies constructed to
provide transport conduits and impoundments constructed as
waterfowl sanctuaries that impede overland flow. These
structural impediments can lengthen exposure of marsh to
water with elevated salinity and, in the case of intense rainfall
accompanying storm events, prolong inundation and promote
water logging that can advance marsh alteration and deteri-
oration. The combination of low topographic relief, poorly
drained soils, tectonic activity, and flow impedance creates a
spatially complex hydrologic landscape.
METHODS
Image Data Collection, Calibration, and Registration
We used SAR and TM scenes collected before and after the
landfalls of Hurricane Gustav on 1 September 2008 at 1500
Coordinated Universal Time (UTC; Beven and Kimberlain,
2009) and Hurricane Ike on 13 September 2008 at 0700 UTC
(Berg, 2009; Figure 1). Prehurricane SAR scenes were selected
from the summer months to minimize differences connected to
marsh seasonality and to best represent periods of normal sea
levels and tidal flushing. Two adjacent SAR scenes (Figure 2a)
and five adjacent TM scenes (Figure 2c) were required to cover
the entire Louisiana coast (Tables 1 and 2).
SAR coverage was obtained by the phased array–type L-band
SAR (PALSAR) sensor aboard the Japanese Advanced Land
Observing Satellite (ALOS) and the C-band advanced SAR
(ASAR sensor onboard the European Space Agency’s Agency
Environmental Satellite (Envisat. PALSAR scenes were
0 Ramsey et al.
Journal of Coastal Research, Vol. 00, No. 0, 0000

collected over eastern Louisiana in wide area observation mode
(burst mode 1) at a nominal spatial resolution of 100 m and
incidence angles of 18u in the near range to 43u in the far range
of the imaged swath (Figure 2 and Table 1). Two PALSAR
scenes with horizontal transmit and receive (HH) polarization
were radiometrically calibrated to the sigma naught backscat-
ter coefficient (s0) with MapReady Remote Sensing Software
available at the Alaska Satellite Facility website (2011). The
ASAR scenes were collected over eastern and western
Louisiana in wide swath mode at a nominal spatial resolution
of 150 m and incidence angles of 17u in the near range to 42u in
far range of the imaged swath (Figure 2 and Table 1). Five
ASAR scenes with vertical transmit and receive (VV) polariza-
tion were transformed to s0 estimates (Lu and Kwoun, 2008).
The s0 calibrations allowed scene-to-scene comparability.
The 2007 and 2008 TM images collected during cloud-free
conditions were obtained from the U.S. Geological Survey
(USGS) Earth Resources Observation and Science Center
(Table 2). TM data acquisitions were restricted to the Landsat
5 because of problems with the scan line corrector in the
enhanced TM sensor onboard the Landsat 7.
All satellite data were registered to a Landsat TM Lambert
conformal conic (LCC) 25-m spatial resolution base image. The
LCC projection eliminated problems of multiple Universal
Transverse Mercator zones and matched the Louisiana State
Plane Coordinate System defined by two standard parallels
separated by 1.5u latitude, a central meridian, and a false
northing and easting (WGA84 geoid). Applying State Plane
parameters, we found that areas projected in the LCC and the
Albers equal-area conic differed by less than 0.01%. In addition,
the base TM projection was assessed by comparison to direct
USGS digital orthophoto quarter quadrangles (DOQQs).
Figure 1. Study area covering the eastern, central, and western coastal regions of Louisiana. Also illustrated are the paths and Saffir-Simpson Hurricane
Wind Scale categories (numbers inside hurricane symbols) assigned along the paths of Hurricanes Gustav and Ike (D refers to tropical depression). The inset
shows the paths of Hurricanes Dolly, Gustav, and Ike and Tropical Storm Edouard in the Gulf of Mexico. The hatched pattern signifies the coastal zone extent.
Satellite Imagery to Monitor Environmental Response to Coastal Flooding 0
Journal of Coastal Research, Vol. 00, No. 0, 0000

Figure 2. Coverage locations and extents of satellite-based radar scenes and optical images used in this study. Data include (a) advanced synthetic aperture
radar (ASAR) data acquired by the Environmental Satellite spacecraft, (b) phased array–type L-band SAR data acquired by the Advanced Land Observing
Satellite, and (c) Land Satellite Thematic Mapper 5 images. Scenes skewed left were acquired during ascending orbital passes, and scenes skewed right were
acquired during descending orbital passes of the satellite.
Table 1. Specifications of satellite radar scenes acquired before and after Hurricanes Gustav and Ike.
Sensor Polarization Date Time (UTC) Orbit LA Coastal Zone
Before
ASAR/WS VV 4 September 2007 0409 Ascending Western
PALSAR/WB1 HH 24 July 2008 1627 Descending Eastern
ASAR/WS VV 28 July 2008 0401 Ascending Eastern
ASAR/WS VV 3 August 2008 0413 Ascending Western
After
PALSAR/WB1 HH 8 September 2008 1628 Descending Eastern
ASAR/WS VV 14 September 2008 1611 Descending Western
ASAR/WS VV 17 September 2008 0358 Ascending Eastern
ASAR 5 advanced synthetic aperture radar, PALSAR 5 phased array–type L-band synthetic aperture radar, WS 5 wide swath mode, WB1 5 wide beam
burst mode 1, VV 5 vertical transmit–vertical receive, HH 5 horizontal transmit–horizontal receive, LA 5 Louisiana.
0 Ramsey et al.
Journal of Coastal Research, Vol. 00, No. 0, 0000
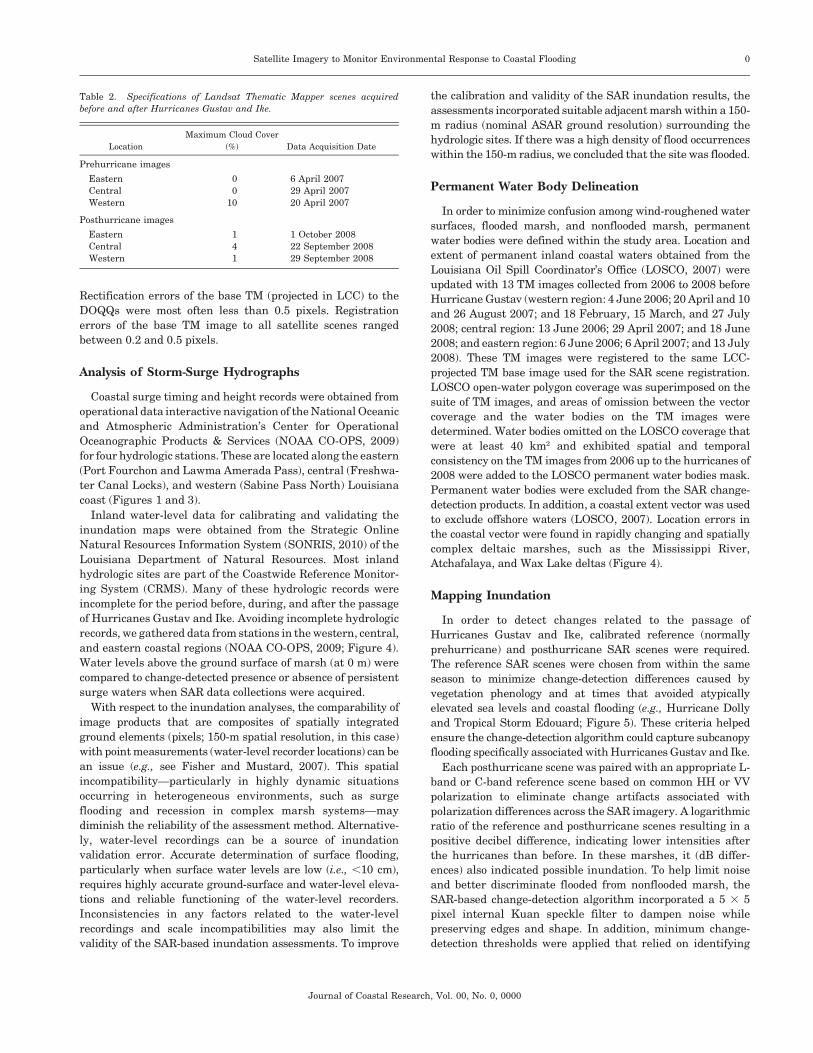
Rectification errors of the base TM (projected in LCC) to the
DOQQs were most often less than 0.5 pixels. Registration
errors of the base TM image to all satellite scenes ranged
between 0.2 and 0.5 pixels.
Analysis of Storm-Surge Hydrographs
Coastal surge timing and height records were obtained from
operational data interactive navigation of the National Oceanic
and Atmospheric Administration’s Center for Operational
Oceanographic Products & Services (NOAA CO-OPS, 2009)
for four hydrologic stations. These are located along the eastern
(Port Fourchon and Lawma Amerada Pass), central (Freshwa-
ter Canal Locks), and western (Sabine Pass North) Louisiana
coast (Figures 1 and 3).
Inland water-level data for calibrating and validating the
inundation maps were obtained from the Strategic Online
Natural Resources Information System (SONRIS, 2010) of the
Louisiana Department of Natural Resources. Most inland
hydrologic sites are part of the Coastwide Reference Monitor-
ing System (CRMS). Many of these hydrologic records were
incomplete for the period before, during, and after the passage
of Hurricanes Gustav and Ike. Avoiding incomplete hydrologic
records, we gathered data from stations in the western, central,
and eastern coastal regions (NOAA CO-OPS, 2009; Figure 4).
Water levels above the ground surface of marsh (at 0 m) were
compared to change-detected presence or absence of persistent
surge waters when SAR data collections were acquired.
With respect to the inundation analyses, the comparability of
image products that are composites of spatially integrated
ground elements (pixels; 150-m spatial resolution, in this case)
with point measurements (water-level recorder locations) can be
an issue (e.g., see Fisher and Mustard, 2007). This spatial
incompatibility—particularly in highly dynamic situations
occurring in heterogeneous environments, such as surge
flooding and recession in complex marsh systems—may
diminish the reliability of the assessment method. Alternative-
ly, water-level recordings can be a source of inundation
validation error. Accurate determination of surface flooding,
particularly when surface water levels are low (i.e., ,10 cm),
requires highly accurate ground-surface and water-level eleva-
tions and reliable functioning of the water-level recorders.
Inconsistencies in any factors related to the water-level
recordings and scale incompatibilities may also limit the
validity of the SAR-based inundation assessments. To improve
the calibration and validity of the SAR inundation results, the
assessments incorporated suitable adjacent marsh within a 150-
m radius (nominal ASAR ground resolution) surrounding the
hydrologic sites. If there was a high density of flood occurrences
within the 150-m radius, we concluded that the site was flooded.
Permanent Water Body Delineation
In order to minimize confusion among wind-roughened water
surfaces, flooded marsh, and nonflooded marsh, permanent
water bodies were defined within the study area. Location and
extent of permanent inland coastal waters obtained from the
Louisiana Oil Spill Coordinator’s Office (LOSCO, 2007) were
updated with 13 TM images collected from 2006 to 2008 before
Hurricane Gustav (western region: 4 June 2006; 20 April and 10
and 26 August 2007; and 18 February, 15 March, and 27 July
2008; central region: 13 June 2006; 29 April 2007; and 18 June
2008; and eastern region: 6 June 2006; 6 April 2007; and 13 July
2008). These TM images were registered to the same LCC-
projected TM base image used for the SAR scene registration.
LOSCO open-water polygon coverage was superimposed on the
suite of TM images, and areas of omission between the vector
coverage and the water bodies on the TM images were
determined. Water bodies omitted on the LOSCO coverage that
were at least 40 km2 and exhibited spatial and temporal
consistency on the TM images from 2006 up to the hurricanes of
2008 were added to the LOSCO permanent water bodies mask.
Permanent water bodies were excluded from the SAR change-
detection products. In addition, a coastal extent vector was used
to exclude offshore waters (LOSCO, 2007). Location errors in
the coastal vector were found in rapidly changing and spatially
complex deltaic marshes, such as the Mississippi River,
Atchafalaya, and Wax Lake deltas (Figure 4).
Mapping Inundation
In order to detect changes related to the passage of
Hurricanes Gustav and Ike, calibrated reference (normally
prehurricane) and posthurricane SAR scenes were required.
The reference SAR scenes were chosen from within the same
season to minimize change-detection differences caused by
vegetation phenology and at times that avoided atypically
elevated sea levels and coastal flooding (e.g., Hurricane Dolly
and Tropical Storm Edouard; Figure 5). These criteria helped
ensure the change-detection algorithm could capture subcanopy
flooding specifically associated with Hurricanes Gustav and Ike.
Each posthurricane scene was paired with an appropriate L-
band or C-band reference scene based on common HH or VV
polarization to eliminate change artifacts associated with
polarization differences across the SAR imagery. A logarithmic
ratio of the reference and posthurricane scenes resulting in a
positive decibel difference, indicating lower intensities after
the hurricanes than before. In these marshes, it (dB differ-
ences) also indicated possible inundation. To help limit noise
and better discriminate flooded from nonflooded marsh, the
SAR-based change-detection algorithm incorporated a 5 3 5
pixel internal Kuan speckle filter to dampen noise while
preserving edges and shape. In addition, minimum change-
detection thresholds were applied that relied on identifying
Table 2. Specifications of Landsat Thematic Mapper scenes acquired
before and after Hurricanes Gustav and Ike.
Location
Maximum Cloud Cover
(%) Data Acquisition Date
Prehurricane images
Eastern 0 6 April 2007
Central 0 29 April 2007
Western 10 20 April 2007
Posthurricane images
Eastern 1 1 October 2008
Central 4 22 September 2008
Western 1 29 September 2008
Satellite Imagery to Monitor Environmental Response to Coastal Flooding 0
Journal of Coastal Research, Vol. 00, No. 0, 0000

inflections on plots of SAR backscatter versus threshold value
and visual interpretation, guided by inland water-level
fluctuations, to discriminate flooded from nonflooded marsh
(Ramsey et al., 2011). Once appropriate threshold values were
obtained, we mapped the surge extent occurring at the time of
posthurricane SAR collection along the entire Louisiana coast.
Reference Scene Comparison
The dependency of the SAR inundation mapping perfor-
mance on the reference scene selection was evaluated at one
posthurricane SAR scene date point. In the western region, we
replaced the reference SAR scene—from 3 August 2008—with
Figure 3. Hydrographs showing water levels (NOAA CO-OPS, 2009) along the Louisiana coast (see Figure 1): (a) western station, Sabine Pass North;
(b) central station, Freshwater Canal Locks; and eastern stations, (c) Lawma Amerada Pass and (d) Port Fourchon.
0 Ramsey et al.
Journal of Coastal Research, Vol. 00, No. 0, 0000
a scene acquired on 4 September 2007. We then compared the
results of these two separate inundation–detection analyses.
Dieback Extent and Marsh Type
Using the 2007 Louisiana Coastal Marsh–Vegetative Type
Map (Sasser et al., 2008) as a guide, we included fresh marsh in
the palustrine wetland class and combined intermediate,
brackish, and saline marshes into the estuarine marsh class
to generalize the comparisons and to better align with national
wetland classification systems (Klemas et al., 1993). At times,
components of the estuarine marsh, including intermediate–
brackish and saline marshes, were separately evaluated with
respect to impact severity. Swamps and upland classes were
excluded from our analysis (Figure 4). Combined, the ASAR
scenes and TM images covered 8688 km2 of estuarine and
3290 km2 of palustrine marshes along the entire Louisiana
coast, and the PALSAR scenes covered 4994 km2 of estuarine
and 1928 km2 of palustrine marshes along the eastern region of
the coast.
Although dieback was visually apparent on the posthurri-
cane TM images, to assess its extent we needed to standardize
the multispectral values of the imagery to a single green-
biomass indicator. We achieved standardization by performing
a simple ratio transformation (near infrared to red) of
vegetation index (VI) values to derive the single green-biomass
estimator. Transformation of the TM-based VI values helped
minimize atmospheric and illumination differences between
prehurricane and posthurricane images and provided a single
index more conducive to analyzing change (Ramsey et al.,
2009a). Once we transformed to VI values, we produced a
single image to capture green-biomass differences between
prehurricane and posthurricane images. Only positive differ-
ences, indicated by green-biomass content that was higher
before than after the storm-surge event, were considered in the
dieback assessment.
We wanted not only to assess the extent of the dieback but
also to estimate its severity across the landscape. In order to
provide an impact severity estimate, we needed to account for
natural variability in green-biomass content outside the
context of hurricane impacts. In order to relate the change
magnitude to the local prehurricane green-biomass levels, we
combined prehurricane–posthurricane change VI values with
prehurricane absolute VI values and then performed an
unsupervised Iterative Self-Organizing Data Analysis Tech-
nique (ISODATA) classification (PCI Geomatics, 1998; Tou and
Gonzalez, 1974) on the entire dataset. Resultant data clusters
were grouped into impact classes based on modal features in
the difference frequency histogram. The prehurricane and
change VI means and standard deviations (SDs) were calcu-
lated for each impact class. The class mean was calculated as
the sum of cluster means divided by the number of clusters
comprising the impact class. The variance per impact class was
calculated by multiplying the sum of the squared SD per
classification cluster (comprising each class) by the reciprocal
number of clusters squared (Bevington, 1969). The SD per class
was calculated as the square root of the variance estimate.
Another aim of our study was to obtain a measure of severity
of the surge impact specific to palustrine and estuarine
marshes. Our classification of change magnitudes (via ISO-
DATA) did not include marsh type; therefore, we overlaid the
2007 Louisiana Coastal Marsh–Vegetative Type Map (Sasser
et al., 2008) onto our initial image indicating green-biomass
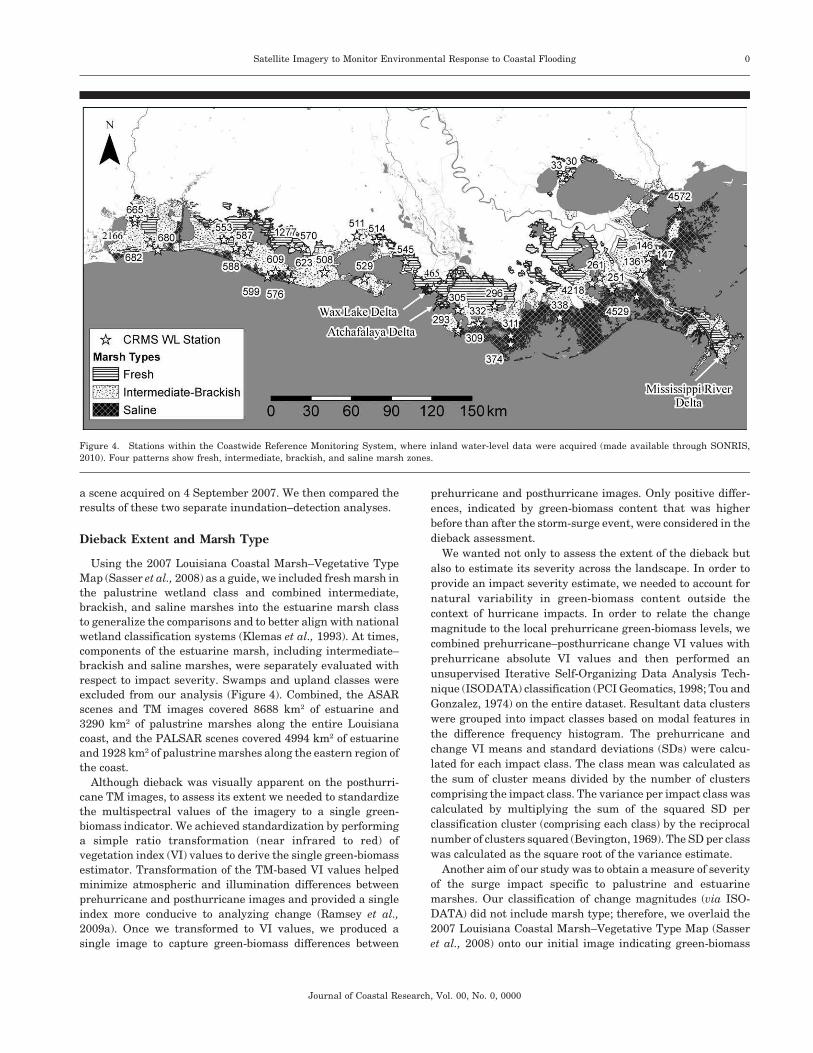
Figure 4. Stations within the Coastwide Reference Monitoring System, where inland water-level data were acquired (made available through SONRIS,
2010). Four patterns show fresh, intermediate, brackish, and saline marsh zones.
Satellite Imagery to Monitor Environmental Response to Coastal Flooding 0
Journal of Coastal Research, Vol. 00, No. 0, 0000

changes. We then introduced our change-magnitude classifi-
cation to map the severity and extent of dieback specific to each
marsh type.
RESULTS
Coastal Surge Data
Analysis of the hydrograph data show that the direct impacts
of elevated salinity related to storm surge from Hurricane
Gustav were limited to the east-central and eastern regions of
coastal Louisiana (Figure 3). Storm surge associated with the
landfall of Hurricane Gustav was clearly indicated only on the
hydrographs for the eastern region (Figures 3c and d). A
hydrograph for Amerada Pass (Figure 3c), at the borderline of
the central and eastern regions, showed a storm-surge peak at
landfall of Hurricane Gustav, but the surge was not recorded
75 km to the west at Freshwater Canal Locks (Figure 3b). In the
central and western regions, offshore flow of coastal water
occurring upon landfall of Hurricane Gustav was reported as a
drawdown on the hydrographs (Figures 3a and b). In contrast,
storm surge associated with the passage of Hurricane Ike
impacted the entire Louisiana coast (Figure 3). Storm-surge
peak heights increased from east to west, while time delays
between the storm-surge peak and the SAR scene collection
decreased. The time delay was particularly pronounced in the
eastern coastal region covered by the 17 September 2008 eastern
ASAR scene, which was acquired 16 days after Hurricane
Gustav and 4 days after Hurricane Ike (Figures 2, 3c, and 3d).
Reference Scenes and Thresholds for DetectingChanges in Inundation
SAR collection times during the summer season ahead of
Hurricanes Gustav and Ike overlain onto a coastal hydrograph
obtained from NOAA CO-OPS (2009) yielded the following
insights. The presence of Hurricane Dolly and Tropical Storm
Edouard in the Gulf of Mexico from mid-July to early August
2008 abnormally elevated coastal sea levels (Figures 1 and 5).
Hydrographs depicting inland conditions from 15 July to 13
October indicated that elevated water levels above the
surrounding marsh surface (denoting the ground surface of
marsh subcanopy or 0-m water level) existed at some CRMS
locations near the times of Hurricane Dolly and Tropical Storm
Edouard landfall (SONRIS, 2010; Figure 6). Although pre-
hurricane reference scenes collected during ‘‘typical’’ sea levels
were preferred, the approaches of Hurricane Dolly and Tropical
Storm Edouard and landfalls of Hurricanes Gustav and Ike
from the latter half of August to mid-September 2008 limited
our choice of reference SAR scenes. Taking into account the
necessity for consistency in seasonality, only two ASAR scenes
and a single PALSAR scene were available as candidate
reference scenes for the change-detection analyses (Figure 5).
The reference SAR scenes were collected at times of higher-
than-preferred water levels.
Inundation Thresholds
The total area associated with positive change-detection
results above each incremental increase of threshold magni-
tude was calculated for each posthurricane ASAR date
(Ramsey et al., 2011). Inflections in the plotted trends were
examined for indications of an abrupt change in the SAR
backscatter that could have been related to a change from
flooded to nonflooded marsh. All five curves decreased without
an obvious inflection point throughout the threshold ranges we
evaluated (Figure 7). Lacking an inflection point indicating an
abrupt change, choice of threshold values was guided by inland
water levels and visual interpretation. Threshold magnitudes
of 0.1 dB (ASAR) and 1.0 dB (PALSAR) were found to retain
trends in hydrologic data recorded inland at CRMS stations
and in visual interpretation of inland inundation extent.
Even though limited to a single comparison, replacement of
the 3 August 2008 scene (the most appropriate reference scene)
with the 4 September 2007 scene as the ASAR reference scene
produced results that exhibited high agreement with inunda-
tion results based on the 3 August reference and 14 September
2008 ASAR scenes (Figure 8).
Flooding-Related Changes and Inland Water LevelRecords
We found that the locations of many inland hydrologic
stations did not allow direct comparisons between recorded
water levels and measurements of surface inundation calcu-
Figure 5. Hydrologic data from 1 July to 20 October 2008 at station
CRMS0465 in the Coastwide Reference Monitoring System (CRMS;
SONRIS, 2010). The hydrograph shows water-level peaks associated with
Hurricane Dolly (23 July), Tropical Storm Edouard (5 August), Hurricane
Gustav (1 September), and Hurricane Ike (13 September). (See Figure 1 for
storm paths and Figure 4 for the CRMS station location.) Reference scene
collection dates are shown as solid lines.
0 Ramsey et al.
Journal of Coastal Research, Vol. 00, No. 0, 0000

lated with SAR data. Although locations on the marsh platform
were preferred, most recording sites were located in water
channels that exhibit flow dynamics different from those of the
marsh platform and were separated from the marsh platform
by varying distances and partial obstructions, such as levies.
Many recording sites were located in a landscape of mixed
marsh and forest stands or in degrading marsh containing a
high proportion of open water. In the most egregious cases (e.g.,
spatially extensive open water, degrading marsh, or mixed
land covers), the incompatibility of the water-level data and the
SAR data required us to discard data from these hydrologic
sites or move assessment points to an adjacent area exhibiting
the desired marsh extent and uniformity.
Even after removal of the most incompatible hydrologic sites,
most sites were influenced by mixed land covers on the SAR
imagery, various hydraulic impediments to flow, and as
mentioned earlier, the possibility of inconsistencies in the
water-level recordings. Increase of the assessment area to the
spatial resolution of the sensor (100 and 150 m for PALSAR and
ASAR, respectively) alleviated some spatial scale incompati-
bilities; however, remaining inconsistencies tempered direct
validation of SAR-based marsh flooding with available hydro-
logic data. This was especially apparent in central and eastern
coastal regions, where SAR-based flood detection produced
scattered pockets of persistent flooding.
Even though most inland hydrologic sites were unsuitable for
use in direct validation, the occurrence or absence of elevated
water levels at the recording stations provided an indication of
flooding in the surrounding marshes and, thus, an overall
measure of the performance of SAR-based flood detection. Site-
specific assessments, especially in areas of shallow water, were
not as important as the assessment of trends.
Storm-Surge Extents Estimated with SAR Data
Inundation maps based on ASAR and PALSAR change-
detection analyses showed prominent storm-surge flooding in
the western region and isolated pockets of residual flooding in
the central and eastern regions (Figure 9). Residual flood
patterns differed in the eastern sector when the scene of 17
September was replaced with the scene of 14 September (both
scenes acquired after Hurricanes Gustav and Ike; Figures 9c
and d). There was generally low correspondence between
satellite-based flood mapping using the 17 September ASAR
scene and ground-based water-level measurements; however,
in one area, the 17 September scene produced more reliable
mapping results than those based on the 14 September scene.
This area included the estuarine marsh in the eastern region,
particularly in the near-shore estuarine marsh and the upper
estuarine marsh located at the eastern edge of the overlap zone
Figure 6. Hydrologic data from selected stations of the Coastwide Reference Monitoring System (CRMS; available through SONRIS, 2010) covering
the eastern, central, and western coastal regions (see Figure 4 for station locations): (a) CRMS0665, (b) CRMS0508, (c) CRMS1277 (note peak delay),
(d) CRMS0545, (e) CRMS0293, (f) CRMS0374, (g) CRMS0338, and (h) CRMS0146. Vertical dashed lines indicate the dates of satellite data acquisition
(before and after Hurricanes Gustav and Ike), and solid lines indicate the dates of hurricane landfall. Water levels of 0 (m) designate the ground-surface
height around a given data recorder.
Satellite Imagery to Monitor Environmental Response to Coastal Flooding 0
Journal of Coastal Research, Vol. 00, No. 0, 0000

between the 14 September and the 17 September scenes
(Figures 9c and d). Extensive flooding detected in the upper
estuarine marsh using the 17 September scene was not
detectable using the 14 September scene. Inland hydrologic
data collected at CRMS stations within this area (CRMS0251,
CRMS146, and CRMS3667) showed that shallow flooding
present in this marsh on 17 September was deeper at the
time of the 14 September ASAR collection. Although the 14
September ASAR scene did not extend far enough to the east to
cover CRMS4572, CRMS146, CRMS147, CRMS136, and
CRMS4529, data from these sites also indicate that water
levels decreased from 14 to 17 September 2008. The unreliable
results from the 14 September scene might be explained by the
relatively high SAR backscatter exhibited in the near range,
which could have decreased the contrast that would be
expected between nonflooded marsh (prehurricane) and flood-
ed marsh (posthurricane) in the ASAR scenes, thus lowering
the performance of our change analysis (Ramsey et al., 2011).
SAR-Based Storm-Surge Extent and InlandHydrologic Data
Overall, correspondence of the spatial and temporal juxta-
position of ground-based water-level measurements with
ASAR-based inundation results was 78% for the 14 September
imagery and 67% for the 17 September imagery; correspon-
dence was 91% with the PALSAR-based inundation results for
the 8 September imagery (Figure 10).
Western Region
The highest regional correspondence of 92% was in the
western region for the 14 September ASAR scene. This high
correspondence was linked to the shortest time delay
between the surge peak (of Hurricane Ike) and SAR data
collection at 33 hours (on 14 September) and the highest
surge-related water levels (1.21 6 0.43 m; 13 September,
0800 UTC, 4.06 m at Sabine Pass North; NOAA CO-OPS,
2009; Figure 3a).
Central Region
The central region was imaged by ASAR on both 14 and
17 September at 40 and 100 hours, respectively, after the
surge peak of Hurricane Ike on 13 September (Figure 3b).
Even though inland measurements of water levels were
higher on 14 September (0.59 6 0.34 m) than on 17
September (0.13 6 0.27 cm), we achieved better perfor-
mance in inundation mapping with the 17 September
imagery (88% correspondence with inland hydrologic data)
than with the 14 September imagery (50% correspondence;
Figures 10a and b).
Eastern Region
The eastern region was imaged by PALSAR 167 hours after
the storm-surge peak of Hurricane Gustav and by ASAR on 14
and 17 September at 55 and 115 hours, respectively, after the
Hurricane Ike storm-surge peak (Figure 3c). Correspondence
between the PALSAR-based inundation data and the ground-
based water-level measurements was 91%, with water levels
averaging 0.22 6 0.10 m (Figure 10c). Correspondence was
86% in the far range of the 14 September ASAR-based
inundation image, with average water levels of 0.79 6 0.17 m,
and 50% in the near range of the 17 September ASAR scene,
with average water levels of 0.27 6 0.13 m.
C-band versus L-band Inundation Mapping
Varying performance rates between PALSAR-based and
ASAR-based inundation mapping offer an estimate of the
canopy penetration limits of C-band sensors applied to denser
estuarine marshes. At ground-based monitoring sites in the
eastern region where flood occurrences were incorrectly
mapped by the 17 September ASAR data, five of the six
sites contained canopies of tall Spartina alterniflora
marsh (CRMS374, CRMS338, CRMS4529, CRMS147, and
CRMS4572). Of those five sites, CRMS374 and CRMS338 were
within the coverage area of the 14 September ASAR scene.
According to ground-based measurements, the average flood
depths on 14 and 17 September (when ASAR scenes were
collected) were 0.60 6 0.08 and 0.20 6 0.07 m, respectively.
ASAR-based mapping of flood occurrences agreed with ground-
measured flood occurrences on 14 September but not on 17
Figure 7. Positive threshold trends for detecting inundation (see Ramsey
et al., 2011). The area of diminished backscatter percentage refers to those
marshes where the reference scene backscatter was higher than the
posthurricane backscatter, indicating flooding (the reference and post-
hurricane scene dates are shown in the legend). The percentage is used
because each trend line is normalized by the pertinent coastal region area
depicted in Figure 1. As described in the text, not all decreased backscatter
indicates the occurrence of flooding; the thresholds are used to help remove
those non–flood-related decreases. Trends were derived to examine
whether an inflection in the trend could be used to establish the threshold.
No inflections were visually apparent; however, the trends describe the
relative differences in extent (intercept) and the form of the threshold
increase with extent.
0 Ramsey et al.
Journal of Coastal Research, Vol. 00, No. 0, 0000

September. Although evidence is not conclusive, C-band ASAR
mapping of subcanopy inundation may be limited, on average,
to flood depths higher than 20 to 30 cm in tall S. alterniflora
marshes. Similarly, flood occurrences at three (CRMS374,
CRMS338, and CRMS4529) of the five ground-based monitor-
ing sites were incorrectly mapped with the 17 September ASAR
scene, but occurrences were correctly mapped with the
PALSAR data when depths averaged 0.10 6 0.086 m. These
results suggest increased ASAR-based mapping performance
with increasing depths of subcanopy inundation (before
overtopping) and the higher efficiency of L-band versus
C-band data in mapping marsh inundation, particularly in
denser marshes with shallow flooding.
Dieback Extent and Marsh Type
TM images collected before and after Hurricanes Gustav and
Ike transformed into VI images (Figure 11) were combined to
produce four classes of VI change relative to the before VI
magnitudes (Table 3). The VI classes formed spatially contig-
uous classes representing four classes of dieback severity
within the palustrine and estuarine marshes (Figure 12 and
Figure 8. Comparison of inundation maps based on advanced synthetic aperture radar (ASAR) reference scenes acquired on different dates before
Hurricanes Gustav and Ike. (a) Inundation based on 3 August 2008 reference and 14 September 2008 posthurricane scenes. (b) Inundation based on
4 September 2007 reference and 14 September 2008 posthurricane scenes.
Satellite Imagery to Monitor Environmental Response to Coastal Flooding 0
Journal of Coastal Research, Vol. 00, No. 0, 0000
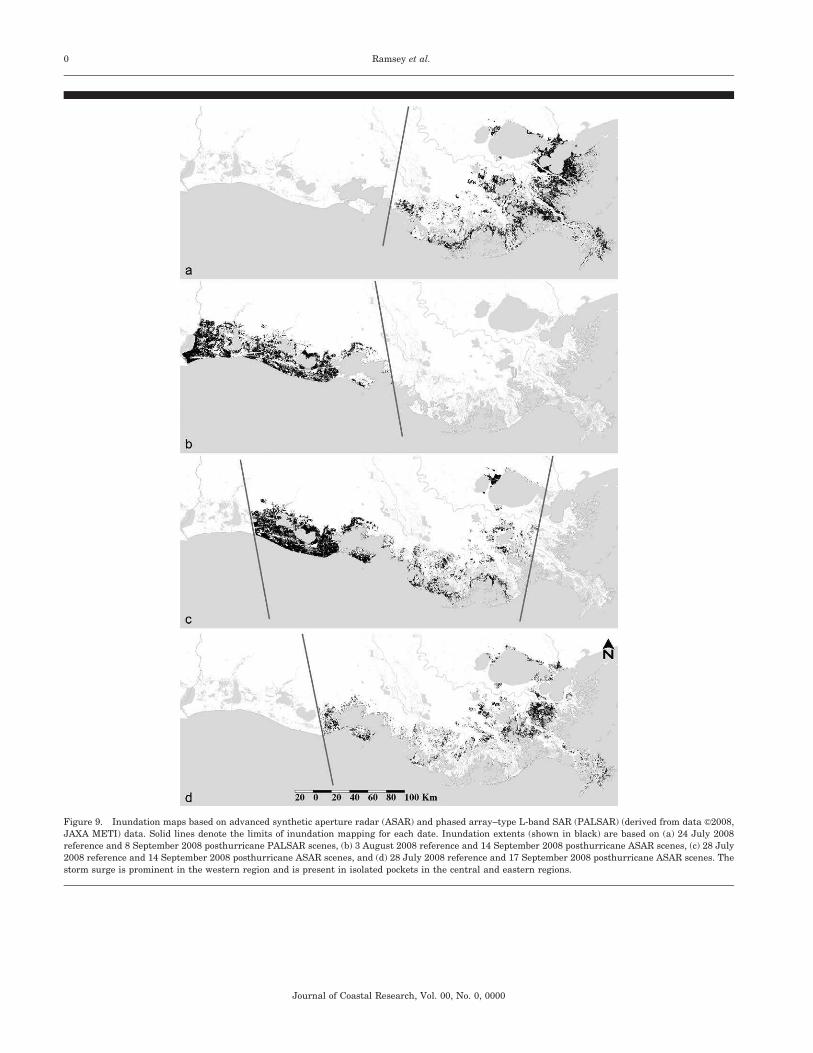
Figure 9. Inundation maps based on advanced synthetic aperture radar (ASAR) and phased array–type L-band SAR (PALSAR) (derived from data ’2008,
JAXA METI) data. Solid lines denote the limits of inundation mapping for each date. Inundation extents (shown in black) are based on (a) 24 July 2008
reference and 8 September 2008 posthurricane PALSAR scenes, (b) 3 August 2008 reference and 14 September 2008 posthurricane ASAR scenes, (c) 28 July
2008 reference and 14 September 2008 posthurricane ASAR scenes, and (d) 28 July 2008 reference and 17 September 2008 posthurricane ASAR scenes. The
storm surge is prominent in the western region and is present in isolated pockets in the central and eastern regions.
0 Ramsey et al.
Journal of Coastal Research, Vol. 00, No. 0, 0000

Table 4). The highest percentage of palustrine marsh dieback
was associated with the low impact class, according to changes
in VI values (Table 4). The low impact palustrine marshes
occurred most often just inland of the estuarine marshes in the
east and western regions. The second highest spatial percent-
age was associated primarily with an isolated inland pocket of
managed palustrine marshes in the east-central coastal region.
The high and severe impact marsh classes were concentrated in
the central coast, where the palustrine marshes occupy the
ocean-to-marsh transition.
The pattern of estuarine dieback varied in the western and
eastern regions. Estuarine dieback in the eastern region was
Figure 10. Water levels above the ground surface of marsh (0 m) at inland hydrologic stations (see Figure 4 for station locations) when satellite data were
acquired after Hurricanes Gustav and Ike. Inundation (or its absence) was compared across the inland hydrologic data and the satellite data. The regional
locations of the stations are indicated with bar shades, with dark, medium, and light gray bars indicating western, central, and eastern zones, respectively.
Where inland and satellite data corresponded, solid bars are used; where they differed, lined bars are used. Water levels and correspondences based on
(a) 14 September 2008 advanced synthetic aperture radar (ASAR; CRMS0146 is located just east of the scene extent), (b) 17 September 2008 ASAR, and
(c) 8 September 2008 phased array–type L-band synthetic aperture radar. (See Figure 9 for inundation coverage.)
Satellite Imagery to Monitor Environmental Response to Coastal Flooding 0
Journal of Coastal Research, Vol. 00, No. 0, 0000

dominantly characterized by the low impact class near shore
and by moderate impact class farther inland (Table 4). In the
western region, estuarine dieback was dominantly character-
ized by moderate impact, but some of the marshes farthest
inland were characterized by low impact. The high and severe
impact classes were associated with estuarine marshes found
in localized pockets along the coastline in the central and
western portions of the western region.
Separating the estuarine marsh into saline marsh compo-
nents and intermediate–brackish components, we found that
saline marshes dominated by S. alterniflora and occupying the
nearshore in the eastern region most often displayed the low
impact class of dieback (72%), followed in frequency by the
moderate impact class (27%; Table 5). The remaining 1% of
saline marsh was characterized by the high impact class. On
the other hand, intermediate–brackish marshes in the eastern
region were equally likely (47%) to be characterized by the low
and moderate impact classes, with 6% included in the high and
severe impact classes.
In the marshes of the eastern region, the direct
comparability of the saline and intermediate–brackish
marshes was justified by their similar spatial extent. In
the central and western regions, saline marshes were only
2 and 11% of the aerial extent of intermediate–brackish
marshes, respectively. Even though the comparison is
tenuous, saline and intermediate–brackish marshes ex-
hibited similar patterns in the western region. About 30%
of both marsh types were characterized by the low impact
class, and about 60% were characterized by the moderate
impact class. The saline marshes in the western region,
Figure 11. Maps of the vegetation indexes created from Landsat Thematic Mapper imagery acquired before and after Hurricanes Gustav and Ike, based on
(a) prehurricane imagery (from April 2007) and (b) posthurricane imagery (from September and October 2008). The lighter gray colors (black progressing to
white) represent increasingly higher vegetation indices.
0 Ramsey et al.
Journal of Coastal Research, Vol. 00, No. 0, 0000

however, are often dominated by Distichlis spicata.
Although D. spicata is commonly called saltgrass and
classified as saline, these plants are more accurately
designated as brackish. Considering D. spicata as an
intermediate–brackish marsh would result in the eastern
and western dieback severities being more comparable. In
that case, it may be that marshes classified as saline are
not less sensitive to elevated salinity waters but that a
specific saline marsh species dominating the eastern
shoreward marsh—namely S. alterniflora—is less sensi-
tive to elevated salinity from storm surge than are most or
all other coastal marsh species.
Figure 12. Magnitudes of severity in marsh dieback along the Louisiana coast indicated by prehurricane and posthurricane vegetation indexes and their
differences based on Landsat Thematic Mapper imagery. (a) Spatial distribution of dieback severity in palustrine wetlands. (b) Spatial distribution of dieback
severity in estuarine wetlands. (Classes of dieback severity follow those presented in Table 4.)
Table 3. Thematic Mapper Vegetation Index (VI) Means and Standard Deviations (SDs) per Impact Class.*
Dieback Severity
Prehurricane VI Values Pre- to Posthurricane VI Change
NMean SD Mean SD
Low impact 1.90 0.05 0.30 0.06 7
Moderate impact 2.80 0.07 0.84 0.07 7
High impact 3.90 0.10 1.70 0.09 5
Severe impact 4.98 0.09 3.22 0.08 8
* The impact classes combined palustrine and estuarine marshes.
N 5 number of clusters aggregated per impact class.
Satellite Imagery to Monitor Environmental Response to Coastal Flooding 0
Journal of Coastal Research, Vol. 00, No. 0, 0000
Storm-Surge and Dieback Relationships
The highest spatial agreement between the geographic
extent of the surge-induced marsh dieback and the mapped
surge flooding occurred in the western portion of the study area
(Figures 9 and 12). Satellite coverage of this region was also
characterized by the least lag time between storm-surge peak
and data collection. By contrast, in the eastern region, timing of
the SAR data collection did not align well with timing of the
storm-surge peak (Figures 9 and 12). In the eastern region, the
residual flooding distribution was calculated based on a
PALSAR scene collected 167 hours after Hurricane Gustav
and an ASAR scene collected 115 hours after the eastern
storm-surge peak of Hurricane Ike.
DISCUSSION
Storm-Surge Mapping
Persistent flooding in the coastal zone brought about by storm
surge from Hurricanes Gustav and Ike was mapped with
reference and posthurricane Envisat ASAR and ALOS PALSAR
scenes. Coastal hydrographs obtained from NOAA CO-OPS
(2009) reported the storm surge from Hurricane Gustav
primarily affected the eastern and more central regions and
from Hurricane Ike affected the entire coast from eastern to
western Louisiana. The PALSAR scene captured residual storm-
surge flooding in the eastern region 167 hours after Hurricane
Gustav, and ASAR scenes captured residual flooding 33, 40, and
115 hours after storm surges from Hurricane Ike in the, western,
central, and eastern regions of the Louisiana coast, respectively.
In all regions, as lag time increased between storm-surge
peaks and ASAR scene collection, detected inland flood extents
and water levels decreased. The shortest time lags in the
western region were associated with fairly spatially contiguous
flooding, while increased time lapses were related to detection of
highly scattered and isolated pockets of flooding in the central
and eastern regions. Although the storm surge had largely
receded in the eastern and central coastal areas by the time
satellite data were collected in those regions, flooding persisted
in the estuarine and palustrine marshes farther inland.
Correspondence of Change-Detected Flooding andRecorded Inland Water Levels
Based on inland water levels (SONRIS, 2010) and flood
extent results in the western region, ASAR-based inundation
mapping performed well when average above-surface water
levels were at least 79 cm. These higher correspondences may
be attributed to the inverse covariance between depth increase
of subcanopy inundation and decrease of SAR backscatter due
to less biomass interacting with the SAR signal (Dobson,
Pierce, and Ulaby, 1996). The greater the degree of difference
between backscatter intensities in the reference and those in
the posthurricane SAR scenes, the more likely the change
detection would forecast a change in site inundation.
As flood depth decreased with time following the surge peak,
differences between backscatter intensities decreased, causing
damping of the SAR intensity contrast in the reference and
posthurricane imagery and, consequently, degrading the
performance of inundation mapping. This degradation was
most apparent in inundation extents based on ASAR data. As
flood depths decreased, there was a general decrease in
correspondence between ground-based and ASAR-based mea-
surements of inundation, dropping to 50% or lower at flood
depths less than 30 cm. In contrast, at even shallower flood
depths, inundations based on PALSAR corresponded 91% of
the time with inland hydrographic recordings. The enhanced
performance in detecting subcanopy flooding with L-band SAR
sensors was most likely due to the higher potential of L-band
sensors to penetrate the canopy, particularly in denser
canopies (Hong, Wdowinski, and Kim, 2010; Kasischke et al.,
2003; Ramsey, 1998; Toyra and Pietroniro, 2005).
Although higher flood levels increased performance of ASAR
inundation mapping based in the western and eastern regions,
performance in the central region seemed to show a contrary
tendency. Using the 17 September 2008 ASAR scene, occur-
rences of flooding associated with ground-based water-level
measurements averaging 13 cm in the central region were
correctly mapped 88% of the time. In contrast, using the 14
September ASAR scene to map inundation at the same ground-
monitoring sites, there was a correspondence rate of only 50%,
which was associated with higher flood depths averaging 59 cm.
One important distinction of the central region (compared to
the eastern and western regions) is that palustrine instead of
estuarine marshes dominate along shore. In addition, the
reference ASAR scenes visually exhibited relatively low SAR
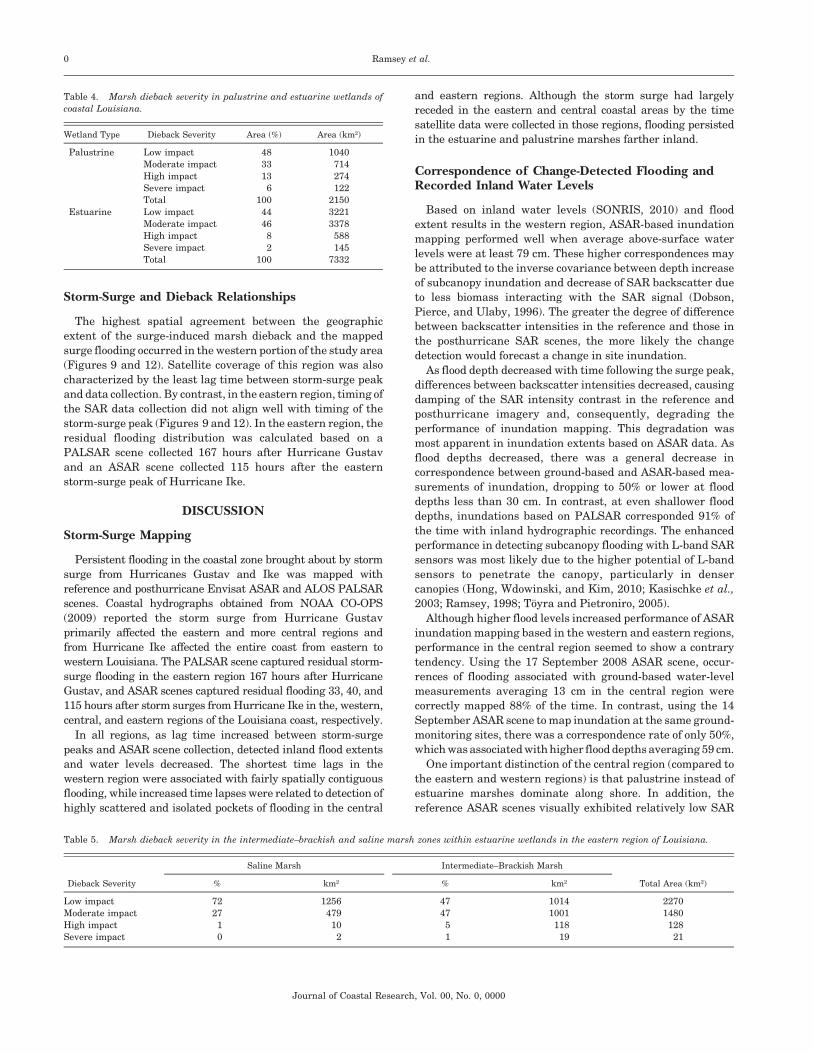
Table 4. Marsh dieback severity in palustrine and estuarine wetlands of
coastal Louisiana.
Wetland Type Dieback Severity Area (%) Area (km2)
Palustrine Low impact 48 1040
Moderate impact 33 714
High impact 13 274
Severe impact 6 122
Total 100 2150
Estuarine Low impact 44 3221
Moderate impact 46 3378
High impact 8 588
Severe impact 2 145
Total 100 7332
Table 5. Marsh dieback severity in the intermediate–brackish and saline marsh zones within estuarine wetlands in the eastern region of Louisiana.
Dieback Severity
Saline Marsh Intermediate–Brackish Marsh
Total Area (km2)% km2 % km2
Low impact 72 1256 47 1014 2270
Moderate impact 27 479 47 1001 1480
High impact 1 10 5 118 128
Severe impact 0 2 1 19 21
0 Ramsey et al.
Journal of Coastal Research, Vol. 00, No. 0, 0000

backscatter in the central region, even though all but one
recorded water level was below the marsh surface at the time of
ASAR reference scene collection. In the central region, the
contrast between satellite-based mapping performance on 14
September and that on 17 September is not explainable by
prehurricane inundation problems with inland hydrologic
locations.
Barring disproportionate problems in obtaining valid corre-
spondence estimates, only differences related to changes in
marsh type and storm-surge history remain. A possible
connection that could be linked to marsh type would be severity
of storm-surge impact. Even though a storm surge from
Hurricane Gustav was not recorded at the NOAA hydrographic
station in the central region, the Amerada Pass coastal station
75 km to the east recorded a 1.15-m storm-surge peak
associated with landfall (Figure 1 and 3c). Surge waters with
elevated salinity could quickly devastate a palustrine marsh
while leaving saline marshes largely intact, except for direct
physical impacts (e.g., see Barras, 2003). The palustrine
marshes of the central region, having already been impacted
by the elevated salinity water of Hurricane Gustav, could have
rapidly degraded following the storm surge of Hurricane Ike,
thus leaving collapsed or highly altered canopies. The surge
from Hurricane Ike, or the subsequently delayed inland runoff
noted at hydrologic sites in palustrine wetlands farther to the
west, could have removed much of the dead and damaged plant
material, thus reducing canopy density. Collapse of the marsh
canopy and its subsequent removal would change the perfor-
mance value of satellite-based inundation mapping because of
the association between canopy structure (density, orientation,
and stalk thickness) and SAR responses from flooded and
nonflooded marshes (e.g., see Grings et al., 2005; Kasischke
et al., 2003; Pope et al., 1997; Ramsey et al., 1999). In order to
answer whether or not changes in the canopy structure caused
by storm-surge impacts resulted in the noted differences in the
performance value of satellite-based inundation mapping,
continuing research is focused on how the structural aspects
of marsh canopies influence SAR data and how these aspects
vary when using L-band SAR versus C-band SAR data.
Some limitations of satellite-based inundation mapping that
we have discussed could have resulted from prehurricane
flooding. This type of limitation could have been aggravated by
point assessments of areal features or by changes in marsh
structure, independently or in combination. However, low
performance of ASAR-based mapping in the central region
using a scene from 14 September and in the eastern region
using a scene from 17 September were ultimately related to the
extended delay in posthurricane scene collection. As delay time
lengthened, flood occurrences, as detected in the satellite data,
became more scattered, isolated, and shallower. Furthermore,
in the case of palustrine marshes, while canopy degradation
progressed, the performance value of satellite-based inunda-
tion mapping decreased.
Complications of Inundation Detection
While some causes for low inundation mapping performance
should be alleviated by more frequent SAR scene collection
(Ramsey, 1998, 2005), in addition to the marsh collapse
previously discussed, we found three cases where the deviation
between ASAR-based estimates of inundation extents and
ground-based records of water levels may represent more
intractable limitations of the inundation mapping based on
change detection. These cases occurred in the eastern region
where persistent flood maps based on ASAR collections from
14 and 17 September spatially overlapped.
The first case of deviation between ASAR-based flood maps
and ground-based water-level records involved an inland
estuarine marsh (CRMS0146) at the eastern edge or near
range of the 14 September scene and the midrange of the 17
September scene (Figures 2, 4, and 6). Although site-specific
water-level records indicated the presence of fairly deep surface
flooding (55 cm) in the region on 14 September and shallow
flooding (,17 cm) on 17 September, spatially contiguous
flooding was only observed on the ASAR imagery acquired on
the latter date (Figure 10). In addition, there was conformity
between ASAR-based estimates of flooding and site-specific
water-level recordings based on the 14 September scene in
coastal marshes (CRMS0261 and CRMS4218) approximately
39 km west of CRMS0146 (Figure 4). A quantitative assess-
ment linking the performance of ASAR-based mapping to SAR
incident angle was not performed; however, the degradation of
mapping performance in the near range of the SAR scene is a
possible limitation of the mapping method.
A second case of deviation between SAR-based flood mapping
and ground-based water-level records involved backbarrier
estuarine marshes surrounding the eastern embayments (e.g.,
CRMS0311). Excluding marsh situated along the shoreline
(e.g., CRMS0374), these backbarrier marshes are often occu-
pied by short (,1 m) stands of S. alterniflora (Ramsey and
Rangoonwala, 2006). The water level at CRMS0311 at the time
of the 14 September ASAR collection was 0.66 m, which could
have nearly reached or overtopped the surface of the marsh.
When water levels are near or over the top of the marsh surface,
the marsh can approach an open-water surface susceptible to
wind roughening. As shown in Ramsey et al. (1994), SAR
backscatter from roughened inland water surfaces can closely
resemble the intensity distribution from nonflooded marshes.
In addition to CRMS0311, similar features indicating over-
topped canopies were exhibited at other sites that were
excluded from the validation-of-inundation analysis. Complex-
ities of this type, particularly in storm-surge situations, lower
the performance of inundation mapping based on SAR data.
A pertinent example of such complexities includes the
passage of a storm front at the time the 14 September ASAR
scene was collected (Ramsey et al., 2009b). The roughened
water surface resulting from the storm front was captured on
the ASAR scene as high backscatter. At CRMS0680, located
within this zone, ground-based water-level records indicate a
1.68-m storm surge at the time of the ASAR collection;
however, the high backscatter from the abnormally roughened
surface did not indicate the occurrence of marsh flooding.
In the same way, roughened water surfaces at more exposed
coastal marshes (e.g., CRMS0311) can produce incorrect
interpretations.
A third case of deviation between ASAR-based flood mapping
using the 17 September scene and ground-based water-level
records involves a discrepancy between a shoreline site
Satellite Imagery to Monitor Environmental Response to Coastal Flooding 0
Journal of Coastal Research, Vol. 00, No. 0, 0000
(CRMS0147) and a marsh site farther inland (CRMS0146) that
may be related to differences in marsh type and structure
(Figure 4). The estuarine marshes farther inland in the eastern
region were dominated by a marsh species type other than S.
alterniflora, which is dominant in more nearshore marshes.
Even though it is labeled as estuarine marsh in the 2007
Louisiana Coastal Marsh–Vegetative Type Map (Sasser et al.,
2008), the inland marsh at CRMS0146 is classified as
intermediate–brackish in the regional classification protocol
(Chabreck, 1970; Sasser et al., 2008). In contrast to the more
vertical and sometimes taller S. alterniflora canopies occupy-
ing the shoreline interface, intermediate–brackish species,
such as Spartina patens (marshhay cordgrass) and Schoeno-
plectus americanus (American bulrush), can be highly logged to
fairly vertical (McKee and Cherry, 2009; Ramsey et al., 2004).
As noted at other coastal sites dominated by S. alterniflora
(e.g., CRMS0147, CRMS0374, CRMS4529), the shallow flood-
ing recorded in ground-based measurements on the 17
September was below the detection limit we estimated for
ASAR-based flood mapping. Conversely, shallow flooding in
the marshhay cordgrass– or American bulrush–type marshes
(e.g., CRMS0146. CRMS0136, CRMS4218, CRMS0261) was
detectable with ASAR. Differences in marsh structures
(intermediate–brackish vs. saline estuarine marshes) could
have caused differences in the performance of ASAR-based
inundation mapping. Results implied a shallower inundation
detection limit when mapping intermediate–brackish marsh
most often typified by marshhay cordgrass or American
bulrush than when mapping marshes of the taller S.
alterniflora.
Marsh Dieback Extent and Severity
Transformation of multispectral VI values of prehurricane
and posthurricane data to a single biomass indicator provided a
first-order indication of the presence or absence of dieback and
allowed us to quantify its spatial extent. By combining the VI
change values with prehurricane values into a common
classification scheme, we were able to produce a map depicting
dieback extents and magnitudes within marshes naturally
exhibiting spatial variability in green-biomass percentages of
canopy.
When severity classes were cross-tabulated with the two
major coastal wetland types—palustrine and estuarine—a
close association between dieback and specific wetland types
was revealed. For the most part, palustrine and estuarine
wetlands were dominantly associated with areas characterized
by the low and moderate impact dieback classes; however,
compared with estuarine marsh, palustrine marsh included a
higher portion of areas characterized by the severest dieback
class. In the central region, areas in palustrine marsh that
were characterized by the severest dieback class were found at
the ocean and wetland interface. Furthermore, the severest
dieback class was associated with palustrine marsh exposed to
the brunt of two coastal storm surges, in contrast to palustrine
marsh located farther to the west or farther inland of hurricane
impacts.
The direct exposure of palustrine marshes in the central
region to inundation from storm surge did not suggest that
these marshes experienced longer inundation durations asso-
ciated with Hurricane Ike than the more moderately impacted
and more inland palustrine marshes farther west. In fact,
inland water-level recordings suggest the opposite (e.g., see
data for CRMS1277, Figure 6). The time delay between the
storm-surge event and the inland flood occurrence, coupled
with the observation (Wayne Sweeny, Louisiana Department
of Wildlife and Fisheries, personal communication) that
floodwaters were moving seaward, implies that inland palus-
trine marshes in the western inland region were impacted by
lower salinity waters more than by the higher salinity waters
that impacted the shorefront marshes in the central region. In
addition, as illustrated by hydrographs provided by NOAA CO-
OPS (2009), coastal palustrine marshes in the central region
were flooded by elevated salinity waters as a result of
Hurricanes Gustav and Ike, with the double ‘‘hit’’ compounding
the impact severity. Exposure of the nearshore palustrine
marshes to elevated salinities resulted in the most dramatic
changes in the greenness of palustrine marsh canopy and (most
likely) in the canopy structure. Because severely impacted
palustrine marshes were not widely located, there is insuffi-
cient evidence for further speculation.
Dieback severity in estuarine wetlands showed a distribu-
tion different from that in palustrine types. Estuarine wetlands
located in the eastern region were associated more with the low
impact class than were those wetlands situated farther inland
in the eastern region and occurring dominantly in the western
region. The former estuarine marshes were dominantly S.
alterniflora, and the latter were primarily associated with
intermediate–brackish marshes. As did the fresh marshes in
the central region, the intermediate–brackish marshes of the
(inland) eastern and western regions seemed more sensitive to
elevated salinities than to inundation duration.
CONCLUSIONS
Persistent flooding related to storm surge throughout the
coastal wetlands of Louisiana was mapped with Envisat ASAR
and ALOS PALSAR scenes collected before and after Hurri-
canes Gustav and Ike in 2008. In the western region of coastal
Louisiana, collection of ASAR data near the time of peak
flooding captured subcanopy flooding in excess of 1 m. The
situation was different during subsequent collection dates that
depicted the eastern portion of the study area, where receding
flood depths of less than 5 cm were encountered. As elapsed
time between peak flooding and satellite data collection
increased, the detected subcanopy flood depth decreased and
the flooding distribution became more scattered.
In estuarine marshes, correspondences between ASAR-
based flood mapping and ground-based water-level records
ranged from 86 to 92% when flood depths averaged 79 cm and
higher and dropped to 50% when flood depths averaged 27 cm.
When water levels averaged 22 cm in the same marshes, the
performance of PALSAR-based mapping remained high, with a
91% correspondence rate. Differences in inundation mapping
performances were likely related to the potential of deeper
canopy penetration of PALSAR relative to C-band ASAR. The
low performance of ASAR-based inundation mapping when
flooding was shallow was further traced to possible differences
0 Ramsey et al.
Journal of Coastal Research, Vol. 00, No. 0, 0000

in estuarine marsh type and structure. Using ASAR, minimum
flood depths detectable in S. alterniflora marshes in shoreward
locations were estimated to be 20 to 30 cm, whereas in the more
inland intermediate–brackish marshes (most likely consisting
of marshhay cordgrass or American bulrush), the detectable
flood depth decreased to less than 20 cm. Overall, based on the
limited comparison and the techniques used, coastal marsh
inundation mapping performance was higher with PALSAR
than with C-band ASAR data.
In addition to the common problems of assessing the
accuracy of aerial mapping performance from point locations,
particularly when flooding is shallow and spotted, a number of
factors seemed to have complicated the inundation mapping
performance. First, storm damage of coastal marsh canopies
would change the SAR backscatter, confusing the interpret-
ability of the prestorm and poststorm comparison. This
appeared particularly relevant to nearshore palustrine marsh-
es impacted by elevated salinity surge waters. Second, SAR
backscatter from wind-roughened water in overtopped marsh-
es can approach backscatter intensities indicative of non-
flooded marsh. Third, mapping performance was lowered in the
scene near range, where backscatter intensities are at a
maximum. Different SAR system configurations (e.g., wave-
length, polarization, and incidence angle range) alter SAR
backscatter relationships. Making more frequent collections
should alleviate inconsistencies related to wind roughening,
and the SAR look angle needs to be taken into account when
comparing two scene regions located in very different range
positions. ASAR-based mapping exhibited more susceptibility
to these two latter complications than did PALSAR-based
inundation mapping.
Marsh dieback severity resulting from storm-surge–induced
flooding was mapped using a VI developed from Landsat TM
images collected before and after Hurricanes Gustav and Ike.
Within the estuarine zone intermediate–brackish marshes
were most often the most severely impacted, while more
shoreward estuarine marshes dominated by S. alterniflora,
which had experienced a similar inundation history, exhibited
less severe impact. This may indicate that under similar
inundation scenarios, S. alterniflora marshes are more tolerant
to surge inundation than are intermediate–brackish marshes.
In contrast, palustrine marshes close to the ocean suffered the
severest impacts. Evidence suggests that severe impact on
these nearshore palustrine marshes may have been more a
consequence of direct exposure to elevated salinity than a
consequence of surge-related flood duration.
The results of our study emphasize the need for a more
consistent monitoring strategy in terms of frequency and
timeliness of remote sensing data collection. The main
limitation of our approach to inundation mapping using
satellite-based SAR data was related to inadequate frequency
of image collection. We found that the closer the time between
when the SAR data were collected and when the storm-surge
peak occurred, the more reliable the detection of maximum
flood extents and depths, whereas increased lag time between
storm-surge peak and SAR collection led not only to a decrease
in the spatial uniformity of flooding but also to a weakening of
the link between marsh dieback and casual agent—surge-
related water logging and elevated salinities. A secondary
limitation of our approach was a lack of specific information
concerning marsh canopy structure and the dynamics that
affect it over time and space. As these variables are better
understood and their influences on the determination of
subcanopy flooding and marsh condition are better determined,
the performance of satellite-based mapping of inundation will
improve.
ACKNOWLEDGMENTS
Envisat ASAR data are copyrighted by the European Space
Agency and were provided via the Cat-1 2853 project. The
Landsat TM data are courtesy of the Earth Resources
Observation Systems data center of the USGS. We thank
Dr. John W. Jones and Russell P. Rykhus (USGS) and Dr.
Barry Haack (University of Michigan) for their thoughtful
reviews. Also, we are grateful for the technical editing done
by the USGS Lafayette Publishing Service Center. Mention of
trade names does not constitute endorsement by the U.S.
government.
LITERATURE CITED
Alaska Satellite Facility. MapReady Remote Sensing Software. 2011.http://www.asf.alaska.edu/sardatacenter/softwaretools (accessedSeptember 8, 2011).
Barras, J., 2003. Change to Cote Blanche Hydrologic Restoration Area(TV-04) after Hurricane Lili. Lafayette, Louisiana: U.S. GeologicalSurvey National Wetlands Research Center, USGS-NWRC 2003-11-112, scale 1: 1,900,000, 1 sheet.
Berg, R., 2009. Tropical Cyclone report Hurricane Ike (AL092008) 1to 14 September 2008. Miami, Florida: National Oceanic andAtmospheric Association National Hurricane Center. http://www.nhc.noaa.gov/pdf/TCR-AL092008_Ike_3May10.pdf (accessedSeptember 1, 2010).
Beven, J. and Kimberlain, T., 2009. Tropical Cyclone reportHurricane Gustav (AL072008) 25 August to 4 September 2008.Miami, Florida: National Oceanic and Atmospheric AssociationNational Hurricane Center. http://www.nhc.noaa.gov/pdf/TCR-AL072008_Gustav.pdf (accessed September 1, 2010).
Bevington, P., 1969. Data Reduction and Error Analysis for thePhysical Sciences. New York: McGraw-Hill, 336p.
Chabreck, R., 1970. Marsh Zones and Vegetative Types in theLouisiana Coastal Marshes. Baton Rouge, Louisiana: LouisianaState University, Ph.D. thesis, 112p.
Dobson, C.; Pierce, L., and Ulaby, F., 1996. Knowledge-based land-cover classification using ERS-11JERS-1 SAR composites. IEEETransactions on Geoscience and Remote Sensing, 34(1), 83–99.
Fisher, J. and Mustard, J., 2007. Cross-scalar satellite phenology fromground, Landsat, and MODIS data. Remote Sensing of Environ-ment, 109, 261–273.
Grings, F.; Ferrazzoli, P.; Karszenbaum, H.; Tiffenberg, J.; Kandus,P.; Guerriero, L., and Jacobo-Berrles, J., 2005. Modeling temporalevolution of Junco marshes radar signatures. IEEE Transactionson Geoscience and Remote Sensing, 43(10), 2238–2245.
Hong, S.; Wdowinski, S., and Kim, S., 2010. Evaluation of TerraSAR-X observations for wetland InSAR application. IEEE Transactionson Geoscience and Remote Sensing, 48(2), 864–873.
Kasischke, E.; Smith, K.; Bourgeau-Chavez, L.; Romanowicz, E.;Brunzell, S., and Richardon, C., 2003. Effects of seasonal hydrologicpatterns in south Florida wetlands on radar backscatter measured fromERS-2 SAR imagery. Remote Sensing of Environment, 88, 423–441.
Kiage, L.; Walker, N.; Balasubramanian, S.; Babin, A., and Barras, J.,2005. Applications of Radarsat-1 synthetic aperture radar imageryto assess hurricane-related flooding of coastal Louisiana. Interna-tional Journal of Remote Sensing, 26(24), 5359–5380.
Klemas, V., 2005. Resolution requirements for coastal applications ofnew geostationary satellites. In: Balancing on the Edge—Coastal
Satellite Imagery to Monitor Environmental Response to Coastal Flooding 0
Journal of Coastal Research, Vol. 00, No. 0, 0000

Zone ’05. Proceedings of the 14th Biennial Coastal Zone Conference(U.S. National Oceanic and Atmospheric Administration, CoastalServices Center, New Orleans, Louisiana), 5p. https://www.csc.noaa.gov/cz/CZ05_Proceedings/pdf%20files/Klemas.pdf (accessedSeptember 8, 2011).
Klemas, V.; Dobson, J.; Ferguson, R., and Haddad, K., 1993. A coastalland cover classification system for the NOAA CoastwatchChange analysis project. Journal of Coastal Research, 9(3), 862–872.
LOSCO (Louisiana Oil Spill Coordinator’s Office), 2007. LouisianaGIS Digital Map of May 2007. Baton Rouge, Louisiana: LOSCO,digital versatile disc.
Lu, Z. and Kwoun, O., 2008. Radarsat-1 and ERS interferometricanalysis over southeastern coastal Louisiana: implication formapping water-level changes beneath swamp forests. IEEETransactions on Geoscience and Remote Sensing, 46(4), 2167–2184.
McKee, K. and Cherry, J., 2009. Hurricane Katrina sediment slowedelevation loss in subsiding brackish marshes of the Mississippiriver delta. Wetlands, 29(1), 2–15.
Morton, R.; Bernier, J.; Barras, J.; and Ferina, N.; 2005. RapidSubsidence and Historical Wetland Loss in the Mississippi DeltaPlain: Likely Causes and Future Implications. U.S. GeologicalSurvey, Open-File Report 2005-1216, 124p.
Neyland, R., 2007. The effects of Hurricane Rita on the aquaticvascular flora in a large fresh-water marsh in Cameron Parish,Louisiana. CASTANEA, 72(1), 1–7.
NOAA CO-OPS (National Oceanic and Atmospheric AdministrationCenter for Operational Oceanographic Products & Services). Tides& Currents. http://tidesandcurrents.noaa.gov/gmap3/ (accessedSeptember 13, 2009).
PCI Geomatics, 1998. Using PCI Software, Version 6.3 EASZIPACE(software documentation). Richmond Hill, Ontario, Canada: PCIGeomatics.
Pope, K.; Rejmankova, E.; Paris, J., and Woodruff, R., 1997. Detectingseasonal flooding cycles in marshes of the Yucatan Peninsula withSIR-C polarimetric radar imagery. Remote Sensing Environment,59, 157–166.
Ramsey III, E., 1998. Radar remote sensing of wetlands. In: Lunetta,R. and Elvidge, C. (eds.), Remote Sensing Change Detection:Environmental Monitoring Methods and Applications. Ann Arbor,Michigan: Ann Arbor Press, pp. 211–243.
Ramsey III, E., 2005. Remote sensing of coastal environments.In: Schwartz, M. (ed.), Encyclopedia of Earth Sciences Series.Dordrecht, the Netherlands: Kluwer Academic, pp. 797–803.
Ramsey III, E. and Rangoonwala, A., 2006, Site-specific canopyreflectance related to marsh dieback onset and progression incoastal Louisiana. Photogrammetric Engineering and RemoteSensing, 72(6), 641–652.
Ramsey III, E.; Laine, S.; Werle, D.; Tittley, B., and Lapp, D., 1994.Monitoring Hurricane Andrew damage and recovery of the coastalLouisiana marsh using satellite remote sensing data. In: Wells, P.and Ricketts, P. (eds.), Proceedings of the Coastal Zone, Canada ’94(Hallifax, Canada), pp. 1841–1852.
Ramsey III, E.; Lu, Z.; Suzuoki, Y.; Rangoonwala, A., and Werle, D.,2011. Monitoring duration and extent of storm surge flooding alongthe Louisiana coast with Envisat ASAR data. IEEE Geoscience andRemote Sensing, 4(2), 387–399.
Ramsey III, E.; Nelson, G.; Baarnes, F., and Spell, R., 2004. Lightattenuation profiling as an indicator of structural changes incoastal marshes. In: Lunetta, R. and Lyon, J. (eds.), Remote Sensingand GIS Accuracy Assessment. New York: CRC Press, pp. 59–73.
Ramsey III, E.; Nelson, G.; Sapkota, S.; Laine, S.; Verdi, J., andKrasznay, S., 1999. Using multiple polarization L band radar tomonitor marsh burn recovery. IEEE Transactions on Geoscienceand Remote Sensing, 37(1), 635–639.
Ramsey III, E.; Rangoonwala, A.; Middleton, B., and Lu, Z., 2009a.Satellite optical and radar image data of forested wetland impact onand short-term recovery from Hurricane Katrina in the lower PearlRiver flood plain of Louisiana, USA. Wetlands, 29(1), 66–79.
Ramsey III, E.; Werle, D.; Lu, Z.; Rangoonwala, A., and Suzuoki, Y.,2009b. A case of timely satellite image acquisitions in support ofcoastal emergency environmental response management. Journalof Coastal Research, 25(5), 1168–1172.
Sasser, C.; Visser, J.; Mouton, E.; Linscombe, J., and Hartley, S.,2008. Vegetation types in coastal Louisiana in 2007. U.S. GeologicalSurvey Open-File Report 2008-1224, 1:550,000 scale, 1 map sheet.
SONRIS (Strategic Online Natural Resources Information System).Welcome to SONRIS. http://sonris-www.dnr.state.la.us/www_root/sonris_portal_1.htm (accessed September 2, 2010).
Tou, J. and Gonzalez, R., 1974. Pattern Recognition Principles.Reading, Massachusetts: Addison-Wesley.
Toyra, J. and Pietroniro, A., 2005. Towards operational monitoring ofa northern wetland using geomatics-based techniques. RemoteSensing of Environment, 97, 74–191.
USACE (U.S. Army Corps of Engineers) Mississippi Valley Division,2006. Enhancing landscape integrity in coastal Louisiana: water,sediment & ecosystems. http://www.mvd.usace.army.mil/lcast/pdfs/CEM2.pdf (accessed August 31, 2010).
0 Ramsey et al.
Journal of Coastal Research, Vol. 00, No. 0, 0000