Life Cycle Assessment of Two Alternative Plastics for Bottle ...
21
materials Article Life Cycle Assessment of Two Alternative Plastics for Bottle Production Patrycja Baldowska-Witos 1, * , Izabela Piasecka 1 ,Józef Flizikowski 1 , Andrzej Tomporowski 1 , Adam Idzikowski 2 and Marcin Zawada 2 Citation: Baldowska-Witos, P.; Piasecka, I.; Flizikowski, J.; Tomporowski, A.; Idzikowski, A.; Zawada, M. Life Cycle Assessment of Two Alternative Plastics for Bottle Production. Materials 2021, 14, 4552. https://doi.org/10.3390/ma14164552 Academic Editor: Ben Amor Received: 21 June 2021 Accepted: 10 August 2021 Published: 13 August 2021 Publisher’s Note: MDPI stays neutral with regard to jurisdictional claims in published maps and institutional affil- iations. Copyright: © 2021 by the authors. Licensee MDPI, Basel, Switzerland. This article is an open access article distributed under the terms and conditions of the Creative Commons Attribution (CC BY) license (https:// creativecommons.org/licenses/by/ 4.0/). 1 Department of Technical Systems Engineering, Faculty of Mechanical Engineering, University of Science and Technology, 85-796 Bydgoszcz, Poland; [email protected] (I.P.); fl[email protected] (J.F.); [email protected] (A.T.) 2 Faculty of Management, Czestochowa University of Technology, 42-200 Czestochowa, Poland; [email protected] (A.I.); [email protected] (M.Z.) * Correspondence: [email protected] Abstract: The article characterizes selected issues related to the method of performing environmental impact analyses. Particular attention was paid to the need for identifying environmental effects associated with the process of shaping beverage bottles. This study concerns the analysis of selected stages of the machine’s life cycle environmental impact in the specific case of the blow molding machine used in the production of bottles. Life cycle assessment analysis was performed using the SimaPro 8.4.0 software (The Dutch Company Pre Consultants). The CML 2 and ReCiPe2016 methods were chosen to interpret the lists of chemical emissions. Impact categories specific to the CML 2 model are: abiotic depletion, acidification, eutrophication, global warming, ozone layer depletion, human toxicity, fresh water aquatic ecotoxicity, marine aquatic ecotoxicity, terrestrial ecotoxicity, and pho- tochemical oxidation. Among all the considered impact categories, marine aquatic ecotoxicity was characterized by the highest level of potential harmful effects occurring during the bottle production process. A new aspect of the research is to provide updated and more detailed geographic data on Polish bottle production. Keywords: life cycle assessment; plastic bottles; environmental impact; quality analysis 1. Introduction Growing public awareness and stricter legal requirements in the field of environmental protection caused an increase in interest in research methods that enable a reduction in the adverse impact on the natural environment and human health of products [1,2]. One such method is the LCA (Life Cycle Assessment) [3]. In light of the urgent need to reduce GHG (greenhouse gas) emissions from food value chains, this document examines GHG emissions from beverage bottle production [4]. The development of knowledge in the field of environmental protection in recent years has shown that the impact of post-consumer packaging on the environment should be considered throughout its life cycle, taking into account many factors that constitute environmental burdens and hazards, among which emissions into the atmosphere of gases containing substances should be distinguished. Others include hazardous conditions, greenhouse gas emissions, water and soil pollution, and excessive use of natural resources. One such method is the Ecological Life Cycle Assessment (LCA). Due to its comprehensive nature, it allows for a full assessment of the environmental impact of the entire life cycle of the selected product from the acquisition of raw materials to the management of waste gen- erated as a result of its use (cradle-to-grave analysis or cradle-to-cradle analysis). According to ISO 14040 and ISO 14044, the LCA test methodology consists of four phases, namely: Goal and Scope Definition, Life Cycle Inventory (LCI), Life Cycle Impact Assessment (LCIA), and Life Cycle Interpretation. These phases are closely related to each other in Materials 2021, 14, 4552. https://doi.org/10.3390/ma14164552 https://www.mdpi.com/journal/materials
-
Upload
khangminh22 -
Category
Documents
-
view
1 -
download
0
Transcript of Life Cycle Assessment of Two Alternative Plastics for Bottle ...

materials
Article
Life Cycle Assessment of Two Alternative Plastics forBottle Production
Patrycja Bałdowska-Witos 1,* , Izabela Piasecka 1 , Józef Flizikowski 1, Andrzej Tomporowski 1 ,Adam Idzikowski 2 and Marcin Zawada 2
�����������������
Citation: Bałdowska-Witos, P.;
Piasecka, I.; Flizikowski, J.;
Tomporowski, A.; Idzikowski, A.;
Zawada, M. Life Cycle Assessment of
Two Alternative Plastics for Bottle
Production. Materials 2021, 14, 4552.
https://doi.org/10.3390/ma14164552
Academic Editor: Ben Amor
Received: 21 June 2021
Accepted: 10 August 2021
Published: 13 August 2021
Publisher’s Note: MDPI stays neutral
with regard to jurisdictional claims in
published maps and institutional affil-
iations.
Copyright: © 2021 by the authors.
Licensee MDPI, Basel, Switzerland.
This article is an open access article
distributed under the terms and
conditions of the Creative Commons
Attribution (CC BY) license (https://
creativecommons.org/licenses/by/
4.0/).
1 Department of Technical Systems Engineering, Faculty of Mechanical Engineering, University of Scienceand Technology, 85-796 Bydgoszcz, Poland; [email protected] (I.P.); [email protected] (J.F.);[email protected] (A.T.)
2 Faculty of Management, Czestochowa University of Technology, 42-200 Czestochowa, Poland;[email protected] (A.I.); [email protected] (M.Z.)
* Correspondence: [email protected]
Abstract: The article characterizes selected issues related to the method of performing environmentalimpact analyses. Particular attention was paid to the need for identifying environmental effectsassociated with the process of shaping beverage bottles. This study concerns the analysis of selectedstages of the machine’s life cycle environmental impact in the specific case of the blow moldingmachine used in the production of bottles. Life cycle assessment analysis was performed using theSimaPro 8.4.0 software (The Dutch Company Pre Consultants). The CML 2 and ReCiPe2016 methodswere chosen to interpret the lists of chemical emissions. Impact categories specific to the CML 2 modelare: abiotic depletion, acidification, eutrophication, global warming, ozone layer depletion, humantoxicity, fresh water aquatic ecotoxicity, marine aquatic ecotoxicity, terrestrial ecotoxicity, and pho-tochemical oxidation. Among all the considered impact categories, marine aquatic ecotoxicity wascharacterized by the highest level of potential harmful effects occurring during the bottle productionprocess. A new aspect of the research is to provide updated and more detailed geographic data onPolish bottle production.
Keywords: life cycle assessment; plastic bottles; environmental impact; quality analysis
1. Introduction
Growing public awareness and stricter legal requirements in the field of environmentalprotection caused an increase in interest in research methods that enable a reduction in theadverse impact on the natural environment and human health of products [1,2]. One suchmethod is the LCA (Life Cycle Assessment) [3].
In light of the urgent need to reduce GHG (greenhouse gas) emissions from food valuechains, this document examines GHG emissions from beverage bottle production [4].
The development of knowledge in the field of environmental protection in recentyears has shown that the impact of post-consumer packaging on the environment shouldbe considered throughout its life cycle, taking into account many factors that constituteenvironmental burdens and hazards, among which emissions into the atmosphere of gasescontaining substances should be distinguished. Others include hazardous conditions,greenhouse gas emissions, water and soil pollution, and excessive use of natural resources.One such method is the Ecological Life Cycle Assessment (LCA). Due to its comprehensivenature, it allows for a full assessment of the environmental impact of the entire life cycle ofthe selected product from the acquisition of raw materials to the management of waste gen-erated as a result of its use (cradle-to-grave analysis or cradle-to-cradle analysis). Accordingto ISO 14040 and ISO 14044, the LCA test methodology consists of four phases, namely:Goal and Scope Definition, Life Cycle Inventory (LCI), Life Cycle Impact Assessment(LCIA), and Life Cycle Interpretation. These phases are closely related to each other in
Materials 2021, 14, 4552. https://doi.org/10.3390/ma14164552 https://www.mdpi.com/journal/materials

Materials 2021, 14, 4552 2 of 21
order to achieve the estimation and ultimately the reduction of the negative environmentalimpact of a given product or process. One of the traditional areas of application of the LCAis the identification of opportunities to improve the environmental aspects of products atdifferent stages of their life cycle. Considering the above, the subject of this article is theecological LCA life cycle assessment of two selected PET and PLA bottle units. Packaging,which includes unit, collective and transport packages, is a product “made of any material,intended for storage, protection, transport, delivery or presentation of products, from rawmaterials to processed goods” [5]. From the ecological point of view, the packaging shouldhave, among others, the following features: minimizing the consumption of raw materialsand energy during the production process. They should have a low level of water, soil,and air pollution at the production stage, use phase, and waste management process. Theyshould be as light as possible, as they then take up less space during storage and transport.They should generate as little waste as possible (both in terms of weight and volume) andbelong to the applicable organizational and legal system through the use of legible andstandardized ecological signs.
Technological progress in the area of polymers from renewable raw materials, as wellas consumer expectations for environmental-friendly polymers cause the development ofstrategic activities aimed at the gradual replacement of the petrochemical raw materialon natural raw materials [6,7]. Packaging materials of natural origin, including PLA(polylactide) [8] are produced by plant organisms that absorb CO2 from the air, which isneeded in the process of photosynthesis with the release of oxygen [9]. Due to the fact thatplants absorb CO2 from the air during photosynthesis, a zero carbon footprint, or evennegative, resulting from the amount of assimilated CO2, is assumed for the productionstage of plant-derived materials [10]. Starch, after the appropriate chemical modification,has found wide application in the packaging industry. The most commonly used starchis rice and wheat maize. Starch-based thermoplastic materials have found a number ofapplications in the food packaging industry ranging from extrusion, injection molding,and blow molding. Modified thermoplastic starch is one of the basic materials for creatingbiodegradable packaging that is constantly undergoing new modifications. Syntheticbiodegradable polymers are polylactides, i.e., compounds obtained from corn that arebiodegradable through fermentation.
Polylactide has good physical and mechanical properties, which makes it a goodcandidate for replacing petrochemical thermoplastics [11–13]. PET (polyethylene tereph-thalate) is a polymer material belonging to thermoplastic polyesters with high mechanicalstrength and high dimensional stability [14]. They are used as packaging material due to anumber of important properties of this polymer, especially transparency similar to glassand its low weight, which, combined with flexibility and mechanical resistance, makespackaging made of this material resistant to breakage. An important role in this processis played by the chemical structure of the packaging material, its surface structure, andthickness. The high durability of polymers is an advantage and a disadvantage because thefinal management hampers its degradation. The degradation mechanism of polymers maybe biological, physical, or chemical. Physical degradation occurs through friction or extrac-tion, while chemical degradation occurs through hydrolysis, photolysis, and/or oxidation.Biodegradation is caused by the enzymatic action of bacteria and fungi. The initial stageis polymer degradation during which the chain length is shortened and its fragments areeliminated, and the degree of polymerization and molecular weight are reduced. The resultof the process is the production of simple chemical compounds that are nutritious food formicroorganisms. The next stage is mineralization. At this stage, microorganisms assimilatethe resulting organic compounds, transport them inside the cell, and oxidize carbon tocarbon dioxide through metabolic processes. The end products of the biodegradationprocess of polymers are biomass, i.e., organic material, water, and gases. An importantissue about the new packaging materials is not only the way they are produced but alsothe possibility to close the loop of their life cycle and end-use management that allowsrecovering the materials for a new production cycle, for example, through the composting

Materials 2021, 14, 4552 3 of 21
procedure. Composting is crucial for packaging polymers as the recycling process requiresenergy. Composting is a series of processes that use the biodegradability of organic matterto transform it into a specific product, so-called compost. Plastics produced from renewableresources are not necessarily biodegradable, and compostability is positively correlatedmore with the chemical structure of the compound than with its origin. It is important todistinguish the concept of material biodegradability as being ambiguous with the termcompostability. All composting polymers are biodegradable, but the opposite is not thecase. The compost generated during the decomposition of plastics must meet certainrequirements for fertilizers and must not contain toxic or non-degradable substances.
Authors S. Walker and R. Rothman [15] made a comparative assessment of the lifecycle of fossil and biological polymers. Based on the results of the analyses, it was possibleto definitely declare differences between the fossil and bio-based polymers. However, it isimpossible to definitively declare any type of polymer as having the lowest environmentalimpact in any of the impact categories. It has been proven that the main sources of variationare the applied methodological procedures of the life cycle assessment and the sourcesof raw material. In turn, the authors Naomi Horowitz et al. [16] assessed the life cycleof bottled water on four types of bottles: ENSO, PLA, recycled PET, and regular PET(petroleum-based). The results showed that of all fourteen impact categories examined,recycled PET and ENSO bottles were generally better than PLA bottles and regular PETbottles. However, another assessment was carried out by L. Chen [17], who proved thatPET bottles based on wood biomass have 21% less global warming potential and require22% less fossil fuel than their fossil fuel counterparts, but they perform worse in othercategories, such as ecotoxicity and ozone depletion. Based on the experience of previousauthors, an attempt was made to evaluate the bottle production process only at the formingstage. The study is a comparative study of two types of polymers. Biodegradable polymerunder appropriate conditions and 100% PET polymer. The initial assumption is to answerthe question whether biodegradable bottles are more environmentally friendly.
The basic research problem is the analysis of the state of knowledge of the issue andcollecting and organizing input data of selected phases of the life cycle of the process ofshaping bottles for beverages (including materials and media). A new aspect of the researchis to provide updated and more detailed geographic data on Polish bottle production.
The work concerns the current issues related to the impact of packaging on the envi-ronment. The main goal was to conduct the LCA of beverage bottles made of polyethyleneterephthalate and polylactide. The functional unit at the LCA was 1000 bottles for foodcontact with a capacity of 1000 ml (weight of PET bottles 23.5 kg and PLA bottles 22.8 kg).A limitation of the system has been adopted, wherein the steps of the preforms to provide aproduction plant for their proper conformation molding of beverage bottles. Further stepsof the manufacturing process, such as bottling, labeling, and storage and distribution, wereexcluded from the system. The LCA analysis was carried out using the program of theDutch company Pre Consultants called SimaPro 8.4.0. The CML2 and ReCiPe 2016 methodswere selected for the interpretation of the lists of released chemical substances. The testresults were presented graphically in the form of bar charts and verified and interpreted.
2. Materials and Methods
The LCA method is defined as a way of estimating the environmental load fromthe extraction of raw materials to their end of life. The LCA enables the identificationand assessment of emissions of harmful substances as well as the consumption of energyand materials at all stages of the life cycle of the tested object, i.e., in design, production,operation, and decommissioning [6,18].
The main stages are: goal definition, inventory, classification of environmental impacts,and estimation and repair proposals [19,20].
Within the scope of the LCA research, research boundaries, assumptions, and limi-tations are defined. At this stage of the LCA, it is very important to define the productsystem that will be the subject of research, product function, and the functional unit [6].

Materials 2021, 14, 4552 4 of 21
The definition of a product system is the determination of all product-related operations.The unit process is the smallest part of the product system for which data is collected [6].
An exemplary description of the unit process is presented in Figure 1.
Materials 2021, 14, x FOR PEER REVIEW 4 of 22
2. Materials and Methods The LCA method is defined as a way of estimating the environmental load from the
extraction of raw materials to their end of life. The LCA enables the identification and assessment of emissions of harmful substances as well as the consumption of energy and materials at all stages of the life cycle of the tested object, i.e., in design, production, operation, and decommissioning [6,18].
The main stages are: goal definition, inventory, classification of environmental impacts, and estimation and repair proposals [19,20].
Within the scope of the LCA research, research boundaries, assumptions, and limitations are defined. At this stage of the LCA, it is very important to define the product system that will be the subject of research, product function, and the functional unit [6]. The definition of a product system is the determination of all product-related operations. The unit process is the smallest part of the product system for which data is collected [6].
An exemplary description of the unit process is presented in Figure 1.
Figure 1. Description of the unit process.
Its task is to provide a reference for the standardization of system input and output data.
The LCA method consists of four main stages: goal definition, inventory, classification of environmental impacts, and estimation and repair proposals [21–25].
Designing a model to analyze a set of inputs and outputs is the second phase of LCA. The model reflects the entire product system, and its smaller elements represent technological operations. A technological operation should be understood as the smallest part of the system for which information on resources is collected. Data collection enables the precise determination of the source of origin, geographic scope, representativeness, and precision, which are essential elements of the uncertainty analysis.
Taking into account the confidential nature of the LCI results presented in the study and the company’s trade secrets, the values presented in Table 1 were changed by a factor from 0.8 to 1.2. Data on individual stages of the process come from one company in Poland and relate to the bottle shaping process carried out there. The modeling used the Ecoinvent 3.2 database. We have included the input data from a PET bottle in our previous article “Application of LCA Method for Assessment of Environmental Impacts of a Polylactide (PLA) Bottle Shaping”. Doi: 10.3390/polym12020388.
Figure 1. Description of the unit process.
Its task is to provide a reference for the standardization of system input and out-put data.
The LCA method consists of four main stages: goal definition, inventory, classificationof environmental impacts, and estimation and repair proposals [21–25].
Designing a model to analyze a set of inputs and outputs is the second phase ofLCA. The model reflects the entire product system, and its smaller elements representtechnological operations. A technological operation should be understood as the smallestpart of the system for which information on resources is collected. Data collection enablesthe precise determination of the source of origin, geographic scope, representativeness,and precision, which are essential elements of the uncertainty analysis.
Taking into account the confidential nature of the LCI results presented in the studyand the company’s trade secrets, the values presented in Table 1 were changed by a factorfrom 0.8 to 1.2. Data on individual stages of the process come from one company in Polandand relate to the bottle shaping process carried out there. The modeling used the Ecoinvent3.2 database. We have included the input data from a PET bottle in our previous article“Application of LCA Method for Assessment of Environmental Impacts of a Polylactide(PLA) Bottle Shaping”. Doi: 10.3390/polym12020388.
Table 1. The results of Life Cycle Inventory for the production of 1 bottle 1000 mL madewith PLA [26].
Technological Operations Ecoinvent Activity Amount PLA Bottle
Raw material acquisition
PLA preform mass Polylactide, granulate {GLO}market for/Alloc Def, S 18.24 g
Electrical energy Electricity, medium voltage{PL} market for/Alloc Def, S 0.368 kWh
Preform heatingElectrical energy (infrared lamp 100 kW)
Electricity, medium voltage{PL} market for/Alloc Def, S
3.2 kWhElectrical energy (infrared lamps 200 kW) 6.4 kWh
Electrical energy (supply chain) 0.16 kWhPreform stretching and extending
Electrical energy Electricity, medium voltage{PL} market for/Alloc Def, S 6.95 kWh
Compressed airCompressed air, 1000 kPa
gauge {RER} compressed airproduction/Alloc Def U
0.0016 kg/m3

Materials 2021, 14, 4552 5 of 21
Table 1. Cont.
Technological Operations Ecoinvent Activity Amount PLA Bottle
Preform pressure shaping
Electrical energy Electricity, medium voltage{PL} market for/Alloc Def, S 5.66 kWh
Bottle degasifying
Electrical energy Electricity, medium voltage{PL} market for/Alloc Def, S 1.01 kWh
Bottle cooling
Electrical energy Electricity, medium voltage{PL} market for/Alloc Def, S 0.71 kWh
Water in a closed circulationTap water {Europe without
Switzerland} marketfor/Alloc Def, S
2.4 m3
For the adopted system, the exact time period, geographical area, technological typeof collected data, and their accuracy and completeness were determined. The includedinventory data come from 2017 from the technological line for the production of bottles.The production factory is located in the central part of the country. On this basis, it ispossible to determine the precision of the real data accepted for research, which are ofhigh quality.
2.1. Characteristics of the Analysis Object
The research object adopted for the analysis is a modern technological line for blowingbottles. The principle of operation of the device is based on bringing the basket filledwith the preform to the elevator, which pours the contents of the package into a specialdispenser. Then, the preforms are directed to the heating zone by means of a conveyor belt.Heating consists of heating the entire volume of the preform while cooling the area of thenecks and the surface at the same time. In the heating module, the air drawn in for coolingthe necks is cooled with cold water from the heat exchanger. The heat is distributed evenlythroughout the preform. After entering the heating module, the preforms are heated to atemperature of 110 ◦C until the material becomes plastic. During this time, the preformsare rotated around their axis, which improves the heat distribution inside them. Theshielding covers protect the preform thread from overheating. The cooling system for thesurface of the preforms and necks covers the entire heating zone and the heating moduleheating zone. The surface of the preform is cooled with ambient air, which prevents it fromoverheating. The heating elements heat the preforms with infrared radiation. The electricalconnections of the infrared heaters are air-cooled to prevent overheating. The soaking zonein the heating module is used to evenly distribute the heat inside the preform. The heatingmodule installed in the device is equipped with numerous control devices. A pyrometerat the preform transfer point from the heating mandrel chain to the inlet star of the blowmodule controls the surface temperature of the preforms and threads. Then the preformsare transferred to the blow molding station.
The high-pressure air supplied must be dry, clean, dust-free, and oil-free. The air blockis responsible for the proper supply of air to the machine. The stretching and blowing unitcontrols the air flow via a nozzle during pre- and final blowing of the preforms. In theblow module, the preforms are blown, and as a consequence, effectively shaped bottlesare obtained. After the blowing process is finished, the finished beverage bottles leave themachine through the outlet zone.
2.2. Determination of Goal and Scope
The most important step in eco-balance technical facilities is to define the goal prop-erly [17]. The purpose of this LCA study is to analyze the environmental loads of selectedunit processes occurring in the bottle blowing process based on selected characteristics [6,8].

Materials 2021, 14, 4552 6 of 21
System boundaries have also been identified that will include subprocesses covering thestages of:
• collecting cold preforms for the furnace;• heating preforms in the blow molding furnace;• stretching and lengthening the hot preform;• cooling and degassing of ready bottles.
The stages of bottle filling, use, collection, storage, and transport have been excludedfrom the boundaries of the analysis [20].
Data for individual unit processes within the product system limits can be, accordingto ISO 14040: 2006, included in the following types:
• input data: energy expenditure, raw material expenditure, auxiliary data, and other;• output data: products, semi-finished products;• pollutant emissions to air, water, and soil;• other environmental aspects.
To date, there is no single, universally recognized LCA methodology in the world,and therefore, these methods used in different countries to evaluate the same productssometimes provide different results. In this way, e.g., in the case of eco-balance analysesof packaging materials, it may happen that one test result favors a returnable bottle overanother cardboard box, and yet, others define the environmental impact of these productsas equal [9–12].
2.3. System Boundary and Functional Unit
The process was divided into six unit operations, taking into account the demandfor media and materials. One thousand bottles with a capacity of 1 L were adopted asthe functional unit of the study. The scope of analysis included taking preforms into thefurnace, heating, stretching, and elongation, as well as pressure preforming, degassing,and cooling of the finished bottle.
As a result, technological operations of the adopted processes were charged with thesame simplifications, which allowed to take the level of exclusion below 0.01% share inthe entire life cycle and share in all potential environmental impacts for each consideredtechnological operation for both types of bottles made of PET and PLA (Figure 2) [3,6,14,15].
Materials 2021, 14, x FOR PEER REVIEW 7 of 22
technological operation for both types of bottles made of PET and PLA (Figure 2) [3,6,14,15].
Figure 2. The block diagram of the PET bottle production process.
2.4. Life Cycle Impact Assessment (LCIA) LCIA is a step for evaluating the potential environmental impacts by converting the
LCI results into specific impact indicators. Carrying out the LCIA must follow several sub-steps: The first is the selection of the impact category to be analyzed. The second is the assignment of the LCI results to different impact categories (classification). Third, potential impact indicators (characteristics) are calculated. These three steps are mandatory for the LCIA.
2.4.1. CML 2001 Baseline 2000 In the CML 2 method, environmental burdens are aggregated according to the
environmental impact they can potentially cause. This method takes into account midpoint categories defined as midpoint categories. We distinguish among them the following categories (Figure 3): Abiotic depletion; Acidification Potential (AP); Eutrophication Potential (EP); Global warming (GWP); Ozone layer depletion (ODP); Human toxicity (HTP); Fresh water aquatic ecotoxicity Potential (FAETP); Marine aquatic ecotoxicity; Terrestrial ecotoxicity Potential (TETP); Photochemical oxidation (POCP).
Figure 2. The block diagram of the PET bottle production process.
Materials 2021, 14, 4552 7 of 21
2.4. Life Cycle Impact Assessment (LCIA)
LCIA is a step for evaluating the potential environmental impacts by converting theLCI results into specific impact indicators. Carrying out the LCIA must follow severalsub-steps: The first is the selection of the impact category to be analyzed. The secondis the assignment of the LCI results to different impact categories (classification). Third,potential impact indicators (characteristics) are calculated. These three steps are mandatoryfor the LCIA.
2.4.1. CML 2001 Baseline 2000
In the CML 2 method, environmental burdens are aggregated according to the envi-ronmental impact they can potentially cause. This method takes into account midpointcategories defined as midpoint categories. We distinguish among them the followingcategories (Figure 3):
• Abiotic depletion;• Acidification Potential (AP);• Eutrophication Potential (EP);• Global warming (GWP);• Ozone layer depletion (ODP);• Human toxicity (HTP);• Fresh water aquatic ecotoxicity Potential (FAETP);• Marine aquatic ecotoxicity;• Terrestrial ecotoxicity Potential (TETP);• Photochemical oxidation (POCP).
Materials 2021, 14, x FOR PEER REVIEW 8 of 22
Figure 3. CML 2 baseline 2000 method map.
Acidification describes the change in soil acidity caused by the deposition of sulfates, nitrates, and phosphates in the atmosphere [23]. The main acidifying substances are NOX, NH3, and SO2. This includes all relevant substances because there are no emissions of other acidifying substances such as HCl, HF, etc., in the foreground system [6,27–29].
퐴푃 = 퐴푃 퐵 kg SO eq (1)
where 퐴푃 represents the acidification potential of gas j expressed relative to the AP of SO2, and Bj is its emission in kg.
Eutrophication can be defined as the enrichment of nutrients in the aquatic environment [30]. In inland waters, eutrophication is one of the main factors determining its ecological quality.
퐸푃 = 퐸푃 퐵 kg PO eq (2)
where 퐸푃 represents their respective eutrophication potentials — 퐵 —in a special emission, such as nitrogen (N), nitrogen oxides (NOx), ammonium (푁퐻 ), phosphate (푃푂 ), phosphorus (P), and chemical oxygen demand (COD). EP is expression relative to 푃푂 .
Another term in the literature is “summer smog” [14]. The photooxidants produced in the process are from the photochemical team that affects health and ecosystems [10]. This ground-level ozone is created in the atmosphere by nitrogen oxides and volatile cards in the presence of sunlight [30–32].
The values of the GWP of the time depend on horizon over which the global warming effect is assessed. GWP factors for shorter times (20 and 50 years) provide an indication of the short-term effect of greenhouse gases on the climate, while GWP for longer periods (100 and 500 years) are used to predict the cumulative effects of these gases on the global climate [33].
Figure 3. CML 2 baseline 2000 method map.
Acidification describes the change in soil acidity caused by the deposition of sulfates,nitrates, and phosphates in the atmosphere [23]. The main acidifying substances are NOX,

Materials 2021, 14, 4552 8 of 21
NH3, and SO2. This includes all relevant substances because there are no emissions ofother acidifying substances such as HCl, HF, etc., in the foreground system [6,27–29].
AP =J
∑j=1
APjBj kg SO2 eq (1)
where APj represents the acidification potential of gas j expressed relative to the AP of SO2,and Bj is its emission in kg.
Eutrophication can be defined as the enrichment of nutrients in the aquatic environ-ment [30]. In inland waters, eutrophication is one of the main factors determining itsecological quality.
EP =J
∑j=1
EPjBj kg PO3−4 eq (2)
where EPj represents their respective eutrophication potentials—Bj—in a special emis-sion, such as nitrogen (N), nitrogen oxides (NOx), ammonium (NH+
4 ), phosphate (PO3−4 ),
phosphorus (P), and chemical oxygen demand (COD). EP is expression relative to PO3−4 .
Another term in the literature is “summer smog” [14]. The photooxidants produced inthe process are from the photochemical team that affects health and ecosystems [10]. Thisground-level ozone is created in the atmosphere by nitrogen oxides and volatile cards inthe presence of sunlight [30–32].
The values of the GWP of the time depend on horizon over which the global warmingeffect is assessed. GWP factors for shorter times (20 and 50 years) provide an indication ofthe short-term effect of greenhouse gases on the climate, while GWP for longer periods(100 and 500 years) are used to predict the cumulative effects of these gases on the globalclimate [33].
GWP =J
∑j=1
GWPjBj kg CO2 eq (3)
where Bj represents the emission of greenhouse gas. GWPj represents the factors fordifferent greenhouse gases that are expressed relative to the global warming potential ofCO2, which is, therefore, unity.
Human toxicity potential is calculated by taking into account releases toxic to humansin three different media: water, air, and soil:
HTP =J
∑j=1
HTPjABjA +J
∑j=1
HTPjW BjW +J
∑j=1
HTPjSBjS kg 1, 4 − DB eq (4)
where HTPjA, HTPjW , and HTPjS are toxicological classification factors for substancesemitted to air, water, and soil, respectively, and BjA, BjW , and BjS represent the respectiveemissions of different toxic substences into the three environmental media [32,33]. Thereference substance for this impact category is 1,4-dichlorobenzene.
Photochemical oxidants creation potential is related to the potential of valolite organiccompounds and NOx to generate photochemical or summer smog. It is usually expressedrelative to the POCP classification factors of ethylene and can be calculated as:
POCP =J
∑j=1
POCPjBj kg ethylene eq (5)
where Bj is the emission of species j participating in the formation of summer smog, andPOCPj is its classification factor for photochemical oxidation formation [6,15].

Materials 2021, 14, 4552 9 of 21
Abiotic resources depletion potential includes the depletion of fossil fuels, metlas, andminerals. The total impact is calculated as:
ADP =J
∑j=1
ADPjBj kg SB eq (6)
where Bj is the quantity of abiotic resources j used, and ADPj represents the abioticdepletion potential of that resource. This impact category is expressed in kg of antimonyused, which is taken as the reference substance for this impact category [34]. Alternatively,kg oil eq can be used instead.
The potential of emissions of chlorofluorohydrocarbons (CFCs) and other halogenatedhydrocarbons to deplete the ozone layer is expressed as:
ODP =J
∑j=1
ODPjBj kg CFC − 11 eq (7)
where Bj is the emission of ozone depleting gas j. The ODP factors are expressed relativeto the ozone depletion potential of CFC-11.
The ecotoxicity to fresh waters indicator refers to the impact on fresh water ecosystemsas a result of the emission of toxic substances to air, water, and soil [6,35]. Ecotoxicitypotential (FAETP) is calculated using USES-LCA, describing the fate, exposure, and ef-fects of toxic substances. The time horizon is infinite [29]. Characterizing factors areexpressed as 1,4-dichlorobenzene equivalents/kg emissions. The indicator is applicable ona global/continental/regional and local scale [10,14].
2.4.2. ReCiPe 2016Fine Particulate Matter Formation
The selected impact assessment methodology that was applied in SimaPro 8.4.1.software is the ReCiPe midpoint (H). Out of set of 18 midpoint impact categories, oneis discussed in this paper as it represents both GHG emissions and air quality in urbanenvironments. This particulate matter formation highlights the impact of primarily formedparticulates as well as particulates formed by the condensation of nitrogen oxides, sulfuroxides, ammonia, and non-methane volatile organic compounds (secondary PM). PMFis represented by the emission of PM10-equivalents, i.e., particles, with an aerodynamicdiameter smaller or equal to 10 micrometers—the presence of such particles in the airincreases the probability of the occurrence of respiratory diseases.
Fine solid particles with a diameter smaller than 2.5 µm (PM2.5) are a complex mix-ture of organic and inorganic substances. Studies (Particulate studies) show that themortality effects of chronic PM exposure probably result from <PM2.5 than from coarserparticles. Particles with a diameter of 2.5–10 µm (PM2.5–10) are associated with respiratorydiseases [26,35,36].
Characterization Factors at Midpoint Level
In the middle points characterizing the factors harmful to human health causedby PM2.5, it is important to accept the pollution because the impact and damage areindependent of the precursor substance. The inlet fraction (iF) of fine particulates due toemissions in the region and is determined as precursor x (iFx,i) [8]. Particulate formationpotentials (PMFP) are expressed in primary PM2.5 equivalents by dividing the iFx and theemission weighted global average iF PM2.5:
PMFPx,i =iFx,i
iFPM 2.5, world(8)

Materials 2021, 14, 4552 10 of 21
2.5. Interpretation
The interpretation of the results of the analysis consisted in the mutual assessmentof results and loads. The input data necessary for the interpretation used for the analysiswere complete and came from a company producing bottles for beverages [14]. Duringthe analysis, the shares of factors of significant importance at individual stages of thebottle shaping process were determined. In addition, the completeness of the LCI data waschecked by analyzing mass and energy balance equations [35]. On this basis, compliancewith the purpose and scope of work and correctness of the LCA methodology was used.The final analysis results obtained are presented in Section 3.1.
3. Results
The results of analyzes carried out as part of Life Cycle Impact Assessment (LCIA) arecompiled into two sections including CML 2 and ReCiPe 2016 (Section 3.1).
3.1. Characterization Analysis Results
Table 2 presents the total share of the analyzed bottles at the production stage inrelation to the functional unit adopted in the work. Based on the obtained results, it isproved that the marine aquatic ecotoxicity category, which is characterized by the highestlevel of environmental loads, is of key importance for the natural environment in the entireprocess of shaping the correct packaging. Despite the many advantages of the PET bottlesthat, e.g., have the best barrier to gases but low water vapor, the biggest problem is that itusually becomes waste as soon as the consumer uses the product. Doing so destroys theconcept of a circular economy. Leaving a plastic bottle in the environment means that thedecomposition process will take from 100 to even 1000 years, depending on the materialand form of the bottle. Hence, it becomes crucial to recognize the problem of the productionof plastic bottles, the level of environmental harmfulness of which is 10 times higher thanthat of bottles made of biodegradable plastics under certain conditions.
Table 2. The total impact of the production of bottles on the environment.
Impact Category Unit PET Bottle PLA Bottle
Abiotic depletion kg Sb eq 8.18 4.89Acidification kg SO2 eq 9.90 × 10⁻⁶ 0.00004
Eutrophication kg PO4 eq 1.47 1.47Global warming (GWP100) kg CO2 eq 6.57 38.14
Ozone layer depletion (ODP) kg CFC-11 eq 3.36 × 10⁻⁵ 0.00004Human toxicity kg 1,4-DB eq 485.12 354.27
Fresh water aquatic ecotox. kg 1,4-DB eq 223.24 258.36Marine aquatic ecotoxicity kg 1,4-DB eq 481,609.65 456,003.83
Terrestrial ecotoxicity kg 1,4-DB eq 1.99 4.08Photochemical oxidation kg C2H4 eq 0.19 0.17
As part of the research using CML 2, a detailed analysis of ten impact categories,characteristic of this model, was carried out: abiotic depletion, acidification potential, eu-trophication potential, global warming, ozone layer depletion, human toxicity, fresh wateraquatic ecotoxicity potential, marine aquatic ecotoxicity, terrestrial ecotoxicity potential,and photochemical oxidation.
The results were compiled for the bottle production process, which included sixtechnological operations: preform before heating, heating the preform, stretching andextension of the preform, pressure shaping of the preforms, degasification of the bottle,and bottle cooling during the production of PET and PLA bottles.
The first step of the analysis included assessing which of the ten categories consideredcould potentially be the source of the largest number of negative (or positive) environmentalconsequences in the bottle shaping process.

Materials 2021, 14, 4552 11 of 21
Among the factors that may negatively affect the quality of the ecosystem, the highestlevel of harmful impacts was characterized by a group of metal compounds that could leadto toxic environmental effects.
During the production of bottles, significant gaseous emission gets into the environ-ment, including carbon dioxide and sulfur dioxide.
In the group of factors affecting the reduction of environmental quality, fine particulatematter formation is of key importance, where the primary source of PM2.5 fine dustemissions are sources belonging to the cooling of the bottle with compressed air operation,in which the largest part of the emissions is related to the cooling of the finished PET bottle.
When starting the analyses under impact categories, special attention was paid toenvironmental consequences in the bottle production cycle. It was noticed that one impactcategory, marine aquatic ecotoxicity (total 456,003.83 kg 1,4-DB eq for PLA bottle and total481,609.65 kg 1,4-DB eq for PET bottle), was characterized by potentially the highest levelof potential harmful effects on the environment. This is the result of a high energy demandin the production processes of disposable bottles and the directly related, highly energy-consuming processes of extracting non-renewable raw materials necessary in individualprocesses during the production of these packaging.
Analyzing category acidification for each technological operation, lower negativeenvironmental impacts were observed throughout the entire cycle of the PLA bottleshaping process (Figure 4). For performing before heat operation, the effect value was1.68 × 10−6 kg SOx/1000 bottles for the PLA preform and 1.94 × 10⁻⁶ kg SOx/1000 bottlesfor the PET preform. The total amount of negative environmental impacts associated withthe emission of sulfur oxides into the atmosphere in the process of shaping beverage bottleswas 1.77 × 10⁻⁵ kg SOx/1000 bottles for PLA preform and 2.02 × 10⁻⁶ kg SOx/1000 bottlesfor PET preform.
Materials 2021, 14, x FOR PEER REVIEW 12 of 22
was 1.77 × 10⁻⁵ kg SOx/1000 bottles for PLA preform and 2.02 × 10⁻⁶ kg SOx/1000 bottles for PET preform.
Figure 4. Acidification emissions throughout the entire bottle shaping process.
Analyzing the category of eutrophication for each technological operation, similar values of environmental influences were observed throughout the whole life cycle (Figure 5). The lowest calcium phosphorus emission value for the preform conveyor PLA process was 0.208 kg PO4/1000 bottles and 0.212 kg PO4/1000 bottles of PET. Higher levels of calcium phosphorus emissions were recorded for PLA bottle shaping operations, i.e., stretching and lengthening the preform 0.245 kg PO4/1000 bottles, blowing preforms 0.259 kg PO4/1000 bottles, degassing the bottle 0.261 kg PO4/1000 bottles, and cooling the bottle with compressed air 0.265 kg PO4/1000 bottles.
Figure 4. Acidification emissions throughout the entire bottle shaping process.

Materials 2021, 14, 4552 12 of 21
Analyzing the category of eutrophication for each technological operation, similar val-ues of environmental influences were observed throughout the whole life cycle (Figure 5).The lowest calcium phosphorus emission value for the preform conveyor PLA processwas 0.208 kg PO4/1000 bottles and 0.212 kg PO4/1000 bottles of PET. Higher levels ofcalcium phosphorus emissions were recorded for PLA bottle shaping operations, i.e.,stretching and lengthening the preform 0.245 kg PO4/1000 bottles, blowing preforms0.259 kg PO4/1000 bottles, degassing the bottle 0.261 kg PO4/1000 bottles, and cooling thebottle with compressed air 0.265 kg PO4/1000 bottles.
Materials 2021, 14, x FOR PEER REVIEW 13 of 22
Figure 5. Eutrophication emissions throughout the entire bottle shaping process.
The share of biodegradable plastic in the bottle shaping process has a positive effect on the size of gas emission indicators. The value of the greenhouse gas emission index preform before the heating process is about 6.57 g CO2/1000 bottles for all PET bottle, while with PLA material, this value is reduced to about 4.04 g CO2/1000 bottles (Figure 6). The total CO2 emission from PLA production is higher than PET. The results show that both energy consumption and CO2 emissions would increase significantly if plastic products were to be replaced by those made of biodegradable materials under appropriate conditions. The examples of bottles made of PLA and their comparison with PET bottles show a large impact of bottle forming conditions and overall life cycle GHG performance. With current waste management solutions, PET bottles contribute less to global warming than bottles made of PLA. If plastic bottles are not disposed of in landfills, the results may be quite different. Depending on the waste management method used, the difference between the minimum and maximum CO2 equivalent emissions can be significant.
Figure 5. Eutrophication emissions throughout the entire bottle shaping process.
The share of biodegradable plastic in the bottle shaping process has a positive effect onthe size of gas emission indicators. The value of the greenhouse gas emission index preformbefore the heating process is about 6.57 g CO2/1000 bottles for all PET bottle, while withPLA material, this value is reduced to about 4.04 g CO2/1000 bottles (Figure 6). The totalCO2 emission from PLA production is higher than PET. The results show that both energyconsumption and CO2 emissions would increase significantly if plastic products were tobe replaced by those made of biodegradable materials under appropriate conditions. Theexamples of bottles made of PLA and their comparison with PET bottles show a largeimpact of bottle forming conditions and overall life cycle GHG performance. With currentwaste management solutions, PET bottles contribute less to global warming than bottlesmade of PLA. If plastic bottles are not disposed of in landfills, the results may be quitedifferent. Depending on the waste management method used, the difference between theminimum and maximum CO2 equivalent emissions can be significant.

Materials 2021, 14, 4552 13 of 21
Materials 2021, 14, x FOR PEER REVIEW 14 of 22
Figure 6. Global warming emissions throughout the entire bottle shaping process.
Abiotic resources are natural resources (including energy resources), such as iron ore and oil, which are considered inanimate. The depletion of abiotic resources includes both the use of non-renewable and renewable abiotic agents (wind, running water, etc.). This study focuses on the depletion of abiotic resources as defined in the classical LCA methodology, where only non-renewable sources are considered. Operations describing the process of making PLA bottles are distinguished by the lowest level of negative influence under this impact category. The process of producing a bottle made of polyethylene terephthalate, for which the highest negative levels of interaction were observed for all six operations, is of key importance during the shaping of these quantities (Figure 7).
Figure 7. Abiotic depletion emissions throughout the entire bottle shaping process.
Figure 6. Global warming emissions throughout the entire bottle shaping process.
Abiotic resources are natural resources (including energy resources), such as ironore and oil, which are considered inanimate. The depletion of abiotic resources includesboth the use of non-renewable and renewable abiotic agents (wind, running water, etc.).This study focuses on the depletion of abiotic resources as defined in the classical LCAmethodology, where only non-renewable sources are considered. Operations describing theprocess of making PLA bottles are distinguished by the lowest level of negative influenceunder this impact category. The process of producing a bottle made of polyethyleneterephthalate, for which the highest negative levels of interaction were observed for all sixoperations, is of key importance during the shaping of these quantities (Figure 7).
Materials 2021, 14, x FOR PEER REVIEW 14 of 22
Figure 6. Global warming emissions throughout the entire bottle shaping process.
Abiotic resources are natural resources (including energy resources), such as iron ore and oil, which are considered inanimate. The depletion of abiotic resources includes both the use of non-renewable and renewable abiotic agents (wind, running water, etc.). This study focuses on the depletion of abiotic resources as defined in the classical LCA methodology, where only non-renewable sources are considered. Operations describing the process of making PLA bottles are distinguished by the lowest level of negative influence under this impact category. The process of producing a bottle made of polyethylene terephthalate, for which the highest negative levels of interaction were observed for all six operations, is of key importance during the shaping of these quantities (Figure 7).
Figure 7. Abiotic depletion emissions throughout the entire bottle shaping process. Figure 7. Abiotic depletion emissions throughout the entire bottle shaping process.
Anthropogenic emissions can deplete stratospheric the ozone. Scientists have carriedout systematic observations since the early 1970s, showing that the thickness of the ozonelayer is being reduced. Its progressive degradation may have serious consequences onthe environment. One of the results of such action is, for example, greater heating of the

Materials 2021, 14, 4552 14 of 21
Earth’s surface and increased impact on human health, increasing the incidence of skincancer and eye diseases. Another aspect of environmental deterioration is the reduction inthe amount of plankton in the seas and oceans, which is the main food for animals living inthe seas and oceans. The highest level of emissions of compounds causing the enlargementof the ozone hole was recorded in the process of shaping the PLA bottle at the stage ofcooling the finished product (7.19 × 10⁻⁹ kg CFC-11 eq), while the lowest level of potentialimpacts was recorded at the stage preform before heating (5.27 × 10⁻⁹ kg CFC-11 eq) forthe PET bottle (Figure 8). Their potentially negative impact causes ozone depletion of theenvironment. Another equally important aspect is their impact on human health. They cancause diseases of the nervous system and human internal organs. In some cases, they arestill used as solvents for specific chemical reactions, and to prevent this, it is recommendedto discontinue their use.
Materials 2021, 14, x FOR PEER REVIEW 15 of 22
Anthropogenic emissions can deplete stratospheric the ozone. Scientists have carried out systematic observations since the early 1970s, showing that the thickness of the ozone layer is being reduced. Its progressive degradation may have serious consequences on the environment. One of the results of such action is, for example, greater heating of the Earth’s surface and increased impact on human health, increasing the incidence of skin cancer and eye diseases. Another aspect of environmental deterioration is the reduction in the amount of plankton in the seas and oceans, which is the main food for animals living in the seas and oceans. The highest level of emissions of compounds causing the enlargement of the ozone hole was recorded in the process of shaping the PLA bottle at the stage of cooling the finished product (7.19 × 10⁻⁹ kg CFC-11 eq), while the lowest level of potential impacts was recorded at the stage preform before heating (5.27 × 10⁻⁹ kg CFC-11 eq) for the PET bottle (Figure 8). Their potentially negative impact causes ozone depletion of the environment. Another equally important aspect is their impact on human health. They can cause diseases of the nervous system and human internal organs. In some cases, they are still used as solvents for specific chemical reactions, and to prevent this, it is recommended to discontinue their use.
Figure 8. Ozone layer depletion emissions throughout the entire bottle shaping process.
Ecotoxicity is a characteristic of substances that have properties, such as reactivity, with the difference that they require a longer time to develop, and the effects of their polluting effects on the environment last longer. These substances can contribute to the deterioration of the quality of the environment, which poses a real threat to humans. Of all the types of waste generated during the production of beverage bottles, most ecotoxic emissions were recorded for operation bottle cooling in the PET bottle formation process (8.53 × 10⁻² kg 1.4-DB eq) and the least for preform before heating operations during bottle production PLA (4.50 × 10⁻² kg 1.4-DB eq) (Figure 9).
Figure 8. Ozone layer depletion emissions throughout the entire bottle shaping process.
Ecotoxicity is a characteristic of substances that have properties, such as reactivity,with the difference that they require a longer time to develop, and the effects of theirpolluting effects on the environment last longer. These substances can contribute to thedeterioration of the quality of the environment, which poses a real threat to humans. Ofall the types of waste generated during the production of beverage bottles, most ecotoxicemissions were recorded for operation bottle cooling in the PET bottle formation process(8.53 × 10⁻² kg 1,4-DB eq) and the least for preform before heating operations during bottleproduction PLA (4.50 × 10⁻² kg 1,4-DB eq) (Figure 9).
Materials 2021, 14, x FOR PEER REVIEW 15 of 22
Anthropogenic emissions can deplete stratospheric the ozone. Scientists have carried out systematic observations since the early 1970s, showing that the thickness of the ozone layer is being reduced. Its progressive degradation may have serious consequences on the environment. One of the results of such action is, for example, greater heating of the Earth’s surface and increased impact on human health, increasing the incidence of skin cancer and eye diseases. Another aspect of environmental deterioration is the reduction in the amount of plankton in the seas and oceans, which is the main food for animals living in the seas and oceans. The highest level of emissions of compounds causing the enlargement of the ozone hole was recorded in the process of shaping the PLA bottle at the stage of cooling the finished product (7.19 × 10⁻⁹ kg CFC-11 eq), while the lowest level of potential impacts was recorded at the stage preform before heating (5.27 × 10⁻⁹ kg CFC-11 eq) for the PET bottle (Figure 8). Their potentially negative impact causes ozone depletion of the environment. Another equally important aspect is their impact on human health. They can cause diseases of the nervous system and human internal organs. In some cases, they are still used as solvents for specific chemical reactions, and to prevent this, it is recommended to discontinue their use.
Figure 8. Ozone layer depletion emissions throughout the entire bottle shaping process.
Ecotoxicity is a characteristic of substances that have properties, such as reactivity, with the difference that they require a longer time to develop, and the effects of their polluting effects on the environment last longer. These substances can contribute to the deterioration of the quality of the environment, which poses a real threat to humans. Of all the types of waste generated during the production of beverage bottles, most ecotoxic emissions were recorded for operation bottle cooling in the PET bottle formation process (8.53 × 10⁻² kg 1.4-DB eq) and the least for preform before heating operations during bottle production PLA (4.50 × 10⁻² kg 1.4-DB eq) (Figure 9).
Figure 9. Human toxicity emissions throughout the entire bottle shaping process.

Materials 2021, 14, 4552 15 of 21
As a result of the conducted experiment, the size of the total environmental impact wasmainly determined by cadmium emissions has been proven. Cadmium is one of the mostimportant environmental pollutants. Toxic activity is demonstrated by free cadmium ions.Cadmium is usually accumulated in the kidneys and liver. It is especially dangerous dueto its rapid absorption by living organisms and easy accumulation in the tissues of plantsand animals. Cadmium also contributes to changes in the functionality of cell membranes,inhibits cell division, and reduces the efficiency of photosynthesis.
Freshwater ecotoxicity showed the highest potential emission value determined forthe bottle cooling, where the bottle cooling process of PET generated 20% more emissioncompared to PLA (Figure 10).
Materials 2021, 14, x FOR PEER REVIEW 16 of 22
Figure 9. Human toxicity emissions throughout the entire bottle shaping process.
As a result of the conducted experiment, the size of the total environmental impact was mainly determined by cadmium emissions has been proven. Cadmium is one of the most important environmental pollutants. Toxic activity is demonstrated by free cadmium ions. Cadmium is usually accumulated in the kidneys and liver. It is especially dangerous due to its rapid absorption by living organisms and easy accumulation in the tissues of plants and animals. Cadmium also contributes to changes in the functionality of cell membranes, inhibits cell division, and reduces the efficiency of photosynthesis.
Freshwater ecotoxicity showed the highest potential emission value determined for the bottle cooling, where the bottle cooling process of PET generated 20% more emission compared to PLA (Figure 10).
Figure 10. Freshwater aquatic ecotoxicity emissions throughout the entire bottle shaping process.
Marine ecotoxicity has potentially the highest negative impact on the aquatic environment. The highest similar emission levels were recorded for the degasification of the bottle, which was 91.65 kg 1,4-DB eq in PET bottle and 89.35 kg 1,4-DB eq PLA bottle operations (Figure 11).
Figure 11. Marine aquatic ecotoxicity emissions throughout the entire bottle shaping process.
The occurrence of terrestrial ecotoxicity is caused by lowering of the pH value. This phenomenon occurs as a result of the ecological imbalance in the processes of energy and matter exchange between elements of ecosystems. The reason for these changes is the presence of chemicals. Regular ground acidification occurs when gases such as CO2 or SO2 are absorbed by the water and react to form acidic compounds at the surface of the earth.
Figure 10. Freshwater aquatic ecotoxicity emissions throughout the entire bottle shaping process.
Marine ecotoxicity has potentially the highest negative impact on the aquatic environ-ment. The highest similar emission levels were recorded for the degasification of the bottle,which was 91.65 kg 1,4-DB eq in PET bottle and 89.35 kg 1,4-DB eq PLA bottle operations(Figure 11).
Materials 2021, 14, x FOR PEER REVIEW 16 of 22
Figure 9. Human toxicity emissions throughout the entire bottle shaping process.
As a result of the conducted experiment, the size of the total environmental impact was mainly determined by cadmium emissions has been proven. Cadmium is one of the most important environmental pollutants. Toxic activity is demonstrated by free cadmium ions. Cadmium is usually accumulated in the kidneys and liver. It is especially dangerous due to its rapid absorption by living organisms and easy accumulation in the tissues of plants and animals. Cadmium also contributes to changes in the functionality of cell membranes, inhibits cell division, and reduces the efficiency of photosynthesis.
Freshwater ecotoxicity showed the highest potential emission value determined for the bottle cooling, where the bottle cooling process of PET generated 20% more emission compared to PLA (Figure 10).
Figure 10. Freshwater aquatic ecotoxicity emissions throughout the entire bottle shaping process.
Marine ecotoxicity has potentially the highest negative impact on the aquatic environment. The highest similar emission levels were recorded for the degasification of the bottle, which was 91.65 kg 1,4-DB eq in PET bottle and 89.35 kg 1,4-DB eq PLA bottle operations (Figure 11).
Figure 11. Marine aquatic ecotoxicity emissions throughout the entire bottle shaping process.
The occurrence of terrestrial ecotoxicity is caused by lowering of the pH value. This phenomenon occurs as a result of the ecological imbalance in the processes of energy and matter exchange between elements of ecosystems. The reason for these changes is the presence of chemicals. Regular ground acidification occurs when gases such as CO2 or SO2 are absorbed by the water and react to form acidic compounds at the surface of the earth.
Figure 11. Marine aquatic ecotoxicity emissions throughout the entire bottle shaping process.
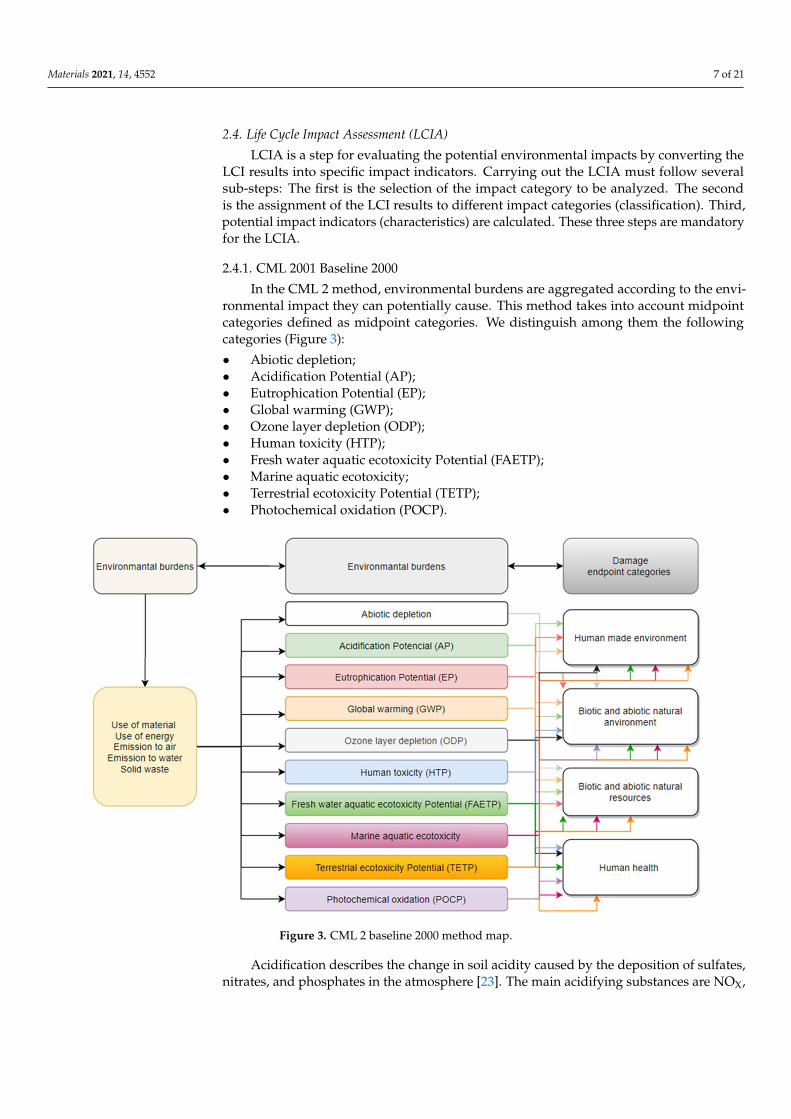
The occurrence of terrestrial ecotoxicity is caused by lowering of the pH value. Thisphenomenon occurs as a result of the ecological imbalance in the processes of energy andmatter exchange between elements of ecosystems. The reason for these changes is thepresence of chemicals. Regular ground acidification occurs when gases such as CO2 orSO2 are absorbed by the water and react to form acidic compounds at the surface of theearth. The magnitude of the impact of the process of shaping bottles from biodegradable
Materials 2021, 14, 4552 16 of 21
material (7.28 × 10⁻⁴ kg 1,4-DB eq) was greater than in the case of shaping PET bottles(3.73 × 10⁻⁴ kg 1,4-DB eq) (Figure 12).
Materials 2021, 14, x FOR PEER REVIEW 17 of 22
The magnitude of the impact of the process of shaping bottles from biodegradable material (7.28 × 10⁻⁴ kg 1.4-DB eq) was greater than in the case of shaping PET bottles (3.73 × 10⁻⁴ kg 1.4-DB eq) (Figure 12).
Figure 12. Terrestrial ecotoxicity emissions throughout the entire bottle shaping process.
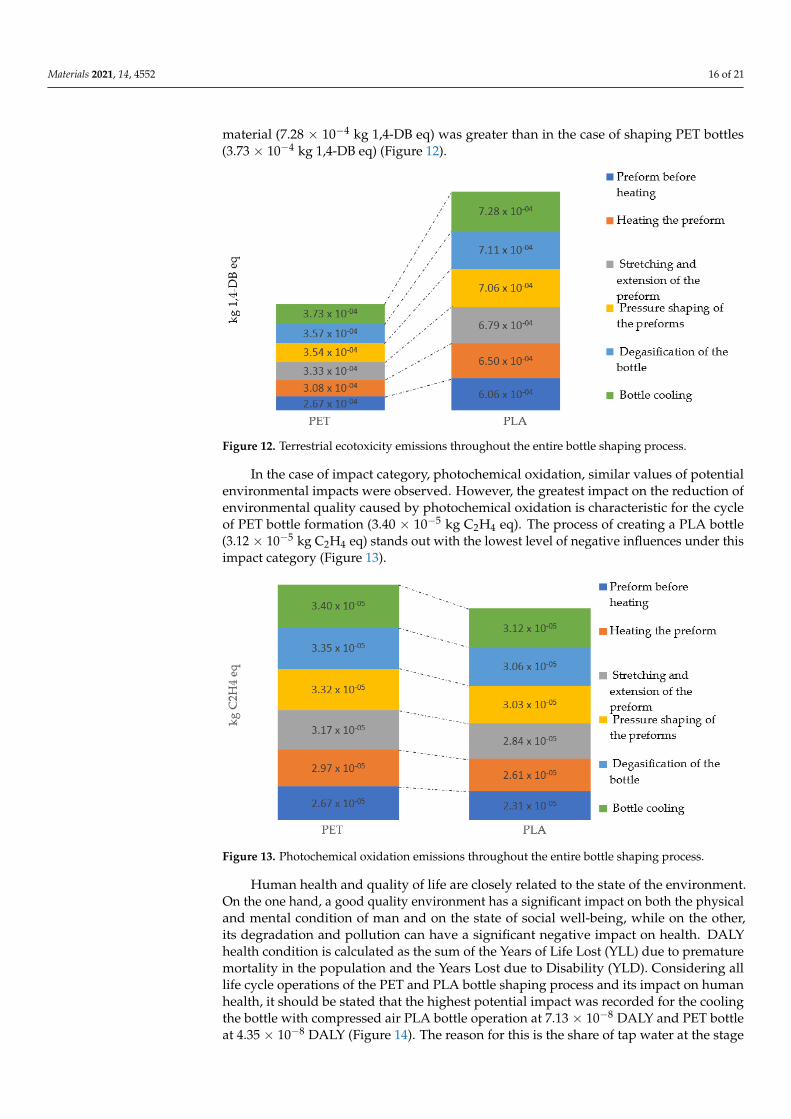
In the case of impact category, photochemical oxidation, similar values of potential environmental impacts were observed. However, the greatest impact on the reduction of environmental quality caused by photochemical oxidation is characteristic for the cycle of PET bottle formation (3.40 × 10⁻⁵ kg C2H4 eq). The process of creating a PLA bottle (3.12 × 10⁻⁵ kg C2H4 eq) stands out with the lowest level of negative influences under this impact category (Figure 13).
Figure 13. Photochemical oxidation emissions throughout the entire bottle shaping process.
Human health and quality of life are closely related to the state of the environment. On the one hand, a good quality environment has a significant impact on both the physical and mental condition of man and on the state of social well-being, while on the other, its degradation and pollution can have a significant negative impact on health. DALY health condition is calculated as the sum of the Years of Life Lost (YLL) due to premature mortality in the population and the Years Lost due to Disability (YLD). Considering all life cycle operations of the PET and PLA bottle shaping process and its impact on human health, it should be stated that the highest potential impact was recorded for the cooling the bottle with compressed air PLA bottle operation at 7.13 × 10⁻⁸ DALY and PET bottle at 4.35 × 10⁻⁸ DALY (Figure 14). The reason for this is the share of tap water at the stage of cooling the finished bottle and the amount of electricity consumed. Lower PM emission levels <2.5 μm with similar potential impacts on human health were noted for the
Figure 12. Terrestrial ecotoxicity emissions throughout the entire bottle shaping process.
In the case of impact category, photochemical oxidation, similar values of potentialenvironmental impacts were observed. However, the greatest impact on the reduction ofenvironmental quality caused by photochemical oxidation is characteristic for the cycleof PET bottle formation (3.40 × 10⁻⁵ kg C2H4 eq). The process of creating a PLA bottle(3.12 × 10⁻⁵ kg C2H4 eq) stands out with the lowest level of negative influences under thisimpact category (Figure 13).
Materials 2021, 14, x FOR PEER REVIEW 17 of 22
The magnitude of the impact of the process of shaping bottles from biodegradable material (7.28 × 10⁻⁴ kg 1.4-DB eq) was greater than in the case of shaping PET bottles (3.73 × 10⁻⁴ kg 1.4-DB eq) (Figure 12).
Figure 12. Terrestrial ecotoxicity emissions throughout the entire bottle shaping process.
In the case of impact category, photochemical oxidation, similar values of potential environmental impacts were observed. However, the greatest impact on the reduction of environmental quality caused by photochemical oxidation is characteristic for the cycle of PET bottle formation (3.40 × 10⁻⁵ kg C2H4 eq). The process of creating a PLA bottle (3.12 × 10⁻⁵ kg C2H4 eq) stands out with the lowest level of negative influences under this impact category (Figure 13).
Figure 13. Photochemical oxidation emissions throughout the entire bottle shaping process.
Human health and quality of life are closely related to the state of the environment. On the one hand, a good quality environment has a significant impact on both the physical and mental condition of man and on the state of social well-being, while on the other, its degradation and pollution can have a significant negative impact on health. DALY health condition is calculated as the sum of the Years of Life Lost (YLL) due to premature mortality in the population and the Years Lost due to Disability (YLD). Considering all life cycle operations of the PET and PLA bottle shaping process and its impact on human health, it should be stated that the highest potential impact was recorded for the cooling the bottle with compressed air PLA bottle operation at 7.13 × 10⁻⁸ DALY and PET bottle at 4.35 × 10⁻⁸ DALY (Figure 14). The reason for this is the share of tap water at the stage of cooling the finished bottle and the amount of electricity consumed. Lower PM emission levels <2.5 μm with similar potential impacts on human health were noted for the
Figure 13. Photochemical oxidation emissions throughout the entire bottle shaping process.
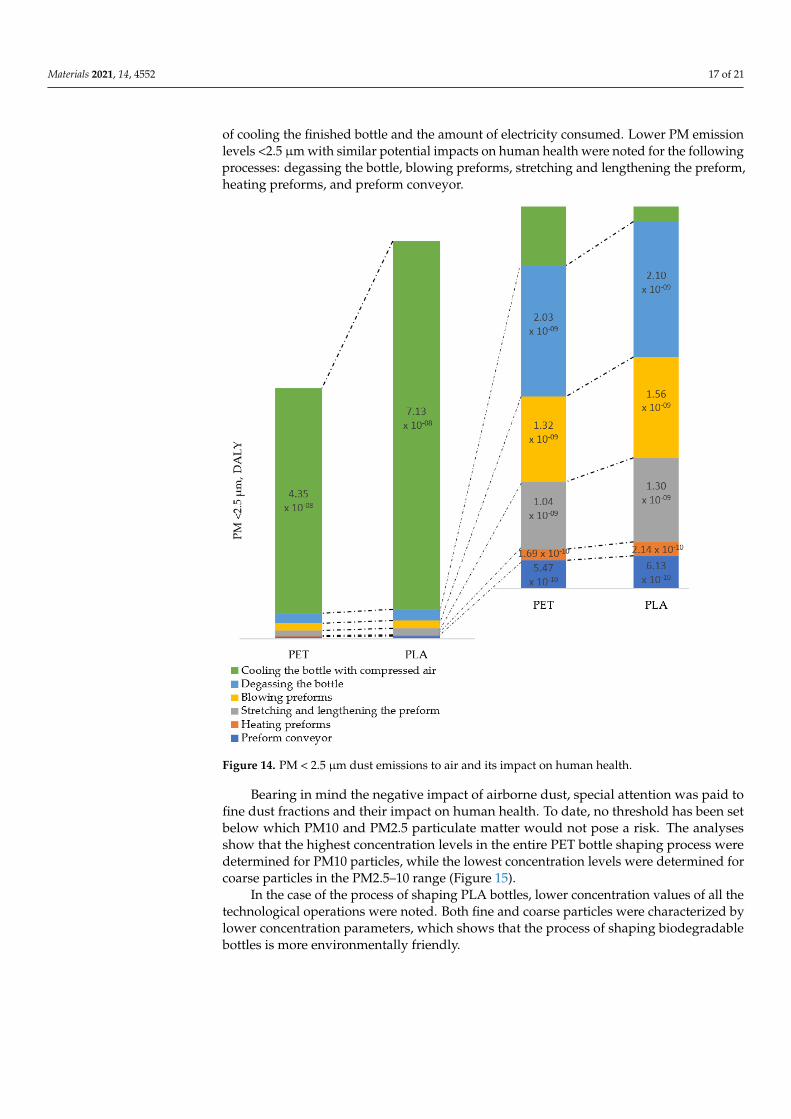
Human health and quality of life are closely related to the state of the environment.On the one hand, a good quality environment has a significant impact on both the physicaland mental condition of man and on the state of social well-being, while on the other,its degradation and pollution can have a significant negative impact on health. DALYhealth condition is calculated as the sum of the Years of Life Lost (YLL) due to prematuremortality in the population and the Years Lost due to Disability (YLD). Considering alllife cycle operations of the PET and PLA bottle shaping process and its impact on humanhealth, it should be stated that the highest potential impact was recorded for the coolingthe bottle with compressed air PLA bottle operation at 7.13 × 10⁻⁸ DALY and PET bottleat 4.35 × 10⁻⁸ DALY (Figure 14). The reason for this is the share of tap water at the stage
Materials 2021, 14, 4552 17 of 21
of cooling the finished bottle and the amount of electricity consumed. Lower PM emissionlevels <2.5 µm with similar potential impacts on human health were noted for the followingprocesses: degassing the bottle, blowing preforms, stretching and lengthening the preform,heating preforms, and preform conveyor.
Materials 2021, 14, x FOR PEER REVIEW 18 of 22
following processes: degassing the bottle, blowing preforms, stretching and lengthening the preform, heating preforms, and preform conveyor.
Figure 14. PM < 2.5 μm dust emissions to air and its impact on human health.
Bearing in mind the negative impact of airborne dust, special attention was paid to fine dust fractions and their impact on human health. To date, no threshold has been set below which PM10 and PM2.5 particulate matter would not pose a risk. The analyses show that the highest concentration levels in the entire PET bottle shaping process were determined for PM10 particles, while the lowest concentration levels were determined for coarse particles in the PM2.5–10 range (Figure 15).
Figure 14. PM < 2.5 µm dust emissions to air and its impact on human health.
Bearing in mind the negative impact of airborne dust, special attention was paid tofine dust fractions and their impact on human health. To date, no threshold has been setbelow which PM10 and PM2.5 particulate matter would not pose a risk. The analysesshow that the highest concentration levels in the entire PET bottle shaping process weredetermined for PM10 particles, while the lowest concentration levels were determined forcoarse particles in the PM2.5–10 range (Figure 15).
In the case of the process of shaping PLA bottles, lower concentration values of all thetechnological operations were noted. Both fine and coarse particles were characterized bylower concentration parameters, which shows that the process of shaping biodegradablebottles is more environmentally friendly.

Materials 2021, 14, 4552 18 of 21Materials 2021, 14, x FOR PEER REVIEW 19 of 22
Figure 15. Dust concentrations PM < 2.5, PM > 10, 2.5 < PM < 10 in the process of shaping for PET and PLA bottles.
In the case of the process of shaping PLA bottles, lower concentration values of all the technological operations were noted. Both fine and coarse particles were characterized by lower concentration parameters, which shows that the process of shaping biodegradable bottles is more environmentally friendly.
4. Discussion The main goal of the study was achieved by conducting an ecological analysis of the
life cycle of the beverage bottle production process. The analyses were based on the LCA method, and CML 2 and ReCiPe2016 were used as calculation procedures. The results were summarized separately for the two types of single-use bottles (PET bottle and PLA bottle).
In conjunction with the greater responsibility of producers, modern recycling devices, and announcements of changes in regulations, the amount of plastic will be reduced. It is estimated that even 8 million tons of plastic end up in the seas and oceans in the world each year. This effect can be avoided if more and more biodegradable packaging becomes available on the market. According to data from the European Commission, 25 million tons of plastic waste is produced in Europe every year, but only one in three is recycled [37]. Manufacturers of plastic packaging are increasingly looking for innovative, pro-ecological solutions that will somehow contribute to reducing the negative impact on the environment.
Comparing the impact categories, the results were presented in accordance with the impact category units adopted by LCA. Based on the conducted analysis, it can be concluded that the PET bottle production process showed a higher level of harmful environmental impact than the PLA bottle production process. The greatest number of potential negative impacts on the environment, in the case of all the studied objects, was recorded for the impact category: processes related to marine aquatic ecotoxicity (from 89.36 to 51.53 kg 1,4-DB eq for PLA bottle and from 91.65 to 57.99 kg 1,4-DB eq for PET bottle). Another category negatively affecting the condition of the natural environment is
Figure 15. Dust concentrations PM < 2.5, PM > 10, 2.5 < PM < 10 in the process of shaping for PET and PLA bottles.
4. Discussion
The main goal of the study was achieved by conducting an ecological analysis of thelife cycle of the beverage bottle production process. The analyses were based on the LCAmethod, and CML 2 and ReCiPe2016 were used as calculation procedures. The results weresummarized separately for the two types of single-use bottles (PET bottle and PLA bottle).
In conjunction with the greater responsibility of producers, modern recycling devices,and announcements of changes in regulations, the amount of plastic will be reduced.It is estimated that even 8 million tons of plastic end up in the seas and oceans in theworld each year. This effect can be avoided if more and more biodegradable packagingbecomes available on the market. According to data from the European Commission,25 million tons of plastic waste is produced in Europe every year, but only one in three isrecycled [37]. Manufacturers of plastic packaging are increasingly looking for innovative,pro-ecological solutions that will somehow contribute to reducing the negative impact onthe environment.
Comparing the impact categories, the results were presented in accordance withthe impact category units adopted by LCA. Based on the conducted analysis, it can beconcluded that the PET bottle production process showed a higher level of harmful envi-ronmental impact than the PLA bottle production process. The greatest number of potentialnegative impacts on the environment, in the case of all the studied objects, was recorded forthe impact category: processes related to marine aquatic ecotoxicity (from 89.36 to 51.53 kg1,4-DB eq for PLA bottle and from 91.65 to 57.99 kg 1,4-DB eq for PET bottle). Anothercategory negatively affecting the condition of the natural environment is human toxicity,for which higher emission values were noted during the cooling process of the finished PETbottle (0.085 kg 1,4-DB eq). In turn, in the case of the freshwater aquatic ecotox category,higher levels of substance emissions were reported for the cooling process of the PLA

Materials 2021, 14, 4552 19 of 21
bottle (0.049 kg 1,4-DB eq). In addition, notable differences in the results were observed forthe global warming category, where during the first operating process—preform beforeheating—the PET bottle production process showed the greatest negative environmentalimpact (Figure 10).
The results show that in most cases, the polymer materials used today contribute tothe most efficient use of resources, taking into account the energy balance [38]. Polymersbased on renewable resources are no better than conventional plastics based on fossilfuels because of their origin. Plastics sourced from renewable resources can contribute toreducing greenhouse gas emissions in the future if the right raw materials are chosen, andfurther appropriate waste management methods are chosen [39]. Similar research resultshave been published in [15–17], in which, in most of the impact categories, raw materialsof natural origin generally give better environmental performance than raw materials usedfor the production of PET bottles.
The analysis evaluation of the effectiveness of the material forming process PLAand PET bottles for beverages proposes a number of measures to improve and correctivemeasures.
When analyzing the research results, it is recommended to focus the measures takenin the field of water management by improving the efficiency of water consumptionand reusing it in the bottling process and in the bottle shaping process. In addition, itis proposed to implement a management system covering wastewater generated in theproduction process and full use of rainwater to reduce and prevent pollution.
Conscious management of post-consumer packaging should focus on reducing theamount of waste and improving the environment.
The implementation of LCA may bring tangible benefits in the environmental as-sessment of production processes responsible for the production of packaging [40]. Thismeans that in addition to the environmental effects of the bottle production process, theLCA analysis also takes into account the environmental impact of all materials and energyused (including the use of PET and PLA preforms). The use of LCA analysis allows for acomprehensive inventory of input and output data in the life cycle of the bottle produc-tion process. It also allows for an environmental assessment both in individual impactcategories, such as greenhouse gas emissions and fossil fuel depletion. This permits acomparative analysis of the different processes of production of bottles made from non-renewable resources and biodegradable material in the landfill. The use of LCA can beused to support environmental management systems and also as a supplementary elementfor the environmental impact assessment. LCA can also be used as a decision-making toolrelated to the environmental impact of manufacturing activities. Environmental indicatorsobtained through the use of LCA can be used to support decisions made in the organizationrelated to the analysis and assessment of the environmental aspects of the operation ofproduction plants in Poland. LCA may also be an element of a strategic, multi-facetedanalysis of the effectiveness of Polish industry [41,42].
Author Contributions: Conceptualization, P.B.-W. and I.P.; methodology, P.B.-W. and I.P.; software,P.B.-W.; validation, P.B.-W., I.P. and J.F.; formal analysis, P.B.-W., I.P, A.T. and J.F.; investigation,P.B.-W. and M.Z.; resources, P.B.-W.; data curation, P.B.-W.; writing—original draft preparation,P.B.-W. and I.P.; writing—review and editing, P.B.-W., A.T., A.I. and J.F.; visualization, P.B.-W. and J.F.;supervision, I.P., P.B.-W., J.F., M.Z. and A.I.; project administration, P.B.-W. All authors have read andagreed to the published version of the manuscript.
Funding: This research received no external funding.
Institutional Review Board Statement: Not applicable.
Informed Consent Statement: Not applicable.
Data Availability Statement: The data presented in this study are available on request from thecorresponding author.
Conflicts of Interest: The authors declare no conflict of interest.

Materials 2021, 14, 4552 20 of 21
References1. Lloyd, S.M.; Ries, R. Characterizing, Propagating, and Analyzing Uncertainty in Life-Cycle Assessment: A Survey of Quantitative
Approaches. J. Ind. Ecol. 2007, 11, 161–179. [CrossRef]2. Piasecka, I.; Baldowska-Witos, P.; Piotrowska, K.; Tomporowski, A. Eco-Energetical Life Cycle Assessment of Materials and
Components of Photovoltaic Power Plant. Energies 2020, 13, 1385. [CrossRef]3. Maurice, B.; Frischknecht, R.; Coelho-Schwirtz, V.; Hungerbühler, K. Uncertainty analysis in life cycle inventory. Application to
the production of electricity with French coal power plants. J. Clean. Prod. 2000, 8, 95–108. [CrossRef]4. Wang, E.; Shen, Z.; Neal, J.; Shi, J.; Berryman, C.; Schwer, A. An AHP-weighted aggregated data quality indicator (AWADQI)
approach for estimating embodied energy of building materials. Int. J. Life Cycle Assess. 2012, 17, 764–773. [CrossRef]5. Act of June 13, 2013 on the management of packaging and packaging waste. J. Laws 2013. item 888. Available online: http:
//isap.sejm.gov.pl/isap.nsf/DocDetails.xsp?id=WDU20130000888 (accessed on 15 June 2021).6. Frischknecht, R.; Jungbluth, N.; Althaus, H.-J.; Doka, G.; Dones, R.; Heck, T.; Hellweg, S.; Hischier, R.; Nemecek, T.; Rebitzer,
G.; et al. The ecoinvent Database: Overview and Methodological Framework (7 pp). Int. J. Life Cycle Assess. 2005, 10, 3–9.[CrossRef]
7. Weidema, B.P.; Wesnæs, M.S. Data quality management for life cycle inventories—an example of using data quality indicators. J.Clean. Prod. 1996, 4, 167–174. [CrossRef]
8. Sonnemann, G.W.; Schuhmacher, M.; Castells, F. Uncertainty assessment by a Monte Carlo simulation in a life cycle inventory ofelectricity produced by a waste incinerator. J. Clean. Prod. 2003, 11, 279–292. [CrossRef]
9. International Organization for Standarization ISO/TR 14047:2003-Environmental Management—Life Cycle Impact Assessment—Examplesof Application of ISO 14042 2003; ISO: Geneva, Switzerland, 2003.
10. International Organization for Standarization ISO/TS 14048:2002-Environmental Management—Life Cycle Assessment—Data Documenta-tion Format 2002; ISO: Geneva, Switzerland, 2002.
11. International Organization for Standardization ISO 14040:2006-Environmental Management—Life Cycle Assessment—Principles andFramework 2006; ISO: Geneva, Switzerland, 2006.
12. International Organization for Standardization ISO-ISO 14044:2006-Environmental Management—Life Cycle Assessment—Requirementsand Guidelines 2006; ISO: Geneva, Switzerland, 2006.
13. Shen, L.; Worrell, E.; Patel, M.K. Open-loop recycling: A LCA case study of PET bottle-to-fibre recycling. Resour. Conserv. Recycl.2010, 55, 34–52. [CrossRef]
14. Bałdowska-Witos, P.; Kruszelnicka, W.; Kasner, R.; Rudnicki, J.; Tomporowski, A.; Flizikowski, J. Impact of the plastic bottleproduction on the natural environment. Part 1. Application of the ReCiPe 2016 assessment method to identify environmentalproblems. Przemysl. Chem. 2019, 98, 1662–1667.
15. Walkerab, S.; Rothmana, R. Life cycle assessment of bio-based and fossil-based plastic: A review. J. Cleaner Prod. 2020, 261,121–158. [CrossRef]
16. Horowitz, N.; Frago, J.; Dongyan, M. Life cycle assessment of bottled water: A case study of Green2O products. Waste Manag.2018, 76, 734–743. [CrossRef] [PubMed]
17. Chen, L.; Pelton, R.E.O.; Smith, T.M. Comparative life cycle assessment of fossil and bio-based polyethylene terephthalate (PET)bottles. J. Clean. Prod. 2016, 137, 667–676. [CrossRef]
18. Kowalski, Z.; Kulczycka, J. Ocena cyklu zycia LCA jako podstawowy czynnik oceny czystszych produkcji. Odzysk odpadów–technologie i mozliwosci. In Proceedings of the Materiały Konfrerencji Waste Recycling; Wydawnictwo IGSMiE PAN: Kraków, Poland,2005; pp. 23–33.
19. Benetto, E.; Dujet, C.; Rousseaux, P. Integrating fuzzy multicriteria analysis and uncertainty evaluation in life cycle assessment.Environ. Model. Softw. 2008, 23, 1461–1467. [CrossRef]
20. Egilmez, G.; Gumus, S.; Kucukvar, M.; Tatari, O. A fuzzy data envelopment analysis framework for dealing with uncertaintyimpacts of input–output life cycle assessment models on eco-efficiency assessment. J. Clean. Prod. 2016, 129, 622–636. [CrossRef]
21. Lasvaux, S.; Schiopu, N.; Habert, G.; Chevalier, J.; Peuportier, B. Influence of simplification of life cycle inventories on the accuracyof impact assessment: Application to construction products. J. Clean. Prod. 2014, 79, 142–151. [CrossRef]
22. Chou, J.-S.; Yeh, K.-C. Life cycle carbon dioxide emissions simulation and environmental cost analysis for building construction.J. Clean. Prod. 2015, 101, 137–147. [CrossRef]
23. Geisler, G.; Hellweg, S.; Hungerbühler, K. Uncertainty Analysis in Life Cycle Assessment (LCA): Case Study on Plant-ProtectionProducts and Implications for Decision Making (9 pp + 3 pp). Int. J. Life Cycle Assess. 2005, 10, 184–192. [CrossRef]
24. Chevalier, J.-L.; Téno, J.-F.L. Life cycle analysis with ill-defined data and its application to building products. Int. J. Life CycleAssess. 1996, 1, 90–96. [CrossRef]
25. Gana, D.; Liptáková, T.; Markovicová, L. Comparison of the properties of the original and applied LDPE foils in returned bottles.Prod. Eng. Arch. 2019, 25, 39–42.
26. Bałdowska-Witos, P.; Kruszelnicka, W.; Kasner, R.; Tomporowski, A.; Flizikowski, J.; Kłos, Z.; Piotrowska, K.; Markowska, K.Application of LCA Method for Assessment of Environmental Impacts of a Polylactide (PLA) Bottle Shaping. Polymers 2020,12, 388. [CrossRef] [PubMed]
27. Mielczarek, K.; Krynke, M. Plastic production machinery–the evaluation of effectiveness. Prod. Eng. Arch. 2018, 18, 42–45.[CrossRef]

Materials 2021, 14, 4552 21 of 21
28. Reap, J.; Roman, F.; Duncan, S.; Bras, B. A survey of unresolved problems in life cycle assessment. Int. J. Life Cycle Assess. 2008,13, 290. [CrossRef]
29. Miller, S.A.; Moysey, S.; Sharp, B.; Alfaro, J. A Stochastic Approach to Model Dynamic Systems in Life Cycle Assessment. J. Ind.Ecol. 2013, 17, 352–362. [CrossRef]
30. Thiel, C.L.; Campion, N.; Landis, A.E.; Jones, A.K.; Schaefer, L.A.; Bilec, M.M. A Materials Life Cycle Assessment of a Net-ZeroEnergy Building. Energies 2013, 6, 1125–1141. [CrossRef]
31. Peters, G.P. Efficient algorithms for Life Cycle Assessment, Input-Output Analysis, and Monte-Carlo Analysis. Int. J. Life CycleAssess. 2006, 12, 373. [CrossRef]
32. Heijungs, R.; Tan, R.R. Rigorous proof of fuzzy error propagation with matrix-based LCI. Int. J. Life Cycle Assess. 2010, 15,1014–1019. [CrossRef]
33. Imbeault-Tétreault, H.; Jolliet, O.; Deschênes, L.; Rosenbaum, R.K. Analytical Propagation of Uncertainty in Life Cycle AssessmentUsing Matrix Formulation. J. Ind. Ecol. 2013, 17, 485–492. [CrossRef]
34. Ciroth, A.; Fleischer, G.; Steinbach, J. Uncertainty calculation in life cycle assessments. Int. J. Life Cycle Assess. 2004, 9, 216.[CrossRef]
35. Piotrowska, K.; Kruszelnicka, W.; Bałdowska-Witos, P.; Kasner, R.; Rudnicki, J.; Tomporowski, A.; Flizikowski, J.; Opielak, M.Assessment of the Environmental Impact of a Car Tire throughout Its Lifecycle Using the LCA Method. Materials 2019, 12, 4177.[CrossRef]
36. Bałdowska-Witos, P.; Kruszelnicka, W.; Kasner, R.; Tomporowski, A.; Flizikowski, J.; Mrozinski, A. Impact of the plastic bottleproduction on the natural environment. Part 2. Analysis of data uncertainty in the assessment of the life cycle of plastic beveragebottles using the Monte Carlo technique. Przem. Chem. 2019, 98, 1668–1672.
37. Report European Commission: European Strategy for Plastics in a Circular Economy. 2018. Available online: https://ec.europa.eu/info/research-and-innovation/research-area/environment/circular-economy/plastics-circular-economy_en (accessed on 15June 2021).
38. Edelen, A.; Ingwersen, W. Guidance on Data Quality Assessment for Life Cycle Inventory Data; United States Environmental ProtectionAgency: Washington, DC, USA, 2016.
39. Abdeev, B.M.; Azamatkyzy, S.A.; Cyganiuk, J.; Doudkin, M.V.; Idzikowski, A.; Przystupa, F.W.; Pustałka, A.; Sakimov, M.A.;Spangemacher, L. Modeling of Machinery Processes; Publisher Czestochowa University of Technology Faculty of Management:Czestochowa, Poland, 2017; Volume 1, pp. 79–81.
40. Cyganiuk, J.; Doudkin, M.V.; Frohilich, S.R.; Idzikowski, A.; Kim, A.I.; Kruszelnicka, W.; Sokolski, P.; Schuning, T.; Tomporowski,A.; Vaviolov, A.V. Modeling of Machinery Processes; Publisher Czestochowa University of Technology Faculty of Management:Czestochowa, Poland, 2017; Volume 2, pp. 60–65.
41. Mannheim, V. Empirical and scale-up modeling in stirred ball mills. Chem. Eng. Res. Des. 2011, 89, 405–409. [CrossRef]42. Mannheim, V.; Fehér, Z.; Siménfalvi, Z. Innovative solutions for the building industry to improve sustainability performance
with Life Cycle Assessment modelling. In Book Solutions for Sustainable Development, 1st ed.; Tóthné Szita, K., Jármai, K., Voith,K., Eds.; Taylor & Francis Group: Milton Park, UK, 2019. [CrossRef]