Screening preemergence herbicides for weed control in cassava
Upload
independentCategory
view
1download
0
14713
Wood and Other Renewable Resources (Subject Editor: Jörg Schweinle)
Life Cycle Assessment of Fuel Ethanol from Cassava in Thailand*Thu Lan T. Nguyen and Shabbir H. Gheewala**
The Joint Graduate School of Energy and Environment, King Mongkut's University of Technology Thonburi, Bangkok, Thailand
** Corresponding author ([email protected])
Since the re-emergence of ethanol, researchers have evalu-ated the fuel as a potential gasoline substitute using a gener-ally applicable assessment tool namely, life cycle assessment(LCA). The two key parameters that most of the ethanol casestudies address are energy and environmental performance[1-4]. Not only providing a complete picture of ethanol pro-duction and use, LCA also helps identify specific areas wheretechnological innovation or strategic policy is needed to makesuch an energy alternative practical and feasible.
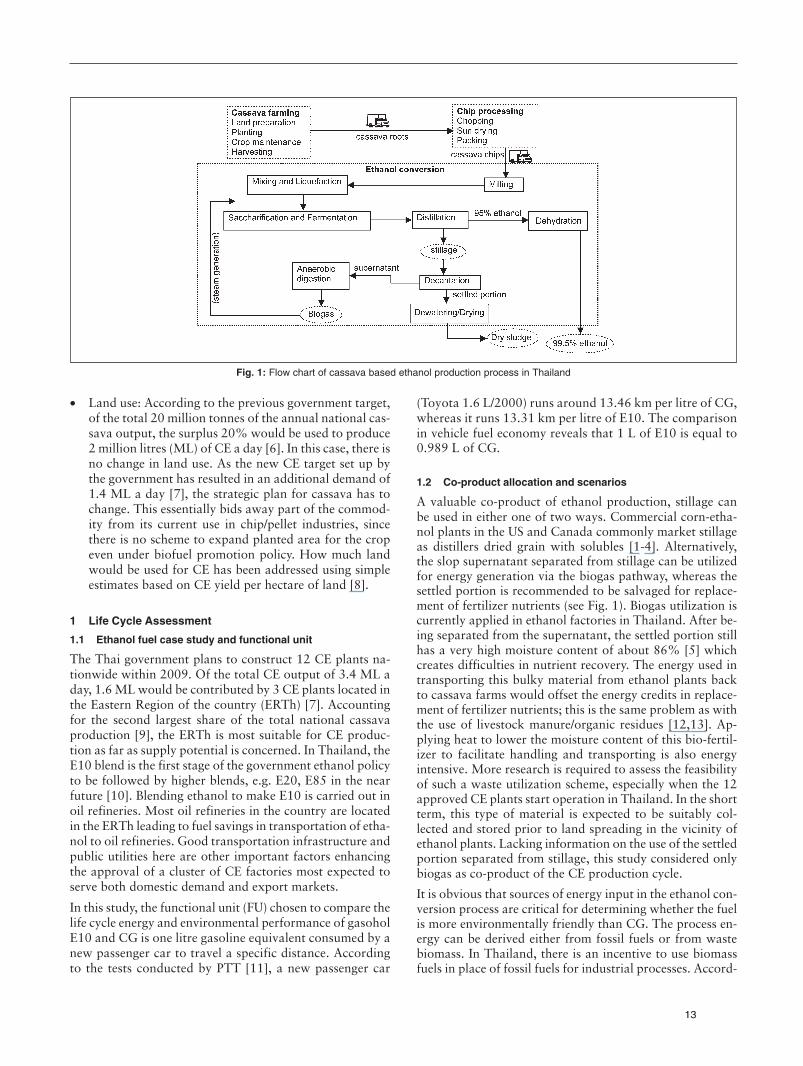
The fastest emerging market for fuel ethanol in Asia, Thai-land hopes a shift of its surplus farm products to ethanolcould, in the short term, reduce the country's oil import bills.What can be expected more from ethanol is its contributionto long-term energy security and environmental sustain-ability. In Thailand, both sugar and starch crops are consid-ered potential feedstock materials for commercial ethanolproduction. At present, ethanol in the form of gasohol avail-able at the Thai gas stations is derived mainly from molas-ses, a by-product of the sugar industry. However, the maindisadvantage of molasses-based ethanol lies in supply ver-sus demand, which has induced a shift towards cassava-basedethanol (CE). To demonstrate the feasibility of feedstockconversion to ethanol on a commercial scale, a research teamat the Cassava and Starch Technology Research Unit,Bangkok, Thailand has conducted research on pilot-scaleproduction of ethanol from cassava [5]. The flow chart rep-resenting the production process for a CE case study in Thai-land is shown in Fig. 1.
So far, it is unclear whether ethanol could work in Thailandas it does in other countries. A satisfying conclusion cannotbe reached unless an integrated assessment of ethanol pro-duction and use in the country is conducted. The objectiveof this study is to perform a life cycle analysis of energy andenvironmental impacts of using cassava-based gasohol as aconventional gasoline (CG) substitute in Thailand. The fol-lowing parameters have been considered in the analysis.
• Energy use (MJ energy carrier), specified as: 1) total grossenergy use (all energy inputs, including both fossil andnon fossil-based energy); 2) Net energy use (total energyuse, excluding energy recovered from system co-prod-ucts); 3) Fossil energy use; and 4) Petroleum use
• Environmental impact potentials in four categories: 1)Global Warming Potential (GWP); 2) Acidification; 3)Nutrient enrichment; and 4) Photochemical Ozone Cre-ation Potential (POCP)
DOI: http://dx.doi.org/10.1065/lca2007.06.343
Please cite this paper as: Nguyen TLT, Gheewala SH (2008):Life Cycle Assessment of Fuel Ethanol from Cassava in Thai-land. Int J LCA 13 (2) 147–154
Abstract
Goal and Scope. A well-to-wheel analysis has been conductedfor cassava-based ethanol (CE) in Thailand. The aim of the analy-sis is to assess the potentials of CE in the form of gasohol E10for promoting energy security and reducing environmental im-pacts in comparison with conventional gasoline (CG).
Method. In the LCA procedure, three separate but interrelatedcomponents: inventory analysis, characterization and interpre-tation were performed for the complete chain of the fuel lifecycle. To compare gasohol E10 and CG, this study addressedtheir impact potentials per gasoline-equivalent litre, taking intoaccount the performance difference between gasohol and gaso-line in an explosion motor.
Results and Discussions. The results obtained show that CE inthe form of E10, along its whole life cycle, reduces certain envi-ronmental loads compared to CG. The percentage reductionsrelative to CG are 6.1% for fossil energy use, 6.0% for globalwarming potential, 6.8% for acidification, and 12.2% for nu-trient enrichment. Using biomass in place of fossil fuels for pro-cess energy in the manufacture of ethanol leads to improvedoverall life cycle energy and environmental performance of etha-nol blends relative to CG.
Conclusions and Outlook. The LCA brings to light the key ar-eas in the ethanol production cycle that researchers and techni-cians need to work on to maximize ethanol's contribution toenergy security and environmental sustainability
Keywords: Cassava ethanol (CE); energy; environmental per-formance; life cycle assessment (LCA); Thailand
Introduction
The 1970s marked a new age of uncertainty when the short-age of world oil supplies and volatile oil prices put manycountries in severe energy insecurity and economic hard-ships. Among various candidate alternative fuels thatemerged, biomass-derived ethanol actually had a chance todominate the fuel market before the introduction of cheapand abundant supplies of petroleum. Not until the early1980s, when the Brazilian government launched theProalcool programme, was interest in ethanol renewed. Sincethen, ethanol overall output has increased rapidly and thistrend goes along with an ever wider geographical spread allover the world, originating from those countries located inthe western hemisphere, Brazil, the US, Canada, etc. * ESS-Submission Editor: Mark Goedkoop ([email protected])
1313
• Land use: According to the previous government target,of the total 20 million tonnes of the annual national cas-sava output, the surplus 20% would be used to produce2 million litres (ML) of CE a day [6]. In this case, there isno change in land use. As the new CE target set up bythe government has resulted in an additional demand of1.4 ML a day [7], the strategic plan for cassava has tochange. This essentially bids away part of the commod-ity from its current use in chip/pellet industries, sincethere is no scheme to expand planted area for the cropeven under biofuel promotion policy. How much landwould be used for CE has been addressed using simpleestimates based on CE yield per hectare of land [8].
1 Life Cycle Assessment
1.1 Ethanol fuel case study and functional unit
The Thai government plans to construct 12 CE plants na-tionwide within 2009. Of the total CE output of 3.4 ML aday, 1.6 ML would be contributed by 3 CE plants located inthe Eastern Region of the country (ERTh) [7]. Accountingfor the second largest share of the total national cassavaproduction [9], the ERTh is most suitable for CE produc-tion as far as supply potential is concerned. In Thailand, theE10 blend is the first stage of the government ethanol policyto be followed by higher blends, e.g. E20, E85 in the nearfuture [10]. Blending ethanol to make E10 is carried out inoil refineries. Most oil refineries in the country are locatedin the ERTh leading to fuel savings in transportation of etha-nol to oil refineries. Good transportation infrastructure andpublic utilities here are other important factors enhancingthe approval of a cluster of CE factories most expected toserve both domestic demand and export markets.
In this study, the functional unit (FU) chosen to compare thelife cycle energy and environmental performance of gasoholE10 and CG is one litre gasoline equivalent consumed by anew passenger car to travel a specific distance. Accordingto the tests conducted by PTT [11], a new passenger car
(Toyota 1.6 L/2000) runs around 13.46 km per litre of CG,whereas it runs 13.31 km per litre of E10. The comparisonin vehicle fuel economy reveals that 1 L of E10 is equal to0.989 L of CG.
1.2 Co-product allocation and scenarios
A valuable co-product of ethanol production, stillage canbe used in either one of two ways. Commercial corn-etha-nol plants in the US and Canada commonly market stillageas distillers dried grain with solubles [1-4]. Alternatively,the slop supernatant separated from stillage can be utilizedfor energy generation via the biogas pathway, whereas thesettled portion is recommended to be salvaged for replace-ment of fertilizer nutrients (see Fig. 1). Biogas utilization iscurrently applied in ethanol factories in Thailand. After be-ing separated from the supernatant, the settled portion stillhas a very high moisture content of about 86% [5] whichcreates difficulties in nutrient recovery. The energy used intransporting this bulky material from ethanol plants backto cassava farms would offset the energy credits in replace-ment of fertilizer nutrients; this is the same problem as withthe use of livestock manure/organic residues [12,13]. Ap-plying heat to lower the moisture content of this bio-fertil-izer to facilitate handling and transporting is also energyintensive. More research is required to assess the feasibilityof such a waste utilization scheme, especially when the 12approved CE plants start operation in Thailand. In the shortterm, this type of material is expected to be suitably col-lected and stored prior to land spreading in the vicinity ofethanol plants. Lacking information on the use of the settledportion separated from stillage, this study considered onlybiogas as co-product of the CE production cycle.
It is obvious that sources of energy input in the ethanol con-version process are critical for determining whether the fuelis more environmentally friendly than CG. The process en-ergy can be derived either from fossil fuels or from wastebiomass. In Thailand, there is an incentive to use biomassfuels in place of fossil fuels for industrial processes. Accord-
Fig. 1: Flow chart of cassava based ethanol production process in Thailand
131313
ingly, three scenarios concerned with process energy sourcesin the ethanol conversion stage have been examined(Table 1). The first scenario is based on the assumption thatthe energy used to drive the ethanol conversion process issimply derived from fossil sources. The second reflects theexisting situation of ethanol factories in Thailand; processenergy source comprises both biomass and fossil fuels. Thethird one assumes that the plant's energy demand can bemet totally by using its co-product (biogas), and biomass,e.g. rice husk, as an external energy source. Among variousbiomass energy resources relevant to Thailand, bagasse andrice husk are ranked first and second as per supply outputs[14], but bagasse is already being utilized by the sugar in-dustry. To figure out how a high content of ethanol in blendswould affect the results, the same calculation procedurequantifying energy use and emissions was applied to E85.
1.3 System boundary and data sources
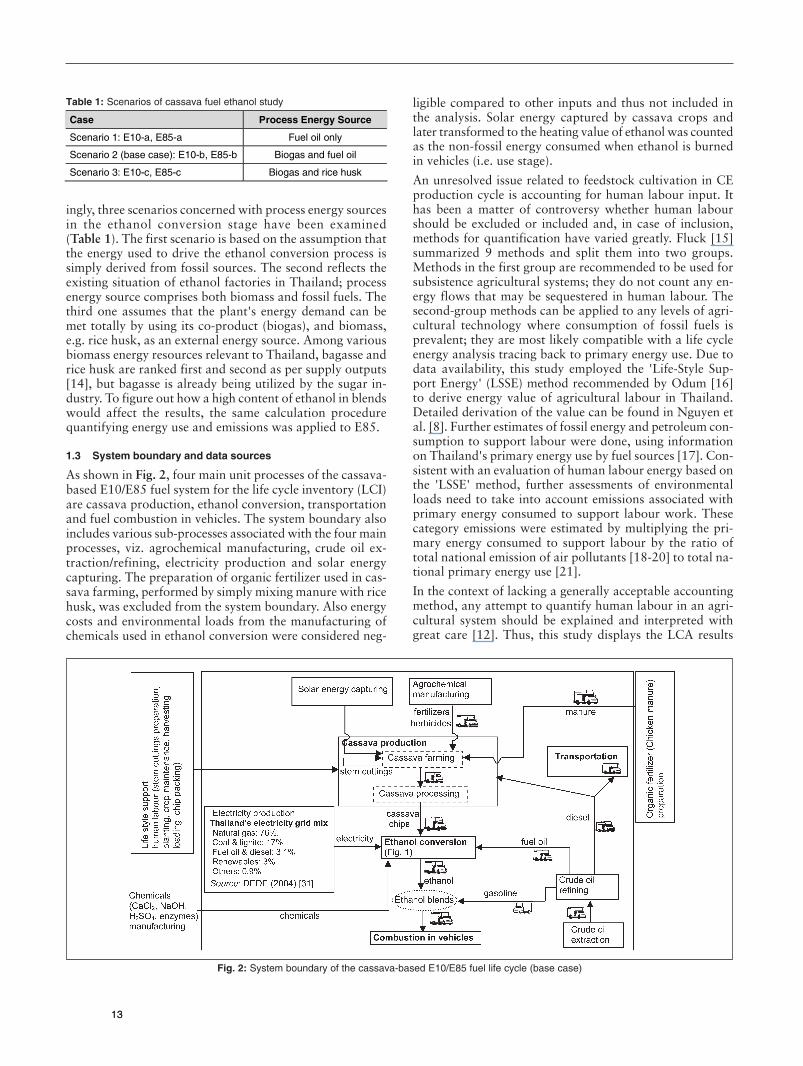
As shown in Fig. 2, four main unit processes of the cassava-based E10/E85 fuel system for the life cycle inventory (LCI)are cassava production, ethanol conversion, transportationand fuel combustion in vehicles. The system boundary alsoincludes various sub-processes associated with the four mainprocesses, viz. agrochemical manufacturing, crude oil ex-traction/refining, electricity production and solar energycapturing. The preparation of organic fertilizer used in cas-sava farming, performed by simply mixing manure with ricehusk, was excluded from the system boundary. Also energycosts and environmental loads from the manufacturing ofchemicals used in ethanol conversion were considered neg-
ligible compared to other inputs and thus not included inthe analysis. Solar energy captured by cassava crops andlater transformed to the heating value of ethanol was countedas the non-fossil energy consumed when ethanol is burnedin vehicles (i.e. use stage).
An unresolved issue related to feedstock cultivation in CEproduction cycle is accounting for human labour input. Ithas been a matter of controversy whether human labourshould be excluded or included and, in case of inclusion,methods for quantification have varied greatly. Fluck [15]summarized 9 methods and split them into two groups.Methods in the first group are recommended to be used forsubsistence agricultural systems; they do not count any en-ergy flows that may be sequestered in human labour. Thesecond-group methods can be applied to any levels of agri-cultural technology where consumption of fossil fuels isprevalent; they are most likely compatible with a life cycleenergy analysis tracing back to primary energy use. Due todata availability, this study employed the 'Life-Style Sup-port Energy' (LSSE) method recommended by Odum [16]to derive energy value of agricultural labour in Thailand.Detailed derivation of the value can be found in Nguyen etal. [8]. Further estimates of fossil energy and petroleum con-sumption to support labour were done, using informationon Thailand's primary energy use by fuel sources [17]. Con-sistent with an evaluation of human labour energy based onthe 'LSSE' method, further assessments of environmentalloads need to take into account emissions associated withprimary energy consumed to support labour work. Thesecategory emissions were estimated by multiplying the pri-mary energy consumed to support labour by the ratio oftotal national emission of air pollutants [18-20] to total na-tional primary energy use [21].
In the context of lacking a generally acceptable accountingmethod, any attempt to quantify human labour in an agri-cultural system should be explained and interpreted withgreat care [12]. Thus, this study displays the LCA results
Case Process Energy Source
Scenario 1: E10-a, E85-a Fuel oil only
Scenario 2 (base case): E10-b, E85-b Biogas and fuel oil
Scenario 3: E10-c, E85-c Biogas and rice husk
Table 1: Scenarios of cassava fuel ethanol study
Fig. 2: System boundary of the cassava-based E10/E85 fuel life cycle (base case)
131313
without accounting for human labour, which is put outsidethe system boundary (see Fig. 2). The results including labourare given in a separate section as a sensitivity analysis.
The procedure for making an LCI of cassava-based E10/E85 fuel is summarized in Table 2. The fuel life cycle envi-ronmental impacts are contributed by upstream (feedstockproduction, fuel conversion) stages and a use stage (fuel com-bustion). With ethanol blends, feedstock stage comprisescassava production and crude oil recovery and fuel stage isa combination of ethanol conversion and CG refining. Asseen, data for the study were collected in different ways fromdifferent sources. An important step of the LCI procedure isprocessing primary data to quantify energy use and emis-
sions associated with each unit process, using well-knownmodels, conceptual guidelines and databases (see Table 2).Note that in the GHG emission estimate, only fossil CO2emissions were considered; biomass-based CO2 emissionswere treated as net zero.
2 Results and Discussions
2.1 Life cycle energy and environmental impact performance
Table 4 summarizes the LCA characterization results forE10-b, E85-b and CG. Change represents impacts of substi-tuting either of the two alternatives for CG. Negative changeimplies a reduction in environmental loads compared to CG,whereas positive change denotes an increase. Breakdown of
Main unit process Data required Data sources Collecting method Data processing
Cassava production Fuel use Fertilizer use Herbicide use
Labour use
Cassava farmers Thai research reports
[23–26]
Manager of cassava processing plant [27]
Questionnaire/
On-site interview Literature review
Ethanol conversion Fuel oil use Electricity use
Biogas recovery/use
Thai research report [5]
Literature review
Transportation related to cassava production Transportation related to ethanol conversion
Distance Transport
mode/capacity
Cassava farmers Bulk terminal company [28]
Assumptions (see Table 3)
Questionnaire/ Interview
Energy use: – Diesel, fuel oil: TEI [29], IFAS/FU [30] – Fertilizer, herbicide: Helsel [13], GREET [22] – Labour: Nguyen et al. [8], IEA [17] – Electricity: DEDE [31] – Rice husk (scenario 3): Chungsangunsit et al. [32]
Emissions: – Diesel, fuel oil (direct emissions, i.e. emissions from fuel combustion, and indirect emissions, i.e. emissions from fuel manufacturing): GREET [22] – Fertilizer, herbicide manufacturing: GREET [22] – Fertilizer application (N2O emission): IPCC [33], IPCC [34] – Human labour: ONEP [18], World Bank/DEDP [19], EarthTrends [20], DEDE [21] – Electricity: Lohsomboon and Jirajariyavech [35] – Biomass/biogas combustion in boilers: DMU/NERI [36]
Crude oil recovery Gasoline refining
Fuel energy content
Thai research report [29]
Literature review Energy use: TEI [29], IFAS/FU [30], GREET [22] Emissions: GREET [22]
Thai research report [29] USDA research report [3]
CG and E10: PTT [11]
Literature review Fuel combustion (Use stage) – CG, E10, E85
Fuel energy content
Fuel economy
E85: flexible fueled vehicles (FFV) not available
in Thailand at present
Energy use: – Gasoline: TEI [29] – E10, E85
Gasoline portion: TEI [29], ethanol portion: using heating value of ethanol [3] (non-fossil energy) Emissions: – Major emissions from cars running on CG, E10: PTT [11] – Emissions from FFV running on E85: estimated from [22]
Table 2: The procedure for life cycle inventory of cassava-based E10/E85 fuel
Type of materials, products Transport mode Capacity (tonnes) Average distance (km)
Cassava chips from cassava processing plants to CE plants Diesel truck 15–20 100
Ethanol from factories to oil refineries Diesel truck 10–12 150
Gasohol from oil refineries to gas stations Diesel truck 10–12 180
E10-b E85-b Impact category CG
% change % change
Total gross energy use (MJ) 38.70 38.78 +0.2 34.02 –12.1
Net energy use (MJ) 38.70 38.48 –0.6 31.57 –18.4
Fossil energy use (MJ) 38.59 36.22 –6.1 14.32 –62.9
Petroleum use (MJ) 34.83 32.65 –6.3 12.58 –63.9
GWP (kg CO2 eq.) 3.00 2.81 –6.0 1.15 –61.6
Acidification (g SO2 eq.) 3.00 3.07 –6.8 4.90 +48.4
Nutrient enrichment (g NO3– eq.) 5.00 4.38 –12.2 6.67 +33.8
POCP (g C2H4 eq.) 1.53 1.54 +0.6 1.27 –17.1
Land use (m2 in one year) – 0.27 2.19
Table 3: Assumptions about transportation activities related to ethanol conversion phase
Table 4: LCA characterization results for 9 impact categories (displayed per functional unit)
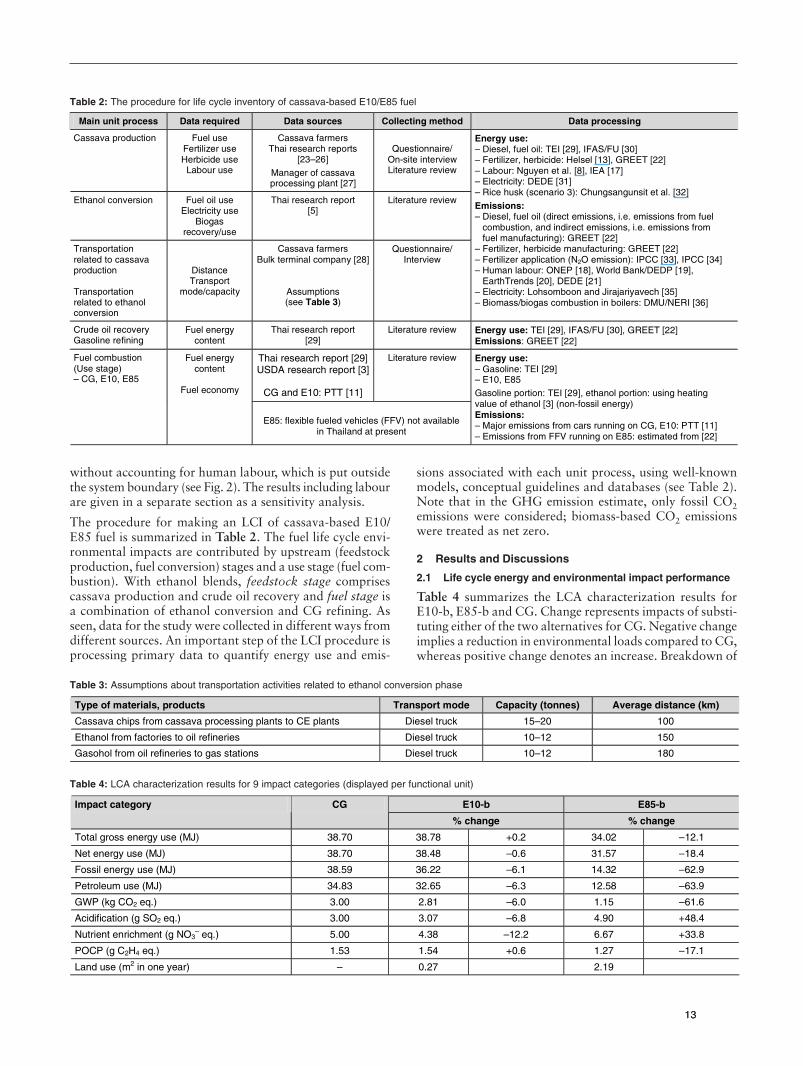
contributions from the three stages (feedstock, fuel and enduse) to the life cycle energy and environmental performanceof CG, E10-b and E85-b is shown in Fig. 3.
Table 4 shows clear advantages of using CE in the form ofeither E85 or E10 as a transportation fuel over CG in terms ofreductions in fossil energy use, petroleum use and GWP. Thereductions mainly result from the absence of fossil-based liq-uid fuel and consequently fossil-based CO2 emissions fromthe combustion of ethanol portion in the blends. It is reason-able that the magnitude of the reductions is proportional tothe percentage of ethanol mixed with CG. Using E85 is evenmore advantageous than E10 considering '% change' in to-tal gross energy use and net energy use relative to gasoline.
Regarding other environmental impact potentials, e.g. acidifi-cation, nutrient enrichment and POCP, the results come out inopposite direction for E10 and E85. Along its whole life cycle,E10 produces positive impacts over CG on acidification andnutrient enrichment, but negligible impact on POCP. In con-trast, the production and use of E85 leads to more severe im-pacts on acidification and nutrient enrichment but less dam-aging impact on POCP than CG. As illustrated in Fig. 3, interms of acidification and nutrient enrichment, lower impactsfrom the use stage of E10 favour the overall life cycle impactsof the fuel mixture over CG. As ethanol content in gasolinereaches 85%, the net changes in the two impact categoriesrelative to CG are dominated by higher impacts from the up-stream of the ethanol fuel life cycle. For POCP, a slightly higherimpact from the use stage of E10 over that of CG is nearlycompensated by lower impact from the upstream. Improve-ment appears with E85 where a combination of lower im-pacts from the fuel stage and use stage completely offset theslightly higher impact from the feedstock stage.
Fig. 3 also reveals that a high percentage of energy use andenvironmental impact potentials is contributed by the com-bustion of the fuel mixture and the production of the majorfuel component, i.e. CG if the mixture is E10 or ethanol if themixture is E85. Obviously, the environmental impacts from
ethanol production cycle play a more dominant role in a high-level ethanol-gasoline blend than in a low-level one.
Presented in Table 4 is a rough evaluation of the area of agri-cultural land used for growing feedstock to produce the etha-nol portion in the two ethanol blends. To meet the govern-ment target of 3.4 ML of CE a day, approximately 0.335million hectares (Mha) a year is required. This accounts for32% of the total national cassava harvested area in 2004(1.057 Mha) [9]. However, only 0.138 Mha (13% of 1.057 Mha)is to be considered for a possible change in the end use of thecrop harvested, as mentioned before. This is essentially a shiftof the use of some of the cassava chips from animal feed toethanol which implies that the substituted animal feed mustbe provided from other sources. The impact of this changeneeds to be studied further in terms of its effect on land use.
2.2 Breakdown of results – Comparison between scenarios
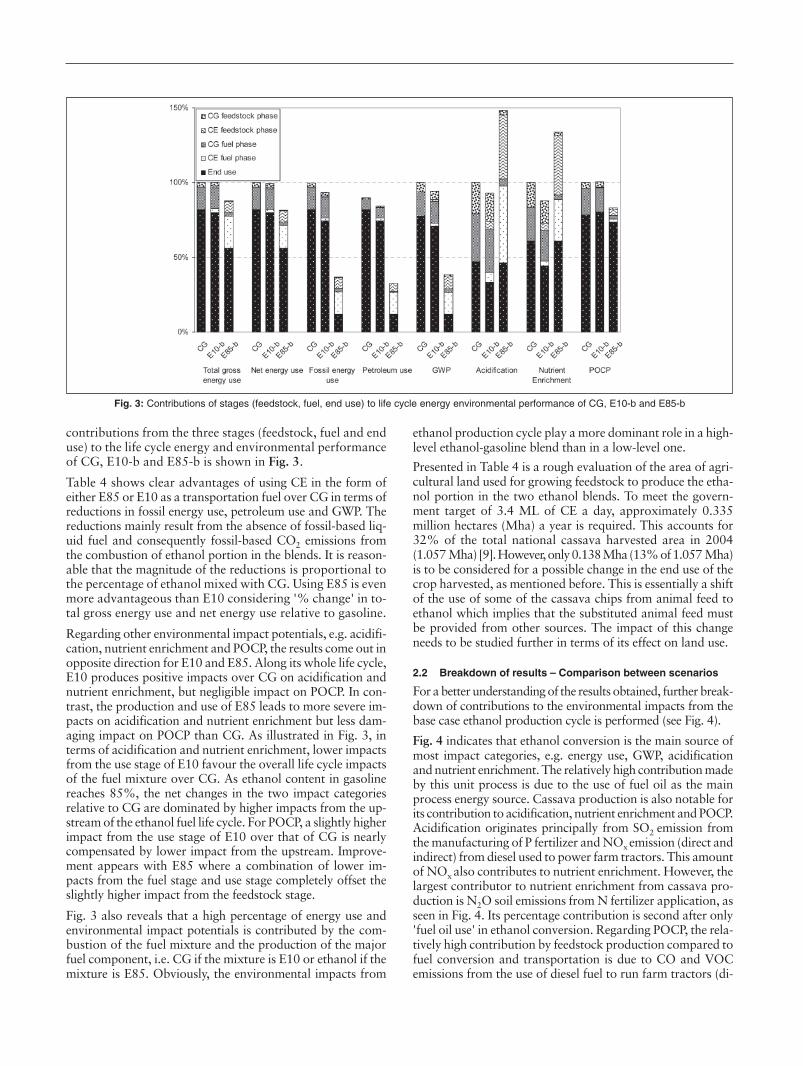
For a better understanding of the results obtained, further break-down of contributions to the environmental impacts from thebase case ethanol production cycle is performed (see Fig. 4).
Fig. 4 indicates that ethanol conversion is the main source ofmost impact categories, e.g. energy use, GWP, acidificationand nutrient enrichment. The relatively high contribution madeby this unit process is due to the use of fuel oil as the mainprocess energy source. Cassava production is also notable forits contribution to acidification, nutrient enrichment and POCP.Acidification originates principally from SO2 emission fromthe manufacturing of P fertilizer and NOx emission (direct andindirect) from diesel used to power farm tractors. This amountof NOx also contributes to nutrient enrichment. However, thelargest contributor to nutrient enrichment from cassava pro-duction is N2O soil emissions from N fertilizer application, asseen in Fig. 4. Its percentage contribution is second after only'fuel oil use' in ethanol conversion. Regarding POCP, the rela-tively high contribution by feedstock production compared tofuel conversion and transportation is due to CO and VOCemissions from the use of diesel fuel to run farm tractors (di-
Fig. 3: Contributions of stages (feedstock, fuel, end use) to life cycle energy environmental performance of CG, E10-b and E85-b
rect and indirect) and from the manufacturing of fertilizers.Transportation contributes a relatively small fraction (less than20%) of energy use as well as environmental impact poten-tials of the CE production cycle.
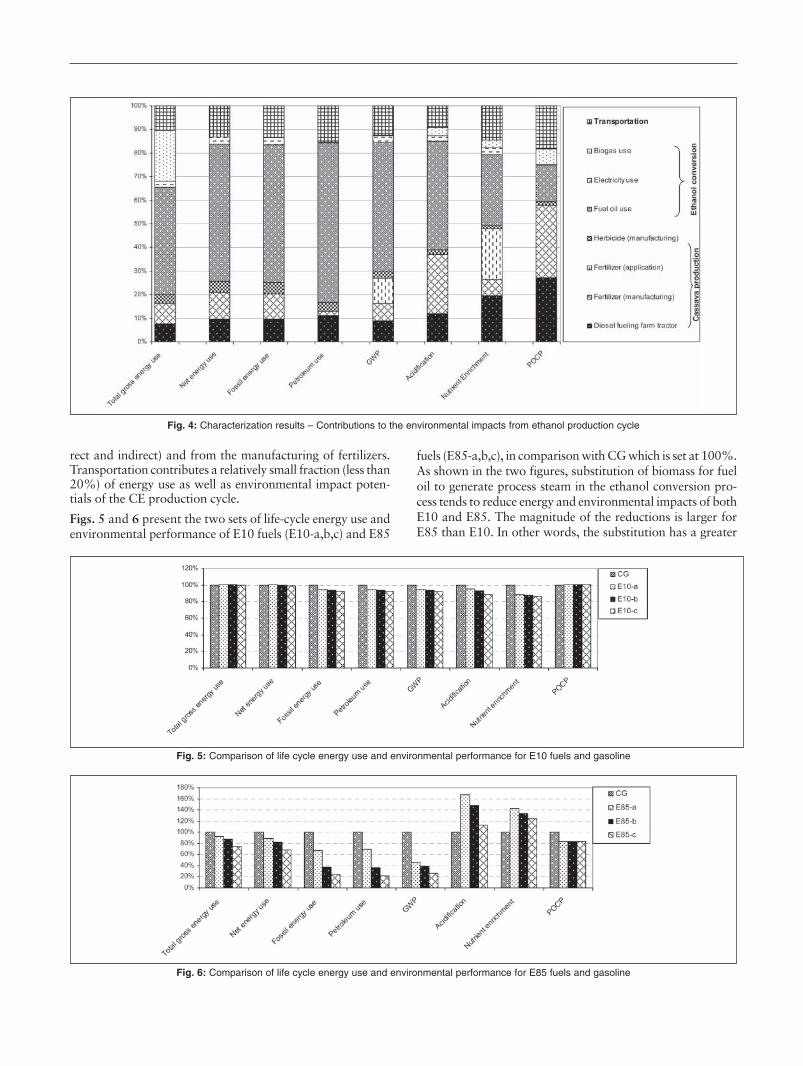
Figs. 5 and 6 present the two sets of life-cycle energy use andenvironmental performance of E10 fuels (E10-a,b,c) and E85
fuels (E85-a,b,c), in comparison with CG which is set at 100%.As shown in the two figures, substitution of biomass for fueloil to generate process steam in the ethanol conversion pro-cess tends to reduce energy and environmental impacts of bothE10 and E85. The magnitude of the reductions is larger forE85 than E10. In other words, the substitution has a greater
Fig. 4: Characterization results – Contributions to the environmental impacts from ethanol production cycle
Fig. 5: Comparison of life cycle energy use and environmental performance for E10 fuels and gasoline
Fig. 6: Comparison of life cycle energy use and environmental performance for E85 fuels and gasoline
131313
influence on E85 than on E10, owing to the dominance ofethanol in the fuel mixture, as discussed before. The resultscan be better interpreted when seen along with Fig. 4.
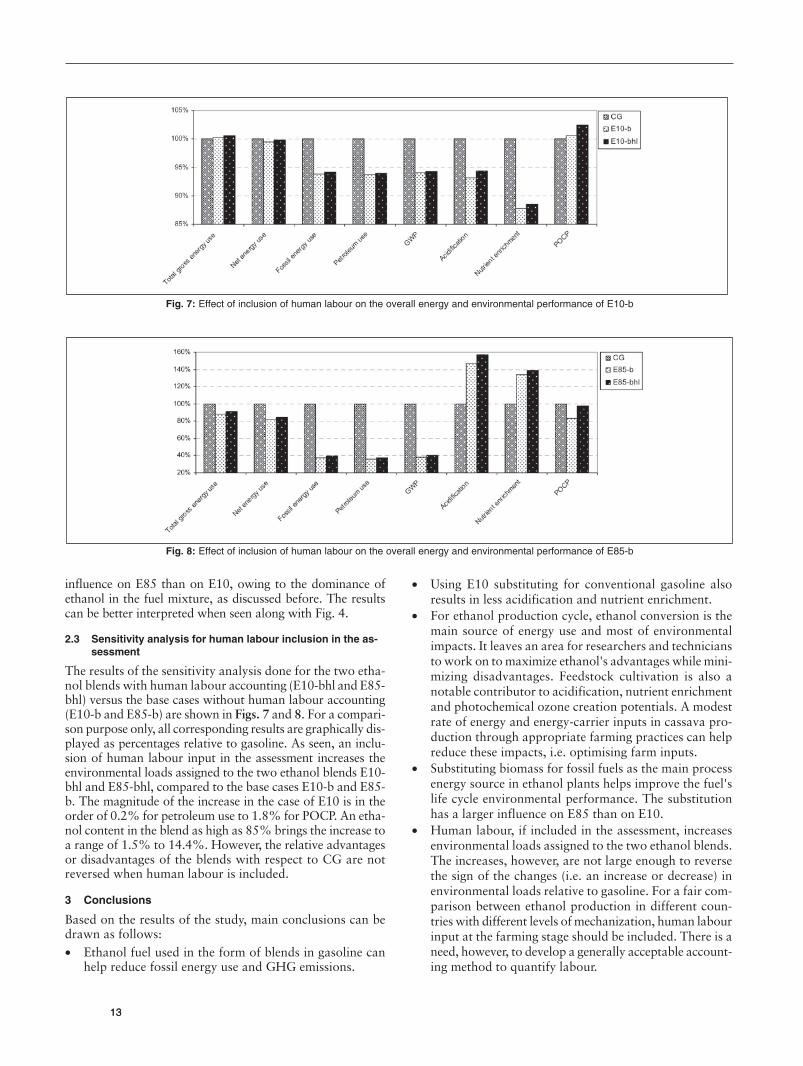
2.3 Sensitivity analysis for human labour inclusion in the as-sessment
The results of the sensitivity analysis done for the two etha-nol blends with human labour accounting (E10-bhl and E85-bhl) versus the base cases without human labour accounting(E10-b and E85-b) are shown in Figs. 7 and 8. For a compari-son purpose only, all corresponding results are graphically dis-played as percentages relative to gasoline. As seen, an inclu-sion of human labour input in the assessment increases theenvironmental loads assigned to the two ethanol blends E10-bhl and E85-bhl, compared to the base cases E10-b and E85-b. The magnitude of the increase in the case of E10 is in theorder of 0.2% for petroleum use to 1.8% for POCP. An etha-nol content in the blend as high as 85% brings the increase toa range of 1.5% to 14.4%. However, the relative advantagesor disadvantages of the blends with respect to CG are notreversed when human labour is included.
3 Conclusions
Based on the results of the study, main conclusions can bedrawn as follows:• Ethanol fuel used in the form of blends in gasoline can
help reduce fossil energy use and GHG emissions.
• Using E10 substituting for conventional gasoline alsoresults in less acidification and nutrient enrichment.
• For ethanol production cycle, ethanol conversion is themain source of energy use and most of environmentalimpacts. It leaves an area for researchers and techniciansto work on to maximize ethanol's advantages while mini-mizing disadvantages. Feedstock cultivation is also anotable contributor to acidification, nutrient enrichmentand photochemical ozone creation potentials. A modestrate of energy and energy-carrier inputs in cassava pro-duction through appropriate farming practices can helpreduce these impacts, i.e. optimising farm inputs.
• Substituting biomass for fossil fuels as the main processenergy source in ethanol plants helps improve the fuel'slife cycle environmental performance. The substitutionhas a larger influence on E85 than on E10.
• Human labour, if included in the assessment, increasesenvironmental loads assigned to the two ethanol blends.The increases, however, are not large enough to reversethe sign of the changes (i.e. an increase or decrease) inenvironmental loads relative to gasoline. For a fair com-parison between ethanol production in different coun-tries with different levels of mechanization, human labourinput at the farming stage should be included. There is aneed, however, to develop a generally acceptable account-ing method to quantify labour.
Fig. 7: Effect of inclusion of human labour on the overall energy and environmental performance of E10-b
Fig. 8: Effect of inclusion of human labour on the overall energy and environmental performance of E85-b
Acknowledgements. The authors would like to thank all officers ofthe Department of Agricultural Extension in the eastern region of Thai-land for their collaboration in collecting cassava farming data. Thanksare also given to the research team in Cassava and Starch Technol-ogy Research Unit (CSTRU), Bangkok, Thailand for providing relevantdata on the ethanol conversion process. The financial support pro-vided by the Joint Graduate School of Energy and Environment is ac-knowledged.
References
[1] Wang M, Saricks C, Santini D (1999): Effects of Fuel EthanolUse on Fuel-Cycle Energy and Greenhouse Gas Emissions. Centerfor Transportation Research, Argonne National Laboratory, Ar-gonne, Illinois
[2] Levelton, R-2000-1: Assessment of Net Emissions of GreenhouseGases from Ethanol-Gasoline Blends in Southern Ontario. Cross-Sectoral Policy Development Division
[3] Shapouri H, Duffield JA, McAloon A, Wang M (2004): The 2001Net Energy Balance of Corn Ethanol, US Department of Agriculture
[4] Fu GZ, Chan AW, Minns DE (2003): Life Cycle Assessment ofBio-ethanol Derived from Cellulose. Int J LCA 8 (3) 137–141
[5] Ronjnaridpiched C, Kosintarasaenee S, Sriroth K, PiyachomkwanK, Tia S, Kaewsompong S, Nitivararat M (2003): Development ofEthanol Production Technology from Cassava Chip at a Pilot PlantScale. National Research Council of Thailand
[6] Sriroth K, Piyachomkwan K, Veerathaworn P, Sarobol V, VichukitV, Ronjnaridpiched C (2003): Bioethanol from cassava. Proceed-ings of the 2nd Regional Conference on Energy Technology Towardsa Clean Environment, Phuket, Thailand, 12–14 February 2003
[7] Sukphisal B (2005): Market development of biofuels in Thailand.The renewable energy committee, Thai parliament – Biomass –Asia Workshop. December 15, 2005.
[8] Nguyen TLT, Gheewala SH, Garivait S (2007): Full Chain EnergyAnalysis of Fuel Ethanol from Cassava in Thailand. Environ SciTechnol 14 (11) 4135–4142
[9] OAE (2004): Agricultural Statistics of Thailand. Center for agri-cultural information, Office of agricultural economics, Ministryof Agriculture and Cooperatives, Bangkok, Thailand
[10] Goyal A, Director, Product Development, Ford Asia PacificHiroshima, Theme: Sustainable Mobility Opportunities for Thai-land. Alternative Fuels Seminar, 26th Bangkok International Mo-tor Show <http://www.theautochannel.com/news/2005/03/29/023736.html>
[11] PTT (2006): Gasohol – Tests conducted by PTT Research and Tech-nology Institute. The Petroleum Authority of Thailand <http://www.pttplc.com/en/ptt_core.asp?page=ps_pr_fu_gs_08>
[12] Pimentel D (1992): Energy inputs in production agriculture. In:Fluck RC (ed), Energy in Farm Production (Vol. 6 of Energy inWorld Agriculture). Elsevier, Amsterdam, pp 13–29
[13] Helsel ZR (1992): Energy and alternatives for fertilizer and pesti-cide use. In: Fluck RC (ed), Energy in Farm Production (Vol. 6 ofEnergy in World Agriculture). Elsevier, Amsterdam, pp 177–201
[14] NEPO (2000): Final report, Thailand – Biomass-Based Power Gen-eration and Cogeneration Within Small Rural Industries. NationalEnergy Policy Office
[15] Fluck RC (1992): Energy of Human Labor. In: Fluck RC (ed), En-ergy in Farm Production (Vol. 6 of Energy in World Agriculture).Elsevier, Amsterdam, pp 31–37
[16] Odum HT (1983): Systems Ecology. Wiley, New York, pp 476–507[17] IEA (2005): Shares of TPES (Total Primary Energy Supply) 2003-
Thailand. IEA (International Energy Agency) Energy Statistics[18] ONEP/MONRE (2005): CDM Development in Thailand. Office
of Natural Resources & Environmental Policy and Planning, andMinistry of Natural Resources and Environment. <http://cd4cdm.org/countries%20and%20regions/Asia/Fifth%20Regional%20Workshop/CDM-Thailand.ppt>
[19] World Bank (2002): Thailand Environment Monitor 2000. DEDP(Department of Energy Development) Pollutant Emissions Esti-mates, World Bank
[20] Earth trends – World Resources Institute (2006): Air pollution:Non-methane VOC emissions –Thailand. <http://earthtrends.wri.org/text/climate-atmosphere/variable-815.html>
[21] DEDE (2004): Thailand energy situation year 2004. The Depart-ment of Alternative Energy Development and Efficiency. <http://www.dede.go.th/dede/fileadmin/usr/wpd/static/energy47/10_ENT3.pdf>
[22] Wang M (2006): Greet 1.7 Beta – Transportation Fuel CycleModel. U.S. Dept. of Energy. Argonne National Laboratory,Argonne, Illinois
[23] Howeler RH (2000): Cassava agronomy research in Asia: Has itbenefited cassava farmers? Cassava's potential in Asia in the 21st
Century: Present Situation and Future Research and DevelopmentNeeds. Proc. 6th Regional Workshop, Ho Chi Minh, Vietnam, Feb-ruary 21–25, 2000
[24] Sriroth K, Ronjnaridpiched C, Vichukit V, Suriyapan P, Oates CG(2000): Present situation and future potential of cassava in Thai-land. Cassava's potential in Asia in the 21st Century: Present Situ-ation and Future Research and Development Needs. Proc. 6th Re-gional Workshop, Ho Chi Minh, Vietnam, February 21–25, 2000
[25] Tongglum A, Suriyapan P, Howeler RH (2000): Cassava AgronomyResearch and Adoption of Improved Practices in Thailand-MajorAchievements during the past 35 years. Cassava's potential in Asiain the 21st Century: Present Situation and Future Research andDevelopment Needs. Proc. 6th Regional Workshop, Ho Chi Minh,Vietnam, February 21–25, 2000
[26] Hershey CH, Howeler RH (2000): Cassava in Asia: Designing cropresearch for competitive markets. Cassava's potential in Asia inthe 21st Century: Present Situation and Future Research and De-velopment Needs. Proc. 6th Regional Workshop, Ho Chi Minh,Vietnam, February 21–25, 2000
[27] Witriyatornpan W, Cassava chip processing manager of Lanman-chairuangkit factory located at 65/1 Moo 2, T. Nonpredoo, A.Laokwan, Kanchanaburi, Thailand. Personal interview. March 13,2006
[28] Rayong Bulk Terminal Company Limited, a joint venture com-pany of the National Chemical Fertilizer Public Co., Ltd; Map TaPhut deep seaport, Rayong, Thailand. Telephone number 038-609239-40
[29] TEI (2001): Fossil fuel production and refinery LCI 2001. Thai-land Environment Institute
[30] IFAS/UF (1991): The Energy Information Handbook. Florida Co-operative Extension Service. University of Florida
[31] DEDE (2004): Thailand Energy Statistics 2004. The Departmentof Alternative Energy Development and Efficiency. <http://www2.dede.go.th/dede/report/TES2004.pdf>
[32] Chungsangunsit T, Gheewala SH, Patumsawad S (2005): Environ-mental Assessment of Electricity Production from Rice Husk: A CaseStudy in Thailand. International Energy Journal 6 (1) 347–356
[33] IPCC (1997): Greenhouse gas emissions from agricultural soils.In: Greenhouse Gas Inventory Reference Manual (Volume 3). Re-vised 1996 IPCC Guidelines for National Greenhouse Gas Inven-tories, Geneva
[34] IPCC (2000): Good Practice Guidance and Uncertainty Manage-ment in National Greenhouse Gas Inventories. IPCC NationalGreenhouse Gas Inventory Program
[35] Lohsomboon P, Jirajariyavech A (2003): Thailand - Final Reportfor the Project on Life Cycle Assessment for Asian Countries - PhaseIII, Business and Environment Program – Thailand EnvironmentInstitute, February 2003
[36] DMU/NERI (2006): Emissions Factors. National EnvironmentalResearch Institute, Denmark
Received: December 24th, 2006Accepted: June 11th, 2007
OnlineFirst: June 12th, 2007
Copyright © 2022 FDOKUMEN