
Full chain energy analysis of fuel ethanol from cassava in Thailand
13
Full chain energy analysis of fuel ethanol from cane molasses in Thailand Thu Lan T. Nguyen, Shabbir H. Gheewala * , Savitri Garivait The Joint Graduate School of Energy and Environment, King Mongkut’s University of Technology Thonburi, Bangkok, Thailand Received 24 September 2007; received in revised form 28 December 2007; accepted 1 February 2008 Available online 18 March 2008 Abstract An analysis of energy performance and supply potential was performed to evaluate molasses utilization for fuel ethanol in Thailand. The Thai government recently has set up a production target of 1.925 million litres a day of sugar-based eth- anol. The molasses-based ethanol (MoE) system involves three main segments: sugar cane cultivation, molasses genera- tion, and ethanol conversion. Negative net energy value found for MoE is a consequence of not utilizing system co- products (e.g. stillage and cane trash) for energy. Taking into account only fossil fuel or petroleum inputs in the production cycle, the energy analysis provides results in favour of ethanol. A positive net energy of 5.95 MJ/L which corresponds to 39% energy gain shows that MoE is efficient as far as its potential to replace fossil fuels is concerned. Another encouraging result is that each MJ of petroleum inputs can produce 6.12 MJ of ethanol fuel. Regarding supply potential, if only the surplus molasses is utilized for ethanol, a shift of 8–10% sugar cane produce to fuel ethanol from its current use in sugar industry could be a probable solution. Ó 2008 Elsevier Ltd. All rights reserved. Keywords: Molasses-based ethanol; Life cycle assessment; Net energy value; Energy ratio; Thailand 1. Introduction After China and India, Thailand is considered another market for fuel ethanol in Asia. At present, the 10% ethanol in gasohol available at the Thai gas stations is mainly a fermentation product of molasses. According to [1], by 2008, 12 sugar-based ethanol plants with the total output of 1.925 million litres (ML) a day will come on stream in Thailand. In line with rapid development of process technologies involved in ethanol production from biomass, eval- uations of ethanol’s advantages over gasoline through intensive life cycle assessment (LCA) studies have been conducted by groups of researchers throughout the world. Through LCA procedure, all exchanges of ethanol system with the environment and their potential impacts are examined. One instrument conventionally used to evaluate ethanol system’s efficiency is net energy value which weighs energy output against energy input. 0306-2619/$ - see front matter Ó 2008 Elsevier Ltd. All rights reserved. doi:10.1016/j.apenergy.2008.02.002 * Corresponding author. Tel.: +66 2 4708309 10; fax: +66 2 8729805. E-mail address: [email protected] (S.H. Gheewala). Available online at www.sciencedirect.com Applied Energy 85 (2008) 722–734 www.elsevier.com/locate/apenergy APPLIED ENERGY
-
Upload
independent -
Category
Documents
-
view
1 -
download
0
Transcript of Full chain energy analysis of fuel ethanol from cassava in Thailand

Available online at www.sciencedirect.com
Applied Energy 85 (2008) 722–734
www.elsevier.com/locate/apenergy
APPLIED
ENERGY
Full chain energy analysis of fuel ethanol from canemolasses in Thailand
Thu Lan T. Nguyen, Shabbir H. Gheewala *, Savitri Garivait
The Joint Graduate School of Energy and Environment, King Mongkut’s University of Technology Thonburi, Bangkok, Thailand
Received 24 September 2007; received in revised form 28 December 2007; accepted 1 February 2008Available online 18 March 2008
Abstract
An analysis of energy performance and supply potential was performed to evaluate molasses utilization for fuel ethanolin Thailand. The Thai government recently has set up a production target of 1.925 million litres a day of sugar-based eth-anol. The molasses-based ethanol (MoE) system involves three main segments: sugar cane cultivation, molasses genera-tion, and ethanol conversion. Negative net energy value found for MoE is a consequence of not utilizing system co-products (e.g. stillage and cane trash) for energy. Taking into account only fossil fuel or petroleum inputs in the productioncycle, the energy analysis provides results in favour of ethanol. A positive net energy of 5.95 MJ/L which corresponds to39% energy gain shows that MoE is efficient as far as its potential to replace fossil fuels is concerned. Another encouragingresult is that each MJ of petroleum inputs can produce 6.12 MJ of ethanol fuel. Regarding supply potential, if only thesurplus molasses is utilized for ethanol, a shift of 8–10% sugar cane produce to fuel ethanol from its current use in sugarindustry could be a probable solution.� 2008 Elsevier Ltd. All rights reserved.
Keywords: Molasses-based ethanol; Life cycle assessment; Net energy value; Energy ratio; Thailand
1. Introduction
After China and India, Thailand is considered another market for fuel ethanol in Asia. At present, the 10%ethanol in gasohol available at the Thai gas stations is mainly a fermentation product of molasses. Accordingto [1], by 2008, 12 sugar-based ethanol plants with the total output of 1.925 million litres (ML) a day will comeon stream in Thailand.
In line with rapid development of process technologies involved in ethanol production from biomass, eval-uations of ethanol’s advantages over gasoline through intensive life cycle assessment (LCA) studies have beenconducted by groups of researchers throughout the world. Through LCA procedure, all exchanges of ethanolsystem with the environment and their potential impacts are examined. One instrument conventionally used toevaluate ethanol system’s efficiency is net energy value which weighs energy output against energy input.
0306-2619/$ - see front matter � 2008 Elsevier Ltd. All rights reserved.
doi:10.1016/j.apenergy.2008.02.002
* Corresponding author. Tel.: +66 2 4708309 10; fax: +66 2 8729805.E-mail address: [email protected] (S.H. Gheewala).
Thu Lan T. Nguyen et al. / Applied Energy 85 (2008) 722–734 723
However, most assessments conducted to date focus mainly on ethanol from starch-based feedstocks [2–6]whereas just a few are available to evaluate ethanol from sugar-based feedstocks, either directly as sugar cane[7] or indirectly, as the by-product from sugar industry, e.g. molasses [8]. Having high content of fermentablesugars, molasses is considered no less important than any other feedstocks in utilization for ethanol produc-tion, especially in tropical and sub-tropical regions where the climate favours cane growth [9].
The reason for conducting this analysis is to better understand the energy performance of ethanol frommolasses in Thailand. Supply potential versus production target is also an important issue to be considered.
2. Methodology
2.1. Goal and scope definition
This paper aims to (1) present a full chain energy analysis of fuel ethanol from molasses in Thailand to eval-uate whether the production and use of the fuel can help can help reduce fossil imports and (2) assess supplypotentials of molasses for ethanol in the country based on the government target.
2.2. Molasses-based ethanol production cycle: System boundary and data sources
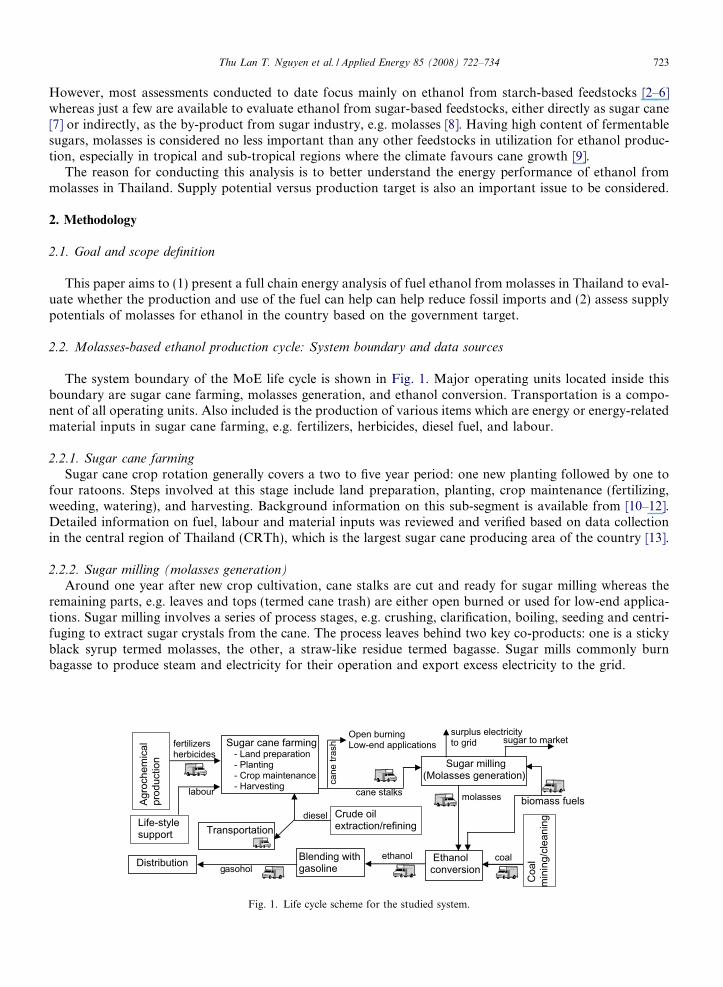
The system boundary of the MoE life cycle is shown in Fig. 1. Major operating units located inside thisboundary are sugar cane farming, molasses generation, and ethanol conversion. Transportation is a compo-nent of all operating units. Also included is the production of various items which are energy or energy-relatedmaterial inputs in sugar cane farming, e.g. fertilizers, herbicides, diesel fuel, and labour.
2.2.1. Sugar cane farming
Sugar cane crop rotation generally covers a two to five year period: one new planting followed by one tofour ratoons. Steps involved at this stage include land preparation, planting, crop maintenance (fertilizing,weeding, watering), and harvesting. Background information on this sub-segment is available from [10–12].Detailed information on fuel, labour and material inputs was reviewed and verified based on data collectionin the central region of Thailand (CRTh), which is the largest sugar cane producing area of the country [13].
2.2.2. Sugar milling (molasses generation)
Around one year after new crop cultivation, cane stalks are cut and ready for sugar milling whereas theremaining parts, e.g. leaves and tops (termed cane trash) are either open burned or used for low-end applica-tions. Sugar milling involves a series of process stages, e.g. crushing, clarification, boiling, seeding and centri-fuging to extract sugar crystals from the cane. The process leaves behind two key co-products: one is a stickyblack syrup termed molasses, the other, a straw-like residue termed bagasse. Sugar mills commonly burnbagasse to produce steam and electricity for their operation and export excess electricity to the grid.
surplus electricity to grid
ethanol
Agr
oche
mic
al p
rodu
ctio
n
Sugar cane farming - Land preparation
- Planting - Crop maintenance - Harvesting
Sugar milling (Molasses generation)
Ethanolconversion
Crude oil extraction/refining
fertilizers herbicides
cane stalks
Blending with gasoline
molasses
diesel
gasohol
Life-style support
labour
Coa
l m
inin
g/cl
eani
ng
coal
Transportation
Distribution
cane
tras
h sugar to market
biomass fuels
Open burning Low-end applications
Fig. 1. Life cycle scheme for the studied system.

724 Thu Lan T. Nguyen et al. / Applied Energy 85 (2008) 722–734
Energy data from a typical Thai sugar mill (with reference to technology, material use, energy use as well asproduct outputs) were used for the analysis.
2.2.3. Ethanol conversionThe process consists of two main steps. First, molasses upon fermentation with yeast (in the presence of
nutrients) yields dilute alcohol. Second, the fermented mash is passed through the distillation and then dehy-dration system to produce anhydrous alcohol, i.e. having 99.5% strength. The residue mash, called stillage, canbe used as fertilizer, animal feed, or further refined into biogas for energy production.
Data on this segment were obtained from an MoE factory in Thailand, representing one of the main sup-pliers to Thai oil companies. The factory employs cogeneration systems to produce both steam and electricityto meet plant energy demand. Coal represents a major part of the distillery energy requirement (59%), fol-lowed by rice husk (39%) and biogas (2%). The 2% biogas component is produced from anaerobic digestionof 12% stillage in UASB (Upflow Anaerobic Sludge Blanket) reactors. The remaining stillage is stabilized in ananaerobic pond.
2.2.4. Transportation
All materials, fuels and products involved in the MoE life cycle (see Fig. 1) are hauled by different transportfacilities through varying distances. Data were obtained mainly via personal communications. Educatedassumptions/estimations were made where necessary. A simplified flowchart of the MoE production processin Thailand is shown in Fig. 2.
2.3. Direct energy and material inputs
Direct energy and material inputs in the system are summarized in Table 1 and briefly explained as follows.
– To favour crop growth, sugar cane farmers in Thailand use a modest application of mixed fertilizers, e.g.15-15-15, 46-0-0, 21-0-0, 16-16-8. The two most common herbicides used are atrazine and ametryne.
– Land preparation by farm tractors and transportation by trucks are the two main sources of diesel con-sumption in sugar cane farming.
99.5%ethanol
Yeast, nutrients
Stillage Distillation
Dehydration Steam and electricity co-generation
Fermentation
CO2
Fossil/biomass fuels
Anaerobicdigestion
Biogas
Anaerobicpond stabilization
Molasses
Sugar cane farming Sugar milling cane stalks
Bagasse
Sugar
Surplus electricity
Steam and electricity co-generation
Supplementalbiomass fuels
Fig. 2. Simplified flowchart of molasses-based ethanol production process.
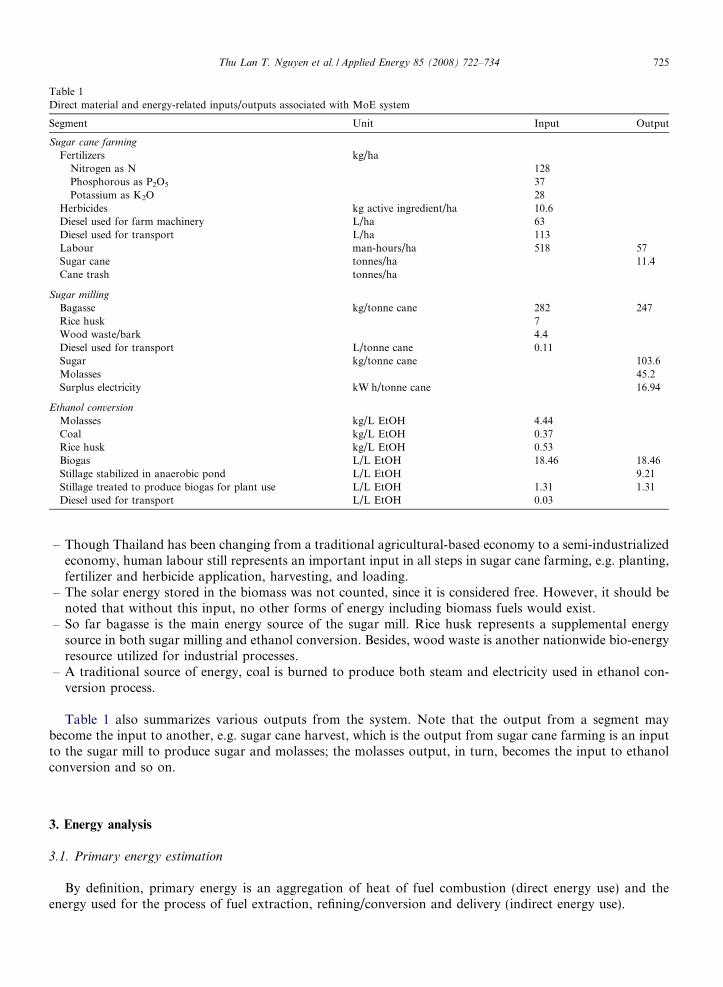
Table 1Direct material and energy-related inputs/outputs associated with MoE system
Segment Unit Input Output
Sugar cane farming
Fertilizers kg/haNitrogen as N 128Phosphorous as P2O5 37Potassium as K2O 28
Herbicides kg active ingredient/ha 10.6Diesel used for farm machinery L/ha 63Diesel used for transport L/ha 113Labour man-hours/ha 518 57Sugar cane tonnes/ha 11.4Cane trash tonnes/ha
Sugar milling
Bagasse kg/tonne cane 282 247Rice husk 7Wood waste/bark 4.4Diesel used for transport L/tonne cane 0.11Sugar kg/tonne cane 103.6Molasses 45.2Surplus electricity kW h/tonne cane 16.94
Ethanol conversion
Molasses kg/L EtOH 4.44Coal kg/L EtOH 0.37Rice husk kg/L EtOH 0.53Biogas L/L EtOH 18.46 18.46Stillage stabilized in anaerobic pond L/L EtOH 9.21Stillage treated to produce biogas for plant use L/L EtOH 1.31 1.31Diesel used for transport L/L EtOH 0.03
Thu Lan T. Nguyen et al. / Applied Energy 85 (2008) 722–734 725
– Though Thailand has been changing from a traditional agricultural-based economy to a semi-industrializedeconomy, human labour still represents an important input in all steps in sugar cane farming, e.g. planting,fertilizer and herbicide application, harvesting, and loading.
– The solar energy stored in the biomass was not counted, since it is considered free. However, it should benoted that without this input, no other forms of energy including biomass fuels would exist.
– So far bagasse is the main energy source of the sugar mill. Rice husk represents a supplemental energysource in both sugar milling and ethanol conversion. Besides, wood waste is another nationwide bio-energyresource utilized for industrial processes.
– A traditional source of energy, coal is burned to produce both steam and electricity used in ethanol con-version process.
Table 1 also summarizes various outputs from the system. Note that the output from a segment maybecome the input to another, e.g. sugar cane harvest, which is the output from sugar cane farming is an inputto the sugar mill to produce sugar and molasses; the molasses output, in turn, becomes the input to ethanolconversion and so on.
3. Energy analysis
3.1. Primary energy estimation
By definition, primary energy is an aggregation of heat of fuel combustion (direct energy use) and theenergy used for the process of fuel extraction, refining/conversion and delivery (indirect energy use).
726 Thu Lan T. Nguyen et al. / Applied Energy 85 (2008) 722–734
(a) For diesel, fuel energy content value is obtained from a national study report [14]. Input efficiency coef-ficients of fossil energy sources, adapted from [15], are then used to estimate primary energy values. Bythe same calculation procedure, the primary energy value of coal is estimated from [2,16].
(b) A majority of the agrochemicals (e.g. fertilizers, herbicides) in Thailand are imported. It is thus reason-able to take data on energy costs of these chemical products from foreign databases [17].
(c) The energy equivalent of agricultural labour in Thailand is estimated based on ‘‘Life Style SupportEnergy” method [18]. Detailed derivation of the value can be found in [19].
(d) For the surplus electricity produced in the sugar mill, a factor of 10 [19] is used to convert the amount ofelectrical energy (kW h) to thermal energy (MJ).
3.2. Fossil energy and petroleum energy use estimation
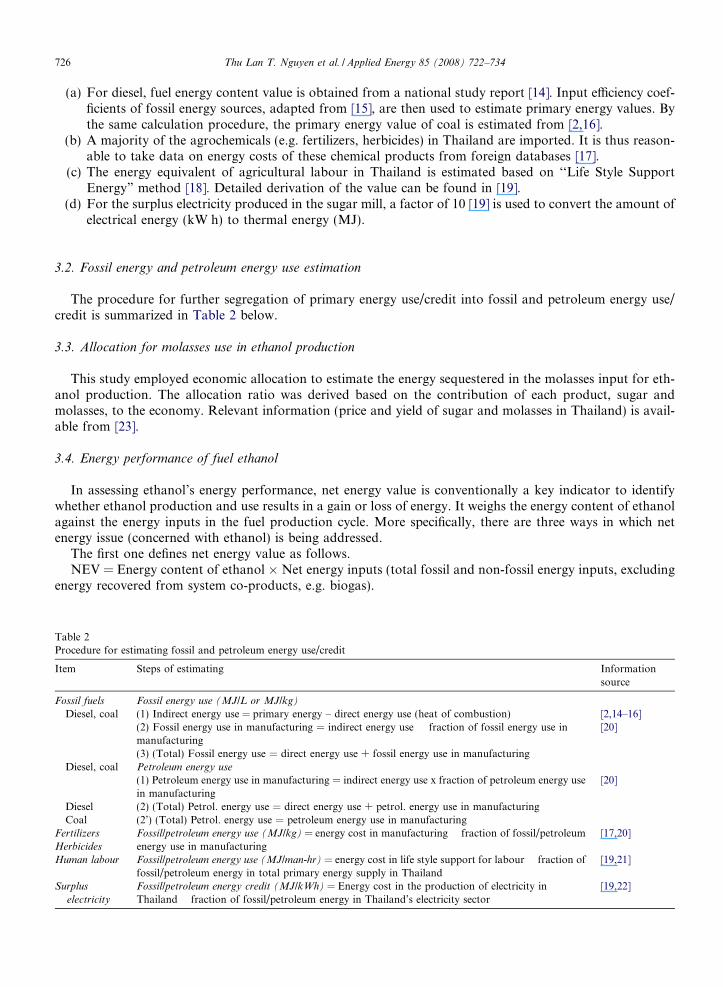
The procedure for further segregation of primary energy use/credit into fossil and petroleum energy use/credit is summarized in Table 2 below.
3.3. Allocation for molasses use in ethanol production
This study employed economic allocation to estimate the energy sequestered in the molasses input for eth-anol production. The allocation ratio was derived based on the contribution of each product, sugar andmolasses, to the economy. Relevant information (price and yield of sugar and molasses in Thailand) is avail-able from [23].
3.4. Energy performance of fuel ethanol
In assessing ethanol’s energy performance, net energy value is conventionally a key indicator to identifywhether ethanol production and use results in a gain or loss of energy. It weighs the energy content of ethanolagainst the energy inputs in the fuel production cycle. More specifically, there are three ways in which netenergy issue (concerned with ethanol) is being addressed.
The first one defines net energy value as follows.NEV = Energy content of ethanol � Net energy inputs (total fossil and non-fossil energy inputs, excluding
energy recovered from system co-products, e.g. biogas).
Table 2Procedure for estimating fossil and petroleum energy use/credit
Item Steps of estimating Informationsource
Fossil fuels Fossil energy use (MJ/L or MJ/kg)
Diesel, coal (1) Indirect energy use = primary energy – direct energy use (heat of combustion) [2,14–16](2) Fossil energy use in manufacturing = indirect energy use � fraction of fossil energy use inmanufacturing
[20]
(3) (Total) Fossil energy use = direct energy use + fossil energy use in manufacturingDiesel, coal Petroleum energy use
(1) Petroleum energy use in manufacturing = indirect energy use x fraction of petroleum energy usein manufacturing
[20]
Diesel (2) (Total) Petrol. energy use = direct energy use + petrol. energy use in manufacturingCoal (2’) (Total) Petrol. energy use = petroleum energy use in manufacturing
Fertilizers Fossil/petroleum energy use (MJ/kg) = energy cost in manufacturing � fraction of fossil/petroleumenergy use in manufacturing
[17,20]Herbicides
Human labour Fossil/petroleum energy use (MJ/man-hr) = energy cost in life style support for labour � fraction offossil/petroleum energy in total primary energy supply in Thailand
[19,21]
Surplus
electricity
Fossil/petroleum energy credit (MJ/kWh) = Energy cost in the production of electricity inThailand � fraction of fossil/petroleum energy in Thailand’s electricity sector
[19,22]
Thu Lan T. Nguyen et al. / Applied Energy 85 (2008) 722–734 727
Although energy performance has conventionally been considered using NEV, it may be more meaningfulto evaluate a biofuel’s contribution to fossil energy use reduction. Such an evaluation should address howmuch energy is gained when non-renewable fossil fuel energy is expended to produce renewable biofuels.The equation of net (renewable) energy value, thus, takes the following form.
NRnEV = Energy content of ethanol � Fossil energy inputs.Net energy addressed in this way is displayed more frequently in the form of energy ratio.ER = Energy outputs/Fossil energy inputs.As far as reducing oil use (and consequently, imports) is increasingly a critical issue, the third way considers
only the petroleum inputs to evaluate ethanol’s net energy gain.Energy credits of co-products, e.g. surplus electricity, animal feed, etc. are either dealt with as system energy
outputs [7] or process energy savings [2].
4. Results and discussion
4.1. Full chain energy analysis
4.1.1. Segmental energy analysis: sugar cane farming and sugar milling
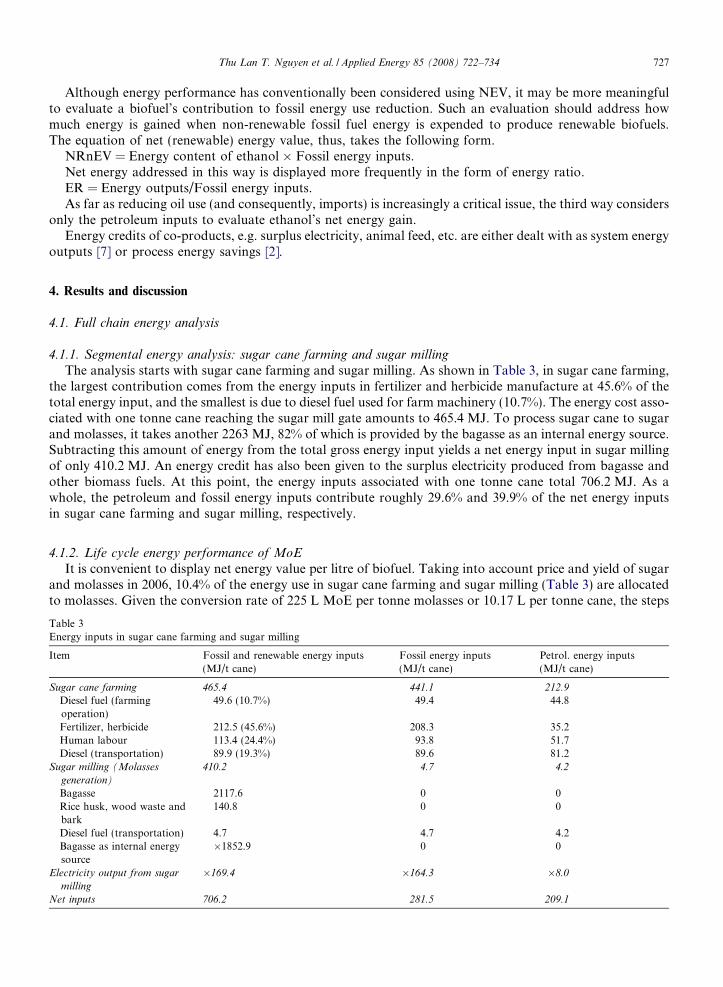
The analysis starts with sugar cane farming and sugar milling. As shown in Table 3, in sugar cane farming,the largest contribution comes from the energy inputs in fertilizer and herbicide manufacture at 45.6% of thetotal energy input, and the smallest is due to diesel fuel used for farm machinery (10.7%). The energy cost asso-ciated with one tonne cane reaching the sugar mill gate amounts to 465.4 MJ. To process sugar cane to sugarand molasses, it takes another 2263 MJ, 82% of which is provided by the bagasse as an internal energy source.Subtracting this amount of energy from the total gross energy input yields a net energy input in sugar millingof only 410.2 MJ. An energy credit has also been given to the surplus electricity produced from bagasse andother biomass fuels. At this point, the energy inputs associated with one tonne cane total 706.2 MJ. As awhole, the petroleum and fossil energy inputs contribute roughly 29.6% and 39.9% of the net energy inputsin sugar cane farming and sugar milling, respectively.
4.1.2. Life cycle energy performance of MoE
It is convenient to display net energy value per litre of biofuel. Taking into account price and yield of sugarand molasses in 2006, 10.4% of the energy use in sugar cane farming and sugar milling (Table 3) are allocatedto molasses. Given the conversion rate of 225 L MoE per tonne molasses or 10.17 L per tonne cane, the steps
Table 3Energy inputs in sugar cane farming and sugar milling
Item Fossil and renewable energy inputs(MJ/t cane)
Fossil energy inputs(MJ/t cane)
Petrol. energy inputs(MJ/t cane)
Sugar cane farming 465.4 441.1 212.9
Diesel fuel (farmingoperation)
49.6 (10.7%) 49.4 44.8
Fertilizer, herbicide 212.5 (45.6%) 208.3 35.2Human labour 113.4 (24.4%) 93.8 51.7Diesel (transportation) 89.9 (19.3%) 89.6 81.2
Sugar milling (Molasses
generation)
410.2 4.7 4.2
Bagasse 2117.6 0 0Rice husk, wood waste andbark
140.8 0 0
Diesel fuel (transportation) 4.7 4.7 4.2Bagasse as internal energysource
�1852.9 0 0
Electricity output from sugar
milling
�169.4 �164.3 �8.0
Net inputs 706.2 281.5 209.1
728 Thu Lan T. Nguyen et al. / Applied Energy 85 (2008) 722–734
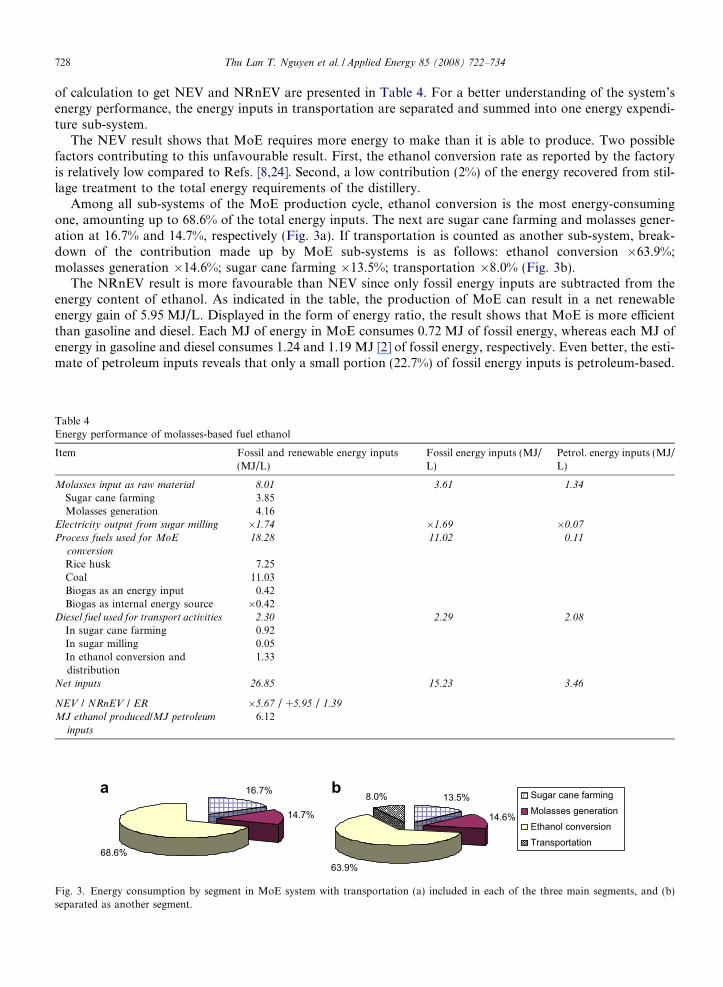
of calculation to get NEV and NRnEV are presented in Table 4. For a better understanding of the system’senergy performance, the energy inputs in transportation are separated and summed into one energy expendi-ture sub-system.
The NEV result shows that MoE requires more energy to make than it is able to produce. Two possiblefactors contributing to this unfavourable result. First, the ethanol conversion rate as reported by the factoryis relatively low compared to Refs. [8,24]. Second, a low contribution (2%) of the energy recovered from stil-lage treatment to the total energy requirements of the distillery.
Among all sub-systems of the MoE production cycle, ethanol conversion is the most energy-consumingone, amounting up to 68.6% of the total energy inputs. The next are sugar cane farming and molasses gener-ation at 16.7% and 14.7%, respectively (Fig. 3a). If transportation is counted as another sub-system, break-down of the contribution made up by MoE sub-systems is as follows: ethanol conversion �63.9%;molasses generation �14.6%; sugar cane farming �13.5%; transportation �8.0% (Fig. 3b).
The NRnEV result is more favourable than NEV since only fossil energy inputs are subtracted from theenergy content of ethanol. As indicated in the table, the production of MoE can result in a net renewableenergy gain of 5.95 MJ/L. Displayed in the form of energy ratio, the result shows that MoE is more efficientthan gasoline and diesel. Each MJ of energy in MoE consumes 0.72 MJ of fossil energy, whereas each MJ ofenergy in gasoline and diesel consumes 1.24 and 1.19 MJ [2] of fossil energy, respectively. Even better, the esti-mate of petroleum inputs reveals that only a small portion (22.7%) of fossil energy inputs is petroleum-based.
Table 4Energy performance of molasses-based fuel ethanol
Item Fossil and renewable energy inputs(MJ/L)
Fossil energy inputs (MJ/L)
Petrol. energy inputs (MJ/L)
Molasses input as raw material 8.01 3.61 1.34
Sugar cane farming 3.85Molasses generation 4.16
Electricity output from sugar milling �1.74 �1.69 �0.07
Process fuels used for MoE
conversion
18.28 11.02 0.11
Rice husk 7.25Coal 11.03Biogas as an energy input 0.42Biogas as internal energy source �0.42
Diesel fuel used for transport activities 2.30 2.29 2.08
In sugar cane farming 0.92In sugar milling 0.05In ethanol conversion anddistribution
1.33
Net inputs 26.85 15.23 3.46
NEV / NRnEV / ER �5.67 / +5.95 / 1.39
MJ ethanol produced/MJ petroleum
inputs
6.12
13.5%
14.6%
63.9%
8.0% Sugar cane farmingMolasses generationEthanol conversion Transportation
16.7%
14.7%
68.6%
a b
Fig. 3. Energy consumption by segment in MoE system with transportation (a) included in each of the three main segments, and (b)separated as another segment.
Thu Lan T. Nguyen et al. / Applied Energy 85 (2008) 722–734 729
In other words, one MJ of petroleum inputs, combined with other forms of energy, can produce 6.12 MJ ofethanol fuel.
It is expected that if by-products of the system, e.g. cane trash in sugar cane farming and stillage in ethanolconversion are utilized for energy, energy performance of MoE would improve significantly. This is examinedin Section 4.1.4.
4.1.3. Comparison with MoE production in India
A comparable case study, energy analysis of ethanol from molasses in India, was carried out by Prakashet al. [8]. The system boundary as defined in [8] includes only ethanol conversion phase. Energy consumedfor the process is derived from bagasse and biogas recovered from stillage. Subtracting the amount of energyfrom biogas, 11.27 MJ/L, from the total process energy consumption, 21.1 MJ/L, gives a net energy input of9.83 MJ/L. Thus, a positive NEV of 11.37 MJ/L (21.2–9.83) was evaluated.
The figure of 18.7 MJ (18.28 + 0.42) presented in Table 4 shows that MoE in Thailand consumes lessenergy in conversion than that in India. However, 53% of energy consumption for MoE in India is derivedfrom biogas as an internal energy source. This makes NEV of MoE in India more favourable than in Thailandwhere a large portion of energy consumption in ethanol conversion is derived from external sources, e.g., coaland rice husk. If the UASB reactor in the MoE plant in Thailand can treat 100% stillage to produce biogas forplant use with the rate of 35 m3 gas/m3 stillage (same as that in India), the NEV of the fuel (considering onlyconversion phase) becomes comparable to that of the Indian case, achieving a positive value of about10.23 MJ/L. A lower rate of stillage produced in Thailand compared to that in India, 10.5 versus 14.0 L/LMoE, explains for its slightly lower NEV.
With zero fossil energy inputs, MoE conversion in India gains more renewable energy than that in Thai-land, 21.2 versus 10.18 MJ/L.
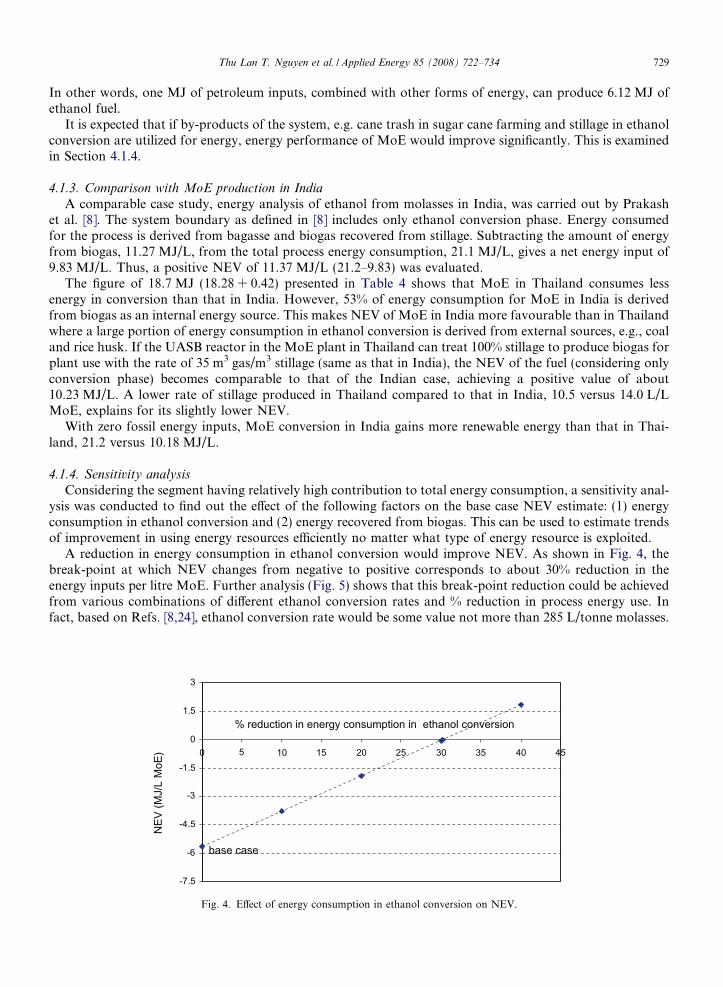
4.1.4. Sensitivity analysis
Considering the segment having relatively high contribution to total energy consumption, a sensitivity anal-ysis was conducted to find out the effect of the following factors on the base case NEV estimate: (1) energyconsumption in ethanol conversion and (2) energy recovered from biogas. This can be used to estimate trendsof improvement in using energy resources efficiently no matter what type of energy resource is exploited.
A reduction in energy consumption in ethanol conversion would improve NEV. As shown in Fig. 4, thebreak-point at which NEV changes from negative to positive corresponds to about 30% reduction in theenergy inputs per litre MoE. Further analysis (Fig. 5) shows that this break-point reduction could be achievedfrom various combinations of different ethanol conversion rates and % reduction in process energy use. Infact, based on Refs. [8,24], ethanol conversion rate would be some value not more than 285 L/tonne molasses.
-7.5
-6
-4.5
-3
-1.5
0
1.5
3
0 10 15 20 25 30 35 40 45
% reduction in energy consumption in ethanol conversion
NEV
(MJ/
L M
oE)
base case
5
Fig. 4. Effect of energy consumption in ethanol conversion on NEV.

730 Thu Lan T. Nguyen et al. / Applied Energy 85 (2008) 722–734
Evidently, bioprocess engineering nowadays makes it possible to reduce process energy demand via increas-ing ethanol productivity. One advanced method is cell immobilization which has been proved to bring prom-ising results [25–28]. Various supports for cell immobilization that can be used to improve alcoholicfermentation are alumina, mineral kissiris, alginate, delignified cellulosic materials, brewer’s spent grains, car-rageenan, and siliceous materials.
The other important factor in determining a positive or negative NEV is the magnitude of the energy recov-ered from stillage treatment via biogas. As shown in Fig. 6, if more than 34.4% of the energy requirement ofthe distillery can be satisfied by using its own source of energy derived from biogas, NEV would become posi-tive. A supporting analysis, summarized in Fig. 7, indicates that the 34.4% contribution of biogas to energydemand of ethanol conversion process can be achieved through combinations of varying proportion of spentwash treated to produce biogas and biogas conversion rate. Notable in the figure is the combination of 95–100% stillage treated to produce biogas and a conversion rate of about 26–30 m3/m3 stillage; it is feasibleand practical given a biogas recovery potential in the range of 22–30 m3/m3 stillage [29].
Considering all opportunities of by-product utilization to optimize MoE energy performance, effect ofenergy salvaged from cane trash together with 100% stillage treatment on NEV has also been examined(Fig. 8). In sugar cane production, per tonne of cane stalk harvested, there is about 200 kg cane trash left
175
200
225
250
275
300
325
0 10 15 20 25 30 35 40
% energy reduction in ethanol conversion
etha
nol c
onve
rsio
n ra
te
(L/t
mol
asse
s)
30.2% reduction in the energy input per litre ethanol
base case
285
5
Fig. 5. Break-point reduction in energy inputs per litre ethanol resulting from different combinations of % energy reduction in ethanolconversion and ethanol conversion rate.
5
-7
-5
-3
-1
1
3
5
0 10 15 20 25 30 35 40 45 50
% contribution of biogas to MoE energy consumption
NEV
(MJ/
L M
oE)
base case
Fig. 6. Effect of biogas recovered on NEV.

20
25
30
35
40
45
50
55
60
50 60 70 80 90 100
% stillage treated to produce biogas
Biog
as c
onve
rsio
n
(m3 /m
3 stil
lage
)
34.4% contribution of biogas to MoE energy consumption
Fig. 7. Break-point energy contribution of biogas recovered to ethanol conversion resulting from different combinations of % stillagetreated and biogas conversion rate.
-2
0
2
4
6
8
10
12
14
16
0 10 20 30 40
% cane trash utilized for energy
NE
V (
MJ/
L M
oE)
50
Fig. 8. Effect of energy salvaged from cane trash on NEV.
Thu Lan T. Nguyen et al. / Applied Energy 85 (2008) 722–734 731
in fields [30]. Some percentage of this biomass resource is traditionally open burned. Such disposal practice isbeing disfavoured in the sense of energy wastage and air pollution creation. The proposed measure is not toburn cane trash in fields but instead collect it for fuel, ensuring that about 50% is reserved to secure soil quality[31].
As seen, with the contribution of energy secured from stillage only, net energy inputs in the production ofethanol and its heating value are nearly balanced, i.e. NEV approaches zero. Trends of improvement areobserved with more energy salvaged from another system by-product, e.g. cane trash. The more cane trashutilized for energy, the higher the NEV of MoE. About 43% of the amount of cane trash available forMoE according to the allocation scheme, i.e. 8.9 kg/tonne cane is required to fill the gap between MoE energyrequirement and the energy recovered from 100% stillage. After this point, the excess 7% trash is assumed tobe utilized for electricity production for export to the grid resulting in an energy credit of 1.4 MJ/L MoE. Netenergy value and oil use reduction potential of MoE considering both opportunities of utilization of stillageand cane trash for energy are presented in Table 5.
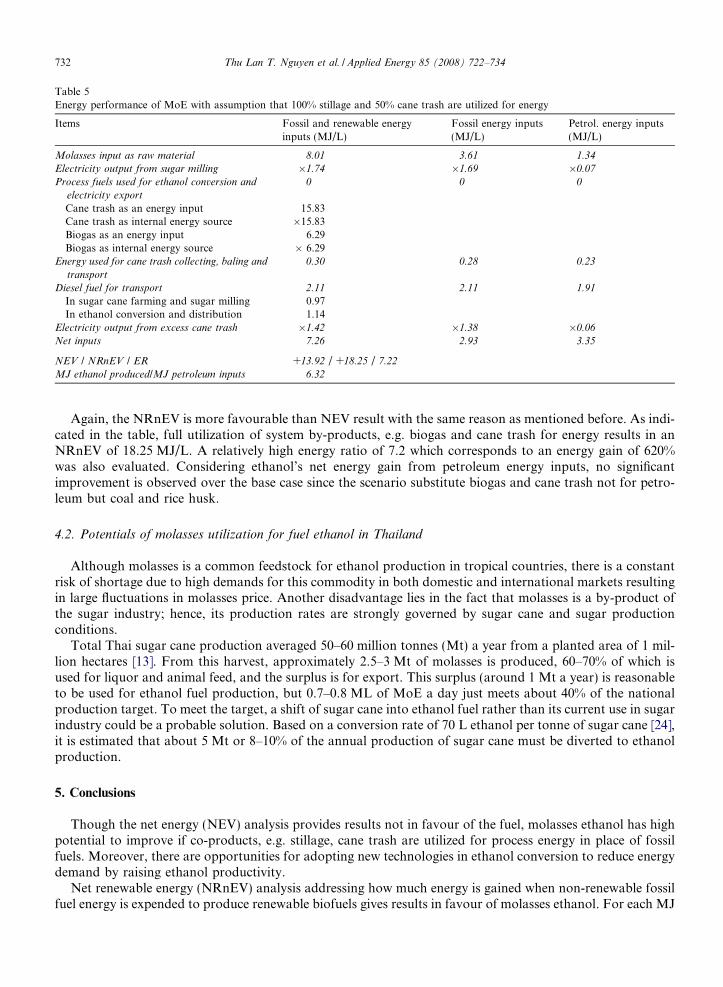
Table 5Energy performance of MoE with assumption that 100% stillage and 50% cane trash are utilized for energy
Items Fossil and renewable energyinputs (MJ/L)
Fossil energy inputs(MJ/L)
Petrol. energy inputs(MJ/L)
Molasses input as raw material 8.01 3.61 1.34
Electricity output from sugar milling �1.74 �1.69 �0.07
Process fuels used for ethanol conversion and
electricity export
0 0 0
Cane trash as an energy input 15.83Cane trash as internal energy source �15.83Biogas as an energy input 6.29Biogas as internal energy source � 6.29
Energy used for cane trash collecting, baling and
transport
0.30 0.28 0.23
Diesel fuel for transport 2.11 2.11 1.91
In sugar cane farming and sugar milling 0.97In ethanol conversion and distribution 1.14
Electricity output from excess cane trash �1.42 �1.38 �0.06
Net inputs 7.26 2.93 3.35
NEV / NRnEV / ER +13.92 / +18.25 / 7.22
MJ ethanol produced/MJ petroleum inputs 6.32
732 Thu Lan T. Nguyen et al. / Applied Energy 85 (2008) 722–734
Again, the NRnEV is more favourable than NEV result with the same reason as mentioned before. As indi-cated in the table, full utilization of system by-products, e.g. biogas and cane trash for energy results in anNRnEV of 18.25 MJ/L. A relatively high energy ratio of 7.2 which corresponds to an energy gain of 620%was also evaluated. Considering ethanol’s net energy gain from petroleum energy inputs, no significantimprovement is observed over the base case since the scenario substitute biogas and cane trash not for petro-leum but coal and rice husk.
4.2. Potentials of molasses utilization for fuel ethanol in Thailand
Although molasses is a common feedstock for ethanol production in tropical countries, there is a constantrisk of shortage due to high demands for this commodity in both domestic and international markets resultingin large fluctuations in molasses price. Another disadvantage lies in the fact that molasses is a by-product ofthe sugar industry; hence, its production rates are strongly governed by sugar cane and sugar productionconditions.
Total Thai sugar cane production averaged 50–60 million tonnes (Mt) a year from a planted area of 1 mil-lion hectares [13]. From this harvest, approximately 2.5–3 Mt of molasses is produced, 60–70% of which isused for liquor and animal feed, and the surplus is for export. This surplus (around 1 Mt a year) is reasonableto be used for ethanol fuel production, but 0.7–0.8 ML of MoE a day just meets about 40% of the nationalproduction target. To meet the target, a shift of sugar cane into ethanol fuel rather than its current use in sugarindustry could be a probable solution. Based on a conversion rate of 70 L ethanol per tonne of sugar cane [24],it is estimated that about 5 Mt or 8–10% of the annual production of sugar cane must be diverted to ethanolproduction.
5. Conclusions
Though the net energy (NEV) analysis provides results not in favour of the fuel, molasses ethanol has highpotential to improve if co-products, e.g. stillage, cane trash are utilized for process energy in place of fossilfuels. Moreover, there are opportunities for adopting new technologies in ethanol conversion to reduce energydemand by raising ethanol productivity.
Net renewable energy (NRnEV) analysis addressing how much energy is gained when non-renewable fossilfuel energy is expended to produce renewable biofuels gives results in favour of molasses ethanol. For each MJ
Thu Lan T. Nguyen et al. / Applied Energy 85 (2008) 722–734 733
of fossil energy inputs to produce molasses ethanol, there is a 39% energy gain compared to 19.5% and 15.7%loss for gasoline and diesel fuels, respectively. Even more remarkable is the figure of ethanol energy gain frompetroleum energy use, 6.12 MJ/MJ. The findings highlight the positive effect of renewable fuel production inhelping to reduce the dependence on non-renewable energy resources, notably petroleum the reserve of whichis very near exhaustion.
As per the assessment of supply potential from the surplus molasses, to meet sugar-based ethanol pro-duction target, a shift of 8–10% sugar cane produce from its current use in sugar industry to new usefor fuel ethanol appears to be a feasible solution. The use of a relatively small portion of the national sugarcane production for ethanol fuel is expected to have minor impact on sugar industry. What is in need topush integrated sugar and ethanol production in Thailand is an appropriate policy favouring a flexibleuse of sugar cane for ethanol production either directly from sugar juice or indirectly via molasses as aby-product of sugar production. The decision on the degree of substitution between the two commodities,driven by market dynamics, would help farmers and sugar millers get reasonable prices for their producesthus stabilizing their income.
Acknowledgements
The authors would like to thank all officers of the Department of Agricultural Extension in the central re-gion of Thailand for their collaboration in collecting sugar cane farming data. Thanks are also given to thesugar mill and the alcohol factory for providing relevant data on molasses generation and ethanol conversionprocess. The financial support of the Joint Graduate School of Energy and Environment, King Mongkut’sUniversity of Technology Thonburi is highly appreciated.
References
[1] Sukphisal B. Market development of biofuels in Thailand. In: Asia biomass conference, Bangkok, Thailand; December 2005.[2] Shapouri H, Duffield JA, McAloon A, Wang M. The 2001 net energy balance of corn ethanol. US Department of Agriculture; 2004.[3] Pimentel D, Patzek TW. Ethanol production using corn, switchgrass, and wood; biodiesel production using soybean and sunflower.
The limits of biomass energy. Natl Resour Res 2005;14(1):65–76.[4] Kim S, Dale BE. Allocation procedure in ethanol production system from corn grain: I. System expansion. Int J Life Cycle Assess
2002;7(4):237–43.[5] Dai D, Hu Z, Pu G, Li H, Wang CT. Energy efficiency and potentials of cassava fuel ethanol in Guangxi region of China. Energ
Convers Manage 2006;47:1686–99.[6] Hu Z, Fang F, Ben D, Pu G. Net energy, CO2 emissions, and life-cycle cost assessment of cassava-based ethanol as an alternative fuel
in China. Appl Energ 2004;78:247–56.[7] Macedo IC, Leal MRLV, Silva JEAR. Assessment of greenhouse gas emissions in the production and use of fuel ethanol in Brazil.
Secretariat of the Environment, Government of the State of Sao Paulo; 2004.[8] Prakash R, Henham A, Bhat IK. Net energy and gross pollution from bio-ethanol production. Fuel 1998;77(14):1629–33.[9] Thomas V, Kwong A. Ethanol as a lead replacement: phasing out leaded gasoline in Africa. Energ Policy 2001;29:1133–43.
[10] Ando M. Present situations and improvements of upland farm management – Focusing on sugar cane production – JIRCAS WorkingReport 2002;30:95–101.
[11] Matsuo K, Wonwiwatchai C, Yashiro M. Alternative tillage system for soil conservation, enhancement of crop growth and increasingworking efficiency. JIRCAS Working Report 2002;30:111–119.
[12] Srijantr T, Molle F, Chompadist C. Profitability and yield gap of sugar cane cultivation in the Mae Klong region. Thai Agri Econ J2002;18:53–69.
[13] OAE (Office of Agriculture Economics). Agricultural Statistics of Thailand. Center for agricultural information, Office of AgriculturalEconomics, Ministry of Agriculture and Cooperatives, Agricultural Statistics; 2006.
[14] TEI (Thailand Environment Institute). Fossil fuel production and refinery LCI (2001). Bangkok, Thailand; 2001.[15] IFAS (Institute of Food and Agricultural Sciences). The energy information handbook. Florida Cooperative Extension Service.
University of Florida; 1991.[16] American Embassy Jakarta. Coal Report Indonesia 2000. Coal Sector Report Indonesia 2000. Embassy of the United States of
America Jakarta; 2000. <http://www.usembassyjakarta.org/download/coal2000.pdf>.[17] Helsel ZR. Energy and alternatives for fertilizer and pesticide use. In: Fluck RC, editor. Energy in farm production. Energy in world
agriculture, vol. 6. Amsterdam: Elsevier; 1992. p. 177–201.[18] Odum HT. Systems ecology. New York: Wiley; 1983, p. 476–507.[19] Nguyen TLT, Gheewala SH, Garivait S. Full chain energy analysis of fuel ethanol from cassava in Thailand. Environ Sci Technol
2007;41(11):4135–42.

734 Thu Lan T. Nguyen et al. / Applied Energy 85 (2008) 722–734
[20] Wang M. Greet 1.7 Beta – Transportation fuel cycle model. US Department of Energy, Argonne National Laboratory, Argonne,Illinois, 2006.
[21] IEA (International Energy Agency). Share of Total Primary Energy Supply in 2003. Thailand – International Energy Agency EnergyStatistics; 2005. <http://iea.org/textbase/stats/pdf_graphs/THTPESPl-pdf>.
[22] DEDE (The Department of Alternative Energy Development and Efficiency) Thailand Energy Statistics 2004. Bangkok, Thailand;2004. <http://www2.dede.go.th/dede/report/TES2004.pdf>.
[23] Prasertsri P. Thailand Sugar Semi-Annual 2006. USDA Foreign Agricultural Service – Gain Report – Global Agriculture InformationNetwork; 2006. <http://www.stat-usa.gov/agworld.nsf/505c55d16b88351a852567010058449b/772c894989a268b4852571fc006f3f92/$FILE/TH6099.PDF>.
[24] DEDE (The Department of Alternative Energy Development and Efficiency). Renewable Energy in Thailand: Ethanol and Biodiesel.The Department of Alternative Energy Development and Efficiency, Ministry of Energy; 2004.
[25] Loukatos P, Kanellaki M, Komaitis M, Athanasiadis I, Koutinas A. A new technological approach proposed for distillate productionusing immobilized cells. J Biosci Bioeng 2003;95(1):35–9.
[26] Kopsahelisa N, Kanellakia M, Bekatorou A. Low temperature brewing using cells immobilized on brewer’s spent grains. Food Chem2007;104(2):480–8.
[27] Kazuo M, Michiko K. Ethanol fermentation of immobilized yeast cells in a rotating basket bioreactor. Bulletin of Tokyo KaseiUniversity. Nat Sci 2000;40:167–72.
[28] Karandikar S, Prabhune A, Kalele SA, Gosavi SW, Kulkarni SK. Immobilization of thermotolerant Kluyveromyces marxianus onsilica aerogel for continuous production of invert syrup. Res J Biotechnol 2006;1(2):16–9.
[29] Gupta BP. Status of biomethanation development in India. World J Microbiol Biotechnol 1998;4:95–8.[30] Methacanon P. Raw materials available in Thailand. InnoBioPlast, Bangkok, Thailand; 21–24 September 2006.[31] Gabra M. Sugarcane residual fuels – a viable substitute for fossil fuels in the Tanzanian sugar industry. Renew Energ Develop
1995;8(2):5–6.