Taxis assays measure directional movement of mosquitoes to olfactory cues
Upload
independentCategory
view
3download
0
Life cycle assessment as a policy-support tool: The case of taxisin the city of Madrid
Michel Vedrenne n, Javier Pérez, Julio Lumbreras, María Encarnación RodríguezDepartment of Chemical & Environmental Engineering, Technical University of Madrid, (UPM), c/ José Gutiérrez Abascal 2, 28006 Madrid, Spain
H I G H L I G H T S
� The potential of Life Cycle Assessment for policy-support activities was examined.� A recently-adopted initiative within the local air quality plan was analyzed.� The air-quality plan reduced 13% climate change and 25% ozone related impacts.� The greenest scenario reduces 34% climate change and 59% ozone related impacts.� The use phase is crucial and impacts depend on fuel, technology and zone.
a r t i c l e i n f o
Article history:Received 22 July 2013Received in revised form23 September 2013Accepted 29 October 2013Available online 21 November 2013
Keywords:Life cycle assessmentRoad trafficAir pollutionDecision supportPolicy
a b s t r a c t
This paper examined the potentialities of Life Cycle Assessment (LCA) as instrument for policy-support.To this respect, the adoption of an initiative within the Madrid Air Quality Plan (AQP) 2011–2015regarding the substitution of diesel taxis with hybrid, natural gas and LPG alternatives was studied. Fourdifferent scenarios were elaborated, a business-as-usual scenario (BAU), the scenario of the AQP, and twoextreme-situation scenarios: all-diesel (ADI) and all-ecologic (AEC). Impacts were characterized accord-ing to the ILCD methodology, focusing especially on climate change (CC) and photochemical ozoneformation (PO). SimaPro 7.3 was used as analysis and inventory-construction tool. The results indicatethat the shift to ecologic alternatives reduced impacts, especially those related to CC and PO. For thecomplete life cycle, reductions of 13% (CC) and 25% (PO) were observed for AQP against BAU (CC:1365GgCO2, PO:13336 MgNMVOC). Deeper reductions were observed for AEC (CC:34%, PO:59%), while ADIproduced slight increases in impacts if against BAU. The analysis of the use-phase revealed that thecentral and highest speed zones of the city benefit from the adoption of AQP. This is especially evident inzone 7, with reductions of 16% in CC and 31% in PO respectively against BAU (CCzone1:3443 kgCO2/veh � km,POzone7:11.1 kgNMVOC/veh � km).
& 2013 Elsevier Ltd. All rights reserved.
1. Introduction
In the last decades, LCA has been intensely used as a corporatestrategic planning instrument, especially destined to promoteproducts and services as eco-friendly. However, this trend hasbeen seldom followed by governments, which usually concentrateactions on tackling problems at isolated life cycle stages. This isusually a consequence of the still-frequent tendency for sectoralpublic planning, which is reputed of being an obstacle for meetingsustainability goals (Thabrew et al., 2009).
The management of the road transportation sector at the urbanlevel is a complex decision process with numerous implications
on the local energy planning, air and acoustic pollution levels,mobility, and life quality levels. As a consequence, the quantifica-tion of its environmental impacts has been a long-standing issuein science and policy circles (Granovskii et al., 2006; Romm, 2006;DeCicco, 2013; Seckin et al., 2013). To this respect, LCA has beenwidely used in the evaluation of the environmental suitability ofdifferent transportation options, powertrains, fuels or vehicletechnologies (Hackney and de Neufville, 2001; Spielmann andAlthaus, 2007; van Vliet et al., 2010; Nanaki and Koroneos, 2013;Köhler et al., 2013). The extension of the same evaluation frame-work to taxi fleets has been already published in Mourato et al.(2004) and Baptista et al. (2011). In general, most of these studiesanalyzed the performance of different models of under a LCAperspective and concluded that cleaner alternatives such ashybrid, electric or gas vehicles are more sustainable than tradi-tional fossil-fuel cars (Granovskii et al., 2006).
Contents lists available at ScienceDirect
journal homepage: www.elsevier.com/locate/enpol
Energy Policy
0301-4215/$ - see front matter & 2013 Elsevier Ltd. All rights reserved.http://dx.doi.org/10.1016/j.enpol.2013.10.073
n Corresponding author. Tel.: þ34 913363203; fax: þ34 913363009.E-mail addresses: [email protected],
[email protected] (M. Vedrenne).
Energy Policy 66 (2014) 185–197

The main objective of this paper is to discuss the convenienceof a recently-adopted environmental decision in the city of Madridregarding the renovation of the taxi fleet. This decision wasanalyzed under a detailed “cradle-to-grave” perspective, usingLCA as an analysis tool and focusing on the transport sector ofthe city as a whole. The analysis addressed in this work seeks to bemore than a declaration of eco-friendliness: it intends to evaluatethe effectiveness of a concrete initiative under the specific condi-tions of Madrid. Moreover, it seeks to provide guidance on the useof LCA for policy-support and on the suitability of referring anyresults to a particular reality.
2. Case study
The city of Madrid is currently affected by levels of NO2 whichexceed the limit value laid down in EU legislation in consequenceof an overwhelming road-traffic sector (Vedrenne et al., 2011;Ayuntamiento de Madrid (AM), 2013). As with other southernEuropean cities, the local commitment to reduce the average CO2
emissions of vehicles in order to prevent climate change resultedin an important dieselization of the fleet, which is an additionalcause of the current NO2 levels in the city (Kassomenos et al.,2006; Baptista et al., 2012). This dieselization process was parti-cularly evident in the taxi sector, which currently accounts for14.8% of the local emissions of nitrogen oxides (NOx). As aconsequence, the city has not been complying with the NO2 limitvalues specified by Directive 2008/50/EC since 2010 (EuropeanComission (EC), 2008).
In April 2012, the government of Madrid approved a series ofgrants to foster the incorporation of less polluting cars to the city'staxi fleet. This decision was part of an ambitious local AQP that willculminate in 2015, aimed mainly to reduce nitrogen dioxide (NO2)levels and carbon dioxide (CO2) emissions (Ayuntamiento deMadrid (AM), 2012). The fleet renovation program was includedin the set of measures that the city pledged to adopt in orderto obtain from the European Commission an extension in themeeting of the NO2 limits stipulated by Directive 2008/50/EC.
The measure urged taxi owners to switch from diesel-fuelled carsto gasoline-hybrid, liquefied petroleum gases (LPG) or compressednatural gas (CNG) vehicles. The reception of the decision by thepublic was positive and towards the end of 2012, the ecologicvehicles of Toyota and SEAT accounted for almost 48% of the totalsales for the taxi sector (Asociación Española de Fabricantes deAutomóviles y Camiones (ANFAC), 2012).
The evaluation of this measure consisted in a LCA of thecomplete taxi fleet of the city of Madrid, focusing on the respectivecycles of the fuel and the materials (vehicle) to further analyze theresulting effects under an impact-evaluation methodology. At thispoint, the consequences of the measure cannot be easily evaluateddue to its recent adoption and the final outcome might beconditioned by the penetration of other technologies, priceincreases or by the suspension of the funding due to budgetshortages. To this respect, a group of scenarios was definedassuming different hypotheses to better illustrate the effects ofthe measure. The characterization of the complete life cycle wascarried out with detailed information, and depending on the stage,with information supplied directly by local authorities. In thefollowing sections, the description of the methodology, datasets,assumptions and evaluation tools is made.
3. Methodology and datasets
3.1. System definition
The system was modeled by trying to include all the phasessusceptible of being affected by the renovation of Madrid's taxifleet (Fig. 1). As it was already stated in Section 2, we divided theentire life cycle of the vehicles in the following parts:
– Fuel life cycle. Composed by the following phases: (i) crudeexploration and production processes, (ii) transportation to therefinery, (iii) conversion and refining, (iv) storage and trans-portation to the distribution centers and (v) the vehicle in-use
Fig. 1. Schematic representation of a taxi fleet life cycle.
M. Vedrenne et al. / Energy Policy 66 (2014) 185–197186
or tank-to-wheels (TtW) phase. The first four phases are alsoknown as the well-to-tank phase (WtT).
– Material life cycle. This comprises (i) the extraction and produc-tion of raw materials, (ii) the manufacturing of the vehicle, (iii)its transportation to the sale point and (iv) the use-phase. Theend-of-life phase is not considered due to its high dependencyon the actual practice in real life and because there is a limitedamount of data on this phase with large variability in openliterature (Ma et al., 2012).
Due to the lack of information, the building and dismantlingprocess of the extraction, distribution, production and sales facil-ities as well as roads and other urban infrastructures were notconsidered. In the same line, vehicle and infrastructure (pumps,vessels, pipelines, etc.) maintenance operations, as well as thespare parts' supply chain were not taken into consideration (Garget al., 2013).
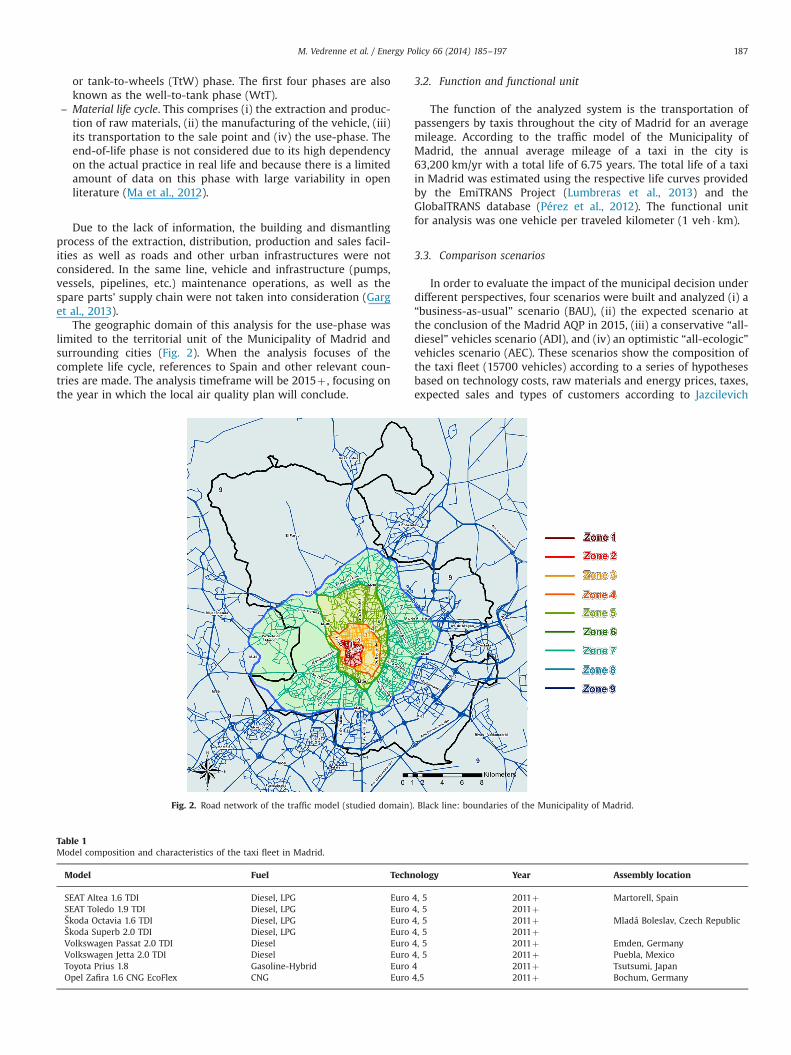
The geographic domain of this analysis for the use-phase waslimited to the territorial unit of the Municipality of Madrid andsurrounding cities (Fig. 2). When the analysis focuses of thecomplete life cycle, references to Spain and other relevant coun-tries are made. The analysis timeframe will be 2015þ , focusing onthe year in which the local air quality plan will conclude.
3.2. Function and functional unit
The function of the analyzed system is the transportation ofpassengers by taxis throughout the city of Madrid for an averagemileage. According to the traffic model of the Municipality ofMadrid, the annual average mileage of a taxi in the city is63,200 km/yr with a total life of 6.75 years. The total life of a taxiin Madrid was estimated using the respective life curves providedby the EmiTRANS Project (Lumbreras et al., 2013) and theGlobalTRANS database (Pérez et al., 2012). The functional unitfor analysis was one vehicle per traveled kilometer (1 veh �km).
3.3. Comparison scenarios
In order to evaluate the impact of the municipal decision underdifferent perspectives, four scenarios were built and analyzed (i) a“business-as-usual” scenario (BAU), (ii) the expected scenario atthe conclusion of the Madrid AQP in 2015, (iii) a conservative “all-diesel” vehicles scenario (ADI), and (iv) an optimistic “all-ecologic”vehicles scenario (AEC). These scenarios show the composition ofthe taxi fleet (15700 vehicles) according to a series of hypothesesbased on technology costs, raw materials and energy prices, taxes,expected sales and types of customers according to Jazcilevich
Fig. 2. Road network of the traffic model (studied domain). Black line: boundaries of the Municipality of Madrid.
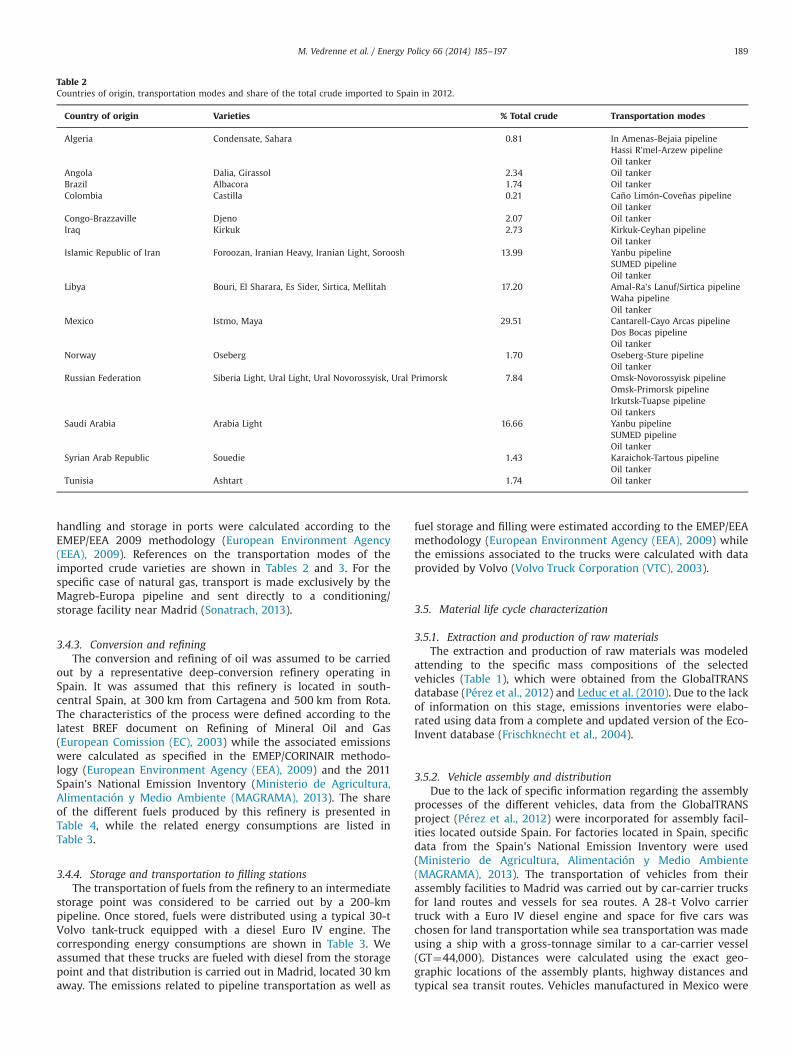
Table 1Model composition and characteristics of the taxi fleet in Madrid.
Model Fuel Technology Year Assembly location
SEAT Altea 1.6 TDI Diesel, LPG Euro 4, 5 2011þ Martorell, SpainSEAT Toledo 1.9 TDI Diesel, LPG Euro 4, 5 2011þŠkoda Octavia 1.6 TDI Diesel, LPG Euro 4, 5 2011þ Mladá Boleslav, Czech RepublicŠkoda Superb 2.0 TDI Diesel, LPG Euro 4, 5 2011þVolkswagen Passat 2.0 TDI Diesel Euro 4, 5 2011þ Emden, GermanyVolkswagen Jetta 2.0 TDI Diesel Euro 4, 5 2011þ Puebla, MexicoToyota Prius 1.8 Gasoline-Hybrid Euro 4 2011þ Tsutsumi, JapanOpel Zafira 1.6 CNG EcoFlex CNG Euro 4,5 2011þ Bochum, Germany
M. Vedrenne et al. / Energy Policy 66 (2014) 185–197 187

et al. (2011) and Propfe et al. (2013). For the construction of thesescenarios, a model-specific taxi fleet with 15,708 vehicles wasprovided by the Municipality of Madrid for 2011. The mostrepresentative models and years for every considered fuel typeare shown in Table 1 and Fig. 3. No new incorporations to the fleetor changes due to breakdowns or accidents were consideredwhatsoever.
For this study case, BAU considers that the taxi composition in2015 is a consequence of the normal evolution of the vehicle fleetaccording to a usual market-flow. This scenario has a limited shareof the so-called ecologic alternatives, being diesel vehicles highlypredominant (Fig. 3). AQP corresponds to the composition ofthe taxi fleet forecasted by the Municipality of Madrid in itsAQP and, in a strict sense it should reflect realistically the pene-tration-degree of the initiative under normal circumstances(Ayuntamiento de Madrid (AM), 2012). Compared to BAU, thisscenario considers an important share of hybrid vehicles and aslightly larger penetration of LPG and CNG technologies. ADIconsiders that every taxi is diesel-fueled (Fig. 3), trying toreproduce a situation of failure of the environmental initiativeand can be considered as a “worst-case scenario”. Conversely, AECreproduces a situation of success of the initiative in which all thetaxis belong to the ecologic alternatives supported by the envir-onmental initiative, reflecting the best feasible scenario (Fig. 3).
3.4. Fuel life cycle characterization
3.4.1. Crude exploration and productionThe crude exploration and production phase was characterized
attending to the oil varieties that are imported to Spain. Table 2contains information on the share of the different oil-exporting
countries to the total crude purchased in 2012 (Corporación deReservas Estratégicas de Productos Petrolíferos (CORES), 2011).These origins and shares were the same for every fuel consumedin Spanish territory and kept constant during the entire periodof analysis. Information regarding airborne1 emissions of theexploration, drilling and extraction operations was taken fromthe International Association of Oil and Gas Producers for on-shoreand off-shore operations in the respective countries (InternationalAssociation of Oil and Gas Producers (OGP), 2010). Energy con-sumptions associated to this stage are listed in Table 3.
3.4.2. Transportation to refineryThe transportation of the different crude varieties from their
respective sources to Spanish territory was carried out either by oiltankers or pipelines. Crude oil was received at the ports of Rota orCartagena depending on the transport routes and sent to therefinery through two pipelines (Repsol, 2012). In every case, routeswere calculated using the exact geographic locations of wells,pipelines and marine terminals (Libyan NOC, 2012; Lukoil, 2012;Pemex, 2013; Saudi-Aramco, 2013; Sonatrach, 2013; Statoil, 2012;Total-E&P Congo, 2008; Total-E&P Sonangol, 2005). Information onthe 2012 vessel fleet, such as name, flag of registry, average speed,gross tonnage, and dead weight was available as well as the routesand crude varieties carried by each of the tankers (Corporación deReservas Estratégicas de Productos Petrolíferos (CORES), 2011;Puertos del Estado, 2011). Energy consumptions associated topipelines have been estimated as in Menegaki (2011). Emissionsrelated to maritime and pipeline transportations as well as
Fig. 3. Vehicle composition by model and fuel in the four 2015 scenarios. Total number of taxis: 15,700 vehicles.
1 The term “emissions” hereinafter refers only to those of airborne nature.
M. Vedrenne et al. / Energy Policy 66 (2014) 185–197188
handling and storage in ports were calculated according to theEMEP/EEA 2009 methodology (European Environment Agency(EEA), 2009). References on the transportation modes of theimported crude varieties are shown in Tables 2 and 3. For thespecific case of natural gas, transport is made exclusively by theMagreb-Europa pipeline and sent directly to a conditioning/storage facility near Madrid (Sonatrach, 2013).
3.4.3. Conversion and refiningThe conversion and refining of oil was assumed to be carried
out by a representative deep-conversion refinery operating inSpain. It was assumed that this refinery is located in south-central Spain, at 300 km from Cartagena and 500 km from Rota.The characteristics of the process were defined according to thelatest BREF document on Refining of Mineral Oil and Gas(European Comission (EC), 2003) while the associated emissionswere calculated as specified in the EMEP/CORINAIR methodo-logy (European Environment Agency (EEA), 2009) and the 2011Spain's National Emission Inventory (Ministerio de Agricultura,Alimentación y Medio Ambiente (MAGRAMA), 2013). The shareof the different fuels produced by this refinery is presented inTable 4, while the related energy consumptions are listed inTable 3.
3.4.4. Storage and transportation to filling stationsThe transportation of fuels from the refinery to an intermediate
storage point was considered to be carried out by a 200-kmpipeline. Once stored, fuels were distributed using a typical 30-tVolvo tank-truck equipped with a diesel Euro IV engine. Thecorresponding energy consumptions are shown in Table 3. Weassumed that these trucks are fueled with diesel from the storagepoint and that distribution is carried out in Madrid, located 30 kmaway. The emissions related to pipeline transportation as well as
fuel storage and filling were estimated according to the EMEP/EEAmethodology (European Environment Agency (EEA), 2009) whilethe emissions associated to the trucks were calculated with dataprovided by Volvo (Volvo Truck Corporation (VTC), 2003).
3.5. Material life cycle characterization
3.5.1. Extraction and production of raw materialsThe extraction and production of raw materials was modeled
attending to the specific mass compositions of the selectedvehicles (Table 1), which were obtained from the GlobalTRANSdatabase (Pérez et al., 2012) and Leduc et al. (2010). Due to the lackof information on this stage, emissions inventories were elabo-rated using data from a complete and updated version of the Eco-Invent database (Frischknecht et al., 2004).
3.5.2. Vehicle assembly and distributionDue to the lack of specific information regarding the assembly
processes of the different vehicles, data from the GlobalTRANSproject (Pérez et al., 2012) were incorporated for assembly facil-ities located outside Spain. For factories located in Spain, specificdata from the Spain's National Emission Inventory were used(Ministerio de Agricultura, Alimentación y Medio Ambiente(MAGRAMA), 2013). The transportation of vehicles from theirassembly facilities to Madrid was carried out by car-carrier trucksfor land routes and vessels for sea routes. A 28-t Volvo carriertruck with a Euro IV diesel engine and space for five cars waschosen for land transportation while sea transportation was madeusing a ship with a gross-tonnage similar to a car-carrier vessel(GT¼44,000). Distances were calculated using the exact geo-graphic locations of the assembly plants, highway distances andtypical sea transit routes. Vehicles manufactured in Mexico were
Table 2Countries of origin, transportation modes and share of the total crude imported to Spain in 2012.
Country of origin Varieties % Total crude Transportation modes
Algeria Condensate, Sahara 0.81 In Amenas-Bejaia pipelineHassi R'mel-Arzew pipelineOil tanker
Angola Dalia, Girassol 2.34 Oil tankerBrazil Albacora 1.74 Oil tankerColombia Castilla 0.21 Caño Limón-Coveñas pipeline
Oil tankerCongo-Brazzaville Djeno 2.07 Oil tankerIraq Kirkuk 2.73 Kirkuk-Ceyhan pipeline
Oil tankerIslamic Republic of Iran Foroozan, Iranian Heavy, Iranian Light, Soroosh 13.99 Yanbu pipeline
SUMED pipelineOil tanker
Libya Bouri, El Sharara, Es Sider, Sirtica, Mellitah 17.20 Amal-Ra's Lanuf/Sirtica pipelineWaha pipelineOil tanker
Mexico Istmo, Maya 29.51 Cantarell-Cayo Arcas pipelineDos Bocas pipelineOil tanker
Norway Oseberg 1.70 Oseberg-Sture pipelineOil tanker
Russian Federation Siberia Light, Ural Light, Ural Novorossyisk, Ural Primorsk 7.84 Omsk-Novorossyisk pipelineOmsk-Primorsk pipelineIrkutsk-Tuapse pipelineOil tankers
Saudi Arabia Arabia Light 16.66 Yanbu pipelineSUMED pipelineOil tanker
Syrian Arab Republic Souedie 1.43 Karaichok-Tartous pipelineOil tanker
Tunisia Ashtart 1.74 Oil tanker
M. Vedrenne et al. / Energy Policy 66 (2014) 185–197 189
sent to Vigo from Tampico, while those manufactured in Japanwere sent to the Barcelona from Yokohama.
3.6. Electricity
The electricity mixes of each of the countries involved in anystage of either the fuel or the material life cycles were
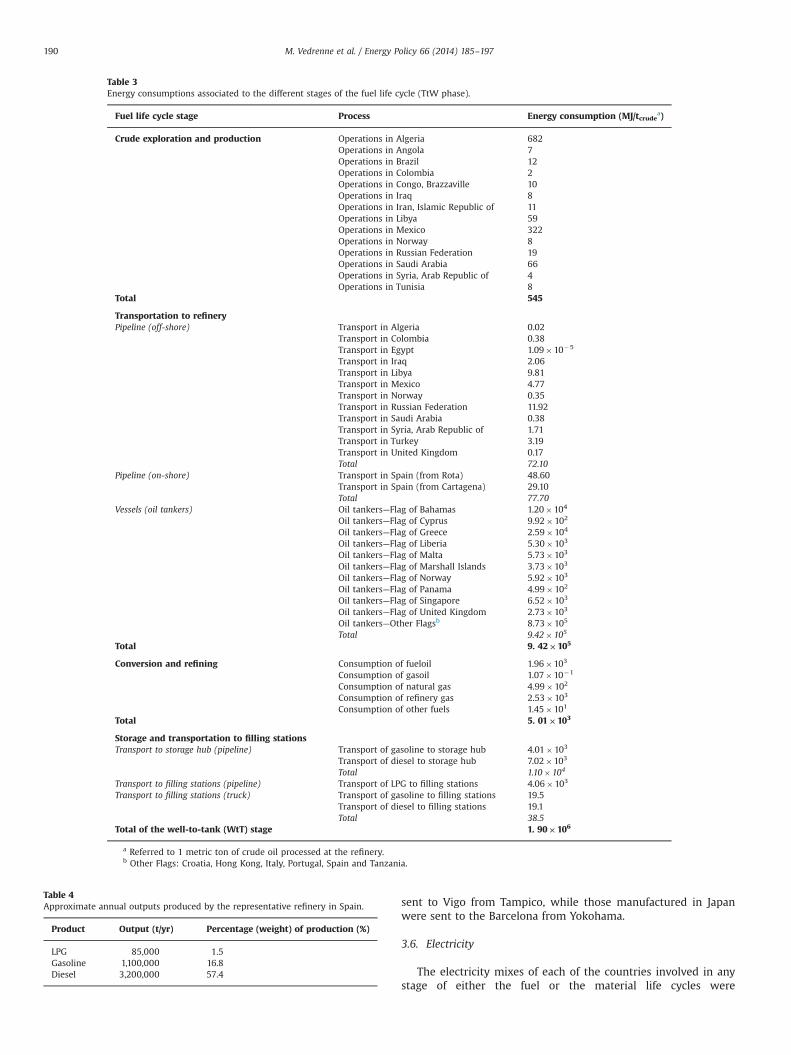
Table 3Energy consumptions associated to the different stages of the fuel life cycle (TtW phase).
Fuel life cycle stage Process Energy consumption (MJ/tcrudea)
Crude exploration and production Operations in Algeria 682Operations in Angola 7Operations in Brazil 12Operations in Colombia 2Operations in Congo, Brazzaville 10Operations in Iraq 8Operations in Iran, Islamic Republic of 11Operations in Libya 59Operations in Mexico 322Operations in Norway 8Operations in Russian Federation 19Operations in Saudi Arabia 66Operations in Syria, Arab Republic of 4Operations in Tunisia 8
Total 545
Transportation to refineryPipeline (off-shore) Transport in Algeria 0.02
Transport in Colombia 0.38Transport in Egypt 1.09�10�5
Transport in Iraq 2.06Transport in Libya 9.81Transport in Mexico 4.77Transport in Norway 0.35Transport in Russian Federation 11.92Transport in Saudi Arabia 0.38Transport in Syria, Arab Republic of 1.71Transport in Turkey 3.19Transport in United Kingdom 0.17Total 72.10
Pipeline (on-shore) Transport in Spain (from Rota) 48.60Transport in Spain (from Cartagena) 29.10Total 77.70
Vessels (oil tankers) Oil tankers—Flag of Bahamas 1.20�104
Oil tankers—Flag of Cyprus 9.92�102
Oil tankers—Flag of Greece 2.59�104
Oil tankers—Flag of Liberia 5.30�103
Oil tankers—Flag of Malta 5.73�103
Oil tankers—Flag of Marshall Islands 3.73�103
Oil tankers—Flag of Norway 5.92�103
Oil tankers—Flag of Panama 4.99�102
Oil tankers—Flag of Singapore 6.52�103
Oil tankers—Flag of United Kingdom 2.73�103
Oil tankers—Other Flagsb 8.73�105
Total 9.42� 105
Total 9. 42�105
Conversion and refining Consumption of fueloil 1.96�103
Consumption of gasoil 1.07�10�1
Consumption of natural gas 4.99�102
Consumption of refinery gas 2.53�103
Consumption of other fuels 1.45�101
Total 5. 01�103
Storage and transportation to filling stationsTransport to storage hub (pipeline) Transport of gasoline to storage hub 4.01�103
Transport of diesel to storage hub 7.02�103
Total 1.10� 104
Transport to filling stations (pipeline) Transport of LPG to filling stations 4.06�103
Transport to filling stations (truck) Transport of gasoline to filling stations 19.5Transport of diesel to filling stations 19.1Total 38.5
Total of the well-to-tank (WtT) stage 1. 90�106
a Referred to 1 metric ton of crude oil processed at the refinery.b Other Flags: Croatia, Hong Kong, Italy, Portugal, Spain and Tanzania.
Table 4Approximate annual outputs produced by the representative refinery in Spain.
Product Output (t/yr) Percentage (weight) of production (%)
LPG 85,000 1.5Gasoline 1,100,000 16.8Diesel 3,200,000 57.4
M. Vedrenne et al. / Energy Policy 66 (2014) 185–197190

characterized using the 2012 national electricity consumptionsfrom the International Energy Agency (International EnergyAgency (IAE), 2012) and power-generation emissions estimatedfor the same year by the Emissions Database for Global Atmo-spheric Research (EDGAR) (Janssens-Maenhout et al., 2012). Addi-tional considerations regarding electricity consumption patternswere made as published in Koroneos and Nanaki, (2007). TheSpanish electricity mix was estimated with data coming from the2011 Spain's National Emission Inventory (Ministerio deAgricultura, Alimentación y Medio Ambiente (MAGRAMA), 2013)and the National Energy Outlook (Ministerio de Industria, Energíay Turismo (MINETUR), 2012).
3.7. Use-phase characterization
The before mentioned fuel and material life cycles converge atthe vehicle use-phase (TtW), which was modeled paying specialattention to the specific conditions of the city as well as theparticularities of the vehicle fleet. It is well known that exhaustemissions are a function of the attributes (i.e. fuel type, engine,technology) of the different vehicle types and of the drivingconditions (Ntziachristos and Samaras, 2001).
To this respect, the calculation of fuel-consumptions and road-traffic emissions factors was carried out with COPERT 4 v.10(Ntziachristos et al., 2009), which is an average speed modelconsidering three different driving patterns (rural, urban andmotorway). The decision of using COPERT was made in order tobe consistent with the EMEP/CORINAIR methodology, alreadyapplied in the quantification of emissions of other life cycle stages(Sections 3.4.2 and 3.4.3). Its adequateness to the particularconditions of Madrid has already been contrasted against observa-tions in other studies (Vedrenne et al., 2011; Borge et al., 2012,2014). This model was fed with information from the traffic modelof the Municipality of Madrid which is a macroscopic simulationmodel for dynamic equilibrium traffic assignment supported by a
Geographic Information System (GIS) where the road network ofthe metropolitan area of Madrid is represented by 14,938 roadsand divided into nine different management zones (Fig. 1) (Borgeet al., 2012). These zones have been separated according to vehicleflows, mean speeds and management importance in the city; threeof them correspond to specific ways/circuits while the remainingsix are geographic areas that enclose the rest of the road network(Table 5). No mobility or road infrastructure changes were con-sidered whatsoever.
3.8. Impact characterization and allocation
The characterization of impacts in this study was carried out atthe midpoint level according to the International Reference LifeCycle Data System (ILCD) methodology (2011 Midpoint V1.01) andonly for those impact categories closely related to the air qualitysituation in Madrid: acidification (AC), climate change (CC),particulate matter (PM), photochemical ozone formation (PO)and terrestrial eutrophication (TE) (European Comission (EC),2011). Impact allocation procedures were carried out only for theWtT stages, namely crude extraction, fuel transportation and fuelrefining. The allocation criterion was the percentage (in weight) ofthe produced fuels by the refinery in 2012 (Table 4).
3.9. Analysis tools
The analysis was carried out according to the InternationalStandards Organization (ISO) 14040 and 14044 regarding life cycleassessment standards, data reductions and allocation procedures.To guarantee consistency and a good practice, the SimaPro 7.3 soft-ware for LCA was extensively used. SimaPro is a process-basedinventory model marketed as a user-friendly software interfacethat allows data assembled by the user in order to conductenvironmental impact and life cycle analyses (Garg et al., 2013).
Table 5Characteristics of the traffic management zones in the city of Madrid.
Zone Drivingpatterna
Mean speed(km/h)
Annual mileage(km)
Area/lengthb Representative roads/streets
1 U 17.8 1255 4.3 km2 Gran Vía, Alcalá, San Bernardo, Atocha, Princesa2 U 20.9 997 9.7 km Bailén, Rda. Toledo, Rda. Valencia, P. Prado, P. Recoletos, Génova, Sagasta,
Alberto Aguilera, M. de Urquijo, Pintor Rosales, Ferraz3 U 21.0 6317 13.4 km2 Alcalá, Serrano, Velásquez, Goya, P. Castellana, Cd. de Barcelona, Sta. Engracia,
Guzmán el Bueno, O'Donnell, Ppe. de Vergara4 U 23.3 1089 26.3 km Av. Valladolid, P. Florida, Rda. Segovia, Rda. Toledo, Embajadores, Ferrocarril, Mdz. Álvaro,
Dr. Esquerdo, Fco. Silvela, R.F. Villaverde, Reina Victoria, Sn. Fco. de Sales, Av. Filipinas5 U 27.1 6221 33.7 km2 P. Castellana, Bravo Murillo, Av. América, Ppe. de Vergara, Pio XII, Ramón y Cajal,
M. de Viana, Sinesio Delgado, P. Delicias6 H 68.8 3429 31.0 km M-307 U 51.9 10602 157.5 km2 P. Extremadura, Av. de los Poblados, Vía Lusitana, Av. Albufera, Av. Entrevías,
Arturo Soria, Hnos. García Noblejas, Alcalá, Herrera Oria8 H 90.0 5777 59.1 km M-409 H 88.1 8308 1551.1 km2 M-45, M-50, Autov. Circunvalación, Av. Andalucía, Av. Aragón, Carr. Toledo,
Av. Ensanche de Vallecas
a U-urban driving pattern, H-highway driving pattern.b Zones 1, 3, 5, 7 and 9 correspond to areas. Zones 2, 4, 6 and 8 are lines.
Table 6Life cycle analysis results for the selected categories under the four tested scenarios according to the ILCD midpoint level methodology.
Impact BAU AQP ADI AEC
Acidification (kmolHþeq) 14,020 10,597 14,768 4,445Climate change (GgCO2eq) 1,365 1,189 1,390 893Particulate matter (MgPM2.5eq) 978 752 1,029 345Photochemical ozone formation (MgNMVOCeq) 13,336 10,035 14,068 4,086Terrestrial eutrophication (kmolNeq) 49,396 36,020 52,197 12,164
M. Vedrenne et al. / Energy Policy 66 (2014) 185–197 191
4. Results and discussion
4.1. Life cycle analysis
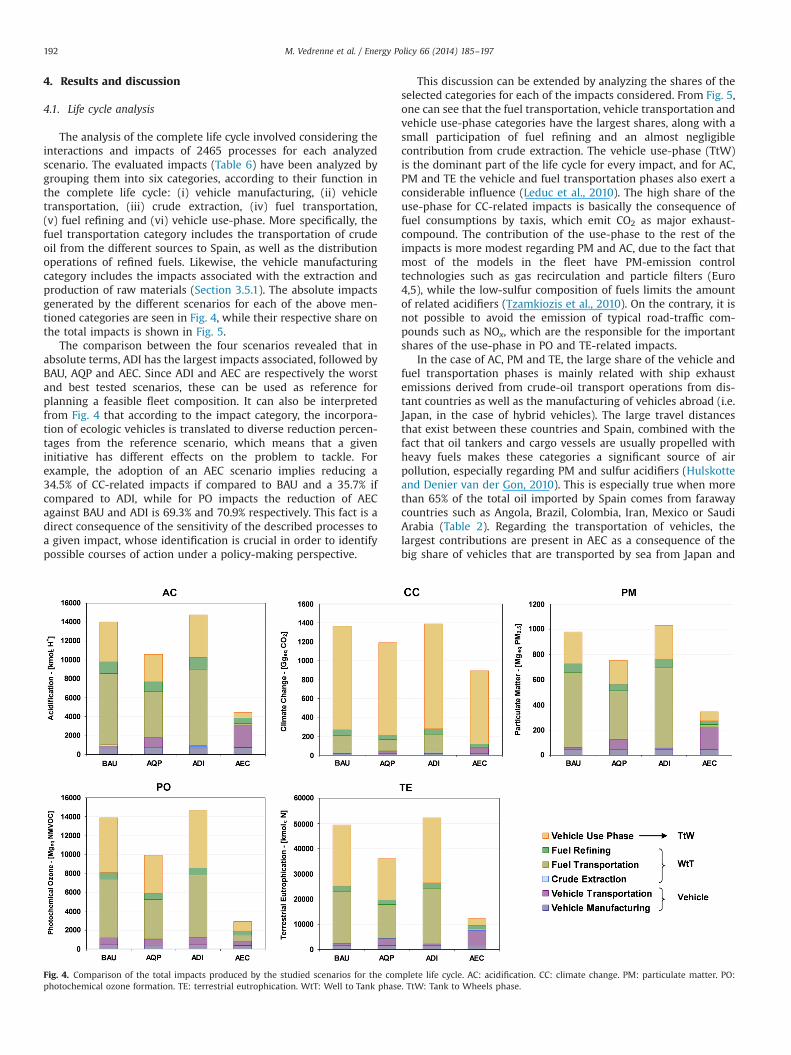
The analysis of the complete life cycle involved considering theinteractions and impacts of 2465 processes for each analyzedscenario. The evaluated impacts (Table 6) have been analyzed bygrouping them into six categories, according to their function inthe complete life cycle: (i) vehicle manufacturing, (ii) vehicletransportation, (iii) crude extraction, (iv) fuel transportation,(v) fuel refining and (vi) vehicle use-phase. More specifically, thefuel transportation category includes the transportation of crudeoil from the different sources to Spain, as well as the distributionoperations of refined fuels. Likewise, the vehicle manufacturingcategory includes the impacts associated with the extraction andproduction of raw materials (Section 3.5.1). The absolute impactsgenerated by the different scenarios for each of the above men-tioned categories are seen in Fig. 4, while their respective share onthe total impacts is shown in Fig. 5.
The comparison between the four scenarios revealed that inabsolute terms, ADI has the largest impacts associated, followed byBAU, AQP and AEC. Since ADI and AEC are respectively the worstand best tested scenarios, these can be used as reference forplanning a feasible fleet composition. It can also be interpretedfrom Fig. 4 that according to the impact category, the incorpora-tion of ecologic vehicles is translated to diverse reduction percen-tages from the reference scenario, which means that a giveninitiative has different effects on the problem to tackle. Forexample, the adoption of an AEC scenario implies reducing a34.5% of CC-related impacts if compared to BAU and a 35.7% ifcompared to ADI, while for PO impacts the reduction of AECagainst BAU and ADI is 69.3% and 70.9% respectively. This fact is adirect consequence of the sensitivity of the described processes toa given impact, whose identification is crucial in order to identifypossible courses of action under a policy-making perspective.
This discussion can be extended by analyzing the shares of theselected categories for each of the impacts considered. From Fig. 5,one can see that the fuel transportation, vehicle transportation andvehicle use-phase categories have the largest shares, along with asmall participation of fuel refining and an almost negligiblecontribution from crude extraction. The vehicle use-phase (TtW)is the dominant part of the life cycle for every impact, and for AC,PM and TE the vehicle and fuel transportation phases also exert aconsiderable influence (Leduc et al., 2010). The high share of theuse-phase for CC-related impacts is basically the consequence offuel consumptions by taxis, which emit CO2 as major exhaust-compound. The contribution of the use-phase to the rest of theimpacts is more modest regarding PM and AC, due to the fact thatmost of the models in the fleet have PM-emission controltechnologies such as gas recirculation and particle filters (Euro4,5), while the low-sulfur composition of fuels limits the amountof related acidifiers (Tzamkiozis et al., 2010). On the contrary, it isnot possible to avoid the emission of typical road-traffic com-pounds such as NOx, which are the responsible for the importantshares of the use-phase in PO and TE-related impacts.
In the case of AC, PM and TE, the large share of the vehicle andfuel transportation phases is mainly related with ship exhaustemissions derived from crude-oil transport operations from dis-tant countries as well as the manufacturing of vehicles abroad (i.e.Japan, in the case of hybrid vehicles). The large travel distancesthat exist between these countries and Spain, combined with thefact that oil tankers and cargo vessels are usually propelled withheavy fuels makes these categories a significant source of airpollution, especially regarding PM and sulfur acidifiers (Hulskotteand Denier van der Gon, 2010). This is especially true when morethan 65% of the total oil imported by Spain comes from farawaycountries such as Angola, Brazil, Colombia, Iran, Mexico or SaudiArabia (Table 2). Regarding the transportation of vehicles, thelargest contributions are present in AEC as a consequence of thebig share of vehicles that are transported by sea from Japan and
Fig. 4. Comparison of the total impacts produced by the studied scenarios for the complete life cycle. AC: acidification. CC: climate change. PM: particulate matter. PO:photochemical ozone formation. TE: terrestrial eutrophication. WtT: Well to Tank phase. TtW: Tank to Wheels phase.
M. Vedrenne et al. / Energy Policy 66 (2014) 185–197192

the observed lower consumption of fuels in the use-phase. For thespecific case of PO, high impacts are caused by NMVOC fugitiveemissions, which are usually present in fuel handling and storageoperations, specifically at pipelines and marine terminals (Klimontet al., 2002).
The shares of the vehicle manufacturing and fuel refiningcategories are intimately related to the scenarios' fleet composi-tions, with the highest percentages present in AEC. These differ-ences can be attributed to the fact that this scenario has a largefleet of hybrid vehicles (Fig. 3) whose manufacturing process isreputed not being as eco-friendly as that of conventional vehicles,which is basically a consequence of the battery assembly process(Pollet et al., 2012). The variations that are observed in thecontribution of the fuel refining process for every impact in thefour scenarios are a consequence of the applied impact allocationhypotheses. According to Section 3.7, the allocation criterion wasbased on the weight percentage of the different fuels produced bythe refinery (Table 4). Since the refinery's major product is diesel,the impacts associated to the refining stage were observed toincrease for diesel-intensive scenarios such as BAU or ADI (Fig. 4).
The analysis of the complete life cycle as presented in thissection is useful for assessing the total environmental impact ofeach of the possible outcomes as a whole. However, this analysishas not been focused on the scale on which these impacts areproduced, which is very relevant since decision-making is usuallylimited by specific territorial boundaries. To this respect, placingthis analysis at the local context is useful for guiding stakeholderson planning activities. The following discussion will be focusedonly on the use-phase due to the fact that it is the only part of thelife cycle that takes place exclusively in Madrid.
4.2. Use-phase analysis
The detailed characterization of the use-phase (Section 3.7),especially regarding the conditions in which it is carried out
(speeds, traffic flows, technologies, etc.) responds to the need ofhaving estimates that are as accurate and as realistic as possible inorder to be used for policy-support. The distinction of road-trafficemissions in nine management zones is a consequence of thedifferent emission rates that vehicles exhibit as a function ofcirculation conditions, which are highly variable at urban environ-ments (Fontaras and Samaras, 2010). Moreover, this division isuseful to identify zones that are more likely of benefiting from theadoption of the environmental initiative.
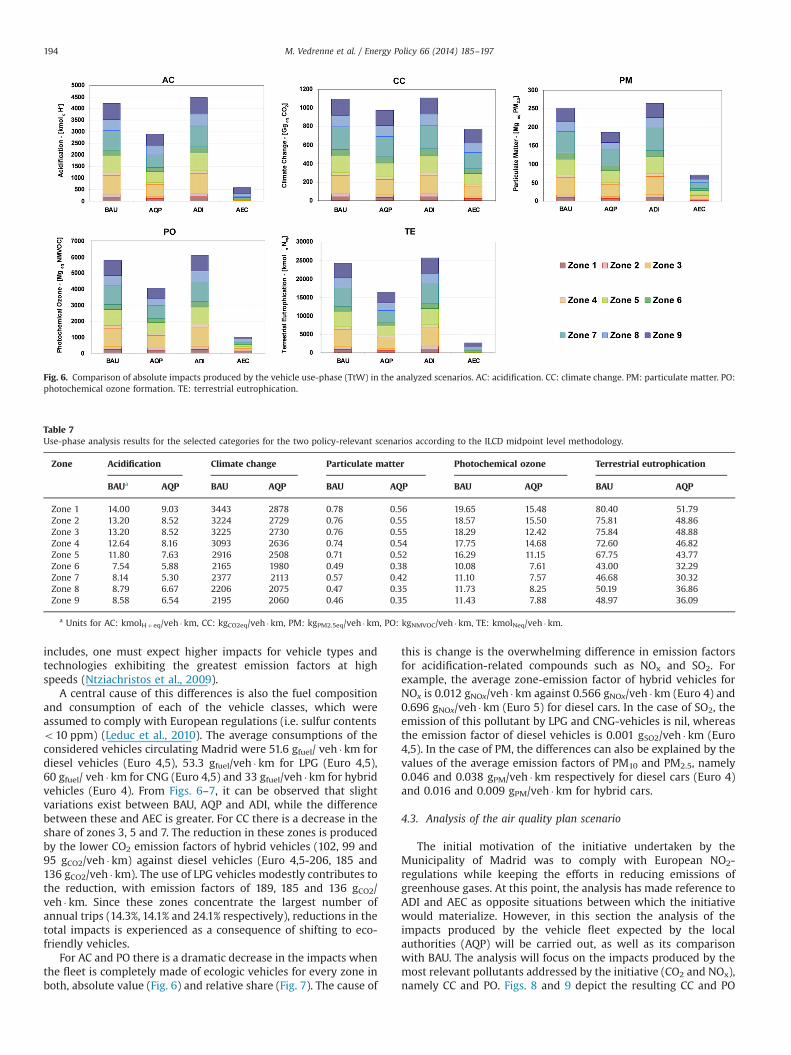
The total impacts caused by each management zone in the fourscenarios are shown in Fig. 6 and in order to facilitate comparisonbetween scenarios, normalized impacts for the two policy-relevant scenarios (BAU, AQP) are included in Table 7. In the sameline with the discussion of the previous section, it can be seen thatthe difference in the behaviors of the scenarios is caused by theamount of diesel vehicles in the fleet. In general, the impactsproduced by zones 7 and 9 are the most considerable in terms oftheir absolute value, while zones 1, 2 and 4 have a marginalcontribution. The distribution of the use-phase impacts accordingto the management zone can be seen in Fig. 7. In both cases theshare and the total impact of the zones is related to the totalnumber of trips that occur at them, according to the traffic modelof the Municipality of Madrid and the general composition of thevehicle fleet (Table 5).
These are necessary inputs that have to be fed to COPERT inorder to quantify the emission factors that are used to build therespective inventories in SimaPro. In this case, zones 3, 5, 8 and9 concentrate each more than 13% of the total trips, while zones 1,2 and 4 accumulate a 7.5% share in total. Additionally, 24% of thetrips in the city occur in zone 7, being the zone with the biggestshare. From the mean speeds shown in Table 5, one can see thatthe highest amount of trips is concentrated in zones with highspeed values. Due to the fact that speed is one of the criticalparameters that COPERT uses to estimate emissions and consider-ing the nature of the “speed-emission” curves that the software
Fig. 5. Comparison of the contribution of the life cycle stages to the impacts produced by the studied scenarios.
M. Vedrenne et al. / Energy Policy 66 (2014) 185–197 193
includes, one must expect higher impacts for vehicle types andtechnologies exhibiting the greatest emission factors at highspeeds (Ntziachristos et al., 2009).
A central cause of this differences is also the fuel compositionand consumption of each of the vehicle classes, which wereassumed to comply with European regulations (i.e. sulfur contentso10 ppm) (Leduc et al., 2010). The average consumptions of theconsidered vehicles circulating Madrid were 51.6 gfuel/ veh � km fordiesel vehicles (Euro 4,5), 53.3 gfuel/veh � km for LPG (Euro 4,5),60 gfuel/ veh � km for CNG (Euro 4,5) and 33 gfuel/veh � km for hybridvehicles (Euro 4). From Figs. 6–7, it can be observed that slightvariations exist between BAU, AQP and ADI, while the differencebetween these and AEC is greater. For CC there is a decrease in theshare of zones 3, 5 and 7. The reduction in these zones is producedby the lower CO2 emission factors of hybrid vehicles (102, 99 and95 gCO2/veh � km) against diesel vehicles (Euro 4,5-206, 185 and136 gCO2/veh � km). The use of LPG vehicles modestly contributes tothe reduction, with emission factors of 189, 185 and 136 gCO2/veh � km. Since these zones concentrate the largest number ofannual trips (14.3%, 14.1% and 24.1% respectively), reductions in thetotal impacts is experienced as a consequence of shifting to eco-friendly vehicles.
For AC and PO there is a dramatic decrease in the impacts whenthe fleet is completely made of ecologic vehicles for every zone inboth, absolute value (Fig. 6) and relative share (Fig. 7). The cause of
this is change is the overwhelming difference in emission factorsfor acidification-related compounds such as NOx and SO2. Forexample, the average zone-emission factor of hybrid vehicles forNOx is 0.012 gNOx/veh �km against 0.566 gNOx/veh �km (Euro 4) and0.696 gNOx/veh � km (Euro 5) for diesel cars. In the case of SO2, theemission of this pollutant by LPG and CNG-vehicles is nil, whereasthe emission factor of diesel vehicles is 0.001 gSO2/veh � km (Euro4,5). In the case of PM, the differences can also be explained by thevalues of the average emission factors of PM10 and PM2.5, namely0.046 and 0.038 gPM/veh �km respectively for diesel cars (Euro 4)and 0.016 and 0.009 gPM/veh � km for hybrid cars.
4.3. Analysis of the air quality plan scenario
The initial motivation of the initiative undertaken by theMunicipality of Madrid was to comply with European NO2-regulations while keeping the efforts in reducing emissions ofgreenhouse gases. At this point, the analysis has made reference toADI and AEC as opposite situations between which the initiativewould materialize. However, in this section the analysis of theimpacts produced by the vehicle fleet expected by the localauthorities (AQP) will be carried out, as well as its comparisonwith BAU. The analysis will focus on the impacts produced by themost relevant pollutants addressed by the initiative (CO2 and NOx),namely CC and PO. Figs. 8 and 9 depict the resulting CC and PO
Table 7Use-phase analysis results for the selected categories for the two policy-relevant scenarios according to the ILCD midpoint level methodology.
Zone Acidification Climate change Particulate matter Photochemical ozone Terrestrial eutrophication
BAUa AQP BAU AQP BAU AQP BAU AQP BAU AQP
Zone 1 14.00 9.03 3443 2878 0.78 0.56 19.65 15.48 80.40 51.79Zone 2 13.20 8.52 3224 2729 0.76 0.55 18.57 15.50 75.81 48.86Zone 3 13.20 8.52 3225 2730 0.76 0.55 18.29 12.42 75.84 48.88Zone 4 12.64 8.16 3093 2636 0.74 0.54 17.75 14.68 72.60 46.82Zone 5 11.80 7.63 2916 2508 0.71 0.52 16.29 11.15 67.75 43.77Zone 6 7.54 5.88 2165 1980 0.49 0.38 10.08 7.61 43.00 32.29Zone 7 8.14 5.30 2377 2113 0.57 0.42 11.10 7.57 46.68 30.32Zone 8 8.79 6.67 2206 2075 0.47 0.35 11.73 8.25 50.19 36.86Zone 9 8.58 6.54 2195 2060 0.46 0.35 11.43 7.88 48.97 36.09
a Units for AC: kmolHþeq/veh � km, CC: kgCO2eq/veh �km, PM: kgPM2.5eq/veh � km, PO: kgNMVOC/veh � km, TE: kmolNeq/veh �km.
Fig. 6. Comparison of absolute impacts produced by the vehicle use-phase (TtW) in the analyzed scenarios. AC: acidification. CC: climate change. PM: particulate matter. PO:photochemical ozone formation. TE: terrestrial eutrophication.
M. Vedrenne et al. / Energy Policy 66 (2014) 185–197194
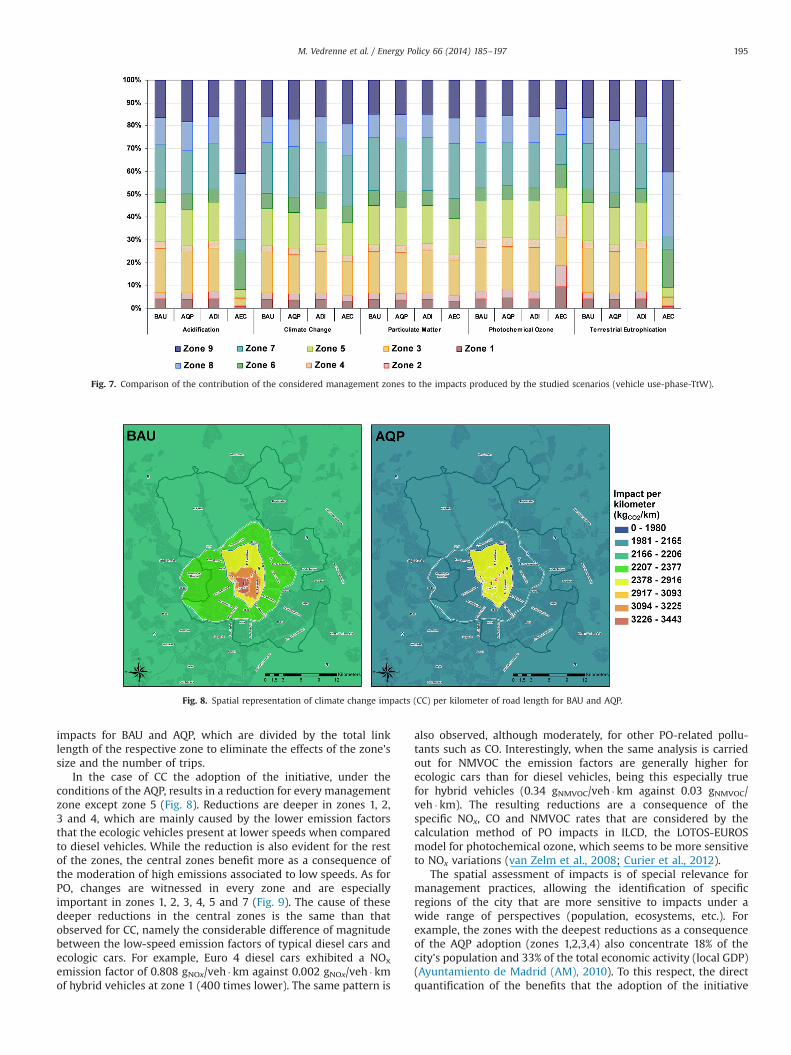
impacts for BAU and AQP, which are divided by the total linklength of the respective zone to eliminate the effects of the zone'ssize and the number of trips.
In the case of CC the adoption of the initiative, under theconditions of the AQP, results in a reduction for every managementzone except zone 5 (Fig. 8). Reductions are deeper in zones 1, 2,3 and 4, which are mainly caused by the lower emission factorsthat the ecologic vehicles present at lower speeds when comparedto diesel vehicles. While the reduction is also evident for the restof the zones, the central zones benefit more as a consequence ofthe moderation of high emissions associated to low speeds. As forPO, changes are witnessed in every zone and are especiallyimportant in zones 1, 2, 3, 4, 5 and 7 (Fig. 9). The cause of thesedeeper reductions in the central zones is the same than thatobserved for CC, namely the considerable difference of magnitudebetween the low-speed emission factors of typical diesel cars andecologic cars. For example, Euro 4 diesel cars exhibited a NOx
emission factor of 0.808 gNOx/veh �km against 0.002 gNOx/veh � kmof hybrid vehicles at zone 1 (400 times lower). The same pattern is
also observed, although moderately, for other PO-related pollu-tants such as CO. Interestingly, when the same analysis is carriedout for NMVOC the emission factors are generally higher forecologic cars than for diesel vehicles, being this especially truefor hybrid vehicles (0.34 gNMVOC/veh �km against 0.03 gNMVOC/veh � km). The resulting reductions are a consequence of thespecific NOx, CO and NMVOC rates that are considered by thecalculation method of PO impacts in ILCD, the LOTOS-EUROSmodel for photochemical ozone, which seems to be more sensitiveto NOx variations (van Zelm et al., 2008; Curier et al., 2012).
The spatial assessment of impacts is of special relevance formanagement practices, allowing the identification of specificregions of the city that are more sensitive to impacts under awide range of perspectives (population, ecosystems, etc.). Forexample, the zones with the deepest reductions as a consequenceof the AQP adoption (zones 1,2,3,4) also concentrate 18% of thecity's population and 33% of the total economic activity (local GDP)(Ayuntamiento de Madrid (AM), 2010). To this respect, the directquantification of the benefits that the adoption of the initiative
Fig. 7. Comparison of the contribution of the considered management zones to the impacts produced by the studied scenarios (vehicle use-phase-TtW).
Fig. 8. Spatial representation of climate change impacts (CC) per kilometer of road length for BAU and AQP.
M. Vedrenne et al. / Energy Policy 66 (2014) 185–197 195
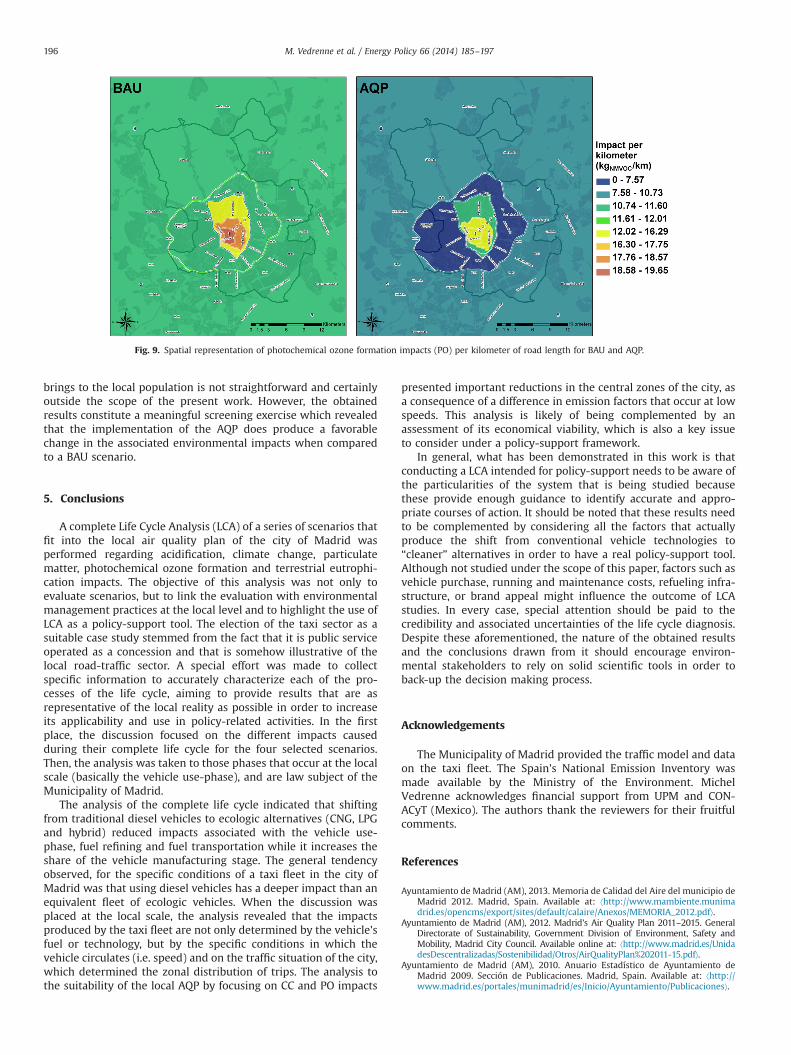
brings to the local population is not straightforward and certainlyoutside the scope of the present work. However, the obtainedresults constitute a meaningful screening exercise which revealedthat the implementation of the AQP does produce a favorablechange in the associated environmental impacts when comparedto a BAU scenario.
5. Conclusions
A complete Life Cycle Analysis (LCA) of a series of scenarios thatfit into the local air quality plan of the city of Madrid wasperformed regarding acidification, climate change, particulatematter, photochemical ozone formation and terrestrial eutrophi-cation impacts. The objective of this analysis was not only toevaluate scenarios, but to link the evaluation with environmentalmanagement practices at the local level and to highlight the use ofLCA as a policy-support tool. The election of the taxi sector as asuitable case study stemmed from the fact that it is public serviceoperated as a concession and that is somehow illustrative of thelocal road-traffic sector. A special effort was made to collectspecific information to accurately characterize each of the pro-cesses of the life cycle, aiming to provide results that are asrepresentative of the local reality as possible in order to increaseits applicability and use in policy-related activities. In the firstplace, the discussion focused on the different impacts causedduring their complete life cycle for the four selected scenarios.Then, the analysis was taken to those phases that occur at the localscale (basically the vehicle use-phase), and are law subject of theMunicipality of Madrid.
The analysis of the complete life cycle indicated that shiftingfrom traditional diesel vehicles to ecologic alternatives (CNG, LPGand hybrid) reduced impacts associated with the vehicle use-phase, fuel refining and fuel transportation while it increases theshare of the vehicle manufacturing stage. The general tendencyobserved, for the specific conditions of a taxi fleet in the city ofMadrid was that using diesel vehicles has a deeper impact than anequivalent fleet of ecologic vehicles. When the discussion wasplaced at the local scale, the analysis revealed that the impactsproduced by the taxi fleet are not only determined by the vehicle'sfuel or technology, but by the specific conditions in which thevehicle circulates (i.e. speed) and on the traffic situation of the city,which determined the zonal distribution of trips. The analysis tothe suitability of the local AQP by focusing on CC and PO impacts
presented important reductions in the central zones of the city, asa consequence of a difference in emission factors that occur at lowspeeds. This analysis is likely of being complemented by anassessment of its economical viability, which is also a key issueto consider under a policy-support framework.
In general, what has been demonstrated in this work is thatconducting a LCA intended for policy-support needs to be aware ofthe particularities of the system that is being studied becausethese provide enough guidance to identify accurate and appro-priate courses of action. It should be noted that these results needto be complemented by considering all the factors that actuallyproduce the shift from conventional vehicle technologies to“cleaner” alternatives in order to have a real policy-support tool.Although not studied under the scope of this paper, factors such asvehicle purchase, running and maintenance costs, refueling infra-structure, or brand appeal might influence the outcome of LCAstudies. In every case, special attention should be paid to thecredibility and associated uncertainties of the life cycle diagnosis.Despite these aforementioned, the nature of the obtained resultsand the conclusions drawn from it should encourage environ-mental stakeholders to rely on solid scientific tools in order toback-up the decision making process.
Acknowledgements
The Municipality of Madrid provided the traffic model and dataon the taxi fleet. The Spain's National Emission Inventory wasmade available by the Ministry of the Environment. MichelVedrenne acknowledges financial support from UPM and CON-ACyT (Mexico). The authors thank the reviewers for their fruitfulcomments.
References
Ayuntamiento de Madrid (AM), 2013. Memoria de Calidad del Aire del municipio deMadrid 2012. Madrid, Spain. Available at: ⟨http://www.mambiente.munimadrid.es/opencms/export/sites/default/calaire/Anexos/MEMORIA_2012.pdf⟩.
Ayuntamiento de Madrid (AM), 2012. Madrid's Air Quality Plan 2011–2015. GeneralDirectorate of Sustainability, Government Division of Environment, Safety andMobility, Madrid City Council. Available online at: ⟨http://www.madrid.es/UnidadesDescentralizadas/Sostenibilidad/Otros/AirQualityPlan%202011-15.pdf⟩.
Ayuntamiento de Madrid (AM), 2010. Anuario Estadístico de Ayuntamiento deMadrid 2009. Sección de Publicaciones. Madrid, Spain. Available at: ⟨http://www.madrid.es/portales/munimadrid/es/Inicio/Ayuntamiento/Publicaciones⟩.
Fig. 9. Spatial representation of photochemical ozone formation impacts (PO) per kilometer of road length for BAU and AQP.
M. Vedrenne et al. / Energy Policy 66 (2014) 185–197196

Asociación Española de Fabricantes de Automóviles y Camiones (ANFAC), 2012.Memoria Anual 2012. Madrid, Spain. Available from: ⟨http://www.anfac.com/publicaciones.action⟩.
Baptista, P.C., Silva, M.C., Farias, T.L., Heywood, J.B., 2012. Energy and environmentalimpacts of alternative pathways for the Portuguese road transportation sector.Energy Policy 51, 802–815.
Baptista, P., Ribau, J., Bravo, J., Silva, C., Adcock, P., Kells, A., 2011. Fuel cell hybrid taxilife cycle analysis. Energy Policy 39, 4683–4691.
Borge, R., Lumbreras, J., Pérez, J., de la Paz, D., Vedrenne, M., de Andrés, J.M.,Rodríguez, M.E., 2014. Emission inventories and modeling requirements for thedevelopment of air quality plans. Application to Madrid (Spain). Sci. TotalEnviron 446–447, 809–819.
Borge, R., de Miguel, I., de la Paz, D., Lumbreras, J., Pérez, J., Rodríguez, M.E., 2012.Comparison of road traffic emission models in Madrid (Spain). Atmos. Environ.62, 461–471.
Corporación de Reservas Estratégicas de Productos Petrolíferos (CORES), 2011.Boletín Estadístico de Hidrocarburos. Madrid, Spain.
Curier, R.L., Timmermans, R., Calabretta-Jongen, S., Eskes, H., Segers, A., Swart, D.,Schaap, M., 2012. Improving ozone forecasts over Europe by synergistic use ofthe LOTOS-EUROS chemical transport model and in-situ measurements. Atmos.Environ. 60, 217–226.
DeCicco, J.M., 2013. Factoring the car-climate challenge: insights and implications.Energy Policy 59, 382–392.
European Comission (EC)-Institute for Environment and Sustainability, 2011. Inter-national Reference Life Cycle Data System (ILCD) Handbook-Recommendationsfor Life Cycle Impact Assessment in the European context. 1 ed. November 2011.EUR 24571EN. Publications Office of the European Union. Luxemburg,Luxemburg.
European Comission (EC), 2008. Directive 2008/50/EC of the European Parliamentand of the Council of 21 May 2008 on ambient air quality and cleaner air forEurope. Off. J. L 152, 11.6. Available at: ⟨http://eur-lex.europa.eu⟩.
European Comission (EC), 2003. Reference Document on Best Available Techniques forMineral Oil and Gas Refineries. Integrated Pollution Prevention and Control (IPPC).Available at: ⟨http://eippcb.jrc.ec.europa.eu/reference/BREF/ref_bref_0203.pdf⟩.
European Environment Agency (EEA). EMEP/EEA Air Pollutant Emission InventoryGuidebook-2009. EEA Technical Report No. 9/2009. ISSN-1725-2237. Available at:⟨http://www.eea.europa.eu/publications/emep-eea-emission-inventory-guide-book-2009⟩.
Fontaras, G., Samaras, Z., 2010. On the way to 130 g CO2/km—estimating the futurecharacteristics of the average European passenger car. Energy Policy 38,1826–1833.
Frischknecht, R., Althaus, H.J., Doka, G., Dones, R., Heck, T., Hellweg, S., Hischier, R.,Jungbluth, N., Nemecek, T., Rebitzer, G., Spielmann, M., 2004. Overview andMethodology. Final Report Ecoinvent 2000 No.1, Swiss Centre for Life CycleInventories. Dübendorf, Switzerland.
Garg, A., Vishwanathan, S., Avashia, V., 2013. Life cycle greenhouse gas emissionassessment of major petroleum oil products for transport and householdsectors in India. Energy Policy 58, 38–48.
Granovskii, M., Dincer, I., Rosen, M.A., 2006. Economic and environmental compar-ison of conventional, hybrid, electric and hydrogen fuel cell vehicles. J. PowerSources 159, 1186–1193.
Hackney, J., de Neufville, R., 2001. Life cycle model of alternative fuel vehicles:emissions, energy, and cost trade-offs. Transp. Res. D-Transp. Environ 35, 243–266.
Hulskotte, J.H.J., Denier van der Gon, H.A.C., 2010. Fuel consumption and associatedemissions from seagoing ships at berth derived from an on-board survey.Atmos. Environ. 44, 1229–1236.
International Association of Oil and Gas Producers (OGP), 2011. EnvironmentalPerformance in the E&P Industry. 2010 Data. Report No. 466. October. London,United Kingdom. Available at: ⟨http://www.ogp.org.uk/pubs/466.pdf⟩.
International Energy Agency (IAE), 2012. 2012 Key World Energy Statistics. OECD/IEA. France. Available at: ⟨http://www.iea.org/publications⟩.
Janssens-Maenhout, G., Dentener, F., Van Aardenne, J., Monni, S., Pagliari, V.,Orlandini, L., Klimont, Z., Kurokawa, J., Akimoto, H., Ohara, T., Wankmueller,R., Battye, B., Grano, D., Zuber, A., Keating, T., 2012. EDGAR-HTAP: A HarmonizedGridded Air Pollution Emission Dataset Based on National Inventories. Eur-opean Commission Publications Office; 2012. JRC68434, EUR Report No. EUR25299. Ispra, Italy.
Jazcilevich, A.D., García Reynoso, A., Grutter, M., Delgado, J., Ayala, U.D., Suarez Lastra, M.,Zuk, M., González Oropeza, R., Lents, J., Davis, N., 2011. An evaluation of the hybridcar technology for the Mexico Mega City. J. Power Sources 196, 5704–5718.
Kassomenos, P., Karakitsios, S., Papaloukas, C., 2006. Estimation of daily trafficemissions in a South-European urban agglomeration during a workday.Evaluation of several “what if” scenarios. Sci. Total Environ 2-3, 480–490.
Klimont, Z., Streets, D.G., Gupta, S., Cofala, J., Lixin, F., Ichikawa, Y., 2002. Anthro-pogenic emissions of non-methane volatile organic compounds in China.Atmos. Environ. 36, 1309–1322.
Köhler, J., Schade, W., Leduc, G., Wiesenthal, T., Schade, B., Tercero Espinoza, L.,2013. Leaving fossil fuels behind? An innovation system analysis of low carboncars. J. Cleaner Prod. 48, 176–186.
Koroneos, C.J., Nanaki, E.A., 2007. Electric energy sustainability in the EasternBalkans. Energy Policy 35, 3826–3842.
Leduc, G., Mongelli, I., Uihlein, A., Nemry, F., 2010. How can our cars become lesspolluting? An assessment of the environmental improvement potential cars.Transp. Policy 17, 409–419.
Libyan National Oil Corporation (NOC), 2012. Summary Sheets of Contract Areas.Tripoli, Libya. Available at: ⟨http://www.temehu.com/oil-gas.htm⟩.
Lumbreras, J., Borge, R., Guijarro, A., López, J.M., Rodríguez, M.E., 2013. A Metho-dology to Compute Emission Projections from Road Transport (EmiTRANS).Technol. Forecast. Soc. http://dx.doi.org/10.1016/j.techfore.2013.02.011.
Lukoil, 2012. Annual Report 2012. Moscow, Russia. Available from: ⟨http://www.lukoil.com/materials/doc/Annual_Report_2012⟩.
Ma, H., Balthasar, F., Tait, N., Riera-Palou, X., Harrison, A., 2012. A new comparisonbetween the life cycle greenhouse gas emissions of battery electric vehicles andinternal combustion vehicles. Energy Policy 44, 160–173.
Menegaki, A.N., 2011. Bourgas–Alexandroupolis oil pipeline; will matching institu-tional and regulatory contexts lead to an effective bargaining and eventualconsensus? Energy Policy 39, 1277–1285.
Ministerio de Industria, Energía y Turismo (MINETUR), 2012. La Energía en España2011. Subdirección General de Desarrollo Normativo, Informes y Publicaciones.Madrid, España.
Ministerio de Agricultura, Alimentación y Medio Ambiente (MAGRAMA), 2013.Sistema Español de Inventario (SEI). Madrid, Spain. Available at: ⟨http://www.magrama.gob.es/es/calidad-y-evaluacion-ambiental/temas/sistema-espanol-de-inventario-sei-/⟩.
Mourato, S., Saynor, B., Hart, D., 2004. Greening London's black cabs: a study ofdriver's preferences for fuel cell taxis. Energy Policy 32, 685–695.
Nanaki, E.A., Koroneos, C.J., 2013. Comparative economic and environmentalanalysis of conventional, hybrid and electric vehicles-the case study of Greece.J. Cleaner Prod. 53, 261–266.
Ntziachristos, L., Gkatzoflias, D., Kouridis, C., Samaras, Z., 2009. COPERT: a Europeanroad transport emission inventory model. In: Athanasiadis, I.N., Mitkas, P.A.,Rizzoli, A.E., Marx Gómez, J. (Eds.), Information Technologies in EnvironmentalEngineering. Springer, pp. 491–504.
Ntziachristos, L., Samaras, Z., 2001. An empirical method for predicting exhaustemissions of regulated pollutants from future vehicle technologies. Atmos.Environ. 35, 1985–1999.
Pérez, J., Lumbreras, J., López, J.M., García, J.A., Vedrenne, M., de Andrés, J.M., de laPaz, D., 2012. Comparison of greenhouse gas emissions from different vehiclescovering the entire life cycle. WIT Trans. Built Environ. 128, 85–95.
Petróleos Mexicanos (Pemex), 2013. Indicadores Petroleros 2013. Informe mensualsobre producción y comercio de hidrocarburos. Subdirección de PlaneaciónEconómica. Mexico City, Mexico. Available at: ⟨http://www.ri.pemex.com/files/dcpe/petro/indicador.pdf⟩.
Pollet, B.G., Staffell, I., Shang, J.L., 2012. Current status of hybrid, battery and fuel cellelectric vehicles: from electrochemistry to market prospects. Rev. Electrochim.Acta 84, 235–249.
Propfe, B., Kreyenberg, D., Wind, J., Schmid, S., 2013. Market penetration analysis ofelectric vehicles in the German passenger car market towards 2030. Int. J.Hydrogen Energy 38, 5201–5208.
Puertos del Estado, 2011. Anuario Estadístico 2011. Ministerio de Fomento. Madrid,Spain. Available at: ⟨http://www.puertos.es/estadisticas/anuarios_de_puertos/index.html⟩.
Repsol, 2012. Informe Anual-Repsol 2012. Madrid, Spain. Available at: ⟨http://www.repsol.com/es_es/corporacion/accionistas-inversores⟩.
Romm, J., 2006. The car and fuel of the future. Energy Policy 34, 2609–2614.Saudi-Aramco, 2013. Shaping Tomorrow: 2012 Annual Review. Dhahran, Kingdom
of Saudi Arabia. Available at: ⟨http://www.saudiaramco.com/content/dam/Publications⟩.
Seckin, C., Sciubba, E., Bayulken, A.R., 2013. Extended exergy analysis of Turkishtransportation sector. J. Cleaner Prod. 47, 422–436.
Société Nationale pour la Recherche, la Production, le Transport, la Transformation,et la Commercialisation des Hydrocarbures (Sonatrach), 2013. Sonatrach: AnIntegrated Oil & Gas Company. Algiers, Algeria. Available at: ⟨http://www.sonatrach.com/rapport-annuel.html⟩.
Spielmann, M., Althaus, H.J., 2007. Can a prolonged use of a passenger car reduceenvironmental burdens? Life Cycle analysis of Swiss passenger cars. J. CleanerProd 15, 1122–1134.
Statoil, 2012. 2012 Annual Reporting Compendium. Stavanger, Norway. Available at:⟨http://www.statoil.com/AnnualReport2012⟩.
Thabrew, L., Wiek, A., Ries, R., 2009. Environmental decision making in multi-stakeholder contexts: applicability of life cycle thinking in developmentplanning and implementation. J. Cleaner Prod. 17, 67–76.
Total-E&P Congo, 2008. Moho-Bilondo: A First in Congo's Deep Offshore. Paris,France. Available at: ⟨http://www.total.com/en/our-energies/oil/exploration-and-production/projects-and-achievements⟩.
Total-E&P Sonangol, 2005. Dalia: The Conquest of the Deep Offshore. Paris, France.Available at: ⟨http://www.total.com/en/our-energies/oil/exploration-and-production/projects-and-achievements⟩.
Tzamkiozis, T., Ntziachristos, L., Samaras, Z., 2010. Diesel passenger car PM emissions:from Euro 1 to Euro 4 with particle filter. Atmos. Environ. 44, 909–916.
van Vliet, O.P.R., Kruithof, T., Turkenburg, W.C., Faaij, A.P.C., 2010. Techno-economiccomparison of series hybrid, plug-in hybrid, fuel cell and regular cars. J. PowerSources 195, 6570–6585.
van Zelm, R., Huijbregts, M.A.J., Den Hollander, H.A., Van Jaarsveld, H.A., Sauter, F.J.,Struijs, J., Van Wijnen, H.J., Van de Meent, D., 2008. European characterizationfactors for human health damage of PM10 and ozone in life cycle impactassessment. Atmos. Environ. 42, 441–453.
Vedrenne, M., Borge, R., de la Paz, D., Lumbreras, J., Rodríguez, M.E., 2011.Comparison and assessment of two emission inventories for the Madrid region.WIT Trans. Ecol. Environ. 157, 81–92.
Volvo Truck Corporation (VTC), 2003. Emissions from Volvo's Trucks (standarddiesel fuel). PM Report No. 20640/03-017. November. Stockholm, Sweden.
M. Vedrenne et al. / Energy Policy 66 (2014) 185–197 197
Copyright © 2022 FDOKUMEN