Lidar profiling of aerosol optical properties from Paris to Lake ...
20
Atmos. Chem. Phys., 15, 5007–5026, 2015 www.atmos-chem-phys.net/15/5007/2015/ doi:10.5194/acp-15-5007-2015 © Author(s) 2015. CC Attribution 3.0 License. Lidar profiling of aerosol optical properties from Paris to Lake Baikal (Siberia) E. Dieudonné 1,* , P. Chazette 1 , F. Marnas 1 , J. Totems 1 , and X. Shang 1 1 Laboratoire des Sciences du Climat et de l’Environnement (LSCE), CEA/CNRS/UVSQ, Gif-sur-Yvette, France * now at: Laboratoire de Physico-Chimie de l’Atmosphère (LPCA), Université du Littoral, Côte d’Opale, Dunkerque, France Correspondence to: E. Dieudonné ([email protected]) Received: 7 September 2014 – Published in Atmos. Chem. Phys. Discuss.: 11 November 2014 Revised: 10 March 2015 – Accepted: 10 April 2015 – Published: 4 May 2015 Abstract. In June 2013, a ground-based mobile lidar per- formed the ∼ 10 000 km ride from Paris to Ulan-Ude, near Lake Baikal, profiling for the first time aerosol optical prop- erties all the way from western Europe to central Siberia. The instrument was equipped with N 2 -Raman and depolarization channels that enabled an optical speciation of aerosols in the low and middle troposphere. The extinction-to-backscatter ratio (also called lidar ratio or LR) and particle depolar- ization ratio (PDR) at 355 nm have been retrieved. The LR in the lower boundary layer (300–700 m) was found to be 63 ± 17 sr on average during the campaign with a distri- bution slightly skewed toward higher values that peaks be- tween 50 and 55 sr. Although the difference is small, PDR values observed in Russian cities (> 2 %, except after rain) are systematically higher than the ones measured in Europe (< 1 %), which is probably an effect of the lifting of terrige- nous aerosols by traffic on roads. Biomass burning layers from grassland or/and forest fires in southern Russia exhibit LR values ranging from 65 to 107 sr and from 3 to 4 % for the PDR. During the route, desert dust aerosols originating from the Caspian and Aral seas regions were characterized for the first time, with a LR (PDR) of 43 ± 14 sr (23 ± 2 %) for pure dust. The lidar observations also showed that this dust event extended over 2300 km and lasted for ∼ 6 days. Measurements from the Moderate Resolution Imaging Spec- trometer (MODIS) show that our results are comparable in terms of aerosol optical thickness (between 0.05 and 0.40 at 355 nm) with the mean aerosol load encountered throughout our route. 1 Introduction The quantification of the aerosol radiative forcing still suffers from large uncertainties, making aerosols the dominant con- tribution in uncertainties on the anthropogenic influence on climate (IPCC, 2013). To improve the performance of cli- mate models, observations are needed in order to provide better constraints from the regional to the global scale. Large observational networks such as the Aerosol Robotic Network (AERONET; Holben et al., 1998), the Micropulse Lidar Net- work (MPLNET; Welton et al., 2001) or the Aerosol, Clouds and Trace gases Research Infrastructure Network (ACTRIS, formerly EARLINET; Pappalardo et al., 2014) provide the long-term measurement series needed to build a climatol- ogy of aerosol optical properties at the continental and global scales. Complementarily, numerous large field experiments have taken place over the past years to monitor long-range trans- port of aerosols and cover areas that do not host dense obser- vation networks like oceans, South-East Asia, Africa or Arc- tic: for instance the Aerosol Characterization Experiments (ACE-1, ACE-2, ACE-Asia; Bates et al., 1998; Raes et al., 2000; Huebert et al., 2003), the Indian Ocean Experiment (INDOEX, Ramanathan et al., 2001), the African Monsoon Multidisciplinary Analysis (AMMA; Lebel et al., 2010), or the Polar study using Aircraft, Remote sensing, surface mea- surements and models, of Climate chemistry, Aerosols and Transport project (POLARCAT; Law et al., 2015). During those field campaigns, airborne measurements have been per- formed, which offer observations on a larger scale than fixed ground-based stations. On a smaller, regional scale, field experiments took place near large pollution hotspots like Mexico City, with the Published by Copernicus Publications on behalf of the European Geosciences Union.
-
Upload
khangminh22 -
Category
Documents
-
view
1 -
download
0
Transcript of Lidar profiling of aerosol optical properties from Paris to Lake ...

Atmos. Chem. Phys., 15, 5007–5026, 2015
www.atmos-chem-phys.net/15/5007/2015/
doi:10.5194/acp-15-5007-2015
© Author(s) 2015. CC Attribution 3.0 License.
Lidar profiling of aerosol optical properties from
Paris to Lake Baikal (Siberia)
E. Dieudonné1,*, P. Chazette1, F. Marnas1, J. Totems1, and X. Shang1
1Laboratoire des Sciences du Climat et de l’Environnement (LSCE), CEA/CNRS/UVSQ, Gif-sur-Yvette, France*now at: Laboratoire de Physico-Chimie de l’Atmosphère (LPCA), Université du Littoral, Côte d’Opale, Dunkerque, France
Correspondence to: E. Dieudonné ([email protected])
Received: 7 September 2014 – Published in Atmos. Chem. Phys. Discuss.: 11 November 2014
Revised: 10 March 2015 – Accepted: 10 April 2015 – Published: 4 May 2015
Abstract. In June 2013, a ground-based mobile lidar per-
formed the ∼ 10 000 km ride from Paris to Ulan-Ude, near
Lake Baikal, profiling for the first time aerosol optical prop-
erties all the way from western Europe to central Siberia. The
instrument was equipped with N2-Raman and depolarization
channels that enabled an optical speciation of aerosols in the
low and middle troposphere. The extinction-to-backscatter
ratio (also called lidar ratio or LR) and particle depolar-
ization ratio (PDR) at 355 nm have been retrieved. The LR
in the lower boundary layer (300–700 m) was found to be
63± 17 sr on average during the campaign with a distri-
bution slightly skewed toward higher values that peaks be-
tween 50 and 55 sr. Although the difference is small, PDR
values observed in Russian cities (> 2 %, except after rain)
are systematically higher than the ones measured in Europe
(< 1 %), which is probably an effect of the lifting of terrige-
nous aerosols by traffic on roads. Biomass burning layers
from grassland or/and forest fires in southern Russia exhibit
LR values ranging from 65 to 107 sr and from 3 to 4 % for
the PDR. During the route, desert dust aerosols originating
from the Caspian and Aral seas regions were characterized
for the first time, with a LR (PDR) of 43± 14 sr (23± 2 %)
for pure dust. The lidar observations also showed that this
dust event extended over 2300 km and lasted for ∼ 6 days.
Measurements from the Moderate Resolution Imaging Spec-
trometer (MODIS) show that our results are comparable in
terms of aerosol optical thickness (between 0.05 and 0.40 at
355 nm) with the mean aerosol load encountered throughout
our route.
1 Introduction
The quantification of the aerosol radiative forcing still suffers
from large uncertainties, making aerosols the dominant con-
tribution in uncertainties on the anthropogenic influence on
climate (IPCC, 2013). To improve the performance of cli-
mate models, observations are needed in order to provide
better constraints from the regional to the global scale. Large
observational networks such as the Aerosol Robotic Network
(AERONET; Holben et al., 1998), the Micropulse Lidar Net-
work (MPLNET; Welton et al., 2001) or the Aerosol, Clouds
and Trace gases Research Infrastructure Network (ACTRIS,
formerly EARLINET; Pappalardo et al., 2014) provide the
long-term measurement series needed to build a climatol-
ogy of aerosol optical properties at the continental and global
scales.
Complementarily, numerous large field experiments have
taken place over the past years to monitor long-range trans-
port of aerosols and cover areas that do not host dense obser-
vation networks like oceans, South-East Asia, Africa or Arc-
tic: for instance the Aerosol Characterization Experiments
(ACE-1, ACE-2, ACE-Asia; Bates et al., 1998; Raes et al.,
2000; Huebert et al., 2003), the Indian Ocean Experiment
(INDOEX, Ramanathan et al., 2001), the African Monsoon
Multidisciplinary Analysis (AMMA; Lebel et al., 2010), or
the Polar study using Aircraft, Remote sensing, surface mea-
surements and models, of Climate chemistry, Aerosols and
Transport project (POLARCAT; Law et al., 2015). During
those field campaigns, airborne measurements have been per-
formed, which offer observations on a larger scale than fixed
ground-based stations.
On a smaller, regional scale, field experiments took place
near large pollution hotspots like Mexico City, with the
Published by Copernicus Publications on behalf of the European Geosciences Union.
5008 E. Dieudonné et al.: Lidar profiling of aerosol optical properties
Megacity Initiative: Local And Global Research Observa-
tions project (MILAGRO, Molina et al., 2010), or Paris, with
the Air Pollution Over the Paris Region project (ESQUIF,
Vautard et al., 2003; Chazette et al., 2005), the Lidar pour
la Surveillance de l’Air (LISAIR, Raut and Chazette, 2007)
and the Megacities: Emissions, urban, regional and Global
Atmospheric Pollution and climate effects, and Integrated
tools for assessment and mitigation project (MEGAPOLI,
http://megapoli.dmi.dk/; Royer et al., 2011). Aerosol optical
properties have thus been extensively documented over west-
ern Europe and North America. Besides, Asia has drawn a
growing attention as this region is becoming a larger contrib-
utor to aerosol anthropogenic emissions.
Conversely, very few measurement programmes exist over
Russia, which for instance hosts only five stable AERONET
stations while the country covers 11.5 % of the world’s dry
lands and contributes to aerosol emissions through large for-
est fires and several pollution hotspots like Moscow (12 mil-
lion inhabitants) or large industrial cities. Some measurement
stations exist like the ZOTTO tower, located in the taiga
600 km northwest of Krasnoyarsk, where CO, particle con-
centration and aerosol optical properties have been measured
continuously up to 300 m a.g.l. (above ground level) since
2006 (Heintzenberg et al., 2013). Vertical profiles of particle
concentration and extinction up to 5 km were collected in the
Tomsk region during an intensive flight campaign in 1986–
1988, and then from monthly flights between 1999 and 2007
(Panchenko et al., 2012). At a larger scale, CO and particle
concentrations have been measured during transcontinental
flights in the framework of the Airborne Extensive Regional
Observations in Siberia project (YAK-AEROSIB, Paris et
al., 2010). However, most of the resulting observations took
place in the free troposphere, and the flight plan was aimed
towards the remote northern Siberian regions rather than the
industrial cities of southern Siberia.
For other regions, and particularly for the industrial cities
of southern Siberia, only space-borne instruments offer a reg-
ular coverage, for instance the Moderate Resolution Imaging
Spectrometer (MODIS, e.g. King et al., 1992; Salomonson et
al., 1989) or the Polarization and Directionality of the Earth
Reflectance/Polarization and Anisotropy of Reflectances for
Atmospheric Sciences coupled with Observations from a Li-
dar (POLDER/PARASOL, e.g. Deuzé et al., 2001) or the
Cloud-Aerosol Lidar and Infrared Pathfinder Satellite Ob-
servation (CALIPSO, e.g. Winker et al., 2003 or Chazette et
al., 2010). However, observations are limited by cloud cover-
age and by the satellite overpass time, so that ground-based
observations are welcome to better document aerosols over
Russia.
In June 2013, we performed the first road transect through
Europe and Russia for aerosol profiling, with a N2-Raman
lidar instrument embedded on a van going all the way from
Paris to Lake Baikal, where the season of forest fires had
begun. This campaign offers a unique snapshot of aerosol
optical properties from western Europe to eastern Russia,
which can be extrapolated in a broader climatological con-
text through satellite observations. This paper aims at pre-
senting the general variability of the aerosol nature, amount
and optical properties along the journey. For this purpose, a
systematic data processing is used, which precision is lim-
ited by the need to apply it both to the nighttime and day-
time, noisier data. For this reason a finer characterization of
the optical properties of the desert dust and biomass burning
aerosols encountered in Russia is also presented, based on a
few case studies using best quality data.
Therefore, this paper is organized as follows. Section 2
presents the itinerary of the campaign, the lidar instru-
ment and the data processing methods used to retrieve the
aerosol extinction, extinction-to-backscatter ratio or lidar
ratio (LR) and particle depolarization ratio (PDR). Then,
Sect. 3 presents the variability of aerosols along the jour-
ney, the particle nature being identified through the combi-
nation of the two intensives properties that are the LR and
PDR. Section 3 also analyses the representativeness of the
observations in regards to longer time series of space-borne
measurements. Finally, Sect. 4 presents a few case studies on
which it was possible to perform a finer characterization of
the optical properties (LR and PDR) of the dust and biomass
burning particles encountered during the route, and the origin
of those particles is also discussed.
2 Experimental setup and method
2.1 Itinerary
The van carrying the lidar instrument departed from Paris
on 4 June 2013 and reached Lake Baikal on 28 June. The
trip was performed during the summer as it corresponds to
the maximum of the wildfire season. After 28 June, fixed lo-
cation measurements were performed on the shore of Lake
Baikal, in Istomino village (52.128◦ N, 106.287◦ E), and mo-
bile observations were recorded during round trips between
Istomino and Ulan-Ude city, 80 km southeast of the lake.
Ground-based mobile measurements, though limited by bat-
tery power, could be conducted during most of the journey
(during daytime). Fixed location measurements took place
during most of the stop-overs (during nighttime) using lo-
cal power supply. Intermissions were thus mainly due to rain
showers and low-level clouds.
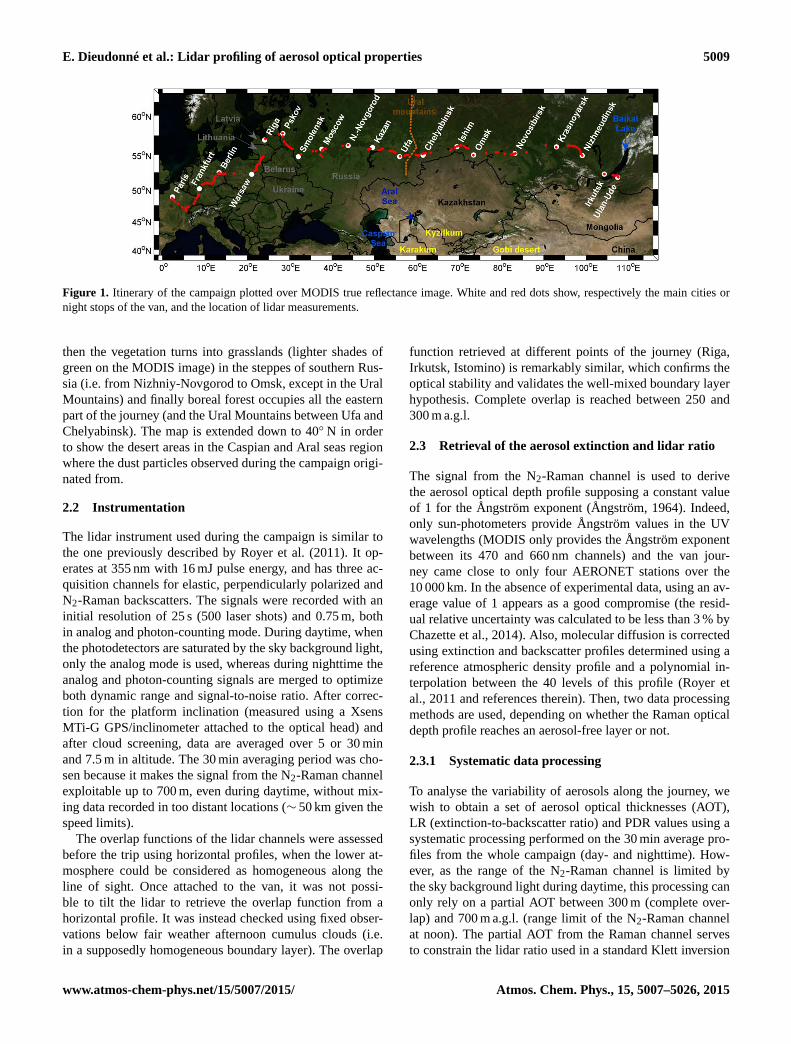
An overview of the van itinerary and of the lidar data avail-
ability can be found on Fig. 1. The journey went through a
number of pollution hotspots: Paris, the Rhine Valley (Frank-
furt), Berlin, Warsaw, Moscow, and several large and indus-
trial Russian cities such as Nizhniy-Novgorod, Kazan, Ufa,
Chelyabinsk, Omsk, Novosibirsk, Krasnoyarsk and Irkutsk.
Regarding wildfires, three main vegetation types susceptible
to produce biomass burning aerosols were encountered: first,
temperate forest (visible in dark green on the MODIS im-
age) dominate in the Baltic countries and western Russia,
Atmos. Chem. Phys., 15, 5007–5026, 2015 www.atmos-chem-phys.net/15/5007/2015/
E. Dieudonné et al.: Lidar profiling of aerosol optical properties 5009
Figure 1. Itinerary of the campaign plotted over MODIS true reflectance image. White and red dots show, respectively the main cities or
night stops of the van, and the location of lidar measurements.
then the vegetation turns into grasslands (lighter shades of
green on the MODIS image) in the steppes of southern Rus-
sia (i.e. from Nizhniy-Novgorod to Omsk, except in the Ural
Mountains) and finally boreal forest occupies all the eastern
part of the journey (and the Ural Mountains between Ufa and
Chelyabinsk). The map is extended down to 40◦ N in order
to show the desert areas in the Caspian and Aral seas region
where the dust particles observed during the campaign origi-
nated from.
2.2 Instrumentation
The lidar instrument used during the campaign is similar to
the one previously described by Royer et al. (2011). It op-
erates at 355 nm with 16 mJ pulse energy, and has three ac-
quisition channels for elastic, perpendicularly polarized and
N2-Raman backscatters. The signals were recorded with an
initial resolution of 25 s (500 laser shots) and 0.75 m, both
in analog and photon-counting mode. During daytime, when
the photodetectors are saturated by the sky background light,
only the analog mode is used, whereas during nighttime the
analog and photon-counting signals are merged to optimize
both dynamic range and signal-to-noise ratio. After correc-
tion for the platform inclination (measured using a Xsens
MTi-G GPS/inclinometer attached to the optical head) and
after cloud screening, data are averaged over 5 or 30 min
and 7.5 m in altitude. The 30 min averaging period was cho-
sen because it makes the signal from the N2-Raman channel
exploitable up to 700 m, even during daytime, without mix-
ing data recorded in too distant locations (∼ 50 km given the
speed limits).
The overlap functions of the lidar channels were assessed
before the trip using horizontal profiles, when the lower at-
mosphere could be considered as homogeneous along the
line of sight. Once attached to the van, it was not possi-
ble to tilt the lidar to retrieve the overlap function from a
horizontal profile. It was instead checked using fixed obser-
vations below fair weather afternoon cumulus clouds (i.e.
in a supposedly homogeneous boundary layer). The overlap
function retrieved at different points of the journey (Riga,
Irkutsk, Istomino) is remarkably similar, which confirms the
optical stability and validates the well-mixed boundary layer
hypothesis. Complete overlap is reached between 250 and
300 m a.g.l.
2.3 Retrieval of the aerosol extinction and lidar ratio
The signal from the N2-Raman channel is used to derive
the aerosol optical depth profile supposing a constant value
of 1 for the Ångström exponent (Ångström, 1964). Indeed,
only sun-photometers provide Ångström values in the UV
wavelengths (MODIS only provides the Ångström exponent
between its 470 and 660 nm channels) and the van jour-
ney came close to only four AERONET stations over the
10 000 km. In the absence of experimental data, using an av-
erage value of 1 appears as a good compromise (the resid-
ual relative uncertainty was calculated to be less than 3 % by
Chazette et al., 2014). Also, molecular diffusion is corrected
using extinction and backscatter profiles determined using a
reference atmospheric density profile and a polynomial in-
terpolation between the 40 levels of this profile (Royer et
al., 2011 and references therein). Then, two data processing
methods are used, depending on whether the Raman optical
depth profile reaches an aerosol-free layer or not.
2.3.1 Systematic data processing
To analyse the variability of aerosols along the journey, we
wish to obtain a set of aerosol optical thicknesses (AOT),
LR (extinction-to-backscatter ratio) and PDR values using a
systematic processing performed on the 30 min average pro-
files from the whole campaign (day- and nighttime). How-
ever, as the range of the N2-Raman channel is limited by
the sky background light during daytime, this processing can
only rely on a partial AOT between 300 m (complete over-
lap) and 700 m a.g.l. (range limit of the N2-Raman channel
at noon). The partial AOT from the Raman channel serves
to constrain the lidar ratio used in a standard Klett inversion
www.atmos-chem-phys.net/15/5007/2015/ Atmos. Chem. Phys., 15, 5007–5026, 2015
5010 E. Dieudonné et al.: Lidar profiling of aerosol optical properties
(Klett, 1985), which is achieved through a convergent pro-
cess described in Appendix A. When convergence is reached,
the retrieved value corresponds to the average lidar ratio in
the 300–700 m a.g.l. layer. The uncertainty on this value is
estimated by propagating the photon noise on the lidar signal
throughout the inversion process using a Monte Carlo algo-
rithm. A profile is considered as “fully convergent”, and the
retrieved lidar ratio is considered as valid, only when all the
200 profiles in the Monte Carlo distribution are convergent.
Unfortunately, the partial AOT produced by the Klett in-
version is very sensitive to the transmission by the upper lay-
ers, making convergence difficult when another aerosol type
with a different LR is present above the constraint layer (e.g.
an elevated dust or biomass burning layer or more frequently,
moist aerosols near the PBL top). Consequently, only a small
fraction of the profiles converge (see Sect. 3.1); for the oth-
ers, it is necessary to choose an arbitrary LR value in order to
compute the extinction profile, total AOT, and subsequently
the PDR. In order to avoid introducing discontinuities in the
AOT and PDR data sets between profiles that converged or
not, the same LR value is used to invert all profiles through a
standard Klett procedure. The chosen LR (58 sr) is the mean
value of the LR distribution obtained from the valid profiles
(see Sect. 3.1).
2.3.2 Case study data processing
The case studies presented in Sect. 4 rely on fixed measure-
ments, with longer time averaging. Nighttime observations,
added to this longer averaging, make the N2-Raman channel
exploitable up to a purely molecular layer (above 6 km a.g.l).
In this case, a complete lidar ratio profile can be retrieved us-
ing either the standard Raman inversion method described in
Ansmann et al. (1990) or a constrained Klett method similar
to the one used for the systematic processing, but applied on
a sliding window browsing the full altitude range. More de-
tails about both inversion processes are given in Appendix A.
After the LR profile has been retrieved from the average pro-
file over the whole period, it is used to process more frequent
5 min average profiles and invert the time-dependent extinc-
tion profile and AOT.
2.4 Retrieval of the PDR
The volumetric depolarization ratio (VDR) was determined
following the procedure described in Chazette et al. (2012).
It uses the transmission and reflection coefficients of the po-
larization separation plates as measured in the lab before de-
parture, along with the gain ratio between the total and per-
pendicular polarization channels. The gain ratio value was
calibrated using measurements obtained next to Lake Baikal
during one night when the atmosphere was devoid of any
elevated aerosol layer, featuring a purely molecular depolar-
ization (with a value known from the filters bandwidth). Sev-
eral tests carried on other days earlier during the campaign
showed that the gain ratio varied by 5 % at most, so that the
value obtained from the Lake Baikal experiment was used
during the whole campaign. The PDR is then computed as in
Chazette et al. (2012). As the PDR is a physical parameter
without meaning when there are few aerosols, its calculation
is performed only for layers where the aerosol backscatter
coefficient is at least 5 % of the molecular backscatter (i.e. a
scattering ratio above 1.05).
The error on the PDR is computed for each case presented
in this study. The values and dominant sources of error are
discussed in Appendix B. Below 4 km a.g.l, we find that,
given the chosen scattering ratio threshold of 1.05, the rela-
tive uncertainty on the PDR is largely constrained by the un-
certainty on the lidar ratio (i.e. between 8 and 20 % – relative)
for PDR values of 5 % and above. Because of the error on the
gain ratio, this relative uncertainty is always at least 7 %. For
very low PDR values, the absolute uncertainty mostly de-
pends on noise conditions, but remains above 0.2 %. More
details and about the validation of these values via Monte
Carlo simulation are given in Appendix B.
3 Variability of aerosols along the transect
This section is based on the 30 min average profiles inverted
using the systematic processing described in Sect. 2.3.1.
First, the distribution of LR values retrieved in the planetary
boundary layer (PBL) is presented. Then, the spatial distri-
bution of aerosols along the journey, analysed in terms of
AOT and PDR, is discussed. A finer classification of the par-
ticle types encountered during the campaign is also proposed,
based on the LR and PDR values retrieved in the PBL. Fi-
nally, the representativeness of the campaign period is as-
sessed by comparison with longer time series of space-borne
observations and ground-based sun-photometers.
3.1 Distribution of lidar ratios in the boundary layer
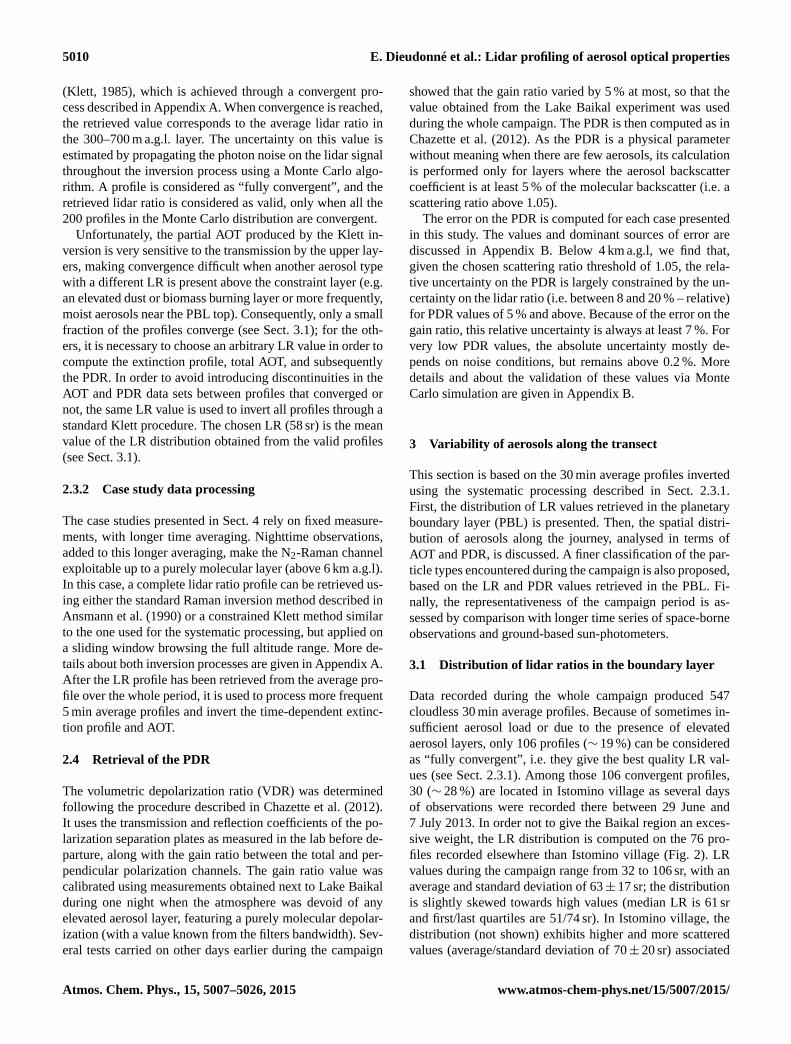
Data recorded during the whole campaign produced 547
cloudless 30 min average profiles. Because of sometimes in-
sufficient aerosol load or due to the presence of elevated
aerosol layers, only 106 profiles (∼ 19 %) can be considered
as “fully convergent”, i.e. they give the best quality LR val-
ues (see Sect. 2.3.1). Among those 106 convergent profiles,
30 (∼ 28 %) are located in Istomino village as several days
of observations were recorded there between 29 June and
7 July 2013. In order not to give the Baikal region an exces-
sive weight, the LR distribution is computed on the 76 pro-
files recorded elsewhere than Istomino village (Fig. 2). LR
values during the campaign range from 32 to 106 sr, with an
average and standard deviation of 63± 17 sr; the distribution
is slightly skewed towards high values (median LR is 61 sr
and first/last quartiles are 51/74 sr). In Istomino village, the
distribution (not shown) exhibits higher and more scattered
values (average/standard deviation of 70± 20 sr) associated
Atmos. Chem. Phys., 15, 5007–5026, 2015 www.atmos-chem-phys.net/15/5007/2015/

E. Dieudonné et al.: Lidar profiling of aerosol optical properties 5011
20 40 60 80 100 1200
5
10
15
20
25
30
Fra
ctio
n o
f p
rofi
les
(%)
Lidar Ratio (sr)
0
5
10
15
20
Nu
mb
er o
f p
rofi
les
Figure 2. Distribution of the lidar ratio (LR) values obtained by
constraining Klett’s inversion with the partial aerosol optical thick-
ness provided by the N2-Raman channel between 0.3 and 0.7 km
above ground level. The only profiles included are the 76 30 min
average profiles for which the agreement was better than 10−3 (and
this for all the 200 profiles generated by the Monte Carlo algorithm).
Profiles from Istomino village (Lake Baikal shore) have also been
removed. The red (resp. green) lines represent the LR average value
and 1σ standard deviation (resp. the median and quartiles).
with a generally low aerosol load observed near Lake Baikal
(the average AOT was only 0.07 at 355 nm).
A sample of the LR observations available in the literature
for different types of aerosols is presented in Table 1 (desert
dust), Table 2 (biomass burning) and Table 3 (anthropogenic
pollution). This shows that the LR distribution observed dur-
ing the Paris–Baikal journey is compatible with previous ob-
servations for pollution aerosols, aged smoke and mixes with
terrigenous particles (dust), which are the types of aerosol
that can be expected in such continental conditions.
In the following parts of Sect. 3, the 30 min average pro-
files are processed using Klett’s inversion with a constant LR
of 58 sr when considering the entire atmospheric column. For
specific study in the PBL, between 300 and 700 m, the N2-
Raman Channel was used to assess LR.
3.2 Classification of aerosols along the route
In order to discuss the distribution of aerosols along the tran-
sect, Fig. 3 presents the AOT and PDR inverted from all the
30 min average profiles, plotted against longitude. Profiles
recorded within a radius of 15 km are grouped and replaced
by their average, which leaves 122 profiles. To discuss the
vertical distribution of aerosols, the partial AOT and the av-
erage PDR below and above a fixed level are computed. An
altitude of 1500 m a.g.l. was chosen as it can be considered
as an average value for continental PBL or residual layer top,
i.e. the maximum altitude influenced by the ground. Values of
PDR above 1500 m a.g.l. are scarce because this ratio cannot
be computed for profiles gathered around noon (the depolar-
ization channel SNR is too low) or when the aerosol load is
too small in the free troposphere.
To obtain more insight into the type of aerosols encoun-
tered during the route, the scatter plot of PDR vs LR val-
ues in the PBL (300–700 m a.g.l.) is presented in Fig. 4. The
uncertainty on the LR values is the standard deviation of
the LR distribution provided by the Monte Carlo algorithm.
The uncertainty on the PDR value is computed following
the process described in Appendix B. Dots are coloured ac-
cording to their geographic origin. In Russia, profiles were
split between urban and background cases, the “urban” crite-
rion being a longitude difference smaller than 0.5◦ with the
city centre. Profiles were also split between the dust event
zone (longitude from 45 to 75◦ E) and the rest of the coun-
try. Cities in the dust zone are Kazan, Ufa, Chelyabinsk and
Omsk (Ishim is not included because too small); other Rus-
sian cities are Pskov, Moscow, Nizhniy-Novgorod, Novosi-
birsk, Irkutsk and Ulan-Ude (Nizhneudinsk is not included
because too small). Krasnoyarsk was analysed separately.
European part of the route. Aerosols from Europe (longi-
tude < 26◦ E, red dots in Fig. 4) are characterized by rather
high LR and low PDR values (60–102 sr and < 1 %) indi-
cating the predominance of spherical carbonaceous particles
(pollution aerosols). This is the case for large cities such as
Paris and Berlin. PDR values in the rural regions of Cen-
tral Germany are slightly higher (< 2 %). Over Germany
and Poland (particularly near Frankfurt, Berlin and Warsaw),
higher values of free tropospheric AOT show the presence
of elevated aerosols layers with PDR values similar to those
found in the PBL, suggesting that this is probably pollution
lifted up and transported from another part of Europe.
Russian part of the route. In Russian cities (black and
orange dots in Fig. 4), the urban PBL is generally charac-
terized by slightly higher PDR values (2–4 %) as compared
to Europe, which indicates that the particle composition re-
sults from a mixture of traffic and industrial emissions with
terrigenous aerosols. Russian cities east of Moscow appear
much dustier than European cities due to bad road tarmac and
lack of vegetation on traffic islands, which results in a lot of
terrigenous aerosols being lifted up by the wind and by road
traffic and injected in the urban PBL. The large dispersion of
LR values may be due to a strong variability of aerosol types.
Krasnoyarsk is the only one city where PDR values are com-
parable with European cities (yellow dots in Fig. 4) but this
is probably not due to a difference in the aerosol sources. In-
deed, heavy rain had fallen during the night before the van
went through the city and the ground was still wet, prov-
ing that the terrigenous aerosol had all been washed down.
Between Krasnoyarsk and Nizhneudinsk, AOT values up to
0.28 have been observed (Fig. 3), with a large fraction lo-
cated in the free troposphere (up to 47 %). As they are as-
sociated with very low values of PDR (< 1 %), both below
and above 1500 m a.g.l., it could either be pollution aerosols
www.atmos-chem-phys.net/15/5007/2015/ Atmos. Chem. Phys., 15, 5007–5026, 2015

5012 E. Dieudonné et al.: Lidar profiling of aerosol optical properties
Figure 3. Partial aerosol optical thickness (AOT, top) and average particle depolarization ratio (PDR, bottom) along the route, computed
below (in blue) and above (in red) 1500 m a.g.l. All values are inverted from the 30 min average profiles using Klett’s inversion with a fixed
lidar ratio of 58 sr. The average PDR is computed only when the scattering ratio is greater than 1.05.
Table 1. Values of the extinction-to-backscatter ratio (also called lidar ratio or LR) and particle depolarization ratio (PDR) reported in the
literature and observed in this study for desert dust aerosols, pure or mixed with biomass burning or pollution. For Burton et al. (2012), values
are the 25–75th (5–95th) percentiles, respectively.
Aerosol Site, campaign Instrument, λ (nm) LR PDR Reference
type inversion method (sr) (%)
Pure dust AERONET network AERONET Sun photometer 550 42± 4 – Cattrall et al. (2005)
North America, High spectral 532 44–51 31–33 Burton et al. (2012)
multi campaign resolution lidar (HSRL) (41–57) (30–35)
Morocco and Cabo Verde, N2 Raman lidar 355 58± 7 25± 3 Groß et al. (2011)
SAMUM Müller et al. (2012)
Thessaloniki (Greece) N2 Raman lidar 355 57± 29 – Amiridis et al. (2005)
(western Saharan dust)
Maldives Islands, INODEX N2 Raman lidar 355 38± 5 – Müller et al. (2007)
(Saudi Arabian dust)
Beijing (China) N2 Raman lidar 532 35± 5 – Müller et al. (2007)
(Gobi desert dust)
Tokyo (Japan) N2 Raman lidar 355 49± 9 ∼ 20 Murayama et al. (2004)
Niamey (Niger) N2 Raman lidar 355 ∼ 50 – Chazette et al. (2007)
Sahel, Middle East, India CALIOP / AERONET 532 50, 39, 44 – Schuster et al. (2012)
synergy
Cyprus (Syrian dust) N2 Raman lidar 532 34–39 28–35 Mamouri et al. (2013)
Dusty mix North America, HHSRL 532 30–42 13–20 Burton et al. (2012)
multi campaign (15–63) (10–28)
Mor./C. Verde, SAMUM N2 Raman lidar 355 75± 9 18± 3 Groß et al. (2011)
Müller et al. (2012)
Niamey (Niger) N2 Raman lidar 355 ∼ 67 – Chazette et al. (2007)
Balearic islands, HyMeX N2 Raman lidar 355 47–63 16–19 Chazette et al. (2014)
Pure dust Kazan, lower sub-layer Multi-layer Raman constr. 355 43± 14 23± 2 This study
Kazan, upper sub-layer Multi-layer Raman constr. 22± 12 20± 2
Dusty mix azan, upper sub-layer 75± 9 13± 3
Pure dust Omsk Full Raman inversion 50± 13 17± 2
Atmos. Chem. Phys., 15, 5007–5026, 2015 www.atmos-chem-phys.net/15/5007/2015/

E. Dieudonné et al.: Lidar profiling of aerosol optical properties 5013
Table 2. As Table 1, but for biomass burning aerosols, either freshly emitted or aged. When the extinction-to-backscatter ratio (LR) and the
particle depolarization ratio (PDR) have been retrieved at different wavelengths, the two values of wavelength are given.
Aerosol type Site, campaign Instrument, λ (nm) LR PDR Reference
inversion method (sr) (%)
Fresh smoke North America, High spectral 532 34–46 3–5 Burton et al. (2012)
multi campaign resolution lidar (24–54) (2–8)
Bucharest, EARLINET N2 Raman lidar 355 73± 12 – Nicolae et al. (2013)
Aged smoke AERONET network Sun-photometer 550 60± 8 – Cattrall et al. (2005)
North America, High spectral 532 55–72 4–9 Burton et al. (2012)
multi campaign resolution lidar (46–86) (2–15)
Tokyo (Siberian smoke) N2 Raman lidar 355 ∼ 40 5–8 Murayama et al. (2004)
Leipzig, EARLINET N2 Raman lidar 355–532 46± 13 < 5 Müller et al. (2005)
Thessaloniki (Greece) N2 Raman lidar 355 39–94 – Amiridis et al. (2009)
(from Russia, Ukraine )
Morocco/Cabo Verde, N2 Raman lidar 355–532 87± 17 5± 2 Tesche et al. (2011)
SAMUM
Bucharest, EARLINET N2 Raman lidar 355 32–48 – Nicolae et al. (2013)
Aged smoke Kazan Multi-layer Raman constr. 355 107± 14 4± 2 This study
Ishim Full Raman inversion 65± 6 3± 1
Omsk Full Raman inversion 76± 10 4± 2
Nizhneudinsk Full Raman inversion 63± 15 ∼ 1
Table 3. As Tables 1 and 2, but for pollution aerosols.
Site, campaign Instrument, λ (nm) LR PDR Reference
inversion method (sr) (%)
AERONET network Sun-photometer 550 71± 10 – Cattrall et al. (2005)
North America, High spectral 532 52–69 3–8 Burton et al. (2012)
multi campaign resolution lidar (42–80) (2–11)
Central Europe, EARLINET N2 Raman lidar 355–532 58± 12 < 5 Mattis et al. (2004)
Müller et al. (2007)
Paris, ESQUIF Lidar/sun-phot. synergy 532 59–77 – Chazette et al. (2005)
Paris, LISAIR N2 Raman lidar 355 83± 22 – Raut and Chazette (2007)
Paris N2 Raman lidar 355 85± 18 – Royer et al. (2011)
Po Valley CALIOP/MODIS synergy 532 83± 25 – Royer et al. (2010)
North India (INDOEX) N2 Raman lidar 532 65± 16 – Franke et al. (2001)
South India 37± 10 Franke et al. (2003)
South-East Asia 51± 20
Pearl River delta (China) N2 Raman lidar 532 47± 6 – Ansmann et al. (2005)
Beijing (China) N2 Raman lidar 532 38± 7 – Tesche et al. (2007)
Omsk (residual layer, Full Raman inversion 355 67± 12 4± 1 This study
after sunset/middle of night) 92± 18 3± 1
transported from the industrial city of Krasnoyarsk, or more
probably part of a forest fire plume.
Desert dust in Russia. The values of PDR> 10 % (Fig. 3)
between Kazan and Ufa (∼ 52◦ E) correspond to a desert dust
event, with first, an elevated layer (PDR∼ 35 %) and then,
mixing of the dust into the PBL (PDR∼ 17 %). The high-
est AOT values (up to 0.40, associated with up to 70 % of
the AOT above 1500 m a.g.l.) were observed farther east, be-
tween Ishim and Omsk (∼ 71◦ E). However, the PDR values
(5–9 %) indicate that a mixing has occurred with combus-
tion aerosols, most probably of biomass burning origin since
the region is very isolated. Indeed, combustion aerosols from
pollution or biomass burning are found with PDR values be-
low 5 % at 355 nm while aerosol mixes dominated by dust-
like particles usually have PDR values above 10 % and pure
desert dust above 20 % (see references in Tables 1, 2 and 3).
The PDR values of ∼ 35 % found between Kazan and Ufa
(Fig. 3, lower panel) are very high for dust but they were de-
www.atmos-chem-phys.net/15/5007/2015/ Atmos. Chem. Phys., 15, 5007–5026, 2015

5014 E. Dieudonné et al.: Lidar profiling of aerosol optical properties
40 60 80 100 1200
1
2
3
4
5
6
Lidar Ratio (sr)
Par
ticl
e D
epo
lari
zati
on
Rat
io (
%)
EuropeRussian citiesR. cities + dustKrasnoyarskR. backgroundR. back. + dust
Figure 4. Scatter plot of the particle depolarization ratio (PDR) vs.
lidar ratio (LR) values retrieved in the constraint zone (300–700 m
averages) for the 76 convergent 30 min average profiles from Fig. 2.
Profiles are sorted into six types of atmospheric and geographic con-
ditions.
rived using the campaign average LR in the PBL, not with
a dust-optimized LR value, which results in large uncertain-
ties. Besides, values of 38 % have already been observed at
355 nm in volcanic ash plumes (Ansmann et al., 2011). Rus-
sian cities located in the area where elevated layers of dust
were observed (orange dots in Fig. 4) do not show a different
distribution of LR and PDR compared to other Russian cities
(black dots). This indicates that the mixing of the elevated
dust layers towards the PBL was low, or that its effects were
limited as the LR values were already affected by terrigenous
aerosols from local sources lifted in the PBL.
Background aerosols. In unpopulated areas of Russia,
aerosols are probably a mix between aged particles from
biomass burning and secondary organic aerosols, so that very
low depolarization can be expected when no dust is present
(PDR< 1 %). Also, under local terrigenous aerosol source-
free conditions, the dust plume has a more sensible effect on
the PDR than in town. LR values in remote areas are rather
low (32–50 sr). However, in the absence of dust, the AOT val-
ues used as constraint are small and result in large uncertain-
ties on the LR values. Note that the smallest AOT values (be-
low 0.1 at 355 nm, Fig. 3) were derived between Pskov and
Smolensk (west of Moscow) and in Siberia between Omsk
and Novosibirsk, and close to Istomino village, on the shore
of Lake Baikal (between Irkutsk and Ulan-Ude). They corre-
spond to periods interspersed with rain.
3.3 Temporal representativeness of the observations
The lidar-derived AOT values presented in Sect. 3.1 were
compared with the AOT measured by MODIS Terra. A multi-
year average was computed from the monthly 1◦× 1◦gridded
product (MOD08_M3) using the months of June from years
2000 to 2013 (years 2001, 2003 and 2012 were removed
because, due to intense fire events, those years are too
far from the conditions encountered during the campaign).
MODIS data from the grid pixel where the lidar was lo-
cated were extracted without any spatial interpolation. For
the four AERONET stations located close to the transect
(Palaiseau, Mainz, Moscow and Irkutsk), monthly averages
were computed from the daily averages including at least
four observations, then the multi-year June average was com-
puted from years 2006 to 2013 (the time period is shorter
than for MODIS because Mainz and Irkutsk records started
in 2006). The AOT values were all converted to 355 nm
using the Ångström coefficients provided by MODIS and
AERONET. The resulting AOT values for the lidar, MODIS
and AERONET are presented in Fig. 5 (top panel).
The lidar-derived AOT stays within a 1σ interval around
the MODIS multi-annual June average during most of the
journey. The largest deviation from MODIS average was ob-
served between Ishim and Omsk, due to the mixed dust and
biomass burning event identified in Sect. 3.2. The pure dust
layers observed near Kazan, as well as the fire or pollu-
tion layers observed near Nizhneudinsk, are associated with
moderate AOT values, which remain close to the MODIS
average. However, the MODIS daily 1◦× 1◦ product (not
shown) displays AOT values larger than the lidar observa-
tions (up to 0.6), suggesting that we did not sample the heart
of the plumes. Elsewhere, AOT values standing clearly be-
low MODIS highlight the areas where we observed back-
ground aerosols, i.e. between Pskov and Smolensk (∼ 30◦ E,
west of Moscow), between Omsk and Novosibirsk (∼ 80◦ E)
and in central Germany (Leipzig area). This AOT compar-
ison shows that our observations are representative of the
aerosol load existing above Europe and Russia in June, in
the absence of exceptional fire or dust events.
In the middle and bottom panels of Fig. 5, the blue curves
(green dots) represent respectively the 470–660 (440–675)
nm Ångström coefficient and the 550 (500) nm AOT fine-
mode fraction from MODIS Terra (AERONET). The aver-
age and standard deviation have been computed the same
way as the AOT. The drop in MODIS AOT around 23◦ E
(Poland–Lithuania border) is correlated with an increase of
the Ångström coefficient and of the fine-mode fraction, in-
dicating that the aerosol mix in Russia contains more small
particles than in Europe, which is in apparent contradiction
with the observations of our lidar highlighting the presence
of a larger fraction of coarse terrigenous particles over Rus-
sia.
However, this discrepancy probably results from the dif-
ferences in the observation scales. The LR and PDR values
observed by the lidar indicate the presence of coarse ter-
rigenous aerosols in the lower PBL (300–700 m a.g.l.) and
nearby the road followed by the van, which is one of the bus-
iest of Russia with heavy truck traffic. On the other hand,
MODIS represents an average over the whole atmospheric
column and a large land surface (111× 64 km2 at 55◦ N) so it
Atmos. Chem. Phys., 15, 5007–5026, 2015 www.atmos-chem-phys.net/15/5007/2015/

E. Dieudonné et al.: Lidar profiling of aerosol optical properties 5015
0
0.2
0.4
AO
T
← P
aris
← F
ran
kfu
rt
← B
erlin
← W
arsa
w
← P
sko
v
← M
osc
ow
← N
.−N
ovg
oro
d
← K
azan
← U
fa
← C
hel
yab
insk
← Is
him
← N
ovo
sib
irsk
← O
msk
← K
rasn
oya
rsk
← N
izh
neu
din
sk
← Ir
kuts
k
← U
lan
−Ud
e
0.5
1
1.5
2
An
gst
röm
0 10 20 30 40 50 60 70 80 90 100 1100
0.5
1
Longitude (°E)
Fin
e M
od
e fr
ac.
Figure 5. Top: aerosol optical thickness (AOT) at 355 nm from the lidar (red), from MODIS Terra (blue) and from the AERONET stations
along the transect (green). Middle: Ångström coefficients from MODIS Terra (470–660 nm) and from AERONET (440–675 nm). Bottom:
AOT small-mode fraction from MODIS Terra (550 nm) and from AERONET (500 nm). For MODIS (MOD08_M3 product), the 1◦× 1◦
pixels including the van position were extracted and the months of June from years 2000 to 2013 (except years 2001, 2003 and 2012 due to
intense fire events) were used to compute MODIS average and standard deviation (blue line and shading). For AERONET, only data since
2006 were used since only Palaiseau (2.5◦ E) has data prior to this year.
Figure 6. Vertical profiles of aerosol backscatter and lidar ratio (LR)
determined from the 55 min average profile on 18 June 2013, us-
ing either the low-pass derivative filter inversion (blue) or the con-
strained Klett procedure on a sliding 200 m window (red). Shaded
areas represent the uncertainties from the Monte Carlo process.
For these mobile observations, the altitude is above mean sea level
(a.m.s.l.); the ground average altitude was around 0.1 km a.m.s.l.
is more representative of the free troposphere and of the rural
areas of Russia, where the aerosol mixture is dominated by
biomass burning particles. Only in Moscow, where the city
is large enough to occupy a significant part of the 1◦× 1◦
pixel, does MODIS exhibit a drop of the fine-mode fraction
down to European values. Those changes in the Ångström
coefficient and in the fine-mode fraction are not visible on the
sun-photometers data, maybe due to a difference between the
aerosol models used in AERONET and MODIS retrievals.
4 Characterization of dust and biomass burning
aerosols events
This section presents case studies of dust or biomass burn-
ing aerosol plumes during which a finer characterization of
the optical properties of these particles was possible through
the retrieval of their lidar ratio using a Raman or multi-layer
constrained Klett inversion. The origin of the particles is also
studied for each aerosol plume. Finally, we discuss our re-
sults taking into account the observations made in other re-
gions of the world.
4.1 Case studies
4.1.1 Dust and biomass burning aerosols observed west
of Kazan
The first significant observation of dust layers occurred near
Kazan (49◦ E, 56◦ N) on 18 June 2013. The LR and PDR
profiles are computed on a 55 min average profile recorded
just after sunset. Figure 6 presents the results from the Ra-
man inversion and from the multi-layer constrained Klett in-
version, along with the uncertainties computed through the
www.atmos-chem-phys.net/15/5007/2015/ Atmos. Chem. Phys., 15, 5007–5026, 2015

5016 E. Dieudonné et al.: Lidar profiling of aerosol optical properties
Monte Carlo process. The two inversions result in a very
good agreement above 1.05 km a.m.s.l.; below this altitude,
the constrained Klett procedure did not converge due to the
low aerosol load, meaning that the high LR values provided
in this layer by the Raman inversion are not significant ei-
ther. The uncertainties on the lidar ratio profiles are relatively
large and come from the low signal-to-noise ratio (∼ 20) due
to an averaging time limited by cloud cover.
According to the PDR profile (Fig. 6, right), the dust
layer extends from 2.05 to 3.45 km a.m.s.l (average PDR
of 19± 2 %). Compared to the references summarized in
Table 1, the lidar ratios retrieved in the upper part of
the layer (2.85–3.45 km a.m.s.l.) are typical of pure dust:
48± 16 sr (43± 14 sr) for the Raman inversion (resp. con-
strained Klett inversion). In the lower part of the layer
(2.05–2.85 km a.m.s.l.), the lidar ratio values are 78± 12 sr
(75± 9 sr) for the Raman inversion (resp. constrained Klett
inversion), which suggests a mix between dust and biomass
burning aerosols within the atmospheric column. Indeed, be-
low the dust layer, the PDR drops down to values < 10 %
that are typical for smoke (see references in Table 2). The
lidar ratios in this layer also point toward combustion parti-
cles, though the values are higher than what is reported in the
literature, with 107± 14 sr for both inversion methods (1.05–
2.05 km a.m.s.l. average).
The temporal evolution of this event is studied using 5 min
average profiles. The inversion is performed using the LR
profile derived from the constrained Klett procedure. The re-
sulting AOT, aerosol backscatter coefficient and PDR are pre-
sented in Fig. 7. The AOT is slightly lower than the values
provided by MODIS Aqua (∼ 0.5), but the satellite overpass
took place at 09:20 UTC, i.e. 8 to 9 h before the lidar obser-
vations. Moreover, the map of MODIS AOT (not shown) in-
dicates that we sampled the eastern edge of the plume, which
is confirmed by the decreasing AOT values observed as the
van moves eastwards.
The backscatter and PDR time–height cross-sections show
that the dust layer became thinner from 17:30 UTC and
moved upwards (Fig. 7, middle and bottom panels). As
the profile used for LR retrieval is an average between
17:29 and 18:24 UTC, this explains why the LR values be-
low 2.85 km a.m.s.l. correspond to a dust–smoke mix. In
contrast, the time–height cross-sections show that dust re-
mains present above 2.85 km a.m.s.l. and confirm that the
LR of 43± 14 sr retrieved in this layer can be attributed to
pure dust. The PDR reaches values of∼ 23± 2 % in the heart
of the layer (average from 17:15 to 17:45 UTC and between
2.05 and 2.85 km a.m.s.l.), which is close to other observa-
tions at 355 nm for pure dust (Table 1; Groß et al., 2011;
Müller et al., 2012). In the biomass burning layer (1.05–
1.4 km a.m.s.l.), the PDR is ∼ 4± 2 % on average while it
is ∼ 13± 3 % in the dust–smoke mix (after 18 UTC, 2–
2.8 km a.m.s.l.).
Figure 7. Aerosol optical thickness (AOT, top), backscatter (mid-
dle) and particle depolarization ratio (PDR, bottom) observed west
of Kazan on 18 June 2013 twilight as a function of UTC time and
altitude above mean sea level (a.m.s.l.). Retrieval was made us-
ing a Klett inversion with the backscatter to extinction ratio profile
from the sliding-window constrained Klett procedure (Fig. 6, mid-
dle panel).
4.1.2 Dust and biomass burning aerosols observed
above Omsk
Omsk is one of Russia’s largest industrial centres and a
1.15 million inhabitant city located 2300 km East of Moscow
(55◦ N, 73◦ E). Several oil and gas fields are exploited north
of the city, whose industry is dominated by hydrocarbon pro-
duction. The van was stationed in the centre of the city, near
the Irtysh River, during the night of 22–23 June.
Observations show the successive overpass of a dust layer
and a biomass burning layer over the van. To retrieve the li-
dar ratio, two average profiles were computed: one that sam-
ples the dust layer (16:44–19:12 UTC) and one during the
overpass of the biomass burning layer (19:12–21:42 UTC).
Figure 8 presents the LR profiles computed using the Raman
Atmos. Chem. Phys., 15, 5007–5026, 2015 www.atmos-chem-phys.net/15/5007/2015/
E. Dieudonné et al.: Lidar profiling of aerosol optical properties 5017
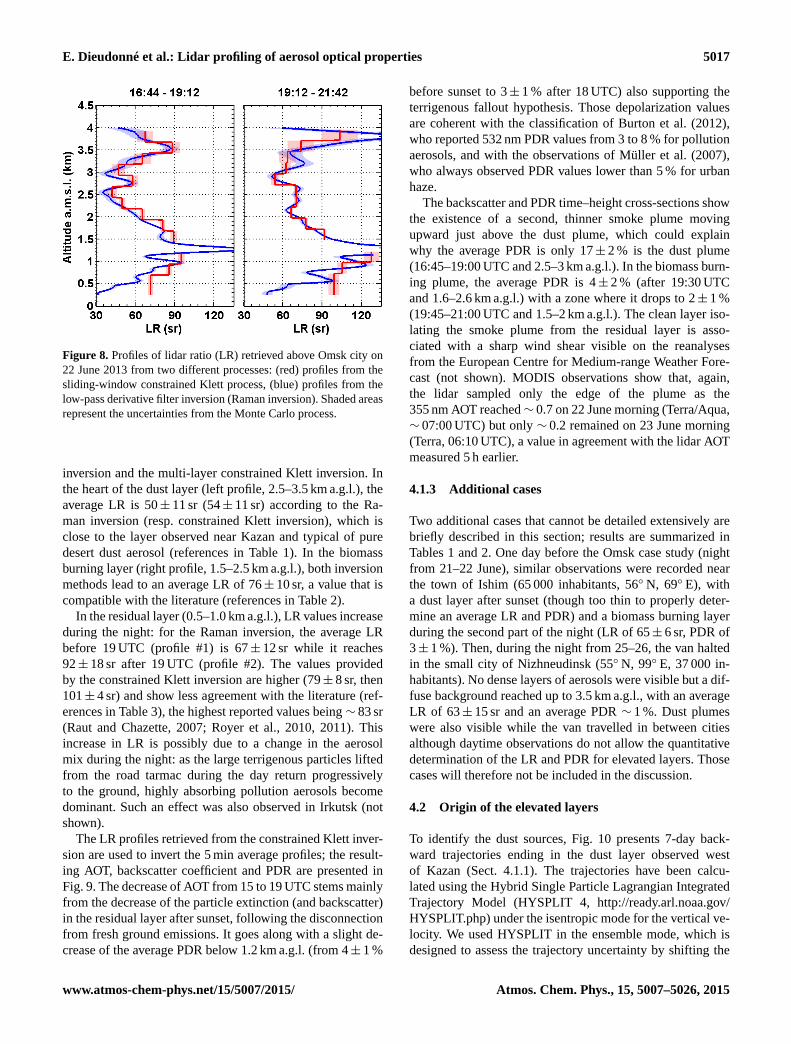
Figure 8. Profiles of lidar ratio (LR) retrieved above Omsk city on
22 June 2013 from two different processes: (red) profiles from the
sliding-window constrained Klett process, (blue) profiles from the
low-pass derivative filter inversion (Raman inversion). Shaded areas
represent the uncertainties from the Monte Carlo process.
inversion and the multi-layer constrained Klett inversion. In
the heart of the dust layer (left profile, 2.5–3.5 km a.g.l.), the
average LR is 50± 11 sr (54± 11 sr) according to the Ra-
man inversion (resp. constrained Klett inversion), which is
close to the layer observed near Kazan and typical of pure
desert dust aerosol (references in Table 1). In the biomass
burning layer (right profile, 1.5–2.5 km a.g.l.), both inversion
methods lead to an average LR of 76± 10 sr, a value that is
compatible with the literature (references in Table 2).
In the residual layer (0.5–1.0 km a.g.l.), LR values increase
during the night: for the Raman inversion, the average LR
before 19 UTC (profile #1) is 67± 12 sr while it reaches
92± 18 sr after 19 UTC (profile #2). The values provided
by the constrained Klett inversion are higher (79± 8 sr, then
101± 4 sr) and show less agreement with the literature (ref-
erences in Table 3), the highest reported values being∼ 83 sr
(Raut and Chazette, 2007; Royer et al., 2010, 2011). This
increase in LR is possibly due to a change in the aerosol
mix during the night: as the large terrigenous particles lifted
from the road tarmac during the day return progressively
to the ground, highly absorbing pollution aerosols become
dominant. Such an effect was also observed in Irkutsk (not
shown).
The LR profiles retrieved from the constrained Klett inver-
sion are used to invert the 5 min average profiles; the result-
ing AOT, backscatter coefficient and PDR are presented in
Fig. 9. The decrease of AOT from 15 to 19 UTC stems mainly
from the decrease of the particle extinction (and backscatter)
in the residual layer after sunset, following the disconnection
from fresh ground emissions. It goes along with a slight de-
crease of the average PDR below 1.2 km a.g.l. (from 4± 1 %
before sunset to 3± 1 % after 18 UTC) also supporting the
terrigenous fallout hypothesis. Those depolarization values
are coherent with the classification of Burton et al. (2012),
who reported 532 nm PDR values from 3 to 8 % for pollution
aerosols, and with the observations of Müller et al. (2007),
who always observed PDR values lower than 5 % for urban
haze.
The backscatter and PDR time–height cross-sections show
the existence of a second, thinner smoke plume moving
upward just above the dust plume, which could explain
why the average PDR is only 17± 2 % is the dust plume
(16:45–19:00 UTC and 2.5–3 km a.g.l.). In the biomass burn-
ing plume, the average PDR is 4± 2 % (after 19:30 UTC
and 1.6–2.6 km a.g.l.) with a zone where it drops to 2± 1 %
(19:45–21:00 UTC and 1.5–2 km a.g.l.). The clean layer iso-
lating the smoke plume from the residual layer is asso-
ciated with a sharp wind shear visible on the reanalyses
from the European Centre for Medium-range Weather Fore-
cast (not shown). MODIS observations show that, again,
the lidar sampled only the edge of the plume as the
355 nm AOT reached∼ 0.7 on 22 June morning (Terra/Aqua,
∼ 07:00 UTC) but only ∼ 0.2 remained on 23 June morning
(Terra, 06:10 UTC), a value in agreement with the lidar AOT
measured 5 h earlier.
4.1.3 Additional cases
Two additional cases that cannot be detailed extensively are
briefly described in this section; results are summarized in
Tables 1 and 2. One day before the Omsk case study (night
from 21–22 June), similar observations were recorded near
the town of Ishim (65 000 inhabitants, 56◦ N, 69◦ E), with
a dust layer after sunset (though too thin to properly deter-
mine an average LR and PDR) and a biomass burning layer
during the second part of the night (LR of 65± 6 sr, PDR of
3± 1 %). Then, during the night from 25–26, the van halted
in the small city of Nizhneudinsk (55◦ N, 99◦ E, 37 000 in-
habitants). No dense layers of aerosols were visible but a dif-
fuse background reached up to 3.5 km a.g.l., with an average
LR of 63± 15 sr and an average PDR ∼ 1 %. Dust plumes
were also visible while the van travelled in between cities
although daytime observations do not allow the quantitative
determination of the LR and PDR for elevated layers. Those
cases will therefore not be included in the discussion.
4.2 Origin of the elevated layers
To identify the dust sources, Fig. 10 presents 7-day back-
ward trajectories ending in the dust layer observed west
of Kazan (Sect. 4.1.1). The trajectories have been calcu-
lated using the Hybrid Single Particle Lagrangian Integrated
Trajectory Model (HYSPLIT 4, http://ready.arl.noaa.gov/
HYSPLIT.php) under the isentropic mode for the vertical ve-
locity. We used HYSPLIT in the ensemble mode, which is
designed to assess the trajectory uncertainty by shifting the
www.atmos-chem-phys.net/15/5007/2015/ Atmos. Chem. Phys., 15, 5007–5026, 2015

5018 E. Dieudonné et al.: Lidar profiling of aerosol optical properties
Figure 9. Aerosol optical thickness (AOT, top), backscatter (middle) and particle depolarization ratio (bottom) retrieved above Omsk during
the night of 22–23 June 2013 as a function of UTC time and altitude above ground level (a.g.l.). Retrieval was made using a Klett inversion
with the lidar ratio profiles from Fig. 8.
wind field at the ending point by one grid point in each of the
three directions, giving 27 back-trajectories.
The fact that 20 of the back-trajectories do not enter
the PBL during their journey shows that the air mass was
mostly of free tropospheric origin, which is not surpris-
ing as MODIS already showed that the lidar sampled only
the edge of the plume. Among the seven remaining back-
trajectories, ground contact occurred in the northwestern
and central parts of Kazakhstan, in the Volga mouth region
(northwest bank of the Caspian Sea) and in the area between
the Caspian and Aral seas. MODIS true colour reflectance
(Fig. 10 background) shows that the Caspian–Aral region
is a desert area, and geological maps available from the
European Soil Portal (http://eusoils.jrc.ec.europa.eu/library/
esdac/index.html) confirm that large sandy areas stand at the
south and east of the Aral Sea (Kyzylkum and Karakum
deserts), and to a lesser extent at the northwest of the Caspian
Sea. In the area between the Aral and Caspian seas, and also
in large parts of central Kazakhstan, soils are of loamy type,
even including clay deserts like in the Sahel (takyr) or salt
deserts (solonchak). Conditions for dust lifting are thus gath-
ered in this region.
To identify the origin of the biomass burning particles ob-
served along with the dust, MODIS fire hotspots are also
indicated in Fig. 10 (MCD14ML product from the Univer-
sity of Maryland; Giglio et al., 2006). Fires coinciding with
the back-trajectories are located in the steppes near the west-
ern Russian–Kazakh border and to the northwest of the Aral
Sea. Regarding the possibility of those particles to actually
be anthropogenic pollution, the cities of Saratov (51.5◦ N,
46◦ E, ∼ 840 000 inhabitants) and Volgograd (49◦ N, 44◦ E,
∼ 1 million inhabitants) could have contributed. However,
only a more detailed backward dispersion study could con-
firm this and meanwhile, a wildfire burning origin remains
much more likely.
Figure 11 displays a similar ensemble of HYSPLIT 7-day
back-trajectories, but ending in the dust layer observed above
Omsk. Those trajectories confirm that it has the same ori-
Atmos. Chem. Phys., 15, 5007–5026, 2015 www.atmos-chem-phys.net/15/5007/2015/

E. Dieudonné et al.: Lidar profiling of aerosol optical properties 5019
Figure 10. Seven-day back-trajectories ending in the dust layer ob-
served west of Kazan city on 18 June 2013, computed using HYS-
PLIT Lagrangian model in single (bold line) and ensemble mode
(thin lines). Trajectories are coloured following the altitude above
ground level (a.g.l.): red parts correspond to ground contact. Ticks
are spaced by 24 h. Pink stars represent MODIS fire hotspots de-
tected during the trajectories time period.
gin as the dust layer observed near Kazan 5 days earlier, i.e.
the sandy/loamy soils of southwestern Kazakhstan. Inciden-
tally, from Moscow (16 June) to Omsk (22 June), the van
travelled eastwards at the same pace as a high-pressure sys-
tem. As the winds curled around the anticyclone, air masses
which had passed over the Caspian–Aral region were con-
tinuously brought up to the north, producing dust outbreaks
over 2300 km, from 38 to 73◦ E. The weak and changing
winds prevailing near the centre of the anticyclone are also
responsible for the erratic shape of the early part of the tra-
jectories.
The back-trajectories (not shown) ending in the biomass
burning layer observed above Omsk a few hours later are
very similar to those presented on Fig. 11. MODIS highlights
three fire areas located in the steppes of northwestern Kaza-
khstan (51◦ N–54◦ E, 50◦ N–56◦ E and 48◦ N–57◦ E) that had
significant fire power (90 to 120 MW) and were overpassed
at low altitude by the back-trajectories. Fire hotspots were
also observed by MODIS in the wooded area located under
the latest part of the back-trajectories (60–62◦ N, 69–73◦ E).
However, their fire radiative power is low (max. 38 MW) so
that it is doubtful that the smoke was injected as high as the
back-trajectories (∼ 2 km a.g.l.). However, larger fires might
have escaped the eyes of MODIS as the back-trajectories
travelled along the southern edge of a cloud system.
Back-trajectories ending above Nizhneudinsk (not shown)
indicate that the air mass came from the forests areas of the
Figure 11. As Fig. 10, but with trajectories ending in the dust layer
observed above Omsk city on 22 June 2013.
far north but a dense cloud cover blinded MODIS and pre-
vented the identification of the aerosol sources.
4.3 Discussion
To summarize, LR and PDR values from the different case
studies are recalled in the lower part of Table 1 (desert dust)
and Table 2 (biomass burning), along with the references they
can be compared with.
4.3.1 Desert dust aerosols
Particle depolarization ratio. The 23± 2 % PDR retrieved in
the Kazan dust layer confirms it was pure desert dust. Indeed,
it falls in between the two values reported in the literature
for PDR at 355 nm which are ∼ 20 % for Gobi desert dust
advected over Tokyo (Murayama et al., 2004) and 25± 6 %
in Saharan dust layers advected over Morocco and Cabo
Verde during the Saharan Mineral dust experiments (SA-
MUM; Groß et al., 2011; Müller et al., 2012). For mixes of
desert dust with biomass burning (“dusty mixes”), the values
retrieved near Kazan (13± 3 %) and above Omsk (17± 2 %)
are difficult to compare as the PDR strongly depends on
the proportions of the aerosol mix. Values of 18± 3 % have
been reported during SAMUM (Groß et al., 2011; Müller et
al., 2012), whereas Chazette et al. (2014) found 16 to 19 %
in Saharan dust layers advected over the Balearic Islands
during the Hydrological cycle in Mediterranean Experiment
(HyMeX) campaign. Simultaneous observations at 355 and
532 nm during the SAMUM campaigns showed that the de-
polarization of desert dust aerosols increases with wave-
length (Groß et al., 2011; Müller et al., 2012) so that the 28 to
35 % PDR values reported at 532 nm by Burton et al. (2012)
www.atmos-chem-phys.net/15/5007/2015/ Atmos. Chem. Phys., 15, 5007–5026, 2015

5020 E. Dieudonné et al.: Lidar profiling of aerosol optical properties
and Mamouri et al. (2013) cannot be compared directly to
our Russian observations.
Extinction-to-backscatter (lidar) ratio. The 355 nm LR
values reported in the literature for pure desert dust range
from 38± 5 sr for Saudi Arabian dust advected over the
Maldives Islands during INDOEX (Müller et al., 2007) to
58± 7 sr for western Saharan dust during SAMUM (Müller
et al., 2012). The observations during SAMUM also show a
slight decrease of the lidar ratio from 355 to 532 nm (Müller
et al., 2012). Indeed, the range of values at this wavelength
is slightly lower, with 34 to 39 sr for Syrian dust advected
over Cyprus (Mamouri et al., 2013) and 44 to 51 sr for an
ensemble of airborne campaigns over North America and the
Caribbean (Burton et al., 2012). The observations presented
in this paper are therefore in good agreement, as we retrieved
43± 14 sr for pure desert dust (Kazan case) and 50± 13 sr
for an aerosol mix containing a large fraction of dust, as in-
dicated by its 17 % PDR (Omsk case). Schuster et al. (2012)
showed that the lidar ratio of desert dust has a strong ge-
ographic dependency, following changes in the mineralogi-
cal composition of the dust particles. Our observations cor-
respond to the LR values retrieved in the Sahel by Schuster
et al. (2012). Unfortunately we cannot relate it to the min-
eralogical composition of dust particles in the Caspian–Aral
region, as we could not find information on that point. Re-
garding dusty mixes, the comparison is difficult as the LR,
like the PDR, will strongly depend on the proportions of dust
in the mix; one can just note that the 75± 9 sr retrieved in the
dust-smoke mix west of Kazan are identical to the SAMUM
observations (Groß et al., 2011).
4.3.2 Biomass burning aerosols
Particle depolarization ratio. During this campaign, aged
smoke plumes of two origins were sampled: particles com-
ing from fires in the steppes or forests of northern Kaza-
khstan/southern Russia have PDR values of 3 to 4 %, whereas
particles coming from forest fires in Far North Siberia have
a very low PDR of ∼ 1 % (Nizhneudinsk case). In the litera-
ture, depolarization ratios for aged smoke are 4–9 % (Bur-
ton et al., 2012), 5± 2 % (Tesche et al., 2011) or < 5 %
(Müller et al., 2007), for measurements that were all per-
formed at 532 nm. No simultaneous observations of PDR at
355 and 532 nm exist for biomass burning aerosols, although
measurement of a mixed smoke and dust layer suggest that
the PDR does not vary much with wavelength (Groß et al.,
2011). Therefore, the PDR values retrieved for smoke com-
ing from Kazakhstan/southern Russia are in good agreement
with the literature.
Particles from the Far North observed above Nizhneudinsk
have a lower depolarization ratio than every observations re-
ported. However, Nisantzi et al. (2014) showed that the de-
polarization of smoke layers strongly depends on their dust
content, that will itself depend on the soil nature around the
fire (as dust can be lifted by the eddies caused by the fire
heat) and on the plume age (as the coarse dust particles will
quickly fall out). This might explain why smoke from Kaza-
khstan, where the ground is semi-desert, exhibits a higher de-
polarization than smoke from northern Siberia. Besides, the
low value of extinction in this plume indicates that the par-
ticle concentration is small, suggesting that, rather than the
plume from a single large fire, this might result from a mix
between smoke from several small scattered fires and bio-
genic aerosols (secondary organics) collected all along the
air mass journey over the plains of northern Siberia.
Lidar ratio. Simultaneous observations at 355 and 532 nm
showed a strong variability of the LR of biomass burning
aerosols with wavelength (Müller et al., 2005; Murayama et
al., 2004; Nicolae et al., 2013; Tesche et al., 2011) so our
measurements will be compared preferentially with other ob-
servations at 355 nm. Amiridis et al. (2005) report a large
dispersion of 355 nm LR values, from 39 to 94 sr, based on
statistics over 4 years of smoke plumes from Russia and
Ukraine advected above Greece. Other observations gener-
ally display LR values in the lower range of this interval:
∼ 40 sr in a Siberian plume advected over Tokyo (Murayama
et al., 2004), 46± 13 sr in Siberian and Canadian plumes ad-
vected over Germany (Müller et al., 2005) and 32 to 48 sr
in plumes from Ukraine and Russia (Nicolae et al., 2013).
However, 87± 17 sr (∼ 100± 25 sr) have also been retrieved
in an African smoke plume during SAMUM (AMMA) by
Tesche et al. (2011) (Chazette et al., 2007). Three of our
observations are in good agreement with those references,
i.e. the cases from Ishim (65± 6 sr), Omsk (76± 10 sr) and
Nizhneudinsk (63± 15 sr). The 107± 14 sr observed west of
Kazan is above all other observations but not incompatible
with Amiridis et al. (2005) or Tesche et al. (2011) given the
large uncertainty.
5 Conclusions
For 1 full month, a mobile N2-Raman and depolarization
lidar probed aerosols along the 10 000 km ride from Paris
to Ulan-Ude (2 to 108◦ E, ∼ 55◦ N). A systematic data-
processing was performed on the 30 min average profiles: the
Raman channel was used to constrain the average extinction-
to-backscatter ratio (i.e. lidar ratio or LR) between 300 and
700 m a.g.l. The campaign average LR was found to be
63± 17 sr along the journey and 70± 20 sr in the isolated
village of Istomino (Lake Baikal shore). The distribution of
the LR and PDR values shows that aerosols in Europe are
characterized by higher LR values (60–102 sr) and very low
PDR (< 1 %) both in cities and in the countryside, indicating
the dominance of pollution aerosols. In Russia, the LR val-
ues are more variable (44–106 sr) and a clear distinction ex-
ists between the countryside (PDR < 1 % as in Europe) and
the cities (PDR> 2 %). The higher depolarization in Russian
cities is likely due to the significant amount of terrigenous
Atmos. Chem. Phys., 15, 5007–5026, 2015 www.atmos-chem-phys.net/15/5007/2015/
E. Dieudonné et al.: Lidar profiling of aerosol optical properties 5021
aerosols lifted by vehicles or by the wind from the roads and
sidewalks that generally have a bad tarmac.
Fixed measurements were performed in the cities during
the night stops and enabled the determination of LR profiles
through a complete Raman inversion or a multi-layer con-
strained Klett inversion. Several events of biomass burning
plumes were recorded during these nighttime observations,
with LR values ranging from 63 to 107 sr and PDR values of
from 1 to 4 %. Desert dust layers were also observed, with
LR (PDR) values of 43± 14 sr (23± 2 %) for pure dust and
75± 9 sr (13± 3 %) for a mixed dust and biomass burning
layer. The back-trajectory analysis identifies the dust source
in the region of the Caspian and Aral Seas (southwestern
Kazakhstan), an area whose dust emissions had not been
characterized so far. Moreover, dust layers were observed
from Moscow to Omsk (37–73◦ E, ∼ 2300 km), demonstrat-
ing that the Caspian–Aral region can give birth to large dust
events spreading over wide areas of Russia and lasting for
several days. Such an event does not require special condi-
tions but a regular anticyclone moving eastwards over north-
ern Kazakhstan, meaning such dust spreading could happen
regularly and contribute significantly to the aerosol budget in
southern Russia.
This ground-based mobile campaign provides a unique
picture of summer aerosols in areas where observations are
usually scarce. Although it is only a snapshot and no clima-
tology, these observations hold more representativeness for
two reasons: first, the lidar instrument involved in this cam-
paign enabled the determination of two intensive properties
of the particles (LR and PDR) that do not depend on aerosol
amounts. And secondly, the comparison with a multi-annual
average of MODIS Terra observations showed that the AOT
values observed during the campaign are representative of
the aerosol loads existing over Europe and Russia in the ab-
sence of exceptional fire events. Only the area where the dust
event took place stands out from MODIS multi-annual aver-
age; however, it offered the opportunity to characterize the
unstudied desert dust from the Caspian–Aral region.
www.atmos-chem-phys.net/15/5007/2015/ Atmos. Chem. Phys., 15, 5007–5026, 2015
5022 E. Dieudonné et al.: Lidar profiling of aerosol optical properties
Appendix A: Details of the lidar ratio retrieval processes
Raman inversion. To differentiate the optical depth profile
provided by the Raman channel, we use a low-pass derivative
filter the kernel of which is based on the first derivative of a
Gaussian curve (ter Haar Romeny et al., 1993) as it allows
a much better rejection of high frequencies, i.e. short-scale
fluctuations in the extinction profile, than the more com-
monly used Savitzky–Golay filters or sliding window linear
fit (the difference is around 30 dB). To take into account the
decrease of the signal-to-noise ratio (SNR) with increasing
altitude, the filter width σ is increased following a saturat-
ing exponential function σ (z)= a+ b× (1− exp(−z/1.5))
with z the altitude above ground level (a.g.l.) in km. The ef-
fective vertical resolution of the retrieved extinction profile
is defined as the inverse of the spatial cut-off frequency (i.e.
the frequency at which the filter response reaches 1/e of its
maximum amplitude). With a = 3 and b = 7 (our standard
set of parameters), the effective vertical resolution tends to-
wards 200 m at 5 km a.g.l., while the pair a = 1 and b = 24
(which we use in low-SNR conditions) produces a coarser
resolution profile (∼ 500 m).
Single-layer constrained Klett inversion. The Raman
channel is used to determine the partial AOT between 300
(complete overlap) and 700 m a.g.l. (range limit) which is
then used to constrain the LR used in the Klett inversion. The
principle is the same as described in Royer et al. (2011), ex-
cept that the convergence is not dealt with using a dichotomy
algorithm. Indeed, due to the transmission by the upper lay-
ers, the partial AOT is not always a monotonic function of
the LR. Instead, the extinction profile is inverted using 13 LR
values distributed from 10 to 130 sr, a range covering LR val-
ues observed in the literature for the main types of aerosols
(Tables 1, 2 and 3). Then, the interval is narrowed between
the two LR values that produce the best partial AOT and the
process is repeated. After three iterations, the LR value giv-
ing the best agreement with the Raman constraint is chosen,
the LR is known by 0.1 sr and the agreement is better than
10−3, if a solution exists. According to the sensitivity study
carried out by Royer et al. (2011), the main source of un-
certainty on the LR value is the random detection processes.
It leads to a relative error on the LR ranging between 4 and
18 % (16 to 100 %) during nighttime (daytime) for AOT val-
ues ranging from 0.1 to 0.5 and with a SNR of 35 (10). For
the lidar-derived AOT the relative uncertainty is between 4
and 16 % (12 to 40 %) during nighttime (daytime) for the
same SNR values.
Multi-layer constrained Klett inversion. When the Raman
channel has a longer detection range than 700 m a.g.l. (during
nighttime), the process described in the previous section can
be applied over several successive layers. At first, the con-
straint zone is located just below the normalization zone, or
just below the limit range of the Raman channel. The LR
value giving the best agreement between the partial AOT
from the Raman channel and from Klett’s inversion is deter-
mined and attributed to this layer. Then, the constraint zone is
translated downwards and the process is repeated until reach-
ing the ground level. Layers where the aerosol load is too
small (average extinction coefficient lower than 0.02 km−1)
are ignored and the LR from the layer located directly above
them is kept. The constraint zone width is chosen between
200 and 900 m, depending on the aerosol load. The case stud-
ies that will be presented in Sect. 4 show that this method
gives similar results as the derivative Raman inversion, with
the advantage of producing a smoother LR profile (no fluctu-
ations in the layers with a low aerosol load).
Appendix B: Uncertainties on the depolarization
Apart from measurement noise, the sources of error on the re-
trieved PDR are (i) the uncertainty on the lidar ratio, (ii) the
uncertainty on the gain ratio and (iii) the error on the cross-
talk between the total and perpendicular polarization chan-
nels. The impact of the former is estimated using the uncer-
tainty on the lidar ratio when it is known (i.e. for case stud-
ies) or by varying LR by an arbitrary ±10 sr as in Freuden-
thaler et al. (2009), which corresponds to a 48–68 sr interval,
for the systematic processing. The second and third terms
are assessed by varying both the gain ratio (by its observed
variability) and the coefficients of the separating plates (mea-
sured in the lab) by ±5 %. When considering the average
PDR in a layer, like in Sect. 4.1, the atmospheric variability
(measured as the vertical standard deviation) in the layer is
added as a fourth source of error. The contributions are then
combined through a quadratic sum.
The error on PDR estimated by the process explained
above is computed by a Monte Carlo simulation of dummy
lidar profiles with thin layers (scattering ratio between 1.02
and 1.2) in the noise conditions of each study (i.e. systematic
processing, nighttime case study 50 min average and 5 min
average). As an example, Fig. B1 shows the results of this
simulation conducted in the conditions of the Kazan case
study (50 min average after dusk), for a layer with a homo-
geneous PDR of 1 or 5 %, a scattering ratio from 1.02 to 1.2,
and error on LR varying from 2 to 10 sr. The error on the
gain ratio and on the coefficients of the polarization separa-
tion plates is fixed at 5 % each. Note that because of the small
number of average profiles and the remaining sunlight after
dusk, the noise condition considered here represents a worst
case for nighttime observations. We find that, given the cho-
sen scattering ratio threshold of 1.05, the relative uncertainty
on the PDR is largely constrained by the one on the lidar ra-
tio for PDR values of 5 % and above and below 4 km a.g.l. –
because of the error on the gain ratio, this relative uncertainty
is always at least 7 %. For very low PDR values, the absolute
uncertainty mostly depends on noise conditions, but remains
above 0.2 %.
Atmos. Chem. Phys., 15, 5007–5026, 2015 www.atmos-chem-phys.net/15/5007/2015/

E. Dieudonné et al.: Lidar profiling of aerosol optical properties 5023
Figure B1. Monte Carlo simulation of error on PDR measurements in the noise conditions of the Kazan case study; (a) mean retrieval for
dummy PDR profile of 5 % from 0 to 4 km a.gl., (b) effects of error parameters and Monte Carlo simulated root-mean-squared error for a
scattering ratio of 1.05 and an error on LR of 5 sr, (c) and (d) the same, for PDR= 1 % from 0 to 4 km.
www.atmos-chem-phys.net/15/5007/2015/ Atmos. Chem. Phys., 15, 5007–5026, 2015

5024 E. Dieudonné et al.: Lidar profiling of aerosol optical properties
Acknowledgements. The authors would like to thank Fred-
erik Paulsen, Honorary Consul for the Russian Federation in the
canton of Vaud, Switzerland, both for his financial support and
for obtaining the permission to operate in Russia. The authors are
also very grateful to Alexander Ayurzhanaev from the Siberian
Branch of the Russian Academy of Sciences, Laboratory of Physics
of Atmospheric Processes, Ulan-Ude, for his vital help with the
logistics of the journey while he was aboard the van. We also
thank Yoann Chazette for his help during the trip. Finally, the
authors thank Cyril Moulin, head of the Laboratoire des Sciences
du Climat et de l’Environnement, for his support and assistance in
the administrative part of the project.
Edited by: A. Petzold
References
Amiridis, V., Balis, D. S., Kazadzis, S., Bais, A., Giannakaki, E.,
Papayannis, A., and Zerefos, C.: Four-year aerosol observations
with a Raman lidar at Thessaloniki, Greece, in the framework
of European Aerosol Research Lidar Network (EARLINET), J.
Geophys. Res., 110, D21203, doi:10.1029/2005JD006190, 2005.
Amiridis, V., Balis, D. S., Giannakaki, E., Stohl, A., Kazadzis, S.,
Koukouli, M. E., and Zanis, P.: Optical characteristics of biomass
burning aerosols over Southeastern Europe determined from UV-
Raman lidar measurements, Atmos. Chem. Phys., 9, 2431–2440,
doi:10.5194/acp-9-2431-2009, 2009.
Ansmann, A., Riebesell, M., and Weitkamp, C.: Measurement of
atmospheric aerosol extinction profiles with a Raman lidar, Opt.
Lett., 15, 746–748, doi:10.1364/OL.15.000746, 1990.
Ansmann, A., Engelmann, R., Althausen, D., Wandinger, U., Hu,
M., Zhang, Y., and He, Q.: High aerosol load over the Pearl River
Delta, China, observed with Raman lidar and Sun photome-
ter, Geophys. Res. Lett., 32, 13815, doi:10.1029/2005GL023094,
2005.
Ansmann, A., Tesche, M., Seifert, P., Groß, S., Freudenthaler, V.,
Apituley, A., Wilson, K. M., Serikov, I., Linné, H., Heinold, B.,
Hiebsch, A., Schnell, F., Schmidt, J., Mattis, I., Wandinger, U.
and Wiegner, M.: Ash and fine-mode particle mass profiles from
EARLINET-AERONET observations over central Europe after
the eruptions of the Eyjafjallajökull volcano in 2010, J. Geophys.
Res. Atmos., 116, D00U02, doi:10.1029/2010JD015567, 2011.
Bates, T. S., Huebert, B. J., Gras, J. L., Griffiths, F. B.,
and Durkee, P. A.: International Global Atmospheric Chem-
istry (IGAC) Project’s First Aerosol Characterization Exper-
iment (ACE1): Overview, J. Geophys. Res., 103, 16297,
doi:10.1029/97JD03741, 1998.
Burton, S. P., Ferrare, R. A., Hostetler, . A, Hair, J. W., Rogers, R.
R., Obland, M. D., Butler, C. F., Cook, A. L., Harper, D. B., and
Froyd, K. D.: Aerosol classification using airborne High Spectral
Resolution Lidar measurements – methodology and examples,
Atm. Meas. Tech., 5, 73–98, doi:10.5194/amt-5-73-2012, 2012.
Cattrall, C., Reagan, J., Thome, K., and Dubovik, O.: Variabil-
ity of aerosol and spectral lidar and backscatter and extinc-
tion ratios of key aerosol types derived from selected Aerosol
Robotic Network locations, J. Geophys. Res., 110, D10S11,
doi:10.1029/2004JD005124, 2005.
Chazette, P., Randriamiarisoa, H., Sanak, J., Couvert, P., and
Flamant, C.: Optical properties of urban aerosol from air-
borne and ground-based in situ measurements performed dur-
ing the Etude et Simulation de la Qualité de l’air en Ile
de France (ESQUIF) program, J. Geophys. Res., 110, 2206,
doi:10.1029/2004JD004810, 2005.
Chazette, P., Sanak, J., and Dulac, F.: New approach for aerosol
profiling with a lidar onboard an ultralight aircraft: application
to the African Monsoon Multidisciplinary Analysis, Env. Sci.
Tech., 41, 8335–8341, 2007.
Chazette, P., Raut, J.-C., Dulac, F., Berthier, S., Kim, S.-W.,
Royer, P., Sanak, J., Loaëc, S., and Grigaut-Desbrosses, H.:
Simultaneous observations of lower tropospheric continental
aerosols with a ground-based, an airborne, and the space-
borne CALIOP lidar system, J. Geophys. Res., 115, D00H31,
doi:10.1029/2009JD012341, 2010.
Chazette, P., Dabas, A., Sanak, J., Lardier, M., and Royer, P.: French
airborne lidar measurements for Eyjafjallajökull ash plume sur-
vey, Atmos. Chem. Phys., 12, 7059–7072, doi:10.5194/acp-12-
7059-2012, 2012.
Chazette, P., Marnas, F., and Totems, J.: The mobile Water vapor
Aerosol Raman LIdar and its implication in the frame of the
HyMeX and ChArMEx programs: application to a dust transport
process, Atm. Meas. Tech., 7, 1629–1647, doi:10.5194/amt-7-
1629-2014, 2014.
Deuzé, J. L., Bréon, F.-M., Devaux, C., Goloub, P., Herman, M.,
Lafrance, B., Maignan, F., Marchand, A., Nadal, F., Perry, G.,
and Tanré, D.: Remote sensing of aerosols over land surfaces
from POLDER-ADEOS-1 polarized measurements, J. Geophys.
Res., 106, 4913–4926, 2001.
Franke, K., Ansmann, A., Müller, D., Althausen, A., Wagner, F., and
Scheele, R.: One-year observations of particle lidar ratio over the
tropical Indian Ocean with Raman lidar, Geophys. Res. Lett., 28,
4559–4562, 2001.
Franke, K., Ansmann, A., Müller, D., Althausen, D., Venkatara-
man, C., Shekar Reddy, M., Wagner, F. and Scheele, R.: Optical
properties of the Indo-Asian haze layer over the tropical Indian
Ocean, J. Geophys. Res., 108, 4059, doi:10.109/2002JD002473,
2003.
Freudenthaler, V., Esselborn, M., Wiegner, M., Heese, B., Tesche,
M., Ansmann, A., Müller, D., Althausen, D., Wirth, M., Fix, A.,
Ehret, G., Knippertz, P., Toledano, C., Gasteiger, J., Garhammer,
M., and Seefeldner, M.: Depolarization ratio profiling at several
wavelengths in pure Saharan dust during SAMUM 2006, Tellus,
Ser. B Chem. Phys. Meteorol., 61, 165–179, 2009.
Giglio, L., Csiszar, I., and Justice, C. O.: Global distribution and
seasonality of active fires as observed with the Terra and Aqua
Moderate Resolution Imaging Spectroradiometer (MODIS) sen-
sors, J. Geophys. Res., 111, 2016, doi:10.1029/2005JG000142,
2006.
Groß, S., Tesche, M., Freudenthaler, V., Toledano, C., Wiegner, M.,
Ansmann, A., Althausen, D., and Seefeldner, M.: Characteriza-
tion of Saharan dust, marine aerosols and mixtures of biomass-
burning aerosols and dust by means of multi-wavelength depolar-
ization and Raman lidar measurements during SAMUM 2, Tel-
lus, Ser. B Chem. Phys. Meteorol., 63, 706–724, 2011.
Heintzenberg, J., Birmili, W., Seifert, P., Panov, A., Chi, X., and An-
dreae, M.: Mapping the aerosol over Eurasia from the Zotino Tall
Atmos. Chem. Phys., 15, 5007–5026, 2015 www.atmos-chem-phys.net/15/5007/2015/
E. Dieudonné et al.: Lidar profiling of aerosol optical properties 5025
Tower, Tellus B, 65, 20062, doi:10.3402/tellusb.v65i0.20062,
2013.
Holben, B. N., Eck, T. F., Slutsker, I., Tanré, D., Buis, J. P., Setzer,
A., Vermote, E., Reagan, J. A., Kaufman, Y. J., Nakajima, T.,
Lavenu, F., Jankowiak, I., and Smirnov, A.: AERONET-A Fed-
erated Instrument Network and Data Archive for Aerosol Char-
acterization, Rem. Sens. Env., 66, 1–16, d 1998.
Huebert, B. J., Bates, T., Russell, P. B., Shi, G., Kim, Y. J., Kawa-
mura, K., Carmichael, G., and Nakajima, T.: An overview of
ACE-Asia: Strategies for quantifying the relationships between
Asian aerosols and their climatic impacts, J. Geophys. Res., 108,
8633, doi:10.1029/2003JD003550, 2003.
IPCC: The Physical Science Basis, Contribution of Working Group
I to the Fifth Assessment Report of the Intergovernmental Panel
on Climate Change, edited by: Stocker, T. F., Qin, D., Plattner,
G.-K., Tignor, M., Allen, S. K., Boschung, J., Nauels, A., Xia, Y.,
Bex, V., and Midgley, P. M., Cambridge University Press, Cam-
bridge, United Kingdom and New York, NY, USA, 2013.
King, M. D., Kaufman, Y. J., Menzel, W. P., and Tanré, D.: Re-
mote sensing of cloud, aerosol, and water vapor properties from
the moderate resolution imaging spectrometer (MODIS), IEEE
T. Geosci. Remote, 30, 2–27, 1992.
Klett, J. D.: Lidar inversion with variable backscatter/extinction ra-
tios, Appl. Opt., 24, 1638–1643, 1985.
Law, K. S., Stohl, A., Quinn, P. K., Brock, C., Burkhart, J., Paris, J.-
D., Ancellet, G., Singh, H. B., Roiger, A., Schlager, H., Dibb,
J., Jacob, D. J., Arnold, S. R., Pelon, J., and Thomas, J. L.:
Arctic Air Pollution: New Insights From POLARCAT-IPY, Bull.
Am. Meteorol. Soc., 95, 1873—1895, doi:10.1175/BAMS-D-13-
00017.1, 2015.
Lebel, T., Parker, D. J., Flamant, C., Bourlès, B., Marticorena,
B., Mougin, E., Peugeot, C., Diedhiou, A., Haywood, J. M.,
Ngamini, J. B., Polcher, J., Redelsperger, J.-L., and Thorncroft,
C. D.: The AMMA field campaigns: multiscale and multidisci-
plinary observations in the West African region, Q. J. R. Meteo-
rol. Soc., 136, 8–33,2010.
Mamouri, R. E., Ansmann, A., Nisantzi, A., Kokkalis, P., Schwarz,
A., and Hadjimitsis, D.: Low Arabian dust extinction-to-
backscatter ratio, Geophys. Res. Lett., 40, 4762–4766, 2013.
Mattis, I., Ansmann, A., Müller, D., Wandinger, U., and Althausen,
D.: Multiyear aerosol observations with dual-wavelength Raman
lidar in the framework of EARLINET, J. Geophys. Res., 109,
13203, doi:10.1029/2004JD004600, 2004.
Molina, L. T., Madronich, S., Gaffney, J. S., Apel, E., De Foy,
B., Fast, J., Ferrare, R., Herndon, S., Jimenez, J. L., Lamb, B.,
Osornio-Vargas, A. R., Russell, P., Schauer, J. J., Stevens, P.
S., Volkamer, R., and Zavala, M.: An overview of the MILA-
GRO 2006 Campaign: Mexico City emissions and their trans-
port and transformation, Atm. Chem. Phys., 10, 8697–8760,
doi:10.5194/acp-10-8697-2010, 2010.
Müller, D., Mattis, I., Wandinger, U., Ansmann, A., Althausen, D.,
and Stohl, A.: Raman lidar observations of aged Siberian and
Canadian forest fire smoke in the free troposphere over Ger-
many in 2003: Microphysical particle characterization, J. Geo-
phys. Res., 110, 17201, doi:10.1029/2004JD005756, 2005.
Müller, D., Ansmann, A., Mattis, I., Tesche, M., Wandinger, U.,
Althausen, D., and Pisani, G.: Aerosol-type-dependent lidar ra-
tios observed with Raman lidar, J. Geophys. Res., 112, 16202,
doi:10.1029/2006JD008292, 2007.
Müller, D., Lee, K.-H., Gasteiger, J., Tesche, M., Weinzierl, B.,
Kandler, K., Müller, T., Toledano, C., Otto, S., Althausen,
D., and Ansmann, A.: Comparison of optical and microphys-
ical properties of pure Saharan mineral dust observed with
AERONET Sun photometer, Raman lidar, and in situ instru-
ments during SAMUM 2006, J. Geophys. Res., 117, 7211,
doi:10.1029/2011JD016825, 2012.
Murayama, T., Müller, D., Wada, K., Shimizu, A., Sekiguchi,
M., and Tsukamoto, T.: Characterization of Asian dust and
Siberian smoke with multi-wavelength Raman lidar over
Tokyo, Japan in spring 2003, Geophys. Res. Lett., 31, 23103,
doi:10.1029/2004GL021105, 2004.
Nicolae, D., Nemuc, A., Müller, D., Talianu, C., Vasilescu, J., Bel-
egante, L., and Kolgotin, A.: Characterization of fresh and aged
biomass burning events using multiwavelength Raman lidar and
mass spectrometry, J. Geophys. Res., 118, 2956–2965, 2013.
Nisantzi, A., Mamouri, R. E., Ansmann, A., and Hadjimitsis,
D.: Injection of mineral dust into the free troposphere dur-
ing fire events observed with polarization lidar at Limassol,
Cyprus, Atm. Chem. Phys., 14, 12155–12165, doi:10.5194/acp-
14-12155-2014, 2014.
Panchenko, M. V, Zhuravleva, T. B., Terpugova, S. A., Polkin, V. V.,
and Kozlov, V. S.: An empirical model of optical and radiative
characteristics of the tropospheric aerosol over West Siberia in
summer, Atm. Meas. Tech., 5, 1513–1527, doi:10.5194/amt-5-
1513-2012, 2012.
Pappalardo, G., Amodeo, A., Apituley, A., Comeron, A., Freuden-
thaler, V., Linné, H., Ansmann, A., Bösenberg, J., D’Amico,
G., Mattis, I., Mona, L., Wandinger, U., Amiridis, V., Alados-
Arboledas, L., Nicolae, D., and Wiegner, M.: EARLINET: to-
wards an advanced sustainable European aerosol lidar network,
Atmos. Meas. Tech., 7, 2389–2409, doi:10.5194/amt-7-2389-
2014, 2014.
Paris, J.-D., Ciais, P., Nédélec, P., Stohl, A., Belan, B. D., Arshinov,
M. Y., Carouge, C., Golitsyn, G. S., and Granberg, I. G.: New
Insights on the Chemical Composition of the Siberian Air Shed
from the YAK-AEROSIB Aircraft Campaigns, B. Am. Meteorol.
Soc., 91, 625–641, 2010.
Raes, F., Bates, T., McGovern, F., and Van Liedekerke, M.: The 2nd
Aerosol Characterization Experiment (ACE2): general overview
and main results, Tellus B, 52, 111, doi:10.1034/j.1600-
0889.2000.00124.x, 2000.
Ramanathan, V., Crutzen, P. J., Lelieveld, J., Mitra, A. P., Althausen,
D., Anderson, J., Andreae, M. O., Cantrell, W., Cass, G. R.,
Chung, C. E., Clarke, A. D., Coakley, J. A., Collins, W. D.,
Conant, W. C., Dulac, F., Heintzenberg, J., Heymsfield, A. J.,
Holben, B., Howell, S., Hudson, J., Jayaraman, A., Kiehl, J. T.,
Krishnamurti, T. N., Lubin, D., McFarquhar, G., Novakov, T.,
Ogren, J. A., Podgorny, I. A., Prather, K., Priestley, K., Prospero,
J. M., Quinn, P. K., Rajeev, K., Rasch, P., Rupert, S., Sadourny,
R., Satheesh, S. K., Shaw, G. E., Sheridan, P., and Valero, F. P.
J.: Indian Ocean Experiment: An integrated analysis of the cli-
mate forcing and effects of the great Indo-Asian haze, J. Geo-
phys. Res., 106, 28371–28398, 2001.
Raut, J.-C. and Chazette, P.: Retrieval of aerosol complex refractive
index from a synergy between lidar, sunphotometer and in situ
measurements during LISAIR experiment, Atmos. Chem. Phys.,
7, 2797–2815, doi:10.5194/acp-9-8617-2009, 2007.
www.atmos-chem-phys.net/15/5007/2015/ Atmos. Chem. Phys., 15, 5007–5026, 2015

5026 E. Dieudonné et al.: Lidar profiling of aerosol optical properties
Royer, P., Raut, J.-C., Ajello, G., Berthier, S., and Chazette, P.: Syn-
ergy between CALIOP and MODIS instruments for aerosol mon-
itoring: application to the Po Valley, Atm. Meas. Tech., 3, 893–
907, doi:10.5194/amt-3-893-2010, 2010.
Royer, P., Chazette, P., Lardier, M., and Sauvage, L.: Aerosol con-
tent survey by mini N2-Raman lidar: Application to local and
long-range transport aerosols, Atm. Env., 45, 7487–7495, 2011.
Salomonson, V. V, Magner, T., Barnes, W., Montgomery, H., and
Ostrow, H.: Moderate Resolution Imaging Spectrometer – A
progress report (April 1989), in Quantitative Remote Sensing:
An Economic Tool for the Nineties, Proceedings of IGARSS ’89
and of the 12th Canadian Symposium on Remote Sensing, IEEE,
New York, Vancouver, Canada, 2917–2921, 1989.
Schuster, G. L., Vaughan, M., MacDonnell, D., Su, W., Winker,
D., Dubovik, O., Lapyonok, T., and Trepte, C.: Comparison of
CALIPSO aerosol optical depth retrievals to AERONET mea-
surements, and a climatology for the lidar ratio of dust, Atm.
Chem. Phys., 12, 7431–7452, doi:10.5194/acp-12-7431-2012,
2012.
Ter Haar Romeny, B. M., Florack, L. M. J., Salden, A. H., and
Viergever, M. A.: Higher order differential structure of images,
in Information Processing in Medical Imaging, edited by: Bar-
rett, H. H. and Gmitro, A. F., Springer, Berlin Heidelberg, 77–93,
1993.
Tesche, M., Ansmann, A., Müller, D., Althausen, D., Engelmann,
R., Hu, M., and Zhang, Y.: Particle backscatter, extinction, and
lidar ratio profiling with Raman lidar in south and north China,
Appl. Opt., 46, 6302–6308, 2007.
Tesche, M., Groß, S., Ansmann, A., Müller, D., Althausen, D.,
Freudenthaler, V., and Esselborn, M.: Profiling of Saharan dust
and biomass-burning smoke with multiwavelength polarization
Raman lidar at Cape Verde, Tellus B, 63, 649–676, 2011.
Vautard, R., Menut, L., Beekmann, M., Chazette, P., Flamant, P. H.,
Gombert, D., Guédalia, D., Kley, D., Lefebvre, M.-P., Martin,
D., Mégie, G., Perros, P., and Toupance, G.: A synthesis of the
Air Pollution Over the Paris Region (ESQUIF) field campaign, J.
Geophys. Res., 108, 8558, doi:10.1029/2003JD003380, 2003.
Welton, E. J., Campbell, J. R., Spinhirne, J. D., and Scott, V. S.:
Global monitoring of clouds and aerosols using a network of
micro-pulse lidar systems, in: Lidar Remote Sensing for Industry
and Environmental Monitoring, in Proc. SPIE 4153, Lidar Re-
mote Sensing for Industry and Environment Monitoring, edited
by: Singh, U. N., Itabe, T., and Sugimoto, N., Sendai, Japan, 151–
158, 2001.
Winker, D. M., Pelon, J. R., and McCormick, M. P.: The CALIPSO
mission: spaceborne lidar for observation of aerosols and clouds,
in: Proc. SPIE 4893, Lidar Remote Sensing for Industry and En-
vironment Monitoring III, edited by: Singh, U. N., Itabe, T., and
Liu, Z., Hangzhou, China, = 1–11, 2003.
Atmos. Chem. Phys., 15, 5007–5026, 2015 www.atmos-chem-phys.net/15/5007/2015/