Lessons from the US growth resurgence
28
Lessons from the U.S. Growth Resurgence Dale W. Jorgenson Harvard University Mun S. Ho Resources for the Future Kevin J. Stiroh * Federal Reserve Bank of New York January 17, 2003 Abstract This paper analyzes the sources of U.S. labor productivity growth in the late 1990s and presents projections for both output and labor productivity growth. We show that investment in information technology (IT) played a substantial role in the U.S. productivity revival and that similar trends are evident in data for other leading OECD countries. We then outline a methodology for projecting trend output and productivity growth for the broadly defined U.S. economy. Our base-case projection puts trend productivity growth at 1.78 percent per year over the next decade with a range of 1.14 to 2.38 percent, reflecting fundamental uncertainties about the rate of technical progress in IT-production and investment in IT-equipment and software. Our central projection is below the average growth rate of 2.07 percent during 1995-2000. * This paper was prepared for the First International Conference on the Economic and Social Implications of Information Technology, held at the U.S. Department of Commerce, Washington, DC, on January 27-28, 2003. The authors are grateful to Jon Samuels for excellent research assistance. The BLS and BEA have kindly provided data and advice. The views expressed in this paper are those of the authors only and do not necessarily reflect those of the Federal Reserve System or the Federal Reserve Bank of New York.
Transcript of Lessons from the US growth resurgence
Lessons from the U.S. Growth Resurgence
Dale W. Jorgenson Harvard University
Mun S. Ho
Resources for the Future
Kevin J. Stiroh∗ Federal Reserve Bank of New York
January 17, 2003
Abstract This paper analyzes the sources of U.S. labor productivity growth in the late 1990s and presents projections for both output and labor productivity growth. We show that investment in information technology (IT) played a substantial role in the U.S. productivity revival and that similar trends are evident in data for other leading OECD countries. We then outline a methodology for projecting trend output and productivity growth for the broadly defined U.S. economy. Our base-case projection puts trend productivity growth at 1.78 percent per year over the next decade with a range of 1.14 to 2.38 percent, reflecting fundamental uncertainties about the rate of technical progress in IT-production and investment in IT-equipment and software. Our central projection is below the average growth rate of 2.07 percent during 1995-2000.
∗ This paper was prepared for the First International Conference on the Economic and Social Implications of Information Technology, held at the U.S. Department of Commerce, Washington, DC, on January 27-28, 2003. The authors are grateful to Jon Samuels for excellent research assistance. The BLS and BEA have kindly provided data and advice. The views expressed in this paper are those of the authors only and do not necessarily reflect those of the Federal Reserve System or the Federal Reserve Bank of New York.

1
I. Introduction
The unusual combination of more rapid growth and lower inflation in the United
States from 1995 to 2000 touched off a strenuous debate among economists about whether
improvements in U.S. economic performance could be sustained. This debate has now given
way to a broad consensus that the role of information technology is the key to understanding
the American growth resurgence. Questions persist about whether similar trends have
characterized the leading industrialized economies. The answers to these questions are
essential for resolving uncertainties about future growth that currently face decision-makers in
both public and private sectors.
In this paper we review the most recent evidence on growth in the United States and
the leading OECD countries and quantify the role of information technology (IT). Despite
downward revisions to the gross domestic product (GDP) and investment in the annual
revisions of the U.S. National Income and Product Accounts (NIPA) by the Bureau of
Economic Analysis (BEA) in July of 2002, we conclude that the U.S. productivity revival
remains largely intact and that IT investment is the predominant source of this revival. The
capital deepening contribution from computer hardware, software, and telecommunications
equipment greatly exceeded the contribution from all other forms of investment to labor
productivity growth after 1995. An increase in total factor productivity (TFP) growth in the
IT-producing sectors also contributed to the resurgence of labor productivity, modestly
augmented by a smaller increase in TFP growth elsewhere in the economy.
Colecchia and Schreyer (2002) have compiled detailed information on investment in
information technology and economic growth in nine OECD countries in the 1990s. This has
two important advantages over previous international comparisons. First, the estimates of IT
investment are based on national accounting data. Second, prices of information technology
equipment and software are comparable among the nine countries. There is clear evidence of
a surge of IT investment in all nine countries, even in Germany and Japan, both of which
experienced slowdowns in economic growth during the period 1995-2000. More
comprehensive comparisons with growth in the United States must await more complete
information.

2
We next turn to the future of U.S. productivity growth for the U.S. economy, defined
broadly to include business, households, and the government. Our overall conclusion is that
the projections of Jorgenson and Stiroh (2000), prepared more than two years ago, are largely
on target. Our base-case projection of trend labor productivity growth for the next decade is
1.78 percent per year, below the average of 2.07 percent per year for the period 1995-2000.
Our projection of output growth for the next decade is only 2.78 percent per year, compared
with 4.07 percent per year for 1995-2000.1 The difference is largely due to a projected
slowdown in the growth in hours worked due to changing demographics. We conclude that
the American growth resurgence of the late 1990s was not sustainable because it depended in
large part on a rate of work force expansion that will not be maintained.
We emphasize that projecting growth for periods as long as a decade is fraught with
uncertainty. Our pessimistic projection of labor productivity growth is only 1.14 percent per
year, while our optimistic projection is 2.38 percent. The range for output growth is from
2.14 percent in the pessimistic case to 3.38 percent in the optimistic case. These ranges result
from fundamental uncertainties about future patterns of investment and changes in technology
in the production of IT equipment and software. Jorgenson (2001) has traced these
uncertainties to variations in the product cycle for semiconductors, the most important
component of computers and telecommunications equipment.
The starting point for projecting U.S. output growth is a projection of future growth of
the labor force. The growth of hours worked of 1.99 percent per year from 1995-2000 is not
sustainable because labor force growth for the next decade will average only one percent.
The slowdown in the growth of hours worked would have reduced output growth by 0.99
percent, even if labor productivity growth had continued unabated. We estimate that labor
productivity growth from 1995-2000 also exceeded its sustainable rate, however, due to
exceptionally high rates of investment in information technology equipment and software.
This implies an additional decline of 0.29 percent in the trend rate of output growth, so that
we project output growth at 2.78 percent for the next decade, precisely the same as the rate of
growth of output during the period 1973-1995, prior to the growth resurgence of the late
1We focus on the period 1995-2000 to avoid the cyclical effects of the 2001 recession. We discuss estimates for the period 1995-2001 later in the paper. Note also that productivity growth for our broad coverage of the U.S.

3
1990s. The decompositions are quite different, however, with stronger productivity growth
offset by slower projected hours growth.
Section II reviews the historical record, extends the estimates of Jorgenson (2001) to
include data for 2000 and 2001 and revises estimates of economic growth for earlier years to
incorporate new information. We employ the same methodology and summarize it briefly.
We compare IT investment and economic growth for the nine OECD countries analyzed by
Colecchia and Schreyer (2002). Section III presents our projections of the trend growth of
output and labor productivity in the U.S. for the next decade. Section IV concludes the paper.
II. Reviewing the Historical Record
Our methodology for analyzing the sources of growth is based on the production
possibility frontier introduced by Jorgenson (1996, pp. 27-28). This framework encompasses
substitution between investment and consumption goods on the output side and between
capital and labor inputs on the input side. Jorgenson and Stiroh (2000), Jorgenson (2001), and
Jorgenson, Ho, and Stiroh (2002b) have used this methodology to measure the contributions
of information technology (IT) to U.S. economic growth and the growth of labor productivity.
a) Production Possibility Frontier
In the production possibility frontier output (Y) consists of consumption goods (C) and
investment goods (I), while inputs consist of capital services (K) and labor input (L). Output
can be further decomposed into IT investment goods -- computer hardware (Ic), computer
software (Is), communications equipment (Im) -- and non-IT output (Yn). Capital services can
be similarly decomposed into the capital service flows from computer hardware (Kc), software
(Ks), communications equipment (Km), and non-IT capital services (Kn).2 The input function
(X) is augmented by total factor productivity (A). The production possibility frontier can be
represented as:
(1) ),,,,(),,,( LKKKKXAIIIYY mscnmscn ⋅=
economy is somewhat slower than the nonfarm business sector. 2Note that our output and capital service flow concepts include the services of residential structures and consumer durables, as well as government structures and equipment. See Jorgenson (2001) for details.

4
Under the standard assumptions of competitive product and factor markets, and
constant returns to scale, Equation (1) can be transformed into an equation that accounts for
the sources of economic growth:
(2) ALvKvKvKvKv
IwIwIwYw
LmKsKcKnK
mIsIcInY
mscn
mscn
lnlnlnlnlnln
lnlnlnln
∆+∆+∆+∆+∆+∆
=∆+∆+∆+∆
where 1−−≡∆ tt xxx , w denotes the average output shares, v the average input shares, and
1=++++=+++ LKKKKIIIY vvvvvwwwwmscnmscn
. The shares are averaged over periods t
and t-1. We refer to the share-weighted growth rates in Equation (2) as the contributions of
the inputs and outputs.
Average labor productivity (ALP) is defined as the ratio of output to hours worked, so
that HYyALP /== , where the lower-case variable (y) denotes output (Y) per hour (H).
Equation (2) can be rewritten in per hour terms as:
(3) ( ) AHLvkvkvy LITKnK ITnlnlnlnlnlnln ∆+∆−∆+∆+∆=∆
wheremscIT KKKK vvvv ++= .
Equation (3) decomposes ALP growth among three components. The first is capital
deepening, defined as the contribution of capital services per hour and allocated between non-
IT and IT components. The interpretation of capital deepening is that increases in capital per
worker enhance labor productivity in proportion to the capital share. The second component
is labor quality improvement, defined as the contribution of increases in labor input per hour
worked. This reflects changes in the composition of the work force and raises labor
productivity in proportion to the labor share. The third component is total factor productivity
(TFP) growth, which raises ALP growth point for point.
In an inter-industry production model like that of Jorgenson, Ho, and Stiroh (2002a),
the growth of TFP reflects the productivity contributions of individual industries. It is
difficult, however, to create the detailed industry data needed to measure industry-level
productivity in a timely and accurate manner. The Council of Economic Advisors (CEA,
2001), Jorgenson and Stiroh (2000), Jorgenson (2001), Jorgenson, Ho and Stiroh (2002b), and
Oliner and Sichel (2000, 2002) have employed the price dual of industry-level productivity to
estimate TFP growth in the production of IT equipment and software.
5
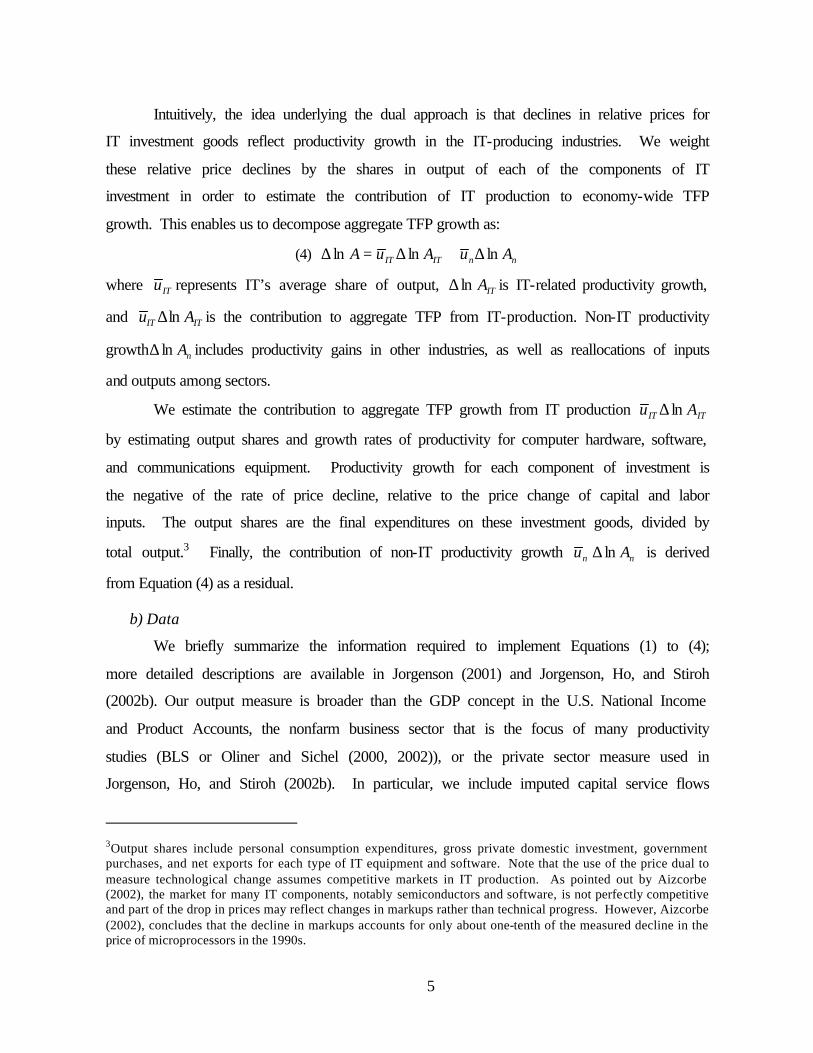
Intuitively, the idea underlying the dual approach is that declines in relative prices for
IT investment goods reflect productivity growth in the IT-producing industries. We weight
these relative price declines by the shares in output of each of the components of IT
investment in order to estimate the contribution of IT production to economy-wide TFP
growth. This enables us to decompose aggregate TFP growth as:
(4) nnITIT AuAuA lnlnln ∆+∆=∆
where ITu represents IT’s average share of output, ITAln∆ is IT-related productivity growth,
and ITIT Au ln∆ is the contribution to aggregate TFP from IT-production. Non-IT productivity
growth nAln∆ includes productivity gains in other industries, as well as reallocations of inputs
and outputs among sectors.
We estimate the contribution to aggregate TFP growth from IT production ITIT Au ln∆
by estimating output shares and growth rates of productivity for computer hardware, software,
and communications equipment. Productivity growth for each component of investment is
the negative of the rate of price decline, relative to the price change of capital and labor
inputs. The output shares are the final expenditures on these investment goods, divided by
total output.3 Finally, the contribution of non-IT productivity growth nu nAln∆ is derived
from Equation (4) as a residual.
b) Data
We briefly summarize the information required to implement Equations (1) to (4);
more detailed descriptions are available in Jorgenson (2001) and Jorgenson, Ho, and Stiroh
(2002b). Our output measure is broader than the GDP concept in the U.S. National Income
and Product Accounts, the nonfarm business sector that is the focus of many productivity
studies (BLS or Oliner and Sichel (2000, 2002)), or the private sector measure used in
Jorgenson, Ho, and Stiroh (2002b). In particular, we include imputed capital service flows
3Output shares include personal consumption expenditures, gross private domestic investment, government purchases, and net exports for each type of IT equipment and software. Note that the use of the price dual to measure technological change assumes competitive markets in IT production. As pointed out by Aizcorbe (2002), the market for many IT components, notably semiconductors and software, is not perfectly competitive and part of the drop in prices may reflect changes in markups rather than technical progress. However, Aizcorbe (2002), concludes that the decline in markups accounts for only about one-tenth of the measured decline in the price of microprocessors in the 1990s.

6
from residential housing and consumer durables, as well as the rate of return to government
capital as in Jorgenson (2001). Our output estimates reflect the most recent revisions to the
U.S. National Income and Product Accounts (NIPA), released in July 2002.
Our capital service estimates are based on the Tangible Wealth Study, published by
the BEA and described in Lally (2002). This includes data on business, household, and
government investment for the U.S. economy through 2001. We construct capital stocks from
the investment data by the perpetual inventory method. We assume that the effective capital
stock for each asset available for production is an average of current and lagged stocks. The
data on tangible assets from BEA are augmented with inventory data to form our measure of
the reproducible capital stock. The total capital stock also includes land and inventories.
Finally, we estimate the service flow for each component of capital stock by
multiplying the rental price by the effective capital stock, as suggested by Jorgenson and
Griliches (1996). Our estimates of rental prices incorporate the asset-specific differences in
asset prices, tax rates, tax lifetimes, and depreciation rates presented by Jorgenson and Yun
(2001). This is essential for understanding the productive impact of IT investment because IT
capital inputs have dramatically higher rates of decline of asset prices and depreciation rates.
We refer to the ratio of capital services to capital stock as capital quality, so that:
(5) ZKKQ lnlnln ∆−∆=∆
where KQ is capital quality, K is capital services, and Z is effective capital stock. The
effective capital stock Z is a quantity index of 70 types of structures and equipment, plus land
and inventories, using investment goods prices as weights. The flow of capital services K is a
quantity index of the same stocks, using rental prices as weights. The difference in growth
rates is the growth rate of capital quality. Capital quality increases as firms invest relatively
more in assets with higher marginal products like information technology equipment and
software.
Labor input is a quantity index of hours worked that takes into account the distribution
of the work force by sex, employment class, age, and education. The weights used to
construct the index reflect the compensation of the various types of workers. In the same way
as for capital, we define labor quality as the ratio of labor input to hours worked, so that:
(6) HLLQ lnlnln ∆−∆=∆

7
where LQ is labor quality, L is labor input, and H is hours worked. Labor quality rises as firms
hire relatively more highly skilled and highly compensated workers.
Our labor data incorporate individual micro-data on hours worked and compensation
per hour from the Censuses of Population for 1970, 1980, and 1990 and the annual Current
Population Surveys (CPS) for 1964-2001. We take total hours worked for employees directly
from the NIPA (Table 6.9c), self-employed hours worked for the non-farm business sector
from the BLS, and self-employed hours worked in the farm sector from the Department of
Agriculture.
c) Results
Table 1 and Figure 1 report our estimates of the sources of economic growth from
Equation (2). For the period 1959-2001, output grew 3.38 percent per year. Capital input
contributed 48.9 percent of this growth or 1.62 percent per year. Labor input followed in
importance with 34.3 of growth or 1.16 percent per year. Less than 17.5 percent of output
growth, 0.59 percentage points, reflects growth in TFP. These results are consistent with the
other recent growth accounting estimates, including CEA (2001), Jorgenson and Stiroh
(2000), Jorgenson (2001), Jorgenson, Ho, and Stiroh (2002b) and Oliner and Sichel (2000,
2002).
Our data also reveal substantial acceleration in output growth after 1995. The growth
rate of output increased from 2.78 percent per year for 1973-1995 to 4.07 percent for 1995-
2000, reflecting a substantial acceleration in IT investment and a modest deceleration in non-
IT investment. For the period 1995-2001, which includes the U.S. recession that began in
March 2001, output growth was 3.55 percent. This is considerably slower, and we focus our
attention on the period 1995-2000 to avoid cyclical effects of the 2001 recession.
On the input side, more rapid capital accumulation contributed 0.68 percentage points
to the post-1995 acceleration through 2000, while faster growth of labor input contributed
0.25 percentage points and accelerated TFP growth the remaining 0.36 percentage points.
These estimates are all smaller when 2001 is included. Finally, the contribution of capital
input from IT increased from 0.42 percentage points per year for 1973-1995 to 0.98 for 1995-
2000, exceeding the increased contributions of all other forms of capital.

8
The last panel in Table 1 presents an alternative decomposition of the contribution of
capital and labor inputs, using Equations (5) and (6). The contributions of capital and labor
inputs reflect the contributions of capital quality and capital stock, as well as labor quality and
hours worked:
(7) ALQvHvKQvZvY LLKK lnlnlnlnlnln ∆+∆+∆+∆+∆=∆
Table 1 shows that the revival of output growth after 1995 can be attributed to two
forces. First, the rising contribution of capital quality reflects a massive substitution toward IT
capital in response to accelerating IT price declines; the growth of capital stock lagged
considerably behind the growth of output. Second, the growth of hours worked surged, while
labor quality growth stagnated. A fall in the unemployment rate and an increase in labor force
participation drew more workers with relatively low marginal products into the work force.
Table 2 and Figure 2 present estimates of the sources of ALP growth from Equations
(3) and (4). For the period 1959-2001 as a whole, growth in ALP of 1.88 percentage points
per year accounted for 55.6 percent of output growth, due to capital deepening of 1.00
percentage points per year, improvement of labor quality of 0.28 percentage points, and TFP
growth of 0.59 percentage points. Growth in hours worked of 1.50 percentage points per year
accounted for the remaining 44.4 percent of output growth.
Looking more closely at the post-1995 period, we see that labor productivity increased
by 0.74 percentage points per year from 1.33 percentage points for 1973-1995 to 2.07
percentage points for 1995-2000, while hours worked increased by 0.55 percentage points per
year from 1.44 percentage points for 1973-1995 to 1.99 percentage points for 1995-2000.
When the recession of 2001 is included, labor productivity falls slightly, while hours growth
falls considerably for 1995-2001, which underscores the remarkable strength of U.S.
productivity growth during this downturn.
The labor productivity growth revival through 2000 reflects more rapid IT-capital
deepening of 0.50 percentage points, partly offset by a decline in non-IT-capital deepening of
0.06 percentage points. It also reflects accelerated productivity growth in IT production of
0.24 percentage points and in non-IT production of 0.12 percentage points. Finally, the
contribution of labor quality growth fell by 0.06 percentage points.
9
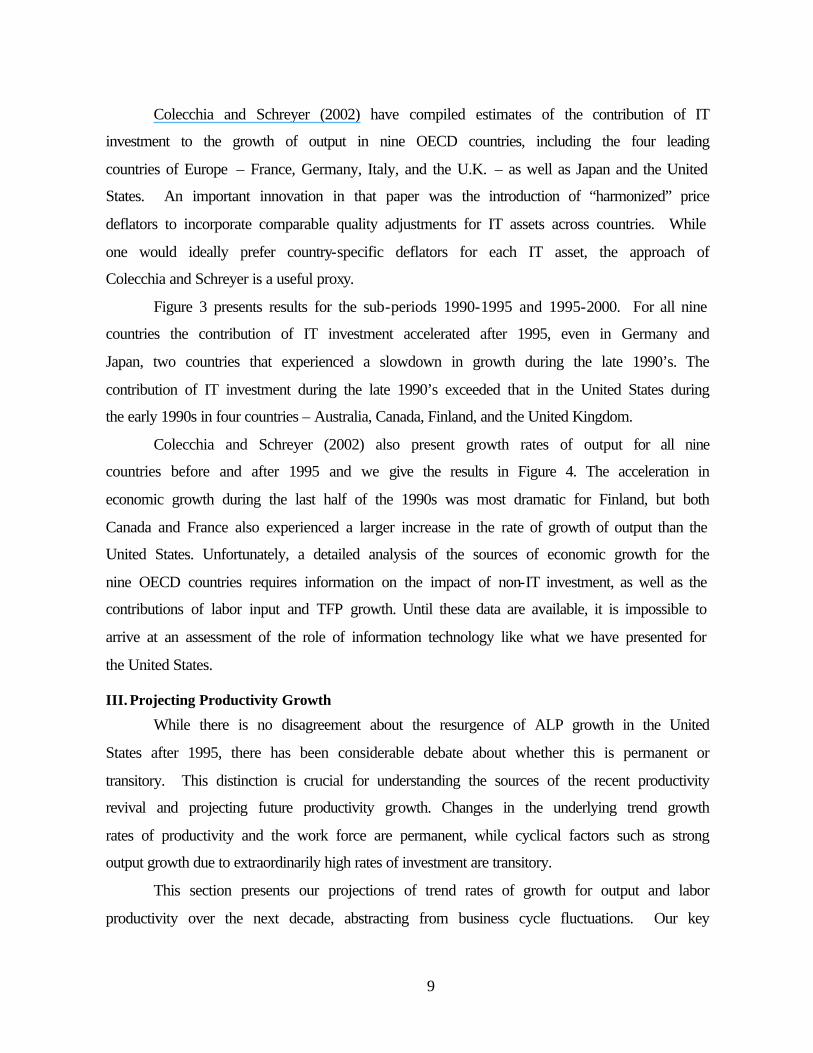
Colecchia and Schreyer (2002) have compiled estimates of the contribution of IT
investment to the growth of output in nine OECD countries, including the four leading
countries of Europe – France, Germany, Italy, and the U.K. – as well as Japan and the United
States. An important innovation in that paper was the introduction of “harmonized” price
deflators to incorporate comparable quality adjustments for IT assets across countries. While
one would ideally prefer country-specific deflators for each IT asset, the approach of
Colecchia and Schreyer is a useful proxy.
Figure 3 presents results for the sub-periods 1990-1995 and 1995-2000. For all nine
countries the contribution of IT investment accelerated after 1995, even in Germany and
Japan, two countries that experienced a slowdown in growth during the late 1990’s. The
contribution of IT investment during the late 1990’s exceeded that in the United States during
the early 1990s in four countries – Australia, Canada, Finland, and the United Kingdom.
Colecchia and Schreyer (2002) also present growth rates of output for all nine
countries before and after 1995 and we give the results in Figure 4. The acceleration in
economic growth during the last half of the 1990s was most dramatic for Finland, but both
Canada and France also experienced a larger increase in the rate of growth of output than the
United States. Unfortunately, a detailed analysis of the sources of economic growth for the
nine OECD countries requires information on the impact of non-IT investment, as well as the
contributions of labor input and TFP growth. Until these data are available, it is impossible to
arrive at an assessment of the role of information technology like what we have presented for
the United States.
III. Projecting Productivity Growth
While there is no disagreement about the resurgence of ALP growth in the United
States after 1995, there has been considerable debate about whether this is permanent or
transitory. This distinction is crucial for understanding the sources of the recent productivity
revival and projecting future productivity growth. Changes in the underlying trend growth
rates of productivity and the work force are permanent, while cyclical factors such as strong
output growth due to extraordinarily high rates of investment are transitory.
This section presents our projections of trend rates of growth for output and labor
productivity over the next decade, abstracting from business cycle fluctuations. Our key

10
assumptions are that output and the reproducible capital stock will grow at the same rate and
that labor hours and the labor force will also grow at the same rate.4 These are characteristic
features of the U.S. and most industrialized economies over periods longer than a typical
business cycle. For example, U.S. output growth averaged 3.38 percent per year for 1959-
2001, while our measure of the reproducible capital stock grew 3.55 percent.5
We begin by decomposing the aggregate capital stock between reproducible capital
stock and land, which we assume to be fixed. This implies:
(8) RRRRR ZLANDZZ lnln)1(lnln ∆=∆−+∆=∆ µµµ
where Rµ is the value share of reproducible capital stock in total capital stock.
We construct estimates of trend output and labor productivity growth, conditional on
the projected growth of the remaining sources of economic growth. More formally, if
RZY lnln ∆=∆ , then Equations (3), (4), (7), and (8) imply that trend labor productivity and
output growth are given by:
(9)
HyYv
AAuLQvHvKQvy
RK
nITITLRKK
lnlnln1
lnlnlnln)1(lnln
∆+∆=∆−
+∆+∆+∆−−∆=∆
µµ
Equation (9) is a long-run relationship that averages over cyclical and stochastic
elements and removes the transitional dynamics due to capital accumulation. The second part
of the definition of trend growth is that the unemployment rate remains constant and hours
growth matches labor force growth. Growth in hours worked was exceptionally rapid in the
1995-2000 period, as the unemployment rate fell from 5.6 percent in 1995 to 4.0 in 2000, so
output growth was considerably above its trend rate.6 We estimate hours growth over the next
decade by means of detailed demographic projections, based on Census Bureau data.
In order to complete intermediate-term growth projections based on Equation (9), we
require estimates of capital and labor shares, the IT output share, the share of reproducible
capital stock, capital quality growth, labor quality growth, and TFP growth. Labor quality
growth and the various shares are relatively easy to project, while extrapolations of the other
4The assumption that output and the capital stock grow at the same rate is a property of balanced growth equilibrium in the standard neo-classical growth model. 5Reproducible assets exclude land. 6These unemployment rates are annual averages for the civilian labor force, 16 years and older from BLS.

11
variables are subject to considerable uncertainty. Accordingly, we present three sets of
projections -- a base-case scenario, a pessimistic scenario, and an optimistic scenario.
We hold labor quality growth, hours growth, the capital share, the reproducible capital
stock share, and the IT output share constant across the three scenarios. We refer to these as
the “common assumptions.” We vary IT-related TFP growth, the contribution to TFP growth
from non-IT sources, and capital quality growth across these scenarios and label them
“alternative assumptions.” Generally speaking for these variables, the base-case scenario
incorporates data from the long expansion of 1990-2000, the optimistic scenario assumes the
patterns of 1995-2000 will persist, and the pessimistic case assumes that the economy reverts
to 1973-1995 averages.
a) Common Assumptions
Hours growth ( Hln∆ ) and labor quality growth ( LQln∆ ) are relatively easy to
project. The Congressional Budget Office (2002) projects growth in the potential labor force
of 1.0 percent per year, a slight decrease from earlier projections. We project hours growth at
1.0 percent per year for 2002-2012. CBO (2002) does not employ the labor quality concept.
We construct our own projections of demographic trends. Ho and Jorgenson (1999)
have shown that the dominant trends in labor quality growth are due to rapid improvements in
educational attainment in the 1960s and 1970s, and the rise in female participation rates in the
1970s. The improvement in educational attainment of new entrants into the labor force
largely ceased in the 1990s, although the average educational level continued to rise as
younger and better educated workers entered the labor force and older workers retired.
We project growth in the population from the demographic model of the Bureau of
Census, which breaks the population down by individual year of age, race and sex.7 For each
group the population in period t is equal to the population in period t-1, less deaths plus net
immigration. Death rates are group-specific and are projected by assuming a steady rate of
improvement in health. The population of newborns in each period reflects the number of
females in each age group and the age- and race-specific fertility rates. These fertility rates are
projected to fall steadily.
7The details of the population model are given in Census (2000).
12
We observe labor force participation rates in the last year of our sample period. We
then project the work force by assuming constant participation rates for each sex-age group.
The educational attainment of workers aged a in period t is projected by assuming that it is
equal to the attainment of the workers of age a-1 in period t-1 for all those who are over 35
years of age in the last year of the sample. For those who are younger than 35 we assume that
the educational attainment of workers aged a in forecast period t is equal to the attainment of
workers aged a in the base year.
Our index of labor quality is constructed from hours worked and compensation rates.
We project hours worked by multiplying the projected population in each sex-age-education
group by the annual hours per person in the last year of the sample. The relative
compensation rates for each group are assumed to be equal to the observed compensation in
this sample period. We project labor quality growth from our projections of hours worked
and compensation per hour.
Our estimates suggest that hours growth ( Hln∆ ) will be about 1.0 percent per year
over the next ten years, essentially the same as the CBO (2002) estimate. We estimate that
growth in labor quality ( LQln∆ ) will be 0.16 percent per year over the next decade. This is
considerably lower than the 0.28 percent growth rate for the period 1959-2000, driven by
rising average educational attainment and stabilizing female participation.
The capital share ( Kv ) has not shown any obvious trend over the past 40 years. We
assume it holds constant at 40.9 percent, the average for 1959-2000. Similarly, the fixed
reproducible capital share ( Rµ ) has shown little change and we assume that it remains
constant at 83.7 percent, the average for 1959-2000. We assume the IT output share ( ITu )
remains at 4.5 percent, the average for 1995-2000. This is likely to prove a conservative
estimate, since IT has steadily increased in relative importance in the U.S. economy, rising
from 1.7% of output in 1970 to 2.3% in 1980, 3.3% in 1990, and 4.7% in 2000.
b) Alternative Assumptions
Productivity growth in IT production ( ITAln∆ ) has been extremely rapid in recent
years with a substantial acceleration after 1995. For 1990-1995 productivity growth for IT
production averaged 7.35 percent per year, while for 1995-2000 growth averaged 9.31
13
percent. While these growth rates are high, they are consistent with industry-level
productivity estimates for high-tech sectors. For example, Jorgenson, Ho, and Stiroh (2002a)
report productivity growth of 18.00 percent per year for 1995-2000 in electronic components,
including semiconductors, and 16.75 in computers and office equipment.
Jorgenson (2001) argues the large increase in IT productivity growth was triggered by
a much sharper acceleration in the decline of semiconductor prices. This can be traced to a
shift in the product cycle for semiconductors in 1995 from three years to two years, a
consequence of intensifying competition in the semiconductor market. It would be premature
to extrapolate the recent acceleration in productivity growth into the indefinite future,
however, because this depends on the persistence of a two-year product cycle for
semiconductors.
To better gauge the future prospects of technical progress in the semiconductor
industry, we turn to The International Technology Roadmap for Semiconductors.8 This
Roadmap, constructed every two years by a consortium of industry associations and updated
annually, projects a two-year product cycle through 2005 and a three-year product cycle
thereafter. This is a reasonable basis for projecting the productivity growth related to IT for
the U.S. economy. Moreover, continuation of a two-year cycle provides an upper bound for
growth projections, while an immediate reversion to a three-year cycle gives a lower bound.
Our base-case scenario projects IT-related growth of 8.33 percent per year, the
average for 1990-2000, giving equal weight to the two-year product cycle for 1995-2000 and
the three-year product cycle for 1990-1995.9 The optimistic scenario assumes that the two-
year product cycle for semiconductors remains in place so that productivity growth in IT
production averages 9.31 percent per year, as it did for 1995-2000. Our pessimistic projection
assumes a reversion to the three-year semiconductor product cycle of 1973-1995, when IT-
related productivity growth was 6.93 percent per year. In all cases, the contribution of IT to
TFP growth reflects the 1995-2000 IT share of GDP of 4.5 percent.
The non-IT TFP contribution is more difficult to project, so we present a range of
alternative estimates that are consistent with the historical record. Our base-case projection
8See International Technology Roadmap for Semiconductors (2001), http://public.itrs.net.

14
uses the average contribution from the 1990s and assumes a contribution 0.11 percentage
points. This assumes that the myriad factors that drove TFP growth in the 1990s -- technical
progress, resource reallocations, and increased competitive pressures -- will continue into the
future. Our optimistic case assumes that the contribution for 1995-2000 of 0.17 percentage
points per year will continue, while our pessimistic case assumes that the U.S. economy will
revert back to the slow-growth period from 1973-1995 when this contribution averaged only
0.06 percent per year.
The final step in our projections is to estimate the growth in capital quality ( KQln∆ ).
The one-sector neo-classical growth model has capital stock and output growing at the same
rate in balanced growth equilibrium. We distinguish between IT and non-IT capital and the
historical record shows that substitution between these two types of capital is an important
source of output and productivity growth. For the period 1959-2001 as a whole capital
quality growth contributed 0.41 percentage points to output growth as firms substituted
toward IT capital inputs with higher marginal products.
An important difficulty in projecting capital quality growth from recent data, however,
is that investment patterns in the 1990s may partially reflect an unsustainable investment
boom in response to temporary factors like Y2K investment and the NASDAQ stock market
bubble, which may have skewed investment toward IT assets. Capital quality for 1995-2000
grew at 2.30% per year as firms invested heavily in IT, but there has been a sizable slowdown
in IT investment in the second half of 2000 and 2001. Therefore, we must be cautious about
relying too heavily on the most recent investment experience.
Our base-case projection uses the average rate of capital quality growth for 1990-
2000, which was 1.63 percentage points; this averages the high rates of substitution of IT for
non-IT capital inputs in the late 1990s with the more moderate rates of the early 1990s. Our
optimistic projection ignores the possibility that capital substitution was unsustainably high in
the late 1990s and assumes that capital quality growth will continue at the annual rate of 2.30
percent for the period 1995-2000. Our pessimistic scenario assumes that the growth of capital
quality will revert to the 0.88 annual growth rate for 1973-1995.
9Note that we explicitly exclude 2001 because the cyclical declines associated with the 2001recession obscure the underlying trends.

15
c) Output and Productivity Projections
Table 3 assembles the components of our projections and presents the three scenarios.
The top panel of Table 3 shows the projected growth of output, labor productivity, and the
effective capital stock. The second panel reports the five factors that are held constant across
scenarios -- hours growth, labor quality growth, the capital share, the IT output share, and the
reproducible capital stock share. The bottom panel includes the three components that vary
across scenarios -- TFP growth in IT, the TFP contribution from other sources, and capital
quality growth.
Our base-case scenario puts trend labor productivity growth at 1.78 percent per year,
and trend output growth at 2.78 percent per year. Figure 5 presents our projection of labor
productivity growth and its decomposition, while Figure 6 gives the corresponding projection
of output growth. Projected productivity growth falls short of our estimate of 2.07 percent for
1995-2000 and even the 2.02 percent for 1995-2001. Output growth is considerably slower
due to the projected slowdown in hours growth. Hours grew at 1.99 percent per year for
1995-2000 and 1.53 percent per year for 1995-2001, compared to our projection of 1.0
percent for the next decade. Capital stock growth is projected to fall in the base-case to 2.32
percent per year.
Our base-case scenario incorporates the underlying pace of technical progress in
semiconductors embedded in the International Technology Roadmap projection and puts the
contribution of IT-related TFP below that of 1995-2000 as the semiconductor industry
eventually returns to a three-year product cycle. Slower growth is partly offset by the larger
IT output share. Other TFP growth also makes a smaller contribution. Although the slower
pace of capital input growth is partly offset by slower hours growth, capital deepening is
insufficient to raise the projected growth rate to the observed growth rate for 1995-2001.
Our optimistic scenario projects labor productivity growth at 2.30 percent per year,
reflecting our assumption of continuing rapid technical progress in IT production. In
particular, the two-year product cycle in semiconductors is assumed to persist for the
intermediate future, driving rapid TFP growth in IT production, as well as continued
substitution toward IT capital input and rapid growth in capital quality. In addition, non-IT
TFP growth continues at the pace for 1995-2000.

16
Finally, the pessimistic projection of 1.14 percent per year growth in labor
productivity assumes that underlying trends in TFP growth and growth in capital quality
revert back to the sluggish growth rates of the 1973-1995 period and that the three-year
product cycle for semiconductors begins immediately. Even with the larger share of IT, labor
productivity growth in this scenario will fall short of the rates seen in the 1970’s and 1980’s.
IV. Conclusions
Our primary conclusion is that a consensus has emerged about trend rates of growth
for output and labor productivity. Our methodology assumes that trend growth rates in output
and reproducible capital are the same, and that hours growth is constrained by the growth of
the labor force along a balanced growth path. While productivity is projected below the pace
seen in late 1990’s, we conclude the U.S. productivity revival is likely to remain intact for the
intermediate future. Similar projections for the leading industrialized economies will have to
await the availability of detailed information on productivity similar to that we have employed
for the United States.
Our second conclusion is that trend growth rates are subject to considerable
uncertainty. For the U.S. economy this can be identified with the future product cycle for
semiconductors and its impact on the production of other high-tech gear. The switch from a
three-year to a two-year product cycle in 1995 produced a dramatic increase in the rate of
decline of IT prices. This is reflected in the investment boom of 1995-2000 and the massive
substitution of IT capital for other types of capital that took place in response to price
changes. The issue that must be confronted by policy-makers is whether this two-year
product cycle can continue, and whether firms will continue to respond to the dramatic
improvements in the performance/price ratio of IT investment goods.
The lessons from the American growth resurgence are, first, that investment in
information technology equipment and software has increased in relative importance in all the
major OECD countries. This lesson has not been fully absorbed by analysts who focus on
trends in the growth of output or labor productivity alone. Second, future trends in economic
growth depend on future labor force growth, as well as future changes in technology. While
trends in labor force growth are relatively easy to project, considerable uncertainty will
continue to characterize projections of new developments in technology.

17
A complete understanding of the role of information technology in Europe requires a
full accounting for recent economic growth like that we have presented for the United States.
A key part of this is the successful measurement of quality-adjusted prices for IT assets. The
U.S. National Accounts currently employ such deflators for computer hardware, and portions
of software and telecomm equipment. This is critical as failure to capture these important
quality improvements leads both capital input and output to be severely understated.

18
References
Aizcorbe, Ana. “Why are Semiconductor Prices Fallings So Fast? Industry Estimates and Implications for Productivity Measurement.” Federal Reserve Board, Mimeo, February 2002.
Bureau of Labor Statistics. “Multifactor Productivity Trends, 2000.” USDL 02-128, March 12, 2002.
Bureau of the Census. “Methodology and Assumptions for the Population Projections of the United States: 1999 to 2100.” www.census.gov/population/www/projections/natproj.html, 2000.
Colecchia, Alessandra, and Paul Schreyer, “ICT Investment and Economic Growth in the 1990s: is the United States a Unique Case? A Comparative Study of Nine OECD Countries,” Review of Economic Dynamics, 5(2), April 2002, 408-43.
Congressional Budget Office. “The Budget and Economic Outlook: An Update.” Washington DC: Government Printing Office, August 2002.
Council of Economic Advisors. “Annual Report of the Council of Economic Advisors.” In the Economic Report of the President, January 2001.
International Technology Roadmap for Semiconductors. 2001, Austin TX, Sematech Corporation, December 2001.
Jorgenson, Dale W. “The Embodiment Hypothesis.” In Postwar U.S. Economic Growth, Cambridge MA: The MIT Press, 1996.
_____. “Information Technology and the U.S. Economy.” American Economic Review, 91(1), March 2001,1-32.
Jorgenson, Dale W., and Zvi Griliches, “The Explanation of Productivity Change.” In Postwar U.S. Economic Growth, Cambridge MA: The MIT Press, 1996.
Jorgenson, Dale W., Mun S. Ho, and Kevin J. Stiroh. “Growth in U.S. Industries and Investments in Information Technology and Higher Education,” prepared for NBER/CRIW Conference on Measurement of Capital in the New Economy , April 2002.
_____. “Projecting Productivity Growth: Lessons from the U.S. Growth Resurgence,” Federal Reserve Bank of Atlanta Economic Review, 87(3), Third Quarter, 2002, 1-14.
Jorgenson, Dale W. and Kevin J. Stiroh. “Raising the Speed Limit: U.S. Economic Growth in the Information Age.” Brookings Papers on Economic Activity, 2000(1), 125-211.
Jorgenson, Dale W., and Kun-Young Yun, Lifting the Burden: Tax Reform, the Cost of Capital,and U.S. Economic Growth , Cambridge, The MIT Press, 2001.
Lally, Paul R. “Fixed Assets and Consumer Durable Goods for 1925-2001.” Survey of Current Business, 82(9), September 2002, 23-37.
Oliner, Stephen D. and Daniel E. Sichel. “The Resurgence of Growth in the Late 1990s: Is Information Technology the Story?” Journal of Economic Perspectives, 14(4), Fall 2000, 3-22.
_____. “Information Technology and Productivity: Where Are We Now and Where Are We Going?” Federal Reserve Bank of Atlanta Economic Review, 87(3), Third Quarter, 2002, 15-44.

1995-2000 1995-2001less less
1959-2001 1959-1973 1973-1995 1995-2000 1995-2001 1973-1995 1973-1995
Growth in GDP (Y ) 3.38 4.18 2.78 4.07 3.55 1.29 0.77Contribution of Selected Output Components
Other Output (Y n ) 2.91 3.92 2.30 3.00 2.65 0.70 0.35Computer Output (Yc ) 0.14 0.06 0.17 0.32 0.28 0.15 0.11Software Output (Ys ) 0.09 0.03 0.10 0.30 0.24 0.20 0.14Communications Output (Y m ) 0.11 0.11 0.10 0.19 0.14 0.09 0.04Information Technology Services (Y it ) 0.11 0.07 0.11 0.25 0.24 0.14 0.13
Contribution of Capital and CD Services (K ) 1.62 1.77 1.40 2.08 2.03 0.68 0.63Other (K n ) 1.20 1.57 0.98 1.10 1.10 0.12 0.12Computers (K c ) 0.20 0.07 0.20 0.53 0.49 0.33 0.29Software (K s ) 0.10 0.03 0.10 0.28 0.27 0.18 0.17Communications (K m ) 0.12 0.10 0.12 0.17 0.17 0.05 0.05
Contribution of Labor (L ) 1.16 1.24 1.12 1.37 1.12 0.25 0.00Aggregate Total Factor Productivity (TFP) 0.59 1.16 0.26 0.62 0.40 0.36 0.14
Contribution of Capital and CD Quality 0.41 0.27 0.36 0.95 0.93 0.59 0.57Contribution of Capital and CD Stock 1.21 1.51 1.04 1.12 1.11 0.08 0.07Contribution of Labor Quality 0.28 0.33 0.27 0.21 0.22 -0.06 -0.05Contribution of Labor Hours 0.88 0.91 0.85 1.16 0.89 0.31 0.04
Table 1: Growth in GDP and the Sources of Growth1959-2001
Note: A contribution of an output or input is defined as the share-weighted, real growth rate.Source: Author's calculations based on BEA, BLS, Census Bureau, and other data.

1995-2000 1995-2001less less
1959-2001 1959-1973 1973-1995 1995-2000 1995-2001 1973-1995 1973-1995
Output Growth (Y ) 3.38 4.18 2.78 4.07 3.55 1.29 0.77Hours Growth (H ) 1.50 1.56 1.44 1.99 1.53 0.55 0.09Average Labor Productivity Growth (ALP ) 1.88 2.63 1.33 2.07 2.02 0.74 0.69
Capital Deepening 1.00 1.13 0.80 1.24 1.39 0.44 0.59IT Capital Deepening 0.37 0.19 0.37 0.87 0.85 0.50 0.48Other Capital Deepening 0.63 0.95 0.43 0.37 0.54 -0.06 0.11
Labor Quality 0.28 0.33 0.27 0.21 0.22 -0.06 -0.05TFP Growth 0.59 1.16 0.26 0.62 0.40 0.36 0.14
IT-related Contribution 0.19 0.09 0.21 0.45 0.41 0.24 0.20Other Contribution 0.40 1.07 0.05 0.17 -0.01 0.12 -0.06
Table 2: Sources of Growth in Average Labor Productivity1959-2001
Note: A contribution of an output or input is defined as the share-weighted, real growth rate.Source: Author's calculations based on BEA, BLS, Census Bureau, and other data.

Total Economy
Pessimistic Base-case Optimistic
Output Growth 2.14 2.78 3.38ALP Growth 1.14 1.78 2.38Effective Capital Stock 1.79 2.32 2.83
Hours Growth 1.00 1.00 1.00Labor Quality Growth 0.157 0.157 0.157Capital Share 0.409 0.409 0.409IT Output Share 0.045 0.045 0.045Reproducible Capital Stock Share 0.837 0.837 0.837
TFP Growth in IT 6.93 8.33 9.31Implied IT-related TFP Contribution 0.31 0.37 0.43
Other TFP Contribution 0.06 0.11 0.17Capital Quality Growth 0.88 1.63 2.30Implied Capital Deepening Contribution 0.68 1.21 1.69
Table 3: Output and Labor Productivity Projections
Notes: In all projections, hours growth and labor quality growth are from internal projections, capitalshare and reproducible capital stock shares are 1959-2000 averages, and IT output shares are for 1995-2000. Pessimistic case uses 1973-1995 average growth of capital quality, IT-related TFP growth, andnon-IT TFP contribution. Base case uses 1990-2000 averages and optimistic cases uses 1995-2000averages.
Projections
Common Assumptions
Alternative Assumptions
Projections

Figure 1. Sources of Economic Growth
0.00
0.50
1.00
1.50
2.00
2.50
3.00
3.50
4.00
4.50
1959-1973 1973-1995 1995-2000
An
nu
al C
on
trib
uti
on
(%
)
Labor Non-IT Capital IT Capital TFP

Figure 2. Sources of Labor Productivity Growth
0.00
0.50
1.00
1.50
2.00
2.50
3.00
1959-1973 1973-1995 1995-2000
An
nu
al C
on
trib
uti
on
(%
)
Labor Quality Other Capital Deepening IT Capital Deepening Non-IT TFP IT TFP

Figure 3. Capital Input Contribution of Information Technology by Country
-0.2
0.0
0.2
0.4
0.6
0.8
1.0
1.2
1.4
1.6
1.8
90-95 95-1999 90-95 95-2000 90-95 95-1999 90-95 95-2000 90-95 95-2000 90-95 95-1999 90-95 95-1999 90-95 95-2000 90-95 95-2000
Australia Canada Finland France Germany Italy Japan United Kingdom United States
Ann
ual
Con
trib
utio
n (%
)
Non-IT ICT

Figure 4. Output Growth, 1990-1995 versus 1995-2000
-2.0
-1.0
0.0
1.0
2.0
3.0
4.0
5.0
6.0
Australia Canada Finland France Germany Italy Japan UnitedKingdom
United States
(%)
1990-95 1995-2000
Note: Latest available output growth is 1995-1999 for Finland, Italy, and Japan.

Figure 5. Range of Labor Productivity Projections
0.0
0.5
1.0
1.5
2.0
2.5
3.0
1995-2001 Pessimistic Base Case Optimistic
An
nu
al C
on
trib
uti
on
(%
)
Labor Quality Capital Deepening TFP

Figure 6. Range of Output Projections
0.00
0.50
1.00
1.50
2.00
2.50
3.00
3.50
4.00
1995-2001 Pessimistic Base Case Optimistic
An
nu
al C
on
trib
uti
on
(%
)
Hours Labor Productivity