leonardo mateus teixeira de rezende - UFJF
172
LEONARDO MATEUS TEIXEIRA DE REZENDE COMPARAÇÕES DOS EFEITOS DO ENVELHECIMENTO NA FISIOLOGIA CARDIOVASCULAR E TERMORREGULATÓRIA EM RATOS WISTAR, WISTAR KYOTO E ESPONTANEAMENTE HIPERTENSOS DURANTE O REPOUSO E O EXERCÍCIO FÍSICO AGUDO Tese apresentada à Universidade Federal de Viçosa, como parte das exigências do Programa de Pós-Graduação em Educação Física, para obtenção do título Doctor Scientiae. Orientador: Thales Nicolau Prímola Gomes Coorientadores: Antônio José Natali Cândido Celso Coimbra VIÇOSA – MINAS GERAIS 2020
-
Upload
khangminh22 -
Category
Documents
-
view
1 -
download
0
Transcript of leonardo mateus teixeira de rezende - UFJF

LEONARDO MATEUS TEIXEIRA DE REZENDE
COMPARAÇÕES DOS EFEITOS DO ENVELHECIMENTO NA FISIOLOGIA CARDIOVASCULAR E TERMORREGULATÓRIA EM RATOS WISTAR, WISTAR KYOTO E ESPONTANEAMENTE HIPERTENSOS DURANTE O REPOUSO E O
EXERCÍCIO FÍSICO AGUDO
Tese apresentada à Universidade Federal de Viçosa, como parte das exigências do Programa de Pós-Graduação em Educação Física, para obtenção do título Doctor Scientiae. Orientador: Thales Nicolau Prímola Gomes Coorientadores: Antônio José Natali Cândido Celso Coimbra
VIÇOSA – MINAS GERAIS
2020


LEONARDO MATEUS TEIXEIRA DE REZENDE
COMPARAÇÕES DOS EFEITOS DO ENVELHECIMENTO NA FISIOLOGIA CARDIOVASCULAR E TERMORREGULATÓRIA EM RATOS WISTAR, WISTAR KYOTO E ESPONTANEAMENTE HIPERTENSOS DURANTE O REPOUSO E O
EXERCÍCIO FÍSICO AGUDO
Tese apresentada à Universidade Federal de Viçosa, como parte das exigências do Programa de Pós-Graduação em Educação Física, para obtenção do título Doctor Scientiae.
APROVADA: 18 de dezembro de 2020.
Assentimento:
Leonardo Mateus Teixeira de Rezende
Autor
Thales Nicolau Prímola Gomes Orientador

AGRADECIMENTOS
Agradeço a Deus pela trajetória percorrida, pelas oportunidades e possibilidades que me foram
apresentadas, pela fé, força e persistência nos momentos conturbados.
Aos meus pais, Oscar e Lauricea, por todo amor e cuidado. Agradeço por plantarem a semente
da curiosidade e representarem fonte de estímulo constante em busca do caminho do estudo,
sempre observando valores e princípios que orientam minhas ações.
À minha irmã, Carolina, pelo apoio, incentivo, amizade e presença em todos os momentos
importantes.
À Monique, por me acompanhar durante toda minha trajetória dentro da UFV. Agradeço pelo
apoio incondicional, pelo cuidado, pela atenção e por ser esta pessoa maravilhosa.
Ao professor Thales Nicolau Prímola Gomes pela cuidadosa orientação em todo meu tempo na
pós-graduação, mas principalmente por me abrir os olhos para a verdadeira importância da
ciência, assim como para a responsabilidade de fazê-la livre de qualquer sentimento de ego ou
vaidade.
Ao professor Antônio José Natali por me abrir as portas do Laboratório de Biologia do
Exercício em 2014. Por representar fonte de inspiração quanto a postura profissional e
dedicação a ciência.
Ao professor Cândido Celso Coimbra pela Coorientação, por estar sempre a disposição para
nos auxiliar nos momentos de dúvida, contribuindo significativamente para o direcionamento
e condução do meu trabalho.
A professora Lukiya Silva Campos Favarato por ser a veterinária responsável pelo projeto e por
realizar, em conjunto com o professor Evandro Silva Favarato, as cirurgias de implante do
sensor nos animais.
A professora Emily Carlo Correna Reis por realizar os exames ecocardiográficos nos animais
e por todo auxilio prestado na análise e interpretação dos resultados.
Ao professor Miguel Araújo Carneiro Júnior, que era estudante de pós-doutorado no momento
de minha chegada em Viçosa, sendo um dos responsáveis pela minha in
tegração ao laboratório. Agradeço também pela amizade, pelos conselhos, pelo auxílio nos
momentos de dúvida e pelas oportunidades apresentadas.
Ao professor Leandro de Campos Brito, pelo auxílio prestado no momento de análise dos
resultados do ritmo circadiano. Por se disponibilizar e se envolver no processo de construção
deste trabalho.

A professora Maria do Carmo Gouvêa Pelúzio por abrir as portas do laboratório de análise de
alimentos no departamento de nutrição para realização de experimentos, bem como ao Ricardo
de Britto Antonucci pelo auxilio nestes.
Aos amigos Leôncio, Filipe, Anselmo, Alexandre Martins, Alexandre Costa, Luciano,
Franciany, Meilene e Pedro por toda ajuda no cuidado com os animais e nos experimentos, mas
também pelos ótimos momentos de convivência, brincadeiras e conversas.
Aos amigos Emanoel, Wanessa, Luciano, Willian, Bruna e Nathalia pela convivência e pelos
momentos de estudo, seja pessoal ou virtualmente, no grupo de estudo sobre termorregulação.
Aos amigos Lucas e Tatiane, por todos esses anos de amizade e companheirismo.
À Universidade Federal de Viçosa, minha segunda casa nos últimos 11 anos. Agradeço pela
oportunidade e pela estrutura. Estendo meu agradecimento a todos os funcionários e servidores
da UFV que se dedicam arduamente para atingir o trabalho de excelência desenvolvido pela
instituição.
Aos animais experimentais, parte fundamental para realização da pesquisa. Além do
agradecimento, registro também meu respeito.
Ao CNPq e a FAPEMIG pelo apoio financeiro.
O presente trabalho foi realizado com apoio da Coordenação de Aperfeiçoamento Pessoal de
Nível Superior - Brasil (CAPES) – código de financiamento 001.

“Talvez não tenha conseguido fazer o melhor, mas lutei para que o melhor fosse feito. Não
sou o que deveria ser, mas graças a Deus, não sou o que era antes.”
(Marthin Luther King)

RESUMO
REZENDE, Leonardo Mateus Teixeira, D.Sc., Universidade Federal de Viçosa, dezembro de
2020. Comparações nos efeitos do envelhecimento na fisiologia cardiovascular e
termorregulatória em Ratos Wistar, Wistar Kyoto e Espontaneamente Hipertensos
durante o repouso e o exercício físico agudo. Orientador: Thales Nicolau Prímola Gomes.
Coorientadores: Antônio José Natali e Cândido Celso Coimbra.
Introdução: O Rato Espontaneamente Hipertenso (SHR) é um modelo experimental
amplamente utilizado para o estudo da hipertensão arterial essencial. Contudo, existe um
impasse na literatura quanto ao apontamento do modelo a ser utilizado como controle
experimental dos SHR, sendo que os ratos Wistar Kyoto (WKY) e os ratos Wistar (WIS) são
os mais utilizados. Esta tese foi dividida em quatro capítulos, em que foram realizadas
caracterizações dos modelos citados quanto a parâmetros cardíacos e termorregulatórios
durante o repouso e durante o exercício físico. Objetivo: avaliar os efeitos do envelhecimento
sobre variáveis cardíacas e termorregulatórias durante o repouso e exercício físico agudo em
Ratos Espontaneamente Hipertensos e seus principais controles experimentais, Wistar e Wistar
Kyoto. Capítulo 1: foi realizada uma revisão de escopo baseada no método Preferred Reporting
Items for Systematic Reviews and Meta-analysis (PRISMA), com objetivo de mapear todos os
estudos que realizaram qualquer tipo de comparação entre WIS, WKY e SHR. Após a aplicação
dos métodos de busca e seleção, 161 artigos foram incluídos para análise, sendo que 68.4%
indicaram que ambos os animais normotensos podem ser utilizados como controle dos SHR.
Em 13.49% e 6.47% dos estudos, foi indicado os WIS e WKY como melhor controle,
respectivamente. Capítulo 2: foram avaliados a pressão arterial por meio da pletismografia de
cauda e a estrutura e forma cardíaca por meio do ecocardiograma durante o processo de
envelhecimento dos animais (16 semanas, 48 semanas e 72 semanas de vida). Foi constatado
que para estas variáveis os WIS representam melhor controle, uma vez que os WKY exibiram
valores de pressão arterial sistólica próxima ao limiar da hipertensão (WKY: 132 – 146 mmHg;
WIS: 116 – 126 mmHg; p<0.05) e perda de função cardíaca antecipada em comparação aos
WIS. Capítulo 3: avaliou o ritmo circadiano da temperatura central dos animais durante o
processo de envelhecimento (16 semanas, 48 semanas e 72 semanas de vida). A medida foi
realizada pelo método de telemetria e análises cronobiológica foram aplicadas sobre os dados.
Foi encontrado que os SHR possuem disfunções do ritmo circadiano já com 16 semanas, o que
foi apontado principalmente pelo maior MESOR (SHR16: 37,49°C; WIS16: 36,50°C; WKY16:
36,44°C; p<0.05), enquanto os animais normotensos apresentaram um aumento do MESOR

com o envelhecimento (WIS16: 36,50°C; WIS72: 37,38°C; WKY16: 36,44°C; WKY72:
37,38°C; p<0.05). Para estas variáveis, foi considerado que ambos os normotensos podem ser
utilizados como controle, uma vez que os resultados foram semelhantes. Capítulo 4: avaliou as
respostas termorregulatórias e o desempenho dos modelos experimentais durante dois
protocolos de exercício físico: exercício progressivo até a fadiga e exercício moderado de
intensidade constante. Foi encontrado que os SHR com 16 e com 48 semanas apresentam
reduzida capacidade de dissipar calor, indicado pela menor temperatura da pele e pelo menor
índice para dissipação de calor. Quanto aos animais normotensos, ambos apresentaram perda
progressiva da capacidade de dissipar calor com o envelhecimento, sendo que os WIS foram
mais afetados nesse sentido. Conclusão geral: a revisão de literatura apontou que ambos os
animais normotensos são amplamente utilizados como controle dos SHR, sendo que a seleção
do modelo deve ser realizada baseada nos objetivos da pesquisa a ser realizada. Este trabalho
contribui adicionando mais elementos quanto a caracterização destes. Foi determinado que os
WIS são melhor controle para estudos com foco na pressão arterial e na estrutura e função
cardíaca. Quanto a trabalhos sobre termorregulação- seja em repouso ou durante o exercício
físico- ambos podem ser utilizados, uma vez que os resultados foram bastante semelhantes.
Palavras-chave: Termorregulação. Hipertensão. Modelos experimentais. Rato
Espontaneamente Hipertenso.

ABSTRACT
REZENDE, Leonardo Mateus Teixeira, D.Sc., Universidade Federal de Viçosa, December,
2020. Comparison of aging effects on cardiovascular and thermoregulatory physiology in
Wistar, Wistar Kyoto and Spontaneously Hypertensive Rats during rest and acute
physical exercise. Adviser: Thales Nicolau Prímola Gomes. Co-advisers: Antônio José Natali
and Cândido Celso Coimbra.
Introduction: The Spontaneously Hypertensive Rat (SHR) is an experimental model widely
used for the study of essential arterial hypertension. However, there is an impasse in the
literature regarding the designation of the model to be used as SHR control, with Wistar Kyoto
rats (WKY) and Wistar rats (WIS) being the most used. This thesis was divided into four
chapters, in which characterizations of the models mentioned were made regarding cardiac and
thermoregulatory parameters during rest and during physical exercise across aging process of
the rats. Objective: to evaluate the effects of aging on cardiac and thermoregulatory variables
during rest and acute physical exercise in SHR and their main experimental controls, WIS and
WKY. Chapter 1: a scoping review based on the Preferred Reporting Items for Systematic
Reviews and Meta-analysis (PRISMA) method, with the objective of mapping all studies that
performed any type of comparison between WIS, WKY and SHR. After applying the search
and selection methods, 161 articles were included for analysis, with 68.4% indicating that both
normotensive animals can be used as control of the SHR. In 13.49% and 6.47% of the studies,
WIS and WKY were indicated as the best control, respectively. Chapter 2: blood pressure was
assessed by tail plethysmography and cardiac structure and function by means of
echocardiography during the animals' aging process (16 weeks, 48 weeks and 72 weeks of life).
It was found that for these variables the WIS represent better control, since the WKY exhibited
values of systolic blood pressure close to the threshold of hypertension (WKY: 132 - 146
mmHg; WIS: 116 - 126 mmHg; p <0.05) and loss of early cardiac function compared to WIS.
Chapter 3: assessed the circadian rhythm of the core temperature during the aging process of
the rats (16 weeks, 48 weeks and 72 weeks of life). The measurement was performed using the
telemetry method and chronobiological analyzes were applied to the data. It was found that the
SHR have dysfunctions of the circadian rhythm at 16 weeks, which was pointed out mainly by
the largest MESOR (SHR16: 37.49 °C; WIS16: 36.50 °C; WKY16: 36.44 °C; p < 0.05), while
normotensive animals showed an increase in MESOR with aging (WIS16: 36.50 °C; WIS72:
37.38 °C; WKY16: 36.44 °C; WKY72: 37.38 °C; p < 0.05). For these variables, it was
considered that both normotensive individuals can be used as a control, since the results were

similar. Chapter 4: evaluated the thermoregulatory responses and the performance of the
experimental models during two physical exercise protocols: progressive exercise until fatigue
and moderate exercise of constant intensity. It was found that SHRs at 16 and 48 weeks have a
reduced ability to dissipate heat, indicated by the lower skin temperature and the lower index
for heat dissipation. As for normotensive animals, both showed progressive loss of the ability
to dissipate heat with aging, and WIS were more affected in this regard. General conclusion:
the literature review pointed out that both normotensive animals are widely used as control of
SHR, and the model selection must be performed based on the research objectives to be carried
out. This work contributes by adding more elements regarding their characterization. It has been
determined that WIS are the best control for studies focusing on blood pressure and cardiac
structure and function. As for studies on thermoregulation - either at rest or during physical
exercise - both can be used, since the results were quite similar.
Keywords: Thermoregulation. Hypertension. Experimental models. Spontaneously
Hypertensive Rat.

LISTA DE SIGLAS E ABREVIATURAS
AA- arachidonic acid
ACE- Angiotensin-converting enzyme
ACTH- Adrenocorticotropic hormone
ADHD- attention deficit hyperactivity disorder
ANF- Atrial natriuretic factor
ANG-2- Angiotensin II
ANP- atrial natriuretic peptide
AT1Rs- ANG II type 1 receptors
AT2Rs- ANG II type 2 receptors
BM- Body mass
C/EBP- CCAAT-enhancer binding proteins
Ca2+- Calcium
CAPES- Coordenação de Aperfeiçoamento de Pessoal de Nível Superior
CCI- Coluna de células intermediolaterais
CD- Corno dorsal
CEUA- Animal Use Ethics Commission
cGMP- Cyclic guanosine monophosphate
CNPq- Conselho Nacional de Desenvolvimento Científico e Tecnológico
COX- Cytochrome oxidase
Cry- Crypthocrome
CT- Continuous test
CV- Corno ventral
DBP- Diastolic Blood pressure
Dyn-A- Dynorphin-A
EAH- Essential arterial hypertension
EC- Exercise capacity
EF- Ejection fraction
ET-1- Endothelin 1
ET-3- Endothelin 3
FAPEMIG- Fundação de Amparo à Pesquisa do Estado de Minas Gerais

FS- Shortening fraction
FTs- Fixed time schedules
g- grama/gram
GABA- Neurotransmissores GABAérgicos
GLU- Glutamato
GRK- G-protein– coupled receptor kinase
HA- Hipertensão arterial
HD- Hipotálamo dorsomedial
HL- Hipotálamo lateral
HLI- Heat loss index
IVSd- Interventricular septum in diastole
IVSs- Interventricular septum in systole
J- Joule
K+- Potassium
LVDd- Left ventricle diameter in diastole
LVDs- Left ventricle diameter in systole
LVM- Left ventricle mass
LVM/BM- Left ventricular/body mass ratio
MAP- Mean arterial pressure
Mesh- Medical Subject Headings
mmHg- Milímetro de mercúrio/Milimeter of mercury
MMP- Metalloproteinase

MTF- Maximal test until fatigue
MVR- medula ventrolateral rostral
ƞ2- Eta squared
Na+- Sodium
NaCl- Sodium chloride
NE- Norepinephrin
NO- Oxid nitric
NPL- Núcleo parabraquial lateral
NPLd- Subdivisão dorsal do núcleo parabraquial lateral
NPLle- Subdivisão lateral externa do núcleo parabraquial lateral
NPR- Núcleo pálido da rafe
NTC- Neurônios termo-sensíveis ao calor
NTS- Núcleo do trato solitário
PAD- Pressão arterial diastólica
PAM- Pressão arterial média
PAS- Pressão arterial sistólica
PDGR-αR- Platelet-derived growth factor-α receptor
PER- Period
POA- Área pré-ótica do hipotálamo
POAm- Área pré-ótica medial do hipotálamo
POAmd- Área pré-ótica mediana do hipotálamo
POAvl- Porção ventral da área pré-ótica lateral do hipotálamo
PRISMA- Preferred Reporting Items for Systematic Reviews and Meta-analysis
PVH- Paraventricular nuclei
PWd- Posterior wall thickness in diastole
RMP- Rest membrane potentials
RVLM- Ventrolateral medullary pressor area
SBP- Systolic Blood pressure
SD- Standard deviation
SHR- Rato espontaneamente hipertenso/Spontaneously Hypertensive Rat

SIP- Schedule-induced polydipsia
SON- Supraoptic nuclei
SQN- Núcleo supraquiasmático
TAM- Tecido adiposo marrom
Tamb- Ambient temperature
Tcentral- Temperatura central
Tcore- Core temperature
Tcorporal- Temperatura corporal
TGF-β1- Fator de crescimento transformador beta 1
Tpele- Temperatura da pele
TRH- Trato retino-hipotalâmico
TRP- Transient receptor potential channel
Tskin- Skin temperature
USA- United states
VMSC- Vascular muscle smooth cells
WIS- Wistar
WKY- Wistar Kyoto
α-MHC- Myosin heavy chain
°C- Grau Celsius
5HT- Serotonin
6-OHDA- 6-hydroxydopamine hydrochloride

LISTA DE FIGURAS
Introdução:
Figura 1. Remodelamento vascular hipertrófico e eutrófico. Adaptado de Sanoyama et al.,
2007. ------------------------------------------------------------------------------------------------------- 20
Figura 2. Canais de potencial receptor transitório (TRPs). Imagem adaptada de Romanovsky
(2007). ----------------------------------------------------------------------------------------------------- 24
Figura 3. Condução neuronal aferente. RGD- raiz de gânglio dorsal; TRPM8- Membro da
subfamília M do canal potencial de cátions do receptor transitório 8; TRPV1- O membro
transitório 1 da subfamília V do canal de cátions em potencial do receptor transitório; GN-
gânglio nodoso; CD- corno dorsal; NTS- núcleo do trato solitário; NPLd- subdivisão dorsal do
núcleo parabraquial; NPLle- subdivisão lateral externa do núcleo parabraquial; POAmd- área
pré-ótica mediana do hipotálamo; POAm- área pré-ótica medial do hipotálamo; GLU-
glutamato . Imagem adaptada de Madden e Morrison (2019). ------------------------------------ 26
Figura 4. Condução neuronal eferente. TAM- tecido adiposo marrom; VC- vasoconstrição;
VD- vasodilatação; POAm- área pré-ótica medial do hipotálamo; POAmd- área pré-ótica
mediana do hipotálamo; POAvl- porção ventral da área pré-ótica lateral; HD- hipotálamo
dorsal; HL- hipotálamo lateral; NPR- núcleo pálido da rafe; MVR- medula ventrolateral rostral;
NSS- núcleo salivatório superior; CV- corno ventral; CCI- células da coluna intermediolateral.
Imagem adaptada de Madden e Morrison (2019) --------------------------------------------------- 28
Figura 5. Imagem representativa do sistema de controle circadiano. Após estímulo de luz
captado pela retina, o sinal fótico é conduzido ao núcleo supraquiasmático (SQN) via trato
retinohipotalâmico (TRH). É iniciado um loop de feedback negativo no SQN, em que as
proteínas Bmal1 e Clock se ligam e induzem a tradução de proteínas responsáveis pelo controle
de diferentes variáveis circadianas. Ainda, o complexo Bmal1/Clock promove a transcrição-
tradução das proteínas Period (PER) e Crypthocrome (Cry) após ausência do sinal fótico, que
por sua vez se ligam e inibem o complexo Bmal1/clock, finalizando o ciclo circadiano, que será
reiniciado após novo sinal de luz. Imagem adaptada de Nakao, Nakamura e Shibata, 2015 e
Durrington et al., 2013) --------------------------------------------------------------------------------- 31
Figura 6. Pressão arterial sistólica (PAS) e frequência cardíaca (FC) de ratos normotensos
Wistar Kyoto (painel A) e temperatura corporal de ratos normotensos Long-Evans (painel B)
durante quatro dias. Imagem adaptada de Lemmer et al. (2003) e Reffineti (2003). ---------- 33

LISTA DE TABELAS
Capítulo 1:
Table 1. Laboratories of experimental strains origin. -------------------------------------- 54
Table 2. Characterization of Wistar, Wistar Kyoto and SHR. ----------------------------- 56
Capítulo 2:
Table 1. Long term behavior of morphological and functional echocardiographic parameters of
WIS, WKY and SHR with 16, 48 and 72 weeks. ----------------------------------------- 1289
Capítulo 3:
Table 1. Cosinor analysis of the Tcore circadian rhythm. ----------------------------------- 149
Capítulo 4:
Table 1. Body mass and blood pressure measurements. ----------------------------------- 162

SUMÁRIO
Introdução:
1- Introdução: ........................................................................................................................................ 18
1.1- Hipertensão arterial: ........................................................................................................... 19
1.2- Termorregulação: ....................................................................................................................... 22
1.3- Ritmo circadiano: ....................................................................................................................... 29
1.4- Envelhecimento: ........................................................................................................................ 33
1.5- Exercício físico: ........................................................................................................................... 34
1.6- O paradigma experimental: ....................................................................................................... 36
2- Objetivos: .......................................................................................................................................... 38
2.1- Geral: .......................................................................................................................................... 38
2.2- Específicos: ................................................................................................................................. 38
3- Referências: ....................................................................................................................................... 38
Capítulo 1:
1- Introduction: ..................................................................................................................................... 47
2- Methods: ........................................................................................................................................... 49
3- Results: .............................................................................................................................................. 50
4- Discussion: ....................................................................................................................................... 103
5- References: ..................................................................................................................................... 108
Capítulo 2:
1- Introduction: ................................................................................................................................... 120
2- Methods: ......................................................................................................................................... 121
3- Results: ............................................................................................................................................ 122
4- Discussion: ....................................................................................................................................... 129
5- Conclusions: .................................................................................................................................... 131
6- References: ..................................................................................................................................... 132
Capítulo 3:
1. Introduction..................................................................................................................................... 138
2. Materials and methods ................................................................................................................... 140
3. Results ............................................................................................................................................. 142
4. Discussion ........................................................................................................................................ 150

5. Conclusions...................................................................................................................................... 153
6. Acknowledgments ........................................................................................................................... 153
7. References ....................................................................................................................................... 154
Capítulo 4:
1- Introduction: ................................................................................................................................... 158
2- Materials and Methods: .................................................................................................................. 159
3- Results: ............................................................................................................................................ 160
4- Discussion: ....................................................................................................................................... 168
5- Conclusions: .................................................................................................................................... 169
6- References....................................................................................................................................... 170

18
1- Introdução:
A população mundial experimentou um processo evolutivo constante que impactou
diferentes áreas da sociedade, incluindo no combate a doenças (1). Este fato levou a criação do
conceito de transição epidemiológica- uma teoria que explica a dinâmica dos padrões de saúde
e mortalidade em função da evolução- que leva em consideração fatores sociais, demográficos
e econômicos (2). Existem três estágios bem definidos de acordo com esta teoria: a) idade da
pestilência e fome; b) idade do declínio das pandemias e; c) idade das doenças crônicas
degenerativas e provocadas pelo homem (3).
O período da pestilência e fome durou até o fim da idade média e tinha como
característica altas taxas de natalidade e mortalidade, sendo que a expectativa de vida era de
aproximadamente 30 anos. Foi marcado por grande incidência de mortes decorrentes da
desnutrição e pandemias (1). A idade do declínio das pandemias teve duração da renascença até
a revolução industrial, marcada pelo aumento da expectativa de vida para 40 anos. Houve um
declínio das pandemias, sendo as doenças infecciosas a principal causa de morte. Da revolução
industrial até o século XX o mundo vivenciou a idade das doenças degenerativas e provocadas
pelo homem. O desenvolvimento levou a maior disponibilidade de alimentos e melhores
condições de moradia e saneamento e, consequentemente, à redução das doenças infecciosas.
Dessa forma, a expectativa de vida aumentou exponencialmente e as doenças crônicas
degenerativas passaram a ser o principal risco a saúde mundial (1-3).
Posterior a estes três estágios a sociedade seguiu em processo evolutivo acelerado,
devido ao desenvolvimento industrial e tecnológico, indicando maior dinâmica das etapas que
caracterizam a saúde/mortalidade da população mundial. Deste modo, já são apontados dois
novos estágios: d) idade das doenças degenerativas atrasadas e; e) idade das infecções
emergentes e re-emergentes. A primeira é caracterizada pelo aumento da expectativa de vida
de indivíduos com doenças crônico degenerativas em função da melhora nos tratamentos, e a
segunda associada ao ressurgimento de doenças parasitárias (3).
O avanço técnico-científico trouxe aumento da longevidade, no entanto, novos desafios
surgiram para as ciências da saúde (3, 4). Apesar do grande esforço e alta fomentação pública
no combate às doenças cardiovasculares, estas seguem como uma das principais causas de
mortalidade mundial (5-9). Um estudo apontou que em 2013 houveram mais de 54 milhões de
mortes no mundo, sendo que 17 milhões (32%) foram atribuídas aos distúrbios cardiovasculares
(10). Entre as doenças cardiovasculares com maior incidência a nível mundial está a hipertensão
arterial (HA), sendo que esta apresenta prevalência acentuada na américa latina, que em sua

19
composição predomina países emergentes, que são os que exibem maior incidência da HA (9,
11).
No Brasil existem estudos com extensa abrangência territorial que apontam alta
incidência da HA (12-16). Andrade e colaboradores realizaram um levantamento da prevalência
de HA autorreferida em todas regiões geográficas do Brasil no ano de 2013, em que foram
entrevistadas 60202 pessoas. Os autores informaram que 21,4% da população avaliada possuía
o diagnóstico de HA (12). Um segundo trabalho analisou a prevalência da HA no Brasil nas
últimas três décadas (1980-2010) e concluiu que apesar de haver uma redução de 6% dentro
deste período, a patologia ainda está presente em aproximadamente 30% da população (13). As
informações apresentadas destacam a HA como uma das patologias contemporâneas de maior
acometimento e diretamente relacionada a taxa de mortalidade a nível nacional e mundial.
Portanto, pesquisas a respeito desta temática possuem grande relevância e contribuem para a
prevenção, diagnóstico e tratamento da doença.
1.1- Hipertensão arterial:
A HA é caracterizada pelo aumento sustentado da pressão sanguínea nas artérias acima
dos níveis normais (17-19). Apesar de existirem informações a respeito de fatores que
predispõem à HA- como histórico familiar, alta ingestão de sódio, sedentarismo, etc.- na
maioria dos casos a doença não apresenta causa identificável, sendo rotulada como HA primária
ou essencial, englobando aproximadamente 95% dos casos (20, 21). Este distúrbio afeta
profundamente os dois componentes estruturais do sistema cardiovascular, coração e vasos
sanguíneos, e frequentemente é associado ao surgimento de outros problemas como a
insuficiência cardíaca e renal (18, 22).
Existe uma categorização da pressão arterial de acordo com os valores mensurados.
Entre os humanos, é considerado normal o indivíduo que apresenta valores abaixo de 120/80
mmHg (Pressão arterial sistólica- PAS/Pressão arterial diastólica- PAD); àqueles com valores
de 120-129/<80 mmHg são classificados com pressão arterial elevada; os com 130-139/80-89
mmHg são considerados hipertensos no estágio 1; e indivíduos acima de 140/90 mmHg são
classificados como hipertensos no estágio 2 (17, 19). Já entre os animais experimentais,
especificamente para os roedores, a hipertensão é classificada como PAS acima dos 150 mmHg
(23).
A resistência vascular periférica aumentada é uma característica clássica da HA,
ocorrendo principalmente na porção distal das artérias e arteríolas (20). A resistência vascular
periférica é determinada principalmente pelo diâmetro do lúmen dos vasos. Existem duas

20
teorias para explicar este fenômeno: rarefação e remodelamento (17, 20). O processo de
rarefação é a redução da densidade de vasos por área, sendo que pode ser dividido em rarefação
estrutural, que indica uma redução real na quantidade de vasos e a rarefação funcional, que
representa menor irrigação dos vasos (24). O remodelamento vascular é um processo de
modificação estrutural que envolve crescimento, morte e migração celular, além de síntese e
degradação de matriz extracelular e ocorre após estímulos como modificação hemodinâmica
(25). É um processo extremamente importante para a saúde cardiovascular e acontece de
maneira ininterrupta, o que quer dizer que a estrutura dos vasos é modificada constantemente a
fim de atender as demandas sanguíneas em adequada quantidade e pressão (20). Contudo, o
remodelamento imposto pela HA leva a um quadro de insuficiência vascular devido ao
desequilíbrio imposto por prevalência de fatores de crescimento endotelial, como TGF-β1,
colágeno e elastina (26, 27). É importante ressaltar que ambos os mecanismos contribuem para
instalação de uma resistência vascular periférica aumentada e, consequentemente, para
patogênese da HA. Estes acometimentos são danosos à estrutura e ao funcionamento vascular,
atuando ainda como fator de risco para uma série de outros distúrbios cardiovasculares como
aterosclerose e infarto do miocárdio (25).
O remodelamento vascular provocado pela hipertensão pode ocorrer de duas maneiras,
o remodelamento eutrófico e hipertrófico. O eutrófico é uma alteração estrutural induzida por
processo hipertensivo menos severo ou inicial, em que ocorre espaçamento das paredes
concomitante à redução do diâmetro do lúmen, e aumento da razão parede/lúmen, no entanto,
a área de secção transversa é conservada (28). É uma resposta que objetiva a manutenção da
função dos vasos, sendo que o tônus miogênico possui papel determinante. O tônus miogênico
é uma importante função das pequenas artérias, caracterizado pela capacidade de constrição
após o aumento da pressão intraluminal (29). Quando a pressão hemodinâmica supera o limite
suportado pela parede das artérias ocorre a quebra do tônus miogênico, levando a uma dilatação
forçada (30). Nesse momento é iniciado o processo de remodelamento vascular patológico, em
que ocorre aumento das paredes vasculares e redução do diâmetro do lúmen, associado ao
aumento da secção transversa dos vasos (28, 31).
Figura 1. Remodelamento vascular hipertrófico e eutrófico. Adaptado de Sanoyama et al., 2007.

21
Este rearranjo da geometria vascular contribui para a evolução da doença, uma vez que
afeta profundamente a hemodinâmica, aumentando a sobrecarga de pressão imposta ao coração.
Assim como os vasos, o coração também é afetado pela HA, sendo importante
considerar que as alterações estruturais e funcionais dos cardiomiócitos ocorrem posterior ao
desequilíbrio hemodinâmico (32, 33). O miocárdio é composto por cardiomiócitos, vasos
sanguíneos e matriz extracelular. A estrutura e função do coração dependem do equilíbrio entre
estes componentes, sendo que alterações ocorrem continuamente em função dos diferentes
estímulos (33, 34). Como já visto, a HA promove sobrecarga hemodinâmica de pressão,
levando a maior quantidade de sarcômeros dispostos em paralelo, originando hipertrofia
concêntrica patológica do ventrículo esquerdo (33).
Uma delicada rede tridimensional de colágeno envolve os cardiomiócitos a fim de
oferecer uma estrutura de suporte, todavia, a HA leva ao aumento de colágeno na matriz
extracelular (35). Dessa forma, o coração do hipertenso apresenta um desequilíbrio em que os
componentes extracelulares aumentam desproporcionalmente em relação aos cardiomiócitos
(36). Estudos confirmam que hipertensos apresentam maior quantidade de colágeno tipo I e III
nas artérias coronarianas (37, 38), sendo que a sobrecarga mecânica funciona como mecanismo
de disparo para aumento da síntese de colágeno (39, 40). Aliado a isto, a maior proporção de
tecido fibroso interfere na condução do impulso elétrico do miocárdio, podendo originar, por
exemplo, arritmias (37).
A quantidade de colágeno na matriz extracelular depende do equilíbrio na atividade das
estruturas responsáveis pela síntese e degradação deste (41). O sistema renina-angiotensina-
aldosterona funciona como precursor da síntese de colágeno no miocárdio, estimulando a ação
dos fibroblastos, enquanto as enzimas do grupo metaloproteinases são responsáveis pela
degradação (36, 37). Sabe-se, no entanto, que a HA promove um desequilíbrio entre estes
processos, promovendo maior síntese de colágeno (35), sendo que a instalação da fibrose
promove redução do fluxo sanguíneo coronariano, bem como enrijecimento do tecido, redução
da distensibilidade, redução do enchimento ventricular e, consequentemente, disfunção
diastólica (37, 39, 42).
O impacto da HA no miocárdio é caracterizado por estágios bem definidos (33, 43).
Inicialmente ocorre a fase compensada, em que o coração responde a sobrecarga de pressão
aumentando a espessura das paredes concomitante à redução do diâmetro do ventrículo
esquerdo, possibilitando gerar maior pressão no momento da ejeção sanguínea, a fim de vencer
a resistência vascular periférica aumentada (41, 44). Este rearranjo estrutural ocorre como
tentativa compensatória de reduzir o estresse na parede das cavidades, bem como promover a
22
manutenção da função sistólica. No entanto, o estímulo aplicado pela HA é crônico, de forma
que o tecido torna-se incapaz de normalizar o estresse imposto, o que, aliado ao
desenvolvimento da disfunção diastólica e aumento da fibrose, levam à instalação da fase
descompensada (34).
A doença atinge a fase descompensada quando as alterações estruturais prejudicam a
funcionalidade dos cardiomiócitos. A literatura aponta mecanismos responsáveis pela
descompensação na hipertensão (45, 46). Ocorre modificação na expressão dos genes
reguladores da função contrátil, como a miosina de cadeia pesada, acompanhado do avançado
estágio de fibrose, podendo levar a disfunção sistólica. Relatos apontam também para apoptose
de cardiomiócitos induzida pela hipertensão, colaborando para o desequilíbrio entre células
cardíacas e tecido fibroso (46-48).
O sistema cardiovascular é determinante para a manutenção de uma série de funções do
organismo, incluindo o controle termorregulatório. Tal controle se dá por meio de ajustes no
débito cardíaco e volume de ejeção quando é necessário regulação na circulação sanguínea,
aliado ao controle do tônus vascular, participando diretamente dos processos de dissipação e
retenção de calor (141). Dessa forma, patologias que afetam a forma e função dos componentes
do sistema cardiovascular podem alterar o controle termorregulatório (142). Por exemplo, A
HA pode influenciar estes mecanismos de controle vascular devido ao aumento da resistência
vascular periférica (142). Dessa forma, pesquisas científicas sobre a associação da HA a
variáveis termorregulatórias possuem relevância, uma vez que o controle termorregulatório é
determinante para manutenção da vida.
1.2- Termorregulação:
A termorregulação representa o controle da temperatura corporal (Tcorporal), mesmo com
grande variação da temperatura ambiente, sendo que o balanço térmico ocorre por meio dos
processos de produção e perda de calor (115). O ajuste termorregulatório acontece
continuamente objetivando manter a homeostase térmica frente aos diferentes desafios, uma
vez que até pequenos movimentos corporais podem promover modificações metabólicas e,
consequentemente, na produção de calor (116, 117).
Os mamíferos são classificados como homeotérmicos, o que significa que seu corpo
representa sua fonte primária de calor (118). A Tcorporal desta classe de animais é mantida em
uma estreita faixa de variação, próxima aos 37°C, e desvios acentuados promovem respostas

23
termorregulatórias comportamentais e/ou autonômicas visando o reestabelecimento de valores
estáveis (119).
A termorregulação desempenha papel central no organismo, sendo determinante para o
funcionamento de uma série de órgãos e tecidos em nível central e periférico (118). Sua
manutenção ocorre por meio de ação integrativa entre os seguintes componentes: agentes
receptores, canal aferente, centro controlador, canal eferente e órgãos efetores. O centro
controlador é localizado na área pré-ótica do hipotálamo (POA)- local de integração sensório-
motor (118, 120)- que tem seus comandos baseados em informações recebidas via aferente e
executados por órgãos efetores (118, 121, 122). Tal ação integrativa utiliza como base
pincipalmente as temperaturas central (Tcentral) e da pele (Tpele). A Tcentral é fortemente estável e
reflete a Tcorporal profunda, incluindo órgãos e tecidos, enquanto a Tpele representa a Tcorporal
periférica, que é intensamente influenciada pelo fluxo sanguíneo e tônus vascular, bem como
pela temperatura ambiente externa ao corpo, sendo sujeita a maior variação (123).
A POA é responsável por administrar as ações destinadas à manutenção da homeostase
termorregulatória (124), sendo que uma rede de neurônios nela contidos regulam a temperatura
dentro da faixa de variação aceitável (36-38°C). Assim, quando a região da POA é aquecida
estes neurônios termo-sensíveis são despolarizados e consequentemente aumentam sua
frequência de disparo, atuando no sentido de aumentar as ações promotoras de perda de calor
(125). Sabe-se que existe uma comunicação entre o centro controlador e as regiões periféricas
corporais, uma vez que estudos apontam que modificações na Tpele geram respostas imediatas
na POA, visando antecipar possível variação da Tcentral (126). Por exemplo, quando a pele de
ratos é resfriada, a termogênese do tecido adiposo marrom (TAM) é ativada via estimulação
simpática a fim de evitar que o resfriamento atinja regiões corporais centrais (122). Tratam-se,
portanto, de respostas termorregulatórias defensivas, induzidas pela detecção de modificações
da temperatura ambiente. Estas respostas acontecem por meio de termorreceptores espalhados
nas terminações nervosas sensoriais primárias distribuídas na pele com direta transmissão para
a POA (120).
As informações térmicas são captadas por canais receptores de ação dependente de
temperatura (transient receptor potential channel- TRP channels). Estes aparecem espalhados
na pele para aferição da influência ambiente, bem como em vários órgãos e tecidos, para
determinação de temperatura local (124). As informações são direcionadas ao centro
controlador via neurônios aferentes, mais especificamente pela via espino-parabraquial-
hipotalâmica (118, 124). Os canais termorreceptores são divididos entre aqueles sensíveis ao
calor (TRPM2, TRPM4, TRPM5, TRPV1, TRPV2, TRPV3 e TRPV4) localizados

24
predominantemente em regiões centrais do corpo, e os sensíveis ao frio (TRPA1 e TRPM8),
encontrados principalmente abaixo da epiderme, sendo considerados receptores periféricos
(fig.4) (118, 127). Os canais TRP são ativados quando a temperatura a qual estão expostos
atingem seu limiar para despolarização de membrana (118). É importante ressaltar que eles
respondem dentro de uma faixa de variação de temperatura, podendo inclusive atuar de maneira
sobreposta.
O processo de comunicação aferente é iniciado nos canais TRP, que têm seus corpos
neuronais inseridos nos gânglios de raiz dorsal da medula espinhal, que por sua vez projeta-se
para o corno dorsal (CD), acessando principalmente a lâmina I (128). Contudo, as vias de
sinalização percorridas pelos estímulos de frio e de calor são distintas, iniciando pelo tipo de
fibra neural associada. As fibras nervosas do tipo A e C são responsáveis pela condução do
estímulo de frio, enquanto apenas as fibras tipo C conduzem o estímulo de calor (129-131). O
CD tem neurônios que se estendem para o núcleo parabraquial lateral (NPL), sendo este ativado
tanto por vias de calor, como de frio, iniciadas na pele (132). Os neurônios do NPL ativados
pelo frio estão locados predominantemente na subdivisão lateral externa do NPL (NPLle), os
quais recebem informações do CD e projetam para a área pré-ótica mediana do hipotálamo
(POAmd). Já os impulsos de calor são recebidos pela subdivisão dorsal do NPL (NPLd), que
providencia comunicação com a POAmd (fig.4). É importante ressaltar que o principal
neurotransmissor envolvido na condução da informação aferente, tanto para o frio, como paro
o calor, é o glutamato (132).
Figura 2. Canais de potencial receptor transitório (TRPs). Imagem adaptada de Romanovsky (2007).

25
As vias aferentes contam ainda com a contribuição da percepção sensorial térmica
abdominal, espinhal e cerebral (124, 132, 133). Sabe-se que modulações da temperatura
abdominal induzem modificação de respostas termoefetoras como a produção de suor e os
tremores (124, 133). Tal percepção aferente é iniciada no nervo vago dos gânglios nodosos, que
conduzem a informação até o núcleo do trato solitário (NTS), que por sua vez, realizam sinapse
no NPLd, promovendo a continuidade do trajeto neuronal, objetivando atingir a POA e
alcançando, portanto, a regulação das respostas termoefetoras (fig.4) (124, 132). A nível
medular, os canais TRP estão localizados principalmente nas fibras somatossensoriais do CD
(124). Estes funcionam ainda como regulador da informação oriunda da periferia, promovendo
a integração com sua própria percepção e então transmissão para a POA. Esta função é
particularmente importante em ambientes extremos, uma vez que a pele é altamente
influenciável, podendo emitir informações descomedidas (124).
Especificamente na POA, existe predominância de neurônios termo-sensíveis ao calor
(NTC), sendo que estes aumentam sua taxa de disparo após aquecimento local (118, 132). Estes
atuam promovendo a integração dos sinais periféricos oriundos da pele e das vísceras com a
temperatura cerebral e, na condução neuronal de saída termoefetora na área pré-ótica medial
(POAm) (132). O influxo referente ao calor promove a estimulação destes NTC, dando
continuidade ao início de respostas termoefetoras adequadas a perda de calor. Entretanto,
quando é chegado influxo de informação oriunda de estímulo de frio das periferias, a primeira
resposta é a inibição da neurotransmissão destes mesmos NTC, o que destaca sua relevância no
controle termorregulatório (fig.5) (132, 134).
As informações até aqui apresentadas indicam que a percepção térmica dos
homeotérmicos é considerada assimétrica, uma vez que existe maior concentração de canais
TRP sensíveis ao calor, bem como predominância em termos de quantidade e atividade de
NTCs no controle central (118). Tal fato justifica-se pela Tcentral estar próxima aos limites
superiores suportados pelo organismo, existindo portanto maior necessidade de controle sobre
o aumento da temperatura (118, 127). Por outro lado, existe maior margem para redução da
Tcentral, já que esta é fixada em maior distância do limite inferior, sendo este o principal motivo
pela reduzida quantidade de neurônios termorreceptores sensíveis ao frio (118).

26
As respostas termoefetoras autonômicas dividem-se em categorias: termogênicas,
vasomotoras e evaporativas. As respostas termogênicas são voltadas para produção interna de
calor, o que incluí a termogênese adaptativa do TAM e a termogênese via tremores. As
modificações do tônus vascular, mais especificamente, os processos de vasoconstrição e
vasodilatação, compõe as respostas vasomotoras. Por fim, a perda evaporativa de calor,
composta pela sudorese para os humanos e a secreção e espalhamento de saliva para os roedores
(132). Todos esses mecanismos termoeferentes têm seu início na POA, possuindo como
principal via eferente o hipotálamo dorsomedial (HD), seguido do núcleo pálido da rafe (NPR)
a nível medular, para então serem encaminhadas para os terminais comunicativos entre a
medula espinhal e os órgãos efetores, intermediados pelos gânglios (fig.5) (132). No entanto,
existem particularidades que as distinguem.
Quanto a termogênese via TAM e tremores, ocorre transmissão neural da POAm
para o HD, que atua como retransmissor, ativando neurônios pré motores do NPR, que dá
seguimento a transmissão descendente via neurônios espinhais, alcançando os neurônios pré-
ganglionares para a termogênese do TAM e neurônios motores, que promovem estímulo para
a termogênese via tremores do músculo esquelético (fig.5). O TAM é um tecido
metabolicamente muito ativo e rico em mitocôndrias, o que fornece sua coloração amarronzada.
Este representa órgão efetor importante em pequenos mamíferos como roedores, mas está
Figura 3. Condução neuronal aferente. RGD- raiz de gânglio dorsal; TRPM8- Membro da subfamília M do canal
potencial de cátions do receptor transitório 8; TRPV1- O membro transitório 1 da subfamília V do canal de cátions
em potencial do receptor transitório; GN- gânglio nodoso; CD- corno dorsal; NTS- núcleo do trato solitário; NPLd-
subdivisão dorsal do núcleo parabraquial; NPLle- subdivisão lateral externa do núcleo parabraquial; POAmd- área
pré-ótica mediana do hipotálamo; POAm- área pré-ótica medial do hipotálamo; GLU- glutamato . Imagem adaptada
de Madden e Morrison (2019).

27
presente também em seres humanos. Já os tremores são contrações involuntárias do musculo
esquelético objetivando aumentar a produção de calor (124).
Sabe-se que em ambiente quente existe um comando inibitório simpático oriundo da
POA, mais especificamente, da POAm e da porção ventral da área pré-ótica lateral (POAvl),
indicando inibição dos neurônios do HD e do NPR via liberação de neurotransmissores
GABAérgicos e, por consequência, suprimindo a ativação da termogênese do TAM (135). De
maneira semelhante, o ambiente quente indica inibição do circuito neural para termogênese via
tremores, entretanto, a inibição oriunda da POAvl atinge apenas os neurônios do NPR (135).
Em contraponto, o estímulo de frio, quando na intensidade suficiente, induz a retirada da
inibição simpática imposta a POA, dando início a cascata de sinalização para termogênese do
TAM e dos tremores (135, 136). O trecho final de ativação do circuito neural do TAM e dos
tremores distingue. Enquanto o circuito do TAM apresenta influxo espinhal simpático
glutamatérgico e serotoninérgico a nível pré-ganglionar, os tremores são iniciados pela ativação
dos neurônios pré-motores somáticos α e γ no corno ventral (CV), que por sua vez, induzem o
início da termogênese diretamente no tecido muscular esquelético.
De forma bastante semelhante acontece a via para vasoconstrição, com exceção da
retransmissão no HD (fig.5B). A transmissão neural efetora é iniciada na POA e entregue
diretamente ao NPR, que promove influxo neural para as células da coluna intermediolateral da
coluna toracolombar, ativando os neurônios pré-ganglionares simpáticos, determinando, por
fim, a ação de fibras nervosas simpáticas que inervam os vasos cutâneos, ativando a
vasoconstrição. Evidências apontam ainda para contribuição da medula ventrolateral rostral
(MVR) na comunicação eferente para vasoconstrição, contudo, esta via ainda não está
devidamente elucidada (137). O circuito neural para vasodilatação ainda não possui um modelo
de consenso na literatura, contudo, sabe-se que o comando central para inibição da
vasoconstrição é fator crucial para o início do processo antagonista, ou seja, a vasodilatação
(138).

28
A terceira via eferente é voltada para perda evaporativa de calor, o que engloba a
sudorese para os seres humanos e a termorregulação salivatória nos roedores (120, 124, 132).
Pouco se sabe sobre o disparo central para produção de suor. Entretanto, as sinapses eferentes
estimulam neurônios da área parafacial, seguindo para coluna de células intermediolaterais
(CCI), que na sequência, promove comunicação com os neurônios simpáticos pré-ganglionares
sudomotores, que ativam as glândulas sudoríparas (120).
Os roedores não possuem o mecanismo de sudoreses, no entanto, utilizam a secreção de
saliva seguida do espalhamento desta pela superfície corporal, dissipando, portanto, calor via
evaporação da saliva (132). Seu controle central se dá via comando eferente inibitório oriundo
da POA para o hipotálamo lateral (HL). A inibição dos neurônios do HL indica ativação dos
neurônios do núcleo salivatório superior (NSS), sendo que estes promovem comunicação com
Figura 4. Condução neuronal eferente. TAM- tecido adiposo marrom; VC- vasoconstrição; VD- vasodilatação; POAm- área pré-ótica
medial do hipotálamo; POAmd- área pré-ótica mediana do hipotálamo; POAvl- porção ventral da área pré-ótica lateral; HD- hipotálamo
dorsal; HL- hipotálamo lateral; NPR- núcleo pálido da rafe; MVR- medula ventrolateral rostral; NSS- núcleo salivatório superior; CV-
corno ventral; CCI- células da coluna intermediolateral. Imagem adaptada de Madden e Morrison (2019)

29
neurônios pré-ganglionares parassimpáticos, que estimulam as glândulas salivares (fig.5C). É
importante ressaltar que as vias termoeferentes apresentadas não ocorrem de maneira exclusiva,
mas sim em sobreposição.
A homeostase térmica não está associada a ausência de variação da Tcentral ao longo do
dia (~36-38°C), havendo um padrão de oscilação diário em conformidade com variações
geofísicas ambientais, sincronizada principalmente com o ciclo dia/noite (139, 140). Existe um
consenso na literatura de que o controle da Tcentral é regulado primariamente pelo ajuste
homeostático e em segundo plano pelo sistema circadiano (63). Os mamíferos possuem um
ciclo de atividade/repouso, sendo que o pico de Tcentral ocorre na fase de atividade seguido de
redução no período de repouso. Humanos tem atividade durante o dia, apresentando aumento
da Tcentral neste momento. Em oposição, os roedores são animais de hábitos noturnos, possuindo
maior atividade termogênica associada a maior atividade locomotora neste período, exibindo
portanto um padrão de oscilação da Tcentral invertido em relação aos humanos (65).
1.3- Ritmo circadiano:
Ritmo circadiano designa um período de aproximadamente 24 horas em que se baseia o
ciclo biológico da maioria dos seres vivos em associação a variação geofísica ambiental. Para
os mamíferos, o principal regulador externo do ritmo circadiano é o ciclo dia/noite, sendo que
a presença de luz ativa fotorreceptores na retina, que por sua vez, indica a condução da
informação ao centro controlador (núcleo supraquiasmático- SQN) de forma direta via trato
retino-hipotalâmico (TRH; Fig.2), e de forma indireta via trato geniculo-hipotalâmico (49). O
SQN- localizado no hipotálamo- recebe a informação e determina a fase circadiana atual, dessa
forma, esta estrutura é responsável pela geração, controle e sincronização do ritmo de diversas
variáveis do organismo, o que acontece por meio da administração de vias de sinalização neural
e hormonal (50).
Além do relógio central, os órgãos periféricos possuem relógios de controle circadiano
específico de suas funções, que atuam sob sinalização central (51). Dessa forma, o SQN atua
como retransmissor, emitindo a informação oriunda do ambiente externo para os demais tecidos
(51, 52). Estes ritmos são criados e controlados através da ação de um conjunto de genes
relógio- Clock, Bmall1, Period (Per) e Crypthocrome (Cry)- situados a nível central e periférico
(52-54). É observado processo interperiódico de ativação/bloqueio da atividade de translação-
tradução-atividade dos genes relógio induzido pela flutuação circadiana. Após a chegada do
sinal fótico ao SQN, as proteínas clock e Bmal1 se ligam formando um complexo que induz a

30
expressão genética seguida da tradução de uma série de proteínas envolvidas no controle
circadiano. Entretanto, encerrado estímulo de luz, o complexo Clock/bmal1 induz a tradução
das proteínas Per e Cry, que por sua vez quebram a ligação entre as proteínas Clock e Bmal1,
encerrando o ciclo. Este mecanismo de feedback negativo permite a oscilação das variáveis
circadianas, possibilitando ao organismo antecipar as alterações ambientais, organizando de
forma ativa sua fisiologia circadiana (51). Contudo, sabe-se que existem diferentes isoformas
dos genes citados, o que provoca particularidades entre espécies (52, 55, 56). Dentre as
variáveis que apresentam variação rítmica destacamos aqui a temperatura corporal e parâmetros
cardiovasculares como a frequência cardíaca e a pressão arterial (Fig. 3) (57, 58).
Como apresentado, todos os mamíferos estão sujeitos a variação circadiana, no entanto,
sabe-se que existem animais de diferentes cronotipos, ou seja, aqueles de hábitos noturnos e os
de hábitos diurnos (55, 56). Para o devido entendimento das diferenças entre espécies, se faz
necessária a compreensão dos conceitos de “dia e noite subjetivos”, que representam
qualitativamente as fases em que ocorrem atividade e repouso, respectivamente. Assim sendo,
os roedores que possuem hábitos noturnos, possuem dia subjetivo na fase noturna e noite
subjetiva na fase diurna. Surpreendentemente, animais com hábitos opostos apresentam
estrutura anatômica semelhante quanto aos componentes responsáveis pelo ritmo circadiano e,
ainda mais interessante, quanto as fases de atividade do SQN (59, 60). Dessa forma, o
funcionamento do SQN frente ao estímulo de luz é semelhante entre as espécies de diferente
cronotipos. No entanto, outros pontos do cérebro são envolvidos no controle circadiano
específico (córtex cingulado, parietal e estriado), bem como os órgãos periféricos possuem
relógios de controle específicos, sendo que nestes é apontado pico do gene Per2 invertido em
180° entre as espécies de cronotipos distintos, explicando as diferenças de preferência temporal
(59).

31
A glândula pineal tem grande importância na imposição dos ritmos biológicos, uma vez
que promove a síntese e liberação de melatonina após estimulação simpática. Um estudo
comparou a dinâmica da melatonina em animais com diferentes cronotipos e concluiu não haver
diferenças no perfil de produção e liberação (61), o que concorda com os achados de atuação
semelhante das estruturas centrais de controle.
O fator ambiental modulador (Zeitgeber) mais evidente é a variação dia/noite, em que é
possível observar clara sincronização com variáveis circadianas fisiológicas e comportamentais
(62, 63). O ciclo dia/noite é acompanhado por alteração da temperatura ambiental, sendo que
relatos indicam que a exposição à baixas temperaturas aumentam a amplitude do ritmo
circadiano da temperatura central em várias espécies, sendo observado também menor valor de
acrofase, ou seja, de pico (63). No entanto, a origem dos ritmos circadianos é endógena, sendo
que a sincronização dos ritmos às variações geofísicas ambientais funciona apenas como agente
modulador (62, 64, 65), fato confirmado por estudos que apontam manutenção dos ritmos
biológicos mesmo na ausência de variação ambiental (66, 67).
Figura 5. Imagem representativa do sistema de controle circadiano. Após estímulo de luz captado pela retina, o sinal fótico é conduzido
ao núcleo supraquiasmático (SQN) via trato retinohipotalâmico (TRH). É iniciado um loop de feedback negativo no SQN, em que as
proteínas Bmal1 e Clock se ligam e induzem a tradução de proteínas responsáveis pelo controle de diferentes variáveis circadianas.
Ainda, o complexo Bmal1/Clock promove a transcrição-tradução das proteínas Period (PER) e Crypthocrome (Cry) após ausência do
sinal fótico, que por sua vez se ligam e inibem o complexo Bmal1/clock, finalizando o ciclo circadiano, que será reiniciado após novo
sinal de luz. Imagem adaptada de Nakao, Nakamura e Shibata, 2015 e Durrington et al., 2013)

32
Além da sincronização externa, os diversos ritmos biológicos apresentam sincronização
interna, controlada pela integração entre os relógios biológicos centrais e periféricos (Fig.4)
(52). Por exemplo, estudos- em diferentes espécies- apontam para associação entre os ritmos
da temperatura corporal e da atividade locomotora (65, 68-70). Ainda, evidências apontam para
direta e bidirecional associação entre os ritmos da temperatura corporal e do metabolismo.
Alterações na temperatura corporal podem afetar a velocidade das reações químicas do corpo,
assim como as alterações metabólicas influenciam diretamente na produção de calor, uma vez
que este é subproduto destas reações (71). É importante ressaltar a diferença entre os termos
sincronização e geração, ou seja, existe evidente associação entre os ritmos, no entanto, eles
são gerados e controlados de forma independente (71). Um grupo de pesquisa europeu buscou
entender a interdependência dos ritmos da temperatura central e da atividade locomotora em
humanos, para isto, mantiveram a amostra em repouso constante por 5 semanas (72). Como
resultado da ausência de atividade locomotora os pesquisadores observaram redução da
amplitude do ritmo circadiano da temperatura central, mas não a extinção do mesmo (72). Em
animais, é documentado que mesmo com baixos níveis de atividade locomotora, àqueles de
característica noturna apresentam maior temperatura central durante a noite, sendo que em
animais de hábitos diurnos, este aumento é observado durante o dia (65). Logo, é possível
observar que o ritmo da temperatura central não é produto de outros ritmos biológicos (71).
Dois fatores amplamente abordados neste trabalho tem influência sobre a função
circadiana: a hipertensão e o envelhecimento (63, 73-75). A pressão arterial apresenta ritmo
com pico observado no período matutino e menor valor no período noturno, durante o repouso
(57). Esse padrão é determinado principalmente por variáveis intrínsecas ao organismo como a
atividade do sistema nervoso simpático e fatores hormonais como liberação de cortisol,
catecolaminas e ação do sistema renina-angiotensina-aldosterona. Entretanto, fatores externos
como o estado sono/vigília e a prática de atividade física influenciam no controle homeostático
e circadiano da pressão arterial (57). A hipertensão leva ao rompimento do ritmo da pressão
arterial, caracterizado pela ausência de redução no período de repouso, o que impõe ao
organismo maior exposição ao estresse hemodinâmico de pressão, sendo este danoso para
diversos órgãos, como coração e os rins (73, 76).
O ritmo circadiano também é afetado pelo envelhecimento (63). Existem alterações
clássicas impostas pelo envelhecimento aos ritmos circadianos, por exemplo, a redução da
amplitude diária e a perda de sincronização interna entre os diferentes ritmos, bem como
desassociação externa aos zeitgebers (75, 77). Ainda, alguns trabalhos mostram que o
envelhecimento pode promover modificações no período dos ritmos, ou seja, antecipação ou

33
atraso dos ciclos (78, 79). Em 1922, um grupo demonstrou encurtamento do ritmo circadiano
de ratos idosos (80). Evidências apontam para modificação funcional nas estruturas de controle
circadiano, apontando que estas apresentam menor responsividade ao estímulo fótico e resposta
de oscilação mais ágil e de menor amplitude (81, 82). Pesquisas apontam que esta perda de
função do SQN com o avançar da idade é relacionada a uma deterioração neuronal senescente,
o que representa processo natural de envelhecimento (83).
1.4- Envelhecimento:
O envelhecimento é um processo contínuo e progressivo acompanhado de redução no
funcionamento de sistemas e órgãos (84). Sabe-se que o envelhecimento por si promove
alterações estruturais semelhantes às ocorridas na HA, como hipertrofia concêntrica do
ventrículo esquerdo (85, 86). Ocorre ainda uma degradação natural dos miócitos, acúmulo de
fibrose e hemodinâmica coronariana prejudicada (34, 85). No entanto, em combinação com a
hipertensão, a gravidade destes distúrbios cardiovasculares é acentuada (85). A prevalência da
hipertensão é maior nos idosos, sendo que 52,9% dos indivíduos entre 45 e 64 anos possuem o
diagnóstico da doença, aumentando para 78,2% acima de 65 anos (87).
O envelhecimento é acompanhado de reduzida capacidade de combater danos e
distúrbios, em função da depressão do sistema imunológico, conhecido como imuno-
senescência, levando a manutenção de um estado inflamatório crônico (88). Estudos apontam
Figura 6. Pressão arterial sistólica (PAS) e frequência cardíaca (FC) de ratos normotensos Wistar Kyoto (painel A) e
temperatura corporal de ratos normotensos Long-Evans (painel B) durante quatro dias. Imagem adaptada de Lemmer et al.
(2003) e Reffineti (2003).

34
a presença elevada de marcadores pró-inflamatórios no envelhecimento, como a interleucina-6
e o fator de necrose tumoral (89, 90). O quadro inflamatório contínuo danifica as respostas
antioxidantes, tendo como consequência o estresse oxidativo (91). Em conjunto, a inflamação
e o estresse oxidativo promovem a disfunção endotelial, os radicais livres prejudicam as vias
de sinalização para liberação de óxido nítrico no sistema vascular (92, 93). Este tipo de alteração
promove um desequilíbrio entre as funções de vasoconstrição e vasodilatação, contribuindo
para o aumento da resistência vascular periférica e, consequentemente, para a patogênese e
manutenção da HA no idoso (18, 94).
1.5- Exercício físico:
Assim como a HA, o exercício físico exerce estímulo para hipertrofia cardíaca, no
entanto, esta é classificada como fisiológica (34). O que diferencia o coração hipertenso do
treinado não é o tamanho, mas sim a qualidade funcional do tecido (36). Dessa forma, é
importante ressaltar que a natureza do estímulo é crucial para determinar o tipo de hipertrofia
do miocárdio. O exercício resistido promove sobrecarga de pressão (pós-carga), assim como na
hipertensão (95). No entanto, seu estímulo é intervalado, possibilitando ao tecido períodos de
recuperação, levando à hipertrofia concêntrica fisiológica, caracterizada pelo aumento das
paredes ventriculares com manutenção da cavidade ventricular. Este padrão de hipertrofia
promove adição em paralelo de miofibrilas, sendo que a contratilidade e eficiência miocárdica
são aprimoradas (95). Já no treinamento aeróbico, caracterizado por impor uma pré-carga ou
sobrecarga de volume ao coração, ocorre a adição de sarcômeros em série, caracterizando a
hipertrofia excêntrica fisiológica, o que leva ao aumento da cavidade do ventrículo esquerdo
aliado à melhora da contratilidade e eficiência do miocárdio (95, 96).
Relatos consistentes apontam que a prática regular de exercício físico é inversamente
relacionada ao desenvolvimento da HA (97, 98). Além de atuar como fator de prevenção, o
exercício físico é capaz de reduzir a pressão arterial de hipertensos (96, 99-103). Percebem-se
respostas hipotensivas imediatamente após a prática, sendo que a magnitude destas é
determinada por fatores como o tipo de treinamento, bem como a intensidade e volume
aplicados. Sabe-se ainda que estas respostas persistem por aproximadamente 24 horas (104-
106). Estudo prévio aponta que uma sessão de exercício aeróbico de baixa intensidade foi capaz
de reduzir a pressão arterial sistólica, diastólica e média de idosos (104). Um segundo trabalho
apontou que sessões de 10 e 30 min de exercício aeróbico de moderada intensidade foi capaz
de reduzir a pressão arterial sistólica e diastólica em aproximadamente 10 mmHg em homens
adultos (107). A literatura aponta que o mecanismo responsável pela hipotensão pós-exercício

35
está ligada a alterações hemodinâmicas promovidas pela prática, entre as quais destacam-se a
diminuição da resistência vascular periférica, do volume diastólico final, do volume de ejeção
e consequentemente do débito cardíaco (104, 105, 108).
Assim como o treinamento aeróbico, o exercício resistido também promove redução da
pressão arterial (109-111). Evitava-se recomendar a prática de exercício resistido para
indivíduos hipertensos, pois acreditava-se que havia risco de grande elevação da pressão arterial
em função de ocorrer a manobra de Valsalva, caracterizada por um esforço expiratório
prolongado após o fechamento da glote, induzindo aumento da resistência vascular periférica e
consequentemente da pressão arterial (112). No entanto, uma série de estudos vem apontando
que apesar do aumento momentâneo da pressão arterial provocado pela prática do exercício
resistido, após a série, a pressão rapidamente retorna para os valores basais e quando encerrada
a sessão de treinamento é observada a hipotensão pós exercício. Estudo prévio encontrou que
o treinamento resistido de baixa intensidade levou a redução da pressão arterial de forma aguda,
sendo que tal resposta perdurou por aproximadamente 10 horas (109). A literatura aponta ainda
que o exercício resistido de moderada e alta intensidade também promovem redução da pressão
arterial (110, 111).
O somatório de sessões agudas de exercício físico leva aos efeitos crônicos do
treinamento sobre o organismo do indivíduo hipertenso. O resultado de um programa de
treinamento sobre a pressão arterial de indivíduos hipertensos é semelhante àqueles observados
após uma única sessão de exercício físico (106, 113). Relatos indicam que o treinamento
promove reduções mais pronunciadas em indivíduos que apresentam valores maiores de
pressão e que a intensidade do treinamento é um fator chave a ser modulado, uma vez que
treinamentos mais intensos resultam em maiores reduções da pressão (105, 108).
Além do controle da pressão arterial, o treinamento físico promove benefícios para
outros fatores do sistema cardiovascular, como melhora da perfusão miocárdica e periférica,
redução do enrijecimento arterial e melhora da função autonômica e endotelial (114). Dessa
forma, a prática regular de exercícios físicos funciona como uma estratégia não farmacológica
muito importante no combate a HA, bem como a outros distúrbios cardiovasculares, estando
presente em todas as orientações de combate à doença (114).
A prática do exercício físico leva a um rompimento momentâneo da homeostase
orgânica, indicando uma série de ajustes necessários para manutenção das funções vitais em
paralelo a manutenção da atividade realizada (70). Do ponto de vista termorregulatório, é
observado um desequilíbrio inicial nas taxas de produção e perda de calor, induzido pela maior

36
produção de calor dos músculos em atividade e do metabolismo em trabalho aumentado, o que
provoca acúmulo de calor corporal (68).
Após as modificações termorregulatórias impostas pelo exercício físico, são iniciados
ajustes com objetivo de alcançar um estado de equilíbrio térmico. Para isto, mecanismos de
dissipação de calor são ativados, como a vasodilatação- que provoca redirecionamento de fluxo
sanguíneo central para periferia- e a sudorese, que por sua vez, possibilita a perda de calor para
o ambiente por meio da evaporação do suor (69). No entanto, os roedores apresentam processo
de sudorese nulo, sendo que em situação de exercício a vasodilatação da cauda será o principal
mecanismo para dissipação de calor (120).
A resposta termorregulatória será dependente do tipo de estímulo aplicado pelo
exercício físico, sendo que protocolos progressivos impõem estímulos intercalados em espaços
curtos de tempo, impossibilitando a obtenção de um estado estável das variáveis fisiológicas
durante a prática. Em contraponto, protocolos com intensidade fixa estabelecem um desafio
inicial, no entanto, permite que o organismo se reajuste e estabeleça um estado estável até o fim
da prática (115). Esta segunda proposta indica a presença de duas fases distintas de controle
termorregulatório durante o exercício físico: as fases dinâmica e estável. A fase dinâmica é
caracterizada pelo aumento acentuado da atividade metabólica com objetivo de manutenção do
suprimento energético, o que eleva o acúmulo de calor. Além disso, é observado um processo
de vasoconstrição com objetivo de redirecionamento de fluxo para musculatura em atividade.
A fase dinâmica acontece nos momentos iniciais do exercício físico, com poucos minutos de
duração. Na sequência, o acúmulo de calor leva ao atingimento do limiar térmico para
vasodilatação, o que promove redirecionamento do fluxo sanguíneo para periferia com objetivo
de dissipar calor e consequentemente promover a instalação de um estado estável do ponto de
vista termorregulatório durante a prática do exercício.
1.6- O paradigma experimental:
A ciência representa um conjunto de conhecimentos a serem estudados, testados,
discutidos, replicados e divulgados. Deve ser objetiva, produzindo informações testadas e
comprovadas a partir de métodos experimentais rigorosamente planejados e executados. Trata-
se de um percurso inacabado, pois a partir do conhecimento já estabelecido novas teorias se
formam almejando a evolução e o acréscimo de informação (143).
Objetivando promover o avanço científico, animais comumente são utilizados como
modelos experimentais em todos os campos da pesquisa (144). Para isto, normas metodológicas
e éticas foram estabelecidas a fim de conservar a qualidade científica, bem como o bem estar

37
das espécies utilizadas (145). Desta forma, tais modelos precisam atuar como uma
representação real do fenômeno a ser estudado. Assim, a seleção do modelo experimental
representa passo de extrema importância no planejamento cientifico, uma vez que o uso do
modelo adequado aos objetivos do estudo é crucial para obtenção de resultados confiáveis
(145).
Para o estudo da HA essencial o Rato Espontaneamente Hipertenso (Spontaneously
Hypertensive Rat- SHR) representa um modelo amplamente utilizado. No século passado,
existia grande necessidade de criação de um modelo experimental que permitisse o estudo da
HA primária ou essencial, portanto, a partir da década de 1950 vários grupos direcionaram seus
esforços para este tópico (23, 146, 147). Em 1954, Alexander e col. desenvolveram uma
linhagem de coelhos hipertensos, em que até 86% dos machos e 53% das fêmeas manifestaram
a doença (147). Em 1958 em Otago, Smirk e Hall desenvolveram uma linhagem de ratos
hipertensos a partir do acasalamento entre irmãos, no entanto, apenas 30% dos animais
desenvolveram a doença (146). Em 1962, o mesmo grupo relatou que 50% manifestaram a HA,
sendo que a média da pressão arterial sistólica obtida foi 147,2 mmHg (148). É importante
ressaltar que para roedores a HA é classificada como pressão arterial sistólica (PAS) sustentada
acima de 150 mmHg (23, 148-150).
Em 1963 Okamoto e Aoki desenvolveram os SHR a partir dos Wistar Kyoto (WKY),
ratos normotensos provenientes de Kyoto, no Japão (23). Os pesquisadores realizaram uma
triagem entre os WKY, selecionando aqueles que apresentaram pressão arterial elevada
sustentada por aproximadamente um mês, os submetendo ao acasalamento consanguíneo por
diversas gerações, até que a partir da 6ª geração todos os descendentes (100%) apresentaram o
desenvolvimento da HA (PAS > 150 mmHg) (23, 151). A partir desse momento, os SHR
estabeleceram-se como o modelo correspondente ao estudo da HA essencial, utilizando os
WKY como controles normotensos (152). Contudo, uma série de pesquisas apontaram
limitações no uso dos WKY como controle dos SHR, indicando que estes podem apresentar
características inerentes a doença, como elevada PAS, hiperatividade simpática e hipertrofia
concêntrica patológica do ventrículo esquerdo (151, 153-156). Desta maneira, os WIS surgiram
como uma alternativa de controle para os SHR, uma vez que não apresentam tais características.
No entanto, este representa um tópico de amplo debate na literatura.
Todo trabalho experimental exige a presença de um grupo controle, possibilitando a
adequada interpretação dos resultados (145, 152). Dessa forma, a seleção do grupo controle
representa etapa tão importante quanto a seleção do grupo experimental. Assim, diferentes
grupos de pesquisa vêm ao longo do tempo demonstrando preocupação em relação a linhagem

38
experimental a ser utilizada como controle do SHR, dessa forma, múltiplos estudos realizaram
a comparação de variáveis distintas entre SHR, WIS e WKY a fim de fornecer aos diferentes
grupos de pesquisa informações no momento da seleção das linhagens (157-169). Ainda assim,
este é um tópico que segue gerando debate e divergências na literatura atual, o que gera
necessidade de pesquisas direcionadas para melhor elucidar a questão e, consequentemente,
fornecer maior segurança aos pesquisadores no momento de planejamento e execução dos
estudos.
2- Objetivos:
2.1- Geral:
Avaliar os efeitos da hipertensão e do envelhecimento sobre a termorregulação basal e
durante o exercício físico de Ratos Espontaneamente Hipertensos e seus principais controles
experimentais, Wistar e Wistar Kyoto.
2.2- Específicos:
Caracterizar e comparar o crescimento físico.
Caracterizar e comparar a pressão arterial.
Caracterizar e comparar a função e morfologia do tecido cardíaco.
Caracterizar e comparar o ritmo circadiano da Tcentral.
Caracterizar e comparar o desempenho físico e as respostas termorregulatórias durante
o exercício agudo em esteira.
Caracterizar e comparar os efeitos do processo de envelhecimento.
Realizar análise comparativa entre as linhagens utilizadas como controle do SHR.
Realizar ampla caracterização das linhagens estudadas objetivando oferecer ferramentas
para seleção dos modelos experimentais em pesquisas futuras.
3- Referências:
1. Blacher J, Levy BI, Mourad JJ, Safar ME, Bakris G. From epidemiological transition to modern cardiovascular epidemiology: hypertension in the 21st century. Lancet. 2016 Jul 30;388(10043):530-2.

39
2. Omran AR. The epidemiologic transition. A theory of the epidemiology of population change. Milbank Mem Fund Q. 1971 Oct;49(4):509-38. 3. Smallman-Raynor M, Phillips D. Late stages of epidemiological transition: health status in the developed world. Health Place. 1999 Sep;5(3):209-22. 4. Carolina Martinez S, Gustavo Leal F. Epidemiological transition: model or illusion? A look at the problem of health in Mexico. Soc Sci Med. 2003 Aug;57(3):539-50. 5. Mensah GA, Roth GA, Sampson UK, Moran AE, Feigin VL, Forouzanfar MH, et al. Mortality from cardiovascular diseases in sub-Saharan Africa, 1990-2013: a systematic analysis of data from the Global Burden of Disease Study 2013. Cardiovasc J Afr. 2015 Mar-Apr;26(2 Suppl 1):S6-10. 6. Townsend N, Nichols M, Scarborough P, Rayner M. Cardiovascular disease in Europe--epidemiological update 2015. Eur Heart J. 2015 Oct 21;36(40):2696-705. 7. Chen WW, Gao RL, Liu LS, Zhu ML, Wang W, Wang YJ, et al. China cardiovascular diseases report 2015: a summary. J Geriatr Cardiol. 2017 Jan;14(1):1-10. 8. Sidney S, Quesenberry CP, Jr., Jaffe MG, Sorel M, Nguyen-Huynh MN, Kushi LH, et al. Recent Trends in Cardiovascular Mortality in the United States and Public Health Goals. JAMA Cardiol. 2016 Aug 1;1(5):594-9. 9. Roth GA, Huffman MD, Moran AE, Feigin V, Mensah GA, Naghavi M, et al. Global and regional patterns in cardiovascular mortality from 1990 to 2013. Circulation. 2015 Oct 27;132(17):1667-78. 10. Global, regional, and national age-sex specific all-cause and cause-specific mortality for 240 causes of death, 1990-2013: a systematic analysis for the Global Burden of Disease Study 2013. Lancet. 2015 Jan 10;385(9963):117-71. 11. Sarki AM, Nduka CU, Stranges S, Kandala NB, Uthman OA. Prevalence of Hypertension in Low- and Middle-Income Countries: A Systematic Review and Meta-Analysis. Medicine (Baltimore). 2015 Dec;94(50):e1959. 12. Andrade SSA, Stopa SR, Brito AS, Chueri PS, Szwarcwald CL, Malta DC. Prevalência de hipertensão arterial autorreferida na população brasileira: análise da Pesquisa Nacional de Saúde, 2013. Epidemiologia e Serviços de Saúde. 2015;24(2):297-304. 13. Picon RV, Fuchs FD, Moreira LB, Riegel G, Fuchs SC. Trends in prevalence of hypertension in Brazil: a systematic review with meta-analysis. Plos One. 2012;7(10):e48255. 14. Guimaraes AC. Hypertension in Brazil. J Hum Hypertens. 2002 Mar;16 Suppl 1:S7-S10. 15. Olmos RD, Lotufo PA. Epidemiologia da hipertensão arterial no Brasil e no mundo. . Revista Brasileira de Hipertensão. 2002;9:21-3. 16. Neder MM, Borges AAN. Hipertensão arterial sistêmica no Brasil: o que avançamos no conhecimento de sua epidemiologia? Revista Brasileira de Hipertensão. 2006;13(2):126-33. 17. Carey RM, Whelton PK. Prevention, Detection, Evaluation, and Management of High Blood Pressure in Adults: Synopsis of the 2017 American College of Cardiology/American Heart Association Hypertension Guideline. Ann Intern Med. 2018 Mar 6;168(5):351-8. 18. Norlander AE, Madhur MS, Harrison DG. The immunology of hypertension. J Exp Med. 2018 Jan 2;215(1):21-33. 19. Cifu AS, Davis AM. Prevention, Detection, Evaluation, and Management of High Blood Pressure in Adults. JAMA. 2017 Dec 5;318(21):2132-4. 20. Mulvany MJ. Small artery remodeling and significance in the development of hypertension. News Physiol Sci. 2002 Jun;17:105-9. 21. Beevers G, Lip GY, O'Brien E. ABC of hypertension: The pathophysiology of hypertension. BMJ. 2001 Apr 14;322(7291):912-6. 22. Sharman JE, Stowasser M. Australian association for exercise and sports science position statement on exercise and hypertension. J Sci Med Sport. 2009 Mar;12(2):252-7. 23. Okamoto K, Aoki K. Development of a strain of spontaneously hypertensive rats. Jpn Circ J. 1963 Mar;27:282-93. 24. Kaiser SE. Contribuição do estudo da microcirculação à fisiopatologia da hipertensão arterial. Brazilian Journal of Health and Biomedical sciences. 2011;10(3):31-8.

40
25. Renna NF, de Las Heras N, Miatello RM. Pathophysiology of vascular remodeling in hypertension. Int J Hypertens. 2013;2013:808353. 26. Sarzani R, Brecher P, Chobanian AV. Growth factor expression in aorta of normotensive and hypertensive rats. J Clin Invest. 1989 Apr;83(4):1404-8. 27. Iwatsuki K, Cardinale GJ, Spector S, Udenfriend S. Hypertension: increase of collagen biosynthesis in arteries but not in veins. Science. 1977 Oct 28;198(4315):403-5. 28. Sonoyama K, Greenstein A, Price A, Khavandi K, Heagerty T. Vascular remodeling: implications for small artery function and target organ damage. Therapeutic Advances in Cardiovascular Disease. 2007;1(2):129-37. 29. Osol G, Osol R, Halpern W. Pre-existing level of tone is an important determinant of cerebral artery autoregulatory responsiveness. Jorunal of hypertension. 1989;7:S67-S9. 30. Izzard AS, Graham D, Burnham MP, Heerkens EH, Dominiczak AF, Heagerty AM. Myogenic and structural properties of cerebral arteries from the stroke-prone spontaneously hypertensive rat. Am J Physiol Heart Circ Physiol. 2003 Oct;285(4):H1489-94. 31. Heerkens EHJ, Izzard AS, Heagerty AM. Integrins, Vascular Remodeling, and Hypertension. Hypertension. 2007;49:1-4. 32. Pawlush DG, Moore RL, Musch TI, Davidson WR, Jr. Echocardiographic evaluation of size, function, and mass of normal and hypertrophied rat ventricles. J Appl Physiol (1985). 1993 May;74(5):2598-605. 33. Matsubara LS, Narikawa S, Ferreira AL, Paiva SA, Zornoff LM, Matsubara BB. [Myocardial remodeling in chronic pressure or volume overload in the rat heart]. Arq Bras Cardiol. 2006 Feb;86(2):126-30. 34. Richey PA, Brown SP. Pathological versus physiological left ventricular hypertrophy: a review. J Sports Sci. 1998 Feb;16(2):129-41. 35. Janicki JS. Myocardial collagen remodeling and left ventricular diastolic function. Braz J Med Biol Res. 1992;25(10):975-82. 36. Weber KT, Brilla CG. Pathological hypertrophy and cardiac interstitium. Fibrosis and renin-angiotensin-aldosterone system. Circulation. 1991 Jun;83(6):1849-65. 37. Rossi MA. Pathologic fibrosis and connective tissue matrix in left ventricular hypertrophy due to chronic arterial hypertension in humans. J Hypertens. 1998 Jul;16(7):1031-41. 38. Querejeta R, Varo N, López B, Larman M, Artiñano E, Etayo JC, et al. Serum carboxy-terminal propeptide of procollagen type I is a marker of myocardial fibrosis in hypertensive heart disease. Circulation. 2000;11(10):1729-35. 39. González A, Lopez B, Díez J. Myocardial fibrosis in arterial hypertension. European Heart Journal Supplements. 2002:18-22. 40. Bishop JE, Lindahl G. Regulation of cardiovascular collagen synthesis by mechanical load. Cardiovasc Res. 1999 Apr;42(1):27-44. 41. Mill JG, Vassallo DV. Hipertrofia cardíaca. Revista Brasileira de Hipertensão. 2001;8:63-75. 42. Ohsato K, Shimizu M, Sugihara N, Konishi K, Takeda R. Histopathological factors related to diastolic function in myocardial hypertrophy. Jpn Circ J. 1992 Apr;56(4):325-33. 43. Adams MA, Bobik A, Korner PI. Differential development of vascular and cardiac hypertrophy in genetic hypertension. Relation to sympathetic function. Hypertension. 1989 Aug;14(2):191-202. 44. Grossman W. Cardiac hypertrophy: useful adaptation or pathologic process? Am J Med. 1980 Oct;69(4):576-84. 45. Bristow MR. Mechanisms of development of heart failure in the hypertensive patient. Cardiology. 1999;92 Suppl 1:3-6; discussion 7-9, 20-1. 46. Díez J, Fortuño MA, Ravassa S. Apoptosis in hypertensive heart disease. Hypertension. 1998;13:317-25. 47. Regula KM, Kirshenbaum LA. Apoptosis of ventricular myocytes: a means to an end. J Mol Cell Cardiol. 2005 Jan;38(1):3-13. 48. Gonzalez A, Ravassa S, Lopez B, Loperena I, Querejeta R, Diez J. Apoptosis in hypertensive heart disease: a clinical approach. Curr Opin Cardiol. 2006 Jul;21(4):288-94.

41
49. Freedman MS, Lucas RJ, Soni B, von Schantz M, Munoz M, David-Gray Z, et al. Regulation of mammalian circadian behavior by non-rod, non-cone, ocular photoreceptors. Science. 1999 Apr 16;284(5413):502-4. 50. Weinert D. Circadian temperature variation and ageing. Ageing Res Rev. 2010 Jan;9(1):51-60. 51. Nakao A, Nakamura Y, Shibata S. The circadian clock functions as a potent regulator of allergic reaction. Allergy. 2015 May;70(5):467-73. 52. Dibner C, Schibler U, Albrecht U. The mammalian circadian timing system: organization and coordination of central and peripheral clocks. Annu Rev Physiol. 2010;72:517-49. 53. Balsalobre A. Clock genes in mammalian peripheral tissues. Cell Tissue Res. 2002 Jul;309(1):193-9. 54. Ukai H, Ueda HR. Systems biology of mammalian circadian clocks. Annu Rev Physiol. 2010;72:579-603. 55. Smale L, Lee T, Nunez AA. Mammalian diurnality: some facts and gaps. J Biol Rhythms. 2003 Oct;18(5):356-66. 56. Dardente H, Klosen P, Caldelas I, Pevet P, Masson-Pevet M. Phenotype of Per1- and Per2-expressing neurons in the suprachiasmatic nucleus of a diurnal rodent (Arvicanthis ansorgei): comparison with a nocturnal species, the rat. Cell Tissue Res. 2002 Oct;310(1):85-92. 57. Takeda N, Maemura K. Circadian clock and cardiovascular disease. J Cardiol. 2011 May;57(3):249-56. 58. Refinetti R, Menaker M. The circadian rhythm of body temperature. Physiol Behav. 1992 Mar;51(3):613-37. 59. Vosko AM, Hagenauer MH, Hummer DL, Lee TM. Period gene expression in the diurnal degu (Octodon degus) differs from the nocturnal laboratory rat (Rattus norvegicus). Am J Physiol Regul Integr Comp Physiol. 2009 Feb;296(2):R353-61. 60. Schwartz WJ, Reppert SM, Eagan SM, Moore-Ede MC. In vivo metabolic activity of the suprachiasmatic nuclei: a comparative study. Brain Res. 1983 Sep 5;274(1):184-7. 61. Garidou ML, Gauer F, Vivien-Roels B, Sicard B, Pevet P, Simonneaux V. Pineal arylalkylamine N-acetyltransferase gene expression is highly stimulated at night in the diurnal rodent, Arvicanthis ansorgei. Eur J Neurosci. 2002 May;15(10):1632-40. 62. Johnson CH, Elliott JA, Foster R. Entrainment of circadian programs. Chronobiol Int. 2003 Sep;20(5):741-74. 63. Refinetti R. The circadian rhythm of body temperature. Front Biosci (Landmark Ed). 2010 Jan 1;15:564-94. 64. Mendoza J. Circadian clocks: setting time by food. J Neuroendocrinol. 2007 Feb;19(2):127-37. 65. Refinetti R. Relationship between the daily rhythms of locomotor activity and body temperature in eight mammalian species. Am J Physiol. 1999 Nov;277(5):R1493-500. 66. van Jaarsveld B, Bennett NC, Hart DW, Oosthuizen MK. Locomotor activity and body temperature rhythms in the Mahali mole-rat (C. h. mahali): The effect of light and ambient temperature variations. J Therm Biol. 2019 Jan;79:24-32. 67. Honma KI, Hiroshige T. Internal synchronization among several circadian rhythms in rats under constant light. Am J Physiol. 1978 Nov;235(5):R243-9. 68. Saltin B, Gagge AP, Stolwijk JA. Body temperatures and sweating during thermal transients caused by exercise. J Appl Physiol. 1970 Mar;28(3):318-27. 69. Webb P. Daily activity and body temperature. Eur J Appl Physiol Occup Physiol. 1993;66(2):174-7. 70. Arnold J, LeBlanc J, Cote J, Lalonde J, Richard D. Exercise suppression of thermoregulatory thermogenesis in warm- and cold-acclimated rats. Can J Physiol Pharmacol. 1986 Jul;64(7):922-6. 71. Refinetti R. Circadian rhythmicity of body temperature and metabolism. Temperature. 2020. 72. Golja P, Eiken O, Rodman S, Sirok B, Mekjavic IB. Core temperature circdian rhythm during 35 days of horizontal bed rest. J Gravit Physiol. 2002 Jul;9(1):P187-8. 73. Uzu T, Kimura G. Diuretics shift circadian rhythm of blood pressure from nondipper to dipper in essential hypertension. Circulation. 1999 Oct 12;100(15):1635-8.

42
74. Pickering TG. The clinical significance of diurnal blood pressure variations. Dippers and nondippers. Circulation. 1990 Feb;81(2):700-2. 75. Hofman MA. The human circadian clock and aging. Chronobiol Int. 2000 May;17(3):245-59. 76. Uzu T, Kazembe FS, Ishikawa K, Nakamura S, Inenaga T, Kimura G. High sodium sensitivity implicates nocturnal hypertension in essential hypertension. Hypertension. 1996 Jul;28(1):139-42. 77. Mistlberger RE, Houpt TA, Moore-Ede MC. Effects of aging on food-entrained circadian rhythms in the rat. Neurobiol Aging. 1990 Nov-Dec;11(6):619-24. 78. Li H, Satinoff E. Changes in circadian rhythms of body temperature and sleep in old rats. Am J Physiol. 1995 Jul;269(1 Pt 2):R208-14. 79. Weinert D, Waterhouse J. Daily activity and body temperature rhythms do not change simultaneously with age in laboratory mice. Physiol Behav. 1999 Jun;66(4):605-12. 80. Witting W, Mirmiran M, Bos NP, Swaab DF. The effect of old age on the free-running period of circadian rhythms in rat. Chronobiol Int. 1994 Apr;11(2):103-12. 81. Satinoff E, Li H, Tcheng TK, Liu C, McArthur AJ, Medanic M, et al. Do the suprachiasmatic nuclei oscillate in old rats as they do in young ones? Am J Physiol. 1993 Nov;265(5 Pt 2):R1216-22. 82. Sutin EL, Dement WC, Heller HC, Kilduff TS. Light-induced gene expression in the suprachiasmatic nucleus of young and aging rats. Neurobiol Aging. 1993 Sep-Oct;14(5):441-6. 83. Hofman MA, Swaab DF. Influence of aging on the seasonal rhythm of the vasopressin-expressing neurons in the human suprachiasmatic nucleus. Neurobiol Aging. 1995 Nov-Dec;16(6):965-71. 84. Franceschi C, Motta L, Motta M, Malaguarnera M, Capri M, Vasto S, et al. The extreme longevity: the state of the art in Italy. Exp Gerontol. 2008 Feb;43(2):45-52. 85. Susic D, Nunez E, Hosoya K, Frohlich ED. Coronary hemodynamics in aging spontaneously hypertensive and normotensive Wistar-Kyoto rats. J Hypertens. 1998 Feb;16(2):231-7. 86. Olivetti G, Melissari M, Capasso JM, Anversa P. Cardiomyopathy of the aging human heart. Myocyte loss and reactive cellular hypertrophy. Circ Res. 1991 Jun;68(6):1560-8. 87. Benjamin EJ, Muntner P, Alonso A, Bittencourt MS, Callaway CW, Carson AP, et al. Heart Disease and Stroke Statistics-2019 Update: A Report From the American Heart Association. Circulation. 2019 Mar 5;139(10):e56-e528. 88. Chung HY, Cesari M, Anton S, Marzetti E, Giovannini S, Seo AY, et al. Molecular inflammation: underpinnings of aging and age-related diseases. Ageing Res Rev. 2009 Jan;8(1):18-30. 89. Singh T, Newman AB. Inflammatory markers in population studies of aging. Ageing Res Rev. 2011 Jul;10(3):319-29. 90. Ershler WB, Sun WH, Binkley N, Gravenstein S, Volk MJ, Kamoske G, et al. Interleukin-6 and aging: blood levels and mononuclear cell production increase with advancing age and in vitro production is modifiable by dietary restriction. Lymphokine Cytokine Res. 1993 Aug;12(4):225-30. 91. Pinzani P, Petruzzi E, Orlando C, Stefanescu A, Antonini MF, Serio M, et al. Reduced serum antioxidant capacity in healthy centenarians. Clin Chem. 1997 May;43(5):855-6. 92. Rubio-Ruiz ME, Perez-Torres I, Soto ME, Pastelin G, Guarner-Lans V. Aging in blood vessels. Medicinal agents FOR systemic arterial hypertension in the elderly. Ageing Res Rev. 2014 Nov;18:132-47. 93. Park S, Lakatta EG. Role of inflammation in the pathogenesis of arterial stiffness. Yonsei Med J. 2012 Mar;53(2):258-61. 94. Chrissobolis S, Miller AA, Drummond GR, Kemp-Harper BK, Sobey CG. Oxidative stress and endothelial dysfunction in cerebrovascular disease. Front Biosci (Landmark Ed). 2011 Jan 1;16:1733-45. 95. Fernandes T, Soci UP, Oliveira EM. Eccentric and concentric cardiac hypertrophy induced by exercise training: microRNAs and molecular determinants. Braz J Med Biol Res. 2011 Sep;44(9):836-47. 96. Tanaka H, Bassett DR, Jr., Howley ET, Thompson DL, Ashraf M, Rawson FL. Swimming training lowers the resting blood pressure in individuals with hypertension. J Hypertens. 1997 Jun;15(6):651-7.

43
97. Barlow CE, LaMonte MJ, Fitzgerald SJ, Kampert JB, Perrin JL, Blair SN. Cardiorespiratory fitness is an independent predictor of hypertension incidence among initially normotensive healthy women. Am J Epidemiol. 2006 Jan 15;163(2):142-50. 98. Banda JA, Clouston K, Sui X, Hooker SP, Lee CD, Blair SN. Protective health factors and incident hypertension in men. Am J Hypertens. 2010 Jun;23(6):599-605. 99. Hagberg JM, Montain SJ, Martin WH, 3rd, Ehsani AA. Effect of exercise training in 60- to 69-year-old persons with essential hypertension. Am J Cardiol. 1989 Aug 1;64(5):348-53. 100. Suter E, Marti B, Tschopp A, Wanner HU, Wenk C, Gutzwiller F. Effects of self-monitored jogging on physical fitness, blood pressure and serum lipids: a controlled study in sedentary middle-aged men. Int J Sports Med. 1990 Dec;11(6):425-32. 101. Blumenthal JA, Sherwood A, Gullette EC, Babyak M, Waugh R, Georgiades A, et al. Exercise and weight loss reduce blood pressure in men and women with mild hypertension: effects on cardiovascular, metabolic, and hemodynamic functioning. Arch Intern Med. 2000 Jul 10;160(13):1947-58. 102. Staffileno BA, Braun LT, Rosenson RS. The accumulative effects of physical activity in hypertensive post-menopausal women. J Cardiovasc Risk. 2001 Oct;8(5):283-90. 103. Miyai N, Arita M, Miyashita K, Morioka I, Shiraishi T, Nishio I, et al. Antihypertensive effects of aerobic exercise in middle-aged normotensive men with exaggerated blood pressure response to exercise. Hypertens Res. 2002 Jul;25(4):507-14. 104. Brandao Rondon MU, Alves MJ, Braga AM, Teixeira OT, Barretto AC, Krieger EM, et al. Postexercise blood pressure reduction in elderly hypertensive patients. J Am Coll Cardiol. 2002 Feb 20;39(4):676-82. 105. Overton JM, Joyner MJ, Tipton CM. Reductions in blood pressure after acute exercise by hypertensive rats. J Appl Physiol (1985). 1988 Feb;64(2):748-52. 106. Cornelissen VA, Fagard RH. Effects of endurance training on blood pressure, blood pressure-regulating mechanisms, and cardiovascular risk factors. Hypertension. 2005 Oct;46(4):667-75. 107. MacDonald JR, MacDougall JD, Hogben CD. The effects of exercise duration on post-exercise hypotension. J Hum Hypertens. 2000 Feb;14(2):125-9. 108. Carpio-Rivera E, Moncada-Jimenez J, Salazar-Rojas W, Solera-Herrera A. Acute Effects of Exercise on Blood Pressure: A Meta-Analytic Investigation. Arq Bras Cardiol. 2016 May;106(5):422-33. 109. Melo CM, Alencar Filho AC, Tinucci T, Mion D, Jr., Forjaz CL. Postexercise hypotension induced by low-intensity resistance exercise in hypertensive women receiving captopril. Blood Press Monit. 2006 Aug;11(4):183-9. 110. Brito Ade F, de Oliveira CV, Santos Mdo S, Santos Ada C. High-intensity exercise promotes postexercise hypotension greater than moderate intensity in elderly hypertensive individuals. Clin Physiol Funct Imaging. 2014 Mar;34(2):126-32. 111. Moraes MR, Bacurau RF, Simoes HG, Campbell CS, Pudo MA, Wasinski F, et al. Effect of 12 weeks of resistance exercise on post-exercise hypotension in stage 1 hypertensive individuals. J Hum Hypertens. 2012 Sep;26(9):533-9. 112. Porth CJ, Bamrah VS, Tristani FE, Smith JJ. The Valsalva maneuver: mechanisms and clinical implications. Heart Lung. 1984 Sep;13(5):507-18. 113. Kelley GA, Sharpe Kelley K. Aerobic exercise and resting blood pressure in older adults: a meta-analytic review of randomized controlled trials. J Gerontol A Biol Sci Med Sci. 2001 May;56(5):M298-303. 114. Fiuza-Luces C, Garatachea N, Berger NA, Lucia A. Exercise is the real polypill. Physiology (Bethesda). 2013 Sep;28(5):330-58. 115. Gordon CJ. Temperature regulation in laboratory rodents.: United Kingdom; 1993. 116. Blatteis CM. Physiology and pathophysiology of temperature regulation. World Scientific Publishing.1998. 117. Ivanov KP. The development of the concepts of homeothermy and thermoregulation. Journal of Thermal Biology. 2006;31:24-9.

44
118. Romanovsky AA. Thermoregulation: some concepts have changed. Functional architecture of the thermoregulatory system. Am J Physiol Regul Integr Comp Physiol. 2007 Jan;292(1):R37-46. 119. Terrien J, Perret M, Aujard F. Behavioral thermoregulation in mammals: a review. Front Biosci (Landmark Ed). 2011 Jan 1;16:1428-44. 120. Morrison SF, Nakamura K. Central neural pathways for thermoregulation. Front Biosci (Landmark Ed). 2011 Jan 1;16:74-104. 121. Romanovsky AA, Ivanov AI, Shimansky YP. Molecular biology of thermoregulation - Selected contribution: Ambient temperature for experiments in rats: a new method for determining the zone of thermal neutrality. Journal of Applied Physiology. 2002 Jun;92(6):2667-79. 122. Nakamura K. Central circuitries for body temperature regulation and fever. Am J Physiol Regul Integr Comp Physiol. 2011 Nov;301(5):R1207-28. 123. Tansey EA, Johnson CD. Recent advances in thermoregulation. Adv Physiol Educ. 2015 Sep;39(3):139-48. 124. Morrison SF. Central neural control of thermoregulation and brown adipose tissue. Auton Neurosci. 2016 Apr;196:14-24. 125. Boulant JA. Neuronal basis of Hammel's model for set-point thermoregulation. J Appl Physiol (1985). 2006 Apr;100(4):1347-54. 126. Boulant JA, Dean JB. Temperature receptors in the central nervous system. Annu Rev Physiol. 1986;48:639-54. 127. Benarroch EE. Thermoregulation: recent concepts and remaining questions. Neurology. 2007 Sep 18;69(12):1293-7. 128. Takashima Y, Daniels RL, Knowlton W, Teng J, Liman ER, McKemy DD. Diversity in the neural circuitry of cold sensing revealed by genetic axonal labeling of transient receptor potential melastatin 8 neurons. J Neurosci. 2007 Dec 19;27(51):14147-57. 129. Campero M, Baumann TK, Bostock H, Ochoa JL. Human cutaneous C fibres activated by cooling, heating and menthol. J Physiol. 2009 Dec 1;587(Pt 23):5633-52. 130. Duclaux R, Kenshalo DR, Sr. Response characteristics of cutaneous warm receptors in the monkey. J Neurophysiol. 1980 Jan;43(1):1-15. 131. Hensel H, Iggo A. Analysis of cutaneous warm and cold fibres in primates. Pflugers Arch. 1971;329(1):1-8. 132. Madden CJ, Morrison SF. Central nervous system circuits that control body temperature. Neurosci Lett. 2019 Mar 23;696:225-32. 133. Morris NB, Filingeri D, Halaki M, Jay O. Evidence of viscerally-mediated cold-defence thermoeffector responses in man. J Physiol. 2017 Feb 15;595(4):1201-12. 134. Chen XM, Hosono T, Yoda T, Fukuda U, Kanosue K. Efferent projection from the preoptic area for the control of non-shivering thermogenesis in rats. J Physiol-London. 1998 Nov 1;512(3):883-92. 135. Conceicao EPS, Madden CJ, Morrison SF. Neurons in the rat ventral lateral preoptic area are essential for the warm-evoked inhibition of brown adipose tissue and shivering thermogenesis. Acta Physiol (Oxf). 2019 Apr;225(4):e13213. 136. Nakamura K, Morrison SF. Preoptic mechanism for cold-defensive responses to skin cooling. J Physiol. 2008 May 15;586(10):2611-20. 137. Tanaka M, Nagashima K, McAllen RM, Kanosue K. Role of the medullary raphe in thermoregulatory vasomotor control in rats. J Physiol. 2002 Apr 15;540(Pt 2):657-64. 138. Tanaka M, McKinley MJ, McAllen RM. Roles of two preoptic cell groups in tonic and febrile control of rat tail sympathetic fibers. Am J Physiol Regul Integr Comp Physiol. 2009 Apr;296(4):R1248-57. 139. Refinetti R. Homeostasis and circadian rhythmicity in the control of body temperature. Ann N Y Acad Sci. 1997 Mar 15;813:63-70. 140. Myers BL, Badia P. Changes in circadian rhythms and sleep quality with aging: mechanisms and interventions. Neurosci Biobehav Rev. 1995 Winter;19(4):553-71. 141. Gonzalez-Alonso J. Human thermoregulation and the cardiovascular system. Experimental Physiology. 2012 Mar;97(3):340-6.

45
142. O'Leary DS, Wang G. Impaired thermoregulatory cutaneous vasodilation in spontaneously hypertensive rats. J Appl Physiol (1985). 1994 Aug;77(2):692-6. 143. Borko H. Information Science: What Is It? American Documentation. 1968:3-5. 144. Ferreira LM, Hochman B, Barbosa MVJ. Modelos experimentais em pesquisa. Acta Cirúrgica Brasileira. 2005;20(2):28-34. 145. Fagundes DJ, Taha MO. Modelo animal de doença: critérios de escolha e espécies de animais de uso corrente. Acta Cirúrgica Brasileira. 2004;19(1):59-65. 146. Smirk FH, Hall WH. Inherited hypertension in rats. Nature. 1958 Sep 13;182(4637):727-8. 147. Alexander N, Hinshaw LB, Drury DR. Development of a strain of spontaneously hypertensive rabbits. Proc Soc Exp Biol Med. 1954 Aug-Sep;86(4):855-8. 148. Phelan EL, Smirk FH. Cardiac hypertrophy in genetically hypertensive rats. The Journal of Pathology and Bacteriology. 1962;80:445-8. 149. Page IH. A Method for Producing Persistent Hypertension by Cellophane. Science. 1939 Mar 24;89(2308):273-4. 150. Phelan EL, Eryetishir I, Smirk FH. Observations on the responses of rats with spontaneous hypertension and control rats to pressor drugs and to hexamethonium. Circ Res. 1962 May;10:817-24. 151. Okamoto K, Tabei R, Fukushima M, Nosaka S, Yamori Y. Further observations of the development of a strain of spontaneously hypertensive rats. Jpn Circ J. 1966 Jun;30(6):703-16. 152. Doggrell SA, Brown L. Rat models of hypertension, cardiac hypertrophy and failure. Cardiovascular Research. 1998 Jul;39(1):89-105. 153. Kurtz TW, Montano M, Chan L, Kabra P. Molecular evidence of genetic heterogeneity in Wistar-Kyoto rats: implications for research with the spontaneously hypertensive rat. Hypertension. 1989 Feb;13(2):188-92. 154. Kurtz TW, Morris RC, Jr. Biological variability in Wistar-Kyoto rats. Implications for research with the spontaneously hypertensive rat. Hypertension. 1987 Jul;10(1):127-31. 155. Deschepper CF, Picard S, Thibault G, Touyz R, Rouleau JL. Characterization of myocardium, isolated cardiomyocytes, and blood pressure in WKHA and WKY rats. Am J Physiol Heart Circ Physiol. 2002 Jan;282(1):H149-55. 156. Collins HL, Loka AM, DiCarlo SE. Daily exercise-induced cardioprotection is associated with changes in calcium regulatory proteins in hypertensive rats. American Journal of Physiology-Heart and Circulatory Physiology. 2005;288:H532–H40. 157. Eichelman B, Dejong W, Williams RB. Aggressive behavior in hypertensive and normotensive rat strains. Physiol Behav. 1973 Feb;10(2):301-4. 158. Lundin S, Herlitz H, Hallback-Nordlander M, Ricksten SE, Gothberg G, Berglund G. Sodium balance during development of hypertension in the spontaneously hypertensive rat (SHR). Acta Physiol Scand. 1982 Jul;115(3):317-23. 159. Nishiyama K, Nishiyama A, Frohlich ED. Regional blood flow in normotensive and spontaneously hypertensive rats. Am J Physiol. 1976 Mar;230(3):691-8. 160. Herlitz H, Lundin S, Henning M, Aurell M, Karlberg BE, Berglund G. Hormonal pattern during development of hypertension in spontaneously hypertensive rats (SHR). Clin Exp Hypertens A. 1982;4(6):915-35. 161. Felten SY, Weyhenmeyer JA, Felten DL. Norepinephrine and serotonin in central autonomic nuclei in the spontaneously hypertensive rat and two normotensive control rats. Brain Res Bull. 1984 Sep;13(3):437-41. 162. Hard E, Carlsson SG, Jern S, Larsson K, Lindh AS, Svensson L. Behavioral reactivity in spontaneously hypertensive rats. Physiol Behav. 1985 Oct;35(4):487-92. 163. Soderpalm B. The SHR exhibits less "anxiety" but increased sensitivity to the anticonflict effect of clonidine compared to normotensive controls. Pharmacol Toxicol. 1989 Nov;65(5):381-6. 164. Sagvolden T, Pettersen MB, Larsen MC. Spontaneously hypertensive rats (SHR) as a putative animal model of childhood hyperkinesis: SHR behavior compared to four other rat strains. Physiol Behav. 1993 Dec;54(6):1047-55.

46
165. Gattone VH, 2nd. Body weight of the spontaneously hypertensive rat during the suckling and weanling periods. Jpn Heart J. 1986 Nov;27(6):881-4. 166. Bizot JC, Chenault N, Houze B, Herpin A, David S, Pothion S, et al. Methylphenidate reduces impulsive behaviour in juvenile Wistar rats, but not in adult Wistar, SHR and WKY rats. Psychopharmacology (Berl). 2007 Aug;193(2):215-23. 167. Langen B, Dost R. Comparison of SHR, WKY and Wistar rats in different behavioural animal models: effect of dopamine D1 and alpha2 agonists. Atten Defic Hyperact Disord. 2011 Mar;3(1):1-12. 168. Sanada LS, Tavares MR, Neubern MC, Salgado HC, Fazan VP. Can Wistar rats be used as the normotensive controls for nerve morphometry investigations in spontaneously hypertensive rats (SHR)? Acta Cir Bras. 2011 Dec;26(6):514-20. 169. Gordon CJ, Phillips PM, Johnstone AF. Impact of genetic strain on body fat loss, food consumption, metabolism, ventilation, and motor activity in free running female rats. Physiol Behav. 2016 Jan 1;153:56-63.
CAPÍTULO 1
Mapping and characterization of experimental models used to Spontaneously
Hypertensive Rat control (Wistar and Wistar Kyoto)- a scoping review.
Leonardo Mateus Teixeira de Rezende1, Leôncio Lopes Soares1, Antônio José Natali1, Cândido
Celso Coimbra2, Thales Nicolau Prímola Gomes1.

47
1- Exercise Biology Laboratory, Department of Physical Education, Federal University of Viçosa,
Viçosa, MG, Brazil
2- Laboratory of Endocrinology and Metabolism, Department of Physiology and Biophysics, Federal
University of Minas Gerais, Belo Horizonte, MG, Brazil.
Abstract:
Introduction: The Spontaneously Hypertensive Rat (SHR) is an experimental model widely
used for the study of essential arterial hypertension. However, there is a literature impasse
regarding the designation of the best model to be used as SHR experimental control, with the
Wistar Kyoto rats (WKY) and Wistar rats (WIS) being the most used. Objective: this work
aimed to map studies that used the WIS and WKY strains simultaneously as SHR control,
allowing the proper characterization of the available variables of strains. Methods: a scoping
review based on the Preferred Reporting Items for Systematic Reviews and Meta-analysis
(PRISMA-ScR). The following descriptors were defined and used in PubMed, Web of science
and Embase data bases: “Spontaneously hypertensive rat OR SHR AND Wistar Kyoto OR
Normotensive Wistar Kyoto Rat OR WKY AND Wistar OR Normotensive Wistar Rat OR WIS OR NWR“.
Two reviewers independently analyzed first the titles and abstract of all studies identified by
the searches using Rayyan, a Web application designed to assist in this step of the review
studies. after this screening, in which the inclusion and exclusion criteria were applied, the
papers were read in full. Results: After applying the search and selection methods, 161 articles
were included for analysis, with 68.4% indicating that both normotensive animals can be used
as controls, 13.49% and 6.47% of the studies indicated WIS and WKY as better control,
respectively. Conclusions: This review confirmed that both normotensive models can be used
to control SHR, however, it is necessary that researchers carefully analyze which one to select
based on their objectives and on which experiments they will perform.
Keywords: Spontaneously Hypertensive Rats; experimental models; control group.
1- Introduction:
The science consists of a set of knowledge to be studied, tested, discussed, replicated
and disseminated. It should be objective, generating tested and proved information from
experimental methods carefully planned and executed. It is a continuous pathway, since from
the established data, new theories are formed aiming the progress and the information addition
(1).
Aiming to promote the scientific advancement, animals are commonly used as
experimental models in all research fields (2). For this, methodological and ethical standards

48
were established in order to preserve the scientific quality, as well as the welfare of the species
used (3). Thus, such models need to be a real representation of the phenomenon studied.
Consequently, the selection of the experimental model represents an extremely important step
in scientific planning, since the use of the appropriate model to the study objectives is crucial
to obtain reliable results (3).
For the study of essential arterial hypertension (EAH), the Spontaneously Hypertensive
Rat (SHR) represents a widely used model. In the 1950s, hypertension expanded as a high-
incidence disease, which made it necessary to develop scientific studies to better understand
this phenomenon. However, until now, there was no adequate experimental model for the
disease studying. Thus, several research groups pointed their efforts towards this topic (4-6).
In 1954, Alexander et al., developed a strain of hypertensive rabbits, in which 86% of
males and 53% of females manifested the disease (6). In 1958 in Otago, Smirk and Hall
developed a strain of hypertensive rats from mating between siblings, however, only 30% of
the animals developed the disease (4). In 1962, the same group reported that 50% of animals
manifested the disease, and the mean systolic blood pressure (SBP) obtained was 147.2 mmHg
(7). It is important to note that for rodents, EAH is classified as sustained SBP above 150 mmHg
(5, 7-9).
In 1963, Okamoto and Aoki developed the SHR strain from Wistar Kyoto (WKY)- a
normotensive rat from Kyoto- Japan (5). The researchers performed a screening among the
WKY rats, selecting those had sustained high blood pressure for approximately one month,
subjecting them to consanguineous mating for several generations, until after the 6th generation
all descendants (100%) presented the development of EAH (SBP > 150 mmHg) (5, 10).
Thereafter, the SHR were established as the appropriate model for EAH study, using the
normotensive WKY as controls (11). However, several studies have pointed out limitations in
the WKY used as SHR control, indicating that strain may have characteristics inherent to the
disease, such as high SBP, sympathetic hyperactivity and left ventricle pathological concentric
hypertrophy (10, 12-15).
The normotensive Wistar rat-WIS emerged as an alternative control for SHR, since they
do not have such characteristics. These animals surged in Philadelphia-USA in the early 20th
century, at the Wistar Institute of Anatomy and Biology and reports show that this experimental
strain served as basis for the development of many others, such as the WKY (16, 17). In 1938
a group of WIS rats were transported from Philadelphia to University of Tokyo-Japan, followed
in 1944 to University Hokkaido. In 1951 they arrived at the Kyoto University Faculty of
Medicine, where they were used as progenitor of the WKY and, consequently, of the SHR (18,

49
19). Thus, there is a genetic relationship between these three strains, with WIS representing the
matrix for generating the others (18). Therefore, which strain supposed to be used as SHR
control represents a topic of wide debate in the literature.
All experimental work requires the presence of a control group, which allows the
suitable interpretation of the results (3, 11). Thus, the selection of the control group represents
a step as important as the selection of the experimental group. Thus, research groups have been
showing concern over the time with which strain that should be used as SHR control. Then,
multiple studies have compared different variables between SHR, WIS and WKY, aiming to
provide a background when selecting strains for the scientific researches (20-32). Thus, this
work aimed to map studies that used the WIS and WKY strains simultaneously as SHR control,
allowing the proper characterization of the available variables of strains.
2- Methods:
The elaboration of this scoping review followed the criteria established by the Preferred
Reporting Items for Systematic Reviews and Meta-analysis with extention for scoping reviews
(PRISMA-ScR) (33, 34). The methodological protocol used was registered in the Open Science
Framework and can be consulted from the following electronic address:
https://osf.io/e7kfm/?view_only=.
The works were searched in electronic databases (PubMed, Web of Sciences and
EMBASE), in addition to the search in the references of the selected articles themselves. The
following descriptors were defined with the aid of Medical Subject Headings (MeSH):
“Spontaneously hypertensive rat OR SHR AND Wistar Kyoto OR Normotensive Wistar Kyoto Rat OR
WKY AND Wistar OR Normotensive Wistar Rat OR WIS OR NWR“.
After searching for papers in the databases, duplicates were eliminated using the
Mendeley software. Two reviewers independently analyzed the titles (phase 1) and abstracts
(phase 2) of all studies identified by the searches. Complete studies (Phase 3) considered
potentially relevant for inclusion after discussion between the reviewers were then be obtained
and two evaluated them for eligibility. Data were extracted from the studies chosen to be
included using a standard form, prepared previously. Any discrepancies were discussed with a
third reviewer. This process was performed using Rayyan, a Web application designed to assist
in this step of the review studies.
The research including all original studies that used simultaneous comparation among
WIS, WKY and SHR. Therefore, the exclusions criterions were: a) qualitative studies; b)

50
studies that did not use the three strains, i.e.; only WIS or WKY as control; used the SHR as
control; used another strain as control; c) review studies.
The data extraction form was previously established, in which information was obtained
about: 1) study/year; 2) country in which the research was carried out; 3) laboratory of source
the experimental strains; 4) age at which they were used; 5) sex of the animals used; 6) body
mass; 7) blood pressure and the method used for its analysis; 8) main analysis carried out and
its results; 9) relationship of the responses between normotensive rats from the analyzes carried
out.
3- Results:
The stages of the article search process are shown in the flowchart (fig.1). After
descriptors application in databases were founded 28676 studies. The duplicates were founded
and excluded (n= 5584) using Mendeley version 1.17.13 (Elsevier), remaining 23092 articles.
The exclusions criterions were applied and 190 papers resting to be read in full. After reading,
29 more studies were excluded because they did not perform a comparative analysis between
the three strains, and 161 articles were finally included for data extraction.

51
Figure 2 shows the annual frequency of articles found in the search (n = 23092; fig.2A),
in which we highlight the year of development of the SHR (1963) (5). In panel B we present
the starting point at which the researchers comparing the three experimental models (1974), as
well as the annual frequency of studies within this theme.
Figure 3 is a map showing all the countries that have developed scientific works
comparing the three strains studied. Researches were found in 23 countries and on all
continents, with the Americas (n = 99) and Europe (n = 44) consisting of the most active
continents within this theme.
Figure 1. Flowchart of searching process.

52
Figure 2. Annual flow of research found from searches (n = 23092; panel A) and annual flow of research that compared
the three experimental models (panel B).

53
Figure 3. Map of countries that developed research comparing the three strains. The intensity of coloring indicates the density of studies in each location.

54
Table 1 shows which laboratories and the number of times that each animal
breeding laboratory provided rats for researches. It is important to note that 34 studies did
not indicate the source of origin of the experimental animals used.
Table 1. Laboratories of experimental strains origin.
Source WIS WKY SHR
Charles-River Breeding Laboratories, Wilmington, Massachusetts- USA 14 17 18
Charles-River Breeding Laboratories, Burlington, Massachusetts- USA 16 4 4
Charles River Breeding Laboratories, Margate- USA 1 2 2
Charles River Laboratories, Raleigh, North Carolina- USA 5 2 2
Charles River Laboratories, Kingston, New York- USA 2 5 5
Charles River Laboratories, St-Constant, Quebec- Canada 9 4 4
Charles River Wiga GmbH, Sulzfeld- Germany 2 2 3
Charles River Laboratories, Kisslegg- Germany 2 2 2
Charles River Laboratories, Yokohama- Japan 2 2 2
Charles River Laboratories, Shizuoka- Japan 1 1 1
Charles River Laboratories, Atsugi- Japan x 1 1
Charles River Breeding Laboratories- United Kingdom 1 x 1
Charles River Breeding Laboratories- Spain 1 1 1
Charles River Laboratories, Lyon- France 4 4 4
Charles-River Breeding Laboratories (not indicated local) 12 10 10
Harlan Laboratories, Frederick- USA 1 x x
Harlan Laboratories, Bicester- England 2 3 2
Harlan Sprague Dawley, Indianapolis- USA 7 9 8
Harlan Laboratories- Netherlands 1 1 1
Harlan Laboratories, Mexico City- Mexico 3 x x
Harlan Laboratories- United Kingdom x 1 x
Wistar Institute, Philadelphia- USA 5 2 2
Mollegaard Breeding Farm, Skensved- Denmark 5 6 6
Biological Laboratories, Ballina- Ireland 1 x 1
Ivanovas Kisleg im Algau, FRG- Germany 1 x 1
Clinical Research Institute of Montreal- Canada x 1 1
IFFA, Credo, Lyon- France 2 2 2
Versuchstierzucht Schönwalde- Germany 1 x x
Central istitute of Cardiovasular research- Germany x 1 1
National institutes of Health stock- USA x 1 1
Breeding colony in Chapel Hill, North Carolina- USA 2 1 1
University of Connecticut School of Medicine, Farmington- USA 1 1 1
Le Genest-Saint-Isle- France 1 1 1
Madörin ag, Füllinsdorf- Switzerland 1 1 1
Central Research Laboratory of the Ministry of Public Health of the USSR, Moscow- Russia x 1 1
USSR Academy of Medical Sciences- Russia 1 x x

55
National Heart and Lung Institute- England x 1 x
Carworth farm, Missouri- USA 1 x 1
National Institutes of Health, Bethesda, Maryland- USA 1 5 5
Paulist school of medicine, São Paulo- Brazil 2 1 1
Laboratory Supplx- Co. Indianapolis- USA 2 2 2
West Jersey Biological Supply , New Jersey- USA 1 x x
Merrell National Laboratories, Cincinnati, Ohio- USA x x 1
Taconic Farms, Germantown, New York- USA 8 14 14
Microbiological Associates, Walkersville, Maryland- USA 1 x x
Simonsen Laboratories, Gilroy, California- USA 1 x x
University of the Pacific, San Francisco- USA x 1 1
Rockland, Gilbertsville, Pennsylvania- USA 1 x x
University of Bristol, University Walk, Bristol- England 1 x x
Dr Karl Thomae GmbH- Germany 1 x x
Shizuoka Laboratory Center, Hamamatsu- Japan 1 x x
school of medical sciences- Argentina 1 x x
Disease Model Cooperative Research Association, Kyoto- Japan x 1 1
Centre d’Elevage René Janvier- France 1 1 1
University of New South Wales, UNSW, Sidney- Australia x 1 1
animal care facility of the Department of Neurology, School of Medicine of Ribeirao Preto- Brazil 1 1 1
Pavlov Institute of Physiology, Saint Petersburg- Russia 1 1 1
Central Institute for the breeding of Laboratory Animals, Zeist- Netherlands 2 3 3
Legend: x- without collecting models in this lab
Table 2. presented the data of papers. The works were detailed as to study/year,
country in which the research was carried out, laboratory of source the experimental
strains, age at which they were used, sex of the animals used, body mass, blood pressure
and the method used for its analysis, main analysis carried out and its results and
relationship of the responses between normotensive rats from the analyzes carried out.

56
Table 2. Characterization of Wistar, Wistar Kyoto and SHR.
Study Country Gender Age Origin Body mass Blood pressure Measurement Results Control group
Tobia, Lee
and Walsh
(1974)
USA Male 5 to 8 months
WIS and SHR- Carworth farm ,
Missouri- USA
WKY-National Institutes of
Health, Bethesda, Maryland, USA
NI
Direct registration of MAP
from catheter in carotid
artery
WIS: 99 ± 4 mmHg
WKY: 114 ± 7 mmHg
SHR: 183 ± 12 mmHg
Regional blood flow
of iliac and mesenteric
arteries
SHR:
↑ Peripheral resistance index
WIS vs. WKY:
↑ Total peripheral resistance
WKY better control
Frohlich and
Pfeffer
(1975)
USA NI 8 to 11 weeks
WIS and SHR- University of
Oklahoma,
Health Sciences Center from
animals, USA WKY- National
Heart and Lung Institute, England
WIS: 225 g
WKY: 221 g
SHR: 210 g
Direct registration of SBP
from catheter in carotid
artery
WIS: 143 mmHg
WKY: 134 mmHg
SHR: 185 mmHg
Blood pressure
LVM
Peripheral resistance
index
SHR:
↑ SBP
↑ LVM
↑ Peripheral resistance index
WIS = WKY
WIS = WKY
Nickerson
(1976) USA Male 21 weeks
WIS and SHR- Charles-River
Breeding Laboratories,
Wilmington, Massachusetts-USA
WKY- Laboratory Supply
Company, Indianapolis, IN, USA
WIS: 467 ± 9g
WKY: 344 ± 8g
SHR: 286 ± 6g
SBP:
Method was not indicated
WIS: 113 ± 2 mmHg
WKY: 105 ± 4 mmHg
SHR: 172 ± 6 mmHg
Ultrastructure of the
adrenal gland
WKY vs WIS:
↑ Adrenal gland weight
Organel Volume in zona
glomerulosa:
↓ mitochondria
smooth endoplasmic reticulum,
↑ lysosomes
WKY better control
Nishiyama,
Nishiyama
and Frohlich
(1976)
USA Male 18 to 25
weeks
WIS- West Jersey Biological
Supply , New Jersey-USA
WKY and SHR- University of
Oklahoma,
Health Sciences Center from
animals, USA
WIS: 458 ± 15g
WKY: 347 ± 7g
SHR: 326 ± 6g
Direct registration of MAP
from catheter in carotid
artery
WIS: 111 ± 6 mmHg
WKY: 102 ± 4 mmHg
SHR: 154 ± 5 mmHg
Organs weight
SHR:
↑ Heart/body mass ratio
↑ Weight of lung
↑ Weight of stomach
↑ Weight of intestine
↑ Weight of liver
SHR vs. WIS
↑ Weight of brain
↑ Weight of adrenal glands
↑ Weight of Kidneys
WKY vs. WIS:
↑ Weight of brain
↑ Weight of pancreas
↑ Weight of adrenal glans
↓ Weight of liver
↓ Weight of splen
Not conclusive

57
Mullins and
Banks (1976) USA Female
6 weeeks
12 weeks
16 weeks
WIS and WKY- Laboratory
Supply Company, Indianapolis,
IN, USA
SHR- Merrell National
Laboratories, Cincinnati, Ohio-
USA
Only shown in
graph
WIS > SHR
Direct registration of SBP
from catheter in femoral
artery; and SBP were
estimated using the tail-cuff
occlusion and
plethsmography method
Tail
WIS: 131 ± 3 mmHg
WKY: 102 ± 1.5 mmHg
SHR: 148.3 ± 4.1 mmHg
Artery
WIS: 127.5 ± 4.6 mmHg
WKY: 107 ± 2.5 mmHg
SHR: 153.8 ± 3.8 mmHg
Kidney weight
SHR:
↓ Kidney weight
6weeks:
SHR vs. WIS:
↓ Sodium load excretion
6 vs. 12 weeks:
SHR:
↓ Glomerular filtration
SHR and WIS:
↑ Kidney weight
WKY better control

58
Hodgins and
Frohlich
(1978)
USA NI 4 and 16
weeks NI NI NI
Levels of
norepinephrine and
serotonin of brain
(Paraventricular
Nucleus, Locus
Coeruleus,
Parabrachial Nuclei,
Dorsal Motor Nucleus
of X, Nucleus Tractus
Solitarius and
Medullary Raphe
Nuclei)
Paraventricular Nucleus:
4 weeks:
↑ 5HT (WIS)
Locus Coeruleus:
4 weeks:
↑ 5HT (WIS)
16 weeks:
↑ NE (WIS)
Parabrachial Nuclei:
4 weeks:
↓ NE (WKY)
↑ 5HT (WIS)
16 weeks:
↑ NE (WIS)
Dorsal Motor Nucleus of X:
4 weeks:
↓ NE (WKY)
16 weeks:
↑ 5HT (SHR)
Nucleus Tractus Solitarius:
4 weeks:
↑ 5HT (WKY)
Medullary Raphe Nuclei:
4 weeks:
↑ 5HT (WIS)
16 weeks:
↓ 5HT (WIS)
Not conclusive

59
Dunn, Pfeffer
e Frohlich
(1978)
USA Male and
famale
8 to 12
weeks
26 to 51
weeks
51 to 76
weeks
> 76 weeks
University of Oklahoma, Health
Sciences Center from animals,
USA
WIS: 239g;
449g; 397g;
328g.
WKY: 189g;
354g; 372g;
447g.
SHR: 218g;
309g; 298g;
313g.
NI LVM/BM
echocardiogram
SHR:
↑ LVM/BM
> 51 weeks SHR:
↑P wave duration
↑ QRS duration
WIS = WKY
WIS = WKY
Hodgins and
Frohlich
(1978)
USA NI 14 to 63
weeks NI
WIS: 290 ± 84g
WKY: 255 ± 20g
SHR: 222 ± 26g
NI
LVM/BM
enzymatic activity in
left ventricle after
norepinephrine
stimulation:
Adenylate cyclase and
lactate
Dehydrogenase.
SHR:
↑ LVM/BM
↑ Lactate Dehydrogenase
activity
SHR vs. WKY:
↓ Adenylate cyclase activity:
WIS = WKY
Cox (1979) USA NI 10 weeks Charles-River Breeding
Laboratories
WIS: 305 ± 9g
WKY: 269 ± 13g
SHR: 245 ± 5g
SBP were estimated using
the tail-cuff occlusion and
plethysmography method
WIS: 121 ± 3mmHg
WKY: 124 ± 4mmHg
SHR: 187 ± 5mmHg
Geometric properties
of carotid
collagen content
SHR:
↑ SBP
↓ Internal radius of carotid
↓ External diameter
SHR vs. WKY
↑ stiffening of carotid
↑ collagen
WIS = WKY

60
Johnson and
macia (1979) USA NI
10 to 12
weeks
WIS: Charles-River Breeding
Laboratories WKY and SHR-
National Institutes of Health,
Bethesda, Maryland, USA
NI
Direct registration of MAP
from catheter in carotid
artery
WIS: 166 ± 2mmHg
WKY: 107 ± 9mmHg
SHR: 201 ± 2mmHg
sympathetic
vasomotor outflow
and blood pressure
after guanethidine
infusion
SHR
↑ Resistance to guanethidine
WIS = WKY
WIS = WKY
Collis, Mey
and
Vanhoutte
(1979)
Belgium NI 6 weeks NI NI
SBP were estimated using
the tail-cuff occlusion and
plethysmography method
WIS and WKY: 119.5 ±.1
mmHg
SHR: 158.3 ± 2.6 mmHg
Perfusion pressure
Noradrenalin efflux
SHR:
↑ Perfusion pressure
↑ Noradrenalin efflux
WIS = WKY
WIS = WKY
Postnov and
Orlov (1980) Russia Male 13 weeks
WIS- USSR Academy of Medical
Sciences, Russia
SHR and WKY- Central Research
Laboratory of the Ministry of
Public Health of the USSR,
Moscow-Russia
WIS: 150 - 175g
WKY: 145 -
170g
SHR:140- 160g
SBP were estimated using
the tail-cuff occlusion and
plethysmography method
WIS: 80 - 100 mmHg
WKY: 120 - 140 mmHg
SHR: 180 - 200 mmHg
Mithocondria calcium
accumulation
Mithocondria calcium
binding capacity of
certain membranes
SHR:
↓ Mithocondria calcium accumulation ↓ Mithocondria calcium binding capacity of certain membranes WIS = WKY
WIS = WKY
Altura,
Cortella and
Altura (1980)
USA Male 14-16 weeks Taconic Farms, Germantown, New
York NI
MAP:
Method was not indicating
WIS: 100-120 mmHg
WKY: 100-120 mmHg
SHR: 175-200 mmHg
In vivo contraction of
VSMC induced by
magnesium ions
SHR and WKY vs. WIS:
↑ Isometric tension of VSMC WIS better control

61
Nordborg,
Barbro and
Johansson
(1980)
Sweden Male and
famale 200 days NI NI
Direct registration of MAP
from catheter in femoral
artery
WIS: 100 - 115 mmHg
WKY: 100 - 115 mmHg
SHR: 150 - 185 mmHg
Morphometry of
cerebral arteries
SHR:
↑ Media area of artery
SHR vs. WIS:
↑ Media/ratius ratio
WIS = WKY
Haack,
Schaffer e
Simpson
(1980)
USA Male 5 to 10
weeks
Charles-River Breeding
Laboratories, Wilmington
Massachusetts, EUA
WIS: 212 ± 11 g
WKY: 176 ± 8 g
SHR: 190 ± 9 g
SBP were estimated using
the tail-cuff occlusion and
plethysmography method
WIS: 124 ± 3 mmHg
WKY: 115 ± 5 mmHg
SHR: 149 ± 4 mmHg
Blood vessels count
Blood vessels
diameter
SHR:
↑ SBP
↓ Fourth-order arterioles
↑ Mean internal diameters
SHR and WKY vs. WIS:
↓ Third-order arterial vessels
SHR vs. WIS:
↓ Fourth-order veins
WKY vs. WIS:
↓ Fourth-order arterioles
WIS better control
Lukacsko,
Messina and
Kaley (1980)
USA Male 210 to 225
days
Charles-River Breeding
Laboratories NI
Direct registration of MAP
from catheter in carotid
artery
WIS: 107 ± 3 mmHg
WKY: 114 ± 4 mmHg
SHR: 143 ± 2 mmHg
MAP after infusion of
vasodilating agents
(prostaglandin,
prostacyclin,
arachidonic acid and
sodium nitroprusside)
WIS, WKY and SHR:
↓ MAP after vasodilating
agents infusion
SHR:
↓ MAP after vasodilating
agents infusion
WIS = WKY
WIS = WKY
Webb,
Vanhoutte
and Bohr
(1980)
Belgium Male and
famale
3.5 to 6
months
WIS and WKY- Charles-River
Breeding Laboratories,
Wilmington Massachusetts, EUA
SHR- University of Antwerp,
Belgium
NI
SBP were estimated using
the tail-cuff occlusion and
plethysmography method
WIS and WKY: 124 ± 2
mmHg
SHR: 183 ± 3 mmHg
Arterial contraction
strength
SHR
↓ Maximum contractile
response
↓ % Maximum response to
norepinephrine
WIS = WKY
WIS = WKY

62
O'donnel and
Volicer
(1981)
USA Male 12 weeks
Charles-River Breeding
Laboratories, Burlington,
Massachusetts, EUA
NI
SBP were estimated using
the tail-cuff occlusion and
physiograph method
WIS: 111 ± 7 mmHg
WKY: 115 ± 7 mmHg
SHR: 185 ± 4 mmHg
Tcore response to
temperature stimulus
SHR:
↑ Basal temperature ↑ Tcore increased after heating ↑ Tcore decreased after cooling WIS = WKY
WIS = WKY
Kitamura et
al. (1981) USA Female
WIS and
WKY: 8 ±
0.2 weeks
SHR: 33 ± 1
weeks
NI NI
MAP was recorded on
multichannel polygraph
WIS: 112 ± 3 mmHg
WKY: 107 ± 4 mmHg
SHR: 162 ± 4 mmHg
Cardiac output
total vascular
resistance
organ vascular
resistance after injury
induction in STN
Pre injury:
SHR:
↑ MAP
↑ Total peripheral resistance
↑ organ vascular resistance
(brain, heart, lungs,
hepatosplanchnic, kidneys)
SHR vs. WIS:
↓ Cardiac output
After injury:
SHR, WIS and WKY:
↑ MAP
↑ Total peripheral resistance
WIS and WKY:
↓ Cardiac output
WIS = WKY
WIS = WKY
Lundin et al.
(1982) Sweden Male
7 Weeks
(WIS and
SHR)
16 Weeks
(WKY and
SHR)
Taconic Farms, Germantown, New
York
7 Weeks:
WIS: 164 ± 2g
SHR: 127 ± 2g
16 Weeks:
WKY: 289 ± 3g
SHR: 285 ± 3g
Direct registration of MAP
from catheter in tail artery:
7 Weeks:
WIS: 109 ± 3 mmHg
SHR: 122 ± 2 mmHg
16 Weeks:
WKY: 105 ± 3 mmHg
SHR: 155 ± 4 mmHg
Sodium
retention/excretion WIS = WKY = SHR WIS = WKY

63
Mullins et al.
(1982) USA NI
5, 10, 15, 20,
25 and 30
days
Charles-River Breeding
Laboratories NI NI Plasma aldosterone
5, 10 and 20 days:
SHR vs. WKY:
↑ Aldosterone concentration
5, 10, 20 and 30 days:
SHR vs. WIS:
↑ Aldosterone concentration
WKY:
↑ Aging Aldosterone
concentration
WIS = WKY
WIS = WKY
Piccoti et al.
(1982) Italy Male
SHR and
WKY: 13 to
14 weeks
University of Oklahoma,
Health Sciences Center from
animals, USA
220 - 300g
Direct registration of MAP
from catheter in carotid
artery
WIS: 111 ± 2 mmHg
WKY: 125 ± 4 mmHg
SHR: 183 ± 4 mmHg
Catecholamines
concentration after
cold exposure
WIS:
↑ Catecholamines
concentration
SHR:
↑ MAP
WIS better control

64
Lukacsko
(1983) USA Male
5, 10 and 20
weeks
Charles-River Breeding
Laboratories NI NI
Arterial
prostaglandins release
with and without AA
stimulation
5 weeks:
Without AA:
SHR vs. WKY:
↑ Prostaglandin release
With AA:
↑ Prostaglandin release (all
strains)
10 weeks:
SHR and WIS vs. WKY:
↑ Prostaglandin release
With AA:
↑ Prostaglandin release (all
strains)
20 weeks:
SHR vs. WIS and WKY:
↑ Prostaglandin release
With AA:
↑ Prostaglandin release (all
strains)
WIS = WKY
WIS = WKY

65
Borkowski
and Quinn
(1983)
England Male NI NI 250-300g
Direct registration of SBP
from catheter in femoral
artery; and SBP were
estimated using the tail-cuff
occlusion and oscilograph
method Tail
WIS: 111 ± 6mmHg
WKY: 151 ± 5mmHg
SHR: 174 ± 10mmHg
Artery
WIS: 119 ± 3mmHg
WKY: 157 ± 5mmHg
SHR: l78 ± 5mmHg
Catecholamines
concentration in both
blood pressure
measurements
methods
Tail
SHR:
↑ Catecholamines concentration
WIS = WKY
WIS = WKY
Häusler et al.
(1983) Switzerland Male NI
Madörin ag, Füllinsdorf,
Switzerland NI
SBP were estimated using
the tail-cuff occlusion and
plethysmography method
Showed only in graph
Hypothalamus
pituitary
adrenocortical
function after
betamethasone
ingestion
SHR and WKY vs WIS:
↑ SBP after betamethasone
ingestion
SHR
↓ ACTH content after
betamethasone ingestion
↑ Relative pituitary weight
WIS better control
Takahashi et
al. (1983) Japan Male 16 weeks NI
WIS: 250 ± 5g
WKY: 289 ± 7g
SHR: 244 ± 4g
Direct registration of MAP
from catheter in femoral
artery
WIS: 115 ± 6 mmHg
WKY: 123 ± 6 mmHg
SHR: 156 ± 6 mmHg
Sympathetic nerver
activity
Vascular
responsiveness to
Carbachol
Carbachol
WIS:
↓ MAP follow by increase
↑ Sympathetic nerver activity
WKY and SHR vs. WIS:
↑ MAP
WIS better control
Preuss and
Goldin
(1983)
USA NI 25 weeks
WIS- Microbiological Associates,
Walkersville, Maryland, USA
SHR and WKY- Taconic Farms,
Germantown, New York- USA
WIS: 158 ± 7.4 -
206 ± 24g
WKY: NI
SHR: 145 ± 9.2g
- 201 ± 10.1g
NI Renotropic activity
SHR:
↑ Kidneys weight
↑ Renotropins
↑ Renotropic activity
WIS = WKY
WIS = WKY

66
Martin and
Quock
(1984)
USA Male 12 - 15g
WIS- Simonsen Laboratories,
Gilroy, California-USA
WKY and SHR- University of the
Pacific, San Francisco-USA
250 - 300g
SBP were estimated using
the tail-cuff occlusion and
plethysmography method
WIS: 131 ± 1 mmHg
WKY: 135 ± 1 mmHg
SHR: 202 ± 1 mmHg
Body temperature
after apomorphine
application
thermal response
index
SHR:
↑ Thermal response index
↑ Hypothermic responses
WIS = WKY
WIS = WKY
Krukoff and
Calaresu
(1984)
Canada Male NI Charles-River Breeding
Laboratories 300 ± 30g
Direct registration of MAP
from catheter in femoral
artery
WIS: 112 ± 3 mmHg
WKY: 104 ± 3 mmHg
SHR: 156 ± 2 mmHg
Celular COX activity
in hypothalamus
SHR: ↑ Cox activity (PVH and SON) WIS = WKY
WIS = WKY
Miasiro et al.
(1985) Brazil NI
20 - 24
weeks
WIS- Wistar Institute,
Philadelphia,
PA, USA
WKY and SHR- National
Institutes of Health, Bethesda,
Maryland, USA
WKY: 210 -
230g
SHR: 170 - 190g
NI
reactivities to
bradykinin and to
increased K+ of
duodenum VSMC
SHR and WkY vs. WIS: ↓ Contraction ↑ Sensitive to bradykinin
Not conclusive
Loeb and
Bean (1985) USA
Male and
famale 4 - 21 weeks
WIS- Harlan Laboratories Inc,
Frederick, USA WKY and SHR-
Charles-River Breeding
Laboratories, Wilmington
massachusett-USA
WIS: 190 - 250g
WKY: NI
SHR: NI
SBP were estimated using
the tail-cuff occlusion and
plethysmography method
Showed only in graph
Aortic DNA synthesis
of smooth muscle
> 17 weeks:
SHR:
↑ Aortic DNA synthesis
WIS = WKY
WIS = WKY
Hard et al.
(1985) Sweden
Male and
famale 87 - 180 days
Mollegaard Breeding Farm,
Skensved, Denmark NI
Direct registration of MAP
from catheter in tail artery
show only in graph
Locomotor behavior
Sexual behavior
SHR vs. WKY:
↑ Locomotor activity
WIS vs. WKY:
↑ Sexual behavior
Suggests using both

67
Kino et al.
(1985) USA Male
14 - 17
weeks NI NI
SBP were estimated using
the tail-cuff occlusion and
plethsmography method
WIS: 109.1 ± 6.6 mmHg
WKY: 116.5 ± 3.8 mmHg
SHR: 218.5 ± 2.4 mmHg
Intracellular Na+/K+
ratios in VSMC
SHR:
↑ Rb+ efflux
↑ Peak of Intracellular Na+/K+
WIS = WKY
WIS = WKY
Farmam and
Bonvalet
(1985)
France Femele NI NI 190 - 210g
Direct registration of MAP
from catheter in femoral
artery
WIS: 108.7 ± 4.1 mmHg
WKY: 111.0 ± 5.4 mmHg
SHR: 143.0 ± 2.2 mmHg
Kidneys aldosterone
binding
SHR vs. WIS:
↑ Cortical collecting tubles
↑ Medullary collecting duct
WKY vs. WIS:
↑ Cortical collecting tubles
Not conclusive
Docherty and
Warnock
(1986)
Ireland Male 2 to 3 months
WIS and SHR- Biological
Laboratories, Ballina, Ireland
WKY- Harlan Laboratories,
Bicester, England
WIS:
WKY:
SHR: 250 - 300g
Direct registration of DBP
from catheter in carotid
artery
WIS: 109.3 ± 5.3 mmHg
WKY: 94.4 ± 5.7 mmHg
SHR: 140.4 ± 2.9 mmHg
Vas deferentia
isometric contraction
after eletric
stimulation and
infusion of vasodilator
drugs
Drugs infusion:
SHR:
↓ Maximum potential of
contraction
WIS = WKY
WIS = WKY
Hopp et al.
(1986) USA Male NI
Charles-River Breeding
Laboratories 250 - 300g
SBP were estimated using
the tail-cuff occlusion and
plethysmography method
WIS: 119.8 ± 3.2 mmHg
WKY: 126.6 ± 1.7 mmHg
SHR: 204.8 ± 4.1 mmHg
Ouabain binding in
VMSC from carotid
arteries
WIS:
↑ Na+ pumps units
↓ Equilibrium dissociation for
ouabain in VSMCs
WIS better control
Leyssac,
Jensen and
Holstein-
Rathlou
(1986)
Denmark Male NI
WIS- Ivanovas Kisleg im Algau,
FRG , Germany
WKY and SHR-Mollegaard
Breeding Farm, Skensved,
Denmark
230 - 300g
Direct registration of SBP
from catheter in carotid
artery
Show only a graph
Proximal tubular
compliance in rats
anaesthetized with
inactin and halothane
Inactin > halothane
↑ tubular compliance SHR = WIS = WKY
WIS = WKY

68
Tamura et al.
(1986) USA Male NI NI 230 - 300g
SBP were estimated using
the tail-cuff occlusion and
plethysmography method
WIS: 119.8 ± 3.2 mmHg
WKY: 126.6 ± 1.7 mmHg
SHR: 204.8 ± 4.1 mmHg
Na+-Ke regulatory
system in
VSMC
SHR:
↑ K+ values
↑ Na+ pump activity
WIS = WKY
WIS = WKY
Tokushige et
al. (1986) USA Male NI NI 230 - 300g
SBP were estimated using
the tail-cuff occlusion and
plethysmography method
WIS: 107.7 ± 4.2 mmHg
WKY: 117.3 ± 4.4 mmHg
SHR: 190.3 ± 4.1 mmHg
Bumetanide- sensitive
Na+ transport in
VSMC
SHR:
↑ Bumetanide- sensitive Na+
transport in VSMC
↑ Na+ turnover
WIS = WKY
WIS = WKY
Head and
Jong (1986) Netherlands Male NI
Central Breeding Laboratories
TNO,
Zeist, The Netherlands
200 - 380g
Direct registration of MAP
from catheter in tail artery
WIS: 113 ± 2 mmHg
WKY: 126 ± 2 mmHg
SHR: 169 ± 4 mmHg
BP response after
clonidine infusion
SHR:
↑ Decreased of MAP after
drug infusion
WKY vs. WIS:
↑ Decreased of MAP after drug
infusion
WIS better control
Toivanen et
al. (1986) Finland
Male and
famale NI
WIS- Mollegaard Breeding Farm,
Skensved, Denmark
WKY and SHR- Central Institute
for the breeding of Laboratory
Animals, Zeist- Netherlands
280 - 330g NI
Arthritis induced by
yersina pseudot
uberciilosis infusion
SHR:
↑ Arthritis infection
WIS = WKY
WIS = WKY

69
Gattone
(1986) USA
Male and
famale
newborns
1 to 6 weeks
Charles-River Breeding
Laboratories, Wilmington,
massachusett-EUA
Newborn:
WIS- 6.06 ±
0.17g
WKY- 4.87 ±
0.09.g
SHR- 5.01 ±
0.08g
1 week:
WIS- 15.6 ±
0.46g
WKY- 10.5 ±
0.23g
SHR- 8.9 ± 0.32g
2 week:
WIS- 34.7 ±
0.94g
WKY- 23.9 ±
0.95g
SHR- 17.7 ±
0.33g
3 week:
WIS- 45.8 ±
1.28g
WKY- 32.9 ±
1.54g
SHR- 28.4 ±
0.71g
4 week:
WIS- 99.8 ±
2.89g
WKY- 65.2 ±
1.29g
SHR- 57.8 ±
1.08g
6 week:
WIS- 178.9 ±
6.38g
WKY- 116.5 ±
3.32g
SHR- 103.7 ±
2.46g
NI Body weight gain
Newborn:
WIS vs. SHR and WKY
↑ Body weight
1 week:
WIS vs. SHR and WKY:
↑ Body weight
WKY vs. SHR :
↑ Body weight
2 weeks:
WIS vs. SHR and WKY:
↑ Body weight
WKY vs. SHR:
↑ Body weight
3 weeks:
WIS vs. SHR and WKY:
↑ Body weight
WKY vs. SHR:
↑ Body weight
4 weeks:
WIS vs. SHR and WKY:
↑ Body weight
WKY vs. SHR:
↑ Body weight
6 weeks:
WIS vs. SHR and WKY:
↑ Body weight
WKY vs. SHR:
↑ Body weight
WIS = WKY
Suggests using bot

70
Sladek,
Davis and
Sladek
(1986)
USA Male 15 to 16
weeks
Charles-River Breeding
Laboratories
WIS: 327 ± 7g
WKY: 224 ± 1g
SHR: 283 ± 4g
SBP were estimated using
the tail-cuff occlusion and
plethysmography method
WIS: 115 ± 4mmHg
WKY: 126 ± 7 mmHg
SHR: 174 ± 3 mmHg
Catecholamines
invervation in
supraotic nucleus
SHR and WIS vs. WKY:
↑ Catecholamines inervation WKY better control
Feig,
D'occhio and
Boylan
(1987)
USA NI 4 months Laboratory Supply Company,
Indianapolis- USA NI
SBP were estimated using
the tail-cuff occlusion and
plethysmography method
WIS: 119.0 ± 2.7mmHg
WKY: 121.4 ± 2.4 mmHg
SHR: 171.4 ± 6.0 mmHg
Lynphcytes volume of
timus
SHR:
↑ Volume gain (NaCl medium)
WIS = WKY
WIS = WKY
Sitsen,
Nijkamp and
Jong (1987)
Netherlands Male NI
Central Institute for the breeding
of Laboratory Animals, Zeist.
Netherlands
225 - 250g
SBP were estimated using
the sphygmographic method
method
WIS: 120 - 135mmHg
WKY: 1130 - 145mmHg
SHR: 190 - 220mmHg
Sensitivity to morphin
in:
Pain sensitivity
Body temperature
Tone of smooth
muscle
Brain concentration of
morphine
WIS:
↑ Analgesic effects of morphin Not conclusive
Hilgenfeldt
and Schott
(1987)
Germany NI NI NI
WIS and WKY:
250 - 300g
SHR: 200 - 220g
NI
Content of plasma
angiotensinogen and
turnover of
angiotensinogen after
nephrectomy
After nephrectomy:
SHR:
↑ increased of angiotensinogen
WIS = WKY
WIS = WKY
Khalil et al.
(1987) USA Male NI NI 250 - 300g
SBP were estimated using
the tail-cuff occlusion and
plethysmography method
WIS: 115 ± 3.3 mmHg
WKY: 117 ± 3.0 mmHg
SHR: 193 ± 3.0 mmHg
ANF content in
VSMC of carotid
ANF receptor density
in VSMC
ANF content in
plasma
SHR:
↑ ANF receptor density
↑ ANF content
WIS = WKY
WIS = WKY

71
Lang and
Johns (1987) USA Male 5 to 8 weeks NI NI
Direct registration of MAP
from catheter in tail artery
WIS: 103 .1 ± 1.3 mmHg
WKY: 99.9 ± 2.1 mmHg
SHR: 125.2 ± 1.5 mmHg
Venule distension WIS = WKY = SHR WIS = WKY
Coskinas and
Price (1987) USA
Male and
famale
16 to 19
weeks
Charles-River Breeding
Laboratories
WIS: 273 ± 6g
WKY: 206 ± 3g
SHR: 193 ± 4g
SBP were estimated using
the tail-cuff occlusion and
electrosphygmomanometer
method
WIS: 110 ± 6 mmHg
WKY: 106 ± 2 mmHg
SHR: 156 ± 2 mmHg
length-sensitivity
response in the aorta
artery stimulated for
epinephrine
WIS = WKY = SHR WIS = WKY
Kunes et al.
(1987) Canada NI newborn
WIS- Taconic Farms,
Germantown, New York
WKY and SHR- Clinical Research
Institute of Montreal- Canada
WIS: 5.69 ±
0.04g
WKY: 5.00 ±
0.06g
SHR: 4.78 ±
0.04g
NI Organs weight
Heart:
↑ SHR
Heart/body weight ratio:
↑ SHR
↑ WKY vs. WIS
Kidneys:
↑ SHR
Kidneys/body weight ratio:
↑ SHR
↑ WKY vs. WIS
Liver:
↑ WIS
Kidneys/body weight ratio:
↑ WIS vs. SHR
WIS better control
Nakamura et
al. (1988) USA Male NI NI 250 - 300g NI
Atrial natriuretic
factor binding in
VSMC
SHR:
↑ Binding sites
↑ Density of atrial natriuretic
factor
WIS = WKY
WIS = WKY

72
Belichard,
Pruneau and
Rochette
(1988)
France Male 23 weeks Iffa Credo, Lyon, France
WIS: 392 ± 6g
WKY: 387 ± 4g
SHR: 357± 5g
Direct registration of SBP
from catheter in tail artery
WIS: 116 ± 4 mmHg
WKY: 123 ± 5 mmHg
SHR: 190 ± 3 mmHg
Left ventricular
hypertrophy
Ventricular fibrillation
SHR:
↑ Left ventricular hypertrophy
↑ Ventricular fibrillation
↑ Duration of ventricular
fibrillation
WIS = WKY
WIS = WKY
Lariviére et
al. (1989) Canada NI
4,8,12, and
16 weeks
Charles River Laboratories, St-
Constant, Quebek, Canada
4 weeks:
WIS: 77 ± 3g
WKY: 58 ± 3g
SHR: 51 ± 2g
8 weeks:
WIS: 241 ± 6g
WKY: 148 v 6g
SHR: 151 ± 6g
12 weeks:
WIS: 360 v 6g
WKY: 228 ± 5g
SHR: 240 ± 1g
16 weeks:
WIS: 398 v 5g
WKY: 262 ± 11g
SHR: 290 ± 2g
SBP were estimated using
the tail-cuff occlusion and
polygraph method
4 weeks:
WIS: 92 ± 2mmHg
WKY: 96 ± 2mmHg
SHR: 100 ± 2mmHg
8 weeks:
WIS: 108 ± 2mmHg
WKY: 103 ± 2mmHg
SHR: 118 ± 3mmHg
12 weeks:
WIS: 111 ± 2mmHg
WKY: 110 ± 2mmHg
SHR: 138 ± 2mmHg
16 weeks:
WIS: 113± 2mmHg
WKY: 102 ± 5mmHg
SHR: 154 ± 2mmHg
vascular vasopressin
receptors
Vasopressin plasmatic
concentration
Vasopressin binding
sites
SHR:
↑ Efficacy to AVP to contract
mesenteric blood vessels
↑ Responsiveness to
vasopressin
WKY:
↓ Vasopressin plasmatic
concentration
WKY better control
Paré (1989) USA Male 120 to 135
days
Charles-River Breeding
Laboratories, Wilmington,
massachusett-EUA
NI NI Behavioral despair WKY:
↑ Behavioral despair
WKY used as
behavior disorder
model

73
Paré (1989) USA Male NI
Charles-River Breeding
Laboratories, Wilmington,
massachusett-EUA
NI NI Stresse induced ulce
WKY:
↑ Stresse induced ulcer ↑ Inactive
WKY used as
behavior disorder
model
Paré (1989) USA Male 50 - 79 days NI NI NI
Cumulative ulcer
scores
Emotional behavior
Behavioral despair
WKY:
↑ cumulative ulcer scores
↑ Emotional
↑ Behavioral despair
↑ Depressive strain
WKY used as
behavior disorder
model
Garcia et al.
(1989) Canada NI
3 to 15
weeks
Taconic Farms, Germantown, New
York
Show only a
graph
SBP were estimated using
the tail-cuff occlusion and
plethysmography method
Show only a graph
Plasma ANF levels
Heart ANF levels
Density of glomerular
ANF receptors
ANF in the right atrium:
4 weeks:
↑ SHR
8 weeks:
↑ WKY
12 weeks:
↓ SHR
ANF in the left atrium:
4 and 8 weeks:
↑ WIS
12 weeks:
↓ SHR
ANF plasma levels:
4 weeks:
↑ SHR vs WIS
8 and 16 weeks:
↑ SHR
Density of glomerular ANF
receptors :
8, 12 and 16 weeks
↑ WIS and WKY vs. SHR
WIS = WKY
WIS = WKY

74
Rodionov et
al. (1989) Russia Male
8 to 10
months NI NI
SBP
Method was not indicated
WIS: 110 ± 3.4 mmHg
WKY: 117 ± 2.3 mmHg
SHR: 194 ± 4.3 mmHg
Gangliar number of
neurons
resistance to hypoxia
SHR and WKY vs. WIS:
↑ Gangliar number of neurons ↑ resistance to hypoxia
WIS better control
Harris,
Grigor and
Millar (1990)
New
Zeland NI
15 to 20
weeks NI NI NI
Mitogenic response of
VSMC
SHR
↑ Basal thymidina
incorporation
↑ Time course to thymidina
incorporation
WIS = WKY
WIS = WKY
Kawasaki,
Saito and
Takasaki
(1990)
Japan Male 15 weeks NI NI
Direct registration of MAP
from catheter in tail artery
WIS: 104.6 ± 7.5 mmHg
WKY: 97.8 ± 4.3 mmHg
SHR: 166.3 ± 3.2 mmHg
Vasodilator response
SHR
↓ Vasodilator response
WIS = WKY
WIS = WKY
Sontag,
Schälike and
Brattström
(1990)
Germany Male 14 to 16
weeks
WIS- Versuchstierzucht
Schönwalde, Germany
WKY and SHR- Central istitute of
Cardiovasular reasearch, Germany
250 - 230g
Direct registration of MAP
from catheter in femoral
artery WIS: 104.6 ±
7.5 mmHg
WKY: 97.8 ± 4.3 mmHg
SHR: 166.3 ± 3.2 mmHg
Effect of vasopressin
injection into the STN
SHR:
↑ Interbeat interval
WKY and WIS:
↑ Interbeat interval
↓ SBP
WIS = WKY
WIS = WKY
Stein et al.
(1990)
South
Africa Male NI NI 250 - 230g NI
Distribution of Atrial
Dense Granules
SHR:
↓ Electron-dense granules
↓ Granule area
WIS vs. WKY and SHR:
↑ Large granules
Suggests using both

75
Alexander et
al. (1990) USA NI NI NI NI
SBP were estimated using
the tail-cuff occlusion and
plethysmography method
WIS and WKY: <130mmHg
SHR: >160mmHg
Aidification of VSMC
WKY:
↓ Na+ dependent alkalinization
WKY better control
Morton et al.
(1990) Escotland Male 3 weeks
Harlan Laboratories, Bicester,
England
WIS: 54.4 ± 7.7g
WKY: 49.7 ±
4.1g
SHR: 50.8 ± 6.1g
Direct registration of intra
arterial blood pressure from
catheter in carotid artery
WIS: 104.6 ± 7.5 mmHg
WKY: 81.1 ± 8.7 mmHg
SHR: 80.1 ± 6.3 mmHg
Cardiac hypertrophy
Vessel morphology
SHR: ↑Cardiac hypertrophy ↑ Vascular protein in mesnteric arterires WIS = WKY
WIS = WKY
Dumont,
Sabourin and
Lamaire
(1990)
Canada Male 4, 8, 12 and
16 weeks
Charles River Laboratories, St-
Constant, Quebek, Canada NI NI Cardiac Dyn-A levels
SHR vs. WKY:
↑ Dyn-A levels
WIS = WKY
WIS = WKY
Schini, Kim
and
Vanhoutte
(1991)
South
Korea Male NI NI
WIS and WKY:
200 - 350g
SHR: 200 - 300g
SBP
Method was not indicated
WIS: NI
WKY: NI
SHR: 201 ± 5.4 mmHg
Influence of the
endhotelium on the
ontractions evoked by
ET-1 and ET-3 in
arteries
SHR:
↑ endothelium depressed
contractions evokd by ET-1 and
ET-3
WIS = WKY
WIS = WKY

76
Widimský et
al. (1991) Canada Male 4 to 9 weeks
WIS- Charles River Laboratories,
St-Constant, Quebek, Canada
WKY and SHR: Taconic Farms,
Germantown, New York- USA
WIS: 71 - 309g
WKY: 70 - 281g
SHR: 65 - 244g
SBP were estimated using
the tail-cuff occlusion and
plethysmography method
shown only a graph
Effects of high salt
diet in
Plasma ANF levels
Plasma renin activity
Plasma aldosterone
SHR: ↓ Sodium excretion ↑ANC levels WIS vs. WKY: ↓SBP WIS = WKY
WIS = WKY
Pollock and
Arendshorst
(1991)
USA Male 10 to 12
weeks
WIS- Chapel Hill Breeding
Colonies, North Carolina- USA
WKY and SHR- National institutes
of Health stock- USA
WIS: 234 ± 11g
WKY: 246 ± 8g
SHR: 232 ± 7g
Direct registration of intra
arterial blood pressure from
catheter in femoral artery
WIS: 130 ± 6 mmHg
WKY: 126 ± 6 mmHg
SHR: 151 ± 6 mmHg
Renal vascular
resistance
SHR vs WKY:
↑ Renal vascular resistance
WIS = WKY
WIS = WKY
Boylan, Liew
and Feig
(1991)
USA NI 6 - 21 weeks University of Connecticut School
of Medicine, Farmington, USA NI
SBP
Method was not indicated
show only a graph
erythroid cell volume
number regulate the
hematocrit
erythroid cell count
mean cell volume
WIS vs. WKY:
↑ SBP
WIS, WKY and SHR:
↑ Progressive increased of
Erythroid cell count
21 weeks:
SHR:
↑ Erythroid cell count
13 weeks:
SHR:
↓ Mean cell volume
WIS = WKY
WIS = WKY

77
Schiffrin et
al. (1992) Canada NI
4, 7, 8, 12
and 16 weeks
WIS- Charles River, St Constant,
Quebec, Canada
WKY and SHR- Taconic Farms,
Germantown,
New York, USA
4 weeks:
WIS: 82 ±
2mmHg
WKY: 86 ±
2mmHg
SHR: 84 ±
2mmHg
8 weeks:
WIS: 107 ±
2mmHg
WKY: 102 ±
2mmHg
SHR: 120 ±
2mmHg
12 weeks:
WIS: 105 ±
2mmHg
WKY: 109 ±
2mmHg
SHR: 147 ±
2mmHg
16 weeks:
WIS: 108 ±
1mmHg
WKY: 102 ±
2mmHg
SHR: 159 ±
2mmHg
SBP were estimated using
the tail-cuff occlusion and
plethysmography method
4 weeks:
WIS:
WKY:
SHR:
7 weeks:
WIS:
WKY:
SHR:
8 weeks:
WIS:
WKY:
SHR:
12 weeks:
WIS:
WKY:
SHR:
16 weeks:
WIS:
WKY:
SHR:
Plasma ANF
concentration
Relaxation of blood
vessels induced by
ANF
Plasma ANF concentration
8 weeks:
↑ SHR vs. WKY
12 and 16 weeks:
↑ WIS
Relaxation of blood vessels
induced by ANF
4, 8 and 12 weeks
↓ SHR vs, WKY
WIS = WKY
WIS = WKY

78
Saltzman,
Delano and
Schmid-
Schönbein
(1992)
USA NI 15 - 16
weeks
Charles-River Breeding
Laboratories, Wilmington
massachusett- USA
NI
Direct registration of MAP
from catheter in femoral
artery
WIS: 118 ± 8 mmHg
WKY: 120 ± 9 mmHg
SHR: 160 ± 8 mmHg
Adrenergic
Innervation of
Arterioles in
spinotrapezius muscle
SHR vs. WKY:
↑ Lenght per area (proximal
supply artery, arcade areteriole,
thoradorsal artery)
SHR vs. WIS:
↑ Lenght per area (,thoradorsal
artery)
WIS = WKY
WIS = WKY
Tabrizchi and
Triggle
(1992)
Canada Male 12 - 13
weeks NI NI
Direct registration of SBP
from catheter in iliac artery
WIS: 125 ± 3 mmHg
WKY: 112 ± 2 mmHg
SHR: 181 ± 6 mmHg
vascular sensitivity to
L-arginine derived NO
Response to L-
arginine inhibitor
WIS, SHR and WKY:
↑ Blood pressure after L-
arginine inhibitor action
WKY and SHR vs. WIS:
↓ Sustained blood pressure after
L-arginine infusion
WKY better control
Feres et al.
(1992) Brazil NI 20 weeks NI
WIS: 198 ± 3g
WKY: 220 ± 7g
SHR: 200 ± 5g
SBP were estimated using
the tail-cuff occlusion and
plethysmography method
Basal values are not show
Effect of vitamin D3
on duodenum smooth
muscle relaxation
Contraction of VSMC
after bradykinin action
SHR:
↑ VSMC contraction after
bradykinin action
D3 vitamin supplementation:
SHR:
↑ Relaxation of VSMC
WIS = WKY
WIS = WKY
Astarie et al.
(1992) France NI 4 days Le Genest-Saint-Isle, France NI NI
pH in cardiomyocytes
Heart/weight ratio
SHR:
↑ Heart/weight ratio ↑ pH after contractile stimulus WIS = WKY
WIS = WKY

79
Magee and
Schofield
(1992)
USA NI 16 - 19
weeks
Harlan Sprague Dawley,
Indianapolis- USA NI NI
Simpathetic
ganglionic transmition
SHR:
↑ sympathetic output post-
ganglia
WIS = W KY
WIS = WKY
Mamuya,
Chobabnan
and Brecher
(1992)
USA Male
6 weeks
10 weeks
24 weeks
40 weeks
Charles-River Breeding
Laboratories, Burlington,
Massachusetts, USA
Taconic Farms, Germantown, New
York- USA
NI
SBP were estimated using
the tail-cuff occlusion and a
photoelectric cell detector
method
6 weeks
NI
10 weeks
WIS: 108 ± 4 mmHg
WKY: NI
SHR: 165 ± 5 mmHg
24 weeks
WIS: NI
WKY: 113 ± 6 mmHg
SHR: 177 ± 9 mmHg
40 weeks
WIS: 109 ± 6 mmHg
WKY: 136 ± 12 mmHg
SHR: 185 ± 12 mmHg
Age-Related Changes
in fibronectin
Expression
WIS and WKY vs. SHR:
↓ Fibronectin with aging
WIS = WKY
WIS = WKY
Tremblay
and Hamet
(1993)
Canada Male NI
Taconic Farms, Germantown, New
York- USA
Charles River, St-Constant,
Quebek, Canada
Harlan Sprague Dawley,
Indianapolis, USA
NI NI
cGMP production
after ANP incubation
Genetic heterogeneity
of differences
commercial sources
Guanylate Cyclase
Activity
SHR
↑ cGMP production after ANP
incubation
↑ Genetic heterogeneity of
differentes commercial sources
↑ Guanylate Cyclase Activity
WIS = WKY
WIS = WKY

80
Turrin,
Santos and
Veiga (1993)
Brazil Femele 11 - 13
weeks
Paulist school of medicine, São
Paulo, Brazil 180 - 210g
SBP were estimated using
the tail-cuff occlusion and
plethysmography method
WIS and WKY: 90 -
120mmHg
SHR: 150 - 200mmHg
Lung capacity of ANP
generating
Plasma ANP
WKY vs. WIS:
↑ Lung ANP
SHR vs. WIS:
↑ Plasma ANP
WIS better control
Van Liew,
Zamlauski-
Tucker and
Feld (1993)
USA Male
WIS- 4
months
WKY- 3
months
SHR- 17
months
WIS- Rockland, Gilbertsville,
Pennsylvania-USA
WKY and SHR- Harlan Sprague
Dawley, Indianapolis- USA
NI NI
endogenous creatinine
chromagen clearances
glomerular filtration
rate
WIS = WKY = SHR WIS = WKY
Klee et al.
(1993) USA NI
16 - 18
weeks Mollegaard, Skensved, Denmark, 330 - 380g
DBP were estimated using
the tail-cuff occlusion and
plethysmography method
WIS: 92 ± 8 mmHg
WKY: 83 ± 7 mmHg
SHR: 117 ± 5 mmHg
Arterial platelet count
SHR:
↓ Arterial platelet count
WIS = WKY
WIS = WKY
Sagvolden,
Pettersen and
Larsen
(1993)
Norway Male NI Mollegaard, Skensved, Denmark, NI NI Activity pattern
Latency time response
SHR:
↑ Activity
↑ Latency time response
WIS = WKY
WIS = WKY
Huang and
Koller (1993) USA Male 12 weeks NI NI
SBP were estimated using
the tail-cuff occlusion and
plethysmography method
WIS: 103.9 ± 3.0 mmHg
WKY: 119.1 ± 7.8 mmHg
SHR: 194.9 ± 3.0 mmHg
Myogenic Arteriolar
Constriction
SHR: ↓ Diameter arterioles ↑ Contractile arterioles WIS = WKY
WIS = WKY

81
Brooksby,
Levi e Jones
(1993)
England Male 16 weeks
WIS- University of Bristol,
University Walk, Bristol- England
WKY and SHR- Charles River
Breeding Laboratories, Margate,
USA
NI NI
contractility and
morphology of
cardiomyocytes
SHR:
↑ Large cardiomyocyte
↑ amplitude of the Cai transient
↑ prolongation of the action
potential
↑ greater myofilament
sensitivity to
calcium
WIS = WKY
WIS = WKY
Magnusson
and
Meyerson
(1993)
Sweden Male 18 - 19
weeks NI NI NI
Basal estimulated
vasopressin release
SHR:
↑ Basal vasopressin release
↑ Stimulated release of
vasopressin
WIS = WKY
WIS = WKY
McLellan et
al. (1993) Escotland NI 11 weeks
Charles River Breeding
Laboratories, Margate- USA
WIS: 288.1 ±
3.4g
WKY: 255.3 ±
3.5g
SHR: 238.3 ±
6.4g
SBP were estimated using
the tail-cuff occlusion and
plethysmography method
WIS: 155.3 ± 3.8 mmHg
WKY: 142.2 ± 3.2 mmHg
SHR: 212.9 ± 3.5 mmHg
Plasma membrana
resposiviness to
isoproterenol
SHR vs. WKY:
↓ Plasma membrana
resposiviness to isoproterenol
WIS = WKY
WIS = WKY
Morano et al.
(1993) Germany NI NI
WIS and WKY- NI
SHR- Savo-Ivanovas, Kiss Leg,
Germany
WIS: 261 ± 11g
WKY: 186 ± 3g
SHR: 250 ± 4g
SBP were estimated using
the tail-cuff occlusion and
plethysmography method
WIS: 96.4 ± 4 mmHg
WKY: 117.9 ± 2 mmHg
SHR: 172.9 ± 4 mmHg
Myosin heavy chain
expression in left
ventricle
SHR:
↑ Heart weight
↓ α-MHC
↓ Adenylate cyclase
WIS = WKY
WIS = WKY
Perez, Petroff
and Mattiazzi
(1993)
Argentina Male 6 months
WIS- NI
WKY and SHR- Charles-River
Breeding Laboratories,
Wilmington massachusett- USA
WIS: 332.19 ±
10.53g
WKY: 292.79 ±
6.33g
SHR: 268.91 ±
3.76g
SBP were estimated using
the tail-cuff occlusion and
plethysmography method
WIS: 126.25 ± 2.28 mmHg
WKY: 129.43 ± 1.8 mmHg
SHR: 194.19 ± 3.69 mmHg
rest-dependent
changes in contractile
parameters of heart
excitation- contraction
coupling of the
myocardium.
SHR:
↓ rested-state contractions
↓ rested potentiation
↑ Heart/body weight ratio
WIS = WKY
WIS = WKY

82
Touyz,
Tolloczko
and Schiffrin
(1994)
Canada Male 3, 9 and 17
weeks
WIS- Charles River, St-Constant,
Quebec, Canada
WKY and SHR- Taconic Farms,
Germantown, New York- USA
3 weeks
WIS: 57 ± 7g
WKY: 74 ± 6g
SHR: 29 ± 4g
9 weeks
WIS: 299 ± 12g
WKY: 273 ± 24g
SHR: 215 ± 4g
17 weeks
WIS: 505 ± 22g
WKY: 470 ± 17g
SHR: 326 ± 10g
SBP were estimated using
the tail-cuff occlusion and a
photoelectric cell detector
3 weeks
WIS: 102 ± 6mmHg
WKY: 102 ± 7mmHg
SHR: 123 ± 9mmHg
9 weeks
WIS: 112 ± 7mmHg
WKY: 107 ± 8mmHg
SHR: 154 ± 15 mmHg
17 weeks
WIS: 121 ± 8 mmHg
WKY: 108 ± 16mmHg
SHR: 204 ± 12mmHg
Effect of ANG-2 and
ET-1 on calcium
response to mesenteric
VSMC
3 weeks
SHR:
↑ Changes induced by ANG-2
9 weeks
SHR:
↑ Basal cytosolic free calcium
concentration
↑ Changes induced by ANG-2
17 weeks
SHR:
↑ ET-1 estimulated cytosolic
free calcium concentration
WIS = WKY
WIS = WKY
Magee and
Schofield
(1994)
USA NI 16 - 19
weeks NI NI
SBP were estimated using
the tail-cuff occlusion and
plethysmography method
WIS and WKY < 120mmHg
SHR: > 170mmHg
changes in ganglionic
transmission
SHR:
↑ Excitatory postsynaptic
potential
↑ Supramaximal stimuli
↑ increased release of
transmitter from preganglionic
neurons
WIS = WKY
WIS = WKY

83
Silva et al.
(1994) Brazil Femele
20 - 30
weeks
WIS- Paulist school of medicine,
São Paulo, Brazil
WKY and SHR- National
Institutes of Health, Bethesda,
Maryland, USA
WIS: 190 - 215g
WKY: 210 -
230g
SHR: 170 - 190g
NI
Celular Na+ content
cell membrane
potential
intracellular potassium
activity
intracellular
sodium activity
Ca2+ uptake
Tension
measurements in
response to K+
SHR:
↑ K+ activity
↓ Na+ activity
WIS vs. WKY and SHR:
↑ contractile responses to K+
↓ cell membrane potentia
↑ Ca2+ uptake
WKY vs. SHR:
↓ cell membrane potentia
WIS better control
David-
Dufilho et al
(1994)
France Male 12 - 14
weeks NI
WIS: 293 ± 8g
WKY: 296 ± 5g
SHR: 281 ± 5g
Direct registration of SBP
from catheter in aortic artery
WIS: 139 ± 4mmHg
WKY: 137 ± 3mmHg
SHR: 184 ± 3mmHg
corpuscular
hemoglobin
concentration
Ca2+ concentration
Ca2+ uptake
SHR:
↑ Ca2+ concentration WIS = WKY
Rowland,
Melvin and
Smith (1995)
USA NI 2 months
WIS- Charles River Breeding
Laboratories WKY and SHR-
Harlan Sprague Dawley,
Indianapolis- USA
NI NI
Fos-like
immunoreactivity
after Ang-2 infusion
in brain
number of FLI cells
SHR:
↑ number of FLI cells n
hypothalamic nucleus and
supraoptic nucleus
WIS:
↑ Fos-like immunoreactivity
after Ang-2 infusion in
hypothalamic nucleus and
supraoptic nucleus
WIS = WKY (subfornical organ
and postrema/medial nucleus of
the solitary tract)
Not conclusive
Dumont and
Lamaire
(1995)
Canada NI 4, 8 and 16
weeks
Charles River, St-Constant,
Quebec, Canada NI NI
Norepinephrine
uptake after Dyn-A
estimulus
8 weeks:
SHR:
↓Norepinephrine uptake after Dyn-A estimulus WIS = WKY
WIS = WKY

84
Grisk et al.
(1995) Germany Male
19 - 24
weeks
Charles River Wiga GmbH,
Sulzfeld, Germany
WIS: 521 ± 8g
WKY: 334 ± 12g
SHR: 359 ± 8g
MAP were estimated using
the tail-cuff occlusion and
plethysmography method
WIS: 105 ± 3 mmHg
WKY: 72 ± 4 mmHg
SHR: 140 ± 8 mmHg
breathing regulation
arterial chemoreceptor
reflex
function
SHR:
↓ length of the inspiratory time
WIS:
↓ Minute ventilation
↓ Inspiratory flow
WKY vs. SHR:
↑ Breathing rate
↓ Tidal volume
WKY better control
Bian,
Richard and
Bukoski
(1995)
USA Male 12 - 15
weeks
Charles-River Breeding
Laboratories, Wilmington
massachusett- USA
WIS:
WKY:
SHR:
SBP was estimated usin the
indirect pneumatic tail-cuff
technique
WIS: 126 ± 2.3 mmHg
WKY: 117 ± 1.4 mmHg
SHR: 157 ± 1.7 mmHg
Vessels measurements
SHR:
↑ saturating Ca2+
WIS vs. WKY:
↑ wall-to-lumen ratio
↑ wall-lumen ratio
WKY better control
Touyz,
Tolloczko
and Schiffrin
(1995)
Canada NI 3, 9 and 17
weeks
WIS- Charles River. St. Constant,
Quebec,
Canada
WKY and SHR- Taconic Farms
Inc. Germantown, New York-
USA
3 weeks:
WIS: 58 ± 1g
WKY: 78 ± 0.8g
SHR: 37 ± 0.8g
9 weeks:
WIS: 300 ± 4g
WKY: 277 ± 5g
SHR: 221 ± 2g
17 weeks:
WIS: 480 ± 3g
WKY: 497 ± 6g
SHR: 329 ± 2g
SBP were estimated using
the tail-cuff occlusion and
plethysmography method
3 weeks:
WIS: 103 ± 2 mmHg
WKY: 101 ± 2 mmHg
SHR: 123 ± 3 mmHg
9 weeks:
WIS: 110 ± 2 mmHg
WKY: 106 ± 3 mmHg
SHR: 221 ± 2 mmHg
17 weeks:
WIS: 107 ± 2 mmHg
WKY: 116 ± 3 mmHg
SHR: 204 ± 3 mmHg
Ca2+ in VSMC
Ang-2 induced Ca2+
concentration
Insulin+Ang-2
induced Ca2+
concentration
9 weeks:
SHR:
↑ Ang-2 induced Ca2+
concentration
↑ Insulin+Ang-2 induced Ca2+
concentration
17 weeks:
SHR:
↑ Ang-2 induced Ca2+
concentration
↑ Insulin+Ang-2 induced Ca2+
concentration
WIS = WKY
WIS = WKY
Feng and
Arendshorst
(1996)
USA NI 7 - 9 weeks Chapel Hill Breeding Colonies,
North Carolina- USA NI
Direct registration of SBP
from catheter in carotid
aortic artery
WIS: NI
WKY: 124 ± 11 mmHg
SHR: 147 ± 7 mmHg
Vascular reactivity to
vasopressin
Renal vascular
resistance
SHR:
↑ Renal vasoconstriction after
vasopressin infusion
↑ Vascular reactivity
WIS = WKY
WIS = WKY

85
Findlay
(1996) England Male NI NI NI NI
Effect of losartan and
ANG-2 blocker on
water and NaCI intake
induced by sodium
depletion
SHR:
↑intakes of saline and water
after drugs estimulus
↑ reduced intakes of saline and
water after drugs estimulus
WIS = WKY
WIS = WKY
Blume et al.
(1997) Germany NI 12 weeks
WIS- Dr Karl Thomae GmbH-
Germany WKY and
SHR- Mollegaard Breeding Farm,
Skensved, Denmark
WIS: 280 - 300g
WKY: 280 -
300g
SHR: 240 260g
Direct registration of SBP
from catheter in carotid
aortic artery
WIS: 90±8 mmHg
WKY: 93±7 mmHg
SHR:165±11 mmHg
Ang II–induced
expression of c-Fos c-
Jun expression
SHR:
↑Ang II–induced expression of
c-Fos
↑ c-Jun expression
WIS = WKY
WIS = WKY
Gattu et al.
(1997) USA Male 12 weeks
WIS- Harlan Sprague Dawley,
Indianapolis- USA
WKY and SHR- Taconic Farms,
Germantown, New York- USA
NI
SBP
Method was not indicating
WIS: 127 ± 9.04 mmHg
WKY: 129 ± 6.25 mmHg
SHR: 192 ± 5.2 mmHg
learning abilities
memory abilities
nicotinic receptors
expression
density of brain
nicotinic receptors
SHR:
↓ learning abilities
↓ memory abilities
SHR vs. WIS:
↓ density of brain nicotinic receptors SHR vs. WKY: ↓ nicotinic receptors expression WIS = WKY
WIS = WKY
Touyz and
Schiffrin
(1997)
Canada Male 17 weeks
WIS- Charles River, St Constant,
Quebec, Canada
WKY and SHR- Taconic Farms,
Germantown, New York, USA
WIS: 444 ± 2.5g
WKY: 478 ±
7.8g
SHR: 318 ± 2.3g
SBP were estimated using
the tail-cuff occlusion and
photo-electric pulse sensor
method
WIS: 106 ± 3.6 mmHg
WKY: 111 ± 3.1 mmHg
SHR: 194 ± 2.5 mmHg
Ca2+ concentration in
mesenteric arteries
Ca2+ concentration in
mesenteric arteries
after Ang-2 stimulated
SHR:
↑ Ca2+ concentration WIS, WKY and SHR: ↑ Ca2+ concentration after Ang-2 estimulated WIS = WKY
WIS = WKY

86
Preuss et al.
(1998) USA Male 6 weeks
Taconic Farms, Germantown, New
York- USA
Show only a
graph
SBP were estimated using
the tail-cuff occlusion and
plethysmography method
Show only a graph
high sucrose ingestion
on SBP
WIS, WKY and SHR:
↑ SBP after high sucrose ingestion WIS = WKY
WIS = WKY
Feres et al.
(1988) Brazil Femele
20 - 30
weeks
WIS- Wistar Institute,
Philadelphia, USA
WKY and SHR- National
Institutes of Health,
Bethesda, USA
200 - 220g NI RMP of arteries
SHR:
↓ Sensitivity or density of α2-
adrenoreceptors
less negative membrane
potential.
WIS=WKY
WIS = WKY
Tanigawa,
Inoue and
Tamura
(1999)
Japan Male 10 weeks
WIS- Shizuoka Laboratory Center,
Hamamatsu, Japan
WKY and SHR- Charles River
Laboratories, Atsugi, Japan
WIS: 312 ± 3g
WKY: 293 ± 3g
SHR: 255 ± 3g
SBP were estimated using
the tail-cuff occlusion and
plethysmography method
WIS: NI
WKY: 163 ± 4 mmHg
SHR: 220 ± 7 mmHg
insulin secretory
activity of pancreas
SHR:
↑ Nonfasting plasma glucose ↑ Insulin levels ↑ insulin secretory activity of pancreas WIS = WKY
WIS = WKY
Kitami et al.
(1999) Japan NI 12 weeks
Charles-River Breeding
Laboratories, Wilmington
massachusett- USA
NI NI VSMC hypertrophy
SHR:
↑ PDGR-αR expression WKY and SHR vs. WIS: ↑ C/EBP probe expression
WIS better control
Dalle Lucca
et al. (2000) Brazil Male NI
Wistar Institute, Philadelphia-
USA 300 - 30g
MAP were estimated using
the tail-cuff occlusion and
plethysmography method
WIS: 114 ± 24 mmHg
WKY: 128 ± 24 mmHg
SHR: 194 ± 18 mmHg
morphometric analysis
of
injured arteries
SHR:
↑ medial hypertrophy ↑ neointima formation WIS = WKY
WIS = WKY

87
Gros et al.
(2000) USA Male 10 weeks
Harlan Sprague Dawley,
Indianapolis- USA 100 - 350g
MAP were estimated using
the tail-cuff occlusion and
plethysmography method
WIS and WKY: <120mmHg
SHR: >125mmHg
isoproterenol
relaxation
SHR:
↑ isoproterenol relaxation WIS = WKY
WIS = WKY
Hancock and
Lindsay
(2000)
USA Male NI Harlan Sprague Dawley,
Indianapolis- USA 300 - 400g
BP were estimated using the
tail-cuff occlusion and
plethysmography method
WIS: 116 ± 10 mmHg
WKY: 92 ± 15 mmHg
SHR: 154 ± 6 mmHg
ganglionic responses
after Intravenous
injection of substance
P
SHR:
↑ Renal nerve firing
↑ Blood pressure increased
WIS = WKY
WIS = WKY
Kawasaki et
al. (2000) Japan Male 15 weeks
Charles River Laboratories,
Shizuoka,
Japan
NI
Direct registration of MAP
from catheter in carotid
aortic artery
WIS: 95.5 ± 2.7 mmHg
WKY: 97.8 ± 1.8 mmHg
SHR:187.7 ± 1.5 mmHg
Baroreflex function
after Spinal Cord
Stimulation
SHR:
↑CGRP mRNA Level
WIS and WKY:
↑ BP decreased
WIS = WKY
WIS = WKY
Casellas et al.
(2000) USA Male 12 weeks Iffa Credo, Lyon, France
WIS: 424 ± 9g
WKY: 266 ± 6g
SHR: 329 ± 7g
NI
adrenergic innervation
along preglomerular
vascular
WIS = WKY = SHR WIS = WKY
Sato et al.
(2001) Brazil Male
14 - 16
weeks NI 250 - 300g
Direct registration of MAP
from catheter in femoral
artery
Show only a graph
effects of acute of
lesion commissural
nucleus of the solitary
tract on basal mean
arterial pressure and
after lesion commissural
nucleus of the solitary trac
SHR:
↓ SBP
↓ chemoreceptor reflex
↑ Baroreceptor Reflex
WIS = WKY

88
the baroreceptor and
chemoreceptor reflex
WIS and WKY:
↓ bradycardic responses
WIS = WKY
Ibarra,
López-
Guerrero and
Villalobos-
Molina
(2001)
Mexico Male 6 months NI NI
SBP were estimated using
the tail-cuff occlusion and
plethysmography method
WIS: 125 ± 20 mmHg
WKY: 135 ± 10 mmHg
SHR: 192 ± 10 mmHg
Contraction of aortic
and tail arterial rings
SHR:
↑ Contraction induced by norepinephrine SHR and WKY vs. WIS: ↑ Contraction induced by chloroethylclonidine
WIS better control
Fox et al.
(2002) USA Male 20 - 24 days
Harlan Sprague Dawley,
Indianapolis- USA 35 - 50g NI Pups behavior
SHR:
↑ Impusivity rate
↓ Rate of learning WIS = WKY
WIS = WKY
Borges et al.
(2002) Brazil Femele
20 - 30
weeks
WIS- Wistar Institute,
Philadelphia- USA WKY and
SHR- National Institutes of Health,
Bethesda, Maryland, USA
200 - 220 g
SBP were estimated using
the tail-cuff occlusion and
plethysmography method
WIS: 130 ± 6 mmHg
WKY: 135 ± 7 mmHg
SHR: 160 ± 5 mmHg
mechanical responses
after bradykinin
estimulus in VSMC
WIS vs. WKY:
↑ Concentration /response
curves
WIS better control

89
Aiello et al.
(2004) Argentina Male 4 - 5 months
WIS- school of medical sciences,
Argentina WKY and SHR-
Charles-River Breeding
Laboratories, Wilmington
massachusett- USA
WIS: 324.9 ±
9.2g
WKY: 305.3 ±
5.1g
SHR: 314.5 ±
4.5g
SBP were estimated using
the tail-cuff occlusion and
plethysmography method
WIS: 118.5 ± 1.0 mmHg
WKY: 119.8 ± 1.6 mmHg
SHR: 175.8 ± 1.8 mmHg
Myocardial
hypertrophy
SHR:
↑ LVM
↑ LVM/BM
↓fractional shortening
WKY vs. WIS:
↑ LVM
↑ LVM/BM
↓fractional shortening
SHR and WKY vs, WIS;
↑ CSA
WIS better control
Wickens et
al. (2004)
New
Zeland NI
30 - 32
weeks
WIS- University of Otago
WKY and SHR-Animal Resources
Centre, Western- Australia
NI
SBP were estimated using
the tail-cuff occlusion and
plethysmography method
Show only a graph
behaviour disorders
SHR:
↑ Lever presser
↑ abnormal sensitivity
WIS = WKY
WIS = WKY
Shcherbin
and Tsyrlin
(2004)
Russia Male 19 - 24
weeks NI 280 - 310g
Direct registration of MAP
from catheter in carotid
femoral artery
WIS: 117 ± 7.1 mmHg
WKY: 123 ± 2.1 mmHg
SHR: 164 ± 5.7 mmHg
Somatosympathetic
Reflex
SHR:
↑ durations and amplitudes of
sympathetic reflex discharges
WIS = WKY
WIS = WKY
Bueno et al.
(2004) Brazil NI 12 weeks NI NI
SBP were estimated using
the tail-cuff occlusion and
plethysmography method
WIS:108.6 ± 8.74 mmHg
WKY: NI
SHR: 150 - 180 mmHg
Expression of 90-kd
isoform ACE
SHR:
↑ Renal artery 90-kd isoform
ACE expression
WIS = WKY
WIS = WKY
Van den
Bergh et al.
(2006)
Netherlands Male and
famale
30 - 100
days. Harlan Laboratories, Netherlands NI NI
activity, attention and
impulse control
SHR vs. WKY:
↑ Hyperactivity
↑ active in the open field
SHR vs. WIS:
↓ Impulsive WIS = WKY
WIS = WKY

90
Kubo and
Hagiwara
(2006)
Japan Male 15 - 16
weeks
WIS- NI
WKY and SHR- Disease Model
Cooperative Research Association,
Kyoto, Japan
WIS:
WKY:
SHR:
SBP were estimated using
the tail-cuff occlusion and
plethysmography method
WIS:101 ± 2 mmHg
WKY: 114 ± 2 mmHg
SHR: 169 ± 2 mmHg
intracerebroventricular
injection of
hypertonic saline on
the neural activity
SHR:
↑firing rate of AHA ANG-2 sensitive neurons ↓ threshold sodium concentration WIS = WKY
WIS = WKY
Sakamoto et
al. (2006) Japan Male
8, 12, 16 and
20 weeks NI NI NI
sensitivity to
glibenclamide
(antidiabetic
agent)
Before glibenclamide
treatment: SHR
and WKY:
↑ Plasma glucose levels
12 - 20 weeks
WKY:
↑ Resistance to glibenclamide
administration
WIS better control
Bizot et al.
(2007) France Male 70 -95 days
Centre d’Elevage René Janvier,
France
WIS: 296 ± 7g
WKY: 248 ± 7g
SHR: 201 ± 2g
NI impulsive behaviour
SHR:
↑ number of choices of the
large reward
↓ number of choices of the
large-but-delayed reward
↑ Impulsivity
WIS = WKY
WIS = WKY
Orduna,
Hong and
Bouzas
(2007)
Mexico Male 60 days
WIS- Harlan, Mexico City,
Mexico WKY and
SHR- Charles-River Breeding
Laboratories, Wilmington
massachusett- USA
190 - 250g
MAP were estimated using
the tail-cuff occlusion and
plethysmography method
WIS: 102 ± 4.51 mmHg
WKY: 124 ± 5.26 mmHg
SHR: 175 ± 8.33 mmHg
timing behavior WIS = WKY = SHR WIS = WKY

91
Wheal et al.
(2007) England Male
SHR: ~20
weeks
WIS and SHR- Charles River
Breeding Laboratories, United
Kingdom WKY-
Harlan Laboratories, United
Kingdom
WIS: 350 - 450g
WKY and SHR:
~300g
Direct registration of MAP
from catheter in tail artery
WIS: 111 ± 2 mmHg
WKY: 120 ± 3 mmHg
SHR: 176 ± 5mmHg
Hemodynamics
effects of
cannabinoids
Before drugs administration
SHR:
↑ SBP
↓ Vascular condutance
anandamide effect
SHR:
↑ Sustained bradycardia
↓ SBP
↑Renal and mesenteric
vasocontriction
AM 251 effect
SHR:
↑ SBP
WIN 55212-2 effect
↑ SBP
↓ Vascular condutance
WIS = WKY
WIS = WKY
Ribeiro,
Afonso and
Macedo
(2007)
Portugal Male 9 weeks Charles River Breeding
Laboratories, Spain 250 - 300g
Direct registration of SBP
from catheter in femoral
atery
WIS: 118.1 ± 3.7 mmHg
WKY: 106.7 ± 2.5 mmHg
SHR: 159.2 ± 3.7mmHg
insulin action
SHR vs. WIS:
↑ Insulin resistant
↓ Insulin action in hepatic parasympathetic nerves ↓ insulin sensitivity indexes WKY vs. WIS: ↓ Insulin action in hepatic parasympathetic nerves ↓ insulin sensitivity indexes
WIS better control
Orduna et al.
(2008) Mexico Male 60 days
WIS- Harlan, Mexico City,
Mexico WKY and
SHR- Charles-River Breeding
Laboratories, Wilmington
massachusett- USA
WIS: 281.3g
WKY: 253.3g
SHR: 228g
MAP were estimated using
the tail-cuff occlusion and
plethysmography method
WIS: 108.33 ± 2.98 mmHg
WKY: 109.17 ± 2.57 mmHg
SHR: 143.92 ± 9.95 mmHg
timing behavior
SHR:
↑ peak response rate
WIS = WKY
WIS = WKY

92
Ordunas,
Valencia-
Torres and
Bouzas
(2009)
Mexico Male 90 days
WIS- Harlan, Mexico City,
Mexico WKY and
SHR- Charles-River Breeding
Laboratories, Wilmington
massachusett- USA
230 - 345g NI Timing behavior
SHR
↓ reinforcers earned
↑ percentage of efficiency
↓ response threshold parameter
SHR vs. WKY:
↑ burst ratio
WIS = WKY
WIS = WKY
Sandow,
Gzik and Lee
(2009)
Canada Male NI
WIS- NI
SHR and WKY- University of
New South Wales, UNSW,
Sidney- Austrália
NI NI
Arterial internal
elastic lamina hole
density and size
WKY vs. WIS:
↑ Arterial internal elastic
lamina hole
↓ rat superior mesenteric
Not conclusive
Oliveira et al.
(2009) Brazil Male
12 - 14
weeks
Wistar Institute, Philadelphia-
USA 290 - 320g NI
lipid reconstructs and
lipid
composition of VSMC
SHR:
↓ Palmitic acid ↑ arachidonic acid WIS and WIS vs. SHR:
↑ Cholesterol levels
WIS = WKY
WIS = WKY
Percy et al.
(2009) Australia Male
3 months and
21 - 24
months
NI
3 months
WIS: 360 ± 16g
WKY: 257 ± 56g
SHR: 262 ± 17g
21 - 24 months:
WIS: 689 ± 53g
WKY: 444 ± 32g
SHR: 392 ± 32g
SBP were estimated using
the tail-cuff occlusion and
plethysmography method 3
months
WIS: 118 ± 3 mmHg
WKY: 133 ± 2 mmHg
SHR: 205 ± 4 mmHg
21 - 24 months:
WIS: 138 ± 4 mmHg
WKY: 148 ± 7 mmHg
SHR: 200 ± 6 mmHg
energy metabolism
and oxidant
handling mechanisms
in chronic kidney
disease
21 - 24 months:
WIS:
↑Visceral and perirenal adipose tissue ↑ Plasmatic lactate dehydrogenase ↑ fibrotic index WIS and SHR vs. WKY: ↑ Apoptosis in tubular epithelium
WKY better control

93
Tran,
DeLano and
Schimd-
Schönbein
(2010)
USA Male 12 - 18
weeks
Charles-River Breeding
Laboratories, Wilmington
massachusett- USA
280 - 350g
Direct registration of MAP
from catheter in femoral
atery
WIS: NI
WKY: 113 ± 4 mmHg
SHR: 164 ± 6 mmHg
Matrix MMP Activity
SHR:
↑ Protease activity
↑ plasma activity
of MMP-2, MMP-9, and MMP-
7 SHR vs. WIS:
↑ plasma activity
of MMP-3
SHR vs. WKY:
↓ plasma activity
of MMP-14
WIS = WKY
WIS = WKY
Dommett and
Rostron
(2011)
England Male NI
WIS and WKY- NI
SHR-Charles River Wiga GmbH,
Sulzfeld, Germany
NI NI air righting reflexes
SHR:
↑ faster movement
↓ height-dependent modulation
WIS and WKY vs. SHR:
↑ tendency to
use a longitudinal movement
WIS = WKY
WIS = WKY
Ibías and
Péllon (2011) Spain Male 12 weeks
Charles River Laboratories, Lyon,
France
WIS: 353g
WKY: 306g
SHR: 277g
NI
levels of acquisition of
schedule-induced
polydipsia
SHR:
↑ drinking
↑ greater cognitive
impulsivity
WKY:
↓ licks and drank per minute WIS vs. SHR: ↑ FT 9-s and FT 15-s schedules
Not conclusive

94
Langen and
Dost (2011) Germany Male 7–8 weeks
Charles River Wiga GmbH,
Sulzfeld, Germany 150–180 g NI dopamine of behavior
SHR:
↑ Activity in open-field arena
after 24h
↑ long-term memory
SHR and WIS vs. WKY:
↑ Activity in open-field arena
fot the first time
↓ anxiety-related behaviour
WIS and WKY vs. SHR:
↑ habituate to a novel
environment
Dopamine effect:
WKY:
↓ Activity
SHR:
↑ Activity
Not conclusive
Castelló-Ruiz
et al. (2011) Spain Male
15 - 17
weeks NI NI
Direct registration of MAP
from catheter in femoral
atery
WIS: 113 ± 4 mmHg
WKY: 111 ± 6 mmHg
SHR: 140 ± 7 mmHg
neuroprotective effect
of nutritional and
pharmacological soy-
derived isoflavones
agains stroke
WKY vs. WIS and SHR:
↓ Cerebral infarct volume
Nutritional and
pharmacological effects:
WIS:
↓ Cerebral infarct volume
WKY better control
Herman et al.
(2011) USA
Male and
famale
WIS- 8 - 10
weeks
WKY and
SHR- 12
weeks
Taconic Farms, Germantown, New
York- USA
Harlan Industries, Indianapolis-
USA
NI NI
Baseline Serum
Cardiac Troponin I
Concentrations
SHR (male):
↑ Cardiac Troponin I
Concentrations
Male vs. female (all strains):
↑ Cardiac Troponin I
Concentrations
WIS = WKY
WIS = WKY

95
Sanada et al.
(2011) Brazil Femele 20 weeks
animal care facility of the
Department of Neurology, School
of Medicine of Ribeirao
Preto
Show only a
graph
SBP were estimated using
the tail-cuff occlusion and
plethysmography method
Show only a graph
Sural nerve
morphology
SHR:
↑ Sural nerve diameter
↑ Myelinated area
WIS = WKY
WIS = WKY
Harvey et al.
(2011) USA Male 25 days
Charles-River Breeding
Laboratories, Wilmington
massachusett- USA
NI NI Methylphenidate
Treatment for ADHD
SHR:
↑ deficit in the acquisition
of learning
Methylphenidate treatment:
SHR:
↑ visual discrimination
WIS = WKY
WIS = WKY
Hill, Herbst
and Sanabria
(2012)
USA Male 24 - 25 days
WIS and SHR- Charles-River
Breeding Laboratories,
Wilmington massachusett- USA
WKY- Harlan Sprague Dawley,
Indianapolis- USA
WIS: 190g
WKY: 127g
SHR: 118g
NI hyperactivity behavior
SHR:
↑ Operant hyperactivity
WIS = WKY
WIS = WKY
Dommett and
Rostron
(2013)
England Male 28 weeks NI Show only a
graph NI
Appetitive and
consummative
responding for liquid
sucrose
SHR:
↑ water intake
↓ time to traverse the runway
↑ velocity
WKY:
↑ Weight gain WIS = WKY
WIS = WKY
Somkuwar et
al. (2013) USA Male 25 - 55 days
WIS- Charles River Laboratories,
Raleigh, NC
WKY and SHR- Charles River
Laboratories, Kingston, New
York- USA
NI NI Methylphenidate
Treatment for ADHD
SHR:
↑ Maximum Velocity in
medial prefrontal cortex
WIS = WKY
WIS = WKY

96
Somkuwar et
al. (2013) USA Male 25 days
WIS- Charles River Laboratories,
Raleigh, NC
WKY and SHR- Charles River
Laboratories, Kingston, New
York- USA
NI NI Atomoxetine
Treatment for ADHD
Baseline:
SHR:
↑ acquired cocaine self-
administration faster
↑ earned cocaine
↑ breakpoints
WIS vs. WKY:
↑ earned cocaine
↑ active lever
Atomoxetine Treatment:
SHR and WKY vs. WIS:
↑ acquired cocaine self-
administration faster
Not conclusive
Umehara et
al. (2013) Japan Male 4 - 7 weeks
Charles River Laboratories.
Yokohama, Japan NI NI Locomotor behavior
SHR:
↑ Horizontal activity
SHR vs. WIS:
↑ Active
Methylphenidate and
venlafaxine infusion:
SHR:
↓ horizontal activity
WIS = WKY
WIS = WKY
Wang,
Thonsen and
Frøkiær
(2013)
Denamark Male 10 - 11
weeks
Mollegaard Breeding Farm,
Skensved, Denmark 200 - 300g
Direct registration of MAP
from catheter in femoral
atery
WIS: 113 ± 4 mmHg
WKY: 115 ± 3 mmHg
SHR: 148 ± 3 mmHg
Renal responses to
acute volume
expansion
SHR vs. WKY:
↑peak Na excretion
↑ Natriuretic response
SHR vs. WIS:
↓ Natriuretic response WIS = WKY
WIS = WKY

97
Harvey et al.
(2013) USA Male 25 - 28 days
Charles-River Breeding
Laboratories, Wilmington
massachusett- USA
NI NI
Performance on a
strategy set shifting
task
WKY and SHR vs. WIS:
↓ trials to learn
↓ latencies to reach criterion
SHR vs. WIS:
↓ trial omissions
WIS better control
Jordan et al.
(2014) USA Male 25 - 55 days
Charles-River Breeding
Laboratories NI NI
Cocaine-seeking
behavior
SHR:
↑ cocaine infusions
↑active lever responses
↑inactive lever responses
↑cocaine-seeking responses
WIS vs. SHR:
↓number of sessions
WIS = WKY
WIS = WKY
Nam et al.
(2014) USA Male 6- 7 weeks
Charles River Laboratories,
Kingston, New York- USA
WIS: 376.0 ±
9.3g
WKY: 254.9 ±
3.8g
SHR: 268.8 ±
3.9g
NI Learned helplessness
and social avoidance
WKY vs. WIS and SHR:
↑ spent time in the avoidance
zone
↑ adrenal glands weights
↑ behavioral inhibition in
anxiogenic environments
↑ immobility levels
WKY used as
behavior disorder
model
Günblatt et
al. (2015) Switzerland
Male and
famale
12 and 28
weeks
Charles River Laboratories,
Kisslegg, Germany NI NI cognitive deficits
SHR:
↓ Morris Water Maze ↑ memory and learning deficits WIS = WKY
WIS = WKY

98
Somkuwar,
Kantak and
Dwoskin
(2015
USA Male 28 - 91 days
Charles River Laboratories,
Raleigh, North Carolina- USA
Charles River Laboratories,
Kingston, New York- USA
NI NI transporter function in
orbitofrontal cortex
SHR:
↑ NE uptake
WIS = WKY
WIS = WKY
Kodavanti et
al. (2015) USA Male
10 - 12
weeks
Charles River Laboratories,
Raleigh, North Carolina- USA NI NI
pulmonary injury
and inflammation
SHR:
↑ Protein levels
↑ Inflammataion
SHR vs. WKY:
↑ numbers in bronchoalveolar
lavage fluid
WIS = WKY
WIS = WKY
Íbias, Pellón
and Sanabria
(2015)
Spain Male 12 weeks Charles River Laboratories. Lyon,
France
WIS: 359 - 384g
WKY: 306 -
361g
SHR: 277 - 302g
NI SIP acquisition
SHR:
↑ Licks/min
↑ drinking episodes
↑ SIP acquisition faster
↑ Operant hyperactivity
WIS = WKY
WIS = WKY
Brace et al.
(2015) England Male
15 - 20
weeks
Harlan Laboratories, Bicester,
England NI NI Auditory responses
SHR:
↓Response to stimulus WIS = WKY

99
intensity ↑ onset
latency
SHR vs. WKY:
↑Vertical activity WKY:
↓ moving less
WIS = WKY
Íbias,
Miguéns and
Pellón (2016)
Spain Male 12 weeks Charles River Laboratories. Lyon,
France
WIS: 359 - 384g
WKY: 306 -
361g
SHR: 277 - 302g
NI Effects of dopamine
on SIP
SHR:
↑ Licks/min ↑ drinking episodes d-amphetamine effect: SHR: ↑ Licks methylphenidate effect: SHR: ↑ Licks SHR vs. WIS: ↑ Entires WIS = WKY
WIS = WKY
Jordan et al.
(2016) USA Male 28 - 77 days Charles River Laboratories
WIS: 356 ± 11g
WKY: 254 ± 5g
SHR: 255 ± 5g
NI
d-amphetamine
treatment to ADHD
acquisition of cocaine
selfadministration
SHR:
↑ acquisition of cocaine
selfadministration faster
↑ number of cocaine infusions
↑ active lever responses
d-amphetamine treatment:
SHR:
↓ postacquisition cocaine
intake WIS = WKY
WIS = WKY

100
Jordan et al.
(2016) USA Male 28 - 77 days Charles River Laboratories NI NI
d-amphetamine
treatment to ADHD
Pro-cognitive effects
cocaine cue reactivity
SHR:
↑ active lever
↑ cocaine infusions
↑ stress vulnerability
SHR and WIS vs. WKY:
↓ Trials
↓ Latencies
SHR and WKY vs. WIS:
↓ reaction time
↑ reaction time variability
d-Amphetamine treatment:
SHR:
↓ latency to criterion
Not conclusive
Kawabe et al.
(2016) USA Male 14 weeks
Charles-River Breeding
Laboratories, Wilmington
massachusett- USA
NI
Direct registration of MAP
from catheter in femoral
atery
WIS: 103.3 ± 2.5 mmHg
WKY: 90.3 ± 2.6 mmHg
SHR: 147.1 ± 2.8 mmHg
Ang-2 receptor
function in the rostral
RVLM
Response to AT2R antagonist
(PD123319):
SHR:
↓ MAP increase
↓ splanchnic nerve activity
Response to L-glutamate:
SHR vs. WKY:
↑ MAP increase
↑ splanchnic nerve activity
WIS = WKY
WIS = WKY

101
Somkuwar et
al. (2016) USA Male 25 - 58 days
WIS- Charles River Laboratories,
Raleigh, North Carolina- USA
WKY and SHR:- Charles River
Laboratories, Kingston, New
York- USA
WIS:
WKY:
SHR:
NI
methylphenidate
treatment to
impulsivity and
hyperactivity in
ADHD
SHR:
↓ percent of responses
reinforced
↓ efficiency
↑ Impulsivity
SHR vs. WKY:
↑ total horizontal beam breaks
WKY vs. WIS:
↓ total horizontal beam breaks
WKY:
↑ Hypoactive
methylphenidate treatment:
SHR:
↑ Hyperactivity redulced
WIS better control
Íbias et al.
(2017) Spain Male 36 weeks
Charles River Laboratories, Lyon,
France
WIS: 343 - 368g
WKY: 310 -
362g
SHR: 299 - 323g
NI
Effect of 6 days of
Methylphenidate
treatment on SIP
SHR:
↑ licking rates
SHR vs. WKY:
↑ Longer dring episode
Methylphenidate treatment:
WKY:
↓ Drink
↓ SIP
WIS:
↓ frequency of licking
Not conclusive
Rostron et al.
(2017) England NI 10 weeks
Charles River Laboratories,
Kisslegg, Germany
WIS: 204 ± 1.8g
WKY: 188 ± 5g
SHR: 132 ± 2.5g
NI learnt behaviour in
ADHD
SHR:
↓ task activity
SHR vs. WKY:
↑ reaction time
WKY and SHR vs. WIS:
Not conclusive

102
WIS- Wistar; WKY- Wistar Kyoto; SHR- Spontaneuously Hypertensive Rat; LVM- left ventricle mass; g- gram; mmHg- milimeter of mercury; NI- not indicated; SBP- Systolic blood pressure; DBP- Diastolic blood pressure;
MAP- mean arterial pressure; LVM/BM: Left ventricular/body mass ratio; ↑- increase than others strains (p<0.05); >- higher; <- lower; STN- Solitary tract nucleus; ACTH- Adrenocorticotropic hormone; 6-OHDA- 6-
hydroxydopamine hydrochloride; 5HT- Serotonin; NE- Norepinephrin; VMSC- vascular muscle smooth cells; K+- potassium; Na+- sodium; RMP- Rest membrane potentials; Ca2+- calcium; AA- arachidonic acid; ANG-2-
Angiotensin II; Dyn-A- Dynorphin-A; COX- cytochrome oxidase; PVH- paraventricular nuclei; SON- supraoptic nuclei; ANF- Atrial natriuretic factor; ET-1- Endothelin 1; ET-3- Endothelin 3; NO- Oxid nitric; cGMP- cyclic
guanosine monophosphate; ANP- atrial natriuretic peptide; α-MHC- Myosin heavy chain; NaCl- sodium chloride; PDGR-αR- Platelet-derived growth factor-α receptor; C/EBP- CCAAT-enhancer binding proteins; GRK- G-
protein– coupled receptor kinase; ACE- Angiotensin-converting enzyme; ADHD- attention deficit hyperactivity disorder; MMP- Metalloproteinase; FTs- fixed time schedules; SIP- schedule-induced polydipsia; AT1Rs- ANG II
type 1 receptors; AT2Rs- ANG II type 2 receptors; RVLM- ventrolateral medullary pressor area;
↑ Weight gain
WIS vs. WKY:
↑ incorrect responses
↓ discrimination index
Peña et al.
(2017)
South
Korea Male 4 weeks
Charles River Laboratories.
Yokohama, Japan NI NI
Effects of
Methylphenidate and
Atomoxetine in
impulsive behavior
SHR and WIS vs. WKY:
↓ choice for the large reward
↑ impulsivity choice
SHR vs. WKY:
↑ nonreinforced responding
↑ Impulsive behavior
Drugs effects:
SHR:
↓ discounting
WIS:
↓ delay discounting
WKY:
↑ discounting
SHR and WIS vs. WKY:
↑ Genes expression in
prefrontal cortex
Not conclusive
Rybinikova,
Vetrovi and
Zenko (2018)
Russia Male NI Pavlov Institute of Physiology,
Saint Petersburg- Russia NI NI
Behavior, Hormonal
Level and Antioxidant
Status
WIS:
↑ indices of anxiety
↑ depressive-like behavior
SHR and WKY vs. WIS:
↓ indices of anxiety
↓ depressive-like behavior
WKY better control

103
4- Discussion:
Methodology is the theory of organization of a scientific research (35). The
planning e application of right methods is critical for scientific researches. This including
the selection of adequate experimental models for sample composing in agreement with
study objectives. Thus, this work aimed to map studies that used the WIS and WKY
strains simultaneously as SHR control, allowing the proper characterization of the
available variables of strains.
The epidemiological transition theory explains the transition of mortality causes
and diseases incidence along the time (36). The world development leading to life
expectation increase and decreased the number of deaths from hunger or infectious
diseases (36). However, this change led to the emergence and high worldwide incidence
of chronic degenerative diseases- such as the hypertension- which generated great
demand for their understanding in the first half of the last century (4, 6, 8). The panel A
of fig.1 shows an exponential increase in the number of researches related to hypertension
since the 1960s, showing a peak in the 1990s. We have already pointed to a collective
effort by researches groups to develop an experimental model that would allow the study
of EAH (4, 6, 7, 9), which culminated in the development of SHR by Okamoto in 1963,
in Japan (5). Consequently, the availability of a model (SHR) that has been shown to
reliably reproduce the characteristics of the disease promote the mass research production
about hypertension.
The use of the SHR model to study the effects of hypertension requires an
experimental normotensive strain as control and the WKY were pointed as the ideal
model, since they are SHR background (5, 10). However, controversial results began to
emerge from the analysis of the WKY, which led to questions about its use as control of
hypertensive animals, initiating a series of comparative researches and a search for an
ideal model for this function. According to our search (fig.2-panel B), Tobia, Lee and
Walsh (1974) published the first study using more than one experimental model as SHR
control ant they investigated the regional blood flow of iliac and mesenteric arteries of WIS,
WKY and SHR and found that WIS presented higher total peripheral resistance that WKY, what
indicated the later as better control (37). Following, Frohlich and Pfeffer in 1975 also
included WIS rats in company with WKY, and they justified the WIS select because they
are the initial progenitor of WKY strain (38). This study evaluated the adrenergic
mechanism of hypertension and found similar results from normotensive animals (38).

104
However, many other factors are involved with the onset and development of the disease,
which prompted the use of both models as control of SHR in many studies in the years
that followed- with peak observed between 1980s and 1990s decades (21, 22, 25, 27-31,
37-187).
Geographic distribution:
We found studies on all continents, which the Americas with ninety-nine studies
and Europe with forty-four studies were the continents that contributed most to the
characterization of the strains. It is important to highlight the volume of work developed
by the United States, which totaled 68 papers. On the other hand, Africa with 1 study and
Oceania with 3 studies were the continents with the lowest production. This analysis of
geographic distribution points out that the concern as to which model should be used as
SHR control was global, which encouraged this methodological organization, including
the three strains in all these studies around the world.
Laboratory of supplying animals:
Another important point to be highlighted is the laboratory of origin of the
experimental models (Tab.1). The laboratories that most frequently supply animals for
the studies were Charles River (WIS- 71; WKY- 57; SHR- 60), followed by Harlan
Laboratories (WIS- 14; WKY- 14; SHR- 14) and Taconic Farms, Germantown, New York-
USA (WIS - 8; WKY-14; SHR-14). The studies pointed to the animals withdraw from
several sites of the Charles River and Harlan laboratories, while just one for the Taconic
Farms.
The choice of the laboratory for supplying the animals is important since there are
research indicates biological variability in WKY and SHR rats from different laboratories,
in which the animals presented different levels of mean arterial pressure (13). Also, the
genetic variability of these strains was tested through genomic analysis and were founded
differences between WKY of different laboratories and even between animals from the
same laboratory (12). Kreutz et al. (1997) found that are WKY strain with chromosome
10 distinctions- this was linked to diastolic and systolic blood pressure (188, 189)- and
they were named WKY0 and WKY1, and the WKY1 had higher baseline arterial pressure
values (190). Langen and Dost (2011) found a behavior and genetic deviation between
Harlan and Charles River laboratories and considerate that they are different substrains
(30). A group of United States develop a serie of researches that confirm the great genetic

105
variability between WKY from different laboratories and that WKY from Charles River
are good model to behavior disorders study, like anxiety and depression (191, 192), what
are supported by others (30, 167, 175, 178, 180, 184). A recent literature review that
collected information on genetic basis about SHR and yours origin strains confirmed that
are genetic variability of animals from different laboratories and indicated that genetic
variants present in the outbred strains from which SHR are created generated differences
in hypertension development (18). The information pointed out here indicates the need
for prior examination regarding the genetic origin and characteristics of the animals
provided by the various laboratories, since there are certainly several differences between
their practices and between the animals raised and supplied.
The experimental dilemma:
Table 2 presents the data extracted from the studies included in the review. Among
the studies, one hundred and seven chose to use male rats, only 8 used exclusively female
rats and eleven studies used both, while thirty-five did not indicate the sex of the animals
used. Coskinas and Price (1987) decide use female animals because they observed a great
difference in body mass between males normotensive and hypertensive rats (80).
One of the dilemmas faced by the researchers is to pair the experimental groups
by age, body mass or blood pressure. We observed that the majority of studies matched
for age, since this is a determining factor in the hypertension development in SHR (11,
108, 126, 193). However, it is important to highlight that the WIS strain showed a higher
body mass compared to the WKY and SHR in the most of studies, this is one of the factors
to be observed and considered when selecting the experimental model. Another point is
the blood pressure values. Cleary, the SHR presented higher blood pressure, as expected.
However, in three studies the WIS exhibited higher blood pressure compared to WKY
(44, 101, 109), while five studies the WKY presented higher values (47, 57, 72, 99, 133).
The studies included in the review had different objectives and analyzed a very
wide range of variables. In the first decades, between 1970 and 2000, the focus was on
autonomic variables, in which studies sought to understand the responsible factors for the
emergence and development of EAH. However, it was discovered that the SHR and WKY
animals could also be used as models for studies on behavioral disorders, such as
depression, locomotor action, hyperactivity and attention deficit hyperactivity disorder
(25). In the last decades - mainly after 2005- many studies that used the three experimental

106
strains promoted the analysis of behavioral disorders and the treatment for them were
published, and this was a little explored area until then.
In 13.49% of the studies the WIS were indicated as the best control, while in
6.74% the WKY were considered as the appropriate strain. Hopp et al. indicated that
WKY from National Institutes of Health presented propensity to blood pressure elevation
(68). And because of this, they decide exclude of yours sample all WKY animals that
present SBP above 130mmHg and they affirmed that be difficult applied WKY as SHR
control without any reservation, indicating the parallel use of WIS and WKY (68).
Tamura and col. following the same precautions about WKY use, indicating that just
included animals of this strain that present SBP lowest that 130mmHg (70). Another study
points that WKY presented properties of smooth muscle very close to SHR, indicating a
relationship with hypertension state (120).
One study that evaluated the adrenal gland structure indicate that WIS differ from
WKY about volume of zona fascicular cells, mitochondria, smooth, endoplasmic
reticulum and lysosomes and they are not most reliable control for SHR (39). They
justified this pointing that WKY are closer in genetic constitution of SHR (39). Harvey
et al. (2013) found that WIS rats present reduced learn capacity compared to WKY and
close to SHR and based on this, they indicated that WKY are more appropriated to SHR
control for this type of analyzes (171).
From the analyzed studies was found that in 68.4% of the articles the
normotensive animals showed similar results, and some of these indicating the use
parallel controls to SHR, suggesting that WKY and WIS are adequate animals for this
(25, 28, 42, 94, 148, 178, 180). Dun and col. indicated that such comparisons may produce
new insights about hypertension effects and perhaps there is not be apparent if only the
WKY were used as control (42). Somkuwar et al. point that studies that use just WKY
are reference control have been disapproved because some variables can be under or
overestimated if the parallel control are not used (167). In 1978, Hodgins and Frohlich
(1978) indicated the use of the two strains, since there appear to be physical and
hemodynamic differences between them, implying that neither one alone may be a
completely appropriate control when investigating hypertension-related parameters (41).
Lundin et al. made a similar statement, indicating that one control complements the other
(21).
Langen and Dost (2011) point that WIS and WKY present similarities and
differences depend of which variable is analyzed and that requires a deep discussion (30).

107
This review supports this theory and point that both can be used as SHR control.
Considering this, the researches need to be caution and analyzed what animal select based
on your objectives, leading in count factors as laboratory of origin of animals, body mass
and mainly, blood pressure measurement.

108
5- References:
1. Borko H. Information Science: What Is It? American Documentation. 1968:3-5. 2. Ferreira LM, Hochman B, Barbosa MVJ. Modelos experimentais em pesquisa. Acta Cirúrgica Brasileira. 2005;20(2):28-34. 3. Fagundes DJ, Taha MO. Modelo animal de doença: critérios de escolha e espécies de animais de uso corrente. Acta Cirúrgica Brasileira. 2004;19(1):59-65. 4. Smirk FH, Hall WH. Inherited hypertension in rats. Nature. 1958 Sep 13;182(4637):727-8. 5. Okamoto K, Aoki K. Development of a strain of spontaneously hypertensive rats. Jpn Circ J. 1963 Mar;27:282-93. 6. Alexander N, Hinshaw LB, Drury DR. Development of a strain of spontaneously hypertensive rabbits. Proc Soc Exp Biol Med. 1954 Aug-Sep;86(4):855-8. 7. Phelan EL, Smirk FH. Cardiac hypertrophy in genetically hypertensive rats. The Journal of Pathology and Bacteriology. 1962;80:445-8. 8. Page IH. A Method for Producing Persistent Hypertension by Cellophane. Science. 1939 Mar 24;89(2308):273-4. 9. Phelan EL, Eryetishir I, Smirk FH. Observations on the responses of rats with spontaneous hypertension and control rats to pressor drugs and to hexamethonium. Circ Res. 1962 May;10:817-24. 10. Okamoto K, Tabei R, Fukushima M, Nosaka S, Yamori Y. Further observations of the development of a strain of spontaneously hypertensive rats. Jpn Circ J. 1966 Jun;30(6):703-16. 11. Doggrell SA, Brown L. Rat models of hypertension, cardiac hypertrophy and failure. Cardiovascular Research. 1998 Jul;39(1):89-105. 12. Kurtz TW, Montano M, Chan L, Kabra P. Molecular evidence of genetic heterogeneity in Wistar-Kyoto rats: implications for research with the spontaneously hypertensive rat. Hypertension. 1989 Feb;13(2):188-92. 13. Kurtz TW, Morris RC, Jr. Biological variability in Wistar-Kyoto rats. Implications for research with the spontaneously hypertensive rat. Hypertension. 1987 Jul;10(1):127-31. 14. Deschepper CF, Picard S, Thibault G, Touyz R, Rouleau JL. Characterization of myocardium, isolated cardiomyocytes, and blood pressure in WKHA and WKY rats. Am J Physiol Heart Circ Physiol. 2002 Jan;282(1):H149-55. 15. Collins HL, Loka AM, DiCarlo SE. Daily exercise-induced cardioprotection is associated with changes in calcium regulatory proteins in hypertensive rats. American Journal of Physiology-Heart and Circulatory Physiology. 2005;288:H532–H40. 16. Atanur SS, Diaz AG, Maratou K, Sarkis A, Rotival M, Game L, et al. Genome sequencing reveals loci under artificial selection that underlie disease phenotypes in the laboratory rat. Cell. 2013 Aug 1;154(3):691-703. 17. Bailey DW. Recombinant-inbred strains. An aid to finding identity, linkage, and function of histocompatibility and other genes. Transplantation. 1971 Mar;11(3):325-7. 18. Doris PA. Genetics of hypertension: an assessment of progress in the spontaneously hypertensive rat. Physiol Genomics. 2017 Nov 1;49(11):601-17. 19. Yosida TH, Amano K. Autosomal polymorphism in laboratory bred and wild Norway rats, Rattus norvegicus, found in Misima. Chromosoma. 1965 Jun 28;16(6):658-67. 20. Eichelman B, Dejong W, Williams RB. Aggressive behavior in hypertensive and normotensive rat strains. Physiol Behav. 1973 Feb;10(2):301-4. 21. Lundin S, Herlitz H, Hallback-Nordlander M, Ricksten SE, Gothberg G, Berglund G. Sodium balance during development of hypertension in the spontaneously hypertensive rat (SHR). Acta Physiol Scand. 1982 Jul;115(3):317-23. 22. Nishiyama K, Nishiyama A, Frohlich ED. Regional blood flow in normotensive and spontaneously hypertensive rats. Am J Physiol. 1976 Mar;230(3):691-8.

109
23. Herlitz H, Lundin S, Henning M, Aurell M, Karlberg BE, Berglund G. Hormonal pattern during development of hypertension in spontaneously hypertensive rats (SHR). Clin Exp Hypertens A. 1982;4(6):915-35. 24. Felten SY, Weyhenmeyer JA, Felten DL. Norepinephrine and serotonin in central autonomic nuclei in the spontaneously hypertensive rat and two normotensive control rats. Brain Res Bull. 1984 Sep;13(3):437-41. 25. Hard E, Carlsson SG, Jern S, Larsson K, Lindh AS, Svensson L. Behavioral reactivity in spontaneously hypertensive rats. Physiol Behav. 1985 Oct;35(4):487-92. 26. Soderpalm B. The SHR exhibits less "anxiety" but increased sensitivity to the anticonflict effect of clonidine compared to normotensive controls. Pharmacol Toxicol. 1989 Nov;65(5):381-6. 27. Sagvolden T, Pettersen MB, Larsen MC. Spontaneously hypertensive rats (SHR) as a putative animal model of childhood hyperkinesis: SHR behavior compared to four other rat strains. Physiol Behav. 1993 Dec;54(6):1047-55. 28. Gattone VH, 2nd. Body weight of the spontaneously hypertensive rat during the suckling and weanling periods. Jpn Heart J. 1986 Nov;27(6):881-4. 29. Bizot JC, Chenault N, Houze B, Herpin A, David S, Pothion S, et al. Methylphenidate reduces impulsive behaviour in juvenile Wistar rats, but not in adult Wistar, SHR and WKY rats. Psychopharmacology (Berl). 2007 Aug;193(2):215-23. 30. Langen B, Dost R. Comparison of SHR, WKY and Wistar rats in different behavioural animal models: effect of dopamine D1 and alpha2 agonists. Atten Defic Hyperact Disord. 2011 Mar;3(1):1-12. 31. Sanada LS, Tavares MR, Neubern MC, Salgado HC, Fazan VP. Can Wistar rats be used as the normotensive controls for nerve morphometry investigations in spontaneously hypertensive rats (SHR)? Acta Cir Bras. 2011 Dec;26(6):514-20. 32. Gordon CJ, Phillips PM, Johnstone AF. Impact of genetic strain on body fat loss, food consumption, metabolism, ventilation, and motor activity in free running female rats. Physiol Behav. 2016 Jan 1;153:56-63. 33. Tricco AC, Lillie E, Zarin W, O'Brien KK, Colquhoun H, Levac D, et al. PRISMA Extension for Scoping Reviews (PRISMA-ScR): Checklist and Explanation. Ann Intern Med. 2018 Oct 2;169(7):467-73. 34. Peters MD, Godfrey CM, Khalil H, McInerney P, Parker D, Soares CB. Guidance for conducting systematic scoping reviews. Int J Evid Based Healthc. 2015 Sep;13(3):141-6. 35. Novikov AM, Novikov DA. Research methodology: From philosophy of science to research design. 2013. 36. Omran AR. The epidemiologic transition. A theory of the epidemiology of population change. Milbank Mem Fund Q. 1971 Oct;49(4):509-38. 37. Tobia AJ, Lee JY, Walsh GM. Regional blood flow and vascular resistance in the spontaneously hypertensive rat. Cardiovasc Res. 1974 Nov;8(6):758-62. 38. Frohlich ED, Pfeffer MA. Adrenergic mechanisms in human hypertension and in spontaneously hypertensive rats. Clin Sci Mol Med Suppl. 1975 Jun;2:225s-38s. 39. Nickerson PA. The adrenal cortex in spontaneously hypertensive rats. A quantitative ultrastructural study. Am J Pathol. 1976 Sep;84(3):545-60. 40. Mullins MM, Banks RO. Age-related changes in Na+ excretion in saline-loaded spontaneously hypertensive rats. Am J Physiol. 1976 Nov;231(5 Pt. 1):1364-70. 41. Hodgins DS, Frohlich ED. Cardiac adenylate cyclase, cyclic nucleotide phosphodiesterase and lactate dehydrogenase in normotensive and spontaneously hypertensive rats. Biochem Pharmacol. 1978;27(8):1179-85. 42. Dunn FG, Pfeffer MA, Frohlich ED. ECG alterations with progressive left ventricular hypertrophy in spontaneous hypertension. Clin Exp Hypertens. 1978;1(1):67-86. 43. Cox RH. Comparison of arterial wall mechanics in normotensive and spontaneously hypertensive rats. Am J Physiol. 1979 Aug;237(2):H159-67.

110
44. Johnson EM, Jr., Macia RA. Unique resistance to guanethidine-induced chemical sympathectomy of spontaneously hypertensive rats: a resistance overcome by treatment with antibody to nerve growth factor. Circ Res. 1979 Aug;45(2):243-9. 45. Collis MG, de May C, Vanhoutte PM. Enhanced release of noradrenaline in the kidney of the young spontaneously hypertensive rat. Clin Sci (Lond). 1979 Dec;57 Suppl 5:233s-4s. 46. Postnov YV, Orlov SN. Evidence of altered calcium accumulation and calcium binding by the membranes of adipocytes in spontaneously hypertensive rats. Pflugers Arch. 1980 May;385(1):85-9. 47. Altura BM, Carella A, Altura BT. Magnesium ions control prostaglandin reactivity of venous smooth muscle from spontaneously hypertensive rats. Prostaglandins Med. 1980 Apr;4(4):255-61. 48. Nordborg C, Johansson BB. Morphometric study on cerebral vessels in spontaneously hypertensive rats. Stroke. 1980 May-Jun;11(3):266-70. 49. Haack DW, Schaffer JJ, Simpson JG. Comparisons of cutaneous microvessels from spontaneously hypertensive, normotensive Wistar-Kyoto, and normal Wistar rats. Proc Soc Exp Biol Med. 1980 Sep;164(4):453-8. 50. Lukacsko P, Messina EJ, Kaley G. Reduced hypotensive action of arachidonic acid in the spontaneously hypertensive rat. Hypertension. 1980 Sep-Oct;2(5):657-63. 51. Webb RC, VANHOUTTE MDP, BOHR DF. Adrenergic Neurotransmission in Vascular Smooth Muscle from Spontaneously Hypertensive Rats. Hypertension. 1980;3(1). 52. O'Donnell A, Volicer L. Thermoregulation in spontaneously hypertensive rats: effects of antihypertensive treatments. Clin Exp Hypertens. 1981;3(3):555-67. 53. Kitamura Y, Ishise S, Pegram BL, Kawamura H, Frohlich ED. Hemodynamic responses to bilateral lesions of the nucleus tractus solitarii in spontaneously hypertensive and normotensive rats. Hypertension. 1981 May-Jun;3(3):362-6. 54. Mullins MM, Kleinman LI, Russell PT, Srivastava LS. Plasma aldosterone concentrations in neonatal spontaneously hypertensive rats. Life Sci. 1982 Dec 13;31(24):2751-5. 55. Picotti GB, Carruba MO, Ravazzani C, Bondiolotti GP, Da Prada M. Plasma catecholamine concentrations in normotensive rats of different strains and in spontaneously hypertensive rats under basal conditions and during cold exposure. Life Sci. 1982 Nov 8;31(19):2137-43. 56. Lukacsko P. Effect of arachidonic acid on the basal release of prostaglandins E2 and I2 by rat arteries during the development of hypertension. Clin Exp Hypertens A. 1983;5(9):1471-83. 57. Borkowski KR, Quinn P. Validation of indirect systolic blood pressure measurement in ether anaesthetised rats. J Auton Pharmacol. 1983 Sep;3(3):157-60. 58. Hausler A, Girard J, Baumann JB, Ruch W, Otten UH. Long-term effects of betamethasone on blood pressure and hypothalamo-pituitary-adrenocortical function in spontaneously hypertensive and normotensive rats. Horm Res. 1983;18(4):191-7. 59. Takahashi M, Inoue A, Takeda K, Okajima H, Sasakim S, Yoshimuram M, et al. Augmented Central Cholinergic Mechanisms in Spontaneously Hypertensive Rats. Japanese Heart Journal. 1983. 60. Preuss HG, Goldin H. Serum renotropic activity and renal growth in spontaneously hypertensive rats. Kidney Int. 1983 Apr;23(4):635-42. 61. Martin JR, Quock RM. Pharmacological characterization of apomorphine-induced hypothermia in the spontaneously hypertensive rat. Life Sci. 1984 Aug 27;35(9):929-36. 62. Krukoff TL, Calaresu FR. Cytochrome oxidase activity in the hypothalamus of SHR and normotensive rats before and after fasting. Brain Res. 1984 Nov 19;322(1):75-82. 63. Miasiro N, Paiva TB, Pereira CC, Shimuta SI. Reactivity to bradykinin and potassium of the isolated duodenum from rats with genetic and renal hypertension. Br J Pharmacol. 1985 Jul;85(3):639-46. 64. Loeb AL, Bean BL. Antihypertensive drugs inhibit hypertension-associated aortic DNA synthesis in the rat. Hypertension. 1986 Dec;8(12):1135-42.

111
65. Kino M, Tamura H, Hopp L, Tokushige A, Searle BM, Aviv A. The effect of melittin on Na+ and Rb+ transport in cultured skin fibroblasts of the spontaneously hypertensive rat. Clin Exp Hypertens A. 1985;7(9):1283-99. 66. Farman N, Bonvalet JP. Aldosterone binding in isolated tubules. IV. Autoradiography along the nephron of the spontaneously hypertensive rat. Am J Physiol. 1985 Jul;249(1 Pt 2):F99-106. 67. Docherty JR, Warnock P. Reduced alpha 1-adrenoreceptor mediated responsiveness in vas deferens from spontaneously hypertensive rats. J Auton Pharmacol. 1986 Dec;6(4):319-22. 68. Hopp L, Khalil F, Tamura H, Kino M, Searle BM, Tokushige A, et al. Ouabain binding to cultured vascular smooth muscle cells of the spontaneously hypertensive rat. Am J Physiol. 1986 Jun;250(6 Pt 1):C948-54. 69. Leyssac PP, Jensen PK, Holstein-Rathlou NH. A study of proximal tubular compliances in normotensive and spontaneously hypertensive rats, and the effect of anaesthesia on the compliance. Acta Physiol Scand. 1986 Mar;126(3):341-8. 70. Tamura H, Hopp L, Kino M, Tokushige A, Searle BM, Khalil F, et al. Na+-K+ regulation in cultured vascular smooth muscle cell of the spontaneously hypertensive rat. Am J Physiol. 1986 Jun;250(6 Pt 1):C939-47. 71. Tokushige A, Kino M, Tamura H, Hopp L, Searle BM, Aviv A. Bumetanide-sensitive sodium-22 transport in vascular smooth muscle cell of the spontaneously hypertensive rat. Hypertension. 1986 May;8(5):379-85. 72. Head GA, de Jong W. Differential blood pressure responses to intracisternal clonidine, alpha-methyldopa, and 6-hydroxydopamine in conscious normotensive and spontaneously hypertensive rats. J Cardiovasc Pharmacol. 1986 Jul-Aug;8(4):735-42. 73. Toivanen A, Merilahti-Palo R, Gripenberg C, Lahesmaa-Rantala R, Soderstrom KO, Jaakkola UM. Yersinia-associated arthritis in the rat: experimental model for human reactive arthritis? Acta Pathol Microbiol Immunol Scand C. 1986 Dec;94(6):261-9. 74. Sladek JR, Jr., Davis BJ, Sladek CD. Localization of vasopressin-neurophysin and norepinephrine in the supraoptic nucleus of spontaneously hypertensive rats. Brain Res. 1986 Feb 19;365(2):293-304. 75. Feig PU, D'Occhio MA, Boylan JW. Lymphocyte membrane sodium-proton exchange in spontaneously hypertensive rats. Hypertension. 1987 Mar;9(3):282-8. 76. Sitsen JMA, Nijkamp FP, Jong W. Differential Sensitivity to Morphine in Spontaneously Hypertensive and Normotensive Wistar-Kyoto and Wistar Rats. Clin And expert-theory and practice. 1987;9(7):1159-71. 77. Hilgenfeldt U, Schott R. Differences in pattern of plasma angiotensinogen in native and nephrectomized rats. Hypertension. 1987 Apr;9(4):339-44. 78. Khalil F, Fine B, Kuriyama S, Hatori N, Nakamura A, Nakamura M, et al. Increased atrial natriuretic factor receptor density in cultured vascular smooth muscle cells of the spontaneously hypertensive rat. Clin Exp Hypertens A. 1987;9(4):741-52. 79. Lang DJ, Johns BL. Venule distension properties in Wistar, Wistar-Kyoto, and spontaneously hypertensive rats. Am J Physiol. 1987 Apr;252(4 Pt 2):H714-20. 80. Coskinas E, Price JM. Length-dependent sensitivity of vascular smooth muscle in normotensive and hypertensive animals. Am J Physiol. 1987 Aug;253(2 Pt 2):H402-11. 81. Kunes J, Pang SC, Cantin M, Genest J, Hamet P. Cardiac and renal hyperplasia in newborn spontaneously hypertensive rats. Clin Sci (Lond). 1987 Mar;72(3):271-5. 82. Feres T, Borges AC, Silva EG, Paiva AC, Paiva TB. Impaired function of alpha-2 adrenoceptors in smooth muscle of mesenteric arteries from spontaneously hypertensive rats. Br J Pharmacol. 1998 Nov;125(6):1144-9. 83. Lariviere R, Baribeau J, St-Louis J, Schiffrin EL. Vasopressin receptors and inositol trisphosphate production in blood vessels of spontaneously hypertensive rats. Can J Physiol Pharmacol. 1989 Mar;67(3):232-9.

112
84. Nakamura M, Nakamura A, Fine B, Aviv A. Blunted cGMP response to ANF in vascular smooth muscle cells of SHR. Am J Physiol. 1988 Nov;255(5 Pt 1):C573-80. 85. Belichard P, Pruneau D, Rochette L. Influence of spontaneous hypertension and cardiac hypertrophy on the severity of ischemic arrhythmias in the rat. Basic Res Cardiol. 1988 Sep-Oct;83(5):560-6. 86. Paré W. "Behavioral Despair" Test Predicts Stress Ulcer in WKY Rats. Physiology & Behavior. 1989;46:483-7. 87. Pare WP. Stress ulcer and open-field behavior of spontaneously hypertensive, normotensive, and Wistar rats. Pavlov J Biol Sci. 1989 Apr-Jun;24(2):54-7. 88. Pare WP. Stress ulcer susceptibility and depression in Wistar Kyoto (WKY) rats. Physiol Behav. 1989 Dec;46(6):993-8. 89. Garcia R, Gauquelin G, Thibault G, Cantin M, Schiffrin EL. Glomerular atrial natriuretic factor receptors in spontaneously hypertensive rats. Hypertension. 1989 Jun;13(6 Pt 1):567-74. 90. Rodionov IM, Iarygin VN, Markov Kh M, Pinelis VG, Lakgueva FK, Tarasova OS, et al. [Increased number of sympathetic neurons in the superior cervical ganglia of rats of SHR and Wistar-Kyoto strains as compared with Wistar rats]. Biull Eksp Biol Med. 1989 Nov;108(11):620-2. 91. Harris EL, Grigor MR, Millar JA. Differences in mitogenic responses to angiotensin II, calf serum and phorbol ester in vascular smooth muscle cells from two strains of genetically hypertensive rat. Biochem Biophys Res Commun. 1990 Aug 16;170(3):1249-55. 92. Kawasaki H, Saito A, Takasaki K. Changes in calcitonin gene-related peptide (CGRP)-containing vasodilator nerve activity in hypertension. Brain Res. 1990 Jun 4;518(1-2):303-7. 93. Sonntag M, Schalike W, Brattstrom A. Cardiovascular effects of vasopressin micro-injections into the nucleus tractus solitarii in normotensive and hypertensive rats. J Hypertens. 1990 May;8(5):417-21. 94. Stein BA, Katzeff I, Norton G, De Wet G, Rosendorff C. Differential size distribution of atrial dense granules in spontaneously hypertensive, Wistar-Kyoto and Wistar rats. Acta Anat (Basel). 1990;137(4):331-5. 95. Alexander D, Gardner JP, Tomonari H, Fine BP, Aviv A. Lower Na(+)-H+ antiport activity in vascular smooth muscle cells of Wistar-Kyoto rats than spontaneously hypertensive and Wistar rats. J Hypertens. 1990 Sep;8(9):867-71. 96. Morton JJ, Beattie EC, Griffin SA, MacPherson F, Lyall F, Russo D. Vascular hypertrophy, renin and blood pressure in the young spontaneously hypertensive rat. Clin Sci (Lond). 1990 Nov;79(5):523-30. 97. Dumont M, Sabourin L, Lemaire S. Alterations of heart dynorphin-A in the development of spontaneously hypertensive rats. Neuropeptides. 1990 Jan;15(1):43-8. 98. Schini VB, Kim ND, Vanhoutte PM. The basal and stimulated release of EDRF inhibits the contractions evoked by endothelin-1 and endothelin-3 in aortae of normotensive and spontaneously hypertensive rats. J Cardiovasc Pharmacol. 1991;17 Suppl 7:S267-71. 99. Widimsky J, Kuchel O, Tremblay J, Hamet P. Distinct plasma atrial natriuretic factor, renin and aldosterone responses to prolonged high-salt intake in hypertensive and normotensive rats. J Hypertens. 1991 Mar;9(3):241-7. 100. Pollock DM, Arendshorst WJ. Effect of acute renal denervation and ANF on renal function in adult spontaneously hypertensive rats. Am J Physiol. 1991 Oct;261(4 Pt 2):R835-41. 101. Boylan JW, Van Liew JB, Feig PU. Inverse changes in erythroid cell volume and number regulate the hematocrit in newborn genetically hypertensive rats. Proc Natl Acad Sci U S A. 1991 Nov 1;88(21):9848-52. 102. Schiffrin EL, Parent A, St Louis J, Tremblay J, Garcia R, Thibault G. Vascular atrial natriuretic factor receptors in spontaneously hypertensive rats. Cardiovasc Res. 1992 Sep;26(9):857-64.

113
103. Saltzman D, DeLano FA, Schmid-Schonbein GW. The microvasculature in skeletal muscle. VI. Adrenergic innervation of arterioles in normotensive and spontaneously hypertensive rats. Microvasc Res. 1992 Nov;44(3):263-73. 104. Tabrizchi R, Triggle CR. Actions of L- and D-arginine and NG-monomethyl-L-arginine on the blood pressure of pithed normotensive and spontaneously hypertensive rats. Clin Exp Hypertens A. 1992;14(3):527-46. 105. Feres T, Vianna LM, Paiva AC, Paiva TB. Effect of treatment with vitamin D3 on the responses of the duodenum of spontaneously hypertensive rats to bradykinin and to potassium. Br J Pharmacol. 1992 Apr;105(4):881-4. 106. Magee JC, Schofield GG. Neurotransmission through sympathetic ganglia of spontaneously hypertensive rats. Hypertension. 1992 Sep;20(3):367-73. 107. Mamuya W, Chobanian A, Brecher P. Age-related changes in fibronectin expression in spontaneously hypertensive, Wistar-Kyoto, and Wistar rat hearts. Circ Res. 1992 Dec;71(6):1341-50. 108. Brooksby P, Levi AJ, Jones JV. Investigation of the mechanisms underlying the increased contraction of hypertrophied ventricular myocytes isolated from the spontaneously hypertensive rat. Cardiovasc Res. 1993 Jul;27(7):1268-77. 109. McLellan AR, Milligan G, Houslay MD, Connell JM. G-proteins in experimental hypertension: a study of spontaneously hypertensive rat myocardial and renal cortical plasma membranes. J Hypertens. 1993 Apr;11(4):365-72. 110. Tremblay J, Huot C, Willenbrock RC, Bayard F, Gossard F, Fujio N, et al. Increased cyclic guanosine monophosphate production and overexpression of atrial natriuretic peptide A-receptor mRNA in spontaneously hypertensive rats. J Clin Invest. 1993 Nov;92(5):2499-508. 111. Turrin MQ, dos Santos LF, da Veiga LV. Generation of atrial natriuretic peptide (ANP) in perfused lungs of spontaneously hypertensive rats (SHR). Comparison to Wistar-Kyoto (WKY) and Wistar (W) rat strains. Comp Biochem Physiol C Comp Pharmacol Toxicol. 1993 Feb;104(2):233-8. 112. Van Liew JB, Zamlauski-Tucker MJ, Feld LG. Endogenous creatinine clearance in the rat: strain variation. Life Sci. 1993;53(12):1015-21. 113. Klee A, Vater S, Schmid-Schonbein GW, Seiffge D. Evidence from comparative investigations that impaired platelet activation is not specific for stroke-prone spontaneously hypertensive rats. Stroke. 1993 Oct;24(10):1528-33. 114. Huang A, Sun D, Koller A. Endothelial dysfunction augments myogenic arteriolar constriction in hypertension. Hypertension. 1993 Dec;22(6):913-21. 115. Magnusson AM, Meyerson BJ. GABA-A agonist muscimol inhibits stimulated vasopressin release in the posterior pituitary of Sprague-Dawley, Wistar, Wistar-Kyoto and spontaneously hypertensive rats. Neuroendocrinology. 1993 Nov;58(5):519-24. 116. Morano I, Adler K, Weismann K, Knorr A, Erdmann E, Bohm M. Correlation of myosin heavy chain expression in the rat with cAMP in different models of hypertension-induced cardiac hypertrophy. J Mol Cell Cardiol. 1993 Apr;25(4):387-94. 117. Perez GN, Petroff MV, Mattiazzi A. Rested-state contractions and rest potentiation in spontaneously hypertensive rats. Hypertension. 1993 Sep;22(3):306-14. 118. Touyz RM, Tolloczko B, Schiffrin EL. Mesenteric vascular smooth muscle cells from spontaneously hypertensive rats display increased calcium responses to angiotensin II but not to endothelin-1. J Hypertens. 1994 Jun;12(6):663-73. 119. Magee JC, Schofield GG. Alterations of synaptic transmission in sympathetic ganglia of spontaneously hypertensive rats. Am J Physiol. 1994 Nov;267(5 Pt 2):R1397-407. 120. Silva EG, Frediani-Neto E, Ferreira AT, Paiva AC, Paiva TB. Role of Ca(+)-dependent K-channels in the membrane potential and contractility of aorta from spontaneously hypertensive rats. Br J Pharmacol. 1994 Nov;113(3):1022-8.

114
121. David-Dufilho M, Pernollet MG, Morris M, Astarie-Dekequer C, Devynck MA. Erythrocyte Ca2+ handling in the spontaneously hypertensive rat, effect of vanadate ions. Life Sci. 1994;54(4):267-74. 122. Rowland NE, Li BH, Fregly MJ, Smith GC. Fos induced in brain of spontaneously hypertensive rats by angiotensin II and co-localization with AT-1 receptors. Brain Res. 1995 Mar 27;675(1-2):127-34. 123. Dumont M, Lemaire S. Inhibitory effects of dynorphin-A on norepinephrine uptake by cardiac synaptosomal-mitochondrial fractions. J Cardiovasc Pharmacol. 1995 Apr;25(4):518-23. 124. Grisk O, Exner J, Schmidt M, Wacker S, Werner M, Honig A. Cardiorespiratory responses to acute hypoxia and hyperoxia in adult and neonatal spontaneously hypertensive and normotensive rats. Clin Exp Hypertens. 1995 Oct;17(7):1025-47. 125. Bian K, Bukoski RD. Myofilament calcium sensitivity of normotensive and hypertensive resistance arteries. Hypertension. 1995 Jan;25(1):110-6. 126. Touyz RM, Tolloczko B, Schiffrin EL. Blunted attenuation of angiotensin II-mediated Ca2+ transients by insulin in cultured unpassaged vascular smooth muscle cells from spontaneously hypertensive rats. Am J Hypertens. 1995 Feb;8(2):104-12. 127. Feng JJ, Arendshorst WJ. Enhanced renal vasoconstriction induced by vasopressin in SHR is mediated by V1 receptors. Am J Physiol. 1996 Aug;271(2 Pt 2):F304-13. 128. Findlay AL. The effect of losartan on drinking and NaCl intake in the rat in response to hyperosmotic and hypovolaemic stimuli: effect of route of administration and strain of rat. Regul Pept. 1996 Oct 8;66(1-2):95-100. 129. Blume A, Lebrun CJ, Herdegen T, Bravo R, Linz W, Mollenhoff E, et al. Increased brain transcription factor expression by angiotensin in genetic hypertension. Hypertension. 1997 Feb;29(2):592-8. 130. Gattu M, Pauly JR, Boss KL, Summers JB, Buccafusco JJ. Cognitive impairment in spontaneously hypertensive rats: role of central nicotinic receptors. I. Brain Res. 1997 Oct 10;771(1):89-103. 131. Touyz RM, Schiffrin EL. Role of calcium influx and intracellular calcium stores in angiotensin II-mediated calcium hyper-responsiveness in smooth muscle from spontaneously hypertensive rats. J Hypertens. 1997 Dec;15(12 Pt 1):1431-9. 132. Preuss HG, Zein M, MacArthy P, Dipette D, Sabnis S, Knapka J. Sugar-induced blood pressure elevations over the lifespan of three substrains of Wistar rats. J Am Coll Nutr. 1998 Feb;17(1):36-47. 133. Tanigawa K, Inoue Y, Tamura K. Insulin secretion and biosynthesis by the perfused pancreas of spontaneously hypertensive rats. Metabolism. 1999 Jan;48(1):3-6. 134. Kitami Y, Fukuoka T, Hiwada K, Inagami T. A high level of CCAAT-enhancer binding protein-delta expression is a major determinant for markedly elevated differential gene expression of the platelet-derived growth factor-alpha receptor in vascular smooth muscle cells of genetically hypertensive rats. Circ Res. 1999 Jan 8-22;84(1):64-73. 135. Dalle Lucca SL, Dalle Lucca JJ, Borges AC, Ihara SS, Paiva TB. Abnormal proliferative response of the carotid artery of spontaneously hypertensive rats after angioplasty may be related to the depolarized state of its smooth muscle cells. Braz J Med Biol Res. 2000 Aug;33(8):919-27. 136. Gros R, Chorazyczewski J, Meek MD, Benovic JL, Ferguson SS, Feldman RD. G-Protein-coupled receptor kinase activity in hypertension : increased vascular and lymphocyte G-protein receptor kinase-2 protein expression. Hypertension. 2000 Jan;35(1 Pt 1):38-42. 137. Hancock JC, Lindsay GW. Enhanced ganglionic responses to substance P in spontaneously hypertensive rats. Peptides. 2000 Apr;21(4):535-41. 138. Kawasaki H, Nuki Y, Yamaga N, Kurosaki Y, Taguchi T. Decreased depressor response mediated by calcitonin gene-related peptide (CGRP)-containing vasodilator nerves to spinal cord stimulation and levels of CGRP mRNA of the dorsal root ganglia in spontaneously hypertensive rats. Hypertens Res. 2000 Nov;23(6):693-9.

115
139. Casellas D, Bouriquet N, Artuso A, Walcott B, Moore LC. New method for imaging innervation of the renal preglomerular vasculature. Alterations in hypertensive rats. Microcirculation. 2000 Dec;7(6 Pt 1):429-37. 140. Akemi Sato M, Vanderlei Menani J, Ubriaco Lopes O, Colombari E. Lesions of the commissural nucleus of the solitary tract reduce arterial pressure in spontaneously hypertensive rats. Hypertension. 2001 Sep;38(3 Pt 2):560-4. 141. Ibarra M, Lopez-Guerrero JJ, Villalobos-Molina R. The influence of chloroethylclonidine-induced contraction in isolated arteries of Wistar Kyoto rats: alpha1D- and alpha1A-adrenoceptors, protein kinase C, and calcium influx. Arch Med Res. 2001 Jul-Aug;32(4):258-62. 142. Fox GB, Pan JB, Esbenshade TA, Bennani YL, Black LA, Faghih R, et al. Effects of histamine H(3) receptor ligands GT-2331 and ciproxifan in a repeated acquisition avoidance response in the spontaneously hypertensive rat pup. Behav Brain Res. 2002 Apr 1;131(1-2):151-61. 143. Borges AC, Feres T, Vianna LM, Paiva TB. Cholecalciferol treatment restores the relaxant responses of spontaneously hypertensive rat arteries to bradykinin. Pathophysiology. 2002 Aug;8(4):263-8. 144. Aiello EA, Villa-Abrille MC, Escudero EM, Portiansky EL, Perez NG, de Hurtado MC, et al. Myocardial hypertrophy of normotensive Wistar-Kyoto rats. Am J Physiol Heart Circ Physiol. 2004 Apr;286(4):H1229-35. 145. Wickens JR, Macfarlane J, Booker C, McNaughton N. Dissociation of hypertension and fixed interval responding in two separate strains of genetically hypertensive rat. Behav Brain Res. 2004 Jul 9;152(2):393-401. 146. Shcherbin YI, Tsyrlin VA. Comparison of the somatosympathetic reflex in normotensive and spontaneously hypertensive rats. Neurosci Behav Physiol. 2004 Jul;34(6):563-7. 147. Bueno V, Palos M, Ronchi FA, Andrade MC, Ginoza M, Casarini DE. N-Domain angiotensin I-converting enzyme expression in renal artery of Wistar, Wistar Kyoto, and spontaneously hypertensive rats. Transplant Proc. 2004 May;36(4):1001-3. 148. van den Bergh FS, Bloemarts E, Chan JS, Groenink L, Olivier B, Oosting RS. Spontaneously hypertensive rats do not predict symptoms of attention-deficit hyperactivity disorder. Pharmacol Biochem Behav. 2006 Mar;83(3):380-90. 149. Kubo T, Hagiwara Y. Enhanced central hypertonic saline-induced activation of angiotensin II-sensitive neurons in the anterior hypothalamic area of spontaneously hypertensive and Dahl S rats. Brain Res Bull. 2006 Jan 30;68(5):335-40. 150. Sakamoto K, Yonoki Y, Fujioka T, Matsumura M, Mitsuta Y, Sano M, et al. Disappearance of glibenclamide-induced hypoglycemia in Wistar-Kyoto rats. Biol Pharm Bull. 2006 Mar;29(3):574-6. 151. Orduna V, Hong E, Bouzas A. Interval bisection in spontaneously hypertensive rats. Behav Processes. 2007 Jan 10;74(1):107-11. 152. Wheal AJ, Bennett T, Randall MD, Gardiner SM. Cardiovascular effects of cannabinoids in conscious spontaneously hypertensive rats. Br J Pharmacol. 2007 Nov;152(5):717-24. 153. Ribeiro RT, Afonso RA, Macedo MP. Hepatic parasympathetic role in insulin resistance on an animal model of hypertension. Metabolism. 2007 Feb;56(2):227-33. 154. Orduna V, Garcia A, Menez M, Hong E, Bouzas A. Performance of spontaneously hypertensive rats in a peak-interval procedure with gaps. Behav Brain Res. 2008 Aug 5;191(1):72-6. 155. Orduna V, Valencia-Torres L, Bouzas A. DRL performance of spontaneously hypertensive rats: dissociation of timing and inhibition of responses. Behav Brain Res. 2009 Jul 19;201(1):158-65. 156. Sandow SL, Gzik DJ, Lee RM. Arterial internal elastic lamina holes: relationship to function? J Anat. 2009 Feb;214(2):258-66. 157. Oliveira TR, Lamy MT, De Paula UM, Guimaraes LL, Toledo MS, Takahashi HK, et al. Structural properties of lipid reconstructs and lipid composition of normotensive and

116
hypertensive rat vascular smooth muscle cell membranes. Braz J Med Biol Res. 2009 Sep;42(9):844-53. 158. Percy CJ, Brown L, Power DA, Johnson DW, Gobe GC. Obesity and hypertension have differing oxidant handling molecular pathways in age-related chronic kidney disease. Mech Ageing Dev. 2009 Mar;130(3):129-38. 159. Tran ED, DeLano FA, Schmid-Schonbein GW. Enhanced matrix metalloproteinase activity in the spontaneously hypertensive rat: VEGFR-2 cleavage, endothelial apoptosis, and capillary rarefaction. J Vasc Res. 2010;47(5):423-31. 160. Dommett EJ, Rostron CL. Abnormal air righting behaviour in the spontaneously hypertensive rat model of ADHD. Exp Brain Res. 2011 Nov;215(1):45-52. 161. Ibias J, Pellon R. Schedule-induced polydipsia in the spontaneously hypertensive rat and its relation to impulsive behaviour. Behav Brain Res. 2011 Sep 30;223(1):58-69. 162. Castello-Ruiz M, Torregrosa G, Burguete MC, Salom JB, Gil JV, Miranda FJ, et al. Soy-derived phytoestrogens as preventive and acute neuroprotectors in experimental ischemic stroke: influence of rat strain. Phytomedicine. 2011 Apr 15;18(6):513-5. 163. Herman E, Knapton A, Rosen E, Zhang J, Estis J, Agee SJ, et al. Baseline serum cardiac troponin I concentrations in Sprague-Dawley, spontaneous hypertensive, Wistar, Wistar-Kyoto, and Fisher rats as determined with an ultrasensitive immunoassay. Toxicol Pathol. 2011 Jun;39(4):653-63. 164. Harvey RC, Sen S, Deaciuc A, Dwoskin LP, Kantak KM. Methylphenidate treatment in adolescent rats with an attention deficit/hyperactivity disorder phenotype: cocaine addiction vulnerability and dopamine transporter function. Neuropsychopharmacology. 2011 Mar;36(4):837-47. 165. Hill JC, Herbst K, Sanabria F. Characterizing operant hyperactivity in the Spontaneously Hypertensive Rat. Behav Brain Funct. 2012 Jan 26;8:5. 166. Dommett EJ, Rostron CL. Appetitive and consummative responding for liquid sucrose in the spontaneously hypertensive rat model of attention deficit hyperactivity disorder. Behav Brain Res. 2013 Feb 1;238:232-42. 167. Somkuwar SS, Darna M, Kantak KM, Dwoskin LP. Adolescence methylphenidate treatment in a rodent model of attention deficit/hyperactivity disorder: dopamine transporter function and cellular distribution in adulthood. Biochem Pharmacol. 2013 Jul 15;86(2):309-16. 168. Somkuwar SS, Jordan CJ, Kantak KM, Dwoskin LP. Adolescent atomoxetine treatment in a rodent model of ADHD: effects on cocaine self-administration and dopamine transporters in frontostriatal regions. Neuropsychopharmacology. 2013 Dec;38(13):2588-97. 169. Umehara M, Ago Y, Kawanai T, Fujita K, Hiramatsu N, Takuma K, et al. Methylphenidate and venlafaxine attenuate locomotion in spontaneously hypertensive rats, an animal model of attention-deficit/hyperactivity disorder, through alpha2-adrenoceptor activation. Behav Pharmacol. 2013 Aug;24(4):328-31. 170. Wang G, Thomsen K, Frokiaer J. Renal responses to acute volume expansion in spontaneously hypertensive rats is related to the baseline sodium excretion. Scand J Clin Lab Invest. 2013 Oct;73(7):529-37. 171. Harvey RC, Jordan CJ, Tassin DH, Moody KR, Dwoskin LP, Kantak KM. Performance on a strategy set shifting task during adolescence in a genetic model of attention deficit/hyperactivity disorder: methylphenidate vs. atomoxetine treatments. Behav Brain Res. 2013 May 1;244:38-47. 172. Jordan CJ, Harvey RC, Baskin BB, Dwoskin LP, Kantak KM. Cocaine-seeking behavior in a genetic model of attention-deficit/hyperactivity disorder following adolescent methylphenidate or atomoxetine treatments. Drug Alcohol Depend. 2014 Jul 1;140:25-32. 173. Nam H, Clinton SM, Jackson NL, Kerman IA. Learned helplessness and social avoidance in the Wistar-Kyoto rat. Front Behav Neurosci. 2014;8:109.

117
174. Grunblatt E, Bartl J, Iuhos DI, Knezovic A, Trkulja V, Riederer P, et al. Characterization of cognitive deficits in spontaneously hypertensive rats, accompanied by brain insulin receptor dysfunction. J Mol Psychiatry. 2015;3(1):6. 175. Somkuwar SS, Kantak KM, Dwoskin LP. Effect of methylphenidate treatment during adolescence on norepinephrine transporter function in orbitofrontal cortex in a rat model of attention deficit hyperactivity disorder. J Neurosci Methods. 2015 Aug 30;252:55-63. 176. Kodavanti UP, Ledbetter AD, Thomas RF, Richards JE, Ward WO, Schladweiler MC, et al. Variability in ozone-induced pulmonary injury and inflammation in healthy and cardiovascular-compromised rat models. Inhal Toxicol. 2015;27 Suppl 1:39-53. 177. Ibias J, Pellon R, Sanabria F. A microstructural analysis of schedule-induced polydipsia reveals incentive-induced hyperactivity in an animal model of ADHD. Behav Brain Res. 2015 Feb 1;278:417-23. 178. Brace LR, Kraev I, Rostron CL, Stewart MG, Overton PG, Dommett EJ. Auditory responses in a rodent model of Attention Deficit Hyperactivity Disorder. Brain Res. 2015 Dec 10;1629:10-25. 179. Ibias J, Miguens M, Pellon R. Effects of dopamine agents on a schedule-induced polydipsia procedure in the spontaneously hypertensive rat and in Wistar control rats. J Psychopharmacol. 2016 Sep;30(9):856-66. 180. Jordan CJ, Lemay C, Dwoskin LP, Kantak KM. Adolescent d-amphetamine treatment in a rodent model of attention deficit/hyperactivity disorder: impact on cocaine abuse vulnerability in adulthood. Psychopharmacology (Berl). 2016 Dec;233(23-24):3891-903. 181. Jordan CJ, Taylor DM, Dwoskin LP, Kantak KM. Adolescent D-amphetamine treatment in a rodent model of ADHD: Pro-cognitive effects in adolescence without an impact on cocaine cue reactivity in adulthood. Behav Brain Res. 2016 Jan 15;297:165-79. 182. Kawabe T, Iwasa M, Kawabe K, Sapru HN. Attenuation of angiotensin type 2 receptor function in the rostral ventrolateral medullary pressor area of the spontaneously hypertensive rat. Clin Exp Hypertens. 2016;38(2):209-17. 183. Somkuwar SS, Kantak KM, Bardo MT, Dwoskin LP. Adolescent methylphenidate treatment differentially alters adult impulsivity and hyperactivity in the Spontaneously Hypertensive Rat model of ADHD. Pharmacol Biochem Behav. 2016 Feb;141:66-77. 184. Ibias J, Daniels CW, Miguens M, Pellon R, Sanabria F. The Effect of Methylphenidate on the Microstructure of Schedule-Induced Polydipsia in an animal model of ADHD. Behav Brain Res. 2017 Aug 30;333:211-7. 185. Rostron CL, Gaeta V, Brace LR, Dommett EJ. Instrumental conditioning for food reinforcement in the spontaneously hypertensive rat model of attention deficit hyperactivity disorder. BMC Res Notes. 2017 Oct 30;10(1):525. 186. Dela Pena I, Dela Pena IJ, de la Pena JB, Kim HJ, Shin CY, Han DH, et al. Methylphenidate and Atomoxetine-Responsive Prefrontal Cortical Genetic Overlaps in "Impulsive" SHR/NCrl and Wistar Rats. Behav Genet. 2017 Sep;47(5):564-80. 187. Rybnikovaa EA, Vetrovoia OV, Zenkoa MY. Comparative Characterization of Rat Strains (Wistar, Wistar–Kyoto, Sprague Dawley, Long Evans, LT, SHR, BD-IX) by Their Behavior, Hormonal Level and Antioxidant Status. Journal of Evolutionary Biochemistry and Physiology. 2018;54(5):374-82. 188. Hilbert P, Lindpaintner K, Beckmann JS, Serikawa T, Soubrier F, Dubay C, et al. Chromosomal mapping of two genetic loci associated with blood-pressure regulation in hereditary hypertensive rats. Nature. 1991 Oct 10;353(6344):521-9. 189. Jacob HJ, Lindpaintner K, Lincoln SE, Kusumi K, Bunker RK, Mao YP, et al. Genetic mapping of a gene causing hypertension in the stroke-prone spontaneously hypertensive rat. Cell. 1991 Oct 4;67(1):213-24. 190. Kreutz R, Struk B, Rubattu S, Hubner N, Szpirer J, Szpirer C, et al. Role of the alpha-, beta-, and gamma-subunits of epithelial sodium channel in a model of polygenic hypertension. Hypertension. 1997 Jan;29(1 Pt 1):131-6.

118
191. Sagvolden T, Dasbanerjee T, Zhang-James Y, Middleton F, Faraone S. Behavioral and genetic evidence for a novel animal model of Attention-Deficit/Hyperactivity Disorder Predominantly Inattentive Subtype. Behav Brain Funct. 2008 Dec 1;4:56. 192. Sagvolden T, Johansen EB, Woien G, Walaas SI, Storm-Mathisen J, Bergersen LH, et al. The spontaneously hypertensive rat model of ADHD--the importance of selecting the appropriate reference strain. Neuropharmacology. 2009 Dec;57(7-8):619-26. 193. Bing OH, Brooks WW, Robinson KG, Slawsky MT, Hayes JA, Litwin SE, et al. The spontaneously hypertensive rat as a model of the transition from compensated left ventricular hypertrophy to failure. J Mol Cell Cardiol. 1995 Jan;27(1):383-96.

119
CAPÍTULO 2
Is the Wistar rat a more suitable normotensive control for SHR to test blood pressure and
cardiac structure and function?
Leonardo Rezendea, Leôncio Soaresa, Filipe Drummonda, Zavagli Suareza, Luciano Leitea, Joel
Rodriguesa, Ferreira Leala , Lukiya Favaratob, Emily Reisb, Evandro Favaratob, Miguel Carneiro-
Júniora, Antônio Natalia, Cândido Coimbrac, Thales Prímola-Gomesa*.
aExercise Biology Laboratory, Physical Education Department, Federal University of Viçosa,
Viçosa, MG, Brazil; b Veterinary Department, Federal University of Viçosa, Viçosa, MG, Brazil;
Laboratory of Endocrinology and Metabolism, Physiology and Biophysics Department, Federal
University of Belo Horizonte, Belo Horizonte, MG, Brazil.
Abstract:
Background: There are divergences in the literature regarding the experimental model (Wistar-
WIS or Wistar Kyoto-WKY) to be used as control of the Spontaneously Hypertensive Rat (SHR).
The characterization of these models in terms of cardiovascular parameters provides researchers
with important tools at the time of selection and application in scientific research. Objective: The
aim of this study was to evaluate the use of WIS (Wistar) and WKY (Wistar Kyoto) as
Spontaneously Hypertensive Rat (SHR) control by assessing the long-term behavior of blood
pressure and cardiac structure and function in these strains. Methods: To this end, WIS, WKY
and SHR underwent longitudinal experiments. Blood pressure and body mass were measured
every two weeks from the 8th to the 72nd. Echocardiographic analysis was performed in all groups
with 16, 48 and 72 weeks of life. Results: The WIS group showed higher body mass compared
to WKY and SHR (p<0.05), but the WKY and SHR presented higher body mass variation along
the time (p<0.05). SHR exhibited increased values of systolic, diastolic e mean blood pressure
compared to WKY and WIS, while the WKY showed, generally, higher values than WIS
(p<0.05). Related to cardiac function, SHR showed reduced values and the WKY presented an
early decrease compared to WIS with aging (p<0.05). Conclusion: WIS is a more suitable
normotensive control for SHR than WKY in experiments to test blood pressure and cardiac
structure and function.
Keywords: Hypertension; Laboratory animals; SHR; Blood pressure; Heart.

120
1- Introduction:
Experimental animals are usually applied in the study of human health and disease,
including the use of rodents as experimental models for investigation of biological phenomenon
similar to those observed in humans (1-3). Among them, the SHR is widely used as a model for
essential hypertension investigation (3-5). For those working with these experimental animals it is
obvious and mandatory to adopt a control group in their experiments.
In this way, two experimental strains are nowadays used as SHR’s controls, namely,
WKY (6-8) and WIS (4, 5, 9). It is a historical fact that WKY was the SHR background and most used
strain as SHR control in scientific research (8, 10, 11). However, the WIS strain has also been used
(4, 5, 9, 12). Besides that, some previous studies have pointed out limitations in the use of both strains
(13-18).
Regarding these limitations, Kurtz & Morris (1987) studied the biological variability of
WKY and SHR in two laboratories in the USA during 20 weeks. Differences in growth rate and
mean arterial pressure (MAP), i.e., in biological variability in the WKY were found (17). In a
second study, the same group tested the genetic variability of these strains through genomic
analysis and found differences between WKY of different laboratories and even between animals
from the same laboratory (16). Evidence also points to the presence of increased sympathetic
activity in WKY as shown by baseline resting catecholamine concentrations similar to the levels
found in SHR (14, 19). In another study, Aiello et al. performed a series of experiments in the
myocardial of WIS, WKY and SHR and found higher left ventricle mass:body mass ratio in WKY
compared to WIS, indicating a hypertrophic process (13). The study also found an increase in
diastolic papillary muscles stiffness and fibrosis on left ventricle in the WKY similar to SHR and
higher than WIS (13).
On the other hand, limitations also have been pointed against the use of WIS. First of all
there is the fact that it is not the SHR' background (10). Furthermore, WIS have higher body mass
values compared to WKY and SHR (20). This difference brings to light an experimental paradigm
when selecting the control group since choosing WIS as control the researcher will assume to
have two groups with different body weights (21). To understand the growth behavior between
WIS, WKY and SHR, a previous study analyzed their physical development immediately after
birth, during suckling and weanling (22). It was found that WIS showed higher body mass than
WKY and SHR. Additionally, WKY presented body mass similar to SHR at birth and higher body
mass between the 1st and the 6th week of life (22). Searching the literature, there is a lack of data
that characterizes the two strains to helps scientists to select the appropriate control for their
experiments. For example, to the best of our knowledge, no study has been conducted to
specifically evaluate the use of WIS as an alternative control for WKY.

121
Therefore, the present study aimed to evaluate the use of WIS and WKY as SHR control
by assessing the long-term behavior of blood pressure and cardiac structure and function in these
strains. We hypothesized that WIS is more suitable normotensive control for SHR than WKY in
experiments to test blood pressure and cardiac structure and function.
2- Methods:
Animals:
Male WIS, WKY and SHR rats were used for all experiments from their 8th to 72nd week
of life. The animals were housed in collective cages and allocated in a controlled environment
with light/dark cycle (12/12h), temperature at 22 ± 2 °C, and had free access to food and water
(ad libitum). The animals were obtained from the central biotery of the Federal University of
Viçosa-UFV.
Ethical approval:
The experiments were conducted in accordance to the Guide for the Care in Laboratory
Animal Use principles and approved by the Ethics Committee on the Use of Animals of the
Federal University of Viçosa (Protocol 09/2018). All procedures were attended by a veterinarian.
Body mass:
Body mass (g) was obtained every two weeks, from the 8th to the 72nd week of life, on
an electronic scale (Rochelle, model 3252). In order to monitor the animals weight gain behavior,
body mass variation (Δ) was calculated.
Blood pressure:
Systolic Blood Pressure (SBP in mmHg) and Diastolic Blood Pressure (DBP in mmHg)
were measured using the noninvasive method of tail plethysmography (LE5001; Panlab,
Barcelona- Spain), as previously described (23). Briefly, animals were adapted to a tail cuff and a
heating apparatus during five consecutive days. After, animals underwent blood pressure
measurements each two weeks. Each measurement was performed three times and the median
value was used. All measurements were performed by the same researcher in a quiet environment
(24). Mean Arterial Pressure (MAP in mmHg) was calculated by the following equation: DBP +
1/3(SBP-DBP).

122
Echocardiogram:
An echocardiographic analysis was performed in all groups with 16, 48 and 72 weeks of
life. The animals underwent to inhalation anesthesia (Isoflurane 1.5% and 100% O2 at constant
flow rate of 1L/min; Isoflurane, BioChimio, RJ- Brazil) and placed in lateral decubitus position.
Two-dimensional tests were performed with rapid sampling rate (frame rate) of 120 fps and M-
mode, using the ultrasound system (MyLabTM30 - Esaote, Genoa- Italy) and 11.0 MHz nominal
frequency transducers (phased array). Two-dimensional transthoracic echocardiography and M-
mode were obtained at a scanning speed of 200 mm, adjusted according to heart rate. The images
were collected according to the recommendations of the American Society of Echocardiography
and stored for further analysis (25). The left ventricle diameter in diastole (LVDd in mm), left
ventricle diameter in systole (LVDs in mm), interventricular septum in diastole (IVSd in mm),
interventricular septum in systole (IVSs in mm) posterior wall thickness in diastole (PWd in mm),
ejection fraction (EF in %) and shortening fraction (FS in %) were measured using a modified
method recommended by the American Society of Echocardiography for three consecutive
cardiac cycles. The examinations were performed by a trained researcher through single-blinded
method. Left ventricle mass (LVM in g) was calculated as follows (26): LVM= 0.8 (1.04 (IVSd +
LVDd + PWd)3 – (LVDd)3) 0.14. The ratio of LVM to body mass (LVM:BM in mg:g) was
calculated as an index of ventricular hypertrophy.
Statistic:
The Shapiro-Wilk test was applied to analyze data normality. Two-Way ANOVA of
repeated measures followed by Tukey post hoc tests were used to analyze body mass, Δ body
mass, blood pressure and echocardiographic results. A significance level of 5% was set. Data are
presented as mean ± SD.
3- Results:
Body mass and body mass variation. Fig.1A shows the results for body mass. A strain
effect for all groups was found (p<0.05). WIS presented higher body mass than WKY and SHR
during the entire period (p<0.05). Also, between the 8th and the 20th weeks, WKY presented higher
body mass compared to SHR (p<0.05). Fig.1B shows the results for body mass variation. A strain
effect for all groups was found (p<0.05). SHR showed higher variation than WIS from the 22nd
to the 72nd week (p<0.05) and higher variation than WKY at 30th, 34th - 50th and 54th - 58th weeks

123
(p<0.05). It was also observed that WKY presented higher variation than WIS at 12th - 16th, 24th
- 30th, 34th - 44th and 60th - 64th weeks (p<005).
Blood pressure. There was a strain effect for all groups (p<0.05). Fig.2A shows the results
of SBP. SHR presented higher SBP than WIS and WKY during the entire experimental period
(p<0.05). Also, WKY presented higher SBP between the 10th and the 16th week and in the 20th,
26th, 30th and between 34th and 72nd weeks (p<0.05). Fig.2B shows the results for DBP. SHR
Figure 1. Long-term behavior of body mass (A) and Δ body mass (B) of WIS (n=8), WKY (n=8) and SHR (n=8) over 72wk.
Data are presented as mean ± SD. Statistical significance (p<0.05) are showed as follows: † = WIS vs. WKY; ‡ = WKY vs.
SHR; * = WIS vs. SHR.

124
presented higher DBP than WIS and WKY in the 8th week (p<0.05). From the 16th week, SHR
showed higher DBP than WIS (p<0.05). In the 18th week and in-between the 22nd and 72nd weeks,
SHR showed higher DBP than WKY (p<0.05). WKY presented higher DBP than WIS from week
40 on, specifically in the 40th, 42nd, 46th – 50th, 56th – 62nd, 70th and 72nd weeks (p<0.05). Fig.2C
shows the MAP results. SHR presented higher MAP value than WIS during the entire
experimental period (p<0.05). Compared to WKY, and in the 8th, 14th, 18th, 22nd, 24th and 30th –
72nd weeks, SHR presented increased MAP (p<0.05). WKY presented higher MAP than WIS in
the 20th, 26th, 28th, 32nd, 40th – 48th, 54th – 58th, 70th and 72nd weeks (p<0.05). Finally, in the SHR
group it was observed a time-dependent increase in SBP, DBP and MAP from 28th week on.
Echocardiographic parameters. Fig.3 shown the representative echocardiographic
images of animals with 16, 48 and 72 weeks of life. Tab.1 shows structural and functional
echocardiographic results. Concerning cardiac structure, there was a strain effect for all groups
for LVDd (p<0.05). WKY presented lower LVDd than WIS and SHR in the 16th week (p<0.05).
In the 48th and 72nd weeks, WIS presented higher LVDd than WKY (p<0.05). An aging effect was
also observed. WIS and WKY showed increased in LVDd in the 48th and 72nd compared to the
16th weeks (p<0.05). For LVDs, both strain and aging effects were observed. SHR showed higher
LVDs than WIS and WKY (p<0.05). WKY presented lower LVDs compared to WIS in the 16th
week (p<0.05). WIS and WKY presented increased LVDs in the 48th and 72nd compared to the
16th weeks (p<0.05). A strain effect was observed for PWd. The WKY and SHR presented higher
PWd compared to WIS in the 48th and 72nd weeks (p<0.05). When analyzing the thickness of the
interventricular septum no differences were found (p>0.05). For LVM, both strain and aging
effects were found (p<0.05). SHR presented higher LVM compared to WIS and WKY in the 16th,
48th and 72nd weeks (p<0.05). WKY and SHR showed increased LVM in the 48th and 72nd
compared to the 16th weeks (p<0.05). A strain effect was found for LVM:BM (p<0.05). SHR
presented higher LVM:BM compared to WIS and WKY in the 16th, 48th and 72nd weeks (p<0.05).

125
Figure 2. Long-term behavior of SBP (A), DBP (B) and MAP (C) of WIS (n=8), WKY (n=8) and SHR
(n=8). The dotted line indicates the moment of significant increase in SHR. Data are presented as mean ±
SD. Statistical significance (p<0.05) are showed as follows: † = WIS vs. WKY; ‡ = WKY vs. SHR; * =
WIS vs. SHR.

126
Figure 3. Representative echocardiographic images of animals with 16, 48 and 72 weeks of life. A= WIS16; B= WIS48; C= WIS72; D= WKY16; E= WKY48; F= WKY72; G= SHR16; H= SHR48; I=
SHR72

127
Regarding cardiac function both strain and aging effects were found for EF (p<0.05). SHR
presented lower EF compared to WIS and WKY at 16th week (p<0.05). WIS presented decreased EF in
the 72nd compared to 16th week (p<0.05), while WKY presented lower EF in the 48th and 72nd compared
to the 16th weeks (p<0.05). Regarding SF, both strain and aging effects were found (p<0.05). SHR
presented lower SF compared to WIS and WKY in the 16th week (p<0.05). WKY presented decreased
SF in the 48th and 72nd compared to 16th week (p<0.05), while WIS presented a decrease of SF only in
the 72nd week compared to the 16th and 48th weeks (p<0.05).

128
Table 1. Long term behavior of morphological and functional echocardiographic parameters of WIS, WKY and SHR with 16, 48 and 72 weeks.
WIS16 (n=8) WKY16 (n=8) SHR16 (n=8) WIS48 (n=6) WKY48 (n=8) SHR48 (n=8) WIS72 (n=8) WKY72 (n=8) SHR72 (n=8)
Morphological parameters
LVDd 7.10 ± 0.17 4.95 ± 0.39† 7.40 ± 0.20‡ 8.60 ± 0.23§ 7.56 ± 0.31§† 8.06 ± 0.22 8.50 ± 0.16# 7.28 ± 0.30# † 8.06 ± 0.33
LVDs 4.32 ± 0.22 2.81 ± 0.25† 5.52 ± 0.31*‡ 5.58 ± 0.21§ 5.45 ± 0.44§ 5.76 ± 0.20 6.20 ± 0.19# 5.36 ± 0.32# 5.98 ± 0.22
IVSd 1.79 ± 0.07 1.93 ± 0.17 1.90 ± 0.08 1.82 ± 0.12 1.57 ± 0.18 2.08 ± 0.08 1.83 ± 0.10 1.69 ± 0.13 1.93 ± 0.11
IVSs 2.00 ± 0.09 2.07 ± 0.14 1.78 ± 0.12 2.02 ± 0.12 1.80 ± 0.26 2.10 ± 0.13 1.85 ± 0.09 1.85 ± 0.20 1.93 ± 0.13
PWd 1.40 ± 0.08 2.01 ± 0.23 2.01 ± 0.15 1.11 ± 0.06 2.10 ± 0.12† 2.21 ± 0.25* 1.22 ± 0.14 2.02 ± 0.08† 2.55 ± 0.30*
LVM 0.76 ± 0.03 0.62 ± 0.04 1.02 ± 0.05*‡ 0.91 ± 0.05 0.96 ± 0.04§ 1.3 ± 0.11§*& 0.94 ± 0.07 0.93 ± 0.02# 1.36 ± 0.08#*‡
LVM/BM 1.61 ± 0.09 2.04 ± 0.18 4.01 ± 0.18*‡ 2.14 ± 0.21 2.57 ± 0.16 3.65 ± 0.30*‡ 1.93 ± 0.16 2.29 ± 0.08 3.50 ± 0.20*‡
Functional parameters
EF 75.25 ± 2.30 80.00 ± 2.00 55.12 ± 5.80*‡ 69.80 ± 2.25 59.80 ± 5.07§ 60.87 ± 1.51 58.50 ± 2.49# 57.75 ± 3.01# 54.62 ± 4.36
FS 39.50 ± 1.90 43.37 ± 2.18 25.75 ± 3.23*‡ 35.50 ± 1.58 28.50 ± 3.10§ 28.75 ± 0.99 27.30 ± 1.49#¶ 26.87 ± 1.82# 25.50 ± 2.52
LVDd– Left ventricle diameter in diastole (in mm); LVDs- Left ventricle diameter in systole (in mm); IVSd- Interventricular septum in diastole (in mm); IVSs- Interventricular septum in systole (in mm);
PWd - Posterior wall thickness in diastole (in mm); LVM - Left ventricle mass (in g); LVM/BM - Left ventricle mass:body mass ratio (in mg:g); EF - Ejection fraction (in %); FS - Shortening fraction (in
%). Data are presented as mean ± SD. Statistical significance (p<0.05) are showed as follows: † = WKY vs. WIS; ‡ = SHR vs. WKY; * = SHR vs. WIS; § = 48 vs. 16; # = 72 vs. 16; ¶ = 72 vs. 48.

129
4- Discussion:
The present study assessed the long-term behavior of blood pressure and cardiac structure
and function in SHR and both WIS and WKY as controls. For this purpose, we assessed blood
pressure and cardiac structure and function over 72 weeks. We confirmed our hypothesis that,
regardless of body weight variations, when the cardiovascular issue is considered to select the
control group, WIS is a more suitable normotensive control for SHR than WKY.
Our main findings were: 1) The blood pressure values in WKY were intermediate
between SHR and WIS and close to hypertension borderline; and WIS showed pressure values
more consistent with those expected for normotensive rats; and 2) WKY presented earlier
reductions in cardiac function compared to WIS.
The correct choice of the control group is essential and has great importance, as it allows
to analyze one variable at a time, making it possible to isolate the variable of interest (27, 28). For
such purpose, the scientific research must be systematically planned and executed, using
appropriate methods and tools (29). Usually, the use of SHR as a model of essential hypertension
requires a normotensive group as control (4, 5, 30). However, researchers face an experimental
paradigm, since they must choose controls matching by body mass or by age (4, 21, 22, 31).
We found important differences in the body mass and body mass variation between the
tested strains over 72 weeks. During entire life period, WIS present higher body mass than WKY
and SHR. However, body mass variation was higher in WKY and SHR strains, which indicates
accentuated growth in these strains. A previous work evaluated the food intake of five
experimental strains, including WIS, WKY and SHR, and found increased food consumption in
WKY and SHR, which can explain the higher body mass variation observed here (31). However,
it is important to highlight that the development of hypertension in SHR is age-dependent rather
than body mass-dependent (21).
According to Okamoto and Aoki (1963), the reference value to classify rats as
hypertensive is SBP above 150 mmHg (10). The experimental animals in the present study were
classified as follows: WIS – normotensive (116-126 mmHg); WKY – normotensive (132-146
mmHg); and SHR - hypertensive (155-203 mmHg). This profile also reflected in altered MAP
results. Despite the fact that WIS and WKY were classified as normotensive, it is important to
note that WKY strain present higher SBP values than WIS and, more important, close to
hypertension borderline. It is known that the chronic increase in blood pressure leads to
consequences such as left ventricular concentric hypertrophy, arterial stiffness, stroke, myocardial
infarction and heart failure (32-35). Moreover, previous studies have shown divergent blood pressure
variability among the WKY from different laboratories (16, 17). Such differences have been

130
confirmed by several studies that classified WKY as both normotensive (8, 13) and hypertensive (6,
7, 11, 20, 36). It is noteworthy that no previous work was found assessing the biological variability of
WIS. Thus, the long-term behavior of blood pressure observed in WKY group allows its use,
though draws attention and requires caution in the use of these animals as SHR control.
It is also important to mention the abrupt increase in SBP, DBP and MAP in SHR on the
28th week. Such results may be explained by understanding the disease progression in SHR (3, 37).
Previous results show blood vessel hypertrophy on the 4th week of age as the first event related to
the disease, despite the SBP values be still like normotensive (38). Additionally, the
prehypertension stage can last up to 4th months of age (3). After this moment, compensated
hypertension is installed, in which the SHR reaches the SBP of 150 mmHg with an increase in
the thickness of the cardiac walls concomitantly with the reductions in the left ventricular internal
diameter. This structural rearrangement occurs to cope with the stress imposed by pressure
overload on the cardiac walls and promote maintenance of systolic function and may last until the
sixth month of age (39, 40). Our data shows that around the 6th to the 7th month established and
balanced hypertension is observed, characterizing the stage of decompensated hypertension (37,
40). With the disease progression, between 18th and 24th months of age SHR reaches the heart
failure stage (40). In fact, 20 week-old SHR presents higher SBP compared to that of 12 week-old
animals (41) and equivalent results have already been demonstrated by others (38, 41).
Regarding the cardiac structure assessed by echocardiography, we observed that WKY
with 16 weeks presented lower LVDd and LVDs compared to WIS and SHR. Moreover, LVDd
was also lower in WKY than in WIS animals 48- and 72-week old. Both WIS and WKY presented
increased LVDd and LVDs with aging. In addition, WKY and SHR showed higher PWd
compared to WIS in weeks 48 and 72. Left ventricular remodeling is a process by which the
cardiac chamber undergoes changes in its shape, size and function, and may occur as a result of
either physiological (i.e. physical training) (8) or pathophysiological (i.e. hypertension stimuli) (42).
Pathophysiological hypertrophy is normally caused by high pressure overload in the cardiac
chambers, leading to reductions in the left ventricular diameter, accompanied by increases in the
ventricular walls’ width (43).
Morphological changes directly affect cardiovascular function. The long-term
pathological hypertrophy cause cardiac adverse remodeling of the extracellular matrix, such as
increases in collagen content, which promote tissue stiffening, affecting thus the diastolic function
leading to systolic dysfunction (44). The left ventricle is responsible for blood ejection and its
morphology is crucial for pump appropriated functioning (39, 45). We demonstrated that SHR group
had higher values for LVM than WIS and WKY. With aging both WKY and SHR exhibited
significant increases in LVM when compared to week 16th. To confirm the pathological

131
hypertrophic process the LVM/BM ratio was calculated (44) and hypertrophy was not found in the
WKY strain. Thus, probably the overload imposed by the increased SBP was not sufficient to
promote pathological hypertrophy in WKY. However, a previous work found that the
hemodynamic cardiac load is more evident in isolated cardiomyocytes than in whole ventricle (7).
In addition to left ventricle analysis, the PWd of WKY and SHR was larger compared to WIS on
weeks 48 and 72.
Concerning cardiac function, different from other study that showed late decreases in the
cardiac function of SHR over lifetime (30), in this study we found decreases in both EF and FS in
SHR from the 16th week on. The WKY, however, presented normal values for EF and FS in the
16th week followed by reductions in the 48th and 72th weeks. This finding is in agreement with
previous studies showing that WKY had diastolic dysfunction as a consequence of increased
pressure overload (13). Finally, cardiac dysfunction was observed in WIS only in the 72th week.
5- Conclusions:
In conclusion, Wistar rat is a more suitable normotensive control for SHR than Wistar
Kyoto in experiments to test issues related to blood pressure and cardiac structure and function in
different ages inasmuch as Wistar Kyoto exhibits early reductions in cardiac function and values
for blood pressure in the upper limit of normal pressure.
Acknowledgements:
This study was supported in part by CNPq (Conselho Nacional de Desenvolvimento
Científico e Tecnológico), CAPES (Coordenação de Aperfeiçoamento de Pessoal de Nível
Superior) and FAPEMIG (Fundação de Amparo à Pesquisa do Estado de Minas Gerais). AJ
Natali is a CNPq fellow.

132
6- References:
1. Casals JB, Pieri NC, Feitosa ML, Ercolin AC, Roballo KC, Barreto RS, et al. The use of animal
models for stroke research: a review. Comp Med. 2011 Aug;61(4):305-13.
2. Chatzigeorgiou A, Halapas A, Kalafatakis K, Kamper E. The use of animal models in the
study of diabetes mellitus. In Vivo. 2009 Mar-Apr;23(2):245-58.
3. Doggrell SA, Brown L. Rat models of hypertension, cardiac hypertrophy and failure.
Cardiovascular Research. 1998 Jul;39(1):89-105.
4. Campos HO, Leite LHR, Drummond LR, Cunha DNQ, Coimbra CC, Natali AJ, et al.
Temperature Control of Hypertensive Rats during Moderate Exercise in Warm Environment. J
Sport Sci Med. 2014 Sep;13(3):695-701.
5. Drummond LR, Kunstetter AC, Vaz FF, Campos HO, Andrade AG, Coimbra CC, et al. Brain
Temperature in Spontaneously Hypertensive Rats during Physical Exercise in Temperate and
Warm Environments. Plos One. 2016;11(5):e0155919.
6. Christensen KL. Reducing pulse pressure in hypertension may normalize small artery
structure. Hypertension. 1991 Dec;18(6):722-7.
7. Deschepper CF, Picard S, Thibault G, Touyz R, Rouleau JL. Characterization of
myocardium, isolated cardiomyocytes, and blood pressure in WKHA and WKY rats. Am J Physiol
Heart Circ Physiol. 2002 Jan;282(1):H149-55.
8. Graham DA, Rush JW. Exercise training improves aortic endothelium-dependent
vasorelaxation and determinants of nitric oxide bioavailability in spontaneously hypertensive
rats. J Appl Physiol (1985). 2004 Jun;96(6):2088-96.
9. Locatelli J, Paiva NCN, Carvalho SHR, Lavorato VN, Gomes L, Castro QJT, et al. Swim
training attenuates the adverse remodeling of LV structural and mechanical properties in the
early compensated phase of hypertension. Life Sci. 2017 Oct 15;187:42-9.
10. Okamoto K, Aoki K. Development of a strain of spontaneously hypertensive rats. Jpn Circ
J. 1963 Mar;27:282-93.
11. Prieto I, Segarra AB, Gasparo M, Martínez-Cañameroa M, Ramírez-Sánchez M. Divergent
profile between hypothalamic and plasmatic aminopeptidase activities in WKY and SHR.
Influence of beta-adrenergic blockade. Life Sciences. 2018;192:9-17.
12. Gomes L, Drummond LR, Campos HO, Rezende LMT, Carneiro-Junior MA, Oliveira A, et
al. Thermoregulation in Hypertensive Rats during Exercise: Effects of Physical Training. Arq Bras
Cardiol. 2019 Mar 14.
13. Aiello EA, Villa-Abrille MC, Escudero EM, Portiansky EL, Perez NG, de Hurtado MC, et al.
Myocardial hypertrophy of normotensive Wistar-Kyoto rats. Am J Physiol Heart Circ Physiol.
2004 Apr;286(4):H1229-35.
14. Chiueh CC, McCarty R. Sympatho-adrenal hyperreactivity to footshock stress but not to
cold exposure in spontaneously hypertensive rats. Physiol Behav. 1981 Jan;26(1):85-9.

133
15. Collins HL, Loka AM, DiCarlo SE. Daily exercise-induced cardioprotection is associated
with changes in calcium regulatory proteins in hypertensive rats. American Journal of
Physiology-Heart and Circulatory Physiology. 2005;288:H532–H40.
16. Kurtz TW, Montano M, Chan L, Kabra P. Molecular evidence of genetic heterogeneity in
Wistar-Kyoto rats: implications for research with the spontaneously hypertensive rat.
Hypertension. 1989 Feb;13(2):188-92.
17. Kurtz TW, Morris RC, Jr. Biological variability in Wistar-Kyoto rats. Implications for
research with the spontaneously hypertensive rat. Hypertension. 1987 Jul;10(1):127-31.
18. Langen B, Dost R. Comparison of SHR, WKY and Wistar rats in different behavioural
animal models: effect of dopamine D1 and alpha2 agonists. Atten Defic Hyperact Disord. 2011
Mar;3(1):1-12.
19. Hendley ED, Cierpial MA, Mccarty R. Sympathetic-Adrenal Medullary Response to Stress
in Hyperactive and Hypertensive Rats. Physiology & Behavior. 1988;44(1):47-51.
20. Sanada LS, Tavares MR, Neubern MC, Salgado HC, Fazan VP. Can Wistar rats be used as
the normotensive controls for nerve morphometry investigations in spontaneously hypertensive
rats (SHR)? Acta Cir Bras. 2011 Dec;26(6):514-20.
21. Hom S, Fleegal MA, Egleton RD, Campos CR, Hawkins BT, Davis TP. Comparative changes
in the blood-brain barrier and cerebral infarction of SHR and WKY rats. Am J Physiol Regul Integr
Comp Physiol. 2007 May;292(5):R1881-92.
22. Gattone VH, 2nd. Body weight of the spontaneously hypertensive rat during the suckling
and weanling periods. Jpn Heart J. 1986 Nov;27(6):881-4.
23. Byrom FB, Wilson C. A plethysmographic method for measuring systolic blood pressure
in the intact rat. J Physiol. 1938 Aug 15;93(3):301-4.
24. Fink GD. Does Tail-Cuff Plethysmography Provide a Reliable Estimate of Central Blood
Pressure in Mice? Journal of the American Heart Association. 2017;6(6):1-3.
25. Sahn DJ, DeMaria A, Kisslo J, Weyman A. Recommendations regarding quantitation in
M-mode echocardiography: results of a survey of echocardiographic measurements. Circulation.
1978 Dec;58(6):1072-83.
26. Brown L, Fenning A, Chan V, Loch D, Wilson K, Anderson B, et al. Echocardiographic
assessment of cardiac structure and function in rats. Heart Lung Circ. 2002;11(3):167-73.
27. Kinser PA, Robins JL. Control group design: enhancing rigor in research of mind-body
therapies for depression. Evid Based Complement Alternat Med. 2013;2013:140467.
28. Pithon MM. Importance of the control group in scientific research. Dental Press J
Orthod. 2013 Nov-Dec;18(6):13-4.
29. Gu J, Li XB, Tian LH. [Scientific research accomplishment of medical staff]. Zhonghua Yi
Xue Za Zhi. 2013 Mar 12;93(10):735-7.
30. Slama M, Ahn J, Varagic J, Susic D, Frohlich ED. Long-term left ventricular
echocardiographic follow-up of SHR and WKY rats: effects of hypertension and age. Am J Physiol
Heart Circ Physiol. 2004 Jan;286(1):H181-5.

134
31. Gordon CJ, Phillips PM, Johnstone AF. Impact of genetic strain on body fat loss, food
consumption, metabolism, ventilation, and motor activity in free running female rats. Physiol
Behav. 2016 Jan 1;153:56-63.
32. Chae CU, Pfeffer MA, Glynn RJ, Mitchell GF, Taylor JO, Hennekens CH. Increased pulse
pressure and risk of heart failure in the elderly. JAMA. 1999 Feb 17;281(7):634-9.
33. Levy D, Larson MG, Vasan RS, Kannel WB, Ho KK. The progression from hypertension to
congestive heart failure. JAMA. 1996 May 22-29;275(20):1557-62.
34. McCrossan ZA, Billeter R, White E. Transmural changes in size, contractile and electrical
properties of SHR left ventricular myocytes during compensated hypertrophy. Cardiovasc Res.
2004 Aug 1;63(2):283-92.
35. Pawlush DG, Moore RL, Musch TI, Davidson WR, Jr. Echocardiographic evaluation of size,
function, and mass of normal and hypertrophied rat ventricles. J Appl Physiol (1985). 1993
May;74(5):2598-605.
36. Bomfim GHS, Mendez-Lopez I, Fernandez-Morales JC, Padin JF, Jurkiewicz A, Jurkiewicz
NH, et al. Electrophysiological properties and augmented catecholamine release from
chromaffin cells of WKY and SHR rats contributing to the hypertension development elicited by
chronic EtOH consumption. Eur J Pharmacol. 2017 May 15;803:65-77.
37. Boluyt MO, Bing OH, Lakatta EG. The ageing spontaneously hypertensive rat as a model
of the transition from stable compensated hypertrophy to heart failure. Eur Heart J. 1995 Dec;16
Suppl N:19-30.
38. Adams MA, Bobik A, Korner PI. Differential development of vascular and cardiac
hypertrophy in genetic hypertension. Relation to sympathetic function. Hypertension. 1989
Aug;14(2):191-202.
39. Grossman W. Cardiac hypertrophy: useful adaptation or pathologic process? Am J Med.
1980 Oct;69(4):576-84.
40. Bing OH, Brooks WW, Robinson KG, Slawsky MT, Hayes JA, Litwin SE, et al. The
spontaneously hypertensive rat as a model of the transition from compensated left ventricular
hypertrophy to failure. J Mol Cell Cardiol. 1995 Jan;27(1):383-96.
41. Bacharova L, Kyselovic J, Klimas J. The initial stage of left ventricular hypertrophy in
spontaneously hypertensive rats is manifested by a decrease in the QRS amplitude/left
ventricular mass ratio. Clin Exp Hypertens. 2004 Aug;26(6):557-67.
42. Ganau A, Devereux RB, Roman MJ, de Simone G, Pickering TG, Saba PS, et al. Patterns
of left ventricular hypertrophy and geometric remodeling in essential hypertension. J Am Coll
Cardiol. 1992 Jun;19(7):1550-8.
43. Grant C, Greene DG, Bunnell IL. Left ventricular enlargement and hypertrophy. A clinical
and angiocardiographic study. Am J Med. 1965 Dec;39(6):895-904.
44. Brower GL, Gardner JD, Forman MF, Murray DB, Voloshenyuk T, Levick SP, et al. The
relationship between myocardial extracellular matrix remodeling and ventricular function.
European Journal of Cardio-Thoracic Surgery. 2006;30(4):604-10.

135
45. Linzbach AJ. Heart failure from the point of view of quantitative anatomy. Am J Cardiol.
1960 Mar;5:370-82.

136
CAPÍTULO 3
Core temperature circadian rhythm across aging in Spontaneously Hypertensive
Rats
Authors:
Leonardo M.T de Rezendea, Leandro C. Britob, Anselmo G. Mouraa, Alexandre J.L.D.
Costaa, Tiago F. Leala, Evandro S. Favarato c, Lukiya S.C. Favaratoc, Antônio J. Natalia,
Cândido C. Coimbrad, Thales N. Prímola-Gomesa.
a- Laboratório de Biologia do Exercício, Departamento de Educação Física, Universidade
Federal de Viçosa, Viçosa, MG, Brasil.
b- Laboratório de Hemodinâmica da Atividade Locomotora, Escola de Educação Física
e Esporte, Universidade de São Paulo, São Paulo, SP, Brasil. Escola de Artes, Ciências e
Humanidades, Universidade de São Paulo, São Paulo, SP, Brasil.
c- Departamento de Medicina Veterinária, Universidade Federal de Viçosa, Viçosa, MG,
Brasil.
d- Laboratório de Endocrinologia e Metabolismo, Departamento de Fisiologia e Biofísica,
Universidade Federal de Minas Gerais, Belo Horizonte, MG, Brasil.
Abstract
The purpose of this study was to evaluate the circadian rhythm of core temperature (Tcore)
across aging in Spontaneously Hypertensive Rats (SHR) with comparison to the two rat
strains often used as their normotensive control animals, namely, Wistar (WIS) and
Wistar Kyoto (WKY). Methods: WIS, WKY and SHR rats were subdivided into three
different groups according their age: WIS16, WIS48, WIS72, WKY16, WKY48,
WKY72, SHR16, SHR48 and SHR72 weeks-old. Body mass and blood pressure were
periodically measured along the experiments. All animal group had their circadian rhythm
of Tcore evaluated over three consecutive days (72 hours) by telemetry using an implanted
temperature sensor. The Tcore circadian rhythm was averaged in 1-h blocks and analyzed
using the cosinor method. Results: Sixteen-week-old SHR (SHR16) presented higher
Tcore than WIS16 (from 06am to 06pm) and WKY16 (from 07am to 06pm). Both
normotensive groups exhibited increases in Tcore during circadian rhythm with aging. The
cosinor analysis showed no differences between strains and ages for the acrophase. An
age effect on the SHR strain (SHR16 < SHR72) was observed regarding the amplitude.

137
SHR16 had higher values regarding MESOR compared to WIS16 and WKY16. In
addition, WIS72 and WKY72 showed higher values than WIS16 and WKY16,
respectively. Finally, no differences were observed in the strength rhythm analysis.
Conclusions: SHR presented impaired thermoregulatory control at only 16 weeks of age
when showing a higher body temperature during the activity phase, while other circadian
rhythm parameters showed no differences across aging. Therefore, in taking our results
as a whole we can conclude that WIS and WKY are appropriate Wistar strains to be used
as normotensive controls for SHR.
Keywords: Circadian rhythm; body core temperature; hypertension; experimental
strains.

138
1. Introduction
Several threats to human health have arisen in recent decades due to global
warming and constant heat waves (Nybo et al., 2017). Thus, the study of thermoregulation
has become extremely important, especially among hypertensive and aging populations
who are known to be more susceptible to heat-related illnesses during heat waves (Argaud
et al., 2007; Ellis, 1972). Accordingly, the development of experimental models to study
these issues is essential. Therefore, despite the fact that Spontaneously Hypertensive Rat
(SHR) is a widely used essential experimental model for human hypertension (Okamoto
and Aoki, 1963), little is known about its thermoregulation including the Tcore circadian
rhythm in aging SHR.
The first studies aimed to evaluate thermoregulation in SHR usually found higher
Tcore values (~1ºC) than that of normotensive Wistar Kyoto (WKY) (Wilson et al., 1977;
O'Donnell and Volicer, 1981; Collins et al., 1987), which they attributed to: i) increased
metabolic heat production uncompensated by increased respiratory evaporative heat loss
or effective tissue thermal conductance (Collins et al., 1987); ii) impaired
thermoregulatory cutaneous tail vasodilation (O'Leary and Wang, 1994); and iii)
hypothalamic dysfunction (Wilson et al., 1977). It was later shown that SHR did not
present baseline elevations in Tcore when not stressed. In fact, it was shown by telemetric
measurements that stress such as heat exposure, handling, restraint, or even the presence
of a colonic temperature probe would promote significant increases in Tcore in SHR
(Berkey et al., 1990; Morley et al., 1990), which was reinforced in recent experiments
showing the inability of SHR to deal with exercise-induced hyperthermia (Campos et al.,
2014; Drummond et al., 2019; Drummond et al., 2016). Thus, taken together these studies
point to impaired thermoregulatory control in SHR in stressed conditions.
In addition, the declines observed in cardiovascular function and responses to
thermal challenge during aging may further affect thermal balance in SHR. As in humans,
hypertension in SHR is sequentially established as pre-hypertensive, developing and
sustained phases (Doggrell and Brown, 1998). Also, it is has been proposed that the aging
SHR is a model of the transition from stable compensated hypertrophy to heart failure
(Boluyt et al., 1995), presenting increased cardiac output alongside with normal total
peripheral resistance in the earlier stages of the disease (Smith and Hutchins, 1979). This
condition changes as the disease progresses, with hypertrophy of blood vessels leading to
increased total peripheral resistance and the cardiac output values returning to normal

139
(Smith and Hutchins, 1979). Moreover, SHR also presents endothelial dysfunction (Kerr
et al., 1999), sympathetic hyperactivity (Judy et al., 1976) and decreased baroreceptor
sensitivity (Andresen and Yang, 1989). Overall, these changes may help to explain the
increased Tcore stress-related seen in SHR.
Tcore, as well as blood pressure, works under a circadian pattern, which enables
mammalian animals to adapt to predictable changes in the environment and known
behavior such as the light/dark and activity/rest cycles (Golombek and Rosenstein, 2010;
Refinetti, 2003). This circadian pattern is ruled by the suprachiasmatic nucleus as the
central clock, and is supported by peripheral ones (Chen and Yang, 2015; Golombek and
Rosenstein, 2010). This machinery is supposed to be threatened by the aging process and
the presence of clinical conditions (Gordon, 2008; Halberg et al., 1981; Refinetti et al.,
1990). Regarding aging SHR and despite the fact that many previous studies have
evaluated the inability of SHR to regulate Tcore in stressful situations, no previous study
has evaluated the circadian rhythm of Tcore in these animals. Information is available
about other experimental models. For example, a previous study observed a reduction of
amplitude and an advancement of acrophase on Tcore in 14 month-old stroke-prone
hypertensive rats (Halberg et al., 1981). However, the stroke-prone SHR are a substrain
of hypertensive animals which are most used for stroke incidence studies (Doris, 2017),
while the SHR strain is actually the model for essential hypertension (Okamoto and Aoki,
1963). Furthermore, a day-light elevation in Tcore was found in aging Brown Norway Rats
which appears at 8 months of age and persists until 24-months of age in these rats
(Gordon, 2008). This elevation was also observed in senescent 21-month-old rats
compared to adult 9-month-old rats (Gordon et al., 2014). The authors suggested that Tcore
would be an important physiological biomarker of age in this strain. Therefore, the study
of how hypertension and aging influence the circadian rhythm of Tcore should also be done
in senescent SHR.
The SHR originated from a WKY strain in Kyoto-Japan in 1963 and WKY is the
inbreed control of SHR (Okamoto and Aoki, 1963). However, WKY present some
limitations, including left ventricle hypertrophy without hypertension and elevated blood
pressure (Aiello et al., 2004; Altura et al., 1980; Widimsky et al., 1991). Given this, the
literature points to extensive use of normotensive WKY and Wistar (WIS) rats for SHR
control without considering which strain would be a better or even an inappropriate
control to study the Tcore circadian rhythm in SHR.

140
Therefore, the present study evaluated the Tcore circadian rhythm in SHR across
aging and compared it to the most used control strains (WIS and WKY). We hypothesized
that aging and hypertension could lead to deleterious losses in the circadian rhythm of
SHR. In addition, we also tested the hypothesis whether there are possible differences
between WIS and WKY compared to SHR animals across aging.
2. Materials and methods
2.1. Sample
The sample was composed by three groups of Wistar (WIS), Wistar Kyoto (WKY)
and Spontaneously Hypertensive Rats (SHR). The two normotensive strains (i.e. WIS and
WKY) were used to test the hypothesis that there would be no differences between the
use of WIS or WKY as SHR controls. In addition, these groups were subdivided into
three age groups to test the hypothesis that aging and hypertension could lead to
deleterious losses in the circadian rhythm of SHR, namely: 1) WIS16 – Wistar at 16
weeks of age; 2) WIS48 – Wistar at 48 weeks of age; 3) WIS72 – Wistar at 72 weeks of
age; 4) WKY: WKY16 – Wistar Kyoto at 16 weeks of at; 5) WKY48 – Wistar Kyoto at
48 weeks of age; 6) WKY72 – Wistar Kyoto at 72 weeks of age; 7) SHR: SHR16 –
Spontaneously Hypertensive Rats at 16 weeks of age; 8) SHR48 – Spontaneously
Hypertensive Rats at 48 weeks of age; and 9) SHR72 – Spontaneously Hypertensive Rats
at 72 weeks of age.
The animals were housed in collective cages (five per cage) and allocated in a
controlled environment with light/dark cycle (12/12h), temperature at 22 ± 2 °C, and had
free access to food and water (ad libitum). The animals were obtained from the central
animal house of the Federal University of Viçosa-UFV.
The project was approved by the Animal Use Ethics Commission (CEUA-UFV)
of the UFV (Protocol 08/2018) and was conducted in accordance with the principles of
the Guide for Care in the Use of Laboratory Animals (Neves et al., 2013).
2.2. Blood pressure and body mass
Body mass (g) was obtained using an electronic scale (Rochelle, model 3252).
Systolic blood pressure (SBP; mmHg) and diastolic blood pressure (DBP; mmHg) were
measured using the non-invasive method of tail plethysmography (LE5001; Panlab,
Barcelona- Spain), as previously described (Byrom and Wilson, 1938). Before the
measurements the animals were adapted to a plethysmograph transductor and cuff during
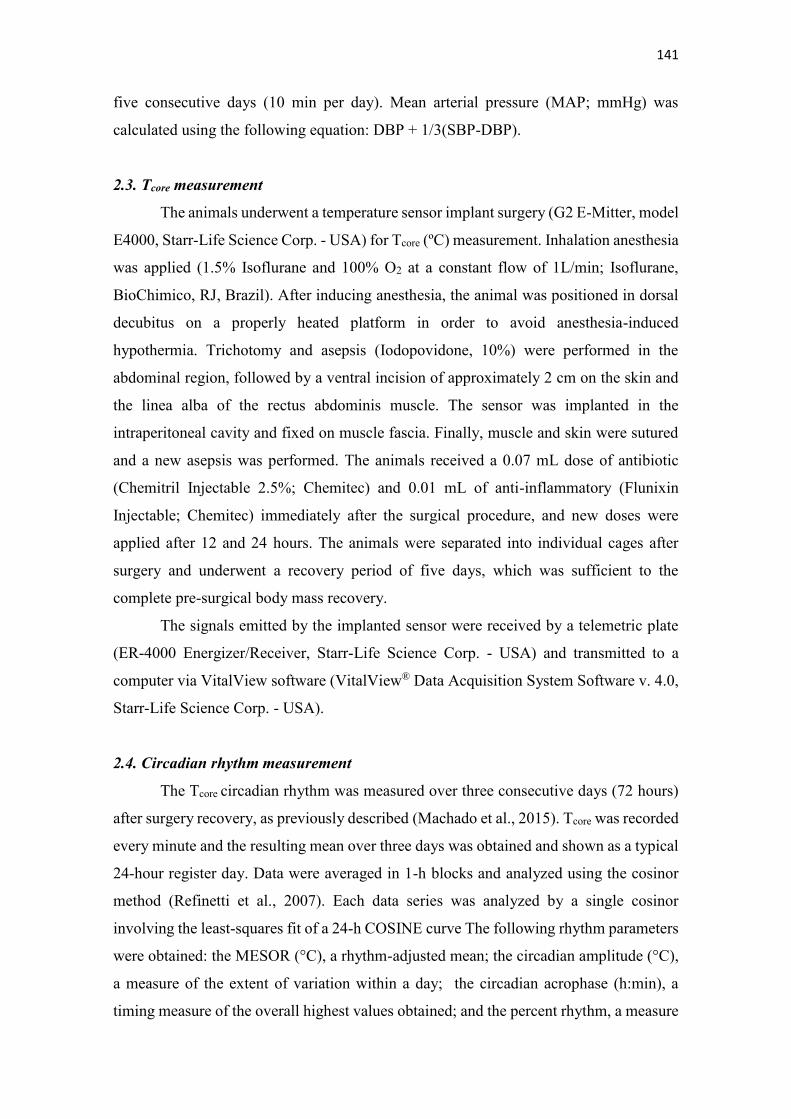
141
five consecutive days (10 min per day). Mean arterial pressure (MAP; mmHg) was
calculated using the following equation: DBP + 1/3(SBP-DBP).
2.3. Tcore measurement
The animals underwent a temperature sensor implant surgery (G2 E-Mitter, model
E4000, Starr-Life Science Corp. - USA) for Tcore (ºC) measurement. Inhalation anesthesia
was applied (1.5% Isoflurane and 100% O2 at a constant flow of 1L/min; Isoflurane,
BioChimico, RJ, Brazil). After inducing anesthesia, the animal was positioned in dorsal
decubitus on a properly heated platform in order to avoid anesthesia-induced
hypothermia. Trichotomy and asepsis (Iodopovidone, 10%) were performed in the
abdominal region, followed by a ventral incision of approximately 2 cm on the skin and
the linea alba of the rectus abdominis muscle. The sensor was implanted in the
intraperitoneal cavity and fixed on muscle fascia. Finally, muscle and skin were sutured
and a new asepsis was performed. The animals received a 0.07 mL dose of antibiotic
(Chemitril Injectable 2.5%; Chemitec) and 0.01 mL of anti-inflammatory (Flunixin
Injectable; Chemitec) immediately after the surgical procedure, and new doses were
applied after 12 and 24 hours. The animals were separated into individual cages after
surgery and underwent a recovery period of five days, which was sufficient to the
complete pre-surgical body mass recovery.
The signals emitted by the implanted sensor were received by a telemetric plate
(ER-4000 Energizer/Receiver, Starr-Life Science Corp. - USA) and transmitted to a
computer via VitalView software (VitalView® Data Acquisition System Software v. 4.0,
Starr-Life Science Corp. - USA).
2.4. Circadian rhythm measurement
The Tcore circadian rhythm was measured over three consecutive days (72 hours)
after surgery recovery, as previously described (Machado et al., 2015). Tcore was recorded
every minute and the resulting mean over three days was obtained and shown as a typical
24-hour register day. Data were averaged in 1-h blocks and analyzed using the cosinor
method (Refinetti et al., 2007). Each data series was analyzed by a single cosinor
involving the least-squares fit of a 24-h COSINE curve The following rhythm parameters
were obtained: the MESOR (°C), a rhythm-adjusted mean; the circadian amplitude (°C),
a measure of the extent of variation within a day; the circadian acrophase (h:min), a
timing measure of the overall highest values obtained; and the percent rhythm, a measure

142
of the rhythm strength that reflects the proportion of the total variance in the raw data
accounted for by the sinusoidal wave.
2.5. Statistics
The Shapiro-Wilk test was used to analyze data normality. Body mass, SBP, DBP,
MAP and cosinor results were analyzed via two-way ANOVA, followed by Bonferroni
post-hoc. The Tcore circadian rhythm was analyzed via repeated measures two-way
ANOVA, followed by Bonferroni post-hoc. A paired t-test was used to compare Tcore
during the day and night moments. The Eta squared effect size was calculated for the
chronobiology results using the eta squared (ƞ2) method and classified as: small effect
(0.10 to 0.30); medium effect (> 0.30 to 0.50); and large effect (> 0.50) (Cohen, 1988 ).
A 5% alpha was adopted. Data are presented as mean ± SD.
3. Results
Figure 1 shows the body mass results. Both strain and aging effects were observed.
SHR and WKY presented lower body mass compared to WIS at all ages (p < 0.05). WKY
and SHR exhibited an increased body mass at the ages of 48 and 72 weeks compared to
measurements at the age of 16 weeks (p < 0.05).
Figure 1.. Body mass. WIS: Wistar; WKY: Wistar Kyoto; SHR: Spontaneously Hypertensive Rats. Ψ WKY
vs. WIS; $ SHR vs. WIS; # 72 vs. 16; * 48 vs. 16. Data are presented as mean ± SD of 8 animals per group;
p<0.05.

143
Figure 2 shows the SBP, DBP and MAP results. Both strain and aging effects were
observed. SHR presented higher values regarding SBP (Fig. 2A) than WIS and WKY at
all ages (p < 0.05). WKY48 had higher SBP compared to WIS48. In addition, SHR48 and
WKY48 showed higher DBP values (Fig. 2B) than WIS48 (p < 0.05). The SHR72
animals exhibited higher DBP compared to WIS72 and WKY72 (p < 0.05); and compared
to SHR16 and SHR48 (p < 0.05). Moreover, SHR16 presented higher MAP values (Fig.
2C) than WIS16 (p < 0.05), while SHR48 and SHR72 showed higher values compared to
WIS48 and WIS72 and WKY48 and WKY (p < 0.05), respectively. The SHR48 and
SHR72 groups exhibited an increased MAP compared to SHR16 (p < 0.05).

144
Figure 2.. Blood pressure. SBP: Systolic Blood Pressure; DBP: Diastolic Blood
Pressure; MAP: Mean Arterial Pressure; WIS: Wistar; WKY: Wistar Kyoto; SHR:
Spontaneously Hypertensive Rats. Ψ = WKY vs. WIS; & = SHR vs. WKY; # = 72 vs.
16; * = 48 vs. 16. Data are presented as mean of 8 animals per group ± SD; p<0.05.

145
Figure 3 shows the strain and age results (panels A, B and C) analysis on the Tcore
circadian rhythm. SHR16 presented a higher Tcore than WIS16 (06am to 06pm; 04 and
05am) and WKY16 (07am to 06pm) (Fig. 3A; p < 0.05). Both WIS16 and WKY16
showed a significant and sustained Tcore increase in the activity period (6pm-02am; p <
0.05) over 24 hours (not pointed in the figure), and a decrease starting at 02am for WIS16
and at 05am for WKY16. On the other hand, SHR16 showed an earlier and shortened
increase (05-08pm; p < 0.05). No differences were observed between the strains at the
ages of 48 and 72 weeks (p > 0.05). The intragroup analysis showed that WIS48 exhibited
increased and less sustained Tcore values in the activity period (06pm-11pm), showing a
decrease after 00pm (p < 0.05). WKY48 presented a sustained increase in the activity
period (06 pm-02am), with a subsequent decrease after 03am (p < 0.05). SHR48 showed
an inconsistent increase in the activity period (p < 0.05). Among 72 week-old animals,
Tcore increased in the activity period in the WIS (07pm-03am; p < 0.05) and WKY (06pm-
02am; p < 0.05) groups, but not in the SHR.
A higher Tcore was found when observing the aging analysis on the Tcore circadian
rhythm in WIS72 compared to WIS16 (06am; 09am-01pm; 04pm; 07pm; 01-03am; p <
0.05) (Fig. 3C). In addition, a higher Tcore was found in WKY72 than in WKY16 (07-
08am; 11-12am; 02pm; 11pm; p < 0.05) (Fig. 3C). No age effects were observed in the
SHR strain (Fig. 3C; p > 0.05).

146
Figure 3. Strain and age analysis on the core temperature (Tcore) circadian rhythm.
WIS16: 16-week-old Wistar; WIS48: 48-week-old Wistar; WIS72: 72-week-old Wistar;
WKY16: 16-week-old Wistar Kyoto; WKY48: 48-week-old Wistar Kyoto; WKY72: 72-
week-old Wistar Kyoto; SHR16: 16-week-old Spontaneously Hypertensive Rats; SHR48:
48-week-old Spontaneously Hypertensive Rats; SHR72: 72-week-old Spontaneously
Hypertensive Rats. $ = SHR vs. WIS at the same age; & = SHR vs. WKY at the same age; # = WIS72 vs. WIS16; * = WKY72 vs. WKY16. Data are presented as mean ± SD of 8
animals per group; p<0.05.

147
Figure 4 shows resting and activity periods analysis on Tcore. Both strain and aging
effects were observed at rest (Fig. 4A). The SHR16 group showed higher Tcore compared
to WIS16 and WKY16 groups (p < 0.05). The WIS48 group exhibited higher Tcore than
WIS16 group (p < 0.05). Furthermore, the WIS72 and WKY72 groups showed higher
Tcore compared to WIS16 and WKY16, respectively (p < 0.05). Finally, no differences
were observed in the activity period in all groups (Fig. 4B; p > 0.05).
Figure 4. Resting (A) and activity (B) period analysis on core temperature (Tcore). WIS:
Wistar; WKY: Wistar Kyoto; SHR: Spontaneously Hypertensive Rats. $ = WIS vs. SHR; &
= WKY vs. SHR; * = 48 vs. 16; # = 72 vs. 16. Data are presented as mean ± SD of 8 animals
per group; p<0.05.

148
Table 1 presents the cosine analysis of the Tcore circadian rhythm. No differences
were found for the acrophase (p > 0.05; ƞ2= 0.37). An aging effect on the SHR strain was
observed regarding amplitude. The SHR72 group presented higher values compared to
SHR16 (p < 0.05; ƞ2= 0.45). In addition, both strain and aging effects were found
concerning MESOR. The SHR16 group had higher values than the WIS16 and WKY16
groups (p < 0.05; ƞ2= 0.56). WIS72 and WKY72 showed higher values compared to the
WIS16 and WKY16 groups, respectively (p < 0.05; ƞ2= 0.56). Lastly, no differences were
observed among strains regarding the strength rhythm analysis, indicating that all groups
present reliable rhythms (p > 0.05; ƞ2= 0.46).

149
Table 1. Cosinor analysis of the Tcore circadian rhythm.
WIS16 WKY16 SHR16 WIS48 WKY48 SHR48 WIS72 WKY72 SHR72
Acrophase (h:min)
23:31 ± 00:53 22:12 ± 03:13 21:06 ± 02:26 23:06 ± 00:39 21:46 ± 05:00 20:54 ± 06:45 23:39 ± 00:25 23:37 ± 00:25 19:53 ± 00:25
Amplitude (°C)
0.51 ± 0.15 0.54 ± 0.26 0.33 ± 0.09 0.44 ± 0.10 0.56 ± 0.20 0.45 ± 0.13 0.47 ± 0.15 0.44 ± 0.22 0.48 ± 0.08 #
MESOR (°C)
36.50 ± 0.75 36.44 ± 0.74 37.49 ± 0.08 $
& 36.83 ± 0.38 37.05 ± 0.41 37.26 ± 0.61 37.38 ± 0.11 # 37.38 ± 0.11 # 37.26 ± 0.62
Percent rhythm (%R)
83.02 ± 6.21 71.12 ± 32.10 56.87 ± 12.19 68.26 ± 11.30 84.34 ± 17.39 71.65 ± 20.31 77.68 ± 3.79 81.17 ± 15.10 77.13 ± 7.83
WIS16: 16-week-old Wistar (n=8); WIS48: 48-week-old Wistar (n=7); WIS72: 72-week-old Wistar (n=6); WKY16: 16-week-old Wistar Kyoto
(n=8); WKY48: 48-week-old Wistar Kyoto (n=7); WKY72: 72-week-old Wistar Kyoto (n=7); SHR16: 16-week-old Spontaneously Hypertensive
Rats (n=6); SHR48: 48-week-old Spontaneously Hypertensive Rats (n=6); SHR72: 72-week-old Spontaneously Hypertensive Rats (n=6). $ =
SHR vs. WIS; & = SHR vs. WKY; * = 48 vs. 16; # = 72 vs. 16. Data are presented as mean ± SD; p<0.05.

150
4. Discussion
The present study evaluated the Tcore circadian rhythm in SHR across aging and
compared it to both WIS and WKY as normotensive controls. Our first hypothesis assessed
whether a combination of aging and hypertension could lead to deleterious losses in the
circadian rhythm of Tcore in SHR. We observed a progressive and similar change in the circadian
rhythm of both WIS and WKY, with the hypertension factor only influencing the circadian
rhythm of 16-week-old SHR. Additionally, as our second hypothesis, our results showed that
these two strains were found to be appropriate to be used as controls for SHR considering
thermoregulatory studies regarding the Tcore circadian rhythm. However, caution needs to be
taken when choosing between them. We observed that the WIS strain presented higher body
mass and blood pressure values closer to normotension than WKY over time. On the other hand,
despite body mass values being similar to SHR, WKY presented blood pressure values closer
to the hypertension borderline.
4.1. Circadian rhythm of Tcore in SHR across aging
The results of the present study showed that hypertension and aging combination, except
at the age of 16 weeks, did not lead to marked losses in Tcore circadian rhythm in SHR. The
percent rhythm indicates the circadian rhythm strength, however, there are no cut-off points for
this analysis (Refinetti et al., 2007). Thus, it is necessary to establish a comparison based on the
study controls. Although there is a hypertension effect on the Tcore circadian rhythm of 16-week-
old rats, our results indicate that there is no loss of rhythm induced by either aging or disease.
In fact, it was observed that the youngest SHR (16 weeks-old) presented higher MESOR Tcore
results in relation to WIS and WKY at the same age. Such differences were supported by higher
Tcore results especially observed in the resting period at 16 weeks of age (Fig. 3A). However,
this disturbance among groups disappeared at the ages of 48 (Fig. 3B) and 72 weeks (Fig. 3C).
Similar results were found in Brown Norway Rats and F344 rats in which aging induced a Tcore
increase (Gordon, 2008; Kiang-Ulrich and Horvath, 1984). Interestingly, the temperature
curves in SHR were similar in the three ages evaluated (Fig. 3A, B and C), indicating that
hypertensive animals already present this thermoregulatory change at 16 weeks of age.
The scientific literature shows that 16 weeks is a critical moment in the SHR
development (Adams et al., 1989; Bing et al., 1995; Boluyt et al., 1995). Previous studies from
our laboratory (Campos et al., 2014; Drummond et al., 2019; Drummond et al., 2016) and
elsewhere (O'Donnell and Volicer, 1981; Berkey et al., 1990; Morley et al., 1990) have

151
consistently shown higher Tcore values in SHR submitted to stress challenges. Regarding the
issue of hypertension, it is particularly important to mention that brain temperature has also
been found to be increased in 16-week-old SHR (Drummond et al., 2016). Thus, the SHR has
a well-established pre-hypertensive stage before reaching this age and present a vessel-related
hypertrophic process approximately by the 4th week, but with normal SBP (Adams et al., 1989).
This pre-hypertensive stage lasts approximately until the 16th week of life, the moment from
which the compensated hypertension stage in the SHR sets in, as characterized by SBP values
above 150mmHg (Doggrell and Brown, 1998). The structural rearrangements which occur in
the heart and blood vessels at this moment in order to maintain cardiac function (Bing et al.,
1995; Grossman, 1980) are also known to affect thermoregulation in these animals (Folkow et
al., 1970).
Surprisingly, we observed an increase in the circadian rhythm amplitude with medium
effect size in the SHR group over time (Table 1). The amplitude of the circadian rhythm is
usually measured by the intersection between acrophase and MESOR (Cornelissen, 2014;
Refinetti et al., 2007). The highest results of Tcore observed in the resting period in the SHR16
group was possibly responsible for the approximation between MESOR and acrophase and
consequently for the amplitude reduction in the 16th, but not in the 48th and 72nd week of age.
Understanding the effects of hypertension on thermal homeostasis is very important
inasmuch as the cardiovascular system is essential to maintain Tcore, mainly through the vascular
tonus control (Gonzalez-Alonso et al., 2008; Lewis et al., 1986; O'Donnell and Volicer, 1981).
Caudal artery vasodilatation in rats represents a point of extreme importance for heat
dissipation, since this is the only region free from hair, and its shape additionally has a large
surface area to volume ratio, favoring the heat exchange with the environment (Rand et al.,
1965). However, evidence indicates that SHR present resistance to blood flow through the tail,
which occurs due to functional and morphological alterations in the small peripheral arteries.
This results in limited vasodilation, thus contributing to a reduction in heat dissipation capacity
and consequently to higher heat storage (Folkow et al., 1970; O'Leary and Wang, 1994).
Interestingly and contrary to our hypothesis, despite the fact that the SHR presented an
unstable rhythm at all evaluated ages, the aging effects were similar among the groups;
therefore, there were no effects of hypertension at the 48th and 72nd weeks (Fig. 3B and C).
Even when free of diseases, aging is usually accompanied by a decline in several bodily
functions, which includes structural and functional changes in the cardiovascular system
(Ferrari, 2002). Evidence points out that aging promotes an increase in heart mass due to

152
ventricular hypertrophy (Miller et al., 1986). As in the heart, the vessels also undergo
hypertrophy and lose elasticity, becoming more stiff, leading to loss of function and causing
problems such as peripheral vascular resistance increases (Ferrari, 2002). Additionally, a
previous study involving aging Brown Norway Rats suggested that aging can promote
dysfunction in the circadian pacemaker (Gordon, 2008).
The current findings may reflect a specific transition condition from pre-hypertensive
and hypertensive stage around 16 weeks of age in these animals which changes their circadian
thermoregulation pattern. Future studies should be conducted attempt to understand the causes
of this specific change, which may favor better understanding of the hypertension model and
will surely contribute to advance the knowledge involving thermal regulation and hypertension
development.
4.2. Which strain (WIS or WKY) is the more appropriate control for SHR in studies on the
Tcore circadian rhythm?
The results of the present study indicate that both the WIS and WKY strains are
appropriate to be used as controls for SHR. However, choosing one should be well planned and
done with caution since higher results of body mass (Fig. 1) and pressure values (Fig. 2A) closer
to those indicated for the normotension were found in the WIS strain. On the other hand, the
WKY strain presented closer body mass values to SHR and blood pressure results closer to the
hypertension borderline. This might influence the difference between groups considering
variables related with obesity, such as inflammation (Nishimura et al., 2009).
Previous reports have indicated that the basal metabolic rate of mammals is strongly
influenced by both body mass and body temperature (Gillooly et al., 2001). We found that the
body mass values of the WKY group were closer to those of SHR compared to those of the
WIS group. Moreover, the ANOVA and cosinor analysis pointed to similar behavior in the
normotensive groups at all ages. These animals presented consistent increases in Tcore between
06pm and 02Am in the 16th week. Interestingly, both normotensive groups showed an increase
in Tcore in the 48th and 72nd weeks, as indicated by higher MESOR and large effect size results.
No differences were observed in this study when comparing Tcore values between WIS
and WKY groups, although the WKY group presented high blood pressure values compared to
the WIS group. Thus, it is conceivable that the blood pressure difference in this case is not large
enough to cause changes in thermoregulatory control, since the homeostatic control is
prominent over the circadian control (Refinetti, 2010). According to Okamoto and Aoki (1963),

153
rats can be classified as hypertensive when presenting SBP values above 150 mmHg (Okamoto
and Aoki, 1963). Thus, the groups used in the present study were classified as follows
(SBP/DBP): WIS16 = normotensive (122.0/85.0 mmHg); WKY16 = normotensive (132.5/95.0
mmHg); SHR16 = hypertensive (155.7/106.0 mmHg); WIS48 = normotensive (115.0/71.8
mmHg); WKY48 = normotensive (145.87/107.75 mmHg); SHR48 = hypertensive
(195.87/128.87 mmHg); WIS72 = normotensive (120.5/76.5 mmHg); WKY72 = normotensive
(142.12/94.2 mmHg); SHR72 = hypertensive (192.12/138.7 mmHg). Thus, although the WKY
strain presented higher values compared to WIS, they showed regular SBP values, which
associated with similar Tcore circadian rhythm results confirms its widespread use as a control
for SHR in thermoregulation research.
5. Conclusions
SHR present worse thermoregulatory control at 16 weeks of age on the rhythm-adjusted
Tcore mean, while other circadian rhythm parameters were not different in hypertensive animals
across aging. In addition, our results showed that both the WIS and WKY strains are appropriate
as normotensive controls for SHR in experiments aimed to evaluate the Tcore circadian rhythm.
6. Acknowledgments
This study was supported by grants from CNPq (Conselho Nacional de
Desenvolvimento Científico e Tecnológico), CAPES (Coordenação de Aperfeiçoamento de
Pessoal de Nível Superior) and FAPEMIG (Fundação de Amparo à Pesquisa do Estado de
Minas Gerais).

154
7. References
Adams, M.A., Bobik, A., Korner, P.I., 1989. Differential development of vascular and cardiac hypertrophy in genetic hypertension. Relation to sympathetic function. Hypertension 14, 191-202. Aiello, E.A., Villa-Abrille, M.C., Escudero, E.M., Portiansky, E.L., Perez, N.G., de Hurtado, M.C., Cingolani, H.E., 2004. Myocardial hypertrophy of normotensive Wistar-Kyoto rats. Am J Physiol Heart Circ Physiol 286, H1229-1235. Altura, B.M., Carella, A., Altura, B.T., 1980. Magnesium ions control prostaglandin reactivity of venous smooth muscle from spontaneously hypertensive rats. Prostaglandins Med 4, 255-261. Andresen, M.C., Yang, M., 1989. Arterial baroreceptor resetting: contributions of chronic and acute processes. Clin Exp Pharmacol Physiol Suppl 15, 19-30. Argaud, L., Ferry, T., Le, Q.H., Marfisi, A., Ciorba, D., Achache, P., Ducluzeau, R., Robert, D., 2007. Short- and long-term outcomes of heatstroke following the 2003 heat wave in Lyon, France. Arch Intern Med 167, 2177-2183. Berkey, D.L., Meeuwsen, K.W., Barney, C.C., 1990. Measurements of core temperature in spontaneously hypertensive rats by radiotelemetry. Am J Physiol 258, R743-749. Bing, O.H., Brooks, W.W., Robinson, K.G., Slawsky, M.T., Hayes, J.A., Litwin, S.E., Sen, S., Conrad, C.H., 1995. The spontaneously hypertensive rat as a model of the transition from compensated left ventricular hypertrophy to failure. J Mol Cell Cardiol 27, 383-396. Boluyt, M.O., Bing, O.H., Lakatta, E.G., 1995. The ageing spontaneously hypertensive rat as a model of the transition from stable compensated hypertrophy to heart failure. Eur Heart J 16 Suppl N, 19-30. Byrom, F.B., Wilson, C., 1938. A plethysmographic method for measuring systolic blood pressure in the intact rat. J Physiol 93, 301-304. Campos, H.O., Leite, L.H.R., Drummond, L.R., Cunha, D.N.Q., Coimbra, C.C., Natali, A.J., Primola-Gomes, T.N., 2014. Temperature Control of Hypertensive Rats during Moderate Exercise in Warm Environment. J Sport Sci Med 13, 695-701. Chen, L., Yang, G., 2015. Recent advances in circadian rhythms in cardiovascular system. Front Pharmacol 6, 71. Cohen, J.I., 1988 Statistical power analysis for the behavioral sciences. . Hillsdale. Collins, M.G., Hunter, W.S., Blatteis, C.M., 1987. Factors producing elevated core temperature in spontaneously hypertensive rats. J Appl Physiol (1985) 63, 740-745. Cornelissen, G., 2014. Cosinor-based rhythmometry. Theor Biol Med Model 11, 16. Doggrell, S.A., Brown, L., 1998. Rat models of hypertension, cardiac hypertrophy and failure. Cardiovascular Research 39, 89-105. Doris, P.A., 2017. Genetics of hypertension: an assessment of progress in the spontaneously hypertensive rat. Physiol Genomics 49, 601-617. Drummond, L.R., Kunstetter, A.C., Campos, H.O., Vaz, F.F., Drummond, F.R., Andrade, A.G.P., Coimbra, C.C., Natali, A.J., Wanner, S.P., Prímola-Gomes, T.N., 2019. Spontaneously hypertensive rats have greater impairments in regulating abdominal temperature than brain cortex temperature following physical exercise. Journal of Thermal Biology 83, 30-36. Drummond, L.R., Kunstetter, A.C., Vaz, F.F., Campos, H.O., Andrade, A.G., Coimbra, C.C., Natali, A.J., Wanner, S.P., Primola-Gomes, T.N., 2016. Brain Temperature in Spontaneously Hypertensive Rats during Physical Exercise in Temperate and Warm Environments. Plos One 11, e0155919. Ellis, F.P., 1972. Mortality from heat illness and heat-aggravated illness in the United States. Environ Res 5, 1-58. Ferrari, A.U., 2002. Modifications of the cardiovascular system with aging. Am J Geriatr Cardiol 11, 30-33. Folkow, B., Hallback, M., Lundgren, Y., Weiss, L., 1970. Structurally based increase of flow resistance in spontaneously hypertensive rats. Acta Physiol Scand 79, 373-378. Gillooly, J.F., Brown, J.H., West, G.B., Savage, V.M., Charnov, E.L., 2001. Effects of size and temperature on metabolic rate. Science 293, 2248-2251.

155
Golombek, D.A., Rosenstein, R.E., 2010. Physiology of circadian entrainment. Physiol Rev 90, 1063-1102. Gonzalez-Alonso, J., Crandall, C.G., Johnson, J.M., 2008. The cardiovascular challenge of exercising in the heat. J Physiol 586, 45-53. Gordon, C.J., 2008. Cardiac and thermal homeostasis in the aging Brown Norway rat. J Gerontol A Biol Sci Med Sci 63, 1307-1313. Gordon, C.J., Johnstone, A.F., Aydin, C., Phillips, P.M., MacPhail, R.C., Kodavanti, U.P., Ledbetter, A.D., Jarema, K.A., 2014. Episodic ozone exposure in adult and senescent Brown Norway rats: acute and delayed effect on heart rate, core temperature and motor activity. Inhal Toxicol 26, 380-390. Grossman, W., 1980. Cardiac hypertrophy: useful adaptation or pathologic process? Am J Med 69, 576-584. Halberg, J., Halberg, E., Regal, P., Halberg, F., 1981. Changes with age characterize circadian rhythm in telemetered core temperature of stroke-prone rats. J Gerontol 36, 28-30. Judy, W.V., Watanabe, A.M., Henry, D.P., Besch, H.R., Jr., Murphy, W.R., Hockel, G.M., 1976. Sympathetic nerve activity: role in regulation of blood pressure in the spontaenously hypertensive rat. Circ Res 38, 21-29. Kerr, S., Brosnan, M.J., McIntyre, M., Reid, J.L., Dominiczak, A.F., Hamilton, C.A., 1999. Superoxide anion production is increased in a model of genetic hypertension: role of the endothelium. Hypertension 33, 1353-1358. Kiang-Ulrich, M., Horvath, S.M., 1984. Age-related metabolic modifications in male F344 rats. Exp Aging Res 10, 89-93. Lewis, S.J., Maccarrone, C., Jarrott, B., 1986. Modification of the circadian body temperature rhythm of the spontaneously hypertensive rat during and following cessation of continuous clonidine infusion. Brain Res 385, 383-388. Machado, F.S., Rodovalho, G.V., Coimbra, C.C., 2015. The time of day differently influences fatigue and locomotor activity: is body temperature a key factor? Physiol Behav 140, 8-14. Miller, T.R., Grossman, S.J., Schectman, K.B., Biello, D.R., Ludbrook, P.A., Ehsani, A.A., 1986. Left ventricular diastolic filling and its association with age. Am J Cardiol 58, 531-535. Morley, R.M., Conn, C.A., Kluger, M.J., Vander, A.J., 1990. Temperature regulation in biotelemetered spontaneously hypertensive rats. Am J Physiol 258, R1064-1069. Neves, S.M.P., Ong, F.M.P., Rodrigues, L.D., Santos, R.A., Fontes, R.S., Santana, R.O., 2013. Manual de Cuidados e Procedimentos com Animais de Laboratório do Biotério de Produção e Experimentação da FCF-IQ/USP, São Paulo.
Nishimura, S., Manabe, I., Nagai, R., 2009. Adipose tissue inflammation in obesity and metabolic syndrome. Discov Med 8, 55-60. Nybo, L., Kjellstrom, T., Bogataj, L.K., Flouris, A.D., 2017. Global heating: Attention is not enough; we need acute and appropriate actions. Temperature (Austin) 4, 199-201. O'Donnell, A., Volicer, L., 1981. Thermoregulation in spontaneously hypertensive rats: effects of antihypertensive treatments. Clin Exp Hypertens 3, 555-567. O'Leary, D.S., Wang, G., 1994. Impaired thermoregulatory cutaneous vasodilation in spontaneously hypertensive rats. J Appl Physiol (1985) 77, 692-696. Okamoto, K., Aoki, K., 1963. Development of a strain of spontaneously hypertensive rats. Jpn Circ J 27, 282-293. Rand, R.P., Burton, A.C., Ing, T., 1965. The Tail of the Rat, in Temperature Regulation and Acclimatization. Can J Physiol Pharmacol 43, 257-267. Refinetti, R., 2003. Metabolic heat production, heat loss and the circadian rhythm of body temperature in the rat. Exp Physiol 88, 423-429. Refinetti, R., 2010. The circadian rhythm of body temperature. Front Biosci (Landmark Ed) 15, 564-594. Refinetti, R., Lissen, G.C., Halberg, F., 2007. Procedures for numerical analysis of circadian rhythms. Biol Rhythm Res 38, 275-325.

156
Refinetti, R., Ma, H., Satinoff, E., 1990. Body temperature rhythms, cold tolerance, and fever in young and old rats of both genders. Exp Gerontol 25, 533-543. Smith, T.L., Hutchins, P.M., 1979. Central hemodynamics in the developmental stage of spontaneous hypertension in the unanesthetized rat. Hypertension 1, 508-517. Widimsky, J., Kuchel, O., Tremblay, J., Hamet, P., 1991. Distinct plasma atrial natriuretic factor, renin and aldosterone responses to prolonged high-salt intake in hypertensive and normotensive rats. J Hypertens 9, 241-247. Wilson, J.R., Wilson, L.M., DiCarra, I.V., 1977. Evidence for an elevation in therrnoregulatory set-point in SHR. In: Int. Symp. on SHR Spontaneous Hypertension: Its Pathogenesis and Complications (2nd ed.). Washington, DC: Dept. Health Educ. and Welfare, 1977. (DHEW Publ. No. 77-1179).

157
CAPÍTULO 4
The Spontaneously Hypertensive Rats had lower heat loss capacity in progressive and
continuous exercise protocols.
Leonardo Rezende, Leôncio Soares1, Filipe Drummond1, Tiago Leal1, Anselmo Gomes1,
Lukiya Favarato2, Evandro Favarato2, Antônio Natali1, Cândido Coimbra3 e Thales Prímola-
Gomes1.
1Laboratório de Biologia do Exercício, Departamento de Educação Física, Universidade
Federal de Viçosa, Viçosa, MG, Brasil; 2Departamento de Veterinária, Universidade Federal
de Viçosa, Viçosa, MG, Brasil; 3Laboratório de Endocrinologia e Metabolismo, Departamento
de Fisiologia e Biofísica, Universidade Federal de Minas Gerais, Belo Horizonte, MG, Brasil.
Abstract:
Introduction: Arterial hypertension is among the cardiovascular disorders with the highest
prevalence, characterized as multifactorial syndrome with sustained chronic blood pressure increase.
Spontaneously Hypertensive Rat (SHR) are widely used as model for essential hypertension researches,
with the Wistar (WIS) and Wistar Kyoto (WKY) as main control strains. However, there is a debate in
the literature about which strain is more appropriated for this function. Objective: the aim of the present
study was to evaluate the long-term behavior of thermoregulation responses during maximal test until
fatigue (MTF) and continuous test (CT) of SHR and its controls, namely WIS and WKY. Methods:
Male SHR and WIS rats with 16, 48 and 72 weeks were used. The blood pressure was performed using
the noninvasive method of tail plethysmography and the body mass using an electronic scale. Core
temperature (Tcore) was measured every minute by telemetry and skin temperature (Tskin) using a
thermometer connected to a thermocouple during two exercise protocols: MTF and CT. The
performance was measured by workload calculation. Results: the WIS strain shown higher workload
(J) results, mainly with 16 and 72 weeks. About thermoregulatory adjustments, SHR exhibited
lower heat loss capacity with 16 and 48 weeks, and the aging process reduced heat loss capacity
of normotensive animals. Conclusions: The SHR presented less effective thermoeffector response
during exercise. Furthermore, they show an equal response at all ages studied, indicating that at 16 weeks
hypertension has already caused serious damage to the thermoregulatory control. Finally, the both
normotensive controls can be used as SHR control. However, the WIS strain seems to be more affected
to aging process than WKY.

158
Keywords: Thermoregulation; heat loss capacity; experimental models; hypertension.
1- Introduction:
The cardiovascular diseases have a high incidence, accounting for a large part of the deaths in
the world (1). Arterial hypertension is among the cardiovascular disorders with the highest prevalence,
characterized as multifactorial syndrome with sustained chronic blood pressure increase (1). Its
incidence is often associated with others clinical disorders such as vascular diseases (2), myocardial
infarction (3) and renal insufficiency (4). Thus, pathophysiology of arterial hypertension understanding
is important, and for this, animals as employs as experimental models (5). Spontaneously Hypertensive
Rat (SHR) are widely used as model for essential hypertension researches (5, 6).
It is known that cardiovascular diseases affect the body's thermoregulatory balance, both during
rest and physical activities (7-9). Particularly, the control of vascular tonus is critical for the
thermoregulatory control, since it directly affects the heat retention and dissipation capacities (10, 11).
To observe the response of vascular tonus during exercise in rats, an important tool is the heat loss index
(HLI), which indicates the state of vascular constriction (12-14). O’donnel and Volicer (1981) shown
that SHR presented less effective thermoregulation capacity during rest and point out the failure of
central mechanism control as responsible (7). Also, our group has pointed in last years that hypertensive
animals show thermoregulatory impairment during physical exercise, like increased heat production and
storage, increased brain temperature, mechanical efficiency reduction and impaired recovery of central
temperature (Tcore) after progressive and continuous exercise (8, 9, 15, 16).
Cardiovascular disorders promoted by hypertension lead to performance impairment (17).
Several factor are pointed as responsible, like as peripheral problems, among which are muscular
atrophy, greater proportion of type IIA muscle fibers and difficulty of dissipating abdominal heat (15,
18, 19). In addition, evidence points to a reduced mechanical efficiency of SHR in low-intensity aerobic
exercise and this is directly associated with higher energy cost and, consequently, higher heat production
(16). Together, cardiovascular and peripheral complications can impair the exercise capacity (EC) of
SHR.
Although the literature points to loss of performance associated with greater thermoregulatory
stress in SHR during both progressive and continuous exercise, no studies analyzed the
thermoregulatory responses of SHR and control strains (Wistar-WIS and Wistar Kyoto- WKY) during
life aging process (16, 48 and 72 weeks). Thus, the aim of the present study was to evaluate the long-
term behavior of thermoregulation responses during maximal test until fatigue (MTF) and continuous
test (CT) of SHR and its controls, namely WIS and WKY.

159
2- Materials and Methods:
Male SHR and WIS rats with 16, 48 and 72 weeks were used. The experimental groups were
stratified randomly. The animals were housed in collective cages allocated in a controlled environment
with light/dark cycle (12/12h), temperature at 22 ± 2 °C, and had free access to commercial food and
water (ad libitum). The animals were obtained from central biotery of the Federal University of Viçosa-
UFV.
The project was approved by the Animal Use Ethics Commission (CEUA-UFV) of the UFV
(Protocol 08/2018) and was conducted in accordance with the principles of the Guide for Care in the
Use of Laboratory Animals (20). The procedures were accompanied by a veterinarian.
Blood pressure and body mass:
The animals were adapted to a containment apparatus heated at 29-32 °C for 10 minutes for five
consecutive days. Subsequently, systolic blood pressure (SBP), diastolic blood pressure (DBP) and
mean arterial pressure (MAP) measurement were performed using the noninvasive method of tail
plethysmography (LE5001; Panlab, Barcelona, Spain). The body mass was measured using an electronic
scale (Rochelle, model 3252).
Temperature Sensor Implant:
The animals underwent a temperature sensor implant surgery (G2 E-Mitter, model E4000, Mini-
Mitter, USA). Inhalation anesthesia was applied (1.5% Isoflurane and 100% O2 in a constant flow of
1L/min; Isoflurane, BioChimico, RJ, Brazil). After induction of anesthesia, the animal was positioned
in dorsal decubitus on a properly heated platform in order to avoid hypothermia induced by anesthetic.
The trichotomy and asepsis (Iodopovidone, 10%) were performed in abdominal region, followed by
ventral incision of approximately 2 cm on the skin and the line alba of the rectus abdominis muscle. The
sensor was implanted in intraperitoneal cavity and fixed on muscle fascia. Finally, the muscle and skin
were sutured and new asepsis was performed. Immediately after the surgical procedure the animals
received a dose of 0.07 mL of antibiotic (Chemitril Injectable 2.5%; Chemitec) and 0.01 mL of anti-
inflammatory (Flunixin Injectable; Chemitec); after 12 and 24 hours, new doses were applied.
Exercise protocols:
Maximal test. The animals were familiarized with a treadmill with 5° of inclination and electrical
stimulation during five days, 10 minutes for day. After, each rat was submitted to MTF to determine
their EC. The test was started at speed of 10 m/min, with increments of 1 m/min each 3 min until fatigue.
The electrical stimulation in treadmill was set to 0.2 mA throughout the exercise period (8, 9, 21), and

160
the fatigue was defined as the point where animals were no longer able to kept pace with treadmill for
10 seconds (22). All tests were realized in the morning period.
Continuous test. After the MTF, all animals were undergoing a continuous test (CT) with
duration of 30 min. The intensity applied was 60% of maximal velocity observed in MTF.
Tcore was measured by telemetry (ER-4000 energizer/receptor, Mini-Mitter Respironics, USA).
Also, skin temperature (Tskin) was measured using a thermometer (THR-140, Instrutherm Instruments,
Brazil) connected to a thermocouple (S-09K, Instrutherm Instruments, Brazil), using an impermeable
adhesive tape at approximately 20 mm from the lateral base of the tail (23). The of Tcore and Tskin results
were presented at the moment of fatigue for the progressive test and in the final minute for the continuous
test. All tests were performed at room temperature between 23-25 °C.
Calculated variables:
workload (J) by the proposed formula (24): body mass (Kg) x TTE (min) x treadmill speed
(m/min) x sinα (treadmill inclination) x acceleration of gravity (9.8 m/s2). Threshold for cutaneous heat
loss: was defined as Tcore mean registered at the time when Tskin significantly increased from the lowest
measure registered during exercise (8). Heat loss sensitivity: was calculated from the regression slope
of Tcore and Tskin during first four minutes after the threshold was achieved (8). Heat loss index: was
calculated as HLI= (Tskin −Tamb)/(Tcore −Tamb), where Tskin is tail skin temperature, Tamb is ambient
temperature, and Tcore is core temperature. HLI varies from 0 (maximum vasoconstriction) to 1
(maximum vasodilation) (14)
Statistics:
The Shapiro-Wilk test was used to analyze the normality of the data. Body mass, blood pressure,
workload, thermoregulatory and calculated variables were tested using two-way ANOVA followed by
Bonferroni post hoc. Data were presented as media ± SD. An alpha of 5% was used.
3- Results:
Table 1 shown body mass and blood pressure results. Body mass. Were found both strain and
age effects. WIS showed higher body mass (g) compared to WKY and SHR in all ages (p<0,05). WIS
strain present an increased in body mass with 72 weeks compared to 16 weeks (p<0.05), while WKY
and SHR present an body mass increased with 48 and 72 weeks compared to 16 weeks (p<0,05).
Blood pressure. A both strain and age effects were observed. SHR presented higher SBP
(mmHg) compared to WIS and WKY in all ages (p<0,05). With 48 and 72 weeks, WKY shown higher
SBP compared to WIS (p<0.05). SHR shown increased SBP with 48 and 72 compared to 16 weeks
(p<0,05). For DBP (mmHg) results, SHR shown higher DBP (mmHg) compared to WIS with 16, 48
and 72 weeks (p<0,05) and compared to WKY with 48 and 72 weeks (p<0.05). WKY presented higher

161
DBP compared to WIS with 48 weeks (p<0.05). SHR present increased DBP with 72 compared to 16
weeks (p<0,05). For MAP (mmHg) results, SHR shown higher MAP compared to WIS with 16, 48 and
72 weeks (p<0,05) and compared to WKY with 48 and 72 weeks (p<0.05). WKY presented higher MAP
compared to WIS with 48 weeks (p<0.05). SHR present increased of MAP with 48 and 72 compared to
16 weeks (p<0,05).

162
Table 1. Body mass and blood pressure measurements.
WIS16 (n=8) WKY16 (n=8) SHR16 (n=8) WIS48 (n=8) WKY48(n=8) SHR48 (n=8) WIS72 (n=8) WKY72 (n=8) SHR72 (n=7)
Body mass (g) 420.00 ± 30.75 355.12 ± 34.79Ψ 282.85 ± 13.6$& 479.85 ± 40.72 385.00 ± 42.01*Ψ 397.37 ± 24.33*$ 527.57 ± 31.02# 446.71 ± 27.52#Ψ 436.42 ± 27.09$#
SBP (mmHg) 123.29 ± 4.89 134.71 ± 6.82 156.57 ± 11.38$& 116.14 ± 8.15 142.85 ± 14.50Ψ 195.14 ± 13.29*$& 120.42 ± 5.22 143.00 ± 9.09Ψ 193.57 ± 18.12#$&
DBP (mmHg) 87.71 ± 14.46 97.71 ± 14.02 109.42 ± 23.07$ 72.14 ± 10.44 94.85 ± 13.81Ψ 128.00 ± 22.83$& 78.85 ± 14.72 94.14 ± 20.15 138.28 ± 27.35#$&
MAP (mmHg) 99.00 ± 10.11 109.85 ± 11.24 121.00 ± 19.25$ 85.71 ± 10.57 116.28 ± 10.11Ψ 146.42 ± 21.73*$& 96.00 ± 7.16 109.42 ± 22.38 162.00 ± 23.34#$&
SBP- systolic blood pressure; DBP- diastolic blood pressure; MAP- mean arterial pressure. Data are presented as mean ± SD. $- SHR vs. WIS; &- SHR vs. WKY; Ψ- WKY
vs. WIS; *- 48 vs. 16; #- 72 vs. 16 (p<0.05).

163
Figure 1 shows the results of the workload (J) during MTF (A) and CT (B) protocols.
Both strain and aging effects were observed. During MTF test (panel A), SHR performed lower
workload compared to WIS and WKY with 16 weeks (p<0.05). With 72 weeks, SHR and WKY
presented lower workload compared to WIS (p<0.05). WKY presented decreased of workload
with 48 and 72 compared to 16 weeks (p<0.05), while SHR presented reduced workload with
72 compared to 48 weeks (p<0.05). Panel B present the workload during CT protocol. WKY
and SHR presented lower workload compared to WIS with 16 and 72 weeks (p<0.05).
Figure 1. Long term behavior of workload in MTF (A) and CT (B) of WIS16 (n=8), WKY16 (n=8),
SHR16 (n=8), WIS48 (n=8), WKY48 (n=8), SHR48 (n=8), WIS72 (n=8), WKY72(n=8) and SHR72
(n=7). Data are presented as mean ± SD. Statistical significance (p<0,05) are showed as follows: $-
SHR vs. WIS; &- SHR vs. WKY; Ψ- WIS vs. WKY; *- 48 vs. 16; #- 72 vs. 16; +- 72 vs. 48.

164
Figure 2 shows the Tcore and Tskin results during MTF (Panels A and B) and CT (panels
C and D) protocols. Both strain and aging effects were observed. In MTF, SHR with 48 weeks
presented higher Tcore compared to WIS and WKY (Panel A; p<0.05). For Tskin (Panel B), SHR
shown lower values compared to WIS and WKY with 16 and 48 weeks (p<0.05). With 72
weeks, WIS presented lower Tskin compared to WKY and SHR (p<0.05). WIS and WKY strains
presented Tskin reduced with 72 compared to 16 and 48 weeks (p<0.05).In CT protocol, SHR
with 48 weeks presented higher Tcore compared to WKY (Panel A; p<0.05). For Tskin (Panel B),
SHR shown lower values compared to WIS and WKY with 16 and 48 weeks (p<0.05). With 72
weeks, WIS presented lower Tskin compared to WKY and SHR (p<0.05). WIS and WKY strains
presented Tskin reduced with 72 compared to 16 and 48 weeks (p<0.05).
Figure 3 point the results of HLI in MTF. The strain effects were presented in panels A, B and
C, and aging effects were shown in panels D, E and F. Both strain and age effects were found. SHR
Figure 2. Long term behavior of Tcore and Tskin in MTF (A and B) and CT (C and D) of WIS16 (n=8), WKY16 (n=8), SHR16 (n=8), WIS48 (n=8),
WKY48 (n=8), SHR48 (n=8), WIS72 (n=8), WKY72(n=8) and SHR72 (n=7). Data are presented as mean ± SD. Statistical significance (p<0,05)
are showed as follows: $- SHR vs. WIS; &- SHR vs. WKY; Ψ- WIS vs. WKY; *- 48 vs. 16; #- 72 vs. 16; +- 72 vs. 48.

165
presented lower HLI compared to WIS (min: 09-15; p<0,05) and WKY (min: 08-15; p<0,05) with 16
weeks. SHR presented lower HLI compared to WIS (min: 11-15; p<0,05) and WKY (min: 06-15;
p<0,05) with 48 weeks. No differences between strains were observed with 72 weeks. The aging analysis
show that WIS with 72 weeks presented decreased in HLI compared to 16 and 48 weeks (min: 0-15;
p<0,05). WKY with 72 weeks presented decreased in HLI compared to WKY with 16 (min: 0-03; 08-
12; p<0,05) and 48 weeks (min: 05-08; 10-14; p<0,05). No aging effects were observed to SHR.
Figure 4 presented the results of HLI in CT. The strain effects were presented in panels A, B
and C, and aging effects were shown in panels D, E and F. Both strain and age effects were found. SHR
presented reduced HLI compared to WIS (min: 8-20; p<0.05) and WKY (min: 9-19; p<0.05)
with 16 weeks (panel A). With 48 weeks (panel B), SHR presented reduced HLI compared to
WIS (min: 7 and 8; 10-24; p<0.05) and WKY (min: 5-25; p<0.05). With 72 weeks (panel C),
WIS presented lower HLI compared to SHR (min: 0-3 and 5; p<0.05), and compared to WKY
(min: 0-2, 5-6 and 10-19; p<0.05). When evaluated aging effect for WIS group (panel D), we
observe that WIS with 72 weeks shown HLI decreased compared to 16 (min: 0-30; p<0.05) and
48 weeks (min: 0 -2, 7-30; p<0.05). For WKY (panel F), the rats with 48 weeks shown
decreased of HLI compared to 16 weeks (min: 7-9; p<0.05). Also, WKY with 72 weeks shown
decreased of HLI compared to 16 (min: 9-11; p<0,05) and 48 weeks (min: 4-30; p<0.05). No
differences were found to SHR strain.

166
Figure 3. Long term behavior of HLI in MTF (A, B and C- strain effect; C, D and F- aging effect) of WIS16 (n=8), WKY16 (n=8),
SHR16 (n=8), WIS48 (n=8), WKY48 (n=8), SHR48 (n=8), WIS72 (n=8), WKY72(n=8) and SHR72 (n=7). Data are presented as mean
± SD. Statistical significance (p<0,05) are showed as follows: $- SHR vs. WIS; &- SHR vs. WKY; #- 72 vs. 16; +- 72 vs. 48.

167
Figure 4. Long term behavior of HLI in CT (A, B and C- strain effect; C, D and F- aging effect) of WIS16 (n=8), WKY16 (n=8), SHR16 (n=8),
WIS48 (n=8), WKY48 (n=8), SHR48 (n=8), WIS72 (n=8), WKY72(n=8) and SHR72 (n=7). Data are presented as mean ± SD. Statistical
significance (p<0,05) are showed as follows: $- SHR vs. WIS; &- SHR vs. WKY; Ψ- WIS vs. WKY; *- 48 vs. 16; #- 72 vs. 16; +- 72 vs. 48.

168
4- Discussion:
The present study evaluated the long-term behavior (16, 48 and 72 weeks) of thermoregulation
responses during MTF and CT of SHR and its normotensive controls. The animals were studied in these
ages because are important moments of SHR disease development, in which enters the compensated
phase of hypertension with 16 weeks and start the cardiac insufficiency phase around 72 weeks (25).
Our main finding was that 16 weeks seems to be a critical age for SHR development, since the analyzed
variables already presented disorders at this moment compared to normotensive animals. Additionally,
SHR with 16 and 48 weeks presented reduced heat loss capacity, indicated by lower Tskin and reduced
HLI. Finally, the both normotensive strains presented aging thermoregulatory disorders with 72 weeks,
indicated by decreased heat loss capacity, and this was more evident for WIS strain.
The animals were submitted to two different models of aerobic exercise. The first comprised an
MTF, which imposes a periodic increase in overload (1m/min in each 3min), inducing constant
adjustments of the physiological variables until fatigue. The second was a CT, in which the animals ran
for 30 minutes at a moderate intensity (60% of the maximal velocity). Campos et al. (2020) show that
workload is the most reliable index to evaluated the performance in aerobic exercise between rats with
body mass differences (17). We observe that WIS are heavier than WKY and SHR in all ages. Even
heavier, they present better performance compared to SHR with 16 weeks and compared to SHR and
WKY with 72 weeks in MTF. When analyzed the CT, the WIS exhibited better workload with 16 and
72 weeks compared both WKY and SHR. The WKY and SHR workload are very close. As previously
pointed out, the SHR strain suffer several hypertension damages, what induced the reduced exercise
capacity (7, 8, 15, 16, 18, 19). Although controversial, there are studies that point to WKY as a strain
that can develop hypertension, as well as presenting the pathophysiological disorders imposed by it,
such as concentric pathological hypertrophy of the left ventricle and sympathetic hyperactivity (26, 27).
In this study, we observed that WKY strain has higher SBP than WIS, in addition to close to the
hypertension borderline (150mmHg).
Despite the differences between the exercise protocols used (MTF and CT), there was a very
similar response for Tcore, Tskin and HLI for both exercise models in all studied strains. The only
difference observed for Tcore occurred in Hypertensive animals with 48 weeks, that presented higher Tcore
in both protocols compared to WKY and compared to WIS just in MTF. However, our main result is
the heat loss capacity, as the SHR showed lower Tskin and HLI with 16 and 48 weeks. The caudal artery
vasodilation is determinant for heat dissipation in rats, since this is the only hair-free region, besides its
great relation between area and volume, favoring the heat exchange with the environment (28). The HLI
results point that SHR have reduced vasodilation during exercise. In agreement with our results,
evidence indicates that SHR has resistance to blood flow for the tail, which occurs due to functional and
morphological changes in the small peripheral arteries, resulting in limited vasodilation, thus

169
contributing to reduction in heat dissipation capacity (13, 29). Aligned of this, higher DBP is indicative
of peripheral vascular resistance (30), and can explain the lower Tskin observed in SHR with 16 and 48
weeks.
Our group has demonstrated in recent years that hypertensive animals show impairments in
thermoregulatory control during physical exercise (8, 9, 15, 16). This findings point mainly to a greater
heat accumulation, indicated by higher central temperatures reached, which consequently contributes to
the performance decrease of hypertensive animals (9, 15-17). In this study, we found no extensive
differences in Tcore. However, our data clearly point to a disturbance in the mechanism of heat dissipation
in hypertensive animals, which is indicated by the lower Tskin and lower HLI observed.
Both normotensive strains presented reduced HLI and Tskin with aging, which are more evident
to WIS strain. Even in senescent aging there may be a decline in cardiovascular functions, with events
such as greater sympathetic activity (31, 32). As well, the blood vessels become hypertrophied and lose
elasticity, becoming stiffer, leading to function loss and causing problems such as peripheral vascular
resistance and consequently reduced HLI and Tskin (31). The reduced HLI and Tskin induced by aging did
not occur in hypertensive animals, indicating that this group has already presented deleterious changes
in the structures that heat dissipation via skin since the first measurement performed, at 16 weeks.
Experimental paradigm:
There is a debate in the literature about the experimental strain to be used as controls for the
SHR (26, 27, 33). Both strains are established and widely used, there are even studies that indicating
their simultaneous use, aiming to avoid possible loss of disease effects when interpreting results (33-
35). This work showed that normotensive animals have particularities. WIS are heavier animals and
seems suffer more the aging impact of heat dissipation variables, while WKY have blood pressure values
close to borderline hypertension. However, in general, these distinctions of origin did not generate
significant differences in thermoregulatory responses, and they showed a very similar behavior in the
measurements obtained. Both showed a reduction in Tskin and HLI due to aging, confirming that both
can be used as controls for the hypertensive animal.
5- Conclusions:
The SHR presented less effective heat dissipation response during exercise. Furthermore, they
show an equal response at all ages studied, indicating that at 16 weeks hypertension has already caused
serious damage to the thermoregulatory control. Finally, the both normotensive controls can be used as
SHR control. However, the WIS strain seems to be more affected to aging process than WKY.

170
6- References
1. Whelton PK. Hypertension curriculum review: epidemiology and the prevention of hypertension. J Clin Hypertens (Greenwich). 2004 Nov;6(11):636-42. 2. Pescatello LS, Franklin BA, Fagard R, Farquhar WB, Kelley GA, Ray CA. American College of Sports Medicine position stand. Exercise and hypertension. Med Sci Sports Exerc. 2004 Mar;36(3):533-53. 3. Korhonen J, Koskinen P. Acute myocardial infarction. A study of the sex distribution, immediate mortality, age distribution, incidence of hypertension and diabetes, and the effect of the seasons in a series of 376 cases. Ann Med Intern Fenn. 1960;49:247-54. 4. Rostand SG, Brown G, Kirk KA, Rutsky EA, Dustan HP. Renal insufficiency in treated essential hypertension. N Engl J Med. 1989 Mar 16;320(11):684-8. 5. Doggrell SA, Brown L. Rat models of hypertension, cardiac hypertrophy and failure. Cardiovascular Research. 1998 Jul;39(1):89-105. 6. Okamoto K, Aoki K. Development of a strain of spontaneously hypertensive rats. Jpn Circ J. 1963 Mar;27:282-93. 7. O'Donnell A, Volicer L. Thermoregulation in spontaneously hypertensive rats: effects of antihypertensive treatments. Clin Exp Hypertens. 1981;3(3):555-67. 8. Drummond LR, Kunstetter AC, Vaz FF, Campos HO, Andrade AG, Coimbra CC, et al. Brain Temperature in Spontaneously Hypertensive Rats during Physical Exercise in Temperate and Warm Environments. Plos One. 2016;11(5):e0155919. 9. Campos HO, Leite LHR, Drummond LR, Cunha DNQ, Coimbra CC, Natali AJ, et al. Temperature Control of Hypertensive Rats during Moderate Exercise in Warm Environment. J Sport Sci Med. 2014 Sep;13(3):695-701. 10. Gonzalez-Alonso J. Human thermoregulation and the cardiovascular system. Experimental Physiology. 2012 Mar;97(3):340-6. 11. Tansey EA, Johnson CD. Recent advances in thermoregulation. Adv Physiol Educ. 2015 Sep;39(3):139-48. 12. Primola-Gomes TN, Pires W, Rodrigues LO, Coimbra CC, Marubayashi U, Lima NR. Activation of the central cholinergic pathway increases post-exercise tail heat loss in rats. Neurosci Lett. 2007 Feb 8;413(1):1-5. 13. O'Leary DS, Johnson JM, Taylor WF. Mode of neural control mediating rat tail vasodilation during heating. J Appl Physiol (1985). 1985 Nov;59(5):1533-8. 14. Székely M. Skin temperature – skin blood flow. Assessment of thermoregulatory changes. Acta Physiologica Hungarica. 1986;68. 15. Drummond LR, Kunstetter AC, Campos HO, Vaz FF, Drummond FR, Andrade AGP, et al. Spontaneously hypertensive rats have greater impairments in regulating abdominal temperature than brain cortex temperature following physical exercise. Journal of Thermal Biology. 2019;83:30-6. 16. Gomes L, Drummond LR, Campos HO, Rezende LMT, Carneiro-Junior MA, Oliveira A, et al. Thermoregulation in Hypertensive Rats during Exercise: Effects of Physical Training. Arq Bras Cardiol. 2019 Mar 14. 17. Campos HO, Drummond LR, Rodrigues QT, Lima PM, Primola-Gomes TN, Coimbra CC. Exercise capacity in different stages of hypertension in spontaneously hypertensive rats. J Sports Med Phys Fitness. 2020 May;60(5):800-5. 18. Nagatomo F, Gu N, Fujino H, Takeda I, Tsuda K, Ishihara A. Skeletal muscle characteristics of rats with obesity, diabetes, hypertension, and hyperlipidemia. J Atheroscler Thromb. 2009 Oct;16(5):576-85. 19. Damatto RL, Martinez PF, Lima AR, Cezar MD, Campos DH, Oliveira Junior SA, et al. Heart failure-induced skeletal myopathy in spontaneously hypertensive rats. Int J Cardiol. 2013 Aug 10;167(3):698-703.

171
20. Neves SMP, Ong FMP, Rodrigues LD, Santos RA, Fontes RS, Santana RO. Manual de Cuidados e Procedimentos com Animais de Laboratório do Biotério de
Produção e Experimentação da FCF-IQ/USP. (FCF-IQ/USP) IdQ, editor. São Paulo2013. 21. Balthazar CH, Leite LH, Rodrigues AG, Coimbra CC. Performance-enhancing and thermoregulatory effects of intracerebroventricular dopamine in running rats. Pharmacol Biochem Behav. 2009 Oct;93(4):465-9. 22. Soares DD, Lima NR, Coimbra CC, Marubayashi U. Intracerebroventricular tryptophan increases heating and heat storage rate in exercising rats. Pharmacol Biochem Behav. 2004 Jun;78(2):255-61. 23. Young AA, Dawson NJ. Evidence for on-off control of heat dissipation from the tail of the rat. Can J Physiol Pharmacol. 1982 Mar;60(3):392-8. 24. Brooks GA, White TP. Determination of metabolic and heart rate responses of rats to treadmill exercise. J Appl Physiol Respir Environ Exerc Physiol. 1978 Dec;45(6):1009-15. 25. Bing OH, Brooks WW, Robinson KG, Slawsky MT, Hayes JA, Litwin SE, et al. The spontaneously hypertensive rat as a model of the transition from compensated left ventricular hypertrophy to failure. J Mol Cell Cardiol. 1995 Jan;27(1):383-96. 26. Aiello EA, Villa-Abrille MC, Escudero EM, Portiansky EL, Perez NG, de Hurtado MC, et al. Myocardial hypertrophy of normotensive Wistar-Kyoto rats. Am J Physiol Heart Circ Physiol. 2004 Apr;286(4):H1229-35. 27. Collins HL, Loka AM, DiCarlo SE. Daily exercise-induced cardioprotection is associated with changes in calcium regulatory proteins in hypertensive rats. American Journal of Physiology-Heart and Circulatory Physiology. 2005;288:H532–H40. 28. Rand RP, Burton AC, Ing T. The Tail of the Rat, in Temperature Regulation and Acclimatization. Can J Physiol Pharmacol. 1965 Mar;43:257-67. 29. Folkow B, Hallback M, Lundgren Y, Weiss L. Structurally based increase of flow resistance in spontaneously hypertensive rats. Acta Physiol Scand. 1970 Jul;79(3):373-8. 30. Smulyan H, Safar ME. The diastolic blood pressure in systolic hypertension. Ann Intern Med. 2000 Feb 1;132(3):233-7. 31. Ferrari AU. Modifications of the cardiovascular system with aging. Am J Geriatr Cardiol. 2002 Jan-Feb;11(1):30-3. 32. Wadstrom BN, Fatehali AH, Engstrom G. A vascular aging index as independent predictor of cardiovascular events and total mortality in an eldery urban population. Angiology. 2019;24(33):1-9. 33. Felten SY, Weyhenmeyer JA, Felten DL. Norepinephrine and serotonin in central autonomic nuclei in the spontaneously hypertensive rat and two normotensive control rats. Brain Res Bull. 1984 Sep;13(3):437-41. 34. Hard E, Carlsson SG, Jern S, Larsson K, Lindh AS, Svensson L. Behavioral reactivity in spontaneously hypertensive rats. Physiol Behav. 1985 Oct;35(4):487-92. 35. Sagvolden T, Pettersen MB, Larsen MC. Spontaneously hypertensive rats (SHR) as a putative animal model of childhood hyperkinesis: SHR behavior compared to four other rat strains. Physiol Behav. 1993 Dec;54(6):1047-55.