Lecturer receptivity to a major educational change in the ...
307
Edith Cowan University Edith Cowan University Research Online Research Online Theses: Doctorates and Masters Theses 1-1-2004 Lecturer receptivity to a major educational change in the context Lecturer receptivity to a major educational change in the context of planned change at Rajabhats in Thailand of planned change at Rajabhats in Thailand Anusak Ketusiri Edith Cowan University Follow this and additional works at: https://ro.ecu.edu.au/theses Part of the Education Commons Recommended Citation Recommended Citation Ketusiri, A. (2004). Lecturer receptivity to a major educational change in the context of planned change at Rajabhats in Thailand. https://ro.ecu.edu.au/theses/791 This Thesis is posted at Research Online. https://ro.ecu.edu.au/theses/791
-
Upload
khangminh22 -
Category
Documents
-
view
3 -
download
0
Transcript of Lecturer receptivity to a major educational change in the ...

Edith Cowan University Edith Cowan University
Research Online Research Online
Theses: Doctorates and Masters Theses
1-1-2004
Lecturer receptivity to a major educational change in the context Lecturer receptivity to a major educational change in the context
of planned change at Rajabhats in Thailand of planned change at Rajabhats in Thailand
Anusak Ketusiri Edith Cowan University
Follow this and additional works at: https://ro.ecu.edu.au/theses
Part of the Education Commons
Recommended Citation Recommended Citation Ketusiri, A. (2004). Lecturer receptivity to a major educational change in the context of planned change at Rajabhats in Thailand. https://ro.ecu.edu.au/theses/791
This Thesis is posted at Research Online. https://ro.ecu.edu.au/theses/791

Edith Cowan University
Copyright Warning
You may print or download ONE copy of this document for the purpose
of your own research or study.
The University does not authorize you to copy, communicate or
otherwise make available electronically to any other person any
copyright material contained on this site.
You are reminded of the following:
Copyright owners are entitled to take legal action against persons who infringe their copyright.
A reproduction of material that is protected by copyright may be a
copyright infringement. Where the reproduction of such material is
done without attribution of authorship, with false attribution of
authorship or the authorship is treated in a derogatory manner,
this may be a breach of the author’s moral rights contained in Part
IX of the Copyright Act 1968 (Cth).
Courts have the power to impose a wide range of civil and criminal
sanctions for infringement of copyright, infringement of moral
rights and other offences under the Copyright Act 1968 (Cth).
Higher penalties may apply, and higher damages may be awarded,
for offences and infringements involving the conversion of material
into digital or electronic form.
\
Lecturer Receptivity to a l\fajor Educational
Change in the Context of Planned Change at
Rajabhats in Thailand
A. Ketusiri
2005
PhD
,,
·--------
LECTURER RECEPTNITY TO A ll'1AJOR EDUCATIONAL CHANGE
IN TIIE CONTEXT OF PLANNED CHANGE
AT RAJABHATS IN THAILAND
by
Anusak Kctusiri
B.Ed., M.Ed.
A Thesis Submitted in Partial Fu!fi\lmcnt of the Requirements for the Award of
Doctor of Philosophy
in the Faculty of Community Services, Education and Social Sciences
at Edith Cowan University
(I.
Date of submission: April, 2004

USE OF THESIS
The Use of Thesis statement is not included in this version of the thesis.
ABSTRACT
In accordance with the National Education Act of 1999, the educational system
in Thailand wa·:i changed after 1999, the largest educational change in Thailand in 50
years. The achievable aims of the change were divided into eight main aspects
covering, primary, secondary and higher education. TI1ese were; (1) ensuring access
to basic edu~ation for all; (2) rdonn of the curriculum and learning processes; (3)
encouraging participation and partnership in education; (4) restructuring of
educational administration; (5) enhancing cducatio11al standards and quality
assurnncc; (6) refonn oftcachcrs; l"aculty staff, and educational personnel; (7)
mobilisation ofresourees and investment for education; and (8) utilisation of
technologies for education.
This study focuses on higher education and aims to: (I) investigate lecturer
receptivity to the major change, in the context of planned educational change at
Rajabhat Universities, (2) investigate the relationships between \cctui~r receptivity,
and nine aspects lo the change, and (3) investigate why Thai lecturers at Rajabhats
hold the attitudes that they do. Lecturer receptivity Willi conceptualised as composed
of nine asp~cts,jointly influencing receptivity. T~ey were: (I) attitude to the change
in comparison with the previous system, (2) prac1icality in the clillisroom, {3)
alleviation of concerns, (4) learning about the change, (5) participation in decision
making. {6) personal cost appraisal, (7) collabor~'.ion with other lecturers, (8)
opportunities for lecturer improvement, and {9) perceived value for students. For each
aspect. lcc1urcrs would have developed expectations that would, in part, influence
their behaviours, and their receptivity to the change.
Data for the study were collected in two parts. Part one involved a survey
questionnaire (N=659), and part two Willi face-to-face interviews (N=30). Initial
findings from part one, the survey questionnaire became the billiis for planning part
tv .. •o, the face-to-face interviews.
The 2000 Rasch Unidimensional ~1easurement Model (RUMM) Computer
m.li!i &!IW
iii
!1@¥WPf1FIIIJ =
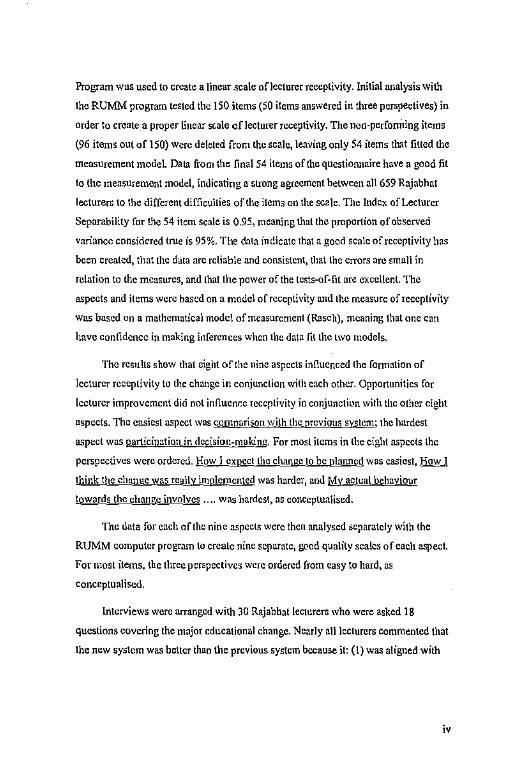
Program was used to create a linear .scale of lecturer receptivity. Initial analysis with
the RUMM program tested the ISO items (50 items answered in three perspectives) in
order to create a proper linear scale of lecturer receptivity. The non-perfonning items
(96 items out of 150) were deleted from the scale, leaving only 54 items that fitted the
measurement model. Data from the final 54 items of the questionnaire have a good fit
to the measurement model, indicating a strong agreement between all 659 Rajabhat
lecturers to \he different difficulties of the items on the se~le. The Index of Lecturer
Separability for the 54 item scale is 0.95, meaning that the proportion of observed
variance consid~rcd true is 95%. The data indicate that a good scale of receptivity has
been created, that the data are reliable and consistent, that the errors are small in
relation to the measures, and that the power of the tests-of-fit arc excellent. The
aspects and items were based on a model of receptivity and the measure of receptivity
was based on a mathematical model of measurement (Rasch), meaning that one can
have confidence in making i,1ferences when the data fit the two models.
The results show that eight of the nine aspects infiucnced the fonnation of
lecturer receptivity to the change in conjunction with each other. Opportunities for
lecturer improvement did not infiuence receptivity in conjunction with the other eight
aspects. The easiest aspect was comparison with the previous system; the hardest
aspect was participation in decision-making. For most items in the eight aspects the
perspectives were ordered. !:low l expect the change to be planned was easiest, H!ill'.l think the chnnge was really implemented was harder, and MY actual behaviour
!owards the change involves .... was hardest, as conceptualised.
The data for each of the nine aspects were then analysed separately with the
RUMM computer program to create nine separate, good quality scales of each aspect.
For most items, the three perspectives were ordered from easy to hard, as
conceptualised.
Interviews were arranged with 30 Rajabhat lecturers who were asked lS
questions covering the major educational change. Nearly all lecturers commented that
the new system was better than the previous system because it: (1) was aligned with
i,
•aw z Lll!M&l,A

the present economic, societal and globalisation aims for Thailand; (2) provided
educational unity (brought Thai people together in a common cause for good); (3)
provided standards and quality assurance for Thai education; (4) implemented a new
and better culture of\eaming; (5) provided for equal rights and opportunities for
learning; (6) provided for lecturer development and support; and (7) implemented
educational decentralisation to some e)[\cnt, to improve the Rajabhat Universities.
Al! the lecturers had mostly positive comments to make about each of the nine
aspects of receptivity to the change ond they gave IC3Sons for their views .
. ,
'
AWAL.d&~
DECLARATION
I certify that this thesis does not to the best ofmy kn.owl edge and belief:
(i) incorporate without acknowledgment any material previously
submitted for a degree or diploma in any institution of higher
education;
(ii) conTain any material previously written by another person except
where due reference in made in the text; or
(iii) contain any defamatory material.
Signatu
\ 'b Am . ...:..1 ~ o.-, ... -'
Date
;,
,;

ACKNOWLEDGMENTS
This study would not have been possible without the support of many people. l
am indebted to the initial encouragement from the president and administrators' staff
ofUbon Ratehathani Rajabaht University, and Mrs. Buntiwa Ketusiri who gave me
the confidence to embark on this Jcarningjoumey.
My grateful thanks are extended lo the Jccturers who generously gave their time
to participate in the study through pilot tests, completing the questionnaire and being
willing subjects face-to-foee interviews. Their cooperation and involvement has
provided valuable knowledge and insight into the lecturer receptivity to a major new
educational change at Rajabhats in Thailand.
In particular, l gr:itefully acknowledge the support and encouragement from my
principal supervisor who has been central to the completion ofthb research. I th:ink
sincerely, Dr. Russell Waugh, Edith Cowan University, for his patient imparting of
his knowlc(\gc and expertise in Rasch analysis. His continual assistance and support
through monitoring my progress and providing critical comment have been very much
appreciated. lam sure that no one else provides detailcd feedback as promptly as he
does.
Finally, l wholeheartedly thank,my family for their enduring support and
extended forbearance.
))
vii
Use ofthesis Abstract Declaration Acknowledgments Table of contents List oftables List of figures List of appendices
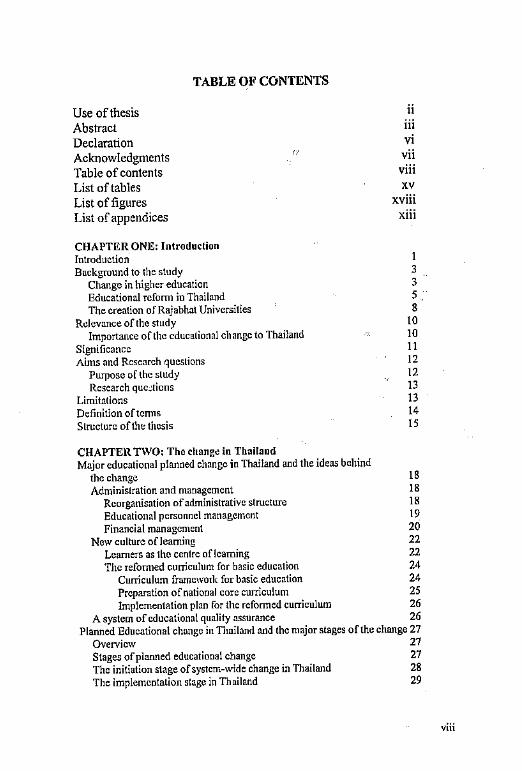
TABLE OF CONTENTS
CHAPTER ONE: Introduction Introduction Background to the study
Change in higher education Educational reform in Thailand The creation ofRajabhat Universities
Relevance of the stt1dy Importance of the educational change to Thailand
Significance Aims and Research questions
Purpose of the study Research qucJtions
Limitations Definition oftcnns Structure ofth(: thesis
CHAPTER TWO: The change in Thailand
ii iii y; vii viii xv
xviii xiii
1 3 3 5. 8
10 IO 11 12 12 13 13 14 15
Major educational planned change in Thailand and the ideas behind the change 18 Administration and management 18
Reorganisation of administrative structure 18 Educational pcrsormc\ management 19 Financial management 20
New culture of learning 22 Learners as the centre of!eaming 22 The reformed curriculum for basic education 24
Curriculum framework for basic education 24 Preparation of national core curriculum 25 Imp!cmeotation plan for the reformed curriculum 26
A system of educational quality assurance 26 Planned Educational clmngc in Thailand and the major stages of the change 27
Overview 27 Stages of planned educational change 27 The initiation stage of system-wide change in Thailand 28 The implementation stage in Thailand 29
viii
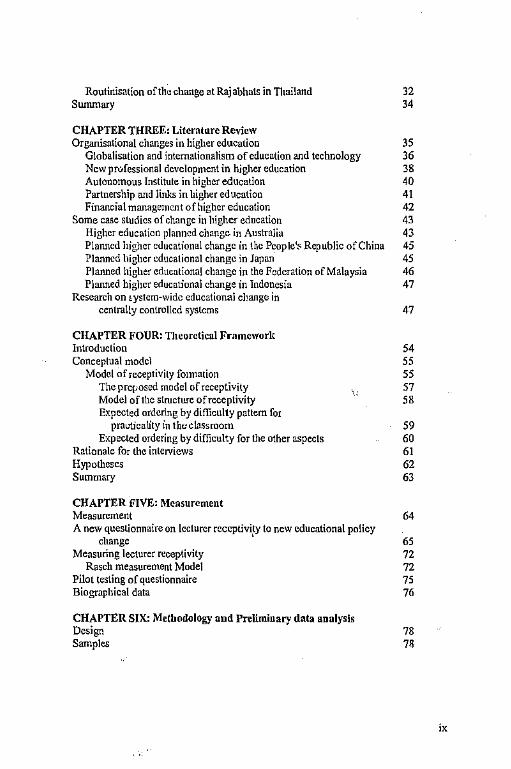
Routinisation of the change at Rajabhals in Thailand 32 Summary 34
CHAPTER THREE: Literature Review Organisational changes in higher education 35
Globalisation and internationalism of education and technology 36 New professional development in higher education 38 Autonomous Institute in higher education 40 Partnership and links in higher education 41 Financial management of higher education 42
Some case studies of change in higher education 43 Higher education planned change in Australia 43 Planned higher educational change in the People'~ Republic of China 45 Planned higher educational change in Japan 45 Planned higher educational change in the Federation of Malaysia 46 Planned higher educational change in Indonesia 47
Research on ~ystem-widc educational cl1ange in centrally controlled systems 47
CHAPTER FOUR: Theoretical Frameworlt Introduction Conceptual model
Model of receptivity f01mation The prq,-osed model of receptivity Model of the structure ofreceptivity Expected ordering by difficulty pattern fo1
pra~1icality in thc:c!assroom Expected ordering by difficulty for the other aspects
Rationale for the interviews Hypotheses Summary
CHAPTER FIVE: Measurement
54 55 55 57 58
59 60 61 62 63
Measurement 64 A new questionnaire on \cclurcr receptivity to new educational policy
change '· 65 Measuring lecturer receptivity 72
Rasch measurement Model 72 Pilot testing of questionnaire 75 Biographical data 76
CHAPTER SIX: Methodology and Preliminary data analysis Design 78 Samples 711
"""'"···
Procedure 81 Questionnaire 82 Interviews 82 Data analysis 83 Preliminary data analysis 83
CHAPTER SEVEN: Data Analysis: Questionnaire (Part 2A) Rasch analysis 96 Initial analysis with ISO items (50K3 perspectives) 96 Final analysis with 54 items 97
Psychometric characteristics of the lecturer receptivity data 97 Ordered thresholds and response categories 99
Item difficulties 99 Category probability curve 100 The structural model of receptivity to change 103 Comm~nts on the scale of receptivity 108 Item difficulties for each aspect 110
Compcrison with the previous system (L=6 items, 2 stem-items) 111 Practicality in the classroom (L=6 items, 2 stem-items) 112 Alleviation of concerns (L=12 items, 4 stem-items) 113 Leawing about the change {1=12 items, 4 stem-items) 114 Participation in decision-making {lr3 items, 1 stem item) 115 Personal cost appraisal {L=6 items, 2 stem-items) I !6 Col!aboration with other lecturers (L'••3 items, I stem-item) 117 Opportunities for lecturer improvement 117 Perceived value for students (L= 6 items, 2 stem-items) 118
Research questions 118 Relevant hypotheses 119 Summary 120
CHAPTER EIGHT: Data Analysis: Questionnaire (Part 28) Comparison with the previous system 121
Final analysis with 12 items 121 The psychometric properties 121 Thresholds 122 Ordering of perspectives 123 Ordering of item difficulties 125 Meaning of the linear scale 12"/ Research questions in relation to the aspect of comparison with
the previous system 127 The relevant hypotheses 129
Practicality in the classroom 129 Final analysis with 18 items 12'} The psychometric properties 129 Thresholds 130 Orderingofperspectives 130
'
Ordering of item difficulties Meaning of the linear scale Research questions in relation to the aspect of practicality in
the classroom The relevant hypotheses
Alleviation of concerns Finai analysis with 12 items The psychometric properties Thresholds Ordering ofper3pcctives Ordering ofitem diffic11\ties Meaning oft he linear scale Research questions in relation lo the aspect of alleviation of concerns The relevant hypotheses
Leaming about the change Final anaiysis with 15 items The psychometric properties !nresholds Ordering of perspectives Ordering of item difficulties Meaning of the linear scale Research questions in rebtion to the aspect of!eaming
about the change The relevant hypotheses
Participation in decision-making Final analysis with 9 items The psychometric properties Thresholds Ordering of perspectives Ordering of item difficulties Meaning ofthe linear scale Research questions io relation to the aspect of participation
in decision-makiog The relevant hypotheses
Summary
CHAPTER NINE: Data Analysis: Questionnaire (Part·2q Persona\ cost appraisal
Final analysis with 15 items The psychometric properties Thresholds Ordering of perspectives Ordering of item difficulties Meaning of the linear scale Research questions in relation to the aspect of personal cost appraisal The relevant hypotheses
132 134
134 137 137 137 137 138 138 140 141 141 143 146 146 146 .146 147 148 150
151 154 154 154 154 155 155 157 157
159 161 162
163 163 163 164 165 166 166 168 170
,,
Collaboration with other lectJrers .. 172 Final analysis with 9 items 172 The psychometric properties 172 Thresholds 172 Ordering of perspectives 173 Ordering of item difficulties 174 Meaning of the linear scale 176 Research questions in relation to the aspect ofeollaboration with
other lecturers 177 The rdcvant hypotheses 180
Opportunities for lecturer improvement 180 Final analysis with 9 items 180 The psychometric properties 180 Thresholds 181 Orderingofperspcctivcs 181 Ordering of item difficulties 183 Meaning of the linear scale 183 Research questions in relation lo lhll aspect of opportunities for
!eclurer improvement 185 The relevant hypotheses 188
Perceived value for students 188 Final analysis with 12 items 188 The psychometric properties 188 Thresholds 189 Ordering of perspectives 189 Ordering ofhem difficulties 191 Meaning of the linear scale 191 Research questions in relation to the aspect of perceived value
for students 193 The relevant hypotheses 195
Summary 196
CHAPTER TEN: Data Analysis: Interviews (Part 3) Lecturer comments by receptivity aspect 199
Comments on comparison with the previous system 199 Comments on practicality in the classroom 202 Comments on al!eviation of concerns 202 Comments on learning about the change 204 Comments on participation in decision-making 204 Comments on personal cost appraisal 205 Comments on collaboration with other lecturers 206 Comments on opportunities for lecturer improvement 207 Comments on perceived value for students 208
Research questions 209
// xii
CHAPTER ELEVEN: Summary, discussion, conclusions and implications
Summary 212 Discussion 214
Lecturcrrcceptivity 214 Lecturer receptivity (items from the nine aspects analysed together) 215 Lecturer receptivity (items from each of the nine aspects
analysed separately) 218 Conclusio.is 221
Conclusions from the Rasch analysis with a!\ eight aspects together 221 Conclusions fro111 the separate Rasch analysis for each of
the nine aspects 222 Conclusions from the interviews 226
Implications 228 Implications for educational administrators 228 Implications for lecturers 231 Implication for research on the change 232
LIST OF REFERENCES 234
APPENDICES Appendix A: Questionnaire and foilow-up leller to questionnaire 243 Appendix B: Item difficulties from the Rasch analysis of
1hc questionnaire data (all aspects analysed together) 255 Appendix C: Lecturer receptivity scores and item thresholds
(54 items, 3 thresholds) 262 Appendix D: Item thresholds (54 items): Lecturer receptivity towards
the new educational system change 264 Appendix E: Item locations (54 items), SE, Residuals
and fit to the model: Lecturer receptivity towards the new educational system change 265
Appendix F: Item thresholds (12 items): Comparison with the previous system) 266
Appendix G: Item locations (12 items), SE, Residuals and fit to the model: Comparison with the previous system 266
Appendix H: Item thresholds (18 items): Practicality in the classroom 267
Appendix I: Item locations (18 items), SE, Residuals and fit to the model: Practica:ity in the classroom 268
Appendix J: Item thresholds (12 items): Alloviation of concerns 269 Appendix K: Item locations {12 items), SE, Residuals
and fit to the mode!: Alleviation of concerns 270 Appendix L: Item thresholds (15 items): Leaming about the change 271
xiii
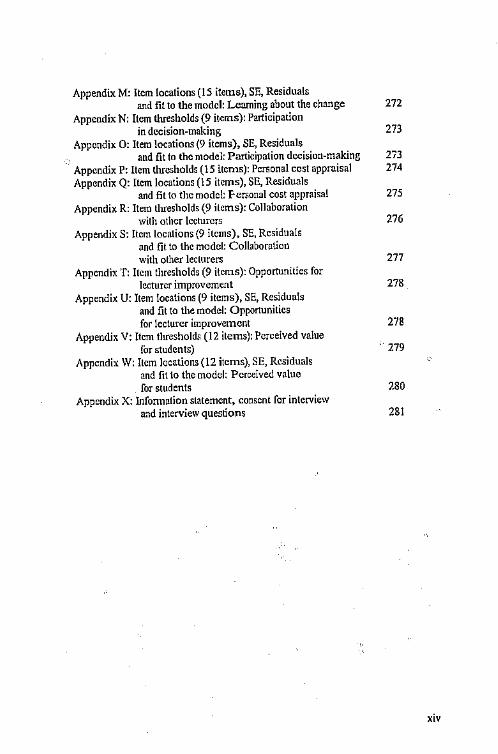
Appendix M: Item locations (15 items), SE, Residuals and fit to the model: Learning about the change 272
Appendix N: Item thresholds (9 items): Participation in decision-making 273
Appendix 0: Item locations (9 items), SE, Residuals and fit to the model: Participation decision-making 273
Appendix P: Item thresholds (15 items): Personal cost appraisal 274 Appendix Q: Item locations (15 items), SE, Residuals
and fit to the mode!: F-ersonal cost appraisal 275 Appendix R: Item thresholds (9 items): Collaboration
with other lecturers 276 Appendix S: Item locations {9 items), SE, Residuals
and fit to the model: Collaboration with other lecturers 277
Appendix T: Item thresholds (9 items): Opportunities for lecturer improvement 278
Appendix U: Item locations (9 items), SE, Residuals and fit to the model: Opportunities for lecturer impro11emcnt 278
Appendix V: Item thresholds (12 items): Perceived value for students) · 279
Appendix W: Item locations (12 items), SE, Residuals and fit lo the model: Perceived value for students 280
Appendix X: lnfonnation statement, consent for interview and interview questions 281
xiv
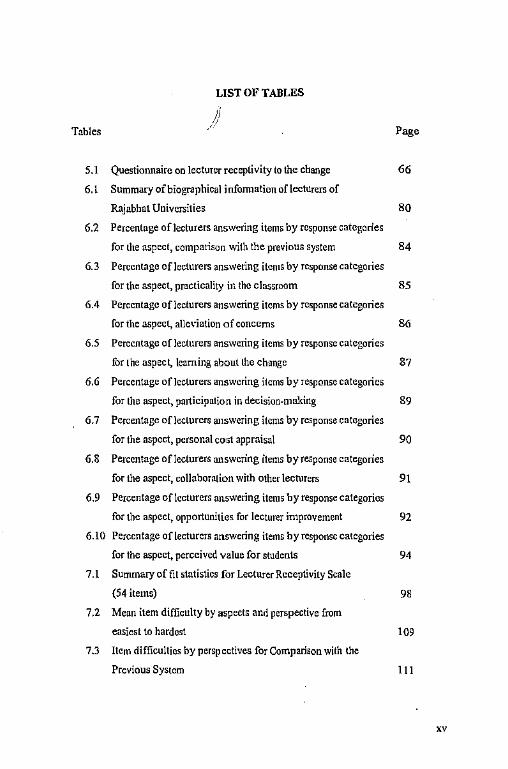
LIST OF TABLES
Ji Tables
:/ Page
5.1 Questionnaire on lecturer receptivity to the change 66
6.l Summary ofbiographical i nfonnation of lecturers of
Rajabbat Universities 80
6.2 Percentage of lecturers answering items by response categories
for the aspect, compatison with the previous system 84
6.3 Percentage of lecturers answering items by response categories
for the aspect, practicality in the classroom 85
6.4 Percentage of lecturers answering items by response categories
for the aspect, alleviation of concems 86
6.5 Percentage of lecturers answering items by response categories
for the aspec~ learning about lhe change 87
6.6 Percentage of lecturers answering items by response categories
for the aspect, participation in decision-making 89
6.7 Percentage of lecturers answering items by response categories
for the aspect, personal cost appraisal 90
6.8 Percentage oflecturers answering items by response categories
for the aspect, collaboration with other lecturers 9!
6.9 Percentage of lecturers answering items by response categories
for the aspect, opportunities for lecturer improvement 92
6.10 Percentage of lecturers answering items by response categories
for the aspect, perceived value for students 94
7.l Summary of fit statistics for Lecturer Receptivity Scale
(54 items) 98
7.2 Mean item difficulty by aspects and perspective from
easiest to hardest 109
7.3 Item difficulties by perspectives for Comparison with the
Previous System ll l
·~ ... ,

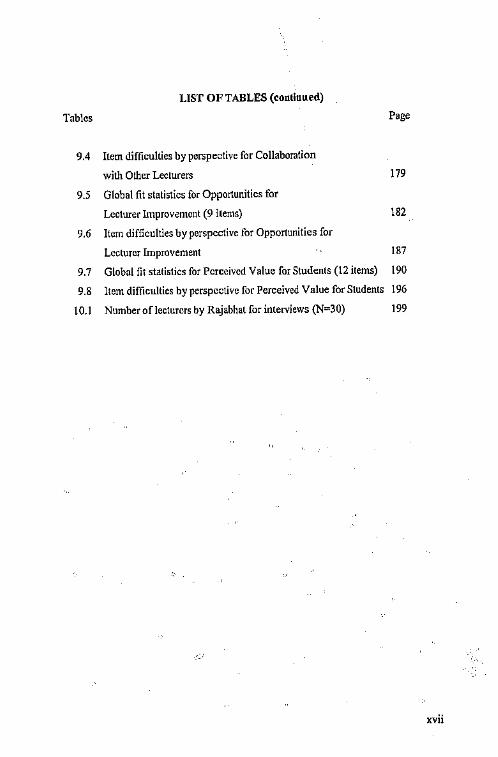
LIST OF TABLES (continued)
Tables Page
7.4 Item difficulties by perspectives for Practicality in
the Classroom 112
7.5 Item difficulties by perspectives for Alleviation of Concerns 113
7.6 Item difficulties by perspectives for Leaming about the Change 114
7.7 Item difficulties by perspectives for Participation in
Decision-making ll5
7.8 Item difficulties by perspectives for Personal Cost Appraisal 116
7.9 Item difficulties by perspectives for Collaboration with
Other Lecturers 117
7.10 Item difficullies by perspectives for Perceived Value for Students 118
8.1 Global fit statistics for Comparison with
the Previous System (12 items) 122
8.2 Item difficulties by perspective for Comparison with
the I'revious System 128
8.3 Global fit statistics for Practicality in the Classroom (18 items) 131
8.4 Item difficulties by perspective for Practk:ality in the Classroom 136
8.5 Global fit statistics for Alleviation of Concerns {12 itJms) 139
8.6 Item difficulties by perspective for Alleviation of Concerns 145
8.7 Global fit statistics for Leaming about the Change (15 items) 147
8.8 Item difficulties by perspective for Leaming about the Change 153
8.9 Global fit statistics for Participation in Decision-making (9 items) 156
8.10 Item difficulties by perspective for Participation
in Decision-making 161
9.1 Global fit statistics for Personal Cost Appraisal {15 items) 164
9.2 Item difficulties by perspectives for Personal Cost Appraisal 171
9.3 Global fit statistics for Collaboration
with Other Lecturers (9 items) 173
xvi
LIST OF TABLES (continued}
Tables Page
9.4 Item difficulties by perspective for Collaboration
with Other Leeturers 179
9.5 Global fit statistics for Opportunities for
Lecturer Improv~mcnt (9 items) 182
9.6 Item difficulties by perspective for Opportunities for
Lecturer Improvement 187
9.7 Global fit statistics for Perceived Value for Students (12 items) 190
9.8 Item difficulties by perspective for Perceived Value for Students 196
10.1 Number of lecturers by Rajabhat for interviews (N"'30) 199
xvii
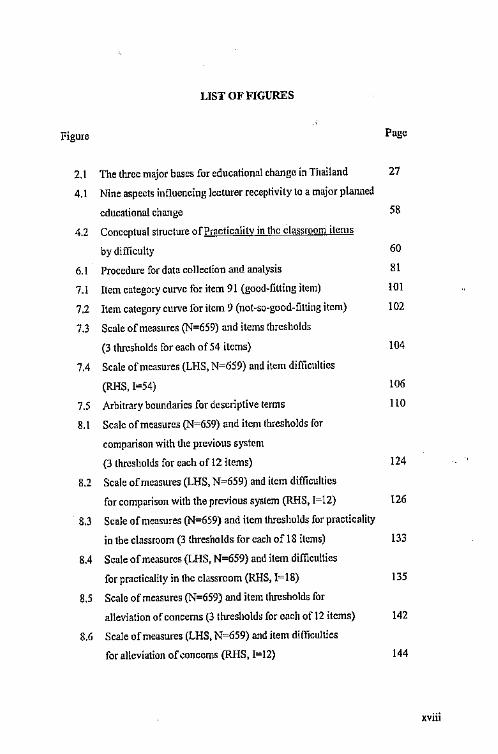
LIST OF FIGURES
Figure Page
2.1 The three major bases for educational change in Thailand 27
4.1 Nine aspects influencing lecturer receptivity to a major planned
educational change 58
4.2 Conceptual structure of Procticalit;i in the classroom items
by difficulty 60
6.1 Procedure for data collection a11d analysis 81
7.1 Item category curve for item 91 (good-fitting item) IOI
7.2 Item category curve for item 9 (11ot-so-good-fitting item) 102
7.3 Scale of measures (N=659) and items thresholds
(3 thresholds for each of 54 items) 104
7.4 Scale of measures (LHS, N=659) and item difficulties
(RHS, 1=54) 106
7.5 Arbitrary boundaries for descriptive terms 110
8.1 Scale of measures (N=659) and item thresholds for
comparison with the previous system
{3 thresholds for each of 12 items) 124
8.2 Scale of measures (LHS, N=659) and item difficulties
for comparison with the previous system (RHS, 1=12) 126
8.3 Scale of measures (N=659) and item thresholds for practicality
in the classroom (3 thresholds for each of 18 items) 133
8.4 Scale of measures (LHS, N=659) and item difficulties
for practicality in the classroom (RHS, 1=18) 135
8.5 Scale of measures (N=659) and item thresholds for
al!eviation of concerns (3 threshold~ for each of 12 items) 142
8.6 Scale of measures (LHS, N=659) and item difficulties
for alleviation of concerns (RHS, 1=12) 144
xviii
LIST OF FIGURES (continued)
Figure Page
8.7 Spale of measures (N=6S9) and item thresholds for
learning about the change (3 thresholds for each of IS items) 149
8.8 Scale of measures (LHS, N=659) and item difficulties for
learning about the change (RHS, 1=15) 152
8.9 Scale of measures (N=6S9) and item thresholds for participation
in dedsion-making (3 thresholds for each of9 items) 158
8.10 Scale of measures (LHS, N=659) and item difficulties
for participation in decision-making (RHS, I=9) 160
9.1 Scale of measures (N=6S9) and item thresholds for
personal cost appraisal (3 thresholds for each of IS items) 167
9.2 Scale of measures (LBS, N=659) and item difficulties
for personal cost appraisal (RBS, I=15) 169
9.3 Scale of measures (N'-659) and item thresholds for collaboration
with other lecturers (3 thresholds for each of9 items) 175
9.4 Scale of measures (LHS, N=659) and item difficulties
for collaboration with other lecturers (RHS, 1=9) 178
9.5 Scale of measures (N=659) and item thresholds for opportunities
for lecturer improvement (3 thresholds for each of9 items) 184
9.6 Scale of measures (LHS, N=659) and item difficulties
for opportunities for lecturer improvement (RI-IS, I=9) 186
9.7 Scale of measures (N=659) and item thresholds for perceived
value for students (3 thresholds for each of 12 items) 192
9.8 Scale of measures (LHS, N=659) and item difficulties
for perceived value for students (RHS, I.aJ2) 194
xix

CHAPTER ONE
INTRODUCTION
This chapter introduces the reader ton major planned educational change at the
Rajabhat Universities in Thailand, .and it is probably the largest and most far reaching
change in the last 50 years of education in Thailand. Following the introduction, the
background to the study and its relevance arc discussed. Next, the limitation,
significance, purpose of the study, .and research questions are presented. Finally, some
tenns used in the study are defined, and the structure of the thesis is outlined,
providing a brief overview of each chapter.
According to the National Education Act of 1999 in Thailand, Rajabhat
lecturers must adapt themselves to a change in order to work in the proposed new
culture of education in Thailand. The change is concerned with new knowledge and
practices. The systems involving institutes ofhighcr education, secondary schools,
and primary schools will be differ~nt from the previous systems. Lecturers and
teachers will have to be active learners. They will need to develop their
professionalism, their use of innovation and technology for education, and their
assessment for quality assurance (Bell & Harrison, 1998, pp.75-77).
There arc more than 600 higher educational institutions distributed throughout
every region of Thailand, and one category of them is the Rajabhal Institute (now
called Raj ab hat Universities). These institutions were controlled by ten government
organisations and one private organisatio:.a (Office of the National Education
Commission, i 999a). In accordance with National Education Act of 1999, the
administration and management systems in these higher educational institutions must
be changed. The changes wiJJ lead them into a new culture. One new cultural aspect is
that al! educational institutions providing edncation at degree level have become legal
entities that arc allowed to function wiU1 some academic freedom, within the central
control of the Office of the National Education Commission. Each institution can
develop its own administration and management system with fle;,;:ibility and academic
freedom under the snpcrvision oft he institutional council empowered by its own Act

(Office oftbe National Education Commission, 2001). The education personnel in
Thailand, including those in the Rajabhats, will be classified into four categories of
staff. They are teaching staff, adm[nistrotivc staff, educational support staff, and other
educational support staff(Office oflhe National Education Commission, 2001).
Moreover, higher education institutes will be given two allocations of resources.
These are public and private sources - public expenditure for education includes the
central government budget and subsidies for local funding and private expenditure,
while the private sources are expendituro from households and other non-government
sources (Office of the National Education Commission, 2002, p.27). Provision of
matching grants for capital cos ls of public higher education institutions wHI be based
on a long-tcm1 development plan, which is in line with the higher edUC3tion
development plan. Distribution ofbudgctary allocations for operating costs of public
institutions will be based on the relative funding mode! (Office of the National
Education Commission, 2001 ). In tenns of the relative funding model, Raj ab hat
Universities will receive their funding on the basis of the number of the students who
choose to enroll (Salmi, 1999, p.62). As a result, lecturers ofRajabhat Universities
will be placed in a new environment that will be concerned with the characteristics of
the change, managing the change, value for the !ec(urer, and perceived value for
students.
The change has been implemented in two phases so far and this is consistent
with some research on system-wide educational changes in centrally controlled
systems. Tllese are an initial planning stage (up to 1999) and then an implementation
' stage from 21)00 onwards. Previous research on planned educational changes, when
successful, slmws that they have a life cycle that can br. divided into three stages:
initiation, implementation and routinisation (Moroz & Waugh, 2000, pp.159-178;
Waugh, 2000a). Initiation refers to the processes and planning which lead up to and
include the decision to proceed with the change. This may take from several monUrn
to many years. Implementation refers to the first use of the change on a system-wide
basis in !be organisation and may extend up to four years or more. Routinisation
refers to whether the change becomes an ongoing part of the system.
The change will profoundly influence both the content and delivery system for
traditional higher educational institutions such as Rajabha!s in Thailand. Staff at
2

Rajabhats will have to rethink their delivery and teaching procedures and the way in
which they teach people to learn. This leads to the focus of this study, lecturer
receptivity to a major new policy ch.ange (in the context of planned change at
Raj ab hats in Thailand), that has been declared since 1999, and is expected to be fully
implemented, Thailand-wide by 2002.
ifackground to tile study
Change in higl1er education
ln the competitive 1990s, higher education institutions ha,;e come lo accept that
they must adopt some business-type procedures in order to succeed, and they must be
committed to sati~fying the needs of their clients in the education ,~ommunity. New
modes oftcaehing and learning should be developed in higher education institutes,
such as building educational quality, providing for lifelong learning oflill, and a
renewed focus on professional purpose for higher education (Office of the Hational
Education Commission, 2002, p.68). Particularly, lhe quest for better quulity higher
education must be linked to the qm1st for cost effectiveness in high:,r education. Bel!
and Harrision (1998) went further to state:
.. .Jfuniversilies do not wish to be regarded by governments or by communities as 'arrogant' or 'self-serving', then they must match cost to outcome, and not simply keep on putting off the day of reckoning through trying to raise yet more money by increased student charges or other escape routes ... (p.74).
Kaselsart University (1997, pp.331-332) reported on a study of the requirements
of higher education in Thailand. Higher education institutes:(!) need to be the right
size and suitable for efficient management; (2) should be democratic institutions in
which people can participato freely; (3) have modem l'<lucational technology suitable
for student learning and the transfer ofknowlcdge; (4) be able to do research and
develop new knowledge; (5) be able to hire personnel for quality and virtue; (6)
provide students with quality outcomes; (7) providt a diversity of curriculum and be
responsive to the needs of their communities; (8) be able to work joint ventures
J

between business and organisations; (9) be able to network with other organisations to
share knowledge and expertise; and (IO) be able to take advantage of the
internationalisation of knowledge, expertise and resources to benefit Thailand and the
Thai people.
Coaldrake and Stedman (1998, p.147) stated that higher education institutions in
countries like Thailand must be concerned with these areas, and they cannot now be
avoided. Academics have long been accu~ed of being remote from the concerns of
society, and sometimes from their students. Academic expertise has been debated in
Tliailand around the concept of higher education autonomy, which basically means
being able to conduct and implement one's own a!Tairs, and be accountable for them.
Higher education is already autonomous in the sense that academics decide what they
teach and research, how they will do it, and who will be admitted.
Bell and Harrison (1998) s~tcd !hat higher education institutes in Thailand have
become aware of the gap that is widening between their own cultural positions and
actual environmental change. Thus, changes in educational organisation have to be
made rapidly in order to close the gap that has emerged between culture and reality.
Basic research and industrial development of new technologies has helped produce
more efficient services and products in other countries; Thailand !ms to 'catch up'.
The 'knowledge centres' in Thailand nei:d to carry new approaches, ideas, and
practices into Thai communities. Culture changes in education at the universities
through technology and globalisation havo Jed them to require planning in two
directions. Theoc are new kinds oftcaching and learning resources, and new staff
policies. In order to achieve high quality in professional develepment in these two
directions, planning will develop changes that link staffing policies (S) with new high
quality teaching modes (f), new infonnation and education technologies (I), and
research enhancement (R)'. This is expected to include new aspects such as:(!) full
opportunities for professional development of existing staff; (2) careful analysis of the
1 From these letters, the acronym STIR was used in reference to stirring the pot
ofhigher education.
4

need to recruit new staff; (3) the development oflhe slafftowards enhancing both
their teaching and research; and (4) achieving satisfaction among their students, the
professions, local communities, and governments (Nix.on, Martin, McKeown, &
Ranson, 1997; Venables, 1997; Bell & Harrison, 1998, pp.75-77).
Eis cm on ct alia (1999, pp.17-18) have suggested that !he organisation which
controls higher education institutioris should better define and provide for five aspects
of higher education reform. These include: (I) a strategic assessment of national high
level human resource requirements; (2) periodic assessment of performance of the
institutions; {3) attestation of the credentials they award; {4) providing core budget
fonding for higher education institutions, funding for capital improvements,
scholarships to students, and support for graduate education and research; and (5)
establishing certain system-level policies governing academic employment and
.. promotion.
Tack (2001) asserted that there are eight major challenges facing higher
education in all countries, including Thailand. These are: {l) globalisation; (2)
increased internal and external competition; (3) diminishing financial resources; (4)
dramatic:ally different students; (5) a radically changed role for faculty; (6) a
significant assessment and accountability movement; (7) sweeping reform of
instruction because oftechnology advances; and (8) redefinition ofresearch and
scholarship.
According to emerging related literature mentioned above, there are at least five
main aspects that would impact on higher education in Thailand. They arc: 1)
globalisation and infonnation tceh11ology, 2) new professional development, 3)
strategic partnerships and links, 4) autonomous institutes, and 5) financial
management. All this led to the development and planning of the largest change in
education in Thailand for 50 years.
Educational rcfonn in Thailand
Thailand has been confronted with major social changes from within and from
its interconnection with the complex and rapidly changing world (Office oft he
National Education Commission, 2002, p.14). These changes can be overwhelming
5

for both individuals and society, and they may cause imbalar,;e; in various aspects of
development. Present social institutions have failed to adapt themselves to these
formidable changes. The results are organisational wcalmesses, confusio1,, conflicts
and suffering. Social reform is indispensable in order to strengthen a!\ parts of society.
Since it is believed that education is a very important process to enhance individual
development, which will contribute to the social and economic development of the
country, educational system refonn is one of the most important areas of social
reform. It will enable Thailand to move through the current crisis (Office oft he
National Education Commission, \999b).
There has been continuous movement to push educational refonns by both the
public and private sectors in Thailand during the 1990s. The first successful attempt
was the inclusion of various provisions relating to education in the 1997 Constitution
(the National Education Commission, 1999b). Among these provisions, there were
two paramount impacts on education in Thailand. They were: equity for all in
receiving at least 12 years of basic quality education; and enactment of the National
Act, which is the first in the history cf Thai education and will allow education
improvements on all aspects. In th~ vthcr words, educational systems in Thailand will
be allowed to improve at least eight main categories, such as ensuring access to basic
education for all, reforming the curriculum and learning processes, encouraging
participation and partnerships in education, restructuring educational administration,
enhancing educational standards and quality assurance, retraining teachers, faculty
staff, and educational personnel, mobilizing the resources and investment for
education, and utilizing technology for education.
Urgent steps were taken by concerned agencies in Thailand to make
preparations for the enactment of the National Education Act in order lo meet the
many ,equircments stated in the various provisions, especially in the univcrsalisation
of 12 years of basic quality education. The drafting oft he National Education Act was
made on a number of significant issues, such as basic academic infonnation, scrutiny
by scholars, participation of all stakeholders, public relations, and public polling.
On !" July 1999, the Bill received final approval in principle from the House of
Representatives. A period of one year and 11 months was devoted to its drafting. On
August 14, His Majesty King Bhumibol Adulyadcj, graciously granted His Royal
6

assent for the promulgation of the National Education Act, B.E.2542 {1999), which
was subsequently published on 19'~ August, 1999 in the Government Gazelle and
brought reform into effect in December the same year (Office of the National
Education Commission, I 999h). Consequently, the structure of the educational
systems in Thailand must be changed and be reformed. These changes include
primary education, secondary education, and higher education. The present study
focuses on higher education.
According to this Act, higher education in Thailand is divided into three levels
(Office of the National Education Commission, 1999c). They are (I) lower than
bachelor degree level, which aims to promote learners' knowledge and vocational
skills at a moderate level; (2) bachelor degree level, which aims to promote learners'
higher level ofknowledge and skill in various disciplines; and (3) graduate level,
which aims to promote learners' special knowledge and skills.
Higher education systems have been affected in at least four aspects, such as Ille
principles of educational provision, the structure of administration and management,
quality assurance cf education, and mobilization of resources and capita! for
education. The Act aims to stimulate higher education to \cad the Thai people to
develop their skills to be competitive with oth~r countries. Higher education in
Thailand must be reformed in line with the National Education Act. Some important
aims of higher education will be refonned. They are: (I) to adjust the missions and
functions of higher education in similar directions, (2) to give the chance of equality
for learning in higher education to each part of society, (3) to promote academic
standards and quality assurance so that higher education is acknowledged in local
areas, country areas, and inlcmationally, and (4) to improve administration and
management systems so that they arc nutonomous institutions, nbreast of the time, and
to mobilize al! resources to ensure education is efficient, and ensure accountability
(Office ofth.e. National Education Commission, 1999c).
In order to achieve these aims, higher education in Thailand must be reformed
in various aspects. Higher education has to manage the new structures of organisation
administration and support educational quality assurance (Office of the National
Education Commission, l 999a).
7

The creatio11 ofRajabhat Universities
A new educational system in Thailand was founded in the reign of King Rama
IV, King Mongkut, more than one hundred years ago. At first, this new type of
education was provided to princes and princesses only, while ordinary people had to
study with monks in monasteries (Hunnakin, 1978, pp. 121-123; S\tthironnarit, 1979,
pp.32-33). This situation continued until the reign of King Rama V, King
Chulalongkom, who upon his return from visiting European countries, brought a new
cducationul system lo Thailand. He founded an elementary school, the Royal Pages'
School, and also r, teacher training school (Office ofRajabhat Institutes Council,
2002).
That first teacher training school in Thailand was founded in 1892 at the former
Yos-se Orphanage (The Children's Home) in Bangkok for the purpose of training
elementary school teachers. As education expanded, the need for teachers inevitably
increased. This resulted in the establishment of teacher training schools, both in
metropolitan and provincial areas, to prepare teachers for teaching in elementary and
secondary schools. In 1928, there were 25 such schools in operation, offering
programs lending to a primary teaching certilicate and a secondary teaching certificate
(Jumpathong, 1979, p. 7; Ministry of Education, 1964).
It was not until 1954, however, that a separate teacher education department
was established in the Ministry of Education (Hunnakin, 1978, p.171; Jumpathong,
1979, p. 8). This constituted a major reorganisation of the teacher education system,
responsible for training qualified teachers for elementary and secondary schools
throughout the country.
Duling the early years, up to 1975, teachers' colleges offered two programs.
One, leading to the lower Certificate in Education, provided for those who had
finished junior high ochool educntion, a two-year program to prepare them to become
elementary school teachers. The 1oecond program, leading to the High Certificate in
Education, provided for those who had finished senior high school education (a two
year training course), to prepare them to teach in secondary schools (Office of
Rajabhat Institutes Council, 2002; Office of Educational Reform, 2000, pp. 592-593).
However, in 1975, as a result of the expansion of compulsory education, the ]1igh rate
8

of population growth and the need to upgrade the quality of secondary school
teachers, the teachers' colleges began to offer a four-year program leading to a
bachelor's degree in education and, throughout the following years, thcsl:' four-year
programs of specialisation have expanded to include various other subject areas, such
as education, sciences, and arts, in order to meet the needs of the c.-mtinually growing
community.
The teachers' College Act of 197:i (Office ofRajaiihat Institutes Council, 2002)
established teachers' colleges as institutions of education in order to provide academic
knowledge, and for training qualified teachers to the bachelor's degree level
(Jumpathong, 1979, p. 13). TI1ey were also required to conduct research, to promote
the quality and status of the teaching and administrative personnel, to maintain and
conserve culture, as well as national identity, and provide academic services to the
community. For about ten years, teachers' colleges perfonned this function
effectively, by training teachers with better qualifications to fill all teaching positions.
However, owi11g to a surplus of teacher education graduates, the Teachers' College
Act of 1975 was revised in 1984 (Office ofRrijabhat Institutes Council, 2002). As a
result of this Act (Te~chcrs' College Act of 1984), the Teacher Education Department
represented by the 36 teachers' colleges, diversified their ,urricula to train manpower
in fields other than education (Office ofRajabhat Institutes Councils, 2002). Various
subject areas were offered in the te.achers' colleges, in accordance with the needs of
the locality, and based on research conducted prior to the curricula design. These
curricula aim to equip the learners with competence, knowledge, skills and good
attitudes towards their future profession, as well as managerial skills and creativity.
They also provided learners with continuous practice and on-the-job training
opportunities. Graduates from teacl1ers' colleges are well prepared to work in these
new-teaching professional areas.
1992 marked the centenary of teacher education in Thailand, aod also saw the
Department ofTeacher Education assuming wider roles in the education of future
professionals to serve the nation. Consequently, there was a serious e!Tort to find a
name which would accurately reflect the teachers' colleges' new tasks and functions.
On February 14'\ 1992, His Majesty King Bhumibol Adulayadaj, graciously
conferred the name "Rajabhat Institute" on the teachers' colleges. This name means
9
'the Royal Official' (Office ofRajabhat Institutes Council, 20;!3, 2000). The
Department of Education and the teachers' colleges feel the d~cpest gratitude for His
Majesty's favour (Rajabhat Institute Ubon Ratchathani, 2002b, p.5; Office of
Educational Reform, 2000, p. 584).
The Rajabhat Institute Act of 1995 brought changes to lhe colleges' institutional
structure, administration and autonomy. Up to then, colleges had been required to
offer certain first degree programs, and could opt to offer other authorised programs
in education, arts and sciences. Many restrictions have now been removed from the
fields and specialisations that the Rajabhat Institutes can offer. Subject to a process of
authentication and accreditation, each college may now offer programs leading to
first, second or third degrees, and intennediate diplomas. An effect of these changes,
and of the autonomy that they create, is 10 establish 41 locally-oriented institutions
endowed with greater flexibility and capacity to provide for the country's cdncational
needs (Office ofRajabhat Institutes Council, 2002). Thus, they will be called
Rajabhat Universities in 2002 in line with lhe National Education Act of 1999
(Rajabhat Institute Ubon Ralchathani, 2001c, pp. 22-28).
Relevance of the study
Importance of the educational change to Thailand
The development pallcrn of the change in Thailand bas b':en modeled on many
western industrialised countries. The social, cultnrnl and environmental impacts on
Thai society, as a result of economic - led policy, arc evidence that there is a need for
a new development paradigm lo help the country fully realise its economic potential
and maintain its social and cultural identity. Amid fierce competition and striving to
gain comparative advantages within the international community, together with the
growing competitiveness of neighbouring countries, Thailand will have to move from
resource-based and labour-intensive industries to a more advanced and knowlcdge
based economy (Office of the National Education Commission, 2002, p.6).
The future ofThailand rests with t~e ability of the Timi people to secure
economic prosperity that goes hand in hand with social well being. The massive
10

influx of foreign culture, coupled with the weakening of traditional Thai values, have
necessitated a counter-movement for cultural regeneration and preservation of Thai
identity (Office of the National Education Commission, 2002, p.6). Currently,
Thailand has entered a period of cultural revitalisation, needed as an antidote to the
economic crisis and moral confusion. The social order restoration policy imp\cmented
throughout the country has been widely supported by the majority of people (Office
of the National Education Commission, 2002, p.6). The policy emphasises in
particular the crackdown on drug trafficking and smuggling which is now identified
as a threat to national security. The crackdov.:i, through strict enforcement of the law
to deter crime, is one measure the Government uses to address social problems.
Thailand is radically improving its educational and training systems as the
foundation of national development. ln order to address the economic and social
problems, particularly tl1e anticipated economic slowdown nnd rising unemployment,
the system of education and training will provide Thai people with self-sufficiency
and adaptability. It will be, therefore, the kind of education that gives the people not
only general and vocational skills, but also adequate learning skills, a love for
learning and learning how lo acquire skills. Jt is an Cducation which provides the
people wilh the ability lo make rational judgments and choices, prepares them to take
up prospective occupations, and gives them a common ground to share with other
members of society. This kind of education will pave the way for Thailand to become
a !earning society (Office of the National Education Commission, 2002, p. 7; Ministry
of Education, 2001, pp. 1-3). In order to achieve a learning society, the educational
system in 'D1ailand is being refonncd in accordance with the National Education Act
of 1999.
Significance
This study will add to knowledge in at least three ways. They are; ( 1) new
knowledge of the change; (2) improving theory of change; and (3) improved variable
measur~s. This study is very important for the decision-makers oft he planned, major
educational change in Thailand. The decision-makers want to improve the educational
standards for the Thai people. This study will provide new knowledge about the
11
.,,,_
receptivity of Thai lecturers to the proposed change in the implementation stage. This
knowledge maybe very useful to them in deciding how to proceed during the later
stage ofthe implementation process.
The study uses a genera] model ofreccptivity to system-wide educational
change. The model has not been tested in Thailand. A test ofthc mode! will provide
new knowledge about the theory of the major educational change in a centrally
controlled system. Th,:i study will test a method of using a Rasch computer program to
create a single scale of receptivity based on nine teacher-change aspects. The nine
aspects arc: (!) attitude to the new system compared to the previous system, (2)
practicality in the classroom, (3) alleviation of concerns, (4) learning about the
change, (5) participation in decision-making, (6) personql cost appraisal, (7)
collaboration with other lecturers, (8) opportunities for lecturer Improvement, and (9)
perceived value for students. This will add new knowledge on each variable and test
whether a Rash measurement model can be used to create a linear scale for each
variable with expectations and behaviours calibrated on the same scale.
The data for each oft he nine aspects will be tested for validity and reliability
using statistics involved in a recently <leve!oped Raschcompulcr program (RUMM;
Andrich, Sheridan, Lyne & Luo, 2000). This could improve our knowledge of the
measurement oft he variables used in understanding system-wide educational change.
Aims and Research questions
Purnnse of the study
There are three aims of the study.
1. To investigate lecturer receptivity to a major new educational policy change in
the context of planned educational change at Rajabhats in Thailand;
2. To investigate the relationships between lecturer receptivity, and nine lecturer
changc aspects: (1) attitude to the new system compared to the previous system, (2)
practicality in the classroom, (3) alleviation of concerns, (4) !earning about the
change, (5) participation in decision-making, (6) persona! cost appraisal, (7)
collabomtion with other \cclurcrs, (8) opportunities for lecturer improvement, and (9)
12
perceived value for students, in the context of three perspectives: (!) How I expect the
change to be plam1ed, (2) How I think the change was really implemented, and (3) My
actual behaviour to the change involved; and
3. To investigate why Thai lecturers at Rajabhats hold the attitudes towards the
change that they do, and help understand their behaviour towards the change.
Research questions
I Can a proper linear scale of lecturer receptivity to change, involving nine
aspects and three perspectives of the change, be created where the receptivity
measures are calibrated on the same scale as the item difficulties, using a new Rasch
computer program? The nine aspects arc: (l) attitude to the new system compared to
the prcviou~ system, (2) practicality in the classroom, (3) alleviation of concerns, (4)
learning about the change, (S) participation in decision-making, (6) persona! cost
appraisal, {7) collaboration with other lecturers, (8) opportunities for lecturer
improvement, and (9) perceived value for students. The three per.;peclivcs are: (1)
How I expect the change to be planned, (2) How I think the chaT!ge was really
implemented, and (3) My actual behaviour lo the change involved.
2. Can proper !inear scales be created for each oflhe nine aspects of change,
using the Rasch computer program?
3. Can the linear receptivity scale involving all aspects together be used to
interpret the expectations and behaviours ofRajabhat lecturers to the change?
4. Can each oft he nine new scales be used to interpret Raj ab hat lecturer
expectations, and behaviours towards a recenlly implemented pl3illled educational
change in Thailand?
S. What arc the reasons that lecturers give for holding their expectations of, and
behaviours towards, the recently implemented planned educational change?
Limitations
The results of this study apply to the lecturers in the South of the northeastern
group ofRajabhat Universities in Thailand: Ubon Ratehathani, Surin, Buriram, and
Nakhom Racha.sima. The results cannot be generalised, strictly, to all lecturers of all
Rajabhat Universities in Thailand. However, there do not seem to be any reasons why
13
the results should not be applicable to all Rajabhats in Thailand.
A main study constraint lies \n the research model itself. Lecturer receptivity
towards the new educational policy is likely to be complex; involving. the interaction
of many variables, audit is not possible to detail all these intcractiom/ The model
attempts to isolate the most important variables in order to simplify the study mid to
provide some general guidance and understanding for the researcher. A limitation !ies
in the extent to which the nine chosen variables are actua\ly the most important ones
and that other important variables have not been omitted, and to how well the
simplified model ofreceptivity can be used to understand complex interactions in a
major educational change.
Definitions of terms
There are some important definitions oftenns in this research.
The educatlonal change is defined as educational system reforn1 in line with the
National Education Acts of 1 J99 in Thailand.
Receptivity to the educational change is defined in term of nine aspects (I) attitude
to the new system compared to the previous system, (2) practicality in the classroom,
(3) alleviation of concerns, (4) \earning about the change, (5) participation in
decision-making, (6) personal cost appraisal, (7) collaboration with other lecturers, (8)
opportunities for lecturer improvement, and (9) perceived value for students. Each
item of each variab\c is measured in three perspectives: (I} How I expect the change
to be planned, (2} How I think the change was really implemented, and (3) My actual
behaviour to the change involved.
New Policy is defined as the National Education Act ofB.E.2542 (1999) ofThailand.
The National Education Act of B.E.2542 (1999) is defined as the National
Education Act, which was subsequently published on \91h August 1999 in the
Government Gazette in Thailand.
ONEC is defined as Office of the Natiooal Education Commission, abbreviated as
ONEC, which is under the jurisdiction of the Office of the Prime Minister, Kingdom
of Thailand.
14
A Raj ab bat University is defined as a higher education institute, which is mainly
under the responsibility of the Ministry of Education in Thailand, and was Connerly
ea!\ed Rajabhat Institute.
A Lecturer is defined as person with major responsibilities for learning and teaching
and ~ncouragement of learning through v:uious methods in a Rajabhat University
such as Ubon Ratchathani, Surin, Burirarn, and Nakhom Ratchasima, in Thailand.
ORIC is defined as Office ofRajabhat Institutes Council in Thailand, abbreviated as
ORIC.
Structure of the thesis
This thesis is reported in eleven chapters.
Chapter one introduces the reader to educational change in higher education (the
Rajabhats in Thailand). Background to the study is provided and its relevance
discussed. The research questions, purpose of the study, and definition oftenns are
also presented in this chapter.
Chapter two describes the major educational planned change in Thailand, ideas
behind the change in line with the 1999 National Education Act, and the 'new' culture
of learning. It also describes planned educational change in Thailand and the major
stages of the change are also discussed.
Chapter three is the literature review. This chapter describes organizational
change in higher education and some case studies of change in higher education. It
summarises what other researchers have fuund on system-wide change in a centrally
controlled educational system and also identifies factors a!Tecting teacher (lecturer)
receptivity to planned system-wide change.
Chapter four presents the model and the theoretical framework oftl1e study. The
presentation begins with a model of lecturer receptivity to a system-wide change in a
Thai Rajabhat. Nine aspects influencing receptivity are highlighted. A rational for the
interviews and hypothesis or"thc study arc proposed.
15
=
Chapter five presents an~ questionnaire on nine aspects relating to lecturer
receptivity to I~<:: change. Questionnaire design, measuring lecturer rec~'Ptivity, and
Rasch Meas'.lremcnt Model are also discussed. The pilot testing for the questionnaire
is describe[
Chapter six descri~ the methodology oft he study. TI1e sample and population
is described. Research design and procedure for data collection are discussed.
Preliminary data analysis is presented.
Chapter seven reports the data analysis of the questionnaire (Part 2A). This
chapter only presents results for lecturer receptivity where all nine aspects of tho
educational change are analysed together. The process of analysis using the RUMM
(2010) computer program is explained and the results presented. Meaning of the
consequence of lecturer receptivity to a major new policy change scale is explained.
Then, research questions and hypotheses arc discussed.
Chapter eight reports the data analysis of the questionnaire (Part 28). This
chapter presents the results for lecturer receptivity in tho first group. There arc five
aspects: I) comparison with the previous system; 2) practicality in the classroom; 3)
alleviation of concerns; 4) learning about the change; and 5) participation in decision
making. The process of analysis using the RUMM (2010) computer program is
outlined and the results for each aspect are presented. Meaning of the scale of lecturer
receptivity to a major new policy change for each aspect is explained. Then, research
questions and hypotheses are stated.
Chapter nine reports the data analysis of the questionnaire (Part 2C). This
chapter presents the results for lecturer receptivity in the second group. There are four
aspects: \) personal cost appraisal of the change; 2) collaboration with other lecturers;
3) opportunities for lecturer improvement; and 4) perceived value for students. The
process of analysis using the Rm,..tM (2010) computer program is outlined and the
results for each aspect arc presented. Meaning of the scale of lecturer receptivity to a
major new policy change for each aspect is explained. Then, research questions and
hypotheses are stated.
16
- 222 I

Chapter ten reports the interview data analysis (Part 3). The findings arc
di~cussed in the light ofreasons .that lecturers give for holding their expectations of,
and behaviours towards the nine change aspects, and receptivity to planned
educational change.
Chapter eleven, the final chapter, provides a summary of the study and draws
together the major findings, conclusions and implications of the study for
administrators, lecturers and research on change at Rajabhats in Thailand.
17

CHAPTER TWO
THE CHANGE IN THAILAND
It is the purpose of this chapter to explain, briefly, the major educational
planned change in Thailand and the ideas behind the change, in line with the 1999
National Education Act. lt focuses on educational administration and management,
and the new culture of learning. The educational administration and management arc
discussed first. Following, the 'new' culture of!eaming is described. Then, planned
educational change in Thailand and the major stages of the change arc discussed.
Major educntional planned change in Thailand and the ideas behind the change
In accord with the 1999 National Education Act, administration and
management of education in Thailand are reorganised iu 1errns of administrative
structure, personnel management and financial management (Office of the National
Educntion Commi~sion, 2001). They arc based on three aspects: 1) re.organising the
educational system; 2) a new educational structure; and 3) a new process of education
as provided by the Act. Educational administration and management arc concerned
with (1) reorganisation of administrative structure, (2) educational personnc\
management, and (3) financial management. The 'new' culture oflearning is
concerned with three main aspects. They arc (1) the learner as centre of learning; (2)
the reform of the curriculum for basic education; and (3) a system of educational
quality assurance (Office of the National Education Commission, 1999b, pp. 218).
Administration and Management of the change
I. Reorganisation of Administrative Structure
By 20 August 2002, the Ministry of Education is to be established by
merging the Office oft he National Education Commission under the Prime Minister's
Office, the Ministry of Education and the Ministry ofUniversity Affairs. Currently,
the process of organizing the structures, organs and division ofrcsponsibilitics is still
18

in its initial stages. However, the Executive Committee of the Education Reform
Office has so far agreed that education in Thailand is administered and managed at
two levels. They are at national level and at local level.
At national level educational administration and management are the
responsibilities of Office oft11e National Council for Education; Office of the
Commission for Basic Education; Office of the Commission for Higher Education;
Office oft he Pemianent Secretary for the Ministry of Education; and Office ofU1e
Commission for Vocational education (Office ofNitirat Press, 2002, p.228).
At local level, educational administration and management arc under the
responsibilities o:" educational service areas and local administrntion organisations as
well as p:ivate and state educational institutions.
2. Educational personnel management
Educational personnel management is supposed lo reform a system for
administering the affairs of teachers, faculty staff and educational personnel. The new
system is based on the principle of decentralization, taking into consideration the
issues of standards, efficiency, and participation of teachers and educational
personnel. These are concerned witl1 two categories. They arc(!) classification of
education personnel, and (2) structure of personnel management for basic education.
In terms of classification of educational pcrsonncl, educational personnel are
classified lo four groups. They consist of (1) teaching staff, including in-service
teachers who arc required to have professional licenses; (2) administrative staff,
including educational institution administrators and educational administrators in
local education areas. These administrators arc required to have professional licenses;
(3) educational support staff, including those providing direct support to teaching and
learning, e.g. educational supervisors, those who prepare and develop educational
media, those responsible for the inspectiou, monitoring and evaluation of educational
institutions, including registration and report. Professional licenses are required for
some of these staff; (4) other educational support staff refers to those who are not
directly involved in the teaching and learning processes o.g. general administrative
staff and accounting staff. These personnel arc not required to have professional
19

------------------------
licenses. The structure of personnel management for basic education is divided into
two parts. They are the structure of personnel management for basic education at
national level and the strocture of personnel r.ianagcment for basic education at local
level. At the national level, apart from the Institute for the Development ofTeachers
and Educational Personnel, and the Council of Teachers and Educational Personnel
proposed for the national level, there is to be a central organisation responsible for the
management of educational personnel for basic education, the Commission for
Teachers and Educational Perso11ncL Al the local !tvel, under the Office of the Arca
Committee for Education, there is to- be an organisation responsible for overseeing
personnel management for teachers and educational personnel in the educational
service area called the Arca Committee for Teachers and Educational Personnel.
Personnel management in an educational institution is the responsibility of the
educational institution committee, or school board, and an administrator of each
institution. The personnel administration of other agencies, under the supervision of
education service areas, is under the responsibility of the ~dministrator of each
organisation (Oflicc of the National Education Commission, 2001, pp. 15-18).
3. Financial Manage111ent
Financial Management is concerned with five aspects. They are(\) the
'demand-side' finance of education; (2) responsibilities of the government; (3)
participation of learners and families; (4) contribution from the private sectors and
society; (5) management, monitoring, auditing, nnd evaluation in utilisation of budget.
In relation to the 'demand-side' finance of education, there are major changes in
the allocation of educational resources in order to achieve the objectives set out in the
National Education Act 1999. Education in Thailand is currently financed through the
'supply-side', that is, the government is the provider of education. The reform
initiatives have proposed financing of education through the 'demand-side', e.g.,
those demanding cducatic.Tlal services, parents and students. Accordingly, any
government subsidies will be provided to learners instead of educational institutions.
The responsibilities of the government are restricted to the allocation of
resources for basic education and the allocation of resources for higher education. For
20

basic education, distribution of budgetary allocations for capital costs of public
edur.ationa\ institutions are to be based on the proposed programs and projects, taking
into cons!deration the needs of each institution. In addition, distribution of budgetary
al\ocatious for operating costs will be based on per head expenditure, excluding
salaries for public educational institutions, and including salaries for private
educational i!istitutions. The allocation of resources for higher education, and the
provision of matching grants for capital costs ofpublie higher education institutions
are to be based on a long-term development p!an, which is in line with the higher
education development plan. Moreover, distribution ofbudgctary allocations for
operating costs of public institutions is to be based on the rclntivc funding model.
Participation of learners and families are separated into two parts. They arc
basic education finance and higher education finance. For basic education finance, the
Government provides 12 years of quality education, free of charge. However, learners
or families take responsibility for other expenses related to education, such as
personal expenses, or other supplementary educational services. Learners from lower
income families arc to be supported by the government based on the poverty line.
Similarly, in higher education finance, learners arc responsible for their cducutional
expenses, in response to the high rate of private returns to higher education. A
progrnm of phased-increases in tuition fees is lo be introduced as a mechanism for
cc>st recovery. Scholarships and loans will be provided to learners who require
financial aid in both public and private institutions.
Contributions from the private sector and society are planned in four categories.
Firstly, financial institutions arc to be encouraged to provide low-interest loans to
private institutions. Secondly, financial support for education is lo be sought from
public and private organisations both in Thailand and other countries. Thirdly, with
additional tax exemption measures, all sectors of the society arc to be encouraged to
be educational providers or participate in the provision of education. Fourthly, a levy
of inheritance tax is to be proposed so that its income can be earmarked for
educational provision. Finally, an endowment fund is to be established in each
educational institution and donations to the fund can be included in calculation oftax
rebates.
21

Management, monitoring, auditing and evaluation in regards to the budget are
planned in three strategies. One is budget management as a financial entity. Each
basic education institution specifies its own financial requirements for submission
through the educational service area lo the Basic Education Commission. The Budget
Bureau distributes the budget directly to the educational service area for schools to
manage by themselves. At the higher education level, request for government
subsidies arc to be submitted to the Higher Education Commission. The budget is to
be allocated directly to e~ch institution. Two is the accounting system. Each
educational institution is required to establish its own accounting system on an accrual
basis in order to show its actual pcrfonnance and financial status. Three is auditing.
Internal auditing is to be in!rodticcd in tenns of financial audit, operation audit, and
pcrfonnance audit, by internal inspectors and the inspection commillee of each
institution. External auditing is to be under the responsibility of the Office of the
Auditor-General of Thailand and licensed auditors (Office of the National Education
commission, 1999b, pp. 220-221; Office of the National Education Commission,
2001,pp.26-3\).
New Culture of Leaming
As learning refonn can be implemented without required regulations, and the
improvement of the learning process is considered to be extremely important, various
efforts have been initiated and carried out in parallel with the drafting of the National
Education Act in order to move towards the new culture ofleaming. Leaming rcfonn
is concerned with three main categories. They are (I) learner, as the centre of
learning; (2) the refonn of the curric1llum for basic education; and (3) a system of
educational quality assurance.
I. Learners as the centre of learning
All learners arc capable of learning, and learning and self-development are
regarded as being most important. To ensure desirable characteristics of future
learners, child-centred learning has been promoted by all agencies concerned. Boll1
teachers and learners arc currently encouraged to change their roles. Teachers must
change themselves from "te!lers" to "facilitators .. , while learners arc encouraged to
22

learn by lhcmsclves with the help of teachers (Office of the National Education
Commission, !999c). Three essential tasks are to b.! undertaken. TI1cy are: (!) change
agents for the !earning reform; (2) research development on the learning process; and
(3) leading schools for !earning refonn. For change agents for the learning reform, the
most significant agents ofteaching and learning reform arc teachers. Therefore, the
Office of the National Education Commission initiated the National Teacher and
Master Teacher Awards in 1998 in order to recognise and reward outstanding teachers
in tenns of teaching- learning refonn. The Ministry ofEduca<fon has currently
accepted the idea of learning rcfonn through national teachers and master teachers.
Any teacher who is likely h.l change his teaching behaviour according to the child
ccntrcd concept is to be selected as Spearhead Teacher. This type of teacher au ends
workshops on child-centred learning, under the supervision of national teachers and
master teachers. These teachers create increasing agents of change for learning rt:fonn
through their networks of teachers.
In addition, research and development on the leaming process arc focused.
Leaming processes me essential for the success of learning reform. Teaching staff in
all faculties of education and educational institutions, as we!l as personnel in other
public and private organis;.:tions, arc encouraged to conduct research and development
(R&D) projects with fina11cial supp-ort from the Thailand Research Fund. The
objectives oft he research and development projects are to develop basic education
institutions through participation of all parties concerned, focusing on the learning
process reform of the whole school. The expected outcomes of the research and
development projects arc: {I) changes in paradigm and learning processes; (2)
development of learners in line with standards set; (3) developing a body of
knowledge on research and development; (4) development of research skills and
utilisation of research as an instrument in work development and building the body of
knowledge; (5) community participation in learning process; and (6) networking of
cooperation for development.
The Office of the National Education Commission has launched a project to
select 1,000 schools in order to promote and support schools, or basic education
institutions, in leading for ]earning reform. These actions arc in the process of
23

teaching and learning reform, or to initiate the reform of learning. These schools are
to be provided with documents on educational reform and learning reform, support for
personnel development, and part financial support for reform of learning. They are
required to improve the quality of education to conduct research and development on
teaching and !earning in their schools and, finally, to create networks by providing
knowledge and experience to other schools. This project is expected to effectively
encourage more schools to participate in the reform of learning in line with the 1999
National Education Act (Office of the National Education Commission, 2001, pp. 19-
22; Office of the National Education Commission, 1999b, pp.221-228).
2. The reformed curriculum for basic education
The curricula at all levels of education arc to be diversified, commensurate with
each level in order to achieve the objectives of learning reform. Both academic and
professional human development require a desirable b~lance regarding knowledge,
critical thinking, capability, virtue and social responsibility. As a result, the existing
curricula for basic education have been developed and redesigned by the Ministry of
Education to ensure effective refonn oflcaming (Office of the National Education
Commission, 2001 ). There are three main categories for the refom1cd curriculum for
basic education. They are: (1) development of a curriculum framework for basic
education; (2) preparation ofa national core curriculum; and (3) an implementation
plan for the reform curriculum.
2.1 Curriculum framework for basic education.
The new curriculum framework for basic education has been based on the
comments of all educational personnel, both public and private. The framework
consists of concepts and principles, curriculum structure, objectives, basic education
standards, standards of groups of learning content, assessment of learning content, and
organisation oflcarning, as well as monitoring, inspection, and evaluation. Standards
of subject groups and their indicators have been drafted in line with four key stages of
basic education. They arc: {\) primary education Grades 1-3; (2) primary education
Grades 4-6; (3) secondary education Grades 7-9; and (4) secondary education Grades
10-12. The subjects are classified into 8 groups. They arc:{\) Health Education and
24

Physical Education; (2) Art, M..isic and Dramatic Arts; (3) Mathematics; (4) Thai
Language; (5) Social Studies (6) Science and Teclmology; (7) Foreign Languages;
and (8) Career and Work Education. The prescribed standards and indicators have
been used for development of the national core curriculum that provide the guic\elines
for nil schools to prepare their learning content in detail, relevant to local conditions
and wisdom.
The Curriculum Framework for Basic Education has been prescribed in line
with Section 27 of the National Education Act 1999 (Office of the National Education
Commission, l 999c), with three components: (I) the curricular framework specifying
its objectives, and standards, as well as assessment and evaluation methods of
teaching and lcaniiug; (2) the framework of the national core curriculum is to be
organized consistently through four key stages; and (3) the framework for local
curriculum providing schools with guidelines for adaptation of learning contents
appropriate to their localities.
2.2 Preparation of national core curriculum
Concepts and guidelines for curriculurn management including strategies for the
introduction of the new curriculum have been dcv;;loped as follows: (\) key structures
of the core curriculum have bee[] developed comprising eight subject groups; (2) four
strategies have bee[] set out for effective implementation of the new curriculum. They
consist of: (I) the strategy for cuniculum development includes a trial of curriculum
management, research studies on the cunict.1lum implementation process,
improvement and development of curriculum implementation, curricular personnel
development and introduction of the new curriculum; (2) a strategy for curriculum
management includes public relations, guidance, academic networking system,
supervision, monitoring, inspection and evaluatio11; (3) a strategy for organisation of
learning experiences includes !earning resources, professional associations, classroom
research, development of learning media, and promotion of Master Teachers; and a
strategy for assessment of educational quality which sets out that a!l educational
institutions are required to establish their own quality assurance system, with
inspection and review as well as the intervention of agencies concerned in their
educational areas. Each educational institution must request evaluation of its quality,
both internal and external.
25

2.3 Implementation plan for the reformed curriculum
The new curriculum for basic education was introduced in the academic year
2002. It started with the first year of each key stage, and the second and the third for
the following years, as follows: (I) Academic Year2002: Grades I, 4, 7 and 10; (2)
Academic Year 2003 : Grades 2, 5, 8 and 11; (3) Academic Year 2004 : Grades 3, 6, 9
and 12.
3. A syste1n of educational quality assurance
To ensure improvement of educa!ional quality and standards at all levels, a
system of educational qtmlity assurance has been initiatt:d, with both internal and
external evaluation (Office of the National Education Commission, 2001). As internal
quality assurance must be regarded as part of educational administration, educational
institutions and agencies have been encouraged to conduct internal evaluation to
improve the quality of education. So far, research and development on internal
evaluation has been undertaken in 30 schools by the Office of the National Education
Commission for the preparation of guidebooks and internal evaluation models. The
Office of the national Education Commission has also conducted research on the
status of internal evaluation in educational institutions, so as to promote internal
evaluation, and prepare all schools for external evaluation. For external evaluation,
the National Education Act 1999 requires that each education?.! institution receive
external quality evaluation at least once every five years, and the evaluation results
arc to be submitted to the relevant agencies, and made available to the genera! public.
The first round of external evaluation of all educational institutions will be completed
by 20 August 2005.
The Office of the National Education Standards have been established as an
independent public organisation since 4 November 2000. The major role of the office
is to promote and set educational standards as well as to organise a system for quality
assurance, evaluation and monitoring the educational standanls of both public and
private institutions. It has designed a system of external and internal evaluation, and
prepared and implemented a major reform of edueational testing and measurement.
In order to achieve the refonn objectives laid down in the Act, understanding of
and support for all parties concemcd and the general public, are essential by the Thai
26

government. Consequently, measures and strategies to mobilise public participation
have been urgently introduced to move forward the reform of education for the new
century.
Planned educational change in Thailand and the major stages of the change
Overview
The first round of the models of planned educational change in Thailand were
concerned with three major plans. They are the National Scheme of Education 1992,
the Eighth National Education Development (1997-2001) and the National Edueation
Act of 1999. The planned educational change in Thailand was implemented in
accordance with the 1992 National scheme of Education and the Eighth National
Education Development Plan (1997-2001). The National Education Act of 1999 was
endorsed in 2002 and the system will be evaluated in 2005 (Office of the National
Education Commission, 1999a, pp.212-215) (Figure 2.1). These are described later in
this section.
Stages of planned educational change
The literature suggests tlmt planned educational changes, in a centralised
educational systcm,when successful, have a life cycle that can be divided into three
stages: initiation, implementation and routinization (Moroz and Waugh, 2000; Waugh
and Godfrey, 1995, !993; Waugh and Punch, 1987, 1985). Initiation refers to the
processes and planning that lead up to and include the dedsion lo proceed with the
National Scheme of ·n1e Eighth National Education 1992 TI1e National (1992-2001) Education Education Act of 1999
Development
i {1997-200!) I T T I Evaluation
(2005)
Figure 2.1; The three major bases for educational change in Thailand
Source: constructed by the author from the literature review.
27

change. This may take from several months to many years. Implementation refers to
the first use of the change on a system-wide basis in the organisation and may extend
up to four years. Routinisation refers to whether the change becomes an ongoing part
of the system. This, however, has only been tested in a secondary school system, and
not in higher education, as in Thailand.
The initiation stage of system-wide change in Thailand
Despite great efforts to improve the provision of educational services in both
quantitative and qualitative aspects, there remain weaknesses in education and
training in Timiland. Fortunately, the 1997 Constitution introduced challenging
guidelines for educational development, particularly the enactment of!he national
education law. The first National Education Act was promulgated in August 1999 to
serve as the fundamental law for the administration and provision ofedueation and
training in accord with the provisions in the Constitution.
However, before the full implementation of the first National Education Act of
1999, which wi!l take at least three years, Thai education will still be provided in
accordance with the 1992 Naliona! scheme of Education and the Eighth National
Education Development Plan (1997-2001). According lo the Eighth National
Education Development Plan (Office oflhe National Education Commission, \999a),
the objectives have three major a:Jpects. They arc: (1) to expand the provision of basic
education to all people, and to cxtelld basic education to secondary education !eve!;
(2) to improve the equality of education and it:; relevance to the needs of individuals,
communities and the Thai nation, and enable learners to achieve their full potential for
self-development; and (3) to enhance Thai education in strengthening the national
potential for self-reliance, and to contribute to national economic stabilisation and the
role of Thailand in the global economy.
The targets for educational development to guide the implementation have been
grouped into nine major programs. They are: (!) promotion of basic education for all;
(2) improvement of educational quality; (3) development of the teacher education
system and process, and the development ofin-service teacher education; (4)
production and development of manpower in the areas of science and technology and
28
social sciences; (5) research and development; (6) improvement of administration and
management; (7) development ofbighereducation; (8) education resource
mobilisation; and 9) development of an educational infonnation system.
In accordance with the National Education Act of 1999, planned educational
change is divided into eight main aspects (Office ofNational Education Commission
1999b). They are: (I) ensuring access to basic education for all; (2) refonn of
curriculum and learning process; (3) encouraging participation and partnership in
education; (4) restructuring of educational administrative structure; (5) enhancing
educational standards and quality Assurance; (6) refonn of teachers; faculty staff, and
educational personnel; (7) mobilisation of resources and investment for education;
and (8) utilisation oftedmologics for education.
The implementation stage in Thailand
Following the promulgation of the National Education Acl 1999, all agencies
concerned are required to take the following action as provided by the Act, including
its transitory provisions (Office ofNational Education Commission, 1999a). The
implementation is divided into 5 stages as follows.
Stage 1. Action taken by 20 August 1999
An Education Refonn Office was to be established as a public organisation by
virtue ofa royal decree, as provided by the Public Organisations Act, with a nine
member Executive Committw of the Education Rcfonn Office (Office of the National
Education Commission, 199%, pp. 212-213). The Executive Committee is to be
composed of a chairperson and members appointed by the Council of Ministers from
among those with knowledge, capability, experience and expertise in educational
administration; state affairs administration, personnel administration; budgetary,
monetary, and !inancial systems; public laws; and educational laws. The Secretary
General of the Education Refonn Office is to serve as a member and secretary of the
Executive Committee. Both the Executive Committee aud the Secretary General will
have a single tenn of office of three years, at the end of which their tenures will be
terminated, and the Education Reform Office will be dissolved.
29

·--·=
The Education R.efonn Office has five new responsibilities. One is to propose
refonn for managing teachers, faculty staff, and educational personnel. Two is to
propose mobilization of educational resources and investment. Three is to submit
proposals to the Council ofMinister.s regarding the necessary bills. Four is to submit
to the Council of Ministers, proposals regarding amendments to legislation, rules,
regulations, statutes and orders. Five is to carry out other functions as provided by the
Public Organisations Act.
A fifteen member Nominations Committee for the Executive Committee of the
Education Refonn Office is to be established. The chairperson and members of the
Executive Committee from among those qualified is submillcd to the Council of
Ministers for appointment.
Stage 2. Actions taken within the enactment date of20 August 2000
There arc two actions to be taken in this stage. One is to issue the ministerial
regulations to differentiate the levels and types ofbasic education. Two is to issue the
ministerial regulations for differentiation or equivalence oft he various levels ofnon
formal or infonnal education (Office of the National Education Commission, 1999b,
p. 213).
Stage 3. Actions to be taken within three years of the enactment date (by 20
August 2002).
Educational rights and duties, educational administration and management, and
development of a system, including production and further refinement for teachers
and educational personnel, are to be issued during this stage. For educational rights
and duties, all individuals have cqua! rights and opportunities to receive basic
education provided by the State, free of charge for at least 12 years. Education is to be
compulsory for 9 years, requiring children aged 7 to enrol in basic education
institutions until the age of 16, with the exception of those who have already
completed grade 9 (Office of the National Education Commission, 1999b, p. 213).
For educational administration and management, there arc eight steps to be
taken. Firstly, the Ministry of Education, Ministry of University Affairs, and the
Office of the National Education Commission arc to be merged and to be established
30

as the Ministry of Education. Secondly, an Office for National Education Standards
and Quality Assessment is to be established as a public organisation. Thirdly, the
National Council for Education, the Commission for Basic Education, the
Commission for Higher Education, and the Commission for Vocational Education arc
lo be established. Their secretariat offices arc to be established as legal entities.
Fourthly, the state educational institutions providing education at degree level are to
be legal entities and enjoy the status of government or state-supervised agencies
except those providing specialized education. Fifthly, the administration and
management ofbasic education and higher education at lower-than-degree level arc to
be based on the educational service .areas. Sixthly, educational administration and
management arc to be decentralised. Scvcnthly, educational administration and
management arc to be administered by local administration organisations. Finally,
educational administration and management arc to be administered by the private
sector.
For development of this system, including production and further refinement for
teachers and educational personnel, there are five strategics to be undertaken. One is
the establishment of the Fund for Development ofTcachcrs, Faculty Staff, and
Educational Personnel. Two is the establishment of an organisation for teachers,
educational institution administrators, and educational administrators as an
independent body, administered by a professional council under the supervision of the
Ministry ofEducation. Three is the establishment of a central organisation responsible
for administering personnel affairs ofteaehers. Four is the provision ofa law on
salaries, remuneration, welfare and other benefits. Five is tho amendment of the
Teachers Act 1945 and Teachers Civil Service Act 1978 (Office of the National
Education Commission, i 999b, pp. 213-21 S).
Stage 4. Actions to be taken within five years of the enactment date (by 20
August 2004).
In this stage, there is only one step to be carried out. All legislation, rules,
regulations, statutes, announcements, and orders pertaining to education, religion, art,
and culture applicable on the enactment date of the National Education Act 1999 arc
Ji

to be amended in line with the Act (Office of the National Education Commission,
1999b, p. 215).
Stage S. Actions to be taken within six years of the enactment date (by 20
August 2005)
The Ministry of Education is to complete the first round of extemal evaluation
of all educational institutions (Office of National Education Commission, 1999b, p.
215), and then the system-wide educational change will be a matter of routine.
Roulinisation of the change at Rajabhats in Thailand
By 20 August 2005, all educational institutions, including Rajabhat
Universities, are expected to have completed a round of external evaluation. All
educational systems arc expected to be in a routinisation stage by 2006 (Office of the
National Education Commission, 1999b). Whether 1his happens as planned is yet to
be seen. In the stage ofroutinisation, Rajabhat Institutes will become Rajabhat
Universities as public universities (Rajabhat Institute Ubon Ratchathani, 200lc, pp. 9-
11; Office of the National Education Commission, 2001, p. 68). This stage, Rajabhat
University routines, will be concerned with new administration and management. This
will consist of education administration and management, academic management and
teaching organisation, and higher education standards and quality (Office oft he
National Education Commission, 2001, p. 69).
Education administration and management in Rajabhats wil! be involved in a
new cultural system. These will consist of: (]) creation of unity and coherence in
policy fommlation, planning and higher education standards; (2) promotion of
lifelong and continuous education, improved access and quality, transfer of credit
among institutions, recognition of work experience; (3) development of capability for
autonomy management; (4) budget a!loeation as block grants for autonomous higher
education institutions; (S) internationalisation of higher education while retaining and
improving indigenous capability and knowledge; instituting good governance
principles and cultivation of enterprising spirit; (6) extensive resources mobilisation
and cultivation of stakeholder culture; (7) networking of higher education about
32

a
themselves and with other education units including private seclor bodies; (8)
academic staff and higher education personnel development; and (9) strengthe.iing the
higher education council (Rajabhat Institute Ubon Ratchathani, 200lb, pp. 16-17).
For academic management and teaching organisation at Raj ab hats in Thailand,
devo\opmcnt of curricula and teaching and learning mechanisms to ensure flexibility,
diversification to meet demands of learners, and national requirement will be placed
into practice in the routinisation. Adoption of innovation and information technology
will be emphasised for Rajabhats' stall Also, development of student-centred
learning, promotion of analytical skill, critical thinking and \earning motivation will
be implemented as routine stage. Pl.icing importance on research, accumulation of
knowledge and technology for dcvelopmcril of the nation will be practised. In
addition, evaluation and assessment mechanisms will be practised (Office of the
National Education Commission, 2001, p.69).
For higher education standard and quality, internal and external quality
assurance will be stiµulatcd by the National Education Act of\ 999. Rajabhat
Universities will be assessed for education standard quality through both internal and
e:o::ternal quality assessment (Orfice oflhc National Education Commission, 2001;
Rajabhat Institute Ubon Ratchathani, 2002a; Rajabhat Institute Ubon Ratchathani,
200lb). Internal quality assessment consists of nine factors. These are: (!) µhilosophy,
vision, mission, objectives and planning; (2) teaching and learning system; (3) student
development; (4) research; (5) academic support for community and society; {6)
cultural preservation; (7) administration and management; (8) finance and budget; and
(9) quality assurance (Rajabhat Institute Ubon Ratchathani, 200lb). External quality
assessment consists of eight factor:s. These are: (I) standard of student quality; (2)
standard of learning system; (3) standard of learning support; (4) standard of research
and creative devices; (5) standard of academic administration; (6) standard of cultural
preservation; (7) standard of administration and management; and (8) standard of
internal quality assurance syst~m (Office for National Education Standards and
Quality Assessment, 2002).
33
Summary
A major educational planned change in Thailand was implemented by Royal
Decree in 2000. The change has been implemented for three years in Ubon
Ratchathani, Surin, Buriram, and Nakhom Ratchasima (2000.2002) where the data
are collected. The change is divided into two levels. They are basic education, and
higher education. However, this study is only focused on Rajabhat Universities. The
change in Thailand involving the Rajabhats focuses on educational administration and
management, and a 'new' culture of learning. Educational administration and
management arc concerned with reorganisation of administrative structure,
educational personnel management, and financial management. The new culture of
learning is concerned with three main aspects. They are the learners as the centre of
education, the refom1 curriculum for basic education, and a system of educational
quality assurance. In addition, it is set up in three stages: (I) an initiation stage (during
1992-2001); (2) an implementation stage (during 2002-2005), and (3) a routinisation
stage (after 2005).
While these changes affect all levels of education in Thailand (primary,
secondary and tertiary), the presclll stmly focuses on lecturer receptivity to the change
at the tertiary level, namely the Rajabhat Universities. The next chapter discusses the
literature review.
34

CHAPTER THREE
LITERATURE REVIEW
It is the purpose of this chapter to introduce the Thai educational change in the
context of planned change in a centralised system. Organisational changes in higher
education arc discussed first b.xausc they were deemed to be important determinants
of the changes and reforms in Thailand. Then, some case studies of change in higher
education arc introduced. Finally, recent research on system-wide e<lucatio1:;1.l change
in a centralised system, and research needs in Raj ab hats in Tlmiland are outlined.
The change literature in education and the social sciences dates back to at least
1940 and is voluminous. This literamre involves numerous aspects such as
administrative change, innovations, system-wide change, change with professional
development, chm1ge in higher education, secondary education, primary education,
the politics of change, variable affecting change, and many more. These arc reported
in refereed journals, in non-refereed joun1als, in government reports, and in various
other publications. Much of the work on change is athcoretical and many oft he
conclusions and claims arc open to challenge. It would be impossible lo summarise all
the findings and conclusions in this thesis. This thesis only reports on those studies
deemed to be most relevant and pertinent to major planned educational changes in a
centrally controlled system, where receptivity to the change is studied, so that it is
possible that the findings might be applicable to lecturer receptivity to the planned
change in Thailand. This literature review relics strongly on a small number of those
studies, each of which summarises the main findings from the relevant change
literature up to their dale of publication.
Organisational changes In higher education
According with emerging related literature for educational system-wide change,
there are at least five main aspects that would affect higher educational
35

organisation. They are: (I) globalisation and internationalism of education and
technology; (2) new professional development; (3) strategic partnerships and links
with other organisations; (4) autonomous institute; and (5) financial management.
Globalisation and internationalism of education and technology
There is a lot of writing about the so-called 'earth-shattering trends' that have
heen labeled as 'globalisation' or 'explosive' growth of knowledge (Bolstcin, 2001).
Globalisation and growth of knowledge have impacted on the economy, information
technology, and education of most countries, including Thailand. Countries are
subject to the glob~] trends, although lhe way in which countries, institutions, and
even individuals react, varies. Jntemationalisalion is related to specific policies and
practices cf academic institutions (and lo some ex lent, national higher education
agencies) in their relationship with other countries, usually aimed at improving and
extending the international links and programs, and raising the consciousness of
academic institutions (Allbach, 2001). Globalisation implies the 'borderlessncss' of
knowledge. The phenomena of globalisation aff~cts many countries and causes, at
least in part, social, economic, cultural and educational changes. The effects of
changes can influence opportunities for improvements in searching for knowledge arid
communication, through in'lovations and technological devices. There appears to be
an cxpcctalion that development will occur in every country, in tenns of personal
communication, and information in order to survive in the competing world. In every
country where development occurs, personnel must be prepared to use new
information technology (United Nations Development Program, 1989, pp. 24-26). An
essential factor for development is education. The rcllcctions of education reforms
can be seen in most countries, as for example in Australia, New Zealand, England,
United States of America, China and Thailand. Educational refonn, particularly in
higher education, is one important thing to be taken urgently (Privateer, 1999; Gunn
& Recker, 2001).
In the United Stales of America, higher education slaffand students are aware
that they live, work, and think in a global marketplace (Altbach, 2001). In Thailand,
howe~cr, students in higher education do not generally think globally in the same
way. Many Thai staff and students suffer from ignorance of world geography, the lack
36

of proficiency in languages, and cultural parochialism when, attempting to function in
international settings (Office of the National Education Commission, 1999a, pp. 25-
26). TI1cy need to be willing to consider a wide array of other perspectives. They
need to be competent to conduct education, business, and governmental activities in
an international environment and be prepared lo make personal and public policy
decisions, as responsible citizens in an international ~ociety. Moreover, growing
global interdependence has substantially accclemtcd a broad social process of change
(Glanz, 2000). These changes have influenced many facets of Timi society, including
its ceonumy, politics, demography, and culture. Education mirrors society in the sense
lhat social change genernles c<lucalional d1angc.
Deem (2001) has investigated some anulyses of change in the higher education
institutes of western nations in reblion to intem,llionalization, new mmrngeria!ism,
globalisation, and entrcprencurialism. The results suggest that many universities in
difTerent countries have strong similarities in regard to their international policies. for
example, higher cdt1cational institu<ions plan al least live categories of their policies
for pcrfom1:111ce, involving some comparison with international efforts and standards
(Eiseman, Mihailcscu, Vlasceanu, Zamf1r, Sheehan, & David, 1999, pp.17- I 8). They
involve (I) slralcgic assessment of national high level human resource requirements;
(2) pe.iodic assessment oft he pcrfom1ance of institution; (3) attestation of the
credentials they award; (4) providing core budget funding for higher education
institutions, funding for capital imprcvcmcnts, scholarships to students, and support
for graduate education and research; and (5) cstablishingeertain systcm~evd policies
governing academic r.mployment and promotion.
Munitz (2001) staled tbJt according to globalisation, infommlion lcchnology
will profoundly influence both the content and delivery system for traditional colleges
and universi1ies. The talent to translate the conlcnt- the 'mountain' of data arriving
rapidly- into accurate and useful infonnalion and, then, into knowledge and wisdom
will test everyone's taknl and energy. We will also have to rethink the delivery
system- the way in which we teach and people learn- aud re-examine the balance
between classroom instructiou and distance learning. Moreover, Board (2001) states
that the tremendous pace of technological change has made it imperative that
37
individuals continuously upgrade their knowledge and skills. To stay competitive, one
has to stay current. As a result, lifelong learning will be the dominant paradigm for
higher education in the twenty-first century. Infonnation technology is driving this
increasing emphasis on establishing and maintaining effective learning relationships
with students throughout their lives. Information technology is also likely to be the
primary vehicle by which we accomplish the goal of staying competitive.
The International Association of University Presidents (IAUP) (2001) reported
th~\ infonnation technology is having a strong influence on teaching and learning,
research and administrative management. This is a lime of enonnous change both in
the telecommunications industry a!ld in the applications of communication and
infom1alion resources in higher education. The use ofteclmology in classrooms
literally inverts lh.! typical focus of educational activities, transforming the way that
education is organi5cd, delivered, and managed. Classrooms now face the world
'outside' as well as the world 'inside'. Furthermore, classrooms have become links to
communications highways, transmitting data, video, and voice to thousands of other
sites. Faculty and students have easy access to vast databases and pruticipate in joint
projects that involve an array of instructional activities throughout the world by
travelling on these virtual electronic highways. Students and faculty in practically
every discipline make extensive use of information technology, from the most basic
operations of word processing, to courses delivered by televised instruction and the
most sophisticated and elaborate exercises in computer simulations. Today,
administrative offices from admission and records to the physical plant depend on
informa11011 technology for their operations.
New professional development in higher education
Corcoran (200!) staled \hat rcfonnativc lecturer professional development
might sound like an impossible task, but engaging all lecturers in discussions of good
practice and supporting their efforts to learn and to use more effective pedagogy
might be the first real step towmds higher standards for all students. In order to obtain
more effective pedagogy, policy makers might be reallocated resources and redirect
exiting channels for professional development so that they arc supportive of desired
reform, which is the incentive structure for lecturers to encourage them to seek the
38
knowledge and skills that they need. On the other hand, desired reform of professional
development will be ineluded: (1) taking full advantage of every opportunity for
professional growth - curriculum development, assessment programs, and lecturer
conventions, (2) building new collaborations and partnerships to mobilize and
coordinate public and private resources, (3) making greater use of lecturer and
university networks, electronic network~ and educational and cable television, to
reinforce the message, help lecturers acquire necessary skills and support their efforts
to clrnngc, and (4) adopting a different time-frame and making a long-term
commitment to rcfom1 based on a coherent set of principles and polices. ln addition,
there arc new kind of teaching/learning resources and new staff policies. In order to
achieve high quality in professional development in these dual directions, planning
which will stir the organisation pot may be seen in these tem1s, which link staffing
policies (S) with new high quality teaching mode (T} new infonnation/cducation
technologies (I} and research enhancement (R). In accord with STIR implementation
is ineluded: (\) full opportunities for professional development of existing Slaff; (2)
careful analysis of need in the recruitment of new stun; (3) staff moving towards
enhancing both their teaching and r~scmch; and (4) achicvahlc sutisfaction among
their students, professional, communities, and governments (Bell and Hanison, 1998,
pp.75-77).
The Australia Curriculum Studies Association (ACSA) (2001) suggested that
accomplished classroom teachers in Australia demonstrated their professionalism in
fourteen categories. 1l1cy were: (I} having knowledge, understanding of and
enthusiasm for intellectual content, discourses and value; (2) enjoying teaching
students and by holding highest expectations; (3) treating all students honcstly,justly
and equitably; (4) being able to empathize with students; (5) having an appropriate
sense ofhumo11r; (6) exemplifying the qualities and values that they seek to inspire in
their stuc.lents; (7) being reflective practitioners, (E) displaying adeptness and
discernment in creative use and crilical evaluation ofinformatio11 technologies, (9)
providing regular, accurate feedback to students and monitoring the growth in
students' learning; (JO) demonstrating excellence in practical, pragmatic cran of
teaching and in managing a learning environment;(! I) exercising high
39
communication and interpersonal skill; (12) being committed to their own
professional development; (!3) exercising educational leadership; and (14) taking due
account of the educational implications of the community's cultural diversity.
Autonomous institute in higher education
Keranun et a!ia (2000, p.4) defined a higher education autonomous institute as a
government higher education institute, which has autonomy but it is controlled by
' higher educational commission. It is emphasized the mana3emenl is a part of the
institution's commission, and the fi11al decision making could be made in the
institutional level. For budgeting, not only might il earn money by ilself, and be
audited, but it could also get block grants from the government.
Olswang and Lee (200!) stated 1hat the increasingly complex environment in
which colleges and universities now operate has spawned a set of requirements for
accounlabilily with which institutions and therefore faculty must comply. Although
academic freedom and tenure provide important protections for faculty, they arc not
unlimited. Al !he same lime, institulions face a myriad of new pressures and
responsibilities, such as the need to account for monies from a variety of sources, and
lo deal with appropriate levels of outside faculty consulting and faculty internal
workloads. There are pressures to review faculty perfonnance in teaching, research,
and service. In response primarily to external constituencies, colleges and universities
arc being compelled to crJnfront areas of traditional faculty autonomy.
In accordance with lhc National Education Act of\999 - sections 36 and 71, all
higher education institutions 111ust be reformed to autonomy (Rajabhat Institute Ubon
Ratchathani, 200lc). For tl1is change, there are several reasons. Firstly, they need to
control and develop their administrative systems more easily, and be independent to
manage their income. Secondly, they need to be more like a private company or
corporation so that they can run all systems freely; they can decide about any
investment and be able to be sloekh-o]dcrs of any private finn. Thirdly, they need to be
free lo respond to any kind of opportunity, and to be able to solve an)' problem that
they face immediately and appropriately. Fourthly, they need to improve standards of
education and infonnalion technology; they need to change their old
40
benchmarks to be able to compete with the foreign higher educational institutes.
Finally, they need to avoid some disadvantages of traditional government systems and
build up new approaches to run the institutes more freely in all aspects
Partnership and links in higher education
According to the findings of the >ludy about Student and Academic affairs
Collaborations and Partnership, it is found that many campuses are realizing that
collaboration bel\{een academic and student affairs is an important technique for
enhancing student !earning. In addition, the separation or academic and student affairs
has a negutive effect on student learning and collaboration between these groups
enhance~ sludenl learning. Student learning and shifting national, societal, and
economic priorities have resulted in decreased funding making collaboration
necessary (Critical Issue Bibliography (CRIB), 2001 ). Although the resources listed
cover the familiar territory of academic and student affairs, it is important to
emphasize the value of partnerships more generally including community agencies,
primary and secondary education, the business sector, students, and government. The
resources of partnerships might have been divided into three sections. They arc: (1)
the collaborative paradigm describing the rationale behind partnerships; (2) best
practices and programs that work, highlighting examples of collaboration; and (3)
bridging specific populations, noting ways that collaboration has been particularly
effective in meeting the needs of different types of students. Similarly, the digest
examination orthe value of collaboration among businesses, community
organisations, and educational institutions reports that partnerships create new
opportunities and challenges (Kuo, 2001). Moreover, the benefits of collaborative
efforts for community colleges include; (I) furthering access and services to local
constituents; (2) bridging secondary cduc~tion and baccalaureate programs; and (3)
promoting economic development.
For encouraging participation and partnership in education in accordance with
the National Education Act of 1999, the government planned to provide educational
systems in five categories (Office oflhe National Education Commission, \ 999a, p.
203). They are: (I) other than the Stale, private persons and local administration
organisations, individuals, families, community organisations, private organisations,
41

·==---
professional bodies, religious institutions, enterprises and other social institutions will
have the right to provide basic education. They will be given government support and
grants, tax rebates or exemptions in bringing up children and providin1; basic
education; (2) educational institutions in cooperation with all sectors of society will
contribute to strengthening tl1e communities by encouraging learning in the
communities themselves; (3) as providers and partners in educational provision,
individuals, families, communities, local administration organisations, private
persons, private organisations, professional bodies, religious institutions, enterprises,
and other socials institutions will mobilize resources, donate properties and other
resources to cd11cation institutions and also share educational expenditures; (4) the
government and local administration organisations wi11 encourage and provide
incentives for mobilization of these resources by promoting, providing support and
applying tax rebate or tax exemption measures as appropriate and when necessary;
and (5) private education institutions arc allowed to provide education at all levels and
of all types. The government will define clear-cut policies and meusurcs regarding
participation ofprivalc sector in provision of education.
Financial manaucmcnt of higher education
According to the reports ofhigher education -The Lessons of Experience
(World Bank, 1999, pp.1-2), the development of higher education is correlated with
economic development: enrolment ratios in higher education average 51 per cent in
the countries that belong to the Organisation for Economic Cooperation and
Development (OECD) compared with 21 per cent in the middle-income countries and
6 per cent in !ow-income countries. Estimated social rates of return of 10 per cent or
more in many developing countries also indicate that investments in higher education
contribute to increase in labor productivity and to higher long-tenn economic growth,
which arc essential for poverty alleviation. Despite the clear importance of
investmcnts in higher education for economic growth and social development, the
sector is in crisis throughout the world. In all countries, higher education is heavily
dependent on government funding. In ;m era of widespread fiscal constraints,
industrial as well as developing countries are grappling with the challenge of
preserving or improving the quality of higher education as education budgets arc
42

compressed. Consequently, the Wor!d Bank reports suggest four key directions for
financial management in higher education (World Bank, 1999, pp.4-8). They are:(!)
diversifying tho funding of public institutions and introducing incentives for their
porfonnancc; (2) mobilizing greater private financing; (3) financial support to needy
students; and (4) incentives for efficient resource allocation and utilization. Further,
the findings of the study of Higher Education in Thailand: Solution considered higher
education budgets (Kasetsart University, 1997, pp.373-382). A budget ofhigher
education is divided into two main portions. It is provided by government and its
diverse funding of public higher institutions. Moreover, the report sugges!s the
directions of higher educational budgets might ho changed into six categories. They
arc: ( !) educational fees that consi.~t of fom1al learning, special learning, distant
learning, and curriculum for foreigner students; (2) research budgets that consist of
6oth research budget and research advantages; (3) local community services that ·,., consist of academic seminar, training short course, assessment of the industrial
produce and new innovation, establishment of service organisations such as local
hospitals and early childhood schools; (4) consultant to private organisation; (5)
cooperative investment with private organisation; and (6) donate propc11ics.
Some case studies of change in higher education
111is study is focused on Rajabhat Universities, which arc higher educational
institutions. Some case studies of the change in higher education of five other
countries in the South East Asian region are discussed to illustrate similarities in order
to achieve the level of development of each country. These are Australia, China,
Japan, Malaysia and Indonesia.
Higher educational planned change in Australia
At present, tlicrc are 38 higher educational institutions that arc distributed in
major centres of Australia. Most of them arc government institutions (Department of
Education, Science and Training, 2003). However, there are a few private institutions
such as Bond University, Notre Dame University and Australian William E Saimon
43

which were later established (Office of the National Education Commission, 1998). It
has been shown that private organis:itions arc participating in higher education
management.
In 1988, the Australian government introduced a new higher educational policy
with the 'While Paper Reforms' (Dawkins, 1988). There were three main purposes.
One, it aimed to reduce the number of higher educational institutions and make them
accountable for both standard and quality. Two, it aimed lo stimulate higher education
leading Australia to develop both quality and academic skills. Three, it aimed to give
a greater chance for participation in higher education to all parts of society (Miller,
1995; Miriam, 1996).
There were three main goals for this 1988 higher educational planned change.
One was a process for reducing the number of higher education institutions. There
w~re several reasons for reducing the number of higher educational institutions. They
were: (I) to establish the national education system which is called the Unified
National System (UNS); (2) to merge smaller higher educational institutions into
larger higher educational institutions; (3) to improve the budget nrnnagcmcnt in
higher educational institution by seeking cost effectiveness and to support budgeting
only for members which have effective full-time student units; (4) to improve the
personnel and management system so that higher institutions can obtain quality
personnel; (5) lo improve the quality of curriculum and create a harmony in important
subjects for the future such as science, computer, engineering and busi11ess
management; and (6) to manage tuition income from the international students by
organising higher educational institutions. TI1e second goal was the process of
stimulating higher education to lead Australia people to develop both quality of life
and academic skills. !n order to achieve human resource management, lhe process was
given as follows: (!) to d~vc!op a continuous curriculum in higher education which
must be in line with workforce characteristics; (2) to develop the curriculum so it will
be flexible and be transferable to other higher institutions. The third goal was the
process of giving equal access to higher education to overy part of society.
The Unified National System has now been implemented for over 10 years in
A,1stralia and has entered the roulinisation stage. The Australian government bas
44

made other changes to lhe university system since 1998, including the introduction of
student fees and the setting up ofan Australian University Quality Assurance Agency
in 2001 (see Kemp, 1999). " I\
Planned higher educational change in the People's Repµblie of China
The educational system oftl1c People's Republic of China haG been changed
since 1990. The changes aimed to strengthen the People's Republic of China in
technology and science. There arc two directions for the changes. Firstly, they aim to
manage the educational system to make it lmnnonious with the needs of all
occupations in order to lead the People's Republic of China into the modem era.
Secondly, they aim lo improve both quality and efficiency of all educational
institutions (Yee, 1995; Law, 1995; Zhu, 1996; Anonymous, l996a).
The People's Republic of China's educational aims (Project 211) were
established. There arc three main categories: (I) to develop a blending of subjects for
higher cducat!onal institutions; {2) to develop important curriculum; and (3) to
establish higher educational services for all people.
By 2010, the People's Republic of China aims to increase its higher educational
students to 9.5 mil!ion. There will be 100,000 graduate students each year (Kasetsarl
University, 1997, p. 251 ). Therefore, government has refonned high::r educational
management in order to achieve both higher quality and efficiency, and to bring it into
line with social needs. Furthem1ore, higher educational institutions will have some
autonomy in admini8tration such as student re-enrollment, curriculum development,
personnel administration, and monthly sa\ary structure.
Planned higher educational change in Japan
According to "World educational competition", the University Council was
established in 1987. This Council works in consultation with the Ministry of
Educ;ition, Science and Culture. ll consists of20 members that are selected with
higher educational expertise (Ministry of Education, Science and Culture Japan,
1994). This committee offers directions for planning higher educational changes in
Japan. The plan came into effect in 1994. As a result, higher educational institutions
45

in Japan have been changed in many aspects (Doyon, 20Cl). 'fhe most important
change is educational quality. It consists of curriculum and instruction development,
organisation development, educational management, research and development in
quality assurance, and self-assessment reporting.
Planned higher educational change in the Federation of Malaysia
Recently, Malaysia has improved its higher education act (Amendments (1996)
to the University and University colleges Acts (of 1971)) that could possibly lead
higher education lo corporntisatio11 {National Office of Overseas Skills Recognition,
1991; Lim, 1995;Sycd, 1995;Anonymous, 1996b).
Higher educational changes in Malaysia have been phmncd for the 21" century.
There arc eight aims in higher education changes. They arc: (1) to establish an
ambitious program in order to stimulate human resource development; (2} to increase,
np grnde and improve the structure ofhigher educational institutions: (3) to manage
the bachelor's degree students enrollment so that lhc ratio of students in Sciences and
Arts equal 60:40 in each higher educational institution; (4) to give opportunity to
private organisations to participate with gove111rnen! and other organisations for
tertiary education and skill training; (5) to establish the National Accreditation Board
and Council for Higher Education and Sub-Committee on Higher Education, Vice -
Chancellor's Cornmillce in order to control quality in higher educational institutions;
(6) to stimulate and accelerate research and development (R&D); (7) to manage long
distance learning and give opportunity to students to get degree qualifications; and (8)
to ]cad higher education to an international standard ofhighcr education.
Further, Malaysia has increased cooperation in the provincial areas. They arc:
(1) to share human resources between universities in provincial areas; (2) to establish
special projects for students in provincial areas in order to study in higher education
institutions; (3) lo snpport all higher educational institutions with forums, work shops,
seminars, and shntirrg experiences IJetwcen the special experts; (4) to establish
'Centres of Excellence' in order to support academe and culture; (5} to support the
activities that are conducted in cooperation and in provincial areas through
46

organisations such as The Association of Southeast Asian Nation university-network
and the Asia-Europe Meeting.
Planned higher educational change in Indonesia
Indonesia has planned to develop higher education (1996-2005)(Anonymous,
1996b; Ranuwihardjo, ]995; Anonymous, l 996c). There are three categories planned
for proceeding. Firstly, the cxpansio11 of opportunities for studying in higher
education will be increased. At present, 10 per cent of the students all end higher
education. There will be an increase to 15 per cent in 2005 and 25 per cent in 2020
(There will he about 6.1 million students in 2020). The government will support the
role of private higher educational institutions. The amount of private higher
educational institutions will increase to 15 per cent in 2005. In addition, the
government will increase its polytechnic programs and support new programs of
study such as engineering and management. In 2020, the bachelor's degree students
wi!l be increased to 1.2 million and about 0.5 million will be engineering students.
Five new universities and one hundred am! fifty polyteehnfo institutes will be
established in the next 25 years. Further, the 'Centres of Excellence' will be
developed. Secondly, the quality in higher education institutes must develop the fields
of science and technology will be improved. Moreover, the quality of instructors will
be improved and the achievements of students will be examined in order to be
standard. Finally, the quality ofhighcr education, involving curriculum, teaching,
resources and ,er-vices, will be improved.
Research on syslcm-widc educational change in centrally controlled systems
In Western Australia, there have been four major, system wide educational
changes introduced in the last 30 years in secondary education: the achievement
Certificate System (begun in 1970)(McAtee & Punch, 1979), the Certificate of
Secondary Education System (begun in 1976)( Waugh, 1983; Waugh & Punch, 1985,
1987), the Unit Curriculum System (begun in I 988)(Waugh & Godfrey, 1993, 1995)
and tbe Student Outcome Statemenl~ System (due in 2004)( Waugh, 1999; Moroz &
Waugh, 2000). All four major system-wide educational changes implemented in
47

Western Australia have been studied in tenns of teacher receptivity (or teacher
attitudes) to the changes. For each change, a model of main variables expected to
influence teacher receptivity was created in terms ofa different ~ct of independent
variables. The variables were measured separately and multiple regression was used
to estimate the influence of the variables on teacher receptivity and amount of
variance that could be predicted from the independent variables.
McAtec and Punch (1979) found lhat knowledge of the change, progressive
attitude to education, traditional attitude to education, perceived participation and
some situation variables predicted 38 per cent of the variance in teacher atlitudes to
lhe Achicvemcnl Certificate System.
Waugh and Punch (1985, 1987) found that progressive attitudes to education,
feeling towards the previous system, attitudes towards the previous system, climate,
practicality, comparability of assessment, teacher cosl appraisal and validity of
teacher assessments of student achievement predicted 43 per cent of the variance in
teacher altitudes towards the Certificate of Secondary Education System. Attitudes to
the previous system, feelings towards the previous system und cost appraisal were the
most important variables.
Waugh and Godfrey (I 993, 1995) found that cost benefit, practicality,
alleviation of concerns, participation, feelings towards the previous system and
support for the change predicted 56 per cent of variance in attitudes towards the Unit
Curriculum System. The most important variables were cost benefit, participation,
support for the change and feelings towards the previous system.
Moroz and Waugh (2000) found that non-monetary cost benefit, the alloviation
of concerns, significant other support, comparisons with the previous system, shared
goals, collaboration, teacher learning opportunities and some situation variables
accounted for 49 per cent of variance in teachers' attitudes towards the Student
Outcomes Statements System. Non-monetary cost benefit, comparisons with the
previous system, significant other support and alleviation of concerns were most
important variables.
48
Previous studies indicate that at least nine variables are likely to be related to
lecturer receptivity (or teacher receptivity) to a planned educational change in a
centrally controlled system. These arc: comparison with the previous system,
practicality in the classroom, alleviation of concems, learning about the change,
participation in decision-making, personal cost appraisal, collaboration with other
lecturers, opportunities for lecturer improvement, and perceived value for students
(Collins & Waugh, 1998; Waugh, 2000a). While the evidence only directly relates to
secondary schools, there doesn't seem to be any reason why these variables shouldn't
be applicable to Rajabhal Universities in Thailand. Indeed, Addison (1995) used these
variables to study accounting practitioners' receptivity to a proposal lo change
accounting to a 4-ycar degree in Australia. The results found eight primary
conclusions. First, there is equivocal support for a change as measured by the three
aspects of receptivity (overall feeling, allitudcs, and geucral behaviour intentions).
Second, two fndcpL'lldcnt variables general beliefs about the change based on the
expanding scope of accounting education, and general behaviour intentions to support
instructors and the accounting profession are both strongly related to receptivity.
Third, three group one independent variables account for 38 per cent oft he
variance in receptivity. They are, allitudcs towards the structure and content of the
proposed change, general beliefs about the change based on the expanding scope of
accounting practice, and overall feelings about the strengths and weaknesses of
accounting graduates. Fourth, overall feelings towards the proposed change, general
beliefs about the change based on the expanding scope of accounting practice, overall
feelings about the strengths and weakness of accounting graduates and overall
feelings about the practicality oflhc change in the lecture room a11d tutorial room
(costs) account for 44.9 per cent of the variance in attitudes towards the proposed
change, and altitudes towards the proposed change, overall feelings about the
proposed change, and general beliefs about the change, based on the expanding scope
of accounting practice, accounted for 67 .2 per cent of variance in general behaviour
intentions towards the proposed change.
Fifth, independent variables concerned with the processes of education arc not
related to receptivity. These variables arc overall feelings about alleviating fears and
49
uncertainties for the proposed change, overall feelings about the practicality of the
change in the lecture room and tutorial room (strategies), and overall feelings about
the practicality of the change in the lecture room and tutorial room (costs). Sixth,
general behaviour intentions to support instructors and the accounting profession
accounted for 22 per cent of the variance in receptivity. Seventh, when all dependent
variables were entered in the regression equation, the variables general beliefs about
the change based on the expanding scope of accounting practice, general behaviour
intentions to support instructors and the accounting profession, and overall feelings
about the strengths and weaknesses of accounting graduates account for 34 per cent of
the variance in receptivity.
Eighth, canonical analyses indicate lhat accounting practitioners' receptivity to
change at the adoption stage is related lo their understanding oft he scope of
accounting practice at that time. Tltey a!so indicate that accounting practitioners who
believe that the scope of accounting practice has expanded intend lo support
instructors and the accounting profession. The canonical coefficient for the first set of
canonical variah!es, altitudes !o the structure and content oft he proposed change,
general beliefs about the change based on the expanding scope ofaceounting practice
and overall feelings about the strengths and weaknesses of accounting graduates is
44. 4 per cent. The strength of this Je\ationship indicates that accounting practitioners'
receptivity to the proposed change is related to their attitudes about variables, which
arc specific to accounting. The canonical coefficient for the second set of canonical
variables is 25.8 per ceril whilst the canonical coefficient for the third set of canonical
variables, general behaviour intentions about expectations and achievements for the
proposed change, am] general behaviour intentions to support instructors and the
accounting profession is 29.4 per cent. This relationship also indicates that accounting
practitioners' receptivity to the proposed change is related to their intention to help the
accounting profession and that they intend to provide expectations and achievements
for proposed change. The findings of this study support the general model used in the
study of accounting practitioners' receptivity to the proposed change in accounting
education al the adoption stage, except that the situation variables can be omitted.
In a previous study of system-wide change, Waugh and Punch (1985) found that
teachers' altitudes to the previous system were positively related to aUitudcs to the
50

new system where the new system focused on demonstrated improvements.
Doyle aml Ponder (1977-1978), and Waugh and Punch (1985, 1987) viewed the
va1iahle cost benefit as a ratio of the ameunt of return against the amount of
investment relating to the effects o fthc change for the teacher and lhc stud en ls, as
perceived by the teacher. ·n1at is, the teacher will have a posi!ive cosl benefit if the
work involved in implementing the change al the Jchool lcvcl is perceived lo provide
benefits such as increased student learning and increased satisfaction with teaching,
and l"ice versa.
Waut:h and Punch (1987), following an idea proposed by Giacquinla (1975) -
lhat aspects such as knowlcd!JC, undcrslandin!J, clarity of change proposal, lack of
feedback, and lack of meetings can all be grouped under the same general variable,
the alleviation of fears and uncertainties, because they aid or hinder the
impkmenlation of change through the mechanism of communication - found that this
variahle was related to teacher's receptivity to the Certificate Secondary Education
System. Th.it is, as changes arc being implemented, teachers will be more receptive lo
the change, if mlministralors .it lhc school provide a means whereby fears and
concerns can be wised and somclhing done ahout them.
Waugh and Godfrey (201JIJ) state that the variable, practiculity, measmed the
extent lo which the teachers perceived the course outlines or syllabus statements to be
prnctical in the classroom. It measured whether teachers found the courses suited lo
their teaching styles; whether the courses reflected the teachers' educational
philosophy; whether courses provided a sufficient range of classroom learning
experiences; whether the co11le111 w.is tuned to the uceds orthc students; and whether
the course outli1.es were ~ufficicntly flexible lo help teachers manage the day-to-day
running of the classro..im.
\Vaugh am! Godfr9 (2000) found that the variable, parlicijialion, was i<lenlificd
In a major review of the literature by Conley (1991) as playing an important part in
lead:crs' altitudes to pliumcd change. She found that teachers examined such aspects
as authority~ influence, actual Olllcomcs versus expected outcomes, and
classroom decisions versus administr.ilive decisions in rclntion to changes that had to
be implemented in their schools 1md their classmoms.
51

Gess-Newsome, Southern land, Johnston, and Woodbury (2003) studied "The
Anatomy of Change in College Science Teaching" by using the Teacher-Centered
Systematic Rcfonn model ([CRS) model. TCRS recognises teaching context, teacher
characccristics, teacher thinking, and their intcnictions as influential fac10rs in
alt empts to implement classroom refonn. Using the TCSR motlcl, teachers' personal
practical theories, and conceptual change as a framework, the researchers of this
article studied three college science faculty members as they designed and
implemented an integrntcd, inquiry-based science course. The documentation and
analysis of context; instructors' knowledge and beliefs, and teaching episotlcs allowed
the authors to identify and study the inlcrnction of foclors, including grant support,
tha1 shape refonn attempts. The results suggest that grant-supported mitigation of
structural barriers is a necessary but insuffir.icnt precursor to change and that personal
practical theories arc the most powerful influence on instructional practice. The
findings highlight the critical role of pedagogical and contextual dissatisfaction in
creating a conlcxt for fundamental change.
Phornphong (2002) sh1dicd "Trends for Development of Autonomy ofRajabhat
Uhon University". It was found th;i.t Rajabhat Ubon Ratchathani should improve the
acatkrnic administration, the studc,11 activities, the personnel <lel'clopmcnt, un<l their
financial situation. While this research on the change in Thailand is timely and useful,
further >'CSearch on change is ncc<lcd, [11 particular, research an<l <lcl'clopment are
needed because R:ijabhat staffs arc placed in a new culture and educational
environment. Research could help administrators implement Che plan better in the
coming years and prepare for aspects thal may hal'e otherwise caused implementation
problems.
According to the National Education act of 1999, the statuses ofRajabhat
Institutes arc changed to that of a university. Rajabha! Universities in Tlmiland arc
now concerned with ten main aspects. Thc~c arc (!)a new culture of!caming: (2)
administration and management; (3) educational personnel management: (4)
educational quality assurance; (5) financial management for higher education {6)
technology development an<l application; (7) accessibility; (8) human resource
training and development; {9) teacher (raining an<l development towards 'Centre of
Excellence': (10) enhancing communication. (R,rjablmt Institute Uhon Ratdiathani,
52
---- --------
200\a). While lecturer receptivity to these ten aspcds has not been studied in
Thailand, one can see that the nine receptivity variables reported in the studies of
planned changc,just stated, could be applicab\c to the change in Thailand.
From this literature review, it woul<l appear that lecturer receptivity !o a major
new change (in the context ofp!::mncd change) at Rajabhm,'. in Thailand could be
related to at i :Jsl nine main variables, but this needs to be tested. The nine variables
arc: {l) auitudc to the new system compared to the previous system, (2) practicality in
the Rajabhal classroom, (3) alleviation ofconccms, (4) learning about tbc cbangc, (SJ
participation in decision-making, (6) persona! cost a11prnisal, {7) collaboration with
other lecturers, (8) opportunities for lecturer improvcrncnl, and (9) perceived value
for students. These arc the variables tested in tbc present study. For each variable,
lecturers woul<l have developed expectations that influence their behaviours. There is
a need to tcs1 this in relation to the cbangcat Rajabhat Universities in Thailand. In
accordance with lhe cducalional syslem change, there arc at least five main aspects
that have impacted on higher educational organisations in Thailand. They arc: (1)
globalisation and intcma(ionalism of cd11eation and technology; {2) new professional
dcvc\opmcn!; (3) strategic p:1r11wrships and links to other organisations; (4)
institutional autonomy; :md {5) finam:ial management. These aspects arc likely to be
rcluted '.Oat le:ist nine \'Uri:1blcs infiucncing lecturer receptivity !o the change, as
outlined abo~·c.
The next chapter discusses the lheorelical and conceptual framework ofa model
of lecturer receptivity to system-wide change in Thailand, nine variables influencing
receptivity, a rationale for !be interviews and hypotheses for the study.
53
CHAPTER FOUR
THEORETICAL FRAMEWORK
Introduction
A complete understanding of the receptivity ofT!mi lecturers to the major
planna! educational change in Tliailand is likely to be complex. It will be difficult,
and perhaps impossible, to understand fully the inter-relationships between al\ the
variables affecting receptivity for every lecturer al the Rajabhat Universities.
However, it is possible to simplify these rebtionships by creating a theoretical model
in which only the expected mosl important and innucn\ia! variables arc used. This
simplified model can provide an understanding of the inter-relationships between the
most important variables, give direction to research in regard to the collection of data
and provide guidelines for analysing and interpreting those data.
The model developed for this study is proposed as a genera! model applying to
any majL'T educational ch;111ge (in the context of planned change comrollcd by a
centrnl body), in its implcn1entation stage. In constn1cting the model, it was necessary
to assume that there arc fundamental generalisations common to all similar changes.
These generalisations arc embodied in lhe model. When the model is applied to the
specific case ofthe change at Rajabhats in Tliailand, the generalisations can bo tested.
Lecturer receptivity is conceptualised as composed of nine aspects innuencing
receptivity. They are: ( l) anitudc lo the change compared lo the previous system, (2)
practicality in the classroom, (3) alleviation of concerns, (4) learning .ibout the
change, (5) participation in decision-making, (6) personal cost appraisal, (7)
collaboration with other lecturers, (8) opportunities for lecturer improvement, and (9)
perceived value for students. For each aspect, lecturers will have developed
expectations that will, in part, innucncc their behaviours, and their receptivity to the
change.
The journal literature suggests that planned educational changes in a centrally
controlled system be studied and managed in three distinct stages. These arc the initial
or adoption stage, the implementation stage, and the routnisation or incorporation as a
54
·== ---
permanent feature of the system stage (Giacquinta, 1973, p. 179; Berman &
McLaughlin, 1976, p. 349; Waugh & Godfrey, 1995, p. 39; Moroz & Waugh,2000,
p.163). It would seem that lecturer receptivity towards a major educational change is
difTerent at each stage and is related differentially to different variables at each stage.
For example, in the adoption stage, lecturer receptivity depends on case of
explanation and communication with others, the possibility ofa trial on a partial or
limited basis, case of use, congruence with existing values and obvious superiority
over prnctices that existed previously (Berman & McLaughlin, 1976, p.342).
However, In the implementation stage, lecturer receptivity is related to the interaction
of the change with its institutional selling {Bcm1a11, 1978, p.157; Waugh & Punch,
! 985, 1987). Herc the prneticalily of the change in the classroom and the perceived
support for the change frol\l Rajabbat lecturers arc likely lo be slrong detcnninants of
the success, or otherwise, oft he implemented change (Doyle & Ponder, 1977-78;
Waugh & Punch, 1985, 1987; Waugh & Godfrey, 1993, 1995; Moroz & Waugh,
2000). Consequently, some of the variables included in this model arc directly related
to the interaction of the change with the Rajabhat, its personnel and the classroom.
The present study is situated during the implementation stage (year's 2001/2002
aficr 2 years ofimplcmentnlion). This refers to the first use oflhc change at Rajabhats
across the educational system. Lecturers are then placed in an environment where
their personal expectatio11s and behaviours arc adapting to the philosophy oflhc
change to a greater or lesser ex ten!, and to the culture of the new system. This is the
culture ofa system-wide educational change where some lecturers might find it
dimeu\t lo adapl to the implementation. Some lecturers will wan\ lo adapt the change
more than others, perhaps to suit their institutions, philosophy and personal sty Jc of
lecturing.
Conceptual Model
Model of receptivity fonnation
A particular lecturer will fonn a view of'How I expect the change to be
implcmcnlcd' in relation to each of the receptivity aspects. Then, lecturers come up
against the evaluation and judgment of how the change is really implemented. The
55

lecturers see how the change is actually implemented at Rajabhats, and they talk to
other Rajabhat staff, and receive feedback about ideas, understanding, expectations,
strengths and weakness for the change. The lecturers compare their views !o those of
others. The lecturers would then come to fonn their real view of 'how I really think
the change is being implemented' in regards lo the same as peels of receptivity. This
is, in effect, the lecturers' real view in relation to receptivity aspects. That is, lecturers
will fonn a view of the implementation oft he change in relation to the receptivity
aspects, based on the interaction be I ween their ideal view and their real view, using
evidence from others around them, in regard to how the change is really being
implemented.
Over a semester, lecturers may a Iler both their ideal view of the planned change,
and they may alter their hclrnviour towards the change. There will be an interaclio11
between their views of 'how I expect the change to be planned', 'How the change is
actually implemented' and their actual behaviour towards the change, in regard lo the
aspects of receptivity. It is expected that there arc likely to be power changes as a
result of the system-wide change, Iha( there will be complexities, and some chaos and
uncertainties, and that they themselves will change during the implementation. This
may he a simplified view of what is probably a complicated process th:lt may vary
between lecturers, but il is intended lo capture some of the main 'flavours' and
interactions in lecturers' receptivity lo the planned system-wide change.
When the change is well planned and implemented, it is cxpectcJ that lecturers
will find it easy to hold positive views about l1ow they expect the change to be
implemented for all their teaching classes, and how they think the change was really
implemented for all lecturers at the Rajabhals. In contrast, when the change is not well
planned and implemented, it is expected tlmt the lecturers will not find it easy to hold
positive views about how they expect the change to be planned for all lecturers at the
Rajabhats. Similarly, il will be much harder to hold positive views about how they
think the change was really imp\cmenlcd for all at Rajabhals, and harder even still to
be behave positively towards the change at Rajabhats.
In the tenns oft he main aspects of lecturer receptivity, when the ehaoge is nol
well planned and implemented, it is expected that lecturers will find it difficult to hold
56

positive views about one or more of the aspects. This will lead to them finding it hard
to behave positively to the change. They may talk and act against the change because
they think that it is not as good as the previous system it replaced, it is not practical in
the classroom, their concerns are not alleviated, they are not learning about the
change, they are nol participating in decision-making, there is a high personal cost to
implement the change, il is difficult lo collaborate wilh other lecturers, these arc few
opportunilies for kc lurer improvement, or there is liule perceived value for students.
However, in direct contrast, when the change is well planned and implemented (in the
view oflhe lecturers}, and they have positive views about each of the aspects oflhc
change, they will be mor~ likely \o behave positively towards the change at Rajabhats,
and have positive views and behaviours in relation to each oflhe nine aspects.
The proposed model of receptivity
The proposed model, using the research findings on receptivity lo major new
policy changes in the context of planned change in a centrally-controlled system, was
devised from empirical and theoretical material in the literature. This model is
depicted in figure 4 1. Lecturer receptivity is concerned with three major self-reported
perspcclil'cs of nine aspects of the change, expectations about implementation, real
self-views about implcmcntalion, and actual behaviour towards the change. l11e nine
influencing aspects arc: lhc new system compared lo the previous system, practicality
in the classroom, alleviation of concerns, learning about the change, participation in
,lecision-making, personal cost .ippraisal, collaboration with other lecturers,
opportunities for lecturer improvement, and perceived value for students. The
thcoTelical relationship amongst these aspects is explained next and used as the basis
for co.1slrncting lhc questionnaire.
Sil:ce the major new polky was implemented in the year 2000 and data were
collected al the end of200\ (and 2002), it is assumed that rcecptivity\o it has
stabilised or is coming to stability, for many lecturers, and that ii varies from leeturcr-
10-lecmrcr across the universities. This variation in receptivity is seen as being due to
difforcnces in the influcnr.c of the nine asp~cts. It is expected, for exrunple, that the
higher the perceived benefit of the change, •J1c higher will be the receptivity to the
c!mnge am! the lower the perceived hcnefil, dte lower the receptivity. This is becaus~
57
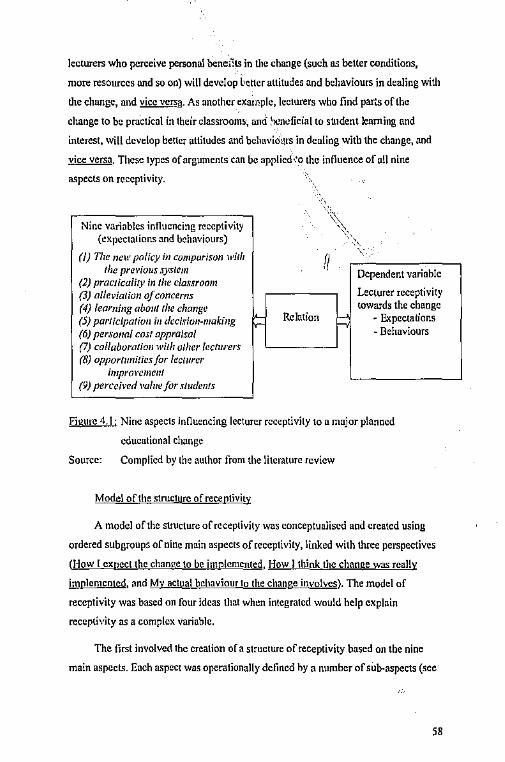
lecturers who perceive personal beneills in tl1e change (such as better conditions,
more resources and so on) will develop httcr attitudes and behaviours in dealing with
the change, and vice ver,;.f!. As another example, lecturers who find par',.s of the
change to be practical in their classroom~·, and: :1'-'11ldicial to student leaming and
interest, will develop better attitudes and behavio\\ts in dealing with the change, and
vice versa. These types of arguments can be applicd·'.o the int1uencc of a!\ nine
aspects on receptivity.
'\ Nine variables influencing receptivity \,
(expectations and behaviours) ',>, '
(l) Tire new policy in compurison wilh fl '<
the pre1•ious sys/em Dependent variable (2) prac/icality in the classroom (3) allevialion of concerns Lecturer receptivity (4) learning about the change towards the change (5) par/icipatioll ill decisio11-ma/cing Relation I= - Expectations (6) personal cast appraisal - Behaviours (7) callaboratiau wilh olher /ccturers (8) opporlllnilicsfor lec111rer
imprm•e111e111 (9) percefred value for sludenls
Figure 4.1: Nine aspects influencing lecturer receptivity to a major planned
educational change
Source: Complied by the author from the literature review
Model of the structure of receptivity
A model of the structure of receptivity was conceptualised and created using
ordered subgroup5 of nine main aspects of receptivity, linked with three perspectives
(How I expect the change to be implemented, How I think the change was really
implemented, and My actual hdmviour lo the change involves). The model of
receptivity was based on four ideas that when integrated would help explain
receptivity as a complex variable.
The first involvec\ the creation of a structure of receptivity based on the nine
main aspects. Each aspect was opcrntionally defined hy a number ofsub·aspccts (see
58

Appendix A and Chapter 5). The second involved creating stem-items in an ordered
pattern by difficulty within each sub-aspect. The structure of receptivity was then
based on sub-sets of stem-items in patterns of ordered difficulty, each aligned from
easy to hard. The third involved an ordered set of perspectives for each of the stem
itcms. These are How I expect the clionge to be implemrmled {expected to be easy on
average), flow f tbiuk 1he c:l1011ge was really implemented (expected lo be harder on
average), and Mv acmal behaviour ta the change i11volves (expected to be hardest on
average). It was expected that most lecturers would find it easy to say that the new
system was expected to be planned to produce some specified benefits and that there
would be some variation around this. It was expected that most lecturers would find it
harder (but still easy) to say that they expected it was really implemented as planned
and produce all the expected benefits because this involves more effort and work that
is unlikely to be 100 % right. It was expected that most lecturers would find it 'harder
still' to say that their behaviour involves everything as centrally planned, because this
involves more personal effort and work again, that is not likely lo be undertaken 100
%. The fourth involved calibrating all the difficulties of the items (from easy to hard)
onto the same scak as the measure of receptivity (from low to high), using a Rasch
Measurement Model. The following material provides an example of the conceptual
and model thinking involved with the construction of one oft he suh·aspccts.
Practicality in the classroom.
Expected ordering by difficulty pal tern for practicality in the classroom
It was expected that most lecturers would find it easy to say that they expected
the new ed11calio11ul .iy.1/em provider/ c/muge.'I tluu cm1 be adap1ed lo the ueeds of
their smrlellls (item 31). It was expected that there would be some variation in lecturer
responses around this. !twas expected that most lecturers would find it harder to say
that they expected 1/Je 1ww educational system would pro1•ide su.fficienl jloibility in
the clumges lo sr,il the needs of dijfere/11 stmlc111s {item 34), and there would be some
variation in lecturer responses around this. This is because item 34 involves 'a little
bit more practically' and conceptually than docs item 31. ll wus expected that most
lecturers would find it 'harder still' to say that they expected the 11cw educatio1111/
system would pro1•ide s11.fficie11/ re.wurces to allow them to impleme11t thc c/11111ge in
59
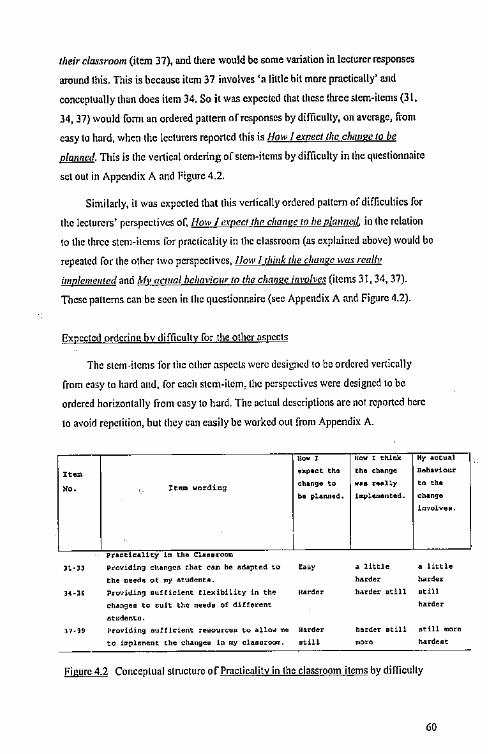
their ciu:1sroom (item 37), and there would be some variation in lecturer responses
around this. This is because item 37 involves 'a little bit more practically' and
conceptually than does item 34. So it was expected that tltcse three stem-items (31,
34, 37) would form an ordered pattern of responses by difficulty, on average, from
easy to hard, when the lecturers reported this is How I expect the change to be
pla1111cd. This is the vertical ordering of stem-items by difficulty in thc questionnaire
set out in Appendix A and Figure 4.2.
Similarly, it was expected that this vertically ordered pattern of difficulties for
the lecturers' perspectives of, How I e.1·necl 1111' change w he planned, in the relation
to the three stem-items for prnclicalily in the classroom (as explained above) would be
repeated for the other two perspectivcs, l/aw l rhiuk tlie change wa.~ rea//v
impleme11ted and My actual behaviour to the change i111v/ves (items] l, 34, 37).
These patterns can be seen in the questionnaire (sec Appendix A and Figure 4.2).
Expected ordering by difficulty for the other aspects
The stem-items for the other aspects were designed to Ce ordered vertically
from easy to lrnrd an<l, for each stem-item, the perspectives were designed to be
ordered horizontally from easy to hard. The actual descriptions arc not reported here
to avoid repetition, but they can easily be worked out from Appendix A.
,~, HOV I think Hy actual
,._ o><poct tho tho chango Bohaviout
"· Hmo wording change to w.a rull.y to tho
ho ploMod. l"'l'lomentod. Cha"'J'O
involve 0,
" octlcollt ' In tho Co l on ·-Jl·ll Providing chongeo that can ho odoptcd to Eooy o little • little
the need• ot my otudcnto. horde< batder
H·ll Providing ouffldcnt flexibility in the HAtdot harder still otill
chongoo to oult the needo of diffetcnt horde<
otudonto,
l1·19 Providing oufl!dent rcuo-utceo to allow me Hatdor harder otill otlll moto
to implc,..nt the ehangco In oty claoot0""1. otlll ..... hardcot
Figure 4.2 Conceptual structure of Practicality in the classroom items by difficully
60
I
Notes on Figure 4.2 I. Items ru-c designed to be ordered by perspective from easy to
hard (vertical ordering).
2. perspectives are designed to be ordered by items from easy to
hard (horizontal ordering).
3. source: part of the questionnaire designed by the author for this
of study.
Rationale for the interviews
In order to answer the research questions outlined in Chapter one, structured
interviews were conducted. This is because structured interviews arc appropriate for
complex situations, are useful for collecting in-depth mfonnation, and the questions
can be explained to the respondents (Kumar, 1996, p. 115; Flick, 1998). In this study,
the researcher expected to find out the reasons that Rajabhat lecturers gave for
holding their expectations of, and behaviours towru-ds, the recently implemented
planned educational change.
The interview questions are set out l:Jclow.
IntervJ<,w queotiooo
Oiuction, You are rcqucoted to respond to the questiona concerning lecturer
receptivity to a major new policy change in the context of planned change at
Rajabh<1ts in Thailand.
Leetunr receptivity to the oew odueational system
Aapoct 11 C°"'Parison with th" previous chang"
1.1 00 you think that the new educational system is better than
the previouo educational system?
1.2 Why do you think that?
Aspect 2, Practicality in your ch .. room 2.1 Do you think that the new system is practkal in your
claoaroom?
2.2 Why do you think that?
Aapaet l, Alleviation ot CODCUDB
3.1 When the new educational policy is implemented, will all your
concems be alleviated?
J.l Why do you think that?
61
Aspect t, Lear11.h>9' about the chang•
4.1 H0'1 did you learn about the educational change?
4 .i Why do you think like that?
Aepect 5, Pllrticipation in docinion•IU.king
5,1 How will you be participated in decision•making at your
Rajabhat, when the new educational policy is implemented?
5.2 Hhy do you think t~at?
Aopect 6, Peuooal co,st app~a!Ml
6.l Do you think the new educational system io worth all the
etton to implement it? Would you pleaee give oome details?
6.2 Why do you think that?
Aspect 7, Collaboration with other locturors 7.l Ia collaboration with other lecturern neceGsary to implement
the nc" educational aystem?
'/, 2 Why do you think ~han
Aopoct 8, Opportunitioo fer Locturar Ilalpruv...,...,t
8.l Does new educational system provide opportunities for your
educational knowledge and profeso!onal improvement?
8. Why do you think that?
Aspect 9• PBrcoived Value for Students
~.l Is the new educational system ~dvantageouu for your atudenta?
9.2 Why do you think that?
Ilypothcscs
Ten hypotheses were set up in order to achieve the purposes of the study. These
arc as follows:
l) Lecturers arc able to answer the items in the conceptually ordered-by
difficulty patterns in which they were designed for the nine aspects.
2) The expectations arc easier than the behaviours for each item in the measure
of the new policy comparetl with the previous system.
3) The expectations arc easier than the behaviours for each item in the measure
of practicality in the classroom.
4) The expectations arc easier than the behaviours for each item in the measure
of alleviation of concerns.
5) The expectations arc easier than the behaviours for each item in the measure
ofleaming about the change.
62
6) The expectations are easier than the behaviours for each item in the measure
ofpartieipation in decision-making.
7) The expcc.tations are easier than the behaviours for each item in the measure
of personal cost appraisal.
8) The expectations arc easier than the behaviours for each item in the measure
of collaboration with other lectures.
9) The expectations easier than the behaviours for each item in the measure of
opportunities for lecturer improvement.
10) The expectations easier thnn the behaviours for each item in the measure of
perceived value for students.
Summary
This chapter has reviewed the major theoretical assumptions that underpin this
study. A model of lecturer receptivity to system-wide change in a Thai Rajabhat was
proposed. Nine aspects innuencing receptivity towards the new educational change,
which were measured in three perspectives, were proposed as part or the model.
Further, the model or the structure oft he questionnaire using items ordered by
difficulty, linked with a model of ordered perspectives, and an ordered set of response
categories, was described. In the fin.,! section ofthis chapter, the rationale for the
interviews and hypotheses of this thesis :.:e explained. The next chapter discusses
measurement of variables and explains the instrument devised for measuring lecturer
receptivity.
"
63
CHAPTER FIVE
MEASUREMENT
111is chapter begins with a brief introduction to Rasch measurement used in this
study. A description of the survey questionnaire that was used in this study follows.
Backgi:ound to measurement of lecturer receptivity is then provided, fol!owed by a
discussion on the use of a Rasch measurement model, used to construct a scale of
lcclUrcr receptivity lo the change. finall•;. the pilot testing of the questionnaire and
biographical data arc discussed.
Measurement
Measurement can be viewed as a process in which numbers are used to !ink
concepts to indicators on a co111inu11m (Punch, 1998). Traditiona!Jy, the most common
means of measuring attitudes have been based on classical test theory with the use of
Thurstonc and Like rt scales {Boyd, 2002). However, for this study, the methods used
arc referred lo as item Resprmse Theory. Item Response Theory is based on the notion
ofa relationship between the observable responses to tcsl items and the unobservable
traits assumed to underlie responses to items on a test. A mathematical fonnula is
used to describe this relationship (Rasch, 1960/1980; Hamblction & Swaminathan,
1985). One family or mcasuremcril models based on Item Response Tlicory that
satisfies the requirements or measurement, as Suggested by Andrich (1989), is the
Rasch models which have been hailed to be "simple", yet "very powerful" models of
measurement (!lambleton & Swaminathan, 1985, p.4). It has also been noted that
Rasch models incorporate the best elements of the Thurstonc and Like rt approaches
(Wright & Stone, 1979; Andrich, 1982). The original Rasch model developed by
Danish mathemathician Georg Rasch in the \ 950's, was the Simple Logistic Model
(Rasch, 1960/1980~ and it was used to analyse dichotomous responses. Subsequent
work has extended Rasch models to incorporate polychotomous responses, where
three or more response categories arc used to compare measures (Andrich, 1988a,
1988b; Anderson, 1995). Central to the notion of objective measurement in Rasch
64
models, a\w tenncd specific objectivity or sample-free measures (Douglas, 1982;
Wright & Masters, 1982; Andrich, 1988b), is that both i1em difficulties and people
measures can be calibrated on the same scale. That is, differences between pairs of
person measures arc scale-free and differences between pairs of item difficultic; arc
expected to be samplc·indepcndcnl (Wright & Masters, J 982; Amlrich, I 988b), which
is a rcquircrm:nt of measurement. As mentioned abol'C, a new questionnaire was
devised to measure lecturer receptivity because lecturer receptivity me,1sures and itcm
difficulties h;\\'e to he calibrated together on the same scale, in order to fonn a proper
linear scale with the R\JMM comp11l1.T program {Amlrich, Shcrid,111, L)1lC & Luo,
:woo, Waugh. 20110b, ZOO\ i. ;1n<l thc items h,weto be designed in onkr of<lif!icully.
,\ new tp1c.1tio1111airc on lcc!urcr rccc11ti\·ity to new cducalional polic)· chan~c
As outlined in the preceding chapter, the model of lecturer receptivity was
crca1cd with nine aspccL,;. They :ire:: l) the new system in comparison with the
previous system, (2) practicality in the cl.1ssroom, (3) alleviation of conccms, {4)
learnii.g 11ho\ll thc change, (5) participation in decision-making, (6) personal cost
nppr,1isa!, (7) col\abor;1tion with other kcturcrs, (8) opportunities for lecturer
impr\11·c111cnt, ;111,! (9) pcrccil'cd vtiluc for students. Rcccplil'ity items on these ni11e
aspects wcr:: anS\\'crcd in three perspectives: one w;1s for /!"II' l ''-t{!l'rl thr! d1m1gc w
fuu!lmuio:,l (to nicasurc the ideal .ispect), two was [Im,, l 1/11nk 1J,,, rlw11g,• was rca//1'
implnu,•111,•d, a11d three was At,, arl1wl b<"i1111·iour w du· rlumgc juw,ll'<'s (to measure
the actu.il or real J.spccl). Tl1c items relating to each ;ispccl were ordered conccptoally
by difficulty. Tiie items were set UJl under their aspect headings, so it would be clear
to lecll1rers what was being measured and a\! the \\ems were written in a positive
sense wi1h an ordered response fonnaL
11ic four ordered response categories - for all or nearly a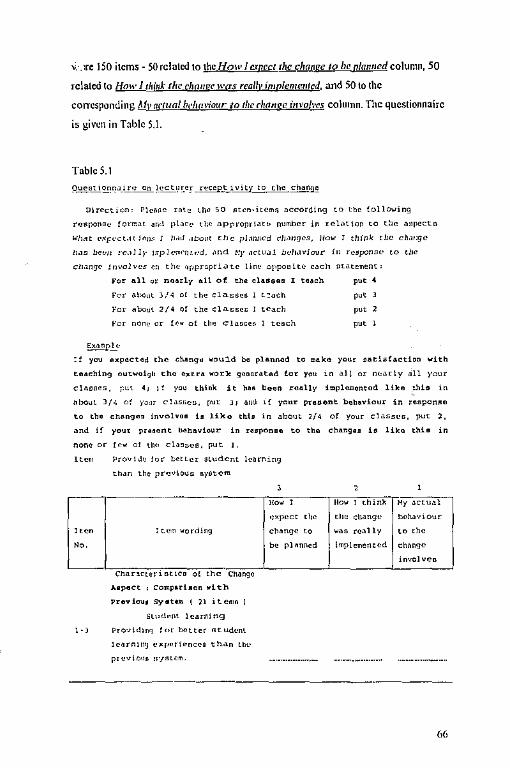
":. :re 150 items - 50 related to the flow 1 exprc;t the fZilllllrre 10 be plamied column, 50
related to How 1 t!iink tire clw11ge wgs rea/11• i,,ipleme,ired, and SO to the
corrcspon<ling M1• arrua/ b,•!wl'io11r to tire rlwnge i1n'IJlves colullln. The questionnaire
is given in Table 5.1.
Table S.1
Oirecuon, Ples,c.c r,lte the 50 otern·itemn accordin9 to the !ollowing
rc~ponoe fon,.at a<.,l plac,• the appropnate number in rel~t,on to t:i.e allpocta
Wh~t ,•.<ft'ct.1' '""-' J /J.HI .,bo,,. tlic pl.11wcd dJa,,gcrr, 110-.., r tllfnk tile ch,ir,gc
1,.rn bet•/! ,r.oll)· ,rrpl,·~··i,,,•d. ,llld t!y ,1cl<J~l bt"!1,1viour in zesponse ,o the
c/i.-,i,~e Jtlvolves c:, the ,ipproptlat.e line oppoultC each statement,
CO< all or noorly t1.1l ot thQ cluoao ' t•oeh '"' ' roe abc.,t 3 /.; "' "" clao""" teach put
For about ,;, "' "" clC>soes teach ""' ' For none or few o[ the claoceo ' teach ""'
~p.!.c
:f you oxpectod th" changu wou1d bo phnnod to make yout uthhction "ith
taachlng outweigh tho""""" worl< gonoratad for you in al) or n~atly all your
cl,,or,es, ;out t, 1! you think it )lao been really impl..,.ontod like ,hi .. in
about J/.\ o: p,,r clase.eu, put J1 a<>U ,1 your pu .. ont behaviour in ,oaponao
to tho chongoo !nvolvoo h lil<o thh 1n aboul l/4 of your classes. put l.
and if your prooont bohavlour in r .. ponoe to tho changoo is liko this in
none or few o! th<a claa5c"· put I,
Item !'rov1Jt, for bolter student learning
than tho pn,v,oua nyotcm
!!0"' ' ,,xpect
c~ wording change
the
,. Hem
'°· " planned
Channennt1co o! the Change
AopGCt ' COIOPO<hcn ~itl>
Vnvlcuo SydtU ( ;a 1ten10
5l\Hl,•nt learn1n9
l·l i,,,,.,,~'"'I loo better Atudcnt
Je,,rnu,~ ""l'"""nceo th.an lhc•
pzc,;1~"" ,iy,,lem.
-------·~--
-...
llo"' ' think My actual
the chan9c boha·nour
• •• really lo the
implemen~ed ch,,ngc
involvcn
(,(,
tBO:OWIW:iiiiMlld:a::§\ikii\-hcih,~
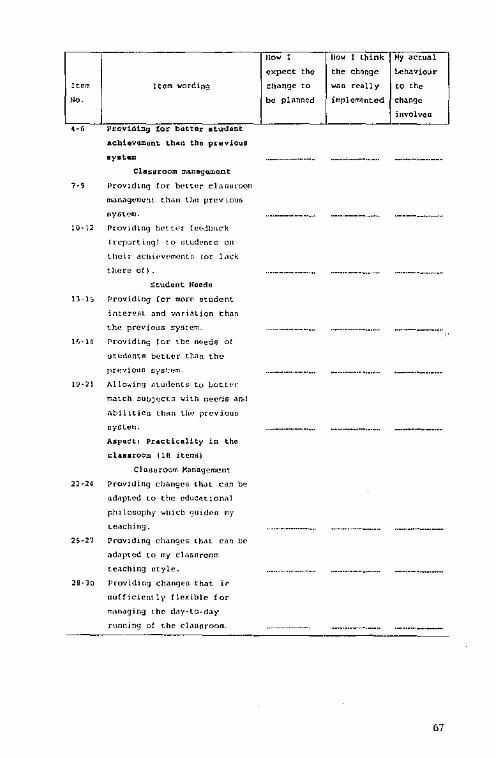
ltem J tern warding
, .. . , r, Prcvidbg for bottor atu<I•••
acbhvomont tbAn tho previous
oyatu,
Claurcom mi,nog..,.ent
7·9 Providing !or b"'ter dana,-oo,,,
""'Mgcmv,il t!l"n th" prcv1ou"
a;•stem.
io·l:l Prnv1d1C\9 hPtt,•r le~,Jbac-k
!reporting) to ,atudent,a on
tl1oi,· ach1,•v<·m~<1lr, lor l,,ck
there of).
Student l-lcodo
ll·l', l'rovidins [or mo,·p otudemt
lmere~t and ·,,,r1Mion than
the prevjouo 5y,1tem.
1"·18 Providing for the n~edG or
~tudQntn heto.c,· tl\an the•
pn,·,ioun nyn"'"-
1~·:il f,llos·1ng ,;tuc!ents to bc~c,,,·
S",atch oul,JnC"'-s "ith ncc<Jo ,1n,I
,1bil1tico tlhln th" p,evious
ayole~.
Aspoct, Practicality in tho
clau,oo"' (111 Hec,»i
Claosroom 1<,,nagemc,nt
22·24 Pr,:,viding ch,onge" that can he
ad,1pted to tbc ed<iCnt1on.,l
r,lulaaoph1· ,,.i.,ch gu,de,i my
te,1c),ing.
:1>·21 Providing changes th,>L can be
ad,1ptcd to my d.,o,,roorn
te,1ching otyle.
2B·lo Providing c!,angeo that ;,
aufficien\ Jy flexible !or
m.,naging the d,,y·lO·day
rnmling of the cl,,aoroorn. ~~-
now ' flow ' think My actual
expect '"" '"" change t..eha•tiOU1"
change '° ••• really '" '"" "" planned implemented change
involvco
67
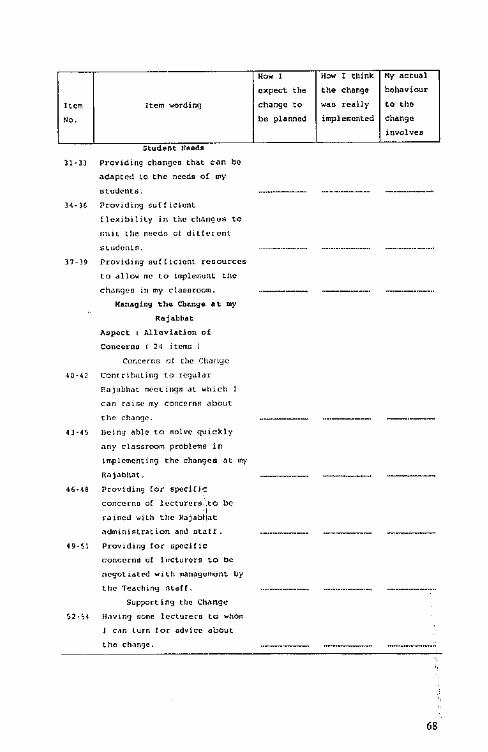
••• ' •= ' think My actual
c,cpect '"" "" change behaviour
Hem Item \<Ording change ,. .,. really ,a t!,e
"· "" planned implercented change
involves . ~tudent l!oodo
ll · ll Providing chongeo that eoo "" ;;,.dnpte,\ " "' needB °' ., otudents ---·-- ··-·--·--·-···-·-·· ----·---
l4-)0 Prnv,ding "ufficwnt
flexibility '" '"' ch,;r,ge~ ,. nun lhe n"edn "' ditlercnt
6t<1de<1te. --------·--·---- ··-·-·-·-·-·-···-·· ·----·--·-·-···-·· 17-H Provid,ng auf[1c1ent n,oourceo
'° allow " ,. 10,plerrm1t the
chang<•o ;,. ., claoornom. -·---- ··-----·-· -·------·· Managing """ Cbnnge " .,
Rajahhoo
Aopcct ' Allnviaticn ., coneeeno ' " i temo '
Cor,cern5 "' the r;lrntigc
a·4l l"oi,<nb,1tw9 '° regular
P.aJ,obh<lt meetings "' wllich
m raise ., concerns ,,bout
the change. --·--··- ··-·-------· --·---4 l ·l5 llc11,~ ,,ble '" solve quic:Uy
any dassroorn problems '" ;,r,plemcntinsi '"' changes " "' Rapbl1at. ··-·----- ----- ------46·'8 Prov1ding co, S!)<lci[ic:
conccrno oC lecturerr. .to "' ' r~1ned with tl,c Rajabt1at
,,dminiMr,Hion "'" nta(f. ··-·-·---·--··- ·-----·-- ---·----49.51 Providing co, "1>eclf1c
conr,en>o .c J.,ctur<,rs ,o "' ncsiot,aled with inanagctn<:nt "' '"' Teaching starr. ··---·---·--- ··-·-·-·-·--··- ··---·----·-··
Supporting tile ChM\gC
si · s, IJ.1vin'J nome lecturern '° whom
' c,rn lurn '"' advice about
Ute ch,,nge. ··-------- -----· -----·
68
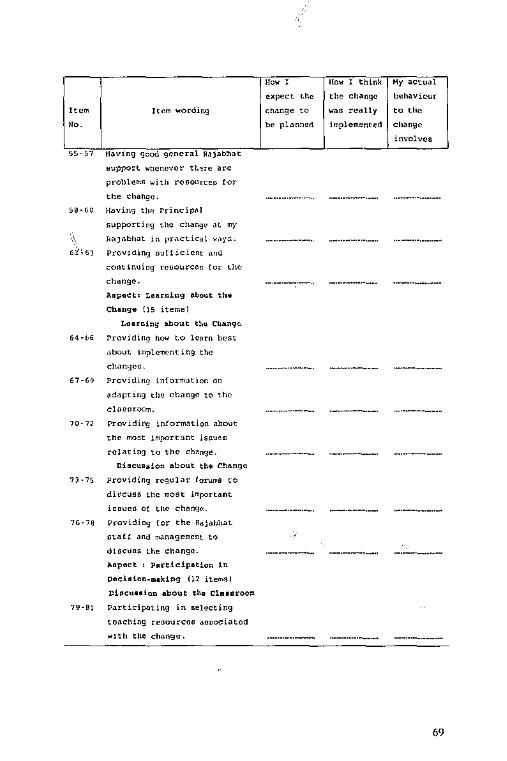
Item Hem "'ordifl9
"· <. s~ 57 t1avrn9 good general R,iJabhat
•upporl »henever tl,,re ar,c
prol,Jems with reeourcen !01·
the change,
5B·GO Having t)"' Princlp,,]
supporting the charu:ie at. my
Gi''GJ Prov1ding nu[!icicnt arid
continuing resources !or t)w
change.
llnpect, Learning oJ,out the
Change {JS itemal
Learning ahout the C~•ng~
H·!·O rroviding hrn< to learn best
ab<>ut i<nplementir.g Lhe
changes.
67·G9 Providing information on
adaptlr,<J Lile change to the
cla~HO<l:n.
70·?, Pr<>vldit>g information about
the most Jmpondnt isnue~
rcl,iting to the change.
Diocu.,.lon about th9 Change
73·75 Providing regula, forums Lo
di11cuss the most important
ioaueo of Lhe cha119~.
7G·78 Providing !or the Rajilbh.at.
naft and m;><1agernent to
d1ocunn t.he cllange.
,\.opact , Participation ln
Dadofoo-making ll2 items!
Dl.ocuooion about the ClusrooOI
79-Bl Partidpating in oelecting
tc,,ching ,eoourcco aoaociatcd
wlth the chunge.
,,. ' expect '"' change •• be planned
l!Ow ' think My actual
'"' change behaViC'ur
"' really " the
implemented change
involves
69
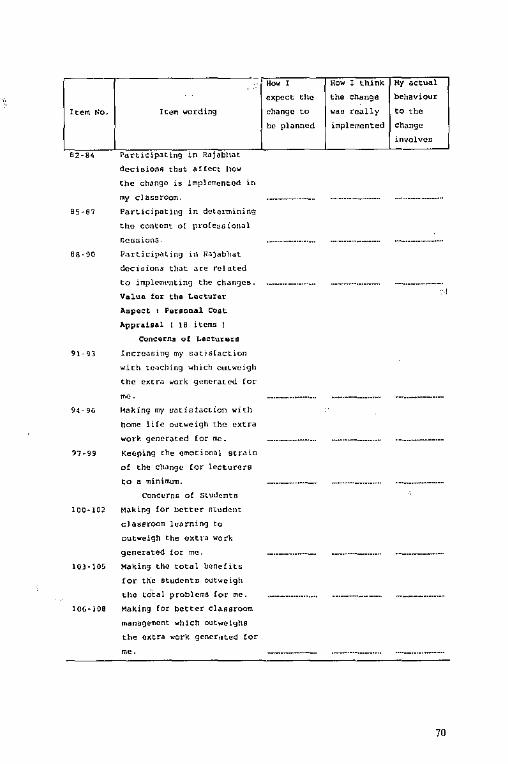
Item No.
B2 84
91- 9]
94-96
'7-99
l 00· 102
IOJ • JO>
106· lOO
Item =rdlng
Pan,c,pating ,n Rajabhat
dec1alons that aHect 1101<
tile change i5 implemented in
my classroom.
Parlidpatlng in determining
the content o[ pro[e"uional
P,utidp,,ting 11\ H,1Jabl1dt
deciaions that are related
to lrnplem,•ntlO<J the changes.
Valu<> for the Locturar
Aspect , ~eroonal Coat
.\.p;,aisal I IS iccms I
Concern, of i.ectureu
Increasing m}' sati5faction
1<itli te.>clling wl1icl1 ouc,mi<Jb
the extra work g,enerated for
'""· Making my uµtidaction with
home life outweigh tho exna
wor~. generated (or rne.
Keeping the emotional st.ain
of the change (or lecturers
to a minimum.
Conc~rns of S1.ude,ita
Ma.king !or better a1.udent
claseroor:i karning to
outweigh the cxtta work
generated !or me.
Making the total benefits
!or the otudenta outw-cigh
the 1.0tal problems to, me.
Making [or better cla.aaroom
mana~emcnt wt,lch out.,ciglrn
the extra work gener,,tcd !or
oe.
. ·~ ' !!ow ' think i,iy actual
expect the '"' change behaviour
change '" ... really to the
be planned implemented chanse
involven
70
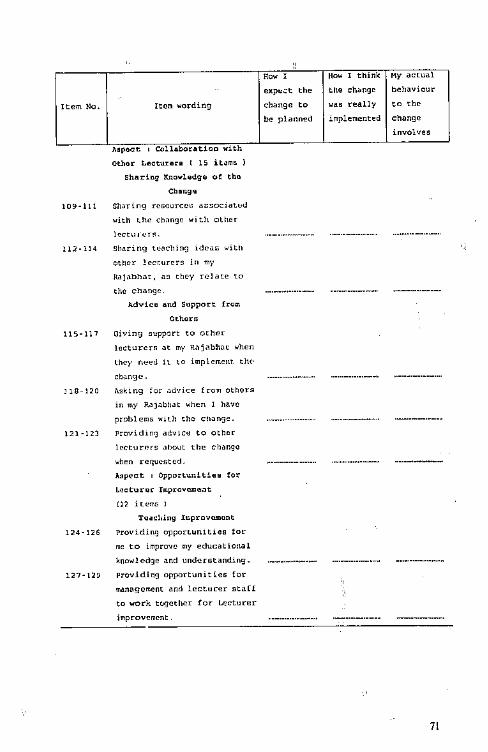
Item No.
109-lll
112-114
115-117
l 18-120
121-12)
124·1:.lG
127·12~
Item wording
Mpect , CollabouUoo 1<ith
Other Lectuuro I 15 itamo )
Sharing Knowledge of tho
Chong~
Shadn9 re"curce" ansociat~d
with ~he change with Otl\OC
l~ctluc•is.
Shnring te,,c),ing idea~ wlLll
otl,er !eccurers in ffl\'
R,1j,,bhat, a" they relate to
the change
Advico and Support from
Others
Giving support to oth..c
lectu.-ern at my Rajablwt when
l11ey r,eed 1t to implement tlw
change.
/,sking :or ad•:ice from othorn
in my R,1Ja~hat when I h«ve
problems with tile cliange.
Providing ad•11ce to other
lecturers .,bout the chor.ge
when requested.
A,pect Opportunitieo for
Lecturer Ionprovruirn"t
ll:l i te~.s I
Tooching l!r.prcvmnont
Providin~ opportunHica for
rne to improve my educatlotial
knowledge and undorstandins.
Providin~ opportunltlcs tor
manago~.ont and lecturer ata[1
to work together for Lecturer
improvement
"" ' """ ' think My actual
exp~c:t '"e the ch~nge behaviour
change ,o . ., really '" '"e be planned implemented change
involves
71
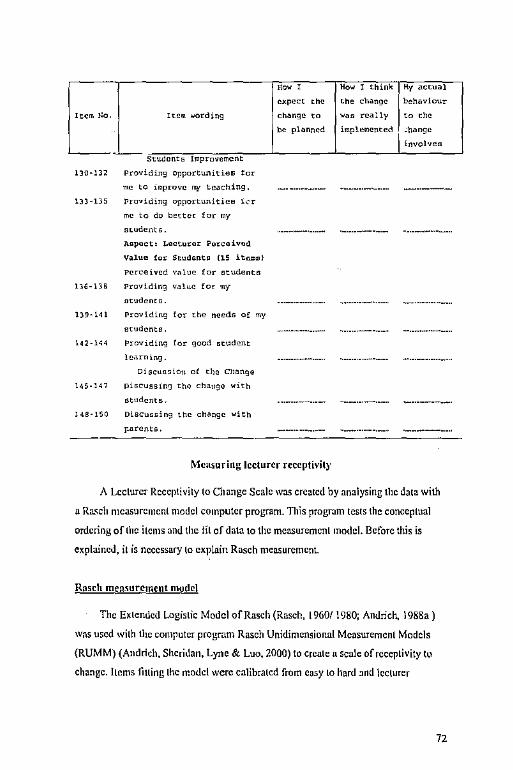
!tow ' ,o, ' think My actual
nxpoct '"' ,,o change bnhavlour
Item No. He"' wording change ,o <oo rea: ly Co '"o ,, planned implemented change
involves
Students Improvement
130-132 Providing opportunities <oe
00 ,o improve ~ tnac:hing, ·-· -···-----·· --···-··-·-··· .. --·--·-133-llS Providing opportunitieB 1c-r
00 <o " bettcc foe o, students. .. -----·-···- ·-···--·····-·- "•··----·---.. 11apoct, l,eoturor Porceivod
Value <oe Studonto '" it<10>0)
Perceived value foe etudentB
1]6-1]0 Providing value <oe ., students. ----·-··---.. ··-··········--.. ·-·--·····--..
139·141 Providing <oe '"o needs o, ., students, ---·-··--·-·· ········-·····-·-- -·---·-··--..
142·H4 Pi:oviding foe good student
learning. -------···· .. ........... ---·-- -·-·---·-··-·-' Dlacuosion o< the c1,ange
145-147 Diocuss1n~ the change with
atudent5. .. -·-···-········· --··-···---···· .. ·-·····-----· l48·l50 Discussing coo change with
i:arcnrn, ---·····--·--- ---·········-··· ·-----.....
Measuring lecturer receptivity
A Lecturer Receptivity to Change Scale was created by analysing the data with
a Ra.~ch measurement model computer program. ll1is progr.tm tests the conceptual
ordering oft he items and the !il of data to the measurement model. Before this is
explained, it is necessary lD explain Rasch measurement.
Rasch mea~uremcnt model
The Extended Logistic Model of Rasch (Rasch, l 96011980; Andrich, l988a)
was used with the computer program Rasch Unidimensional Measurement Models
{RUMM) (Andrkh, Sheridan, Lyne & Luo, 2000) to create a sca!c of receptivity tu
change. hr.ms filling the rr.o<lcl were calibrated from easy to hard Jnd lecturer
72
receptivity measures were calibrated from low to high on the same scale. It should be
note that, in Rasch measurement, attitude items arc described as easy or hard because
they arc treated just like achievement items and interpreted in the same way. The
Rasch method proi.luccs scale-free person measures and sample-free item difficulties
(Wright & Masters, 1982: Andrich, !988h). Thi~ means that the differences between
pairs of lecturer measures and pairs of ilem difficuhics arc expected to he sample
independent- one oflhc requirements or measurcmcnl.
The Rasch model requires that data must fit the measurement model (sec
Andrich, 1989). This foll,iws from the requirements ncc<lc,! to create a proper, linear
scale. This is contrary to Clnssical Test Theory where one tries to model the d;ita,
There arc three main scale rcquirc1ncnts (not ussumplions oflhc rncasurcmcnl model).
One is th al of scale .iddi1ivity. EquJI differences between two sets ofitcm tlifficultics
on the scale must equal tliffercnccs between the two corrcspontling sets of measures
on the scale. In a psychology lest ll'llerc item scores arc atldcd lo give a percentage,
Che difference between 55'Y,, anti 65% docs not equal tile same amount of Psychology
unJcrstanding as between 75% and 85°/.,; that is, there is 110 additivity and simply
adtling marks on a 11umhcr ofilcms tines not mean one has a proper scale. The second
is thnt il should be possible lo omit some items without affecting a lecturer's mc.isurc
on the sc:1le. The third is that the created scale should not be affected by the opinions
of lecltlrers whose answers arc used to construct it. Tbat is, a proper scale is invariai1!
across groups for which it is used. This means that, for the Rasch model, all the items
contributing to the scale must have the same discrimination parameter. In contrast to
Classical Test Theory, item discriminations can very considerably.
The RUMM computer program (Andrich, Sheridan, Lyne & Luo, 2000)
calculates standard errors of measurement for lhe lecturer measurements of receptivity
to change and for the item difficulties, as well as a Lecturer Separability Index. TI1e
equations for these arc given in Wright and Masters (1982). The Index shows the
proportion of observed vuriancc considered true.
The zero point on the scale docs not represent zero Lecturer Receptivity to
Change. It is an artificial point representing lhe mean of the item difficulties,
calibrated lo be zero. It is nol possible lo calibrate a true zero point of Receptivity to
Change in the present stL•dy.
73
The RUMM program parameterises an ordered threshold ~tructure,
corresponding with the ordered response categories of the items (see Andrich, 1988a;
Andrich & van Sehoubrocck, ! 989). The responses to the categories were checked to
ensure that discrimination is satisfactory and that lecturer responses arc logical and
consistent, in relation lo measurement on the Receptivity to Change scale.
Discrimination is satisfactory when the thresholds arc ordered in correspondence with
the ordering of the response calegorics. ln Rasch measurement, threshold values arc
calculated so that there arc odds of] ·1 for lecturers answering in adjacent response
categories. !flhrcsbolds arc disordered, items arc discarded because it means tl1at the
response categories arc not answered logically or consistently. In the present study,
there .ire four categories and hence three thresholds per item that should be ordered.
The RUMM program subslitutes the parameter estimates back into the model
and cxalllincs the difference between the expected values predicted from the mode!
and obs~rved values using two tests·of-fit: one is the item-trait interaction and the
second is the item-lecturer interaction. The item-trait lest-of-fil (a chi-square)
examines the consistency oft he item parnmclers across the lecturer measures for each
item, and data arc combined across all items to give an overall test-of-fit {sec Andrich
& van Schoubrocck, 1989, pp.479·480 for the e(1u.1lions). This will show the
collective agreement for the difficulties of .ill items across lecturers of differing
Receptivity lo Change measures. This means that all the lecturers, irrespective of their
measure of receptivity to change, a:grce that particular items me easy and others arc
hard. The item-lecturer tesl·of-fit examines both the response patterns for lecturers
across items and for items across lecturers. It examines the residual between the
expected estimate and actual values for each lecturer-item summed over a!l ilcms for
each lecturer and summed over all lecturers for each item {see Andrich & van
Schoubroeck, 1989, p.482; or Styles & Andrich, 1993, p.914 for the equations). The
fit statistics approximate a !-distribution with a mean near zero and standard deviation
near one, when the data fit the measurement model. Negative values indicate a
rcoponse pattern that fits the model too closely (probably because response
dependencies arc present, sec Andrich, 1985) and positive values indicate a poor fit to
the model (probably because other measures -'noise' - arc present).
74
There are at !east three reasons why items may not fit the Rasch measurement
model in the present study. One, the response categories may not be answered
consistently and logica1\y. An example would be where a lecturer with a high measure
answers a !ow category for an easy item and a higher category for a harder item. 1lte
RUMM program creates item thresholds and produces a category characteristic curve
for each item. This allows the researcher to check how the categories arc answered.
Two, lecturers may not be ahle lo agree on the difficulty of all items on the scale. This
may indicate, for example, that hair the lecturers with high measures wmvcr an item
positively and the other half answer negatively. Three, the residuals may be loo large
indicating th:11 there is too big a difference hctwecn 1hc actual and expected values
according lo the measurement model. This could arise for a number of reasons such as
the item not being affected by the same dominant trait as the other items, or a
particufar group of lecturers responding differently to one response category oft he
item than would be expc:ctcd for their overall score on the scale.
Pilot testing of questionnaire
An infonnal trial or the qucstiornmirc was conducted with three colleagues.
They w('··c asked to unswcr the questionnaire, and then the researcher discussed the
questionnaire with them. l11cir feedback indicated respond ems 111igh1ji11d it c11sicr to
circle the ,1ppmprillle 1111mbcr in rcfalirm to the aspects instead of pulling it directly
on the appropriate line opposite each s\atcment. They staled that the instructions were
clear enough and that Rajabhat lecturers should be able to understand the items and
answer them satisfactorily. The qucstio1mairc was then considered ready for a fonnal
pilot test.
A fonnal pilot test oflhc questionnaire survey instrument was conducted with
50 Malmsarakham Rujabhat University's lecturers. Sampling was processed through
individuals initially selected, and they suggested ?he names of others who might be
appropriate for the sample. This process has been referred to as the network, chain, or
"snowball" mcthO(l (Wiersma, 2000, p. 287). Each participant was asked to complete
the original 50 stem-item questionnaire and rcspo11dcd with wrillcn feedback on
several aspects. Particularly, each lecturer was asked to consider the following
questions, adapted from Boyd {2002, p. 64).
75
I. How Jong did it take to complete the questionnaire?
2. Were the instructions clear7
3. Do you think any major nspecl has been left oul?
4. Were the response fonnat cntegoric, workable?
5. Any other con1ments?
While all respondents completed the original 50 stem-item questionnaire, only
35 respondents provided verbal feedback on several aspects. They reported varying
times lo complete lhe questionnaire, ranging from 25 to 40 minutes, with most
reporting around 30 minutes. None of the 35 \cclurcrs reported any problems with the
response fonnat or clarity of inslntclions. However, two lecturers commented that
there were dimcullies in responding. lo some items. They imlicalcd that the ilctns
'Pro1'idi11g wdm! for my s/1ufr11ts' (Items 136-138) 11111/ "!'rovidi11gfor the needs of my
strulellls' (Items 139-14 !) were a problem. They pointed out that the question needed
to define the words 'value for my stm!cnts' :md 'needs of my student'. They discussed
the words 'value' and 'need'. As one lecturer wrote "l had to think about this before I
placed the appropriate number on the questionnaire", These items uwc i11 1he aspect:
paceil'cd 1·1J/11e for .,·111,lc11/s. This aspect was one of nine aspects innucncing
receptivity. Further discussion was not able lo produce another way to wrile the items
more clearly. Therefore, the researc]1er did not discard the items. Lecturers made no
additional commcn1s about the questionnaire in general, no comments were made thal
any important aspects had been lefl out, and no other main comm en ls were made
aboul the questionnaire. Apart from minor changes 10 lhe wording of some items, no
further changes were made.
Biographical data
The questionnaire contained four biographic questions such as name of
Rajabhal Universities, gender, academic position, and educational degree. This
section provides infom1ation on which a description of the sample is derived.
76

Please complete the following details.
I. At what Rajabhat University do you work?
D Nakhom Ratchasrima Rajabhat University
O Buriram Rajabhat University
O Surin Rajahhat University
O Uhon Ratclmthani Rajabhat University
2. Whal gender arc you"/
D Male
D Female
3. Whal is yot1r academic position?
D Associ,ue Professor
D Assistant Professor
D Lecturer
4. What is your higher education degree?
D ,\ doctorate
D ,\ master's degree
D A bachelor's dcgrrc
77
CHAPTER SIX
METHODOLOGY AND PRELIMINARY DATA ANALYSIS
This chapter begins with the design of present study, followed by a description
of the samples. Next, the procedure is presented, and then, the process of data
collection using the questionnaire is outlined, followed by a description of the trial
and data collection using the semi-structured interview schedule. A summary
statement nfkcturer support for the change is given from a preliminary analysis of
the raw questionnaire data.
Design
A "mixed method design" is used for this study. ·nie mixed method design is
referred to as an apparent dichotomy created between quantitative and qualitative
methods (Clarke & Dawson, 1999, pp.86-90; Green &McClintock, 1985). In other
words, this study employed a combination of quantitative and qualitative methods
(see also Punch, 1998). Both survey questionnaire (quantitative data) and semi
structured interview (qualitative data) were used for data collection.
Tim study was conducted in three phases. Plmse one involved tria!ing the
questionnaire, phase two was collecting data using a survey questionnaire, and phase
three was face-to-face interviews. lnitial lindings from phase two, the survey
questionnaire became the basis for planning phase three, the face-to-face intc1views.
Samples
For the pilot test of the questionnaire data, Ii fly lecturers from the
Mahasarakham Rajabhat University were chosen and seven of these lecturers were
chosen for pilot interviewing. Sampling was processed by voluntary selection and
they suggested the names of others who might be appropriate. Tilis process has been
referred to as "snowballing" method (Wiersma, 2000, p.287). The pilot test was
necessary in order to invcstig11tc whether the items made sense, that the lecturers
78
could answer the items sensibly, and that the items covered all the topics that the
researcher wanted to study. Pilot testing was described in the previous clmq\er
(Chapter 5). ,I
For the questionnaire data, the population was 952 Jecturers, who were working
during the academic year 2001-2002, from four Raj ab hat Universities in the southern
part of the northeastern region of Thailand. The population comprised 285 kcturers
from Nakhon Ralchasima Rajabhat University, 238 lccturers from Buriram Rajabhat
University, 209 lecturers from Surin Rajabhat University, and 220 lecturers from
Ubon Ratchathani Rajabhat University (Rajabhat Institute Ubon Ratchathani, 2001:l,
2000). Of the 952 invited to complete the questionnaire, 6601 did so on a voluntary
basis (69.3%). and data from this sample were analysed in the next chapter (Chapter
7).
The first step in the analysis of the biographical data was to assign numbers to
the questionnaire responses in order to code the responses for entering into an Excel
computer program. The codes were a single number representing the'qucstions and
the answers that were provided. The biographical data was used to identify the status
of lecturers ofRajabhat U11iversities: name ofRajabhat University; gender; academic
position; and educational degree. Table 6.1 provides a summary ofbiographical data
of lecturers ofRajabhat Universities.
For the 660 respondents, there were 28.80 percent from Nakhon Ratchasima
Raj ab hat University, 21.20 percent from Buriram Raj ab hat University, 20.50 percent
from Surin Rajabhat University, and 29.50 percent from Ubon Ratchathani Rajabha!
University. Female wns 45.60 percent and male was 54.40 percent. For academic
position, Associate Professor was 2.90 percent, As~istant Professor was 39.40 percent,
and lecturer was 57.70 percent. For educational degree, a doctorate was 6.20 Jlercent,
a master's degree was 68.50 percent, aud a bachelor's degree was 25.30 percent (see
Table6.!).
!,'
2 N"'660 in chapter 6, but N"'659 in chapter 7, 8, and 9 due to RUMM rejecting
incomplete data for one person.
79
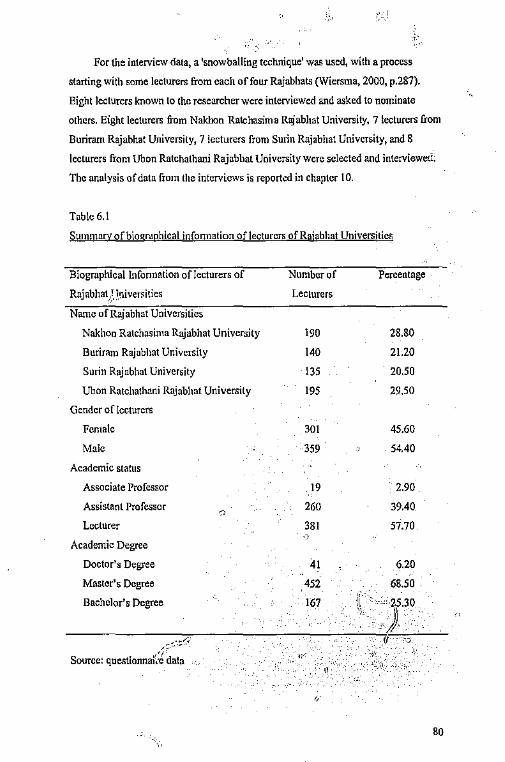
For the interview data, a 'snowballing technique' was used, with a process
starting with some lecturers from each of four Rajabhats (Wiersma, 2000, p.287).
Eight lecturers known to the researcher were interviewed and asked to nominate
others. Eight lecturers from Nakhon Ratchasima Rajabhat University, 7 lecturers from
Buriram Rajabhat University, 7 lecturers from Surin Rajabhat University, and 8
lecturers from Ubon Ratchalhani Rajabhat University were selected and interviewed.
The analysis of data from the interviews is report~d in chapter 10.
Table 6.1
Summary pfbiogrnphical infonnation of lecturers ofRajabhat Universities
Biographical lnfonnation of lecturers of
Raj abhat }_ 1.niven;itics
Name ofRajabhat Universities
Nakhon Ratchasinia Rajabhat University
Burirnm Rajabhat University
Surin Rajabhat University
Ubon Ratchathani Rajabhat University
Gender of lecturers
Female
Male
Academic status
Associate Professor
Assistant Professor
Lecturer
Academic Degree
Doctor's Degree
Master's Degree
Bachelor's Degree
~~-;:~
Source: questionnai'.i data
Number of
Lecturers
190
140
135
195
301
359
19
260
381 ,,
41
452
167
Percentage
28.80
21.20
20.50
29.50
45.60
54.40
2.90
39.40
57.70
6.20
68.50
i(· ·,.,._"·25.30 f,;_, )
,} (I ·.·::,.
80
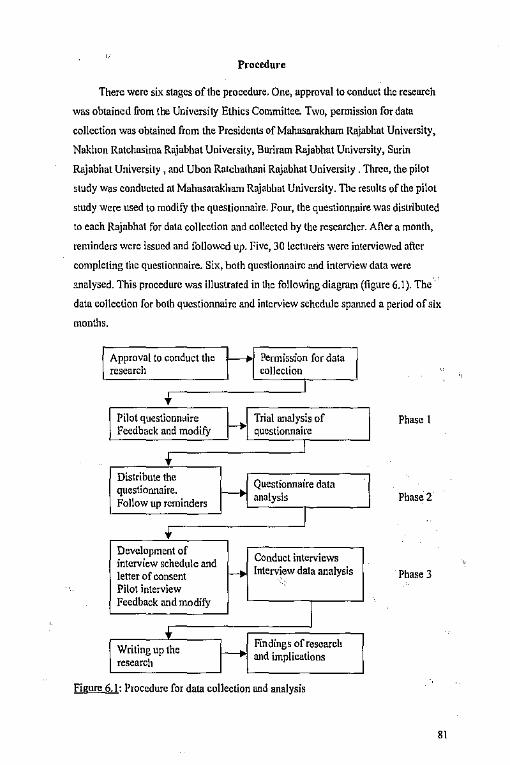
Procedure
There were six stages of the procedure. One, approval to conduct the research
was obtained from the University Ethics Committee. Two, pennission for data
collection was obtained from the Presidents ofMahasarakham R'\iabhat University,
Nakhon Ratchasima Rajabhat University, Buriram Rajabhat University, Surin
Rajabhat University, and Ubon Ratchathani Rajabhat University . Three, the pilot
study was conducted at Mahasarakham Rajablmt University. The results of the pilot
study were used to modify the questionnaire. Four, the questionnaire was distributed
to each Rajabhat for data collection and col!ectcd by the researcher. After a month,
reminders were issued and followed up. Five, 30 lecturers were interviewed after
completing the questionnaire. Six, both questionnaire and interview data were
:umlysed. This procedure was illust.fated in the following diagram (figure 6.1). The·.
data collection for both questionnaire and interview schedule spanned a period of six
months.
Approval to conduct the research
Pilot questiomrnire Feedback and modify
Distribute the questionnaire. Fol!ow up reminders
Development of interview schedule and letter of consent Pilot interview Feedback and modify
Writing up the research
Permis8ion for data collection
Trial analysis of questionnaire
Questionnaire data analysis
Conduct interviews Intervfew data analysis
Findings of research and implications
Figure 6.1: Procedure for data collection and analysis
Phase I
Phase2
Phase 3
81
Packages containing questionnaires for Rajabhat's !ectllt:ers were prepared and
distributed to each Rajabhat University in the southern part ofthc northeastern region
of Thailand. The distribution was conducted via each office of the Faculties in
Raj ab hat Universities. The covering lcl!er of the questionnaire was taken as infonned
consent, based on the condition of anonymity (see Apendix A). Principals distributed
the questionnaires mostly during Semester 2, in academic year 2001 (October 2001-
March 2002). In the main, the questionnaires were cvlleetcd together at the Rajabhat
and mailed directly lo the researcher. Follow-up letters and phone calls were made to
every Rajabhat University, where lecturers had not responded by the beginning of
January, 2002.
Interviews
Three expert lecturers from the Office ofRajabhat Institute Council infonnally
examined questions and key issues of the original interview schedule, that could be
explored in more depth in an initial stage of the interview pilot study. Discussion
revealed that general lecturer receptivity to a major new policy change at Rajabha1s in
Thailand was an important heading and needed more stress. Accordingly, it was
decided to emphasis more strongly the words 'a major 1ww policy cha11ge at
Rajabhars ill Thailand'. Tiie interviewee had to be given pennission by the Rajabhat
to take part before the interview was begun. Some alterations to the wording of some
questions were made to the interview schedule, based on comments from the Rajabhat
Council lecturers.
).n initial sample of eight Rajabhats' lecturers known lo the researcher was
selected. Two of them were from each of lour li.ajahhat Universities: Nakhon
katchasima Rajabhat University, Buriram Rajabhat University, Surin Rajabhat
University, and Ubon Ratchathani Rajabhat University. They were asked to
participate in an interview about their receptivity to a major new policy change at
Raj ab hats in Thailand. Tiiey were also asked to suggest other lecturers, who had
known about the major new policy-change at Rajabhats in Thailand, for participation
:,'; in an interview. With this approach, 30 lecturers agreed to participate in this study.
Before the lecturers participated in the interview, they were provided with a letter of
82
--------------------
consent and an infonnation statement (see Appendix A). The lecturers then read the
enclosure of the interview questions and they confinned their participation in the
interview again before the interview was conducted. The lecturers were asked to sign
a form of consent. In the case where lecturers refused to participate, their current
positions were not prejudicOO in any way. The time and place for the interview was
set according to the interviewees' preferences. Most of them preferred to set the
interview at their working room in their office. AB interview data were recorded with
a code number. No names were used in this study. The average length of the
interviews was 45 minutes. None of the lecturers declined to answer any of the
questions.
Data analysis
The model behind the questionnaire was tested by analysing the data collected
with the questionnaire. The tests were performed with a Rasch computer program,
Rasch Unidimensional Measurement Models (RUMM) (Andrich, Sheridan, Lyne &
Luo, 2000). Responses to the questionnaire items were entered into an Excel !i!c in
tenns of the response code (I, 2, 3, or 4). Then the data were converted to a text file in
Word, and analysed with the RUMM computer program. Various linear scales were
created. These analyses are described in chapters 7-9.
An attempt was mad:.i to discover why Rajabhat lecturers answered the
questionnaire tile way that they did and to find out some of the reasons behind their
answers to the questionnaire. These qualitative data were analysed with a view to
providing some answers to why (or background to) the lecturers holding their
attitudes, expectations and behavi-ours towards the change. These analyses are
described in chapter 10.
Preliminary data analysis
According lo the conceptual design of the questions for each aspect, most
lecturers were expected to find it easy to hold positive perspectives about how they
expected the change to be implemented for a!\ their leaching classes. The percentage
response of most lecturers' expectations was high because they did find it easy to hold
a positive perspective. Mosl lecturers were expected to find it harder to hold positive
83
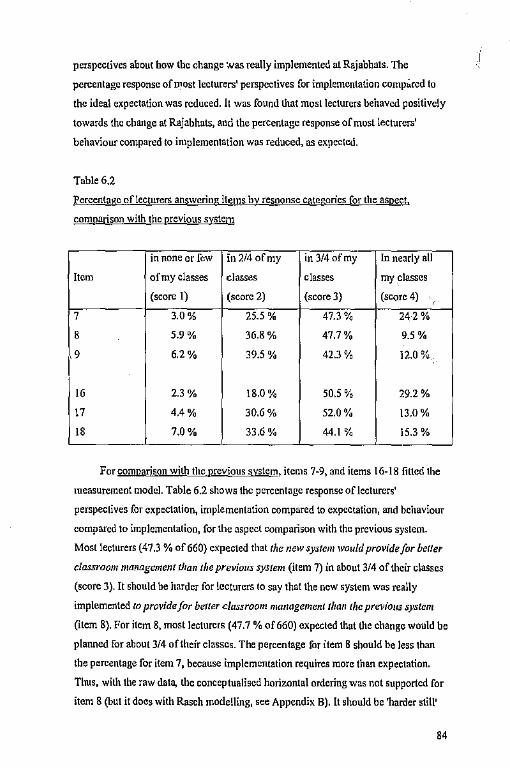
perspectives about how the change ,_.as really implemented at Rajabhats. The
percentage response of wost lecturers' perspectives for implementation comphrcd to
the ideal expectation was reduced. It was found that mosl lecturers behaved positively
towards the change at Rajabhats, and the percentage response of most lecturers'
behaviour compared to implementation was reduced, as expected.
Table 6.2
Percentage of lecturers answering items by response categories for the aspect,
comparjson with the previous system
in none or fow in 2/4 ofmy in3/4ofmy In nearly all
Item ofmy classes classes classes my classes
(score!) (score 2) (score 3) (score 4)
7 3.0% 25.5 % 47.3% 242%
8 5.9% 36.8% 47.7% 9.5%
1' 6.2% 39.5 % 42.3% 12.0%
JG 2.3% 18.0% 50.S % 29.2 %
17 4.4% 30.6% 52.0% 13.0%
18 7.0% 33.6% 44.1 % 15.3 %
'
Forcomparjson with the previous system, items 7-9, and items 16-18 fitted the
measurement model. Table 6.2 shows the percentage response of lecturers'
perspectives for expectation, implementation compared to expectation, and behaviour
compared to implementation, for the aspect comparison with the previous system.
Most lecturers (47.3 % of660) expected that the new system would provide for heller
classroom mmwgcmen/ than the previous system (item 7) in about 3/4 of their classes
(score 3). It should be harder for lecturers to say that the new system was really
implemented lo provide for heller classroom management than the previous system
(item 8). For item 8, most lecturers (47.7 % of660) expected that the change would be
planned for about 3/4 of their classes. The percentage for item 8 should be less than
the percentage for item 7, because implementation requires more than expectation.
Thus, with the raw data, the conceptualised horizontal ordering was not supported for
item 8 (but it does with Rasch modelling, see Appendix B). It should be 'harder still'
84
.i
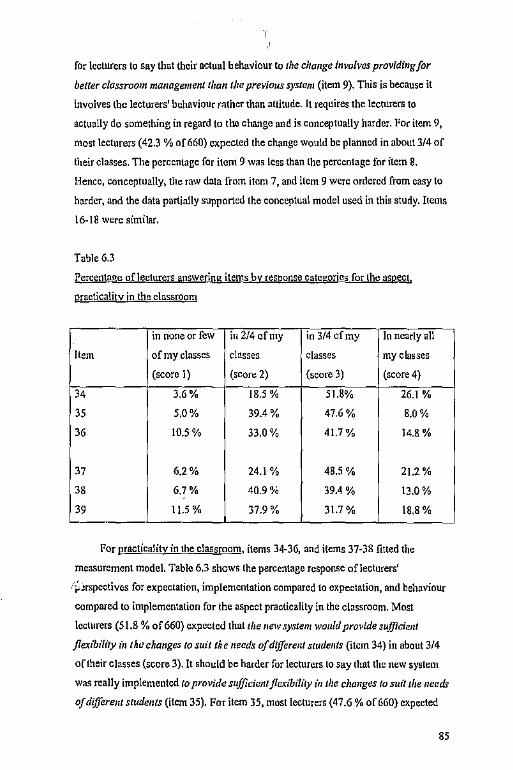
for lecturers to say that their ao::tual behaviour to the change involves providing for
better classroom ma11ogemelll tha11 the previous system (item 9). This is because it
involves the lecturers' behaviour rather than attitude. It requires the lecturers to
actually do something in regard to the change and is conceptua!ly harder. For item 9,
most lecturers (42.3 % of 660) expected the change would be planned in about 3/4 of
their classes. The percentage for item 9 was less than the percentage for item 8.
Hence, conceptually, the raw data from item 7, and item 9 were ordered from easy to
harder, aod the data partia!ly supported the conceptual model used in this study. Items
16-18 were similar.
Table6.3
Percentage of lecturers answering items by response categories for lhe aspec!,
practicality in the classroom
\n none or few iu 2/4 ofmy in 3/4 ofmy In nearly all
Item of my classes classes classes my classes
(score 1) (scar.: 2) (score 3) (score 4)
34 3.6 % 18.5 % 51.8% 26.1 %
35 5.0% 39.4% 47.6% 8.0%
36 10.5% 33.0% 41.7 % 14.8%
37 6.2% 24.l % 48.5 % 21.2 %
38 6.7% 40.9% 39.4 % 13.0%
39 11.5 % 37.9% 31.7 % 18.8%
For practica!ity in the classroom, items 34-36, and items 37-38 fitted tl1c
measurement model. Table 6.3 shows the percentage response of lecturers'
r;~rspectivcs for expectatil'n, implementation compared to expectation, and behaviour
compared to implementation for the aspect practicality in the classroom. Most
lecturers (51.8 % of660) expected that the 11ew system wrmld provide sufficient
flexibility (11 thecha11ges to sufl the needs of different s111de11ts (item 34) in about 3/4
of their classes (score 3). It should be harder for lecturers to say that the new system
was really implemented to provide sufficient flexibility in the changes to suit the needs
of different students (item 35). For item 35, most lecturers (47 .6 % of660) expected
85

that the change would be planned for about 3/4 oftl1cir classes. The percentage for
item 35 was less than the percentage fur item 34, because implementation requires
more than expectation. It should be 'harder still' for lecturers to say that their actual
behaviour to the cha11ge involves providing s1ifficie11tjlexibi/ity lo suit the 11eeds of
differe11t students (ilem 36). This is because it involves lhe lecturers' behaviour rather
than attitude. I! requires the lecturers to actually do something in regard to the change
and is conceptually harder. Foritem 36, most lecturers (41.7 % of 660) expected the
change would be planned in about 3/4 of their classes. The percentage for item 36 was
less than the percentage for item 35. Hence, conceptually, the raw data from item 34,
item 35, and item 36 were ordered from easy to harder, and lhe data supponcd the
conceptual model used in this study. Hems 37-39 were similar.
Table 6.4
Percentage of lecturers answering items by response categories for the aspect,
alleviation of concerns
in none or few in 2/4 ofmy in 3/4 ofmy In nearly all
Item ofmyclasses classes classes my classes
(score 1) (score 2) (score 3) (score 4)
40 8.0% 23.9% 48.2% 19.8 %
41 9.8% 36.7 % 45.2 % 8.3 %
42 11.5 % 36.5 % 40.8% 11.2%
43 7.3% 29.5 % 45.6% 17.6%
44 10.8% 43.3 % 37.9 % 8.0%
45 17.9% 39.\ % 36.6% 9.4%
46 7.7% 24.1 % 46.2% 22.0%
47 7.6% 37.0% 44.5% 10.9 %
48 11.1 % 38.5 % 37.9% 12.6%
'
58 6.8% 28.6% 45.3 % 19.2%
59 8.2% 40.9% 43.6% 7.3 %
60 13.9% 37.7% 37.3 % II.I%
86
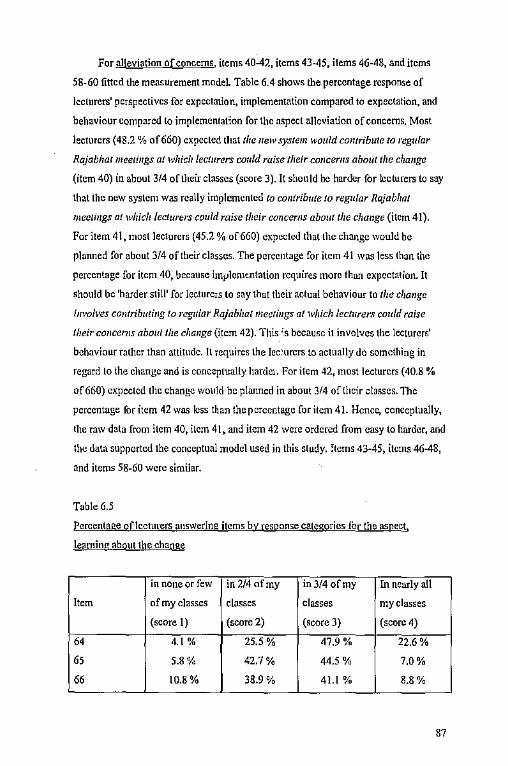
For a]!eviation of concerns, items 40-42, items 43-45, items 46-48, and items
58-60 fitted the measurement model. Table 6-4 shows the percentage response of
lecturers' perspectives for expectation, implementation compared to expectation, and
behaviour compared to implementation for the aspect alleviation of concerns. Most
lecturers (48.2 % of660) expected that the new system would comribute lo regular
Rajabhat mee1i11gs at which lecturers could raise their co11cems about t/ze change
(item 40) in about 3/4 of their classes (score 3). It should be harder for lecturers to say
that the oew system was really implemented to co11trib11te to regular Rajabhat
111ee1i11gs at which lecturers could raise their concerns about the change (item 41).
For item 41, mosl lecturers (45.2 % of660) expected that the chai1ge would be
planned for about 3/4 of their classes. The percentage for item 41 was less (ban the
percentage for item 40, because imµlcmrntation requires more than expectation. It
should be 'harder still' for lecturers to say that their actual behaviour to tlze change
involves co11tributi11g lo regu/a,· Rajabhal mee1i11gs al which lecturers could raise
their co11ce1·11s abou/ the cliange (item 42). This 's because it involves the lecturers'
behaviour rather than attitude. II requires the leciurcrs to actually do something in
regard lo the change and is conceptually lrnrdci. For item 42, most lecturers (40.8 %
of660) expected the change would be planned in about 3/4 of their classes. The
percentage for item 42 was less than the percentage for item 41. Hence, conceplually,
the raw data from item 40, ilem 41, and item 42 were ordered from easy to harder, and
the data supported the conceptual model used in this study. ':terns 43-45, items 46-48,
and items 58-60 were similar.
Table 6.5
Percentage pf lecturers answering items by response categories for the aspect,
learning about the change
in none or few in 2/4ofmy in3/4ofmy In nearly all
Item ofmyc]asses classes classes my classes
(score I) (score 2) (score)) (score 4)
64 4.1 % 25.5 % 47.9 % 22.6%
" S.8% 42.7% 44.5% 7.0%
66 10.8% 38.9% 41.1 % 8.8%
87
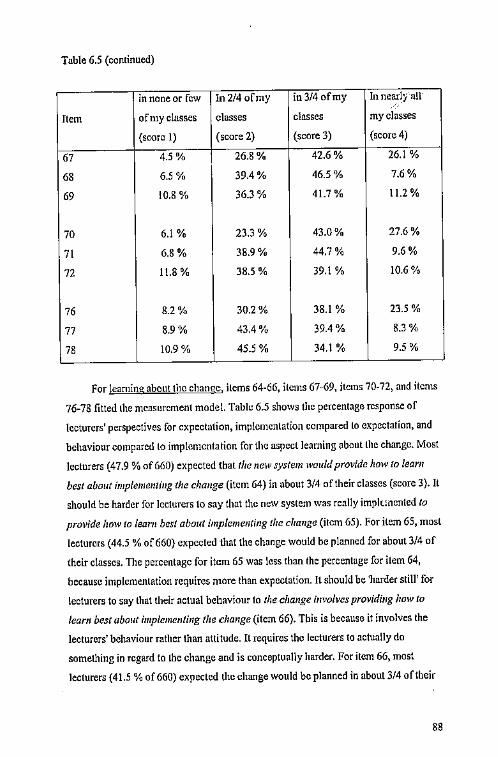
Table 6.5 (continued)
in none or fow In 2/4 ofmy in3/4 ofmy In near!/ all
Ttem ofmyclasses classes classes my classes
(score I) (score 2) {score 3) (score4)
67 4.5% 26.8% 42.6% 26.1 %
68 6.5 % 39.4 % 46.5% 7.6%
69 10.8% 36.3 % 41.7 % 11.2 %
70 6.1 % 23.3 % 43.0% 27.6%
71 6.8% 38.9% 44.7% 9.6%
72 I 1.8 % 38.5 % 39.1 % 10.6%
76 8.2% 30.2% 38.1 % 23.5 %
77 8.9% 43.4% 39.4 % 8.3%
78 10.9% 45.5 % 34.1 % 9.5%
For learning about the change, items 64-66, items 67-69, items 70-72, and items
76-78 fitted the measurement mode!. Tabk 6.5 shows the percentage response of
lecturers' perspectives for expectation, implementation compared lo expectation, and
behaviour compared lo implementation for the aspect learning about lhe change. Most
lecturers (47.9 % of660) expected that the lleW syslem would provide how to learn
best about impleme111i11g the change (item 64) in about 3/4 of their classes (score 3). It
should be harder for lecturers to say that the new system was really impkrncnted lo
provide how to learn best about impleme111i11g the change (item 65). For item 65, most
lecturers (44.5 % of660) expected that the change would be planned for about 3/4 of
their classes. The percentage for item 65 was less than the percentage for item 64,
because implementation requires more than expectation. It should be 'harder still' for
lecturers to say that their actual behaviour to t/ie change involves providing how to
lear/J best abo11/ impieme1Jti11g the change (item 66). This is because it involves the
lecturers' behaviour rather than attitude. It requires the lecturers to actua!ly do
something in regard to lhe change and is conceptually harder. For item 66, most
lecturers (41.5 % of 660) expected the change would be planned in about 3/4 of their
88
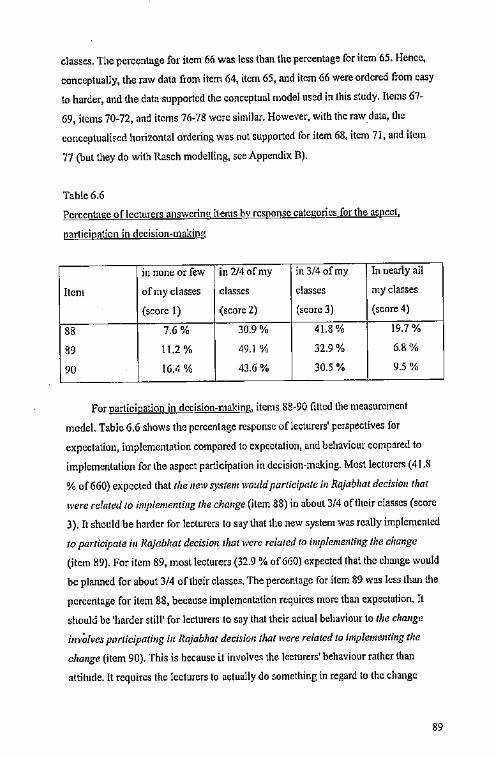
classes. The percentage for item 66 was less than the percentage for item 65. Hence,
conceptually, the raw data from item 64, item 65, and item 66 were ordered from easy
to harder, and the data supported the conceptual model used in lhis study. Items 67-
69, items 70-72, and items 76-78 were similar. However, with the raw data, the
conceptualioed horizontal ordering was not supported for item 68, item 71, and item
77 (but they do with Rasch modelling, see Appendix B).
Tab!e6.6
Percentage of lecturers answering items by response categories for the aspect,
participation in decision-making
in none or few in 2/4 ofmy in 3/4ofmy In nearly all
Item ofmydasses classes classes my classes
(score I) (score 2) (score3) (score4)
88 7.6% 30.9% 41.8 % 19.7%
89 11.2 % 49.l % 32.9 % 6.8%
90 16.4% 43.6 % 30.5 % 9.5%
For participation in decision-making, items 88-90 fitted the measurement
model. Table 6.6 shows the percentage response of lecturers' perspectives for
expectation, implementation compared to expectation, and behaviour compared to
implementation for the aspect participation in decision-making. Most lecturers (41.8
% of660) expected that the new system would participate in Rajabhat decision that
were related to i111pleme11ti11g the change (item 88) in about 314 oftl1cir classes (score
3). It should be harder for lecturers to say that the new system was really implemented
to participate ill Rajabhat decisio11 that were related lo impleme111i11g the cha11ge
(item 89). For item 89, most lecturers (32.9 % of660) expected that the change would
be planned for about 3/4 of their classes. The percentage for item 89 was less than the
percentage for item 88, because implementation requires more than expectation. It
should be 'harder still' for lecturers to say that their actual behaviour to the change
invOlves parlicipaling in Rajabhat decision that were related ta implementing the
cha11ge (item 90). This is because it involve~ the lecturers' behaviour rather than
attitude. It requires the lecturers to actually do f,omcthing in regard to the change
89
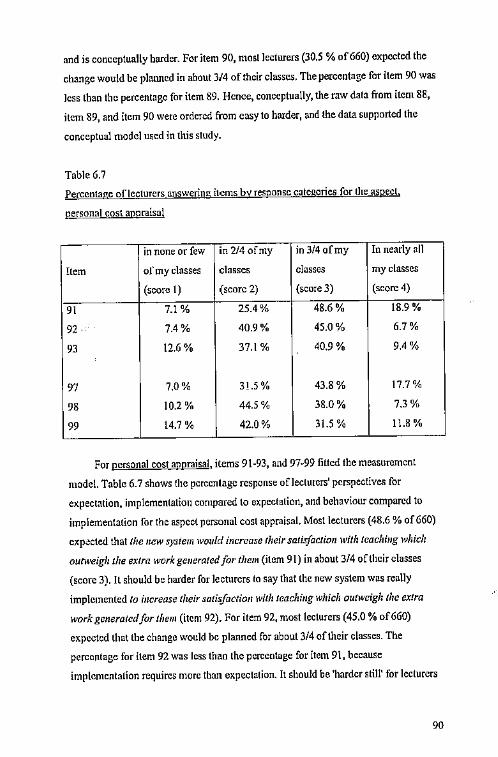
and is conceptually harder. For item 90, most lecturers (30.5 % of660) expected the
change would be planned in about 3/4 of their classes. The percentage for item 90 was
Jess than the percentage for item 89. Hence, conceptually, the raw data from item 88,
item 89, and item 90 were ordered from easy to harder, and the data supported the
conceptual model used in this study.
Table 6.7
Percentage of lecturers answering items by response categories for the aspect,
~onal cost appraisal
in none or few in 2/4 ofmy in 3/4 ofmy In nearly all
Item ofmyclasses classes classes my classes
(score I) (score 2) (score 3) (score 4)
91 7.1 % 25.4% 48.6% 18.9%
92 7.4 % 40.9% 45.0% 6.7%
93 12.6% 37.1 % 40.9 % 9.4%
97 7.0% 31.5 % 43.8% 17.7%
98 10.2% 44.5% 38.0% 7.3%
99 14.7 % 42.0% 31.S % 11.8 %
For personal cost appraisal, items 91-93, and 97-99 fitted the measurement
mode!. Table 6.7 shows the percentage response of lecturers' perspectives for
expectation, implementation compared to expectation, and behaviour compared to
implementation for the aspect personal cost appraisal. Most lecturers (48.6 % of 660)
eXp.!cted that the new system would ill crease their satisfaction with teaching which
outweigh the extra work generated for them (item 91) in about 3/4 of their classes
(score 3). It should be harder for lecturers to say that the new system was really
implemented lo increase their soti:efaction with teaching which outweigh the extra
work ge11era1edfor them (item 92). For item 92, most lecturers (45.0 % of660)
expected that the change would be planned for about 3/4 of their classes. The
percentage for item 92 was less thi:m the percentage for item 91, because
implementation requires more than expectation. It should be 'harder still' for lecturers
90
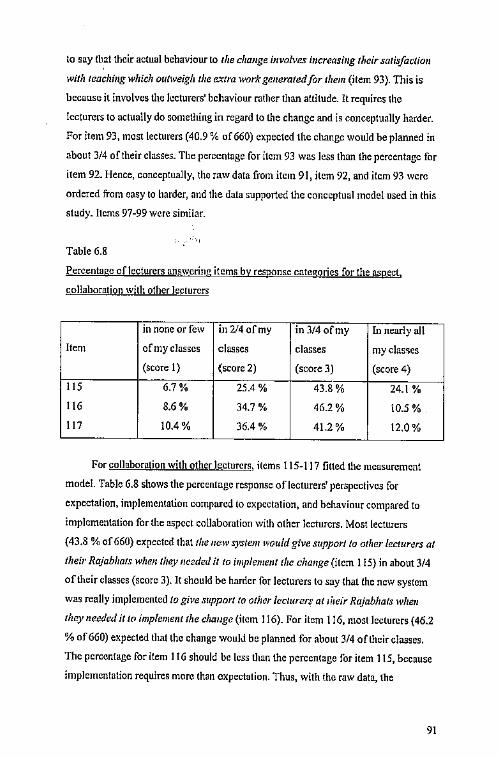
to say that their actual behaviour to the change involves increasing their satisfaction
with teaching whid1 outweigfl the extra work generated for them (item 93). This is
because it involves the lecturers' behaviour rot her than attitude. It requires the
lecturers to actually do something in regard to the change and is conceptually harder.
For item 93, most lecturers (40.9 % of660) expected the change would be planned in
about 3/4 of their classes. The percentage for item 93 was less than the percentage for
item 92. Hence, conceptually, the raw data from itc1n 91, item 92, and item 93 were
ordered from easy to harder, and the data supported the conceptual model used in this
study. Items 97-99 were similar.
Table 6.8
Percentage of lecturers answering items by response categories for the aspect,
collaboration with other lecturers
in none or few in 2/4 ofmy in 3/4 ofmy In nearly all
Item ofmyclasscs classes classes myclas~es
(score I) {score 2) (score 3) (score 4)
115 6.7% 25.4 % 43.8% 24.1 %
116 8.6% 34.7 % 46.2% 10.5%
117 10.4% 36.4 % 41.2% 12.0%
For collaboration with other lecturers, items 115-117 fitted the measurement
model. Table 6.8 shows the percentage response of lecturers' perspectives for
expectation, implementation compared to expectation, and behaviour compared to
implementation for the aspect collaboration with other lecturers. Most lecturers
(43.8 % of660) expected that the 11ew sys/em would give support lo oilier !ect11rers at
their Rajabliats when they needed ii to impleme/11 the change (item 115) in about 3/4
of their classes (score 3). It ~hould be harder for lecturers to say that the new system
was really implemented to give sr1pporl to other !eclureri al iiwir Rajabhais whe11
they 11eeded ii In implemem the cha11ge (item I 16). For item 116, most lecturers (46.2
% of660) expected that the change would be planned for about 3/4 of their classes.
The percentage for item 116 should be less than the perccn!age for item 115, because
implementation requires more than expectation. Thus, with the raw data, the
91
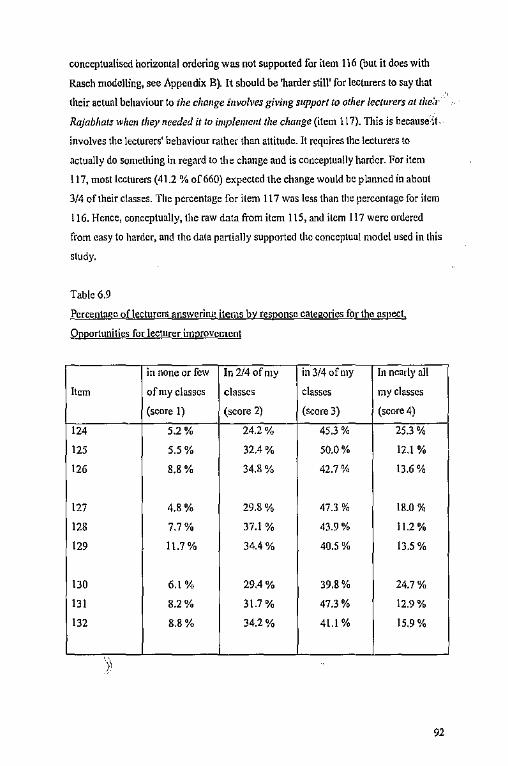
conceptualised horizontal ordering was not suppotted for item 116 (but it does with
Rasch modelling, see Appendix B). It should be 'harder still' for lecturers to say that
their actual behaviour lo the change involves givillg support to other lecturers ot tl1e;r
Rajablwls whell they 11eeded it to implement the cha11ge (item 117). This is because it.
involves the lecturers' behaviour rather than attitude. It requires the lecturers to
actually do something in regard to the change and is conceptually harder. For item
117, most lecturers (41.2 % of660) expected the change would be planned in about
3/4 of their classes. The percentage for item 117 was less than the percentage for item
! 16. Hence, conceptually, the raw data from item 115, and item 117 were ordered
from easy to harder, and the data partially supported the conceptual model used in this
study.
Table 6.9
Percentage of lecturers answering iter,1s by response categories for the aspect,
Opportunities for lecturer improvement
in none or few In 2/4 ofmy in 3/4ofmy In nearly all
Item ofmyclasses classes classes my classes
(score 1) (score 2) (score 3) (score 4)
124 5.2% 24.2% 45.3 % 25.3 %
125 5.5% 32.4 % 50.0% 12.1 %
126 8.8% 34.8% 42.7% 13.6%
127 4.8% 29.8% 47.3 % 18.0 %
128 7.7% 37.1 % 43.9% 11.2 %
129 11.7% 34.4% 40.S % 13.5%
130 6.1% 29.4% 39.8% 24.7%
131 8.2% 31.7 % 47.3% 12.9%
132 8.8% 34.2% 41.1 % 15.9%
92
, ,wwwwmzoa,so szmw1ra94!11AAW""-. ..,,, .. ,.~
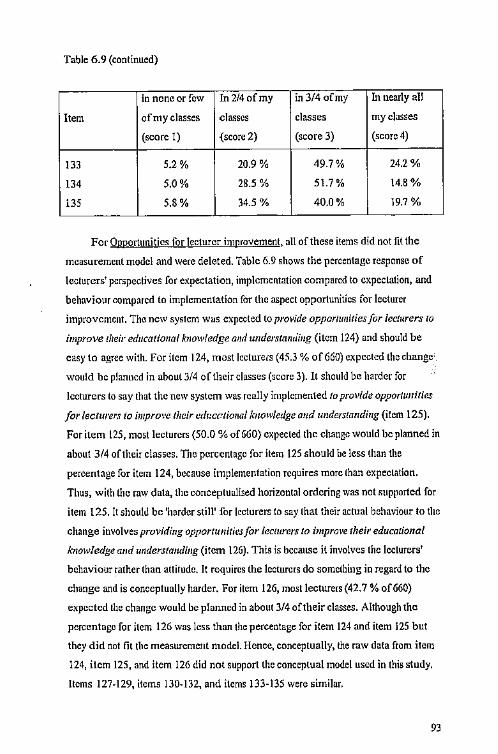
Table 6.9 (continued)
in none or few In2/4ofmy in3/4ofmy In nearly al!
Item ofmyclasses classes classes my classes
(score I) {score 2) (score 3) (score 4)
133 5.2% 20.9 % 49.7% 24.2%
134 5.0% 28.5 % 51.7 % 14.8%
135 5.8% 34.5 % 40.0% 19.7%
For Opportunities for lecturer improvement, all of these items did not fit the
measurement model and were deleted. Table 6.9 shows the percentage response of
lecturers' perspectives for expectation, implementation compared to expectation, and
behaviour compared to implementation for the aspect opportunities for lecturer
improvement. The new system wus expected to provide oppor/ul!iliesfor /ecl11rers lo
improve 1/ieir educaliona/ know/edge and u11derstamii11g (item 124) and should be
easy to agree with. For item 124, most lecturers (45.3 % of660) expected the change·
would be planned in about 3/4 of their classes (score 3). It should be harder for
lecturers to say that the new system was really implemented lo provide oppor/uuilics
for lecturers to improve their edi:cctiorial knowledge and 1111dersto11ding (item 125).
For item !25, most lecturers (50.0 % of660) expected the change would be planned in
about 3/4 of their classes. Tlie percentage for item 125 should be less than the
percentage for item 124, because implementation requires more than expectation.
Thus, with the raw data, the conceptualised horizontal ordering was not supported for
item 125. It should be 'harder still' for lecturers to say that their actual behaviour to the
change involves providing opportunities for /ec/urcrs lo improve their educolionai
knowledge a11d w1ders/011di11g (item 126). This is because it involves the lecturers'
behaviour rather than attitude. It requires the lecturers do something in regard to the
change and is conceptually harder. For item 126, most lecturers (42.7 % of660)
expected the change would be p!anncd in about 3/4 of their classes. Although the
percentage for item 126 was less than the percentage for item 124 and item 125 but
they did not fit the measurement model. Hence, conceptually, the raw data from item
124, item 125, and item 126 did not support the conceptual model used in this study.
Items 127-129, items 130-132, and items 133-135 were similar.
93
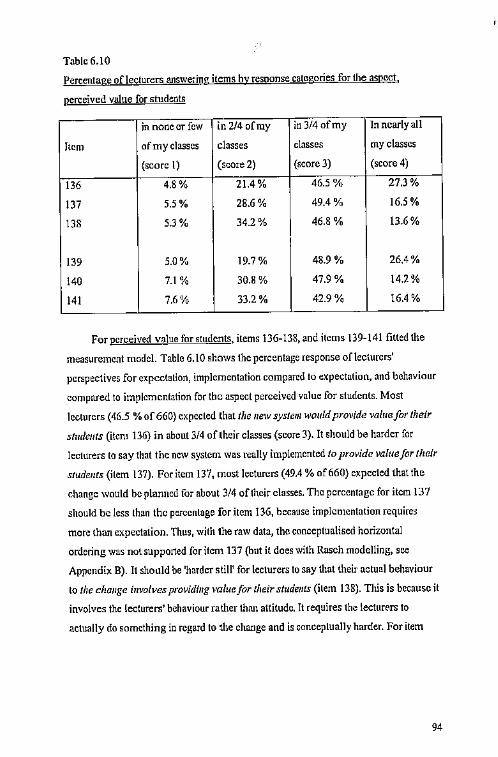
Table6.10
Percentage of lecturers answering items by response categories for the aspect,
perceived value for students
in none or few in 214 ofmy in3/4ofmy In nearly all
Item ofmyclasses classes classes my classes
(score I) (score 2) (score 3) (score 4)
136 4.8% 21.4% 46.5% 27.3 %
137 5.5% 28.6% 49.4% 16.S %
138 5.3 % 34.2% 46.8 % 13.6%
139 5.0% 19.7% 48.9% 26.4%
140 7.1 % 30.8% 47.9% 14.2%
141 7.6% 33.2% 42.9% 16.4 %
For perceived value for students, items 136-138, and items 139-141 fitted the
measurement model. Table 6.10 shows the percentage response of lecturers'
perspectives for expectation, implementation compared to expectation, and behaviour
compared to implementation for the aspect perceived value for students. Most
lecturers (46.5 % of 660) expected that the new system would provide valrmfor their
students (item 136) in about 3/4 of their classes (score 3). It should be harder for
lecturers to say that the new system was rcal!y implemented lo provide value for their
students (item 137). For item 137, most lecturers (49.4 % of660) expected that the
change would be planned for about 3/4 of their cfasses. The percentage for item 137
should be less than tho percentage for item 136, because implementation require~
more than expectation. Thus, with tho raw data, th(l conceptualised horizontal
ordering was not supported for item 137 (but it does with Rasch modelling, see
Appendix B). It should be 'harder still' for lecturers to say that their actual behaviour
to the clza11ge involves providing value for their stude/lls (item 138). This is because it
involves the lecturers' behaviour rather than attitude. It requires the lecturers to
actually do something in regard to the change and is conceplually harder. For item
94

138, most lectnn:rs (46.8 % of 660) expected the change would be planned in about
3/4 of their classes. The percentage for item 138 was less than the percentage for item
136. Hence, conecptually, the raw data from item 136, and item 137 were ordered
from easy to harder, and the data partially supported the conceptual model used in this
study. Items 139-141 were similar.
The next chapter describes the Rasch data analysis (Part 2 A)
95
CHAPTER SEVEN
DATA ANALYSIS: QUESTIONNAIRE (Part 2A)
This chapter pres~.nts the Rasch analysis results for lecturer receptivity to the
change, where all nine aspects of the educational change arc analysed together. The
presentation begins with a description of the analysis forreccptivity that is reported in
two parts: (I) initial analysis with !SO items, and (2) final analysis with 54 items.
Then, meaning oflhc receptivity scale is discussed. Following this, research questions
and hypotheses are answered.
Rasch analysis
Initial analysis with 150 items (50x3 perspectives)
Initial analysis with the RUMM program tested the 150 items (50 items
answered in three pcrspectives)3 in order lo try lo create a linear scale of\ecturer
receptivity. The item thresholds were checked so that only those items wilh ordered
tluesholds (indicating that the response categories for the item were answered
consi:;tently and logically) were included in the final analysis. After that, the residuals
were examined; the residual being the difference between the ctµectcd item score
calculated according to the Rasch measurement model and the actual item score oflhe
lecturers. This is converted to a standardized residual score in the computer program.
The probability of fit of items to the measurement model was then checked to identify
items that fitted the model. The item-trail test of fit examiues the consistency of the
item difficulties across the lecturer receptivity measures along the scale. This
detcnnines whether there was agreement among lecturers as to the difficulties of all
items along the scale. The non-perfonning items (96 items out ofl50) were deleted
from the scale, leaving only items that fitted the measurement model In traditional
measurement practice, the deletion of96 items might be considered a problem.
However, in Rasch analysis, it is the scientific thing to do. In Rasch analysis, the
96
AMJ
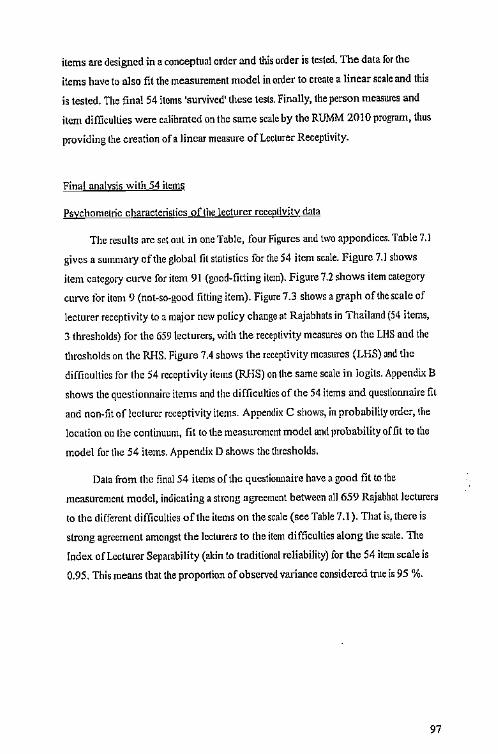
items are designed in a conceptual order and this order is tested. The data for the
items have to also fit the measurement model in order to create a linear scale and this
is tested. The final 54 items 'survived' these tests. Finally, the person measures and
itom difficulties were calibrated on the same scale by the RUMM 2010 program, thus
providing the creation ofa linear measure of Lecturer Receptivity.
Fina! analvsis with 54 items
Psychometric characteristics oft he lecturer receptivity data
The results arc set out in one Table, four Figures and two appondices. Table 7.l
gives a summary of the global fil statistics for the 54 item scale. Figure 7.1 shows
item category curve for item 91 (good-fitting item). Figure 7.2 shows item category
curve for item 9 (not-so-good fitting item). Figure 7.3 shows a graph of the scale of
lecturer receptivity to a major new policy change at Rajabhats in Thailand (54 items,
3 thresholds) for the 659 lecturers, with the receptivity measures on the LBS and the
throsholds on the RI-IS. Figure 7.4 shows the receptivity measures (LHS) and the
difficulties for lhe 54 receptivity items (RHS) on the same scale in logits. Appendix B
shows the questionnaire items and the difficulties of the 54 items and questionnaire fit
and non-fit of lecturer receptivity items. Appendix C shows, in probability order, the
location m1 lhe continuum, fit to the measurement model and probability of fit to the
model for the 54 items. Appendix D shows the thresholds.
Daln from the final 54 items of the questionnaire have a good fit to the
measurement modal, indicating a strong agreement between all 659 Rnjabhat lecturers
to the different difficulties of the items on the scale (see Table 7 .1 ). That is, there is
strong agreement amongst the lecturers to the item difficullies along the scale. The
[ndex ofLceturer Separability (akin to traditional reliability) for the 54 item scale is
0.95. This means that the proportion of observed variance considered true is 95 %.
97
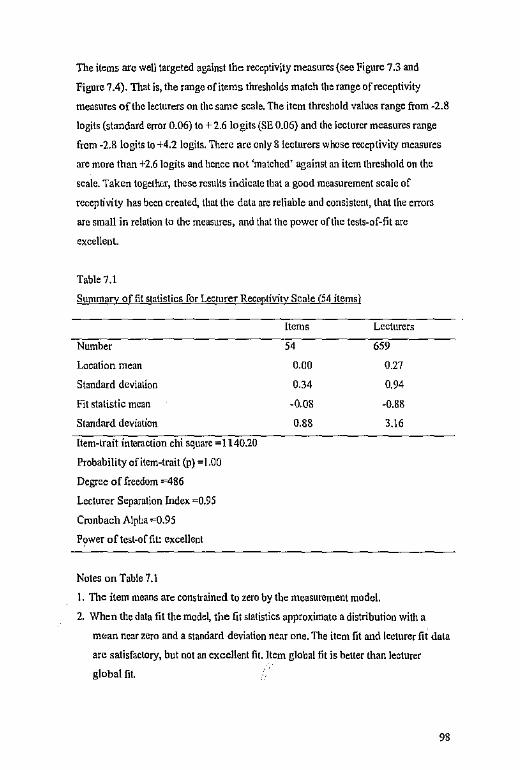
REY - -The items are well targeted against the receptivity measures {see Figure 7.3 and
Figure 7.4). That is, the range of items tluesholds match the range of receptivity
measures of the lecturers on the same scale. The item threshold values range from -2.8
logits (standard error 0.06) to+ 2.6 Jogits (SE 0.06) and the lecturer measures range
from -2.8 logits to +4.2 logits. There arc only 8 lecturers whose receptivity measures
are more than +2.6 Jogits and hence not 'matched' against an item threshold on the
scale. Taken togethc.-r, these results indicate that a good measurement scale of
receptivity has been created, that the data are reliable and consistent, that the errors
arc small in relation to the measures, and that the power of the tests-of-fit are
excellent.
Table7.l
Summary of fit statistics for Lecturer Receptivity Scale (54 items)
Number
Location mean
Standard deviation
Fit statistic mean
Standard deviation
Item-trait interaction chi square 1140.20
Probability of item-trait (p) = \ .00
Degree of freedom ==486
Lecturer Separation Index =0.95
Cronbach Alpha =0.95
P!)wer oftest-of fit: excellent
Notes on Table 7.1
Items
54
0.00
0.34
-0.08
0.88
Lecturers
659
0.27
0.94
-0.88
3.16
I. The item means are constrained to zero by the measurement model.
2. When the data fit the modei the fit statistics approximate a distribution with a
m«an near zero and a standard deviation near one. The item fit and lecturer fit data
are satisfactory, but not an excellent fit. Item global fit is better than lecturer
global fit.
98
...
3. The item-trait interaction indicates the agreement displayed with all the items
across a\\ lecturers from different locations on the scale (acceptable for these
data).
4. The Lecturer Separation Index is the proportion of observed lecturer receptivity
variance considered true (in this scale, 95% and is very high).
Ordered thresholds and response categories
Figure 7.3 is in logits, the log odds ofanswering the response categories
positively. Lecturer Receptivity measures are placed on the LHS of the scale and item
thresholds are placed on the RHS scale. Compare 8.1 refers to the threshold between
the response categories O and I for item 8; Compare 8.2 refers to the threshold
between the response categories land 2; Compare 8.3 refers to the threshold between
the response categories 2 and 3 for the same item. These thresholds are ordered:
Compare 8. ! is easiest (difficulty is -2.5 logits), Compare 8.2 is hard (difficulty is -0.5
\ogits), and Compare 8.3 is hardest (difficulty is +2.0 logits), in line with the ordering
of the response categories. Other item thresholds are labeled similarly. Generally, the
first threshold is towards the easy end oflhe scale (as expected), the second threshold
is harder, and the third threshold is harder still (as expected). This supports the
conceptual model of the response categories.
In order to determine threshold values, the RUMM 2010 program estimates the
boundaries between each pair of adjacent response categories where there are odds of
I; I of answering in either category. For an item to fit the measurement model, the
thresholds need to be ordered in line with the response categories. The threshold
values are ordered from low to high for each of the 54 items indicating that the
lecturers have answered consistently and logically, in !inc with response format used
(see Appendix D).
Item difficulties
The 54 items that fitted the measurement model consisted of eight aspects. For
each aspect, the items were conceptually ordered from easy to hard, vertically, In
99
addition, tlte perspectives for each item were also conceptually ordered from easy to
hard, horizontally (expectation, implementation, and behaviour). The results
supported the model in relation to increasing difficulty for the three perspectives for
most, but not all, items. Expectation was easy, implementation was harder, and
behaviour was harder still {sec Figure 7.4 and Tables 7.3, 7.4, 7.5, 7.6, 7.7, 7.8, 7.9,
7.10).
For example, in aspect of practicality in the classroom, most lecturers found it
easy to say that they expected the new educational system to provide s1iflicienl
jlexibiluy ro suit the needs of dif!ere11t studell/s (34PracticExp, difficulty= -0.64) It
was harder for Rajabhat lecturers lo say that the new educational system was really
implemented to provide s1!1Jicie11tjlexibilily ta suit the needs of different studellls
(35Practiclmp, difficulty= 0.05) because implementation requires more than
expectation. It was 'harder still for Rajabhat lecturers to say that their actual behaviour
to the change provided sufficient flexibility to suit the 11eeds of different students
(36PracticBeh, difficulty= +0.10) (see Figure 7.4). This is because it involves the
lecturers' behaviour rather than altitude. It requires the lecturers to actua\ly do
something in regard to the change and is conceptually harder. Hence, conceptually,
items 34, 35, and 36 are ordered from easy to hard to harder still, and the data
supported this. This horizontal ordering by perspectives holds for the other item in
practicality (see Table 7.4).
Category probability cuives
The RUMM program provides a Category Probability Curve for each item,
which makes it possible to view the ordering of the thresholds, and check whether the
category responses are being answered logically and consistently. A perusal of the
category cuives for the 54 iten:is indicates that the lecturers answered the response
categories consistently and logically, resulting in ordered thresholds. For example, in
Figure 7.1, the category response curve is shown fur the e.xcellent fitting item 91,
!11creasi11g my satisfaclio11 with teachi11g which out-weiglls the extra work ge11erated
for me.
100
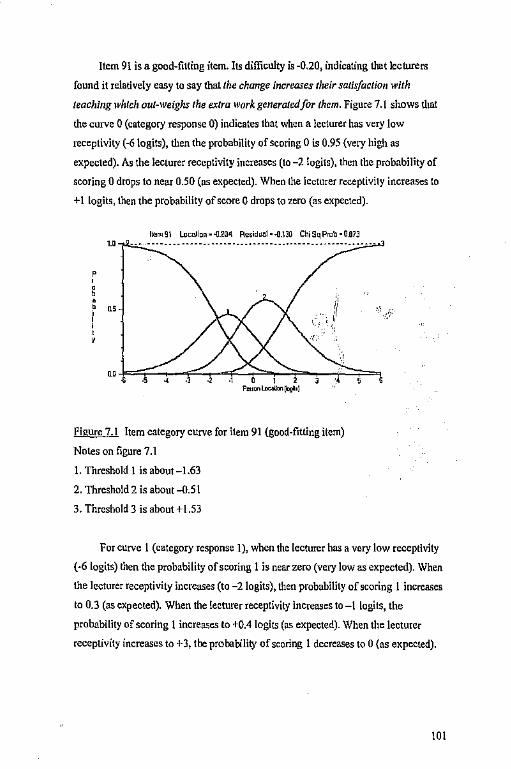
Item 91 is a good-fitting item. Its difficulty is-0.20, indicating that lecturers
found it relatively easy to say that the change increases their satisfaction with
teaching which out-weighs the extra work generated/or them. Figure 7.1 shows that
the curve O (category response 0) indicates that when a lecturer has very low
receptivity (-6 \ogits), then the probability of scoring O is 0.95 (very high as
expected). As the lecturer receptivity increases (to -2 !ogits), then the probability of
scoring O drops to near 0.50 (as expected). When the lecturer receptivity increases to
+I logits, then the probability of score O drops to zero (as expected).
ltam g\ Lornlicn • ,u_io~ Re,idoal • .0.130 Chi Sq Pmh • 0.013
e '
i,' .. ,{ ',.
·.:,
'° ~.-=•.,;::::,,-4.,F~.,, -a.,c:'.:=0;,,,..,_, .:::,,=-,,--.,, ::::'F=, P,mnl.J>c>tlonllogb]
Figure 7.1 Item category curve for item 91 (good-fitting item)
Notes on figure 7.1
1. Threshold I is about-1.63
2. Threshold 2 is about-0.51
3. Threshold 3 is about +1.53
For curve I (category response 1), when the lecturer has a very low receptivity
(-6 logits) then the probability of scoring I is near zero (very low as expected). When
the lecturer receptivity increases (to -2 logits), then probability of scoring I increases
to 0.3 (as expected). When the lecturer receptivity increases to -1 logits, the
probability of scoring I increases to +0.4 logits (as expected). When the lecturer
receptivity increases to+ 3, the probability of scoring I decreases to O (as expected).
IOI
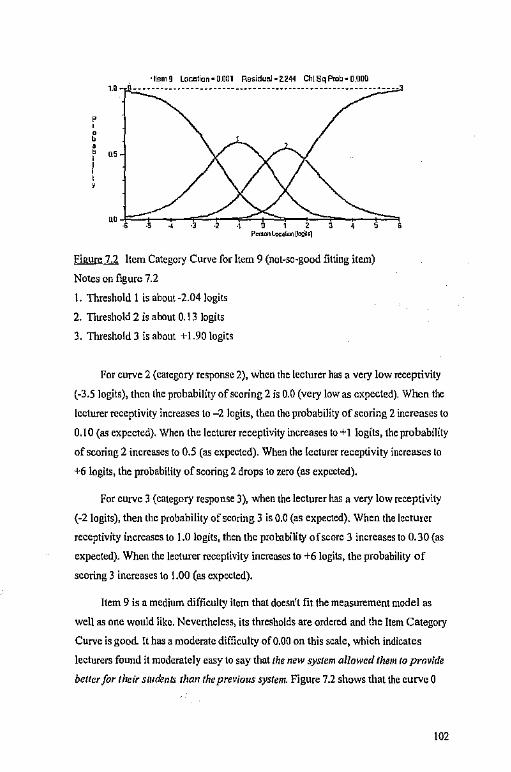
' ' 1
• 11!,m 9 Lo<:<11ion • 0.001 Ra$iduo.J • 2.244 Chl Sq Prob• o.oao to -- •••• ·-· ••••• - •••••• ·- •• ··- -- •••••••••• ·- --· ·-·-- -- • ·-·-- ••
Figure 7.2 Item Category Curve for Item 9 (not-so-good fitting item)
Notes on figure 7.2
I. Threshold I is about ·2.04 !ogits
2. Threshold 2 is about 0.13 logits
3. Threshold 3 is about +1.90 logits
For curve 2 (category response 2), when the lecturer has a very low receptivity
(-3.5 logits), then lhe probability of scoring 2 i, 0.0 (very low as expected). When the
lecturer receptivity increases to -2 Jogits, then the probability of scoring 2 increases to
0.10 (as expected). When the lecturer receptivity increases to +I iogits, the probability
of scoring 2 increases to 0.5 (as expected). When the lecturer receptivity increases to
+6 logits, the probability of scoring 2 drops to zero (as expected).
For curve 3 (category response 3), when the lecturer has a very low receptivity
(-2 logits), then the probability of scoring 3 is 0.0 (as expected). When the lecturer
receptivity increases to 1.0 logits, then the probability of score 3 increases to 0.30 {as
expected). When the lecturer receptivity increases to +6 logits, the probability of
scoring 3 increases to 1.00 (as expected).
Item 9 is a medium difficult~ item that doesn't fit the measurement model as
weli as one would like. Nevertheless, its thresholds are ordered and the Item Category
Curve is good. It has a moderate difficulty of0.00 on this scale, which indicates
lecturers found it moderately easy to say that tile new system allowed them lo provide
bell er for their s/11de11ts than the previous system. Figure 7.2 shows that the curve O
102
(category response 0) indicates that when a lecturer has a very low receptivity (-6
logits), then the probability of scoring O is 0.95 (very high as expected} As the
lecturer receptivity increases to -2 !ogits, then the probability of scoring O drops to
0.50 (as expected). When the lecturer receptivity increases to +l logits, U1en the
probability of scoring O drops to zero (as expected).
For curve I (category response 1), when the lecturer has a very !ow receptivity
(-6 logits) then the probability of scoring l is 0.05 (very low a.;.'expected). When the
lecturer receptivity increases to -2 logits, then probability of scoring 1 increases to 0.5
(as expected). When lhe lecturer receptivity increases to -1 logits, the probability of
scoring I increases to 0.6 (as expected). When the lecturer receptivity increases to +3
logits, the probability of scoring I decreases to O (as expected).
For curve 2 (category response 2), when the lecturer has a very low receptivity
(-3.5), then the probability of scoring 2 is 0.0 (very low as expected). When the
lecturer receptivity increases to -2 logits, then the probability of scoring 2 increases to
0.05 (as expected). When the lecturer receptivity increases to +I logits, the probability
of scoring 2 incr~ases to 0.58 (as e;,:pccted). When the leGturer receptivity increases to
+5.4 logits, the probability of scoring 2 drops to zero (as expected).
For curve 3 (category response 3), when the lecturer has a very low receptivity
(~2 logits), then the probability of scoring 3 is 0.0 (very low as expected). When the
lecturer receptivity increases to +l logits, then the probability of score 3 increases to
0.2 (as expected). When the lecturer receptivity increases to +(i Iogits, the probability
ofscoring 3 increases to 0.95 (as expected).
The structural model pf receptivity to change
The structure of Lecturer Receptivity was conceptualised from a model
involving nine aspects: 1) comparison with previous system; 2) practicality in the
classroom; 3) alleviation of concerns; 4) learning about the change; 5) participation in
decision-making; 6) personal cost appraisal; 7) collaboration with other lecturers; 8)
opportunity for lecturer improvement; and 9) value of the change for the students.
Three lecturer perspectives (How I expect the change lo be planned, Howl think the
change was really i111pleme11ted, a11d My actual behaviour to the change) were
103
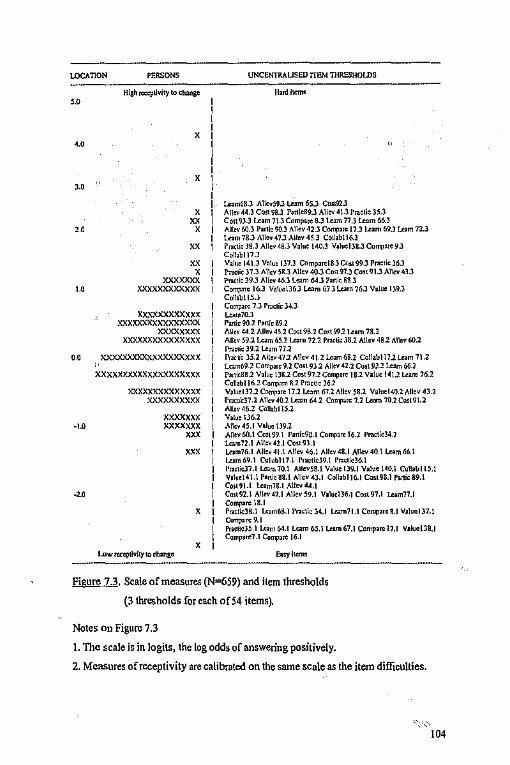
LOC.\TION PERSONS
''
' ,.,
' ,.,
' " '" ' " " ' """""" ,., xxxxxxxxxxxx
xxxxxxxxxxxx xxxxxxxxxxxxxxxx
xxxxxxxx xxxxxxxxxxxxxxx
"" xxxxxxxxxxxxxxxxxxx xxxxxxxxxxxxxxxxxxxx
xxxxxxxxxxxxxx xxxxxxxxxx
xxxxxxx -1.0 xxxxxxx
= "'"
'
I I I I
I : I
UNCENTRALISED ITEM TilRESHOlDS
11,nl IICITd
I.· Lc,,n68,) A\l<v59J Lc,m 6S.l eos,!llJ I A llov 44.l Co~ 98.l Putlc!!9.l /lllov 4\.) Praelio )'i.J
II C01t9l.l L<,m 7\J Compa,e 8J l=n n,3 L<:tm 66.l
Allov 60.l Panic 90.l Allev 42.l Colt'I''"' 17 .l l.o:>m 69.l Wm 72.l I l.<>m78.l/ll\<v41.lAllev45.l Collob\16.l I Pr,c!ie J8.J Alltv 48.3 V,lue !40.l ValuolJ8.l Colt'I',,. 9.l
Collobl17,l v,1,~ I~ l.l Volu, 137.l Compml8.l Co" 99.l Practic l6.l !'ra<oie )7.3 Allcv 'iB.J Atlov 40.l Co~ 97.J Cost 91.) /lllev 4l.l l"r.,e,ie l9J illi<V 46.l loam 64.l Panic 88.l Comp.,re 16.l Valuctl6.l L<am 67.lWm 76.l Va\oe lJ9.l Collabll5.J Compo« 1.l Prae1i, J4.l LeamlO.J r,ni, 902 r,n;, 89.l All" .;.t,2 Alie, 4'i.2 Cos! 9a.2 Co,t 992 u:,m 78.2 Allcv 592 Wm 65.2 Lc,m 72.2 Prntie JS.2 Allov 48.2 Allov 00.2 f'ractid9.2 Uom77.l Pr,cl'e JS.2 /IIIOY 47.2 Allev 41.2 l.c,m 6U Coll,bl 112 te,m 712 L<:om69.2 Comp.are 9.1 CoS! 93.2 Allev 42.2 Cos\ 91.2 Wm 66.l PankSS.2 Voluo \JS.2 Co,t 97.2 Colt'l"re 18.2 Value 14\.2 Lc,m 76.2 Coll,bl 16.:!CoITl""'~-2 Prae!ie )6.2 Voluel37.2 Comp,ro \7.l l.o:,m 67.2 Alkv 'iS.2 Valuol40.2 Alkv 4).2 r,. .. «37 .2 Alb 40.2 1.c,m 64.2 Co""'"' 7.2 Lec,n 10.2 Cosl 91.2 Allcv 46.2 Coll,bl 1S.2 v,1,. 136.2 Alie, 45.1 v,lue tl9.2 Allev 00.1 Cost 99. \ r,nic90.l Con~m<16.l Pr.>:\icl4.l 1.c,mn.1 /I\I0'14l.l Co>193.1 Lc,ml6.I Alle,41.\ All<'l 46.1 ... lk,48.1 /lllev40.\ lnmM.\ Leom 69.! Coll,bll 7.) rra,t;oJ9.\ Po,ellol6.1 l'r.o"i<ll,I Leom 70.1 Allev58.l Valoe 139.I V,lue 140.1 Collobl l5.1 v,1,.141.\ P•~i,88.l Allcv4J.I Coll,b116.I Co5l98.1 r,rti,89.! CoOl91.l t...mJi.l Allev44,1 Con92.l Allev47.I A\lev 59.1 V1l0<ll6.1 Co,!97.1 Wm77.I Compare 18.1 P010IOOJ8.l U,m6S.1 !'nelio 34.1 Lc,mll .1 Co,,-.,m !.I V,luol )l.1 Cm,parc9.I Pn<1;0J5.1 Lc,n, 64.1 1.o>m 6!i, l !.Hm 67.1 Comp,re 17.1 v,hJoll8.I c,"'1''"'7 .1 Co"I'''" 16.1
Figure 7.3. Scale of measures (N=659) and item thresholds
(3 thresholds for each of54 items).
Notes on Figure 7.3
1. The scale is in logits, the log odds of answering positively.
2. Measures of receptivity are calibrated on the same scale as the item difficulties.
104

3. Measures are ordered from !ow 1;o high on the LHS and item thresholds are ordered
easy to bard on the RHS
4. Items at the easy end of the scale are answered positively by most lecturers. As the
items become harder, lecturers need a higher receptivity to answer the items
positively.
5. Each X represents 4 Rajabhat lecturers.
6. N = 659 lecturers
7. I= 54 items
9. Compare= Comparison with previous system
10, Practice= Practicality in the classroom
l I. Allev = Alleviation of concerns
12. Learn= Learning about the change
13. Partic = Participation in decision-making
14. Cost= Personal cost appraisal
15. Col!ab = Collaboration with other lecturers
16. Value= Value of the change for the students.
l 7. Opport = Opportunities for lecturt!r improvement (These items did not fit the
model and were deleted).
conceptualised as part of model. Items on eight of these nine aspects fitted the model
of Lecturer Receptivity (opportunities for lecturer improvement did not fit the model
of Lecturer Receptivity).
The items relating to each aspect were designed in simple ordered-by-difficulty
patterns. All the item difficulties were calibrated on the same scale together so that
their difficulties in relation to one another cnn be seen (see Appendix B) and so that
the relationships between the aspects can be tested and explained. The results support
that part of the model in relation to the increasing difficulty by perspectives (How I
expect the change to be planned, Howl thi11k the cha11ge was really 1i11p/emented, and
My actual behaviour to the change), for the 54 items, that fitted the measurement
model.
105
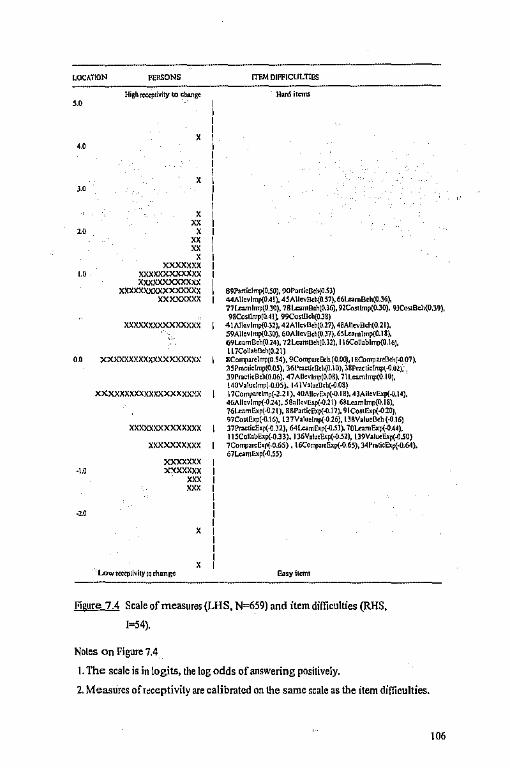
LOCATION PERSONS
,.o '
'
' " '° ' " " ' xxxxxxx l.O XXXXXXXXXX)ll(
)l)ll()OOO(Xl(X)ll(
==· ~=
ITEM OIFFICULTI6S
89Particlmp{0.50), 90Port>CBch(0.5)) 44A\lcvlmp(O A l ), 4SA \IOY!l,ch(O.S7), 661.nmBch(ll.36), 77 u,,m lmp(O .10), 7 81.camllch(0.)6), 9lCo,Ump(OJO), 9JCostBch{O .19), 9SC0S1lmp(n41i 99Costll<h[0.38)
)ll(llXXXXXXXXXXXX
0.0 )O(}(X)ll(XXXXXXXXXllX)ll(
·\,O
-2.0
XXXXXXX)ll(XXXXXXXXX.':X
llllX)ll(XXXXXXXXX
xxxxxxxxxx X>OOOOO<
=" "'" "'
'
41,',.llovlmp(O.)l), 42A IIOY!leh(O.l7148AIIOY llch(0.21 ), ~9A\lovlmp(0.JO), 60A1IOY!l,ch(O.l7), 6SL<am lmp(0.18), 6'1l.cam8ch(O.l4), 121.camO,h[O.ll), I 16CoTiablmm0.\6), l l 7Collablleh(Oll) ~Ca"V'!rtlmp(0.54), 9Comp:rn:Elch(O.QO), I 8Comp'11ell<h[.0.07), JSP,nc,klmp(ll.05), J6l'racti,B,l~O.\O), l8P,o,:tidmpl.0.0l),', J9Pmli<ll<MO.CHi), 47Allevlmp(0.08), 7\l.camlmp(O 10), \40V,lu<lmp(--O.OSJ. 14 \ v,1,.n,h(.0~8) \ 7Camp,r< lrnp( -2.2 I ), 40Allevrc,I"( .0.18), 4 lAllevExp( .0.14), 4fu\llevl mp( ,I) .14 ), S 8alkvE<p( .O .l \ ) 6aL<:tm lmp(0.18), 76L<:tmExp(--OJI ), aar,rtior;:,:f!(--O.l 7J, 91CwExp(.(l.l0), 97Cos!Exp(-0.\6), D7Valoel~--0 26), \l8Valoe0<h (-0.16) l7PraccicE,p(.(l.)2), 64Lam!:•f!(-0.5)), 70I.<>mExp(.(IA4), 1 lSCollobExp(-O.Jl), J J6ValoeE,p(.0.5l), ll9V•lueExp(.0.50) 7Co~an:E,r,(,0.6S) , !6C0"1"r<Exp(--0.6!i), 34~ra<icfap(.0.64). 67Lea"'E>.p(.0.SS)
Figure 7.4 Scale of measures (LHS, N.=659) and item difficulties (RHS,
1"'54).
Noles on Figure 7.4
I. The scale is in !ogits, the log odds of answering positively.
2. Measures of receptivity are calibrated on the same scale as the item difficulties.
106
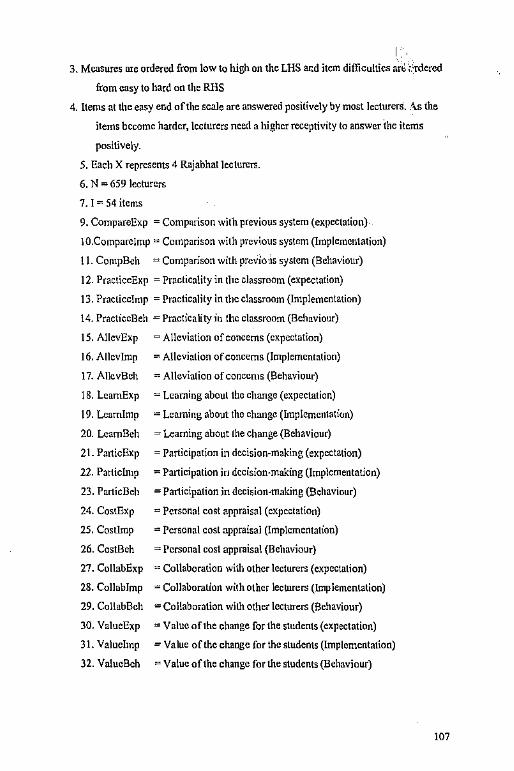
3. Measures are ordered from low to high on the LHS ar:d item difficulties art> ';.'rdered
from easy to hard on the RBS
4. Items at the easy end of the scale are answered positively by most lecturers .. \s the
items become harder, lecturers need a higher receptivity to answer lhc items
positively.
5. Each X represents 4 Rajabhat lecturers.
6. N = 659 lecturers
7. I= 54 items
9. CompareExp = Comparison with previous system (expectation)
10.Comparclmp = Comparison with previous system (Implementation)
I I. Con1pBch = Comparison with prcviO'ls system (Behaviour)
12. PracticcExp = Practicality in the classroom (expectation)
13. Praclicelmp = Practicality in the classroom (Implementation)
14. PracticeBeh = Practicality iii the classroom (Behaviour)
15. A!levExp = Alleviation nfconcems (expectation)
16. Allevlmp = Alleviation of concerns (Implementation)
17. AllevBeh = Alleviation of concerns (Behaviour)
18. LcamExp = Leaming about the change (expectation)
19. Lcamlmp = Leaming about the change (bnplcmentation)
20. LcamBeh = Leaming about lhe change (Behaviour)
21. ParticExp = Participation in decision-making (expectation)
22. Particlmp = Participation in decision-making (Implementation)
23. ParticBeh = Participation in decision-making (Behaviour)
24. CostExp = Personal cost appraisal (expectation}
25. Costlmp = Personal cost appraisal (Implementation)
26. CostBeh =< Personal cost appraisal (Behaviour)
27. CollabExp = Collaboration wilh other lecturers (expectation)
28. Collablmp = Collaboration with other lecturers (Implementation)
29. Col!nbBch = Collaboration with other lecturers (Behaviour)
30. ValucExp = Value of the change for the students (expectation)
31. Valuclmp = Value of the change for the students (Implementation)
32. Va\ucBeh = Value oft he change for the students (Behaviour)
,w,www+a u
107
The items have been designed to have a conceptual ordering horizontally in the
questionnaire, by perspectives. For example, the 11ew system was expected lo provide
/or sufficient resources tu allow /hem lo imp/eme11/ 1.'1e change in their classrooms
(item 37) should be easy to agree with. It should be harder for a Rajabhat lecturer to
say that the new system was really implemented lo provide for srif]icient resources to
a/law them ta implement the c/u:mge i11 their classrooms (item 38) because
implementation requires more than expectation. It should be harder still for Rajabhal
lecturers to say that rheir aclrm/ behaviour to the cha11ge involved heller provision/or
s1if]icie11/ resources 10 allow them to impleme11t the change ill their classrooms
(item39). This is because it involves the !eclurers' behaviour rather than attitude. It
requires the lecturers to actually do something in regard to the change and is
conceptually harder. Hence, conceptually, items 37, 38 and 39 arc ordered from easy
to hard to harder still. The difficulty of item 37 is -0.32, item 38 is -0.02, and then
item 39 is +0.06, and so the data support the conceptual ordering for these items. On
the other hand, there were some items where horizontal ordering was not supported,
such as items 7, 8, and 9, items 40, 41, and 42, and items 97, 98 and 99, but these
ikms still fitted the measurement model.
Comments on the scale ofreccptMcy
Equal differences on the sca!e between the measures of Lecturer Receptivity
represent equal differences in item difficulty. However, there is no true zero point of
item difficulty, or Lecturer Receptivity, and the scale is thus at the interval level. The
54 items of the scale are ordered from easy to hard (see figures 7.3 and 7.4). Nearly
all lecturers answered the easy items positively for all their aspects (for exumple,
items 16, 7, 34, 67, 64, 136, 142, 70, 115). As the item difficulties become positively
higher on the scale, the lecturers neetl a corresponding higher receptivity measure to
answer them positively. The hardest items are only answered positively by lecturers
who have high receptivity measures (for example, items 45, 90, 89, 98, 44, 93, 99,
60). Lecturers with low measures ofLceturer Receptivity cannot answer these
'difficult' items positively for all their aspects.
108
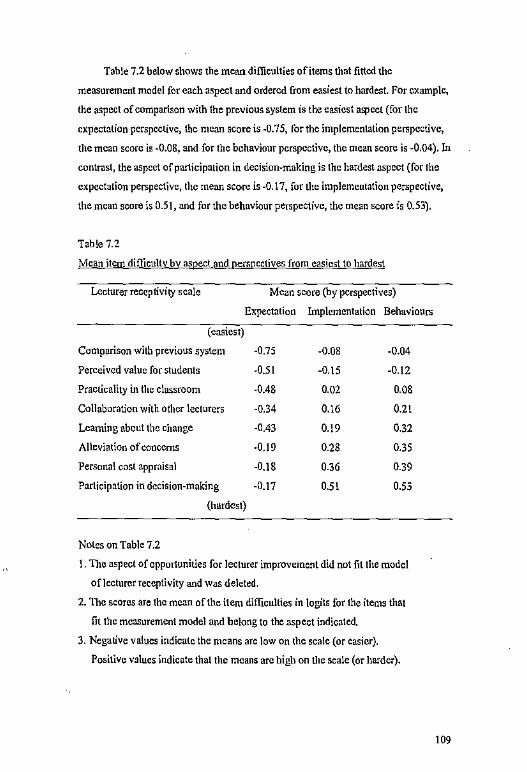
., smc,
Table 7.2 below shows the mean difficulties of items that fitted the
measurement model for each aspect and ordered from easiest to hardest. For example,
the aspect of comparison with the previous system is the easiest aspect (for the
expectation perspective, the mean score is -0.75, for the implementation perspective,
the mean score is -0.08, and for the behaviour perspective, the mean score is -0.04). In
con trust, the aspect of participation in decision-making is the hardest aspect (for the
expectation perspective, the mean score is -0.17, for the implementation perspective,
the mean score is 0.5\, and for the behaviour perspective, the mean score is 0.53).
Table 7.2
Mean item difficulty by aspect and perspectives from easiest to hardest
Lecturer receptivity scale Mean score (by perspectives)
Expectation Implementation Behaviours
(easiest)
Comparison with previous system -0.75 -0.08 -0.04
Perceived value for students -0.51 -0.\5 -0.12
Practicality in the classroom -0.48 0.02 0.08
Collaboration with other lecturers -0.34 0.16 0.21
Leaming about the change -0.43 0.\9 0.32
AJ\eviation of concerns -0.19 0.28 0.35
Personal cost appraisal -0.18 0.36 0.39
Participation in decision-making -0.17 0.51 0.53
(hardest)
Noles on Table 7.2
I. The aspect of opportunities for lecturer improvement did not fit the model
of lecturer receptivity and was deleted.
2. The scores are the mean of the item difficulties in logils for the items that
fit the measurement model and belong to the aspect indicated.
3. Negative values indicate the means are low on the scale (or easier).
Positive vslues indicate that the means are high on the scale (or harder).
109
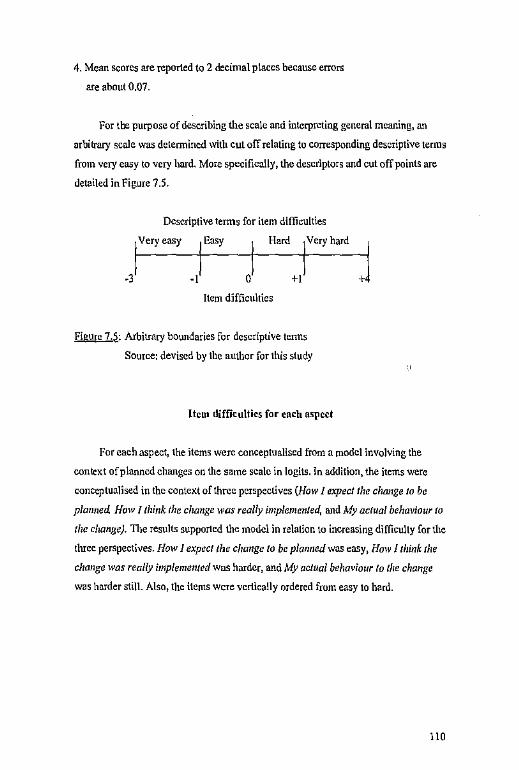
IF MC%?
4. Mean scores are reported to 2 decimal places because errors
are about 0.07.
For the purpose of describing the scale and interpreting general meaning, an
arbitrary scale was detennined with cut off relating to corresponding descriptive tcnns
from very easy to very hard. More specifically, the descriptors and cut off points are
detailed in Figure 7.5.
Descriptive tenns for item difficulties
.3
!Very easy
Item difficulties
Figure 7.~: Arbitrary boundaries for descriptive tenns
Source: devised by the author for this study
Item difficulties for each aspect
For each aspect, the items were conceptualised from a model involving the
context of planned changes ou the same scale in \ogits. ln addition, the items were
conceptualised in the coutcxt of three perspectives (How I expect the change lo be
planned. Howl tlzink !he change was really implemented, and My aclua/ behaviour to
the change). TI1e results supported the model in relation to increasing difficulty for the
three perspectives. How I expect the change lo be planned was easy, How I think 1he
change was really implemell/ed was harder, and My actual behaviour lo the change
WllS harder still. Also, the items were vcrtica!ly ordered from easy to hard.
110
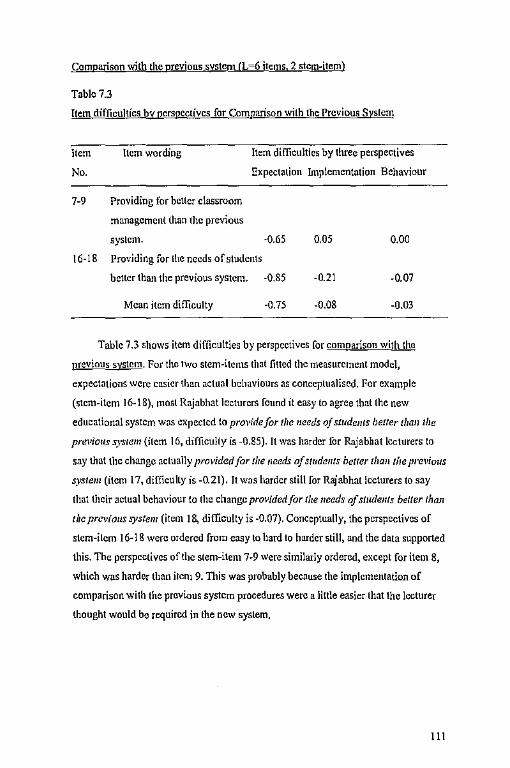
Comparison with the previous system (L=6 items, 2 stem-item)
Table 7.3
Item difficulties by perspectives for Comparison with the Previous System
Jtem
No.
7-9
16-18
Item wording
Providing for better classroom
management than the previous
system.
item difficulties by three perspectives
Expectation Implementation Behaviour
-0.65 0.05 0.00
Providing for the needs of students
better than the previous system. -0.85 -0.21 -0.07
Mean item difficulty -0.75 -0.08 -0.03
Table 7.3 shows item difficulties by perspectives for comparison with the
previous system. For the 1wo stem-items that fitted the measurement model,
expectations were easier than actual behaviours as conceptualised. For example
(stem-item 16-18), mos( Rajabhat lecturers found it easy to agree that the new
educational system was expected to provide for the needs of st11de11ts bell er t/ia11 /he
previor1s sys/em (item 16, difficuHy is -0.85). It was harder for Rajabhat lecturers to
say that the change actually provided for tlte 11eeds of students bell er th,m the previous
system (item 17, difficulty is -0.21). It was harder still for R.ajabhat lecturers to say
that their actual behaviour to the change provided for the needs of st11de11/s bell er lhan
the previous system (item 18, difficulty is -0.07). Conceptually, the perspectives of
stcm-ilcm 16-18 were ordered from easy to hard to harder still, and the data supported
this. The perspectives of the stem-item 7-9 were similarly ordered, except for item 8,
which was harder than itc111 9. This was probably because the implementation of
comparison with the previous system procedures were a little easier that the lecturer
thought would be required in the new system.
Ill
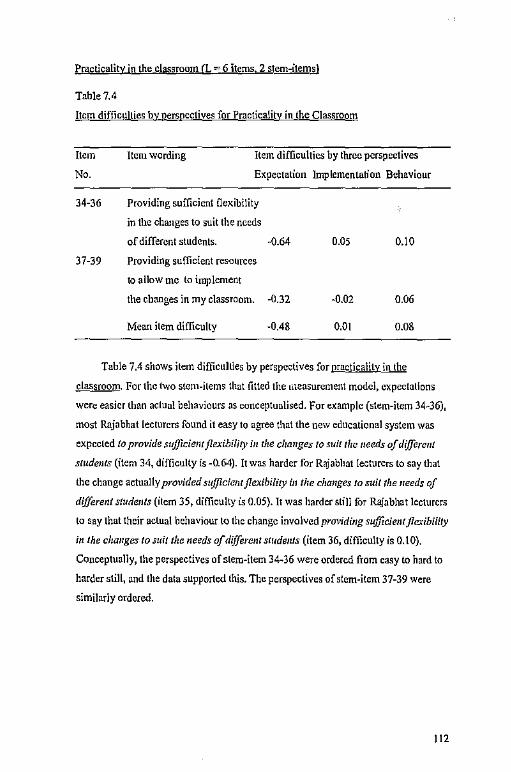
•••
Practicality in the classroom (L- 6 items, 2 stem-items)
Table7.4
Item diffieu]lies by perspectives for Practicality in the Classroom
Item
No.
Item wording Item difficulties by three perspectives
Expectation lrnplementation Behaviour
34-36 Providing sufficient flexibility
in the changes to suit the needs
of different students.
37-39 Providing sufficient resources
toallowme to implement
-0.64
the changes in my classroom. -0.32
Mean item difficulty -0.48
0.05 0.10
-0.02 0.06
0.01 0.08
Table 7.4 shows item difficulties by perspectives for practicality in the
classroom. For the two stem-items that fitted the ,neasurement model, expectations
were easier than actual behaviours as conceptualised. For example (stem-item 34-36),
most Rajabhat lecturers found it easy to agree that the new educational system was
expected lo provide sufficie111jlexibility in the changes to s11il the needs of diflere11/
stude1ils (item 34, difficulty is -0.64). It was harder for Raj ab hat lecturers to say that
the change actually provided sufficie1itjlexibility in the changes to suit lhe needs of
diflerent students (item 35, difficulty is 0.05). It was harder still for Rajabhat lecturers
to say that their aclua\ behaviour to the change involved providing sufficiellljlexibility
in the changes to suit the needs of diflerent str1de/Zls (item 36, difficulty is 0.10).
Conceptually, the perspectives of stem-item 34-36 were ordered from easy to hard to
harder still, and the data supported this. The perspectives of stem-item 37-39 were
similarly ordered.
112
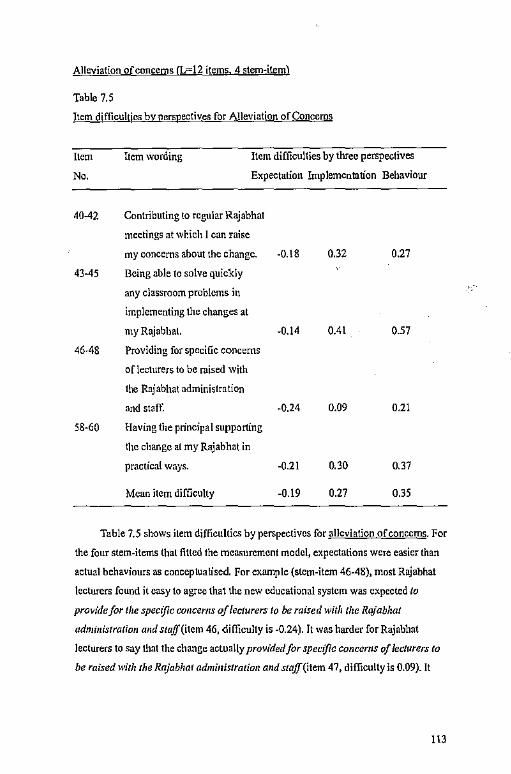
Alleviation of concerns (L--12 items, 4 stem-item)
Table 7.5
Item difficulties by perspectives for AJleviation ofConcems
Item Item wording Item difficulties by three perspectives
Ne. Expectation Implementation Behaviour
40-42 Contributing to regular Rajabhat
meetings at wr.ich I can raise
my concerns about the change. -0.18 0.32 0.27
43-45 Being able to solve quickly
any classroom prob!oms iu
implementing the changes at
myRajabhal. -0.14 0.41 0.57
46-48 Providing for specific concerns
oflccturers to be raised with
the Rajabhat administration
and staff. -0.24 0.09 0.21
58-60 Having the principal supporting
the change al my Raj ab hat in
practical ways. -0.21 0.30 0.37
Mean item difficulty -0.19 0.27 0.35
Table 7.5 shows item difficulties by perspectives for alleviation of concerns. For
the four stem-items thal fitted the measurement model, expectations were easier than
actual behaviours as conceptualised. For example (stem-item 46-48), most Rajabhat
lecturers found it easy to agree that the new educational system was expected lo
provide/or the specific concerns of lecturers lo be raised with the Rajabhat
admi11istrali011 mid staff(ilem 46, difficulty is -0.24). It was harder for Rajabhat
lecturers to say that the change actually provided/or specific concertis of lectrirers to
be raised with the Rajabhat admi11istratio11 arid staff(item 47, difficulty is 0.09). It
113
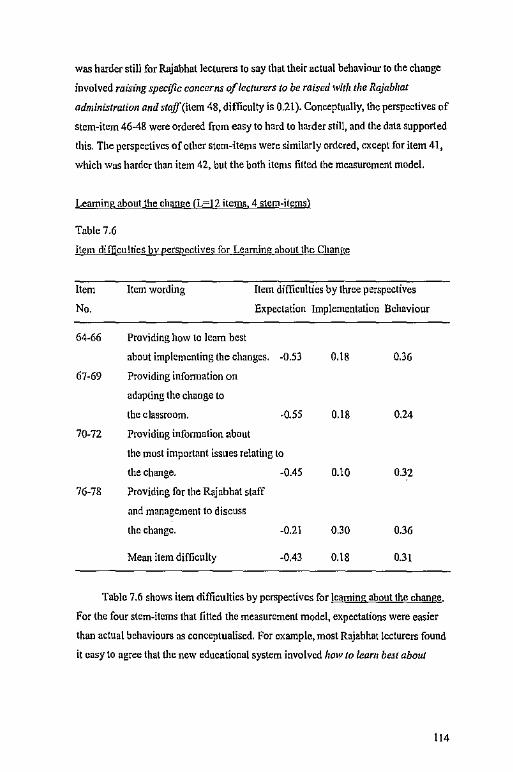
was harder still for Rajabhat lecturers lo say that their actual behaviour to the change
involved raising specific concerns of lecturers to be raised witlz tlze Rajabllat
administration and staff (item 48, difficulty is 0.21). Conceptually, the perspectives of
stem-item 46-48 were ordered from easy to hard to harder still, and the data supported
this. The perspectives of other stem-items were similarly ordered, except for item 41,
which was harder than item 42, but the both items filled the measurement model.
Leaming about the change (L=)2 items, 4 stem-items)
Table 7.6
Item difficulties by perspectives for Leaming about the Change
Item Item wording Item difficulties by three perspectives
No. Expectation Implementation Behaviour
64-66 Providing how to learn best
about implementing the changes. -0.53
67-69 Providing infom1ation on
adapting the change to
the classroom.
70-72 Providing infonnation about
-0.55
the most important issues relating to
the change. -0.45
76-78 Providing for the Rajubhat staff
and management to discuss
the change. -0.21
Mean item difficulty -0.43
0.18 0.36
0.18 0.24
0.10 0.32
0.30 0.36
0.18 0.31
Table 7.6 shows item difficulties by perspectives for \earning about the change.
For the four stem-items that fitted the measurement model, expectations were easier
than actual behaviours as conceptualised. For example, most Ra jab hat lecturers found
it easy to agree that the new educational system involved how to learn best about
114
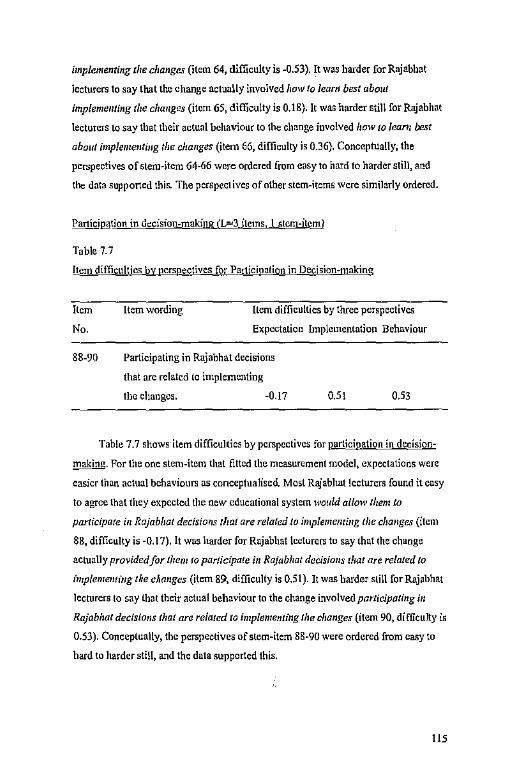
=
implementing the changes (item 64, difficulty is -0.53). It was harder for Rajabhat
lecturers to say that the change actually involved how lo learn best about
implemell/i11g the changes (item 65, difficulty is 0.18). It was harder still for Raj ab hat
lecturers to say that their actual behaviour to the change involved how to /eam best
about implementiug Ifie changes (item 66, difficulty is 0.36). Conceptually, the
perspectives of stem-item 64-66 were ordered from easy to hard to harder still, and
the data supported this. The perspectives of other stem-items Were similarly ordered.
Particimition in d~cision-making (1?3 items, I 5tcm-it,;:m)
Table 7.7
Item difficulties bY perspectives for Participation in Decision-making
Item Item wording Item difficulties by three perspectives
No. Expectation Implementation Behaviour
88-90 Participating in Raj ab hat decisions
that are related to implementing
the changes. -0.17 0.51 0.53
Table 7.7 shows item difficulties by perspectives for participation in decision
making. For the one stem-item that fitted the measurement model, expectations were
easier than actual behaviours as conceptualised. Most RaJabhat lecturers found it easy
to agree that they expected the new educational system wo1ild allow them to
participate ill Rajabfwt decisiorrs that are related to implementing the changes (item
88, difficulty is -0.17). It was harder for Rajabhal lecturers to say that the change
actually provided for them to porlicipote in Rajabhat decisions that are related to
imp/ememi11g the changes (item 89, difficulty is 0.51). It was harder still for Raj ab hat
lecturers to say that their actual behaviour to the change involved participating in
Rajobhat decisions that are related lo implementing the changes (item 90, difficulty is
0.53). Conceptually, the perspectives of stem-item 88-90 were ordered from easy to
hard to harder sti!l, and the data supported this.
115
. ~, -· .-. __
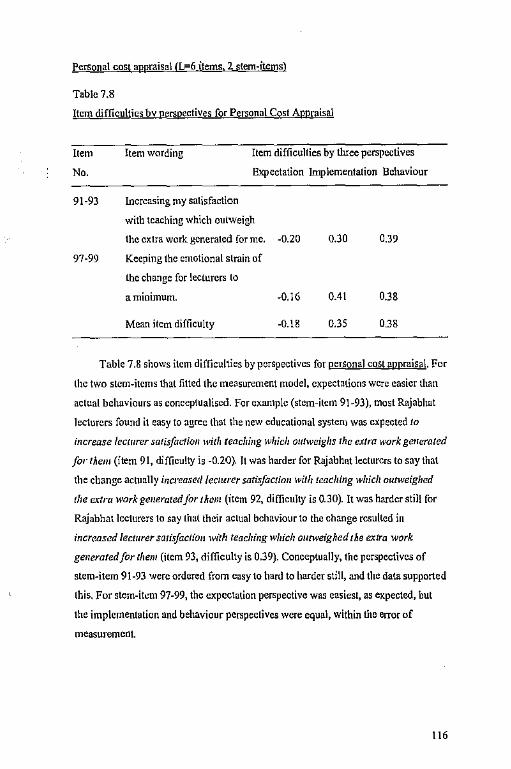
... , ...... .
Personal cost appraisal (L=6 items, 2 stem-itemfil
Table 7.8
Item difficulties by perspectives for Personal Cost Appraisal
Item
No.
91-93
97-99
Item wording Item difficulties by three perspectives
Expectation Implementation Behaviour
Increasing my sali,faclion
with teaching which outweigh
the extra work generated for me. -0.20 0.30 0.39
Keeping the emotional strain of
the change for lecturers to
a minimum. -0.16 0.41 0.38
Mean item difficulty -0.18 0.35 0.38
Table 7.8 shows item difficulties by perspectives for personal cost appraisal. For
the two stem-items that fitted the measurement model, expectations were easier than
actual behaviours as conceptualised. For cxan1plc (stem-item 91-93), most Rajabhat
lecturers found it easy to agree that the new educational system was expected lo
increase /ecwrcr satisfaclio11 wit Ii teaching which outweighs /he extra work generated
for tkm (item 91, difficulty is -0.20). It was harder for Rajabh11t lecturers to say that
the change actually increasc1/ leclurcr satisfac/io11 with teachillg which ar1tweighcd
the extra work generated for them (item 92, difficulty is 0.30). It was harder still for
Raj ab hat lecturers to say that their actual behaviour to the change resulted in
increased lecturer satisfaclian w11h teaching which outweighed the cx!ra work
generated for them (item 93, difficulty is 0.39). Conceptually, the perspectives of
stem-item 91-93 were ordered from easy to hard to harder still, and the data supported
this. For stcm-itc.111 97-99, the expectation perspective was easiest, as CKpected, but
the implementation and behaviour perspectives were equal, within the error of
measurement.
116
_ ........... .,

. --
Collaboration with other lecturers (1?=3 items, I stem-item}
Table 7.9
Item difficu\jics by pyrspectivcs for Collaboration with Other Lecturers
Item Item wording Item difficulties by three perspectives
No. Expectation Implementation Behaviour
115-117 Giving support to other lecturers
at my Rajabhat when they need it
to implement lhe change. -0.34 O.IG 0.21
Table 7.9 ~hows item difficulties by perspectives for collaboration with other
\ccturers. For the one stem·itcm that fitted the measurement model, expectations were
easier than actual behaviours as coticeptualised. Most Rajabhat lecturers found it easy
to agree that they expected the new educational system to give support lo other
leclurers al their Rojabhats whe11 they ,wed it to implemem the change (item 115,
difficulty is -0.34). It was harder for Rajabhat lecturers to say that the change actually
gave support to other iecwrers at 1heir Rajabhats whe111/zey needed ii lo impleme/11
the dange (item 116, difficulty is 0.16). It was harder still for Rajabhat lecturers to
say that their actual behaviour to the change involved giving support to other
lecturers at their Rajabhars when /Irey needed ii to implement /he change (item 117,
difficulty is 0.21). Conceptually, the perspectives of stem-item 115-117 were ordered
from easy to hard to harder still, aod the data supported this.
Opportunities for lecturer improvement
No items fitted the measurement model with the other items.
ll7
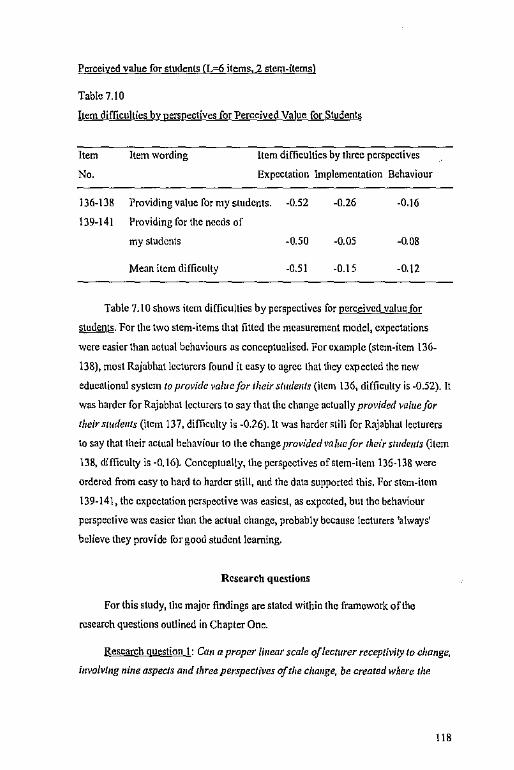
• 77
Pcrceiyed value for students (L=6 items, 2 stem-items}
Table 7.10
Item difficulties by perspectives for Perceived Value for Students
Item
No.
136-138
139-141
Item wording Item difficulties by three perspectives
Expectation hnplementation Behaviour
Providing value for my students. -0.52 -0.26 -0.16
Providing for the needs of
my students -0.50 -0.05 -0.08
Mean item diffk.ulty -0.51 -0.15 -0.\2
Table 7.10 shows item difficulties by perspectives for perceived value for
students. For the two stem-items that fitted the measurement model, expectations
were easier than actual behaviours as conceptualised. For example (stem-item 136-
138), most Rajabhat lecturers found it easy to agree that they expected the new
educational system to provide value for their sl111le11/s (ilen1 136, difficulty is -0.52). It
was harder for Rajablrnt lecturers to say that the change actually provided value for
their s111de11ts (item 137, difficulty is -0.26). It was harder still for Raj ab hat lecturers
lo say that their actual behaviour to the change providedvaliiefor rheir st11de11/s (item
138, difficulty is -0.16). Conceptually, the perspectives of stem-item 136-138 were
ordered from easy to hard to harder still, nnd the data supported this. For stem-item
139-141, the expectation perspective was easiest, as expected, but the behaviour
perspective was easier than the actual change, probably because lecturers 'always'
believe they provide for good studeot leaming.
Research questions
For this study, the major findings are stated within the framework of the
research questions outlined in Chapter One.
Research question I: Can a proper linear scale of lec111rer receptivity to change,
illvolvt11g nine aspects mid three perspectives of the change, be created where the
118
reuptivity measures are calibrated on the same scale as tke item difficulties, using a
new Rasch computer program?
Yes, a proper linear scale of lecturer receptivity to change was created where
the receptivity measures were calibrated on the same scale as the item difficulties,
using a new Rasch computer program. But only eight aspects (out of nine} and 54
items (out of 150) fitted the measurement model. The aspect of opportunities for
lecturer improvement did not fit the measurement mode!.
Research question 3: Qm the linear receptivity scale be used lo illlerpre/ the
expectario11s am/ /Jeliaviour)' of Rajab/lat focturers lo the chauge?
Yes, the linear receptivity scale could be used to interpret the expectations and
behaviours ofRajabhat lecturers to the change. Generally, how lecturers expected the
change to be planned was easy, how they thought it really was implemented was
harder, and their actual behaviours in relation to the change were harder still, although
there were some exceptions, especially where the lal\er two perspectives were equal
within the measurement error.
For eight out of nine aspects that filled the model of lecturer receptivity, the
aspect of comparison with the previous system was the easiest and the aspect of
participation in decision-making was the hardest.
The relevant hypotheses
The major findings arc stated within the framework of the relevant hypotheses.
Hypothesis I: Lecl11rers are able /o answer the items 1iJ t/ie crmceptua/iy
ordered-by difficulty pall ems tha1 //icy were desig11edfor tlte nine as peels.
It was found that 96 items out of 150 did not fit the measurement model and so
their difficulty patterns, as initially conceptualised, were not supported. Generally,
lecturers answered the items in tile conceptua\ly ordered-by difficu\ly patterns for the
other 54 items. A major finding of this study was lhat for 8 aspects (out of9) and for
54 items (out of 150} there was good, but not total support for the conceptualised
model ofreccptivity. Only one aspect of\ecture receptivity (opportunities for lecturer
improvcme,11) could not be ordered by difficulty patterns or fit into the conceptual
structure, of lecturer receptivity to the change.
119
Summary
This chapter has described the process of data analysis for the model of lecturer
receptivity, initially with 150 items, but reduced to 54 items that fitted the
measurement model. A Rasch measurement model computer program was used to
create a linear scale of Lecturer Receptivity to the change, for 54 items and 659
lecturers. Lecturer measures were calibrated from low to high receptivity on the same
scale as the item dirficultics were calibrated from easy to hard. The 54 items consisted
of: (1) six items measuring receptivity compared with the previous system, (2) six
items measuring receptivity in the classroom, (3) twelve items measuring alleviation
of concerns, (4) twelve items measuring !earning about the change, (5) three items
measuring participation in decision-making, (6) six items measuring personal cost
appraisal of the change, (7) three items measuring collaboration with other lecturers,
and (8) six items measuring perceived value for students.
The 54 items were each influenced by a single trait, Lecturer Receptivity to the
Change. The perspectives for each item were ordered from easy (How I expected rhe
chm1ge /o be pl aimed), to harder (How I think the change was really imp/emc11tcd),
and to harder still (My acwal be/iavio11r to the clta11ge), in line with the conceptual
design oft he questionnaire. The data supported the model behind the questionnaire
for mos\ of the 54 items and the evidence supported the view that the data were valid
and reliable (Separation Indcx<=0.95).
The next chapler continues the description of data analysis for the nine aspects
of change (Part 2B).
120
=
CHAPTER EIGHT
DAT A ANALYSIS: QUESTIONNAIRE (Part 28)
This chapter presents the Rasch analysis results where the first five aspects
(variables) arc analysed separately. They are compari:;on with previous sys!cm,
practicality in the classroom, a!Ieviation of concerns, learning about the change, and
participation in decision-making. The Rasch results for the other four variables,
personal cost appraisal ofthc change, collaboration with other lecturers, opportunities
for lecturer improvement, and value oflhc change for students, me described in the
next chapter (Chapter 9). The presentation for each variable contains: (1) the
psychometric properties, (2) meaning of the scale, (3) rescl\Tch questions, and (4) the
relevant hypotheses. Finally, a summary is provided.
Comparison with the previous system
Final analysis with 12 itt:ms
TI1e psychometric properties
There were originally 21 items, but 9 were deleted as not fitting the
measurement model sumcicntly well. The final accepted 12 items of the questionnaire
(items 1-9 and items 16-18) formed a scale in which there is acceptable (but not good)
agreement between all 659 Raj ab hat kc!urers to the different difficulties of the items
along the scale. The Index ofLceturcr Separability (akin to traditional reliability) for
the 12 item scale is 0.90. This means that the proportion of observed variance
considered lrnc is 90 % (sec Table 8.1). The items arc well targeted against the
receptivity measures. Thal is, the range of item thresholds match the range of
receptivity measures of the lecturers an lhc same scale. The item threshold values
range from ---4.0 !ogits (standard error 0.06) to +3.6 ]ogits (SE 0.06) and the lecturer
measures range from --6.4 log its to +6.2 logils. There are only 24 lecturers whose
receptivity measures are more than +3.6 logils and hence not 'matched' against an
item threshold on the sen le (sec Figure 8.1 ). Taken together, thC.'le results indicate that
a good measurement scale has been created, that the data arc reliable and consistent,
121
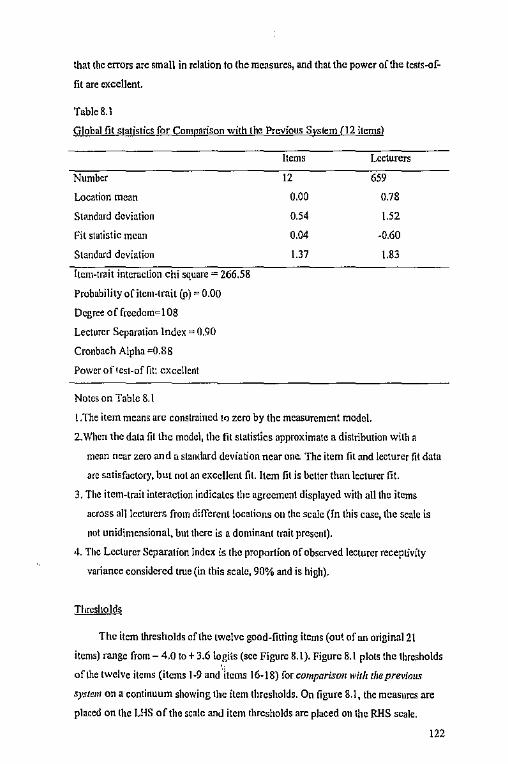
that the errors are small in relation to the measures, and that tho power of the tests-of
fit are excellent.
Table8.l
Global fit statistics for Comp:arison with the Previous System (12 items)
Number
Location mean
Stmidard deviation
Fit statistic mean
Standard deviation
!tem-trait interaction chi square - 266.58
Probability of item-trait (p)"' 0.00
Degree of freedom"'! 08
Lecturer Separation Index"' 0.90
Cronbach Alpha <=0.88
Power of!est-of nt: excellent
Notes on Table 8.1
Items
12
0.00
0.54
0.04
1.37
Lecturers
659
0.78
\.52
-0.60
1.83
! .The item means arc constrained !<J zero by the measurement model.
2.\\~1en the data nt the model, the fit statistics approximate a distribution with a
mean near zero and a standard deviation near one. The item fit and lecturer fit data
arc satisfactory, but not an excellent fil. Item fit is better than lecturer fit.
3. The item-trait interaction indicates the agreement displayed with all the items
across all lecturers from different locations on the scale (In this case, the scale is
not unidimensional, but there is a dominant trait present).
4. The Lecturer Separation Index is the proportion of observed lecturer receptivity
variance considered true (in this scale, 90% and is high).
Thresholds
The item thresholds of the twelve good-fitting items (out of an original 21
items) range from - 4.0 to+ 3.6 logi\s (see Figure 8.1). Figure 8.1 plots the thresholds
of the twelve items (items 1·9 and 'items 16· 18) for comparison with the previa11s
system on a continuum showing the item thresholds. On figure 8.1, the measures are
placed on the UIS of the scale and item thresholds arc placed on the RHS scale.
122
Compare 1.1 refers to the threshold between the response categories O and 1 for item
t; Compare l.2 refers to the threshold between the response categories I and 2;
Compare 1.3 refers to the threshold between the response categories 2 and 3 for the
same item. These thresholds arc orde1ed: Compare I .I (threshold value= -3.92) is
easiest, Compare 1.2 (threshold value= -0.51) is harder, and Compare 1.3 (threshold
value= +L32) is hardest in line with the ordering of the response categories. Other
item thresholds arc labeled similarly. Generally, the first threshold is towards the easy
end of the scale (as expected), the second threshold is harder, and the third threshold
is harder still (as expected). This supports the conceptual model of the response
categories.
Ordering of perspectives
For the aspect comparison wit11 the previous system, the items were
conceptualised from a model involving providing for better students learning,
providing for the needs of the students, and providing for better classroom
management, in the context of three perspectives (How I expect the cha11ge to be
plwmcd, Howl lhillk 1/re c/umge was really implemellled, and My actual behaviour to
the change involves). The results supported the model in relation to increasing
difficulty for the three perspectives. How I expecl tlte cha11ge to be planned was easy,
How I think the c/iauge was really (111p/eme11redwas harder, and My actual behaviour
lo tlte c/iange was harder still for all except one of the 3 stem-itmns. For stem-item 7-
9, the difficulty ofitem 8 is harder than that of item 9 (see Table 8.2). This means that
the provision of classroom management procedures was not implemented as we11 as
lecturers would have liked.
For example, the new system was expected to be planned to provide for belier
student learning experiences than \he previous system (item I) and was easy to agree
with. It was harder for Rajabhat lecturers to say that the new system was really
implemented to provide for better student learning experiences than the previous
system (item 2) because implementation requires more than expectation. It was harder
still for Rajabhat lecturers to say that tbei1 actual behaviour to tho change involved
providing for better student !earning experiences than the previous system (itcm3).
123
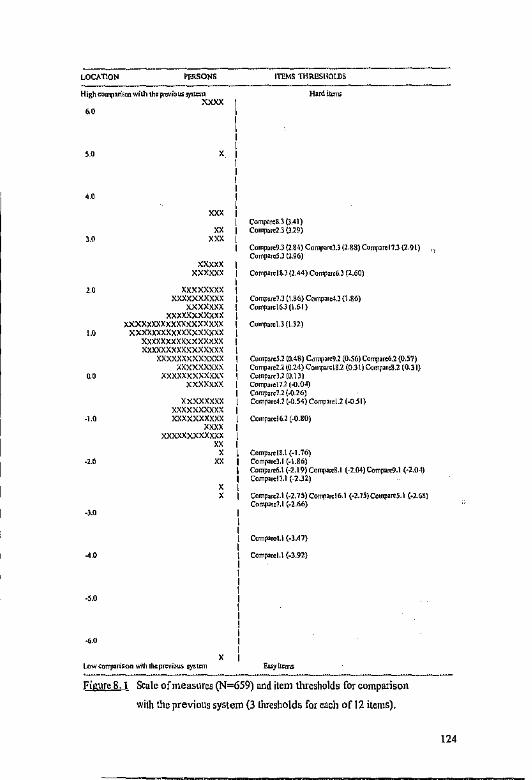
LOCl,TION
High co°",ri"n wilh 111' provio "' ')'ltm1
=
'"
•••
'"
'" , ..
-1.0
-1.0
'
xxxxx xxxxxx
xxxxxxxx xxxxxxxxxx
xxxxxxx xxxxxxxxxxx
xxxxxxxxxxxxxxxxxxx xxxx:,;xxxxxxxxxxxxx
xxxxxxxxxxxxxxxx xxxxxxxxxxxxxxxx
xxxxxxxxxxxxx xxxxxxxxx
xxxxxxxxxxxx xxxxxxx
xxxxxxxx xxxxxxxxxx xxxxxxxxxx
'"' xxxxxxxxxxxx
" ' " '
ITEMS UlRESUOLDS
Comp>reS.3().41) Comp,rc1..J 019)
Harditcw
Comp,rc'J.J (l.84) Co°"'"'l.l (l.88) Compon,17.l (2.9l) Coml"'TOS.l (l.96)
Comp.,,elS.J (l.44) Cor,\>"'6.l (1.60)
Comp,r,:1.J (1.86) Comp,r<4.l (\ .86) Compm\6.l(l.61)
Comp,a:\J(\J1.)
Comp,rcU (0.48) Camp>r<9.l (0.56) Comp,rt6l (0,57) Comp.,ro1.l (0.24) Comp,rcl8.2 (0.3 \) Comfl>rcll.2 (0.J 1) Comp,r<l.1 (0. \J) Comp,,,\ J.1. (-0.04) Comp,n:l.l (-0.26) Com!"r<4.l (-0.54) Comp>roll (-0.51)
Comp,a:16 l (-0.SO)
Comp,roli.\ (-1.76) Coml"n:),1(-!.Sfil Comp,ce6.\ (·2.19) Corrv,,"8.1 (-2.04) Comp,"9.1 (·1.04) Coml"r<IJ.1 (-1.Jl)
X Comp,r<l.l (•2.75) Compar<l6. l (·2.JS)Co"'l""S.l (•l.68]
-).0
-s.o
•••
C<>mpa,el,I (-2.66)
Coml"r<4.l (-3.47)
Coml"rcl,\ (.J.n}
Eu>yltem,; -----------Figure 8. 1 Scale of measures (N=659) and item thresholds for comparison
with the previous system {3 thresholds for each of 12 items).
124
-=
Notes on figure 8.1
l. Each X rP.presents 3 Rajabhat lecturers
2. Compare= comparison with the previous system.
3. Com'j}are LI = item 1 threshold I
4. Compare 1.2 = item I threshold 2
S. Compare 1.3 = item I threshold 3
This is because it involves the lecturers' behaviour rather than attitude. It requires the
le~turers lo actually do something in regard to the change and is conceptually harder.
Hence, conceptually, items I, 2, and 3 are ordered from easy to hard to harder still and
the data supported this. The difficulty of item I is -1.04, item 2 is +0.26 and item 3 is
+0.38.
Ordering of item difficulties
For comparison with the previous system, there were originally 21 items
divided into three sub-aspects: {I) student learning (items 1- 6); (2) classroom
management (items 7-12); and (3) student needs {items 13-21). Nine items did not fit
the measurement model and were deleted. The items in each sub-aspect were
conccplua\!y ordered from easy to hard, vertically. For oxamplc, in the sub-aspect of
student learning (sec Table 8.2), it was expected that most lecturers would find it easy
to say that the new educational sys.tern provided for bell er student learning
experiences than tlte previous system (stem-item 1-3). It was expected that there
would be some variation in lecturer responses around this. It was expected that most
lecturers would !ind it harder to say that the new educational system provided for
heller s1ude111 achicve111en11/ia11 l/ie previous system (slem-ltem 4-6) and there would
be some variation in lecturer responses around this. This is because stem-item 4-6
involves 'a little bit more' practically and conceptually, than stem-item 1-3. So, as
expected, these two stem-items form an ordered pattern ofresponsos by difficulty on
average, from easy lo hard. The results supported this conceptual order for
expectations and behaviour, but not for implementation (see Table 8.2). The
difficullies of their two stem-items were the same (within the 1:'ITOT of measurement)
in the implementation perspective.
125
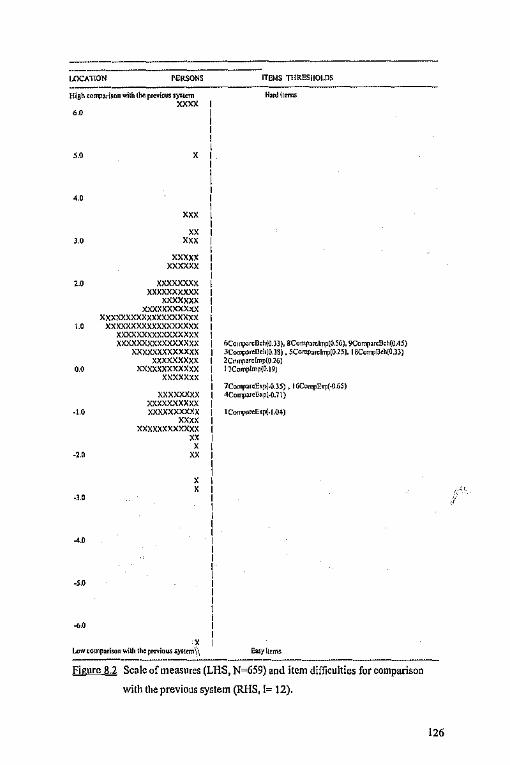
LOCATION
High ,o..,ori,on wilh !he P""'°"' l)"L<Tn
"""" ·-·
'"
,.o
'"
'
"' " '"
xxxxx
'""""' 2.0 xxxxxxxx
xxxxxxxxxx xxxxxxx
xxxxxxxxx.-xx xxxxxxxxxxxxxxxxxxx
1.0 xxxxxxxxxxxxxxxxxx xxxxxxxxxxxxxxxx xxxxxxxxxxxxxxxx
xxxxxxxxxxxxx xxxxxxxxx
0.0 xxxxxxxxxxxx xxxxxxx
xxxxxxxx xxxxxxxxxx
-1.0 xxxxxxxxxx xxxx
xxxxxxxxxxxx
" ' -2.0 XX
-l.O
4.0
-5.0
' '
' Low tomp,ri,oa wilh 111e prnious ,ytt<m \\
ITEMS n!RESilOWS
Ho,,Htoms
6Comp:m:D,h(O.JJ ), BCornp,rdmp[0.56 ), 9Coq,,rcB,h(OA5) Jco..,,.,o.i,10.JB) • 5Com;,,rclmp(O 15). I aco..,JJ<h(O.ll) 2Co,rq,mlmp(O 16) I JComplmp{0.19)
"ICo-.,mfap(.O.JS), IOCo..,E'P(.0.65) ~Com;,mfup(.0.71)
IConvoroExp(-1.04)
--------Figurn 8.2 Scale of measures (LHS, N=659) and item difficulties for comparison
with the previous system (RHS, != 12).
126
Notes on figure 8.2
I. Each X represents 4 Rajabhat lecturers.
2. CompareExp = Comparison with the previous system (expectation)
3. Comparelmp = Comparison with the previous system (Implementation)
4. CompBeh = Comparison with the previous system (Behaviour)
Meaning of the linear scale
Equal differences on the scak between the measures represent equal differences
in item difficulty. However, there is no true zero point of item difficulty, or measures
of comparison with the previous system and the scale is thus at the interval level. The
12 items oft he scale arc ordered from easy to hard (sec figure 8.1 and 8.2). Nearly a!I
lecturers answered the easy items positively, for example, items I, 4, 16, and 7. As the
iten1 difficulties become higher on the scale, the lecturers need con-esponding higher
measures to answer them positively. The hardest items are only answered positively
by lecturers who have high measures, for example, items 9, 3, 18, and 6. Lecturers
with low measures cannot answer these difficult items positively.
Research questions in relation to the aspect of comparison with the previous system
For research questions relating to com[!arison wjth the previous system, the
major findings are stated within the framework of the research questions outlined in
Chapter One.
Research question 2 (1}: Can a proper linear scale be created for the aspect,
comparison with the previous sys/em, using a Rasch computer progrum?
Yes, a proper linear scale was created for the aspect of comparison with the
previous sys(em, using a Rasch computer program. The findings indicated that the
lecturer measures (N=659) and the item difficulties (1=12) were calibrated on the
same linear scale where a dominant aspect influenced all the items. While the data for
the 12 items were reliable, some revision to the item wording is needed to improve
validity.
127
' '1.S',a ·.-, '
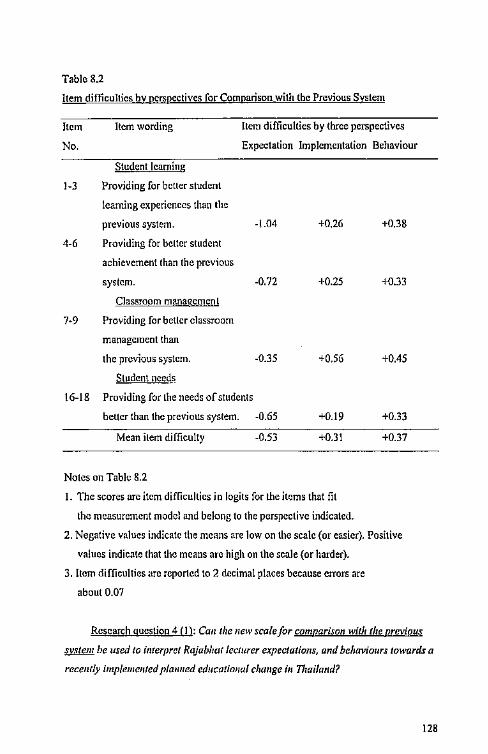
Table 8.2
Item difficulties by perspectives for Comparison with the Previous System
Item
No.
Item wording Item difficulties by three perspectives
Expectation Implementation Behaviour
Student learning
1-3 Providing for better student
!earning experiences than the
previous system.
4·6 Providing for belier studcrit
achievement than the previous
system.
Classroom managemcnl
7-9 Providing for bctler classroom
management than
the previous system.
Student need_s
16-18 Providing for lhe needs of students
-!.04
-0.72
-0.35
better than the previous system. -0.65
Mean item difficulty -0.53
Notes on Tabk 8.2
+0.26
+0.25
+0.56
+0.19
+0.31
I. The scores arc item difficulties io logits for the items that fit
the measurement model and belong to the perspective indicated.
+0.38
+0.33
+0.45
+0.33
+0.37
2. Negative values indicate the means arc low on the scale (or easier). Positive
values indicate that the means arc high on the scale {or harder).
3. Item difficulties arc reported to 2 decimal places because errors are
about 0.07
Research question 4 (I): Can the new scale/or comparison with tire previous
sy.~tem he used to interpret Rajablml {ec/Urer cxpeetations, and be/Javio11rs towards a
rece111/y imp/eme1r/ed p{a,med ed11catio11a{ dw11ge ill 11iaila11d?
128

Fl 11 i.W.M&&pr,p1mw
Yes, the new scale for comparison with the previous system was used to
interpret Raj ab hat lecturer expectations, and behaviours towards a recently
implemented plannei.l educational change in Thailand. For all the stem-items,
expectarfons were easier than actual behaviours as conceptualised. For example, most
Rajabhat lecturers found it easy to agree that the new system was expected to be
planned lo provide for belier student /ear11ing experiences than the previous system
(difficulty of item 1 is -1.04) It was harder forRajabhat lecturers to say that the new
system was actually provided for bet/er stud en/ /earnillg experiences thall the
previous system (difficulty of item 2 is +0.26). It was harder still for Rajabhat
lecturers to say that their actual behaviour lo the change Involved belier provision for
bet/er s111de11t learning expcrie11ces than in the previo11s system (difficulty of item 3 is
+0.38). Hence, conceptua\ly, the perspectives for stem-item 1-3 were ordered from
easy to hard to harder still, and the data supported most of the conceptualisation of the
scale for comparison with the previous system (see Table 8.2).
The relevant hypotheses
The major findings arc stated within the framework oflhe relevant hypotheses
outlined in Chapter Four. One relevant hypothesis was set up in order to achieve the
purposes oft he study for aspect, comparjsop with the previous system.
Hypothesis 2: Tlie expcctatio11s are easier thau the behaviours for the measures
of the new policy compared with the previous system.
It was found that the expectations were easier than the behaviours for all the
items relating to comparison with the previous system, except for items 8 and 9,
where the behaviour perspective was easier than the implementation perspective.
Practicality in the classroom
Fina\ analysis with 18 items
The psychometric propertjes
The final accepted l 8 items of the questionnaire (items 22-39) fonned a scale in
which there is acceptable (but not good) agreement between al\ 659 Rajabhat lecturers
to the different difficulties of the items along the scale. The Index of Lecturer
129
.,,,,
.. ,,., .....
-•-
Separability (akin to traditional reliability) for the 18 item scale is 0.92. This means
that the proportion of observed variance considered troe is 92 % (see Table 8.3). The
items are well targeted against the practicality measures. That is, the range of item
thresholds matches the range of practicality measures of the lecturers on the same
scale. The item threshold values range from -4.0 logits (standard error 0.06) to +3.0
logits (SE 0.06) and the lecturer measures range from -2.8 \ogits to +6.2 logits. There
are on!y 24 lecturers whose practicality measures are more than +3.0 logits and hence
not 'matched' against an item threshold on the scale (sec Figure 8.3). Taken together,
these results indicate that a good measurement scale of receptivity bas been created,
that the data arc reliable und consistent, that the errors are small in relation to the
measures, and that the power of the tests-of-fit are excellent.
Thresholds
The thresholds of the 18 items ranged from -4.0 to+ 3.0 Jogits (see Figure 8.3).
Figure 8.3 plots the 18 items for practicality in the classroom on a continuum
showing the item thresholds from easy to hard, and the measures from low to high.
On figure 8.3, the measures ure placed on the LHS of the scale and item thresholds are
placed on the RHS scale. Prnctic 35. I refers to the threshold between the response
categories O and I for item 35; Pratic 35.2 refers to the threshold between the response
categories I and 2; Practic 35,3 refers to the threshold between the response
categories 2 and 3 fur the same item. These thresholds vre ordered: Pratic 35.1
(threshold value= -2.52) is easy, Pructic 35.2 (threshold value= +0.32) is harder, and
Practic 35.3 (threshold value= +3.17) is harder still, in line with the ordering of the
response categories. Other item thresholds arc labeled similarly, and ordered
similarly. Generally, the first threshold is towards the easy end of the scale (as
expected), the second threshold is harder, and the third threshold is at the hard end of
the scale (as expected). This supports the conceptual model of the response categories.
Ordering of perspectives
For the aspect ofpracth;alily in jhe classroom, the items were conceptualised
from a model involving provision of sufficient resources, suitability to teaching style,
suitability to student needs, and flexibility in the classroom management, in the
context of the three perspectives (How I expect the change to be planned, How I think
130
,., .. "
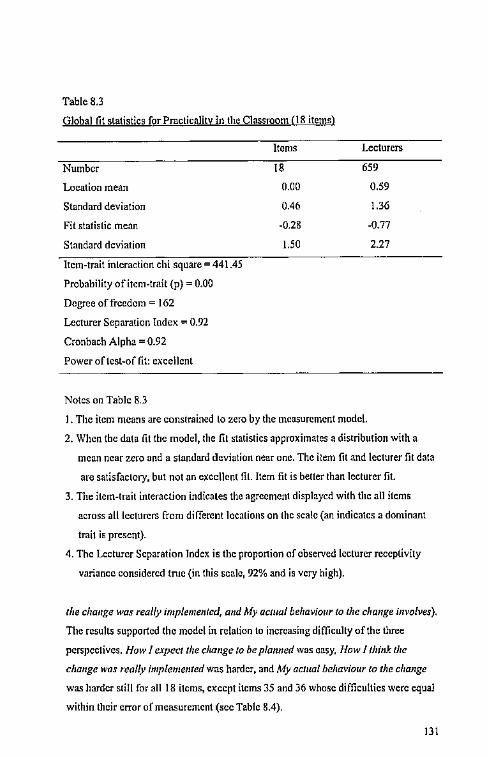
Table 8.3
Global fit statistics for Practicality in the Classroom (18 items)
Number
Location mean
Standard deviation
Fit statistic mean
Standard deviation
Item-trait interaction chi square 441.45
Probability of item-trait (p) = 0.00
Degree of freedom= 162
Lecturer Separation Index= 0.92
Cronbach Alpha= 0.92
Power oftest-of fit: excellent
Notes on Table 8.3
Items
18
0.00
0.46
-0.28
1.50
Lecturers
659
0.59
1.36
-0.77
2.27
1. The item means are constrained lo zero by the measurement mode!.
2. When the data fit the model, the fit statistics approximates a distribution with a
mean near zero and a standard deviation near one. The item fit and lecturer fit data
are satisfaclol)', but not an excellent fil. Item fit is better than lecturer fit.
3. The item-trait interaction indicates the agreement displayed with the all items
across all lcc1urers from different locations on the scale (an indicates a dominant
trait is present).
4. The Lecturer Separation Index is the proportion of observed lecturer receptivity
variance considered tme (in this scale, 92% and is VCI)' high).
the cha11ge was really imp/emenled, and My acwal behaviour to the change involves).
The results supported the model in relation to increasing difficulty of the three
perspectives. Haw I expect the change to be planned was easy, Howl thitik the
change was really implemented was harder, and My ac/ua/ behaviour lo lhe change
was harder still for all 18 items, except items 35 and 36 whose difficulties were equal
within their error of measurement (see Table 8.4).
131
M:m
For example, the new system was expected lo provide changes that could be
adapted to the ed11catio11al phi!osop!iy which guides lecturer leaching (item 22) and
was easy to agree with. It was harder for a Rajabhat lecturer to say that fhe new system
is really lmp/eme111ed to provide changes that can be adapted to the educarional
philosophy which guides their teachillg (item 23) because implementation requires
more than expectation. It was harder still for Ra jab hat lecturers to say that their actual
behaviour to the change involve better prol'isio11for better adapti11g to the
ed11catio11ai philosophy which guides their teaching tha11 i11 the previous system (item
25). This is because it involves the lecturers' behaviour rather than attitude. It requires
the lecturers to actually do something in regard to the change and is conceptually
harder. Hence, conceptually, items 22, 23, and 24 arc ordered from easy to hard to
harder still and the data supported this. The difficulty of item 22 is -0.49, item 23 is
+0. ! 8 and item 25 is ~·0.40 (a reader can see this trend for the other items in Table
8.4).
Ordering of item difficulties
For practicality in the classroom, there were originally 18 items and the items
were divided into two sub-aspects: (1) classroom management (items 22-30); and (2)
sllldcnt needs (items 31-39). The items in each sub-aspect were vertically ordered
from easy to hard (sec Table 8.4). For example, in sub-aspect of student needs, it was
expected that most lecturers would find it easy to say that the new educational system
provided changes that can be adapred to the needs of my students (stem-item 31-33).
It was expected that there would he some variation in lecturer responses around this.
It was expected that most lecturers would find it harder to say that the new
educational system provided sufficientjlexibi/ity in tile changes to suit the needs of
different stud ems (stem-item 34-36) and there would be some variation in lecturer
responses around this. This is because stem-item 34-36 involves 'a little bit more'
practically and conceptually, than stem-item 31-33. It was expected that most
lecturers would find it harder still , say that they expected the new educational
system would provide suj]icie11/ resources to allow them lo impleme111 the cha11ge in
their classroom (stem-item 37-39). This is because stem-item 37.39 involves 'a little
bit more' prac1ically and conceptually, than stem-item 34-36. So, as expected, these
132
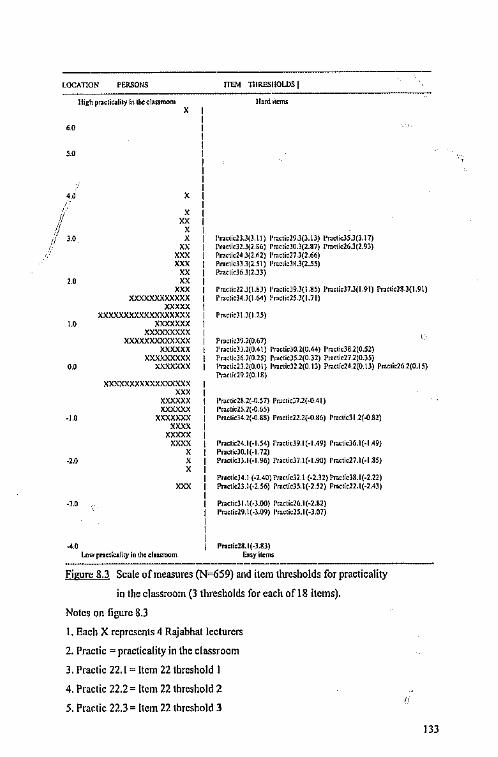
00
,o
,., ' • " ../
,1/ J.O
' "" ' ' "" '"" = l'mticll.J(J.ll) l'ra<ti,l9.J(J.1JJ l'ra,li<JS.l(l.17) !'ncti,Jl.J(l.06) rracti,J0.3(2.87) Pr:i<ti<26.l(l.9J) Pr.,,ti,14.l(l.~l) l'raclicl7.l(l.66) l'flcti<Jl.]{2.51) l'mLidM.J(l.55) !'n<Lid6 J(l.J]) ,o "" "" ""' xxxxxxxxxxxx Prn<ticll.J(l.ol) l'raelkl9.J(1.85) Praeti,37.l(l.91) Prac~ol8.l(1.91) l'racliolO(\.M) Pr.>C11025.l(l.71)
,.o ""'"" xxxxxxxxxxxxxxxxxx •== xxxxxxxxx
p,.";o)\_)(125)
Pr>coicl9.l(0.67) Proctioll.l(0.4 \) l'raotiolO.l(U.44) Pra<1i<l8.l(O.Sl) rraolldi l(O 25) Pra<tiolS.2(0.Jl) Po,<1io27.l(O.J5)
00
xxxxxxxxxxxxx xxxxxx
XXXl<XXXXX xxxxxxx l'r.icti,ll.l{0.01) l'raeticl1.l(0.1J) Pra<!iaU(O. tJ) Pr.1e1it26 2(0.15)
PmLi<l9 l{O.IH)
-1.0
-2.0
-l.O
xxxxxxxxxxxxxxxxx "' xxxxxx
= xxxxxxx
'"' xx:o::x xxxx
' ' ' '""
Low pn<t...,.lity in th<, cl,uroorn
l'racticl8 l(-ll.57) Pr;ccic;7.2{.0 41) rracciell.l(.0.65) Prneliol4.l(.O 88) PrnC!kll.l(-0.86) Pr:octicJl .2(.0.81)
Pr>ollo14.l(·L54) Ptacticl9.I (·1.49) Practid6.1(-l .49) Pmoicl0.1(·1.72) Pncticl).1(·1.96) r,ac,icl7.l(·l.'l<l) ro:u:ti<:27.1(·1.SSJ
l'mticl4.l (·2.40) Pmticll.1 (·2.ll) l'ralicl8.1(·2.ll) l'rnti<ll.1(•2.S6) Pmtim, 1(·2.Sl) Pnctio22.l(·l.4l)
!'rnttcJI. \(·l.00) Pr.tcticl6.l(·l.Sl) r=ci,29.l(·l.09) l'racticl5.1(-l.07)
rncoi,18.1(-J.83) E>>yil<ms
Figure 8.3 Scale of measures (N=659) and item thresholds for practicality
in the classroom (3 thresholds for each of 18 items).
Notes on figure 8.3
I. Each X represents 4 Rajabhat lecturers
2. Practic = practicality in the classroom
3. Practic 22. l = Item 22 threshold I
4. Practic 22.2 = Item 22 threshold 2
5. Practic 22.3 = [tern 22 threshold J ,.
133
- 15H'ft1'ffflkwv==--=-•
three stem-items form an ordered pattern ofresponses by difficulty on average, from
easy to hard on the expectation perspective. The data supported this for the
expectation perspective, but not for the implementation and behaviuor perspectives,
all hough al\ the 18 items fitted the measurement model (see Table 8.4).
For the vertical ordering of c!o.1sroo111 mo1wge111e11I, flexibility for managing the
day-to-day running of the c\a,;sroom (stem-item 28-30) was easiest, adoption to
classroom teaching style (stem-item 25-27) was harder, but still easy, and adapting
philosophy to teaching was harder still, bm still easy (stem-item 22-24). In the other
perspectives, this vertical ordering docs not hold (sec Table 8.4}.
Meaning pf the linear scale
Equal differences on the scale belwecn the measures represent equal differences
in item difficulty. However, there is no true zero point of item difficulty or measure of
practicality and the scale is thus at the interval level. The 18 items of the scale arc
ordered from easy to hard (sec figures 8.3 and 8.4). Nearly a\1 lecturcrs answered the
easy items positively, for example, item3 31, 28, 25, 34, 22, and 37. As the item
difficulties become positively higher on the scale, the lecturers need correspondi11g
higher measures to answer them positively. The hardest items arc only answered
positively by lecturers who have high measurer, for example, items 30, 24, 27, 36, 39,
and 33. Lecturers with !ow measures cnnnot answer the>c difficult items positively.
Research questions in relation to the aspect of practicality in the classroom
For the research questions i11 aspect ofpractieality in the classroom, the major
findings arc stated within the frameworkofthe research questions outlined in Chapter
One.
Research question.l.ffi: Ca11 a proper /i11ear scale be created/or 1/w aspect,
practicality i11 the classroom, 11sitrg a Rasch computer program?
Yes, a proper linear scale was created for the aspect of practicality in the
classroom, using a Rasch computer prosram. The findings indicated that the lecturer
measures (N,.659) and the item difficulties (1=18) were calibrated on the same linear
scale where a daminant aspect influenced all the items. While the data for the !8
items were reliable, some revision to the item wording is needed to improve validity.
134

'"
'"
'"
.,.
.].0
' ' " ' ' " '" '" " " x:o;
xxxxxxxxxxxx xxxxx
x:xxxxxxxxxxxxxxxxx xxxxxxx
xxxxxxxxx xxxxxxxxxxxxx
:o.:xxxx
xxxxxxxxx xxxxxxx
xxxxxxxxxxxxxxxxx xxx
xxxxxx xxxxxx
xxxxxxx xxxx
xxxxx x,:xx
' ' ' xxx
Ulw pr.,cuo,li,yfn lh< <l.,.,oom
im•,ac,icll,hiO lll l.\l'r.,""n,1,10 !O), 1Jl'm,idl,h(O.J9), lll'ncticlleh(O.)l), lll'm1iclrnplO Jl), l6 l'r:"'i<lloh(O.J6), 391',.oti,Ueh(O.l4) 1i1•.,,u,1mi,(O m. JlP,,,L1<fmr(~ 211. Jil'r,cti<lmp(0.11) 1<,l'mL"lmp(O 09), 191'r>ctl<lrnp(O 07) JJl~J<ti,1:,r1-0 141 lll'tact"fal'{-0 4')) l11'r..lcc E,l'{-0 67), 1•1~"1icfar(-O }l) l!l'r:i.o,cl:,p(-0 8)), l ll'c;, ti,E,p(-0.81,)
E.uyitcm, ·--·----·-----
Figure 8.4 Seale of measures (LHS, N=659) and item difficulties for practicality in
the classroom (RHS, I= 18).
Notes on figure 8.4
I. Each X represents 4 Rajabhat lecturers
2. Prnctic = practicality in the classroom
3. 22PracticExp"' item 22 (Expectation)
4. 23Practic!mp = item 23 (lmplcrncnlation)
5. 24PracticBch 24 = item 24 (Behaviour)
135
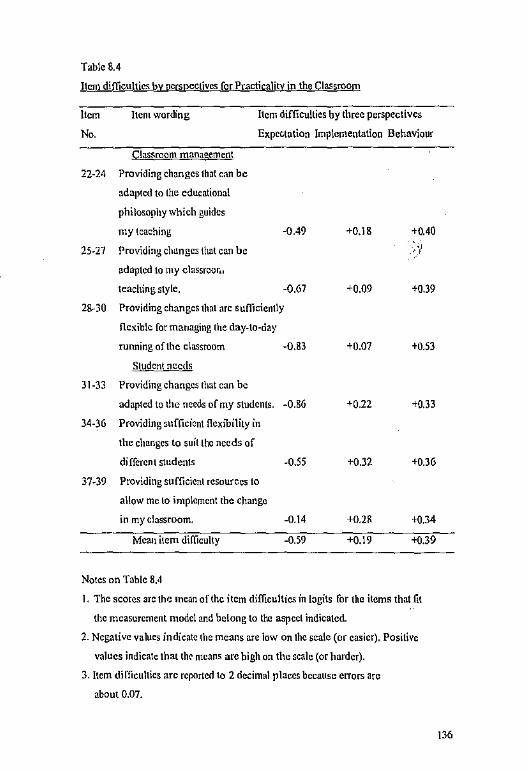
ff .. ,_,
Table 8.4
Item difficu\jics by perspectives for Practicality in the Classrooni
Item
No.
Item wording Item difficulties by three perspectives
Expectation Implementation Behaviour
Classroom management
22-24 Providing changes that can be
adapted to the educational
philosophy which guides
my teaching
25-27 Providing changes that can be
adapted to my classroor ..
teaching style.
-0.49
-0.67
28-30 Providing changes that arc sufficiently
flexible for managing the day-to-day
31-33
34-36
37-39
runningofthe classroom
Student needs
Providing changes that can be
adapted to the needs of my students.
Providing sufficient flexibility in
the changes to suil the needs of
different students
Providing sufficient resources to
allow me lo implement the change
in my classroom.
Mean item difficulty
Notes on Table 8.4
-0.83
-0.86
-0.55
-0.14
-0.59
+0.18 .J-0.40
+0.09 +0.39
+O.D7 +0.53
+0.22 .J-0.33
+0.32 +0.36
+0.2R +0.34
+0.19 +0.39
1. The scores are the mean of the item difficulties in logits for the items that fit
the measurement model and belong to the aspect indicated.
2. Negative values indicate the means arc low on the scale (or easier). Positive
values indicate that thr means arc high on the scale (or harder).
3. Item dirficultics are reported to 2 decimal places because errors arc
about 0.07.
136
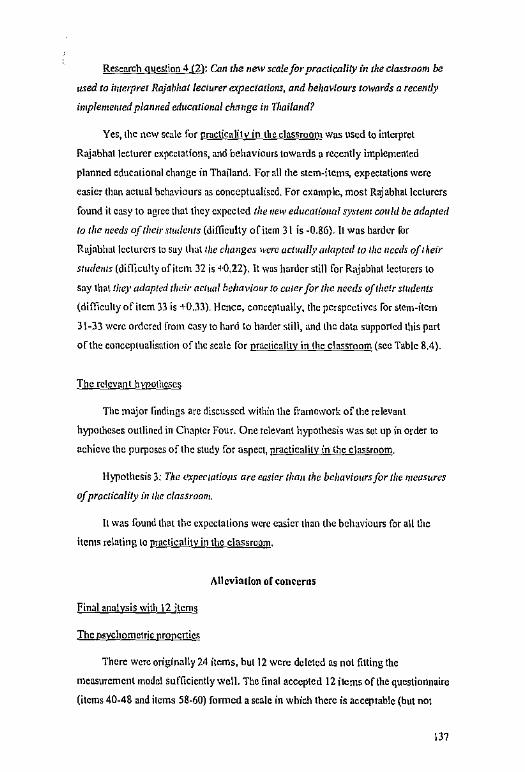
we et "' :er
Research question 4 (2): Can the new scale for practicality in the classroom be
used to i111erpret Raja/J/iat /eclurer expectations, and behaviours towards a recelllly
i111pleme111ed planned educational change in Thailand?
Yes, the new scale for practicality in the classroom was used to interpret
Rajabhat lecturer expectations, and behaviours towards a recently implemented
planned educational change in Thailand. For a!l the stem-items, expectations were
easier than actual behaviours as conceptualised. For example, most Rajabhat lecturers
found it easy to agree that they expected the ,1etv ed11cal{o1ml sy~·tem cor1/d be adapted
lo the needs of their .l/1u/e111s (difficulty of item 31 is -0.86}. It was harder for
Rajablmt lecturers lo say that I/JC cliai1ges were ac/11111/y adapted to lhc 11eeds of thdr
st1ule111s (difficulty of item 32 is +0.22). It was harder still for Rajabhat lecturers to
say that I/icy adapted their 11ct1wl bciwvimir to ca/er for the needs of rlwtr sllldents
(difficulty of item 33 is +0.33). Hence, conceptually, the perspectives for stem-item
3 !-33 were ordered front easy to hard to harder still, and the data supported this part
of the conceptualisation of the scale for practicality in the classroom (sec Table 8.4).
The relevant hypotheses
The major findings arc discussed within the framework of the relevant
hypotheses outlined in Chapter Four. One relevant hypothesis was set up in order to
achieve the purposes of the study for aspect, practicality in t~e e)assroom.
Hypothesis 3: The expec111rio11s are easier thau the be/wvio11rs for tlic measures
of practicality in lhc classroom.
ll was found that the expectations were easier than the behaviours for all the
items relating lo prnctica!ity in the classroom.
Allcviat!on of concerns
Final analysis with \2 items
The psychometric properties
There were originally 24 items, but 12 were deleted as not fitting the
measurement mode! sufficiently well. The final accepted 12 items of the questionnaire
(items 40-48 and items 58-60) formed a scale in which there is acceptable (but not
137
m•·.
" '

good) agreement between all 659 Rajabhat lei;turers to the different difficulties of the
items along the scale. The Inder. of Lecturer Scparability(akin lo traditional
reliability) for the 12 item scale LS 0. 92. This means thatthe proportion ofobserved
variance considered true is 92 % (see Table 8.S). The items are well targeted against
the receptivity measures. That is, the range of item thresholds match the range of
receptivity measures of the lecturers. on the same scale. The item threshold values
range from -2.8 logits {standard error 0.06) to +2.8 logils (SE 0.06) and the lecturer
measures range from -6.0 logits lo +5.8 logits. There arc only 15 lecturers whose
receptivity measures arc more than +2.8 logits and hence not 'matched' against an
item threshold on the scale (sec Figure 8.5). Taken togclhcr, these rcsuHs indicate that
a good measurement scale ofreccptivity has been created, that the data are reliable
and consistent, that the errors ~re small in relation to the measures, and that the power
of the ks1s-of-fit are excellent.
Thresholds
The thresholds of the l 2 items ranged from -2.8 to +2.8 logits (sec Figure 8.5).
Figure 8.5 plots the 12 items for alleviation of co11cer11s on a continuum showing the
item thresholds from easy lo hard, and the measure from low to high. On figure 8.5,
the measures arc plnced on tho LHS of the scale and item thresholds are placed on the
RHS scale. Altcv 47.1 refers to the threshold between the response categories O and I
for item 47; Allev 47.2 refers to the threshold between the response categories 1 and
2; Allev 47.3 refers to the threshold between the response categories 2 and 3 for the
same item. These thresholds are ordered: Allev 47. l {threshold value= -2.79) is
easiest, Allcv 47 2 (threshold value= -0.04) is harder, and Allev 47.3 (threshold value
= +2.46) is hardest, in line with the ordering of the response categories. Other item
thresholds arc labeled similarly. Generally, the first threshold is towards the easy end
of the scale (as expected), the second threshold is harder, and the third threshold is al
the hard end of the scale (as c;,;pectcd). This supports the conceptual model of the
respon~c categories.
Ordering of pcrspr.ctives
For the aspect, alleviation of concerns, the items were conceptualised from a
model involving solving classroom problems, having support for the change, and
138
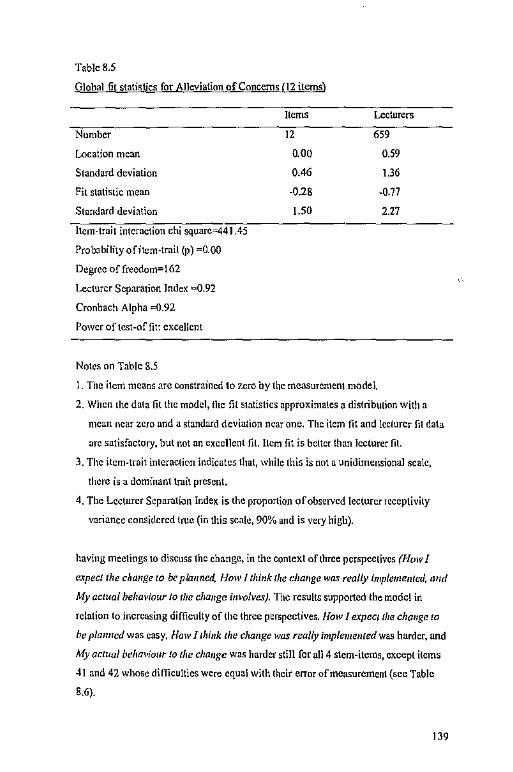
Vil ,.,
Table 8.5
Global fit statisijcs for Alleviation of Concerns (12 items)
Number
Location mean
Standard deviatio11
Fit statistic mean
Standard deviatio11
Item-trait interaction chi square=-441.45
Probability of item-trail (p) "'0.00
Degree of frecdom=\62
Lecturer Separation Index "-0.92
Cronbach Alpha o=0.92
Power oftest-of fit: excellent
Notes on Table 8.5
Items
12
0.00
0.46
-0.28
I.SO
Lecturers
659
0.59
1.36
-0.17
2.27
l. The item means arc constrained to zero by the measurement model.
2. When the data fit the model, the fit statistics approximates a distribution with a
mean near zero and a standard deviation near one. The item fit and lcc!urer fit data
arc satisfactory, but not an excellent fil. Hem fit is belier than lecturer fil.
3. The item-trait inleractic,n indicates that, while this is not a unidimensional scale,
there is a dominant trait present.
4, The Lecturer Scparatkm Ind el{ is the proportion of observed lecturer receptivity
variance considered !rue (in this scale, 90% and is very high).
having meetings to discuss the change, in the context of three perspectives (How I
expect /he change to be planned, How I think the cha11ge was really implemented, and
My actual behaviour lo /he cha11gf! i11wilves). The results supported the model in
relation to increasing difficulty of the three perspectives. How I expect the change to
be planned was easy, Howl lhink the change was really implememed was harder, and
My actual behaviour to the cha11ge was harder still for all 4 stem-items, Cl{Cept items
4 J and 42 whose difficulties were equal with their error of measurement (sec Table
8,6).
139
For example, the new system was expected lo contribute lo solving q11iddy a11y
c/as.;room problems in implementing the change al their Rajabhats (item 43) was
easy to agree with. It was harder for a Rajablmt lecturer to say that the new system is
really implemented to co11tribu1e 10 solv1i1g q11ickly any classroom prob/ems 1i1
implementing the change at their Rajabliars (item 44) because implementation
requires more than expcctation. ll was harder still for Rajabhat lecturers to say that
tl,eir actual behaviour 10 the chm1ge involves so/vitzg quickly any classroom problems
ill i111p/eme11ti11g the clumge al their Rajabhats (ilem 45). This is because it involves
the lecturers' behaviour rather than attllude. U requires the lecturers to actually do
something in regard lo the change and is conceptually harder. Hence, conceptually,
item 43, item 44, and item 45 arc ordered from easy to hard to harder still and the data
support this. The difficulty of item 43 is -0.39, item 44 is +0.34 and item 45 is +0.55.
However, the conceptualised horizontal ordering was not supported for items 41 and
42, but both items filled the measurement model. It is probable that the
implementation of raising concerns about the change procedures was a !iltle easier
than lecturers thought would be required in lhe new system.
Ordering of item difficulties
For alleviation of concerns, there were originally 24 items and these were
divided into two aspects: (I) concerns about the change (items 40-51); and (2)
supporting the change (item 52-63). Only 12 ilcms filled the measurement model
(items 40-48, and items 58-60), and other l 2 items did not fit the measurement model
and they were deleted. The items ir.i each sub-aspect were conceptually ordered from
easy to hard, vertically. For example, in the sub-aspect of concerns about the change
(sec Figure 8.6), it was expected that most lecturers would find it easy to say that the
new educational system was p/(llmed lo i11vofre regular Rajabhat meetings al wlzich
ircwrers call raise their concems abom tlte change (stem-item 40-42). It was
expected that there would be some variation in lecturer responses around this. It was
expected that most lecturers would find it harder to say that the new educational
system was plamied lo e11ablcc/assroo111 pro/Jlems to be solved quickly during
implementi11g of /he change al tlreir Rajabhats (stem-item 43-45) and there would be
some variation in lecturer responses around this. This is because stem-item 43-45
involves 'a little bit more' practically and conceptually, tlmn stem-item 40-42. It was
expected that mosl lecturers would find it harder still lo say that they expected the
140
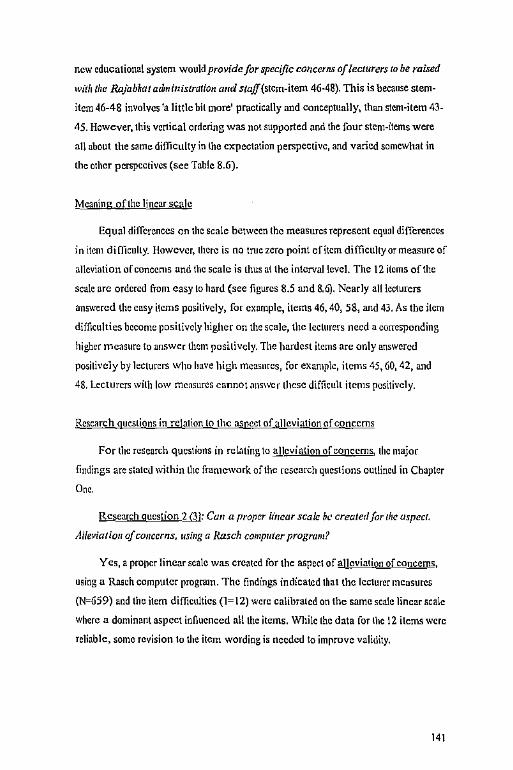
new educational system would provide /or specific concerns of lecturers to be raised
wit ii the &jabhat admi11istration a11d staff(stcm-itern 46-48). This is because stem·
item 46-48 involves 'a little hil more' practically and conceptually, than stem·item 43.
45. However, this vertical ordering was not supported and the four stem-items were
all about the same difficulty in !he expectation perspective, and varied somewhat in
the other perspectives (see Table 8.6).
Meaning of the linear scale
Equal dilTercnces on the scale between the measures represent equal differences
in item difficulty. However, there is no true zero point of item difficulty or measure of
alleviation of concerns and the scale is thus a( the interval !eve]. The 12 i(cms of the
scale arc ordered fron1 easy lo hard {see figures 8.5 and 8.6). Nearly al! lecturers
answered the easy items positively, for example, items 46, 40, 58, and 43. As the item
difficulties become positively higher on the scale, the lecturers need a corresponding
higher measure to answer them positively. The hardest items arc only answered
positively by lecturers who have high measures, for example, items 45, 60, 42, and
48. Lecturers wilh low measures cannot answer these difficu\L items positively.
Research question, in re)ation lo the aspect of alleviation of concerns
For the research questions in relating to alleviation of concerns, the major
findings are stated within the framework of the research questions outlined in Chapter
One.
Research question 2 (3): Cun a proper linear scale be- created /or 1/ie as peel.
Alleviat/011 of concerns, using a Rasch computer program?
Y cs, a proper linear scale was created for the aspect of a]leviation of concerns,
using a Rasch computer program. The findings indicated that the lecturer measures
(N=659) and the item difficulties (1=12) were calibrated on the same sca!e linear scale
where a dominant aspect influenced all the items. While the data for lhc !2 items were
reliable, some revision lo the item wording is needed to improve validity.
141
WWW
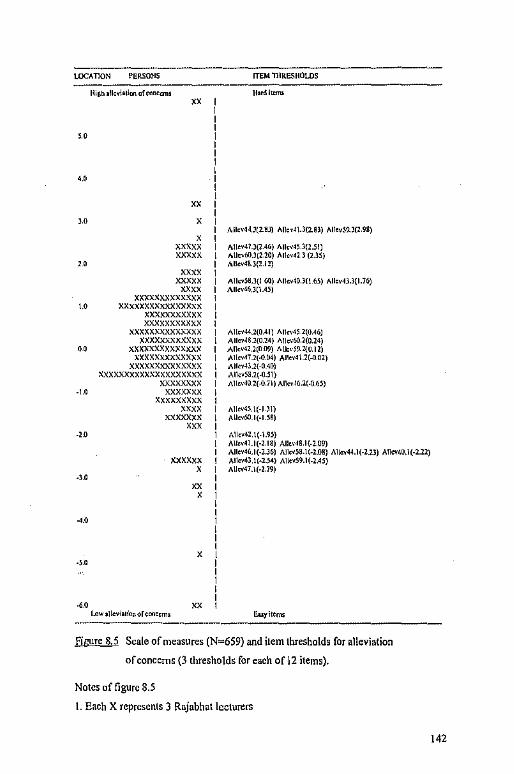
=
UICATlON PERSONS
, ..
'·"
,.
High ,lkvl•tion afoon<ans
" ' ' xxxxx
xxxxx xxxx
xxxxx xxxx
xxxxxxxxxxxxx LO XXXXXXXXXXXXXXXX
xxxxxxxxxxx xxxxxxxxxxx
xxxxxxxxxxxxxx xxxxxxxxxxxx
00 xxxxxxxxxxxxxx xxxxxxxxxxxxx
xxxxxxxxxx.xxxx xxxxxxxxxxxxxxxxxxxx
xxxxxxxx -1.0 xxxxxxx
-l.O
, ..
-6.0
xxxxxxxxx xxxx
xxxxxxx
"' xxxxxx
' " '
'
ITEM TllRESIIOLOS
H1rditcm>
AllovH}(Hl) Alk,-4\.l(l!l) Allev59')(2.98)
Alle,41.l(i.46) All.,,.•45.l(l.51) Atk,60.l[UO) Alk,·4ll (2.Jl) i.11«·4a.;(2.11J
Allevl!.l(I 60) Allo,40.l(I 6'i) Alkv4l.l(l.76) All.,,,.46.)(\Al)
Alle,44.2(0.41) Allev4l l(0.46J Alle,48 l(0.24) Alle1·61l.<(O.l4) Alle;·4l.l(O!l'J) Al~d9.l{0.12) All"47.1(-0.04) Alle1·4l.2(--001) Alkv4l.l(-0.40) Alkvl8.l(-0.ll) A II01'40 l( -0. 71 ) All<,46 .l( -0.65)
AII01'4l. \(-1.)l) Alk,(.0.1(-lj!)
All,v4l.\(·l.9l) A\1<1·41.l(·l.18) Alle1·4~.l(.l.09) Allo,46.l(·lJ6) All<,l8.\(-2.0~) Al"'44.1(·?.2l) All<V40,1(·2.l2) Allev4l.1(-2.5,1} AllovS9.1(.l.45} Atlev47.l(·2.l9)
lluyitems ---------------------Figure 8.5 Scale of measures (N'-'659) and item thresholds for alleviation
of concerns {3 thresholds for each ofl2 items).
Notes of figure 8.5
I. Each X represents 3 Rajabhat lecturers
-= LliW
142
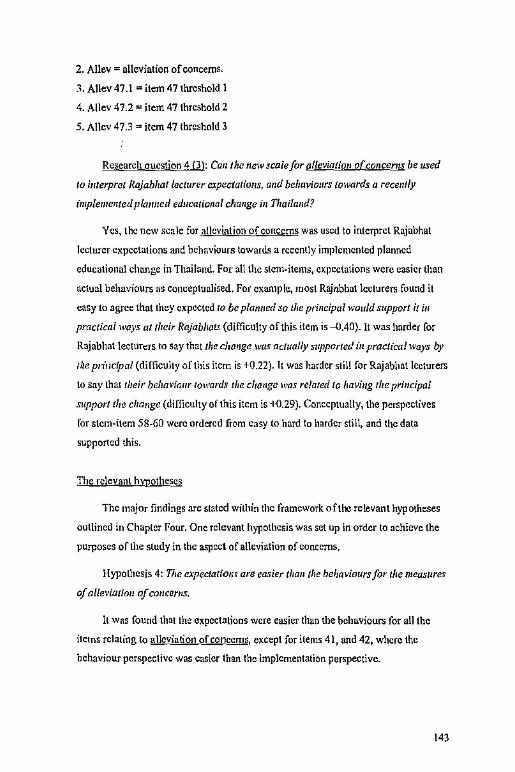
r F ama,e,1n
2. Allev = alleviation of concerns.
J. Allev 47.1 = item 47 threshold 1
4. Al\ev 47.2 = item 47 thrcsho!d 2
5. Al\cv 47.3 = item 47 threshold 3
tmmer
Research question 4 (3): Can the 11ew scale/or pl/eviatio11 of concerns be used
to interpret Rajab/iat lecturer expectations, and behaviours towards a recently
implemented planned educational clwnge ill Thaila11d?
Yes, the new scale for alleviation of concerns was used to interpret Rajabhat
lecturer expectations and behaviours towards a recently implemented planned
educational change in Thailand. For alt the stem-items, expectations were easier than
actual behaviours as conceptualised. For example, most Rajnbhat lecturers found it
easy to agree that they expected to be planned so lhe pd11dpa/ would support it in
practical ways at their Rajab/iats (difficulty of this item is ---0.40). It was harder for
Rajabhal lecturers to say that the c/,a11ge was actually supported in practical ways by
the pniic[pal (difficulty of this item is +0.22). It was harder still for Rajabhat lecturers
to say that their behaviour towards the c/w11ge was related to having the principal
s11ppor/ the change (dif!ieulty oftltis item is +0.29). Conceptually, the perspectives
for stem-item 58-60 were ordered from easy to hard to harder still, and the data
supported this.
The relevant hvpotheses
The major findings arc stated within the framework oft he relevant hypotheses
outlined in Chapter Four. One relevant hypothesis was set up in order to achieve the
purposes orthe study in the aspect of alleviation of concerns.
Hypothesis 4: The expectatio,;1 are easier t/la1J the behaviours for tile measures
of alleviatio11 of concems.
lt wns found that the expect.al ions were easier than the behaviours for all the
itetns relating to alleviation of concerns, except for items 41, and 42, where the
behaviour perspective was easier than the implementation perspective.
'"
143
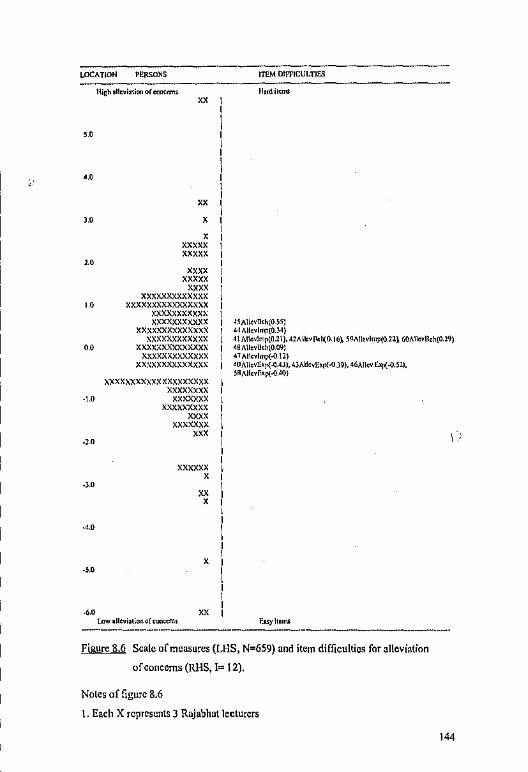
LOCATION
'"
'-"
'"
'"
'"
PERSONS
" ' ' xxxxx
xxxxx xxxx
xxxxx
""' xxxxxxxxxxxxx xxxxxxxxxxxxxxxx
xxxxxxxxxxx xxxxxxxxxxx
xxxxxxxxxxxxxx
WTP =
tTEl,I Dlfl'ICULTIES
11,l\'.li«ms
!SAHevilchtOSI) 44 Allcvlmp(OJ4)
"" xxxxxxxxxxxx
xxxxxxxxxxxxxx xxxxxxxxxxxxx
xxxxxxxxxxxxxx
41 Alle,lm[>(O.lt), 4lAlkv[loli(0.16~ S9Allcvlmp(O.l2~ 60Allevlleh(O.l9) 48A\levll<h(O 091
,,:xxxxxxx~·xx xxxxxxxxx xxxxxxxx
·\.0 xxxxxxx
·l.O
.J.O
4.0
_,,
xxxxxxxxx xxxx
xxxxxxx
"' xxxxxx
'
I.ow all<vi>liono( coown,
"' '
'
4TA11cvl"'l'{-0.\2) <O A tlevfa[>(-0.43 ), 4lAlkvfa[>(-0 .39), 46Alle, E'.xp( -0. Sl), sa,.,ucvfe<p(-0.<0)
F.uyltoms
Figure 8.6 Scale of measures (LHS, N=659) and item difficulties for alleviation
of concerns (RHS, I"' 12).
Noles of figure 8.6
I. Each X represents 3 Rajabhut lecturers
, ... ~
144
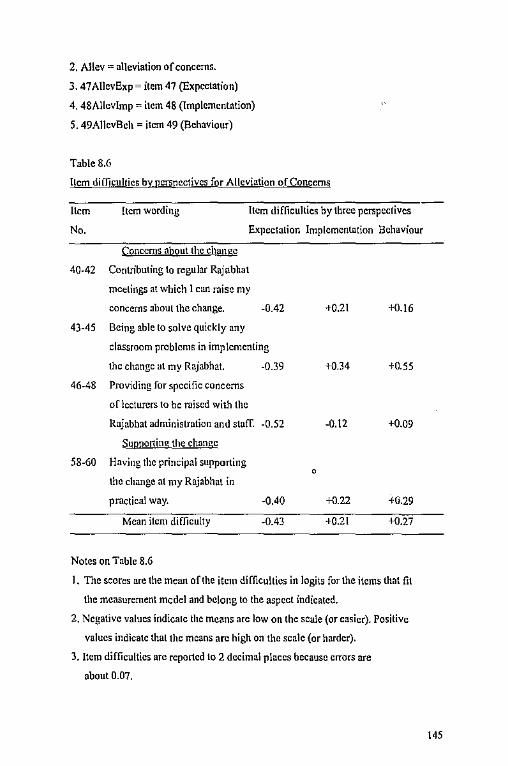
2. Allev = alleviation of concerns.
3. 47AllevExp = item 47 (Expectation)
4. 48Allcvlmp = item 48 (Implementation)
5. 49A11cvBch = item 49 (Behaviour)
Table 8.6
Item diffieu]tics by perspectives for Alleviation of Concerns
Item
No.
!tern wording Item difficulties by three perspectives
Expectation Implementation Behaviour
Concerns about the change
40-42 Contributing lo regular Rajabhat
meetings at which I can raise my
concerns about the change. -0.42
43-45 Being able to solve quickly any
classroom problems in implementing
the change at my Rajabhat. -0.39
46-48 Providing for specific concerns
oflccturers to be raised with the
Rajabhat administration and staff. -0.52
Su1morting the change
58-60 Having the principal supporting
the change at my Rajabhat in
practical way. -0.40
Mean item difficulty -0.43
Notes on Table 8.6
+0.21
+0.34 +0.55
-0.12 +0.09
0
+o.22 +G.29
+0.21 +0.27
I. The scores arc the mean oft he item difficulties in logits for the items that fit
the measurement mcdcl and belong to the aspect indicated.
2. Negative values indicate the means arc low on the scale (or easier). Positive
values indicate that the means arc high on the scale (or harder).
3. Item difficulties arc reported to 2 decimal places because errors are
about 0.07.
145

'BA;:.,·,,;qe;tF!:i'lillPil'Mli"i"''l M"'lllilKI
Learning about the change
Fin?J analysis with 15 items
111e psychometric properties
The final accepted 15 items of the questionnaire (items 64-78) formed a scale in
which there is acceptable (but not good) agreement between al! 659 Raj ab hat iectllr~rs
to the different difflcuHies of the items along the scale. The lndcx of Lecturer
Separability (akin to traditional reliability) for the 15 item scale is 0.92. This means
that the proportion of observed variance considered tr Jc is 92 % (sec Table 8.7). The
items are we!\ targeted against the receptivity n1casurcs. That is, the range ofitcm
thresholds match the range of receptivity measures oft he lecturers on the same scale.
TI1e item threshold values range from -3.0 legits (standard error 0.06) to +3.0 !ogits
(SE 0.06) and the \ccturcr measures range from --6.4 logits to +6.0 legits (see Figure
8.7). There arc only 20 lecturers whose receptivity measures are more than +3.0
logits, and 5 \ccturers whose receptivity measures are less than -3.0 legits. and hence
not 'matched' against an item threshold on the scale (see Figure 8.7). Taken together,
these results indicate that a good scale of receptivity has been created, that the data arc
reliable and consistent, that the errors are small in relation to the measures, and that
the power of the tests-of-fit arc excellent.
Thresholds
The item thresholds of these 15 items range from - 3.0 to+ 3.0 logits (see
Figure 8.7). Figure 8.7 plots the thresholds oft he 15 items (items 64-78) from
/eaml11g aba111 the ch ·11ge on a continuum showing the item difficulty, or order of
items from easy to hard, and the measures from !ow to high. On Figure 8.7, the
measures arc placed on the LHS of the scale and item thresholds (item difficulties) are
placed on the RHS scale. Le~rn 64. l refers to the threshold between the response
categories O and I for item 64; Learn 64.2 refers to the threshold between the response
categories I and 2; Learn 64.3 refers to the threshold between the response categories
2 and 3 for the same item. These thresholds are ordered Learn 64. l (threshold value=
-3.03) is easiest, Learn 64.2 (threshold value= -0.69) is harder, and Learn 64.3
(threshold value= 1.59) is hardest, in line with the ordering of the response
categories. Other item thresholds are fabclcd similarly. Generally, the first threshold is
towards the easy end of the scale (as expected), the second threshold is harder, and the
146
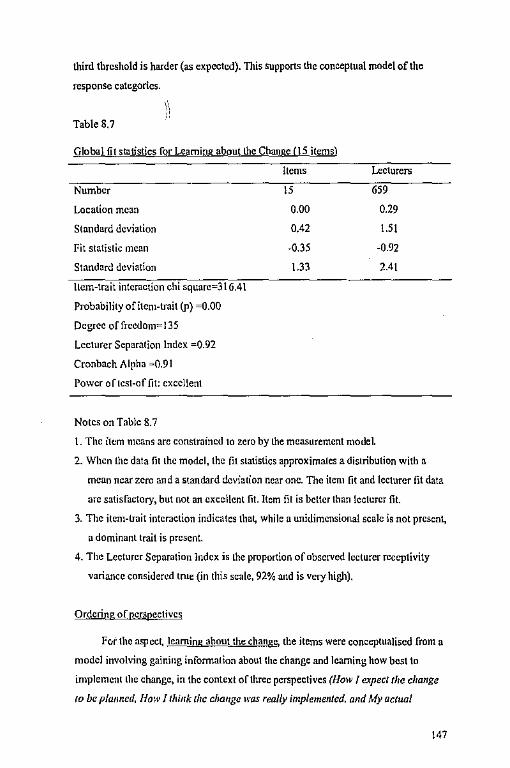
third threshold is harder (as expected). This supports the conceptual model of the
response categories.
Table 8.7
Global fit statistics for Leaming about lhe Change (15 items)
Number
Location mean
Standard deviation
Fit statistic mean
Standard deviation
Hem-trait interaction chi squarc-316.41
Probability of item-trait (p) =0.00
Degree of freedom"'l 35
Lecturer Separation Index =0.92
Cronbach Alpha =0.91
Power or test-of fit: excellent
Notes on Table 8.7
!terns
15
0.00
0.42
.o.35
1.33
Lecturers
659
0.29
1.51
-0.92
2.4\
I. The item means arc constrained to zero by the measurement model.
2. When lhc data fit the model, the fit statistics approximates a distribution with a
mean near zero and a standard deviation near one. The item fit and lecturer fit data
arc satisfactory, but not an excellent fit. Item fit is better than lecturer fit.
3. The item-trait interaction i11dicates tha~ while a unidimensional scale is not present,
a dominant trait is present.
4. The Lecturer Separation lndex is the proportion of observed lecturer receptivity
variance considered true {in this scale, 92% and is very high).
Ordering of perspectives
For the aspect, learning about the chang~ the items were conceptualised from a
model involving gaining infonnalion about the change and learning how best to
implement the change, in the context of three perspectives (How/ crpec/ the change
10 be p/a11ncd, How/ lliink the e/Ja11gc was really implcme/1/ed, and My actual
147
= -behaviour to the clwr.ge involves). The results support the model in relation to
increasing difficulty of the three perspectives. 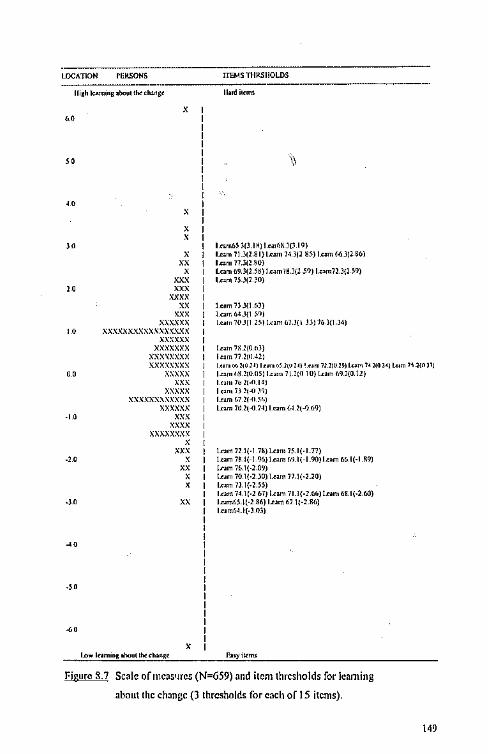
LOCATION rEl!SONS
lliih le,rnong ,t>Ooo ""' duns<
•••
'"
' ' ' ' xx ' )()()(
)()()(
)()()()(
" )()()( )()()()()()(
!IEMS TllltSIIOLDS
ll,r<lil<m$
I I I I I I I \\ I I I I I I I I I I 1.o,m6SJ(J.IH)l<a,6~J(Jl9) I lnm 11.l(l.El}Lo,m 14 lll gS) l.o,mMlll 16) I I.um 17.)(l ~O) I L<,mW.J(l.5!)1<aml8.l{l 59) l.<>mll.l(l 59) I l.<•mlS.J(l :o) I I I t,,mlJJ{I r,J) [ la,"M.J{I SO) I l.<.,n?Ol(I lS)l.<amoJ.J{I l3)16J(l.l4) I I I l.o,m 71 l(O <,l) I l<>m7ll1'14ll
)()()()()()()()()()()()()()()()()(
x.uxx.x )(XX)()()()(
xxxxxxxx xxxxxxxx J Lum'-"' '<0 NI l"m <•l 110 l<I ' "m 71110 lO) lx>r, '4 llO H) l<,t, " l(O llJ
-l.O
.,o
X.\XXX xxx
)()(.\)()(
XXXXXX.\XXXXX xxxxxx
xxx X)()()(
xxxxxxxx ' )()()(
' " ' ' "
I 1-<•rnM liOOl) l.oam 11110 10) 1-'"" 091{0.tl) I I <>t,o lo ll·O 1,1 I I ,m, 7J 11-0 n1 I l.<am 67 l(-O )t,J
I l.oaml01(-074)1caml.-11(.JJ{,9)
I I I I I l.aon 7l I{· I lS) L<,m JS.I(· 1.11) I lam 711{-I %)1-<•m r,•J.l{-1.90)1-<•m 661(-1.R?I I J,.,ml6.l(·lM) I l.e,mlOl{·lJO)l.<>mll.l{·l.lO) I i.<,m ll.1(-l.lS) I l.<>tn lU(·l 67) l.<,rn 71.1(-l M) !nm 68.1(-2.60) I 1-=ntl.l(·l 86) Le,m 61 H·! 86) I l~•mM.1(-l Ol) I I I I I I I I I I I I I I I I
Figure 3.7 Scale ofrneasoires (N=659) and item thresholds for learning
about the change (3 thresholds for each of 15 items).
149
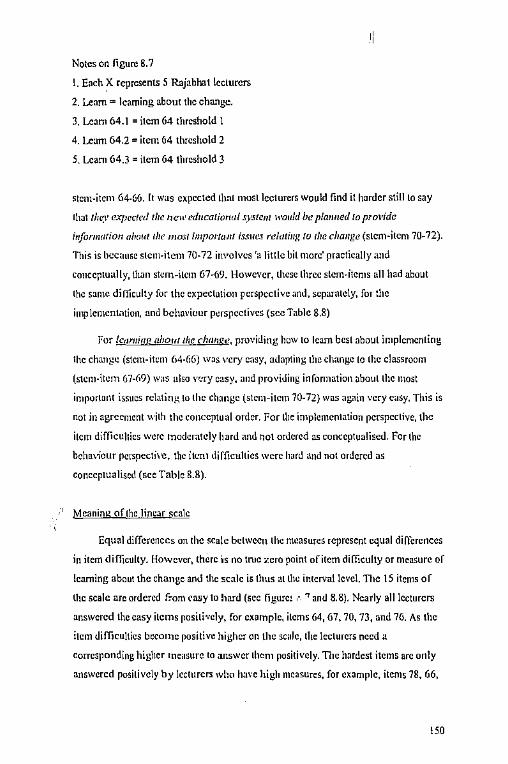
Notes on figure 8.7
!. Each?', represents S Rajabhat lecturers
2. Learn"' learning about the change.
3. Leam 64.1 = item 64 threshold 1
4. Learn 64.2 = item 64 threshold 2
5. Leam 64.3 = item 64 thrcshold 3
s1em-itcm 64.66. It was expected lhal mosl lecturers would find it harder still lo say
lha1 they expecf(',l the new ed11cativrwl system woi,ld be plamwd lo pro1•id<!
illfomwrion 11/J(Jlll 1hc most impol'/11111 is.mes re/atiug to //w change (stem-item 70-72).
This is bcc,n1sc stem-item 70-72 involves 'a little bil more' prac1ically and
conceptually, than stcm-ilcm 67-69. However, these lhrcc stem-items all had about
the same dimculty for the cxpeclation rerspectivc and, separately, fm :he
implementation, and bclm1'iour perspectives (sec Table 8.8)
For le,mrim! 11hor,11/ie clmm;e, providing lmw to learn besl aboul implementing
1hc change (stein-item f,4.(,6) was very easy, adapting the change lo the classroom
(stem·item 67-69) was itlso 1·cry e;1sy, and providing infonnation ~bout the ll\ost
important issues relating 10 the change (stc111-item 70-72) was again very easy. This is
not in agreement with the conceptual order. For llic implementation perspective, the
item diffieullics were tno<lerately hard and not ordered as conceptualised. For the
bcha\iour perspective, the itml dirficuhics were hard and not ordered as
conceptualised (sec Tahlc 8.8).
Meaning ofthc linear scale
Equal differences 011 the scale bclwecn the measures represent equal differences
in item difficulty. However, there is no true zero point of item dimculty or measure of
learning about the change and the scale is thus al the interval level. The 15 items of
the scale arc ordered from i•asy lo hard (sec figure! , ., antl 8.8). Nearly all lecturers
answered the easy ilcms positi.,cly, for example, ilems 64, 67, 70, 73, and 76. As the
item difficulties bccon1c positive higher on the scale, the lecturers need a
corresponding higher tne.isurc to answer them positively. The hardest items arc only
answered positively by lecturers w!w hal'C high measures, for example, items 78, 66,
150
72, 75, and 69. Lecturers with low measures cannot answer these difficult items
positively.
Research questions in rclatjon to !he aspect of learning about [he change
, For the research questions in relation to learning about the chapgc, the major
findings arc stated within the framework of the research questions outlined in Chapter
One.
· Research question 2 (4}: C111111 proper linear scale bc creared for 1/w aspecl,
/e11r11i11g ahn1111/ic duwgc, mi11g" /fosc/1 co111p11ler program?
Yes, a prop~r linear scale w;is -created for the aspect, learning about the change,
using a Rasch computer program The findings indicated that the lecturer measures
(N,.659) and the item difficulties(]"' IS) were calibrated on the same linear scale
where a dominant aspect influenced all !be items. While the data for the 15 items were
rcJ:ahlc, S'Jlllc revision to the item wording is needed to improve validity.
Rcsc,irch question 4 {4): Ca11 ,1 new scale for learning a/Jo1111/lc chwrgc be used
to imcrpn•t llaj11hlr<11 lcc111rcr cxpecru1io11.1 muf bcha1'io1m1 towards a recently
imple11u.:nr,•d plwmci/ cd11catio11al change ill Tlrai/muf?
Yes, the new scale for ~11g about the change was used to intcrprcl Rajabhat
lecturers' expectations, aml behaviours toll'ards a recently implemented planned
educational change in Thailand. For all the stem-items, expectations were easier than
actual behaviours as conccp1ualiscd. f-or example, most Rajablmt lecturers found it
easy to agree 1hm !hey expc·ctcd 1/ic new cd11e1llw1wl sy.1tcm would pro,•ide
i1ifor111111im111/mUI how h,.s, to fr11m 10 imp/c111c1111hc change (difficulty of item 64 is
-0.71 }. 11 was harder for Rajabhat lecturers to say that 1/ac new cd11catio11ul sy.;tcm
acwa//y fJf!J\'ii/L"d i11formlllio11 ubow lio\\' /Jest to /cam to i111plcmc1111hc c/11111gc
(difficulty of item 65 is +0,19). 11 was harder still for Rajabhat lecturers to say that
their ,1c1twl l,clwvim1rs to the ch,mge inmlved le11r11ing how best to implemc/11 the
clumgc (difficulty of item 66 is +0.40). Conceptually, the perspectives of stem-item
64-ii6 arc ordered from easy to hard to harder still, and th: data supported this.
151
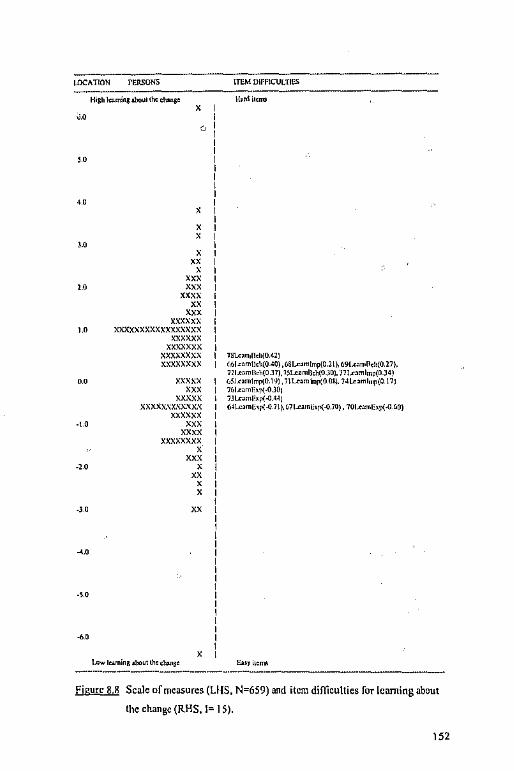
l.OCATlON
'"
'"
'"
'"
"·"
-!.O
4.0
-s.o
rEl\SONS
' ' ' " ' XX)(
)()()( ){){)()(
" "' )()()()()()(
xxxxxxxxxxxxxxxxx )()()(){)()(
)()()()()()()( )()()()()()()()(
)()()()()()()()(
xxxxx )()()(
)()()()()(
xxxxx.xx.xxxxx xxxxxx
)()()(
xxxx xxxxxxxx
' )()()(
' " ' '
ITEM DlfF\CU~Tll:S
H,rd i1<ms
JSL<an,lld~0.4l) r,M-<>mtl,1>(0.40) ,681..,.mln,p(0.21), 69!.<>mRcl,(0.27), 'lll.<>mB,h(O.lJ), 1~Lcamlkh(O.)OJ, J;!.<>mlmp(0.)4) 651.<amlrnp!O.\?), l\L,,,minp(OO!I), 741.J:>mln~(O 171 7M.<>tnhp(.0.l0i 7JL<,mbpl.0.4!) 64\.c,mE,p( .(11\), 07lL>mfap(.0.JO), 701.<,,..~,p(.(l 60)
E>•iiLeml
Figurl" 8.8 Scale of measures (Ll{S, N=659) and item diniculties for learning about
the change (RMS, I= 15).
152
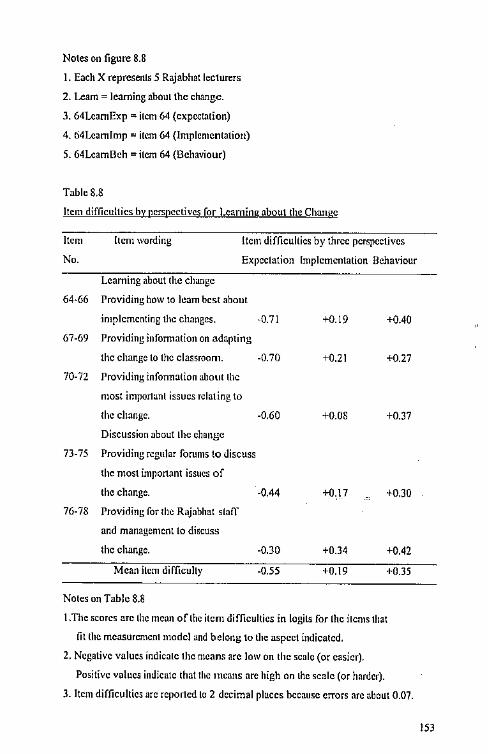
Notes on figure 8.8
I. Each X represents 5 Rajabhat lecturers
2. Learn= learning abnul the change.
J. 64LcarnExp = ilcm 64 (expectation)
4. ti4Lcam[mp = item 64 (Implementation)
S. 64LeamBch = ilcm 64 (Behaviour)
Table 8.8
Item diflicultics by perspectives for Leaming about the Change
Item
Ne.
Item wording !!cm difficulties by three perspectives
Expectation Implementation Behaviour
Leaming about the change
64·66 Providing how to learn bes.t about
implementing the changes. ·0.71 +0.19 +0.40
67-69 Providing infonnation on adapting
the change to the classroom. -0.70 +0.21 +0.27
70-72 Providing infonnation about the
most important issues relating to
the change. -0.60 +0.08 +0.37
Discussion about the change
73-75 Providing regular forums to discuss
the most important issues of
the change. -0.44 +o.17 +0.30
76-78 Providing for the Rajablm! slaff
and management to discuss
the change. -0.JO +0.34 +0.42
Mean ilcm difficulty -0.55 +0.19 +0.35
Notes on Table 8.8
I .The scores arc lhc mean oflhc item difficulties in logils for lhc items that
fit the measurement model and belong to the aspect indicated.
2. Negative values indicate the means arc low on the scale (or easier).
Positive values indicate that 1hc means are high on the scale (or harder).
J. Item difficulties arc reported lo 2 decimal places because errors arc about 0.07.
153
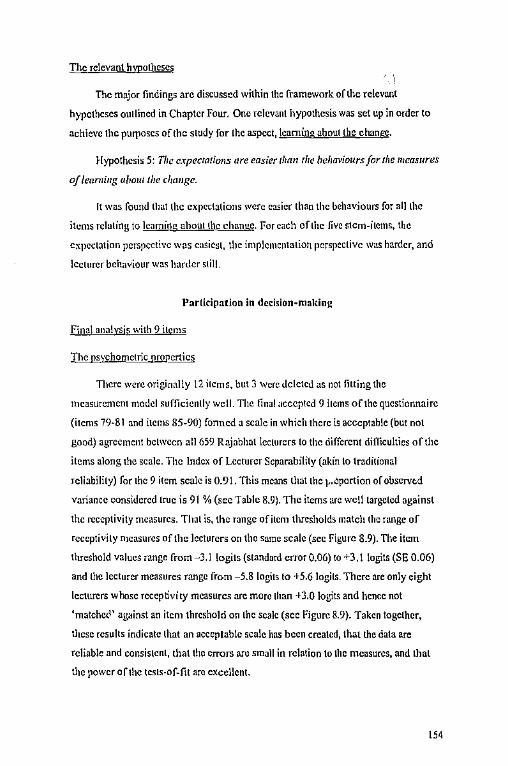
The relevant hypothese~
The major findings are discussed within the framework of the relevant
hypotheses outlined in Chapter Four. One relevant hypothesis was set up in order to
achieve the purposes of the study for lhc aspect, \earning about the change.
Hypothesis 5: T/11: cxpec1mio11s are easier 1/ian the behaviours for tlic 111cas11res
of /e11rni11g 11boul the cliauge.
It was found that the expcc!alions were easier than the behaviours for all the
items rcfating to learning about (he clrnm,1e. For each of the five stem-items, the
c~pectation perspective was easiest, the implementation perspective was harder, and
\cclurer behaviour was harder still.
Participation in decision-making
Fina\ ana!ysjs with 9 items
The psychometric properties
There were originally 12 items, but 3 \\'ere dcletci.1 as not fitting the
measurement moi.lel ~ufficienlly well. The liiial ,1cceptcd 9 items oft he questionnaire
(items 79-81 and items 85-90) fanned a scale in which there is acceptable (but not
good) agreement between all 659 Rajabhat lecturers to the different difficulties of the
items along the scale. The Index of Lecturer Separability (akin lo traditional
reliability) for the 9 item scale is 0.91. This means that the J,,<iportion of observed
variance considered true is 91 % (sec Table 8.9). 1110 items arc we!! targeted against
the receptivity measures. Thal is, the range of item thresholds match the range of
receptivity measures of the lecturers on the same scale (sec Figure 8.9). The item
threshold values range from -3.1 logits (standard error 0.06) to+ 3.1 logits (SE 0.06)
and the lecturer measures range from -5.8 logits to +5.6 logils. There are only eight
lecturers whose receptivity measures arc more than+ 3.0 logits and hence not
'matchCO' against an item threshold on the scale (see Figure 8.9). Taken together,
these results indicate that an acceplable scale has been created, that the data arc
reliable and consistent, that the errors arc small in relation to the measures, and thal
the power of the tests·of.fit arc excellent.
154
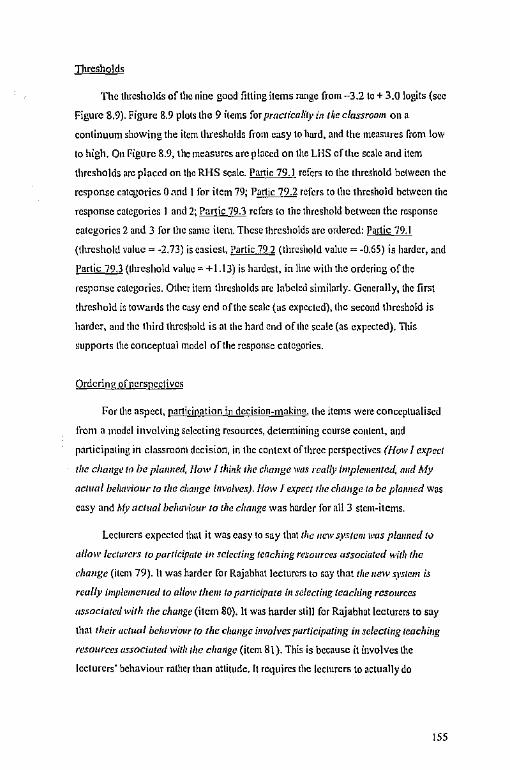
Thresholds
The thresholds of the nine goad fitting items range from -3.2 to+ 3.0 !ogits (sec
Figure 8.9). Figure 8.9 plots the 9 items for practfcah'ty in the classroom on a
continuum showing the item thresholds from easy to hard, and the measures from !ow
to high. 011 Figure 8.9, the measures are placed on the LHS of the scale and item
thresholds arc placed on the RHS scale. Partic 79.1_ refers to the threshold between the
response categories O .1nd 1 for item 79; Partic 79.2 refers to the threshold between the
response categories I and 2; Partic 79.3 refers to the threshold between the response
categories 2 and 3 for the same itcni. These thresholds arc ordered: Partic 79.1
(threshold value= -2.73) is easiest, Partic 79.2 (threshold value= -0.65) is harder, and
Partic 79.3 {threshold value"'+ 1.13) is hardest, in line with the ordering of the
response categories. Other item thresholds arc labckd similarly. Generally, the first
threshold i~ towards the easy end of the scale {as expected), the second threshold is
harder, and the third thrcslmld is al the hard end of the scale (as expected). This
supports the conceptual model of the response categories.
Ordering of perspectives
For the aspect, participation in decision-making, the items were conceptualised
from a model irwolving selecting rcsourees, determining course content, and
participating in classroom decision, in the context of three perspectives (Howl exp eel
the chmrge to be p/111med, /low l tliirik the change ll'as really imp/emellled, out! My
acl1wl belwvi()llr lo the c/iauge i11110/ws). /law l expect the c!w11ge la be p/01111ed was
easy and h(v //Clual beluwio11r lo tl1e c!1m1ge was harder for all 3 stem-items.
Lecturers expected thut it was easy to say that the 11ew sys/em was p/mmed tv
allow /ec/urers to participate in sc/cetillg 1cachi11g resources associaled wilh the
change (item 79). It was harder for Rajabhat lecturers to say that tile 11ew sys/em is
really implemented lo allow them lo Jlilrlicipate i11 selecri11g /eac/1i11g resources
11ssocia1ed with the change (item 80). It was harder still for Rajabhat lecturers to say
that their aclrwl belwvio11r 10 the change involves purticipeting in selecting leaching
resources 11ssociated with the change (item 81 ). This is because it involves !he
lecturers' behaviour rather than attitude. It requires the lecturers to actually do
155
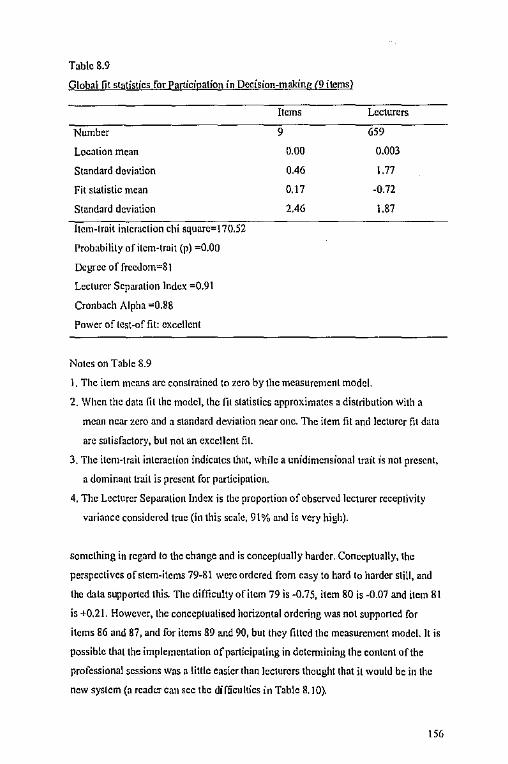
Table 8.9
Global [it statistics for participation in Decision-making (9 items)
Number
Location mean
Standard deviation
Fit statistic mean
Standard deviation
ltem-lrnit interaction chi square-170.52
Probability ofilem-trait (p) =0.00
Degree of freedom=81
Lecturer Separation Index =0.91
Cronbach Alpha "'0.88
rower of lest-of fit: excellent
Notes on Table 8.9
items
9
0.00
0.46
0.17
2.46
Lecturers
659
0.003
1.77
-0.72
1.87
l. The item means arc constrained to zero by the measurement model.
2. When the data fil the model, the /il statistics approximates a distribution with a
mean near zero and a standard deviation near one. The item fit and lecturer fit data
are satisfactory, but not an excellent fit.
3. The item-trail interaction indicates thm, while a unidimensional trait is not present,
a dominant trail is present for participatio11.
4. The Lecturer Separation Index is the proportion of observed lecturer receptivity
variance considered true (in this scale, 91 % and is very high).
something in regard to the change and is conceptually harder. Conceptually, the
perspectives of stem-items 79-81 were ordered from easy to hard to harder still, and
the data supporte<l this. The difficulty of item 79 is -0.75, item 80 is -0.07 and item 81
is +0.21. However, the conccplua!ised horizontal ordering was not supported for
items 86 and 87, and for items 89 and 90, but they filled the measurement model. It is
possible that the implementation of participating in determining the content of the
professional sessions was a little easier than lecturers thought that )l would be in the
new system (a read~,- can sec the difficulties in Table 8.10).
156
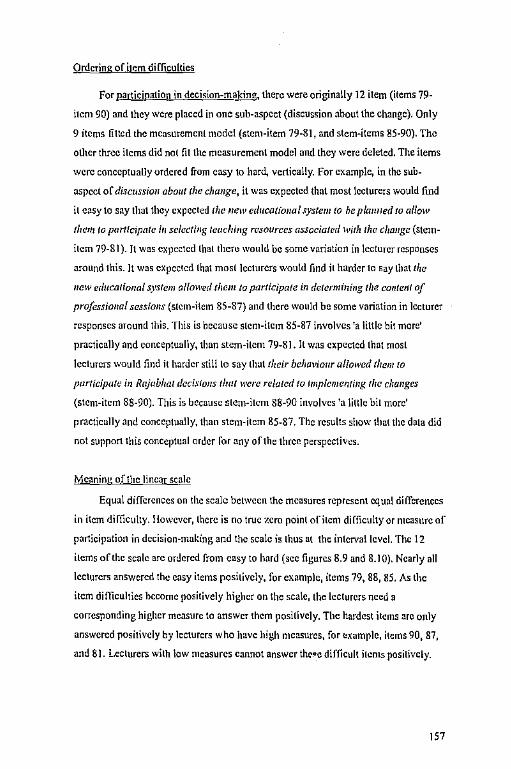
•
Ordering of i)~m difficulties
For participation in decision-making, there were originally 12 item (items 79-
item 90) and they were placed in one sub-aspect (discussion about the change). Only
9 items fitted the mcasuremcnl mode! (stem-item 79-81, and stem-items 85-90). Tho
other three items did not fit the measurement model and they were deleted. The items
were conceptually ordered from easy to hard, vertically. For example, in the sub.
aspect of di.icmsio11 obo1111he change, it was expected that most lecturers would find
it easy to say that they expected /he new educa({o11al system to be pla1med to allow
them to participate il1 sclec1i11g leachi11g resources associated With the c/iauge (stem
itcm 79-81 ). It was expected lhal them would be some variation in lecturer responses
around this. It was expected that mosl lecturers would find it harder to say that the
new erlucalional system a/lowed them ta participate i11 de1ermini11g the co,1/elll of
professional sessions (stem-item 85-87) and there would be some variation in lecturer
responses around this. This is because stem-item 85-87 ir1volves 'a little bit more'
practically and conceptually, than stem-item 79-81. It was expected that mosl
lecturers would find it harder sti!! lo say that their bchal'iaur allowed them to
p11rticipate in Rajabliat rlecislo11s 1/1111 were re/aled to t111pleme111ing the changes
(stem-item 88-90). This is because stem-item 88-90 involves 'a lilllc bit more'
practically and conceptually, than stem-item 85-87. The results show that the data did
not support this conceptual order for any of the three perspectives.
Mcaniru; oft)lc linear scale
Equal differences on the scale between the measures represent equal differences
in item dirriculty. However, there i5 no true zero point ofitem dirticulty or measure of
participation in decision-making and the scale is thus at the interval level. The 12
items of the scale arc ordered from easy to hard (sec figures 8.9 and 8.10). Nearly all
lecturers answered the easy items positively, for example, items 79, 88, 85. As the
item dirtieuhies become positively higher on the scale, the lecturers need a
corresponding higher measure to answer them positively. The hardest items arc only
answered positively by lecturers who have high measures, for example, items 90, 87,
and 81. Lecturers with low measures cannot answer th~~e difficult items positively.
157
41£0,G/1
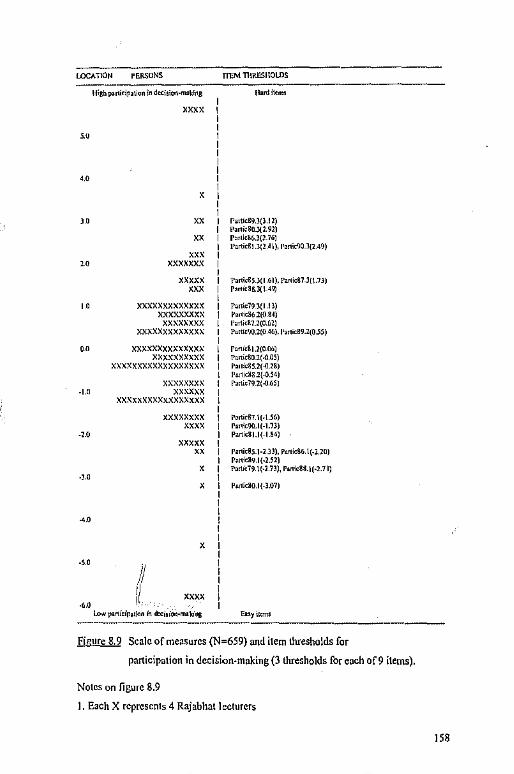
PERSONS 111,M 11\llESltOLDS ---------------------------
·-· ,.
'"
'"
••
-1.0
-l.O
.J.O
so
-S.O
-6.0
xxxx
' ~
" xxx xxxxxxx
xxxxx
'" xxxxxxxxxxxxx xxxxxxxxx xxxxxxxx
xxxxxxxxxxxxx xxxxxxxxxxxxxx
xxxxxxxxxx xxxxxxxxxxxxxxxxxx
xxxxxxxx xxxxxx
xx.~xxxxxxxxxxxxxx
JI [/
xxxxxxxx xxxx
xxxxx " ' '
'
!broit<m,
rarti,89.J(l.l l) ~.n;,80..l(l. 9l) r,,,i,&6.l(l.161 l'articil .J(l.4 I), 1•,n;c<JO.l(U9)
T'artk8S l(l .61), !'>1'ic&7.l(\.7l) r,t1icS~l(l.4\IJ
Pani,79J(l.ll) r,<110862(0 s4J l'arti<Rl.l(0.6l) Pnttic'IO.l(O 46), l'ani,89 .l(0.55)
r,ni,Sl.l(o.01,1 PatticS0.2(·0.05) 1•, .. ic85.l(.(l.l8) l'artic~8.l(.0.54) r,ni,79 l(.(1.651
r,rti,11.1c-U6J r,nic90.1(-1.1l) Pani,81.1(-1 !4)
r,nieis.1-1.JJ), p,10icS6. t(-l.lOJ Partic89.l(-l.52) r,ni,79. \(·l.7l), r,ni,83.1(·2.7 IJ
PorticR0.1(-3.07)
Figure 8.9 Scale of measures (N:659) and item thresholds for
participation in decision-making (3 thresholds for each of9 items).
Notes on figure 8.9
I. Each X represents 4 Rajabhat lecturers
•
158
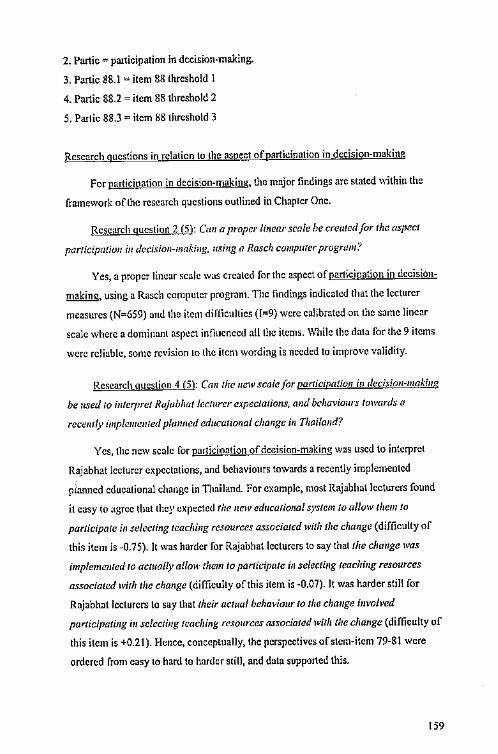
2. Partic = participation in dccision·rnaking.
3. Partic ll8.l = item 88 threshold 1
4. Partic 88.2 = item ll8 threshold 2
5. Par1ic 88.3 = item 88 thrcshold 3
Research questions in relation lo the aspect of participation in decision-making
For participation in decision-making, the major findings are stated within the
framework of the research questions outlined in Chapter One.
Research question 2 (5): Can {I proper li11car scale be created/or the aspect
participatio11 i11 decisio11-11111ki11g. 11.;ing a Rasch compwerprogram?
Yes, a proper linear scale was created for the aspect of participation in dccision
making, using a Rasch computer program. The findings indicated that the lecturer
measures {N=659) and the item difficulties ([=9) were calibrated on the same linear
scale where a dominant aspect inf1ucnced a!l thc items. While the data for the 9 items
were reliable, some revision lo lhe item wording is needed lo improve validity.
Research question 4-.iil: C1111 the 11ew scale for par1ici(!atio11 i11 deci.<irm-maki11g
be used 10 interpret Rajabhat lecturcr expeclalions, and behaviours towards II
recently impleme111ed p/a1111ed educalior1al change iii Thai/1111d?
Yes, the new scale for participation of decision-making was used to interpret
Rajabhat lecturer expectations, and behaviours towards a recently implemented
pianncd educational change in Thailand. For example, most Rajabhal lecturers found
it easy to agree that they expected the new edr1c11tioual system to allow them to
parlicipale i11 selecting teaching resources associated with the cliange (difficulty of
this item is -0.75). It was harder for Rajabhal lecturers to say that the cha11ge was
impleme11ted to ac/110/ly allow them ta participate ill selecti11g leaching resources
associated with the cha11ge (difficulty of this item is -0.07). It was harder still for
Rajabhat lecturers to say that their 11c11111/ behaviour to tile change involved
participating i11 se{ccling tcachi1Jg resources associated with the cha11ge (difficulty of
this item is +0.21). Hence, conccplually, the perspectives of stem-item 79-81 were
ordered from easy lo hard to harder still, and data supported this.
159
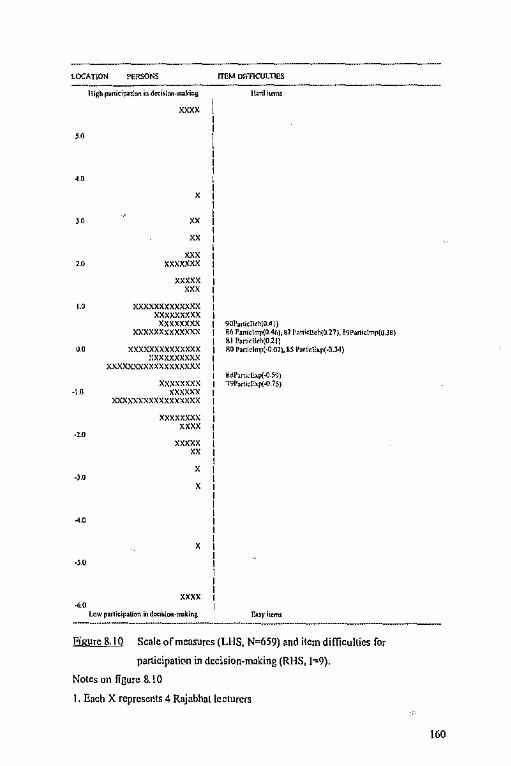
mrr
UXATION
'"
'"
'"
""
·t.O
.z.o
.J.O
.,.
xxxx
" " "' xxxxxxx
xxxxx xxx
xxxxxxxxxxxxx xxxxxxxxx xxxxxxxx
xxxxxxxxxxxxx xxxxxxxxxxxxxx
::xxxxxxxxx xxxxxxxxxxxxxxxxxx
xxxxxxxx xxxxxx
xxxxxxxxxxxxxxxxx xxxxxxxx
xxxx xxxxx
" ' '
'
ITEM DIFFICULTIES
H>.rdil«TlS
901',n;,n,h(o.•t) B~ r,nictrnp(O 4~). SJ l'an1<Boh{0.27), 69Panichp(O.JB) 81 l'an,,Uch(0.21) RO r,nichnp(-0 OJ), gs l',rU,fup(-0.J.4)
aol',nL<E>i>(-0.S<Ji 7W,nicf:>p(-0.75)
r:uyit<m,
Fi sure 8.10 Scale of measures (LHS, N.,659) and item difficulties for
participation in decision-making (RHS, J-.9).
Notes on figure 8.10
1. Each X represents 4 Rajabhal lecturers
160
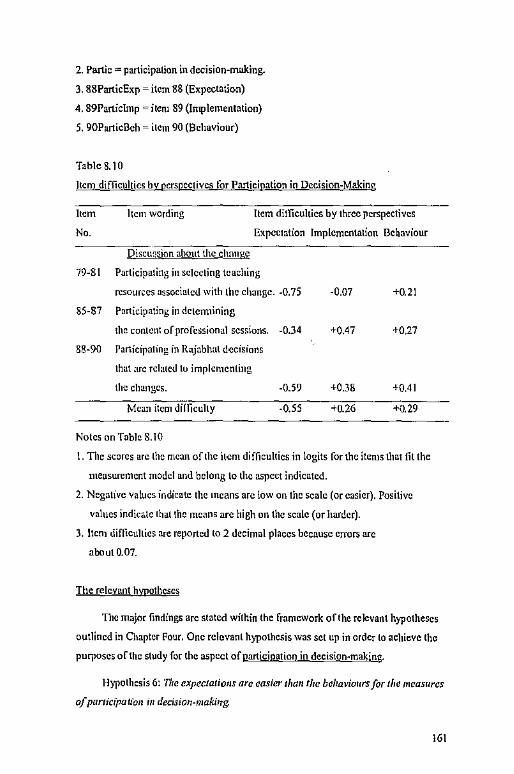
zm:•r a ==
2. Partic-= participation in decision-making.
3. 88ParticExp = item 88 (Expectation)
4. 89Particlmp = item 89 (Implementation)
5. 90ParticBch = item 90 (Behaviour)
Table 8.10
Item difficulties by perspectives for Participation in Decision-Making
Item
No.
hem wording Item di!liculties by three perspectives
Expectation Implementation Behaviour
Discu~sjon ahout the clmnge
79-81 Participating in sclccting teaching
resources associalc<l with ll1e change. -0.75 -0.07 +0.21
85-87 Participating in dctcm1ining
the content of professional sessions. -0.34 +0.47 +0.27
88-90 Participating in Rajabhal decisions
that are related tu implementing
the changes. -0.59 +0.38 +0.41
Mean item di!licuhy -0.55 +0.26 +0.29
Notes on Table 8.10
I. 111c scores arc lhc mean oft he item difficulties in logits for the items that fit the
measurement model and belong to the aspect indicated.
2. Negative values indicate the means arc low on the scale (or easier). Positive
values indic;;tc lhal the means are high on the scale (or harder).
3. Item difficulties arc reported to 2 decimal places because errors arc
about 0.07.
The relevant hypotheses
The major findings are stated within the framework of the relevant hypotheses
outlined in Chapter Four. One relcvanl hypothesis was set up in order lo achieve the
purposes of the study for the aspect of participation in decision,making.
Hypothesis 6: The expcctatio11s arc easier than the behavioflrs for the measflres
ofparticfpalfrm ill decisio1Hmiki1rg.
161
,-;.,'.:.,,,.·
{twas found that the expectations were easier than the behaviours for all the
items relating lo participation in dceision-makipg.
Summary
This chapter has described the process of data analysis for the mode! of!cclurcr
receptivity :u1d presented the results with an explanation or each of the five aspects of
lecturer receptivity to the change (comparison with the previous system, practicality
in the classroom, alleviation of concerns, learning about the change, and participation
in decision-making). A Rasch computer progr;1n1 was used lo create a linear scale for
each aspect. For each aspect, the measures were calibrated from low to high on the
san1e scale as the item difficulties wcic calibrated from easy to hard. For each
measure, the data were valid and reliable and lhc items were each influenced by a
dominant trait. Most of the perspectives for each stem-item were ordered from easy to
hard, and to harder, in line with the conceptual design of the questionnaire, but not all.
The data supported most of the mode! behind the questionnaire (but not all), and the
cvii!cncc supports the view that ihc data ~re valid and reliable.
The data for these five aspects came from 659 Rajabhat lectnrers. For
comparison with the previous system, there were originally 21 items, but only 12
items fitted the measuremen\ model (Separation Index is 0.90). The expectations were
easier than actual behaviours for all items. For practicality in the clnssr2om, there
were originally 18 items, al\ of them fitted the measurement model {Separation index
is 0.92). The expectations were easier than actual behaviours for a!\ the items. For
alleviation of concerns, there were originally 24 items, but only 12 items fitted the
measurement mode\ {Separation J.idex is 0.92). The expectations were easier than
actual behavionrs. For learning aboµt the change, there were originally 15 items and
all of them filled the measurement model {Separation Index is 0.92). The expectations
were easier than actual behaviours for all the items. For participation in decision
making. there were originally 12 items, but only 9 items fitted the measurement
model (Separation Index is 0.91). The expectations were easier than actual
behaviours.
The next chapter continues lhe description of data analysis: questionnaire (Part
2C).
162
CHAPTER NINE
DATA ANALYSIS: QUESTIONNAIRE (Part 2C)
TI1is ch:1ptcr presents Ilic Ra~ch analysis results where the last four aspects
(variables) arc analysed separately. They arc: (1) persona! cost appraisal oflhc
change, (2) collaboration with other lecturers, (3) opportunities for lecturer
improvcmcllt, and ( 4) perceived value for studcnls. Thc presentation of each aspect
contains: ( 1} the psrcho1nctric properties, (2) me,ming of the sc.ilc, (3) research
questions, and (4) the rclc\-.111l h}1101hcscs. Finally, a su111rnary is provided.
Personal cost appr~irnl
Fin,11 analysjs with l 5 items
The psvcl1m11ctric prm~crtics
Th~rc were nriginJlly \8 items, but 3 were deleted as not fitting the
n1e:1suremcru model sL1ffieic11tly well. The final accepted ! 5 items oftbc ques!ionnairc
(items 91-102 :11ul items 106-108) formed a scale in which lhcrcia acceptable (bu1 not
good) agreement bclwccu 11\1659 Rajahhal lecturers lo Che different difficulties oflhe
items alon~ the .,cak. The lmlcx of Lecturer Scparnbility (akin lo traditioiu1I
reliability) for 1l1c l 5 item sc;,lc is 0.9! This mc:ms 1hat the proportion of ohscrm!
v:,rinncc coi1sidcrcd tn1e is 91 % (sec T;1hlc 9.1). The items arc well targeted against
lhc rcc1..-plivity nicas11re:,. Thal is, the r:111gc of item 1hresho\ds matches the r.inge of
receptivity 1nc;1surcs 0(1hc lcctur,~rs on 11ic same scale. The item threshold values
range from -2.R !ogils (st,m<iard error O.Of>} to + 3.2 logils (SE 0.()(,) and the lecturer
mc:isurcs range from -6.2 legits to -+ 6.0 logits. There arc only 12 !cc!urers whose
receptivity 1J1e:1sures arc more than 1·3.2 logits and hence not 'matched' against an
item thre~hold on the scale (sec Figure 9. ! ). Taken log ether, these results indicate that
a good measurement scale of receptivity has been created, that 1hc data arc reliable
and consistent, that lhe errors are small in relation lo the measures, and that the power
of the lcsts-nf·lil are excellent.
16]
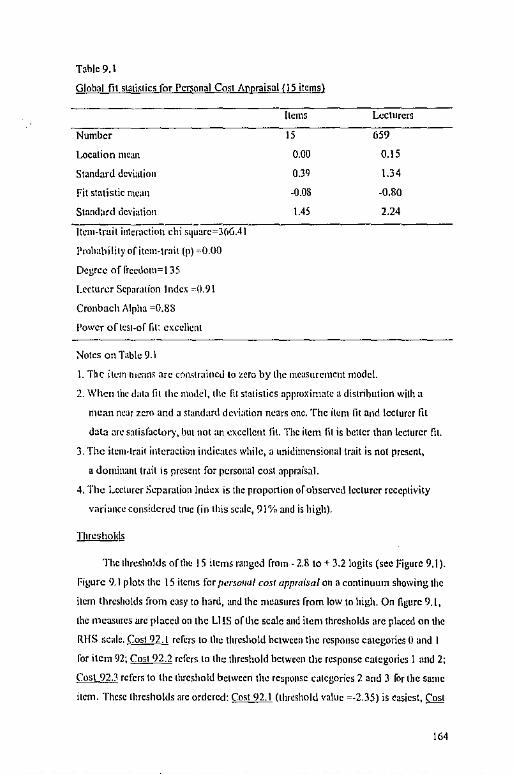
~-v,;wcw1ttwwmez:nwr r 1
Tablc9.I
Global fit statistics for Pcr,;onal Cost AQpraisal {l 5 items)
Number
Location mean
Standar<l deviation
Fit statistic nic;u1
Standard dcl"iat\011
ltcm-truit i11tcr.1ctio11 chi S(]Uarc=J(,6.41
Prohahi!ily of item-trail (p) ,.0.00
Dci;rcc of frccdotn=\ 35
Lecturer Separation Index ~o.91
Cronbach Alpha =0.88
Power oflcs1-of fit: excellent
Notes on Table 9. l
[terns
15
0.00
0.39
-0.08
1.45
Lecturers
659
0.15
1.34
-0.80
2.24
l. The itcm 11,can.1 arc cr>1H!raineJ to zero by the measurement mode!.
2. Whc11 the Jal.i !it the mot.I cl, the !ii statistics approximate a <listrihution with a
mean nc:1r zero an<l a stan<lard <lcl'i.ition nears one. The ilcm !it and lecturer fit
tlata arc satisfactory, bm not an cxccl\cnt fit The item fit is better than lecturer fit.
3. The itcnHruit interaction indicates while, a unitlitncnsional trnit is not present,
a dominant trJil is present for personal cost appraisal.
4. The Lcctllrer Sq>aration Index is the proportion or obscr,.•cd lecturer receptivity
v;iriance considcrc<l tlllc (in this scale, 9!% and is high).
Thresholds
The lhresholds oft he I 5 items rJ11gcJ rrom - 2.8 to+ 3.2 logits (sec Figure 9.1 ).
Fii;urc 9.1 plots the 15 items for J1crs0!11JI cosr appmisa/ on a continuum showing the
item thresholds from easy to hard, aml the measures from low to high. On figure 9. l,
(he mcasmcs arc placed on the L1 !S oflhc scale ant.I item lhrcshokls arc pluced on the
RHS sc;1lc. Cos1 92. l refers to the threshold between the response categories O ant.I 1
for item 92; Cos1 92.2 refers lo the threshold between the response categories l an<l 2;
Cost 92J refers to the lhrcshokl between the response calci;ories 2 an<l 3 for the same
item. These lhrcsho!<ls arc or<lcrcd: Cost 92. 1 (threshold value =-2.35) is easiest, Cost
164
•== z_.,,
75-'fr=
92.2 (threshold value= +o.04) is harder, and Cost 92.3 (threshold value= +2.89) is
hardest, in line with lhe ordering of the response categories. Other item thresholds a:re
labeled similarly. Generally, the first threshold is towards the easy end ofthc scale (as
expected), the second threshold is harder, and the third threshold is harder (as
expcc1cd}. This supports the conceptual model of the response categories.
Ordering nfpqi;pcclivcs
Fnr the aspect, r.ersona\ c9sl apprnisal, the items were conceptualised from a
model involving pro"iding for lecturer's satisfaction with teaching and home life,
better student learning in the classroom, a11d heller classroom ma11agc1m:nt, in 1hc
contc~l of three pcrspcclil'c~ (/fo11· I e.17>(.'C/ 1Ac change lo he plwrned. /low I li1i11k the
chw11;c 11',L< rcullr imp/c111,ml(.·d. and My ac11111/ bchat•iour to the clia11ge im·al\'es).
The results supported the 1110dcl in rclatio11 to increasing difficulty for the three
pcrspecti\'cS. /lo\\' I c•xpcc11/te c/1,rngc lo /1<1 p!amrcd was easy, flow I 1/Ji11k tile
clumge \\'<1s rc11/ly implcmemcrl was harder. and My ucwal bchaviour lo 1/ie c/umge
was harder still for a\11 S i1cms, except for items 95 and 96, items 98 and 99, an(!
items I 0\ ,md 102 where di f!icL1ltics were equal within their error of measurement
(sec Table 'l.2).
For example, 1 /1e /l(S\ ,1)~lc111 ,1.·ni c.rp,•c1cl/ to he pla1111cd to i11crca:;c /cclurcr
.rn11<}i1cti,m with 1cac/,i11i: w/11rl, omwciglis 1/rc e:,;/ra work gc11cratcd for them (item
91) was easy 1<1 a~rcc with. h w;u; harder for a Raj~bhat lecturer to say that 1he 11cw
.1ys1M1 wm really implc111c111cd lo i11c,·casc /cc111rcr smisfi1ctio11 wirl, tcachi11g which
mlll<'d};/,s th,• extrn work [:!"ll<'ril/<'d for th"m {item 92) because implc111entatio11
rcq11ires more than expectation. 11 was hirtlcr ,till for Rajabhat lecturers lo say that
1/reir 11c11111/ h<'haviow 10 1/i(.' d11111se 111crcascd lecturer sati!,fi1etio11 with leaching
which 011/wdgh.11/Jc c.ttm \\'Ork gc11cratcd for tlrem (item 93). This is because il
in,·olves the kcwrcrs' behaviour rather than altitude. It requires the lecturers to
actually do something in regard to the change and is conceptually harder. llcncc,
c,111ceptua\ly. items 91, 92. am! 93 .ire ordered from easy lo hard 10 harder still, ;1ml
thcduta snpportcd this. Tile 1\ifficully of item 91 is -0.36, item 92 is +0.20 and item
93 is ·+ 0.29. 111c conccptua\i~cd horizontal ordering was supported for items 95 and
%, 'JS ,111,j 99, and 101 and 102, fr,r the first two perspectives but the second and third
!(,5
......
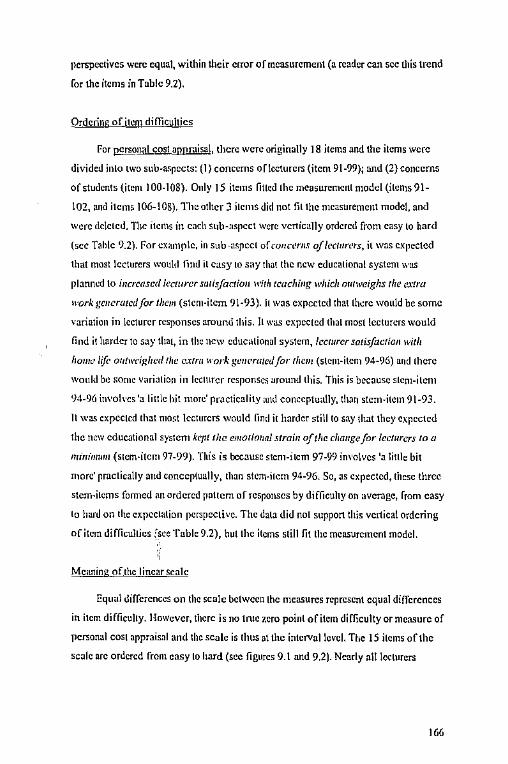
perspectives were equal, within their error of measurement (a reader can see tl1is trend
for the items in Table 9.2).
Ordering of i1em difficulties
For personal cos1 appraisal, there were originally 18 items and the items were
divided inlo two sub-aspects: (1} concerns of!ccturcrs (item 91-99); and (2} concerns
of students (ite1n I 00-108). Only 15 items litlcd the mea,uremenl model (items 91-
102, and items 106-108). The other J items did not fit the measurement mode!, and
were deleted. The items in each sub-aspect were vertically ordered from easy to hard
(sec Table 9.2). For eqmplc, in sub-aspect of cm1ccr11s of frc1ur.•rs, it was expected
that most lecturers wo11\d find il easy to say thut the new educational system was
planned to increased lecwrcr smisfactiou willi teaching which ml/weighs the extra
work generated for them (stem-item 91-93}. h was expected that there would be some
variation in lecturer responses around this. ll was expected thal most lecturers would
find it harder to say that, in the new educational system, /r;ciurcr sotisfuctio11 with
home life 011/wcighcrl ilw cxtrn ll'Ol"k ge11cr111edfar them (sle1n-iten1 94-96) and there
would be some l'<lfi<tlion in lcclurcr responses uround this. This is because stem-item
94-96 involl'cs 'u little hit more' practicality and conceptually, than stcm-ilem 9\-93.
11 was expected that most \ccturers would lind it harder still to say that they expected
the new educational system k,.pl the emotirmal .1train of the cliauge for /cc/11rers to a
minirmm1 (stcrn·itc11197-99). This is because stem-item 97-99 inl'o\ves 'a little bit
more' practically and conccp!ually, than stern-item 94-96. So, as expected, these three
stem-items fo1111ed an ordered pattern of responses by difficulty on average, from easy
lo hard on the expectation perspective. The data did nol support this ve11ica! ordering
of item difficullics ;sec Table 9.2), bul the items still fit the measurement model.
Meaning ofthc linearsca\c
Equal differences on the scale between the measures represent equal differences
i11 item difficulty. I !owever, there is no true 1.cro point of item difficulty or measure of
personal cost appraisal and the scale is thus at the inteival !eve I. The 15 items of the
scale arc ordered from easy lo hard (see figures 9.1 and 9.2). Nearly al! le.:lurcrs
166
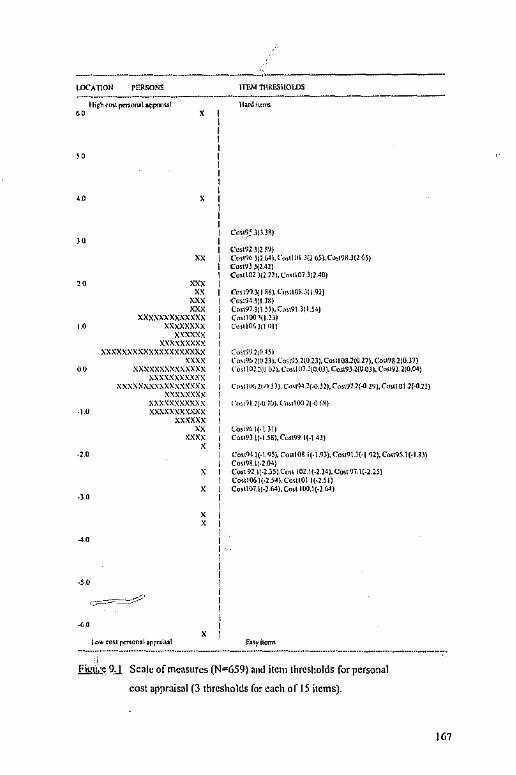
NCP sn:arrn er
-·-----------JTP,t TIHlf.SHOIDS
'" Co<t9lJil m) XX Co,,% Jll ~).l"o,,1111 l{l 6S).Cos,9R.J(l~S)
cu,\9JJ(1All
20 xxx
" )()()(
xxx xxx.,xxxxxxxxx
IO XXXXXXXX )(XXXXX
xxx.xxxxxx xx.xxxxxxxxxxxxxxxxxx
xxxx 00 xxxxxx.wxxxxxx
xxxxxxxxxxx .xxxxxxxx~xxxxxxxx
xxxxxxxx xxxxxxxxxxx
.j O xxxxxxxx.wx
., "
•l.O
.s.o
-(, 0
;
xxxxxx xx
xxxx ' '
' '
Co,<!Ol lil lll. Co,tlOl lilAO)
Ce!t7l l{ I RI) <"u<tlOij Ji 1.91) ("o,:94 J(I.JS) Co,\91.Jil JJJ.C<>s\91 Jll l4) c,,,,100,on1 c.,,,101,J(I 01)
Cust'J'JJ10•Jl r o,,% 110 lJI. CosL'lS l(O lll. co,uoaJ(O 27). Co,,9S 110 J1) C""I 111 l{O 0)1. C<><tl<>l l{O OJ). Cu,t9) l{O OJ). Co,L9l.l(0.04i
co,'1 '"' 11-0 J )), c,,,,91 l{-0.ll). Cost'Jl 1(-0 l'J). CO!OI 01 J(·O ll)
l"o,t%1(·lll) Co,o9J IH lil.Cn!!'N 1(-1 4l)
Co<t'141(· I. 95), cos,IOR I(· l.9)), Co<t9l.lH 92), CO<l'lS. l(·l.iJ) Ca.,9! li-10-IJ Col\ 91 1(-l ll1,c,,,, IOl l(·l l4). Co,1 97. \[.J.lll Co<1I06.l(·l >•).Cu<tlO\ l(·l ll) Co,l\07.l(·l M). Co,! 100.1(-l r.,J
Figµ,·~ 9.J. Scale of measures (N"'659} and item thresholds for personal
cost appraisal (3 1hrcsholds for each of 15 items).
167
Notes on figure 9.1
1. Each X represents 4 Rajabhat lecturers
2. Cost = personal cost appraisal.
3. Cost 92.1 = !lem 92 threshold I
4. Cost 92.2 = !!cm 92 threshold 2
5. Cost 92.3 = Hem 92 threshold 3
answered the easy items positively, for example, items 100, 106, 91, 97, and 94. As
the item dinicullics become positively higher on the scale, the lecturers need a
c111Tesponding higher mc:1surc lo answer them positively. The hardest items arc only
answered positil'cly by lecturers who have high measures, for example, items 95. 96,
99, and 93. Lecturers with low me,1sures cannot answer these difficult items
positively.
Rescari;;h questions in relation 'to the aspect of personal cost appraisal
For the research questions relating to ncrsonal c,1st appraisal, the major findings
arc stated witliin the framework or the research questions outlined in Chapter One.
Research question 2 ((i}: Ca11 a proper linear scale be created for tlte aspe-cl of
personal cos/ appraisal. 1,.1i11g a Rasch compurer program.?
Y cs, a proper linear sca:c was created for the aspect orl}frsonal cost appraisal,
using a Rasch computer program. The findings imlicatcd that the lecturer measures
{N=659) and the item difficulties {l~J 5) were calibrated on the same linear scale
where a dominant aspect influenced all !he ittms. White the data for the 15 items were
reliable, some revision to the item wording is needed lo improve validity.
168
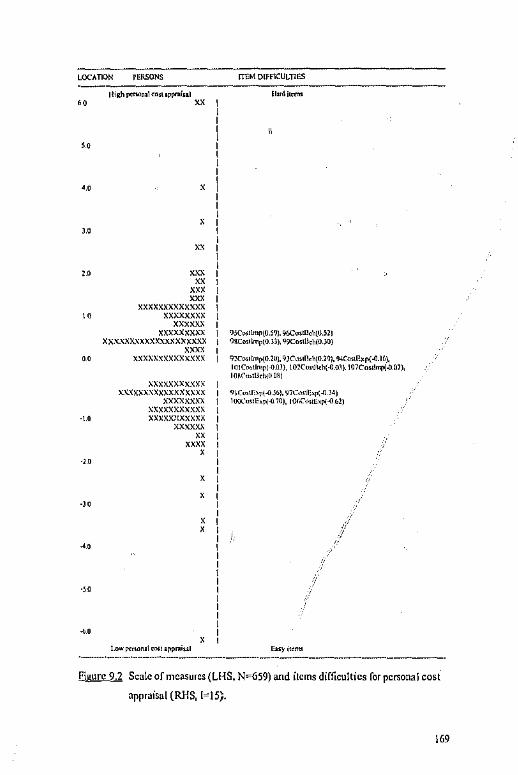
'"
'"
l!igh penon,I conlµl'.W>iul
"
)()(
Ill XXX
" xxx xxx
xxxxxxxxxxxxx \0 xxxxxxxx
xxxxxx xxxxxxxxx
xxx.,;xx.uxxxxxxxxxxxx xxxx
00 xxxxxxxxxxxxxx
xxxxxxxxxxx xx.xxxx.xxxxxxxxxxx
)()()()()()()()(
xxxxxxxxxxx ·\.O XXXXX;'(XXXXX
""
xxxxxx
" xxxx '
' '
ITEM DlfflCULT!ES
~lCo"Imr>(0.5?). %Co,tU,h(O.Sll 'IHCosolmp(O ll). ~9Co,Ul,h(O.l0)
qlCo>I eTif>(O .Jo). ? JC ., .. n, h(O .l ?!. 'J.ICo,\fap( -0.1 I). 1'11Co,Un,p( -0 OJ), \OlCo,tlkh(-0.0)). 107Co"lnq,{.0.0J), 10,r.,,m,n(<>Dil
'll(o,tE,p\-0 )6). 97C,><tl:'l'(-O l4) IOQ(u<thp(--010), 10<.C"<><tbp(-0 61)
Figure 9.2 Scale of measures (LHS, N=659) and items difficulties for personal cost
appraisal (RHS, [=15/.
169
_,,""e,,w,,vM..Jiiltill\rilM,~Jtf;,':'ffl,

Notes on figure 9.2
I. Each X represents 4 Rajabhat lecturers
2. 92CostExp"' !tern 92 (Expectation)
3. 9JCostlmp = Item 93 (Implementation)
4. 94CostBehaviour = Item 94 {Behaviour)
Research question 4 (6): Can the new sc,i/efor perso11al cost appraisal be used
lo imerprct Rojabhar /ec111rcr e:1pectatio11s, and behal'iours towards a recemly
imp/ememcd p/a11ned edr1calimia/ clumge i11 Thailand?
Yes, the new scale for personal cost appraisal was used lo intc!]irct Ra jab hat
lecturer expectations, and behal'iours towards a recently implemented planned
educa1ional change in Thailand. For all the stem-items, expectations were easier than
actual bchavioms as conceptualised. For example, mosl Rajabhat lecturers found it
easy lo agree that lhc new educational system was plallncd to increase /ecwrer
satisfuctio11 with leaclting which 0111weighs the extra workge11eratedfor them
(difficulty of this item is -0.36). It was harder for Rajabhat lecturers to say that the
change actually i11creased lecturcr satisfac1io11 wilh 1eachi11g which outweighs the
extm work ge11cra1edjol' them (difficulty oflhis item is +0.20). It was harder still for
Rajablmt lecturers to say that their actual behJviour to the change involved i11creasi11g
lecl!lrcr satisfaction with leuchi11g which outweighs the extra work geuerutedfor them
(difficulty of this item is +0.29). Conceptually, the perspectives for stem-ilcm 91-93
were ordered from easy to hard to harder still, and the da1a supported this.
The relevant lmmthc:ses
The major findings arc discussed within the framework of the relevant
hypotheses oullincd in Chapter Four. One relevant hypothesis was set up in order to
achieve the purposes of the study for the :ispect, personal cost appraisal.
Hypothesis 7; The c:.,:pectations are easier 1hun the bel111vioursfor the measures
of personal crul appraisal.
It was found that the ~xpectations were easier than the behaviours for a!l the
items relating to personal' cost appraisal.
170

Table 9.2
Jtem difficulties by perspectives for Personal Cost Appraisal
Item
No.
Item wording ]!cm difficulties by three perspectives
faµectation Implementation Beha1•iour
Concerns of lecturers
91-93 lncrea.sing my satisfaction with
teaching which outweighs the
ex:ra work generated for me.
94-96 Making my satisfaction with
home life outweigh the extra
work generated for me.
97-99 Kecpi1,g the emotional strain of
the change for lecturers to
a minimum.
Concerns of students
-0.36
-0.16
-0.34
100-102Making for belier stutk:nt classroom
lcaming to outweigh the extra work
generated for me.
106-1 OS Making for belier cla.ssroom
management which outweighs
-0.69
the extra work generated for me. .Q.62
Mean item difficulty -0.43,
Notes on tab!c 9.2
+0.20
+0.59
+0.33
-0.03
-0.07
+o.20
I. The scores arc the item difficulties in logits for the items that fit
the measurement model and belong to the perspective indicated.
+0.29
+0.52
+0.30
-0.03
+0.08
+0.23
2. Negative values indicate the means are low on the scale (or easier). Positive
values indicate that the means are high on the scale (orh:irder).
3. The difficulties arc reported to 2 decimal places because errors arc ab?ut 0.07
171
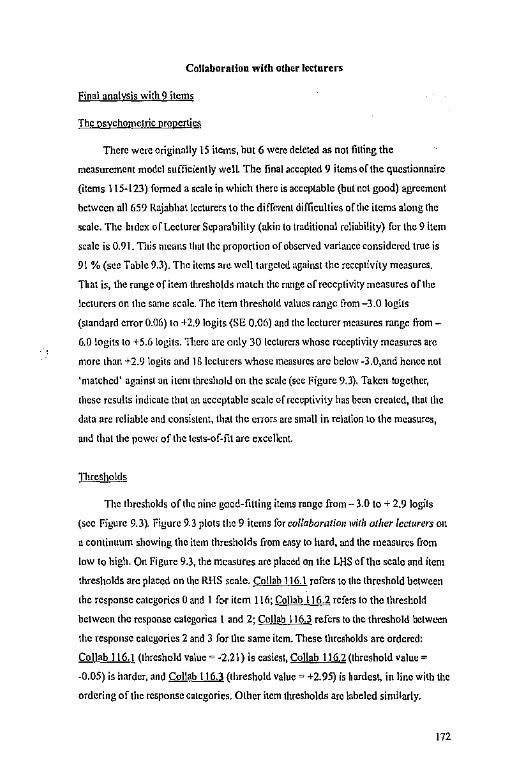
Collaboration with other lettnrer.i
Final analysis with 9 items
The psychometric nropertie&
There were originally IS items, but 6 were deleted as not fitting the
measurement model sufficiently well The final accepted 9 items of the questionnaire
(items 115-123) fonned a scale in which there is acceptable (but not good) agreement
between all 659 Ra jab hat lecturers to the diffe'1enl difficulties of the items along the
scale. TI1e h1dex of Lecturer Separability (akin lo traditional reliability) for the 9 item
scale is 0.91. This means tlrnt the proportion of obscrveJ variance considcrcJ true is
91 % (sec Table 9.3). The items arc wcl! targeted against the receptivity measures.
That is, the range of item thresholds match the range of receptivity measures of the
lecturers on the same scale. The item threshold values range from -3.0 logils
(standard error 0.06) to +2.9 logits {SE 0.06) and the lecturer measures range from -
6.0 logits to +5.6 logits. TI1crc arc only 30 lecturers whose receptivity measures arc
more than +2.9 \ogits and IS lecturers whose measures arc below -3.0,and hence not
'matched' against an item threshold on the scale (see Figure 9.3). Taken together,
these results indicate that an acceptable scale of receptivity has bec11 created, that the
data arc reliable and consistent, that the errors are small in relation to the measures,
and that the power oft he tcs\s-of-iit arc excellent.
111rcsholds
TI1c thresholds oft he nine good-fi1ti11g items range from - 3.0 to+ 2.9 logits
(sec Figure 9.3). Figure 9.3 plots the 9 items for co/!aboralio11 wilh other lecturers 011
a continuum showing the item thresholds from easy to hard, and the measures from
low to high. On Figure 9.3, the measures are placed on the LHS of the scale and item
thresholds arc placed on lhc RHS scale. Co!lah 116.1 refers to the threshold between
the response categories O and I for item 116; Collab 116.2 refers to the threshold
between the response categories I and 2; Coll ab l 16.3 refers to the threshold hclW1-'Cn
the response categories 2 and 3 for the same item. These thrcsholds arc ordered:
Coll ab 116. \ (threshold value= -2.21) is easiest, Collab 116,2 (threshold valu~ =
-0.05) is harder, and Col!ab 116.) (threshold value= +2.95) is hardest, in line with the
ordering of the response categories. Other item thresholds arc labeled similarly.
172
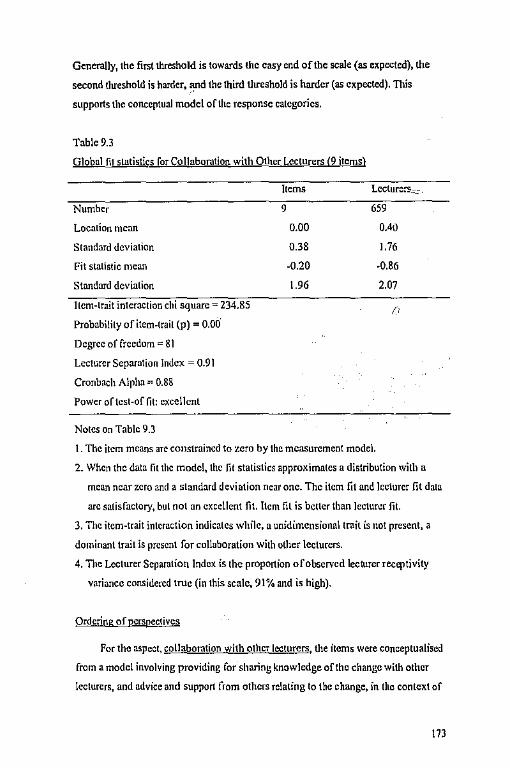
Generally, the first threshold is towards the easy end of the scale (as expected), the
second threshold is harder, ~d the third tlrreshold is harder (as expected). This
supports the conceptual model of the response categories.
Tab!e9.3
Global fi1 statistics for Collaboration with Other Lecturers (9 items)
Number
Location mean
Standard deviation
Fil statistic mean
Standard deviation
Hem-trait interaction chi square - 234.85
Probability of item-trait (p) = O.Oo'
Degree of freedom= 81
Lecll.irer Separation Index = 0.91
Cronbach Alpha= 0.88
Power oftest-of lit: excellent
Notes on Table 9.3
Items
9
0.00
0.38
-0.20
1.96
Lectur:~cc;-.
659
0.40
1.76
-0.86
2.07
I. The item means are constrained to zero by the measurement model.
2. When the data lit the model, the lit statistics approximates a distribution with a
mean near zero and a standard deviation near one. The item fit and kclurer fit data
arc satisfactory, but not an excellent fit. Item fil is better than leetun:r fit.
3. The item-trait interaction indicates while, a unidimensional trait is not present, a
dominant trait is present for collaboration with other lecturers.
4. T11c Lecturer Separation Index is the proportion ofobservcd lecturer receptivity
variance considered true (in this scale, 91% and is high).
Ordering of perspectives
For the aspect, collaboration with other lecturers, the items were conceptualised
from a model involving providing for sharing knowledge of the change with other
lecturers, and advice and support from others relating to the change, in the context of
173
three perspectives (How I expect the change la be planned, How I 1!11i1k the change
was really implemented, and My actual behaviour lo 1/Je change involves). The results
supported the model in relation to increasing difficulty of the three perspectives. How
J expect the c/Ja11ge to be planned was easy, How I tht11k the change was really
imp/eme11red was harder, and My act1ial behaviour to the change was harder still for
all 15 items.
For example, the new sys/em was ex peeled to be p/am1ed fo give sr1pport to
ot/zer leclurcrs al their Rajabliats w'1e11 they ,wed ii ta impleme11t the chu11ge (item
l 15) and was easy to agree with. It was harder for a Rajabhat lecturer to say that the
new educational system is really imj1leml.!11tcd a~.pianned to gil'e support to other
lecturers al their Rojablwts whe11 they 1ieed ii to imple1111.!11t 1/1e change (item 116)
because implementation requires more than expectation. !I was harder still for
Rajabhat lecturers to say that their actual behaviour to the change involved g/1•i11g
sr1pporJ to oilier lecturers al the ii' Rajabliats when they 1ice1/ ii to i111ple111e111 the
c!iange (item I l 7). This is because it involves the lecturers' behaviour rather than
attitude. 1l requires the lecturers lo actually do something in regard to the change and
is conceptually harder. Conceptually, the perspectives for items 115, 116, and 117 arc
ordered from easy to hard to harder still, and the data supported this. The iteni
difficulty oCitcm l 15 is -0.41, item 116 is +0.26 and item 117 is +0.33 (a reader can
see this trend for the other items in Table 9.4).
Ordering of item difficulties
For col]aboration with other lcc\Urers, there were originally 15 items and the
items were divide into two sub·aspeets: (1) sharing knowledge of the change (items
109-114); and (2) advice and support from others (items 115-123). Only 9 items fitted
the measurement model (items 1 I 5-123). The other 6 items did not fit the
measurement mode! and they were deleted. The items in each sub-aspect were
vertically ordered from easy to hard (sec Table 9.4). For example, in sub-aspect of
advice and s11pport from others, it was expected that most lecturers would find it easy
to say that the in new educational system 1/icy \~ere adapted to give support to other
174
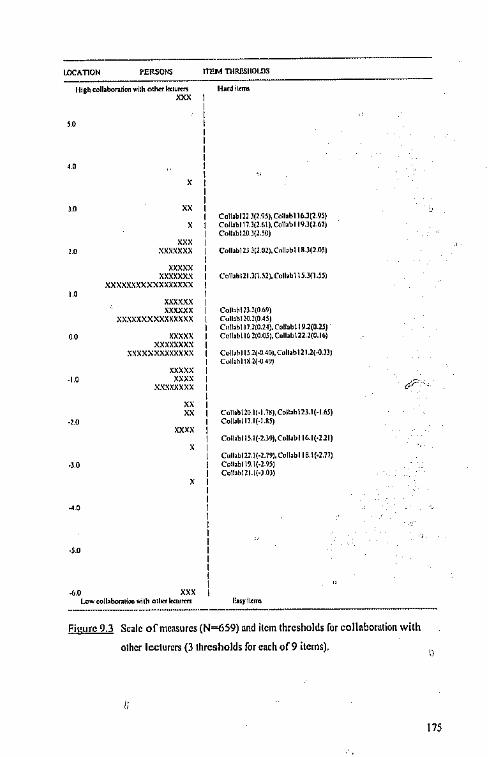
LOCATION PERSONS
11, B~ coll,bon.Oon wilh olh<r lo:IUr<n
'" ,.
••
,.
, ..
.1.0
·1.0
.J.O
·S.o
" • xxx
xxxxxxx xxxxx
xxxxxxx xxxxx.~xxxxxxxxxxx
xxxxxx xxxxxx
xxxxxxxxxxxxxxx xxxxx
xxxxxxxx xxxxxxxxxxxxx
xxxxx xxxx
xxxxxxxx
xxxx
Low coll>bon.1;00 "11h cth<t lo:'"'ffl
ITEM THRESIIOLllS
I I I I
' I I I I I I I I I I I I
' I I
' ' I ' I I
' I ' I I
' I ' ' I ' I ' I I I I I I I
' I ' I I I I I I I I I I
Coll,blll J(l.95), Coll,bl 16.l[l.91) Coll>bl 17.l(l h\), Collabl 19.](l.61) Coll,bllO l{l.JO)
C<ollabl ll )ll 01), Coll,bl 18..l(l.OJJ
Co ll>b I l I .l(Ul ). C oll,b \ l J.l(l .JJ)
Coll.01 ll l{O (,9) Call,blmli04SJ c .. 11abl IJ.ll0.24). Coll,b! 19.l(O.ll) Coil,bl 16110 Ill), Coll>b\ll.l(0.16)
Coll,01 ll l(-0 401, Collablll.l(-0.ll) Coll,bl lg l(-11 4~1
Collab\lD 11·1.l!), Collah\lJ.lH.65) Collahlll.l(·l.Sl)
Coll,bl IS.l(·l.19), Colla bl lld(•l.11)
Cull>bll1.l(·l.l91, Colbbl I a.\(•l,17) Collabl\?. \(-l.9SJ Coll>l>lll.l{·J OJ)
Figure 9.3 Scale of measures (N=659) and item thresholds for collaboration with
o1hcr lecturers (3 thresholds for each of9 items).
" 175
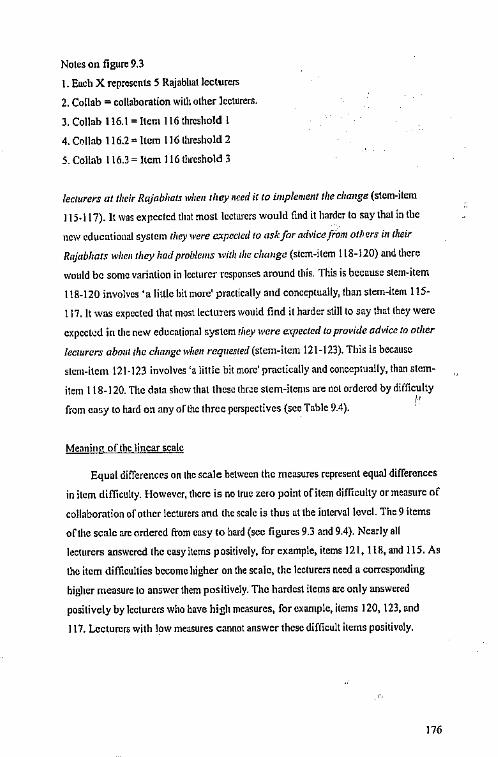
Notes on figure 9.3
I. Each X represents 5 Rajabbat lecturers
2. Co!lab = collaboration with other lecturers.
3. Collab 116.1 = Item 116 threshold !
4. C,:,llab 116.2 = Item 116 threshold 2
5. Col!ab 116.3 = Item 116 threshold 3
/eclurers at their Rajabhats when they 11eed if to implemem the change (stem-item
115-l I 7). It wns expected tl1at most lecturers would find it harder to say that in the
new edueatioual system they were e;,:pecled to ask for advice from others in their
Raj11bhats whe11 they had problems with the change (stem-item 118-120) and there
would be some variation in lecturer responses around this. This is because stem-item
118-120 involves 'a little bit more' practically and conceptually, 1han stem-item I 15-
117. It was expected that most lecturers would find it harder still to say that they were
expected in the new educational system 1/iey were e;o;pected lo provide advice lo other
/ecwrers about the cha11gc when req11es1ed (stem-item 121-123). This is because
stem-item 121-123 involves 'a little bit more' practically and conccptu:dly, than stem-
item 118-120. The data show that these thr~e stem-items are not ordered by difficulty
from easy to hard on any of the three perspectives (see Table 9.4). !'
Meaning of the linear scale
Equal differences on the scale between the measures represent equal differences
in item difficulty. However, there is no true zero point of item difficulty or measure of
collaboration of other lecturers and the scale is thus at the interval level. The 9 items
of the scale arc ordered from easy to hard (sec figures 9.3 and 9.4). Nearly all
lecturers answered the easy items positively, for example, items 121, 118, and 115. As
the item difficulties become higher on the scale, the lecturers need a corresponding
higher measure to answer them positively. The hardest items are only answered
positively by lecturers who have high measures, for example, items 120, 123, and
117. Lecturers with low measures cannot answer these difficult items positively.
176

Research questions in relation to the aspect of collaboration with other le.~turers
For the research questions in relation to co!!ab.:iration with other lecturers, the
major findings are stated within the framework of the research questions outlined in
Chnpter One.
Research question 2 (7): Can a proper !i1Jear scale be created for the aspect,
col/aboralio11 with other lecturers, using a Rasch computer program?
·- Yes, a proper linear scale was created for the aspect of collaboration with other
lecturers, using a Rasch computer program. The findings indicated that the lecturer
measures (N=659) and the item difficulties (!=9) were calibrated on the same linear
scale wh~'rc a dominant aspect influenced all the items. While the data for the 9 items
were reliable, some revision lo the item wording is needed to improve validity.
Research question 4 (7): Can the new scale far ca/iaboralion with a!her
[eLl11rers be used to interpret Rujabhat lecturer CXFectalians, and behaviours towards
a rece111ly i111plemeu1ed p/anued ed11catio11al change in Thailaud?
Yes, the new scale for collaborntion with other lecturers was used to interpret
Rajabhat lecturer expectations, and behaviours towards a recently implemented
planned educational change in Thailand. For all the stem-icems, expectations were
easier than actual behaviours as conceptualised. For example, most Rajabhat lecturers
found it easy to agree that the new educational system was planned /a give support to
other /ec/urers at their Rajabhats w!um /hey need ii to implement the change
(difficulty of this item is -0.41). It was harder for Rajabhat lecturers to say that the
change ac111aliy implememcd to giFe support lo other lec/urers al their Rajabhars
when /hey 11eed it to implement the change (difficulty oftl1is item is +0.26). It was
harder ~till for R~jabhat lecturllrs to say that their actual behaviour to the change
involved giving support lo other lecturers al thr.ir Rajabhats when they 11eeded ii lo
impleme!!l the change (difficulty of this item is +0.33).
177
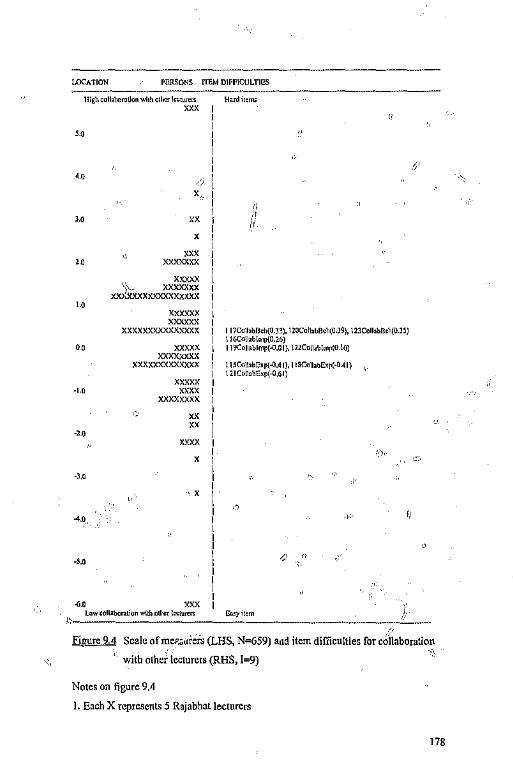
LOCATION P!illSONS rrEM D!FF!CULTillS
High ooll,borotlon whh 011..,, l«turm
""" ,.
'"
'"
•••
-1.0
-2.0
·l,O
-4.0.
-S.O
' """ """"" >= '\__ xxxxxxx
XX>kxxxxxxxxxxx xxxxxx == xxxxxxxxxxxxxxx
xxxxx xxxxxxxx
xxxxxxxxxxxxx xxxxx xxxx
xxxxxxxx ~
" ""
' ". x
,,
" .'r /,'
I 17Coll,blkh(O.Jl), I 20Coll>b0oh(O.J9), l23ColbbBeh(OJS) t IOColl,btm~0.20) I t \>Collablmp(-0.01), \llColl,blmp(O.!O)
l lSCoil>b!;x~-OA I), I ISCall,oE,p(·OAI) \ llCo!,bfap(-0.61)
;;,,
"
Figure 9,4 Scale ofmeP.;;o.1feis (LHS, N=659) aad item difficulties for cO\iaboration
with othef lecturers (RHS, 1=9) .,
Notes on figure 9.4
I. Each X represents 5 Rajabhat lecturers
178
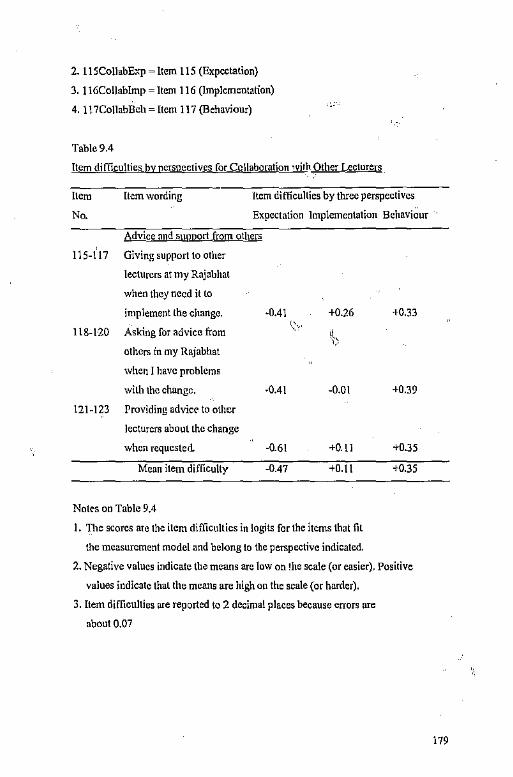
m
2. l ISCoUabE:tp = Item 115 (Expectation)
3. I 16Col\ablmp = Item 116 (lmplernentation)
4. l l 7Co\labBch = Item 117 (Behaviour)
Tablc9.4
Item difficulties bY perspectives for Collaboration with Other Lecturers
Item Item wording Item difficullies by three perspectives
Nc Expectation Implementation BchaviOur
Advice and Sl)IJI!Orl from others
115-117 Giving support to other
lecturers at my Rajabhat
when they need it to
implement the change. -0.41 +0.26
1 lB-120 Asking for advice from I~.,.
( ,, others in my Rajabhat
when I have problems
wilh the change. ·DAI -0.01
121-123 Providing advice to other
lecturers about the change
when requested. -Q.61 +O. ll
Mean item difficulty -0.47 +0.11
Notes on Table 9.4
I. The scores are the item difficulties in !ogits for the items that fit
the measurement model and be],ong to the perspective indicated.
+0.33
+0.39
+o.]5
+0.35
2. Negative values indicate the means are low on !he scale (or easier). Positive
values indicate thal the means are high on the scale (or harder).
3. Item difficulties are reported to 2 decimal places because errors are
about 0.07
179
fl m
The rcJevant hypotheses
The major findings are stated within the framework of the relevant hypotheses
outlined in Chapter Four. One relevant hypothesis was set up in order \o achieve the
purposes of the study in the aspect of collaboration with other lect1trers.
Hypothesis 8: The expectalio11s .are easier thar. the behaviours for the measures
of collpliora/io11 with at[ier /ectrirer:;_,
It was found that the expectations were easier than the behaviours for all thr,
items relating to collaboration with other lecturers.
Opportunities for lecturer improvement
Final analysis with 9 items
The psychometric properties
There were originally 12 items, but 3 were deleted as not fitting tho
measurement model sufficicJ!lly well. The final accepted 9 items of the questionnaire
(items 124" \3S) formed a scale in which there is acceptable (but not good) agre,cmcnt
between all 659 Rajabhat lecturers to the different difficulties of the items ak11g the
scale. The Index of Lecturer Separability (akin to traditional reliability) for the 9 item
scale is 0.88. This means tl1at the proportion of observed variance considered true is
88 % (see Table 9.5). The itr.ms arc \1·el! targeted against the receptivity measures.
That is, the range of item thresholds match the range of receptivity measures of the
lecturers on the same scale. The item threshold values range from -2.6 logits
(standaid error 0.06) to +2.9 logits (SE 0.06) and the lecturer measures range from -
5.6 legits to +5.6 legits. There are forty-four lecturers whose receptivity measures are
more than +2.9 legits, and 8 lecturers with measures less than ~2.6, and henc1J not
'match,::d' against an item threshold on the scale (see Figure 9.5). Taken together,
these results indicate that a scale has been created, hut improvements need lo be made
for a future use of the scale.
180
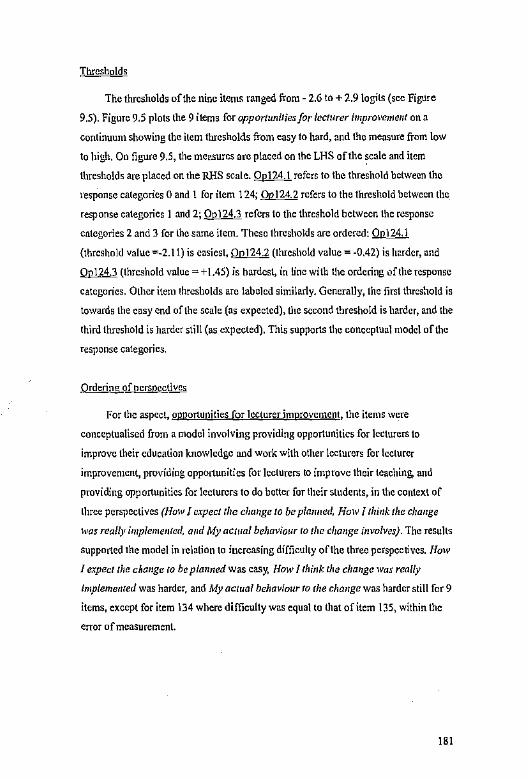
== m ·=·
Thresholds
The thresholds of the nine items ranged from - 2.6 to+ 2.9 \ogits (see Figure
9.5). Figure 9.5 plots the 9 items for opportw1iliesfor ieclllrer improveme11t on a
continuum showing the item thresholds from easy to hard, and the measure from low
to high. On figure 9.5, the me?.surcs arc placed on the LHS of the ~cale and item
thresholds are placed on the RHS scale. Op124. l re fern to the threshold between the
response categories O and I for item 124; QQ.!.ill refers to the threshold between the
response categories I and 2; Op124.3 refers to the threshold between the response
categories 2 and 3 for the same item. These thresholds are ordered: Op124.1
{threshold value =-2.11) is easiest, QlllID (tluesho!d value= -0.42) is harder, und
~ (threshold value= +J.45) is hardest, in !inc with the ordering of the response
categories. Other item thresholds arc labeled similarly. Generally, the first threshold is
towards the easy end of the scale (as expected), the second threshold is harder, and the
third threshold is harder still (as expected). This supports the conceptual mode\ of the
response categories.
Ordering of perspectives
For the aspect, opportunities (or lecturer improvement, the items were
conceptualised from a model involving providing opportunities for lecturers to
improve their education knowledge and work with other lecturers for lecturer
improvement, providing opportunities for lecturers to improve their teaching, and
providing opportunities for lecturers to do better for their students, in the context of
three perspectives (How I expect the cha11ge to be p/amiecl, How I think the change
was really imp/eme1Jied, a11d My ac111al behovio11r to the change involves). The results
supported the model in relation to increasing difficulty of the three perspectives. How
I expect the change 10 bep/an,red was easy, How I lhillk the cha11gc was really
lmpieme11ted was harder, and My ac1ua/ behaviour ro the change was harder still for 9
items, except for item 134 where difficulty was equal to that of item 135, within the
error of measurement.
181
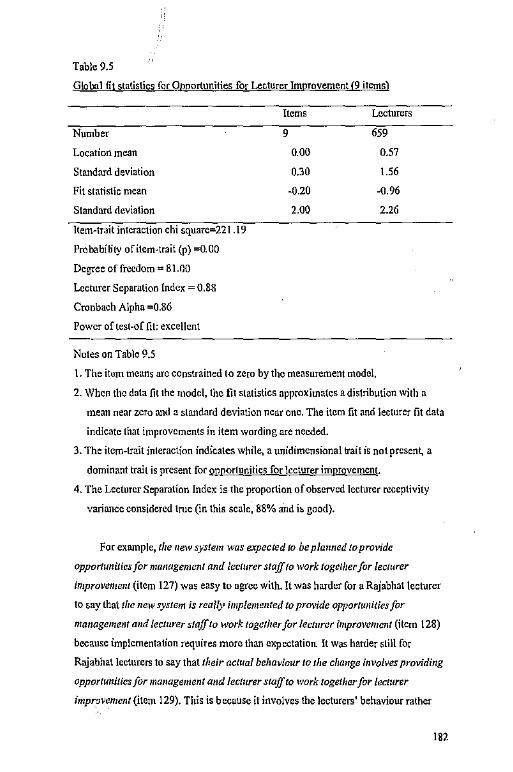
Table 9.5
G!ol.xtl fit statistics for Opportunities for Lecturer Improvement (9 items)
Number
Location mean
Standard deviation
Fit statistic mean
Standard deviation
Item-trait interaction chi square=221.19
Probability of item-trait (p) =0.00
Degree of freedom= 81.00
Lecturer Separation Index= 0.88
Cronbach Alpha =0.86
Power oftest-of fit: excellent
Notes on Table 9.5
Items
9
0.00
0.30
-0.20
2.00
Lecturers
659
0.57
t.56
-0.96
2.26
I. The itom means arc constrained to zero by the measurement model.
2. When tho data fit the model, the fit statistics approximates a distribution with a
mean near zero and a standard deviation near one. The item fit and lecturer fit data
indicate that improvements in item wording are needed.
3. The item-trait interaction indicates while, a unidimensional trait is not present, a
dominant trait is present for ~nities for \ccturer improvement.
4. The Lecturer Separation Index is the proportion of observed lecturer receptivity
variance considered true (in this scale, 88% and b good).
For example, the new system was e.xpccted to be planned lo provide
opportunities for management am{ lecl!/rcr staff to work toge/her for lecturer
improvement (item 127) was easy to agree with. It was harder for a Raj ab hat lecturer
to say that the new system is really implemented to provide opportrmitiesfor
manogeme11t and lecturer staff to work toge/her for lecturer improvement (item 128)
because implementation requires more than expectation It was hartler still for
Rajabhat lecturers to say that I heir actual behaviour to the change involves providing
opportunities for management and lecturer staff to work together for [ecwrer
impr~vement (item 129). This is because it involves the lecturers' behaviour rather
182

than attitude. [I requires the lecturers to actually do something in regard to the change
and conceptually harder. H<.mce, conceptually, items 127, 128 and 129 are ordered
from easy to hard to harder still and the data supported thi~. The difficulty of item 127
is ---0.23, item 128 is +0.34 and item 129 is +0.46.
Ordering of item difficu\tjcs
For Opportunities for lecturer improvement, there were originally 12 items and
the items were divided imo two sub-aspects: (I) teaching improvement (items 124-
129); (2) student improvement (items 130-135). Only 9 items fitted the measurement
mode! (items 124-129, and items 133-\35)(see Table 9.6). The other 3 items did not
fit the measurement mod!.'!, and they were deleted. The items in each sub-aspect were
vertically ordered from easy to hard. For example, in sub-aspect of /eachi1ig
improvement, it was expected that most lecturers would find it easy to say that the
new educational system was planned lo provide opporl1mitiesfor them to improve
their educatio11al k11owledge and r111dcrstamli11g (stern-item 124-126). It was expected
that there would be some variation in lecturer responses around this. It was expected
that most lecturers would find it harder to say that the new educational system
actually p1·ovidcd opporllmi/icsfor ma1111gemc11t 0111/ lec/!lrcr staff lo work together
(stem-item 127-129), and that there would be some variation in lecturer responses
around this. This is because stem-item 127-129 involves 'a little bit mot\,' practically
and conceptually, than stem-item 124-126. So, as expected, these two stem-items
form an ordered pattern of responses by difficulty on average, from easy to hard on
the ell:pcctation perspective.
Meaning of the linear sca)e
Equal differences on the scale between the measures represent equal differences
in item difficulty. However, there is no true zero point of item difficulty or measure of
opportunities for lecturer improvement and the scale is thus at the interval level. The 9
items of the scale are ordered from easy to hard (see figures 9.5 and 9.6). Nearly all
\cclurers answered the easy items positively, for ell:ample, items 124, 133, 127. As the
183
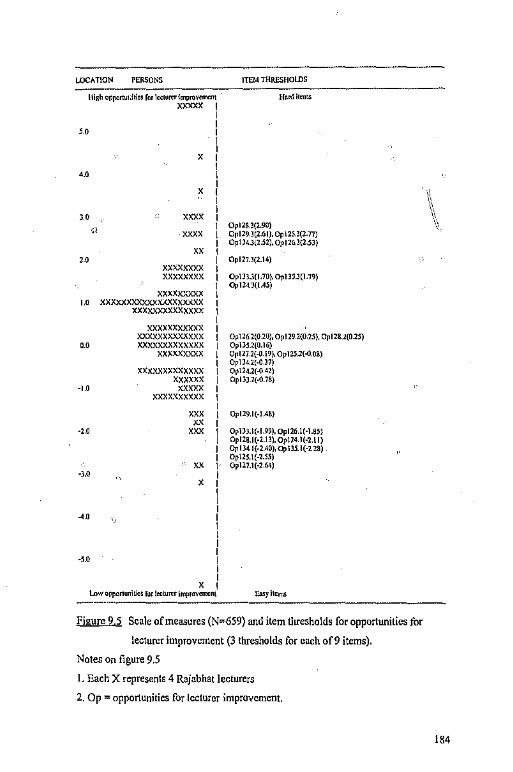
LOCATION PERSONS ITEM 1HRESHOlllS
High opportu1.hie, for lc<lor<rlmpn>,"""'11 Hordilerns
= I I I ,.o I I I
' I I ,.o I I
'vi ' I I '·\ I ,,
,.o '""" I ,,
I Opl28.l(2.90) \\ ,1
""'' I Opl29.l[2.~I). Op l25.l(2.T/J I Opl l4.l(l.52). Opll6.l{2.Sl)
" I ,o I Opll7.l(2.l4) xxxxxxxx I xxxxxxxx I 0p1ii.Jo.10), 0pm.J(J.19)
I Q,lUJ(l.45) xxxx=xx I ,o xxxxxxxxxxxx,cxxxxxxx I xxxxxxxxxxxxxx I
I xxxxxxxxxxx I
xxxxxxxxxxxxx I Op l 26. 2(0 20), Op I l9 l(0.25). Op 128.l(0.25) 0.0 xxxxxxxxxxxxx I Opll5.l(O.l6)
xxxxxxxxx I Opll7.2(--0.19), OpllS.l(--0.0S)
I Opl l4.l(·O.l7) xxxxxxxxxxxxx I Opl2U(--04l)
xxxxxx I OpllJ l(--0.78) -1.0 xxxxx I
xxxxxxxxxx I I
'" I Opl29.l(·l.4&)
" I ·2.0 '" I Oplll.J(.J.99), Op126.l(·l.85}
I Op12S.1(·2.1l). Opll4.1(·2.l I)
I Op 1341(-2.40), Op lli l(·llB) I Op\l5.t(·l.S5)
" I OpllJ.1(·2.64) -).0 I
' I I I I ,.o I I I I I
"' I I I
' I I.ow oppononiOe, for l«tun:r lmpro,mxnt 1,11,yitcms
Figure 9,5 Scale of measures (N~59) and item thresholds for opportunities for
lecturer improvement (3 thresholds for each of9 items).
Notes on figure 9.5
I. Each X represents 4 Rajabhat lecturers
2. Op= opportunities for lecturer improvement.
184
l""fflW'illS IF
3. Or, 124.1 = Item 124 threshold 1
4. Op 124.2 = Item 124 threshold 2
5. Op 124.3 = Item 124 threshold 3
item difficulties become higher on the scale, the lecturers need a corresponding higher
measure to answer them positively. The hardest items arc only answered positively by
lecturers who have high measures, for example, items 129, 126, and 128. Lecturers
with low measures cannot answer these difficult )\ems positively.
Research questions in relation to the asnect oforportµnities for lecturer improvement
For the research questions relating to opportunities for lecturer improvement,
the major findings are stated within the framework of the research questions outlined
in Chapter One.
Research question 2 (8): Ca11 a proper linear scale be created for the aspec~
opportimflies for lecturer improvement, using a Rasch computer program?
Y cs, a proper linear scale can be created for the aspect of opportunities for
lecturer improvemen!, using a Rasch computer program. The Cindings indicated thnt
the lecturer measures (N=659) and the item difficulties (1=9) were calibrated on the
same linear scale where a dominant aspect influenced all the items. While the data for
the 9 items were reliable, some revision to the item wording is needed to improve
validity.
Research question 4 (8}; Can the uew scale far ornortimities (or lecturer
improveme11t be used to in/e1prct Rajah/wt lcct11rer e>:pec/atio11s, and belzavlo11rs
towards a rece11tly implemented planned educational cha11ge in Thailand?
Yes, the new scale for opportunities for lecturer improvement was used to
interpret Raj ab hat lecturer expectations, and behaviours towards a recently
implemented planned educational change in Thailand. For all the stem-items,
expectations were easier than actual behaviours as conceptualised, except for items
134 and 135. For example, most Rajabhat lect..irers found it was easy to agree that
they expected the new educational system to be planned to provide opportunities for
185
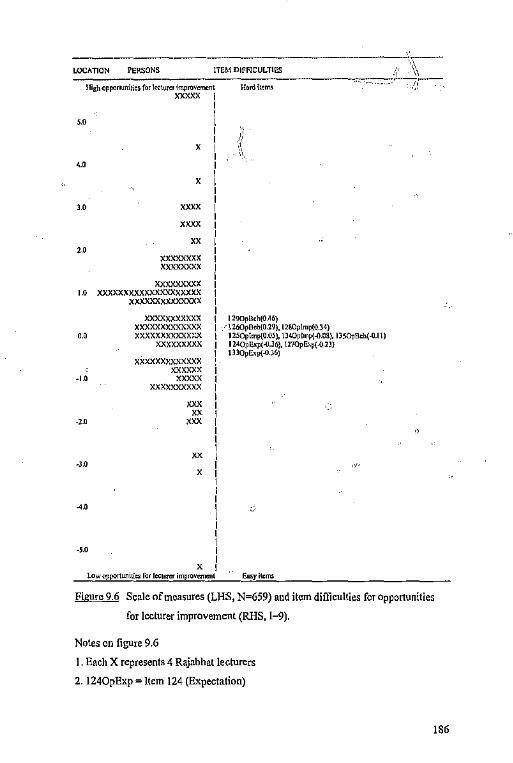
LOCATION PERSONS ITEM DIFFICULTIES
High ~pponunitie, for le<\\ll'CI' impl'O'lomt11\
'" , ..
, ..
, ..
=
'
'
""' '"" "
xxxxxxxx Xl(J[J{)()(XX
xxxxxxxxx
I I I I I I I I I I I I I I I I I I
1.0 xxxxxxxxxxxxxxxxxxxx xxxxxxxxxxxxxx
-1.0
-l.O
-l.0
4.0
XXXXXXXXXXX xxxxxxxxxxxxx xxxxxxxxxxxP:
xxxxxxxxx xxxxxxxxxxxxx
xxxxxx xxxxx
xxxxxxxxxx i : I I
: I
: " I I ' I
I I I
: I I I I
' : Lowop"°11W1itie, for l«lllrer impr<l'l<IUOlll
H,,,Hte""
i :\ •
I 2'10pll,h(0.46) 'l260~!1oh{0.29), 11!.0plmp(0.34)
1250.,lmp{O.OS), tl40plmp{-0.0S), llropllch(-0.1 t) m0pi;.p{-0.J6J, 1210.,E.p{-0.m !llOpfap{-O.J6)
Easyi\cm>
Figure 9.6 Scale of measures (LHS, N=659) and item difficulties for opportunities
for lecturer improvement (RHS, 1==9).
Notes on figure 9.6
1. Each X represents 4 Rajah hat lecturers
2. 1240pExp = Item 124 (Expectation)
186
•->MO"™"" • • ZC& ($ LM,i
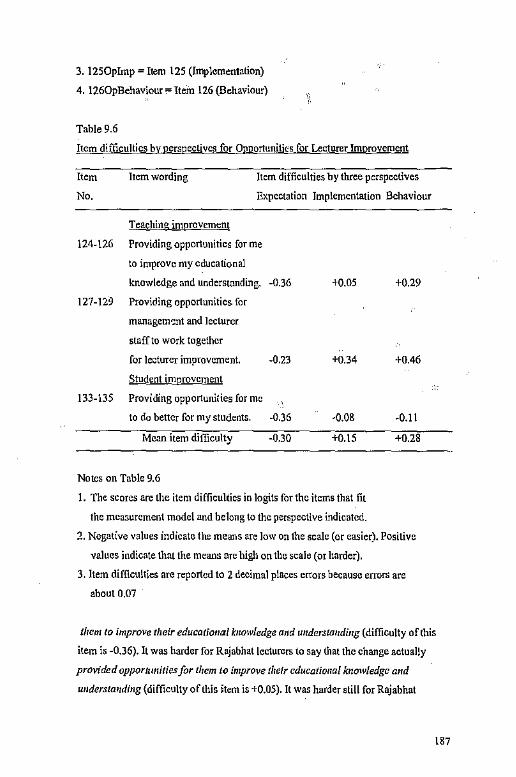
3. 1250pirnp = Irem 125 (Implementation)
4. 1260pBehaviour;: Item 126 (Behaviour)
Table 9.6
[tern difficulties by perspectives for Opportuni\ks for Lecturer Improvement
Item
No.
Item wording item difficulties by three perspectives
Expectation Implementation Behaviour
Teaching improvement
124-126 Providing opportunities for me
to improve my educational
knowledge and understunding. -0.36
127-129 Providing opportunities for
managem-.:nt and lecturer
staff to work together
for lecturer improvement.
Student improvement
133-135 Providing opportunities for me
-0.23
to do better for my students. -0.36
Mean item difficulty -0.30
Notes on Table 9.6
+0.05
+0.34
-0.08
+0.15
1. The scores are the item difficulties in logits for the items that fit
the mea5urcment model and belong to the perspective indicated.
+0.29
+0.46
-0.11
+o.28
2. Negative values indicate the means are ]ow on the scale (or easier). Positive
values indicate that the means arc high on the scale (or harder).
3. Item difficulties are reported to 2 decimal places errors because errors are
about 0.07
them to improve their educational knowledge and u11dersta11ding (difficulty of this
item i5 -0.36). It was harder for Rajabhat lecturers to say that the change actual!y
provided opporll.mities for them to improve their educa/io11a/ knowledge and
u11dersta11di1Jg (difficu\\y of this item is +0.05). It was harder still for Raj ab hat
187

lecturers to say that their actual behaviour to the change involved taki11g part in
activities to improve their educational knowledge and z111derstm1di11g (difficulty of
this item is +0.29). Hence, conceptually, items 124, 125, and 126 aroordcred from
easy to hard to harder still, and the data supported this.
The relevant hypotheses
The major findings are stated wiUdn the framework of the relevant hypotheses
outlined in C'mpter Four. One relevant hypothesis was set up in order to achieve the
purposes of the study for the aspect, opportunities for \ccturcr improvement.
Hypothesis 9: The expectations are easier t/ia11 lhe behaviours for the measures
of opportu11itiesfor lecturer improvement.
It was found that the expectations were easier than the behaviours for all the
items relating to opportunities for lecturer improvement, except fur item~' 134 and
135, where t::11. behaviour perspective was equal to the implementation perspective,
within the error of measurement.
Perceived value for students
Final analysis with l2 items
The psychometric properties
There were originally 15 items, but 3 were de]eled as not fitting the
measurement model sufficiently well. The final accepted 12 items of the questionnaire
(items 136-147) fonned a scale in which there is acceptable (but not good) agreement
between al! 659 Rajabhat lecturers to the different difficulties of the items along the
scale. The Index of Lecturer Separability (akin to traditional reliability) for the 12
item scale is 0.93 This means that the proportion of observed variance considered true
is 93 % (see Table 9.7). The Items arc well targeted against the receptivity measures.
That is, the range of item thresholds matches the range ofreceptivity measures of the
lecturers on the same scale. The item threshold values range from -2.9 logits
(standard error 0.06) to +2.8 logits (SE 0.06) and the lecturer measures range from -
6.0 logits to +6.0 logits. There arc forty lecturers whose receptivity measures are more
than +2.8 logits and 16 lecturers with measures less than -2.9, and hence not
188

1:rzrmz 'l'Pt
'matched' against an item threshold on tl1e scale (see Figure 9.7). Tak.en together,
these results indicate that, while a scale has been created, improvements are needed to
be made in a future use of the scale.
Thresholds
The thresholds of the 12 items range from -2.9 to+ 2.8 logits (see Figure 9.7).
Figure 9. 7 plots thresholds of the 12 items (items 136-147)/or perceived value for
swdents on a continuum showing the item difficulty from easy to hard, and the
measures from !ow to high. On figure 9.7, the measures are placed on the LHS of the
scale and item thresholds are placed on the RHS scale. Value 138.1 refers to the
threshold between the response categories O and 1 for item 138; Value 138 2 refers to
the thn;:shold'between the response categories 1 and 2; Value 138.3 refers to the
threshold between the respo:ise categories 2 and 3 for the same item. These thresholds
are ordered: Value J38.1. (threshold value= -2.87) is easiest, Value ]38.2
(threshold value c=+0.08) is harder, and Value 138.3 {tl1reshold value =+2.70) is
hardest, in line with the ordering of the response categories. Other item thresholds are
labeled similarly. Generally, the first threshold is towards the easy end of the scale (as
expected), the second threshold is harder, and lhe third threshold is harder (as
expected). This supports the conceplua\ model of the response categories.
Ordering ofncrspcctives
For the aspect, perceived value for students, the items were conceptualised from
a model involving providing for the needs of students, discussing the change with
students, and discussing the change with parents, in the context of three perspectives
(How I expect the change to be plmmcd, How I think the change was really
implemented, and My actual behaviour lo the change involves). The results supported
the model in relation to increasing difficulty of the three perspectives. How I expect
the change lo be pla11ncd was easy, How I think the change was really implemented
was harder, and My actrial bchavio11r ta the clia11gc was harder still) for 12 items,
except for items 140 and 141 whose difficulties in the implementation perspectives
and behaviour perspectives are equal, within the error of measurement (see Table
9.8).
189
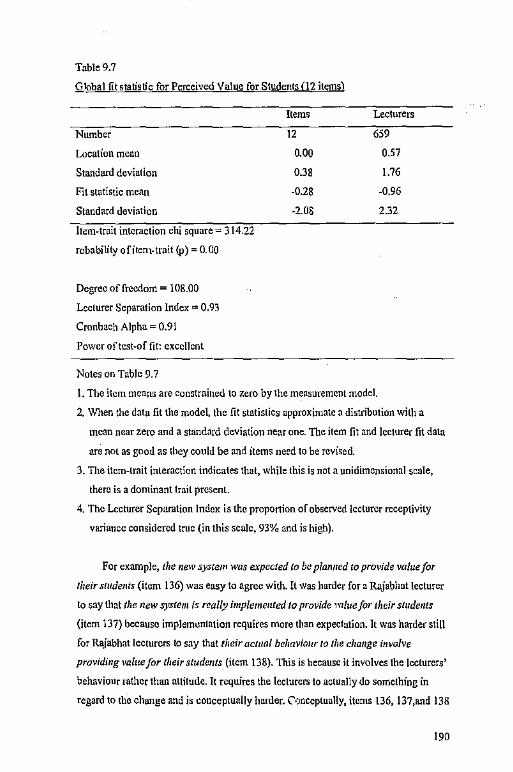
"'""" . -,--
Table 9.7
Q.lobal fit statistic for Perceived Value for Students (12 items)
Number
Location mean
Standard deviation
Fit statistic mean
Standard deviation
Item-trait interaction chi square 314.22
robability of item-trait (p) = 0.00
Degree offrcedom = 108.00
Lecturer Separation Index= 0.93
Cronbach Alpha= 0.91
Power oftest-of fit: excellent
Notes on Table 9.7
Items
12
•oo 0.38
-0.28
-2.08
Lecturers
659
0.57
1.76
-0.96
2.32
I. The item means are constrained to zero by the measuremcm model.
2. When the data fit the modeL the fit statistics approximate a distribution with a
mean near zero and a standard deviation near one. The item fit and lecturer fit data
are not as good as they could be and items need to be revised.
3. The item-trait interaction indicates that, while this is not a unidimensional scale,
there is a dominant trail present.
4. The Lecturer Separation Index is the proportion or obseived lecturer receptivity
variance considered true (in this scale, 93% and is high).
For example, the new sys1e111 was expected lo be p/a1111ed to provide value/or
their s1Ude11ts (item 136) was easy to agree with. It was harder for a Rajabhat lecturer
to say that the 11ew system is really implemented to provide m!ue for their students
(item 137) because implem,.mtation requires more than expectation. It was harder still
for Rajabhat lecturers to say that tliefr actual behaviour to tile change in valve
providing value for their students (item 138). This is because it involves the lecturers'
behaviour rather than attitude. It requires the lecturers to actually do something in
regard to the change and is conceptually harder. ('.)nceptually, items 136, 137,and 138
190
are ordered from easy to hard to harder still and the data supported this. The difficulty
of item 136 is .....0.53, item 137 is -0.17 and item 138 is --0.03 (a reader can see this
trend for the other items in Table 9.B).
Ordering ofitem difficulties
For perceived value for students, there were originally 15 items and these items
were divided into two sub-aspects; (1) value of the change for students {items 136-
144); and (2) discussion of the change {items 145-150). Only 12 items fitted the
measurement model (items 136-147). The other 3 items {item; 148-150) did not fit the
measurement model and they were deleted. The items in each sub-aspect were
vertically ordered from easy to hard {see Table 9.8). For exa1uple, in sub-aspect of
value of the change for students, it was expected that most lecturers would find it easy
to say that the new educational system was pl aimed lo provide t•aluefor 1/ieir students
(stem-item 136-!38). It was expected that there would be some variation in lecturer
responses around this. It was expected that most lecturers would find it harder to say
that the new educational system was imp/eme111ed lo provide for the needs of their
st11de11ts {stem-item 139-141) and there would be some variation in lecturer responses
around this. This is because stcm-ilem 139-141 involves 'a little bit more' practica\\y
and conccplually, than stem-item :136-138. It was expected that most lecturers would
find it harder still to say that their behaviour involved providing for good student
lea ming {stem-item 142-144). This is because stem-item 142-144 involves 'a little bit
more' practicality and conceptua!ly, than ~tem-ilem 139-I4n So, as expected, these
three stem-items form an ordered pattern of responses by difficulty on average, from
easy lo hard on the expectation perspective. The data mostly supported this
conceptualisation for the three perspectives (see Table 9.8).
Meaning of the linear scaJe
Equa! differences on the scale between the measures represent equal differences
in item difficulty. However, there is no true zero point of item difficulty or measure of
perceived value for students and the scale is thus at the interval level. The 12 items of
the scale are ordered from easy to hard {see figures 9.7and 9.8), Nearly a!! lecturers
191
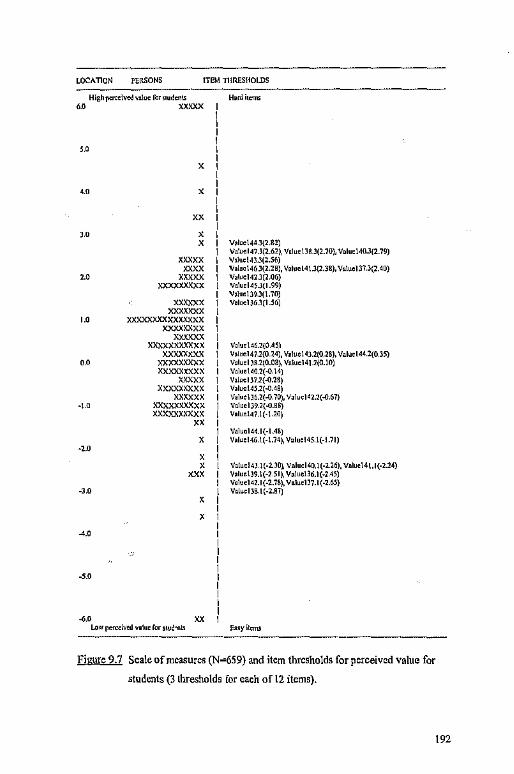
Mrr7:n
LOCATION PEil.SONS ITEM Tl!RESUOUJS
Higt,pa,:o\V«l -,\ue ro, !luda,IS
" =
,.,
,.,
,,
,.,
,.,
·1.0
x
x
" x x
""'" = """" XXJOOO(XXX
""'"' """"'' xxxxxxxxxxxxxxx ,oo:xxxxx
'"""' xxxxxxxxxxx """'= xxxxxxxxx
xxxxxxxxx xxxxx
xxxxxxxxx xxxxxx
xxxxxxxxxx xxxxxxxxxx
"
HaolitcmS
Voluo\44.3(2.82) v,:uo147J(U2), Volud3B.l(2.70), Volue140.l(2.19) v,lud43J(:!.56) v,luo \ 46.3(2.2 8), Volue l 4 \J(l.38), Value 137 .3(2.40) V,luel4:!.l(l.06) v,luel45J(l.99) Vo\uell?.l(l.70) Volu<l)6.l(1.S6)
Value146.2(0.45l v,1,, 14 7.l(0.24), V,luo l U.2(0.18), Value 144.2(0.35) V,luel J&.2(0.08t Va1ue14J.2(0.!0) Volue\40.1(-0. \4] V,luelJJ.l(-0.28) v,luo!45.l(-0.48) V,luo\Ji.2(-0.70), V,lue14l.2(-0.67) VoluelJ9.l(-O.BB) Voluo\47.l(·\.20)
v,lue14tl(·l .4BJ X V,luol46. t(-1.74~ Voluol45.l(-1.11)
·2.0
-3.0
4.0
,.,
x x
V,lucl4J. l(·ll0) Volud40,1(·2.26). Volue\4!.l(-2.l4) Volue\J9.1(·2 51), Valuell6.1(-2.4S) Vo luel 42.1 ( -2.78), Valuel 31. l ( -2.65) VoluelJB.!(·2.87)
Low pe=ived v,lue for s!uO"IIS l'-asy items ------------------ ------Figure 9.7 Scale of measures (N-=659) and item thresholds for perceived value for
students (3 lhresholds for each of 12 items).
192

Notes on figure 9.7
I. Each X represents 4 Rajabhat lecturers
2. Value= perceived value for students
3. Value 138.\ = Item 138 threshold I
4. Value 138.2 = Item 138 threshold 2
5. Value 138.3 = Item 138 threshold 3
answered the easy items positively, for example, items 139, 136, and 142. As the item
difficulties become positively higher on the scale, the lecturers need a corresponding
higher measure to answer them positively. Thr. hardest items are only answered
positively by lecturers who have high measures, for example, items 144, 147, and
146. Lecturers with low measures cannot answer these difficult items positively.
Research questions in relation to the aspect of perceived value for student,
For the research questions relating to 11erceived v;ilue for students, the major
findinp;s are slated within the framework oft he research questions outlined in Chapter
011e.
Research question 2 (9): Call a praper /i11ear scale be created for tlte aspect,
perceived va/i1efor sllldc11ts, using a Rasch computer program?
Yes, a proper linear scale was created for the aspect of perceived value for
students, using a Rasch computer program. The findings indicated that lhe lecturer
measures (N:659) and the item difficulties (I=l':J were calibrated on the same linear
scale where a dominant aspect innuenccd all the items. While the data for the 12
items were reliable, some revision to the item wording is needed to improve validity.
Research question 4 {9): Can the new scale/or perceived value [or studP11ts be
used to interpret Rajabhal lecturer expectations, and bchavior1rs towards a recently
i111plemc11tcd planned educational change in Thailand?
Yes, the new scale for perceived value for students was used to interpret
Raj ab hat lecturer expectations, and behaviours towards a recently implemented
planned educational change in Thailand. For all the stem-items (except 139-141),
193
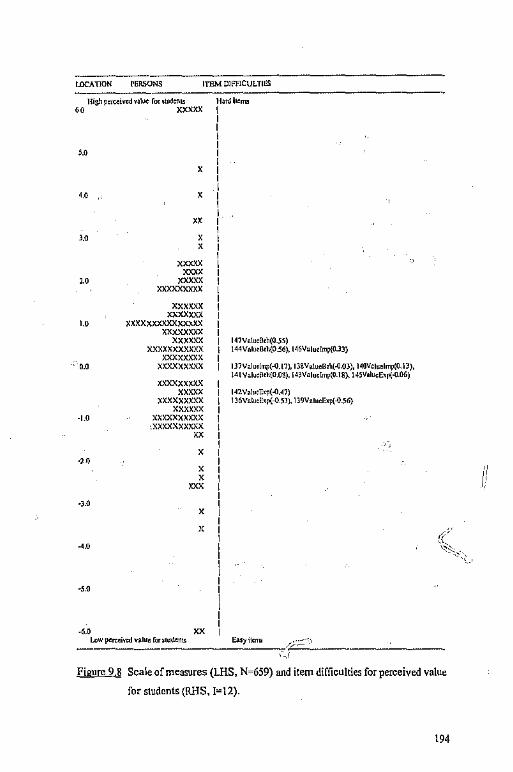
1117 =
t.OCAUON rERSONS ITEM DH'FICULTIES
Hi&h pet«iV<d voloe rm ,tudeolS H•nl ;"'"" 6-0 xxxxx I
, ..
, ..
, ..
•••
· 0.0
·1.0
•J.0
4.0
"'"" = ""'' xxxxxxxxx
xxxxxx xxxxxxx
)(XXXXXXXXX,oo;XX xxxxxxxx
xxxxxx xxxxxxxxxxx
xxxxxxxx xxxxxxxxx xxxxxxxxx
xxxxx xxxxxxxxx
xxxxxx xxxxxxxxxx
·.xxxxxxxxxx
"' ' ' ' "" ' x
"'
l~iValooD,h(O.~S) 144Valueil<h(0.S6), 146Valu<lmp(O.l3)
137 Val ool~( .Q. l"l), 1 lSV •\uoBoh( .0.0l ), 140V <luelmp(O. l 3), 141 Value~<h(O.OS). 14JValu,lmp(0.18). 145VolucExp(.0.06)
142Voluoll<p(.Q.4i) I l6ValueE,p{--0.Sl). I J9VolueExp(-0.S6)
Lowp<rcei,cd value for>1u<len1> Easy item, •.. -------------------·"',~-----·--------t .. ,
Figure 9,8 Scale of measures (LHS, N=659) and item difficulties for perceived value
for students {RHS, 1=12).
194
ii '
WWW...WWWBJL·C __ ' .. ·-
Notes on figure 9.8
1. Each X represents 4 Rajabhat lecturers
2. Value= perceived value for students
3. 136ValueExp = Item 136 (Expectation)
4. 137Va\ueimp = Item 137 (Implementation)
5. l38ValueBch = Item 138 (Behaviour)
expectations were easier than actual behaviours as conceptualised. For example, most
Rajabhal lecturers found it was easy to agree that the new cducationai system
provided vai11efor their sl!lde11ts (difficulty of this item is -0.53). It was harder for
Rajabhat lecturers to say that the change actually provided value for their s111de111s
(difficulty of this item is -0.17). It was harder still for Rajabhat lecturers to say that
their actual behaviour to the change provided value for their students (difficulty of
this item is -0.03). Hence, conceptually, the perspectives for stem-tern 136-138 were
ordered from ensy to hard to harder still and the datn supported the conceptualisation
of the scale for perceived value for students.
The relevant h)Potheses
The major findings are stated within the framework of the relevant hypotheses
outlined in Chapter Four. One relevant hypothesis was set up in order lo achieve the
purposes of the study in the aspect, perceivet.1 value for students.
Hypothesis 10: The expectatioris are easier th@ the behaviours for /he
measures of perceived value for students.
It was fouud that the expectations were easier than the behaviours for a\l the
items relating to perceived value for students, except for items 140 and 141, where the
behaviour perspective was ensier than the implementation perspective.
195
ow
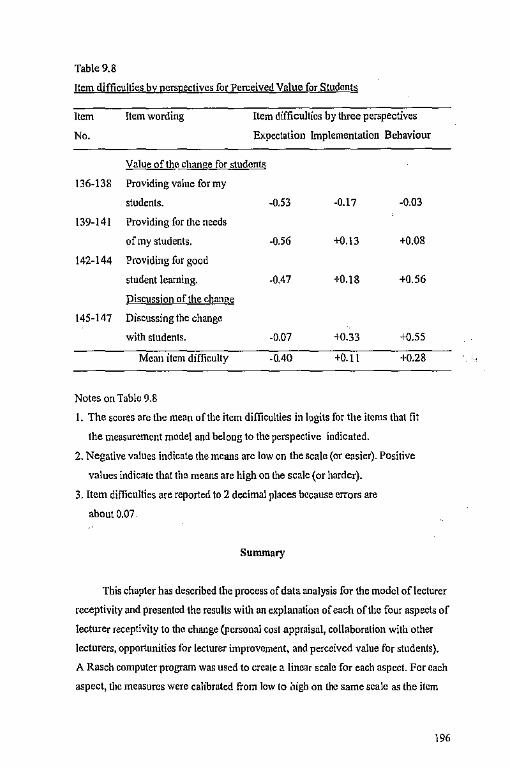
Table 9.8
Item difficulties by perspectives for Perceived Value for Students
Item
No.
Item wording Item difficulties by three perspectives
Expectation Implementation Behaviour
Value of the change for students
136-138 Providing value for my
students. -0.53 -0.17 -0.03
139-141 Providing for the needs
ofmy students. -0.56 +o.13 +0.08
142-144 Providing for good
student learning. -0.47 +0.18 +0.56
Discussion of the change
145-147 Discussing the change
with students. -0.07 +0.33 +o.55
Mean item difficulty -0.40 +0.1\ +0.28
Notes on Table 9.8
I. The scores arc the mean of the i1cm difficulties in hgits for the items that fit
the measurement model and belong to the perspective indicated.
2. Negative values indicate the means arc low on the scale (or easier). Positive
values indicate that the means arc high on the scale (or harder).
3. Item difficulties are reported to 2 decimal places because errors are
about 0.07
Summary
This chapter has described the process of data analysis for the model of lecturer
receptivity and presented the results with an explanation of each of the four aspects of
lecturer receptivity to the change (personal cost appraisal, collaboration with other
lecturers, opportunities for lecturer improvement, and perceived value for students).
A Rasch computer program was used to create a linear scale for each aspect. For each
aspect, tl1c measures were calibrated from low to ;,igh on the same scale as the item
196

=
difficulties were calibrated from easy to hard. For all ofllie 9 measures, the data were
valid and reliable and the items of each measure were influenced by a separate
::iominant trait. The P'-"T'Spectives for each item were genera!ly (but not in every case)
ordered from easy, to hard, and lo harder, in line with the conceptual design of the
questionnaire. The data supported most of tho model behind the questionnaire (but not
all).
The data for these four aspects came from 659 Rajabhat lecturers. For personal
r.ost appraisal, there were originally 18 items, but only 15 items fitted the
measurement model (Separation Index is 0.91). For all the items, the expectations
were easier than actual behaviours, except for items 95 and 96, 98 and 99, and IOI
and 102, where the behaviour perspective was easier than the implementation
perspective. For collaboration with other lecturers, there were originally 15 items, but
only 9 items fitted the measurement model (Separation Index is 0.91). For all the
items, the expectations were easier than actual behaviours. For opportunities for
lecturer improvement, there were originally 12 items, but only 9 items fitted the
measurement model (Separation Index is 0.88). For all the items, lhe expectations
were easier than actual behaviours, except for items 134 and 135, where the behaviour
perspective was easier than the implcmenlalion perspective. For perceived value for
students, there were originally 15 items, but only 12 items fitted the measurement
model (Separa1ion Index is 0.93). For al! the items, the expectations were easier than
actual behaviours, except for items 140 and 141, where the two perspectives were
equal within tllcir error of measurement.
The next chapter continues the description of data analysis: interviews (Part 3).
197
.... -
CHAPTER TEN
DATA ANALYSIS: INTERVIEWS (Part3) ,, This chapter investigates lecturers' interview comments on the change to the
educational system in Tha[Jand, and addresses research question five identified at
chapter one. That is, What are the reasons that lecturers give for holding their
expcct~tions of, and behaviours towards, the recently implemented planned
educational change?
The source of the information in this chapter is interviews with 30 Rajabhat
lecturers: 8 lecturers from Nakhon Ratchasima Rajabhat University; 7 lecturers from
Buriram Rajabbat University; 7 lecturers from Surin Rajabhat University and 8
lecturers from Ubon Ratcbathani Rajnbhat University. The lecturers were asked 18
questions covering nine lecturer-c.l1ange aspects, in relation to the major new
educational policy change. These aspects are: 1) altitudes to the new system compared
to the previous system; 2) practicality in the classroom; 3) alleviation of concerns; 4)
learning about the change; S) participation in decision-making; 6) personal cost
appraisal; 7) collaboration with other lecturers; 8) opportunities for lecturer
improvement; and 9) perceived value for students. The intetvicw questions are given
in Appendix X.
For the 30 intetvicwecs, there were 26.70percent from Nakhon Ratchasima
Rajabhat University, 23.30 percent from Buriram Rajabhat University, 23.30 percent
from Surin Rajabhat University, and 26. 70 percent from Ubon Ratc\m!ha11i Rajabha!
University (sec Table 10.1). Th.esewere more or Jess representative of the 660
lecturers from the four Rajabhat Universities involved in answering the questionnaire
on receptivity and for whom Rasch measures were described in the previous chapter.
The interviews were recorded and transcribed, and each transcription was
numbered by person and paragraph. For each aspect of receptivity, the reasons given
by each person were categorised under the general heading and collated. These are
now reported for each aspect of receptivity.
198
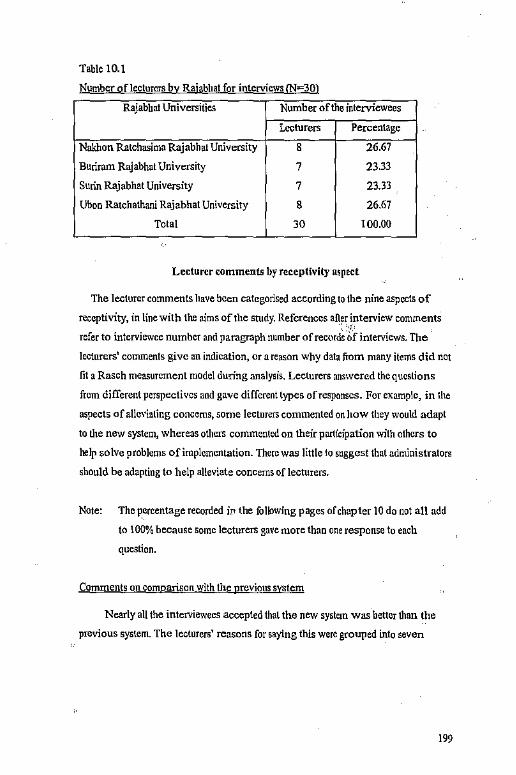
Table 10.1
Number of lecturers bv Raiabbat for interviews (N-30) -Rajabbat Universities Number of the interviewees
Lecturers Percentage
Nakhon Ratchasima Rajabhat University 8 26.67
Buriram Rajabhat University 7 23.33
Surin Rajabhat University 7 23.33
Ubon Ratchathani Rajabhat University 8 26.67
Total 30 100.00
Lecturer comments by receptivity aspect
The lecturer comments have been categorised according to the nine aspci::ts of
receptivity, in line with the aims oftl1e study. References after interview comments
refer to interviewee number and paragraph number ofrecurd~lf interviews. The
lecturers' comments give an indication, or a reason why data from many items did not
fit a Rasch measurement model during analysis. Lecturers answered thequcslions
from different perspectives and gave different types of responses. For example, in the
aspects ofa\lev[aling concerns, some lecturers commented on how they would adapt
to the new system, whereas others commented on their participation with others to
help solve problems of implementation. There was little to suggest that administrators
should be adapting to help a\!eviate concerns of lecturers.
Note: The ~crcentage recorded in the following pages of chapter 10 do not all add
to 100% because some lecturers gave more than one response to each
question.
Comments on comparison with the previous S\llltem
Nearly all the interviewees accepted thal the new system was better than the
previous system. The lecturers' reasons for saying this were grouped into seven
199

categories. These are: (1) alignment with the present economic, societal, and
globalisation aims for Thailand (90.00% of30); (2) providing educational unity
(70.00% of30); (3) providing standards and qnality assurance for Thai education
(73.33% of30); (4) implementing a new cullure of learning (76.67% of30); (5)
providing for equal rights and opportunities for learning (66.67% of30); (6) providing
for lecturer develapment and support (76.67% of30); and (7) implementing
educational decentralisation {66.67% of30). Some examples of lecturer comments are
provided.
Two lecturers suggested that the new system is better than the previous system
because it is in line with the present economic, societal, and globalisation aims. They
commented as follows .
.. .I think the new educational system is better than the previous educational system because the new educational system is in the line with the present economic, society, nnd the progression oftechnology ... (sic) (interview 3: 2) .
... Because of globalisation, lecturers have to adapt themselves fur catching it {sic). The new educational system helps lecturers to find new knowledge from g\obalisation ... {interview 7:2).
Two other lecturers commented that the educational system helps to encourage
unity among higher education staff. They slated:
I think that the new educational system make higher education become unity (sic) for education management because the Ministry of Education and the Ministry of University Affairs are merged to the ministry of Education (interview 8: 2) .
... According to new educational system, higher educatiou institutes every where in Thailand are changed into the same system for administration (sic). This will be effected the standard quality of higher education in Thailand (sic) (interview 16:2)
Three lecturers believed that the new educational system promoted a standard of
education and quality assurance for higher education. They conunented:
I think that theuew educational system is better than the previous educational system because it would enhance educational standards and quality assurance (interview 19:2) .
... The new educational system is stipulated educational audit that would be effected the standard of education ... (sic) (interview 21:2).
200

I think that the education will be up-graded for the implementation of the new educational system from implementation (sic) (inteiview 23:2).
Two lecturers stated that the new educational system has brought a new culture
ofleaming to higher education in Thailand. They commented;
I think that the new educational system is better than the previous educational system because al! leamers arc capable of learning and se!fdeve!opment is regarded as being most important. To ensure desirable characteristics of future learners, child-centred learning has been promoted by all agencies concerned. Both lecturers and learners are currently encouraged changing their roles. Lecturers must change themselves from 'tellers' to 'facilitators', while learners are encouraged to learn by themselves with the help of lecturers (inteiview 6:2).
I think the results of implementing the new educational system would be to gain the production and development of manpower in the areas of
science and technology .and social sciences (intciview 24:2).
One of the inteiviewees gave his opinion that the new educationn\ system would
make equal rights and opportunity for learning available to all students, not just in
higher education .
.. .! think all individuals have equal rights and opportunities to receive basic education provided by the State free of charge for at least 12 years. Furthermore, education is compulsory for 9 years, requiring children aged 7 to enrol in basic education institutions until the age of 16 with the exception of those who have already completed grade 9 (intciview 20:2).
One of the interviewees gave his idea that the new educational system would
help to develop the professionalism oflecturers. He commented:
.. .! think the new educational system supports the development of the lecturer education system and process, and the development ofin-seivice lecturer education (inteiview 18:2).
One lecturer suggested that the new educational change helps decentralise the
education system in Thailand and improves the efficiency of administration and the
quality of teaching and learning .
... There will be some better aspects from such change, for example, the r;:conslruct of organisation structure (sic), decentralisation of administration, improvement and efficiency of teaching and quality assurance (inteiview 27:2).
201
Commeots on practicality in the classroom
Most of the ioterviewees thought that the new educational system is practical in
the classroom (93.33% of30). That is, they believed that !11ey could implement the
change in their classrooms in line with the objectives of the change and the Act. They
were not being asked to do tltings that they e-0uld not implement in their teaching.
They commeoted as follows.
I thiok that the new educatiooal system is practical in my classroom. In the ioitial stage, the changes would make me confused because there arc various approaches to implement in the classroom. However, I can adapt myselfto the changes (imerview 1:4).
The new educational system is emphasised on student thinking and practicing which would have various approaches for teaching. I should have trained the new approaches before the new educational system is implemented (sic) ... I think it is practical in the classroom ... (interview 7:4).
I think that the new educational system is practical in the classroom if multi-media and various kinds of learning are supplied. The chances of the students to learn from are not only in the classroom but also multi- media nod various kinds oflearning is one of the objectives of the Act (sic) (interview I0:4).
I think that the new educational system is practical in the classroom but lecturers must change themselves from 'tellers' to 'facilitators', while learners are encouraged to learn by themselves with the help of lecturers
(interview 13:4).
I think the !e~turers have to be developed for new knowledge and techno!ogX;i,Sic) before the new educational system is implemented. Especially,·.:1,c !ectures must search the new knowledge from new technology (siC) (interview 18:4).
I think that the new educational system is practical in the classroom but lecturers have to change the ways of teaching. They must prepare the lesson for the students such packages of learning including Computer Instructor Assistance {sic) (interview 24:4).
Comments on alleviation of concerns
Nearly all the interviewees stated that when the new educational system is
implemented, their concerns would be alleviated, at least to some extent. The
lecturers' reasons for saying this were grouped into three categories. These are: {I)
adapting in the line with the Act (86.67% of30); (2) pr'!])aring before working
202

(80.00% of30); (3) and participating with other members in the organisation (73.33%
of JO). Most of the comments referred to how the lecturers were alleviating their
concems, not how the administrators alleviated their concerns, although from
comments 011 other aspects adminis.trators did try to alleviate concerns.
One lecturer thought that when the new educational system is implemented, his
concerns would be alleviated because he would adapt himself in the line with the Act
and the main aspects of the change. He commented:
When the new educational system is implemented, all my concerns would be alleviated. I would adapt myself in the line with the organisation and the new educational system (interview 2:6).
Four lecturers stated that when the new educational system is implemented,
their concerns would be alleviated because they would prepare themselves before
working in line with the main aspects of the change. They commented:
All my concerns would be al!eviated when the new educational system is implemented. Before working, planning and preparing for work are necessary, because these are the basic steps of working. I think I would adapt myself like these (sic) ... (interview 7:6)
... Before the new education.ii syslem is implemented, I would study the new educational system in order to be alleviated from all concerns (sic) (interview 13:6) .
. .. Before the new educational system is implemented, I would join the seminar that is related (sic) to the new educational system. I think that we could be alleviated from all concerns (sic) ... (interview 22:6) .
... To be alleviated of all concerns, I think that we should have three approaches. Firstly, we should fix the period of time for implementing the new educational system. Then, the new system's documents would be provided for lec!11rers. Secondly, the seminar would be set up for the lectures in order to prepare for adapting themselves to the new educational system. Thirdly, the government must support all materials that are important used for implementing the new education system (sic) .. (inteiview 26:6).
One lecturer stated that when the new educational system is implemented, her
concerns would be alleviated because she would participate with oilier members in the
organisation and discuss any concerns that she had. She commented:
For participating with other members in the organisation, my concerns would be alleviated when the new educational system is implemented. I think that when one gets along with other members in the organisation they would be alleviated from every thing that are concerns (sic) ... (inteiview 11 :6).
203
Comments on learning about the change !/
Nearly all the interviewees stated that they learnt about the new educational
system through three main aspects. These are: (1) mass media (70.00% of30); (2)
visual education (specially designed videos) and making a tour of inspection (60.00%
of30); (3) and communicating with olher persons (73.33% of30). They commented
as follows.
Three lecturers commented that they learnt about the new educational system
through the mass media or government documents provided to the Rajabhat
Universitfos. They stated:
... I ofic11 read the documents that are provided by Rajabhat Universities and the Office of Educational Reforrn ... and I have chances to join the seminars on the new education system i11 many places (sic) ... (interview 10:7) .
. . .I learn about the new educational system from the mass media such as newspapers, radio, television, includini; inter-net working ... {interview 17:7) .
... I learn about the new educational system from the govcmrncnt's documents ... {interview 23 :7).
One lecturer commented that she learnt about the new educational system
through the visual education (speci.ally designed videos) and making a tour of
inspection. She stated:
I learn about the new educational system through visual education and making a tour o finspcction before the new educational system is
implemented ... (interview21:7).
Comments on participation in decision-making
Nearly all the interviewees said that they would be participating in decisionmaking at their Rajabhats, as the new educational system is implemented (73.33% of 30). The primary reason that they _gave for participating was to present their opinions about the new educational system to the concerned organisations. They commented as follows.
. . .I used lo give my opinion about the new educational system at the assembly ofRajabhal University (sic) ... (interview 7:8)
I participate in dccision·making at public opinion for the Act ofRajabhat University (sic) ... {interview 19:8).
204

I participate in decision·making to the head of my program for the practicality of the new educational system before it is implemented in the classroom (sic), .. (interview 27:8).
Comments on the personal cost appraisal
Most of the interviewees said that the new cduC~tional system brought a high
personal cost appraisal. That is, they believed that bringing the new educational
system into line with the objectives of the change and the Act would involve a !ot of
work on their part, and that the change was good. The reasons that tney gave were
grouped into five categories. These .are: (!) alignment with the present economic,
societal, and globalisation aims for Thailand (90.00% of30); (2) providing
educational unity (70.00% of30); (3) implementing a new culture of learning
(76.67% of30); (4) reconstructing organisations and imp\cmenting educational
decentralisation (66.67% of30); and (5) in the line with the needs of local
communities (70.00% of30).
One lecturer suggested that the new system will make him work harder to bring
it into in line with present economic, societal, and globalisation aims, because this is a
good for Thailand and the Thai people. For example, a high personal cost to me will
help:
... The new educational system accord with the globalisation changes, which energise people (interview 9:12).
Another lecturer commented that the new educational system has brought a high
cost appraisal because it helps to encourage unity among higher education staff.
The new system will provide us the same standard in higher education throughout the country which, in turn, results in educational and learning quality and opportunity to the students (sic) (interview 17: !2).
Two 0U1er lecturers commented that the new educational system has brought a
high cost appraisal because it aims to implement a new cullure of learning. They
stated:
The new system changed wiJJ encourage more student participation in classrooms. Also, new innovation and technology will be employed in teaching and learning ... (interview 23: 12).
The system will give more room for lecturers to design and construct a variety of learning activities while students have more choices to choose the means that meet their needs nnd interests. The new system focuses on participatory learning and group working (interview 15:12).
205
,,

Another lecturer commented that the new educational system has brought a high
cost appraisal because educ~tional organisations will be re-constructed and
decentralisation will be implemented. Although this is better for Thai people, it will
require more work for lecturers.
There will bC somewhat better aspects from such a change, for example, the reconstroction of organisation strocturc, decentralisation of a~ministration, improvement and efficiency of teaching, and quality assurance (interview 25:12).
Another lecturer commented that the new educational system has brought a high
cos\ appraisal but it is in line with the needs of local communities.
The new educational system can serve the needs of locality (sic). It benefits the majority of nation's manpower, who consequently improve !heir quality in many aspects that, in tum, result in problem solution of the entire country (sic) (interview 29:12).
C:immcnt;· on collaboration with other lecturers
Nearly all the interviewees thought that collaboration with other lecturers is
necessary to implement the new educational system. The reasons that they gave were
grouped into two main categories. These are: (I) administrative system in the line
with the objectives of the change and the Act (76.67% of30); ~nd (2) a new culture of
learning {73.33% of30).
Four lecturers stated that the collaboration with other lecturers is necessary to
implement the new educational system because this would help bring the
administrative system in the line with the objectives of the change and the Act. They
commented:
The new educational system in relation to higher e,lncation reflects the proficiency and potential ofadministrators in collaboration and participation, and cooperation from all members of an organisation ... (interview 5:13).
I think that the administration of the new educational system aims for the same goal in the organisations (sic). To achieve the goal set, every member must be cooperative, supportive of one another in all aspects ... (interview 16:13).
Other instructions are [mportant and valuable resource personnel who wil! implement the policy and the Act; their cooperation is severely (sic) needed (interview 23:13).
206
TI1e new educational system concentrates on resources pcrso11nel to make the system succeed; failure in the estab]islunent of people's cooperation can make the system rcfomiation impossible (inteiview 27:13).
Five lecturers thought that collaboration with other lecturers is necessary to
implement the new educational system because of the new culture ofleaming. They
commented:
... According to the new educational system, the trend of education in Thailand should be inter-disciplinary. Therefore, collaboration with other lecturers is necessary to implement the new educational system ... (interview 8:13)
I believe that the new educational system values a variety of \earning/teaching activities. Implementing these activities mean~
collaborating with different networks of society (interview 11 :13).
The new eilucational system enhances the holistic, instead of one single subject achievement. Hence, it needs to have cooperation from other instructors to completely fulfil the goals (interview 18:13).
T\Je variety of activities and complexity of work performance of the new educational system requires the cooperation and support of everyone in the organisation (interview 21 :13).
The neeil for cooperation within the new educational system is vital, since the new curriculum centres on !earners/students (or it is stndent centred); team work is, therefore, very important (interview 25:13).
~ts on opportunities for lecturer improvement
Nearly al! the interviewees accepted that the new educatioual system provides
opportunities for gaining educational knowledge and for the profcs~ional
improvement of\eeturers (76.67% of30). They stat ct! that, in order to implement the
new educational system in line with the Act, the lecturers must be provided
opportunities for educational knowledge and professional improvement, because the
new system cannot be implemented without them.
Four lecturers gave more comments as follows:
... Yes, I am quite ce11ain that I will have more opportunitks to improve myselfboth academically and profc~sionally. Since the new system requires high standards and better quality assurance as its ultimate goal, to fulfil such goa!, better quality of resources and people are needed. So the Rajabhat Universities have no other way but to dev<.'lop their lecturers and staff to meet such requirements ... (interview 8:15).
207

According to the Act, the lecturers will be able to widely gain knowledge and skills from the new educational system (interview 13:15).
According to the new educational system, the lecturers have the opportunities to launch, and experiment with, new teaching methods and activities (interview 18:15) .
.. . Not only will the \cdurers improve academically but also they liave the chance to practice teaching and learning skills they have constructed (sic) ... (interview 21:15).
Comments on perceived value for students
Nearly all the interviewees agreed that the new educational system would
advantage their students. The reasons that they gave were grouped into four
categories. These arc: (I) providing morn learning activities for students {76.67% of
30); {2) providing standards and quality assurance for Thai education (73.33% ofJO);
(3) providing for equal rights and opportunities for learning (66.67% of JO); and (4)
higher education in the line with the needs of local communities (66.67% ofJO).
Seven lecturers thought that the new educational system would advantage
their students because it provides more learning activities for students. They
commented as follows:
... Certainly, the new educational system benefits students ... Since the new educational system centres on the development of approaches, quality of life, ideas of students, their attitudes and ideas will change after they are
educated through the new system. They will be more creative and se\fdependent. .. (interview 7; J 6).
The new educational system will encourage and give room for students to work in-groups, demonstrate their individual abilities and appreciate more in the Thai identity (sic) (intervicw\6:16).
By implementing the new educational system, students can apply the knowledge and skills to their daily life greatly (sic) (interview! 7:16).
By implementing the new educational system, the students will be able to adjust themselves more with the changes of economy, politics and technology, nationally and internationally (interview 21 :16).
By implementing the new educational system, there will be educational quality assurance in respect to learning and teaching, and instructors. The \earner-centred approach will be focused. The development oftcaching will be established for the students' growth in all aspects (interview 23:16).
208

The new educational system promotes life-long education. The students will apprt{)iate learning and be able to easily access new learning centres. They will also be able to improve themselves, think and solve their own problems. Theywi!I sustain and su1vive well in the midst of social changes inside and outside their ~ociety (interview 25:16).
The education will centre more on students' needs, as they arc the centres of learning. They will, subsequently, have more chances to learn, not only from the classroom but also with multi-media and various kinds of learning materials (interview 26:16).
By implementing the new educational system, the curriculum meets the students' needs. There are various means to learn and the learned skills arc applicable to their daily life (interview 27:16~
One lecturer thought that the new educational system would advantage his
students because it provides standards and quality assurance for all Thai education.
The new educational system wi!! allow the Higher Education Committee to supervise and inspect 1he standard of tertiary education, which will result in the similar standardisation of the student's learning achievement (interview 10:16).
Another lecturer stated that the new educational system would advantage his
students b~'Cause it provides equal rights and opportunities for !earning.
The new educational system enhances equity of educational opportunities. The disadvantaged, the poor and the disabled will be treated more fairly (interview 19:\6fa
Another lecturer thought that the new educational system would advantage
his students because it provides higher education in the line with the needs ofloca!
communities.
ln according with the expectation of the new educational system in requiring the Rajabhat Universities to be the higher educational institutions for local development, students will be motivated to learn and know their locality more and better. This will hopefully inspire them to develop their communities (interview 24:16).
Research Questions
This chapter reports the investigation of30 lecturers' views ofthe change in the
educational system in Thailand, covering nine aspects of the change. This was done to
answer research question S: What are the reasons that lecturers give for holding their
expectations of. and behaviours towards, the recently implemented planned
educational clr,mge?
209

Nearly all the lecturers commented that the new system was better than the
previous system because the new educational system: (1) was aligned with the present
economic, socictai and globalisation aims for Thailand; (2) provided educational
unity (that is, it brought Timi people together in a common cause for good); {3)
provided standards and quality assurance for Thai education; (4) implemented a new
and better culture of learning; (5) provided for equal rights and opportunities for
learning; (6) provided for lecturer development and support; and (7) implemented
educational decentralisation to some extent, to improve the Rajabhat Universities.
For the practicality in the clas~ronm, they believed that they could implement
the change in their classroom, in line with the objectives of the change of tho Act
because they could adapt and they had training.
For the alleviation of concerns, the lecturers stated that when the new
education a! system is implemented, their concerns would be alleviated because they
would adapt themselves in line with the Act, prepare themselves before working, and
participate with other members in the organisation.
For learning about the change, they learnt about the new educational system
through three main ways. These are: (1) learning from mass media; (2) learning from
visual education (specially designed videos) and from tours of inspection; and (3)
communicating with other persons.
For participation in decision-making, the lecturers thought that they would
participate in decision-making at their Raj ab hats, when the new educational system is
implemented. The reasons that they gave for participating were lo give their opinions
about the new educational system to the concerned organisations.
For the personal cost appraisal, the lecturers believed that implementing the new
educational system in the line with the objectives of the cha.'1gc and the Act involved
a high personal cost appraisal, but it was worth it. The reasons that they gave were:
(1) alignment with the present economic, societal, and globalisation aims for
Thailand; (2) providing educational unity; (3) implementing a new culture of\eaming;
(4) reconstructing organisations and implementing educational decentralisation; and
(5) in the line with the needs of local communities.
210

For the collaboration with other lecturers, the lecturers thought that the
collaboration with other lecturers is necessary to implement the new educational
system. The reasons that they gave were to ensure that the new system was
implemented in line with the objectives of the change and the Act, and lo provide a
new culture of learning.
For opportunities for lecturer improvement, the lecturers accepted that the new
educational system provides opportunities for educational knowledge and professional
improvement to lecturers, and that the lecturers must be provided opportunities for
educational knowledge and professional improvement in order to implement the
change.
For perceived value for the students, the lecturers agreed that the new
educational system would advantage their students. The reasons that they gave were
that the change: (1) provides more learning activities for students; (2) provides
standards and quality assurance for Thai education; (3) provides for equal rights and
opportunities for \earning; and (4) implements higher education in the line with the
needs of local communities.
The next and final chapter provides a summary oft he study and draws together
the major findings, conclusioiis and imp!icntions of the study.
211

CHAPTER ELEVEN
SUMMARY, DISCUSSION, CONCLUSIONS
AND IMPLICATIONS
This chapter provides a summary of the study. Then the conclusions are
presented including the major findings involving lecturer receptivity towards the nine
aspects of the new educational system. Then, the implications ufthe study for
administrations, lectures, and research on change at Rajabhats in Thailand are
discussed.
In accordance with the National Education Act of 1999, the educational system
in Thailand has been changed since 1999 (Office ofNational Education Commission,
l999a). This is the largest educational change in Thailand during the last 50 years.
The achievab\c aims of the change were divided into eight main aspects. These were:
1) ensuring access to basic education for all; 2) refonn of the curriculum and learning
process; 3) encouraging participation and partnership in education; 4) restructuring of
educational administrative structure; 5) enhancing educational standards and quality
assurance; 6) refonn oftcael1ers; faculty staff, and educational personnel; 7)
mobilisation of resources and investment for education; and 8) utilisation of
technologies for education (Office of National Education Commission !999b). The
planned implementation of the change was divided into five stages: (1) actions taken
by 20 August 1999, (2) actions taken within the enactment date of20 August 2000,
(3) actions taken within three years of enactment date (by 20 August 2002), {4)
actions to be taken within five years of enactment date (20 August 2004), and (5)
actions to be taken within six years of the enactment date (by 20 August 2005).
The present study is concerned with Rajabhat university lecturers' receptivity to
the change two years after implementation of the change.
SUMMARY
There were three main aims. These were: (i) to investigate lecturer receptivity to
a major educational change in the context of planned educational change at Rajabhats
212
... -----------------·------~--~
.,,.,.,.,.,,_
in Thailand; (II) to investigate the relationships between lecturer receptivity and nine
lecturer-change aspects: (1) comparison with the previous system, (2) practicality in
the classroom, (3) alleviation of concerns, (4) !earning about the change, (5)
participation in decision-making, (6) personal cost appraisal, (7) collaboration with
other lecturers, (8) opportunities for lecturer improvement, and (9) perceived value
for students, in the context of three perspectives: - (1) How I expect the change to be
planned, (2) How I think the change was really implemented, and (3) My actual
behaviour to the change; and (III) to investigate why Thai lecturers at Raj ab hats hold
the attitudes towards the change that they do, and help understand their behaviour
towards the change.
Data collection was conducted in two parts. Part one was co!lecting data using a
survey questionnaire. The population was 952 lecturers from four Rajabhat
Universities: Nakhon Ratchasima Rajabbat University; Buriram Rajabhat University;
Surin Rajabhat University; and Ubon Ratchathani Rajabhat University. Data were
obtained from 659 lccturers through a que~tionnaire that involved responding to items
of lecture receptivity towards the new educational 5ystem. The questionnaire was
based on a model of receptivity and consisted of SO stem-items that were answered in
three perspectives (50x3 items).
Part two was face-ta-face interviews. Thirty lecturers from four Rajabhat
Universities, in the south em part oft he northeastern region of Thailand (Nakhon
Ratchasima Rajabhat University, Rajabhat Buriram University, Surin Rajabhat
University, and Ubon Ratchathani Rajabhat University), voluntarily took part in the
interviews. The questions of the interviews were concerned about Jccturcr receptivity
to the major educational change at Raj ab hats in Thailand (sec Appendix X). Most of
them preferred to set the interview at their working room in their office. All interview
data were recorded with a code number. No names were used in this study.
There were five research questions:(\) can a proper linear scale of lecturer
receptivity to change, involving nine aspects and three perspectives of the change, be
created where the receptivity measures are calibrated on the same scale as the item
difficulties, using a new Rasch Measurement Mode! computer program? (2) can a
proper linear scale be created separately for each of the nine aspects of change, using
the Rasch computer program? (3) can the linear receptivity scale involving all aspects
213
together be used to interpret tho expectations and behaviours ofRajabhat lecturers to
the change? (4) can the nine new scales be used to interpret Rajabhat lecturer
expectations of, and behaviours towards, a recently implemented planned educational
change in Thailand? and {5) what are the rem;ons that lecturers give for holding their
expectations of, and behaviours towards, tl1e recently implemented planned
educational change?
Discussion
Lecturer receptivity
The model of lecturer receptivity towards educational change suggests that
changes are complex and that there is some uncertainty associated with their
implementation. The questionnaire Wm; designed to measure some of this complexity
and nine aspects of the change were included in the questionnaire each answered in
three perspectives. The items relating to each ofll1e nine m;pects were conceptualised
in ordcrcd-by·difficulty patterns. All the 150 items were initia!ly calibrated on the
same scale together so that their difficulties in relation to one another could be seen
and so that the relationships between the aspects could be tested and explained. The
items were designed to have a conceptual ordering from easy to hard, horizontally, in
the questionnaire by perspectives.
The resulls support that part of the model in relation to the increasing difficulty
oft he three lecturer perspectives, with eight aspects {out of nine), for most, but not
ati of the 18 (out of 50 stem-items). That is, how I expect the change to be planned
was easiest, how I thl11k the cba1Jge was really imp/emel!led wm; harder, and my actual
behaviour lo tlie cha11ge was hardest for most of the 18 stem-items.
The data provide partial support for the model behind the questionnaire for 54
out of 150 items and the evidence supports the view that the data for the 54 items are
valid and reliable. Only one aspect does not fit the measurement model (opportunities
for lecturer improvement). The mean item difficulties of eight aspects show that the
aspect comparison with the previous system is the em;iest and the aspect participation
jn decision-making is the harder,!.
214

Lecturer receptivity(items from the nine aspects analysed together)
Comparison with the previous system
For the aspect comparison with the previous system, six items out of21 fitted
the measurement model. Their difficulties were calibrated on the same scale together
with the measurements of receptivity, so that their difficulties can be compared, and
so that the relationships between the aspects can be tested and el(p\ained. The results
support that part of the model in relation to the increasing difficulty of the expectation
(easy) and behaviour (harder) perspectives, for two stem-items. The item diflicultics
of this aspect show that providing for t/ie 11eeds of stude/1/s belle/" th,m the previous
system was easy and providi11gfor better classroom ma11ageme11t tha11 the previous
system was also easy, but harder. The expectation perspective was easier than the
behaviour perspective for the two stem-items.
Practicajity in tho classroom
For the aspect practicality in the classroom, six items out of 18 fitted tho
measurement model. Their difficulties were cahbrated on the same scale together with
their measures of receptivity so that their difficulties can be compared and so that the
relationships between the aspects cnn be tested and explained The results support that
part of the model in relation to the increasing difficulty of the three perspectives. The
item difficulties of this aspect show that providing sufficiellt flexibility ill tile cha11ges
to suit the needs of different swdenls was easy andprovidillg sufficient resources to
allow lecturers to tmpleme/11 the clia11ges i11 their classrooms was harder. The
expectation perspective was easy, the implementation perspective was harder, and
behaviour perspective was harder still.
AHevialion of concerns
For the aspect alleviation of concerns, 12 items out of24 fitted the measurement
model. Their difficulties were calibrated on the same scale together with their
measures ofrecqilivity so that their difficulties can be compared and so that the
relationships between the aspects can be test~d and explained. The results support that
215

part of the model in relation to the increasing difficulty of the three perspectives. The
expectation perspective was easy, th-e implementation perspective was harder, and the
behaviour perspective was harder still. The item difficulties of this aspect show that
providing/or specific concerns of lecturers lo be raised with the Rajabhat
admi11istratia11 and staff was easy and being able to solve quickly any classroom
problems in imp/eme11ti11g the clia11ges at Rajabhat was harder.
Leaming about the i,hange
For the aspect learning about the change, 12 items out of IS filled the
measurement model. Their difficulties were calibrated on the same scale together with
their measures of receptivity so that their difficulties can be compared and so that the
relationships betweeo the aspects can be tested and explained. The resulls support that
part of the model in relation to the increasing difficulty of the three perspectives. The
expectation perspective was easy, !he implementation perspective was harder, and the
behaviour perspective was harder still. The item difficulties of this aspect show that
providing i11for111atio11 011 adapting rite change lo the classroom was easy and
pravidi11gfar the Rujubhat slajf and 111a11uge111e11/ to discr1ss the change was harder.
Participation in decision-makjng
For the aspect participation in decision-making, three items out of 12 fitted the
measurement model. Their difficulties were ca\ibrnted on the same scale together with
their measures of receptivity so that their difficulties can be compared and so that the
relationships between the aspects can be tested and explained. The re.suits partia!ly
support the model in relation to the increasing difficulty oft he three pcrspci.:tives.
Expectations about participating in decisions related to the change were easy and
behaviours were harder.
216

Personal cost appraisal
For the aspect personal cost appraisal, six items out of 18 fitted the
measurement model. Their difficulties were calibrated on the same scale together with
their measures of receptivity so that their c!ifficu\tics can be compared and so that the
relationships between the aspects can be tcste<.1.md explained. The results partially
support the model in relation to the increasing diE1cu!ty of the three perspectives.
The expectation perspectives were easier than the behaviour perspectives. The item
difficulties of this aspect show that i11creasillf!. lecturer satisfaction with teaching
which outweighs the crtra workge11eratcdfor rhem was easier in the expectation
perspective than keepi11g tlie c111otio11a/ s1rai11 of the change for lecturers to a
minimum, but equally difficult in the behaviour perspective.
Collaboration with other lecturers
;' For the aspect collaboration with other lecturers, 3 items out of 15 fitted the
measurement model. Their difficulties were calibrated on the same scale together with
their measures of receptivity so that 1heir difficulties can be compared and so that the
relationships between the aspects can be tested and explained. The results partially
support the model in relation to the increasing difficulty of the three perspectives. TI1e
item difficulties of this aspect show thatgivi11g support to other /ecwrers at Rajabhat
when they 1Jeed it to impleme11t the t:lw11gc was easy in the expectation perspective
and harder in the behaviour perspective.
Opportunitjes for lecturer improvement
For the aspect opportunities for lecturer improvement, there were originally 12
items. None of them fitted the measurement model and all were discarded.
Perceived value for students
For the aspect perceived value for students, 6 items out of 15 fitted the
measurement model. Their difficulties were calibrated on the same scale together with
their measures of receptivity so that their difficulties can be compared and so that the
relationships between the aspects can be tested and explained. The results support that
part of the model in relation to the increasing difficulty of the three perspectives. The
217
er 0
item difficulties of this aspect show 1hatproviding value/or students was equally easy
as providbigfor the needs of students, and expectations are much easierlhan
behaviours.
Lecturer receptivity (items from eaclt ofthe nine aspects analysed separately)
Comparison with the previous system
For the aspect comparison with the previous system, 12 out of21 items fitted
the measurement model and the items ofthis aspect need revising if used on their
own. Their difficulties were calibrated 011 lhc same scale together with the
measurements ofreceptivity, so that their difficulties can be compared, and so that the
relationships between the aspects can be tested and explained. The results support that
part of the model in relation to the increasing difficulty of twelve lecturer
pcrspectives. llems in the expectation perspective were easier than items in the
implementation perspective which, fa tum, were easier than the behaviour
perspective. The item difficulties of this aspect show !hat providing/or heller st11de11t
learning experie11ces than the previo11s system was easy and providing/or bell er
classroom managrme/1/ tliau the previous sysrem was harder.
Practicality in the classroom
For the aspect practicality in the classroom, there were originally 18 items and
they need revising if used on their own. Their difficulties were calibrated on the same
scale together with their measures of receptivity so that their difficulties can be
compared and so that the relationships between the aspects can be tested and
explained. The results partially support that part of the model in relation to the
increasing difficulty of the L'l.rec perspectives. The expectation perspectives are easier
than the behaviour perspectives. The item difficulties oflhis aspect show that
providing challges that ca11 be adapted to t/1e 11ceds of stud en ls was easy and
providing sufficient resources to c.llaw lecturers to implement the changes 1i1 their
class roams was easy, but harder.
218

Alleviation of concerns
For the aspect alleviation of concerns, 12 out of24 items fonned a scale, but
they need revising if used on their own. Their difficulties were calibrated on the same
scale together with their measures of receptivity so that their difficulties can be
compared and so that the relationships between the aspects can be tested and
explained. The results partially support the model in relation to the increasing
difficulty of the three perspectives. The expectation perspectives arc easier than the
behaviour perspectives. The item difficulties of this aspect show that providing far
sprcific concerns of /cct11rers to be rai;ed willi t/ie Rajah/mt admitiistratior1 am/ staff
was easy aod being able to solve quick(\' any classroom prob/ems ill implementing tire
c/mugcs at Rajabhat was harder.
Learning ahqut the change
For the aspect learning about the change, there were originally IS items and
they need revising if used on their own. Their difficulties were calibrated on the same
scale together with their measures of receptivity so that their difficulties can be
compared and so that the relationships between the aspects can be tested and
explained. The results partially support the model in relation to the increasing
difficulty of the three perspectives. The expectation perspective was easier than the
implementation perspective which was easier than the behaviour perspective. The
item difficulties of this aspect show that providi11g how to learn best aboul
implementing the changes was easy and providillg/01· the Rajabhal staff mid
management to discuss the change was harder.
Participation in decision-making
For the aspect participation in decision-making, nine items out of 12 fonned a
scale but need revising if used on their own. Their difficulties were calibrated on the
same scale together with their measures of receptivity so that their difficulties can be
compared and so Um\ the relationships between the aspects can be tested and
explained. The results partially support the mcdel in relation to the increasing
difficulty of the three perspectives. The expectation perspectives were easier than tl1e
behaviour perspectives. The item difficulties of this aspect show that participating ill
219
- a5
~· '
selecting teaching resources associotedwilh the change was easy andparticfpaling ill
determining the c01!1e111 of profess{onal sess(ons was harder.
Personal cost appraisal
For the aspect personal cost appraisal, 15 items out of 18 formed a scale but
need revising ifuml on their own. Their difficulties were calibralcd on the same scale
together with their measures of receptivity so that their difficulties can be compared
and so that the relationships between the aspects can be tested and explained. The
results partially support the model in relation to the increasing difficulty of the three
perspectives. The expectation perspective is easier than the behaviour perspective.
The item difficulties of this aspects.how that making for better student classroom
learning to mlf\veigh the extra work geueratedfor lecturers was easy and making
lecturer satisfactio11 with home life .outweigh the extra work generated for tliem was
harder.
Collaboration with other lecturers
For the aspect collaboration with other lecturers, 9 items out of 15 formed a
scale, but nee<l revising if used on their OWll Their difficulties were calibrated on the
same scale together with their measures of receptivity so that their difficulties can be
compared and so that the relationships between the aspects can be tested and
explained. The results partially support the model in relation to the increasing
difficulty of the three perspectives. The expectation perspective is easier tl1an the
imp!emcntation perspective which, in tum, is easier than the behaviour perspective.
The item difficulties of this aspect show that providing advice to arher /ectr,,rers abo111
the clm11ge when reqr1es1ed was easy and askingfor advice from others in Rajabhat
when lecturers have prob/ems with the change was harder.
Opportunities for lecturer improvement
For the aspect opportunities for lecturer improvement, 12 items out of IS
formed a scale, but need revising if used on their own. Their difficulties were
calibrated on the same scale together with their measures of receptivity so that their
difficulties can be compared and so that the relationships between the aspects can be
220
.au,> mw.eo»A= SIO.M-~l;o.!,. S. >_9 ,
tested and explained. The results partially support the model in relation to the
increasing difficulty of the three perspectives. The expectation perspective is easier
than the behaviour perspective. The item difficulties of this aspect show that
providing oppor/lmitiesfor lecturers lo improve their educalionai !mow/edge and
under sta11di11g was easy and providing opportrmities for ma11ageme11t and lecturer
staff to work together for lecturer improvement was harder.
Perceived value for students
For the aspect perceived value for studc1!ls, 12 items out of 15 fonncd a scale,
but need revisi11g if used on their own. Their difficulties were calibrated on the same
scale together with their measures ofreceptivity so that their difficulties can be
compared and so that the relationships between the aspects can be tested and
explained. The results partially support the model in relation to the increasing
difficulty of the three perspectives. The expectation perspective is easier than the
behaviour perspective. The item difficulties of this aspect show thatprovidi11gfor /lie
11eeds of studc11/s was easy and discussing the change with sllldellts was harder.
CONCLUSIONS
The conclusions from this study arc summarised in regard to three results ofthe
data analyses: {I) A Rasch analysis of\ecturcr 1cccptivity with all eight change
aspects together, (2) separate Rasch analyses of lecturer receptivity for each of nine
aspects of change, and (3) interviews with lecturers about their receptivity to the
change.
Conclusions from the Rasch analysis with a]! eight aspects together
It can be concluded that:
(!) A good scale of lecturers' receptivity to the change was created using a
model ofre]ated aspects of the change and a mathematical model of
measurement (Rasch);
(2) Eight of the nine aspccls postulated are important contributors le an
explanation of lecturer receptivity to thi~ change. (They are listed in Table
7.2);
221

(3) The data from the 54 items 11sed to create this scale are valid and reliable,
and so reliable inferences can be made from it;
(4) While the data are influenced by eight aspects, there is one dominant trait
influencing all their eight aspects - which might be called receptivity lo the
change;
(5) How lecturers expect the change to be planned was easier than their actual
behaviour towards the clmnge; and
(6) Administrators could provide help lo alleviate concerns, reduce lecturers'
personal cost and increase participation in local discussion-making, in
relation to the change.
Omc\usions from the separate Rasch analysis for each of nine aspects
Comparison with lbc previous system
It can be concluded that:
(1) A scale of lecturers' receptivity to the change in comparison with the
previous system was created;
(2) The 12 items forming this scale need some revision and re-testing, if the
scale is to be used on its own;
(3) The data arc influenced by a dominant trait relating to lecturers'
comparison with the previous system;
(4) How lecturers expect the change to be planned was easy, how they think
the change was really implemented was harder, and their actual behaviour
towards the change was harder still, for items related to a comparison with
the previous system; and
(S) Help needs to be provided to lecturers to improve behaviour relating to
student learning and classroom management to help them implement the
change belier.
Practicality in 1he classroom
It can be concluded that:
(I) An acceptable scale of lecturers' receptivity relating to the practicality of
the change in the classroom was created;
222

(2) The 18 items fonning this scale need some revision and re-testing, if the
scale is to be used on its own;
(3) The data are influenced by a dominant trait relating to the practicality of
the change in the classroom;
(4) How lecturers expect the change to be planned was ea~y, how they think
the change was really implemented was harder, and their aetual behaviour
towards the change was harder still, for practicality of the change in the
classroom; and
(5) Help needs to be provided to lecturers to improve practicality in the
classroom in relation to implementing the change better.
Alleviation of concerns
It can be concluded that:
(I) An acceptable scale of lecturers' receptivity relating to the alleviation of
concerns was created;
(1) The 12 items forming this scale need some revision and re-testing, if the
scale is to be used on its own;
(3) The data are influenced by a dominant trait relating to the al!cviation of
concerns about the change;
(4) How lecturers expect the change to be planned was easier than their actual
behaviour towards the change, relating to the alleviation of concerns; and
(5) Help needs to be provided to lecturers lo solve classroom problems
relating to the change more quickly.
Lenming about the change
It can be conclude that:
(!) An acceptable scale oflecturers' receptivity relating to their learning about
the change was created;
(2) The 15 items forming this scale need some revision and re-testing, if the
scale is to be used on its own;
(3) The data arc influenced by a dominant trait relating to what and how
lecturers learn about the change;
223
(4) How lecturers expect the change to be planned was easy, how they think
the change was really implemented was harder, and their actual behaviour
towards the change was harder still, relating to learning about the change;
Md
(5) Help needs to be provided to learn how best to implement the change and
the main issues of the change, and management needs to implement more
discussion with Rajabhat lecturers.
Participation in decision-making
It can be concluded that:
(1) An acceptable scale of lecturers' receptivity relating to participation in
decision-making\~ :s created;
(2) The 9 items fonning this scale need some revision and re-testing, if the
scale i; to be u;ed on its own;
(3) The data arc influenced by a dominant trait relating to participation in
decision-making;
(4) How lecturers expect the change to be planned was easier than their actual
behaviour towards the change, for all items relating to participation in
decision-making; and
(5) Help needs to be provided to lecturers to participate in decision-making
related to their implementing the changes.
Personal cost appraisal
It can be concluded lhat:
(1) An acceptable scale of\ecturcrs' receptivity relating to personal cost
appraisal was created;
(2) The 15 items forming this scale need some revision and re-testing, if the
scale is to be used on its own;
(3) The data are influenced by a dominant trait relating to personal cost
appraisal;
(4) How lecturers expect the change to be planned was easier than their actual
behaviour towards the change, for personal cost appraisal; and
224
w ne,mn& <DLO&d '''"""™'"'·5'-">.lil!tMoitffllM·.4. , '1-.- .," .0

lftPllJCV
(5) Help needs to be provided to lecturers to reduce or help tliem overcome
the extra work generated because of the change.
Collaboration with other lecturer.,
It can be concluded that:
(I) An acceptable scale oflecturcrs' receptivity relating to collaboration with
other lecturers was created;
(2) The 9 items fanning this scale need some revision and re-testing, if the
scale is to be used on its own;
(3) The data arc influenced by a dominant trait relating to collaboration with
other lecturers;
( 4) How lecturers expect the change to be planned was easy, how they think
the change was really implemented was harder, and their actual behaviour
towards the change was harder still, for collaboration with other lecturers;
'"' (5) Help needs to be provided so Rajabhat lecturers can collaborate beUerwi1.h
colleagues.
Opportunities for lecturer improvement
It can be concluded that:
(1) The items for this variable need revising and improving;
(2) How lecturers expect the change to be planned was easier than their actual
behaviour towards the change, in relation to oppo1tunities for lecturer
improvement; and
(3) Administrators could provide for management and lecturers to work
together to implement improvements.
Perceived value for students
It can be concluded that:
(1) The items for thls vari ablci need revising and improving;
225

=·--
(2) How lecturers expect the change to be planned was easier than actual
behaviour towards the change, in relation to perceived value for students;
Md
(3) Administrators could discuss the change more with students in relation to
improving learning.
Conclusion from the interyiews
It was concluded that there was strong support for the change and that it would
be an improvement that would help Thai people modernise and compete with people
from other nations.
Comparison with the previous system
It was concluded that the new system was better than the previous system
because it was: (I) aligned with the present economic, societal, and globalisation aims
for Thailand; (2) provided educational unity (that is, some common educational goals
for Thai people); (3) provided standards and quality assurance for Thai education; {4)
implemcoted a new culture of!eaming that was better for Thai people; (S) provided
for equal rights and opportunities for learning; (6) provided for lecturer development
and support; and (7) implemented educational decentralisation that could improve
decision-making and education generally.
Practicality in the classroom
It was concluded that lecturers believed that they could implement the change in
their classroom, in line with the ohjcetives of the Act because they would adapt
themselves and they had training.
Alleviation of concerns
II was concluded that, when the new educational system was implemented,
lecturer concerns would be alleviated, at least to some extent, because they would
adapt themselves in line with the Act, prepare themselves before working, and
participate with other members in the organis3tion.
226

Leaming about the change
It was concluded that lecturers learnt about the new educational system through
three main ways. These are: (1) learning from mass media; (2) learning from visual
education (specially designed videos) and from tours ofinspection; and (3)
communicating with other persons.
Participation in decision-making
II was concluded that !eclurers would participate in decision-making at their
Rajabhat, when the new educational system was implemented, and that theywou!d
give their opinions about lhc new educational system to the concerned organisations.
Personal cost appraisal
II was concluded that the new educational system was being implement~ in the
line with the objectives of the Act, but it involved a high personal cost appraisal that
lecturers thought was worth it. This was because U1e change: (1) was aligned with the
present economic, societal, and globalisation aims for Thailand; (2) provided
educational unity (that is, some common educational goals for the common good); (3)
concerned a new culture oflcaming that was an improvement; (4) involved
reconstructing organisations and implementing educational decentralisation to make
improvements; and (5) was in line with the needs ofloca\ communities.
Collaboration with other lecturers
It was concluded that lecturers thought that collaboration with other lecturers
was necessary to implement the new educational system. This was to help implement
the new system in line with the objectives of the Act, and to provide a new culture of
learning that would improve learning.
Opportunities for lecturer improvement
It was concluded that lecturers accepted that the new educational system
provided opportunities for educational knowledge and professional improvement to
227
lecturers, and that the lecturers might be provided opportunities for educational
kr.owledge and professional improvement in order to implement the change.
Pcrcejved value for students
It was concluded that lecturers agreed that the new educational system would
advantage their students because the change;(!) provided more learning activities for
students; (2) provirled standards and quality assurance for Thai education; (3)
provided for equal rights and opportunities for learning; and (4) improved higher
education in the line with the needs oflocal communities.
IMPLICATIONS
Implications for educational administrators
The results of this study indicate that almost all the hard items are located in six
aspects. They are I) participation in decision-making, 2) personal cost appraisal, 3)
alleviation of concerns, 4) \earning about the change, 5) collaboration with other
lecturers, and 6) practicality in the classroom. It suggests that educational
administrators should revise and amend new major changes in line with the
conclusions from the implementation stage. This means that administrators should try
to improve lecturer receptivity towards the etlucational change for each of the six hard
aspects.
Firstly, administrators, particularly the Rajabhat president, should give lecturers
opportunities to participate in decision-making at Rajabhats to improve their learning
in relation to Rajabhat Universities and students, and in order to maximise lecturer
receptivity to the change. Educational administrators and senior staff could arrange
for teachers to take part in dcdsioos about the change which affect their Rajabhat and,
in particular, their classrooms. It would seem that lecturers are more likely to
implement a new plan with Jess compromise if they have a say in how it is
implemented in their classrooms. This probably means the resources and methods of
tho change should be such that they can easily be used in the classrooms or, if there
are problems, then the resources 3lld methods can be adapted by the lecturers without
compromising the main aspects of the change required by the administrators,
228

Se<::ondly, educational administrators and senior staff should tailor their change
proposals so the lecturers can gain a perceived non-monetary cost benefit as a result
of implementing the change. This benefit can be in the fonn of increased satisfaction
with teaching, better student !earning, better matching of courses with student needs,
interests and abilities, and easier Raj ab hat administration.
Thirdly, educational administrators could try to ensure that there is effective
communication between lecturers and administrators. It would seem important that
the Rajabhat president is kept well infonned about the change proposal and is i•ble to
alleviate lecturers' fears and concerns when they arise. Educational administrators
could conduct regular briefings through forums such as administrators' associations,
newsletters and memos, and meetings and discussion groups in university
departments.
Fourthly, educational administrators could improve lecturers' awareness of the
change proposal. This could be achieved by improving Jcctums' knowledge about the
proposed change, and in particular, by presenting the benefits of the change for
students, lecturers and social to lecturers. Strategies employed le improve lecturers'
knowledge about the benefit of the change proposal could include the use of
brochures, workshops and seminars, and school visits. This is in line with the
implications of a major changed studied by Collins and Waugh (1997).
Fifthly, educational administrators shcu!d give lecturers opport1.1nitics fer
sharing knowledge with other lecturers. Various methods, singularly and in
combination, could be used to do this, such as infonnal meetings, fonnal meetings,
and lecturer workshops.
Sixthly, educational administrators and staff should tailor their proposals so that
they arc suited to, or adaptable to, the various teaching styles for various subjects.
Sufficient resources should be allocated to allow lecturers to implement the changes
in each subject and at each Rajabhat as faithfully as possible to the new plan.
Lecturers also have to be able to manage the day-to-day running of their classrooms
and any new plan needs tc allow them to deal wich problems; otherwise the teachers
are likely to implement major compromises to the plan. This is in line with
implications from Waugh and Godfrey (1995). Further, the majority of lecturers
reported that they were confused about the change in the initial stage because there
229

were various approaches given for implementation in the classroom. lfthe lecturers
are not going to be provided with guidance to develop stronger knowledge about the
change they must find ways themselves. If lecturer:; do not receive support from
within the educational system to aceess professional development relevant to their
needs, it is essential that they seek sources themselves. If administrators want
lecturers to adapt the change to different types ofRajabhat, they need to provide
special courses to help lecturers learn about the change and its implications, and
provide more opportunities for lecturers to develop and improve their teaching. This
is in line with implications from Waugh (J 995).
For the interview data, the major fi11dings were that lecturers believed that the
new educational system was better than the previous system because it was aligned
with the present economic, societal, and globalisation aims for Thailand. Further, they
commented that before the system was implemented in the classroom, lecturers
should be trained about the new educational system and they should adapt themselves
in line with the new educational sy.stem. These findings relate to administration in two
categories. They arc(\) administrator improvement and (2) lecturer improvement. For
administrator improvement, administrators could share a fresh view of educational
professionalism, which engages them in continuous networking, consultation and
collaboration with their staff and all those involved with change at the Rajabhats.
Dalin (1993) suggested thal administrators should set up plans for the professional
development of lecturers. They might provide activities and procedures to facilitate
staff development such 1lS assessment processes that lead to a university development
plan, project groups that provide staff with development and learning opportunities,
co-operative planning work, peer supervision that helps each lecturer to be critically
assessed by a trusted colleague, and planning and development of tailor-made courses
to import needed knowledge and skill appropriate to the development tasks that iri
which the University is involved.
Lecturers could share a common disposition lo discuss tasks that need to be
implemented. Moreover, they should believe that their colleagues have the potential
to be at least as good as thcmselve.s. This is in line with the suggestions from Bell and
Harrison {1998). For lecturer improvement, new materials concerned with learning
about the change could be created for lecturers in order that they could learn about the
change by themselves, such as computer assisted instruction, and multimedia. In
230

addition, lecturer opportunities for sharing knowledge with other lecturers could be
provided such as lecturer workshops, meetings, and tours of inspection.
Implications for lecturers
The findings of the present study revealed that lecturers need to adapt
themselves to gain more knowledge about the benefits of the change. This could be
done through various approaches.
First, lecturers could \cam more about the change. Michael (1997) suggested
that understanding higher education systems and the po!itical-cconomic forces
shaping them arc important to the appreciation of the dynamics within institutions of
higher education. They might Jcam about the change through brochures, workshops
and seminars, displays, and university visits. This is in !inc with findings from Collins
and Waugh (1997) in Western Australia. Further, they could learn about the change
by themselves from the mass media, visual education (specially designed videos), and
tours of inspection, including communicating with other persons.
Second, lecturers could involve themselves with professional bodies, and
practising professionals 'getting together' has long been an important role for
academics. Annual conferences, workshops and short courses on topical issues and
skills, relating to the change, could be widdy available. This is in line with the
suggestion from Pember {1998).
Third, ensuring participation in Rajabhal decision-making and other activities
can help raise lecturers' status within the Raj ab hat context and afford more
opportunities to explain lo others about how lhe change can be made practical in their
classrooms in line with the Act. In addition, they need to be active participants in
Rajabhal life, and be involved witl1 senior management, academic staff, other
lecturers, technical and library staff. This is in line with the findings from Mackay
(2001) in United Kingdom. Being active participants can help them become more
aware of opportunities, of the change, and how best to implement it.
Four1h, lecturers could adapt themselves to be quality lecturers in line with the
change. Hill, Lomas and MacGregor (2003) asserted that the quality of lecturers
consisted of three categories: 1) delivery in the classroom; 2) feedback to students
231
during th~ session and in assignments; and 3) relationship with students in the
classroom. Lecturen, could work on strategies to help themselves in these aspects.
l.ru;t, lecturers could adapt themselves for quality assurance in line with the
change. They could learn how higher education responds to the question of
accountability (in terms of what performance indicaton, to adopt) that would depend
on whether the system is operating under a centralized or decentralized approach.
This is in line with the suggestions from Michael (1997).
Implications for research on the change
The fiodings of the present study have contributed to knowledge of lecturer
receptivity to a major new educational policy change at Rajabhats in Thailand and
provided future possibilities for the direction of further research in the field. The new
model ofkctmer receptivity developed in the present study has enabled expectations,
implementation, and behaviour items, representing nine aspects of lecturer receptivity
towards the change, to be linked together with lecturer receptivity measures to form a
valid ;md reliable scale. However, the model can only be regarded as a beginning in
this area, and needs further testing and refinement. Subsequent versions of tho scale of
lecturer receptivity could be improved with altemative wording for some items, and
extending the model beyond the three perspectives to include capability of three
perspectives, thus forming a Gullman-type pa!lem for each of the perspectives in tho
model. For example, lecturers found that implementation was harder than behaviour
for the new educational system providing/or belt er classroom ma,iagemelll tha11 the
previous sys/em. It is probable that the implementation of classroom management
procedures was a little easier thao lecturers thought it would be in the oew system. It
is suggested that one issue that may have some bearing on the direction of future
models of lecturer receptivity is the need for a clearer distinction for classroom
management.
In addition, the model could be expanded to include additional aspects of
lecturer receptivity towards the change. The present model is focused on the eight
aspects (one did not lit the measurement model and was discarded) of the educational
system clmogc for Rajabhats' lecturers. The results of the study indicate that the
aspect of opportunities for lecturer improvcmcot does not fit the measurement model
232

when all items are analysed together. Further items encompassing this aspect need to
be included and existing items in the model need to be reworded. [t is also possible to
reword, or ammge subsequent versions of, all items in this aspect. Further, the model
could be amended for relating receptivity towards the nine aspects in an educational
system change, such as teacher receptivity in secondary schools, or in primary schools
in other countries.
233

LIST OF REFERENCES
Addison, P.A. (1995). Receptit-ily lo a proposed change in accounting educatirm. Unpublished doctoral dissertation, Edith Cowan University, Perth, Western Australia.
Altbach, P. G. (2001). Universities and globalisation. The Journal of Higher Ed11catio11, 72(2), 254-256.
Anderson, E. (1995). Polytomous Rasch models and !heir estimation. In G. Fischer & I. Molenaar (Eds.), Rasch models: Fouudatio11s, recc111 deve/op11icms and applicatiolls (pp. 271-291 ). New York: Springer-Verlag.
Andrich, D. {1982). Using latent trnit measurement models to analyse attitudinal data: A synthesis of viewpoints. In D. Spearrill (Ed.), The impro1•eme11/ of measuremrnt in educaliou am! psychology: Co111rib111ions of lote11/ trait theories (pp. 89·126). Melbourne: Australian Council for Educational Research.
Andrich, D. (1985). A lalcnt trait rne.isurcmcnt model for items with response dependencies: lmplicatio11s for tcst construction and analysis. In S. E. Embrcston (Ed.), Test desig11: Developme11ts in psychology 1111d psychometrics (pp. 245-275). Orl.indo: Academic Press.
Andrich, D. (1988a). A general fonn ofRasch's extended logistic model for partial credit scoring. Applied Meas1u·,.m1c111 in Education, 1(4), 363-378.
Andricl1, D. (l 988b). lla.,ch models for meas11re111e11/. Sage 1111iversity paper 011 quimlitative opplicatio11s 111 lhc sac/al sciences, series number 07/068. Newbury Park, California: Sage Publications.
Andrich, D. (1989). Distinctions between assumptions and requirements in mea.1urement in the social sciences. In J. A. Keats, R. Tan, R. A. Heath & S. Lovibond (Eds.), Mathe111a1ic1d am! theoretical Sys/ems (pp. 7-16). Amsterd.1111, North-Holand: Elsevier Science Publishers.
Andrich, D., Sheridan, B., Lyne, A., & Luo, G. (2000). RUMM 2010: A willdowsbascd item analysis program employi11g Rasch 1midi111e11sio11al 111e11s11re111e11/ models. Perth: Murdoch University.
Andrich, D., & vmi Schoubrocck, L. (1989). The general health questionnaire: A psychometric analysis using latent trait theory. Psyclwfogica/ Medicine, 19, 469·485.
Anonymous. ( l 966a). China in brief Jmpleme11talio1J of Ilic eight jive-plan. Beijing: New Star Publishers.
234
Anonymous. (1996b, July). The development of higher education syslenr i11 Malaysio: Policy and perspectives and inrp/icalionsfor cooperation in the SEAMEO regio11. Paper presented at the first SEAMEO-UNESCO PR OAP Regional ConCerence or Higher Education: Rccngineering of Higher Education for the 21" Century, Palua Pcnang, Malaysia.
Anonymous. ( 1996c, July). Higher Ed11catio111ir /11do11esia Country. Paper presented at the first SEAMEO-UNESCO PRO AP Regional Conforenc,1 of Higher Education: Reengincering of Higher Education for the 21" Century, Pa\ua Penang, Malaysia.
Austmlia Curriculum Studies Association. (2001). Standard ofp1·ofessio11a! practice for accomplished tcochi11g i11 A11straliw1 classroom. Retrieved March 29, 2001, from hllp:l/www.austc(ll\ed.com.au
Bel!, J., & Harrison, B. T. (1998). Leading people: /ean1i11gfrom people. Great Britain: Biddies Ltd., Guildford and King's Lynn.
Bcmian, P. (1978). The study of nrncro-and macro-implementation. /'11/J/ic Policy, 26 (2), 157-184.
Berman, P., & Mclaughlin, M. W. (1976). Implementation of education innovation. The Ed11ca1io11a/ Forum, 40(3), 345-370.
Board, M. (2001 ). Plmcl on 1hcfi1h1re of higher ,•d11c11tia11. Retrieved March 27, 2001, from http://www.cducause.edu/puplcr/~'ml00/mJ03203.1rul.f
Botstcin, L. (2001). A brave new world? School Admi11islra/or. 58(3), 6-9.
Boyd, G. S. (2002). Early childhood 1cacliers' perceptio11s of the leadership role. Unpublished doctoral dissertation, Edith Cowan University, Perth, Western Australia.
Clarke, A., & Dawson, R. ( 1999). E1dualirm re.1carch: An i11lrod11ctio11 to prillciples, method mid practice. London: Sage Publications.
Coaldrake, P., & Stedman, L. (1998). On the hr ink. Queensland, Australia: University ofQuecnsland Press.
Collins, P.R., & Waugh, R. F. (1998). Teachers' receptivity to purposed system-wide change. Journal of Ed11ca1io1ml Administration. 36(2), l 83-199.
Conley, S. (1991 ). Review of research on teaehcr participation in school decision making. Re1•iew of Research in Educmiori, I 7, 225-268.
Corcoran, T. B. (2001 ). lfe/pi11g teachers teach well: Tra11sforml11g professional developmetU. Retrieved March 29, 2001, from http: /lwww .ed.gov/Pubs/CPREl\6 !
235
Critical Issue Bibliography. (2001). Student and academic affair:;. Retrieved April 2, 2001, rrom hltp:flwww .erichc.org(cripl5tudaffrs.htm!
Dalin, P. ( 1993). Cha11gi11g the school culture. London: Redwood Books.
Dawkins, J. S. (1988). Higher ed11calio11: A po/icy s/atemel!I. Canberra: Australian Government Publishing Service.
Deem, R (2001 ). Globalisation, new manageria!ism, academic capitalism and entrcprencurialism in universities: is the local still important? Comparati1•e Educa1io11. 37(1), 7-20.
Department of Education Science anil Tniining. (2003). Universities iii Australia. Retrieved March 28, 2003, fron1 h!!n.Pwww.dest.gov.au
Douglas, G. (1982). Conditional inference in a generic Rasch model. In D. Spcarritl (Ed.), The improvcmc/11 of measurement 111 erlucatiou a11d psychology: comrib11ti011s of /atcut trait theories (pp, 129-157). Hawthorn, Victoria: Australian Council for Education Reseorch.
Doyle, W., & Ponder, G. A. (1997-1998). The practicality ethic in teacher decision making. !nterclm11ge, 8(3), 1-12.
Doyon, P. (2001 ). A review of higher educational rcfom1. flig/ler Ed11catio11, 41(4), 443-470.
Eiscmon, T. 0., Mihai!cscu, I., Vlascconu, L., Zamlir, C~ Sheehan, J., & David, C. I-1. {1999). Higher education refonn in Romania. Europem1 Ed11ca1io11, 31(2), 39-62.
Flick, U. (1998). An l!!lroductiou to Qua!ita/ive Research. London: Butler & Tanner Ltd.
Gess-Newsome, J., Southern land, S. A., Johnston, A., & Woodbury, S. (2003). falucational refonn, personal practical theories, and dis,atis!action: The Anato1ny of cha11ge in college science teaching. American Educalional Research Jouma/, 40(3), 731-767.
Giacquinta, J. B. (!973). The process of organizational in schools. In F. N. Ker linger (Ed.), Review af re:;earch {11 education (Vol. I, pp. 178-208~ Itasca, IL: Peacock.
Giaequinta, 1. B. (1975). Status risk-taking: a central issue in the initiation and implementation of public sclmo] innovations. Jarmwl of Research a11d Devc/apme11/ {11 Ed11catfo11, 9(1 ), 102-114.
Glanz, J. (2000). Univcrnities and globalization. Ed11ca1io11al Studies, 30, 342-346.
236
Green, J. G., & McClintock, C. (1985}. Triangulation in evaluation: design and analysis issues. Evaluation Review, 9(5}, 252-291.
Gunn, C., & Recker, M. M. (2001). New Zealand higher education in the ageofthc global virtual university. Ed11catio11a/ Tech110/ogy Research ond Development, 49(2}, 107-116.
Hambleton, R., & Swarninathan, H. (!985). Jtem response theory: principles and applicalions. Boston: KluwcrNijhoff Publishing.
Hill, Y., Lomas, L., & MacGregor, J. (2003). Students' perceptions of quality in higher <!duc.1ticn. Q11a/ily Ass11rance i11 Educarion, 11(1), 15-20.
Hunnakin, P. (1978). Thai cd11cario11. Bangkok, Thailand: Tlmiwaltlmnapanil.
International Association or University Presidents. (2001). JAUP policy slalcment 011
tecli110/ogy and /iig!icr educalio11. Retrieved March 29, 2001, from hltp·//www .csug.edu/iaup/pol stm4.html
lumpalhong, S. (1979). Thai reacher traiuing: pas/, present, audfl1tr1re. Nakomratchasinm, Thailand: Nakomratchasima Teachers' College.
Kasetsart University. (l997). Higher educallon i11 Thailand: Solu1io11 considered hig!Jercdurntiou budgets. Bangkok, Thailaml: Knsclsart University.
Kemp, D. A. (1999, December). Qm1/i1y assured: a 11cw A11.~lralia11 quality assurance framework/or university ed11ca1{011. Paper presented at the seminar on New Quality Assurance Framework, Canberra, Australia.
Keranun, T., Jamonman, U., Sirisumpun, T., Wisanwaj, T., & Jetsadachut, P. (2000). Preparing govemmc11/ wi!Fcrsities towards aulo11oma11s inslilulion. Bangkck, Thai fond: Office ofRescarcl1 Supporting.
Kumar, R. (1996). Researcli mcrkodology. London: Sage Publications Ltd
Kuo, E.W. (2001). Crca/brg beneficial i1Jslitutio1111/ col/abora/ion. Retrieved April 4, 200 I, from http://www.ericir.syr/plwcb-cgi/fastweb?gctdoc+ericdb
adv+ericdb+999467 +0+w AAA +%28partnrnhip%29%26AND%26 %281ink%29%26AND%26%28highcr%26education%29%26 AND%26%28073%29%26%3Apublication_typc
Law, W. (1995). The role of the Slate in higher education rdonn: Mainland China and Taiwan. Comparative Edru:alion Review, 39(3), 322-355.
Lim, T. G. (1995). Malaysia and Singaporean higher education: Common roots but different directions. In A.H. Yee (Ed.), East Asia11 higher education, traditions a11d 1ra11sfor111a1io11 (pp. 69-83). U.K.: Elsevier Science Ltd.
237
Mackay, M. (2001). Collaboration and liaison: TI1e importance of developing working partnerships in the provision of networked hybrid services to lifelong learners in rural areas. Library Mar,agement, 22(8/9), 411-415.
Mc A tee, W., & Punch, K. F. (1979). Accounting for teachers' altitudes towards change. Jormwl of Educotio11al Administration, !7(2), 171-182.
Michael, S. 0. (1997). American higher education system; consumerism versus profossionalism. llllernationa/ Jo11rnal of Edr1catio11 Mo11ageme11t, I 1(3), 117-130.
Miller, H. (1995). The ma11age111e11/ of change in 1111iversities: Slate aud ccor1omy i11 Australia, Ca11ada, and tile United Kingdom. Buckinghnm: The Society for Research in Higher Educ~lion and Open University Press.
Ministry of Education. (1964). History of Minisll)' of Education. Bangkok, Thailand: Kurusapa.
Ministry of Education. (2001). Basic ed11cario11 ciirricu/11111. Bangkok, Thailand: Ministry of Education.
Ministry of Education Science and Cullurc Japan. (1994). Educatio11 i11 Japar1. Tokyo: Gyosei Corporation Japan.
Miria1n, H. (!996). Tile restr11c/uring of higher educalio11 ill A1mralia. Paris: UNESCO.
Monitz, B. (2001). Panel 011 1/iefulure of higher edueation. Retrieved March 2B, 200 I, rrom hl1p:l/www.cduease.cd0/pt1plermOO/pp03203 7
Moroz, R., & Waugh, R. F. (2000). Teacher receptivity to system-wide educational change. Jormml of Edi1ealional Admi11islrotio11, 38(2), 159-178.
National Office of Overseas Skills Recognition. (1991). Cor111l1J> education profiles. Malaysia am/ compara/il'e st11dy. Malaysia: National Office of Overseas Skills Recognition.
Nixon, J., Martin, J., McKcown, P., &Ranson, S. (1997). Towards a new professionalism: changing codes of occupational practice within the new management of education. Joumal of Edr1cationa/ Administration, 18(1), 5-28.
Office for National Education Standards and Quality Assessment. (2002). Edu.cali011a/ qr1ality assurance. Bangkok, Thailand: Office for Nalioirnl Education Standards and Quality Assessment.
Office ofNitirat Press. (2002). Reorga11isatio11 af admir,islralfre structure in acconli11g willi the 1999 National Educatio11 Act. Bangkok, Thailand; Office ofNitirat Press.
238

Office ofRajabhat Institutes Council. (2000). Rajah/wt diary 2000. Bangkok, Thailand: Office ofRajabhat Inslitutes Council.
Office ofRajabhat Institutes Council. (2002). J111roduclio11: Rojabhat Institutes. Retrieved May 16, 2002, from http:/fwww.rajabhat.ae.th
Office ofRajabhat Institutes Council. (2003). Rajablwt: Diaiy of Rajahllat lnsli/utcs 2003. Bangkok, Thailand: Office ofRajabhat Institutes Council.
Office of the Educational Rcfom1. (2000). Educatio11al reform (Vol. 2). Bangkok, Thailand: Office of the Educational Rcfonn.
Office of the National Education Commission. (1998). Thinking and direction of higher education reform i11 1he 21" ce11t11ry. Bangkok, Tliailan<l: Office of the National Education Commission.
Office of the National Education Commission. (1999a). Tile Approach/or education reform in accordance willi the Na1io11al Education Ac/ of B.E.2542 (/999). Bangkok, Thailand: Office of the National Education Commission.
Office of the National Education Commission. (\999b). Educarion i11 Thaila11d 1999. Bangkok, Thailand: Amarin Printing and Publishing.
Office of the National Educaiion Commission. (1999c). The N11tio11a/ Educalio11 Act of B.E.2542 (/999). Bangkok, Thailand: Seven Printing Group.
Office of the National Education Commission. {2001 ). Education ill Thailand 2000/200/. Bangkok, Thailand: Office of the National Education Commission.
Office of the Na!ional Education Commission. (2002). Ed11calio11 in Thailand 200112002. Bangkok, Thailand: Office ofthc National Education Commission.
Olswang, S. G., & Lee, B. A. (200 I). Associutionfor 1/ie study of higher education. Retrieved March 27, 2001, from http://www.eriche.org/digcsts/ED284517.html
Pember, M. (1998). The rise of the 'new age' records management professional: records management education and training in Australia. Records Ma1wgcmcnt Jo11ma/, 8(3}, 63-75.
?hornphong, W. (2002). Trends for developmc11/ of rmtmwmy of Rajabhot Ubo11 Ra1cliatlia11i Uuivrmity. Ubon Ratchathani, Thailand: Rajabhat Institute Ubon Ratchathani.
Privateer, P. M. (1999). Academic technology and the future of higher education: Strategic paths taken and not taken. Jo1mial of Wgher Education (Columbus, Ohio), 70(1}, 60-79.
239
:wrre --Punch, K. F. (1998). Introductiou to social research: Quantilative a11d qualitative
approaches. London: Sage Publications.
Rajabbat Institute Ubon Ratchathani. (2000). Educatio11a/ statistics of Rajabhal lnsli//1/e Ubo11 Ratchotharri. Ubon Ratchathani, Thailand: Rajabhat Institute Ubon Ratchathani.
Raj ab hat Institute Ubon Ratchathani. (200la). S111denl handbook: The academic year 2001. Ubon Ratchathani, Thailand: Rajabhat Institute Ubon Ratchathani.
Rajabhat !nstilutc Ubon Ratchathani. (2001b). Quality assurance for Rajabhat Inslitute Ubo11 Ratcharhaui. Ubon Ratchathani, Thailand; Rajabhat Institute Ubon Ratchath,mi.
Rajab!mt Institute Ubon Ra!chathani. (200lc). Rajabhat: The University for all. Ubon Ratchath.1ni, Thailand: Rajabhat Jnstitute Ubon Ratchathani.
Raj ab hat Institute Ubon Ratchathani. (2002a). Sys rem of ed11catio1Jal q1wlity assurance. Ubon Ratchathani, Thailand: Rajabhat Institute Ubon Ratchathani.
Rajabhat Institute Ubon Ratchathani. (2002b). Student handbook: The academic year 2002. Ubon R~tchathani, Thailand: Rajabhat Institute Ubon Ratchathani.
Ranuwihardjo, S. (1995). Higher education in Indonesia: It's development, problems and prospects. In A. H. Yee {Ed.), East Asian higher cd11catiou, tmdition aud /rausformatio11 (pp. 84-91). U.K.: Elsevier Science Ltd.
Rasch, G. (1980/1960). Prababilislic mode/for some intelligence aud al/af11meut Jests. Chicago: The University of Chicago.
Salmi, J. (1999). Higher education at the eve of the 21" ce11tury. Bangkok, Thailand: Office of the National Educntion Commission.
Sitlhironnar\t, W. (1979). Thai et!11catio11. Bangkok, Thailand: Sillapakom University.
Styles, [., & Andrich, D. (1993). Linking the standard and advanced fonns of the Raven's Program Matrices in both the pencil-and-paper and computer-adaptive tests. Ed11catio1Jal Psychological Mca.mreme1rt, 53(4), 905-925.
Syed, J. S. (1995, December). Implication of corparalisatio11for Malaysia. Paper presented at the Malaysia Seminar x510 on Higher Education Management: Challenges and Respon~cs, The Pan Pacific Glenmaria Resort, Kula Lumper, Malaysia.
Tack, M. W. (2001). Thecha11gillgfaceof/Jighcreduca1(011: Trendand(ssues. Retrieved December 26, 2002, from http://www.cminix.emich/mtack/findlay.html
240
United Nations Development Program. (1989). Edt1Cll/ion and training in the 1990s. New York: United Nations Publications.
Venables, J. (1997). Bum out warning at rebirth of the cool. Multimedia section, The Times Higher Educa1io11 S11ppleme11t \4 March.
Waugh, R. F. (1983). Teac/1er receptivity lo system wide change in the impleme11ta1ia11 srage. Unpublished doctoral dissertation, University of Western Australia, Perth, Western Australia.
Waugh, R. F. (1999). Teacher receptivity to a system-wide change in a centralized Education System: A Rasch measurement model analysis. Jo11ma/ of Outcome Measurement, J(!), 77-78.
Waugh, R. F. (2000a). Townrds a model of teacher receptivity to planned systemwide educational change in a central controlled system. Jormial of ed11callo11al Adm(mS/ralion, 38(4). 350-367.
Waugh, R. F. (2000b). Meas11ri11g self-reported studying and /eamingfor university sruder11s: Linking a11i111des and belmvio11rs 011 the same scale. Perth, Western Australia: Edith Cowan University.
Waugh, R. F. (2001 ). Measuring ideal and real self-concept on the same scale, based on a multifaceted, hicrachic.al model of self-concept. Educalio11al 011d Psychological Meas11reme11t. 61(! ), 85-101.
Waugh, R. F., & Godfrey, J. (1993). Teacher receptivity to system-wide change in the implementation stage. British Educolio11al Research Jarmial, 19(5), 565-578.
Waugh, R. F., & Godfrey, J. (1995). Understanding teachers' receptivity to systemwide educational change. Jouma/ of Educational Ad1rd11istratio11, 33(3), 38-54.
Waugh, R. F., & Punch, K. F. (1985). Teacher receptivity to system-wide change. Brilish Ed11catio11a/ Research Jo1mwl, { /(2), I 13-121.
Waugh, R. F., & Punch, K. F. (1987). Teacher receptivity to system wide change in the implementation stage. Re~icw of Educational Res care/~ 57(3), 237-254.
Wiersma, W. (2000). Research methods i11 cducatio11: a,1 illtroduclion. Boston: Allyn & Bacon.
World Bank. (1999). Higher ed11cotio11.· The lessons of e:rperie1Jce. Suratthani, Thailand: Rajabhal Institute Suratthani.
Wright, B. (1999). Rasch measurement models. In G. N. Masters & J.P. Keevcs (Eds.), Advances it, meos11rcment in cdr1catio11al research a11d assessment (pp. 85-97). Oxford: Elsevier Science Lld.
241
"'™ ..
Wright, B., & Masters, G. {1982). Rati11g scale analysis: Rasch measurement. Chicago, IL: MESA Press.
Wright, B., & Stone, M (1979). Best lest desig11: Rasch measureme/11. Chicago: MESA Press.
Yee, A.H. (1995). East Asia11 higher educatia11: Tradi1(ons and trausformatiom. U.K.: Elsevier Science Ltd.
Zhu, W. (1996, July). China's higher ed11culim1 strides towards the 1we11ty-first cemu,y. Paper presented at the first SEAMEO-UNESCO PRO AP Regional Conference of Higher Education: Rccngineering of Higher Educiltion for the 2!" Century, Pulau Penang, Malaysia.
242

Appendix A: Questionnaire and follow-up letter
Dear Infonnant
This study is being undertaken to investigate lecturer receptivity to a major
new educational policy change in Jiae with the National Education Act of !999 at
Raj ab hats. The infonnation will lead to the clarification of lecturers' receptivity
towards a major new educational change, and the reasons they have for their attitudes.
You are asked to complete the attached questionnaire. It contains 50 statements
covering nine lcclurer·clrnngc aspects in relation lo a major new educational policy
change. These arc (l) comparison with the previous system, (2) practicality in the
classroom, (3) alleviation of concerns, (4) learning about the change, (5) participation
in decision·making, (6) persona! cost appraisal, (7) collaboration with other lecturers,
(9) opportunities for lecturer improvement, and (9) perceived value for students.
It is expected that this research will be benefit the Rajabhats, lecturers, students,
educational administrators, and researchers studying the new educational policy
change.
Your consent to be interviewed would be very welcomed and appreciated. You will
be assigned a subject number, whicl1 will be used by the researcher to assure
confidentiality of individual results.
It will take approximately 20 minutes. You are requested to take time with the
questions and answer them honestly.
Any questions concerning the project can be directed lo Anusak Ketusiri on
(045) 262 423-32 ext. 1217.
I have read the infonnation above and any questions I have asked have been answered
to my satisfaction. I agree to participate in this activity, realising that I may withdraw
at anytime.
I agree that the research data gathered for t\1is study may be published provided my
name iS not used.
Signature ......................................................... Date ................... .
Investigator .........................•........................... Dale .................. ..
243
Note:
Jfyou would like to receive a copy of a results of this study please complete the slip '
below and return to:
Asst.Prof.Anusak Ketusiri
Faculty of Education
Ubon Ratchathani Rajabhat University, 34000
Name ............... ~'. ............................................................................. .. '
Address ...................• , .................•. , .............. :~ •...•................•.............
Postcode ..................... ,_
------------
244
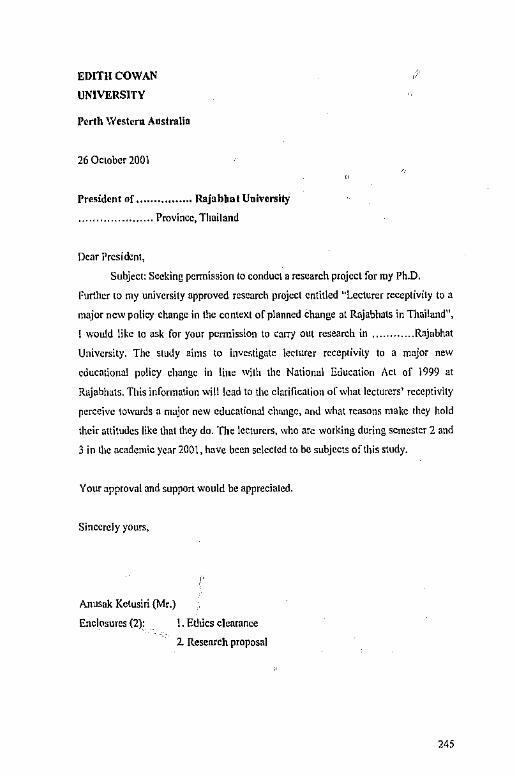
EDITH COWAN
UNIVERSITY
BIWPR
Perth \Vestem Australia
26 October 2001
President of,, .............. Rajabhat University
..................... Province, Thailand
Dear President,
Subject: Seeking pcnnission to conduc\ a research project for my Ph.D.
Further to my university approved research project entitled "Lecturer receptivity to a
major new policy change in the context of planned change at Rajabhats in Thailand",
! would like to ask for your permission to carry out research in ........... Rajabhat
University. The study aims to investigate lecturer receptivity to a major new
educntiona! policy change in line with the National Education Acl of )999 at
Rajabhats. This infonnation will lead to the clarification of what lecturers' receptivity
perceive towards a major new educational change, and what reasons make they hold
their nttitudes like that they do. 'fbe lecturers, who arc working during semester 2 and
3 in the academic year 2001, have been selected to be subjects of this study.
Your approval and support would be appreciated.
Sincerely yours,
Anusak Ketusiri {Mr.)
Enclosures (2): I. Ethics clearance
2 Research proposal
OJWZ,UOA.USG&Z
245
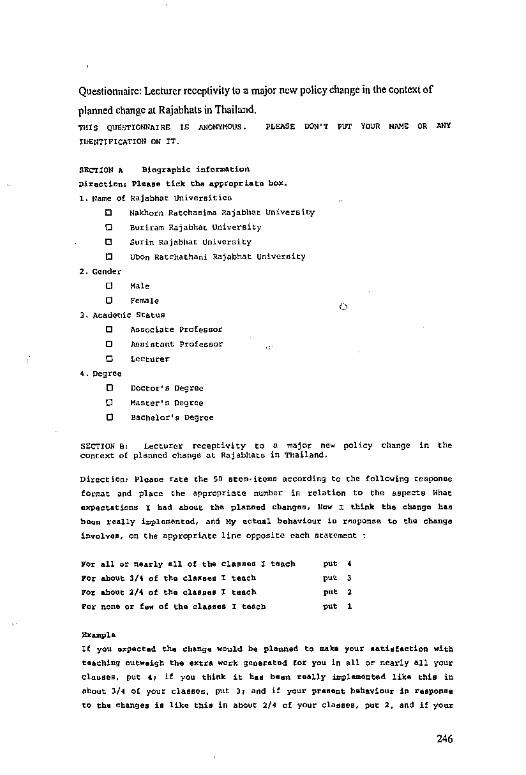
-
Questionnaire: Lecturer receptivity to a major new policy change in the context of
planned change at Raj ab hats in Thailand. 'l'l!l S QU!l!,'TIOIDIAI RE 15 ANONYMOUS •
WENT!FICA'l'IOII ON IT.
PLEASE DON'T PUT ¥0\JR NAME OR l\NY
SECTION A llio9"nphic infon,ation
Diracticn, Pleau tick tl>a appropriate b<>:<.
l. Name of Rajabhat Universit!ca
D Nakhorn Ratchaeima Rajabhat University
D Buriram Rajahhat Univershy
D Surin Rajabhat Univer5ity
D Ubon Ratchathan! Rajab'1at Univeraity
,. Gender
D Male
D l'ema!e
J, N:ade<ilc Status
D /\aaociate Profesaor
D l\!lniatant Professor
D Lecturer
'. Degree
D Doctor's Degree
D Master's Oe<3ree
D Bachelor's Degree
SECTION e, Lecturer receptivity to a major new policy change in the context o( planned change at Rajabhatn in Thailand.
Direction, Pleaoe rate the SD stcrn·item• according to the following reaponse
format and place the appropri.,,te number in relation to the aopecte Hhat
nx,>ectaticns I ba<l about thB planned cbangBo, llcw :i: think the change bu
bean roally i,opla.,entad, and My actual behaviour io r11oponoB to tbe change
involvoo, on the appropri.~te line opposite each statement
for all or nearly all of tho ClBDDOO ! teach put
Fer about 3/4 of tba clUHO l teach
For about l/4 of tl>a cl&oau l teach
Per none er hw of the cluou I tHcl>
)txamph
pu~ 3
put l
put 1
If you a><Pecta<1 the change "ould he planned to makoo your aeti•factioo with
teaching cutweigl> the e,ctra worl< gooeuted for yau in all or nearly all your
cl,rnocs, put 41 if you think it bu baan roally il<lplemented like tllis in
about l/4 o[ your claoaea, put lr and if your pr•oant bahavicur in responoe
to th• changes is lik~ thh in abou~ 2/4 of your claaeco, put~. and if your
246
.... 5.
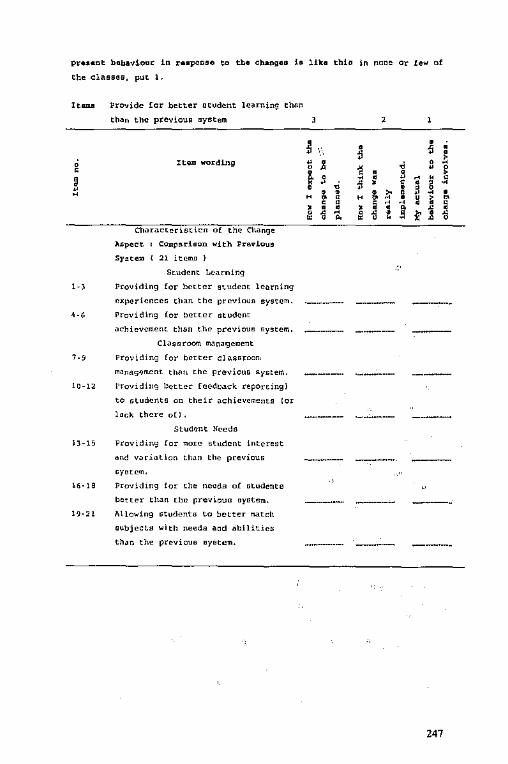
Pr•••nt b•ba,,iour in raaponse to the ol,.ongu h lika tbia in none or Lew of
the classea, put l,
! ! "
Provide Lor better etudent learning than
than the previous oystem
ItP wordlng
Characteristirn of the Change
11opect co,.padoon witl> Previous
Syatem 21 i tema )
Student !.earning
1-l Providing for better sludent learning
expedcnceo than the pcevious system.
4-6 Providing for better otudcnt
achievement than t.he previous system.
Claooroom mana9ement
7-9 Providing [or better clasoroon,
manug~ment than the previouo system.
l 0-12
))-15
P!:ovidir,g better feedback repordng)
to r,tudents on their achievements lo<
lack there o[I.
Student lleeds
Providing for mor" student interest
and v~r:iatlon than the previous
oystem.
P<oviding !or the needs of otudents
!>otter than the previous oyotem.
11\iowing studento to better rTl1lUI\
oubjecta with needa and abllhica
than the previouo oyoto,m.
l
247
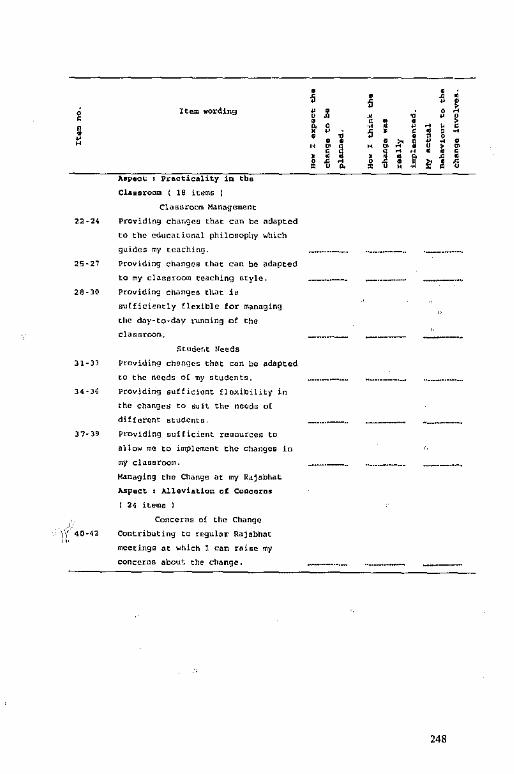
22-24
25·27
2a .30
31-Jl
34 ·36
37· )9
f,' 40-42
"
ITT
Item wording
Aopeo~ , Practicality in tho
Clauroom ( 10 items I
Claagroom Management
Providing char,geo that can be adapted
to the educational plliloaophy "hich
guides my teaching.
Providing cha'1ges that can be adapted
to my clanarnom teaching ntyle.
Provi<ling changes that ie
sufficiently flexible for rnanaglng
the da1-··to-day ,"\.Inning of the
clasoroorn,
Studer.t Needs
Providing changes that can be adapted
to the needs o[ my otudento.
Providim:i suff1cient flexibility in
the change~ to suit the need" o[
different students
Providing nufricient reaource& to
allow me to implement the change• in
my claaaroo,o.
Kanaging the Cl1ange at my R<1jabh,,t
ABpect , Alleviatior. of Ccocaro•
I 24 itema I
Concerna of the Chango
Contributing to regular Rajabhat
meeting• at "'hkh 1 can r~ioe my
concerns about tho change,
l
SWWWAM
l . ! ! •
248
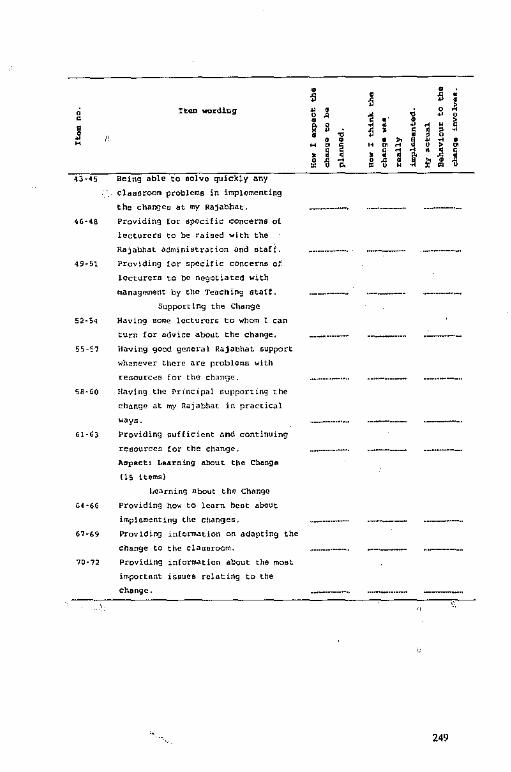
5B·GO
61 ·6)
U·6G
67·69
70·7:l
Being able to eolve quickly any
clansroom problems in implementing
the chall<)ea at my Rajabhat,
Providing [or specific concerns ol
lecturers to be raised with the
RajabllaL M0>lnistration and ntari.
Prov;ding !or specific concerns of
lecturern to be negotiated with
rnanagemet1t by ch<> Teacning atarf.
Suppon!ng the Change
)laving some lecturers to whom I can
turn [or advice about the change,
Having good gen<H·al Rajabhat support
whenever there are problems with
resourc~, !or the chan<Je.
!laving tile Principal euppc,rung the
change at o,y Rajabhat in practical
wayn.
Providing i;ufficicnt an<I continuing
re"ourcea [or the cl1angc,
Aapact, Laarning about tho Change
!lS itcmn)
l,earning nbout the Change
Providing how to lcurn bent a~Ut
impl~m~nting the ch,ingea.
Providin<J inlo.rnatlot\ on adapting the
change to the claaaroom.
Providrng information about the most
!mponnnt isouea relating to the
change.
249
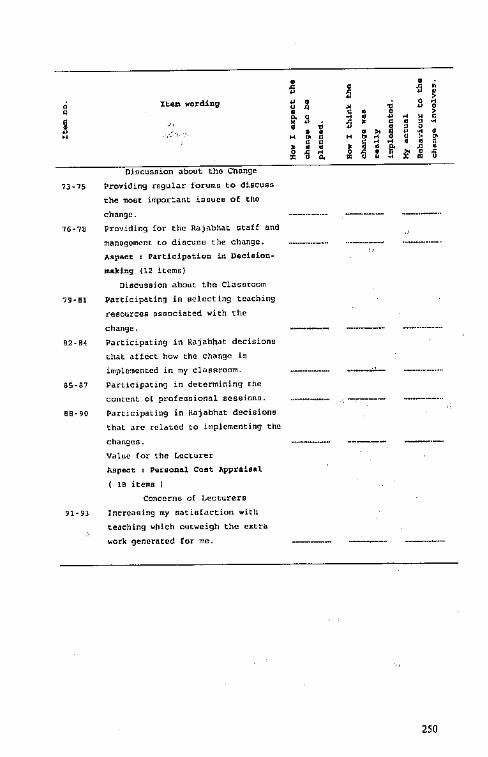
0 0
! "
'3·1S
76-?H
"/9 • Bl
02- 04
85-87
B8· 90
91· 9]
Obcussion al>out the Chanse
Providing regular forumo to disr;uso
the moat impor~ant isoueo of tho
change.
Providing Lor the M.j,<bhat ~taff and
:nanagoment to diecunu the change.
11,spact , Particip~tion in o .. doion
mo.king (12 items)
Discusaion about the Clasornom
l'anicipating in selecting teaching
reeources oooociated with the
chan9e.
Participating in Rajabhat decisions
that aUcn how the change is
imple'Oented in my class,oom.
Participating in determining the
content o( p,·ofeooional scsGiono.
Pankipating in Rojabhat decisions
that are rdated to implementing the
changes.
Value for the Lecturer
l\opoot , Personal Cont 1.pprdul
( lB Items I
Concerns of Lecturers
lncrcaoin9 my satiof<H:tion with
teaching whkh outweigt, the extr;,
work generated for me.
250
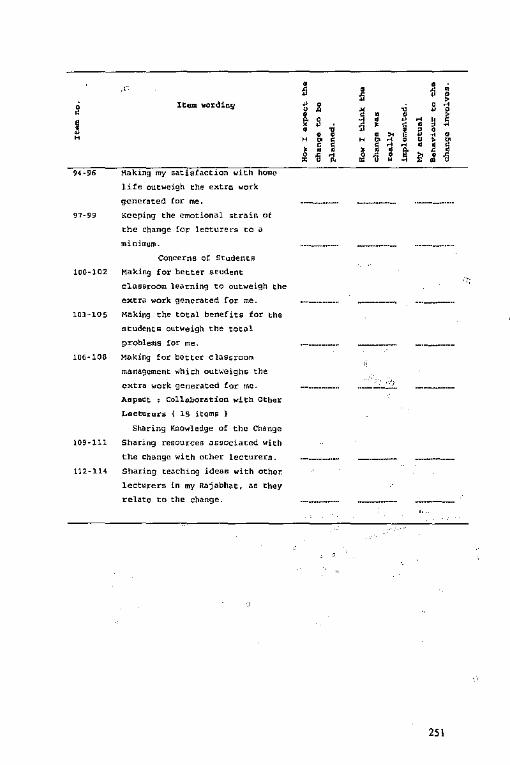
! "
97·99
100-102
It..,. ""rdin'il
Making my Batiefaction with home
life outweigh the ext«> work
generated for me.
Keeping the emotional atrain ot
the change ror lectu,ern to a
minimum.
Concerns ot St.identa
Making Cor better student
classroom lea:rnlng to outweigh the
extra work generated for me.
lOl·lOS Making th~ total benefits for the
students outweigh the total
problems Cor me.
106·108 M<>king for better Cl05HOOffl
management which out••eighs the
extra work generated for me.
Anpaot ; Collo.borati<>n with Other
L<>nturors ( lS items l
109-111
112-114
Shoring Knowledge of the Change
Sharing resources associated with
the Change with other lecturers.
Sharing teaching ideac with other
lecturer!! in my Rajabhat, ao they
relate t<> the change.
• ' 0 i 0
! • • 0 • " • • • ' • ~ '
l • ' a • • • •
' ' ' • ! i t ~ " • a a ! • ! a
' • • • •
··---:.:'.!..
251
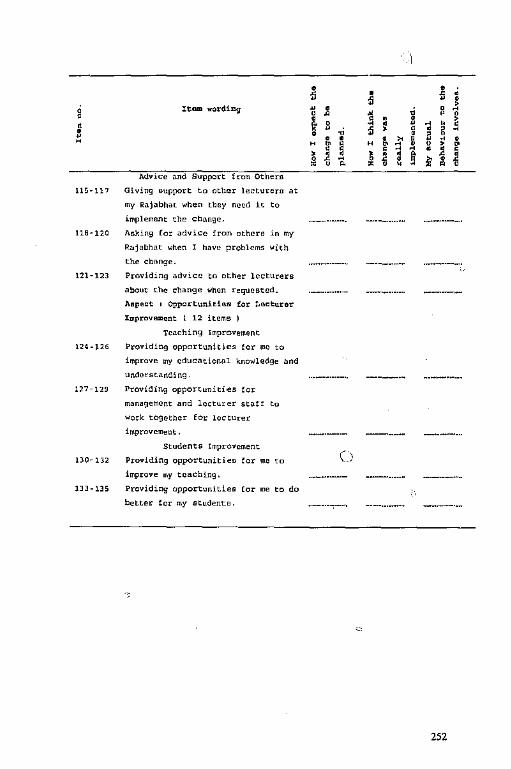
g
l "
115·117
11B·l20
121-123
124-126
1)0-112
lJJ-lJS
Itom wording
Mvice an<l Support from Others
Giving aupport to other lecturern at
my Rajabhat wllen they need it to
implement the change.
Asking for advice !,om othcro in my
Rajabhat when J have problems 1<ith
the chnnge.
Providing advice to other lecturers
about the change when requested.
Aopoct , Opportunith" for !,octurer
1,.provftmont ( 12 items
Teaching lrnprovernent
Providing opportunitieo for me to
improve my cducationol knowledge and
un<lcrstanding.
Providing opportuniti,es ro"
management and lecturer sta!f to
work together for lecturer
irnprovement.
StudentG lmproverncnt
Providing opportunitien for me to
improve my teaching.
Providing opportunltieo tor me to do
better for my Hudcnta.
(_)
--·-·-·- .--~.
252
--------------=·~
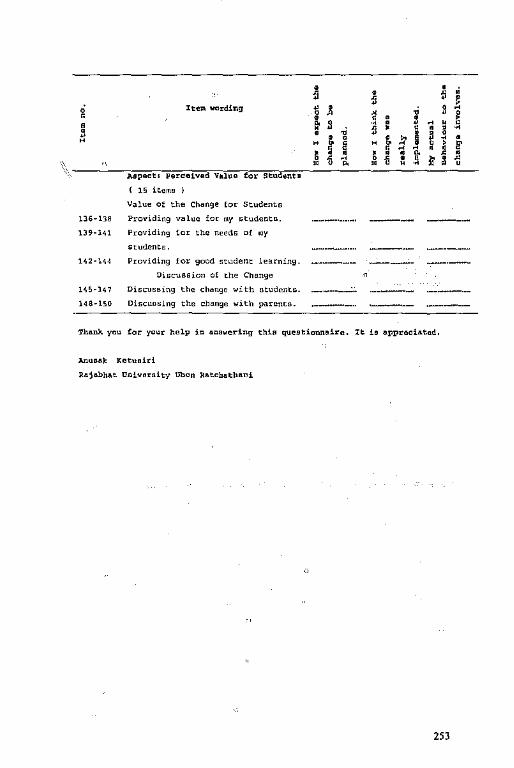
It""' wording
. ' ! z I'! t ] 3 ~
fs,a J; !!1l, .. "il'~ "i,~:~ :.i~~~ Ir ~1i:. ~{i1 t;~
\.--~M~,.~.,~. ~,.~ .• =-.,= .. ,~.~""'••~<~,.~,~,,x,,=oo~, --------( 15 items )
lH-141
142·1'!4
HS-147
HS-150
Value of the Change [or Students
Providing value for my studentn.
Providin9 [or the needs of my
students.
Providing for good stL1dent learning.
Discussion of the Change
Discussing the chat1<3e "'ith otudents.
Discun"ing the change with parenta.
'.l'hank you for ycur holp in an,.,ering tllia questionnaire. It io apprecia.tad.
Anusa):. Ketueid
Rajabhat tlnivorsity Ubon }U1.tchat1>ani
253

a z:w•=
Follow-up letter to questionnaire
Dear lofonnant
Recently, a survey questionnaire on lecturer receptivity to a major new policy change in the context of planned change at Rajabhats in Thailand was sent lo you.
If you have completed and returned questionnaire, l tl1ank you sincerely for your time and effort. Your contribution is vallted and you will help knowledge in lee lurer receptivity education.
If you have yet to complete the questionnaire, I wish to reiterate how appreciative I would be of your response. The qua lily of data obtained from this questionnaire will depend largely on high retum r.itc.
I realize you will become increasingly busy at this time of the year, but appeal to your professionalism and kindness and ask that you support research into lecturer receptivity by completing and return the questionnaire.
Jfyou did not receive a questionnaire but would like one, or if you are willing to be involved further by participating in an interview, please contact me on 01-9674440.
Thanking you in anticipation of your support, Yours sincerely
Anusak Ketusiri
254
., ,,,,..,......
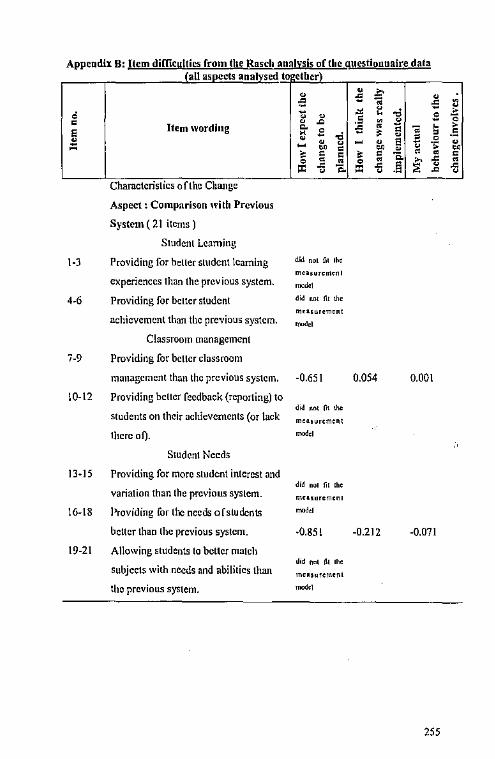
Appendix B• Item difficulties from the Rnscb analvsis oftlie auestionnalre data fall asnects analvsed to ether)
1-3
Item wording
Charactcnst1cs ofthe Cha:nge
Aspect: Co1nparison with Previous
System ( 21 items)
Student Leaming
Providing for bell er student learning rl.t not fll lhe
m,.,u,cmenl experiences than the previous system. ,oo&I
4-6 Providing for better student
achievement than the previous system.
Classroom management
i-9 Providing for bc1tcr classroom
!0-12
13-15
16-18
management than the previous system.
Providing belier feedback (reporting) to
students on their achievements (or Jack
there of).
Student Needs
Providing for more student interest and
variation than the previous system.
l'roviding for the needs ofstudents
better than the previous system.
19-21 Allowing students to better match
subjects with needs and abilities than
the previous system.
rli~ not fit \lie
m.a,urement
-0.651
meo,ur<mont
did nol fit the
me.,urcmcnl
"""'' -0.85!
did not fll lhe
0.054 0.001
-0.212 -0.071
255
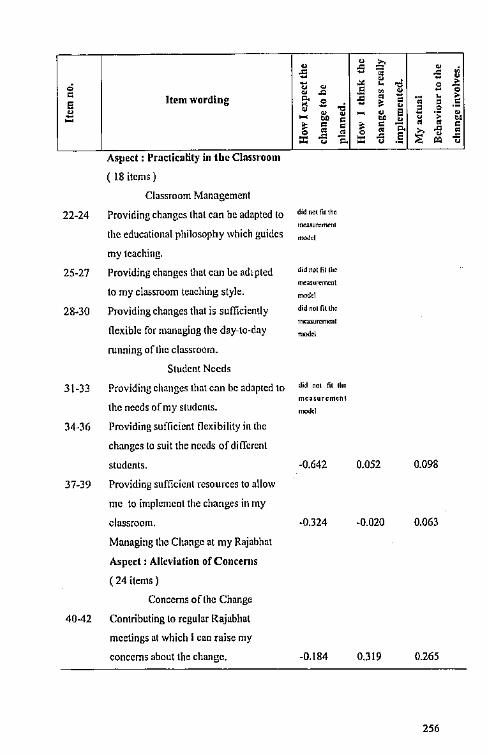
22-24
Item wordlog
Aspect : Practicably m the Classroom
( 18 items)
Classroom Management
Providing changes that can be adapted to
the educatio1rnl philosophy which guides
my teaching.
25-27 Providing changes that can be ad,plcd
to my classroom teaching style.
28-30 Providing changes that is sufficiently
~;d oo,n, the
'"""'""""""
_, did no, nuh,
m=uromenl
flexible for managing the day-to-day ,..,.i,1
3\-33
running ofllm classroom.
Student Needs
Providing changes that can be adapted to
the needs ofmy students.
34-36 Providing sufficient flexibility in the
changes to suit the needs of different
students.
37-39 Providing sufficient resources to allow
me to implement the changes in my
classroom.
Managing the Change at my Rajabhat
Aspect: Alleviation of Concerns
( 24 items)
Concerns of the Change
40-42 Contributing lo regular Rajabhat
meetings at which I can misc my
concerns about the change.
meuurcmen\
-0.642
-0.324
-0.184
0.052 0.098
-0.020 0.063
0.319 0.265
256

d = I 43-45
46-48
49-51
52-54
55-57
61-63
64-66
67.69
70-72
Item wording
Bemg able to solve quickly any
classroom problems in implementing the
changes at my Rajabhal. ·
Providing for specific concerns of
lecturers to be raised with the Rajabhat
administration and staff.
Providing for specific concerns of
lecturers to be negotiated with
management by the Teaching staff.
Supporting the Change
Having some lecturers to whom I can
tum for atlvicc about the change.
Having good gc11cral Rajabhat support
whenever there arc problems with
resources for the change.
Having the Principal supporting the
-0.142 0.407
-0.242 0.085
d,~ "°' r., 11,,
"""'"«'"'"'
did not fie IJ>o
m,.,urom<nl
nlOOol
~iJ not fil the
meo,urom•nt _,
change al my Rajabhat in practical ways. -0.207 0.303
Providing sufficient and continuing
resources for the cha11gc.
Aspect: Le;irning aboul the Clrnnge
(lS items)
Leaming about the Change
Providing how to \cam best about
implementing lhe changes.
Providing information on adapting the
changci to the classroom.
Providing information about tlw most
important issues rcilaling to the change.
d;J no! fl\ the
mouurcmon1 _,
-0.528 0.180
-0.552 0.179
-0.446 0.098
a«4£ltl&:::.4W
0.570
0.209
0.370
0.357
0.236
0.321
257
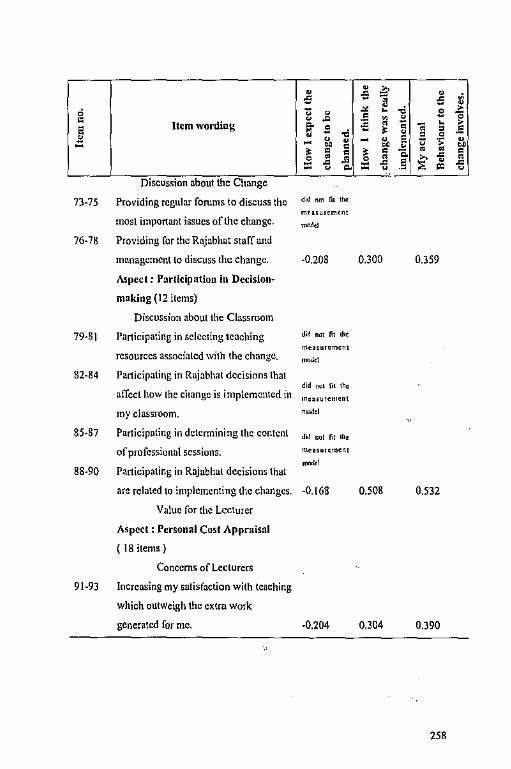
0 • i .. 0 • = = d " 0 ~ • ~ • .. • 0 " ~ " 0 c Item wording ~ • " ~ • 1 e • ' • ~ 0 • ·~ = ~
0 • ~ ~ e " • • = 'a • ' • = ' • • • = • • i " • c
" ~ c
" § 0
" = 0 ~ = 0 = 0
D1scuss1on about the Change
73-75 Providing regular forums to discuss the ,M no\ r., tho
m•uurem,,n most important issues oflhe change.
_,, 76-78 Providing for the Rajablmt staff and
management to discuss the change. -0.208 0.300 0.359
Aspect: Participation in Dedsio11-
making (12 items)
Discussion about the Classroom
79-8\ Participating in selecting teaching ~;d not r,, 1Jle
meuuremen\ resources associated with the change. _,
82-84 Participating in Rajabhat decisions lhat did no, r,, the
a!Tcct how the change is implemented in '""'"""""'
my classroom. n,o,ld
85-87 Participating in dctcnnining the content ~kl nol fil lho
of profcssionnl sessions. meuorcment _, 88-90 Participating in Rajabha( decisions that
are related to implementing the changes. -0.168 0.508 0.532
Value for the Lecturer
Aspect : Personal Cost Appraisal
(18itcms}
Concerns of Lecturers
91-93 Increasing my satisfaction with teaching
which outweigh the eKtra work
generated for me. -0.204 0.304 0.390
258
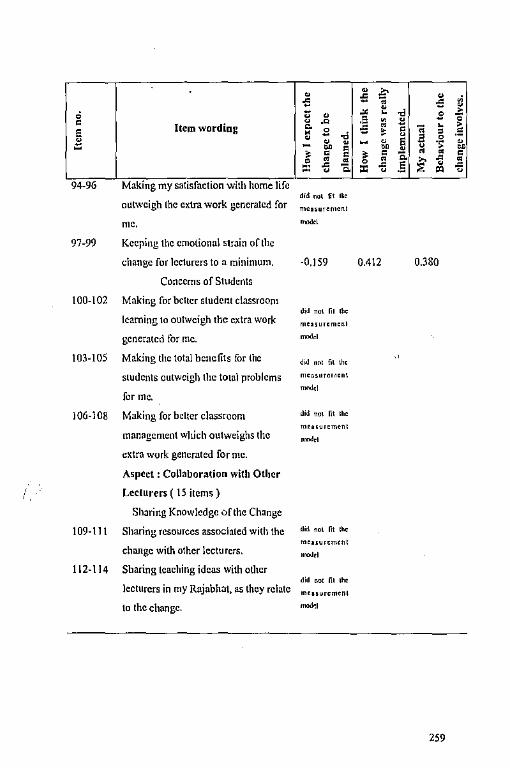
94-96
97-99
Item wording
Malung my sa1lsfact1on with home hfc
outweigh the extra work generated for
me.
Keeping the emotional strain of the
change for lecturers to a minimum.
Concerns of Students
100-102 Making for better student classroom
learning to outweigh the extra work
generated for me.
103-105 Making the total benefits for (he
students outweigh the total problems
for me.
106-108 Making for helter classroom
management which outweighs the
extra work generated for me.
Aspect : Collaboradon with Other
Lecturers ( 15 items)
Sharing Knowledge ufthe Change
109-111 Sharing resources associated with the
change with other lecturers.
112-114 Sharing leaching ideas with other
lecturers in my Rajabhat, as they relate
to the change.
did nol fit 11,
me1>ur<ment
-0.159 0.412 0.380
d«I not fll the
""""''''""'
~id nol fl1 ""
mea,urcment
nX><lel
d,d "°' fit '"" mouurcment
did not fil lhe
meuur«nenl
259

• ~ 0 : • • : • " • d " • ~ 0 " ' ~
~ 0 c • ~ • ~ 0 • e Item wording ~ • ~ ~ = .5 • " • ~ ·~ !: • • ~ • e • ~ ~ ' • "E. •
t ' ' ' ' • • ' • • • > ~ • ~
0 ~ . § ~ • ~
~ 0 "E. ~ ~ 0
Advice and Support from Others
115-1 !7 Giving support to other lecturers at my
Rajabhat when they need it lo
impkmcn\ the change. -0.338 0.157 0.208
118-120 Asking for advice fron1 others in my did nol r,uhe
Rajabhal when I have problems with the ="'""'""' change. n,,,kl
121-123 Providing advice to other lecturers did ""' r,nh,
about the change when requested. "=""""'"' _, Aspect : Opportunities for Lecturer
Improvement ( 12 items)
Teaching Jmprovcrncnl
124-126 Providing opportunities for me to did nol r,«n<
improve my educational knowledge and m=ur=t -., understanding.
127-129 Providing opportunities for dH!notfiLthe
management and lecturer staff to work """"""""' _, together for lecturer in1provement.
Students Improvement
130-132 Providing orportunities for me to did oo,fil~"
mc,uun:,1,rn, improve my teaching. _,
133-135 Providing opportunities for me to do did ...,,mu,, rn:,uurc:mm•
better for my students. .~,
260
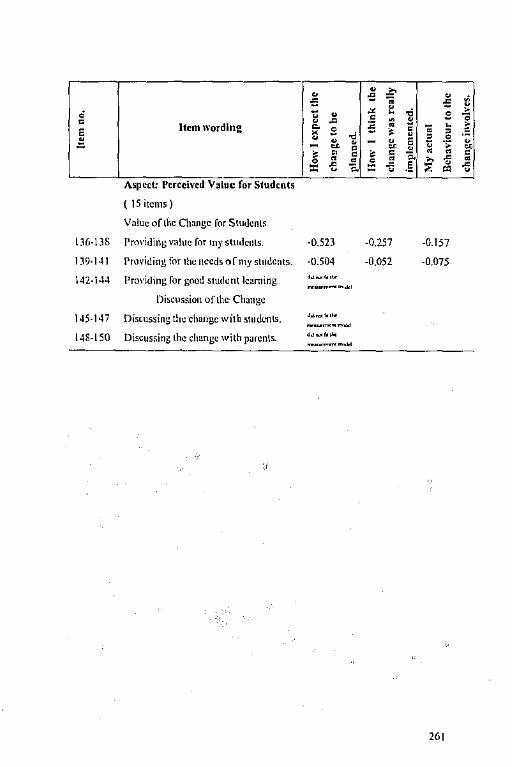
• _., • " • " • " • e • • "
~ ,; • > • • ~ • • ~ . • Item wording ~ £ • • • >
' " • ' • .E • ,; • • •• • ~ • - • ' " • = - • ~ • > ~
' ' • ' • "E. • • • • • • • • " ~ • ~ ~ . ! ~ • ~ :,: • "E. :,: • "' • Aspect: Perceived Value for S1udcnts
(15itcms)
Value of the Change for Students
136-138 i'rol'iding value for 111y students. -0.523 -0.257 -0.157
139-141 Providing for 1hc needs of 111y students. -0.504 -0.052 -0.075
142-144 Providing for good stu(lcnt learning. ..... , ..... -u~~~"'"''
Discu;sion of the- Ch,rngc
145-147 Discussing the change with stud~'l11.5. ,, ... , ..... --""'~"'""'
148-150 Discussing the change with parcn\s. ..... , ..... _ti,,,,_ .... ,
261

Appendix C: Ll'cturcr Receptivity scores and itepi thresholds
£54 Item, J thresholds)
·------···------------·-------····-····------LOCAllON
'"
'"
""
_,.
_,.
Hogh '"''l'"''"Y ,., <h>ng<
'
'
' " ' ;o: xx ' xxxxxxx
xxxxxxxxxxxx xxxxxx.•;xxxxx
xxxxxxxxxxxxxxxx X.\.X.X.\X.XX
x.xxxxxxxx.xxxxxx xxxxxxxxxxx~xxxxxx.x
xx~xxxxxxxxxxxxxxxxx xxxxxxxx.xxxxxx
xxxxn:xxxx xxxxxxx xxxxxxx
)(XX
xxx
'
\,,~ '"<1''""1 '"'"°"I'
l.<>M,08 J ,\lkv\9.) l.<>mb}] Co>t?I.J Allev ,I.I.} Cn>t O,i l l'•n"S~.J All<' 4 I.) Pr.1"1c ll.J ('o<t9l l l=m Jl.)Conll"',k l l.<ffll 77 J l<>m f,bl AlkHIJ.J p,,,i,'IOJ Alk, Ol )Cnoc~,r< 11 l l.<,m 1,91 I.<,m 12 l L<am JU /\llcv,1.J /\ll<v~l.J Cnll>l>l 16 l f'mt;, Jk l Allev ,R l V,loe HO l V,loe\l! l ('oop,rc 9 J (oll,bl 11 J V,luc l' I .J "''"' 1)1 l Cocnrcuelb' J Cm! 'I') l l'r;,CI" )6 l l'r,"" JJ J /Ill" \i.l /111..,. ,n.J l"m1 91 J ('mt 91 ] All" 4) J r.,..,.,, J9 l All"· M, J l.c,rnM J r,n" R~ J Cmu;»,o I(, ) l'>lod .% J l.<,m Ol JI <am 1[, J Value 1)9 J Coll,hl ll l
c""'I''" 1 JI'""" i• 1 I <>•n70 J 1•m,,'l<J~l'"'"''Jl ,\lk, U) All,·, 4S l l",!t•J~ l ( ,»c'IJ) )<am 7i l ,\II" IS l I <ar, ,,< l lc"n Jl l l'r,'1,c JS l Alie, 48 l All<" ,ll l
I''""" ,\•J l I '""' 71 l I'"''" JS l ,\lie, '7 l Allcv 41 l l.<"n 1,1' l ('oli,hl11 l l.<am JI 2 L<,,n,? l ("""'l''"'l l ("0<19) l 111:c, 4l ll"o119l 11.<,m f,/, 1 f•.rt<cSS l \' ,loc I )H l l""" '/1 l l\o11to•« Ii l Value 141 l I.<"" 76 l ('nll,t.111, l Coa~m S l l•r,c,,e )I, 1 Valod J J 2 ("ui,,pa,e l 7 .l l"m 61 l ,\llcv SS l \'al,el,O l All" 4) l 1,,n,dl l "11e,· ,u lc,rn ,,. i Co~,o, ll l.<,m 10 1 Co!l~I 2 Allo,4(,l <.'<%hll5l ,,..,,,, 1)1, 1 ,\II"' 41.I V,I"' IJ'J l Alic, fl) I c,»1 'J') I P,nic')I) I(;'""'"" 10 l l'r.>;c,o),1 lc,n,Jl l ,\lle,411 ("'"'')) I [,,,,,,it, I ,\II" ,1.t ,\II« •t. \ 11"" 4S, Alln ,o I lum bbl l.<>m <,? \ (\,IL,hll7 I l'r.>oc,c)I I l•.,,i,<)t, I l'•><t>,Jl I l'"" 70 I Allcsl! I V,i.,,, J'j I V>lu, 140 I Cull,M I.I I v,1..,1,1 11'•""'' I 1111"-41 I C,11,hl I(, I <"o<:'111.I l'•rt" s•,.l Co!l'JI \ lwn1i I Alles 441 ('.,!! 91 I "II" 41 I Alie, J•J I v,,"'l J(, I ("0,1 'J7 I I 02mJl.l Cnnl!"!S I! I Pm1,d8 I 1,-mr,~ \ Pr•ct" J4 I 1,e,mll I Co11ra,e 8 \ v,lucll7 l
c"""'"' 9 1 l'rxto,H \ tc,m trl I l~•m 61 \ l<>m f,11 Comp,r, 17.1 V1lu<IJR I {"0111f"«l I '""~'"' 16 I
1,,,y '"""
Grnph or the scale of measures (N,,,659) and item thresholds (J thresholds for each of
54 items}
262
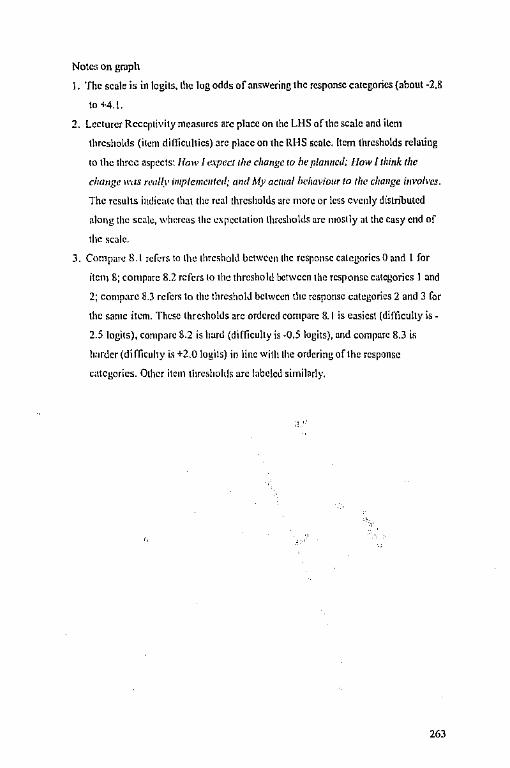
Notes on graph
l. ·nic scale is in legits, the log odds of answering the response categories (about -2.8
to ;-4, ! ,
2. Lecturer Receptivity measures arc place on the LBS of the scale and item
thresholds (item difficulties) :ire place on the RHS scale. Item thresholds rcla1ing
to the 1hree aspects: /fow I ,il'pcc/ 1he cha1Jge ro he pla1111cd; flow l 1hi1Jk the
c/wnge w,1s rml(l' i111p/eme11ted; and My ac11ml bd1aw·aur to tht' cltange im•oll'es.
The results indicate that the real thresholds arc more or less evenly distnbutcd
al011g the scale, wlu:rc;is !he c~rcclation thresholds arc mostly at the easy end of
the scale.
3. Compare 8 l refers to the threshold between the response categories O and I for
item 8; compare 8.2 refers lo the threshold between the response categories I and
2; compare 8.3 refers to the thrcsho!J between the response categories 2 and 3 for
the sa111e it~'fll. Tksc lhre~ho!ds arc ordered compare 8.1 is easiest (difficulty is -
2.5 logits), compare 8.2 is hard {difficulty is -0.5 logits), and compare 8.3 is
harder (difficulty is +2.0 logils) in line with the ordering of the response
categories. Other item thresholds arc l,1be!ed simifor!y.
263
-·· •
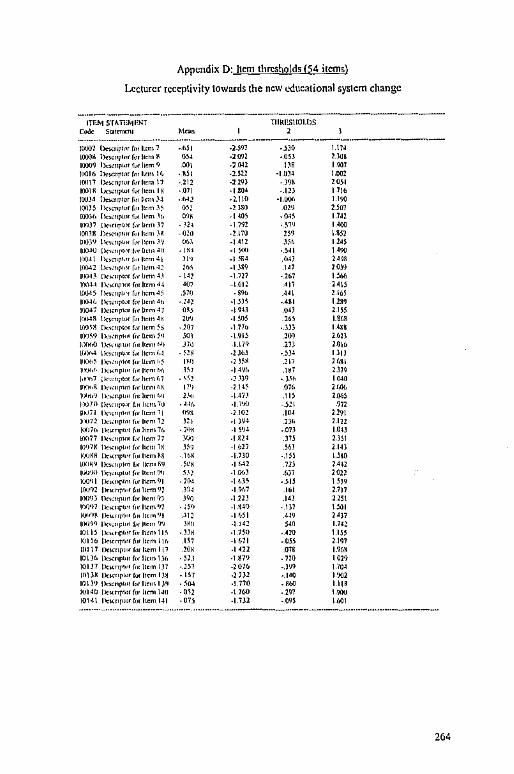
Appendix D: Jtcrn thresholds {54 items)
Lecturer rcccpth•ity towanls the new Lxlucational system change
---·--··-··-· ITEM STATiol>ll'l<T n1~1~<;\I01.t,s
COO< S~"m<t\l ' -·······-·-···--···- ······-····--·-·-----------···--···---····----------l<iOOl l>,"'Lph>rfmll<m; ·Ml -2.591 •. )JO 1.\N IOOOH ])<,cr,plo< fod""' ~ 01, -Jon ·OIJ l.lU1 l~J09 ll<,,e<1pk,tfc,tll<m'> oo, .;~1 1)8 '., l"ll6 ll<><np,.,rrml~m ,,, . ijJI ·l S1l ·1.Ul4 LOOl 10<117 l)<,copior fodcml \1 ·lll .J 19) .Jq~ 10J4
~'" lx,,.·r1;oLu1f,"l1,m Ii . OJI ·I 10, ·.11) 1116 IOOJ4 l1<;<11ptorf,,,l1<m.'4 ·M! ·l.110 -1.oor, l.l'IO IOO)J llrnnpior fa,• I""' JJ OJ/ ·l 180 01') l.501 IOOJ!, l).,,,.·r,r"" re, 11cm ,,, 11'1, -1 ,01 .{),lJ I.Ni "")1 11<,"r'"' (,,, 11<,n J1 .. ,1, ·11'!1 ·ll" ><oo I001H J:>,,cnplm fol l«m J, .Q)U -1170 "" l ~ll 11,1w !""'"P'"' r.,,l',m.1'/ C)(,J -1411 .I.Ir, u,s ILK>lU 11<,"'r'"' 1 .. , 1,c1" .r, • IS! -ll<XO · 141 "" 1•>04\ 1><,mr•·"f'"'""'"I )l'J -1 !,14 .0,1 14•)8 lf)l}.:l !Jc""P'"' f,,ii""''' )hS -1 )i9 .147 10)9
'""-' l'"'"r"" f.,, 1,,,.., ,., ·l•l -1.111 ·261 llM ,=, ll<><•~""fo•I""'"'' '"' -I 611 "' 14\l 100-!5 r,.,""W' r,,, l1<rn,.s ,11,1 .,. .4•1 1105
'""'' 11<"""'"' r.,. 1,w, ,., . )J) .,m -4lll l.lll9 11)()'7 l\c<"'P'·"f",l"m-'J 015 -19U .0,1 l.lSI 1,,,_.~ l><,rnpL,H r,,. l1c1114' ,,, ·I 501 .211 l.$Oi 1m<x lk1rnp<"<f,>rll<m~,< . ,~, ., 11" . .))) 1.4n 11,w11,""'r'•"fmlL"nl•1 .1111 .\.91J .200 loll 1<,w.o \J<><,~1r,rf,,,l,en1cJ\ JJ,l -1.110 m 2.016 ll;W,4 lk,<t,pWf,,11<m(~ .11, ·l )(,) .JJ4 l.l1J 1w1,,i ll<""r'"' fm IL,m 1,) l"l ·l JjH .111 lfrlll 1,,#,f· lkX"P"" f,,1[1<m,,r, ll7 -14% .117 lln 1,,.,1 <><·.ctr;*" f,Hllctn!,1 . \I) .1))9 • J.IO '"' '""·~ n, .. .,r"" r,,, 1""'''' 17'1 .1,,1 07(, "~ I''"''' 1"''"r,,.,r,,,1""''''' 1.1,, -141.1 .Ill z or,1 l·~llO ll<m•r•"' !" 11,rn 7u .4.,r, ·I 7•,o .Jn .971 i>JJI ll'""r•mfo,IL<m'I "'' .J ,Ol .104 l.M 1•"71 lkxupt,,. r,,, h<m 11 lll ·I )94 l)(, 1.IJl 1,,-,;,. il<,cnr"'' f,,. l1cn1 H, .JHS ·I l'J4 .on 1.01) 1<)071 ll'""P'"' r_,, IL<m 17 i,,, -1 ill .l75 1.lll 1mn 1><,rnr'"' f,,, ll<r111S )j'J ·I (,)1 .JOJ l lU l<XJfifi ll<>cr,p1"' r,,. l1<rn1i , .. , ·l.llO ·.Ill u,o 1<•11·0 l>c,ctrp1'" l• l~n• fi<J 5,,, ·I f~l m l4'l ll'-'N Tl<,rnpl"' f,,, hrnl '~1 J.\) .,()(,) .(,)1 lOll 1w•n lb,,.p<m fo,l1<m'!I .10, .j 0)5 -m \l)'I IW'll 1"""?''"r,r11t<m'>1 )~4 .1111;; .161 2.111 lfKm !l<,c1<pLrr1fmll<n1'IJ '"" -llll .14) 111\ 1"'1'>1 11c..:1ar,,,.r,,,11«n'JJ .;5,, ·I !40 . Ill \ lOI
"""'~ 11c"""'"' r,,, 1""''" .,,, ·lf,51 44') 14)7
irms ll<""f'"' IH ll<m 'rl m, ·I '" "" 1.1,1
IOIII lh.i,pw fm lt<m I IS .J)H ·1.1l0 .uo I.Ill l(JI H, l><,rnpM• r,,, l«m IH, .117 ·I 611 -Oll 1197 I"' 17 11<,mpLr• f,• l'<nl 111 10, -1 lll .01! 1.%~ IOIJf, l><><i,p<,.,!mlL,mlJI, ·ll.1 ., ~1') .1rn I 019 IOIJ7 lk><nr"" r,,, l«n1 1.11 · Jl1 -2016 •. )'J9 1,104 IOI Ji ll<>e"r"'' fu< i,,m I Jfi • IJJ -l lJl • 1'0 I '!02 IOlW l""'"l''"'fo,IL<1l'I)'! •• \{)-l ·1.170 .,. I.Iii io1,u llc«"P'"'f" l1<m 14<1 · Oil .\ )60 . J!l ·~ 10,,1 llc><rrr"" r,~ h<m 141 .QJJ -11Jl ·O'!S '"' ·-··--·-···--··--· ·-····-·--···· ···--···-······------
264
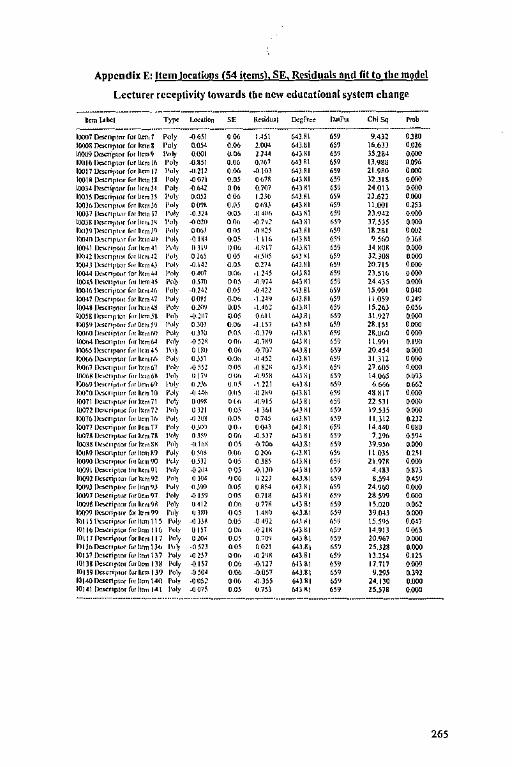
Appendix E: Item 1~ations {54 Items}, SE, Residuals and fit to the model
Lecturer receptivity towards U.e new educational system change
-·---··-··--- -----·--··-------·-··---··------ ·--------Im, L>b<I .,~ l.o<ation " R"i<lu,i D<&f"< 1, .. r,, Chi5<i ""' -----···--··-------·------ .. ·---·--·
10007 O,>mp,n, for ILrn, 1 Poly -0 6.11 •• 1,11 r,.l)il "' 9,4)1 OJiO IOOOi De><npoor Ira l,n, ! l'oli· """ •• ,~ 6.U.SI '" \6.6]] 0.0l6 IIJQ09 O<,rnptnr for 11om9 !'nly 0001 o.o,, 1144 6'HI "" lS.2S4 O.® 10(11611,,mpw forlkn, 1, l'"I) -OUI 0.06 0.767 6') R\ '" IJ.9~S 0.0'!6 10011 !k><np,<>r for IL<m IJ Pol, ~•lll •• -0 \OJ l..!)RI "' 21.9RO ·~ 1001R lh:npon, fo111~n IR l'nly -0011 0.0.1 067R 6HRI '" Jl.JIS ·~ IOOJ• lksc11p"" [,or ll<nL J• Pol) .OMl . "' Olm 6') ii '" 14 O\J "® 100.11 [)acripoor fm l1<m ]j Poli [IOJJ o or, I l.16 MJ!l "' ll.61) ·~ IOOJr,lk<mp,,,r fo1 ltcm)O l'nl) 00'1' o.~.1 OM.\ 6'HI r,10 \l.OOI 0.15)
IOOJl i"''"P'"' fot hnn )1 l'"I)· .I) Jl' '"' .,1,0,, r,.,J~I 65') ll.942 "® IOOJR ll<,.cnpt,., f,,r I""' J< Pol) -0 010 '"' .0 1'! (,.\Jll r,10 Jl.J)l ·~ 1r,m l>«rnr"'' r.,r l1<m!' 1•.,11 ow,, on, -OS)j MHI <,'in \H 2SI ooo, i<)("~O [>.,<t1pW fo, lsc,,,,,. 1'<>1) .om oos -1111, l~HI 6l'I '1j(,0 Ol6H 1001111<,.,.ropw, f,,rl"mJI )"-,1, "Jl'j ()'11, ·" >'17 r~)OI r,in J4 soi ,.~ 10()1) lk>mp,m fot llt1,.'1 l'<'l) OM OOl ,,.sr,s MJSI "" J2. JOH ·~ IOO•J lk!<t1pt<Jr frn l<en,4) 1'<'11 -0141 O o., 0 114 Ml.ii (,j<J l071l "® 100-\4 ll<><np,or for l•«n .J !""I) 0,01 00(, ·1 l4l (,1)&1 M'J ll.SH, '® 1001.I lk<mp,m r.,, llcmH 1•.,1., OJJII 00\
.(] ~·· Mlil "" ).4 4)1 o@ 100,1(, !><,rnpw [,H l1tnLM, l'"l' -0 1,1 00) .0 4ll r,.\JBI 61'1 \S.901 ••• 100.1 [k,cr,P"" for ltcm47 l',ol) OOll 00(, ·l.l" 6•J 81 "" 11 O'i? OJ4') loo,i ll<><np,m ro, I'"" 41 l'.il)' Ol"! 00\ ·L'il <,.IJ.Hl 65'! ll.26) 00l6 IOOli lk<rnpt<l1 I>< 11=.<H i,.,,_, .0 lll1 ~Oj 0<,11 {~Joi (,\? l!.?ll O@ I(>(]\~ l>«mp,m f,,r ll<ll' )'! l'<>I) 0 )01 "'" -1.1 \7 Ml ~I (,\? 18.lll ·~ 100,,0 1,"""P"" r,,, I""''" l'.sl) ")1() ~o., -0.JJ<) <,B.RI M'! zg.uw "® IOOM lk<cnpt,,, f,,r l1<m (~ 1•.,1y ,OllR om, .O.WJ M)RI (,50 ll.'1'11 0.1'1!1 100<,j lk!CHplm f,,r lie," ,1 ]\11) O Im ~ or, -0707 MHI "" 10 .• ,, ·~ 100<,(, lk><np~,r I.,, I~'"'''' l",ol_> '1)J1 ""'' ,,,1, <,,) RI 1,5'! ll.Jll "® l<!Or,1 lk><!ipL"t forl,cn,07 1'"1)· ·O.ll) ""' ·OR" (~HI 6J•j 27Wl O@ 100,,1 p,,,"'I""' fm l,e,,,r,, l'"I' r,j)•i UUh _,J'!.IH ,~Joi "" 1, ()(,5 009) l'AJ<o?\"'rnp1"r (», [IC,n(,'! 1,,1., "l.~. u r,., ., lll <,<) HI ,,1'! 6 6(,(, O(,(,l lm:o l)<,;.c"I''"' r,,. lk,n rn 1',,I) .,, "{, 0111 .11 m, r,.irn1 (,j') •s HI 1 "·® IOOJI l);,sct,pt<>rfmltemil l'oi; 00'11 "(<, '1 911 l~HI "" 21 Ill o@
IOOll 11<:«ropwr fur l1<m 7/ l'<>I) om oo., ·IJ61 64) SI r,\'} l?.lJ'i ·~ 10076 11c,,or1ptm rm l1e,n 1<, l',oll ,iJul ""' 0745 <AHi ;.w 11.lll om loon lk<.cnr"" fo, 11<"' 11 1'"11 OWi ,0, 01).!) 6'3 Hi (,l') 14 440 OOHO l!illR lk<cropk" foo l<en, JR l'ol) 0.11•, 00(, .0 j)J 64HI 65'1 1.2% 05'!4 loo~! l><><.,ptor (,or lscm is 1'<11) ,Olf,1 001 -1'70h (,.\)RI f,I'! )9.?j{o ·~ 10019 ll<>Cnpto, r,,r 11<"11? 1• .. 11 O \f)S '"' O l<K, t•J ,1 (,j'J I! OJJ 0211 100'!0 lk<cropom r.,, l1t1" •!O l'cl1· um ""' O J!I (~HI 65'! ll.911 0@
100?1 De,cnptor lnrll<n,?l !'<>I/ -Ol,l' (105 -0.1.10 MJHI 1,!? 4ARJ OSJl lllO'll [)«cnp '°' for l:c1n '!l l'ol) O lD' 1)06 "lll Ml Hi (,\') 8.J?4 041'! IOIJ'!Jl)«cnponr rml1<.n'!.\ l'ol\' o .v,1 ""' U i\4 MHI '" 14.%() 0@
IOO'JJ lle><nptor forll<m?7 1'"11 -Oil'! OOl 0.71H 64HI M'I lS l'I? o= loon lle><nptm f,a l1tno'JO l'"I) O<ll O o,, Ol1H LoORI (,\? ll.OW M6l IOO'>'Jl)«c,-.pt«r"l•m'I? l'"lf OJW> ()()) I 4'0 o<J ~ I (,'i') 391).\J "® l<ll il l\c><ror"" for lkm 11 I l'<>ly >IJJR '"' .0 401 M.\l<I (,\'! \5,5•); ,~, 101 I~ lbcnptor for IICm 11 b Pol, Olll
0 "'' ·Oll' 6') RI ,,,,, 14.91) ""' IOIIJ lle><rtp1"' f0<l~n, 117 l'oly OJO< "" 0.0fJ'j MHl ii~ l0%1 ,~
lrJI J" Oc>mph" for l~m I Jb l\,fy .o 11) "' 0011 Ml Hi l,S'J l5.Jl8 ·= 101 )1 lk<<nptnr [m l,e.n l )7 1'<0ly .Q lJl oo,, ·O l'•R 6'Jil <,j•) 1l.ll4 0.121 IDI l! lk""P"'' f,u ll<m I JR l'"ly -OISl """ -0. \ll 64HI M~ 17.lll om IOI J? ll<>cnpoor r,~ IL<m 1)9 l'ol) -OJO• 000 .0 0)7 <.4) Rl "" ~.l9J O.l?l 101<0 Oc><nptor for l'<n, \40 l'<0ly ·0011 "'" .Olli 64) HI (,\'} 14. IJO ·= 10141 l>c,c11p1or for l,cm 141 1· .. 1y .007\ . "' 07JJ MJRI "" lS.JJB >= -·-··--·-··-······- ········-··-· .. ···-------·----· ····--······--·--····-----------
265
WWW C&JZ AQ\OffiAf-"1}-,,,,,.,. ,,
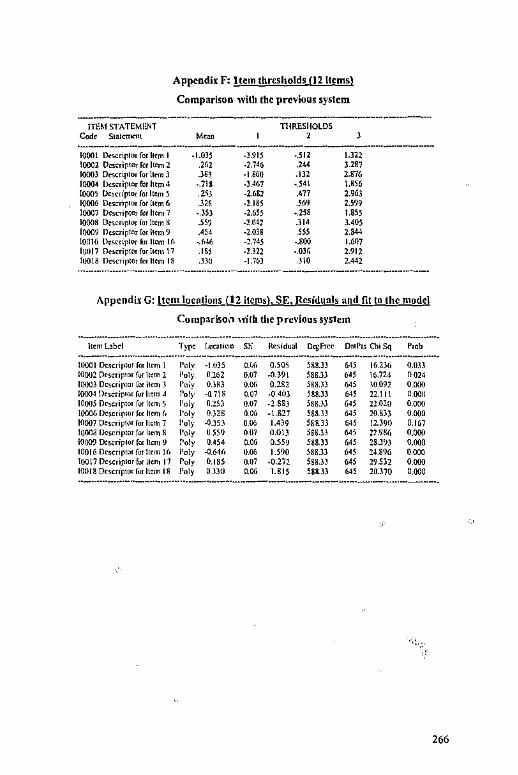
Appendix F: Item thresholds {12 Items)
Comparison "ilh the previous system
---------------------------------------ITEM STATEMENT
Code Sto1cmrn1
10001 Des.rnplor for ll<rn I 10002 Descriptor for liom 2 1000) Dc«:riplor for llcm l 10004 ll<mip!or for hem 4 10005 Descriptor fo, I lorn S 10006 Desenplor for ll<rn 6 10001 Dcsrnptor for lloa, 7 10008 De>mpw, fat llom ~ 10009 ll<Srnptor [or llom 9 tonJ6 llo.scnpWr ~, llom 16 10017 Descriptor forllOm \ 1 IOOtB Do,rnptor for Item 18 ·-···························-······
TIIRESIJOLDS
' ' -1.0l5 .J.915 -.512 l.322
.2r,2 -2.746 .244 J.28/ .JBJ -1.S60 .132 2.876
•. 718 -JA67 •.54\ USG .llJ -2681 .4"17 2.963 .l2B -2.ISS .sm 2.599 .,)5) -2.655 •.258 1.855 .55~ -2.042 .314 .1405 .454 ·l.Ol8 .m "" ,1,41, -2.745 -.800 1.607 .18S -l.J22 -.OJI, 2.912 .l30 -1.76) .310 2.442
·················--·············---····-······--···-········-······-···-·
Appendix G: Item locations (12 items), SE, Residuals and fit to the model
Comparison wHll lhc previous system
--------·--·~··········-·······-····--····-···········-·······-·····-·····-··········-·····-····----··· horn l.3bd ''" Looallo~ sr: Resid"al Dcgl'ree DatPIS Chi Sq Prob
----·-·-··········-··············· ···-·-·······--·-···--·····-· ··············----···----······-····--······ 10001 Descriptor for hoa, t Poly ·1.035 0.111, 0.505 588.Jl "' 16.23(, 0.033 10002 Domip,or for Item l l'oly 0 21,2 om -0.391 58B.ll "" 16.724 0024 10003 Descriptor ror lien, 3 PuOv 0.J~3 Q.{J(, o.2s2 5SS.ll "" J0.092 ·~ 10004 Dcs.criplor fo, horn J Pol)· ·O 7\~ 0.07 .Q.403 588.Jl "' 22.11 l 0 0011 IOOU5 [)c,cr,ptor for l1,n1 5 l'oly 0.253 O.oJ -2 8SJ 58B..\J "' 22 020 0.000 10006 Doscr<p1or for 11"n r, l'oly O J20 "" -l.827 58& JJ "" 10.8)3 0.000 10007 Dc,rnpl<ll for lion, 7 l'oly -0.JSJ "" 1.4)9 588.ll "" 12.)91) 0,167 10003 D<scnpto, for r,,n, S Poly U 559 ""' 0.0\3 5SS.Jl "' 2W8(, ·-~ 1000') D:s.criplor for hon, 9 Poly 0~54 0.06 0.559 58.8 JJ "'' 28.J?J 0.000 10016 Dc,cr,ptot fo, I tern Ir, l'o\y -0.64(, O.OI, 1.590 58B.ll "' 24.8% 0.000 10017 Dom1p1or for Ilea, 17 Poly 0.185 O.oJ -0.2"12 5SS.ll "" 29.532 ·~ 10018 lloscr,ptor for horn 18 Poly 0.JJO "" 1.615 588.ll "" l0.l70 0.000 ··-············----················-·······--·-···-----·····--------··-·-··-······-·-···-··
266
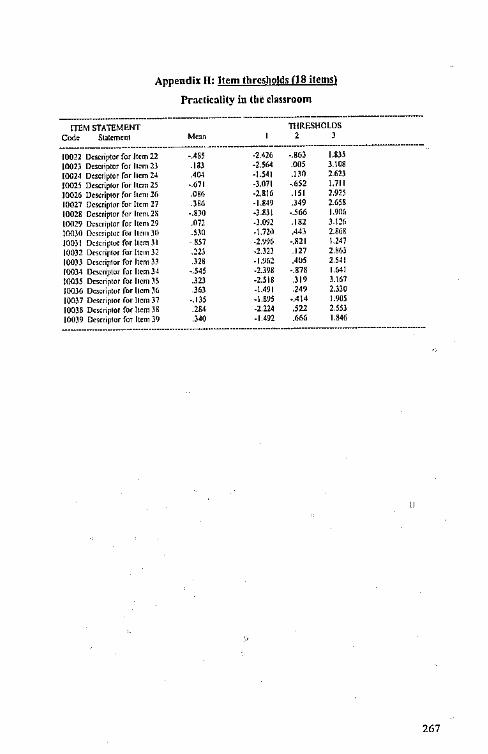
Appendix II: Item threshollls (18 items}
Practicality in tbc classroom
-------------····---····---- -··-·····--------····-----------ITEM STATEMENT THRESHOLDS
coo, Sta1omeo1 Mean ' ' --···-·-···--···············---·-······-------·····-----···------·······-10022 Dcooriptor for Jtom 22 -.4SS ·2.426 -.863 1.835
10023 0cscr;p1or for 11,m 21 .133 ·2.564 .005 ).\08
[0024 Domiplor for 11,m 24 '" -1.541 .!JO 1.62)
!0025 Dcsctiplor for hem 25 •.671 -3.071 -.6S2 1.711
]0026 Dt!<riplOr for !tom 2(, .Oi6 ·2,816 .Ill 2.915 IOOl7 DtS<riplor for Item l7 .)i6 -1.849 .349 2658
10028 Dc,..,iptor for l,cm2S -.8)0 ·3.831 -.566 1.90(,
1()(129 Dm11plor for Item 29 .072 .J.1)')2 .182 l.\2(, !!HBO Dcsrnplor for l1em JI) .5.10 .1.n,1 .443 2.S6i JOOJI Dc<crip,or for llOm .11 -857 -2.'.1% -.821 \.W IOOJ2 Doscriplor for !10111 32 .m .1.m .127 1.86) IOOJJ Dcscriplor for Item J) .Jli -1.%~ .40S 2.541 100)4 [k,..nptor for llon,34 -.545 -2.)98 ·.878 l.r.41 !00)5 D,srnplor for llcm )5 .323 -2.SIS .)19 l.\67 10036 Descriptor for ll<m )6 .Jf,J -1.491 .249 2.JlU 100)7 D«<np1or for licm Ji -.135 -l.895 •.414 1.905
10038 Des<11plor for !!om Ji .2B4 -2.224 .m 2.m IOOJ9 Oos<riplor for lten1 )9 .340 -1.492 .6f>li 1.1146 -·-···············---····-················-----··············-·-------------------·········-··-····
267
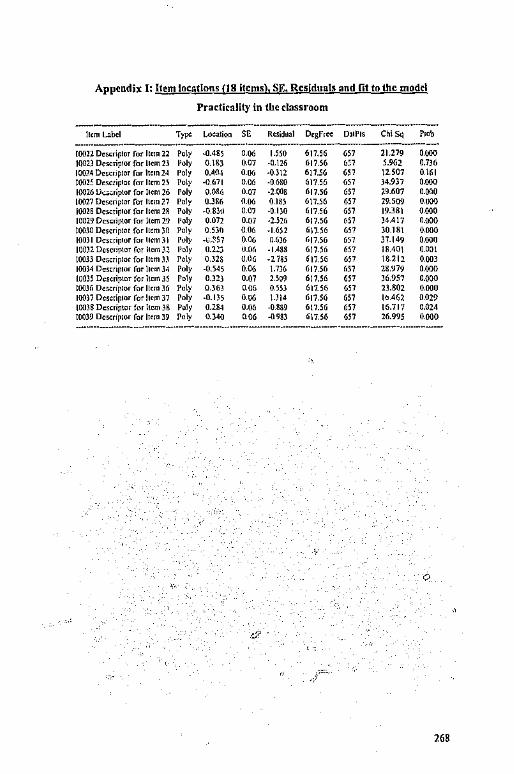
Appendix I: Hem locations £18 items}, SE, Residuals and (it to the model
Practicality in the classroom
--------····---------------- ---------!1cm Lo.h<I ,,~ Lo<0.tion " Rcsiduol Dogfree DOI Pis Chi Sq '"" -·····------···--·----······--····-·--·-------------------
[OOll Doocriplor for llcm 22 Poly .().485 000 l.5SO 617.56 "' 21.279 0.000 1002) Doscriplor for llcm 21 Poly 0.\63 0,07 -0.\26 617.56 ~;; 5.%2 0.7)6 100~4 Do,cnplor for ltom 24 Poly 0.40~ 0.00 -0.J\2 617.56 "' \2.507 0.\(,1 !OOl5 Desctip•~r far llom l.l Poly -o.671 000 -0 680 617.56 "' 34.937 0000 10026 lk.criptor for lien\ 26 Poly O.ORf, 0.07 ·2.008 617.56 "' 29.607 a.ooo 10027 Dosc~ptor for Item 27 Poly 0.386 0.00 0.18.1 6\i.56 "' 29.509 0.00, 10018 Doscriplor for llcm 2R Poly -0.83!1 om ·0.IJO 617.% "' 19.381 0.000 IOOl9 Descriptor for !tom 29 l'oly 0.072 0.07 ·2.Slf, 617.56 r,57 )4.417 0.000 100.10 Descriptor for llom J{l Poly O.Slll 0.06 -1.652 6\i.56 "" J0.18\ 0000 IOOJ I Doscrip1or for llcm 3 I Poly -o.~57 0.06 0.6)6 617.56 "' 37.149 0.000 IOOJ2 Dc,cnptor for llom Jl Poly 0.2!J !I.Dr, -1.4~8 617 . .16 "' 18.40\ 0.001 tOOJJ Dcscflplor for llom J.I Poly 0.328 0.06 -218.I ~ 17 . .16 "' 18.212 0.00J 100)4 o~,mr1or for l1cm l4 Poly -0.54.1 0.06 \.7J6 617.56 f,57 28.979 0.000 lOOJS Dcmiplor for ]\con 35 Poly O.J2l o.o; D09 617 . .16 "" J6.957 0.000 JOOlfi D<scliplor for Item 36 Poly O.J6J 0.06 o.m 617.56 "' 2).802 0.000 100l7 Dcmip10, for ll<m 37 Poly -0.IJS ·~ \.)14 617.56 "' lb.4(,2 0.029 10038 Descriptor for l!omJ8 Poly 0.284 o.oo ·0869 6!7.56 "' 16.717 0.024 100)9 DeS<riplor for Item J9 Poly 0.)40 0.00 -0.983 617.56 "' 26.995 0.000 -------------····--····--·········· ···-·-············-·-··-···-·-···-·-·-····---·-····---···
268
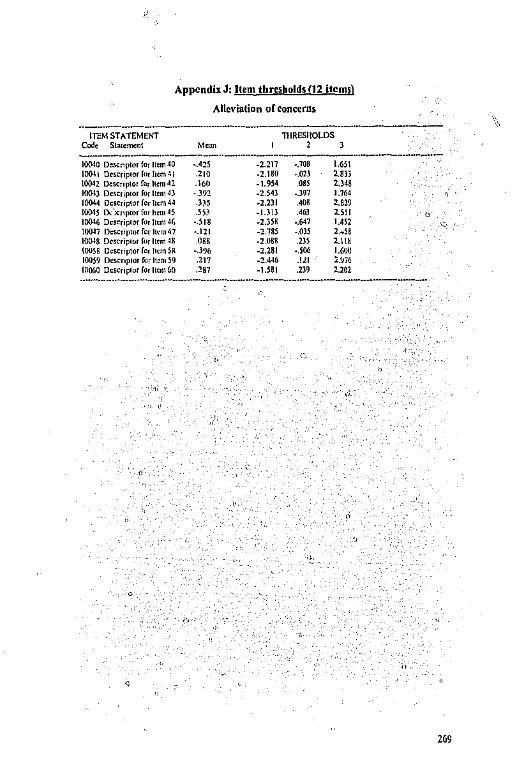
Appendix. J: Item thresholds {12 item1)
Alleviation or concerns
---------·-·····-·····--···-------------ITEM STATEMENT
Code Slotcmcot 11lRESl!OLOS
' -----·--·---······-----··-·····---·-··-·------·------10040 OeKr,ptor for ltem40 --425 -2.217 •.708 l.65\ 10011 Dtscr,plor for h,m 41 .210 .z.180 -.02l 2.m 10042 Descnptor for l!om 42 .l60 • J.954 .085 2.m 10043 o,,cupcor for lien, 4l -.392 ·2.541 •. )97 l.764 10014 Dcscrip!or for t1em 44 .))5 -2.Zll .408 U29 10045 o..\:r,pcor for h,m45 .553 • I.) tl •• 2.SI I " 10041, Qe,qiplOf for Item 4(, ·.518 -2.358 •.647 1.4S2 ,. !004/ Des<:f1ptor for Item 4 7 -.121 -2.785 -.OJ5 2.~5s I00-18 Doscripwr for 11,m 48 .088 ·2.088 .m 2.\a !OQS8 Doscr,ptor for ]1<m 5~ -.396 -2.281 -.50li '-"" 1005? Dc,cnplor for Item 59 .217 -2.446 .Ill 2.~76 IOOliO Dcscnplur for lien, 60 .287 -USI .239 2.202
o'i .
• , l'
"
;,,
269
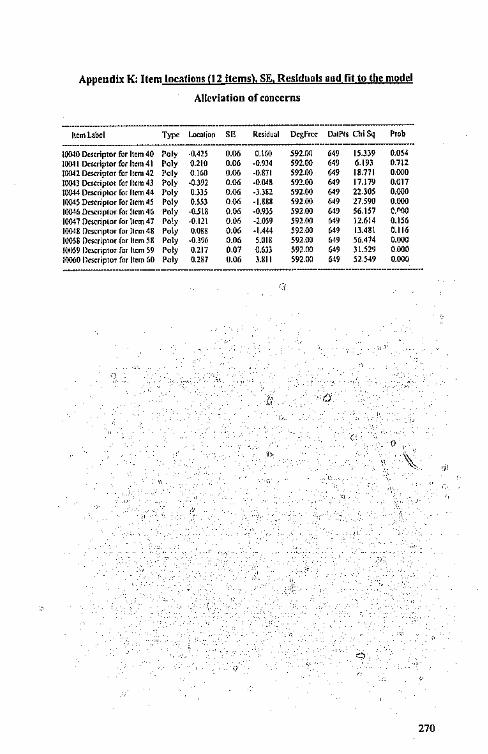
Appendix K: Item localions (12 items), SE, Residuals and fit to the model
Alleviation of concerns
-·····-----------------------------··········· 11,mlabel ,_ l.ocolion " Resi<iual ""'= DalPt1 Chi Sq Prob
··----------- ·····-------· l00-10 Descriptor for Item 40 Poly -0,4!S 0.00 0.\60 S92.00 '" IS.JJ9 0.054 100-I I D<soriptor for Item 41 roly 0.210 0.00 -0.9)4 S92.00 "" 6.193 0.712 10042 D<,aiptor for Item 42 Poly 0.160 0.00 -0.871 S92.00 "' 18.771 o= !OOIJ D<l<ripco, for lccm 43 Poly ·0.392 0.00 -0.048 S?2.00 "' 17.179 0.017 100!4 D<1<riplor fo, llem 44 Poly o.m 0.00 -J.J8l S92.00 "' 22.305 o.= 10045 De<rriplor for !Ion, 45 Poly O.S.ll 000 -I.SS8 592.00 "' 27.590 o= IOOlfi Oescnplor for !lorn 46 Poly ·O.S\8 O.IX> -0.935 592.00 '" 56.157 """ 100!7 Dmnplor for llcm47 Poly -0.121 0.06 -l.OS9 592.00 "' l2.614 0.156 10048 Dmnptor forll,m48 Poly O.OBB 0.00 -1.444 591.00 '" ll.481 0.116 10058 Descriptor for 11,m 58 Poly -0.3% 0.06 S.OIS sn.oo "'" 56.474 ··= 1(11)59 ll"mptor for Item 59 Poly 0.217 0.117 O.fill sn.oo ''" Jl.529 0.000 IOOliO llc,;criptor far Item 60 Poly 0.287 0.06 l.811 592.00 "" Sl.549 o= ----------···-··----··-·----------------·-··--····-----
<'I
"· ,:-
,,
270
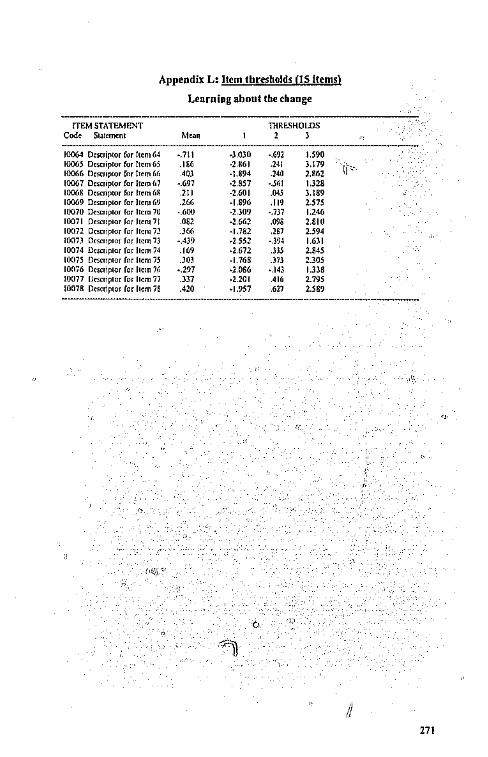
Appendix L: Item thresholds {IS Items)
Learning about the change
·---·····-·---····----------··-----~ !TEM STATEMl:NT
Code S1a1em<nl TilRf.SHOLDS
' ' ---------------------------------·· 10064 Doscriplor for l!cm M ·,711 .J.030 ·.692 l.590 10065 Descrip,or for Item 65 .166 -2.K61 .241 l.179 't(·· 10066 Doscnp1or for Item r,r, .40l -1.894 .240 2,862 10067 Dm11p1or for llcml,7 -.697 ·2.857 -.5(,1 1.328 10068 Descnp,or for Item f,8 .211 -2.601 ., l.189 10069 Dmnp,or for ]lcmf,9 .266 ·1.896 .119 2.575 10070 Desmplor for 11cm 70 ·.600 -2.309 -.737 1.246 10071 Desmplar for l!cm 71 .082 ·2.662 .oos 2.810 I0072 Deso11p10, for 1,cm n _J(,6 ·1.782 .m 2.594 mon Dcsmp101 for l!cm 73 • .439 ·2 552 • .394 1.631 I0074 De,mp10, for l1cm 74 .169 ·2.672 .m 2.845 I0075 Dcm,p10, for l1crn 75 .lOJ -1.768 .J1l 2.305 10076 Dcmip10, for l1cm 76 •.297 ·2.066 •.143 I.Jl8 !0077 1Jesmp10, ro, l1em 71 .337 -2.201 .416 2.195 !0078 Desorip10, for l1em 78 .420 ·1.957 .627 2.589
ii
;;
271
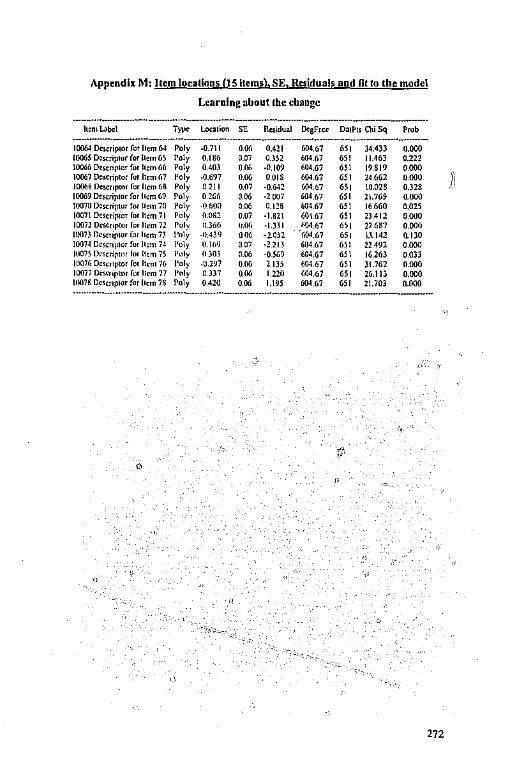
Appendh: M: Item locations (15 Items), SE, Res[duals and (it to the model
Learning about the change
-----------·----------------~---------------ltm Labot ··~ Local ion " Re>idual DegF«< DoiP1s ChiSq ••• ------·--------·--·····--·-········--·-··--------------------
10064 Descrip1or for llcm 64 Poly -0.7\ I ... 0.421 604.67 .,, 34.433 0.000 l006S Doscrip1or for llcm 6S Poly 0.186 0.07 o.Jn 604.67 "' 11.463 0.222 10066 Doscnplor for Item 66 Poly 0.403 0,. -0.109 604.67 "' 19.819 0.000 10067 Descriptor for Item <,7 Poly -0.697 000 O.olS 604.67 "' 24.662 0.000 )i 10068 Dcscnplor for llom 68 Poly 0 211 0.07 ·0.642 604.67 "' \0.028 0.328 10069 Dei<riplor for llom 69 Poly 0 26(, O.M -2 007 604.67 "' 2\.769 ,ooo !007U Descriptor for llom 70 Poly ,OfiOll 0,. 0.llS 604.67 "' 16.660 o.ois 1007\ Do,oriptor for Item 71 Poly O.OH2 0.07 -1.82 \ 60167 .,, 2).412 000,, 10072 oosc,.p1or for llom 72 Poh· 11.3(,(, u.or, -1.Jll "'A<,1 "' 22.687 0.000 1001) Dosctiplor for lion, 7) Pol)' -l).4l9 ,,. -l0l2 • (,04.(, J "' l.\142 0.130 10074 Dosmplor for llcm 14 l'o\y 1),1(,'J 0 117 ·2 213 604.(,7 "" 22 492 0.000 10075 Dcsodpw for 11,n, JS l'oly O lOJ 000 ·0569 604.67 "' 16.2(,l 0.033 10071, Dcscr1ptor ro, ltom 16 Pol)· -0.2~7 OM 2.m 604.67 "' )1.762 ,.ooo IO!lil D«<r,plor for I com 77 Poly O.ll7 0.00 1.220 604.67 "' 26.113 0.000 lllOli DoscnplOr for lien, 78 Poly 0.420 ,,. l.\~S 604.67 "' 2!.703 0.000 ············----·-······-----············-·-···-·······----·-···----·-·-·····---------
D
272

ITEM STATEMENT co& Statomi:nt
Appendix N: Item thresholds {9 Items)
Participation in decision-making
--·-----THR!'.Sl!OLDS
M,an ' ' -------------------------------l0079 Dcscriplor for u,n, 19 -.149 -2.727 -.64S 1.126 10000 Do=ip4or for h<m 30 -.Oli6 ·3.071 -.047 2.922 10081 Dcsctir,tor for 11,mS\ .212 -\.838 -~' 2.4\4 !DOSS Dcscnptor for u,m 6S .. m -2.327 -.283 l.606 10086 Dc<ctiplor for lt,m !6 .467 -2.201 ~, 2.758 \0087 Dcscn'p40, for ll<m 87 .m -1558 ·'" 1.7ll 10088 Descriptor for u,m 88 -.587 ·2.7W -.54\ 1.489 10089 D=:tipto, for ltcm !9 .m -2.519 .551 J,118 10000 Dcmiplor for l1rn1W) .~08 •I .725 .456 2,494
Appendix 0: Item locations j9 Items}, SE, Residuals and fit to the model
Participation in decision-making
------·-·-·····-·······-··-·-···-----------····----------·-····-----------html..ab<I '"' Loc,uion SS Rcs;<lual DogFrcc Doti'" Chi Sq ••• -----·-···--··-·----····------------·--·----···--------------
!0079 Descriptor for Jt,m 79 Poly -0.749 ·~ 6.199 557.! 1 "" 32.757 "-""' !0080 Descriptor for llcm 80 ••• ·0.066 '"' -1.547 557.11 "" 12.717 0.150 10081 Dcscroplor for llom 8\ Poly 0.212 ·~ 1.187 557.1 \ "" 26.676 0.000 moss Dcscrip1or for tt,mi5 Poly ·O.Jl5 ·~ --0.023 557.! I "" \9.323 """' !0081, Dcscnptor ior l1cmi6 Poi)' 0.467 0.07 --0.807 557.11 "" 26.085 """' 10087 Descriptor for ll<m 07 Poly 0.265 ,.~ -1.84) 557.11 "" !).23) 0.)98 10088 D=:nplor for !!om !8 Poly -0.587 ,~ 0.254 557.11 "" 6.922 0.634 10089 DesctiJ'IOf for ]tom 89 Poly O.JSl 0.07 -!.352 557.\ I "" 18.714 "-""' 10000 Descri~tor for ll<m Wl Poly 0.408 ·~ -0.538 557.11 "" 18.102 •-= ----------------···-··-----------------------·-······------
"
;, .,
{(
273
,i.:
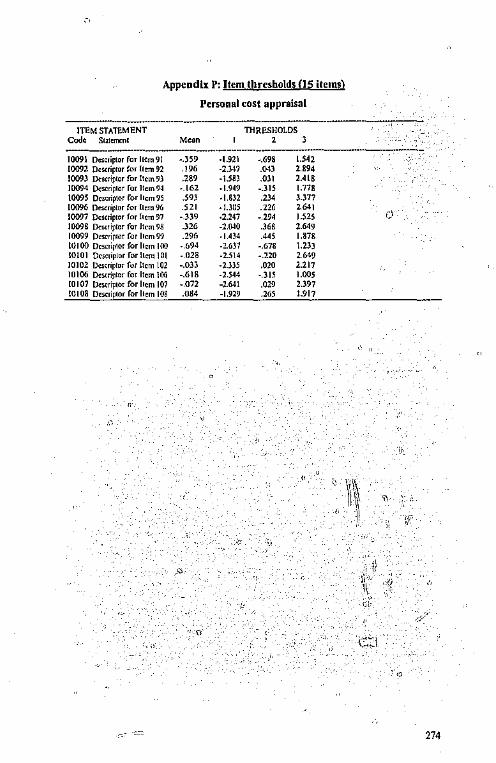
Appendix P: Item thresholds {15 items)
Personal cost appraisal
ITEM STATEMENT Code S1atemro1
TliRf.SHOLDS
' ' ----------------·--------'""' Demiptor fm llem91 -.)59 •l,921 -.698 l.542 [0092 D«<riplor for llem 92 .J96 ·2.341 ... , 2.894 10093 Des<fiplor for !tom 9l .289 -1.m .Oll 2.418 10094 [)ooc,riplor for 1tcm94 ..[62 -1.949 -.315 1.778 10095 Dc,criptor for llcm9S .593 .i.m .234 3.377 10096 D<><riplor for hem% .521 • l.lOS .Z26 ''" 10097 DcS<riplor for !tom 97 •.339 -2.247 -.294 J.S2S 10098 D<«tiplor for l1cm 98 .326 -2.CJ.tO .368 2.649 10099 Dmriplor for l1cm99 .296 -1.4)4 .44S 1.878 IOIOO Do,criplor for llcm 100 ·.694 -2.637 -.678 \.233 IO!Ol Domiplor for hem I 01 -.028 -2.S\4 -.220 ,.,, IOI02 Dcm1plor for Item 102 -.Oll -2.m .o20 2.217 10106 0.S<riptor for Item 106 -.618 -2.544 ·.llS 1.005 !0107 Descrip10, for llcm 107 -.072 -2.641 .029 2.397 IOl08 Dcscrip!Or for llem 108 .084 -1.929 .265 1.917
"
,'~
., ....
'
0
' ,_
ii,_
ji~ ·ii " !! "(f
,,. / " 1\ ,),(
-:Y-,-
-c:::.1
"
274
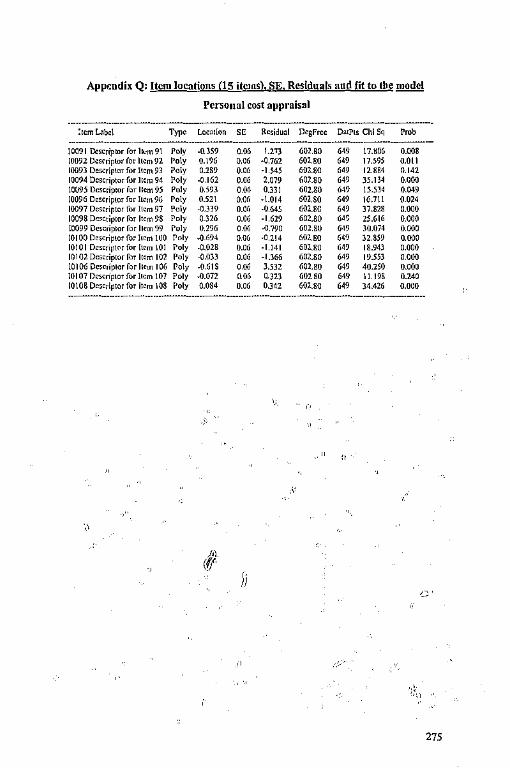
Appr.ndix Q: Item locations (15 items}, SE, Rcsi{!uals and fit to the model
Perso11al cost appraisal
···-----------------·-···-·-··--···-------------------······ :1cm Lllbol ,,,,, Local ion " Rcsiduol Dcgfrtc Da<Pls Chi Sq ,.,
-------------······---------------···-···----------···----------!0091 Descriptor for h,m 9\ Poly -0.359 OM 1.2•3 602.HO "' 17.H06 0.008 ioon Dcsrriptor for hcm92 Poly 0.\% 0,06 -0,762 602.80 "' 11.595 O.Ol 1 10093 Descriplar for !!om 93 Poly 0.289 0.06 -1.545 602.80 "' 12.884 0.142 I0094 Descriptor for Hom 94 Poly -0.162 0.06 2.0'19 602.80 "' 35.134 0.000 10095 Dcscriplor for lion, 95 Poly 0.593 0.00 0.331 602.80 "' \5.Sl4 0.()49 10096 Descriptor far !lorn 96 Poly 0.52\ o.or, -l.014 602.SO "' 16.7\1 0.024 10097 Descriptor for Item 97 Poly -0.3l9 O.Ofi -0.645 602.80 "" 37.828 0.000 10098 Do,criplor for Item 98 Poly 0.326 0.06 -1.629 602.80 640, lS.616 0.000 10099 Dcscriplor for I lorn 99 Poly 0.296 '" .0.190 602.60 "' 30.074 0.000 IOI 00 Descriptor ro, Item 100 Poly ..0.694 0.06 -0.214 r,02.so "' 32.859 0000 10101 Doscnplor for Item 101 Poly .Q.Q28 0.06 -1.141 602.80 (,49 18.943 0.000 IOI 02 Descriptor for 11,m 102 Poly -0,033 0.06 -1.366 602.80 "'' 19.553 0.000 10106 Dcscriplor for llom 106 Poly -0.61S O.M 3.532 602.80 "' 40.2SO o.oero 10107 Descriptor for !1cm 107 Poly ..0.072 0.06 0.323 60280 "' l 1.198 0.240 10\08 Descriptor for item 108 Poly 0.084 0.06 0,342 602.80 "' 34.426 0.000 ----------··-·······--·----------------·-····-··-··--------····-·-··----···-
I;_
"
Ii
27.5
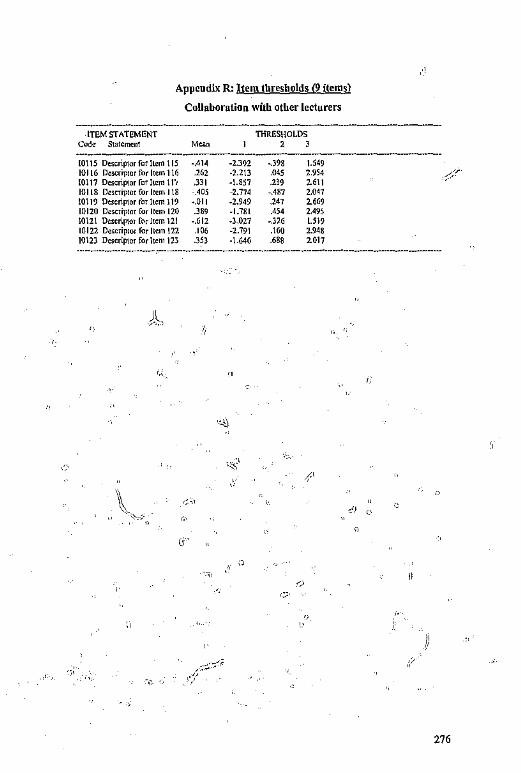
Appendix R: Item thresholds (9 items)
Collaboration with other lecturers
ITEM STATEMENT Code Statement
IO\ 15 Doscriptorfor !lorn\ IS 10116 Descriptor for Item 11() !0117 Doscriprnr for Imn \ 1·, 10118 Dcmiptor for Item I \8 !O\ 19 Descriptor r'or !!om l 19 l0120 Descriptor for Item 120 10\2\ Descripto, for !tom 121 !0122 Descriptor for llcm !22 10\23 Doscriptcr forlten, 123
-.414 .262 .331 -.405 -.011 .389
-.612 .106 .]SJ
-2.3?2 -2.2\3 -\.857 -2.774 -2.949 -1.781 -3.027 -2.791 -\.646
TilRESHOLDS
' ' -.398 .045 .2l9 -.487 .247 .454
-.326 .\60 .688
1.549 2.954 2.611 2.047 2.669 2.495 l.Sl9 2.948 2.017
/' ;.,-
···---·-·-·-··------·. ·--··--·-··-·----···--------------------------------------
Jl -,-· ... ,
•.
-_-,,
"
• ..
_,.._) II
276
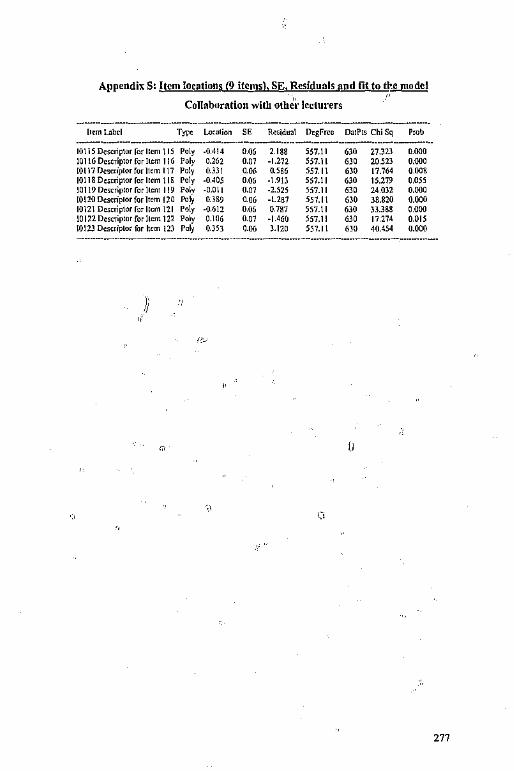
Appendix S: Item locations (9 items), SE, Residuals and £it to tr.c @ode!
Collaburalion with othCl· lccturers '
l1<mLobd Type l.,Jcalion SE Residua\ DegFroc DalPts Chi Sq Prob
10\ JS Dcsorip\Or for llcm \ IS Poly -0.414 0.06 2.188 SS7.11 "" 27.323 0.000 101 !6 Descriptor forllom 116 Poly 0.262 0.07 -1.272 557.11 "" 20.523 0.000 10l l7 Dcscriplor for ]tom I \ 7 Poly 0.331 ""' 0.586 557.1 \ "" [7.764 0.008 10118 Dmiiptor for llcm \ 10 Poly -0.405 0.06 -\.913 557.11 "" 15.279 0.055 10119 Dcmiplor for Item 119 Pols -0.011 0.07 -2.525 557.11 "" 24.032 0.000 10120 Dcscriplor for ]tom 120 ~, O.l89 ""' -l.287 557.1 t "" 38.820 0.000 10\2\ Dcmiptor for l1cm \21 P~ly -0.612 0.06 0.787 557.t I "" 33.388 0.000 !O 122 Dcscriplor for Item 122 Poly 0.106 0.07 -1.460 557.11 "" 17.274 0.015 1012J Descriptor fur ~cm !23 '"' 0.35] , ... ].120 557.1 t "'" 40.454 0.000 --···--···-··---··--······-·-······--- --·-----~--------··-··--· ---------------····-···-·
,, I JJ
,,
II
277
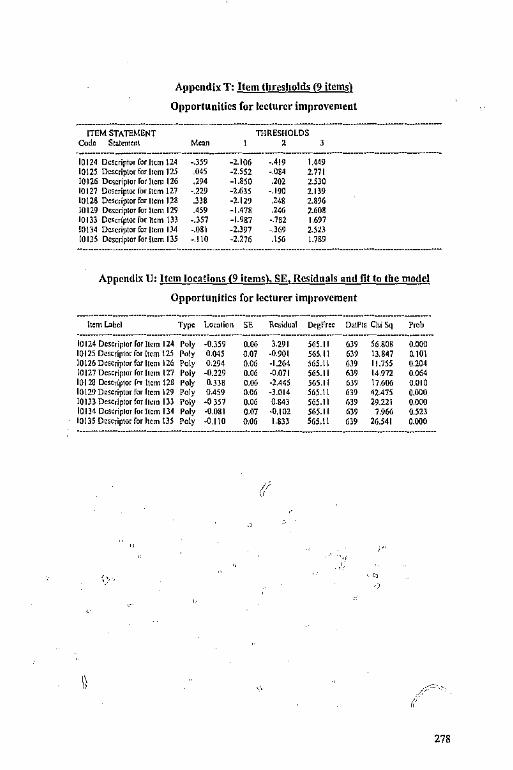
Appendix T: Item tllresholds (9 items)
Opportunities for lecturer improvement
ITEM STATEMENT Code S101cmcn\ Mcon
10124 Descriptor for Item 124 -.359 10125 Doscriptorfor l1cm 125 .045 10126 Dcmipiorforllem 126 .294 10127 Descriptor for Jtcm 127 -.229 10128 De<criplorfor llcm 128 .3J8 10129 Dcscriplor for u,m 129 .459 IOIJJ Dcs,TLptorforn,m DJ -.357 !0134 Do.scriptorforllcm D4 -.081 10135 Dcmiplorfor!(cmll5 -.110
TilRESHOLDS
' -2.106 -.419 -2.552 -.084 -1.850 .202 -2.635 -.190 -2.129 ,248 -1.478 .2~6 -1.987 -.782 -2.397 -.JG9 -2.27() .\56
1.449 2.771 2.530 2.139 2.896 2.608 1.697 2.5H 1.789
Appendix U: Item locations (9 items), SE, Residuals 11nd fit to the model
Opportunities for lecturer im11roveme11t
··-·····--·····------···------------······-··-··---------·······---··-···-·-·-·-· lteml.abd '"' Loealion SS Residual Dcgfreo DatPls Chi Sq '"' ·---·-·····--····-----·-···-·-·-·····-------------·-··--····-····-··-·····--··-·-···-···-
10 124 Dcscriplor for llcm 124 Poly -0.359 ··~ 3.291 565.11 639 56.808 0.000 10125 Descriptor for Item !25 Poly 0.045 0.07 -0.901 565.11 "' 13.847 0.10\ 10126 Descriptor for l1cm 126 Poly 0.294 0.06 -1.264 565.l I '" 11.755 0.204 10 127 Dcscriplor for liem 127 Poly -0.229 0.06 -0.071 SGS.I I '" 14.972 O.OG4 IOI :m DcsoTLplor fr< !tom !W Poly 0.336 e.~ ·2.445 SGS.I I "' 17,606 O.OIO 10129 Descriptor for ltom 129 Poly 0.459 0.06 -l.014 565.t \ "' 42.475 0.000 10133 Dcscriplor for llcm I 33 Poly -0 357 0.06 0.843 565.11 r,39 29.221 0,000 10 I J4 Dcsoriplor for !tom 134 Poly -0.081 om ·0,102 565.11 f,)9 ?.966 O.S2l IOI JS Descriptor for horn tl5 Po!y -0.1 \0 0.06 1.833 565.11 "' 26.541 0.000 ·----------·-·----------·-··-··-----------------------·-··---··-·
\I .,
278
. "'~·-""'
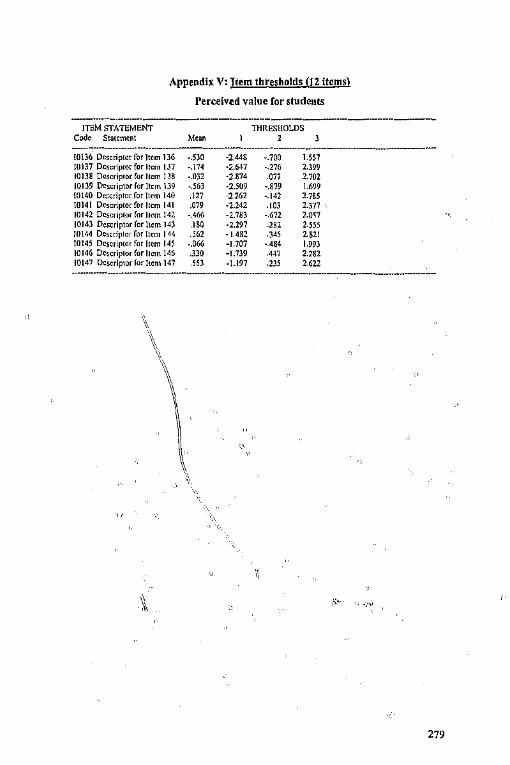
Appepdix V: Item thresholds (12 items)
Perceived value for students
---------------------------------------ITEM STATEMENT
Codo Statement Moan THRESHOLDS
' -----------------------------------!0136 Dosoriptor for ]tom 116 -.5]0 -2,448 -.700 1.m !0137 Dcsorip,or for Item 137 -.\74 -2.647 -.276 2.399 10138 Doscriplor for Item I J8 -.032 -2.874 .OJl 2."102 IOl39 Descriptor for Item 139 -.563 ·2.509 -.879 1.699 !0140 D=dptor for ]\cm 140 .127 -2.262 -.142 2.785 !0141 Descriptor for Item 141 .079 -1.242 .IOJ 2.377 10142 Descriptor for llcm 142 -.466 -2.783 -.672 2.011 IOl43 Do.scfiptor for !tern 143 .180 ·2.297 ,282 2.sss !0144 Descriptor for Item 144 .l62 • 1.482 -34S 2821 !0145 Descriptor for Item 145 -.066 -1.707 •.484 1.993 10 146 Dcscriplor for liem 146 .330 -1.739 .447 2.282 IOl47 Descriptor for !!cm 147 .553 -1.197 ,235 2.622 ---····------···----···-----·-·-··-·-····-------------····-
--------
---
\ \1
\
279

... , -,.,
Appendi)( W: 1,Cm locations (12 itemsl, SE, Residuals and fit to the model
Perceivl'd value [or studl'Uls
---------------------- ··------------11cm Label '"' Location SE Residual llcgf~oe DolPls Chi Sq , ..
-------------------------------···-·-·------·-··---·-···------10 I 36 Descriptor for !lcrn 136 Poly -0.530 0.00 2J61 577.H "' 27.7\4 0.000 10137 Descriptor for l\cm 137 Poly -0.174 O.o7 o.m 577.3] "' \J.047 0.135 !OJJS Doscriplor for Item I JS Poly --0.032 O.o7 --0.236 577.JJ "' 27.2% 0.000 10139 Descriptor for Item 139 Poly -0.563 0.06 • 1.i07 577.JJ "' 28.202 0000 10140 Dcscriplor for llcm 140 Poly 0.127 0.07 -2.422 577.JJ rn 28.710 0.000 I0\41 Descriptor for Item 141 Poly 0.079 000 -1.807 577.33 "' 12.119 0.!82 I0\42 Descriptor for Item 142 Poly --0.466 0-07 -2.907 577.JJ rn 20.945 0.000 10143 Dtsoriplor for Item \43 Poly 0.180 o.or, ·2.0'.lf, 577.3) rn 22.9)6 0.000 10144 Descriptor for llcm 144 Poly 0.562 0.06 ·1.6)2 577.JJ "' 48.)95 0.000 10145 Descriptor for 1:,rn 145 Poly -0.1)66 0.00 \.753 577.JJ "' 21.437 0.000 10146 Dcsoriplor for Item 146 Poly 0.330 0.06 2.219 577.33 rn 24.981 0.000 10147 Descriptor for Item 147 Poly 0.5SJ 0.06 2,!iOJ 577.33 rn JS.442 0.000 ··---·--·····--····-·----------------·······-··--··-······---- -------------·-·
,1
280
-----------------------"--~--·'-.-::-'.""

Appendix X: Information statement, consent for interview and interview gucsti011s
INFORMATION STATEMENT AND CONSENT FOR INTERVIEW
This study is being undertaken to investigate lecturer receptivity to a major
new educational policy change in line with the National Education Act of 1999 at
Rajabhats. The iufommtion will lead to the clarification ofkcturer receptivity towards
a major new educational change, and the reasons they have for their atlitudca. You
will be asked to respond to questions in a taped interview.
It contains 18 questions covering nine lecturer-change aspects in relation to a major
new educational policy change. These arc I) attitude to the new system compared to
the previous system, 2) practicality in the classroom, 3) alleviation of concerns, 4)
learning about the change, 5) participatiotl in decision-making, 6) personal cos(
appraisal, 7) collaboration with other lecturers, 8) opportunities for lecturer
improvement, and 9) perceived value for students.
It is expected that this research will be benefit the Rajabhats, lecturers, students,
educational administrators, and researchers studying the new educational policy
change.
Your conse11t to be interviewed would be Very welcomed and appreciated. You will
be assigned a subject number, which will be used by the researcher to assure
confidentiality of individual results.
lt will take approximately 30 minutes. You are requested to take time with the
questions and answer them honestly.
Any questions concerning the project can be directed to Anusak Ketusiri on
(045) 262 423-32 ext. 1217.
I have read the information above and any questions I have asked have been answered
to my satisfaction. I agree to participate in this activity, rcalisii"l.g that I may withdraw
at any time.
281
I agree that the research data gathered for this study may be published provided my
name is not used.
Signature ..............................•..............•.......... Date ................... .
Investigator ...................................................... Date
Note:
If you would like to receive a one page summary of the outcomes of this study please ':\ ,, complete the slip below and return to:
Asst.Prof.Anusak Kelusiri
Faculty ofEducation
Ubon Ratcba!hani Rajabhat University, 34000
Name ...... .
Address ............................................................................................ .
Postcode .................... .
282

EDITH COWAN
UNIVERSITY
Perth Western Australia
26 October 2001
President of .................................. ,Rajabl111t Uulvcrsity
Rajabhat
............... Pro,vincc, Thailand
Dear President,
Subject: Seeking pennission to conduct a research project for my Ph.D.
Further to my university approved research project entitled "Lecturer receptivity to a
major new policy change in the context of planned change at Raj ab hats in Thailand",
l would like to ask for your pcnnission to carry out research in Rajabhat University
The study aims to investigate lecturer receptivity to a major new
educational policy change in line with the National Education Act of 1999 at
Rajabhats. This infonnation will lead to the clarification of what l~cturers' receptivity
perceive towards a major new educational change, and what reasons m~kc they hold
their attitude~ like that they do. The lecturers, who arc working during semester 2 and
3 in the academic year 2001, liave been selected to be subjects of this study.
'Your approval and support would be appreciated.
Sincerely yours,
Anusak Ketusiri (Mr.)
Enclosure~ (2): 1. Ethics ele:nrance
2. Research proposal
283

Interview questions ,,
Direction: You arc requested to respond \(l the questions concerning lec0
/urcr
receptivity to a major new policy ~hangc in the context of planned change al
Rajabhats in Thailand.
Lecturer receptivity to the new educational system
Aspect I: Comparison with the previous change
1.1 Do you think that the new educational system is bcllcr than the prcvic1us
educational system?
1.2 Why do you think that?
Aspect 2 : Practicality in your cla~.room
2.1 Do you think that the new system is practical in your classroom?
2.2 Why do you think that?
Aspect 3: Alleviation of concerns
3.1 When the new educational policy is implemented, wi!I all your concerns be
alleviated?
3.2 Why do you think that?
Aspect 4: Learning about the change
4.1 How did you learn about the educational change?
4.2 Why do you think like that?
Aspect 5: Participation in decision-making
5.1 How will you be participated in decision-making at your Rajahhat, when the
new educational policy is implemented?
5.2 Why do you think that?
Aspect 6: Personal cost appraisal
6.1 Do you think the new educational system is worth all the effort to
implement it? Would you please give some details?
6.2 Why do you think that?
Aspect 7 : Collaboration witl1 other lecturers
7.1 ls collaboration with other lecturers necessary to implement the new
educational system?
7.2 Why do you think that?
284

Aspect 8: Opportunities for Lcclluer Im~rovement
8.1 Does new educational system provide opportunities for your educational
knowledge and professional improvement?
8.2 Why do y(lu think 1hat?
Aspect 9: Perceived Value for Students
9.1 ls tile new educational system advantageous for your students?
9.iWhy do you think that?
"""·
,,
285