Lecture: Lagrangian Mechanics 1 1 Lecture: Lagrangian Mechanics
Upload
khangminh22Category
view
1download
0
Lecture 2 Phase Relations

A given volume of soil in natural occurrence consists of solid particles and the void spaces between the particles. The void space may be filled with air and/or water; hence, soil is a three-phase system.
If there is no water in the void space, it is a dry soil. If the entire void space is filled with water, it is referred to as a saturated soil. However, if the void is partially filled with water, it is a moist soil.
Introduction

Components of Phase Diagram
To develop the weight–volume relationships, we must separate the three phases (that is: solid, water, and air) as shown in the figure in this slide.
Vs = volume of soil solids Vv = volume of voids Vw = volume of water in the voids Va = volume of air in the voids Ws = weight of soil solids Ww = weight of water
Mass-Based and Weight Based Phase Diagrams
Weight Based Mass Based

Volume Relationships
The volume relationships commonly used for the three phases in a soil element are void ratio, porosity, and degree of saturation.
Void ratio (e) is defined as the ratio of the volume of voids to the volume of solids.
Vs = volume of soil solids Vv = volume of voids
s
v
V
Ve

Volume Relationships
Porosity (n%) is defined as the ratio of the volume of voids to the total volume.
Degree of Saturation (S%) is defined as the ratio of the volume of water to the volume of voids.
Vw = volume of water in the voids Vv = volume of voids
V
Vn v
v
w
V
VS
V = total volume Vv = volume of voids
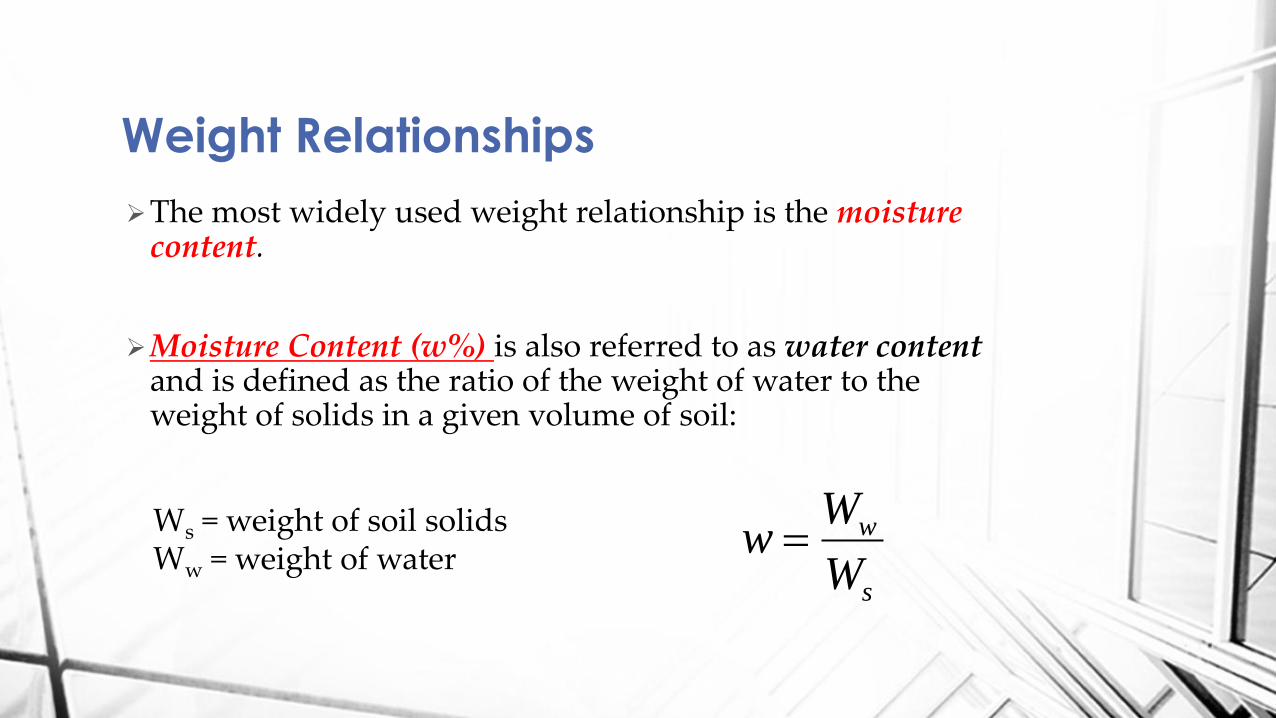
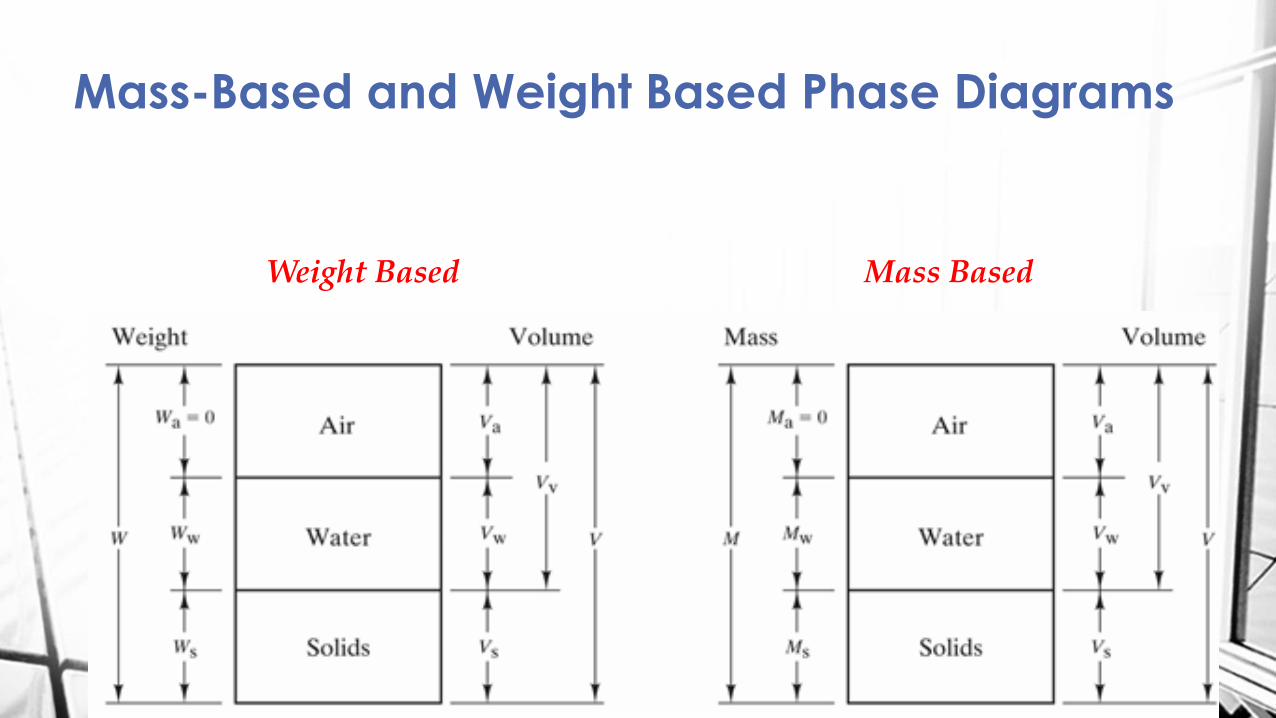
Weight Relationships
The most widely used weight relationship is the moisture content.
Moisture Content (w%) is also referred to as water content and is defined as the ratio of the weight of water to the weight of solids in a given volume of soil:
Ws = weight of soil solids Ww = weight of water
s
w
W
Ww
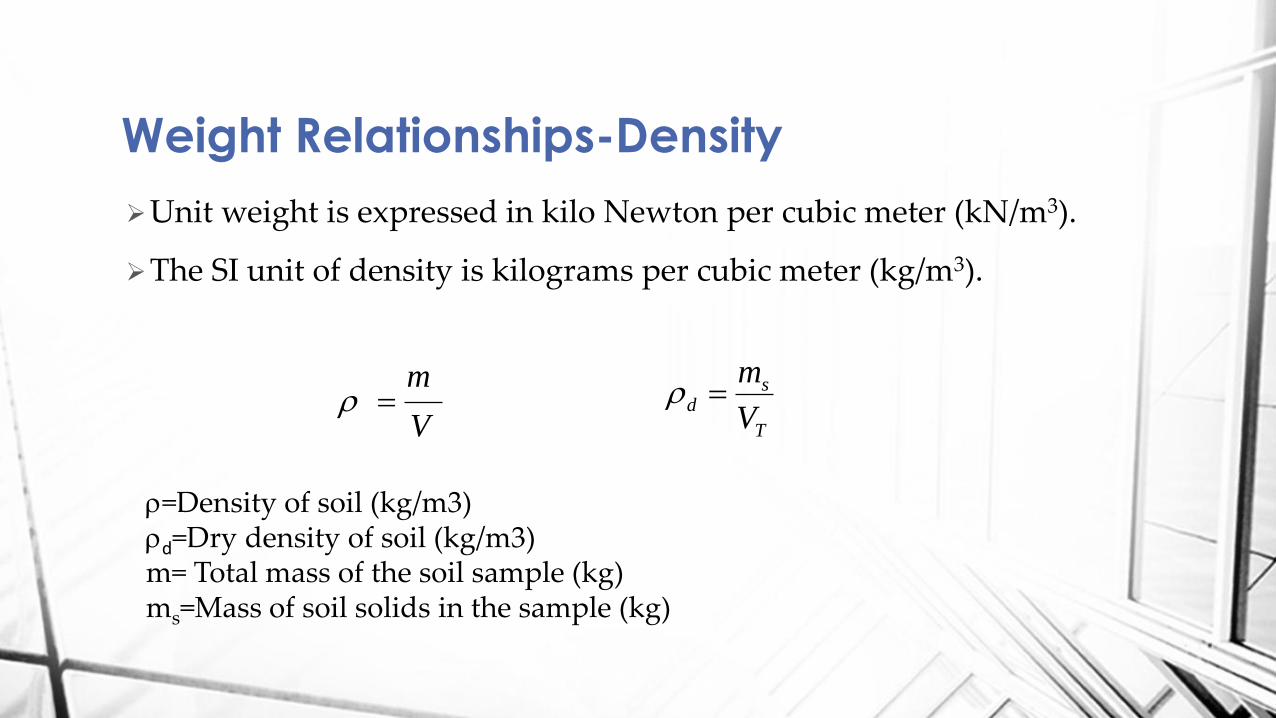
Weight Relationships-Density
Unit weight is expressed in kilo Newton per cubic meter (kN/m3).
The SI unit of density is kilograms per cubic meter (kg/m3).
V
m
T
sd
V
m
=Density of soil (kg/m3) d=Dry density of soil (kg/m3) m= Total mass of the soil sample (kg) ms=Mass of soil solids in the sample (kg)
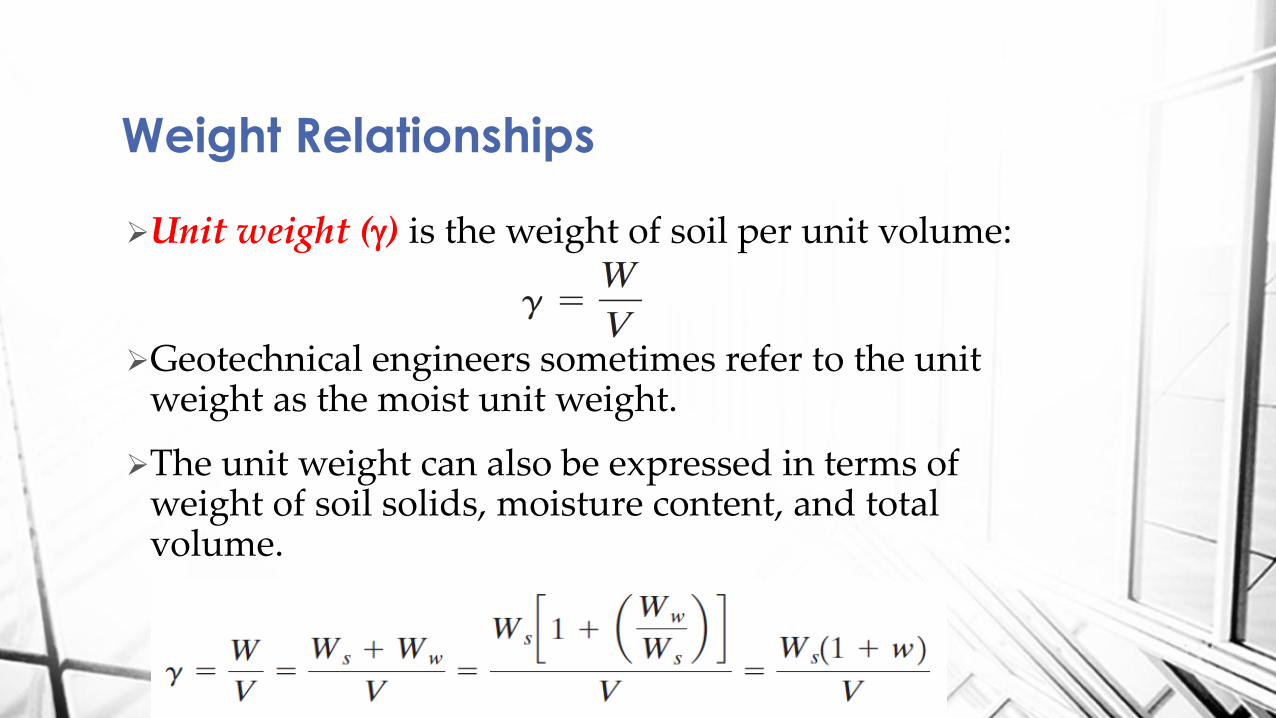
Weight Relationships
Unit weight (g) is the weight of soil per unit volume:
Geotechnical engineers sometimes refer to the unit weight as the moist unit weight.
The unit weight can also be expressed in terms of weight of soil solids, moisture content, and total volume.

Weight Relationships
It is sometimes necessary to know the weight per unit volume of soil excluding water.
This is referred to as the dry unit weight.
Relationship among unit weight, dry unit weight, and moisture content as
V
Wsd g
wd
1
gg
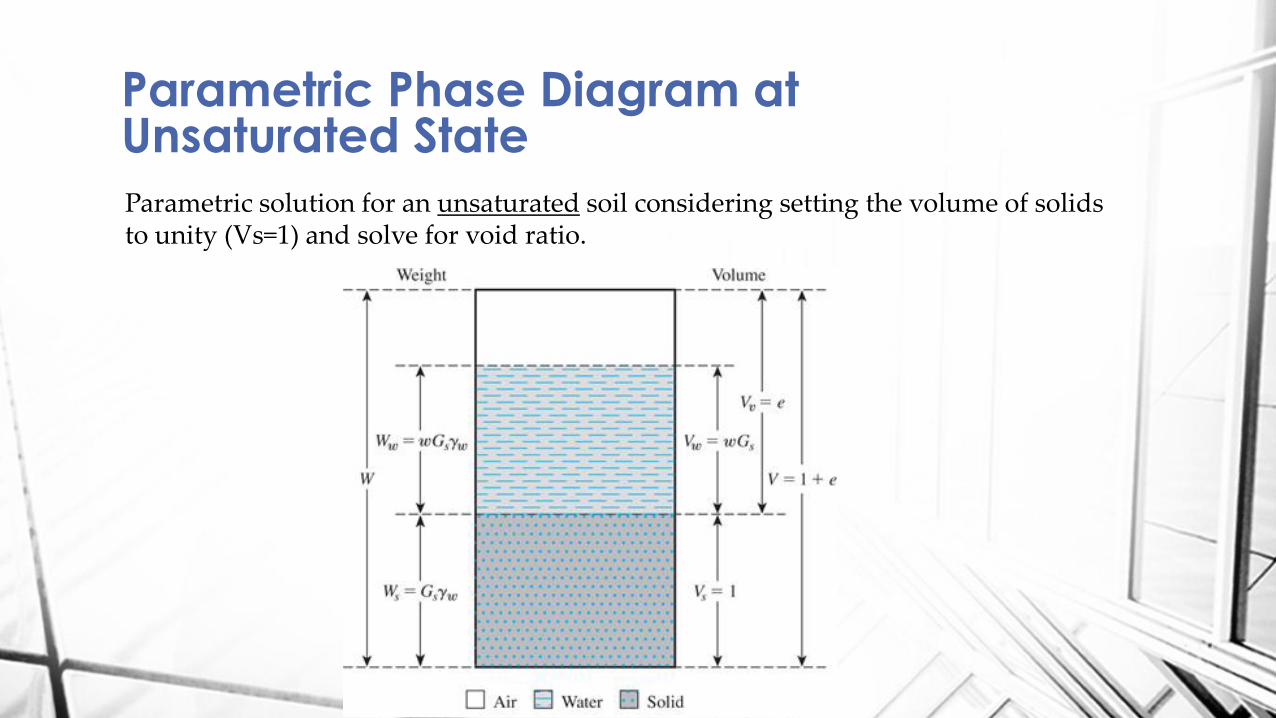
Parametric Phase Diagram at Unsaturated State
Parametric solution for an unsaturated soil considering setting the volume of solids to unity (Vs=1) and solve for void ratio.
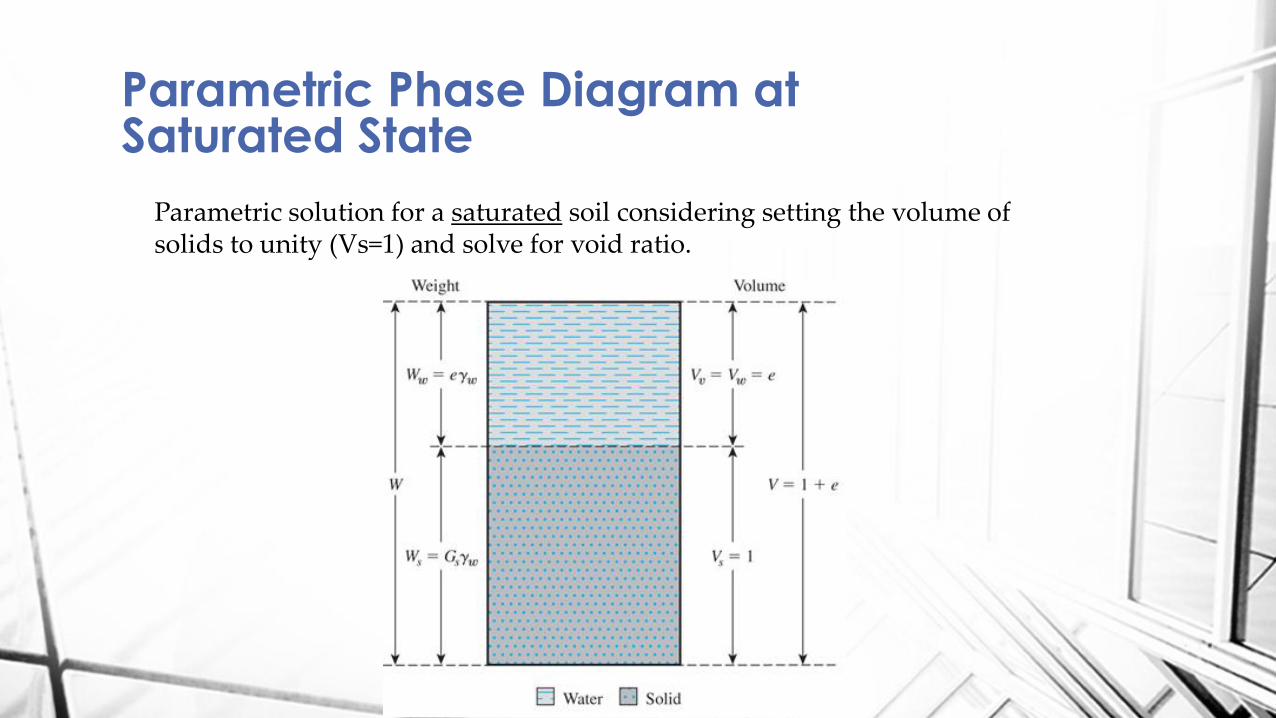
Parametric Phase Diagram at Saturated State
Parametric solution for a saturated soil considering setting the volume of solids to unity (Vs=1) and solve for void ratio.
Parametric Phase Diagram at Unsaturated State
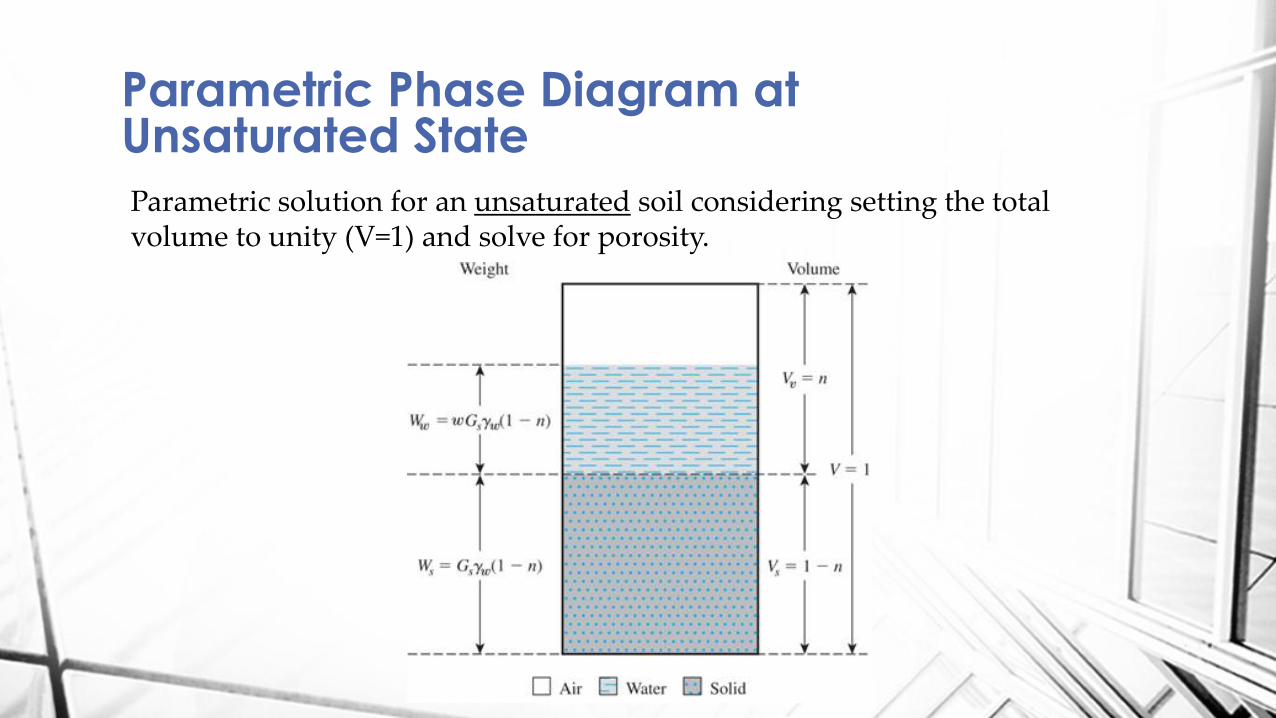
Parametric solution for an unsaturated soil considering setting the total volume to unity (V=1) and solve for porosity.
Parametric Phase Diagram at Saturated State
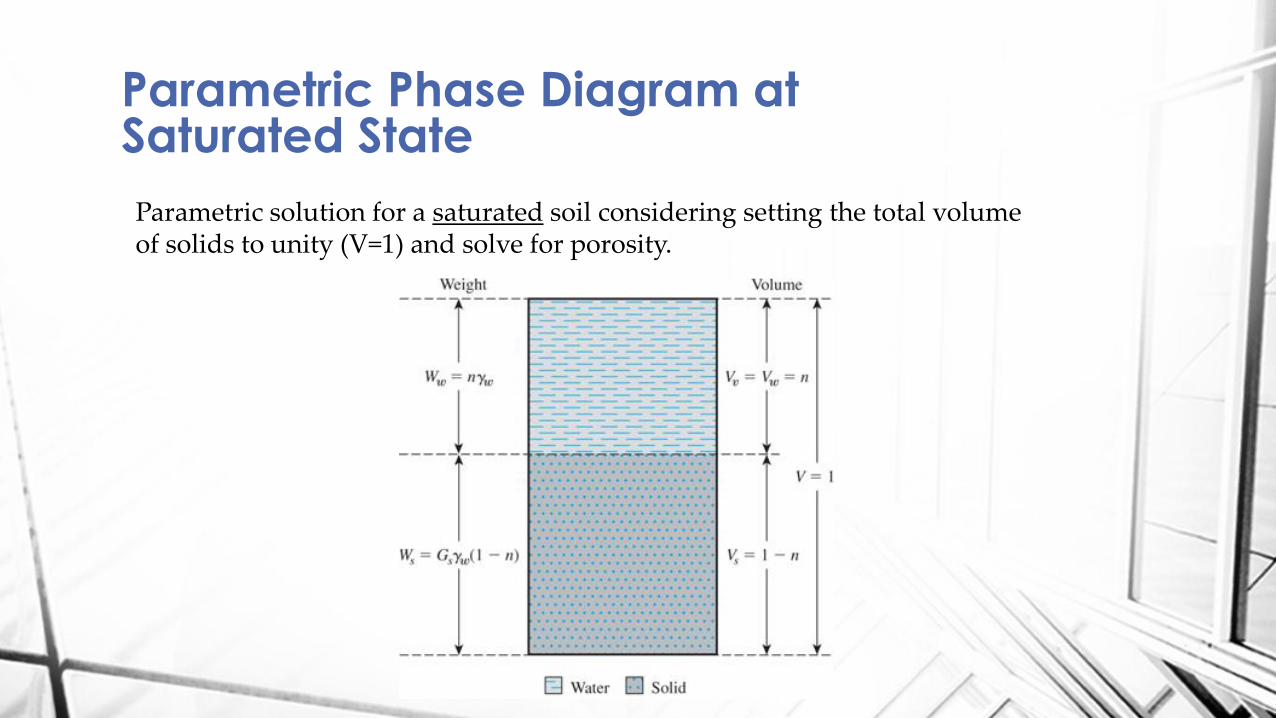
Parametric solution for a saturated soil considering setting the total volume of solids to unity (V=1) and solve for porosity.
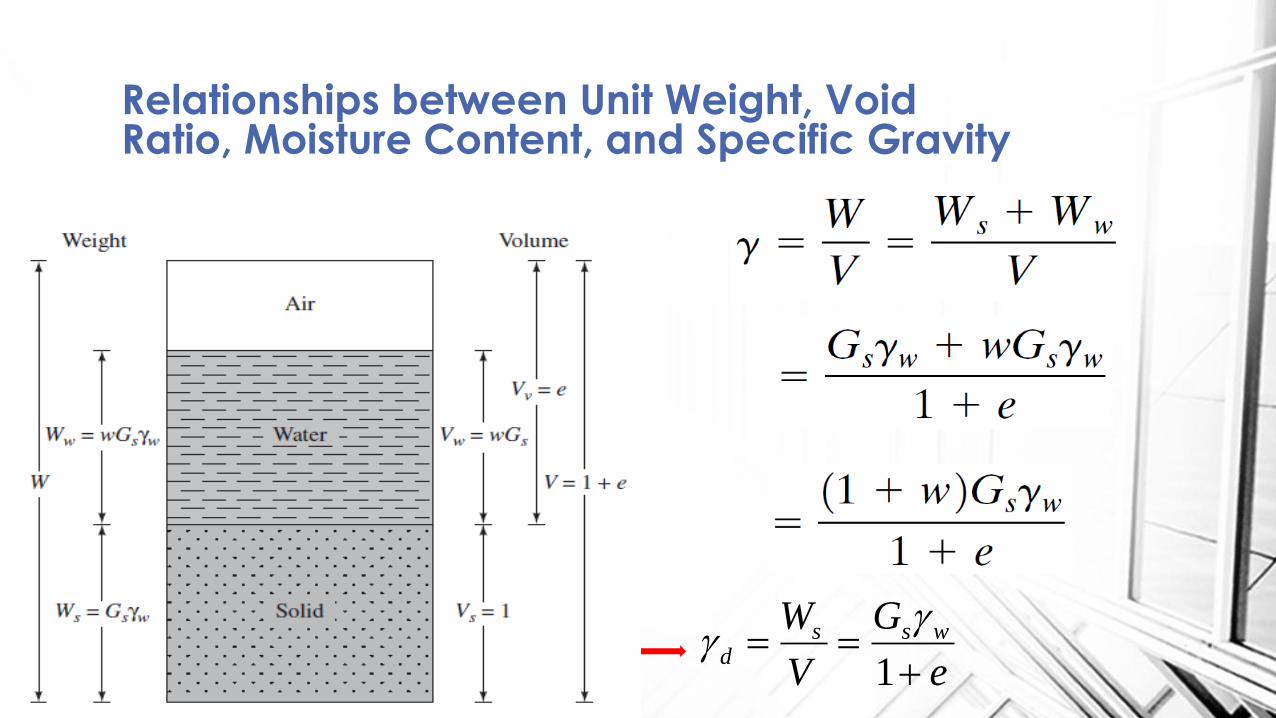
Relationships between Unit Weight, Void Ratio, Moisture Content, and Specific Gravity
e
G
V
W wssd
1
gg
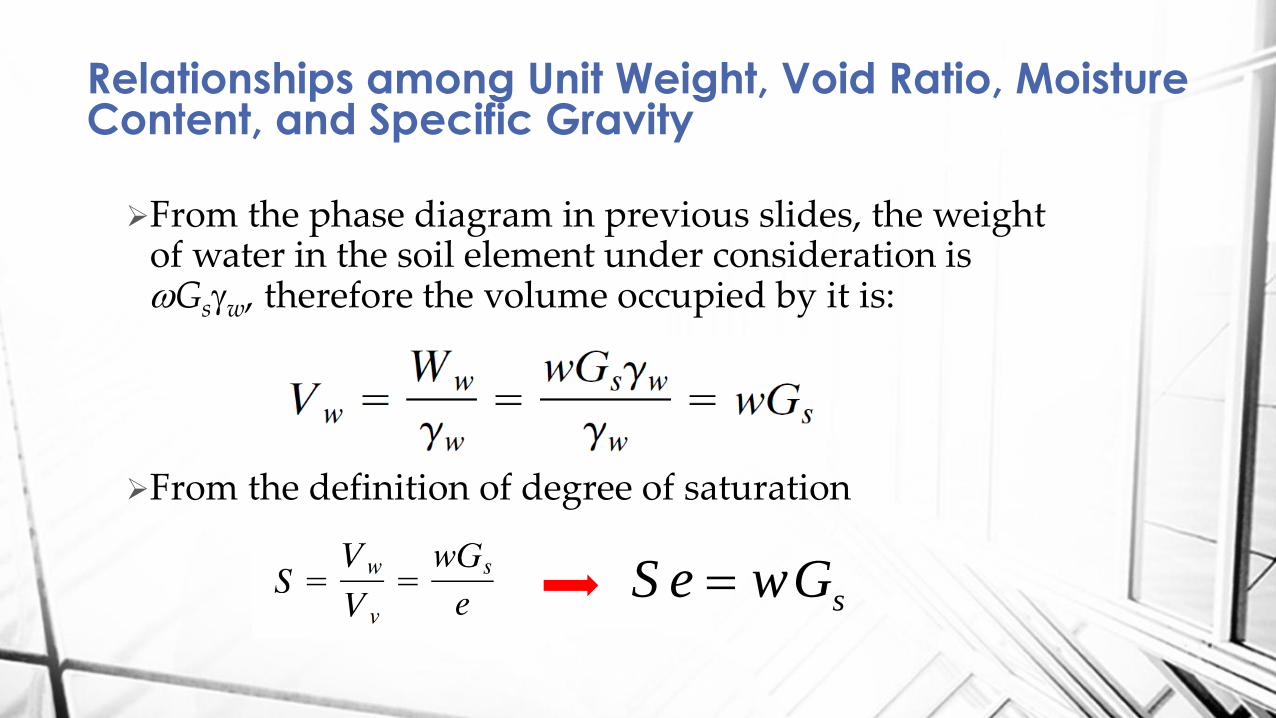
Relationships among Unit Weight, Void Ratio, Moisture Content, and Specific Gravity
From the phase diagram in previous slides, the weight of water in the soil element under consideration is wGsgw, therefore the volume occupied by it is:
From the definition of degree of saturation
sGweS

Relationships among Unit Weight, Void Ratio, Moisture Content, and Specific Gravity
When the soil sample is fully saturated, the void spaces are completely filled with water.
Saturated unit weight of soil can be calculated as:
e
eG
e
eG
V
WW
V
W wswwswssat
1
)(
1
gggg
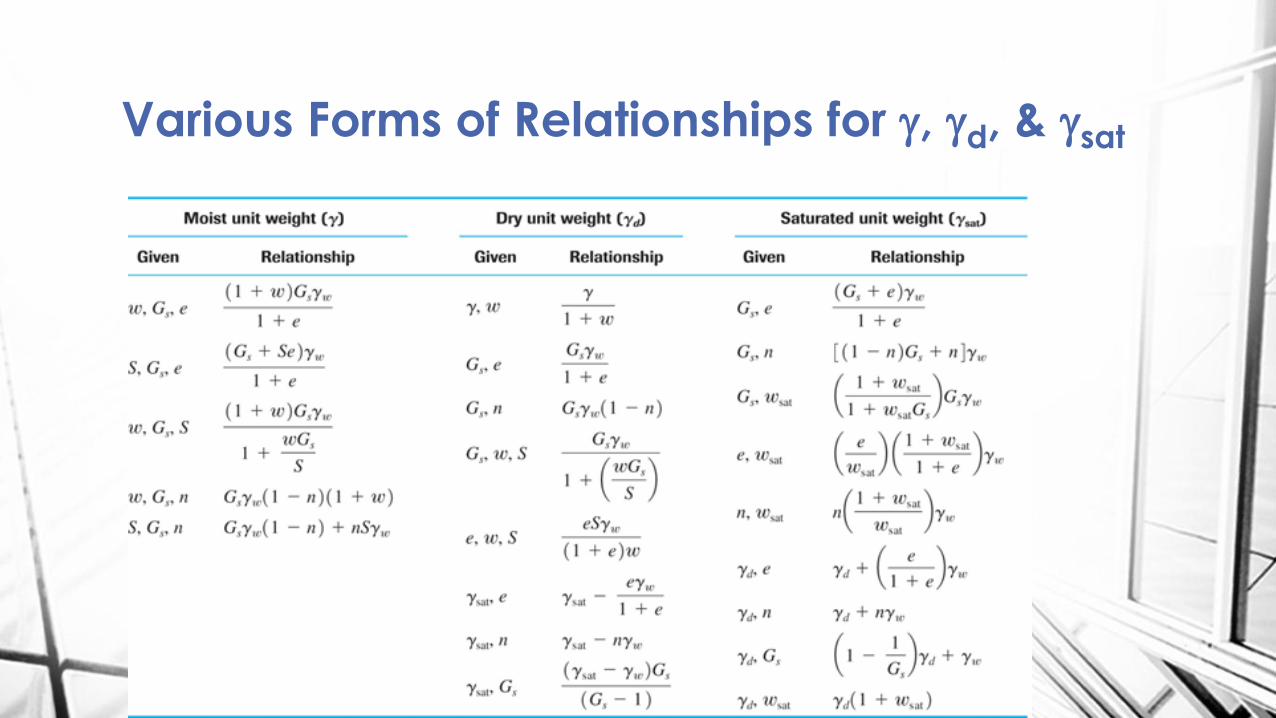
Various Forms of Relationships for g, gd, & gsat
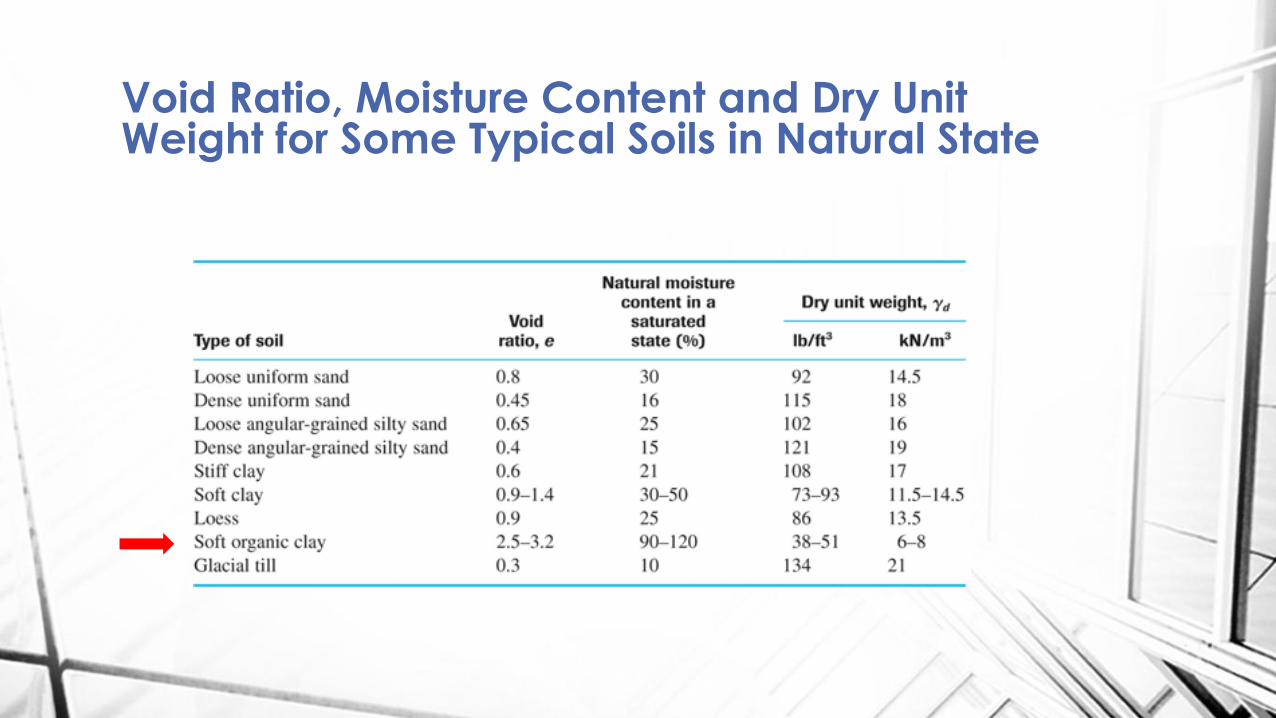
Void Ratio, Moisture Content and Dry Unit Weight for Some Typical Soils in Natural State
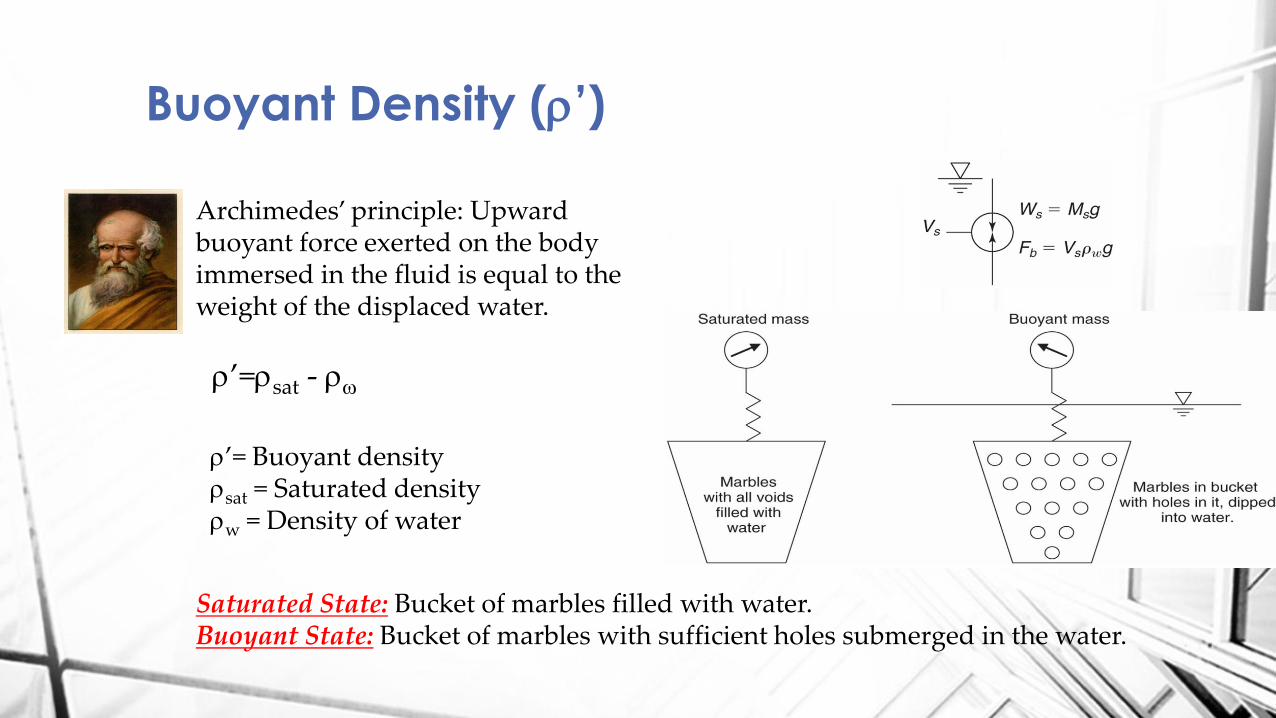
Buoyant Density (’)
Archimedes’ principle: Upward buoyant force exerted on the body immersed in the fluid is equal to the weight of the displaced water.
’=sat - w
’= Buoyant density sat = Saturated density w = Density of water
Saturated State: Bucket of marbles filled with water. Buoyant State: Bucket of marbles with sufficient holes submerged in the water.

minmax
max
ee
eeDr
(min)(max)
(min)
dd
dd
dIgg
gg
Relative Density or Index Density based on Void Ratio (e)
Relative Density or Index Density based on Dry Unit Weight (gd)
In practice, its often useful to know how dense or how loose the soil is with respect to its densest and loosest conditions. That’s when we use the relative density concept.
e max : Void ratio of the soil in its loosest condition e min : Void ratio of the soil in its densest condition e : Current void ratio of the soil in the field gd (max) : Dry unit weight of the soil in its densest condition gd (min) : Dry unit weight of the soil in its loosest condition gd : Current unit weight of the soil in the field
Relative Density
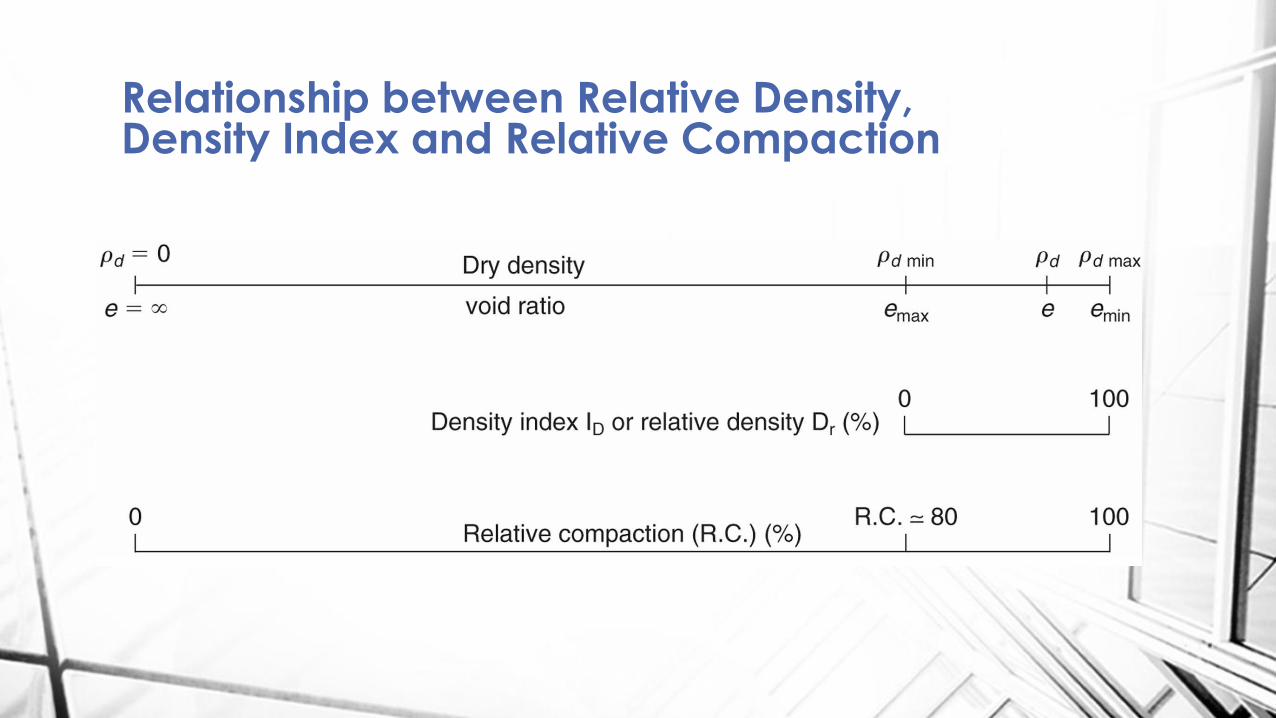
Relationship between Relative Density, Density Index and Relative Compaction
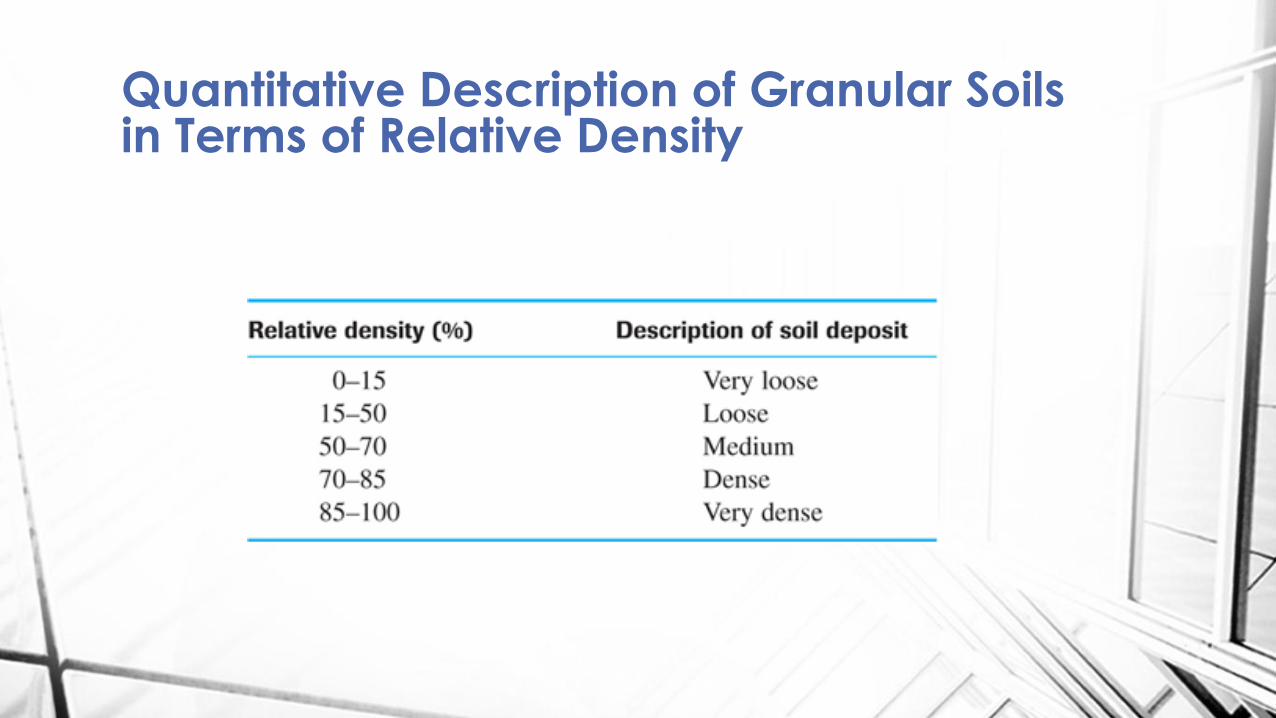
Quantitative Description of Granular Soils in Terms of Relative Density
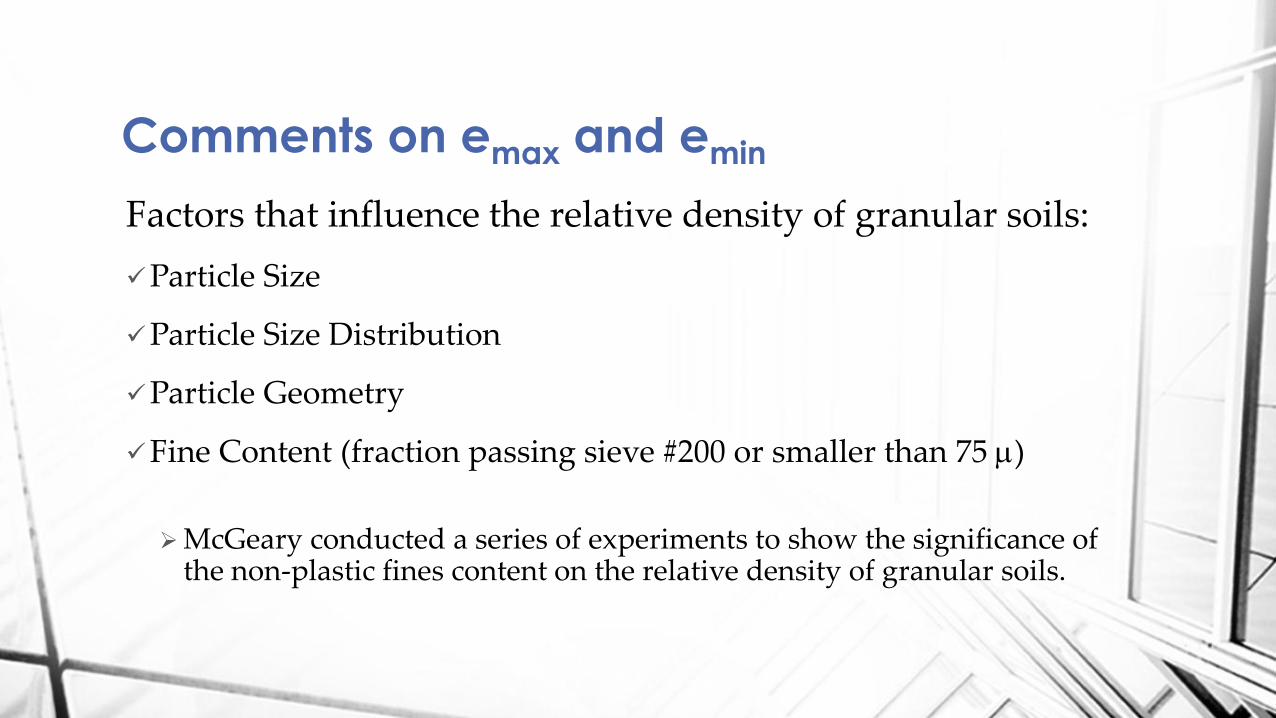
Factors that influence the relative density of granular soils:
Particle Size
Particle Size Distribution
Particle Geometry
Fine Content (fraction passing sieve #200 or smaller than 75 m)
McGeary conducted a series of experiments to show the significance of the non-plastic fines content on the relative density of granular soils.
Comments on emax and emin
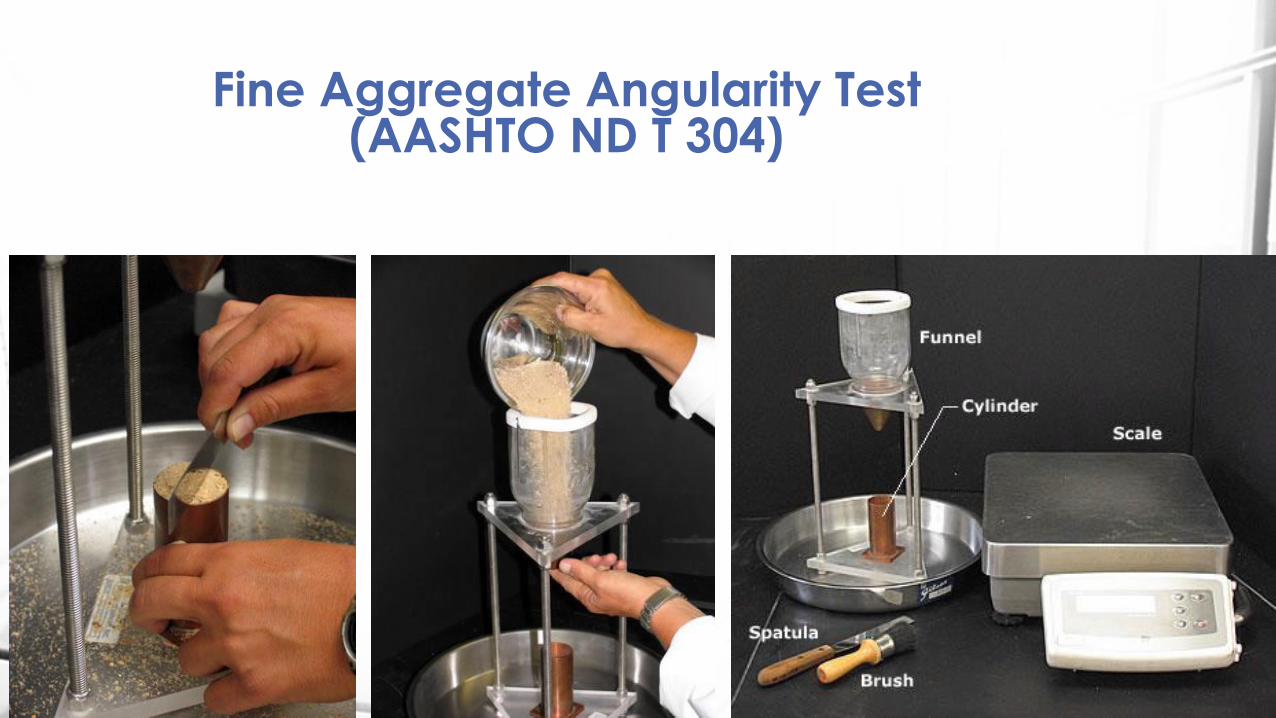
Fine Aggregate Angularity Test (AASHTO ND T 304)
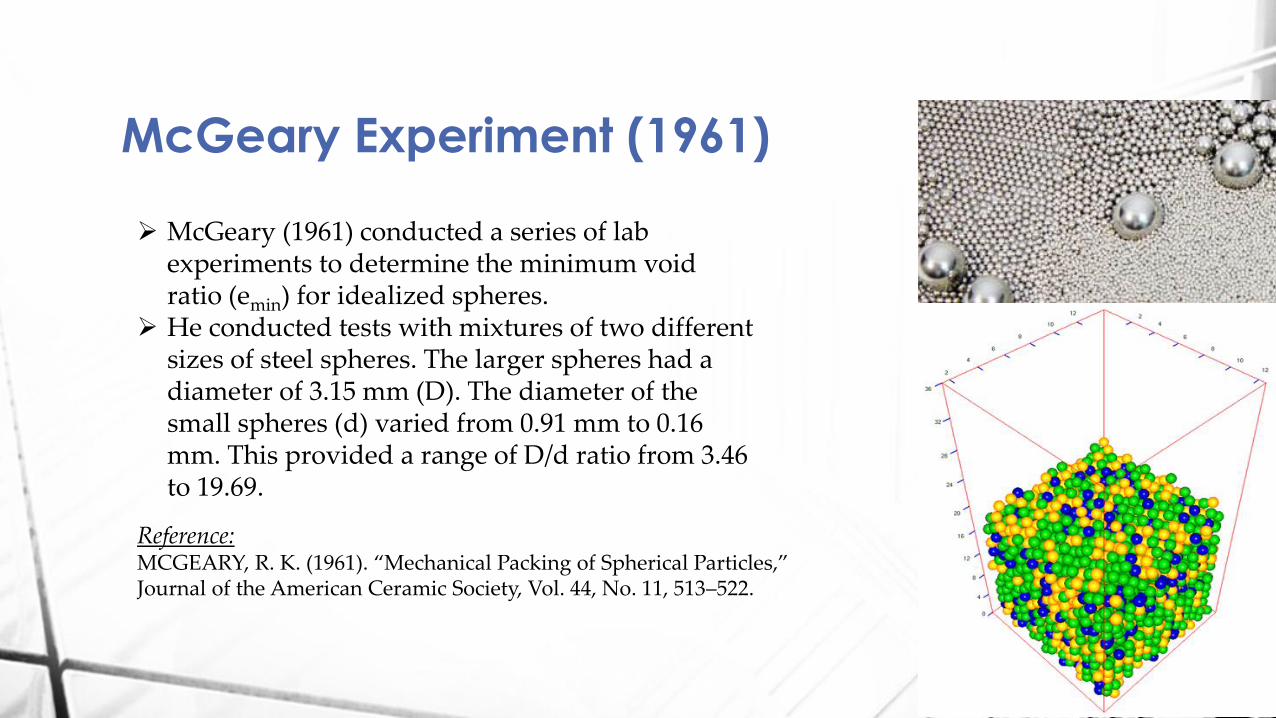
McGeary Experiment (1961)
McGeary (1961) conducted a series of lab experiments to determine the minimum void ratio (emin) for idealized spheres.
He conducted tests with mixtures of two different sizes of steel spheres. The larger spheres had a diameter of 3.15 mm (D). The diameter of the small spheres (d) varied from 0.91 mm to 0.16 mm. This provided a range of D/d ratio from 3.46 to 19.69.
Reference: MCGEARY, R. K. (1961). “Mechanical Packing of Spherical Particles,” Journal of the American Ceramic Society, Vol. 44, No. 11, 513–522.
Variation of the Minimum Void Ratio with Percent of Smaller Steel Spheres by Volume (McGeary,1961)
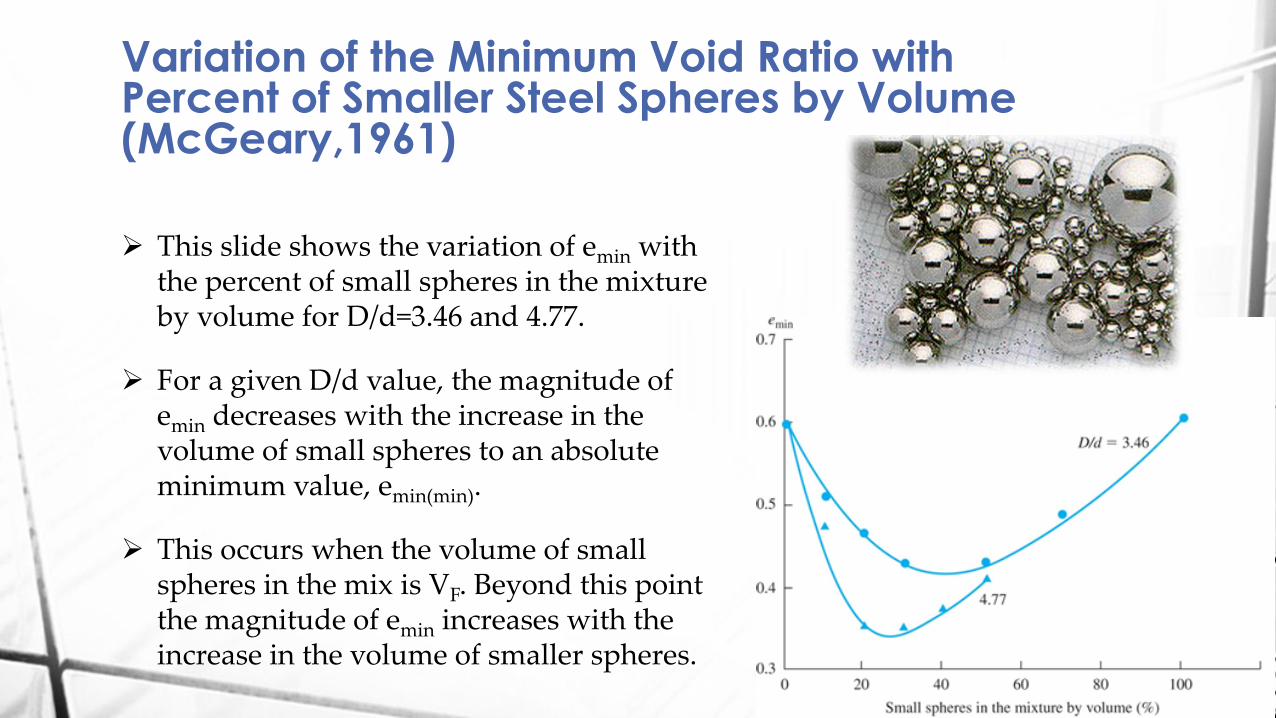
This slide shows the variation of emin with the percent of small spheres in the mixture by volume for D/d=3.46 and 4.77.
For a given D/d value, the magnitude of emin decreases with the increase in the volume of small spheres to an absolute minimum value, emin(min).
This occurs when the volume of small spheres in the mix is VF. Beyond this point the magnitude of emin increases with the increase in the volume of smaller spheres.

Summary of Test Results, McGeary, 1961
Notice that : (a) For D/d > 7, the magnitude of emin(min) remains approximately constant ( ~ 0.2) and, (b) At emin(min) , the approximate magnitude of VF ~ 27%.
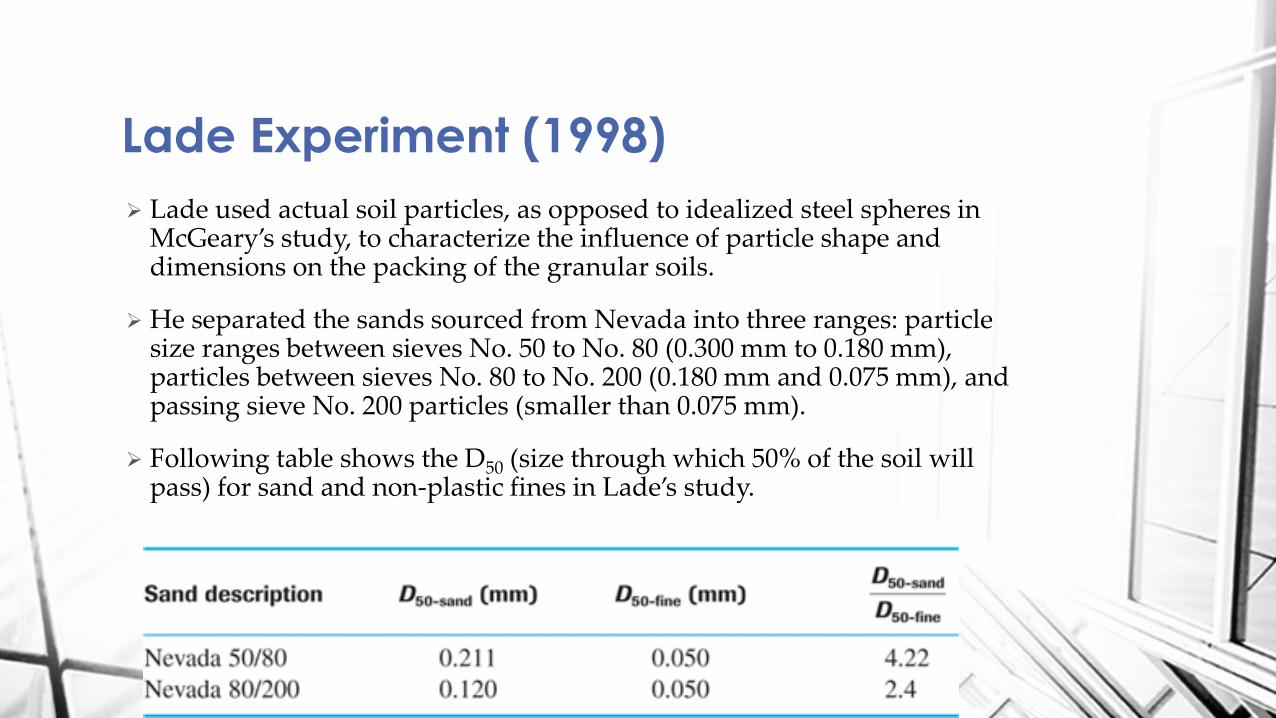
Lade used actual soil particles, as opposed to idealized steel spheres in McGeary’s study, to characterize the influence of particle shape and dimensions on the packing of the granular soils.
He separated the sands sourced from Nevada into three ranges: particle size ranges between sieves No. 50 to No. 80 (0.300 mm to 0.180 mm), particles between sieves No. 80 to No. 200 (0.180 mm and 0.075 mm), and passing sieve No. 200 particles (smaller than 0.075 mm).
Following table shows the D50 (size through which 50% of the soil will pass) for sand and non-plastic fines in Lade’s study.
Lade Experiment (1998)
Variation of emax and emin with Percent of
Nonplastic Fines Content
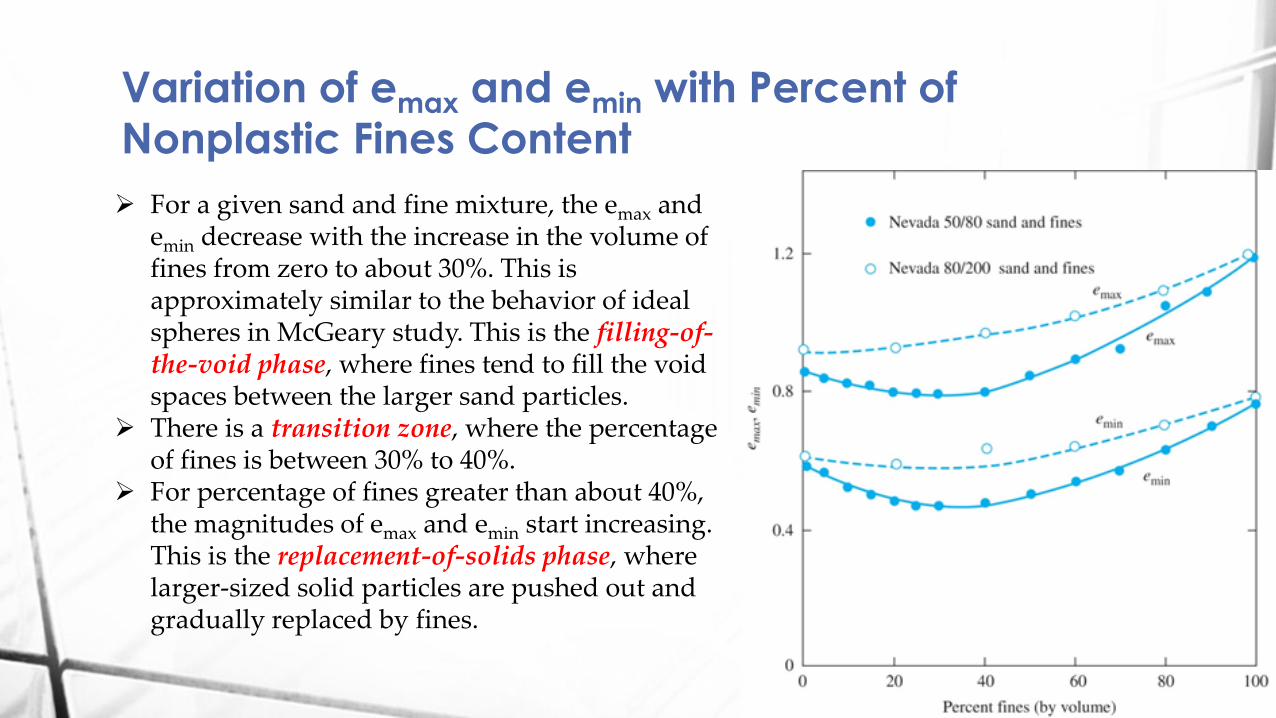
For a given sand and fine mixture, the emax and emin decrease with the increase in the volume of fines from zero to about 30%. This is approximately similar to the behavior of ideal spheres in McGeary study. This is the filling-of-the-void phase, where fines tend to fill the void spaces between the larger sand particles.
There is a transition zone, where the percentage of fines is between 30% to 40%.
For percentage of fines greater than about 40%, the magnitudes of emax and emin start increasing. This is the replacement-of-solids phase, where larger-sized solid particles are pushed out and gradually replaced by fines.
Variation of the emin and emax with Median
Grain Size D50 (Fuggle, 2014)
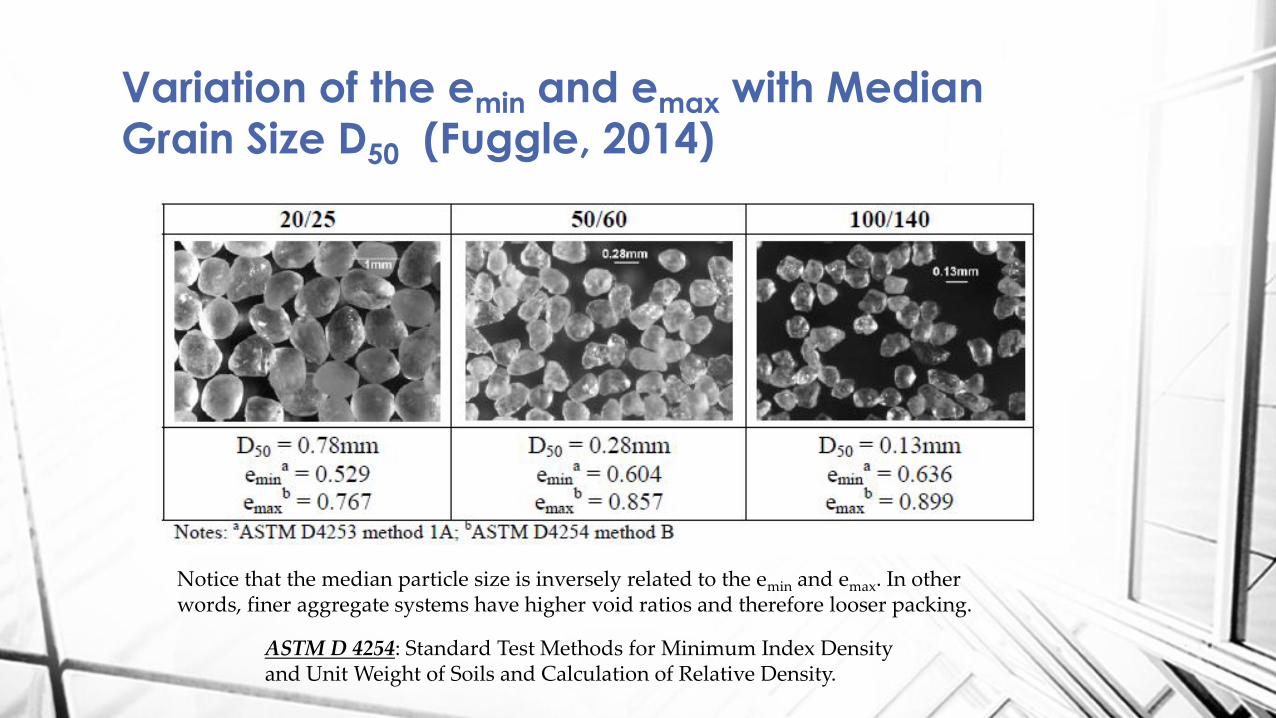
ASTM D 4254: Standard Test Methods for Minimum Index Density and Unit Weight of Soils and Calculation of Relative Density.
Notice that the median particle size is inversely related to the emin and emax. In other words, finer aggregate systems have higher void ratios and therefore looser packing.
Correlations between emax , emin,
and Median Grain Size (D50)
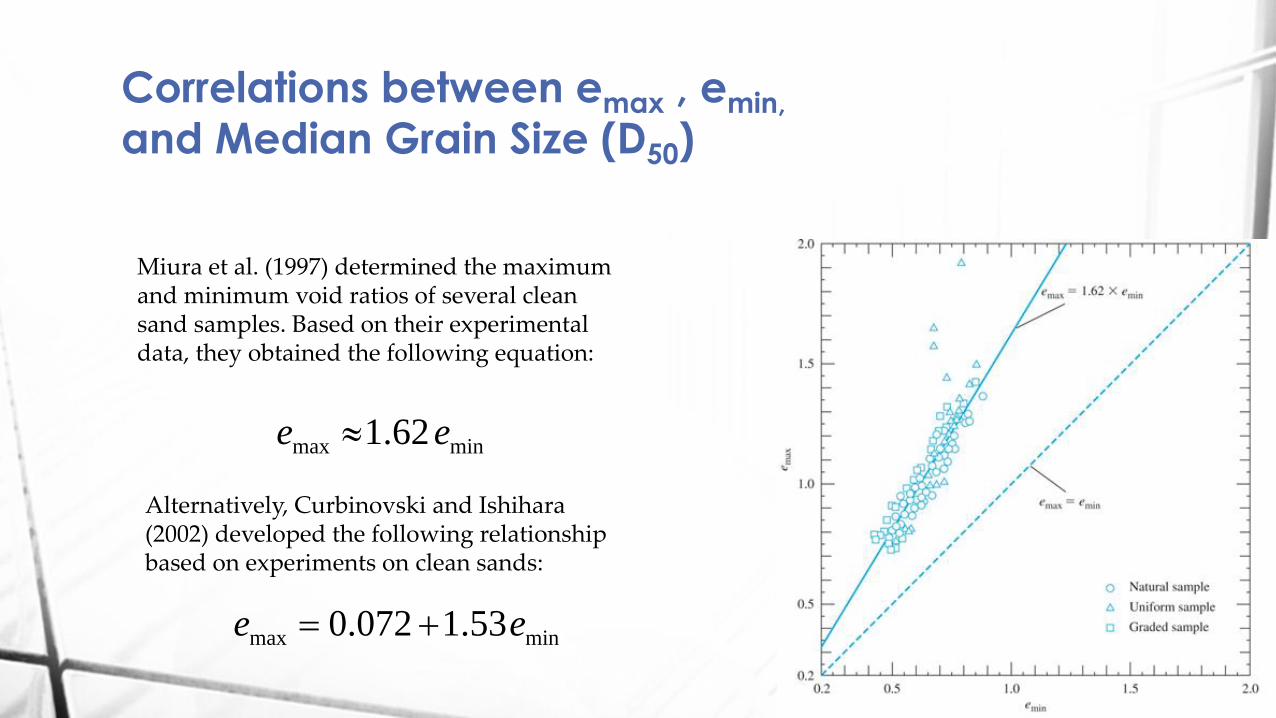
Miura et al. (1997) determined the maximum and minimum void ratios of several clean sand samples. Based on their experimental data, they obtained the following equation:
minmax 62.1 ee
minmax 53.1072.0 ee
Alternatively, Curbinovski and Ishihara (2002) developed the following relationship based on experiments on clean sands:

Cubrinovski and Ishihara (2002) studied the variation of emax and emin for a much larger database of soils compared to Miura’s experiment. Based on the best fit linear regression lines, they developed the following
relationships:
Correlations between emax , emin,
and Median Grain Size (D50), Cont.
Fc = fine fraction for which grain size is smaller than 0.075 mm Pc = clay-size fraction (< 0.005 mm)
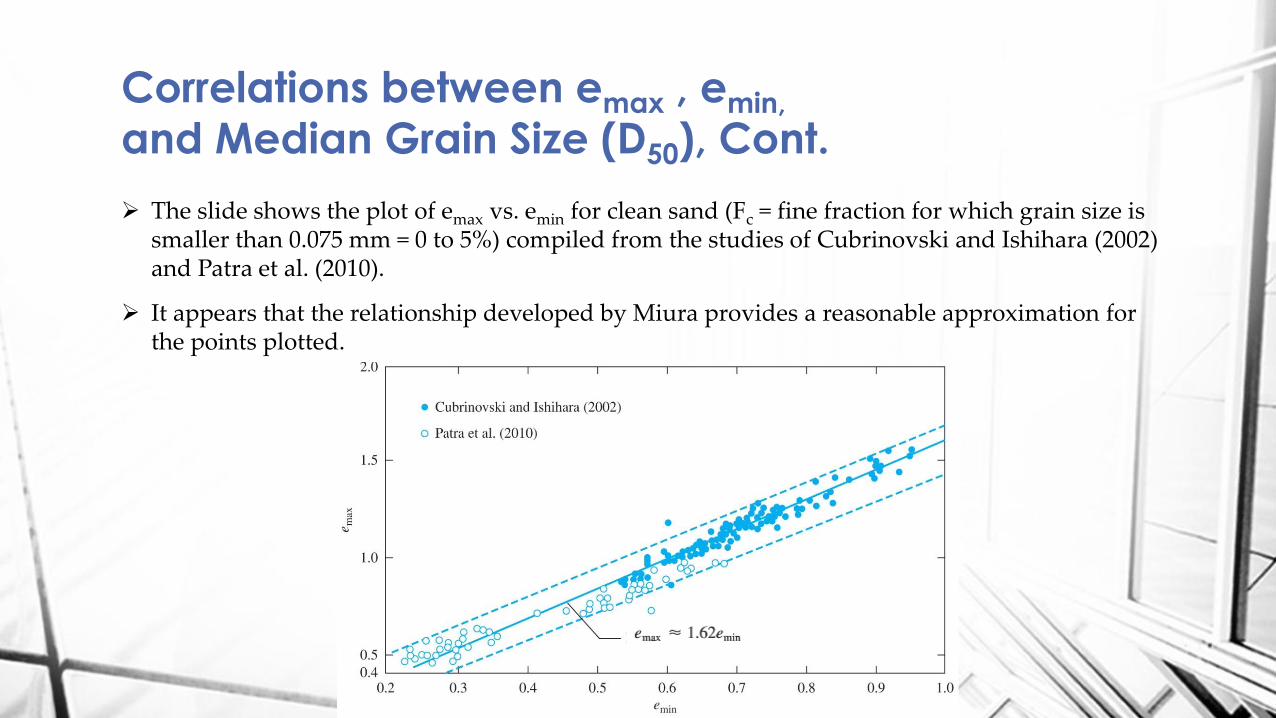
The slide shows the plot of emax vs. emin for clean sand (Fc = fine fraction for which grain size is smaller than 0.075 mm = 0 to 5%) compiled from the studies of Cubrinovski and Ishihara (2002) and Patra et al. (2010).
It appears that the relationship developed by Miura provides a reasonable approximation for the points plotted.
Correlations between emax , emin,
and Median Grain Size (D50), Cont.
Correlations between [emax-emin]
and Median Grain Size (D50)
50
minmax
06.023.0
Dee
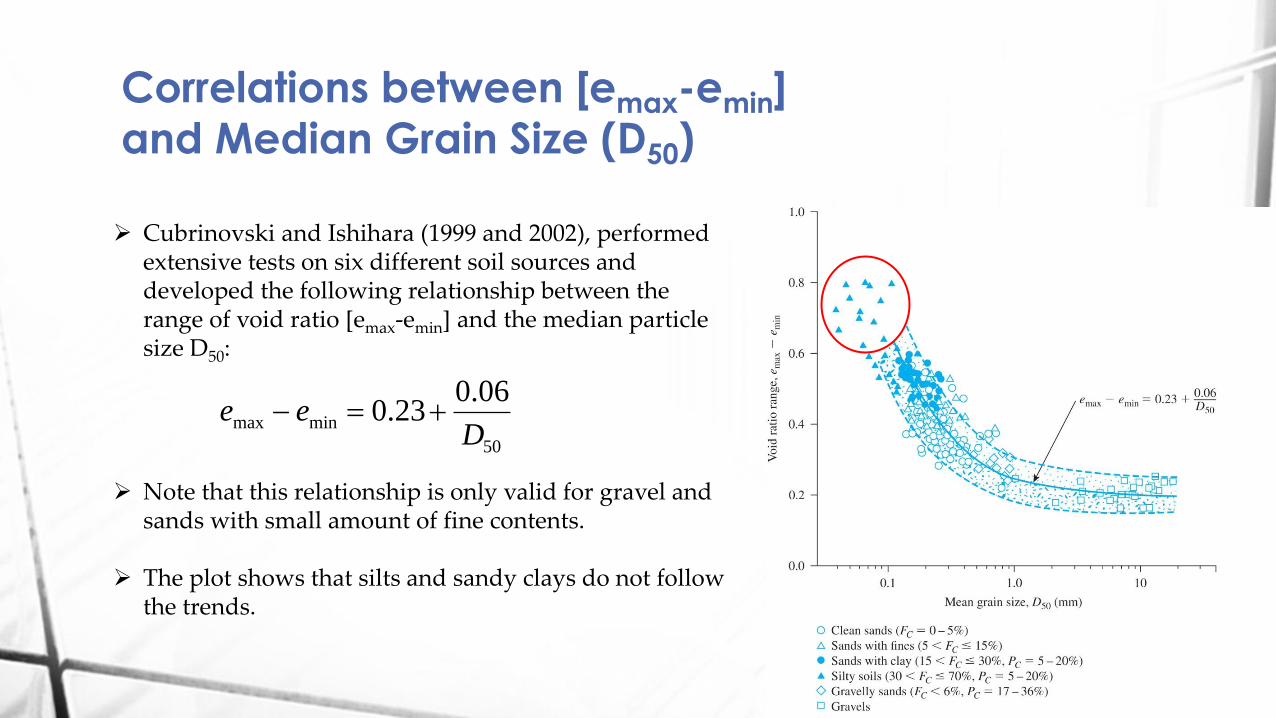
Cubrinovski and Ishihara (1999 and 2002), performed extensive tests on six different soil sources and developed the following relationship between the range of void ratio [emax-emin] and the median particle size D50:
Note that this relationship is only valid for gravel and sands with small amount of fine contents.
The plot shows that silts and sandy clays do not follow the trends.

Significance of Void Ratio
Void Ratio and Permeability As we discussed in our previous lectures,
the inter-connected air void system in soils resemble Nano-Tubes that act as channels of water. It’s intuitively evident that aggregate systems with higher void ratio allow the water molecule to pass through the body of soils much easier than densely packed systems.
Kozney-Carmen relationship quantifies the relationship between the void ratio and soil permeability as:
e
ek
1
3
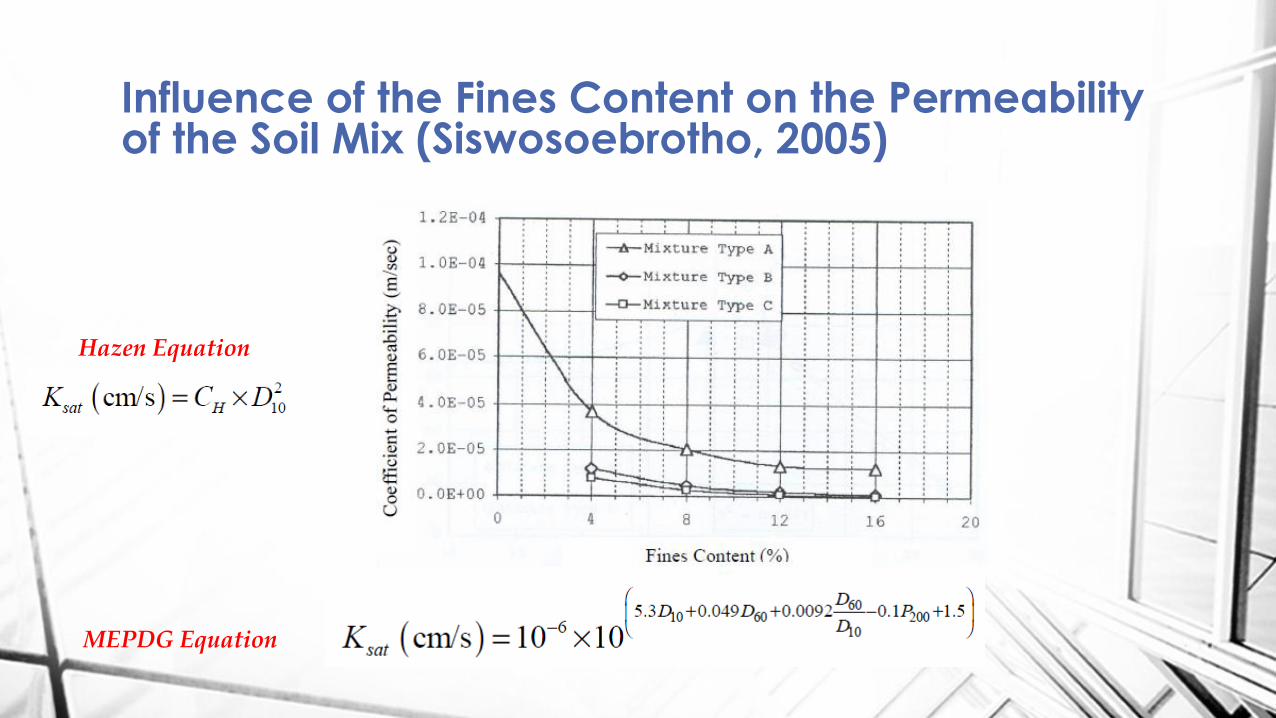
Influence of the Fines Content on the Permeability of the Soil Mix (Siswosoebrotho, 2005)
Hazen Equation
MEPDG Equation

Influence of Gravel/Sand Ratio on the Permeability of Crushed Granite Mixes (After Xiao, et. al. 2016)
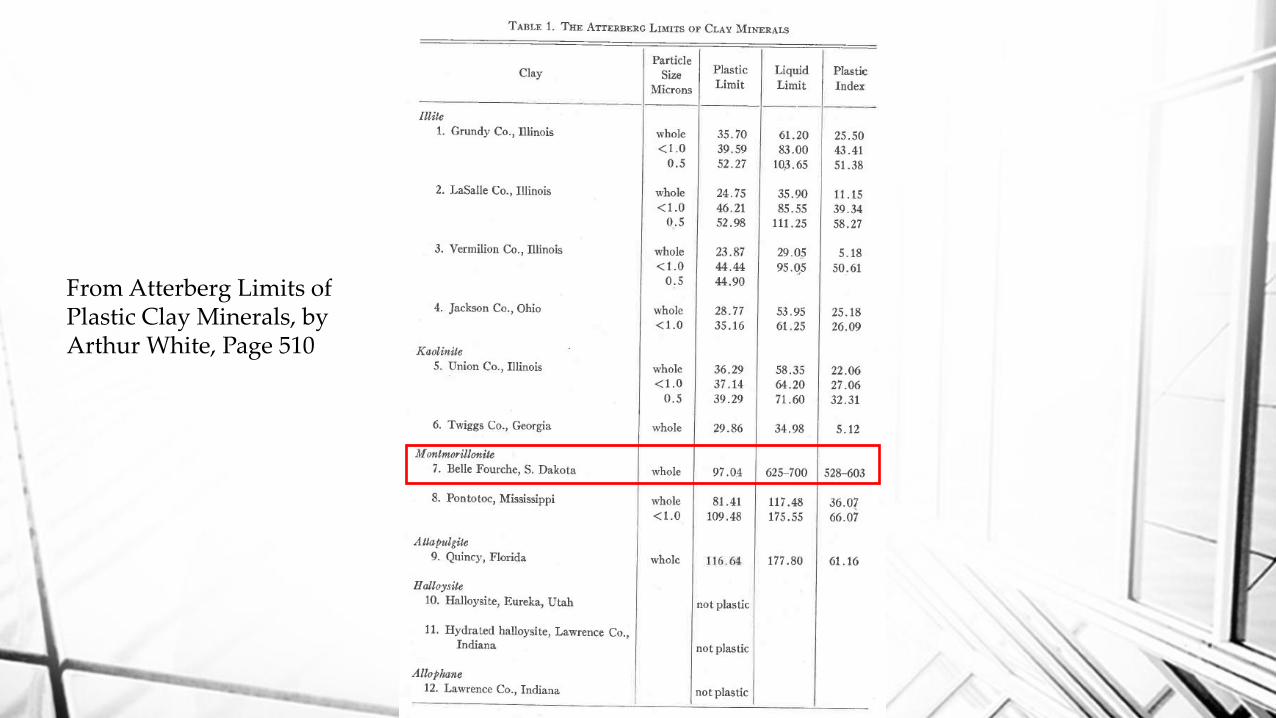
From Atterberg Limits of Plastic Clay Minerals, by Arthur White, Page 510
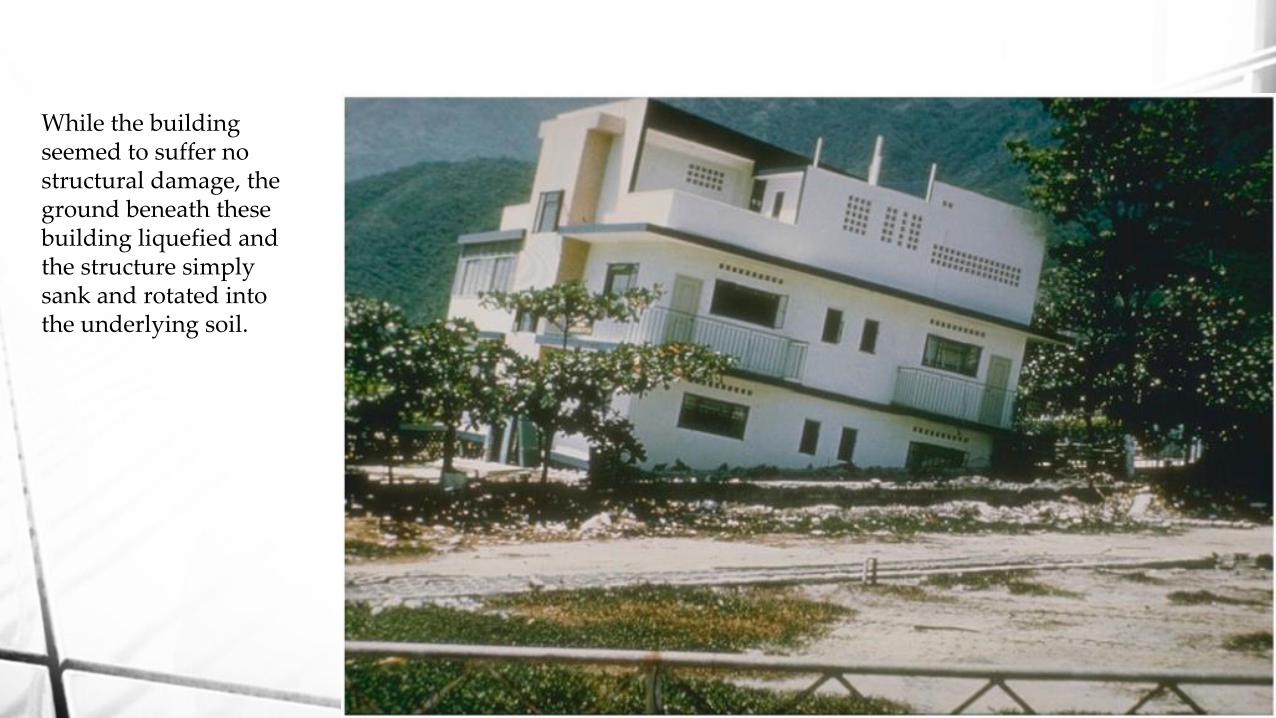
While the building seemed to suffer no structural damage, the ground beneath these building liquefied and the structure simply sank and rotated into the underlying soil.


Copyright © 2022 FDOKUMEN