Leaf wax n-alkane distributions in arid zone South African flora: Environmental controls,...
14
This article appeared in a journal published by Elsevier. The attached copy is furnished to the author for internal non-commercial research and education use, including for instruction at the authors institution and sharing with colleagues. Other uses, including reproduction and distribution, or selling or licensing copies, or posting to personal, institutional or third party websites are prohibited. In most cases authors are permitted to post their version of the article (e.g. in Word or Tex form) to their personal website or institutional repository. Authors requiring further information regarding Elsevier’s archiving and manuscript policies are encouraged to visit: http://www.elsevier.com/authorsrights
Transcript of Leaf wax n-alkane distributions in arid zone South African flora: Environmental controls,...

This article appeared in a journal published by Elsevier. The attachedcopy is furnished to the author for internal non-commercial researchand education use, including for instruction at the authors institution
and sharing with colleagues.
Other uses, including reproduction and distribution, or selling orlicensing copies, or posting to personal, institutional or third party
websites are prohibited.
In most cases authors are permitted to post their version of thearticle (e.g. in Word or Tex form) to their personal website orinstitutional repository. Authors requiring further information
regarding Elsevier’s archiving and manuscript policies areencouraged to visit:
http://www.elsevier.com/authorsrights

Author's personal copy
Leaf wax n-alkane distributions in arid zone South African flora:Environmental controls, chemotaxonomy and palaeoecologicalimplications
Andrew S. Carr a,⇑, Arnoud Boom a, Hannah L. Grimes a, Brian M. Chase b,c, Michael E. Meadows d,Angela Harris e
a Department of Geography, University of Leicester, University Road, Leicester LE1 7RH, UKb Institut des Sciences de l’Evolution de Montpellier, UMR 5554, Centre National de Recherche Scientifique/Université Montpellier 2, Bat. 22, CC061, Place Eugène Bataillon,34095 Montpellier cedex 5, Francec Department of Archaeology, History, Culture and Religion, University of Bergen, Postbox 7805, 5020 Bergen, Norwayd Department of Environmental and Geographical Sciences, University of Cape Town, Rondebosch, Cape Town, South Africae Geography, School of Environment, Education and Development, University of Manchester, Oxford Road, Manchester M13 9PL, UK
a r t i c l e i n f o
Article history:Received 5 September 2013Received in revised form 7 November 2013Accepted 10 December 2013Available online 16 December 2013
a b s t r a c t
The environmental controls on leaf wax n-alkane distributions and associated interpretation of such dis-tributions in geological archives have long remained rather enigmatic. Studies of contemporary vegeta-tion often conflate changing environmental conditions and species differences between biomes, making itdifficult to assess the extent to which variation is driven by plant adaptation to prevailing environmentalconditions and/or more fixed chemotaxonomic patterns. We present a case study of arid and semi-aridregions of South Africa that considers these issues. We anticipate that such conditions may impart strongcontrols upon leaf wax synthesis.
Leaf wax n-alkane data from 215 plants and 93 soils from the Succulent Karoo and Fynbos biomes ofSouth Africa revealed yield and distributions to be highly variable. While many plants exhibited concen-trations comparable with previous reports, several succulent plants produced n-alkane yield up to 100�the modal n-alkane concentration for their biome. The data demonstrate that, on average, leaf wax n-alkane distributions in the Succulent Karoo are different from those of the Fynbos biome, with the formerassociated with longer maximum chain length, less dispersed distributions and stronger odd numberedchain length preference. The patterns were closely mirrored in the soils. Average chain length was weaklycorrelated with climate and this is interpreted to be a function of multiple factors. We hypothesise that akey control is the shifting proportion of plant functional type between biomes, with a greater abundanceof succulent growth forms in the more arid Succulent Karoo (which tended to produce longer and lessdispersed n-alkane chain length distributions), differentiating this biome from the Fynbos, in whichwoody shrubs are more dominant. Inter-biome variability was also apparent, with some same taxonomicor functional groups common to both biomes tending to produce longer chain length n-alkane distribu-tions under more arid conditions. There was, however, considerable individual plant variability and weobserved both insensitivity to environmental conditions (i.e. consistent n-alkane distributions) andmarked variability in chain length distributions.
A key finding is the high yield of n-alkanes from multiple succulent plants, many of which use the CAMphotosynthetic pathway. Compound specific d13C/dD analyses (e.g. estimates of C3 and C4 biomass) forregions with potential succulent plant contributions should therefore be carried out cautiously.
� 2013 Elsevier Ltd. All rights reserved.
1. Introduction
Leaf waxes comprise complex mixtures of fatty acids, n-alkanes(C21–C35), n-alkanols (C20–C32), aldehydes and wax esters, which
form a protective barrier around plant leaves (Jenks and Ashworth,1999). They are hypothesised to serve various specific functions,including internal water retention, external water repellence andprotection from UV radiation and pathogens (Jenks and Ashworth,1999; Shepherd and Griffiths, 2006). Wax abraded or ablated to theatmosphere is replaced throughout a plant’s life (Conte et al.,2003), potentially very quickly (Gao et al., 2012). As a result, waxes
0146-6380/$ - see front matter � 2013 Elsevier Ltd. All rights reserved.http://dx.doi.org/10.1016/j.orggeochem.2013.12.004
⇑ Corresponding author. Tel.: +44 (0)1162523851; fax: +44 1162523854.E-mail address: [email protected] (A.S. Carr).
Organic Geochemistry 67 (2014) 72–84
Contents lists available at ScienceDirect
Organic Geochemistry
journal homepage: www.elsevier .com/locate /orggeochem

Author's personal copy
are widely distributed in the environment and are commonly acomponent of atmospheric aerosols (Peltzer and Gagosian, 1989;Conte and Weber, 2002).
Leaf waxes are preserved in a range of sedimentary and geolog-ical contexts, and n-alkanes have attracted particular interest forpalaeoenvironmental research as they are both relatively recalci-trant in the sedimentary context (i.e. high preservation potential)and amenable to compound specific stable carbon and hydrogenisotope analysis (e.g. Feakins et al., 2005; Schefuß et al., 2005;Sachse et al., 2012). Such data have been used to infer past changesin the abundance of plants using the C3 and C4 pathways (Collisteret al., 1994; Boom et al., 2002) or to assess palaeo-hydrologicalchange (e.g. Niedermeyer et al., 2010). Various studies have consid-ered spatial, temporal and botanical patterns in the distributions ofn-alkane homologues (i.e. the relative proportions of the differentn-alkane homologues, usually C21–C35). Such patterns have alsobeen considered in sedimentary contexts and used to infer palaeo-environmental or palaeoecological change (inter alia, Poynter et al.,1989; Ficken et al., 2000; Schwark et al., 2002; Zhang et al., 2006;Bai et al., 2008).
Given the functions of leaf waxes, it is reasonable to assumethat their synthesis is, at least to some extent, regulated and opti-mised by plants (Conte et al., 2003; Shepherd and Griffiths, 2006).However, the underlying significance of changes in n-alkane distri-butions is often not simple to interpret (Dodd and Afzal-Rafii,2000; Bush and McInerney, 2013). In particular, the question ofwhether or not leaf wax distributions provide chemotaxonomicinformation has long been debated and there have been numerousattempts to link carbon chain length distributions to specific plantspecies, genera or plant functional type (Maffei, 1996), as well asdifferent photosynthetic pathways (e.g. Rommerskirchen et al.,2006a). However, it remains rather unclear to what extent changesin leaf wax composition within palaeoenvironmental archives canbe interpreted in terms of shifts in the relative proportions of dif-ferent plant functional types or plant species and/or the response(i.e. adjustment in leaf wax composition) of a plant communityto environmental conditions. For example, distinct shifts in n-al-kane and n-alkanol chain length are seen in north–south transectsin southwest Africa. They are associated with the transition fromtropical rainforest to savannah (Vogts et al., 2009) and the patternis mirrored in wax components transported offshore to the south-east Atlantic (Rommerskirchen et al., 2003; Vogts et al., 2012).However, resolving the processes driving such patterns, and thusthe (palaeo)environmental significance of records obtained fromthe same area (e.g. Rommerskirchen et al., 2006b; Maslin et al.,2012), is difficult because the patterns in modern atmosphericaerosols conflate changing environmental conditions and changingplant species/functional type. A recent meta-analysis of n-alkanedistributions from > 2000 specimens highlighted the great variabil-ity in leaf wax n-alkane production and distribution, suggestingthat there is a need for caution when interpreting leaf wax distri-butions (Bush and McInerney, 2013). Comparative data concerningleaf wax concentration/production are less often reported (Bushand McInerney, 2013), but the importance of the issue for theinterpretation of sedimentary archives has recently been demon-strated (Diefendorf et al., 2011).
Here we have built on such analyses to present a detailed casestudy that tracks patterns in leaf wax distribution within and be-tween two arid zone biomes in South Africa. It was anticipatedthat, in arid environments, where stomatal conductance is lowfor a greater proportion of the time, water loss through the cuticlewould be of increased significance (Shepherd and Griffiths, 2006).Hence, there would be environmental pressure for plants to opti-mise their wax composition (e.g. Macková et al., 2013). Droughtadaptation is of further interest as the Succulent Karoo is re-nowned for an abundance of stem and leaf succulents, many of
which utilise the crassulacean acid metabolism (CAM) pathway(Mooney et al., 1977; Rundel et al., 1999). Leaf wax distributionsfrom CAM plants (which include > 10,000 angiosperm speciesand ca. 7% of vascular plants) have received relatively little study(cf. Maffei et al., 1997; Feakins and Sessions, 2010; Boom et al.,2014). Many terrestrial CAM plants are drought-adapted and havethick, waxy cuticles that potentially yield high leaf wax concentra-tion (Eglinton et al., 1962; Maffei et al., 1997). In large parts of theSucculent Karoo, they are the dominant growth form/functionaltype and their contribution to, and influence on, various marinesedimentary archives in the region (e.g. Rommerskirchen et al.,2006a; Maslin et al., 2012), as well as emerging terrestrial palaeo-environmental archives (Carr et al., 2010; Chase et al., 2012), ispoorly defined.
We also sought to address a ‘‘scale gap’’ that exists between theanalysis of individual plants (e.g. Maffei, 1996; Vogts et al., 2009;Bush and McInerney, 2013) and the integrated signals that charac-terise atmospheric aerosols (e.g. Huang et al., 2000; Vogts et al.,2012), lake basin sediments (Castañeda et al., 2009) and marine ar-chives (Schefuß et al., 2005). This was achieved via the combinedanalysis of plant specimens and local soils sampled across thestudy area. There have been relatively few studies that directly linkdata from plants and associated soils (cf. Otto and Simpson, 2005),but soils are a potentially significant store and source of (re-worked) wax, both to atmospheric aerosols (e.g. Poynter et al.,1989) – particularly in desert regions – and via runoff within catch-ments (Schefuß et al., 2005). This step is thus pertinent for the useof leaf wax component distributions in palaeoenvironmentalreconstruction, not only in terms of understanding and assessingthe influence of post-depositional diagenesis (e.g. Buggle et al.,2010), but also in terms of understanding the effect of differencesin leaf wax production between plant species, genera or plant func-tional type.
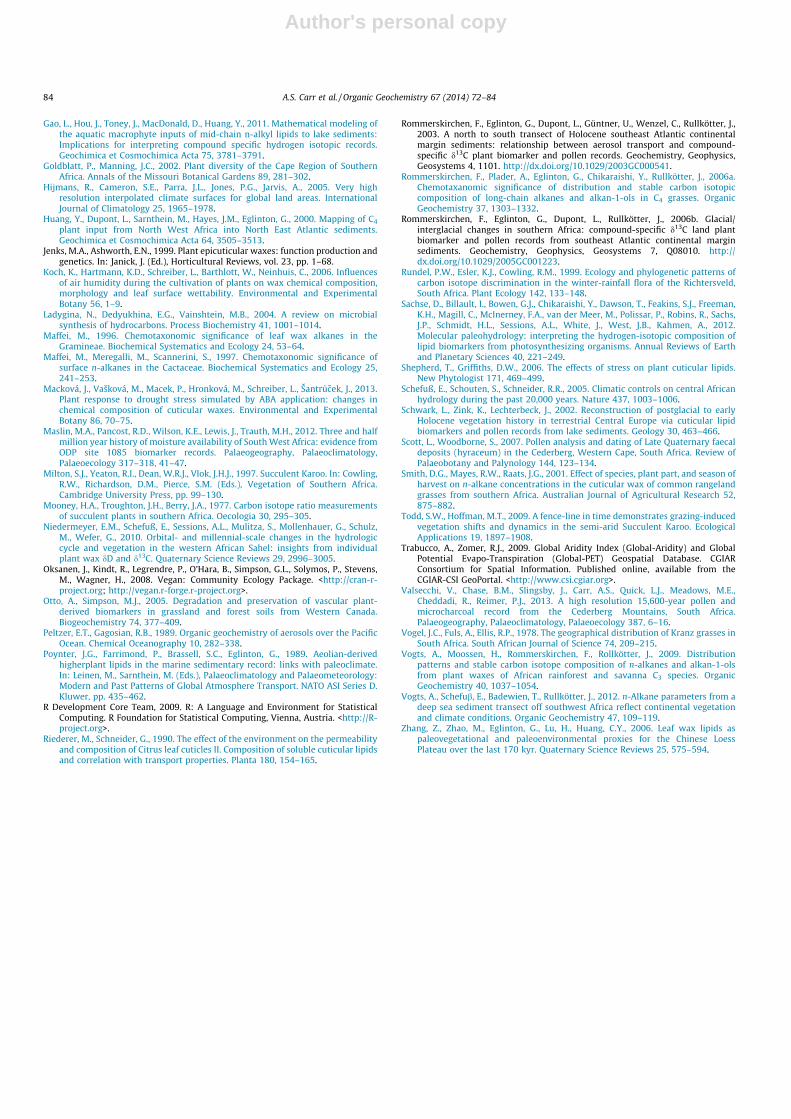
We present a data set comprising 215 samples of modern plantsand 93 soils from the Succulent Karoo and Fynbos biomes of south-west South Africa (Fig. 1). The environmental (climatic andedaphic) gradients in the region, as well as the occurrence of sev-eral cosmopolitan plant species throughout the study area allowedus to consider both biome-scale differences in leaf wax n-alkanedistributions and some chemotaxonomic responses. Overall, theaims were to:
(i) Characterise the n-alkane leaf wax yield/concentration forcontemporary plants and soils across the dryland biomesof South Africa.
(ii) Assess whether the major biomes/associated eco-regions/plant functional type in the sampling area produce charac-teristic n-alkane leaf wax concentrations and distributions.
(iii) Assess the extent to which comparable plant leaf wax signa-tures are preserved within the extractable lipids of theregion’s soils.
(iv) Assess the significance of the results for application of leafwax distributions as palaeoenvironmental proxies in south-ern Africa and for the interpretation of compound-specificstable isotope analysis.
2. Material and methods
2.1. Study area
The study area encompasses the Fynbos (part of the Cape Floris-tic Region; CFR) and Succulent Karoo biomes of South Africa(Fig. 1). Fynbos is a Mediterranean-type shrubland occupying ca.90,000 km2 at the southwest tip of South Africa. It exhibits someof the highest levels of plant diversity and endemism in the world(Goldblatt and Manning, 2002) and is characterised by
A.S. Carr et al. / Organic Geochemistry 67 (2014) 72–84 73

Author's personal copy
sclerophyllous proteoid shrubs, small-leaved ericoid shrubs (dom-inantly from the Ericaceae family), Cape reeds (Restionaceae) and adiverse array of geophytes from the Liliaceae and Iridaceae families(Cowling et al., 1997). The vegetation is for the most part structur-ally uniform and characterised by an absence of trees. It is adaptedto summer drought, frequent burning and low nutrient soil (Cowl-ing and Holmes, 1992). Fynbos is broadly divided into two majoreco-regions: Lowland Fynbos, found on the coastal plains (often lo-cally referred to as ‘‘Sandveld’’), and Montane Fynbos, associatedwith the uplands of the Cape Fold Belt Mountains (Campbell andWerger, 1988). Mean annual rainfall in the Fynbos Biome is vari-able and is strongly influenced by the topography of the Cape FoldBelt Mountains (Fig. 1). At the southern limit of the study area(Lowland Fynbos) mean annual rainfall is ca. 480 mm/yr, >95% ofwhich falls during the austral winter. As such, apart from someCAM species, all Fynbos plants, including grass, use the C3 pathway(Vogel et al., 1978).
The Succulent Karoo occupies > 100,000 km2 (Cowling and Hil-ton-Taylor, 1999). Its vegetation is also distinguished by the lim-ited occurrence of trees and large shrubs, and it experiences awinter rainfall climate regime. As a result, it shares some affinitywith the Fynbos Biome (Born et al., 2006). Summer aridity – andtherefore growing season length – is, however, a key environmen-tal factor (along with geological substrate) differentiating thesebiomes, with the Succulent Karoo generally being more arid andexperiencing higher summer temperature (Cowling et al., 1997).At the northern limit, mean annual rainfall is ca. 160 mm/yr andrainfall seasonality is markedly reduced (ca. 50% during australwinter; Fig. 1). Rainfall is, however, unusually reliable for a desertecosystem (Cowling et al., 1999). Mean annual temperature rangesbetween 14 and 19 �C, with summer temperature ranging between27 and 34 �C (Hijmans et al., 2005). As a result of these relativelyarid conditions, there is a greater occurrence of drought-adaptedspecies and the Succulent Karoo is renowned for a high concentra-tion of leaf succulents and dwarf shrubs from the Aizoaceae, Cras-sulaceae and Euphorbiaceae families (Milton et al., 1997; Cowling
and Hilton-Taylor, 1999). Many use CAM photosynthesis (Rundelet al., 1999) and are characterised by other (some relatively unu-sual) drought adaptations, such as a predominance of dwarf succu-lence and shallow rooting systems (Cowling et al., 1999), alongwith more common drought adaptations such as thick, waxycuticles.
2.2. Field sampling
Sampling was carried out in April 2010 and September 2011(Supplementary material, Tables S1 and S2). Sample plots wereplaced across the north–south climate gradient in the Fynbos/southern Succulent Karoo biomes as well as across an east–westgradient from the coast, across the Cape Fold Belt Mountains intotheir rain shadow and the Fynbos/Succulent Karoo ecotone(Fig. 1). All material was obtained from detailed 10 � 10 m vegeta-tion survey plots. Small samples of fresh leaf or photosyntheticmaterial (e.g. stem succulents) were obtained from each plantwithin the survey plot and were identified with reference to her-barium material at the University of Cape Town. Assignment togenus and species was not always possible, particularly for somefamilies (notably Aizoaceae) and for specimens for which flowermaterial could not be found in the field. All plants were, however,further classified into five plant functional types. Soil samples(200–400 g) were obtained from the upper 10–15 cm of the soil(i.e. the A horizon, with the litter layer first removed) from 4 fixedlocations within each plot (see Carr et al., 2013 for further details).It was anticipated that the leaf wax preserved within the soils [spe-cifically the soil organic matter (SOM), not fresh leaf litter] wouldprovide an opportunity to consider the extent that survey plot/eco-region/biome-averaged plant leaf wax n-alkane signaturesare represented in local SOM. It was hypothesised that the soilsamples would integrate larger spatial and temporal scales andtherefore be less susceptible to potential sampling bias caused byannual/seasonal variation in wax production.
Montane FynbosLowland Fynbos
Nama KarooSucculent Karoo
PDryQ (mm)100755025
0
Precipitation during the driest quarter (mm)
Lowland FynbosSucculent Karoo Montane Fynbos
0 25 50 75 100 125 150 175 200 2250
400800
1200160020002400280032003600
Freq
uenc
y
0 25 50 75 100 125 150 175 200 2250
300060009000
1.2E041.5E041.8E042.1E042.4E042.7E04
Freq
uenc
y
0 25 50 75 100 125 150 175 200 2250
50010001500200025003000350040004500
Freq
uenc
y
Aridity index0 2400 4800 7200 9600
0300600900
120015001800210024002700
Freq
uenc
y
0 2400 4800 7200 96000
300600900
120015001800210024002700
Freq
uenc
y
0 2400 4800 7200 96000
20004000600080001E04
1.2E041.4E041.6E041.8E04
Freq
uenc
y
Lowland FynbosSucculent Karoo Montane Fynbos
10000750050002500
0
Aridity index
Fig. 1. Distribution of biomes and major eco-regions in south west South Africa, along with sample site locations (upper diagram). The field codes for the sites relate to thedifferent biomes/eco-regions and are as follows: SK, Succulent Karoo; FB, Montane Fynbos and SV, Lowland Fynbos (often referred to locally as ‘‘Sandveld’’). The lower twodiagrams provide contextual information on climatic conditions across the study area, specifically, precipitation of the driest quarter and aridity index (after Trabucco andZomer, 2009). Note the broader (and overlapping) distributions of climatic conditions in the two Fynbos eco-regions compared with the Succulent Karoo, which occupies amuch narrower range of climatic conditions. The Montane Fynbos sites represent the relatively drier end of spectrum of conditions under which this eco-region is found.
74 A.S. Carr et al. / Organic Geochemistry 67 (2014) 72–84

Author's personal copy
2.3. Sample preparation and extraction
All samples were stored in paper bags and immediately airdried at the University of Cape Town prior to shipping to the UK,whereupon they were freeze-dried. In total, from 26 survey plotsacross the study area, 133 plants from the Succulent Karoo, 54plants from the Montane Fynbos eco-region and 28 plants fromthe Lowland Fynbos eco-region, along with 102 soil samples fromacross the whole study region were analysed (Fig. 1). Sample prep-aration and analysis were conducted at the University of LeicesterEnvironmental Stable Isotope Laboratory. In most cases plantleaves were removed for analysis, with stem material and/or flow-ers excluded. Exceptions included stem succulents such as Euphor-bia mauritanica and some grass samples where whole specimenshad to be processed in order to obtain sufficient leaf wax yield.Sub-samples of the air-dried soils were sieved at 2 mm to removeclasts and leaf litter/roots, freeze dried and homogenised. Ca. 0.5 gpowdered leaf material and ca. 25 g soil, along with 5a-cholestaneas a standard were subject to Soxhlet extraction [24 h; in hexane/CH2Cl2/MeOH, 1:2:2). Each extract was rotary evaporated and puri-fied over a Na2SO4 column. The apolar fraction was obtained viaAl2O3 column chromatography, eluted using hexane/CH2Cl2 (9:1).
2.4. Gas chromatography-mass spectrometry (GC-MS)
GC was carried out with a Perkin Elmer Clarus 500 GC-MSinstrument equipped with a CP-Sil 5CB-MS(30 m � 0.25 mm � 0.25 lm) column. The GC oven programmewas: 60 �C to 120 �C at 20 �C/min, then to 310 �C (held 15 min) at4 �C/min. Components were assigned on the basis of mass spectraand retention times. Retention times were confirmed with anauthenticated standard. Absolute concentrations were determinedin Turbomass 5.2.0 using the peak areas of the n-alkanes and thatof the internal standard. Response factors for the standard andeach n-alkane homologue were determined using an authenticatedstandard (C7–C40). Linearity between peak area and concentrationwas checked for all n-alkanes in the concentration range 0–500 lg/mg.
2.5. Data analysis
Using the concentration data, various indices were used to char-acterise the n-alkane distributions. The carbon preference index(CPI) was calculated using the following equation:
CPI23—33 ¼12
C23 þ C25 þ C27 þ C29 þ C31 þ C33
C22 þ C24 þ C26 þ C28 þ C30 þ C32
� �
þ C23 þ C25 þ C27 þ C29 þ C31 þ C33
C24 þ C26 þ C28 þ C30 þ C32 þ C34
� �ð1Þ
where Cx is the concentration of the n-alkane with x carbons. Distri-butions exhibiting odd/even preference have CPI > 1, which is con-sidered indicative of a terrestrial plant leaf wax origin and/orlimited diagenesis and/or no petroleum contamination.
The average chain length (ACL21–35) was calculated as per Eq.(2) following Poynter et al. (1989):
ACL21—35 ¼21 � C21þ23 � C23þ25 � C25þ27 � C27þ29 � C29þ31 � C31þ33 � C33þ35 � C35
C21þC23þC25þC27þC29þC31þC33þC35
ð2Þ
where Cx is the concentration of the n-alkane (C) with x carbons.Dispersion (d) around the weighted average N (i.e. the spread in
the n-alkane distribution) was calculated following Dodd andAfzal-Rafii (2000). Here the weighted mean chain length (N) forall detected n-alkanes is:
N ¼Xð%CnnÞ=100 ð3Þ
from which dispersion is calculated as:
d ¼X
%Cnðn� NÞ2 ð4Þ
where n is the number of carbons (C21–C35). The ratio d/N is of rel-evance to consideration of lipid phase transition. Lipid distributionsthat are longer and narrower (i.e. low d/N) are anticipated to have ahigher melting point to maintain their crystalline structure (Rieder-er and Schneider, 1990; Shepherd and Griffiths, 2006).
Various studies have also found the ratio between the C29 andC31 n-alkanes (Norm31) to be an environmentally sensitive param-eter. This is calculated as follows:
Norm31 ¼ C31=ðC31 þ C29Þ ð5Þ
where Cx is the concentration of the n-alkane (C) with x carbonsWe also used multivariate analysis to consider inter-/intra-
biome variability in leaf wax distribution. The analysis was compli-cated by the strongly non-normal distributions of the proportionsof the different n-alkane homologues (tested using a Wilks-Shapirotest). Consequently, non-metric multidimensional scaling (NMDS)was used as a non-parametric ordination approach to explore theunderlying structure in the data. The technique uses measures ofdissimilarity to graphically represent the relationships betweensamples in multidimensional space. The use of rank order similar-ity makes fewer assumptions concerning data structure (Clarke,1993). Analysis was performed on the C27–C33 data (present inevery sample). The data were square root transformed using Wis-consin double standardization, and dissimilarity between sampleswas measured using the Bray–Curtis index (Bray and Curtis, 1957).Three dimensional NMDS (stress 0.038) was subsequently per-formed on the dissimilarity matrix using 9999 random starts toavoid local minima and reach a stable solution. The output NMDSdata space was rotated via principal components analysis so thatthe first axis expressed the maximum amount of variation in n-alkane distribution (Clarke, 1993). The significance of biome indetermining the distribution of individual samples in ordinationspace was also tested. Ordination was undertaken using the VE-GAN package in R (Oksanen et al., 2008; R Development Core Team,2009). In addition, climatic data for the study sites were obtainedfrom WorldClim 1.4 (Hijmans et al., 2005), with site aridity indicesderived following Trabucco and Zomer (2009).
3. Results
The apolar lipid fraction from fresh plant material revealed asuite of compounds typical of plant leaf waxes (e.g. Jenks and Ash-worth, 1999), including n-alkanes as dominant components, alongwith iso-alkanes, alkenes and wax esters (>C35) in subordinateamounts. Data pertaining to the n-alkane yield are presented inTable S2.
3.1. Leaf wax n-alkane concentration and distributions from plants
Long chain n-alkanes occurred in all plant samples and spanneda range from C21 to C37. C36 and C37 homologues were occasionalfound in very low concentration (<1% of total n-alkanes), whileshort chain (<C24) homologues were detected in very low concen-tration. The total yield was extremely variable, ranging between0.009 mg/g dry weight (dw) and 32.5 mg/g dw (Table 1). The distri-bution was highly skewed, particularly for the Succulent Karoospecimens (Fig. S1). The majority (90%) of plants in the study areaafforded 5 mg/g dw (mode 1 mg/g dw), consistent with previousstudies (e.g. Vogts et al., 2009). However, some specimens withhigh n-alkane yield were found. All were succulents from the Eur-phorbiaceae and Aizoaceae families. The lowest concentration wasfound in plants from the Restionaceae family (ca. 0.01 mg/g dw). In
A.S. Carr et al. / Organic Geochemistry 67 (2014) 72–84 75

Author's personal copy
terms of plant functional type, succulents and woody succulentsgave on average the largest (but also the most variable) amount(Table 1).
ACL21–35 ranged from 25.5 to 33.4, while CPI ranged between3.58 and 139, i.e. an odd preference, consistent with recent studies(Bush and McInerney, 2013). As with the n-alkane concentration,the distribution of CPI values was highly skewed. High values wererare, with the majority of plants (>90%) having CPI between 3 and40 (mode 15). Those with the highest values (Psilocaulon junceumand Aizoon sp.) were associated with distributions dominated bya single homologue (C31). The lowest values were clearly associ-ated with the broadest n-alkane distributions, with dispersionand CPI negatively correlated (Fig. 2). Succulent Karoo plantstended to exhibit lower dispersion (d) than plants from the Fynbos(Table 2 and Fig. 2).
Biome/eco-region averaged leaf wax distributions are shown inFig. 3. In the Succulent Karoo Cmax for the majority of plants was atC31 (81% of specimens), followed by C33 (10%) and C29 (3%). Onespecimen maximised at C35. For the Montane Fynbos eco-regionmost plants had Cmax at C29 (28%) or C31 (43%), with the shorterhomologues (C25–C27) markedly more common than the SucculentKaroo (Fig. 3).
The Lowland Fynbos specimens produced distributions inter-mediate between Succulent Karoo and Montane Fynbos, with themajority exhibiting Cmax at C31 (61%), but with a significantproportion maximising at C29 (29%). ACL21–35 thus increased from
Montane Fynbos (28.7 ± 2.0) to Lowland Fynbos (29.3 ± 1.7) to Suc-culent Karoo (30.7 ± 1.7). The Norm31 ratio followed a similartrend, increasing from 0.49 ± 0.28 for Montane Fynbos to0.57 ± 0.31 for Lowland Fynbos, rising to 0.84 ± 0.17 for SucculentKaroo (Table 2). Succulent Karoo plants were significantly differentfrom the two Fynbos eco-regions (Kruskal Wallis test, p < 0.001) forall of the parameters derived using Eqs. (1)–(5). The Lowland andMontane Fynbos eco-regions were not significantly different forany parameter. It is also important to note the high standard devi-ation associated with the biome-averaged data, reflecting signifi-cant inter-specimen variation in the dataset as a whole.
The ordination analysis revealed that the largest differences inn-alkane composition (reflected in the first two axes of the rotatedNDMS) were driven by the significance of C27–C29 relative to C31
and C33 in the individual distributions (Fig. 4). There was also aclear role for C33 in distinguishing a significant proportion (butnot all) of the Succulent Karoo plants. The third axis separatedC25 from the other homologues (data not shown). The average ordi-nation scores for each biome are represented by the centre of eachellipse in the ordination space in Fig. 4, illustrating the separationof the Succulent Karoo from the two closely associated Fynbos eco-regions. The goodness of fit (r2 = 1 � SSw/SSt, where SSw and SSt arethe within-group and total sums of squares) was used to considerthe separation of individual biomes. The results suggest that biometype explains a statistically significant, but low proportion of thetotal variation in the dataset (r2 0.23, p < 0.001 based on 999permutations). This, in conjunction with the overlap of the 95%confidence intervals (Fig. 4), further illustrates the considerablevariation associated with individual specimens. On the basis ofthese data it would therefore be difficult to confidently assign anunknown specimen to a single biome, other than perhaps one char-acterised by a very short or a very long n-alkane distribution. Bushand McInerney (2013) recently reported similar results.
3.2. Individual variability: cosmopolitan species
As illustrated in Fig. 4, there was significant variability in indi-vidual plant n-alkane distribution. Disentangling the causes of suchvariability is challenging, but one obvious approach is to considerindividuals of the same species across the study area and associ-ated climatic gradients (e.g. Dodd et al., 1998; Dodd and Poveda,2003). Unfortunately, in this study there were relatively few spe-cies common to multiple sampling plots. This reflects the high spe-cies turnover in and between the biomes (Cowling et al., 1997,1999). Two cosmopolitan species, Galenia africana (Aizoaceae)and Salsola tuberculata (Chenopodiaceae) were, however, identi-fied. G. africana is the most widespread and occurred in sites withmean annual rainfall ranging from 180 mma to > 300 mm/a (arid-ity index from 1200 to 1900 – equivalent to half of the total aridityindex variability in the study area). Despite this, G. africana pro-duced quite consistent chain length distributions, characterisedby co-dominant C29 and C31 homologues, low dispersion and highCPI values (Fig. 5). Six specimens of S. tuberculata were sampledfrom sites spanning a narrower climatic range (mean annual rain-fall 157–217 mm/yr and aridity index 980-1390), including twospecimens from the same sample plot (SK4). In contrast toG. africana, Salsola produced highly variable n-alkane distributions(Fig. 5). These were highly dispersed, spanned the range C21–C33
and maximised at either C25 or C31. CPI values were lower andmore variable. Due to the low replicate numbers it would be highlyspeculative at correlate the distributions for individual S. tubercu-lata specimens with climatic parameters, but the rather limitedenvironmental range over which this species was sampled impliesthat some of the variability may represent (a) response(s) to micro-scale soil conditions and thus flexibility in leaf wax synthesis.
Table 1n-Alkane concentration averaged (with standard deviation) per biome and per plantfunctional type for plant samples and averaged per biome for soil samples. Thenumber of samples is in parentheses. The PFT averages exclude 4 unassignedspecimens (i.e. n = 211).
Total n-alkane content (mg/g dry plant wt.)Succulent Karoo (133) 2.82 ± 5.15Montane Fynbos (54) 0.65 ± 1.11Lowland Fynbos (28) 0.51 ± 0.82
Grass (6) 0.81 ± 1.07Herb (19) 0.57 ± 1.15Woody shrub (93) 1.10 ± 2.55Succulent (23) 2.73 ± 4.71Woody Succulent (70) 3.34 ± 5.94
Total n-alkane content (lg/g dry soil wt.)Succulent Karoo (53) 2.95 ± 3.84Montane Fynbos (21) 2.67 ± 2.83Lowland Fynbos (19) 1.37 ± 1.38
Fig. 2. Relationship between CPI and n-alkane dispersion (‘‘d’’, following Dodd andAfzal-Rafii, 2000) presented by biome/eco-region.
76 A.S. Carr et al. / Organic Geochemistry 67 (2014) 72–84

Author's personal copy
3.3. Plant families
Grouping the plants by family allowed some limited consider-ation of chemotaxonomic patterns. Ten families had six or morerepresentatives across the study area. Considering the associatedstandard deviations, the results suggest that n-alkane distributionscannot be considered diagnostic for these families (Fig. 6). Theplots do, however, broadly indicate that the families associatedwith succulent growth forms (Euphorbiaceae, Crassulaceae, Aizoa-ceae) tend to be dominated by C31 and C33. The Poaceae samples,consistent with previous findings (Smith et al., 2001; Rommerskir-chen et al., 2006a; Bush and McInerney, 2013) were also associatedwith a higher proportion of the longer chain length homologues(avg. ACL21–35 31.2 ± 0.5). The Aizoaceae (60 specimens) was thebest represented family and, with the exception of G. africana, allwere succulents. Although on average Aizoaceae were associated
with relatively high ACL and low dispersion (avg. ACL21–35
31.4 ± 0.8, average dispersion 1.42 ± 0.9), in detail they showedsome variability. For example, the three specimens of Cephalophyl-lum sp. were all co-dominated by C31 and C33, as were specimens ofRuschia burtoieae, Ruscia tumidula and Ruschia stricta. However, oneRuschia sp. sample produced a single large peak at C31, whileAntimima sp. (also Aizoaceae) maximised at C33.
3.4. Plant functional type
As it was not possible to identify all specimens to generic andspecies level, the samples were also classified into plant functionaltypes, which allowed the data to be considered in the context of aplant’s broader ecophysiology (Table S1). The plants were groupedinto one of five broad PFTs (modified from Todd and Hoffman,2009). This is a rather coarse division (cf. the more detailed
Table 2n-Alkane distribution descriptive parameters [see Eqs. (1)–(5)] averaged (with standard deviation) per biome/eco-region for both plants and soils (ND, not determined).
Biome/eco-region Number of samples CPI23–33 ACL21–35 ACL27–33 Dispersion (d) d/Na Norm31 C31/(C29 + C31)
Succulent Karoo Plants 133 27 ± 19 30.7 ± 1.7 31.0 ± 0.77 2.04 ± 1.98 0.07 ± 0.07 0.84 ± 0.17Succulent Karoo Soils 53 12 ± 4 30.4 ± 0.75 31.0 ± 0.36 6.94 ± 3.46 ND 0.83 ± 0.08
Montane Fynbos Plants 54 18 ± 19 28.7 ± 2.03 29.7 ± 0.87 3.47 ± 2.52 0.12 ± 0.09 0.49 ± 0.28Montane Fynbos Soils 21 9 ± 5 27.9 ± 1.58 29.7 ± 0.93 7.99 ± 1.51 ND 0.52 ± 0.14
Lowland Fynbos Plants 28 18 ± 10 29.3 ± 1.70 30.0 ± 0.91 3.17 ± 2.02 0.11 ± 0.17 0.57 ± 0.31Lowland Fynbos Soils 19 10 ± 2 29.3 ± 0.71 30.2 ± 0.47 8.46 ± 2.55 ND 0.60 ± 0.18
a Calculated only for plant material (i.e. fresh/unaltered wax).
Fig. 3. Panel A: Biome/eco-region average n-alkane distributions, with standard deviation plotted. Panel B: Box and whisker plots for the four main n-alkane distributiondescriptive parameters.
A.S. Carr et al. / Organic Geochemistry 67 (2014) 72–84 77

Author's personal copy
division of Todd and Hoffman, 2009), but it was considered suffi-cient to both distinguish the main plant physiologies/form and toretain (given the variability for individual plants) a significantnumber of specimens within each category. When aggregated byPFT (Fig. 7) the various homologue descriptors revealed clear dis-tinction of the grasses, succulents and woody succulents fromwoody shrubs and to a lesser extent, herbs (latter PFT highly vari-able). This implies that the greater abundance of woody shrubs inthe Fynbos Biome, particularly the Montane Fynbos sites, alongwith an absence of grasses and the rarer occurrence of succulents,
can explain some proportion of the differences between the biome-averaged distributions. Succulents and grasses tended to be associ-ated with higher ACL and lower dispersion, while the herbs (in theFynbos) and woody shrubs were associated with lower ACL andmore dispersed chain length distributions. It was also apparentthat for those PFTs found in multiple biomes/eco-regions (herbs,woody shrubs and woody succulents), the average values for CPIand ACL tended to be higher (dispersion lower) in the SucculentKaroo. Thus, for the same PFT, plants in the Succulent Karoo, onaverage, produced longer n-alkane distributions. This was mostapparent for the herbs and woody shrubs (Fig. 7).
3.5. n-Alkane concentration and distribution in soils
The concentration of SOM in the region is generally low (Carret al., 2013) and 9 of 102 original soil samples had insufficient n-alkanes for analysis. The n-alkane concentration was markedlylower than for the plant material, ranging between 0.1 and c. 20 lg/g soil dw (Fig. S1), i.e. highly variable and, as seen in the plants,the distribution of n-alkane yields was positively skewed. This issignificant in the Succulent Karoo samples, which produced thehighest soil concentration, both on average and in terms of maxi-mum values (Fig. S1). Average concentration was lowest in theLowland Fynbos (Table 1). CPI values in the soils were consistentlylower than those in the plants (Table 2), although they all retaineda strong odd preference and so were not therefore suggestive ofhydrocarbon contamination (Bray and Evans, 1961). Shorter chainlength (C21–C24) homologues were more prominent in the soils,averaging 16%, 10% and 7% of the total n-alkane yield, vs. 3%, 2%and 1% in the plants (Montane Fynbos, Lowland Fynbos and Succu-lent Karoo, respectively), which probably reflects some microbialcontribution (e.g. Ladygina et al., 2004).
The biome-average ACL21–35 values for soils increased fromMontane Fynbos (27.9 ± 1.58), to Lowland Fynbos (29.3 ± 0.71)and maximised in Succulent Karoo (30.4 ± 0.75). These values werevery similar to the plant averages (Table 2). The slightly lower val-ues for Succulent Karoo and Montane Fynbos probably reflectedthe increased prominence of the C21–C24 in the soils. For mostparameters, the biome average standard deviation was lower thanfor the plants, which is interpreted as indicative of spatial/tempo-ral averaging of the n-alkanes in the soils. When the n-alkane dis-tributions in the plants and soils were compared as plot averages(Fig. 8) there was a strong correlation (r2 0.66; p < 0.01; n = 24),particularly for ACL27–33. The correlation, although still positiveand significant (r2 0.45; p < 0.01; n = 24), was weaker for ACL21–35,reflecting the admixture of shorter homologues in the soils. Inter-estingly, CPI was not significantly correlated (r2 0.11; p 0.1), norwas there a correlation between average dispersion in soils andaverage dispersion in the associated plants. The Norm31 indexand ACL27–33 for the soils were, given the uncertainties, indistin-guishable from biome/ecoregion plant averages (Table 2). The nearidentical values for C27–C33 (Table 2) suggest that either the life-time of n-alkanes in the soils is either very short (i.e. removing po-tential for the soils to reflect seasonal or inter-annual variation inleaf wax composition), or that there is little to no seasonal variabil-ity in leaf wax distributions, or that leaf wax production domi-nantly occurs in a single season.
4. Discussion
4.1. Alkane production and variability in the Succulent Karoo andFynbos biomes
The leaf wax distributions from plants in the Fynbos and Succu-lent Karoo are consistent with numerous studies in revealing a
Fig. 4. Two dimensional NMDS ordination plots of n-alkane composition for thesampled biomes/eco-regions. The closer points plot together, the more similar theirn-alkane distributions. The variable score for each n-alkane is also plotted in theordination space (text in boxes). The ellipses represent the confidence limits for thebiome/eco-region averaged ordination scores. The average ordination score for eachbiome therefore lies at the centre of each ellipse. Solid line, Montane Fynbos; longdash, Lowland Fynbos; short dash, Succulent Karoo. Note the close overlap of theLowland and Montane Fynbos ellipses.
Fig. 5. Comparison of averaged n-alkane distributions for Salsola tuberculata (n = 6)and Galenia africana (n = 5). Standard deviation is also shown.
78 A.S. Carr et al. / Organic Geochemistry 67 (2014) 72–84

Author's personal copy
dominance of C27–C33 n-alkanes and strong odd preference(CPI > 1). Modal n-alkane yield, particularly from non-succulentgrowth forms, is comparable with other studies and angiospermsin general (Bush and McInerney, 2013 and references therein). Sev-eral succulent plants show some unusual features, most notablythe high CPI in some specimens which is in excess of ranges previ-ously reported for angiosperms (Bush and McInerney, 2013; Fig. 9).The highest values are seen in plants from the Aizoaceae and Mon-tiniaceae families. These plants also tend to produce high n-alkaneyield, which in some cases exceeds 10,000 lg/g (dw), but this is notalways the case (Fig. 9). Although the yields are high comparedwith other African vegetation communities (particularly grasses;e.g. Smith et al., 2001; Rommerskirchen et al., 2006a), Maffeiet al. (1997) reported an n-alkane concentration of 1–10 mg/g freshweight for various Cactaceae, and the dw concentrations here arealso comparable with several succulent Crassulaceae species fromarid areas of the Canary Islands (Eglinton et al., 1962). Thus, thefindings provide further evidence that lipid concentration for someplant types (in this case succulents) may be several orders of mag-nitude greater than other plant types (see also Diefendorf et al.,2011). Our data therefore suggest that such differences should becarefully considered in the application of plant biomarker proxiesto arid regions, or sites that might source n-alkanes from aridzones.
The data further suggest that on average there are clear biome-scale differences between n-alkane distributions in Succulent Kar-oo plants and plants in Fynbos Biome. The former tend to maximise
at longer chain length, have narrower distributions (lower d) andare more likely to be dominated by C31 and C33 (Fig. 3). The lattertend to maximise at shorter chain length, show greater dispersionand have a lower tendency for odd dominance. However, consider-able variation is apparent at the scale of individual plants, which isreflected in the large standard deviations and skewed distributionsof the biome-averaged descriptive parameters (Fig. 3). Interest-ingly, although the maximum values (and thus total range) forthe various descriptive parameters for the Succulent Karoo plantstend to be highest (i.e. there are some quite extreme values), theinter-quartile range for Succulent Karoo is actually smaller thanboth Fynbos eco-regions for three of the four parameters (Fig. 3).Such complexity and variability is underlined by the n-alkane dis-tributions obtained from the multiple G. africana and S. tuberculataspecimens, which demonstrate both consistency across the studyarea (G. africana), and enormous variability in closely related (geo-graphically) specimens/locations (S. tuberculata).
4.2. Relationship with climatic parameters
Across the study sites, mean annual temperature varies by5.5 �C, maximum temperature of the warmest month by 9 �C andmean annual precipitation by 326 mm/yr. We found no statisti-cally significant relationship between any n-alkane distributiondescriptor and any temperature-related parameter [includingmean annual temperature, maximum temperature of the warmestmonth or growing season (wettest quarter) temperature].
Fig. 6. Examples of average distributions for four families across the Fynbos (black) and Succulent Karoo (grey) biomes. Note that in each case the n-alkane distribution ischaracterised by longer chain length for plants sampled in the Succulent Karoo biome.
A.S. Carr et al. / Organic Geochemistry 67 (2014) 72–84 79

Author's personal copy
Considered in its entirety, the dataset shows a weak (r2 0.14) butsignificant (p < 0.01) relationship between ACL21–35 and aridity in-dex. The relationship is stronger (r2 0.21) when log aridity is usedand substantially stronger (r2 0.35) when a single outlier site (SV1)from the Lowland Fynbos is removed. The ACL27–33 data producevery similar results (r2 0.16 for all data, 0.22 for all data with logaridity and 0.28 with the removal of SV1). The reasons for siteSV1 being an outlier are unclear. CPI does not correlate with anyclimatic variable. These patterns are the same for both soil andplant data, with the former associated with higher r2 values andstatistical significance (Fig. S3), which presumably reflects greateraveraging of individual plant variation for the soil samples(Table 2).
When biomes are considered individually, the relationships be-tween rainfall/aridity and n-alkane distribution are no longer
significant. There is, however, a clear division between the two bio-mes (Fig. 10). When the data are plotted in terms of plant func-tional type it is apparent that the distinction at least partlyreflects differences in the predominant plant functional types be-tween the two biomes (Fig. 10). When individual plant functionaltypes are considered, the relationships between n-alkane distribu-tion and climate are also insignificant (though the small number ofreplicates for some PFTs should be noted). Thus, although at facevalue the total data set could be interpreted as indicating that ter-restrial leaf wax component distributions in western South Africaare weakly linked with aridity (Fig. 10), such a correlation is moreindirect, and is seemingly driven to some extent by the differencesin several key plant functional types along an environmental gradi-ent, particularly the lower significance of succulents relative towoody shrubs in the Fynbos Biome (Fig. S4). This does not mean
Fig. 7. n-Alkane distributions averaged by functional type. The associated PFT averaged ACL21–35 and CPI are shown, along with the standard deviation. Grey bars representspecimens from the Succulent Karoo biome and black bars specimens from the Fynbos biome.
80 A.S. Carr et al. / Organic Geochemistry 67 (2014) 72–84

Author's personal copy
that plants do not/cannot respond individually to their environ-mental conditions. Such additional variability is seen here to besuperimposed on the overall patterns in the dataset (Figs. 6 and7). For instance, in the PFTs common to both biomes there is a ten-dency to longer and less dispersed distributions for the specimensfrom the Succulent Karoo (Fig. 7). Furthermore, the data demon-strate that some plant species, such as S. tuberculata, are able to ad-just their leaf wax n-alkane composition substantially, while somespecies (e.g. G. africana) and some families (Aizoaceae) show muchless variability. It is known that fluctuation in leaf wax concentra-tion and composition can be induced experimentally in response todrought (e.g. Koch et al., 2006; Macková et al., 2013). In naturalhabitats, Dodd et al. (1998) demonstrated an increased abundanceof the longest chain length homologues with increasingly arid con-ditions in the leaf wax of Austocedrus chilensis. We cannot resolvesuch trends in terms of an individual species, but we do see sometendency for succulent plants/plants in the Succulent Karoo to bemore frequently associated with the longer chain length distribu-tions. C33, in particular, is much more significant in succulents(Figs. 3 and 4).
Various hypotheses concerning specific controls on leaf wax li-pid distributions have centred on their role as a protective coating,particularly in terms of water retention (i.e. a hydrophobic coating
to limit non-stomatal water loss). Given such a role, a response toaridity and/or temperature would be anticipated (Riederer andSchneider, 1990; Dodd et al., 1998; Shepherd and Griffiths,2006). Riederer and Schneider (1990) proposed a model in whichhydrocarbon distribution in leaf waxes is optimised such thatwater loss is minimised by the co-alignment and organisation ofhydrocarbon molecules. Concerning lipid phase transition, it isanticipated that hydrocarbon melting point would increase withchain length (i.e. the melting point of C31 n-alkane is nearly 9 �Chigher than for C27) and that hydrocarbon mixtures would influ-ence the temperature range of phase transition (Shepherd andGriffiths, 2006). Thus, a low d/N ratio is associated with a highcystallinity and is more resistant to phase transition with risingtemperature (Shepherd and Griffiths, 2006). Our data suggest anassociation between succulence (i.e. drought adaptation) and highACL/low dispersion n-alkane distribution and a (weaker) associa-tion between aridity and longer chain length, which is consistentwith these mechanisms. Similarly, Eglinton et al. (1962) presentedn-alkane distributions for > 60 plants from the Crassulaceae family,including several succulent plant forms. These plants also tendedto exhibit high ACL, low dispersion and high CPI distributionswhich, in conjunction with high n-alkane yield, are consistent withour findings in implying that n-alkane distributions are optimisedfor water retention in some succulent plants.
4.3. Implications for palaeoenvironmental reconstruction
This study has several implications for the use of leaf wax dis-tributions as palaeoenvironmental proxies. The comparison of thesoil and plant data indicates that, although n-alkane concentrationin soils is often low, the distributions, particularly when the longerhomologues are considered, show a close correspondence with lo-cal plants. This implies that a signal representative of local plantcommunities is retained within local soils, including the stronglypositively skewed distribution of n-alkane concentration in theSucculent Karoo Biome (Fig. S1). We would therefore anticipatethat (excluding the potential influence riparian vegetation in wet-land and lake contexts; e.g. Gao et al., 2011) representative leafwax distributions ought to be preserved in local sedimentary andpalaeoecological archives. Some preliminary data from the studyregion are consistent with this statement (see Carr et al., 2010,Table 3).
However, the results also indicate that there is significant vari-ability in leaf wax lipid yield from plants (cf. Diefendorf et al.,2011). In this respect, the tendency of the succulent plant func-tional type to be associated with the highest yield is an importantfinding, suggesting that caution is required when interpreting fos-sil leaf wax data in the region (or other regions where such plantsare present). This may be particularly significant for studies inwhich there is a large or poorly understood/characterised sourcearea for leaf waxes. In these circumstances it is important to con-sider information on likely wax lipid yield rather than broad esti-mates of plant biomass in a geographic area (Diefendorf et al.,2011). The issue is perhaps most relevant for studies seeking toestimate proportions of C3 and C4 plants using n-alkane d13C (Boomet al., 2014) and sites associated with long transport distance (e.g.marine archives), as opposed to more confined terrestrial locales inwhich local source vegetation can more easily be characterised.
Our data demonstrate that, on average, differences betweenplant functional type and major biomes are apparent in southwest-ern South Africa. Various studies have sought to use shifts in dom-inant chain length, ACL or CPI in sedimentary records to inferpalaeoenvironmental or palaeoecological change. They have beeninterpreted in terms of the changing occurrence/presence of planttypes in both terrestrial (e.g. Schwark et al., 2002; Bai et al., 2008)and aquatic/riparian (e.g. Ficken et al., 2000; Gao et al., 2011)
Fig. 8. Plot averaged n-alkane distribution parameters for plants and soils. The datacomprise the averaged ACL21–35 for each measured plant or soil sample from a10 � 10 m survey plot. The former ranged between 3 and 14 individuals (seeTable S2) and the latter 3–4 soil samples. The 1:1 line is shown for comparison.
Fig. 9. A log–log plot of n-alkane concentration vs. CPI. For comparison, the readeris also directed to a comparable compilation presented by Bush and McInerney(2013).
A.S. Carr et al. / Organic Geochemistry 67 (2014) 72–84 81

Author's personal copy
contexts. In other circumstances such changes have been consid-ered more in terms of fluctuation in climatic conditions, for in-stance changing temperature (Castañeda et al., 2009). Fig. 11compares data from this study with various other southern Africanvegetation types (taken from Rommerskirchen et al., 2006a andVogts et al., 2009). As previously noted, C4 grasses tend to producethe longest distributions (Rommerskirchen et al., 2006a), but herethese are exceeded by some of the succulents of the Succulent Kar-oo biome, particularly when the Norm31 parameter is considered.Considerable overlap is seen between the woody and herbaceousvegetation of the Fynbos and Savanna biomes and it is thereforeunlikely that such woody/shrubby vegetation types could ever bereliably distinguished in a fossil sample. The variability in the Suc-culent Karoo and Fynbos vegetation (Fig. 11; note for instance theinter-quartile ranges and total ranges for Norm31), compared withsome savanna vegetation types and the grasses is also noteworthyand perhaps reflects some combination of the high edaphic vari-ability in the Succulent Karoo and Fynbos (Cowling et al., 1999),as well as the larger number of plants sampled (across a topo-graphically and climatically diverse region) in this study.
From our data it is argued that the link between n-alkane distri-bution and climate is rather indirect in that it reflects a combina-tion of shifting proportions of plant functional types across thestudy area and/or the adjustment of n-alkane distributions withinplant type or taxa (Figs. 6 and 7). The latter aspect is currentlypoorly characterised, but there is potentially considerable variationin the propensity or ability of different taxa to modify their n-al-kane distributions (Fig. 5). Considering these data in terms of pal-aeoenvironmental research for the region, it is not likely that longterm, large scale changes in the occurrence and distribution of
various plant functional types occurred independently of climaticchange and, as such, an understanding of site context should assistwith the interpretation of fossil n-alkane data. For instance, at sitesclose to the ecotone between the Fynbos and Succulent Karoo (e.g.Carr et al., 2010; Chase et al., 2011), leaf wax distributions may beuseful as an environmental proxy as palaeoclimatic changes mayinduce fluctuations in the extent, distribution and/or relative pro-portions of the various functional types. While it would prudentto interpret such data in conjunction with other proxy data, in thissituation leaf wax distribution data can be envisaged to fluctuate ina manner that reflects larger scale climate changes. Some evidencefor such changes can be seen in palynological records from the re-gion (e.g. Scott and Woodborne, 2007; Valsecchi et al., 2013). Fur-thermore, the data presented here suggest that, in such a context,significant fluctuations in leaf wax distributions associated withthe shifting balance of plant functional type, need to be consideredvery carefully in the interpretation of n-alkane d13C and dD records(e.g. Feakins and Sessions, 2010; Sachse et al., 2012; Douglas et al.,2012), particularly given the generally higher production of n-al-kanes in succulent plants in the region. Furthermore, Boom et al.(2014) show that CAM photosynthesising plants produce leafwax with highly variable n-alkane d13C values, potentially con-founding simple mixing model-based reconstructions of C3/C4
plant occurrence.
5. Conclusions
This study presents n-alkane leaf wax distributions for 215plants and 93 soils from arid and semi-arid Fynbos and SucculentKaroo biomes of South Africa. In terms of biome average, the
Fig. 10. (A) Relationship between ACL21–35 and aridity index. Note the outlier site (SV1) on the right, removal of which markedly increases the r2 value for the relationship(from 0.14 to 0.35). This site is the most southerly and is on the Atlantis coastal dune plume. (B) Same data but with plants marked according to functional type.
Fig. 11. Box plots summarising n-alkane distributions from this study with data from the savannas of southern Africa (Namibia and Zimbabwe) taken from Vogts et al. (2009)and Rommerskirchen et al. (2006a) n = 8 for savanna herbs, n = 9 for savanna shrubs, n = 28 for savanna trees, n = 31 for C4 grasses. Due to different reported n-alkane chainlength ranges, the data used here comprise only the C27–C33 range, which is the reported n-alkane range common to all studies.
82 A.S. Carr et al. / Organic Geochemistry 67 (2014) 72–84

Author's personal copy
n-alkane distributions of the Fynbos and Succulent Karoo biomesare distinct and the patterns are closely mirrored in the contempo-rary soils. There is a tendency for chain length distribution to belonger (increased C33 in particular) and less dispersed for plantsand soils in the Succulent Karoo. The individual Fynbos eco-regionsshow considerable overlap and are not distinguishable. Impor-tantly, the data also demonstrate considerable variability in n-al-kane yield from individual plant specimens. Succulent growthforms are associated with the highest yield. The data also revealthe complexity and variability in leaf wax production when indi-vidual plant specimens are considered, and it is apparent that somespecies, such as S. tuberculata can synthesise highly variable leafwax distributions.
Although the more arid biome (the Succulent Karoo) is, on aver-age, associated with higher ACL, lower dispersion and higher CPIs,correlation with multiple climatic parameters is weak. Taking thedataset as a whole, there is a weak but significant relationship be-tween average chain length and aridity/rainfall, but in detail it canbe seen that this is at least partly a function of the changing pro-portions of distinct (in terms of leaf wax) plant functional typesas climatic conditions change (i.e. increased abundance of succu-lent growth forms). There are several implications for palaeoenvi-ronmental research. In the study locality itself, the data suggestthat plant wax n-alkane distributions are preserved in local soilswith some fidelity. Furthermore, although any correlation betweenleaf wax distribution and climatic parameters is rather indirect,there may be potential for using such data to infer shifts in theabundance of plant functional types in locations near to major eco-tones. More generally, the data illustrate the great variability in n-alkane yield from different plant functional types and particularlythe high n-alkane concentration associated with some succulentgrowth forms. We suggest that the influence of succulent plant-derived waxes on sedimentary leaf wax records should not be dis-counted in arid regions, even if the apparent biomass of such plantsis low. As many plants with this growth form are CAM plants, theirpotential to influence the interpretation of compound-specific sta-ble carbon and hydrogen isotope analyses should be consideredcautiously.
Acknowledgements
We thank the Leverhulme Trust (Grant F/00 212/AF) for fund-ing. B.M.C. is supported by the European Research Council (ERC)under the European Union’s Seventh Framework Programme(FP7/2007e2013)/ERC Starting Grant ‘‘HYRAX’’ (Grant AgreementNo. 258657). Z. Roberts and A. Cumming are thanked for laboratoryassistance. M. Britton is thanked for assistance in the field and forplant identifications, as are J. Rullkötter and an anonymours re-viewer for constructive comments.
Appendix A. Supplementary material
Supplementary data associated with this article can be found, inthe online version, at http://dx.doi.org/10.1016/j.orggeochem.2013.12.004.
Associate Editor—I.D. Bull
References
Bai, Y., Fang, X., Nie, J., Wang, Y., Wu, F., 2008. A preliminary reconstruction of thepaleoecological and paleoclimatic history of the Chinese Loess Plateau from theapplication of biomarkers. Palaeogeography, Palaeoclimatology, Palaeoecology271, 161–169.
Boom, A., Marchant, R., Hoogheimstra, H., Sinninghe-Damsté, J.S., 2002. CO2 andtemperature-controlled altitudinal shifts of C4 and C3 dominated grasslands
allow reconstruction of palaeoatmospheric pCO2. Palaeogeography,Palaeoclimatology, Palaeoecology 177, 151–168.
Boom, A., Carr, A.S., Grimes, H.L., Chase, B.M., Meadows, M.E., 2014. CAM plant leafwax lipids and compound-specific n-alkane d13C from arid southwest Africa.Organic Geochemistry 67, 99–102.
Born, J., Linder, H.P., Desmet, P., 2006. The greater Cape Floristic Region. Journal ofBiogeography 34, 147–162.
Bray, J.R., Curtis, J.T., 1957. An ordination of upland forest communities of southernWisconsin. Ecological Monographs 27, 325–349.
Bray, E.E., Evans, E.D., 1961. Distribution of n-paraffins as a clue to recognition ofsource beds. Geochimica et Cosmochimica Acta 22, 2–15.
Buggle, B., Wiesenberg, G.L.B., Glaser, B., 2010. Is there a possibility to correct fossiln-alkane data for post-sedimentary alteration effects? Applied Geochemistry25, 947–957.
Bush, R.T., McInerney, F.A., 2013. Leaf wax n-alkane distributions in andacross modern plants: implications for palaeoecology andchemotaxonomy. Geochimica et Cosmochimica Acta 117, 161–179.
Campbell, B.M., Werger, M.J.A., 1988. Plant form in the mountains of the Cape,South Africa. Journal of Ecology 76, 637–653.
Carr, A.S., Boom, A., Chase, B.M., 2010. The potential of plant biomarker evidencederived from rock hyrax middens as an indicator of palaeoenvironmentalchange. Palaeogeography, Palaeoclimatology, Palaeoecology 285, 321–330.
Carr, A.S., Boom, A., Chase, B.M., Meadows, M.E., Roberts, Z.E., Britton, M.N.,Cumming, A.M.J., 2013. Biome-scale characterisation and differentiation ofsemi-arid and arid zone soil organic matter compositions using pyrolysis-GC/MS analysis. Geoderma 200–201, 189–201.
Castañeda, I.S., Werne, J.P., Johnson, T.C., Filley, T.R., 2009. Late Quaternaryvegetation history of southeast Africa: the molecular isotope record fromLake Malawi. Palaeogeography, Palaeoclimatology, Palaeoecology 275, 100–112.
Chase, B.M., Quick, L.J., Meadows, M.E., Scott, L., Thomas, D.S.G., Reimer, P.J., 2011.Late glacial interhemispheric climate dynamics revealed in South African hyraxmiddens. Geology 39, 19–22.
Chase, B.M., Scott, L., Meadows, M.E., Gil-Romera, G., Boom, A., Carr, A.S.,Reimer, P.J., Truc, L., Valsecchi, V., Quick, L.J., 2012. Rock hyrax middens:a palaeoenvironmental archive in southern African drylands. QuaternaryScience Reviews 56, 1–19.
Clarke, K.R., 1993. Non-parametric multivariate analysis of changes in communitystructure. Australian Journal of Ecology 18, 117–143.
Collister, J.W., Rieley, G., Stern, B., Eglinton, G., Fry, B., 1994. Compound-specific d13Canalyses of leaf lipids from plants with differing carbon dioxide metabolisms.Organic Geochemistry 21, 619–627.
Conte, M.H., Weber, J.C., 2002. Plant biomarkers in aerosols record isotopicdiscrimination of terrestrial photosynthesis. Nature 417, 639–641.
Conte, M.H., Weber, J.C., Carlson, P.J., Flanagan, L.B., 2003. Molecular and carbonisotopic composition of leaf wax in vegetation and aerosols in a northern prairieecosystem. Oecologia 135, 67–77.
Cowling, R.M., Holmes, P.M., 1992. Flora and vegetation. In: Cowling, R.M. (Ed.), TheEcology of the Fynbos: Nutrients, Fire and Diversity. Oxford University Press,Cape Town, pp. 23–63.
Cowling, R.M., Richardson, D.M., Mustart, P.J., 1997. Fynbos. In: Cowling, R.W.,Richardson, D.M., Pierce, S.M. (Eds.), Vegetation of Southern Africa. CambridgeUniversity Press, pp. 99–130.
Cowling, R.M., Hilton-Taylor, C., 1999. Plant biogeography, endemism anddiversity. In: Dean, W., Milton, S. (Eds.), The Karoo: Ecological Patternsand Processes. Cambridge University Press.
Cowling, R.M., Esler, K.J., Rundel, P.W., 1999. Namaqualand, South Africa – anoverview of a unique winter-rainfall desert ecosystem. Plant Ecology 42, 3–21.
Diefendorf, A.F., Freeman, K.H., Wing, S.L., Graham, H.V., 2011. Production of n-alkyllipids in living plants and implications for the geologic past. Geochimica etCosmochimica Acta 75, 7472–7485.
Dodd, R.S., Afzal-Rafii, Z., Power, A.B., 1998. Ecotypic adaptation in Austrocedruschilensis in cuticular hydrocarbon composition. New Phytologist 138, 699–708.
Dodd, R.S., Afzal-Rafii, Z., 2000. Habitat-related adaptive properties of plantcuticular lipids. Evolution 54, 1438–1444.
Dodd, R.S., Poveda, N.M., 2003. Environmental gradients and population divergencecontribute to variation in cuticular wax composition in Juniperus communis.Biochemical Systematics and Ecology 31, 1257–1270.
Douglas, P.M.J., Pagani, M., Brenner, M., Hodell, D.A., Curtis, J.H., 2012.Aridity and vegetation composition are important determinants of leaf-wax dD values in southeastern Mexico and Central America. Geochimicaet Cosmochimica Acta 97, 24–45.
Eglinton, G., Gonzalez, H., Hamilton, R.J., Raphael, R.A., 1962. Hydrocarbonconstituents of the coatings of plant leaves: a taxonomic survey.Phytochemistry 1, 89–102.
Feakins, S.J., deMenocal, P.B., Eglinton, T.I., 2005. Biomarker records of Late Neogenechanges in East African vegetation. Geology 33, 977–980.
Feakins, S.J., Sessions, A.L., 2010. Crassulacean acid metabolism influences D/H ratioof leaf wax in succulent plants. Organic Geochemistry 41, 1269–1276.
Ficken, K.J., Li, B., Swain, D.L., Eglinton, G., 2000. An n-alkane proxy for thesedimentary input of submerged/floating freshwater aquatic macrophytes.Organic Geochemistry 31, 745–749.
Gao, L., Tsia, Y.-J., Huang, Y., 2012. Assessing rate and timing of leaf waxregeneration in Fraxinus americana using stable hydrogen isotope labelling.Rapid Communications in Mass Spectrometry 26, 2241–2250.
A.S. Carr et al. / Organic Geochemistry 67 (2014) 72–84 83
Author's personal copy
Gao, L., Hou, J., Toney, J., MacDonald, D., Huang, Y., 2011. Mathematical modeling ofthe aquatic macrophyte inputs of mid-chain n-alkyl lipids to lake sediments:Implications for interpreting compound specific hydrogen isotopic records.Geochimica et Cosmochimica Acta 75, 3781–3791.
Goldblatt, P., Manning, J.C., 2002. Plant diversity of the Cape Region of SouthernAfrica. Annals of the Missouri Botanical Gardens 89, 281–302.
Hijmans, R., Cameron, S.E., Parra, J.L., Jones, P.G., Jarvis, A., 2005. Very highresolution interpolated climate surfaces for global land areas. InternationalJournal of Climatology 25, 1965–1978.
Huang, Y., Dupont, L., Sarnthein, M., Hayes, J.M., Eglinton, G., 2000. Mapping of C4
plant input from North West Africa into North East Atlantic sediments.Geochimica et Cosmochimica Acta 64, 3505–3513.
Jenks, M.A., Ashworth, E.N., 1999. Plant epicuticular waxes: function production andgenetics. In: Janick, J. (Ed.), Horticultural Reviews, vol. 23, pp. 1–68.
Koch, K., Hartmann, K.D., Schreiber, L., Barthlott, W., Neinhuis, C., 2006. Influencesof air humidity during the cultivation of plants on wax chemical composition,morphology and leaf surface wettability. Environmental and ExperimentalBotany 56, 1–9.
Ladygina, N., Dedyukhina, E.G., Vainshtein, M.B., 2004. A review on microbialsynthesis of hydrocarbons. Process Biochemistry 41, 1001–1014.
Maffei, M., 1996. Chemotaxonomic significance of leaf wax alkanes in theGramineae. Biochemical Systematics and Ecology 24, 53–64.
Maffei, M., Meregalli, M., Scannerini, S., 1997. Chemotaxonomic significance ofsurface n-alkanes in the Cactaceae. Biochemical Systematics and Ecology 25,241–253.
Macková, J., Vašková, M., Macek, P., Hronková, M., Schreiber, L., Šantrucek, J., 2013.Plant response to drought stress simulated by ABA application: changes inchemical composition of cuticular waxes. Environmental and ExperimentalBotany 86, 70–75.
Maslin, M.A., Pancost, R.D., Wilson, K.E., Lewis, J., Trauth, M.H., 2012. Three and halfmillion year history of moisture availability of South West Africa: evidence fromODP site 1085 biomarker records. Palaeogeography, Palaeoclimatology,Palaeoecology 317–318, 41–47.
Milton, S.J., Yeaton, R.I., Dean, W.R.J., Vlok, J.H.J., 1997. Succulent Karoo. In: Cowling,R.W., Richardson, D.M., Pierce, S.M. (Eds.), Vegetation of Southern Africa.Cambridge University Press, pp. 99–130.
Mooney, H.A., Troughton, J.H., Berry, J.A., 1977. Carbon isotope ratio measurementsof succulent plants in southern Africa. Oecologia 30, 295–305.
Niedermeyer, E.M., Schefuß, E., Sessions, A.L., Mulitza, S., Mollenhauer, G., Schulz,M., Wefer, G., 2010. Orbital- and millennial-scale changes in the hydrologiccycle and vegetation in the western African Sahel: insights from individualplant wax dD and d13C. Quaternary Science Reviews 29, 2996–3005.
Oksanen, J., Kindt, R., Legrendre, P., O’Hara, B., Simpson, G.L., Solymos, P., Stevens,M., Wagner, H., 2008. Vegan: Community Ecology Package. <http://cran-r-project.org; http://vegan.r-forge.r-project.org>.
Otto, A., Simpson, M.J., 2005. Degradation and preservation of vascular plant-derived biomarkers in grassland and forest soils from Western Canada.Biogeochemistry 74, 377–409.
Peltzer, E.T., Gagosian, R.B., 1989. Organic geochemistry of aerosols over the PacificOcean. Chemical Oceanography 10, 282–338.
Poynter, J.G., Farrimond, P., Brassell, S.C., Eglinton, G., 1989. Aeolian-derivedhigherplant lipids in the marine sedimentary record: links with paleoclimate.In: Leinen, M., Sarnthein, M. (Eds.), Palaeoclimatology and Palaeometeorology:Modern and Past Patterns of Global Atmosphere Transport. NATO ASI Series D.Kluwer, pp. 435–462.
R Development Core Team, 2009. R: A Language and Environment for StatisticalComputing. R Foundation for Statistical Computing, Vienna, Austria. <http://R-project.org>.
Riederer, M., Schneider, G., 1990. The effect of the environment on the permeabilityand composition of Citrus leaf cuticles II. Composition of soluble cuticular lipidsand correlation with transport properties. Planta 180, 154–165.
Rommerskirchen, F., Eglinton, G., Dupont, L., Güntner, U., Wenzel, C., Rullkötter, J.,2003. A north to south transect of Holocene southeast Atlantic continentalmargin sediments: relationship between aerosol transport and compound-specific d13C plant biomarker and pollen records. Geochemistry, Geophysics,Geosystems 4, 1101. http://dx.doi.org/10.1029/2003GC000541.
Rommerskirchen, F., Plader, A., Eglinton, G., Chikaraishi, Y., Rullkötter, J., 2006a.Chemotaxanomic significance of distribution and stable carbon isotopiccomposition of long-chain alkanes and alkan-1-ols in C4 grasses. OrganicGeochemistry 37, 1303–1332.
Rommerskirchen, F., Eglinton, G., Dupont, L., Rullkötter, J., 2006b. Glacial/interglacial changes in southern Africa: compound-specific d13C land plantbiomarker and pollen records from southeast Atlantic continental marginsediments. Geochemistry, Geophysics, Geosystems 7, Q08010. http://dx.doi.org/10.1029/2005GC001223.
Rundel, P.W., Esler, K.J., Cowling, R.M., 1999. Ecology and phylogenetic patterns ofcarbon isotope discrimination in the winter-rainfall flora of the Richtersveld,South Africa. Plant Ecology 142, 133–148.
Sachse, D., Billault, I., Bowen, G.J., Chikaraishi, Y., Dawson, T., Feakins, S.J., Freeman,K.H., Magill, C., McInerney, F.A., van der Meer, M., Polissar, P., Robins, R., Sachs,J.P., Schmidt, H.L., Sessions, A.L., White, J., West, J.B., Kahmen, A., 2012.Molecular paleohydrology: interpreting the hydrogen-isotopic composition oflipid biomarkers from photosynthesizing organisms. Annual Reviews of Earthand Planetary Sciences 40, 221–249.
Shepherd, T., Griffiths, D.W., 2006. The effects of stress on plant cuticular lipids.New Phytologist 171, 469–499.
Schefuß, E., Schouten, S., Schneider, R.R., 2005. Climatic controls on central Africanhydrology during the past 20,000 years. Nature 437, 1003–1006.
Schwark, L., Zink, K., Lechterbeck, J., 2002. Reconstruction of postglacial to earlyHolocene vegetation history in terrestrial Central Europe via cuticular lipidbiomarkers and pollen records from lake sediments. Geology 30, 463–466.
Scott, L., Woodborne, S., 2007. Pollen analysis and dating of Late Quaternary faecaldeposits (hyraceum) in the Cederberg, Western Cape, South Africa. Review ofPalaeobotany and Palynology 144, 123–134.
Smith, D.G., Mayes, R.W., Raats, J.G., 2001. Effect of species, plant part, and season ofharvest on n-alkane concentrations in the cuticular wax of common rangelandgrasses from southern Africa. Australian Journal of Agricultural Research 52,875–882.
Todd, S.W., Hoffman, M.T., 2009. A fence-line in time demonstrates grazing-inducedvegetation shifts and dynamics in the semi-arid Succulent Karoo. EcologicalApplications 19, 1897–1908.
Trabucco, A., Zomer, R.J., 2009. Global Aridity Index (Global-Aridity) and GlobalPotential Evapo-Transpiration (Global-PET) Geospatial Database. CGIARConsortium for Spatial Information. Published online, available from theCGIAR-CSI GeoPortal. <http://www.csi.cgiar.org>.
Valsecchi, V., Chase, B.M., Slingsby, J., Carr, A.S., Quick, L.J., Meadows, M.E.,Cheddadi, R., Reimer, P.J., 2013. A high resolution 15,600-year pollen andmicrocharcoal record from the Cederberg Mountains, South Africa.Palaeogeography, Palaeoclimatology, Palaeoecology 387, 6–16.
Vogel, J.C., Fuls, A., Ellis, R.P., 1978. The geographical distribution of Kranz grasses inSouth Africa. South African Journal of Science 74, 209–215.
Vogts, A., Moossen, H., Rommerskirchen, F., Rollkötter, J., 2009. Distributionpatterns and stable carbon isotope composition of n-alkanes and alkan-1-olsfrom plant waxes of African rainforest and savanna C3 species. OrganicGeochemistry 40, 1037–1054.
Vogts, A., Schefub, E., Badewien, T., Rullkötter, J., 2012. n-Alkane parameters from adeep sea sediment transect off southwest Africa reflect continental vegetationand climate conditions. Organic Geochemistry 47, 109–119.
Zhang, Z., Zhao, M., Eglinton, G., Lu, H., Huang, C.Y., 2006. Leaf wax lipids aspaleovegetational and paleoenvironmental proxies for the Chinese LoessPlateau over the last 170 kyr. Quaternary Science Reviews 25, 575–594.
84 A.S. Carr et al. / Organic Geochemistry 67 (2014) 72–84