Latest Report - Maldives Monetary Authority
245
-
Upload
khangminh22 -
Category
Documents
-
view
1 -
download
0
Transcript of Latest Report - Maldives Monetary Authority
ANNUAL REPORT2020
MALDIVES MONETARY AUTHORITY
mma.gov.mv

Maldives Monetary AuthorityBoduthakurufaanu MaguMale’ 20182Republic of MaldivesEmail: [email protected]
ANNUAL REPORT2020
MALDIVES MONETARY AUTHORITY
mma.gov.mv

Maldives Monetary AuthorityAnnual Report 2020 i
PREFACE
In accordance with Article 35 (b) of the Maldives Monetary Authority Act 1981, this Annual Report covers policies adopted by the MMA during the year 2020 to achieve its main objectives, and the activities and developments of the MMA for the year 2020. It also covers developments in the domestic economy during 2020 and presents an overview of events in the global economy during the year. An outlook for 2021 is also included in the report. All analyses are based on information relating to the year 2020, received from relevant government authorities, financial sector agencies, public enterprises and other private sector sources. All data is as of April 2021. The views expressed in this report, however, are those of the MMA and do not necessarily represent those of the source of data. This report also includes a copy of the Financial Statements for the year ended 31 December 2020 that have been examined and certified by the external auditors. We thank all those who have contributed to the publication of this report including the provision of the information contained herein.

Maldives Monetary AuthorityAnnual Report 2020 iii
GOVERNOR’S STATEMENT
The year 2020 was a difficult year for everyone across the globe. In addition to creating a global health crisis, the COVID-19 pandemic has had a devastating impact on the global economy. The Maldives is among the hardest hit economies due to the country’s excessive dependence on the tourism sector, with the real GDP growth estimated to have contracted by 32.0% in 2020. The tourism sector, the mainstay of the Maldivian economy, came to a standstill with the announcement of international border closures in March 2020, while the lockdown measures in the Greater Male’ Region deeply affected activity across all sectors of the economy.
The rate of inflation turned negative in 2020 and remained subdued at -1.4 percent at the end of the year, reflecting the effects of the pandemic dynamics on the price level of the economy. Overall, the deflationary pressures in 2020 stemmed from the measures announced by the government to alleviate the negative impact on activity and incomes of households and businesses in the pandemic-struck economy. Meanwhile, food prices registered a growth of 3.0% in 2020 and was the primary contributor to the upward pressure on inflation during the year.
The current account deficit narrowed in 2020, largely owing to the sizable decline in imports especially from tourism, as well as the decline in outflows on the services account. In addition, the decline in reinvestment of earnings and profit repatriation by companies primarily in the tourism sector, and the decline in worker’s remittances contributed to the improvement in the current account deficit. In 2020, net inflows from the financial account outpaced the deficit on the current account, resulting in an accumulation of gross international reserves which was driven by a surge in short-term foreign liabilities.
The growth prospects for the year 2021 appear to be brighter as mass vaccine roll out programs are gaining momentum across the globe. Meanwhile, incoming high-frequency indicators signal the strengthening of domestic economic recovery, reflecting the pickup of tourist arrivals. Nonetheless,
Maldives Monetary AuthorityAnnual Report 2020iv
uncertainties surrounding the mutation of the coronavirus, and the numerous resurgences of COVID-19 cases in various regions across the globe, that has prompted governments to reintroduce more stringent travel restrictions, accompany huge risks to the recovery path of the tourism sector. Therefore, the outlook for the recovery of the tourism sector is surrounded by a considerable level of risks, constituting both upside and downside risks. As for the price level in the economy, the rate of inflation is expected to turn positive, mainly reflecting the fading of the disinflationary pressures from the COVID-19 related price reductions introduced at the onset of the pandemic.
Due to the incomparable nature of the activities that followed in 2020, the MMA was proactive in implementing policy measures to mitigate the financial and economic disruptions arising from the COVID-19 pandemic, while supporting economic activity and maintaining price stability. The MMA increased the amount of foreign exchange provided to the market from April 2020 onwards to alleviate the US dollar supply shortages in the economy owing to the loss of foreign exchange earnings. Regulatory measures were also taken in March 2020 to facilitate moratoriums on loan repayments for a period of six months for those affected by the COVID-19 crisis. The regulatory leeway on loan moratoriums was extended for an additional six months, until 31 March 2021. To address the liquidity shortages in the financial system, the minimum reserve requirements (MRR) of the commercial banks were temporarily reduced for both local and foreign currency deposits, from 10% to 7.5% during April 2020. The MRR for foreign currency was further reduced to 5% in July 2020.
While the pandemic re-emphasized the need for international cooperation to attain a sustainable future, the MMA continued to strengthen its ties with both multilateral and bilateral institutions. As early as March 2020, the MMA along with the Ministry of Finance requested the International Monetary Fund for financial assistance from the Rapid Credit Facility of the Fund. This was one of the initial steps that were taken to lessen the fiscal burden while the country began its journey to battle the novel virus. Furthermore, through the Currency Swap Arrangement for SAARC countries, the MMA extended the bilateral currency swap agreement with the Reserve Bank of India to relieve the severe impact of the pandemic on the foreign exchange reserves of the country.
The MMA continued on the path of ensuring a healthy and stable financial system in the country. Although the financial sector’s profitability declined on the back of the pandemic, the high capital and liquidity buffers, with key prudential indicators well above the minimum regulatory requirements, indicated the resilience of the sector. To ensure a stable financial system, the MMA also formulated and issued regulations that would protect the integrity and security of the financial sector of the Maldives.
In addition to the robust prudential indicators and the issuance of regulations, an efficient and secure payment system is a pre-requisite for a sound and stable financial sector. The MMA’s efforts to modernize the payment system of the Maldives, began with the Maldives Payment System Development Project. Although the COVID-19 outbreak affected the timeline of the project, considerable strides have been made, including the signing of the contract with Tieto Latvia SIA, the vendor selected to set up the infrastructure which will facilitate affordable access to digital financial services in the country. I believe, the MMA will be successful in making the new system available for domestic transactions before the end of 2021.
Maldives Monetary AuthorityAnnual Report 2020 v
Ali Hashim
Governor
The MMA considers Financial Inclusion as a medium to increase prosperity and reduce the regional income and wealth inequality in the country. In terms of improving the access to finance, the MMA expanded the distribution networks of the mobile payment provider services, which now covers more than half of the inhabited islands of the Maldives. Aided by the technical assistance from the Alliance for Financial Inclusion, the MMA continued the work on formulating and implementing the National Financial Inclusion Strategy, which was initiated in 2019. In 2020, the MMA continued work on the Credit Guarantee Scheme and the development of the Credit Information Bureau. However, the year witnessed the discontinuation of the Affordable Housing Loan Scheme, due to the expiration of the scheme’s regulation in August 2020.
I strongly believe that the most important asset of the MMA is the valuable contributions of the past and present colleagues of the Authority. As such, the MMA’s internal policies remained committed to attract and retain the most competent personnel, tailoring the policies to cater for the needs of the staff during the sudden shift to the remote work system. Furthermore, the MMA continued to provide financial benefits to the staff. During 2020, two staff were awarded financial support for the purchase of residential flats, while eight staff were provided with short-term loans under the staff loan scheme introduced in 2017. The MMA was successful in facilitating the necessary training requirements of the staff in virtual format, providing the opportunity for the staff to equip themselves with the knowledge and skills required to improve performance. This has ensured continuous increase in staff development and productivity despite the unprecedented nature of the work format in 2020. Although the MMA continued to assist the awardees of the ‘MMA Scholarship’ in 2019, the MMA did not announce the scholarship scheme in 2020 owing to the travel restrictions and visa difficulties posited by the COVID-19 pandemic.
The year ahead is full of exceptional uncertainties. In 2021, my main goal is to build on the experiences and lessons of 2020, while working towards ensuring an inclusive, resilient and sustainable recovery from the COVID-19 pandemic. I wish to extend my sincere gratitude to the Board of Directors of MMA and all my colleagues for a year of hard work, and the commitment demonstrated during such trying times. Going forward, I am confident that the dedicated and competent staff of the MMA team will remain committed to their efforts and initiatives in addressing the scarring effects of the health crisis, and continue efforts to maintain price stability and the soundness and stability of the financial system in the country.

Maldives Monetary AuthorityAnnual Report 2020 vii
OBJECTIVES OF THEMALDIVES MONETARY AUTHORITY
The Maldives Monetary Authority (MMA) functions as the central bank of the Maldives and was established on 1 July 1981 under the Law no. 6/81 (Maldives Monetary Authority Act 1981).
The primary objectives of the MMA are as follows:
• Maintain price stability conducive to the sustainable growth of the economy.
• Without prejudice to maintaining price stability, maintain financial stability.
• Without prejudice to maintaining price stability and financial stability, support the
government in achieving macroeconomic stability and economic growth.

Maldives Monetary AuthorityAnnual Report 2020viii
BOARD OF DIRECTORS
Right to left: Mr Ahmed Imad, Deputy Governor; Ms Idham Hussain, Assistant Governor;
Uz Ashraf Rasheed, Ministry of Finance; Ms Neeza Imad, Ministry of Economic Development;
Mr Ali Hashim, Governor and Chairperson; Mr Ali Ihusaan (Private Sector)
Maldives Monetary AuthorityAnnual Report 2020 ix
EXECUTIVE COMMITTEE
Mr Ali Hashim – Governor
Mr Ahmed Imad – Deputy Governor
Ms Mariyam Hussain Didi – Assistant Governor, Banking Operations
Ms Idham Hussain – Assistant Governor, Monetary Policy, Research and Statistics
Ms Mariyam Shifa – Assistant Governor, Financial Stability
Ms Fathimath Jawza – Senior Executive Director, Corporate Services
Maldives Monetary AuthorityAnnual Report 2020x
MANAGEMENT COMMITTEE
Ms Aishath Nadhiya – Banking Operations
Ms Mariyam Najeela – Financial Stability
Mr Abdul Hameed Mohamed – General Services Division
Uza Sheeza Ahmed – Legal Section
Ms Lubna Abdul Gadir – Human Resource Division
Ms Muna Ibrahim – Public Bank
Ms Mariyam Rashfa – Research Division
Mr Moosa Ahmed Manik – Technology Services Division
Uz Hassan Fiyaz – Insurance Division
Ms Hamida Shakeela – Other Financial Institutions Division
Mr Mansoor Zubair – Statistics Division
Ms Siya Ahmed Najeeb – Internal Audit
Mr Ahmed Shihad Abdul Hameed – Building, Property and Security Management Division
Ms Aishath Jabeen – Financial Controls Division
Ms Aminath Shaheeda – Banking and Payments Division
Ms Aishath Asha Ali – Reserve Management and Market Operations Division
Ms Aminath Shafwath – Monetary Policy and Exchange Rate Division
Ms Hawwa Latheef – Payment Systems and Oversight Division
Mr Safiyyuddeen Rasheed – Strategic Planning and Development Projects Section
Maldives Monetary AuthorityAnnual Report 2020 xi
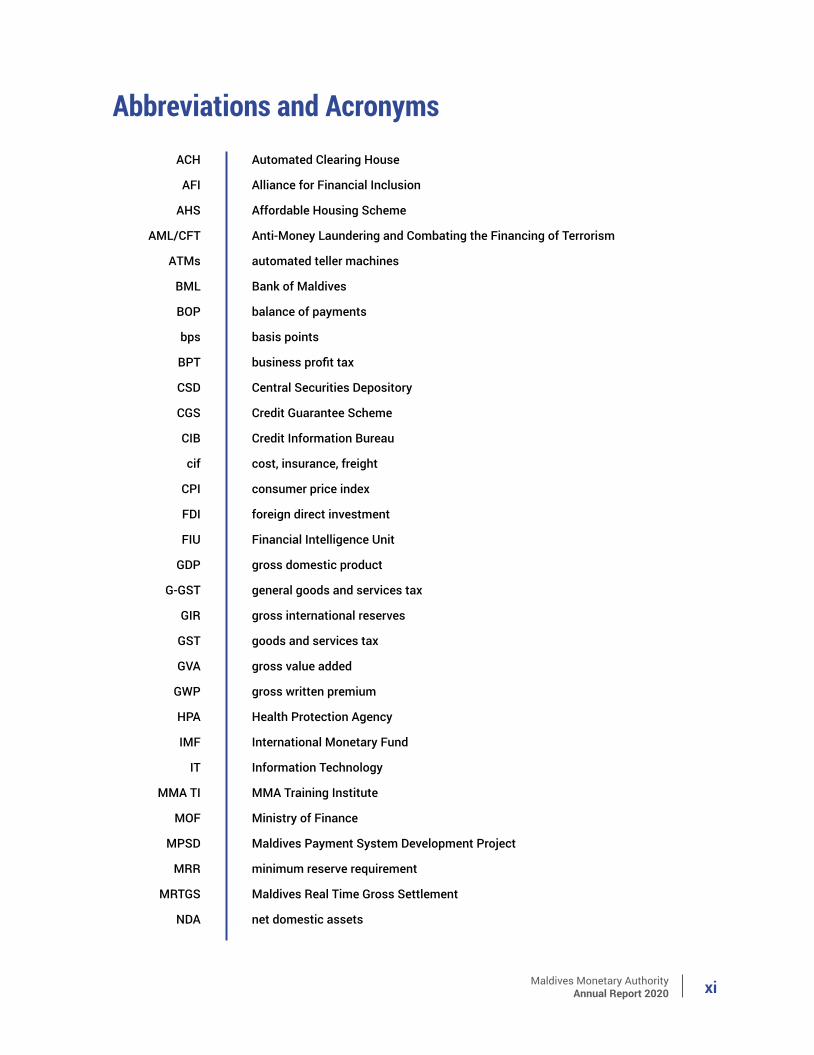
Abbreviations and AcronymsAutomated Clearing House
Alliance for Financial Inclusion
Affordable Housing Scheme
Anti-Money Laundering and Combating the Financing of Terrorism
automated teller machines
Bank of Maldives
balance of payments
basis points
business profit tax
Central Securities Depository
Credit Guarantee Scheme
Credit Information Bureau
cost, insurance, freight
consumer price index
foreign direct investment
Financial Intelligence Unit
gross domestic product
general goods and services tax
gross international reserves
goods and services tax
gross value added
gross written premium
Health Protection Agency
International Monetary Fund
Information Technology
MMA Training Institute
Ministry of Finance
Maldives Payment System Development Project
minimum reserve requirement
Maldives Real Time Gross Settlement
net domestic assets
ACH
AFI
AHS
AML/CFT
ATMs
BML
BOP
bps
BPT
CSD
CGS
CIB
cif
CPI
FDI
FIU
GDP
G-GST
GIR
GST
GVA
GWP
HPA
IMF
IT
MMA TI
MOF
MPSD
MRR
MRTGS
NDA
Maldives Monetary AuthorityAnnual Report 2020xii
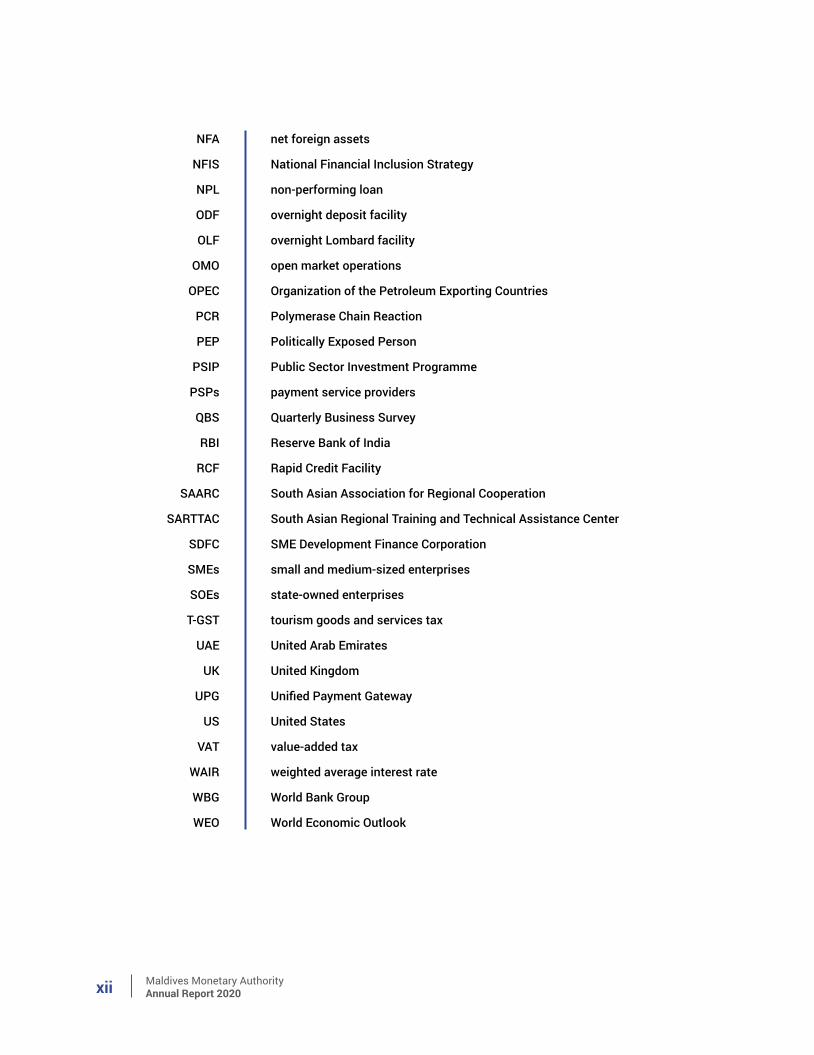
NFA
NFIS
NPL
ODF
OLF
OMO
OPEC
PCR
PEP
PSIP
PSPs
QBS
RBI
RCF
SAARC
SARTTAC
SDFC
SMEs
SOEs
T-GST
UAE
UK
UPG
US
VAT
WAIR
WBG
WEO
net foreign assets
National Financial Inclusion Strategy
non-performing loan
overnight deposit facility
overnight Lombard facility
open market operations
Organization of the Petroleum Exporting Countries
Polymerase Chain Reaction
Politically Exposed Person
Public Sector Investment Programme
payment service providers
Quarterly Business Survey
Reserve Bank of India
Rapid Credit Facility
South Asian Association for Regional Cooperation
South Asian Regional Training and Technical Assistance Center
SME Development Finance Corporation
small and medium-sized enterprises
state-owned enterprises
tourism goods and services tax
United Arab Emirates
United Kingdom
Unified Payment Gateway
United States
value-added tax
weighted average interest rate
World Bank Group
World Economic Outlook
Maldives Monetary AuthorityAnnual Report 2020 xiii
ContentsPREFACE
GOVERNOR’S STATEMENT
OBJECTIVES OF THE MALDIVES MONETARY AUTHORITY
BOARD OF DIRECTORS
EXECUTIVE COMMITTEE
MANAGEMENT COMMITTEE
ABBREVIATIONS AND ACRONYMS
ECONOMY IN 2020
Overview
MACROECONOMIC DEVELOPMENTS
International Economic Developments
Output
Global Inflation
Commodity Prices
Exchange Rates
Domestic Economic Developments
Real Economy
Inflation
Public Finance
Monetary Developments
Financial Sector
External Sector
Outlook for 2021
INTERNAL MANAGEMENT, POLICIES AND ORGANISATIONAL DEVELOPMENTS
Monetary Policy
Monetary Policy Framework
Implementation of Monetary Policy
Reserve Management
Financial Stability
Developments to the Legal Framework
Developments to the Regulatory Framework of the Financial Sector
i
iii
vii
viii
ix
x
xi
1
5
7
8
8
11
13
15
16
16
33
37
46
52
64
79
81
82
82
82
84
86
86
87
Maldives Monetary AuthorityAnnual Report 2020xiv
Licensing, Supervision and Other Regulatory Activities
Development of the Financial Sector
Measures Taken to Prevent Financial Crimes
Currency, Banking and Payment Systems
Currency
Payment Systems
Maldives Payment System Development Project
Mobile Payment Services
Banking Services to the Government
Economic Research and Statistics
Economic Research
Economic Surveys
Statistics
Governance
Board of Directors
Audit Committee
Executive and Management Committee
Internal Audit
Shari’ah Council
Risk Management
Human Resources
Operational Infrastructure
International Relations
International Monetary Fund
SAARCFINANCE Network
Other Institutions
Participation at International Meetings and Forums
ANNUAL FINANCIAL STATEMENTS
STATISTICAL APPENDIX
88
90
92
94
94
95
96
97
98
99
99
99
100
101
101
102
102
102
103
103
104
106
107
107
108
109
109
111
193

Maldives Monetary AuthorityAnnual Report 2020 1
ECONOMY IN 2020
Maldives Monetary AuthorityAnnual Report 20202
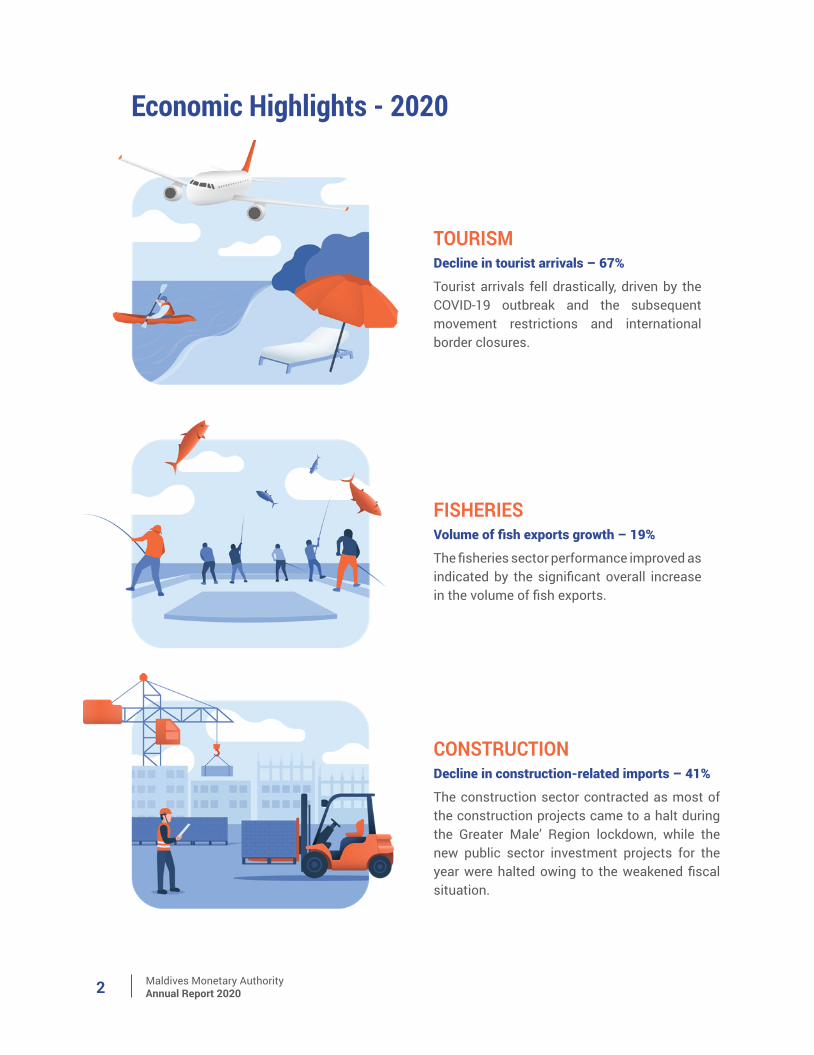
Economic Highlights - 2020
TOURISM
FISHERIES
CONSTRUCTION
Decline in tourist arrivals – 67%
Volume of fish exports growth – 19%
Decline in construction-related imports – 41%
Tourist arrivals fell drastically, driven by the COVID-19 outbreak and the subsequent movement restrictions and international border closures.
The fisheries sector performance improved as indicated by the significant overall increase in the volume of fish exports.
The construction sector contracted as most of the construction projects came to a halt during the Greater Male’ Region lockdown, while the new public sector investment projects for the year were halted owing to the weakened fiscal situation.
Maldives Monetary AuthorityAnnual Report 2020 3
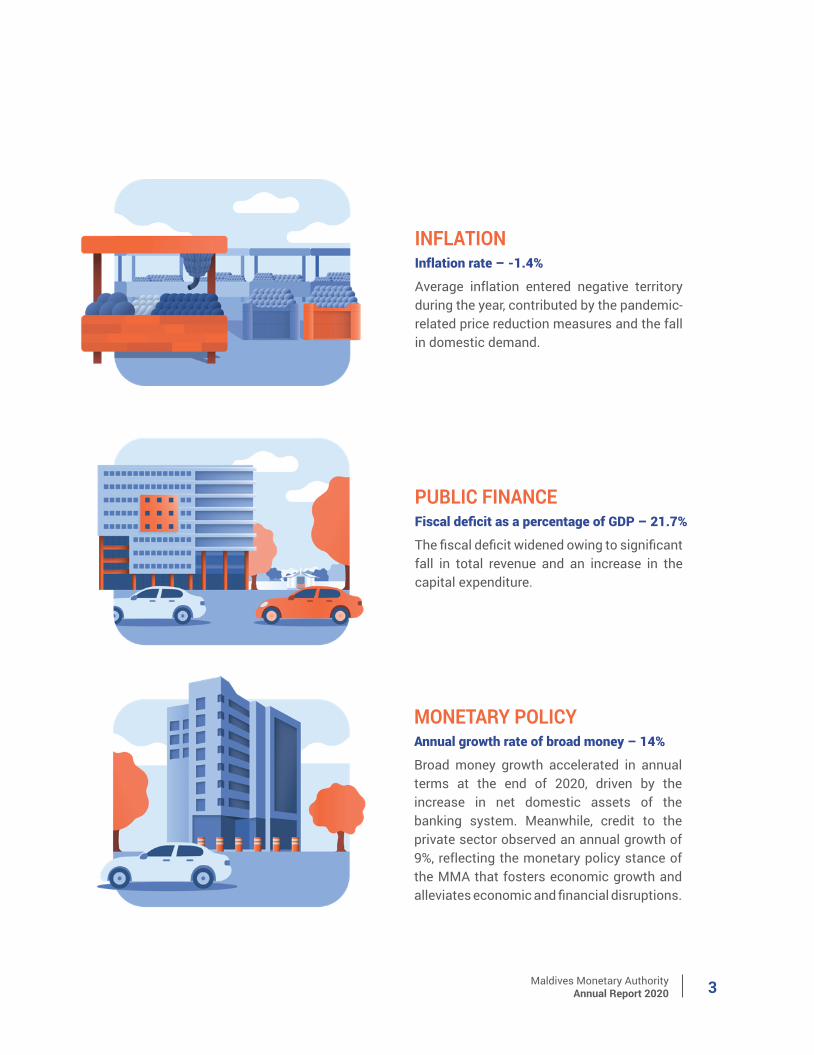
INFLATION
PUBLIC FINANCE
MONETARY POLICY
Inflation rate – -1.4%
Fiscal deficit as a percentage of GDP – 21.7%
Annual growth rate of broad money – 14%
Average inflation entered negative territory during the year, contributed by the pandemic- related price reduction measures and the fall in domestic demand.
The fiscal deficit widened owing to significant fall in total revenue and an increase in the capital expenditure.
Broad money growth accelerated in annual terms at the end of 2020, driven by the increase in net domestic assets of the banking system. Meanwhile, credit to the private sector observed an annual growth of 9%, reflecting the monetary policy stance of the MMA that fosters economic growth and alleviates economic and financial disruptions.
Maldives Monetary AuthorityAnnual Report 20204
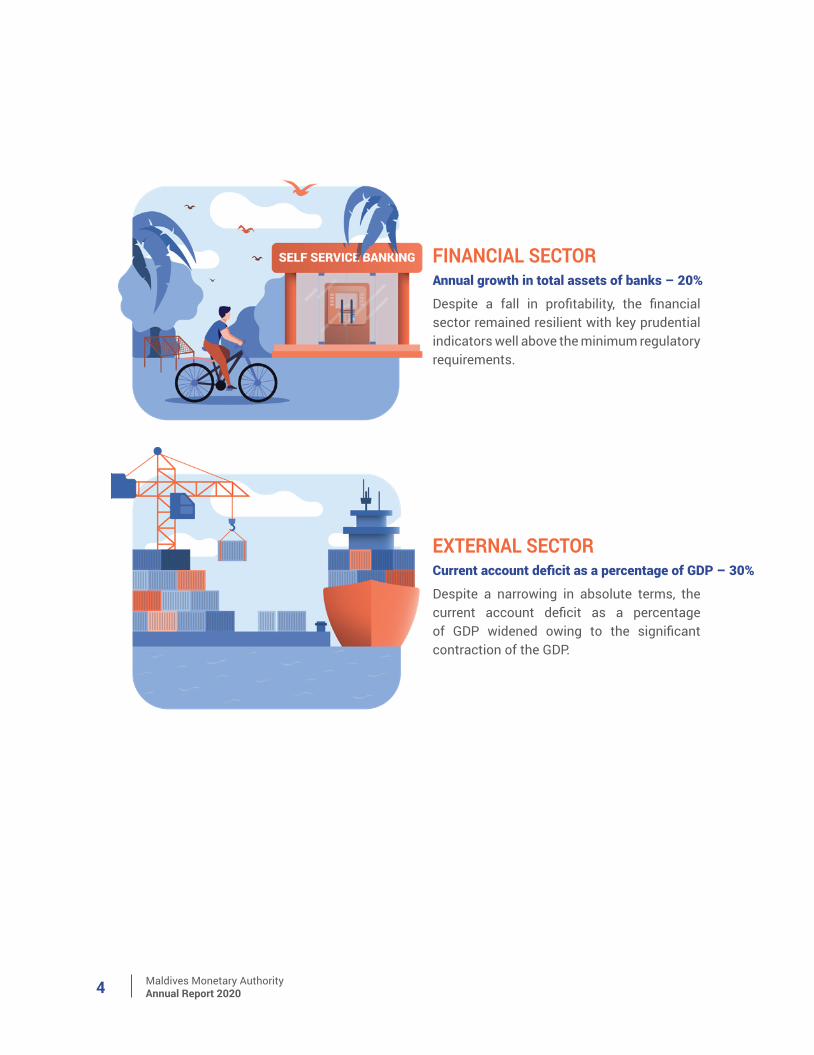
FINANCIAL SECTOR
EXTERNAL SECTOR
Annual growth in total assets of banks – 20%
Current account deficit as a percentage of GDP – 30%
Despite a fall in profitability, the financial sector remained resilient with key prudential indicators well above the minimum regulatory requirements.
Despite a narrowing in absolute terms, the current account deficit as a percentage of GDP widened owing to the significant contraction of the GDP.
Maldives Monetary AuthorityAnnual Report 2020 5
Overview
As the global economy contracted severely owing to the pandemic-led economic fallout, the effects of the pandemic were felt by the Maldivian economy during 2020. According to the first estimate of the annual real gross domestic product (GDP) released at the end of March 2021, the Maldivian economy contracted by 32.0% in 2020—far from both the initial growth forecast of 7.5% for 2020, made in October 2019, and the growth rate of 7.0% that was observed for 2019. The contraction stemmed from the negative repercussions of the COVID-19 pandemic and the subsequent movement restrictions on the tourism sector and related sectors such as wholesale and retail trade, and construction. Further, domestic economic activity was also impacted by the pandemic containment and mitigation measures enforced, such as the closure of the country’s borders, the lockdown of the Greater Male’ Region as well as other movement restrictions between outer islands.
Looking at the domestic price level, the average annual rate of inflation, based on the national Consumer Price Index (CPI), turned negative in 2020, registering -1.4%, following a marginal uptick of 0.2% in the previous year. This deflationary pressure stemmed from the pandemic-related reductions in prices, reflecting the measures implemented to combat the economic fallout experienced by individuals and businesses. These include relief on housing rent, reduction of petrol prices, discount on electricity and water bills, as well as discounts on information and communication services extended by the telecommunication service providers.
On the fiscal front, the fiscal deficit for 2020 widened to 21.7% of GDP, owing to the marked drop in total revenue. The total revenue fell short of the budgeted target by a sizeable margin, reflecting declines in both tax and non-tax revenue, driven by
the concessions provided to alleviate the contraction of economic activity, particularly in the tourism and related sectors. Further, only a few out of the new revenue measures proposed were implemented, with delays. Meanwhile, total expenditure depicted a decline, which was due to the notable decline in recurrent expenditure, despite the increase in capital expenditure. The fall in recurrent expenditure stemmed from expenses incurred as losses and write-offs, as well as administrative and operational expenses. Meanwhile, the growth in capital expenditure mirrored the comparatively faster pace of progression in the public sector investment programme (PSIP) projects, and the capital injections provided as government support to public enterprises. As the total revenue of the government plummeted significantly in 2020, the fiscal deficit observed a sizeable increase, which was financed mainly through domestic sources—both treasury bills and treasury bonds—and external borrowings. In line with these developments, total public debt (including publicly guaranteed debt) rose to MVR86.5 billion (149% of GDP) at the end of 2020.
With regard to monetary developments, the monetary policy stance of the MMA was geared towards mitigating the financial and economic disruptions caused by the pandemic, supporting economic activity, and maintaining price stability. As such, a host of measures were implemented by the MMA to address the macroeconomic fallout from the pandemic, which included lowering the minimum reserve requirement (MRR), increasing foreign exchange interventions and facilitating the debt moratoriums, among other measures. In 2020, broad money accelerated, entirely reflecting the annual growth in net domestic assets (NDA) of the banking system, while the net foreign assets (NFA) declined.
Maldives Monetary AuthorityAnnual Report 20206
As for the performance of the financial sector, although the profitability of the financial sector declined on account of the pandemic-led decrease in business activities and the economic downturn, the sector remained resilient as evidenced by the high capital and liquidity buffers as well as prudent provisioning norms for loan losses. The performance of the finance companies remained satisfactory, with strong capital and robust asset quality, although profitability observed a decline. As for the insurance industry, despite the decline in premium income in the general insurance market, owing to reduced economic activity, the fall in insurance claims outpaced the fall in premium income during the year, which lead to growth in both total assets and profitability.
With regard to the balance of payments (BOP), the current account deficit widened to 30% of GDP, from 26% in 2019, reflecting the marked contraction of GDP during 2020. However, in absolute terms, the current account deficit narrowed during
the year, primarily owing to the narrowing of the merchandise trade deficit and the reduced outflows on the services account, together with the decrease in reinvestment of earnings and profit repatriation by the companies in the tourism sector. The improvement was also contributed by the drop in worker’s remittances during the year. This was offset to an extent by the fall in both the merchandise re-exports and the surplus on the services account, which mirrored the sizeable contraction in tourist arrivals. In 2020, the deficit on the current account was financed mainly through the borrowings by the government, commercial banks and the private sector. As the inflows on the financial account outpaced the deficit on the current account, the overall balance of payments recorded a surplus of US$231.1 million. In line with these developments, the gross international reserves (GIR or official reserve assets) reached a record high of US$984.9 million at the end of 2020.
International Economic Developments

Maldives Monetary AuthorityAnnual Report 2020 7
MACROECONOMIC DEVELOPMENTS
Maldives Monetary AuthorityAnnual Report 20208
International Economic Developments
After a moderate economic expansion in 2019, the pandemic-struck global economy collapsed in 2020, resulting in unprecedented economic damages, supply chain disruptions, and unsynchronized developments across the economies. Against the backdrop of stringent containment measures and shutdown of certain industries, headline inflation remained low owing to the collapse of global oil prices and demand for specific commodities.
Global Output
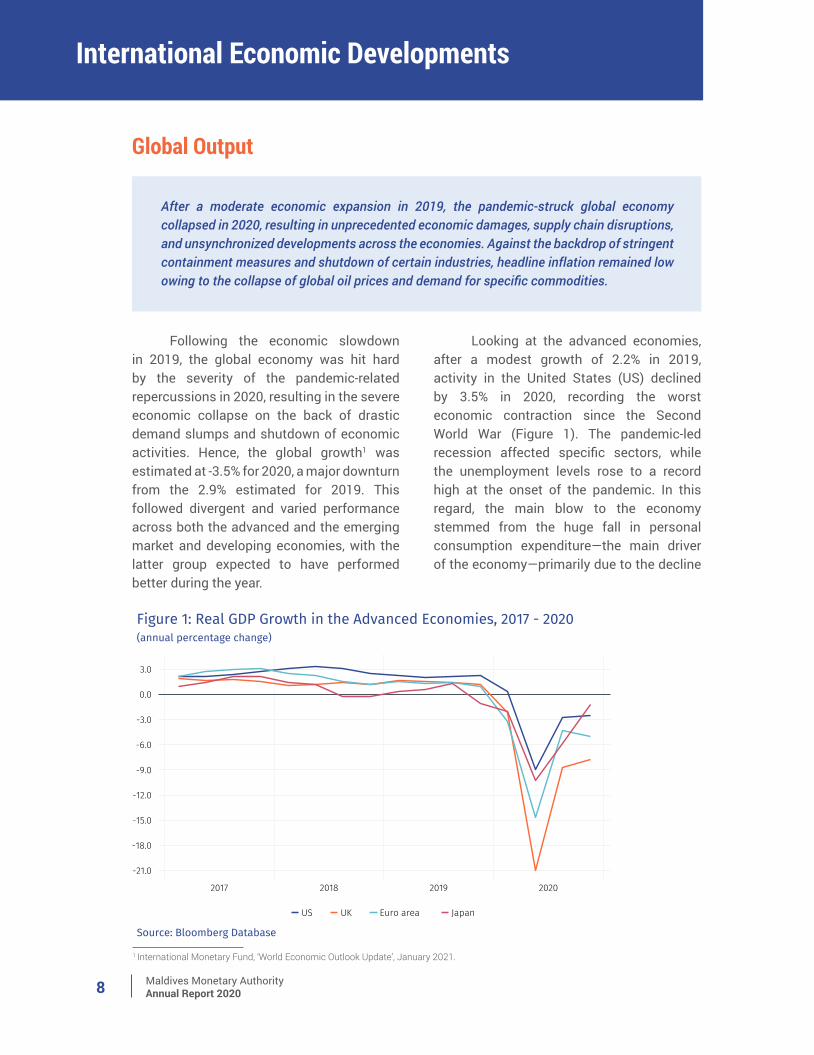
Following the economic slowdown in 2019, the global economy was hit hard by the severity of the pandemic-related repercussions in 2020, resulting in the severe economic collapse on the back of drastic demand slumps and shutdown of economic activities. Hence, the global growth1 was estimated at -3.5% for 2020, a major downturn from the 2.9% estimated for 2019. This followed divergent and varied performance across both the advanced and the emerging market and developing economies, with the latter group expected to have performed better during the year.
Looking at the advanced economies, after a modest growth of 2.2% in 2019, activity in the United States (US) declined by 3.5% in 2020, recording the worst economic contraction since the Second World War (Figure 1). The pandemic-led recession affected specific sectors, while the unemployment levels rose to a record high at the onset of the pandemic. In this regard, the main blow to the economy stemmed from the huge fall in personal consumption expenditure—the main driver of the economy—primarily due to the decline
1 International Monetary Fund, ‘World Economic Outlook Update’, January 2021.
Maldives Monetary AuthorityAnnual Report 2020 9
in consumption of services amid stringent containment measures and voluntary social distancing. In addition, the decrease in exports alongside the increase in imports added to the downturn, leading to a higher trade deficit for the economy in 2020.
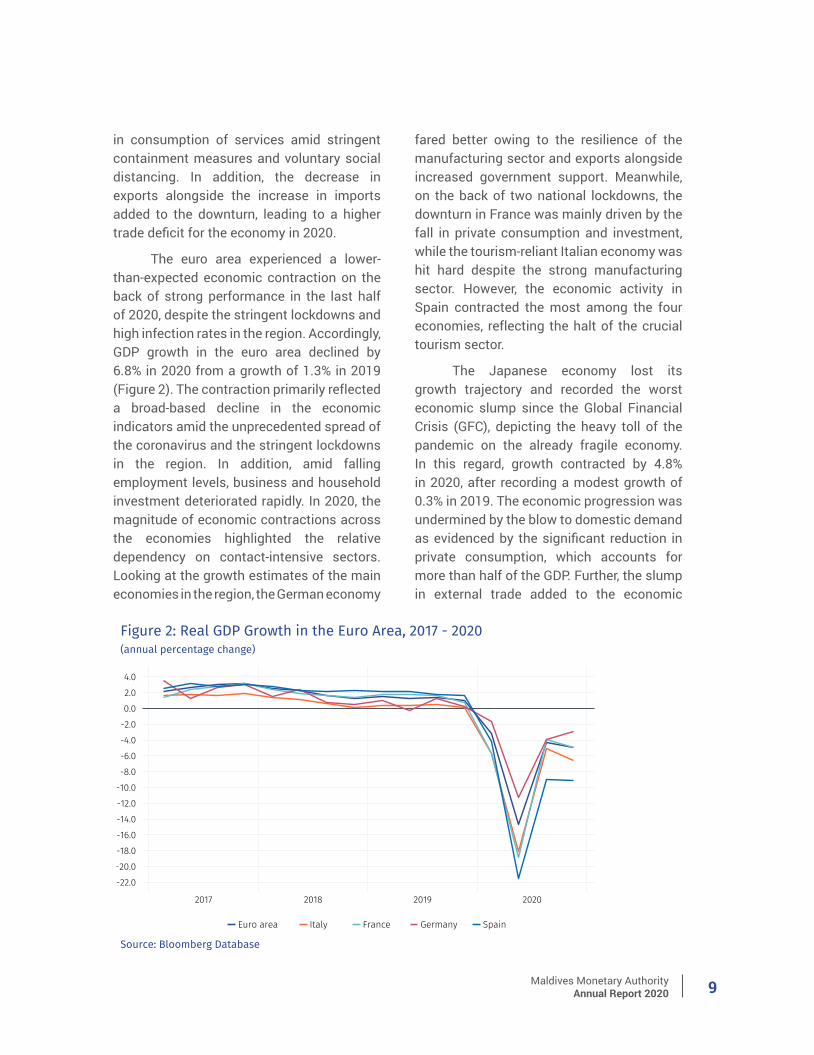
The euro area experienced a lower-than-expected economic contraction on the back of strong performance in the last half of 2020, despite the stringent lockdowns and high infection rates in the region. Accordingly, GDP growth in the euro area declined by 6.8% in 2020 from a growth of 1.3% in 2019 (Figure 2). The contraction primarily reflected a broad-based decline in the economic indicators amid the unprecedented spread of the coronavirus and the stringent lockdowns in the region. In addition, amid falling employment levels, business and household investment deteriorated rapidly. In 2020, the magnitude of economic contractions across the economies highlighted the relative dependency on contact-intensive sectors. Looking at the growth estimates of the main economies in the region, the German economy
fared better owing to the resilience of the manufacturing sector and exports alongside increased government support. Meanwhile, on the back of two national lockdowns, the downturn in France was mainly driven by the fall in private consumption and investment, while the tourism-reliant Italian economy was hit hard despite the strong manufacturing sector. However, the economic activity in Spain contracted the most among the four economies, reflecting the halt of the crucial tourism sector.
The Japanese economy lost its growth trajectory and recorded the worst economic slump since the Global Financial Crisis (GFC), depicting the heavy toll of the pandemic on the already fragile economy. In this regard, growth contracted by 4.8% in 2020, after recording a modest growth of 0.3% in 2019. The economic progression was undermined by the blow to domestic demand as evidenced by the significant reduction in private consumption, which accounts for more than half of the GDP. Further, the slump in external trade added to the economic
Maldives Monetary AuthorityAnnual Report 202010
downturn, while the fall in imports and the government income support and subsidies to boost consumer spending proved insufficient to improve economic growth during the year.
In the United Kingdom (UK), GDP declined by 9.9% in the year—the largest drop since the Great Frost of 1709—from a growth of 1.4% in 2019, reflecting the broad-based negative effect of the two lockdowns on all sectors and the consequent plunge in demand amid renewed infection waves and new variants. As such, the output of all major sectors declined, while services—which accounts for nearly 80% of GDP—was hit the hardest, reflecting the impact of the stringent COVID-19 containment measures and voluntary social distancing. However, the government support schemes such as the “Eat Out to Help Out” scheme aimed at protecting incomes, and the relaxation of the restrictions added impetus to the revival of demand and economic activity during the year.
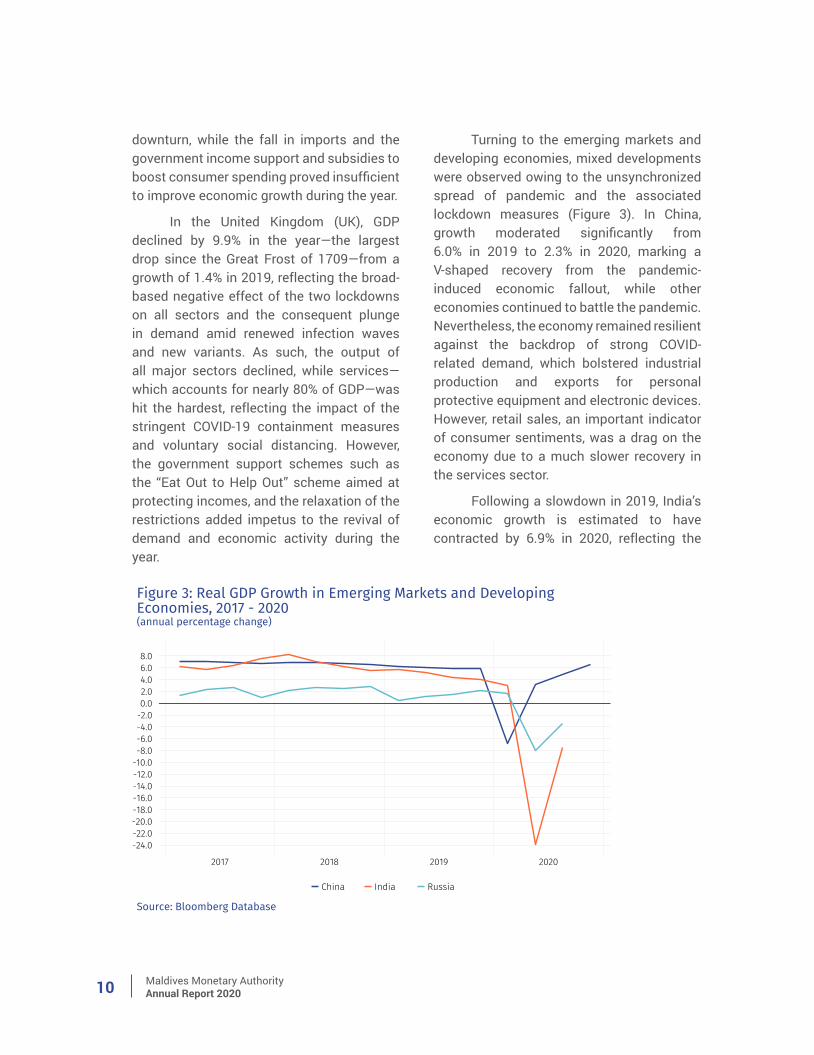
Turning to the emerging markets and developing economies, mixed developments were observed owing to the unsynchronized spread of pandemic and the associated lockdown measures (Figure 3). In China, growth moderated significantly from 6.0% in 2019 to 2.3% in 2020, marking a V-shaped recovery from the pandemic-induced economic fallout, while other economies continued to battle the pandemic. Nevertheless, the economy remained resilient against the backdrop of strong COVID-related demand, which bolstered industrial production and exports for personal protective equipment and electronic devices. However, retail sales, an important indicator of consumer sentiments, was a drag on the economy due to a much slower recovery in the services sector.
Following a slowdown in 2019, India’s economic growth is estimated to have contracted by 6.9% in 2020, reflecting the
Maldives Monetary AuthorityAnnual Report 2020 11
negative effect on the economic activities of one of the strictest nation-wide lockdowns. The output from industrial production and contact-intensive services sectors shrank considerably during the year, while farming remained as a positive contributor. Further, the plunge in private consumption, a key driver of economic growth, signalled poor consumer and business sentiments on the back of the pandemic-related restrictions. Meanwhile, the calibrated government stimulus and gradual resumption of activity improved the economic conditions towards the end of the year.
The Russian economy experienced the worst economic slump since 2009, registering a contraction of 3.1% in 2020, against a 2.0% growth recorded in 2019. The bulk of the economic ravages were felt during the first half of the year for the oil exporting economy, amid the stringent lockdown measures and the collapse of global oil prices as demand plummeted. Meanwhile, economic activity picked up, albeit inadequately, during the second half of the year, owing to the gradual rebound in domestic demand due to the increase in household consumption. Meanwhile, pick up in the manufacturing activity during the second half eased the economic downturn. It is noteworthy that agricultural production remained robust throughout the year.
Global InflationAgainst the backdrop of the COVID-19
pandemic and the resultant weak demand and supply disruptions, the headline inflation fell and remained muted across both advanced economies and emerging markets and developing economies during 2020. However, towards the end of the year, inflationary pressure saw a slight upturn in some of the
economies mirroring idiosyncratic factors. Core inflation remained muted and below the central banks’ target rates in most countries in both the country groups, reflecting the impact of the pandemic developments on aggregate demand and worsened labour market conditions.
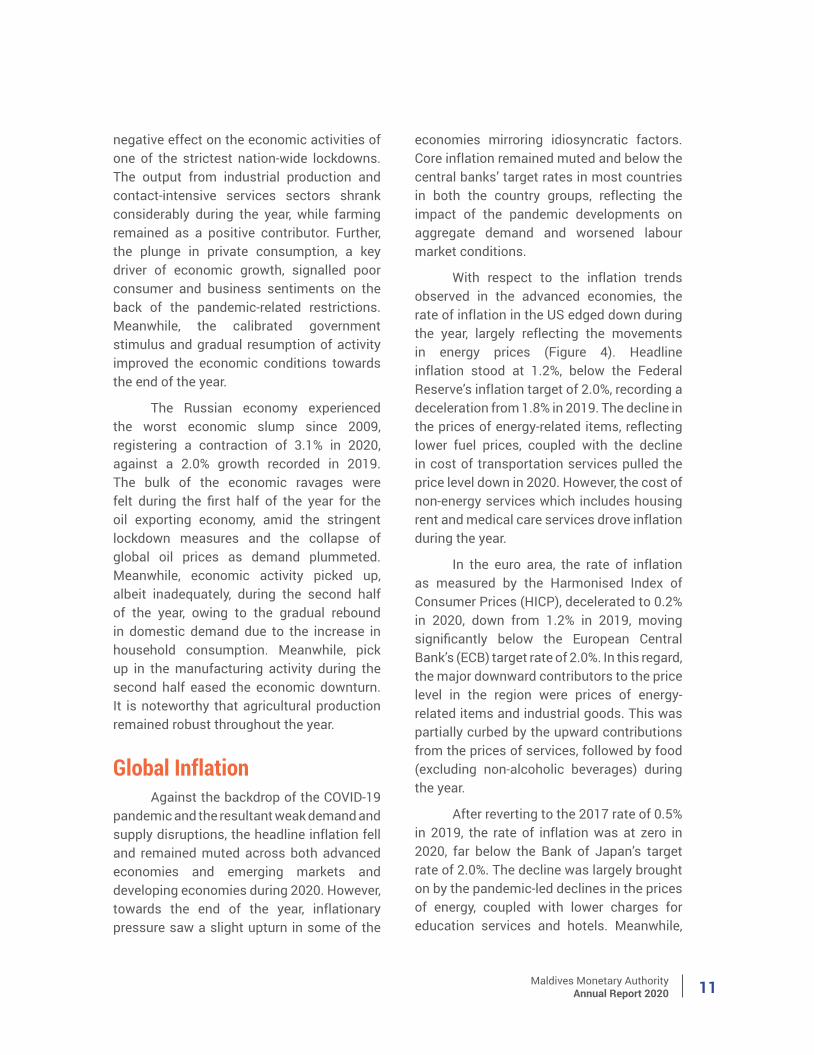
With respect to the inflation trends observed in the advanced economies, the rate of inflation in the US edged down during the year, largely reflecting the movements in energy prices (Figure 4). Headline inflation stood at 1.2%, below the Federal Reserve’s inflation target of 2.0%, recording a deceleration from 1.8% in 2019. The decline in the prices of energy-related items, reflecting lower fuel prices, coupled with the decline in cost of transportation services pulled the price level down in 2020. However, the cost of non-energy services which includes housing rent and medical care services drove inflation during the year.
In the euro area, the rate of inflation as measured by the Harmonised Index of Consumer Prices (HICP), decelerated to 0.2% in 2020, down from 1.2% in 2019, moving significantly below the European Central Bank’s (ECB) target rate of 2.0%. In this regard, the major downward contributors to the price level in the region were prices of energy-related items and industrial goods. This was partially curbed by the upward contributions from the prices of services, followed by food (excluding non-alcoholic beverages) during the year.
After reverting to the 2017 rate of 0.5% in 2019, the rate of inflation was at zero in 2020, far below the Bank of Japan’s target rate of 2.0%. The decline was largely brought on by the pandemic-led declines in the prices of energy, coupled with lower charges for education services and hotels. Meanwhile,
Maldives Monetary AuthorityAnnual Report 202012
during the year, inflationary pressures stemmed from the prices of food items.
In the UK, the rate of inflation decreased to 1.0% in 2020, down from 1.7% in 2019, falling below the Bank of England’s target rate of 2.0%, due to the direct and indirect effects of the COVID-19 policies. While the fall in the cost of energy and seasonal foods suppressed the growth in the price level of the economy, the rise in the cost of housing and recreational services have controlled the disinflationary factors during the year.
Turning to the price developments within the emerging markets and developing economies, the rate of inflation in China edged down to 2.5%, down from 2.9% in the previous year, below the target rate of 3.0% of the People’s Bank of China (Figure 5). The deceleration in prices stemmed primarily from the prices of transportation and communication, due to lower global oil prices during the year. Meanwhile, inflationary pressures broke from prices of food items, which mainly reflected the hike in pork prices
due to supply disruptions during most parts of the year.
The rate of inflation in India fell to 6.7% in 2020, showcasing a major decline from the previous year’s rate of 7.7%. However, the rate of inflation remained above the upper margin of the target band of 4.0% to 6.0% set by the Reserve Bank of India (RBI). During the year, sluggish domestic demand owing to the pandemic-led restrictions, alongside the ease in food prices towards the end of the year, led to muted prices in 2020. However, food and beverages remained as the main contributor to inflationary pressure throughout the year.
In Russia, the price level declined and registered below the Bank of Russia’s target inflation rate of 4.0%. As such, the rate of inflation stood at 3.4% in 2020, down from 4.5% recorded in 2019. The deceleration was more pronounced during the first quarter of 2020, due to the fading temporary base effect of the value-added tax introduced in early 2019, coupled with lower global oil prices. Meanwhile, the pass-through effects
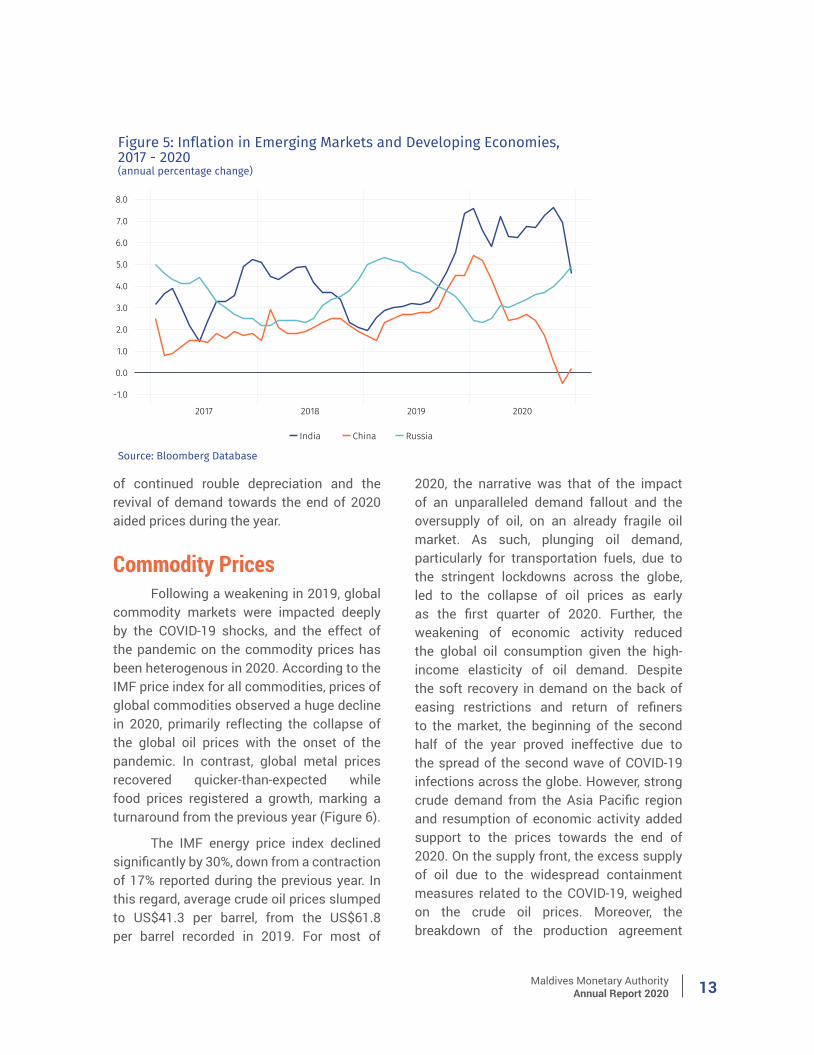
Maldives Monetary AuthorityAnnual Report 2020 13
of continued rouble depreciation and the revival of demand towards the end of 2020 aided prices during the year.
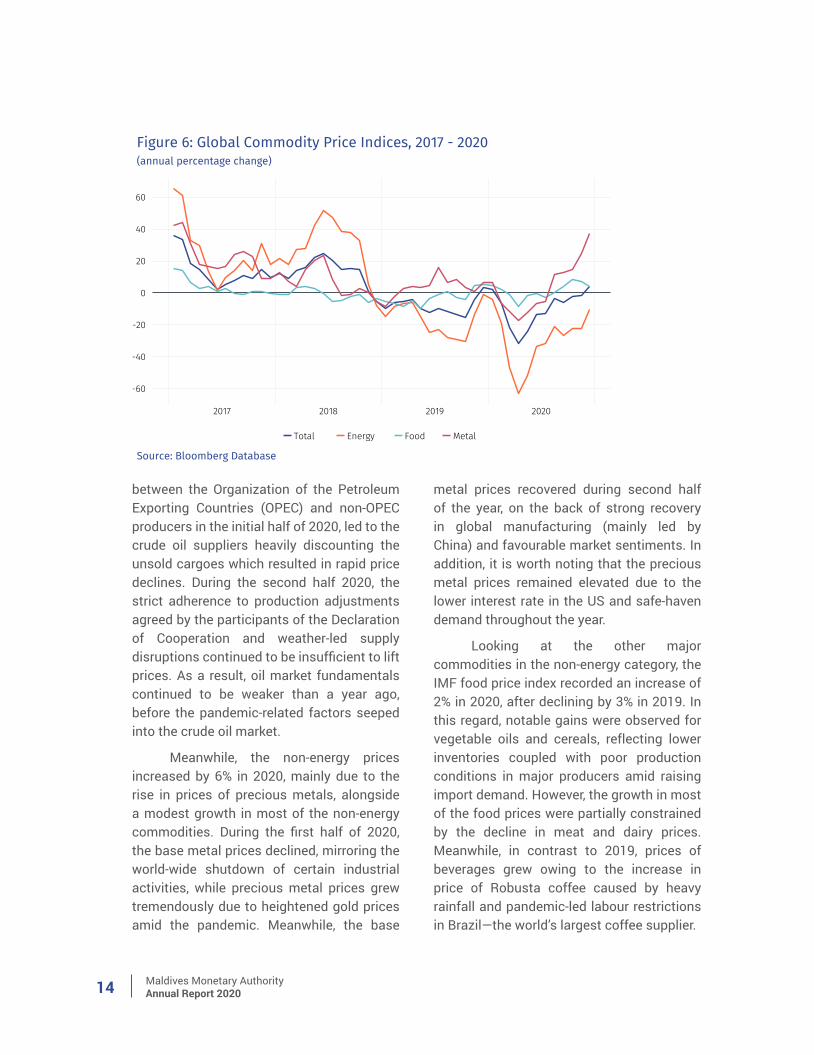
Commodity PricesFollowing a weakening in 2019, global
commodity markets were impacted deeply by the COVID-19 shocks, and the effect of the pandemic on the commodity prices has been heterogenous in 2020. According to the IMF price index for all commodities, prices of global commodities observed a huge decline in 2020, primarily reflecting the collapse of the global oil prices with the onset of the pandemic. In contrast, global metal prices recovered quicker-than-expected while food prices registered a growth, marking a turnaround from the previous year (Figure 6).
The IMF energy price index declined significantly by 30%, down from a contraction of 17% reported during the previous year. In this regard, average crude oil prices slumped to US$41.3 per barrel, from the US$61.8 per barrel recorded in 2019. For most of
2020, the narrative was that of the impact of an unparalleled demand fallout and the oversupply of oil, on an already fragile oil market. As such, plunging oil demand, particularly for transportation fuels, due to the stringent lockdowns across the globe, led to the collapse of oil prices as early as the first quarter of 2020. Further, the weakening of economic activity reduced the global oil consumption given the high-income elasticity of oil demand. Despite the soft recovery in demand on the back of easing restrictions and return of refiners to the market, the beginning of the second half of the year proved ineffective due to the spread of the second wave of COVID-19 infections across the globe. However, strong crude demand from the Asia Pacific region and resumption of economic activity added support to the prices towards the end of 2020. On the supply front, the excess supply of oil due to the widespread containment measures related to the COVID-19, weighed on the crude oil prices. Moreover, the breakdown of the production agreement
Maldives Monetary AuthorityAnnual Report 202014
between the Organization of the Petroleum Exporting Countries (OPEC) and non-OPEC producers in the initial half of 2020, led to the crude oil suppliers heavily discounting the unsold cargoes which resulted in rapid price declines. During the second half 2020, the strict adherence to production adjustments agreed by the participants of the Declaration of Cooperation and weather-led supply disruptions continued to be insufficient to lift prices. As a result, oil market fundamentals continued to be weaker than a year ago, before the pandemic-related factors seeped into the crude oil market.
Meanwhile, the non-energy prices increased by 6% in 2020, mainly due to the rise in prices of precious metals, alongside a modest growth in most of the non-energy commodities. During the first half of 2020, the base metal prices declined, mirroring the world-wide shutdown of certain industrial activities, while precious metal prices grew tremendously due to heightened gold prices amid the pandemic. Meanwhile, the base
metal prices recovered during second half of the year, on the back of strong recovery in global manufacturing (mainly led by China) and favourable market sentiments. In addition, it is worth noting that the precious metal prices remained elevated due to the lower interest rate in the US and safe-haven demand throughout the year.
Looking at the other major commodities in the non-energy category, the IMF food price index recorded an increase of 2% in 2020, after declining by 3% in 2019. In this regard, notable gains were observed for vegetable oils and cereals, reflecting lower inventories coupled with poor production conditions in major producers amid raising import demand. However, the growth in most of the food prices were partially constrained by the decline in meat and dairy prices. Meanwhile, in contrast to 2019, prices of beverages grew owing to the increase in price of Robusta coffee caused by heavy rainfall and pandemic-led labour restrictions in Brazil—the world’s largest coffee supplier.
Maldives Monetary AuthorityAnnual Report 2020 15
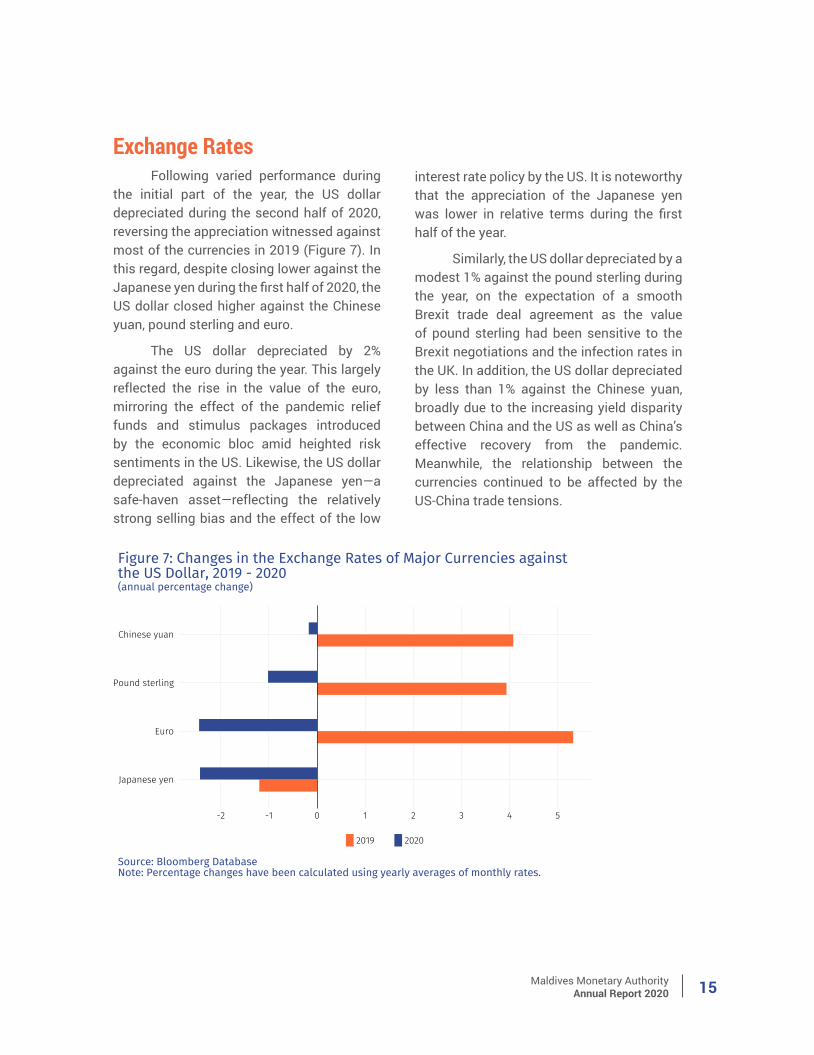
Exchange Rates Following varied performance during
the initial part of the year, the US dollar depreciated during the second half of 2020, reversing the appreciation witnessed against most of the currencies in 2019 (Figure 7). In this regard, despite closing lower against the Japanese yen during the first half of 2020, the US dollar closed higher against the Chinese yuan, pound sterling and euro.
The US dollar depreciated by 2% against the euro during the year. This largely reflected the rise in the value of the euro, mirroring the effect of the pandemic relief funds and stimulus packages introduced by the economic bloc amid heighted risk sentiments in the US. Likewise, the US dollar depreciated against the Japanese yen—a safe-haven asset—reflecting the relatively strong selling bias and the effect of the low
interest rate policy by the US. It is noteworthy that the appreciation of the Japanese yen was lower in relative terms during the first half of the year.
Similarly, the US dollar depreciated by a modest 1% against the pound sterling during the year, on the expectation of a smooth Brexit trade deal agreement as the value of pound sterling had been sensitive to the Brexit negotiations and the infection rates in the UK. In addition, the US dollar depreciated by less than 1% against the Chinese yuan, broadly due to the increasing yield disparity between China and the US as well as China’s effective recovery from the pandemic. Meanwhile, the relationship between the currencies continued to be affected by the US-China trade tensions.
Maldives Monetary AuthorityAnnual Report 202016
Domestic Economic Developments
Real Economy
TourismThe performance of the tourism sector
was hit hard by the COVID-19 outbreak during 2020, after undergoing robust growth in 2019. While the gross value added (GVA) by the sector declined by 98.0% and 92.5% over the second and third quarters, respectively, the magnitude of the decline eased markedly
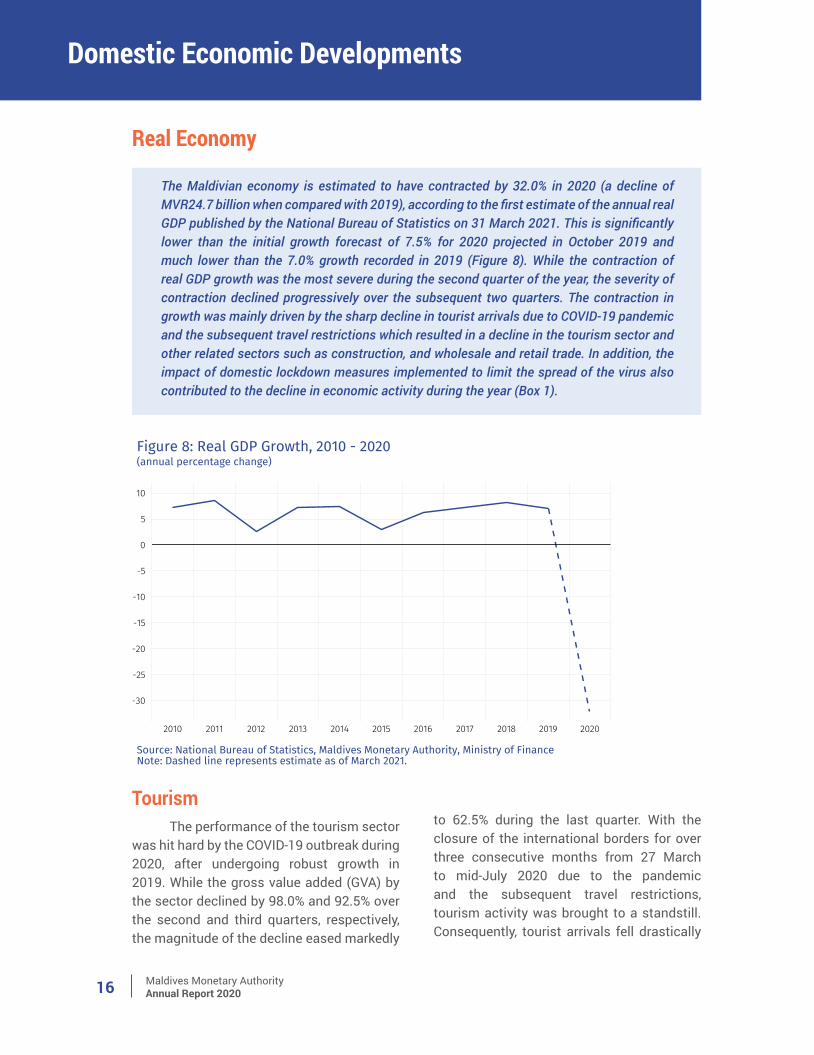
The Maldivian economy is estimated to have contracted by 32.0% in 2020 (a decline of MVR24.7 billion when compared with 2019), according to the first estimate of the annual real GDP published by the National Bureau of Statistics on 31 March 2021. This is significantly lower than the initial growth forecast of 7.5% for 2020 projected in October 2019 and much lower than the 7.0% growth recorded in 2019 (Figure 8). While the contraction of real GDP growth was the most severe during the second quarter of the year, the severity of contraction declined progressively over the subsequent two quarters. The contraction in growth was mainly driven by the sharp decline in tourist arrivals due to COVID-19 pandemic and the subsequent travel restrictions which resulted in a decline in the tourism sector and other related sectors such as construction, and wholesale and retail trade. In addition, the impact of domestic lockdown measures implemented to limit the spread of the virus also contributed to the decline in economic activity during the year (Box 1).
to 62.5% during the last quarter. With the closure of the international borders for over three consecutive months from 27 March to mid-July 2020 due to the pandemic and the subsequent travel restrictions, tourism activity was brought to a standstill. Consequently, tourist arrivals fell drastically
Maldives Monetary AuthorityAnnual Report 2020 17
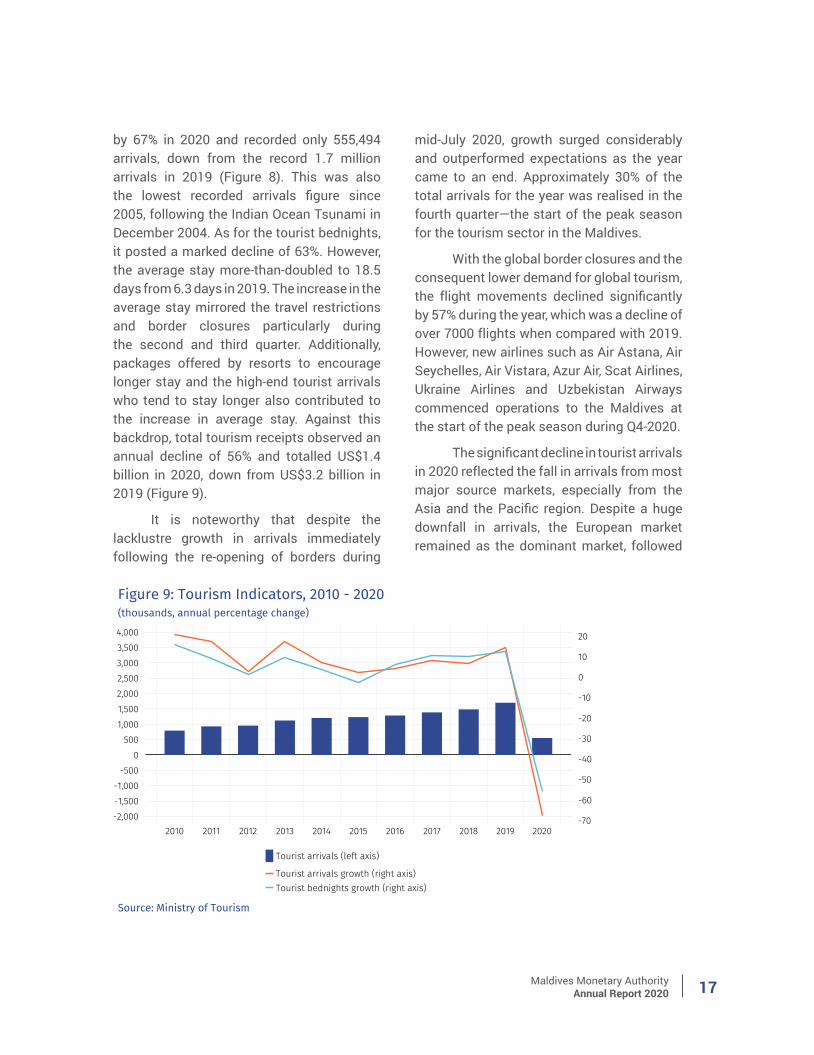
by 67% in 2020 and recorded only 555,494 arrivals, down from the record 1.7 million arrivals in 2019 (Figure 8). This was also the lowest recorded arrivals figure since 2005, following the Indian Ocean Tsunami in December 2004. As for the tourist bednights, it posted a marked decline of 63%. However, the average stay more-than-doubled to 18.5 days from 6.3 days in 2019. The increase in the average stay mirrored the travel restrictions and border closures particularly during the second and third quarter. Additionally, packages offered by resorts to encourage longer stay and the high-end tourist arrivals who tend to stay longer also contributed to the increase in average stay. Against this backdrop, total tourism receipts observed an annual decline of 56% and totalled US$1.4 billion in 2020, down from US$3.2 billion in 2019 (Figure 9).
It is noteworthy that despite the lacklustre growth in arrivals immediately following the re-opening of borders during
mid-July 2020, growth surged considerably and outperformed expectations as the year came to an end. Approximately 30% of the total arrivals for the year was realised in the fourth quarter—the start of the peak season for the tourism sector in the Maldives.
With the global border closures and the consequent lower demand for global tourism, the flight movements declined significantly by 57% during the year, which was a decline of over 7000 flights when compared with 2019. However, new airlines such as Air Astana, Air Seychelles, Air Vistara, Azur Air, Scat Airlines, Ukraine Airlines and Uzbekistan Airways commenced operations to the Maldives at the start of the peak season during Q4-2020.
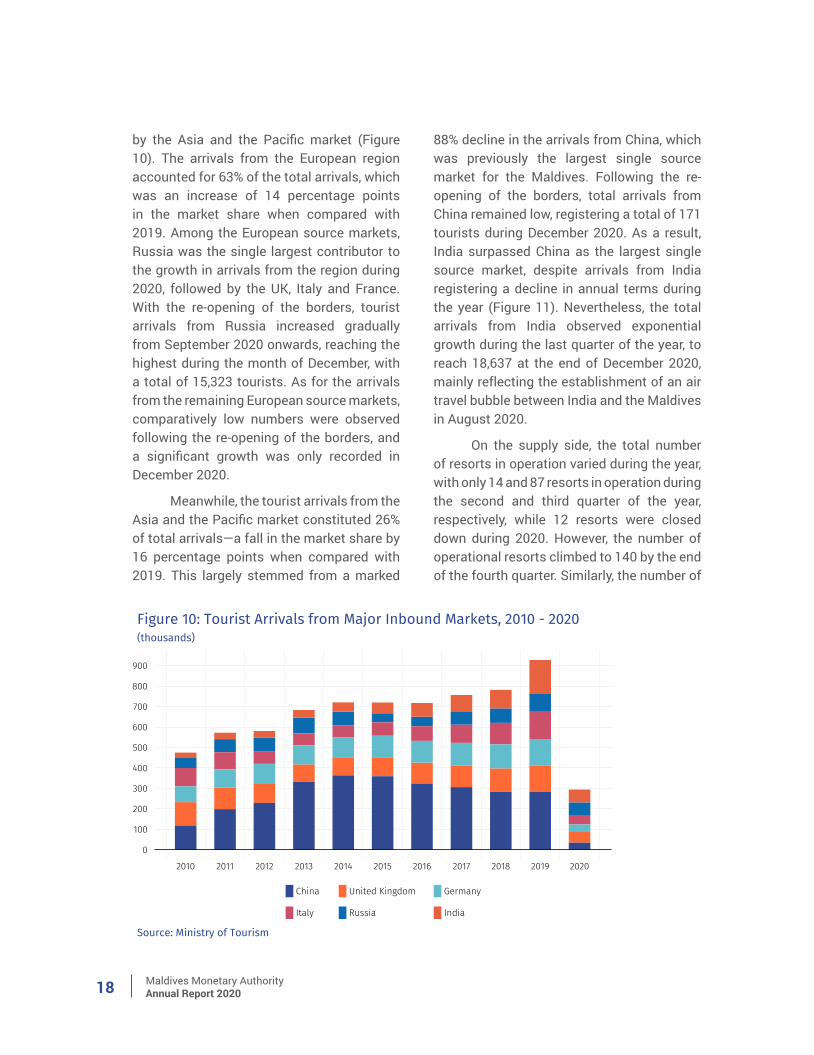
The significant decline in tourist arrivals in 2020 reflected the fall in arrivals from most major source markets, especially from the Asia and the Pacific region. Despite a huge downfall in arrivals, the European market remained as the dominant market, followed
Maldives Monetary AuthorityAnnual Report 202018
by the Asia and the Pacific market (Figure 10). The arrivals from the European region accounted for 63% of the total arrivals, which was an increase of 14 percentage points in the market share when compared with 2019. Among the European source markets, Russia was the single largest contributor to the growth in arrivals from the region during 2020, followed by the UK, Italy and France. With the re-opening of the borders, tourist arrivals from Russia increased gradually from September 2020 onwards, reaching the highest during the month of December, with a total of 15,323 tourists. As for the arrivals from the remaining European source markets, comparatively low numbers were observed following the re-opening of the borders, and a significant growth was only recorded in December 2020.
Meanwhile, the tourist arrivals from the Asia and the Pacific market constituted 26% of total arrivals—a fall in the market share by 16 percentage points when compared with 2019. This largely stemmed from a marked
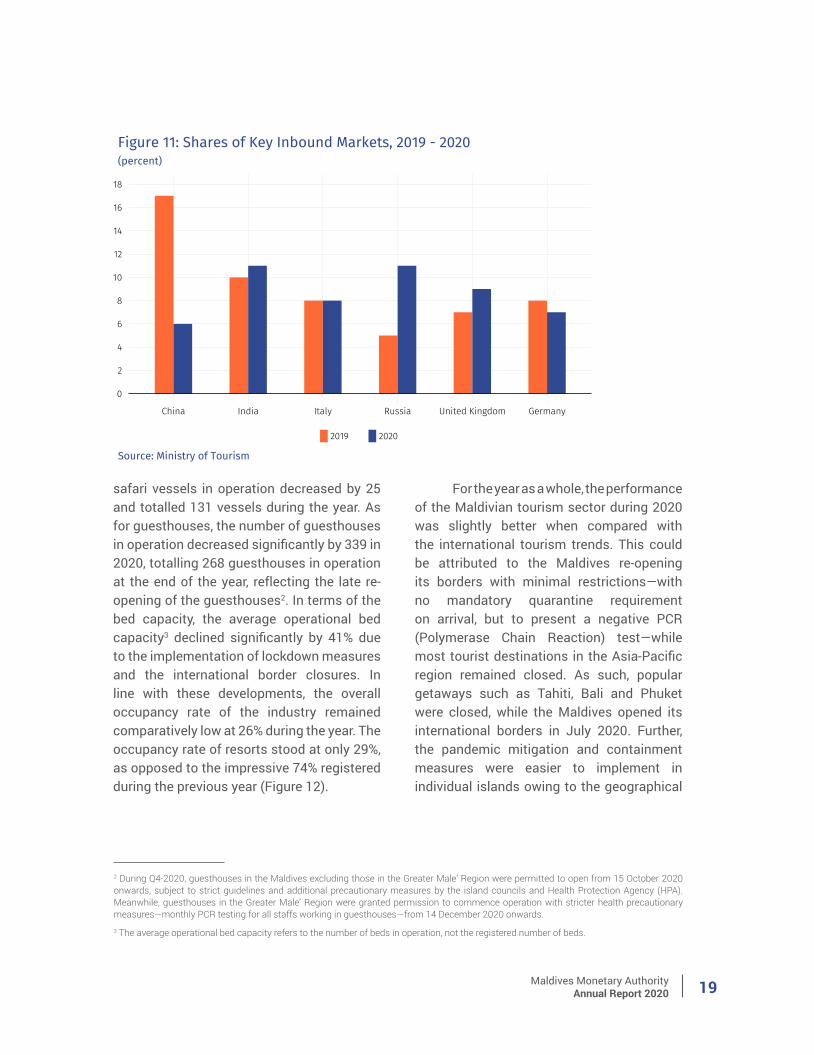
88% decline in the arrivals from China, which was previously the largest single source market for the Maldives. Following the re-opening of the borders, total arrivals from China remained low, registering a total of 171 tourists during December 2020. As a result, India surpassed China as the largest single source market, despite arrivals from India registering a decline in annual terms during the year (Figure 11). Nevertheless, the total arrivals from India observed exponential growth during the last quarter of the year, to reach 18,637 at the end of December 2020, mainly reflecting the establishment of an air travel bubble between India and the Maldives in August 2020.
On the supply side, the total number of resorts in operation varied during the year, with only 14 and 87 resorts in operation during the second and third quarter of the year, respectively, while 12 resorts were closed down during 2020. However, the number of operational resorts climbed to 140 by the end of the fourth quarter. Similarly, the number of
Maldives Monetary AuthorityAnnual Report 2020 19
safari vessels in operation decreased by 25 and totalled 131 vessels during the year. As for guesthouses, the number of guesthouses in operation decreased significantly by 339 in 2020, totalling 268 guesthouses in operation at the end of the year, reflecting the late re-opening of the guesthouses2. In terms of the bed capacity, the average operational bed capacity3 declined significantly by 41% due to the implementation of lockdown measures and the international border closures. In line with these developments, the overall occupancy rate of the industry remained comparatively low at 26% during the year. The occupancy rate of resorts stood at only 29%, as opposed to the impressive 74% registered during the previous year (Figure 12).
For the year as a whole, the performance of the Maldivian tourism sector during 2020 was slightly better when compared with the international tourism trends. This could be attributed to the Maldives re-opening its borders with minimal restrictions—with no mandatory quarantine requirement on arrival, but to present a negative PCR (Polymerase Chain Reaction) test—while most tourist destinations in the Asia-Pacific region remained closed. As such, popular getaways such as Tahiti, Bali and Phuket were closed, while the Maldives opened its international borders in July 2020. Further, the pandemic mitigation and containment measures were easier to implement in individual islands owing to the geographical
2 During Q4-2020, guesthouses in the Maldives excluding those in the Greater Male’ Region were permitted to open from 15 October 2020 onwards, subject to strict guidelines and additional precautionary measures by the island councils and Health Protection Agency (HPA). Meanwhile, guesthouses in the Greater Male’ Region were granted permission to commence operation with stricter health precautionary measures—monthly PCR testing for all staffs working in guesthouses—from 14 December 2020 onwards. 3 The average operational bed capacity refers to the number of beds in operation, not the registered number of beds.

Maldives Monetary AuthorityAnnual Report 202020
advantage provided by the one-island-one-resort concept. Additionally, with the efforts made by the government and the tourism industry to revive the sector by implementing enhanced health and safety measures, the Maldives was awarded the World Travel and Tourism Council (WTTC) ‘Safe Travel Stamp’ in September 2020. According to the World
Tourism Organization (UNWTO) Barometer, international tourist arrivals plunged by 74% and recorded 1 billion fewer tourist arrivals in 2020—when compared with the 1.5 billion in 2019. Furthermore, arrivals to the Asia and the Pacific region contracted significantly by 84% during the year.
Maldives Monetary AuthorityAnnual Report 2020 21
Box 1: The Evolution and Economic Impact of the COVID-19 Pandemic in the Maldives
The COVID-19 pandemic has made countries vividly aware of the major global imbalances and challenges that could occur at any time. The pandemic has been by far the worst crisis faced by the Maldives in recorded history. While the country looked forward to a prosperous year in 2020, economic events took a radical turn during the first quarter of the year. With the unprecedented hit to the tourism sector, the country faced the worst economic downturn, with GDP contracting by 32.0% in 2020, worsening the already prevalent macroeconomic imbalances in the economy.
Evolution of COVID-19 Cases and Containment MeasuresWith the first cases of COVID-19 recorded on 7 March 2020, after two
tourists tested positive in the Maldives, protocols established by the COVID-19 national taskforce was initiated and strict monitoring was undertaken. As the very first measure, the Maldives established thermal screening, local testing facilities, travel advisories and designated quarantine centers. Subsequently, the government declared a state of public health emergency on 12 March—restricting travel between resorts, safaris and islands—hours after the World Health Organization, (WHO) declared the spread of the novel coronavirus as a pandemic. Further, tourist check-ins to guesthouses and city hotels in the Greater Male’ Region was suspended on 14 March, while on 19 March entry was suspended to all tourists arriving via safaris, yachts and other passenger vessels. To curb imported infections, Maldivians travelling from affected areas were subject to 14 days of quarantine. Several other measures implemented to mitigate the spread include the closure of government offices, schools and education service facilities, the halting of all dine-in services offered by restaurants and hotels, as well as the closure of spas, salons and cinemas in the Greater Male’ Region.
The Maldives closed off its international borders on 27 March, resulting in a halt of tourist arrivals at the end of the first quarter. Prior to the complete closure of the borders, entry restrictions were placed on passengers originating from or transiting through China in early February, while during March the restrictions were extended to include passengers from Iran, South Korea, Italy, Bangladesh, Spain, Germany, France, Malaysia, the UK and Sri Lanka.
The ban had a major impact on the overall tourism industry with February 2020 registering a decline of 11%; the biggest decline recorded since the financial
Maldives Monetary AuthorityAnnual Report 202022
crisis. As a result of the border closure, tourist arrivals for the month of March 2020, registered at 59,630 arrivals indicating a marked decline of 63% for the month of March 2020.
By the end of March, the Maldives had only confirmed 18 positive cases. However, with the detection of local transmission of COVID-19 in Male’ City on 15 April, the number of positive cases rose to 23. Concurrently, the Greater Male’ Region was placed under a stringent lockdown, and by the end of April, cases rose rapidly to 468, with one death recorded. To curb the community spread, several containment measures were implemented. As such, all domestics flights were temporarily suspended; departure of vessels docked in the Male’ City was prohibited and travel between all inhabited islands was also prohibited. Furthermore, movement on the roads including vehicles and pedestrians were banned alongside public transport services and public gatherings.
Following the 43-day lockdown period, the government commenced easing the restrictions on 29 May 2020, opening-up the economy in phases. While nationwide restrictions on travel and public gatherings were lifted, travel out of the Greater Male’ region to outer atolls remained restricted to essential travel, with a 14-day self-isolation requirement upon arrival. At the time, the number of confirmed COVID cases stood a total of 1,553, with the number of new cases below 45 and a total of 5 deaths. By the end of the second quarter, the number of cases climbed to 2,367, with 9 reported deaths. However, the number of new daily cases were stable (below 50) from mid-June to mid-July.
The third phase of easing restrictions commenced from 1 July onwards; as movement within the Greater Male’ region was permitted, with a curfew still in place, including gathering at public places; re-opening of shops, dine-in option in restaurants and cafés. Businesses, offices as well as government offices and schools (for key stages) were re-opened. Further, on 15 July, Maldives opened its international borders, resuming tourism activity with 40 resorts resuming operation. However, it was only limited to tourist resorts, liveaboards and hotels in uninhabited islands, subject to strict guidelines and additional precautionary measures. Guesthouses in inhabited islands outside the Greater Male’ Area were allowed to operate only on 15 October, while those that operated within the Greater Male’ Area were granted permission on 15 December. With the reopening in July 2020, Maldives received a total of 1,752 arrivals, a decline of 98% compared to the corresponding month in 2019.
While the new daily cases rose again, towards the end of July (marking the beginning of the second wave), the number of new daily cases surged during August and September, with the total reaching 10,297 cases by the end of the third quarter, and death toll reaching 34. Daily new COVID cases stabilised again
Maldives Monetary AuthorityAnnual Report 2020 23
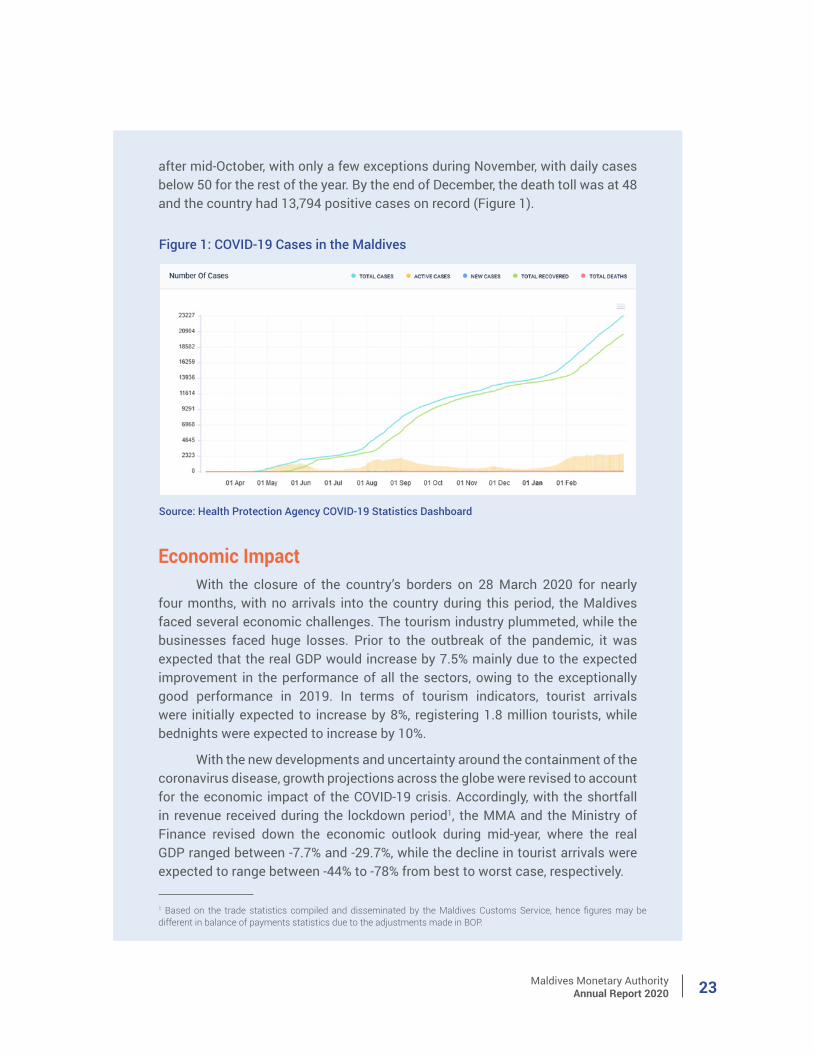
after mid-October, with only a few exceptions during November, with daily cases below 50 for the rest of the year. By the end of December, the death toll was at 48 and the country had 13,794 positive cases on record (Figure 1).
Economic ImpactWith the closure of the country’s borders on 28 March 2020 for nearly
four months, with no arrivals into the country during this period, the Maldives faced several economic challenges. The tourism industry plummeted, while the businesses faced huge losses. Prior to the outbreak of the pandemic, it was expected that the real GDP would increase by 7.5% mainly due to the expected improvement in the performance of all the sectors, owing to the exceptionally good performance in 2019. In terms of tourism indicators, tourist arrivals were initially expected to increase by 8%, registering 1.8 million tourists, while bednights were expected to increase by 10%.
With the new developments and uncertainty around the containment of the coronavirus disease, growth projections across the globe were revised to account for the economic impact of the COVID-19 crisis. Accordingly, with the shortfall in revenue received during the lockdown period1, the MMA and the Ministry of Finance revised down the economic outlook during mid-year, where the real GDP ranged between -7.7% and -29.7%, while the decline in tourist arrivals were expected to range between -44% to -78% from best to worst case, respectively.
Figure 1: COVID-19 Cases in the Maldives
Source: Health Protection Agency COVID-19 Statistics Dashboard
1 Based on the trade statistics compiled and disseminated by the Maldives Customs Service, hence figures may be different in balance of payments statistics due to the adjustments made in BOP.
Maldives Monetary AuthorityAnnual Report 202024
The pace of recovery was slow during the initial period, from July to September 2020, following the re-opening of the country’s international borders and the forecasts were further revised down, where the real GDP was expected to decline by 29.3%. Tourist arrivals were expected to total 458,768 with 3,527,424 bednights. However, over the subsequent months until November 2020, the tourism sector recovered gradually, and during December 2020 the country reached its new target of 100,000 tourists post re-opening, ahead of the projections. The pace of recovery picked up during December 2020 with the peak season of the tourism sector. By the end of 2020, total arrivals registered 555,494, of which 172,568 was recorded during the period July to December 2020, while total bednights registered 3,984,712 in 2020 with 1,243,435 post border re-opening. Overall, the country brought in an additional 96,726 tourists compared with the forecast and achieved approximately 33% of the 2019 levels.
The better-than-expected performance mainly stemmed from the efforts of the industry and the government to revive the tourism sector, with measures such as the introduction the Maldives Border Miles—a three-tier loyalty program—aggressive marketing, customized packages, insurance packages and increased direct connectivity of flights to the Maldives.
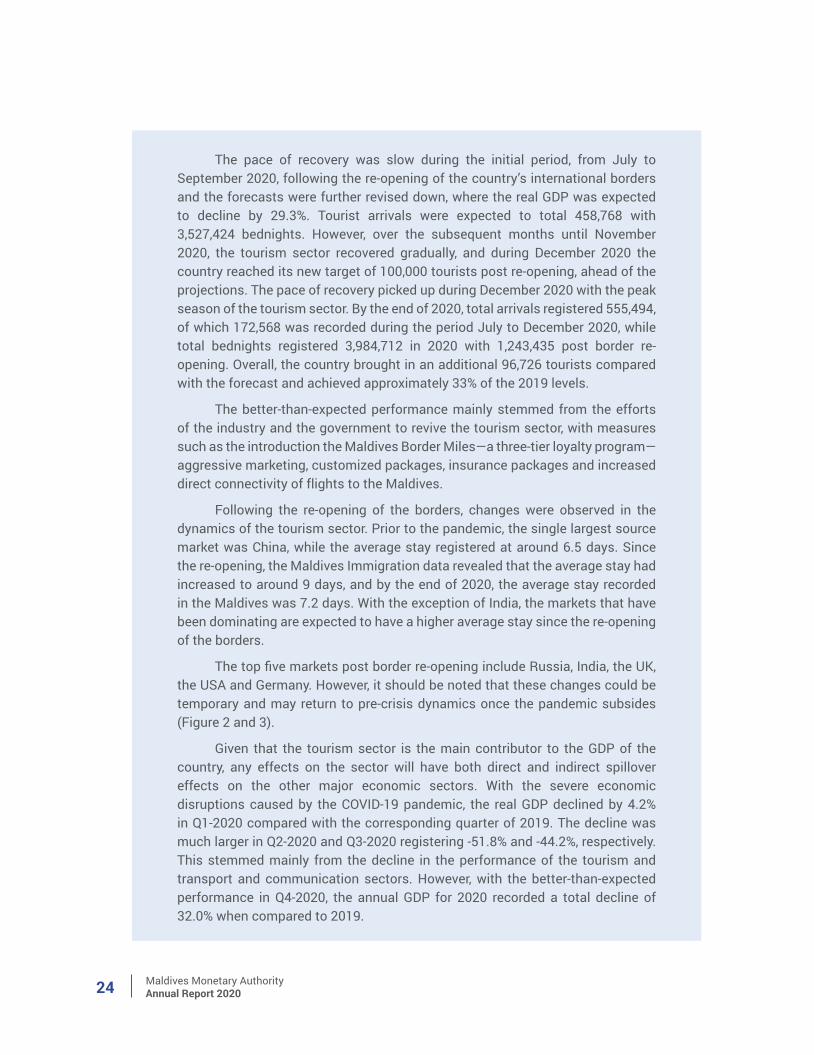
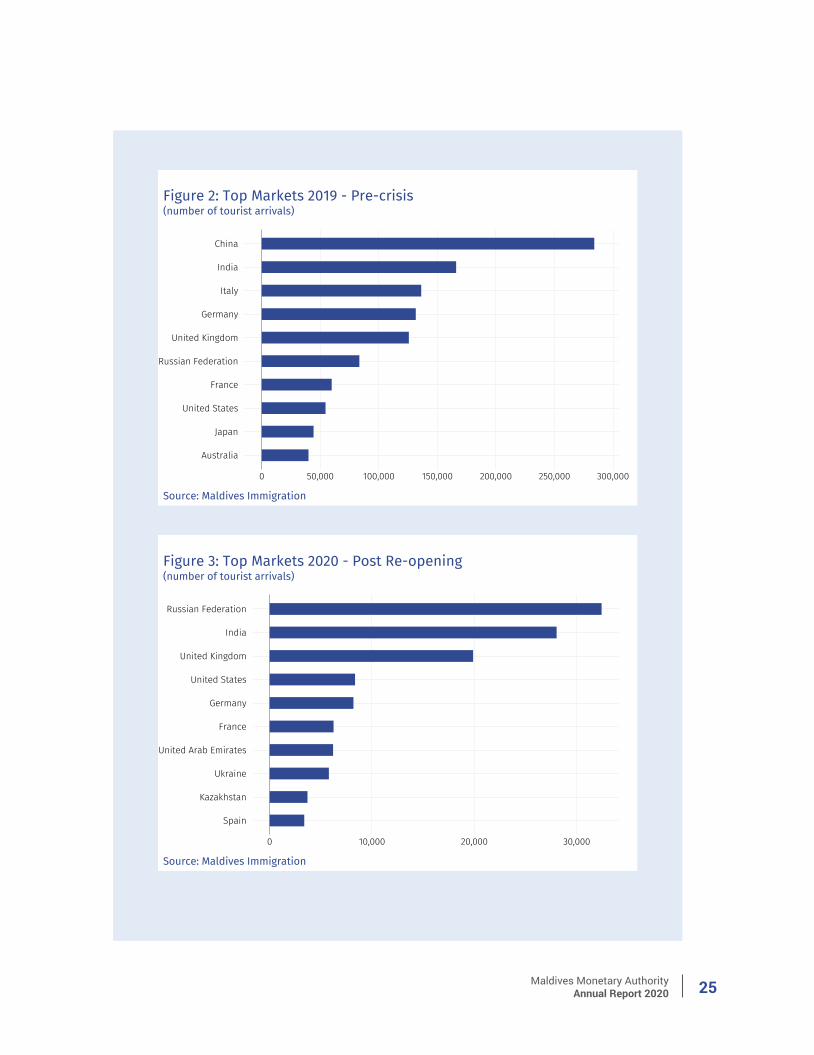
Following the re-opening of the borders, changes were observed in the dynamics of the tourism sector. Prior to the pandemic, the single largest source market was China, while the average stay registered at around 6.5 days. Since the re-opening, the Maldives Immigration data revealed that the average stay had increased to around 9 days, and by the end of 2020, the average stay recorded in the Maldives was 7.2 days. With the exception of India, the markets that have been dominating are expected to have a higher average stay since the re-opening of the borders.
The top five markets post border re-opening include Russia, India, the UK, the USA and Germany. However, it should be noted that these changes could be temporary and may return to pre-crisis dynamics once the pandemic subsides (Figure 2 and 3).
Given that the tourism sector is the main contributor to the GDP of the country, any effects on the sector will have both direct and indirect spillover effects on the other major economic sectors. With the severe economic disruptions caused by the COVID-19 pandemic, the real GDP declined by 4.2% in Q1-2020 compared with the corresponding quarter of 2019. The decline was much larger in Q2-2020 and Q3-2020 registering -51.8% and -44.2%, respectively. This stemmed mainly from the decline in the performance of the tourism and transport and communication sectors. However, with the better-than-expected performance in Q4-2020, the annual GDP for 2020 recorded a total decline of 32.0% when compared to 2019.
Maldives Monetary AuthorityAnnual Report 2020 25
Maldives Monetary AuthorityAnnual Report 202026
Economic Recovery Measures The MMA along with the government implemented several measures to
mitigate the negative repercussions of the COVID-19 pandemic and to ensure the smooth functioning of the economy. As such, the MMA increased the amount of foreign exchange provided to the market from April 2020 onwards, in order to address the difficulties in the foreign exchange market due to the loss of foreign currency revenue into the economy. This increase was mainly targeted towards the imports of necessities such as medical and food items.
Moreover, to mitigate the constraints faced by the commercial banks in terms of both foreign currency and local currency liquidity, the MMA reduced the minimum reserve requirement (MRR) from 10% to 7.5% during April 2020. In addition, during July 2020, the MRR for foreign currency was further reduced to 5%.
Several regulatory measures were also implemented in March 2020 to facilitate the moratoriums on loan repayments for a minimum of six months, for those affected by the COVID-19 crisis. The regulatory leeway was extended by an additional six months, until 31 March 2021. In addition, short-term fixed deposit investments were made available to financial institutions.
As the MMA utilises the reserve assets to cater the foreign exchange requirements, further measures were taken to boost the reserves. As such, the repayment of the US$150 million swap that was availed under the swap facility with the Reserve Bank of India was further extended. In addition, the MMA also secured an additional US$250 million under the swap facility, that was availed in December 2020.
The government also initiated several policy response packages that helped sustain the industries, small and medium enterprises as well as freelance workers and individuals. As such, the government announced an economic relief package, which included the following measures:
• Provision of working capital loans to businesses and individuals at a low interest.
• Discounts on electricity and water bills up to 40% and 30%, respectively, for two months.
• A debt moratorium of six months for individuals, businesses and students abroad.
• Income support allowances for those unemployed due to the COVID-19.
Maldives Monetary AuthorityAnnual Report 2020 27
In addition, the ‘COVID-19 front line allowance’ was introduced to incentivise the frontline workers exposed to different levels of risk associated with the health protection efforts. The government also received donor financing from several institutions such as the Asian Development Bank, the International Monetary Fund, the World Bank, as well as from the government of India.
In order to reduce the strain on the economy, there were several other measures that were adopted which included measures to cut back government expenditure. Some of the areas where expenditure cuts were proposed are highlighted below.
• Travel and training.
• Temporary halt of new recruitments to the civil service.
• Cut back salaries of parliament members and political appointees above the deputy minister level by 20%.
• Construction and repair work.
• Halt the PSIP projects scheduled for 2020, that had not passed the tendering stage.
• Grants provided to local councils.
With these plans, the government aimed to cut back expenditure to MVR30,132.8 million. To further manage the cash flow, the public bank overdrawing limit was increased to MVR4.4 billion, for a period of one year.
To compensate for the loss of revenue and manage cashflow requirements, the government secured other sources of financing, which included:
• US$28.9 million, rapid credit response loan by the IMF in April 2020.
• US$50 million, combined grant and loan by the ADB in July 2020.
• US$250 million domestic treasury bond by the State Bank of India.
• US$47.5 million by the Japan International Corporation Agency.
• US$20 million by the OPEC Fund for International Development.
• US$10 million by the World Bank.
Maldives Monetary AuthorityAnnual Report 202028
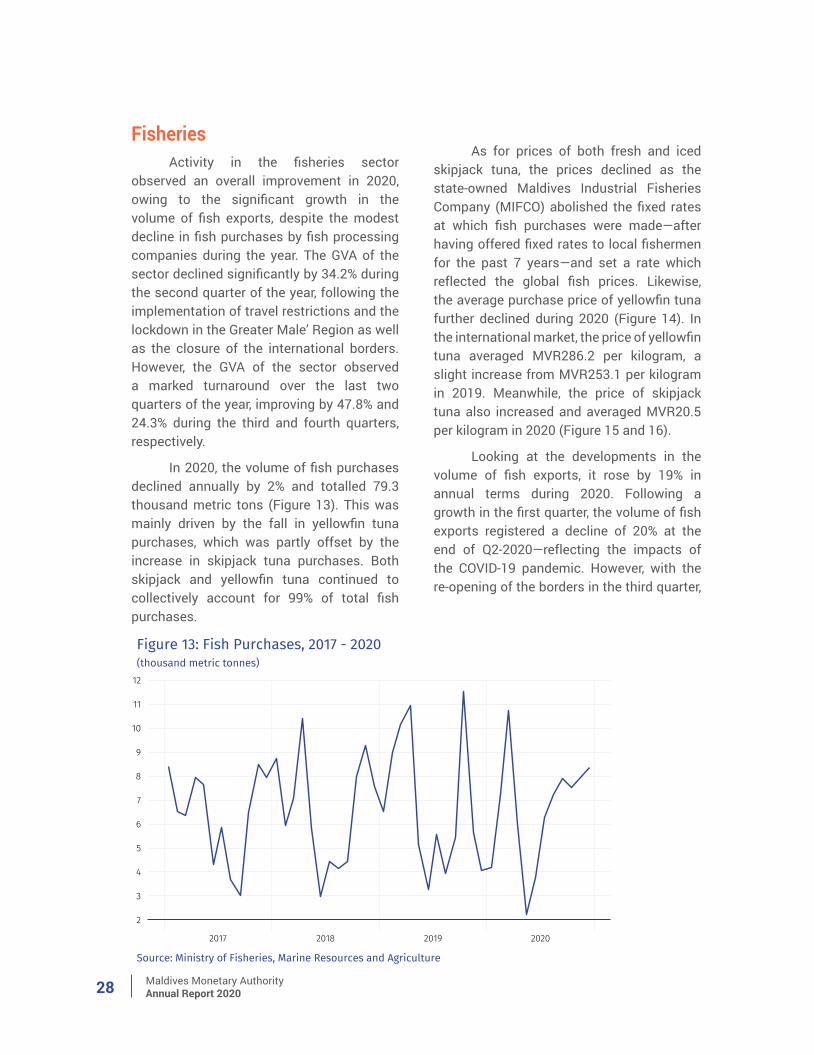
FisheriesActivity in the fisheries sector
observed an overall improvement in 2020, owing to the significant growth in the volume of fish exports, despite the modest decline in fish purchases by fish processing companies during the year. The GVA of the sector declined significantly by 34.2% during the second quarter of the year, following the implementation of travel restrictions and the lockdown in the Greater Male’ Region as well as the closure of the international borders. However, the GVA of the sector observed a marked turnaround over the last two quarters of the year, improving by 47.8% and 24.3% during the third and fourth quarters, respectively.
In 2020, the volume of fish purchases declined annually by 2% and totalled 79.3 thousand metric tons (Figure 13). This was mainly driven by the fall in yellowfin tuna purchases, which was partly offset by the increase in skipjack tuna purchases. Both skipjack and yellowfin tuna continued to collectively account for 99% of total fish purchases.
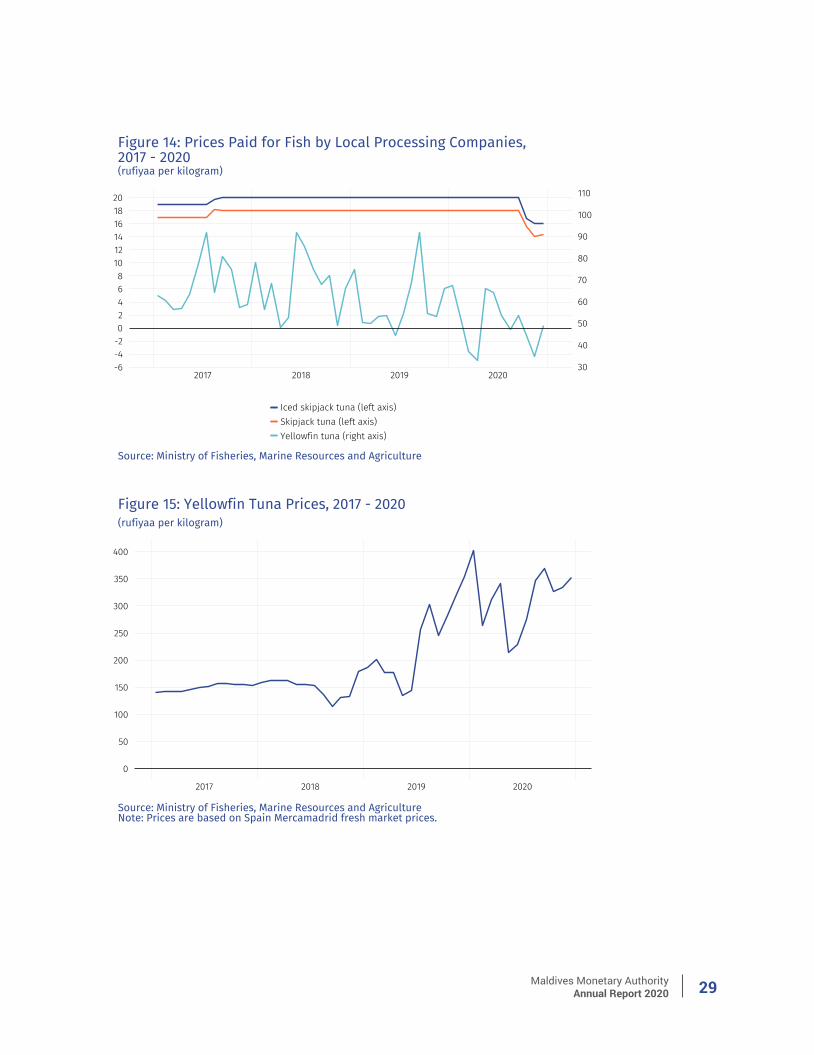
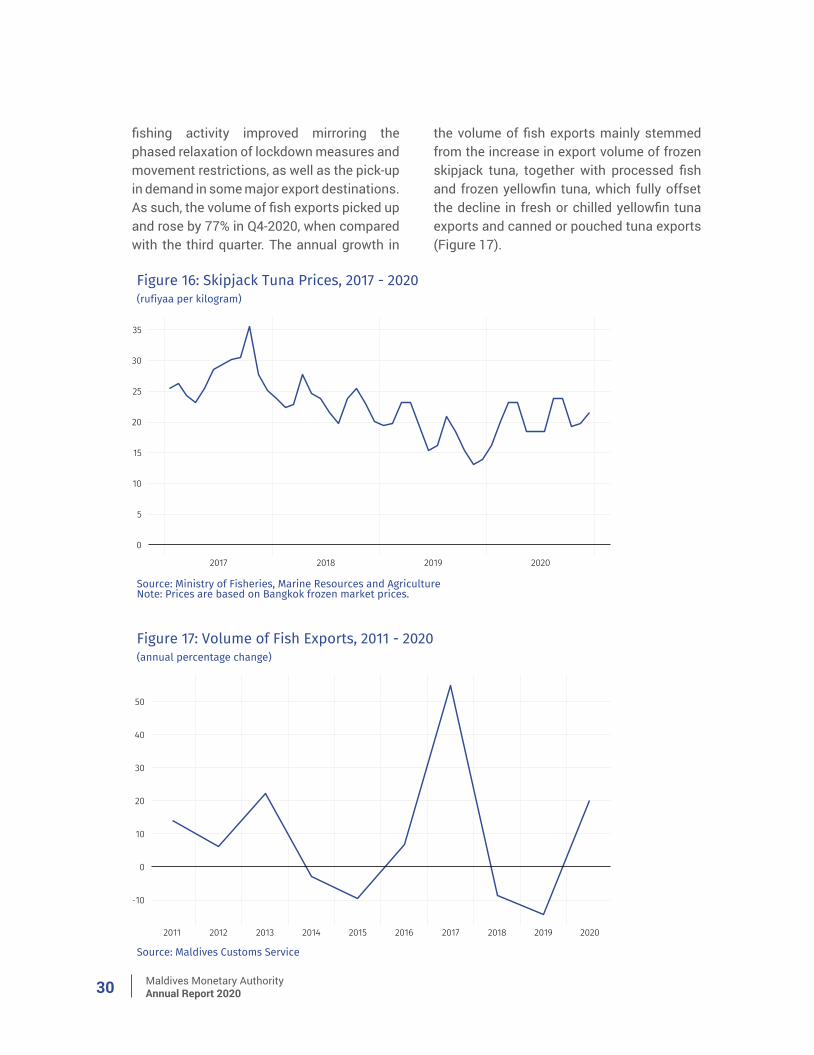
As for prices of both fresh and iced skipjack tuna, the prices declined as the state-owned Maldives Industrial Fisheries Company (MIFCO) abolished the fixed rates at which fish purchases were made—after having offered fixed rates to local fishermen for the past 7 years—and set a rate which reflected the global fish prices. Likewise, the average purchase price of yellowfin tuna further declined during 2020 (Figure 14). In the international market, the price of yellowfin tuna averaged MVR286.2 per kilogram, a slight increase from MVR253.1 per kilogram in 2019. Meanwhile, the price of skipjack tuna also increased and averaged MVR20.5 per kilogram in 2020 (Figure 15 and 16).
Looking at the developments in the volume of fish exports, it rose by 19% in annual terms during 2020. Following a growth in the first quarter, the volume of fish exports registered a decline of 20% at the end of Q2-2020—reflecting the impacts of the COVID-19 pandemic. However, with the re-opening of the borders in the third quarter,
Maldives Monetary AuthorityAnnual Report 2020 29
Maldives Monetary AuthorityAnnual Report 202030
fishing activity improved mirroring the phased relaxation of lockdown measures and movement restrictions, as well as the pick-up in demand in some major export destinations. As such, the volume of fish exports picked up and rose by 77% in Q4-2020, when compared with the third quarter. The annual growth in
the volume of fish exports mainly stemmed from the increase in export volume of frozen skipjack tuna, together with processed fish and frozen yellowfin tuna, which fully offset the decline in fresh or chilled yellowfin tuna exports and canned or pouched tuna exports (Figure 17).
Maldives Monetary AuthorityAnnual Report 2020 31
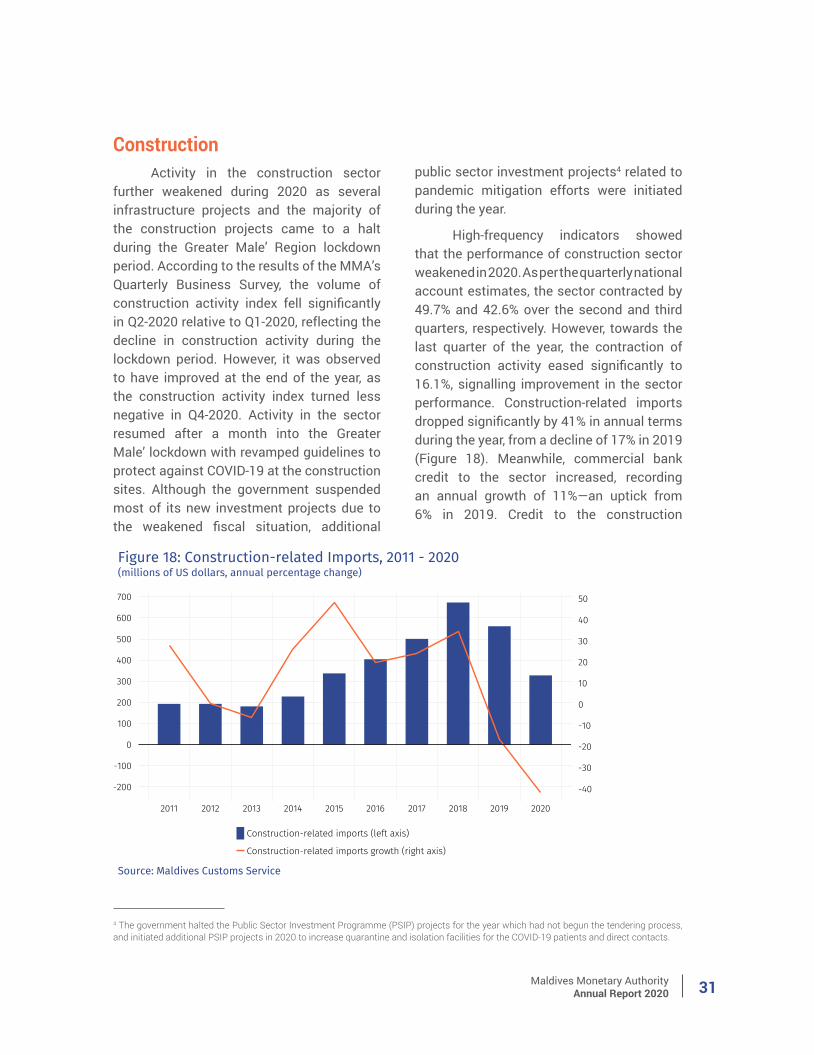
ConstructionActivity in the construction sector
further weakened during 2020 as several infrastructure projects and the majority of the construction projects came to a halt during the Greater Male’ Region lockdown period. According to the results of the MMA’s Quarterly Business Survey, the volume of construction activity index fell significantly in Q2-2020 relative to Q1-2020, reflecting the decline in construction activity during the lockdown period. However, it was observed to have improved at the end of the year, as the construction activity index turned less negative in Q4-2020. Activity in the sector resumed after a month into the Greater Male’ lockdown with revamped guidelines to protect against COVID-19 at the construction sites. Although the government suspended most of its new investment projects due to the weakened fiscal situation, additional
public sector investment projects4 related to pandemic mitigation efforts were initiated during the year.
High-frequency indicators showed that the performance of construction sector weakened in 2020. As per the quarterly national account estimates, the sector contracted by 49.7% and 42.6% over the second and third quarters, respectively. However, towards the last quarter of the year, the contraction of construction activity eased significantly to 16.1%, signalling improvement in the sector performance. Construction-related imports dropped significantly by 41% in annual terms during the year, from a decline of 17% in 2019 (Figure 18). Meanwhile, commercial bank credit to the sector increased, recording an annual growth of 11%—an uptick from 6% in 2019. Credit to the construction
4 The government halted the Public Sector Investment Programme (PSIP) projects for the year which had not begun the tendering process, and initiated additional PSIP projects in 2020 to increase quarantine and isolation facilities for the COVID-19 patients and direct contacts.
Maldives Monetary AuthorityAnnual Report 202032
sector accounted for 52% of total private sector credit during 2020. The growth in construction-related loans5 was largely due to the increase in loans extended for new resort development and residential housing projects. It should be noted that a significant share of financing for resort development projects are sourced from abroad, while funding for public infrastructure projects is obtained from the government budget and through external borrowings.
Wholesale and Retail TradeThe performance of the wholesale and
retail trade sector weakened significantly in 2020, in line with the contraction of other major sectors such as tourism and construction. As indicated by the quarterly national accounts estimates for 2020, activity in the trade sector declined by 55.4% and 49.0% during the second and third quarter of the year, respectively. Similar to the other major sectors, the contraction of activity
eased to 32.2% during the last quarter of the year, largely reflecting the improvement in tourism activity.
The trade sector was adversely impacted by the decline in tourism activity as well as overall economic activity, reflecting the border closures and domestic movement restrictions. Private sector imports (excluding tourism) registered an annual decline of 33%, down from a growth of 6% during the preceding year. As for the developments in private sector imports within the year, it plummeted by 46% in the second quarter of the year, during the lockdown period. However, private sector imports picked up in the third and fourth quarter, with the re-opening of the international borders and the subsequent pick-up in tourism activity during Q4-2020, although imports were still significantly lower than the pre-pandemic levels. Meanwhile, similar to the previous two years, commercial bank credit to the sector observed a decline during the year.
5 Construction sector-related loans include loans to the construction sector and for new resort development, resort renovation and construction of guesthouses (classified as tourism sector loans), as well as loans to the real estate sector. Hence, this figure will be different from the loans to the construction sector reported under Monetary Developments.
Maldives Monetary AuthorityAnnual Report 2020 33
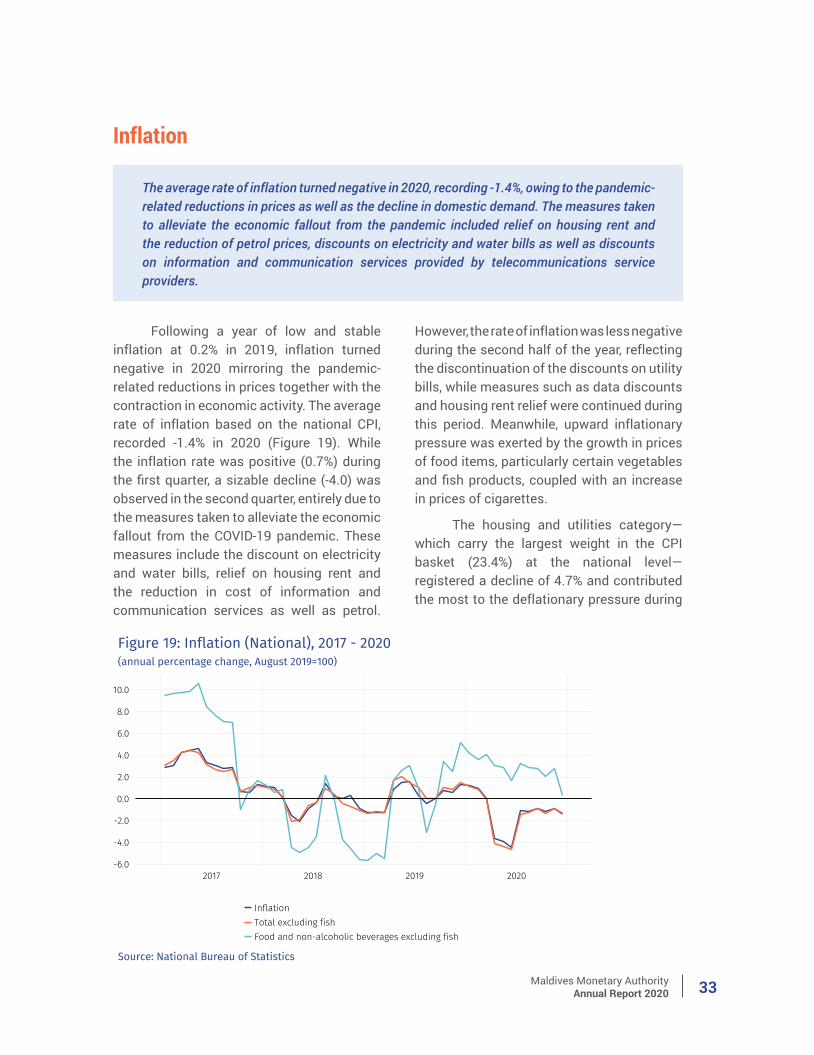
The average rate of inflation turned negative in 2020, recording -1.4%, owing to the pandemic-related reductions in prices as well as the decline in domestic demand. The measures taken to alleviate the economic fallout from the pandemic included relief on housing rent and the reduction of petrol prices, discounts on electricity and water bills as well as discounts on information and communication services provided by telecommunications service providers.
Inflation
Following a year of low and stable inflation at 0.2% in 2019, inflation turned negative in 2020 mirroring the pandemic-related reductions in prices together with the contraction in economic activity. The average rate of inflation based on the national CPI, recorded -1.4% in 2020 (Figure 19). While the inflation rate was positive (0.7%) during the first quarter, a sizable decline (-4.0) was observed in the second quarter, entirely due to the measures taken to alleviate the economic fallout from the COVID-19 pandemic. These measures include the discount on electricity and water bills, relief on housing rent and the reduction in cost of information and communication services as well as petrol.
However, the rate of inflation was less negative during the second half of the year, reflecting the discontinuation of the discounts on utility bills, while measures such as data discounts and housing rent relief were continued during this period. Meanwhile, upward inflationary pressure was exerted by the growth in prices of food items, particularly certain vegetables and fish products, coupled with an increase in prices of cigarettes.
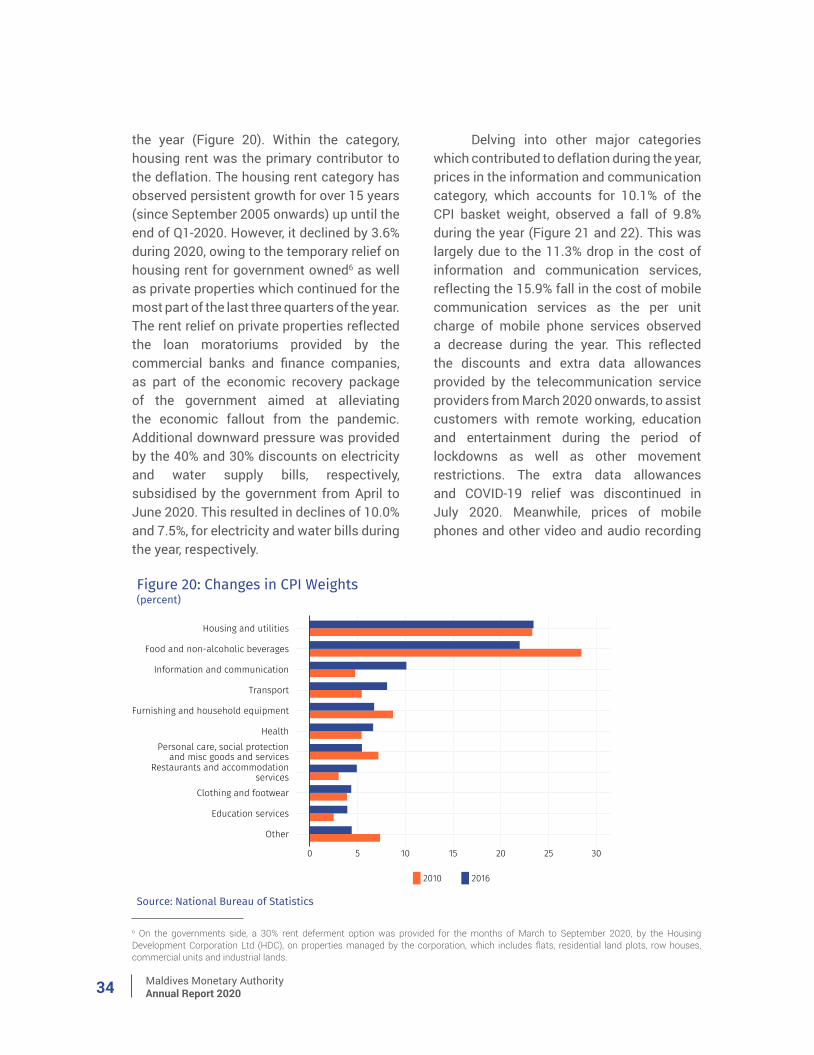
The housing and utilities category—which carry the largest weight in the CPI basket (23.4%) at the national level—registered a decline of 4.7% and contributed the most to the deflationary pressure during
Maldives Monetary AuthorityAnnual Report 202034
the year (Figure 20). Within the category, housing rent was the primary contributor to the deflation. The housing rent category has observed persistent growth for over 15 years (since September 2005 onwards) up until the end of Q1-2020. However, it declined by 3.6% during 2020, owing to the temporary relief on housing rent for government owned6 as well as private properties which continued for the most part of the last three quarters of the year. The rent relief on private properties reflected the loan moratoriums provided by the commercial banks and finance companies, as part of the economic recovery package of the government aimed at alleviating the economic fallout from the pandemic. Additional downward pressure was provided by the 40% and 30% discounts on electricity and water supply bills, respectively, subsidised by the government from April to June 2020. This resulted in declines of 10.0% and 7.5%, for electricity and water bills during the year, respectively.
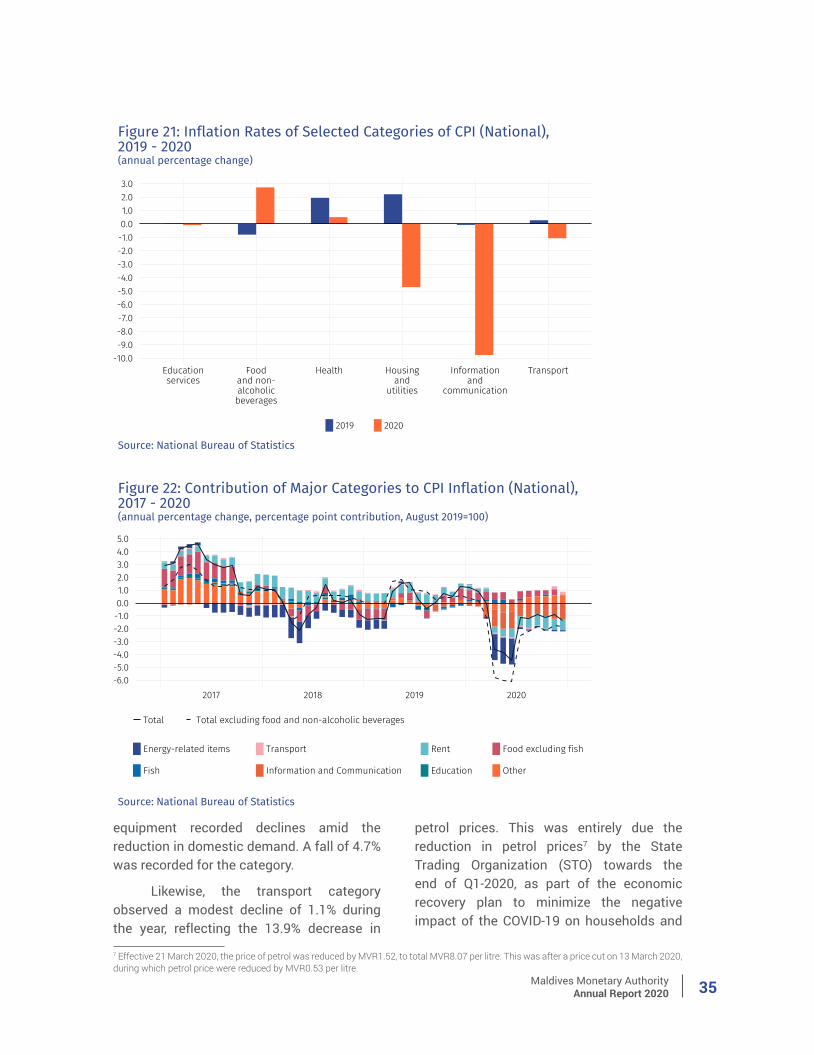
Delving into other major categories which contributed to deflation during the year, prices in the information and communication category, which accounts for 10.1% of the CPI basket weight, observed a fall of 9.8% during the year (Figure 21 and 22). This was largely due to the 11.3% drop in the cost of information and communication services, reflecting the 15.9% fall in the cost of mobile communication services as the per unit charge of mobile phone services observed a decrease during the year. This reflected the discounts and extra data allowances provided by the telecommunication service providers from March 2020 onwards, to assist customers with remote working, education and entertainment during the period of lockdowns as well as other movement restrictions. The extra data allowances and COVID-19 relief was discontinued in July 2020. Meanwhile, prices of mobile phones and other video and audio recording
6 On the governments side, a 30% rent deferment option was provided for the months of March to September 2020, by the Housing Development Corporation Ltd (HDC), on properties managed by the corporation, which includes flats, residential land plots, row houses, commercial units and industrial lands.
Maldives Monetary AuthorityAnnual Report 2020 35
equipment recorded declines amid the reduction in domestic demand. A fall of 4.7% was recorded for the category.
Likewise, the transport category observed a modest decline of 1.1% during the year, reflecting the 13.9% decrease in
petrol prices. This was entirely due the reduction in petrol prices7 by the State Trading Organization (STO) towards the end of Q1-2020, as part of the economic recovery plan to minimize the negative impact of the COVID-19 on households and
7 Effective 21 March 2020, the price of petrol was reduced by MVR1.52, to total MVR8.07 per litre. This was after a price cut on 13 March 2020, during which petrol price were reduced by MVR0.53 per litre.

Maldives Monetary AuthorityAnnual Report 202036
businesses. This was also aided by the sizable plummeting of global demand and the subsequent historic drop in crude oil prices in the international market, owing to the plunge in global economic activity due to the widespread pandemic containment measures. Meanwhile, the cost of domestic passenger sea and air transport declined by 3.1% and 2.0%, respectively during the year, reflecting the slump in domestic transportation amid the pandemic-related travel restrictions and ongoing community spread in the country. However, the cost of international passenger air travel observed a growth of 3.8% in 2020, particularly towards the last quarter, in line with the opening of the international borders and easing of travel and other restrictive measures imposed to curb the spread of the virus. International airfare for some destinations rose due to the discontinuation of COVID-related airfare discounts provided by airlines.
In contrast, the prices of food items were the primary contributors to the upward pressure on inflation during the year, registering a growth of 3.0%. This was largely driven by the growth in prices of certain vegetables—observing a growth of 17.8%—owing to increases in prices in both the ‘other vegetables’ category (which grew by 25.6% and includes onions, potatoes and carrots) and fruit bearing vegetables (which grew by 10.0%). The other vegetables category surged by 101% in the first quarter, reflecting both the Ramadan demand and the lockdown-related supply chain disruptions8,
while the surge during the third quarter reflected both the supply chain disruptions caused by lockdowns as well as crop damage due to heavy monsoon rainfall in the main import source market, India. However, the supply improved towards the end of the year, alleviating the shortages and reducing prices in the markets. As for fruits, prices increased primarily due to the growth in prices of citrus fruits, which recorded an increase of 14.2%, while the prices of dates, figs and other tropical fruits grew by 9.5%. These increases were offset to an extent by the decline (10.5%) in the ‘other fruits’ category. Meanwhile, fish prices registered a 2.5% growth, owing largely to the 4.5% growth in prices of live, fresh, chilled or frozen fish, while dried, salted, in brine or smoked fish observed an increase of 4.2% during the year.
Considering other major categories which contributed positively to inflation during the year, the price of cigarettes increased by 15.5%, while other tobacco products also observed a growth of 19.4%. This was following the ratification of the 17th amendment of the Export-Import Act in July 2020, which saw the per unit tax on cigarettes increased from MVR2.0 to MVR3.0. Meanwhile, prices in the restaurants and cafés category observed an increasing trend throughout the year, with an overall growth of 1.1% in 2020. Contrastingly, the notable decline in clothing and footwear prices (1.9%), due to lower prices of garments for men and boys, exerted downward pressure on inflation during the year.
8 This was despite the government-imposed price controls on products such as red onions, potatoes, yellow lentils and eggs, and the announcement of penalties such as a fine of MVR100,000 and six-month business closure, for retailers who sell at higher prices.
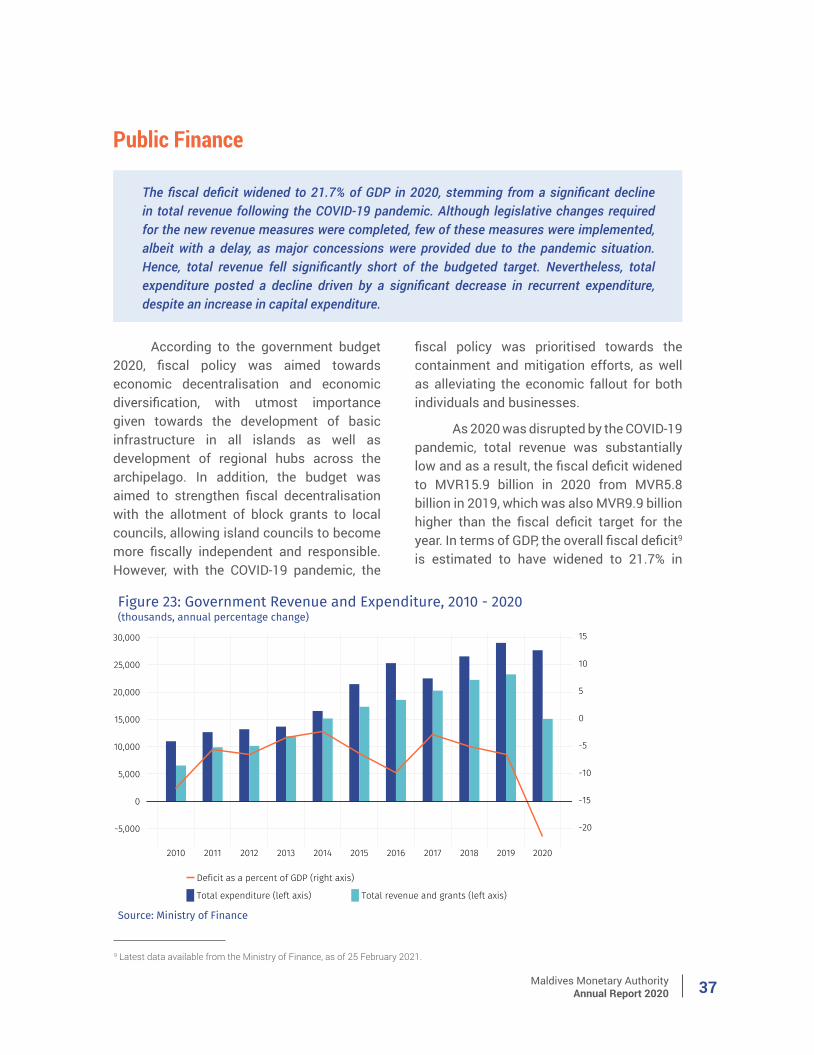
Maldives Monetary AuthorityAnnual Report 2020 37
The fiscal deficit widened to 21.7% of GDP in 2020, stemming from a significant decline in total revenue following the COVID-19 pandemic. Although legislative changes required for the new revenue measures were completed, few of these measures were implemented, albeit with a delay, as major concessions were provided due to the pandemic situation. Hence, total revenue fell significantly short of the budgeted target. Nevertheless, total expenditure posted a decline driven by a significant decrease in recurrent expenditure, despite an increase in capital expenditure.
Public Finance
According to the government budget 2020, fiscal policy was aimed towards economic decentralisation and economic diversification, with utmost importance given towards the development of basic infrastructure in all islands as well as development of regional hubs across the archipelago. In addition, the budget was aimed to strengthen fiscal decentralisation with the allotment of block grants to local councils, allowing island councils to become more fiscally independent and responsible. However, with the COVID-19 pandemic, the
fiscal policy was prioritised towards the containment and mitigation efforts, as well as alleviating the economic fallout for both individuals and businesses.
As 2020 was disrupted by the COVID-19 pandemic, total revenue was substantially low and as a result, the fiscal deficit widened to MVR15.9 billion in 2020 from MVR5.8 billion in 2019, which was also MVR9.9 billion higher than the fiscal deficit target for the year. In terms of GDP, the overall fiscal deficit9 is estimated to have widened to 21.7% in
9 Latest data available from the Ministry of Finance, as of 25 February 2021.
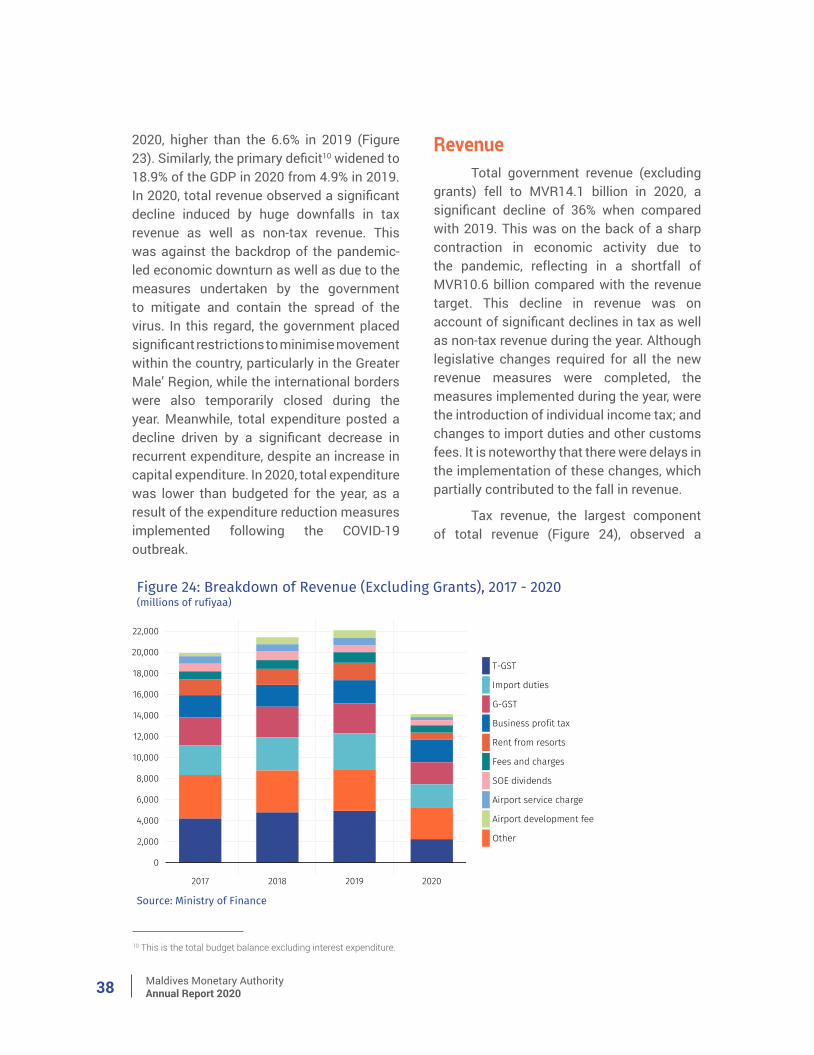
Maldives Monetary AuthorityAnnual Report 202038
2020, higher than the 6.6% in 2019 (Figure 23). Similarly, the primary deficit10 widened to 18.9% of the GDP in 2020 from 4.9% in 2019. In 2020, total revenue observed a significant decline induced by huge downfalls in tax revenue as well as non-tax revenue. This was against the backdrop of the pandemic-led economic downturn as well as due to the measures undertaken by the government to mitigate and contain the spread of the virus. In this regard, the government placed significant restrictions to minimise movement within the country, particularly in the Greater Male’ Region, while the international borders were also temporarily closed during the year. Meanwhile, total expenditure posted a decline driven by a significant decrease in recurrent expenditure, despite an increase in capital expenditure. In 2020, total expenditure was lower than budgeted for the year, as a result of the expenditure reduction measures implemented following the COVID-19 outbreak.
RevenueTotal government revenue (excluding
grants) fell to MVR14.1 billion in 2020, a significant decline of 36% when compared with 2019. This was on the back of a sharp contraction in economic activity due to the pandemic, reflecting in a shortfall of MVR10.6 billion compared with the revenue target. This decline in revenue was on account of significant declines in tax as well as non-tax revenue during the year. Although legislative changes required for all the new revenue measures were completed, the measures implemented during the year, were the introduction of individual income tax; and changes to import duties and other customs fees. It is noteworthy that there were delays in the implementation of these changes, which partially contributed to the fall in revenue.
Tax revenue, the largest component of total revenue (Figure 24), observed a
10 This is the total budget balance excluding interest expenditure.
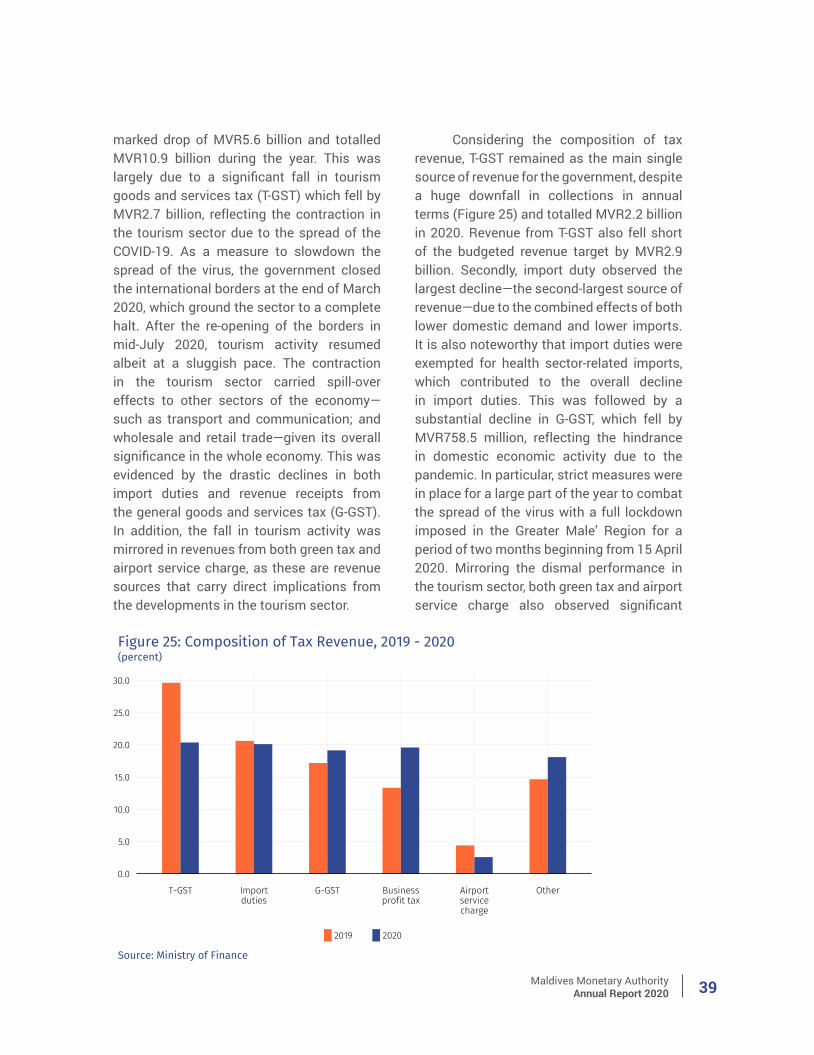
Maldives Monetary AuthorityAnnual Report 2020 39
marked drop of MVR5.6 billion and totalled MVR10.9 billion during the year. This was largely due to a significant fall in tourism goods and services tax (T-GST) which fell by MVR2.7 billion, reflecting the contraction in the tourism sector due to the spread of the COVID-19. As a measure to slowdown the spread of the virus, the government closed the international borders at the end of March 2020, which ground the sector to a complete halt. After the re-opening of the borders in mid-July 2020, tourism activity resumed albeit at a sluggish pace. The contraction in the tourism sector carried spill-over effects to other sectors of the economy—such as transport and communication; and wholesale and retail trade—given its overall significance in the whole economy. This was evidenced by the drastic declines in both import duties and revenue receipts from the general goods and services tax (G-GST). In addition, the fall in tourism activity was mirrored in revenues from both green tax and airport service charge, as these are revenue sources that carry direct implications from the developments in the tourism sector.
Considering the composition of tax revenue, T-GST remained as the main single source of revenue for the government, despite a huge downfall in collections in annual terms (Figure 25) and totalled MVR2.2 billion in 2020. Revenue from T-GST also fell short of the budgeted revenue target by MVR2.9 billion. Secondly, import duty observed the largest decline—the second-largest source of revenue—due to the combined effects of both lower domestic demand and lower imports. It is also noteworthy that import duties were exempted for health sector-related imports, which contributed to the overall decline in import duties. This was followed by a substantial decline in G-GST, which fell by MVR758.5 million, reflecting the hindrance in domestic economic activity due to the pandemic. In particular, strict measures were in place for a large part of the year to combat the spread of the virus with a full lockdown imposed in the Greater Male’ Region for a period of two months beginning from 15 April 2020. Mirroring the dismal performance in the tourism sector, both green tax and airport service charge also observed significant
Maldives Monetary AuthorityAnnual Report 202040
declines of MVR498.9 million and MVR447.8 million, respectively. On the upside, receipts from the business and property tax11 observed a noticeable growth which curbed further dampening of revenue. This was driven by both other business and property tax (which consists mainly of bank profit tax); and individual income tax which offset the decrease in business profit tax (BPT). Individual income tax was a new revenue measure implemented by the government during the year.
Non-tax revenue fell by MVR2.2 billion and totalled MVR3.4 billion during 2020. This was mainly on account of a fall in rent from resorts; as well as fees and charges, which posted declines of MVR1.0 billion and MVR777.9 million, respectively. As such, the fall in rent from resorts was due to the deferments12 allowed by the government to alleviate the adverse economic impact of the pandemic on the tourism industry. Meanwhile, the decline in fees and charges was mainly driven by lower collections in airport development fee, reflecting the fall in tourist arrivals as well as lower revenue collected as other fees and charges. In addition, dividends from state-owned enterprises (SOE) posted a sizeable decrease, which can be primarily attributed to the non-payment of dividends by most of the SOEs due to cashflow difficulties faced by such companies.
ExpenditureTotal government expenditure
(excluding net lending) amounted to MVR27.7 billion in 2020, registering a decline of MVR1.3 billion in annual terms. The decline in total expenditure was driven by a significant decrease in recurrent expenditure,
while capital expenditure observed an increase during the year. This was also in line with the government’s pledge to cut down recurrent expenditure by MVR1.0 billion, as a fiscal measure to reduce government expenses following the COVID-19 outbreak in the Maldives.
Recurrent expenditure—which accounted for 70% of total expenditure—decreased by MVR1.9 billion and totalled MVR19.5 billion (Figure 26). This was 13% less than the amount budgeted for recurrent expenditure in 2020. The decrease in recurrent expenditure largely stemmed from expenses incurred as losses and write-offs which observed a decline of MVR1.3 billion, mirroring the one-off payments made in the preceding year as compensation settlements to resolve disputes from arbitration cases regarding questionable contracts. The second largest decline in recurrent expenditure was observed in administrative and operational expenses which registered a decline of MVR588.1 million, with all major categories observing a decline except for income support and job seeker allowance; and financing and interest costs. Particularly, job seeker allowance, which observed a growth of MVR307.5 million, was a fiscal measure implemented by the government to support workers affected by the pandemic. Looking into major categories in administrative and operational expenses, the largest decreases were observed in administrative services, and repairs and maintenance. This can be attributed to the cost reduction strategies adopted by the government to reallocate the funds for health sector-related spending. Also, the closure of government offices and the transition to work-from-home contributed to this decline. Further, sizeable declines were also observed in grants
11 Business and Property Tax revenues for 2019 were collected during 2020.12 The government allowed a year-long deferment on tourism land rent as well as those on agricultural islands, as part of the fiscal measures in response to COVID-19.

Maldives Monetary AuthorityAnnual Report 2020 41
Maldives Monetary AuthorityAnnual Report 202042
and contributions; and the national health insurance scheme (Aasandha). Specifically, the expenditure on Aasandha was dragged down by difficulties in receiving health care due to movement restrictions within the country as well as abroad.
Meanwhile, salaries and wages continued to account for the highest share of the total recurrent expenditure, although it remained broadly unchanged in annual terms, as an increase in allowances to employees was offset by a fall in salaries and wages. The government implemented measures to reduce the expenditure on this category such as imposing a four-month salary reduction on the salaries exceeding a specific threshold; halting the recruitment of new employees; and deduction of salaries of political appointees above a certain rank, and members of the parliament. However, this was met by a proportionate increase in allowances to employees, largely reflecting increased costs on front-line workers of the COVID-19 response.
Capital expenditure recorded a growth of MVR538.2 million and totalled MVR8.2 billion in 2020, although this was significantly lower than the amount budgeted for the year. While capital expenditure was lower than expected due to the government’s decision to delay the commencement of some projects, as a measure to cut down expenses following the pandemic, it was higher compared to the previous year due to two key reasons. Firstly, faster progressions were made in the commencement of the PSIP projects unlike the previous year, evidenced by the increased expenditure on land and buildings. This also mirrored the development of quarantine and isolation facilities related to the pandemic mitigation efforts. Secondly,
the HDC was provisioned support from the budget. Moreover, the government provided support to public enterprises, in the form of capital injections, to sustain operations. This was reflected in the increased expenditure on development projects and investments outlays, which registered a growth of MVR919.4 million, the largest capital increase during the year. Further, loans were issued to businesses under the economic relief package through the Bank of Maldives Plc (BML) and SME Development Finance Corporation (SDFC).
FinancingDue to the COVID-19 pandemic,
total revenue of the government observed a significant downfall which resulted in a substantial increase in the fiscal deficit. During 2020, the fiscal deficit was mostly financed through domestic sources, while borrowing through external sources also observed a sizeable increase. Hence, financing through both domestic and external sources highly exceeded the budgeted target for the year.
Domestic borrowing by the government—consisting of both short-term and long-term loans and debt securities—represented a net borrowing of MVR9.4 billion in 2020, a significant increase when compared with the net borrowing of MVR4.6 billion recorded in the previous year. The higher net borrowing during the year largely reflected a marked increase in issuance of government securities, followed by an increase in borrowings from the central bank13. Hence, the issuance of government securities—treasury bills and treasury bonds14—was the primary source of domestic borrowing
13 This was enacted following the suspension of certain clauses of the Fiscal Responsibility Act by the People’s Majlis for a one-year period, at the request of the government, allowing long-term loans to be taken from the MMA.
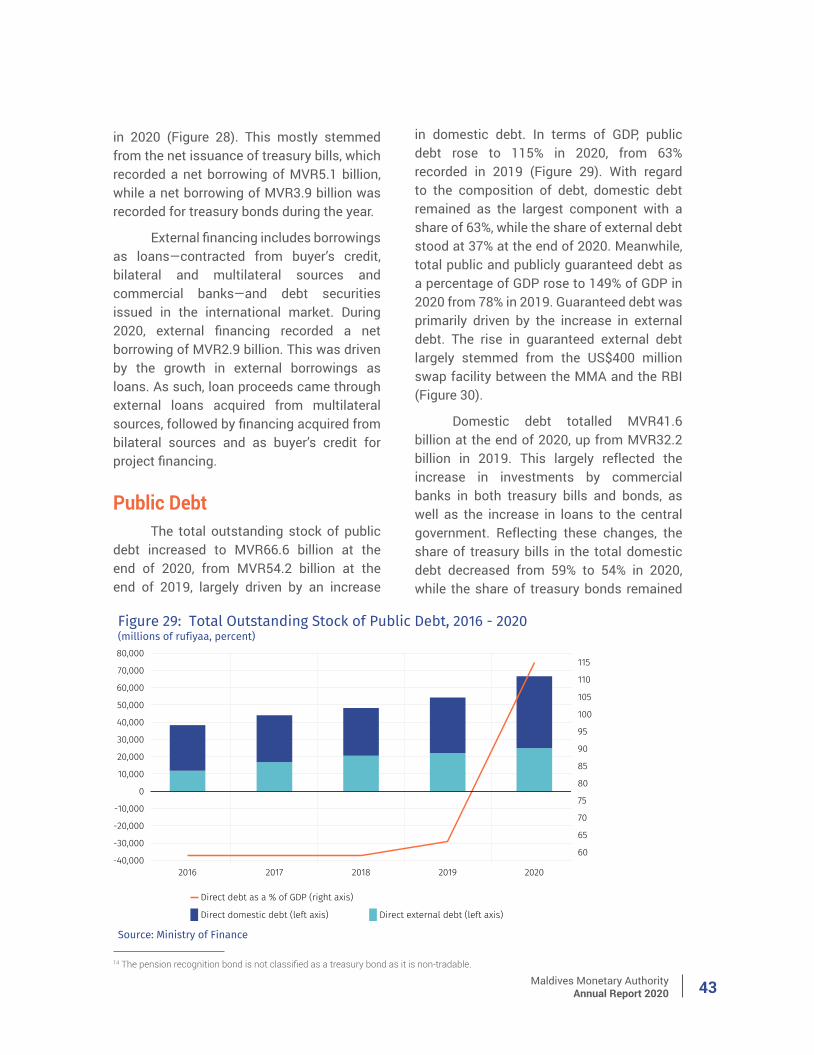
Maldives Monetary AuthorityAnnual Report 2020 43
in 2020 (Figure 28). This mostly stemmed from the net issuance of treasury bills, which recorded a net borrowing of MVR5.1 billion, while a net borrowing of MVR3.9 billion was recorded for treasury bonds during the year.
External financing includes borrowings as loans—contracted from buyer’s credit, bilateral and multilateral sources and commercial banks—and debt securities issued in the international market. During 2020, external financing recorded a net borrowing of MVR2.9 billion. This was driven by the growth in external borrowings as loans. As such, loan proceeds came through external loans acquired from multilateral sources, followed by financing acquired from bilateral sources and as buyer’s credit for project financing.
Public DebtThe total outstanding stock of public
debt increased to MVR66.6 billion at the end of 2020, from MVR54.2 billion at the end of 2019, largely driven by an increase
in domestic debt. In terms of GDP, public debt rose to 115% in 2020, from 63% recorded in 2019 (Figure 29). With regard to the composition of debt, domestic debt remained as the largest component with a share of 63%, while the share of external debt stood at 37% at the end of 2020. Meanwhile, total public and publicly guaranteed debt as a percentage of GDP rose to 149% of GDP in 2020 from 78% in 2019. Guaranteed debt was primarily driven by the increase in external debt. The rise in guaranteed external debt largely stemmed from the US$400 million swap facility between the MMA and the RBI (Figure 30).
Domestic debt totalled MVR41.6 billion at the end of 2020, up from MVR32.2 billion in 2019. This largely reflected the increase in investments by commercial banks in both treasury bills and bonds, as well as the increase in loans to the central government. Reflecting these changes, the share of treasury bills in the total domestic debt decreased from 59% to 54% in 2020, while the share of treasury bonds remained
14 The pension recognition bond is not classified as a treasury bond as it is non-tradable.
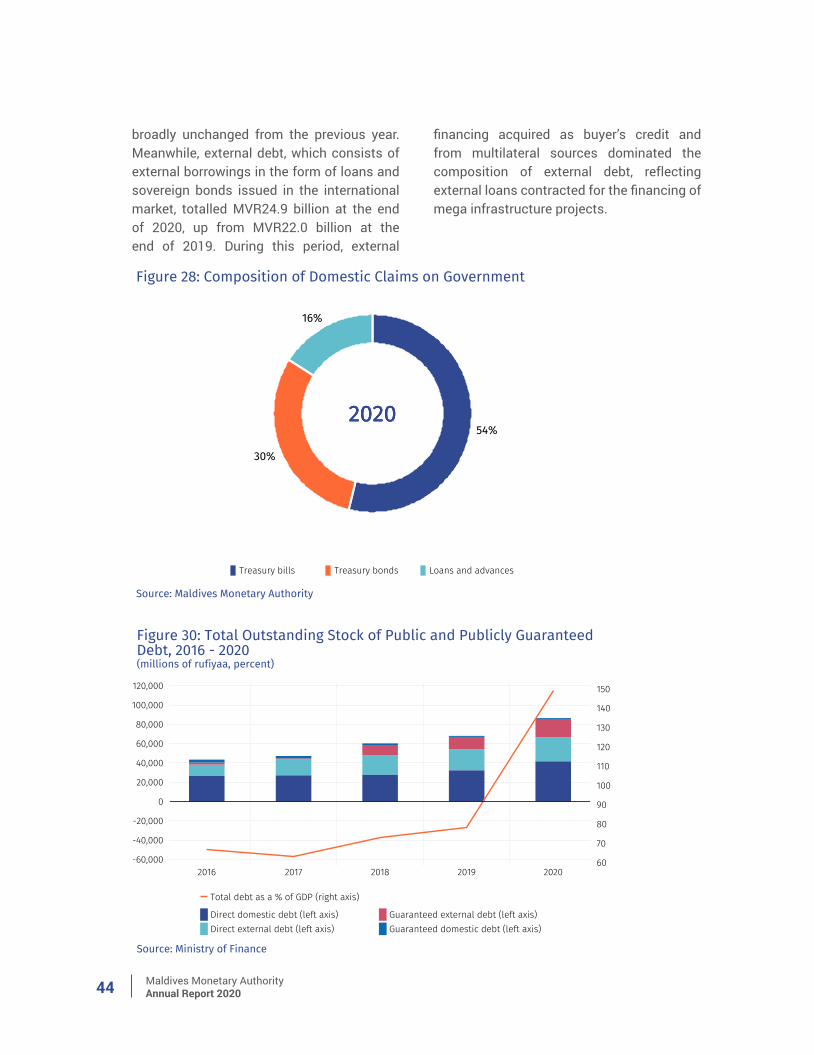
Maldives Monetary AuthorityAnnual Report 202044
broadly unchanged from the previous year. Meanwhile, external debt, which consists of external borrowings in the form of loans and sovereign bonds issued in the international market, totalled MVR24.9 billion at the end of 2020, up from MVR22.0 billion at the end of 2019. During this period, external
financing acquired as buyer’s credit and from multilateral sources dominated the composition of external debt, reflecting external loans contracted for the financing of mega infrastructure projects.
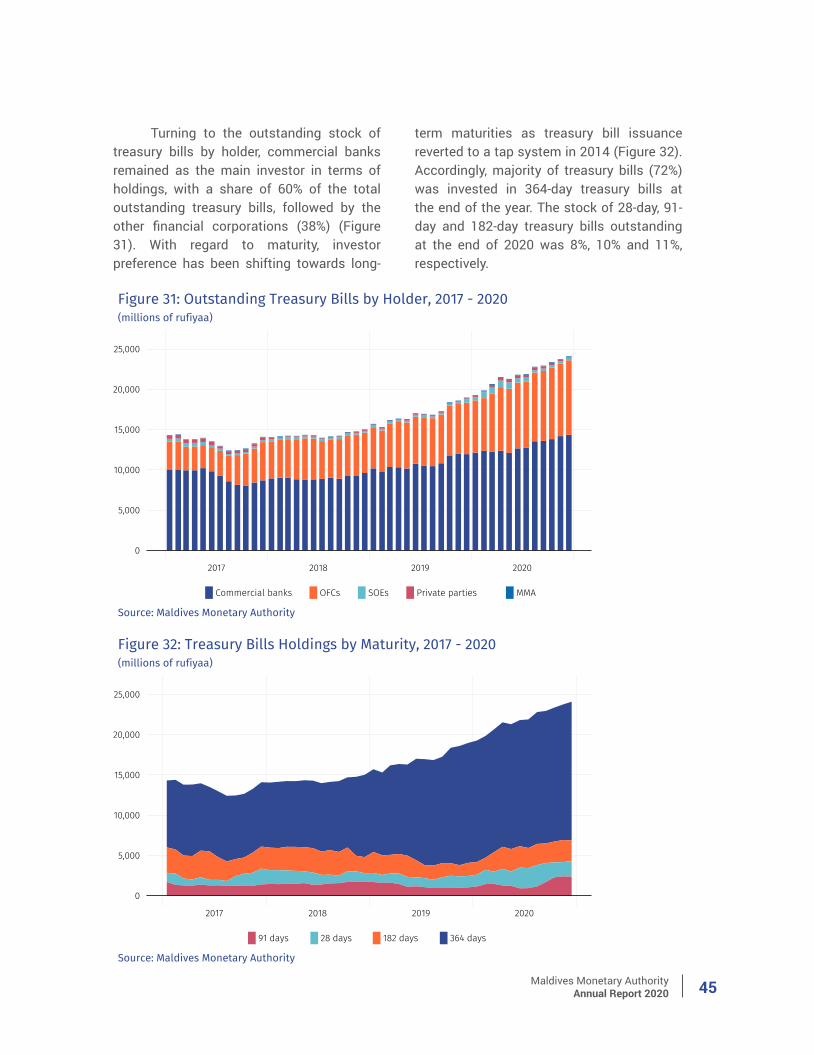
Maldives Monetary AuthorityAnnual Report 2020 45
Turning to the outstanding stock of treasury bills by holder, commercial banks remained as the main investor in terms of holdings, with a share of 60% of the total outstanding treasury bills, followed by the other financial corporations (38%) (Figure 31). With regard to maturity, investor preference has been shifting towards long-
term maturities as treasury bill issuance reverted to a tap system in 2014 (Figure 32). Accordingly, majority of treasury bills (72%) was invested in 364-day treasury bills at the end of the year. The stock of 28-day, 91-day and 182-day treasury bills outstanding at the end of 2020 was 8%, 10% and 11%, respectively.
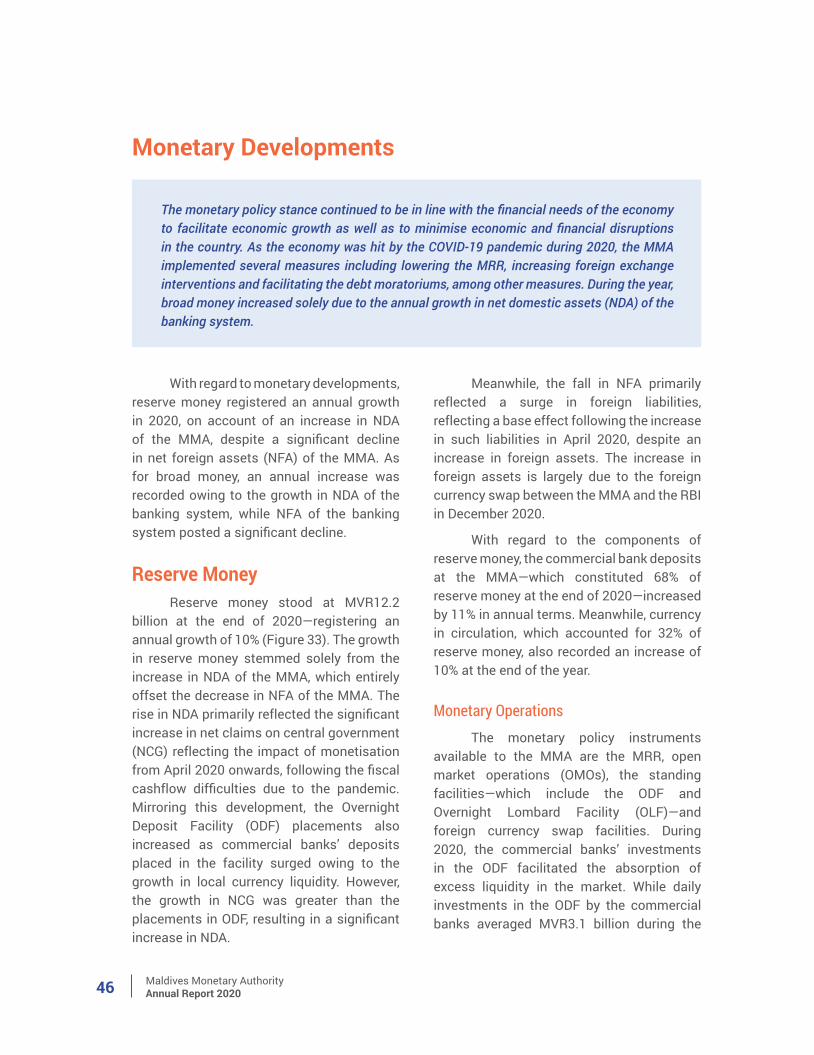
Maldives Monetary AuthorityAnnual Report 202046
The monetary policy stance continued to be in line with the financial needs of the economy to facilitate economic growth as well as to minimise economic and financial disruptions in the country. As the economy was hit by the COVID-19 pandemic during 2020, the MMA implemented several measures including lowering the MRR, increasing foreign exchange interventions and facilitating the debt moratoriums, among other measures. During the year, broad money increased solely due to the annual growth in net domestic assets (NDA) of the banking system.
Monetary Developments
With regard to monetary developments, reserve money registered an annual growth in 2020, on account of an increase in NDA of the MMA, despite a significant decline in net foreign assets (NFA) of the MMA. As for broad money, an annual increase was recorded owing to the growth in NDA of the banking system, while NFA of the banking system posted a significant decline.
Reserve MoneyReserve money stood at MVR12.2
billion at the end of 2020—registering an annual growth of 10% (Figure 33). The growth in reserve money stemmed solely from the increase in NDA of the MMA, which entirely offset the decrease in NFA of the MMA. The rise in NDA primarily reflected the significant increase in net claims on central government (NCG) reflecting the impact of monetisation from April 2020 onwards, following the fiscal cashflow difficulties due to the pandemic. Mirroring this development, the Overnight Deposit Facility (ODF) placements also increased as commercial banks’ deposits placed in the facility surged owing to the growth in local currency liquidity. However, the growth in NCG was greater than the placements in ODF, resulting in a significant increase in NDA.
Meanwhile, the fall in NFA primarily reflected a surge in foreign liabilities, reflecting a base effect following the increase in such liabilities in April 2020, despite an increase in foreign assets. The increase in foreign assets is largely due to the foreign currency swap between the MMA and the RBI in December 2020.
With regard to the components of reserve money, the commercial bank deposits at the MMA—which constituted 68% of reserve money at the end of 2020—increased by 11% in annual terms. Meanwhile, currency in circulation, which accounted for 32% of reserve money, also recorded an increase of 10% at the end of the year.
Monetary OperationsThe monetary policy instruments
available to the MMA are the MRR, open market operations (OMOs), the standing facilities—which include the ODF and Overnight Lombard Facility (OLF)—and foreign currency swap facilities. During 2020, the commercial banks’ investments in the ODF facilitated the absorption of excess liquidity in the market. While daily investments in the ODF by the commercial banks averaged MVR3.1 billion during the
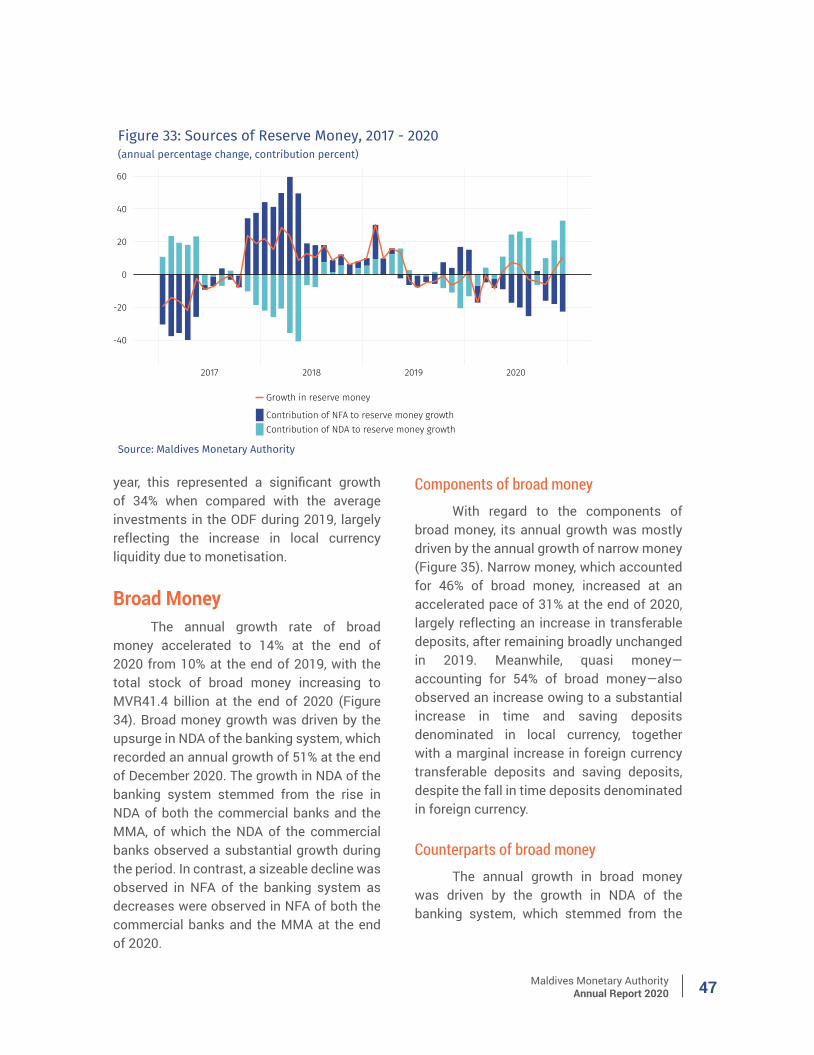
Maldives Monetary AuthorityAnnual Report 2020 47
year, this represented a significant growth of 34% when compared with the average investments in the ODF during 2019, largely reflecting the increase in local currency liquidity due to monetisation.
Broad MoneyThe annual growth rate of broad
money accelerated to 14% at the end of 2020 from 10% at the end of 2019, with the total stock of broad money increasing to MVR41.4 billion at the end of 2020 (Figure 34). Broad money growth was driven by the upsurge in NDA of the banking system, which recorded an annual growth of 51% at the end of December 2020. The growth in NDA of the banking system stemmed from the rise in NDA of both the commercial banks and the MMA, of which the NDA of the commercial banks observed a substantial growth during the period. In contrast, a sizeable decline was observed in NFA of the banking system as decreases were observed in NFA of both the commercial banks and the MMA at the end of 2020.
Components of broad moneyWith regard to the components of
broad money, its annual growth was mostly driven by the annual growth of narrow money (Figure 35). Narrow money, which accounted for 46% of broad money, increased at an accelerated pace of 31% at the end of 2020, largely reflecting an increase in transferable deposits, after remaining broadly unchanged in 2019. Meanwhile, quasi money—accounting for 54% of broad money—also observed an increase owing to a substantial increase in time and saving deposits denominated in local currency, together with a marginal increase in foreign currency transferable deposits and saving deposits, despite the fall in time deposits denominated in foreign currency.
Counterparts of broad money The annual growth in broad money
was driven by the growth in NDA of the banking system, which stemmed from the
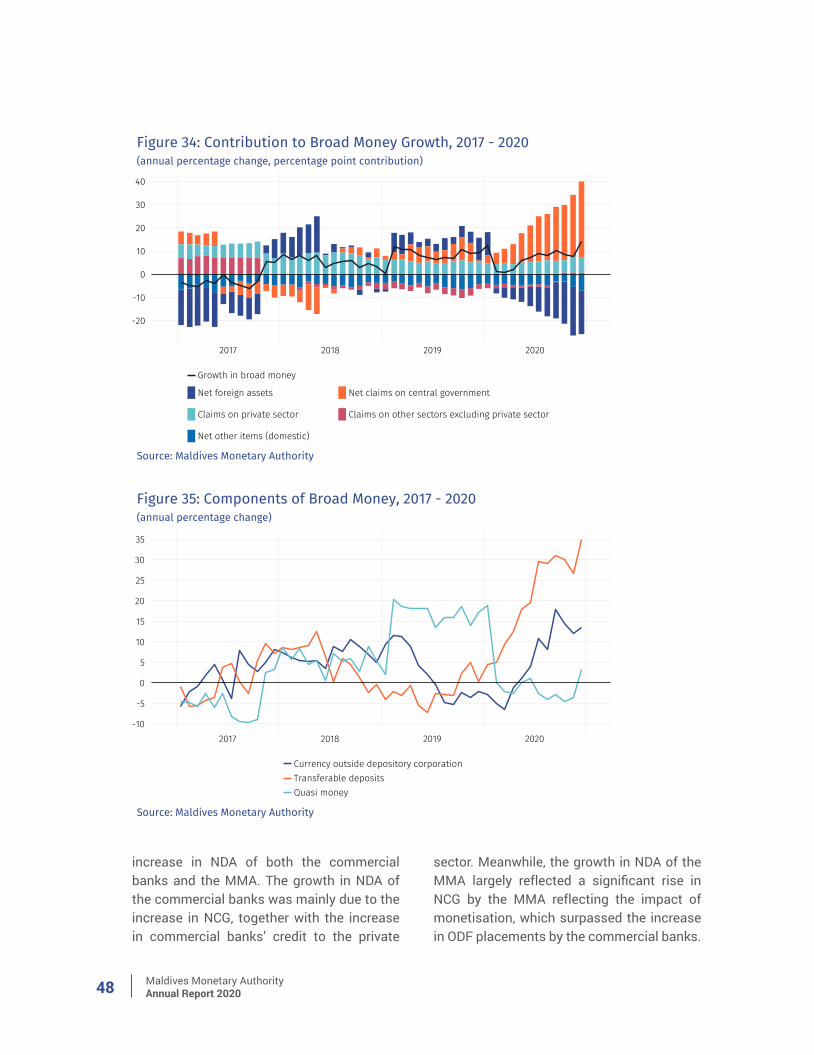
Maldives Monetary AuthorityAnnual Report 202048
increase in NDA of both the commercial banks and the MMA. The growth in NDA of the commercial banks was mainly due to the increase in NCG, together with the increase in commercial banks’ credit to the private
sector. Meanwhile, the growth in NDA of the MMA largely reflected a significant rise in NCG by the MMA reflecting the impact of monetisation, which surpassed the increase in ODF placements by the commercial banks.
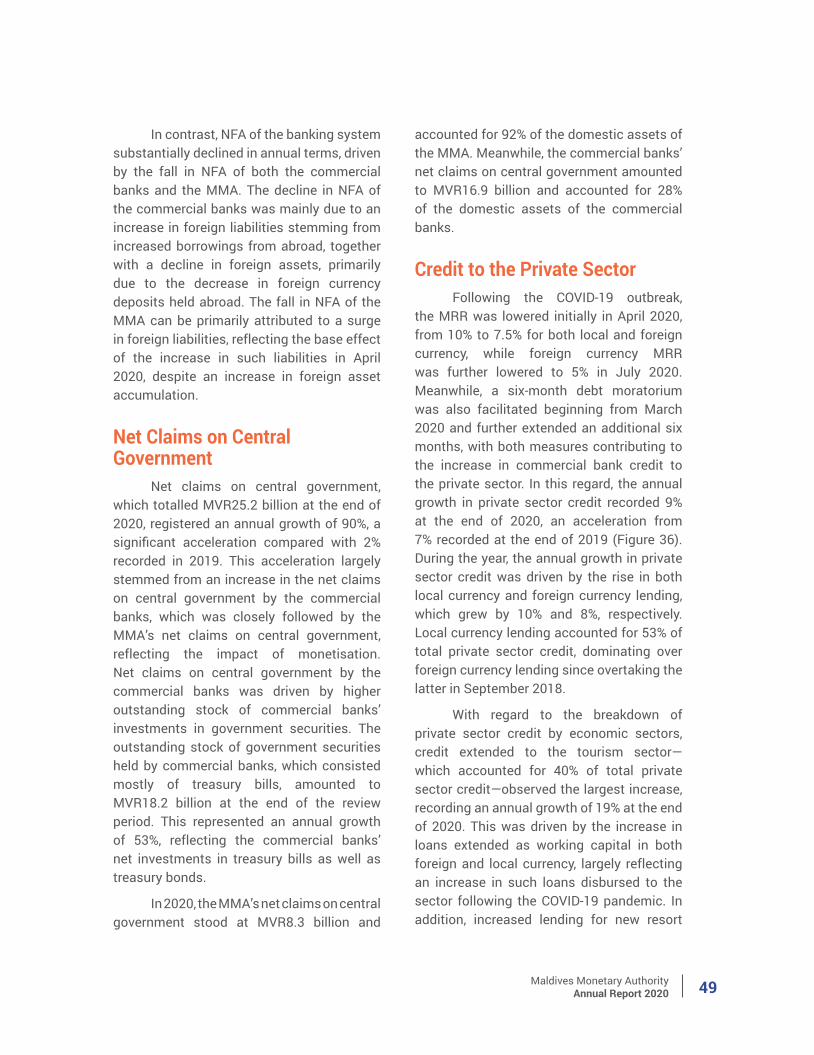
Maldives Monetary AuthorityAnnual Report 2020 49
In contrast, NFA of the banking system substantially declined in annual terms, driven by the fall in NFA of both the commercial banks and the MMA. The decline in NFA of the commercial banks was mainly due to an increase in foreign liabilities stemming from increased borrowings from abroad, together with a decline in foreign assets, primarily due to the decrease in foreign currency deposits held abroad. The fall in NFA of the MMA can be primarily attributed to a surge in foreign liabilities, reflecting the base effect of the increase in such liabilities in April 2020, despite an increase in foreign asset accumulation.
Net Claims on Central Government
Net claims on central government, which totalled MVR25.2 billion at the end of 2020, registered an annual growth of 90%, a significant acceleration compared with 2% recorded in 2019. This acceleration largely stemmed from an increase in the net claims on central government by the commercial banks, which was closely followed by the MMA’s net claims on central government, reflecting the impact of monetisation. Net claims on central government by the commercial banks was driven by higher outstanding stock of commercial banks’ investments in government securities. The outstanding stock of government securities held by commercial banks, which consisted mostly of treasury bills, amounted to MVR18.2 billion at the end of the review period. This represented an annual growth of 53%, reflecting the commercial banks’ net investments in treasury bills as well as treasury bonds.
In 2020, the MMA’s net claims on central government stood at MVR8.3 billion and
accounted for 92% of the domestic assets of the MMA. Meanwhile, the commercial banks’ net claims on central government amounted to MVR16.9 billion and accounted for 28% of the domestic assets of the commercial banks.
Credit to the Private SectorFollowing the COVID-19 outbreak,
the MRR was lowered initially in April 2020, from 10% to 7.5% for both local and foreign currency, while foreign currency MRR was further lowered to 5% in July 2020. Meanwhile, a six-month debt moratorium was also facilitated beginning from March 2020 and further extended an additional six months, with both measures contributing to the increase in commercial bank credit to the private sector. In this regard, the annual growth in private sector credit recorded 9% at the end of 2020, an acceleration from 7% recorded at the end of 2019 (Figure 36). During the year, the annual growth in private sector credit was driven by the rise in both local currency and foreign currency lending, which grew by 10% and 8%, respectively. Local currency lending accounted for 53% of total private sector credit, dominating over foreign currency lending since overtaking the latter in September 2018.
With regard to the breakdown of private sector credit by economic sectors, credit extended to the tourism sector—which accounted for 40% of total private sector credit—observed the largest increase, recording an annual growth of 19% at the end of 2020. This was driven by the increase in loans extended as working capital in both foreign and local currency, largely reflecting an increase in such loans disbursed to the sector following the COVID-19 pandemic. In addition, increased lending for new resort
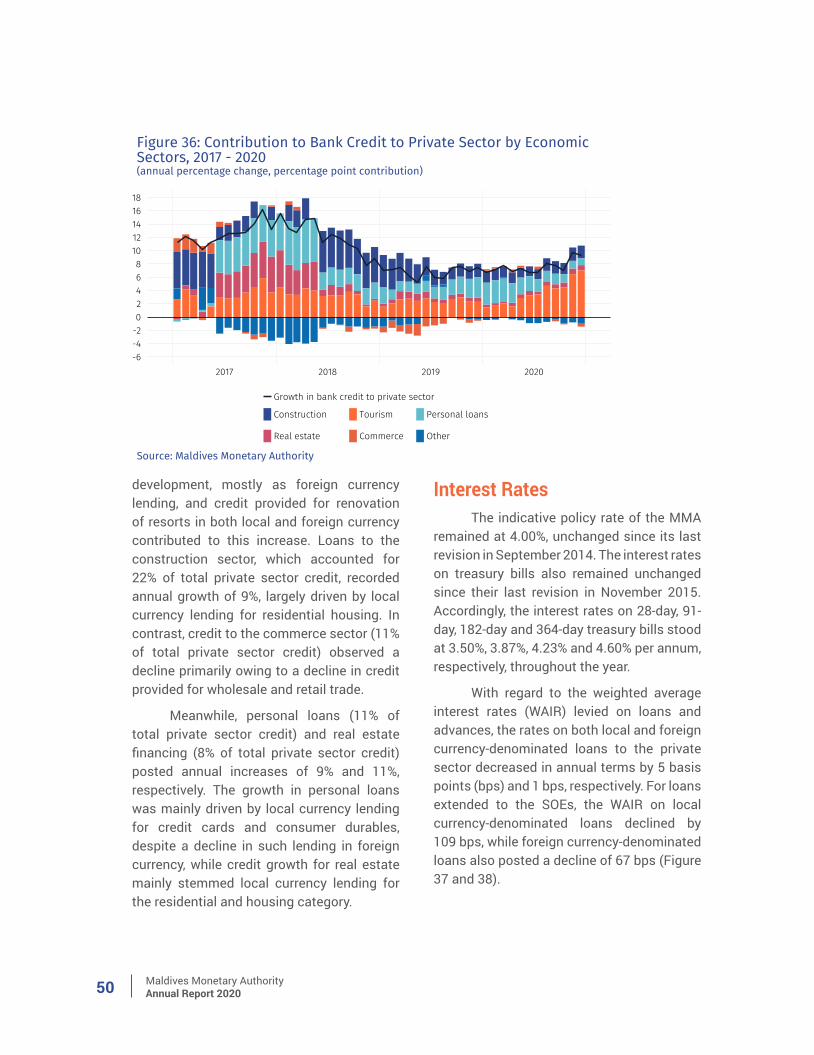
Maldives Monetary AuthorityAnnual Report 202050
development, mostly as foreign currency lending, and credit provided for renovation of resorts in both local and foreign currency contributed to this increase. Loans to the construction sector, which accounted for 22% of total private sector credit, recorded annual growth of 9%, largely driven by local currency lending for residential housing. In contrast, credit to the commerce sector (11% of total private sector credit) observed a decline primarily owing to a decline in credit provided for wholesale and retail trade.
Meanwhile, personal loans (11% of total private sector credit) and real estate financing (8% of total private sector credit) posted annual increases of 9% and 11%, respectively. The growth in personal loans was mainly driven by local currency lending for credit cards and consumer durables, despite a decline in such lending in foreign currency, while credit growth for real estate mainly stemmed local currency lending for the residential and housing category.
Interest RatesThe indicative policy rate of the MMA
remained at 4.00%, unchanged since its last revision in September 2014. The interest rates on treasury bills also remained unchanged since their last revision in November 2015. Accordingly, the interest rates on 28-day, 91- day, 182-day and 364-day treasury bills stood at 3.50%, 3.87%, 4.23% and 4.60% per annum, respectively, throughout the year.
With regard to the weighted average interest rates (WAIR) levied on loans and advances, the rates on both local and foreign currency-denominated loans to the private sector decreased in annual terms by 5 basis points (bps) and 1 bps, respectively. For loans extended to the SOEs, the WAIR on local currency-denominated loans declined by 109 bps, while foreign currency-denominated loans also posted a decline of 67 bps (Figure 37 and 38).
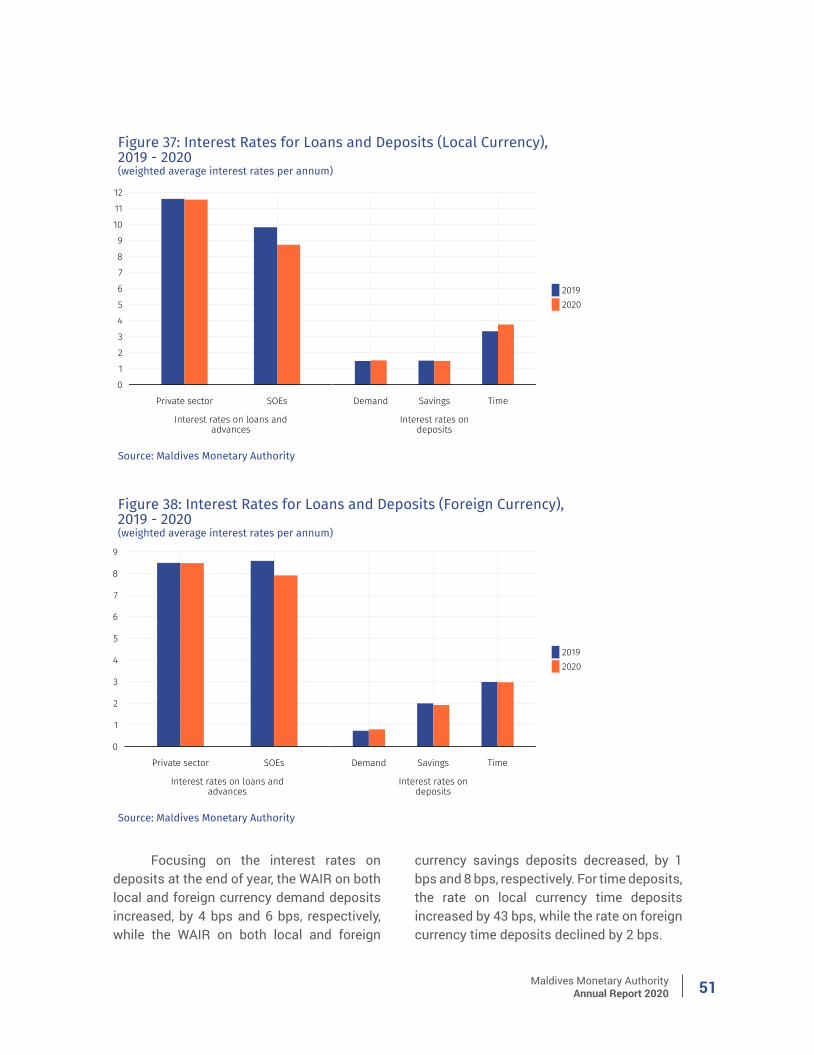
Maldives Monetary AuthorityAnnual Report 2020 51
Focusing on the interest rates on deposits at the end of year, the WAIR on both local and foreign currency demand deposits increased, by 4 bps and 6 bps, respectively, while the WAIR on both local and foreign
currency savings deposits decreased, by 1 bps and 8 bps, respectively. For time deposits, the rate on local currency time deposits increased by 43 bps, while the rate on foreign currency time deposits declined by 2 bps.
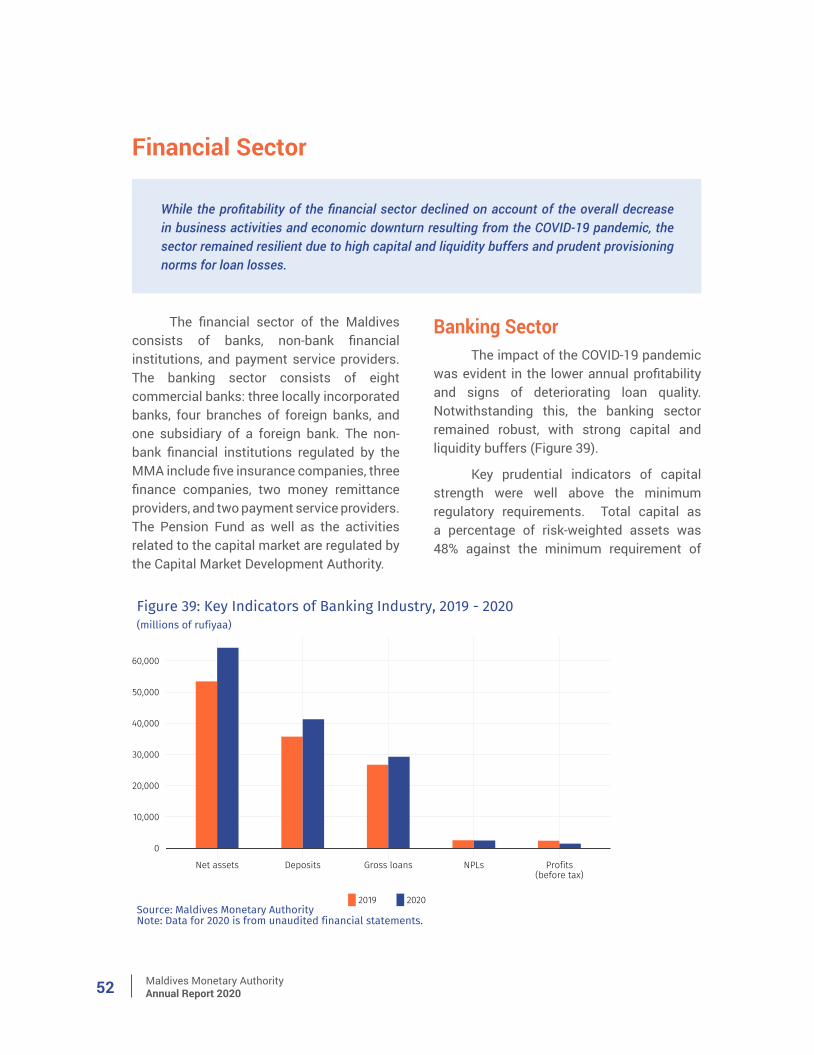
Maldives Monetary AuthorityAnnual Report 202052
While the profitability of the financial sector declined on account of the overall decrease in business activities and economic downturn resulting from the COVID-19 pandemic, the sector remained resilient due to high capital and liquidity buffers and prudent provisioning norms for loan losses.
Financial Sector
The financial sector of the Maldives consists of banks, non-bank financial institutions, and payment service providers. The banking sector consists of eight commercial banks: three locally incorporated banks, four branches of foreign banks, and one subsidiary of a foreign bank. The non-bank financial institutions regulated by the MMA include five insurance companies, three finance companies, two money remittance providers, and two payment service providers. The Pension Fund as well as the activities related to the capital market are regulated by the Capital Market Development Authority.
Banking SectorThe impact of the COVID-19 pandemic
was evident in the lower annual profitability and signs of deteriorating loan quality. Notwithstanding this, the banking sector remained robust, with strong capital and liquidity buffers (Figure 39).
Key prudential indicators of capital strength were well above the minimum regulatory requirements. Total capital as a percentage of risk-weighted assets was 48% against the minimum requirement of
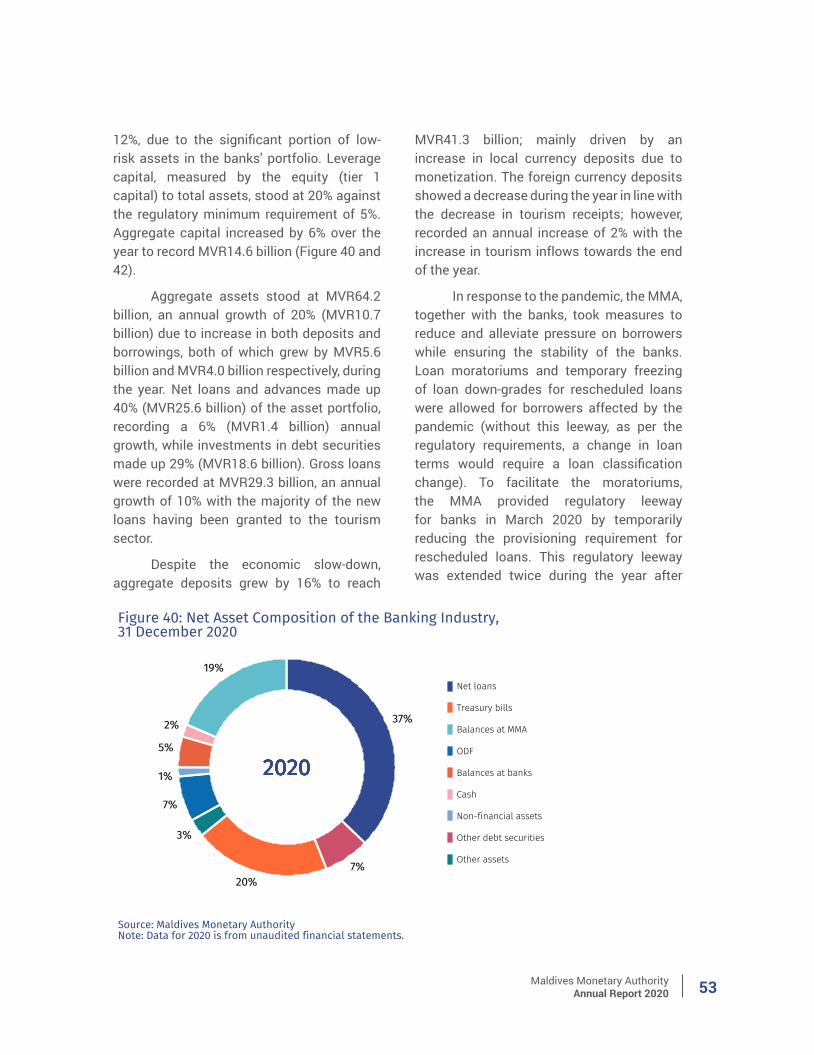
Maldives Monetary AuthorityAnnual Report 2020 53
12%, due to the significant portion of low-risk assets in the banks’ portfolio. Leverage capital, measured by the equity (tier 1 capital) to total assets, stood at 20% against the regulatory minimum requirement of 5%. Aggregate capital increased by 6% over the year to record MVR14.6 billion (Figure 40 and 42).
Aggregate assets stood at MVR64.2 billion, an annual growth of 20% (MVR10.7 billion) due to increase in both deposits and borrowings, both of which grew by MVR5.6 billion and MVR4.0 billion respectively, during the year. Net loans and advances made up 40% (MVR25.6 billion) of the asset portfolio, recording a 6% (MVR1.4 billion) annual growth, while investments in debt securities made up 29% (MVR18.6 billion). Gross loans were recorded at MVR29.3 billion, an annual growth of 10% with the majority of the new loans having been granted to the tourism sector.
Despite the economic slow-down, aggregate deposits grew by 16% to reach
MVR41.3 billion; mainly driven by an increase in local currency deposits due to monetization. The foreign currency deposits showed a decrease during the year in line with the decrease in tourism receipts; however, recorded an annual increase of 2% with the increase in tourism inflows towards the end of the year.
In response to the pandemic, the MMA, together with the banks, took measures to reduce and alleviate pressure on borrowers while ensuring the stability of the banks. Loan moratoriums and temporary freezing of loan down-grades for rescheduled loans were allowed for borrowers affected by the pandemic (without this leeway, as per the regulatory requirements, a change in loan terms would require a loan classification change). To facilitate the moratoriums, the MMA provided regulatory leeway for banks in March 2020 by temporarily reducing the provisioning requirement for rescheduled loans. This regulatory leeway was extended twice during the year after
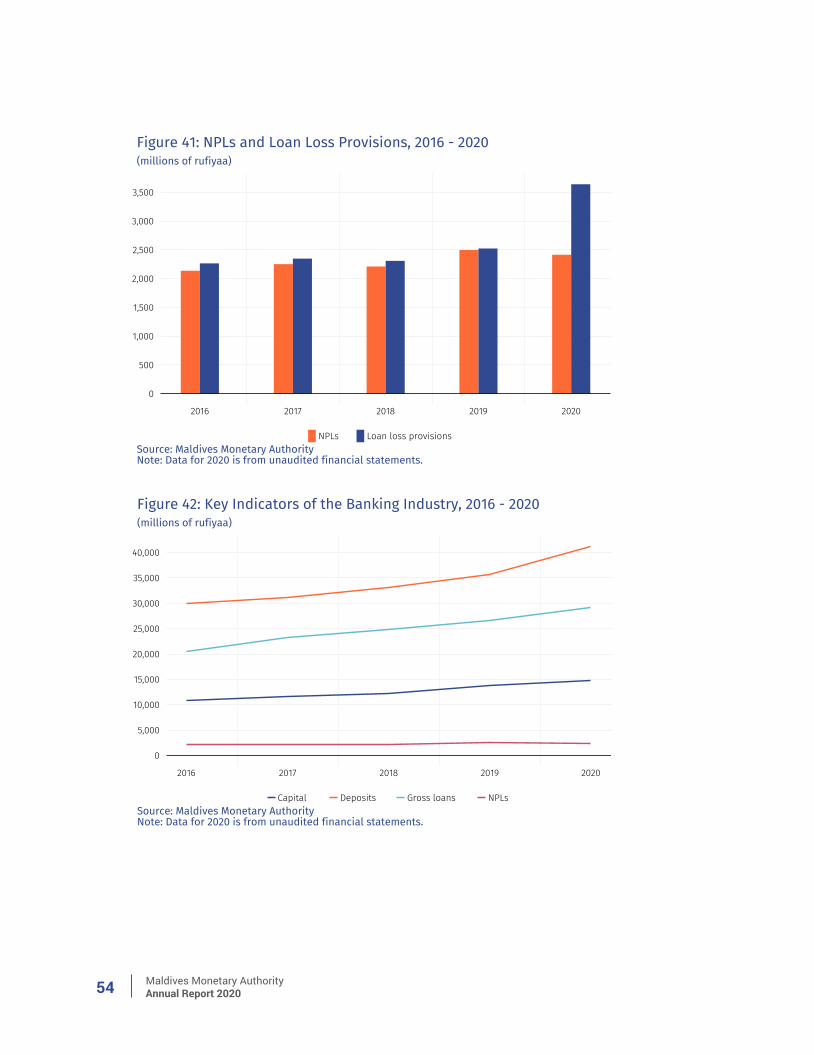
Maldives Monetary AuthorityAnnual Report 202054
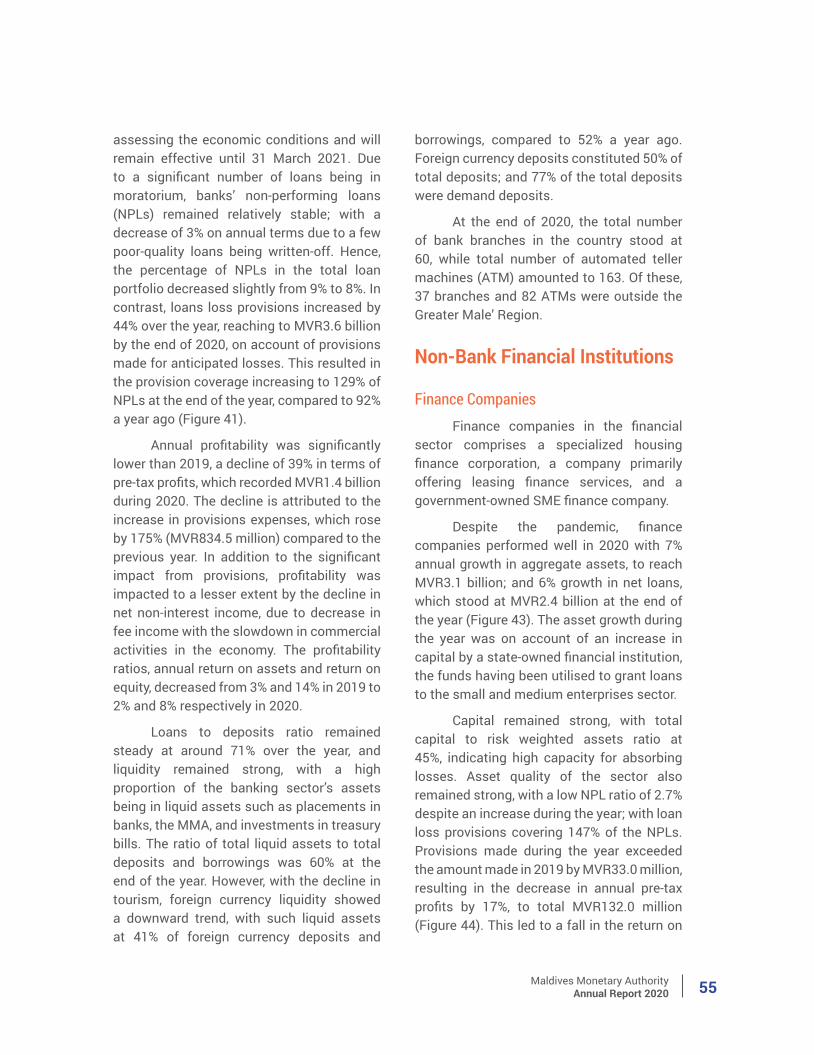
Maldives Monetary AuthorityAnnual Report 2020 55
assessing the economic conditions and will remain effective until 31 March 2021. Due to a significant number of loans being in moratorium, banks’ non-performing loans (NPLs) remained relatively stable; with a decrease of 3% on annual terms due to a few poor-quality loans being written-off. Hence, the percentage of NPLs in the total loan portfolio decreased slightly from 9% to 8%. In contrast, loans loss provisions increased by 44% over the year, reaching to MVR3.6 billion by the end of 2020, on account of provisions made for anticipated losses. This resulted in the provision coverage increasing to 129% of NPLs at the end of the year, compared to 92% a year ago (Figure 41).
Annual profitability was significantly lower than 2019, a decline of 39% in terms of pre-tax profits, which recorded MVR1.4 billion during 2020. The decline is attributed to the increase in provisions expenses, which rose by 175% (MVR834.5 million) compared to the previous year. In addition to the significant impact from provisions, profitability was impacted to a lesser extent by the decline in net non-interest income, due to decrease in fee income with the slowdown in commercial activities in the economy. The profitability ratios, annual return on assets and return on equity, decreased from 3% and 14% in 2019 to 2% and 8% respectively in 2020.
Loans to deposits ratio remained steady at around 71% over the year, and liquidity remained strong, with a high proportion of the banking sector’s assets being in liquid assets such as placements in banks, the MMA, and investments in treasury bills. The ratio of total liquid assets to total deposits and borrowings was 60% at the end of the year. However, with the decline in tourism, foreign currency liquidity showed a downward trend, with such liquid assets at 41% of foreign currency deposits and
borrowings, compared to 52% a year ago. Foreign currency deposits constituted 50% of total deposits; and 77% of the total deposits were demand deposits.
At the end of 2020, the total number of bank branches in the country stood at 60, while total number of automated teller machines (ATM) amounted to 163. Of these, 37 branches and 82 ATMs were outside the Greater Male’ Region.
Non-Bank Financial Institutions
Finance CompaniesFinance companies in the financial
sector comprises a specialized housing finance corporation, a company primarily offering leasing finance services, and a government-owned SME finance company.
Despite the pandemic, finance companies performed well in 2020 with 7% annual growth in aggregate assets, to reach MVR3.1 billion; and 6% growth in net loans, which stood at MVR2.4 billion at the end of the year (Figure 43). The asset growth during the year was on account of an increase in capital by a state-owned financial institution, the funds having been utilised to grant loans to the small and medium enterprises sector.
Capital remained strong, with total capital to risk weighted assets ratio at 45%, indicating high capacity for absorbing losses. Asset quality of the sector also remained strong, with a low NPL ratio of 2.7% despite an increase during the year; with loan loss provisions covering 147% of the NPLs. Provisions made during the year exceeded the amount made in 2019 by MVR33.0 million, resulting in the decrease in annual pre-tax profits by 17%, to total MVR132.0 million (Figure 44). This led to a fall in the return on
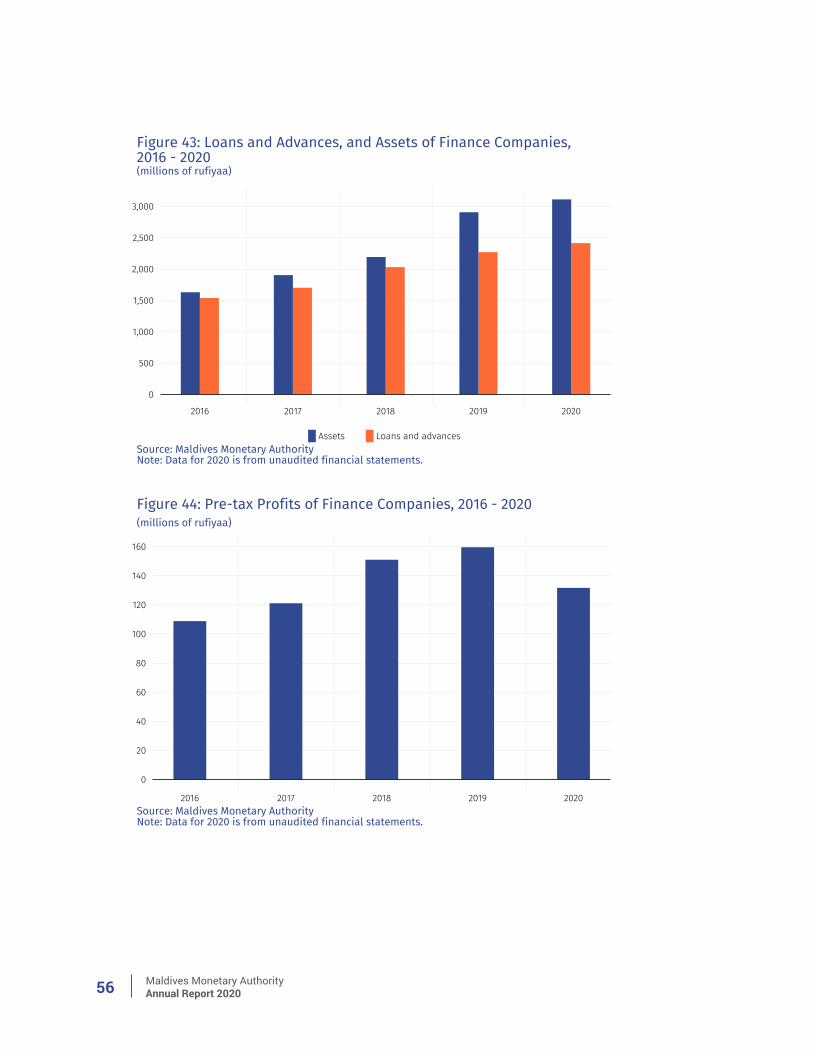
Maldives Monetary AuthorityAnnual Report 202056
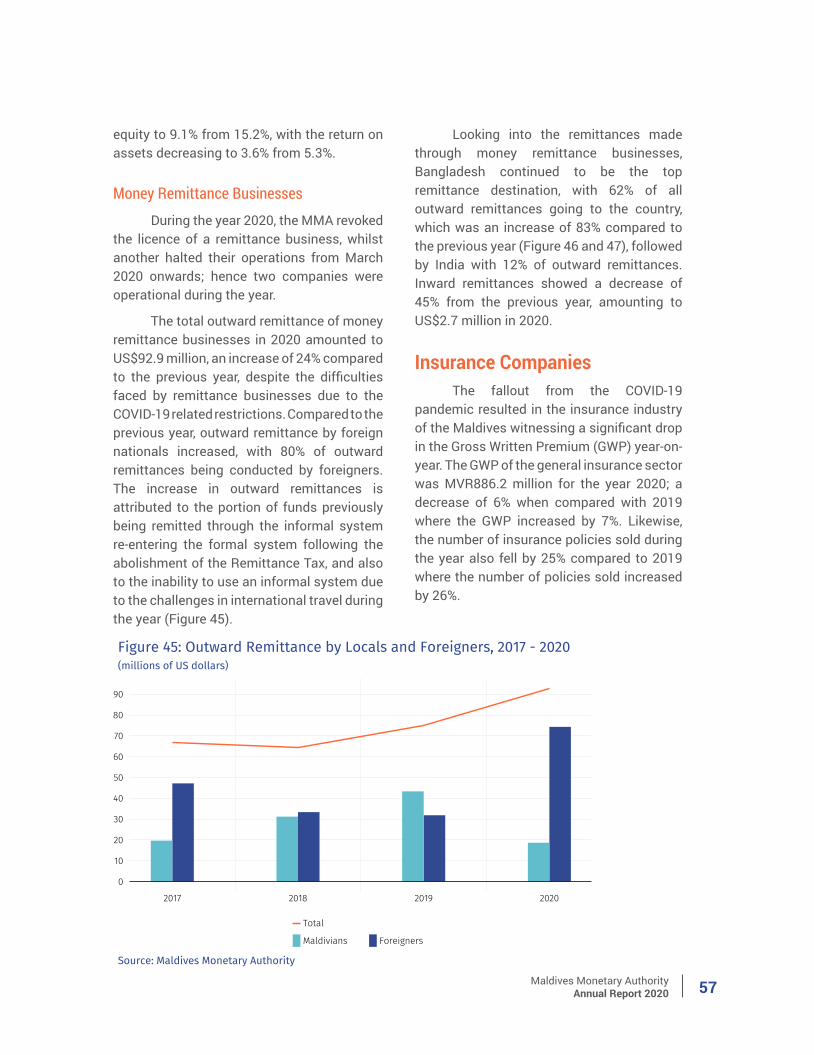
Maldives Monetary AuthorityAnnual Report 2020 57
equity to 9.1% from 15.2%, with the return on assets decreasing to 3.6% from 5.3%.
Money Remittance BusinessesDuring the year 2020, the MMA revoked
the licence of a remittance business, whilst another halted their operations from March 2020 onwards; hence two companies were operational during the year.
The total outward remittance of money remittance businesses in 2020 amounted to US$92.9 million, an increase of 24% compared to the previous year, despite the difficulties faced by remittance businesses due to the COVID-19 related restrictions. Compared to the previous year, outward remittance by foreign nationals increased, with 80% of outward remittances being conducted by foreigners. The increase in outward remittances is attributed to the portion of funds previously being remitted through the informal system re-entering the formal system following the abolishment of the Remittance Tax, and also to the inability to use an informal system due to the challenges in international travel during the year (Figure 45).
Looking into the remittances made through money remittance businesses, Bangladesh continued to be the top remittance destination, with 62% of all outward remittances going to the country, which was an increase of 83% compared to the previous year (Figure 46 and 47), followed by India with 12% of outward remittances. Inward remittances showed a decrease of 45% from the previous year, amounting to US$2.7 million in 2020.
Insurance CompaniesThe fallout from the COVID-19
pandemic resulted in the insurance industry of the Maldives witnessing a significant drop in the Gross Written Premium (GWP) year-on-year. The GWP of the general insurance sector was MVR886.2 million for the year 2020; a decrease of 6% when compared with 2019 where the GWP increased by 7%. Likewise, the number of insurance policies sold during the year also fell by 25% compared to 2019 where the number of policies sold increased by 26%.
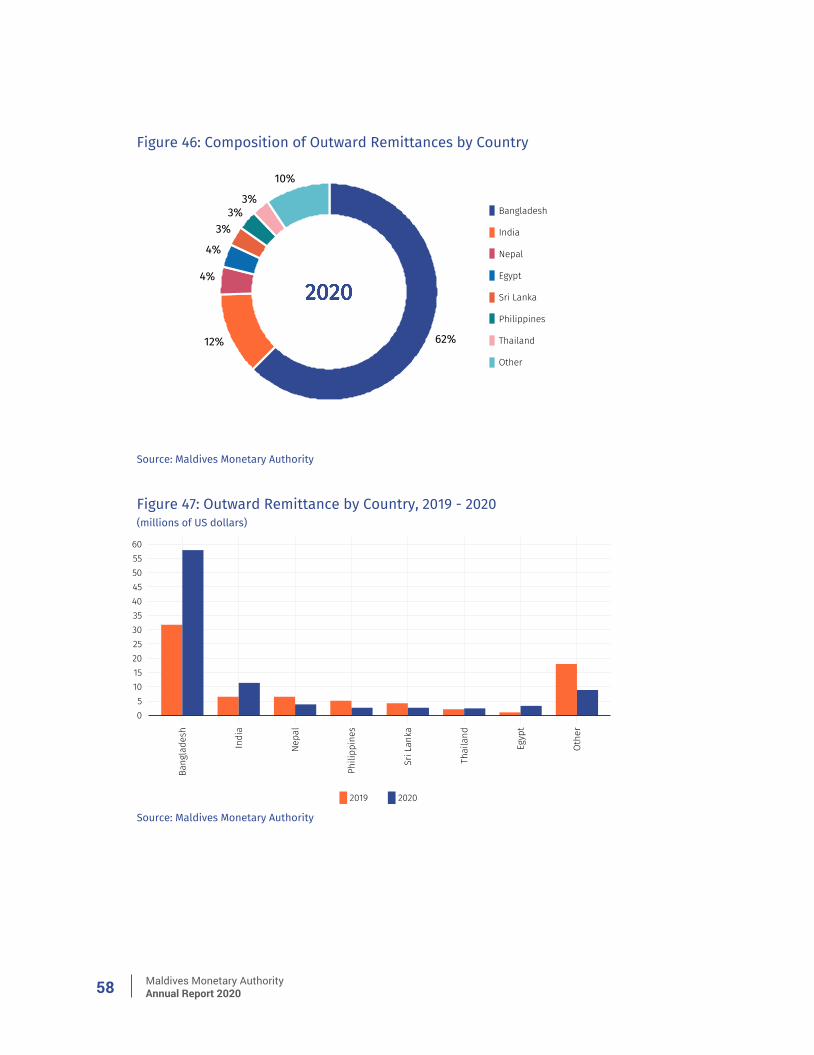
Maldives Monetary AuthorityAnnual Report 202058
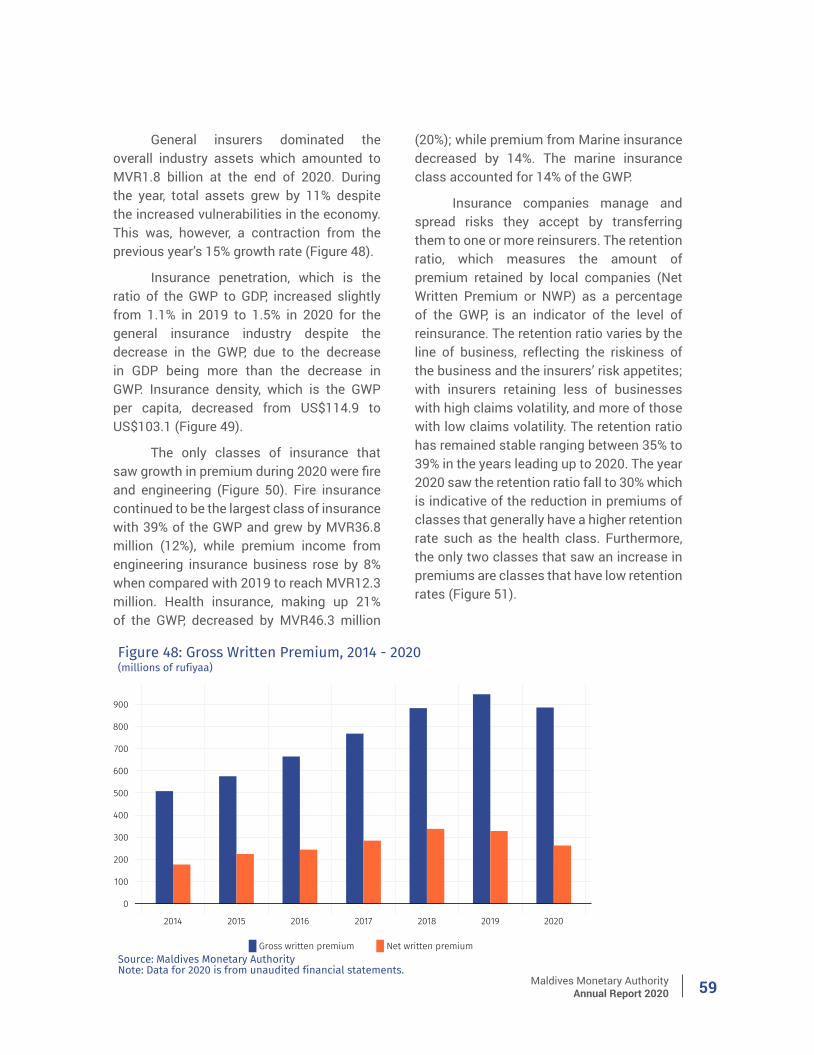
Maldives Monetary AuthorityAnnual Report 2020 59
General insurers dominated the overall industry assets which amounted to MVR1.8 billion at the end of 2020. During the year, total assets grew by 11% despite the increased vulnerabilities in the economy. This was, however, a contraction from the previous year’s 15% growth rate (Figure 48).
Insurance penetration, which is the ratio of the GWP to GDP, increased slightly from 1.1% in 2019 to 1.5% in 2020 for the general insurance industry despite the decrease in the GWP, due to the decrease in GDP being more than the decrease in GWP. Insurance density, which is the GWP per capita, decreased from US$114.9 to US$103.1 (Figure 49).
The only classes of insurance that saw growth in premium during 2020 were fire and engineering (Figure 50). Fire insurance continued to be the largest class of insurance with 39% of the GWP and grew by MVR36.8 million (12%), while premium income from engineering insurance business rose by 8% when compared with 2019 to reach MVR12.3 million. Health insurance, making up 21% of the GWP, decreased by MVR46.3 million
(20%); while premium from Marine insurance decreased by 14%. The marine insurance class accounted for 14% of the GWP.
Insurance companies manage and spread risks they accept by transferring them to one or more reinsurers. The retention ratio, which measures the amount of premium retained by local companies (Net Written Premium or NWP) as a percentage of the GWP, is an indicator of the level of reinsurance. The retention ratio varies by the line of business, reflecting the riskiness of the business and the insurers’ risk appetites; with insurers retaining less of businesses with high claims volatility, and more of those with low claims volatility. The retention ratio has remained stable ranging between 35% to 39% in the years leading up to 2020. The year 2020 saw the retention ratio fall to 30% which is indicative of the reduction in premiums of classes that generally have a higher retention rate such as the health class. Furthermore, the only two classes that saw an increase in premiums are classes that have low retention rates (Figure 51).
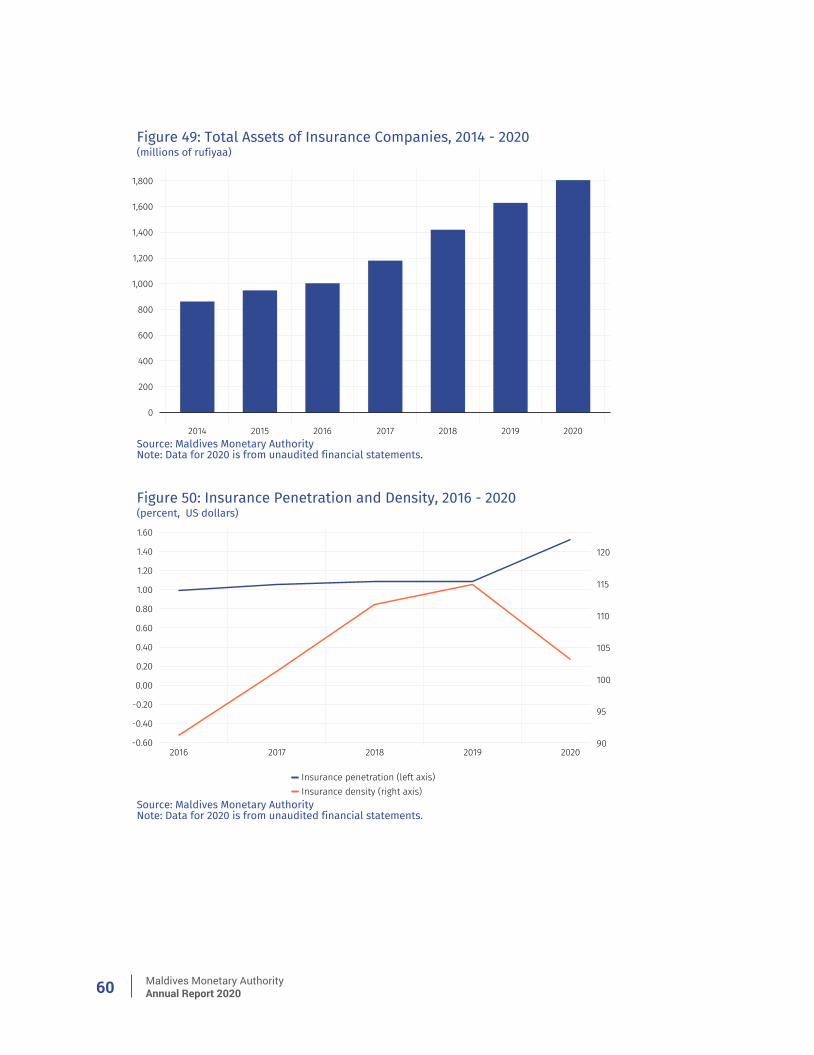
Maldives Monetary AuthorityAnnual Report 202060
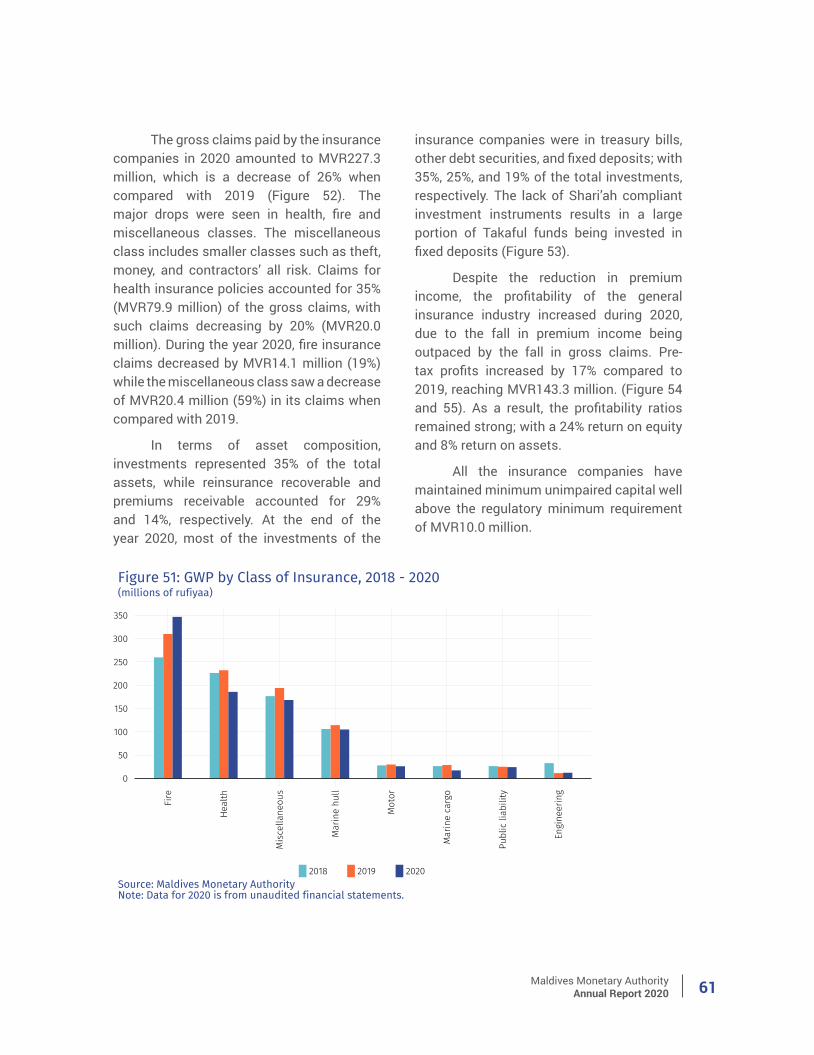
Maldives Monetary AuthorityAnnual Report 2020 61
The gross claims paid by the insurance companies in 2020 amounted to MVR227.3 million, which is a decrease of 26% when compared with 2019 (Figure 52). The major drops were seen in health, fire and miscellaneous classes. The miscellaneous class includes smaller classes such as theft, money, and contractors’ all risk. Claims for health insurance policies accounted for 35% (MVR79.9 million) of the gross claims, with such claims decreasing by 20% (MVR20.0 million). During the year 2020, fire insurance claims decreased by MVR14.1 million (19%) while the miscellaneous class saw a decrease of MVR20.4 million (59%) in its claims when compared with 2019.
In terms of asset composition, investments represented 35% of the total assets, while reinsurance recoverable and premiums receivable accounted for 29% and 14%, respectively. At the end of the year 2020, most of the investments of the
insurance companies were in treasury bills, other debt securities, and fixed deposits; with 35%, 25%, and 19% of the total investments, respectively. The lack of Shari’ah compliant investment instruments results in a large portion of Takaful funds being invested in fixed deposits (Figure 53).
Despite the reduction in premium income, the profitability of the general insurance industry increased during 2020, due to the fall in premium income being outpaced by the fall in gross claims. Pre-tax profits increased by 17% compared to 2019, reaching MVR143.3 million. (Figure 54 and 55). As a result, the profitability ratios remained strong; with a 24% return on equity and 8% return on assets.
All the insurance companies have maintained minimum unimpaired capital well above the regulatory minimum requirement of MVR10.0 million.
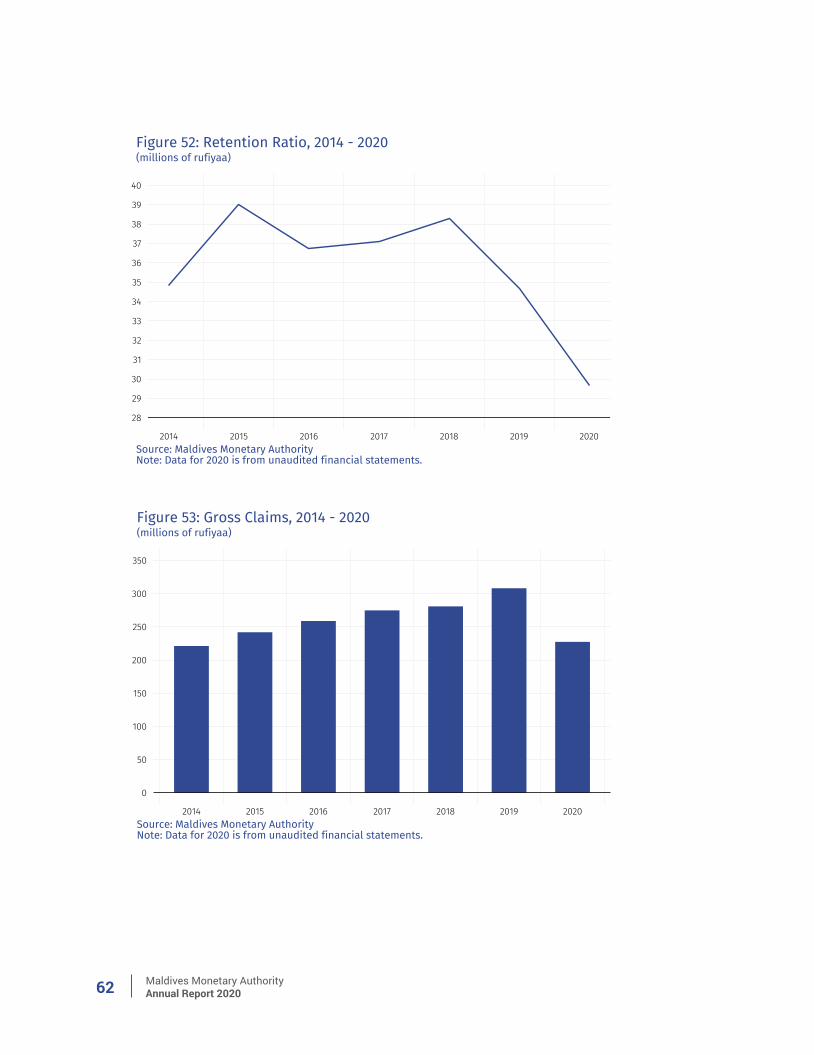
Maldives Monetary AuthorityAnnual Report 202062
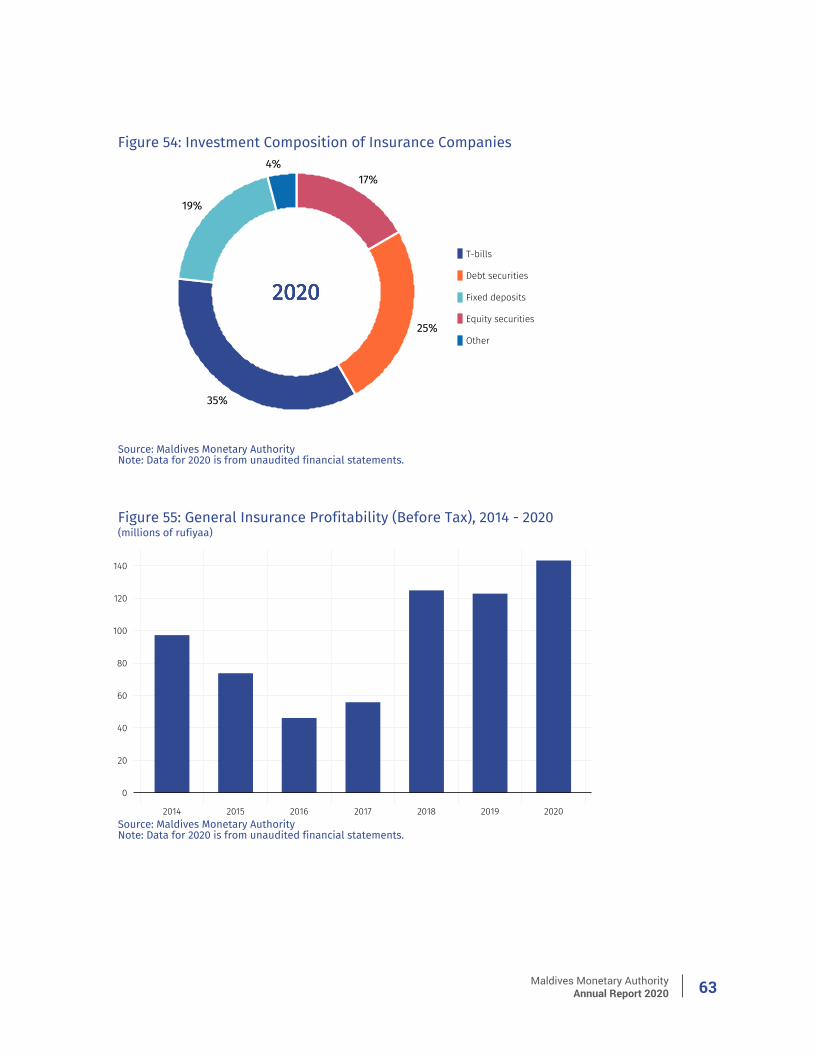
Maldives Monetary AuthorityAnnual Report 2020 63
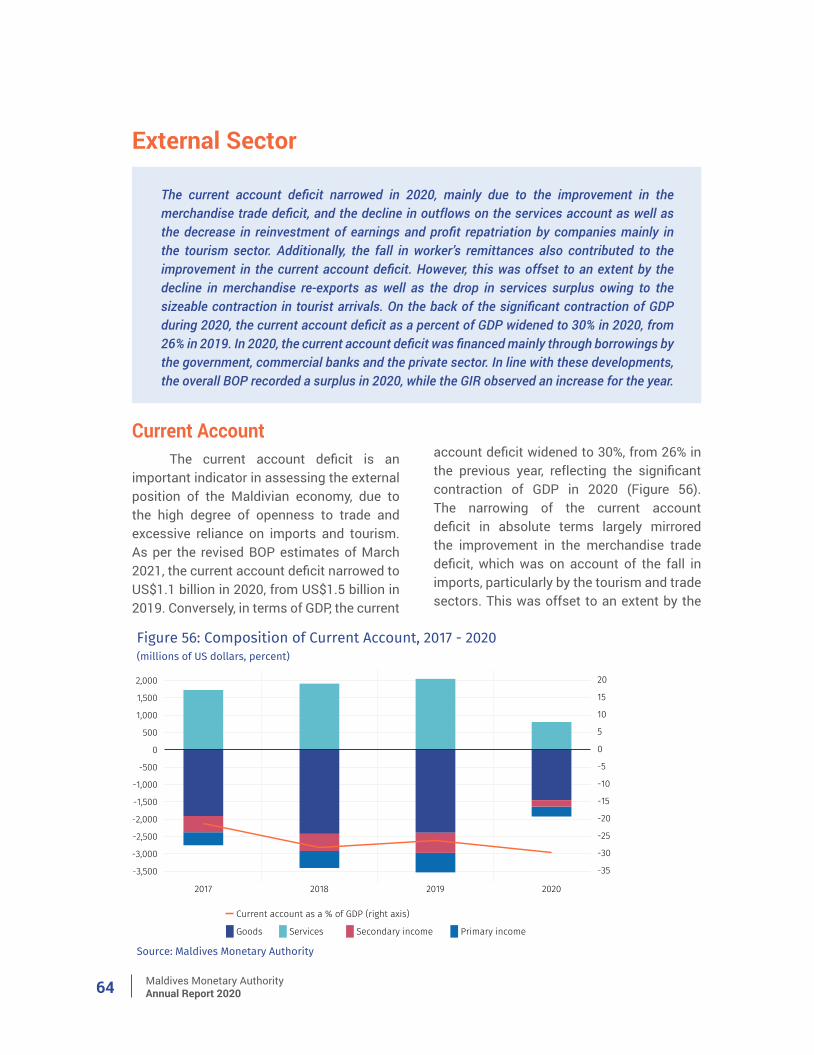
Maldives Monetary AuthorityAnnual Report 202064
The current account deficit narrowed in 2020, mainly due to the improvement in the merchandise trade deficit, and the decline in outflows on the services account as well as the decrease in reinvestment of earnings and profit repatriation by companies mainly in the tourism sector. Additionally, the fall in worker’s remittances also contributed to the improvement in the current account deficit. However, this was offset to an extent by the decline in merchandise re-exports as well as the drop in services surplus owing to the sizeable contraction in tourist arrivals. On the back of the significant contraction of GDP during 2020, the current account deficit as a percent of GDP widened to 30% in 2020, from 26% in 2019. In 2020, the current account deficit was financed mainly through borrowings by the government, commercial banks and the private sector. In line with these developments, the overall BOP recorded a surplus in 2020, while the GIR observed an increase for the year.
External Sector
Current AccountThe current account deficit is an
important indicator in assessing the external position of the Maldivian economy, due to the high degree of openness to trade and excessive reliance on imports and tourism. As per the revised BOP estimates of March 2021, the current account deficit narrowed to US$1.1 billion in 2020, from US$1.5 billion in 2019. Conversely, in terms of GDP, the current
account deficit widened to 30%, from 26% in the previous year, reflecting the significant contraction of GDP in 2020 (Figure 56). The narrowing of the current account deficit in absolute terms largely mirrored the improvement in the merchandise trade deficit, which was on account of the fall in imports, particularly by the tourism and trade sectors. This was offset to an extent by the
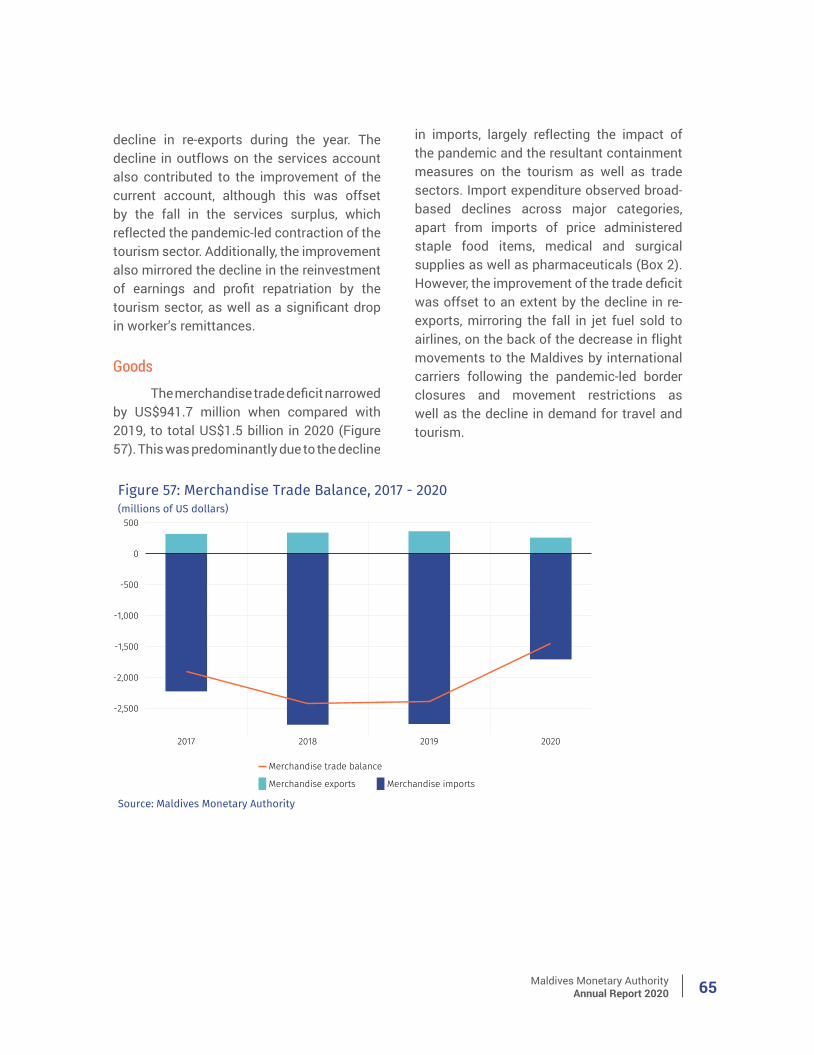
Maldives Monetary AuthorityAnnual Report 2020 65
decline in re-exports during the year. The decline in outflows on the services account also contributed to the improvement of the current account, although this was offset by the fall in the services surplus, which reflected the pandemic-led contraction of the tourism sector. Additionally, the improvement also mirrored the decline in the reinvestment of earnings and profit repatriation by the tourism sector, as well as a significant drop in worker’s remittances.
GoodsThe merchandise trade deficit narrowed
by US$941.7 million when compared with 2019, to total US$1.5 billion in 2020 (Figure 57). This was predominantly due to the decline
in imports, largely reflecting the impact of the pandemic and the resultant containment measures on the tourism as well as trade sectors. Import expenditure observed broad-based declines across major categories, apart from imports of price administered staple food items, medical and surgical supplies as well as pharmaceuticals (Box 2). However, the improvement of the trade deficit was offset to an extent by the decline in re-exports, mirroring the fall in jet fuel sold to airlines, on the back of the decrease in flight movements to the Maldives by international carriers following the pandemic-led border closures and movement restrictions as well as the decline in demand for travel and tourism.
Maldives Monetary AuthorityAnnual Report 202066
1 Based on the trade statistics compiled and disseminated by the Maldives Customs Service, hence figures may be different in balance of payments statistics due to the adjustments made in BOP.
Box 2: Merchandise Trade1
Merchandise ExportsReflecting the downturn in economic activity due to the COVID-19
pandemic, merchandise exports, constituting domestic exports and re-exports, decreased by 21% (US$74.9 million) and totalled US$285.7 million during 2020. The decline in merchandise exports stemmed entirely from a plunge in re-exports (which accounted for 43%), while domestic exports (which accounted for 57%) registered a modest increase during the year.
Re-export earnings decreased significantly by 39% (US$79.7 million), totalling US$122.9 million in 2020. In contrast to the previous year, during which the earnings from jet fuel re-exports registered a record high, such earnings declined significantly by 63% in 2020. This was due to the international border closures and lower global tourism demand resulting from the COVID-19 pandemic, which led to a steep decline in flight movements to the Maldives by the international carriers. Meanwhile, the other re-export categories also registered declines during the year owing to the impact of the pandemic. As such, significant declines were observed in the re-export earnings from machinery and mechanical appliances; metal; as well as capital goods.
Domestic exports, which predominantly comprise fish exports (96%), increased moderately by 3% (US$4.8 million) and totalled US$162.9 million in 2020, despite the travel restrictions, border closures and the decline in fish purchases by fish processing companies (Figure 1). While domestic exports rose by 23% during the first quarter, a decline of 20% was observed during the second quarter, mainly reflecting the domestic and international border closures. However, exports picked up during the latter half of the year, increasing by 75% in the fourth quarter. The increase in such exports mainly stemmed from the significant growth (46%) in export earnings from frozen skipjack tuna. This largely mirrored the annual increase in international skipjack tuna prices, which averaged MVR20.5 per kilogram (a growth of 13%), as well as the increase in the volume of such exports. The increase in skipjack prices was predominantly due to the increased global demand for canned tuna, for which skipjack tuna is a popular raw material. Furthermore, both the earnings and the volume of frozen yellowfin tuna exports increased, by 5% and 4%, respectively, during the year, while the earnings from processed tuna rose by 17% in annual terms. However, the increase in such
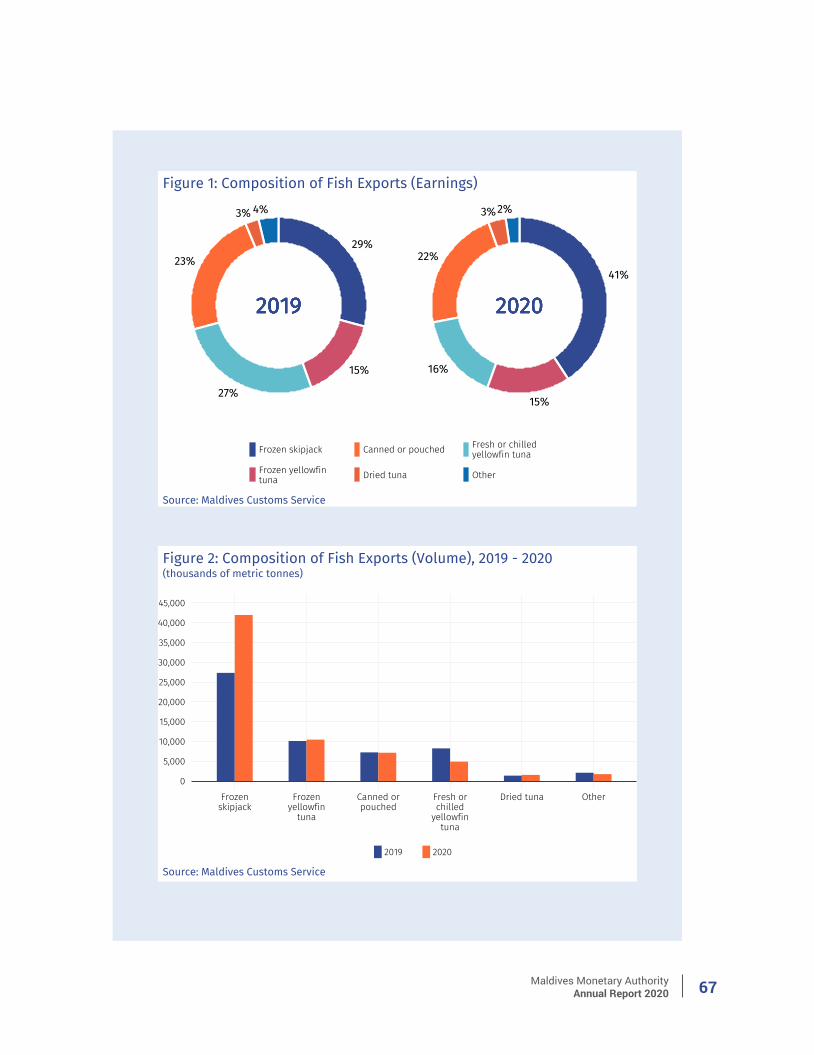
Maldives Monetary AuthorityAnnual Report 2020 67
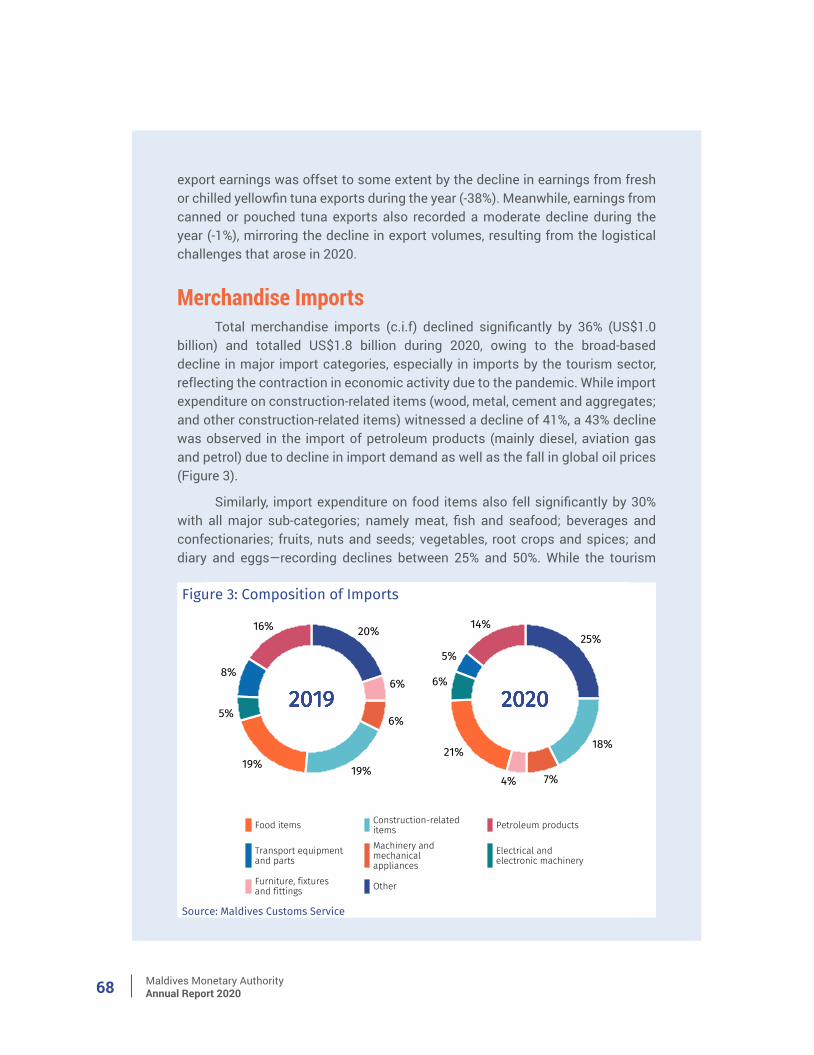
Maldives Monetary AuthorityAnnual Report 202068
export earnings was offset to some extent by the decline in earnings from fresh or chilled yellowfin tuna exports during the year (-38%). Meanwhile, earnings from canned or pouched tuna exports also recorded a moderate decline during the year (-1%), mirroring the decline in export volumes, resulting from the logistical challenges that arose in 2020.
Merchandise ImportsTotal merchandise imports (c.i.f) declined significantly by 36% (US$1.0
billion) and totalled US$1.8 billion during 2020, owing to the broad-based decline in major import categories, especially in imports by the tourism sector, reflecting the contraction in economic activity due to the pandemic. While import expenditure on construction-related items (wood, metal, cement and aggregates; and other construction-related items) witnessed a decline of 41%, a 43% decline was observed in the import of petroleum products (mainly diesel, aviation gas and petrol) due to decline in import demand as well as the fall in global oil prices (Figure 3).
Similarly, import expenditure on food items also fell significantly by 30% with all major sub-categories; namely meat, fish and seafood; beverages and confectionaries; fruits, nuts and seeds; vegetables, root crops and spices; and diary and eggs—recording declines between 25% and 50%. While the tourism
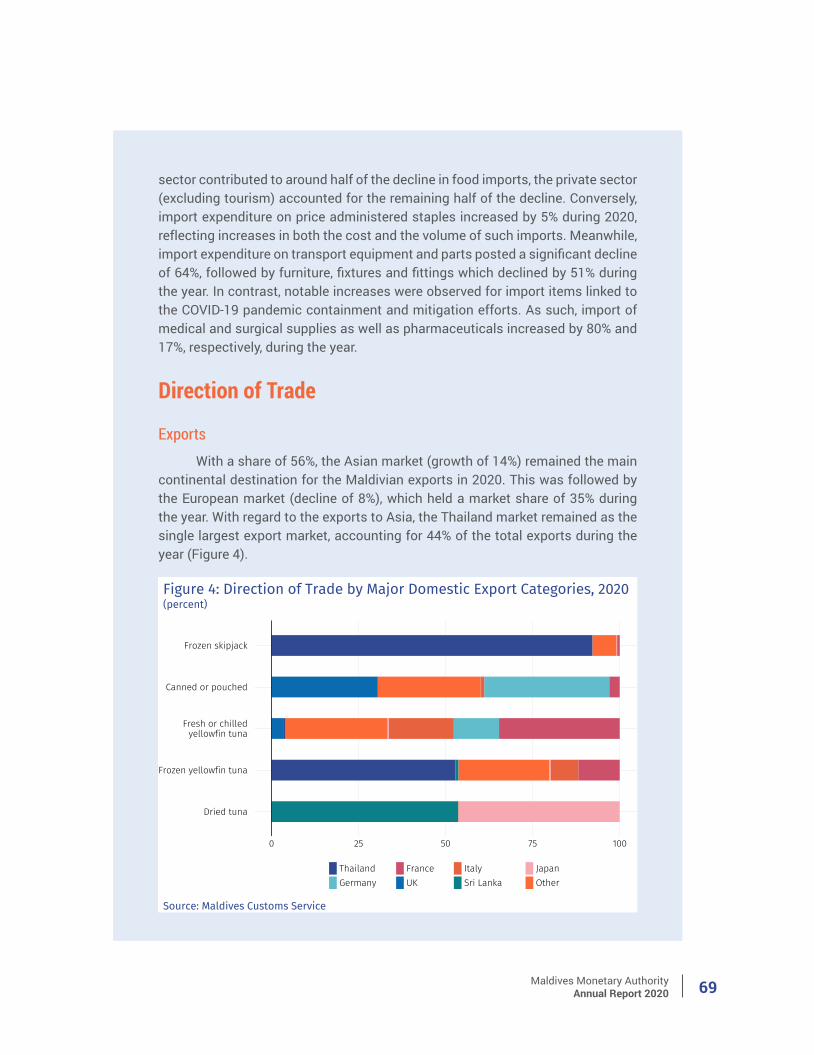
Maldives Monetary AuthorityAnnual Report 2020 69
sector contributed to around half of the decline in food imports, the private sector (excluding tourism) accounted for the remaining half of the decline. Conversely, import expenditure on price administered staples increased by 5% during 2020, reflecting increases in both the cost and the volume of such imports. Meanwhile, import expenditure on transport equipment and parts posted a significant decline of 64%, followed by furniture, fixtures and fittings which declined by 51% during the year. In contrast, notable increases were observed for import items linked to the COVID-19 pandemic containment and mitigation efforts. As such, import of medical and surgical supplies as well as pharmaceuticals increased by 80% and 17%, respectively, during the year.
Direction of Trade
ExportsWith a share of 56%, the Asian market (growth of 14%) remained the main
continental destination for the Maldivian exports in 2020. This was followed by the European market (decline of 8%), which held a market share of 35% during the year. With regard to the exports to Asia, the Thailand market remained as the single largest export market, accounting for 44% of the total exports during the year (Figure 4).
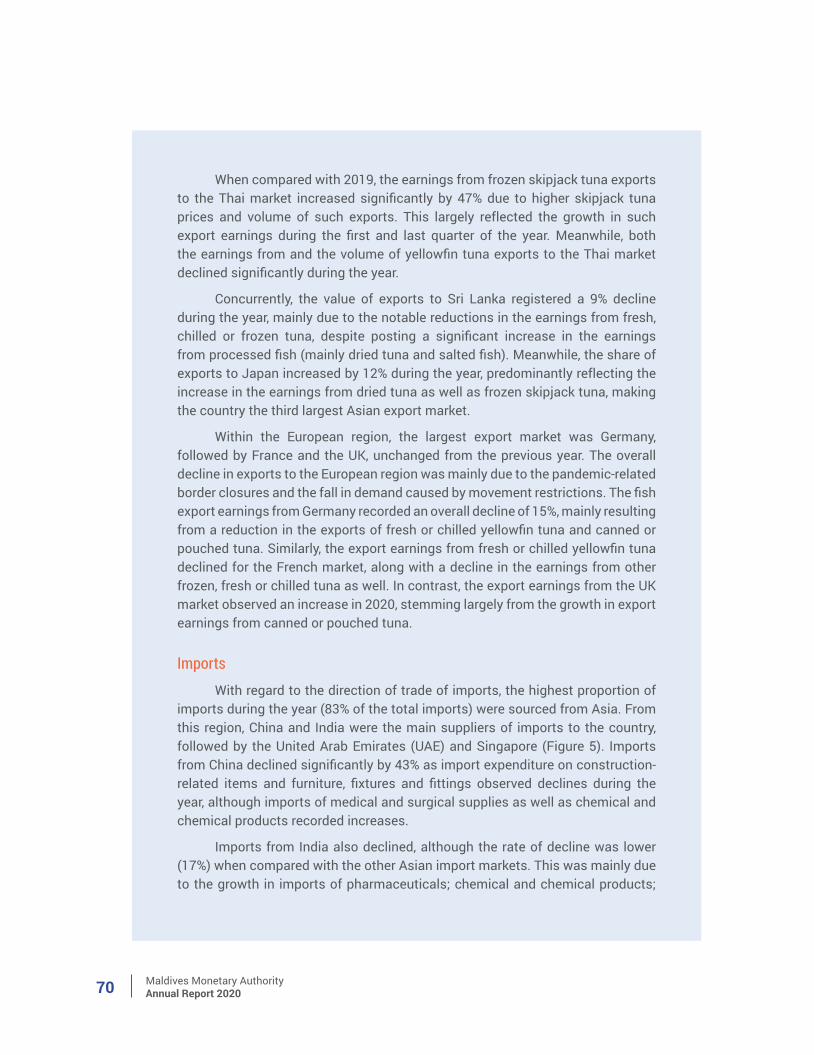
Maldives Monetary AuthorityAnnual Report 202070
When compared with 2019, the earnings from frozen skipjack tuna exports to the Thai market increased significantly by 47% due to higher skipjack tuna prices and volume of such exports. This largely reflected the growth in such export earnings during the first and last quarter of the year. Meanwhile, both the earnings from and the volume of yellowfin tuna exports to the Thai market declined significantly during the year.
Concurrently, the value of exports to Sri Lanka registered a 9% decline during the year, mainly due to the notable reductions in the earnings from fresh, chilled or frozen tuna, despite posting a significant increase in the earnings from processed fish (mainly dried tuna and salted fish). Meanwhile, the share of exports to Japan increased by 12% during the year, predominantly reflecting the increase in the earnings from dried tuna as well as frozen skipjack tuna, making the country the third largest Asian export market.
Within the European region, the largest export market was Germany, followed by France and the UK, unchanged from the previous year. The overall decline in exports to the European region was mainly due to the pandemic-related border closures and the fall in demand caused by movement restrictions. The fish export earnings from Germany recorded an overall decline of 15%, mainly resulting from a reduction in the exports of fresh or chilled yellowfin tuna and canned or pouched tuna. Similarly, the export earnings from fresh or chilled yellowfin tuna declined for the French market, along with a decline in the earnings from other frozen, fresh or chilled tuna as well. In contrast, the export earnings from the UK market observed an increase in 2020, stemming largely from the growth in export earnings from canned or pouched tuna.
ImportsWith regard to the direction of trade of imports, the highest proportion of
imports during the year (83% of the total imports) were sourced from Asia. From this region, China and India were the main suppliers of imports to the country, followed by the United Arab Emirates (UAE) and Singapore (Figure 5). Imports from China declined significantly by 43% as import expenditure on construction-related items and furniture, fixtures and fittings observed declines during the year, although imports of medical and surgical supplies as well as chemical and chemical products recorded increases.
Imports from India also declined, although the rate of decline was lower (17%) when compared with the other Asian import markets. This was mainly due to the growth in imports of pharmaceuticals; chemical and chemical products;
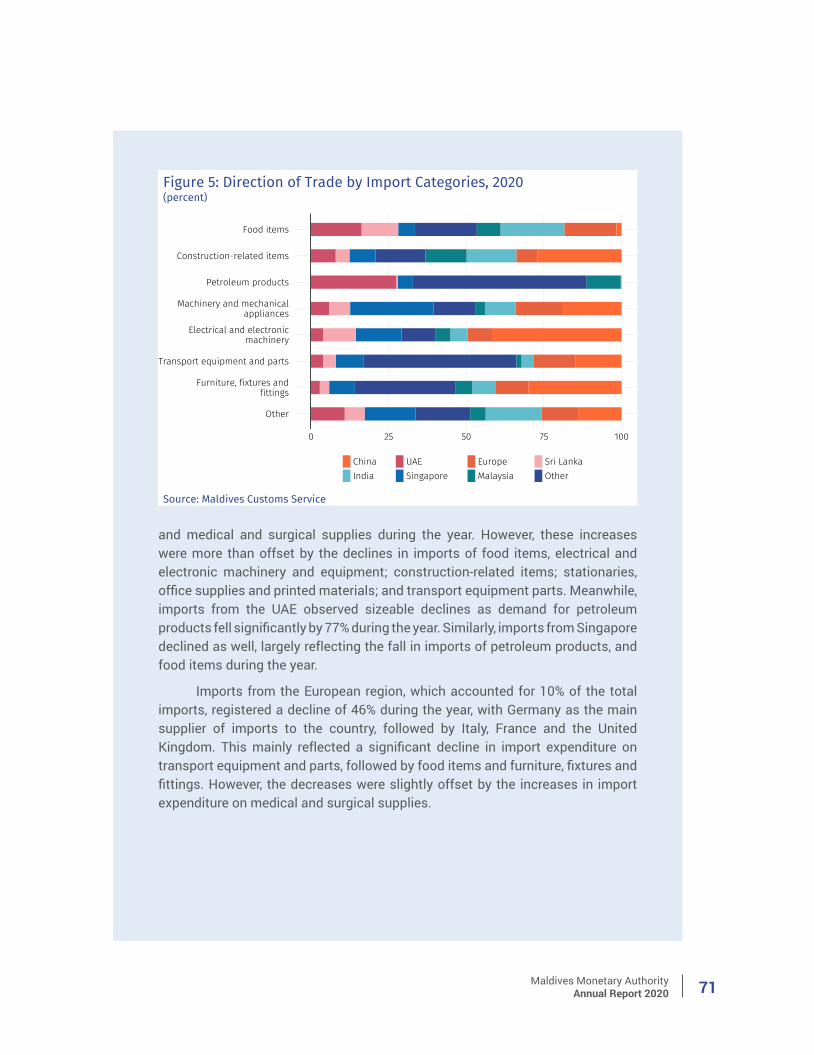
Maldives Monetary AuthorityAnnual Report 2020 71
and medical and surgical supplies during the year. However, these increases were more than offset by the declines in imports of food items, electrical and electronic machinery and equipment; construction-related items; stationaries, office supplies and printed materials; and transport equipment parts. Meanwhile, imports from the UAE observed sizeable declines as demand for petroleum products fell significantly by 77% during the year. Similarly, imports from Singapore declined as well, largely reflecting the fall in imports of petroleum products, and food items during the year.
Imports from the European region, which accounted for 10% of the total imports, registered a decline of 46% during the year, with Germany as the main supplier of imports to the country, followed by Italy, France and the United Kingdom. This mainly reflected a significant decline in import expenditure on transport equipment and parts, followed by food items and furniture, fixtures and fittings. However, the decreases were slightly offset by the increases in import expenditure on medical and surgical supplies.
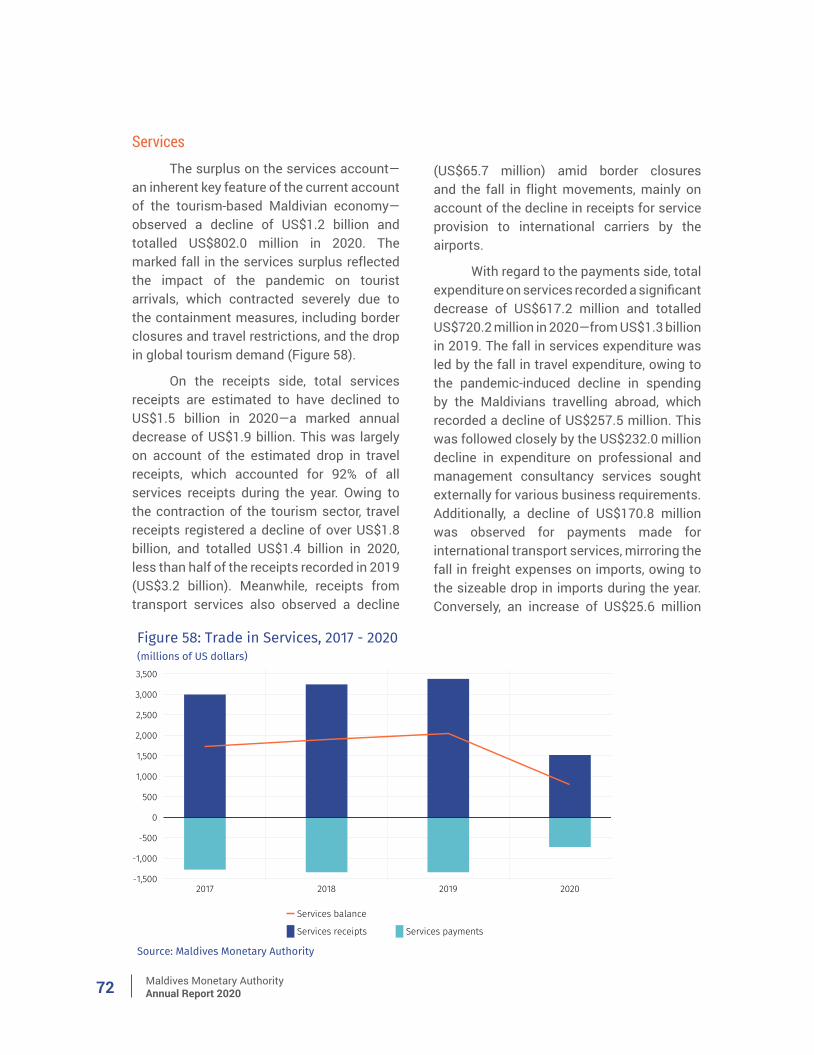
Maldives Monetary AuthorityAnnual Report 202072
Services The surplus on the services account—
an inherent key feature of the current account of the tourism-based Maldivian economy—observed a decline of US$1.2 billion and totalled US$802.0 million in 2020. The marked fall in the services surplus reflected the impact of the pandemic on tourist arrivals, which contracted severely due to the containment measures, including border closures and travel restrictions, and the drop in global tourism demand (Figure 58).
On the receipts side, total services receipts are estimated to have declined to US$1.5 billion in 2020—a marked annual decrease of US$1.9 billion. This was largely on account of the estimated drop in travel receipts, which accounted for 92% of all services receipts during the year. Owing to the contraction of the tourism sector, travel receipts registered a decline of over US$1.8 billion, and totalled US$1.4 billion in 2020, less than half of the receipts recorded in 2019 (US$3.2 billion). Meanwhile, receipts from transport services also observed a decline
(US$65.7 million) amid border closures and the fall in flight movements, mainly on account of the decline in receipts for service provision to international carriers by the airports.
With regard to the payments side, total expenditure on services recorded a significant decrease of US$617.2 million and totalled US$720.2 million in 2020—from US$1.3 billion in 2019. The fall in services expenditure was led by the fall in travel expenditure, owing to the pandemic-induced decline in spending by the Maldivians travelling abroad, which recorded a decline of US$257.5 million. This was followed closely by the US$232.0 million decline in expenditure on professional and management consultancy services sought externally for various business requirements. Additionally, a decline of US$170.8 million was observed for payments made for international transport services, mirroring the fall in freight expenses on imports, owing to the sizeable drop in imports during the year. Conversely, an increase of US$25.6 million
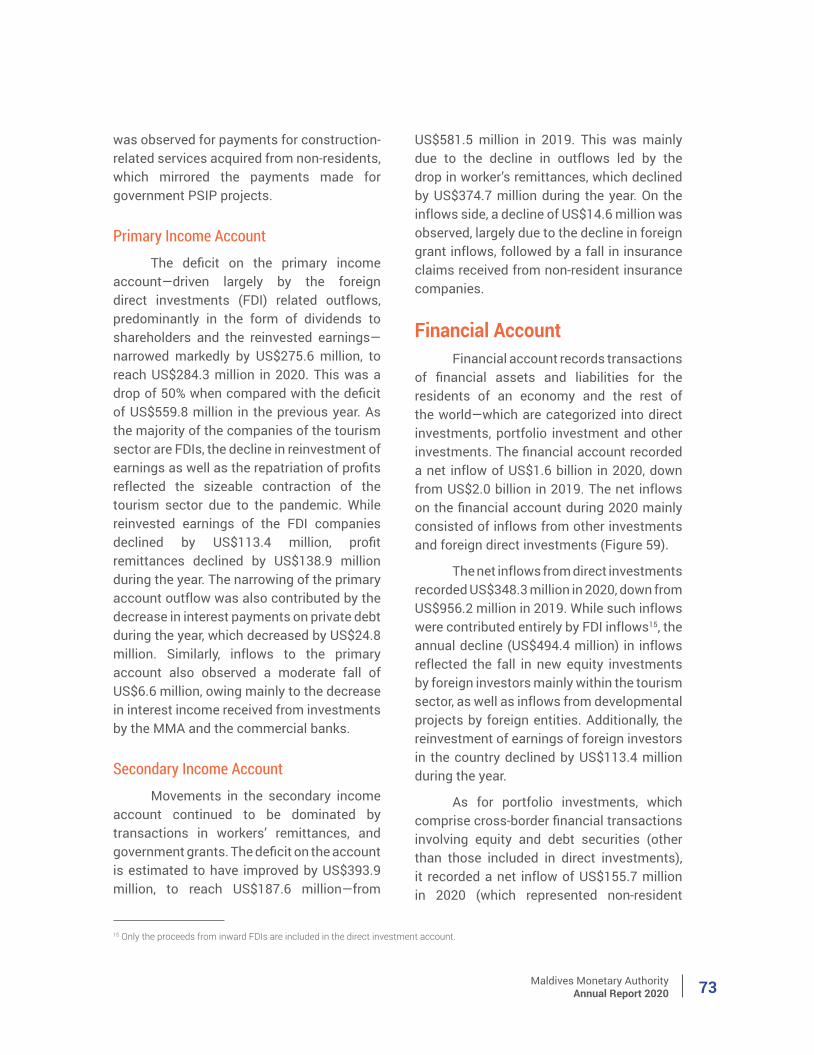
Maldives Monetary AuthorityAnnual Report 2020 73
was observed for payments for construction-related services acquired from non-residents, which mirrored the payments made for government PSIP projects.
Primary Income AccountThe deficit on the primary income
account—driven largely by the foreign direct investments (FDI) related outflows, predominantly in the form of dividends to shareholders and the reinvested earnings—narrowed markedly by US$275.6 million, to reach US$284.3 million in 2020. This was a drop of 50% when compared with the deficit of US$559.8 million in the previous year. As the majority of the companies of the tourism sector are FDIs, the decline in reinvestment of earnings as well as the repatriation of profits reflected the sizeable contraction of the tourism sector due to the pandemic. While reinvested earnings of the FDI companies declined by US$113.4 million, profit remittances declined by US$138.9 million during the year. The narrowing of the primary account outflow was also contributed by the decrease in interest payments on private debt during the year, which decreased by US$24.8 million. Similarly, inflows to the primary account also observed a moderate fall of US$6.6 million, owing mainly to the decrease in interest income received from investments by the MMA and the commercial banks.
Secondary Income Account Movements in the secondary income
account continued to be dominated by transactions in workers’ remittances, and government grants. The deficit on the account is estimated to have improved by US$393.9 million, to reach US$187.6 million—from
US$581.5 million in 2019. This was mainly due to the decline in outflows led by the drop in worker’s remittances, which declined by US$374.7 million during the year. On the inflows side, a decline of US$14.6 million was observed, largely due to the decline in foreign grant inflows, followed by a fall in insurance claims received from non-resident insurance companies.
Financial AccountFinancial account records transactions
of financial assets and liabilities for the residents of an economy and the rest of the world—which are categorized into direct investments, portfolio investment and other investments. The financial account recorded a net inflow of US$1.6 billion in 2020, down from US$2.0 billion in 2019. The net inflows on the financial account during 2020 mainly consisted of inflows from other investments and foreign direct investments (Figure 59).
The net inflows from direct investments recorded US$348.3 million in 2020, down from US$956.2 million in 2019. While such inflows were contributed entirely by FDI inflows15, the annual decline (US$494.4 million) in inflows reflected the fall in new equity investments by foreign investors mainly within the tourism sector, as well as inflows from developmental projects by foreign entities. Additionally, the reinvestment of earnings of foreign investors in the country declined by US$113.4 million during the year.
As for portfolio investments, which comprise cross-border financial transactions involving equity and debt securities (other than those included in direct investments), it recorded a net inflow of US$155.7 million in 2020 (which represented non-resident
15 Only the proceeds from inward FDIs are included in the direct investment account.
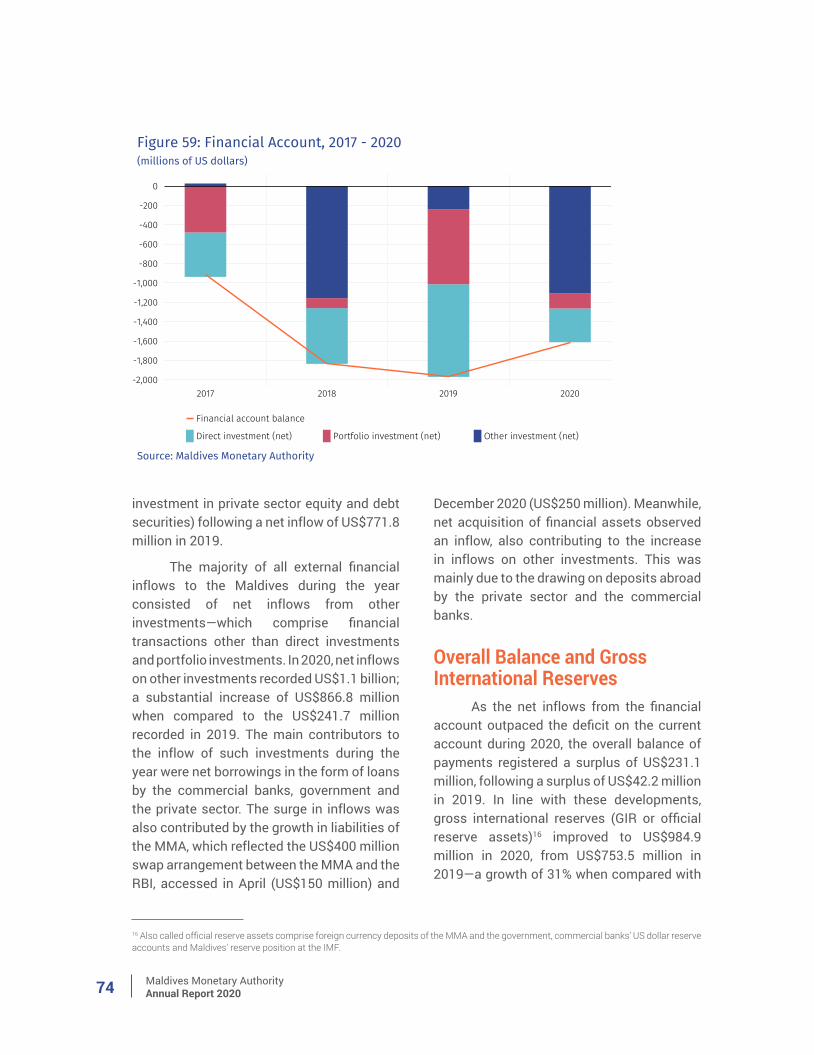
Maldives Monetary AuthorityAnnual Report 202074
16 Also called official reserve assets comprise foreign currency deposits of the MMA and the government, commercial banks’ US dollar reserve accounts and Maldives’ reserve position at the IMF.
investment in private sector equity and debt securities) following a net inflow of US$771.8 million in 2019.
The majority of all external financial inflows to the Maldives during the year consisted of net inflows from other investments—which comprise financial transactions other than direct investments and portfolio investments. In 2020, net inflows on other investments recorded US$1.1 billion; a substantial increase of US$866.8 million when compared to the US$241.7 million recorded in 2019. The main contributors to the inflow of such investments during the year were net borrowings in the form of loans by the commercial banks, government and the private sector. The surge in inflows was also contributed by the growth in liabilities of the MMA, which reflected the US$400 million swap arrangement between the MMA and the RBI, accessed in April (US$150 million) and
December 2020 (US$250 million). Meanwhile, net acquisition of financial assets observed an inflow, also contributing to the increase in inflows on other investments. This was mainly due to the drawing on deposits abroad by the private sector and the commercial banks.
Overall Balance and Gross International Reserves
As the net inflows from the financial account outpaced the deficit on the current account during 2020, the overall balance of payments registered a surplus of US$231.1 million, following a surplus of US$42.2 million in 2019. In line with these developments, gross international reserves (GIR or official reserve assets)16 improved to US$984.9 million in 2020, from US$753.5 million in 2019—a growth of 31% when compared with
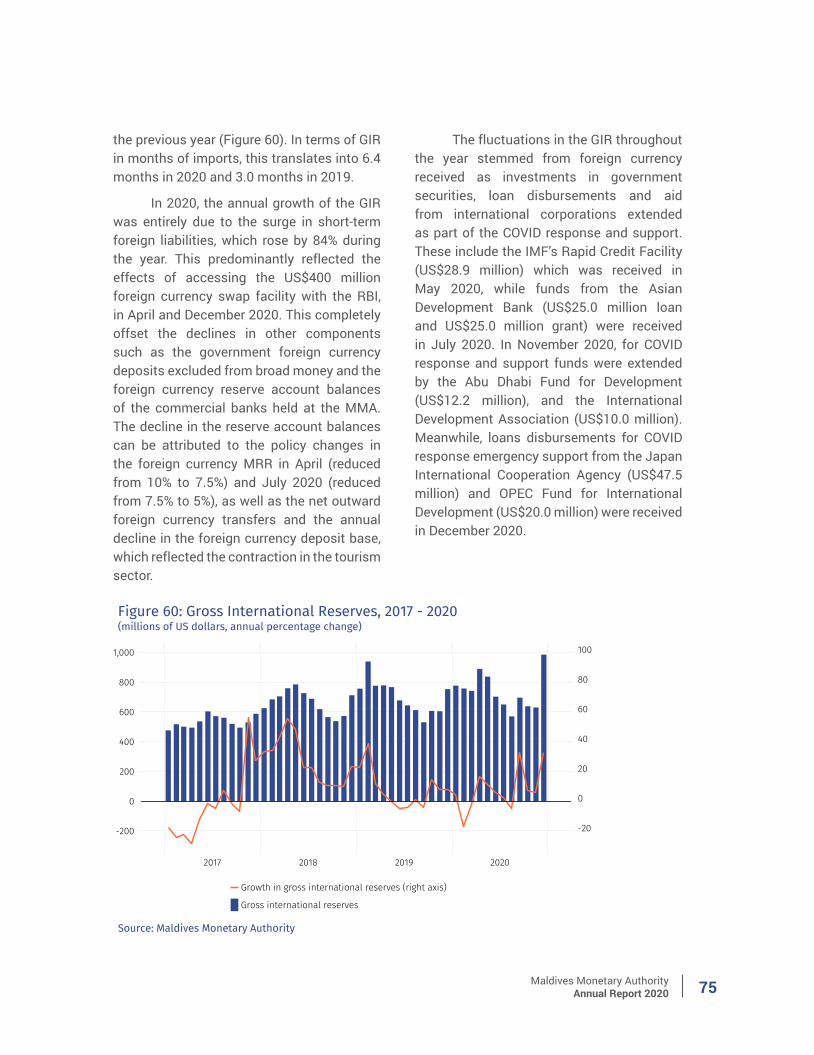
Maldives Monetary AuthorityAnnual Report 2020 75
the previous year (Figure 60). In terms of GIR in months of imports, this translates into 6.4 months in 2020 and 3.0 months in 2019.
In 2020, the annual growth of the GIR was entirely due to the surge in short-term foreign liabilities, which rose by 84% during the year. This predominantly reflected the effects of accessing the US$400 million foreign currency swap facility with the RBI, in April and December 2020. This completely offset the declines in other components such as the government foreign currency deposits excluded from broad money and the foreign currency reserve account balances of the commercial banks held at the MMA. The decline in the reserve account balances can be attributed to the policy changes in the foreign currency MRR in April (reduced from 10% to 7.5%) and July 2020 (reduced from 7.5% to 5%), as well as the net outward foreign currency transfers and the annual decline in the foreign currency deposit base, which reflected the contraction in the tourism sector.
The fluctuations in the GIR throughout the year stemmed from foreign currency received as investments in government securities, loan disbursements and aid from international corporations extended as part of the COVID response and support. These include the IMF’s Rapid Credit Facility (US$28.9 million) which was received in May 2020, while funds from the Asian Development Bank (US$25.0 million loan and US$25.0 million grant) were received in July 2020. In November 2020, for COVID response and support funds were extended by the Abu Dhabi Fund for Development (US$12.2 million), and the International Development Association (US$10.0 million). Meanwhile, loans disbursements for COVID response emergency support from the Japan International Cooperation Agency (US$47.5 million) and OPEC Fund for International Development (US$20.0 million) were received in December 2020.
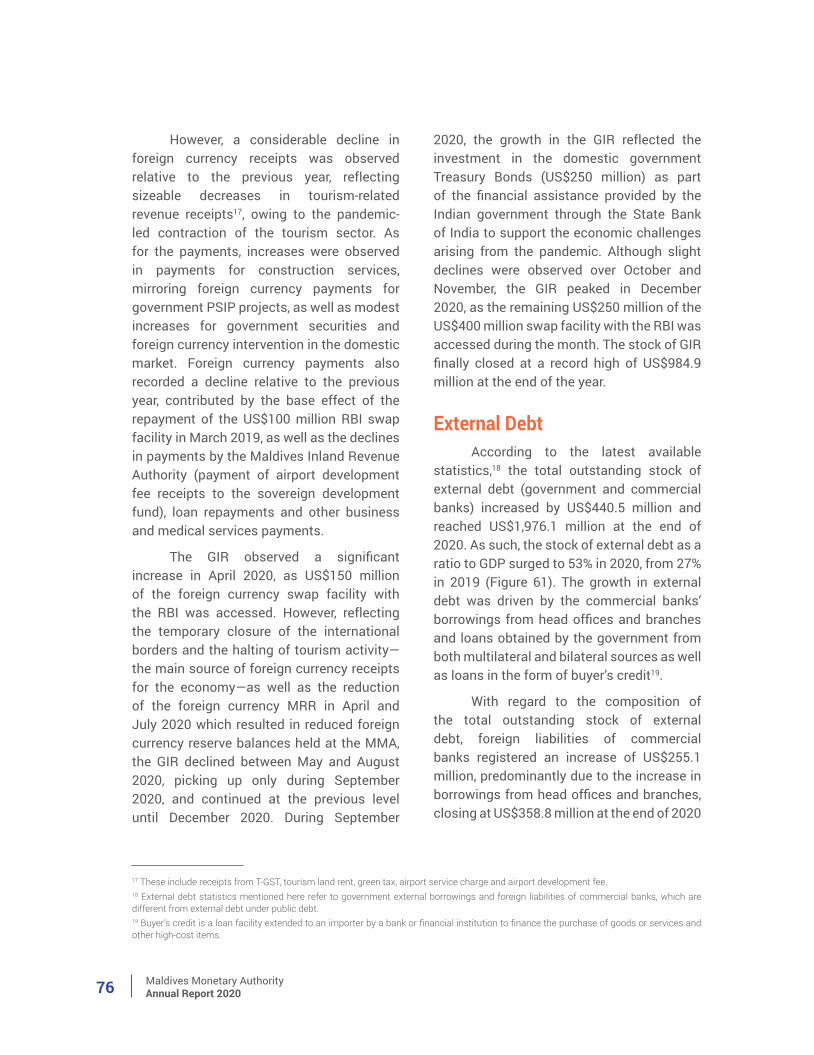
Maldives Monetary AuthorityAnnual Report 202076
However, a considerable decline in foreign currency receipts was observed relative to the previous year, reflecting sizeable decreases in tourism-related revenue receipts17, owing to the pandemic-led contraction of the tourism sector. As for the payments, increases were observed in payments for construction services, mirroring foreign currency payments for government PSIP projects, as well as modest increases for government securities and foreign currency intervention in the domestic market. Foreign currency payments also recorded a decline relative to the previous year, contributed by the base effect of the repayment of the US$100 million RBI swap facility in March 2019, as well as the declines in payments by the Maldives Inland Revenue Authority (payment of airport development fee receipts to the sovereign development fund), loan repayments and other business and medical services payments.
The GIR observed a significant increase in April 2020, as US$150 million of the foreign currency swap facility with the RBI was accessed. However, reflecting the temporary closure of the international borders and the halting of tourism activity—the main source of foreign currency receipts for the economy—as well as the reduction of the foreign currency MRR in April and July 2020 which resulted in reduced foreign currency reserve balances held at the MMA, the GIR declined between May and August 2020, picking up only during September 2020, and continued at the previous level until December 2020. During September
2020, the growth in the GIR reflected the investment in the domestic government Treasury Bonds (US$250 million) as part of the financial assistance provided by the Indian government through the State Bank of India to support the economic challenges arising from the pandemic. Although slight declines were observed over October and November, the GIR peaked in December 2020, as the remaining US$250 million of the US$400 million swap facility with the RBI was accessed during the month. The stock of GIR finally closed at a record high of US$984.9 million at the end of the year.
External DebtAccording to the latest available
statistics,18 the total outstanding stock of external debt (government and commercial banks) increased by US$440.5 million and reached US$1,976.1 million at the end of 2020. As such, the stock of external debt as a ratio to GDP surged to 53% in 2020, from 27% in 2019 (Figure 61). The growth in external debt was driven by the commercial banks’ borrowings from head offices and branches and loans obtained by the government from both multilateral and bilateral sources as well as loans in the form of buyer’s credit19.
With regard to the composition of the total outstanding stock of external debt, foreign liabilities of commercial banks registered an increase of US$255.1 million, predominantly due to the increase in borrowings from head offices and branches, closing at US$358.8 million at the end of 2020
17 These include receipts from T-GST, tourism land rent, green tax, airport service charge and airport development fee.18 External debt statistics mentioned here refer to government external borrowings and foreign liabilities of commercial banks, which are different from external debt under public debt.19 Buyer’s credit is a loan facility extended to an importer by a bank or financial institution to finance the purchase of goods or services and other high-cost items.
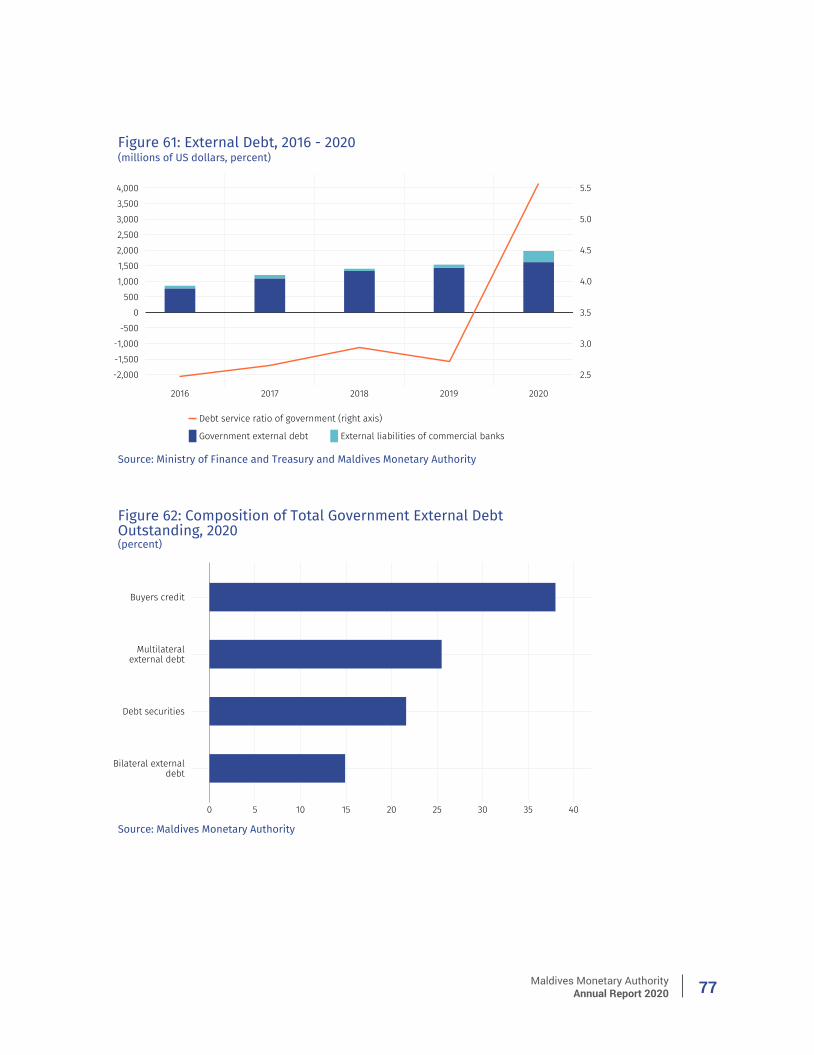
Maldives Monetary AuthorityAnnual Report 2020 77
Maldives Monetary AuthorityAnnual Report 202078
(Figure 62). In terms of GDP, the outstanding stock of commercial banks’ borrowings increased to 10% in 2020, from 2% in 2019.
As for the government external borrowing—which primarily consists of buyer’s credit, debt securities and loans obtained from multilateral and bilateral sources—rose by US$185.4 million and totalled US$1,617.2 million at the end of 2020 (Figure 64). In terms of GDP, the outstanding stock of central government external debt surged to 43% in 2020, from 25% in 2019. Debt obtained in the form of multilateral loans increased by US$95.4 million to total US$412.0 million during 2020. Meanwhile, bilateral loans observed a growth of US$70.6 million to total US$240.4 million. While debt securities remained virtually unchanged during the year, debt obtained in the form of buyer’s credit observed a growth of US$20.5 million and totalled US$614.8 million during the year.
The total cost of debt servicing20 declined by US$12.3 million and amounted to US$88.6 million (2% of GDP) in 2020, mainly reflecting the decline in principal payments on bilateral loans and loans obtained from commercial banks, as well as interest payments on buyer’s credit. While the decrease in debt service cost on bilateral loans was due to the G20 Debt Service Suspension Initiative (DSSI), the debt service cost on commercial bank loans decreased as there were no outstanding loans to commercial banks at the end of 2020. Meanwhile, mirroring the both decrease in debt service payments as well as the pandemic-led decline in exports of goods and services, the debt service ratio21—which measures the adequacy of a country’s foreign exchange earnings to meet maturing debt obligations—increased to 5.6% in 2020, from 2.7% in 2019.
20 Includes both principal and interest payments.21 Debt service ratio is the ratio of debt service payments to export of goods and services.
Maldives Monetary AuthorityAnnual Report 2020 79
Outlook for 2021
The global economy continues its uneven recovery path since the second half of 2020, with global recovery projected to gain momentum in 2021 as vaccine rollout programmes are expected become widespread during the year. The IMF in its April 2021 World Economic Outlook (WEO) projects global GDP growth to be 6.0% in 2021, which is an upward revision to forecasts made in October 2020 WEO. However, a high level of uncertainty surrounds the global economic outlook for 2021, owing to the re-imposition of more stringent containment measures in some countries due to the resurgence of coronavirus (COVID-19) infections, a slower-than-expected vaccine rollout program in certain regions and the emergence of new virus variants, that could undermine the effectiveness of available COVID-19 vaccines. Against this backdrop, the prospects for global growth in 2021 will continue to depend on the path of the pandemic and continued policy support.
Following an unprecedented contraction of real GDP estimated at 32.0% in 2020, the Maldivian economy is projected to grow in the range of 13.5% and 18.3% in 2021, according to the projections made in October 2020, largely reflecting low base effects. Meanwhile, based on the latest available high-frequency indicators related to trade and tourism, the recovery of the tourism sector could be faster than projected, thus accelerating the pace of domestic recovery. In 2021, growth is expected to be driven by the gradual recovery of the tourism sector as well as the recovery of sectors that are closely linked to tourism, such as transport and communication, and wholesale and retail trade. Construction activity is also expected to recover strongly in 2021, reflecting the ramp-up in public sector infrastructure projects envisaged in the 2021 Budget. Despite the strong recovery of tourist arrivals anticipated for 2021, arrivals
are expected to remain well below the pre-pandemic level of 1.7 million achieved in 2019.
In 2021, the rate of Inflation is expected to remain subdued, mainly due to the dissipation of base effects related to the price reduction measures implemented by the government in 2020 due to COVID-19, as well as the high import prices stemming from continued foreign exchange shortages in the economy. With respect to the inflation trajectory, the rate of inflation is expected to turn slightly positive in Q1-2021 from -1.4% in 2020, reaching a peak in Q2-2020 and slightly decelerate in the second half of the year. The outlook for inflation also depends on the developments in the domestic foreign exchange market as well as global oil and commodity prices. In 2021, despite the anticipated global recovery and the projected rebound in global commodity prices, global inflation is projected to remain largely muted due to the high level of economic slack in several economies.
According to the 2021 Budget, fiscal deficit is projected to decline from 27.5% of GDP in 2020 to 18.5% in 2021 driven by a partial recovery of revenue despite the projected increase in expenditure. The projected increase in revenue mainly stems from increases in non-tax revenue associated with resort lease rent, reflecting the payment of deferred resort lease rent, and revenue collections from the new revenue measures proposed in the 2020 Budget, subject to the approval of the Parliament. The new revenue measures include changes to airport service charge and the airport development fee, development of real estate tourism, changes to telecom license fees and introduction of a frequency spectrum charge, leasing parking slots and introduction of a congestion
Maldives Monetary AuthorityAnnual Report 202080
charge, and allocating a percentage of reclaimed land on different islands to be sold. In 2021, total expenditure is also projected to increase reflecting a substantial increase in capital spending, driven by the increase in public infrastructure projects largely to be financed by external loans. The 2021 Budget plans to finance the fiscal deficit largely through external financing, which includes borrowings as loans, the issuance of sukuk/bonds and budget support through multilateral and bilateral sources. In 2021, total public debt is projected to increase from 121% of GDP in 2020 to 125% of the GDP at the end of 2021.
The current account deficit is projected to widen in 2021, as the expected increase in the services surplus, stemming from higher travel receipts, is estimated to be offset by the increase in merchandise imports as well as higher outflows in the primary and secondary income categories. In 2021, net inflows on the financial account are expected to increase further, driven by direct investments and borrowings by the government.
Risks to OutlookThe outlook for both the global
economy and the Maldives continues to be surrounded by a high level of uncertainty, with both upside and downside risks. Major downside risks include the resurgence of
coronavirus infections and the emergence of more transmissible or dangerous variants of the virus in major tourism source markets in Europe and India, which has led to the reintroduction of more stringent travel restrictions and issuance of travel advisories, and the slower-than-expected vaccine rollout programs due to production delays. On the upside, a potential resumption of outbound travel from China to the Maldives and a faster-than-anticipated rollout of vaccination programs across the globe could accelerate the recovery of tourist arrivals and real GDP than anticipated. The rapid progress made in the domestic vaccination campaign—with 55% of the population already having received the first dose of COVID-19 vaccine—would also further help in promoting Maldives as a safe destination and boost the confidence of travellers which could increase the pace of tourism recovery.
As for inflation, risks remain persistent, led by uncertainty surrounding persistence of discounted rental rates and reduced prices in the information and communication sector. Inflation is largely dependent on government policy direction, and any changes to taxation and subsidies would directly impact inflation, which further elongates the uncertainty led by the pandemic, that continues to affect fiscal policy with greater frequency.

Maldives Monetary AuthorityAnnual Report 2020 81
INTERNAL MANAGEMENT, POLICIES AND ORGANISATIONAL DEVELOPMENTS
Maldives Monetary AuthorityAnnual Report 202082
Monetary Policy
Monetary Policy Framework One of the key responsibilities of the
MMA is the formulation and implementation of the monetary policy. The main aim of the monetary policy is to achieve price stability conducive to the sustainable growth of the economy. Under the current monetary policy framework, the exchange rate peg to the US dollar is used as the nominal anchor for achieving price stability. Since the Maldives is a small open economy with high dependence on imports, the domestic price levels are greatly influenced by the changes in global market prices and exchange rate. Therefore, in order to maintain price stability through the exchange rate, the MMA strives to maintain the exchange rate peg within the set horizontal band, where the exchange rate is allowed to fluctuate within the bounds of MVR10.28 to MVR15.42. Further, the MMA continues to manage the excess liquidity in the banking system to support the exchange rate stability.
To achieve the monetary policy objectives, the MMA uses the following instruments: the MRR, OMOs, the standing facilities that include the ODF and the OLF, and foreign currency swaps. In light of the COVID-19 pandemic, the MMA adjusted the policy instruments to support the Maldivian economy.
The monetary policy decisions are made by the Board of Directors of the MMA, after careful consideration of the recommendations made by the Monetary Policy Committee (MPC).
Implementation of Monetary Policy
The COVID-19 pandemic severely affected global economic activities,
creating massive uncertainty about the macroeconomic environment. Similarly, the Maldivian economy faced major economic and financial disruptions as well. In response to this, in March 2020, the MMA together with the government announced a set of policy measures to support the domestic economy. These measures included changes to liquidity management operations and foreign exchange intervention policy.
As for liquidity management, the MMA temporarily lowered the MRR twice in 2020 to address the liquidity issues in the market. The MMA also provided foreign currency liquidity support through fixed deposit investments at the commercial banks in addition to the existing policy instruments.
In order to maintain an adequate level of gross international reserves and improve market confidence, the MMA accessed US$400 million in 2020 through a foreign currency swap arrangement between the RBI and the MMA, which was signed in July 2019. In addition, the MMA, together with the Ministry of Finance, availed the IMF Rapid Credit Facility (RCF) of US$28.9 million in April 2020. Furthermore, the MMA increased foreign exchange intervention to address foreign currency shortages in the domestic economy.
Exchange Rate StabilitySimilar to the previous years, the MMA
continued its foreign exchange intervention to maintain the exchange rate stability. To address the US dollar supply shortage in the domestic foreign exchange market due to the COVID-19 pandemic, the MMA increased the total US dollar sales to the market. As such, the total US dollar sales by the MMA in 2020 amounted to US$633.9 million, which was an increase of 1% when compared to 2019.
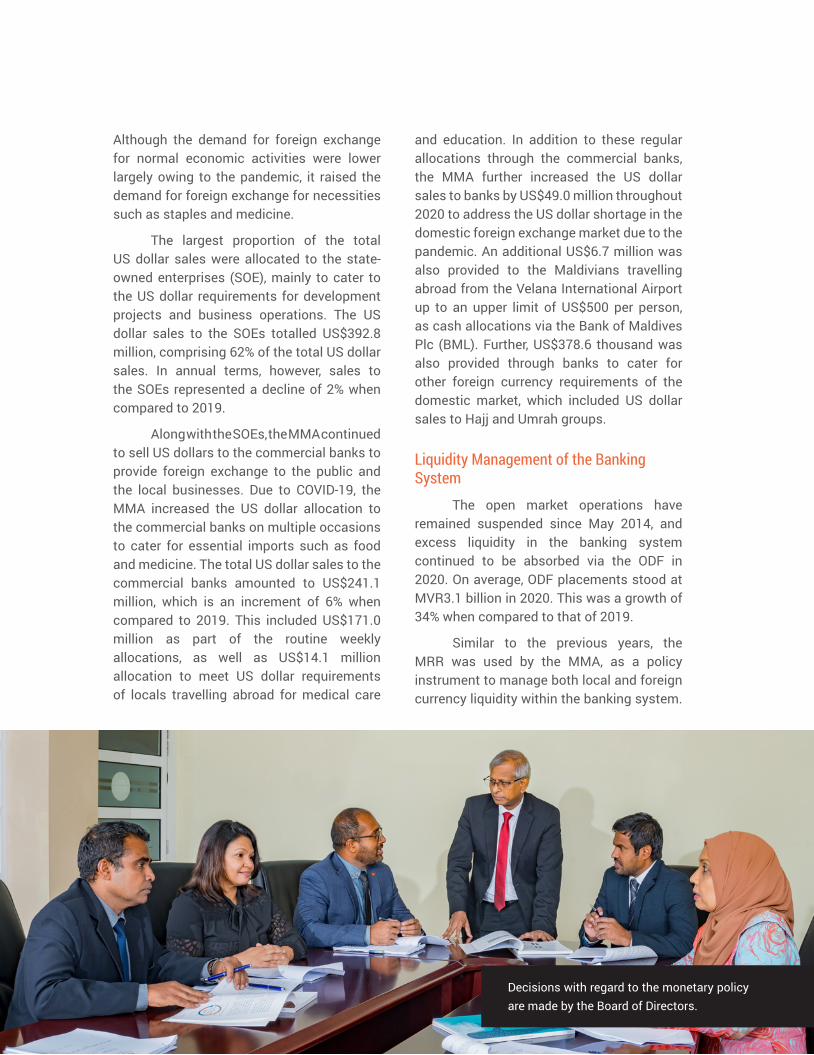
Maldives Monetary AuthorityAnnual Report 2020 83
Although the demand for foreign exchange for normal economic activities were lower largely owing to the pandemic, it raised the demand for foreign exchange for necessities such as staples and medicine.
The largest proportion of the total US dollar sales were allocated to the state-owned enterprises (SOE), mainly to cater to the US dollar requirements for development projects and business operations. The US dollar sales to the SOEs totalled US$392.8 million, comprising 62% of the total US dollar sales. In annual terms, however, sales to the SOEs represented a decline of 2% when compared to 2019.
Along with the SOEs, the MMA continued to sell US dollars to the commercial banks to provide foreign exchange to the public and the local businesses. Due to COVID-19, the MMA increased the US dollar allocation to the commercial banks on multiple occasions to cater for essential imports such as food and medicine. The total US dollar sales to the commercial banks amounted to US$241.1 million, which is an increment of 6% when compared to 2019. This included US$171.0 million as part of the routine weekly allocations, as well as US$14.1 million allocation to meet US dollar requirements of locals travelling abroad for medical care
and education. In addition to these regular allocations through the commercial banks, the MMA further increased the US dollar sales to banks by US$49.0 million throughout 2020 to address the US dollar shortage in the domestic foreign exchange market due to the pandemic. An additional US$6.7 million was also provided to the Maldivians travelling abroad from the Velana International Airport up to an upper limit of US$500 per person, as cash allocations via the Bank of Maldives Plc (BML). Further, US$378.6 thousand was also provided through banks to cater for other foreign currency requirements of the domestic market, which included US dollar sales to Hajj and Umrah groups.
Liquidity Management of the Banking System
The open market operations have remained suspended since May 2014, and excess liquidity in the banking system continued to be absorbed via the ODF in 2020. On average, ODF placements stood at MVR3.1 billion in 2020. This was a growth of 34% when compared to that of 2019.
Similar to the previous years, the MRR was used by the MMA, as a policy instrument to manage both local and foreign currency liquidity within the banking system.
Decisions with regard to the monetary policy are made by the Board of Directors.
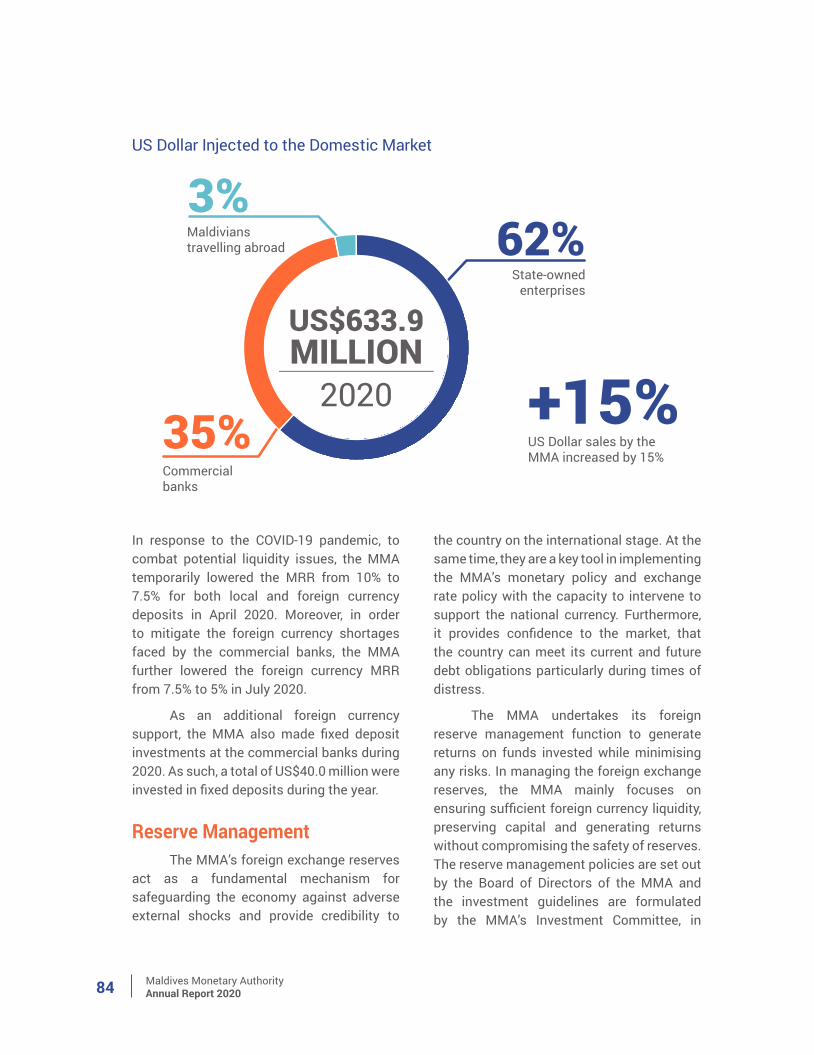
Maldives Monetary AuthorityAnnual Report 202084
US Dollar Injected to the Domestic Market
+15%
62%3%
35%
Maldivians travelling abroad
Commercial banks
State-ownedenterprises
US Dollar sales by theMMA increased by 15%
MILLION2020
US$633.9
In response to the COVID-19 pandemic, to combat potential liquidity issues, the MMA temporarily lowered the MRR from 10% to 7.5% for both local and foreign currency deposits in April 2020. Moreover, in order to mitigate the foreign currency shortages faced by the commercial banks, the MMA further lowered the foreign currency MRR from 7.5% to 5% in July 2020.
As an additional foreign currency support, the MMA also made fixed deposit investments at the commercial banks during 2020. As such, a total of US$40.0 million were invested in fixed deposits during the year.
Reserve ManagementThe MMA’s foreign exchange reserves
act as a fundamental mechanism for safeguarding the economy against adverse external shocks and provide credibility to
the country on the international stage. At the same time, they are a key tool in implementing the MMA’s monetary policy and exchange rate policy with the capacity to intervene to support the national currency. Furthermore, it provides confidence to the market, that the country can meet its current and future debt obligations particularly during times of distress.
The MMA undertakes its foreign reserve management function to generate returns on funds invested while minimising any risks. In managing the foreign exchange reserves, the MMA mainly focuses on ensuring sufficient foreign currency liquidity, preserving capital and generating returns without compromising the safety of reserves. The reserve management policies are set out by the Board of Directors of the MMA and the investment guidelines are formulated by the MMA’s Investment Committee, in

Maldives Monetary AuthorityAnnual Report 2020 85
accordance with these policies. Accordingly, during 2020, foreign exchange reserves were managed in an active and flexible manner, with a focus on identifying and capitalising on new opportunities in the global financial markets, without prejudice to the MMA’s investment objectives of safety and liquidity. At the end of 2020, reserves were mainly invested in money market instruments, and in fixed income securities issued by foreign governments and international financial institutions. Of total interest income
generated through reserve management activities, 77.5% was from investments in money market instruments, while 21.7% was from investments in fixed income securities.
The MMA continued to establish counterparty relationships with international banks and financial institutions, with the aim of expanding reserve management activities. By the end of 2020, the MMA had established counterparty relationships with 17 financial institutions.
Reserve Investments by Main Asset Classes, 2020
Investments in money market
Investments in fixed income securities
Deposits with central banks and supranationals
86%
11%
3%
Maldives Monetary AuthorityAnnual Report 202086
Financial Stability
Maintaining a healthy and stable financial system in the Maldives is one of the key objectives of the MMA, which is essential to ensure public confidence in the financial system. To achieve this objective, the MMA licences and regulates financial institutions, and supervises them in order to identify risks to the financial system and to assess the system’s capacity to cope with threats. In addition, the MMA undertakes several measures to further strengthen and develop the financial sector. Financial institutions and service providers operating in the financial sector that fall under the MMA’s regulatory purview include commercial banks, insurance companies, a finance leasing company, a housing finance institution, money remittance companies, insurance brokers and agents, and mobile payment service providers.
Developments to the Legal Framework
In 2020, measures were undertaken to develop the existing legal framework to strengthen the operations of the financial institutions and to align the functions and operations of the MMA with that of a modern central bank. The following were the legislation enacted and regulations issued during 2020.
• Fourth Amendment to Law no. 6/81 (Maldives Monetary Authority Act 1981) was brought on 24 December 2020. This amendment ensures that the objectives and functions of the MMA are in line with that of modern central banks currently in place. Moreover, this amendment enables the MMA to have a more professional and technical Board of Directors and enables the MMA to develop the financial sector
further by carrying out projects to increase financial inclusion.
• Second Amendment to Regulation no. 2015/R-111 (Regulation on Cross Border Cash Declaration Amount) was passed on 22 December 2020, which came into effect on 17 January 2021. Under this amendment, the threshold for cash transported cross border to be reported to the Maldives Customs Service was reduced from US$20,000 to US$10,000 or more, or its equivalent in Rufiyaa or foreign currencies.
• Third Amendment to Regulation no. 2016/R-80 (Regulation on Fees and Charges Payable by Financial Institutions) was issued on 4 February 2020. This amendment enables to increase participation of insurance agents in the financial sector, by reducing the licence application fee and abolishing the annual fee payable to the MMA by insurance agents.
• In order to promote sound and prudent corporate governance principles within banks, insurance companies and finance companies in the Maldives, the MMA issued Regulation no. 2020/R-59 (Regulation on Corporate Governance for Banks, Insurance Companies and Finance Companies) with effect from 21 July 2020. The Regulation provides for the minimum corporate governance principles to be followed by these financial institutions.
• Regulation no. 2020/R-61 (Regulation on Management of Confiscated Funds and Properties related to Money Laundering and Financing of Terrorism) was issued under Law no. 10/24 (Prevention of Money Laundering and Financing of
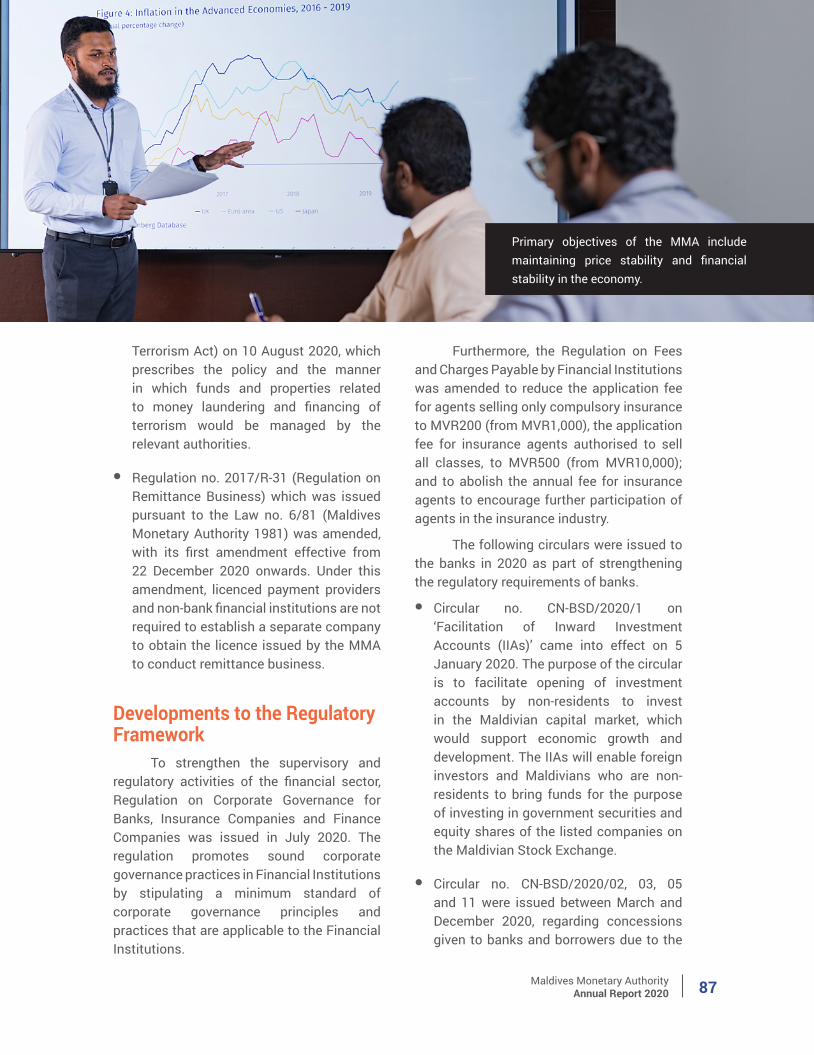
Maldives Monetary AuthorityAnnual Report 2020 87
Terrorism Act) on 10 August 2020, which prescribes the policy and the manner in which funds and properties related to money laundering and financing of terrorism would be managed by the relevant authorities.
• Regulation no. 2017/R-31 (Regulation on Remittance Business) which was issued pursuant to the Law no. 6/81 (Maldives Monetary Authority 1981) was amended, with its first amendment effective from 22 December 2020 onwards. Under this amendment, licenced payment providers and non-bank financial institutions are not required to establish a separate company to obtain the licence issued by the MMA to conduct remittance business.
Developments to the Regulatory Framework
To strengthen the supervisory and regulatory activities of the financial sector, Regulation on Corporate Governance for Banks, Insurance Companies and Finance Companies was issued in July 2020. The regulation promotes sound corporate governance practices in Financial Institutions by stipulating a minimum standard of corporate governance principles and practices that are applicable to the Financial Institutions.
Furthermore, the Regulation on Fees and Charges Payable by Financial Institutions was amended to reduce the application fee for agents selling only compulsory insurance to MVR200 (from MVR1,000), the application fee for insurance agents authorised to sell all classes, to MVR500 (from MVR10,000); and to abolish the annual fee for insurance agents to encourage further participation of agents in the insurance industry.
The following circulars were issued to the banks in 2020 as part of strengthening the regulatory requirements of banks.
• Circular no. CN-BSD/2020/1 on ‘Facilitation of Inward Investment Accounts (IIAs)’ came into effect on 5 January 2020. The purpose of the circular is to facilitate opening of investment accounts by non-residents to invest in the Maldivian capital market, which would support economic growth and development. The IIAs will enable foreign investors and Maldivians who are non-residents to bring funds for the purpose of investing in government securities and equity shares of the listed companies on the Maldivian Stock Exchange.
• Circular no. CN-BSD/2020/02, 03, 05 and 11 were issued between March and December 2020, regarding concessions given to banks and borrowers due to the
Primary objectives of the MMA include maintaining price stability and financial stability in the economy.
Maldives Monetary AuthorityAnnual Report 202088
COVID-19 pandemic, mandating banks to provide moratorium for a minimum of six months for those borrowers unable to make the scheduled loan repayments due to the impact of the pandemic. This would ensure that borrowers obtained the relief required to make payments on feasible terms during the challenging period, which would also serve to protect the banks’ financial condition. Furthermore, concessions were given to banks in making loan loss provisions for rescheduled or restructured loans, by reducing the provision requirement to 3% for loans which observed changes to terms due to the impact of the pandemic, and by not requiring adverse grading on account of restructuring or rescheduling done for such loans. This regulatory leeway was extended twice during the year, after assessing the economic conditions, and will remain effective until 31 March 2021.
• Circular no. CN-BSD/2020/4 was issued on 15 July 2020, regarding the reduction of the foreign currency MRR to 5%. During April 2020, MMA had reduced the MRR from 10% to 7.5% for both local and foreign currencies, to support the commercial banks’ liquidity during the pandemic.
• Circular no. CN-BSD/2020/9 was issued on 19 November 2020, regarding the imposition of a daily cash withdrawal limit. The purpose of the circular is to encourage electronic transactions, and reduce dependency on cash thereby mitigating the associated risks. A daily limit for transactions per customer across all the channels was set at MVR200,000, or equivalent in foreign currencies.
• Circular no. CN-INS/2020/10 regarding capital requirements was issued to
insurance brokers on 27 December 2020, mandating them to maintain a minimum net asset value of MVR500,000 at all times.
Licensing, Supervision and Other Regulatory Activities
As part of the MMA’s mandate to ensure financial stability, it is necessary to ascertain that all banks and non-bank financial institutions function in a safe and sound manner, and within the laws and regulations governing these institutions. Accordingly, the MMA conducts regular on-site examinations and off-site monitoring of these institutions, and undertakes work related to the issuance and cancellation of the licences of financial institutions.
On-site ExaminationsDuring on-site examinations, areas of
risks in the operations of financial institutions are identified and the level of compliance with relevant regulatory requirements and internal policies are checked. While the on-site examinations of all financial institutions including banks are conducted based on the risk profile of the institutions, those of banks are also required by law to be conducted at least once every two years. The following on-site examinations of the financial institutions were conducted in 2020:
• An examination of the Maldives Islamic Bank Plc. was conducted to assess the financing risk, cybersecurity and information security, and compliance with AML/CFT law and regulations.
• An examination of the Commercial Bank of Maldives Pvt. Ltd. was carried out to follow-up on issues related to the previous
Maldives Monetary AuthorityAnnual Report 2020 89
examination, to assess its operational risk, and to review compliance to the relevant laws, regulations, and internal policies.
• An examination of the Hongkong and Shanghai Banking Corporation Limited was conducted to assess the AML/CFT risk management practices and compliance with AML/CFT laws and regulations.
• On-site examinations of two money remittance companies—Bandaha Financials Pvt. Ltd. and Island Financial Services Pvt. Ltd.—were conducted during the year.
Off-site ExaminationsOff-site monitoring of financial
institutions involves reviewing and analysing the financial reports and other information submitted to the MMA by these institutions, and preparing quarterly off-site reports. These reports focus mainly on the institutions’ financial condition and compliance with relevant regulatory requirements. Regular off-site monitoring activities of all financial institutions were conducted in 2020.
Licences Issued and Cancelled during the Year • Insurance agent licences were issued to
five insurance agents.
• A finance leasing licence was issued to CMD Finance Leasing Company Pvt. Ltd. in January 2020. However, due to the difficulties faced owing to the COVID-19 pandemic, the deadline for commencing business has been extended until the end of March 2021; and failure to meet this deadline will result in cancellation of the licence.
• International Money Remittance Licence of Bandaha Financials Pvt. Ltd. was revoked in January 2020.
• Licences were issued to 21 new money changers, while 93 money changer licences were cancelled during the year; either at the licensee’s request or as a result of non-compliance to licensing conditions.
Identifying risks to the financial system and assessing its capacity to cope with threats is vital in maintaining financial stability.
Maldives Monetary AuthorityAnnual Report 202090
Development of the Financial Sector
In the effort to sustainably develop the financial sector and to foster inclusive growth in the Maldives, several initiatives were undertaken by the MMA. As such, the key initiatives undertaken focused mainly on facilitating ease of access to finance for the small and medium enterprises (SMEs), enhancing financial consumer protection and fostering financial inclusion in the Maldives.
The MMA worked towards strengthening the financial infrastructure to enhance the efficiency of the financial sector. In this regard, the MMA continued to carry on the work related to the Maldives Payment System Development Project, Credit Information Bureau, Islamic finance, and financial consumer protection. Furthermore, in order to facilitate financial inclusion, the MMA continued work on the formulation of the National Financial Inclusion Strategy.
National Financial Inclusion Strategy The MMA initiated the formulation of a
National Financial Inclusion Strategy (NFIS) for the Maldives, in 2019, with the purpose of sustainably achieving financial inclusion objectives in the country. In this regard, a national level steering committee was proposed, and the discussions were carried out to formulate the steering committee. It was proposed that the committee would compose of members from key stakeholders including financial sector institutions and government entities who will be responsible for making policy level decisions regarding the strategy. The technical knowledge needed for the formulation and implementation of the NFIS is provided by the Alliance for Financial Inclusion (AFI).
Credit Guarantee SchemeThe purpose of the Credit Guarantee
Scheme (CGS) is to facilitate access to finance by alleviating the financing challenges faced by SMEs. The scheme provides guarantee cover for 90% of the loan granted by the participating banks to commercially viable SMEs.
At the end of 2020, a total of 87 applicants were provided loans under the scheme, of which 2 loans were guaranteed in the year 2020. The loans approved in 2020 were relatively lower when compared to 2019, reflecting the introduction of additional credit facilities to SMEs.
At the end of 2020, 16% loans approved under the scheme were granted to SMEs owned by women. With respect to the sector-wise spread of CGS loans, the retail sector held the major portion of the total CGS loans (50%). While 12% of loans were given to the construction sector, 9% and 5% of the total loans were issued to SMEs operating in the tourism and fisheries sectors, respectively. Under this scheme, loans were facilitated to SMEs operating across 17 atolls outside the Greater Male Region.
During 2020, decision was taken by the management to terminate the CGS due to the existing challenges to the scheme and the introduction of additional credit facilities for SMEs in the financial sector. Hence, the scheme has been terminated effective from 1 February 2021.
Maldives Monetary AuthorityAnnual Report 2020 91
Affordable Housing Loan SchemeAs part of the MMA’s broader objective
of increasing access to finance and financial inclusion, the Affordable Housing Scheme (AHS) was established to enable affordable loans to first-time home owners to secure housing. The AHS regulation was enacted in August 2017, and as per the AHS regulation, the scheme is to be operated for a period of three years. Hence the scheme was discontinued in August 2020.
The MMA provided guarantee for down payments of 53 loans amounting to MVR23.9 million under the first phase of the scheme. At the end of the tenor of the scheme a total of 85 loans amounting to MVR158.7 million were approved under the second phase of scheme.
Credit Information BureauThe Credit Information Bureau (CIB)
of the Maldives was established in 2011, governed by Regulation No. 2011/R-29 (Credit Information Regulation 2011) issued under the Law no. 24/2010 (Maldives Banking Act). An initiative of the MMA and financed by Asian Development Bank (ADB), the purpose of the CIB is to establish a credit information registry for the Maldives to improve access to finance and to further develop and improve the efficiency of the financial sector of the country with the main objective of providing a national credit information registry in the Maldives that will aid the financial sector in making more informed credit decisions. Further, the CIB also aims to provide a Secured Transactions Registry to facilitate and encourage the availability of loans and other forms of credit facilities through the use of movable property as collateral for such loans and credit.
The Credit Information System
The Credit Information System collects credit information from all banks and financial institutions who are members of the bureau. All banks and financial institutions in the Maldives are members of the bureau and are legally bound to submit credit information to the bureau. The credit information collected from the members includes public record data, statutory information, identity information, credit transactions and payment histories of individual consumers and commercial entities. The credit data is collated and compiled into Credit Information Reports (CIR) which provides credit-decision support for member institutions in making more informed credit decisions, and to obtain Self-Inquiry Reports (SIR) which can be requested by individuals or corporate entities in order to identify their credit standing.
Accordingly, during 2020 a total of 5,566 CIRs were obtained by the member institutions of the CIB. This included 3,410 consumer CIRs and 2,156 commercial CIRs. This is a decrease of 4% compared to the number of CIRs generated in the previous year, mainly due to the decline in banking services during the pandemic-related lockdown.
Meanwhile, the demand for SIRs has been improving in line with the increase in public awareness of the service. However, the number of SIRs generated also decreased during 2020, due to the COVID-19 pandemic. To facilitate easy access to the SIR service for the general public during the lockdown period, the process of issuing the reports was changed from manual collection to a fully online process, which has been maintained since, to adhere to the HPA guidelines.
Maldives Monetary AuthorityAnnual Report 202092
The Secured Transactions Registry
The purpose of the registry is to provide easier access to information for the banks and other financial institutions regarding moveable collateral assets, as well as to facilitate SMEs to use moveable assets as collateral to gain easier access to credit. The work on finalising the ‘Secured Transactions Act’, which is vital to implement the Secured Transactions Registry developed in 2018, was continued in 2020.
Additionally, the fourth amendment to the Law no. 6/81 (Maldives Monetary Authority 1981) in 2020 allowed the MMA to licence, regulate and supervise credit information systems operated by other parties and also to incorporate other credit providers such as utilities, telecommunication and insurance service providers.
Financial Consumer ProtectionIn the pursuit of maintaining financial
stability and to uphold customer trust in the financial sector, a complaint handling mechanism is established within MMA. In 2020, the Financial Consumer Protection Section received 20 written complaints, all of which were resolved by the end of the year.
During the year 2020, the MMA acquired further legal power to look into financial consumer complaints and financial consumer protection.
As the central bank, the MMA places great importance on creating a financially conscious community, as it complements the development of the financial sector.
Measures Taken to Prevent Financial Crimes
The MMA takes various measures to protect the integrity of the financial
system, and to ensure public confidence in the financial system. In this regard, work is continuously undertaken to ensure that the financial system is not used for financial crimes, particularly those related to money laundering and the financing of terrorism.
As part of these efforts, Law no. 10/2014 (Prevention of Money Laundering and Financing of Terrorism Act) was ratified in 2014 and amendment process of this act was initiated during 2019 in order to strengthen the legal framework to prevent money laundering and terrorism financing. Moreover, several regulations have also been issued by the MMA under this Act.
The Anti-Money Laundering and Combating the Financing of Terrorism (AML/CFT) regulations require financial institutions to undertake ‘customer due diligence’ measures prior to establishing a business relationship and while conducting transactions. These regulations also require the financial institutions to monitor customer transactions and report suspicious transactions to the Financial Intelligence Unit of the MMA (FIU-MMA). During 2020, the Regulation on Management of Confiscated Funds and Properties related to Money Laundering and Financing of Terrorism was issued. Additionally, the ‘AML/CFT Compliance General Guidelines for Reporting Entities on Politically Exposed Persons (PEPs)’ was also issued, which gives guidance to assist reporting entities in the identification and risk management of PEPs.
The FIU-MMA conducted trainings on identifying money laundering and terrorism financing activities and information sessions on anti-money laundering and financing of terrorism were also provided to reporting entities.
As part of the ongoing efforts to prevent financial crimes, the FIU-MMA
Maldives Monetary AuthorityAnnual Report 2020 93
continued its supervision of financial institutions, to monitor their compliance with the requirements under the regulatory framework. Accordingly, AML/CFT on-site examination of a bank was carried out during the year.
Moreover, MMA is committed to the highest-level AML/CFT measures in the daily operations and activities carried out by the
MMA. The MMA’s Risk and Compliance Unit ensure that appropriate measures are in place to mitigate the risk of Money Laundering and Terrorism Financing. Over the past years, various control measures such as customer screening and cash transaction guidelines have been put into practice to strengthen the AML/CFT activities in the daily operations of the MMA.
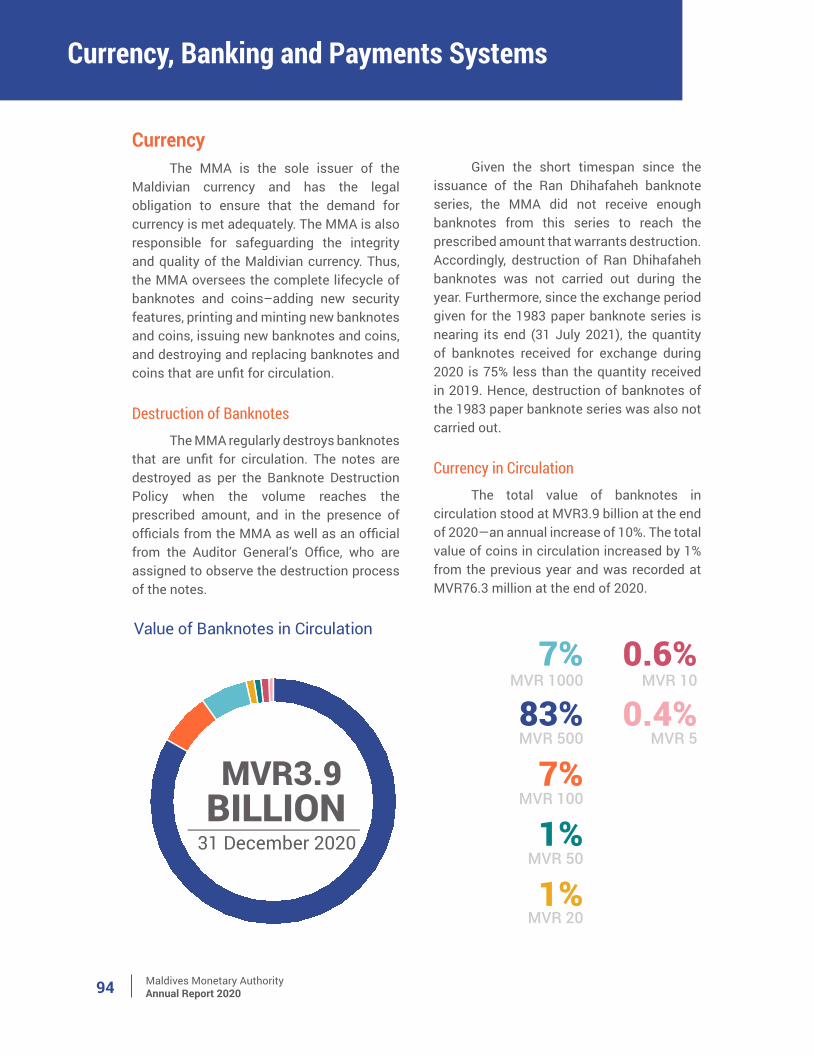
Maldives Monetary AuthorityAnnual Report 202094
CurrencyThe MMA is the sole issuer of the
Maldivian currency and has the legal obligation to ensure that the demand for currency is met adequately. The MMA is also responsible for safeguarding the integrity and quality of the Maldivian currency. Thus, the MMA oversees the complete lifecycle of banknotes and coins–adding new security features, printing and minting new banknotes and coins, issuing new banknotes and coins, and destroying and replacing banknotes and coins that are unfit for circulation.
Destruction of BanknotesThe MMA regularly destroys banknotes
that are unfit for circulation. The notes are destroyed as per the Banknote Destruction Policy when the volume reaches the prescribed amount, and in the presence of officials from the MMA as well as an official from the Auditor General’s Office, who are assigned to observe the destruction process of the notes.
Given the short timespan since the issuance of the Ran Dhihafaheh banknote series, the MMA did not receive enough banknotes from this series to reach the prescribed amount that warrants destruction. Accordingly, destruction of Ran Dhihafaheh banknotes was not carried out during the year. Furthermore, since the exchange period given for the 1983 paper banknote series is nearing its end (31 July 2021), the quantity of banknotes received for exchange during 2020 is 75% less than the quantity received in 2019. Hence, destruction of banknotes of the 1983 paper banknote series was also not carried out.
Currency in CirculationThe total value of banknotes in
circulation stood at MVR3.9 billion at the end of 2020—an annual increase of 10%. The total value of coins in circulation increased by 1% from the previous year and was recorded at MVR76.3 million at the end of 2020.
Currency, Banking and Payments Systems
Value of Banknotes in Circulation
MVR3.9BILLION
31 December 2020
83%
7%MVR 1000
MVR 500
MVR 10
MVR 5
MVR 100
MVR 50
MVR 20
7%
1%
1%
0.6%
0.4%
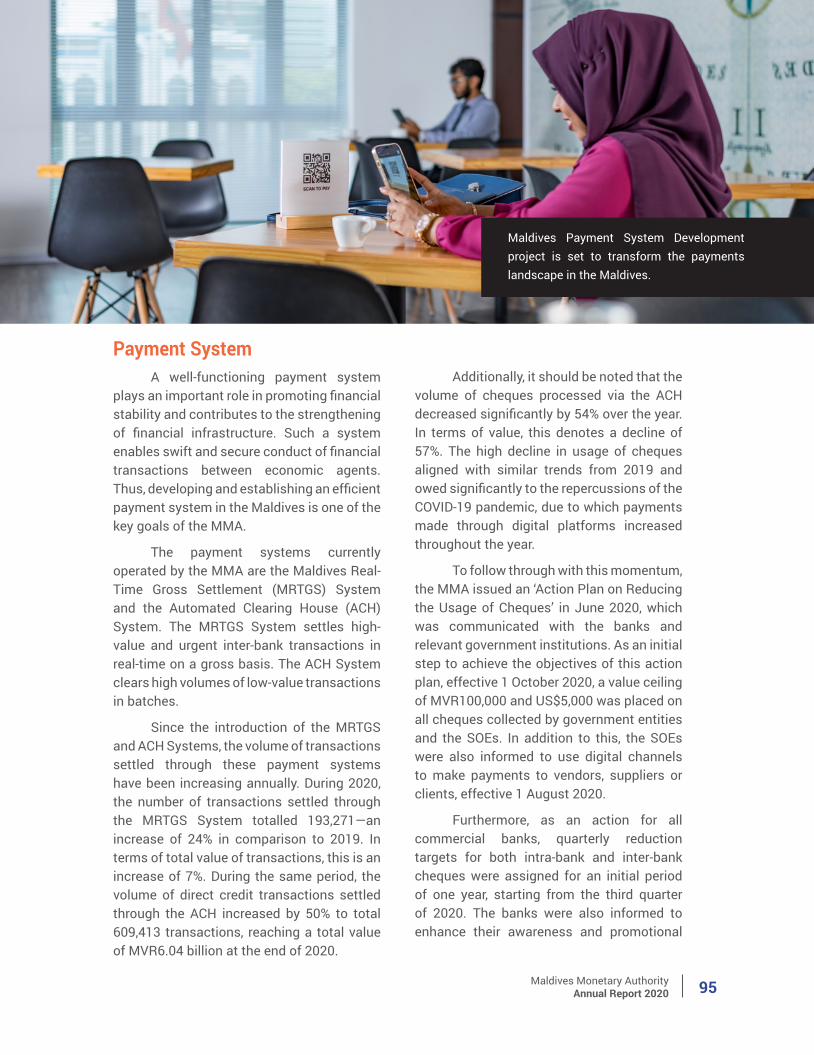
Maldives Monetary AuthorityAnnual Report 2020 95
Payment SystemA well-functioning payment system
plays an important role in promoting financial stability and contributes to the strengthening of financial infrastructure. Such a system enables swift and secure conduct of financial transactions between economic agents. Thus, developing and establishing an efficient payment system in the Maldives is one of the key goals of the MMA.
The payment systems currently operated by the MMA are the Maldives Real-Time Gross Settlement (MRTGS) System and the Automated Clearing House (ACH) System. The MRTGS System settles high-value and urgent inter-bank transactions in real-time on a gross basis. The ACH System clears high volumes of low-value transactions in batches.
Since the introduction of the MRTGS and ACH Systems, the volume of transactions settled through these payment systems have been increasing annually. During 2020, the number of transactions settled through the MRTGS System totalled 193,271—an increase of 24% in comparison to 2019. In terms of total value of transactions, this is an increase of 7%. During the same period, the volume of direct credit transactions settled through the ACH increased by 50% to total 609,413 transactions, reaching a total value of MVR6.04 billion at the end of 2020.
Additionally, it should be noted that the volume of cheques processed via the ACH decreased significantly by 54% over the year. In terms of value, this denotes a decline of 57%. The high decline in usage of cheques aligned with similar trends from 2019 and owed significantly to the repercussions of the COVID-19 pandemic, due to which payments made through digital platforms increased throughout the year.
To follow through with this momentum, the MMA issued an ‘Action Plan on Reducing the Usage of Cheques’ in June 2020, which was communicated with the banks and relevant government institutions. As an initial step to achieve the objectives of this action plan, effective 1 October 2020, a value ceiling of MVR100,000 and US$5,000 was placed on all cheques collected by government entities and the SOEs. In addition to this, the SOEs were also informed to use digital channels to make payments to vendors, suppliers or clients, effective 1 August 2020.
Furthermore, as an action for all commercial banks, quarterly reduction targets for both intra-bank and inter-bank cheques were assigned for an initial period of one year, starting from the third quarter of 2020. The banks were also informed to enhance their awareness and promotional
Maldives Payment System Development project is set to transform the payments landscape in the Maldives.
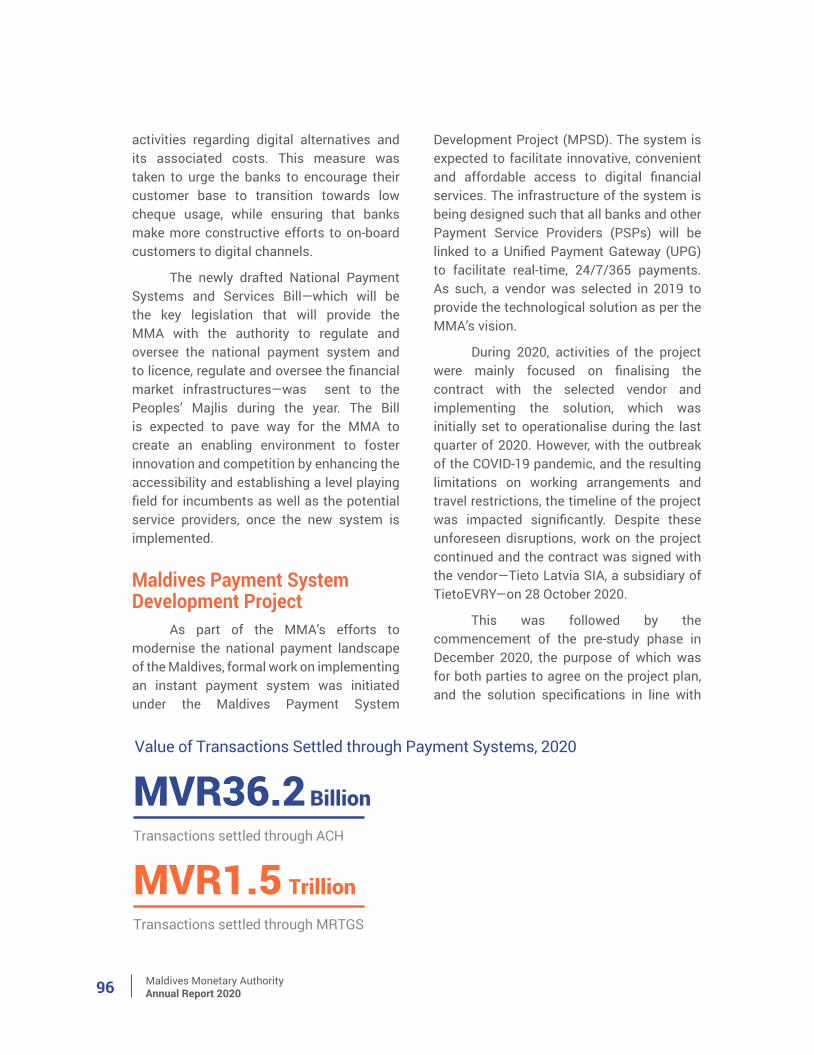
Maldives Monetary AuthorityAnnual Report 202096
activities regarding digital alternatives and its associated costs. This measure was taken to urge the banks to encourage their customer base to transition towards low cheque usage, while ensuring that banks make more constructive efforts to on-board customers to digital channels.
The newly drafted National Payment Systems and Services Bill—which will be the key legislation that will provide the MMA with the authority to regulate and oversee the national payment system and to licence, regulate and oversee the financial market infrastructures—was sent to the Peoples’ Majlis during the year. The Bill is expected to pave way for the MMA to create an enabling environment to foster innovation and competition by enhancing the accessibility and establishing a level playing field for incumbents as well as the potential service providers, once the new system is implemented.
Maldives Payment System Development Project
As part of the MMA’s efforts to modernise the national payment landscape of the Maldives, formal work on implementing an instant payment system was initiated under the Maldives Payment System
Development Project (MPSD). The system is expected to facilitate innovative, convenient and affordable access to digital financial services. The infrastructure of the system is being designed such that all banks and other Payment Service Providers (PSPs) will be linked to a Unified Payment Gateway (UPG) to facilitate real-time, 24/7/365 payments. As such, a vendor was selected in 2019 to provide the technological solution as per the MMA’s vision.
During 2020, activities of the project were mainly focused on finalising the contract with the selected vendor and implementing the solution, which was initially set to operationalise during the last quarter of 2020. However, with the outbreak of the COVID-19 pandemic, and the resulting limitations on working arrangements and travel restrictions, the timeline of the project was impacted significantly. Despite these unforeseen disruptions, work on the project continued and the contract was signed with the vendor—Tieto Latvia SIA, a subsidiary of TietoEVRY—on 28 October 2020.
This was followed by the commencement of the pre-study phase in December 2020, the purpose of which was for both parties to agree on the project plan, and the solution specifications in line with
Value of Transactions Settled through Payment Systems, 2020
MVR36.2 Transactions settled through ACH
Billion
MVR1.5 Transactions settled through MRTGS
Trillion
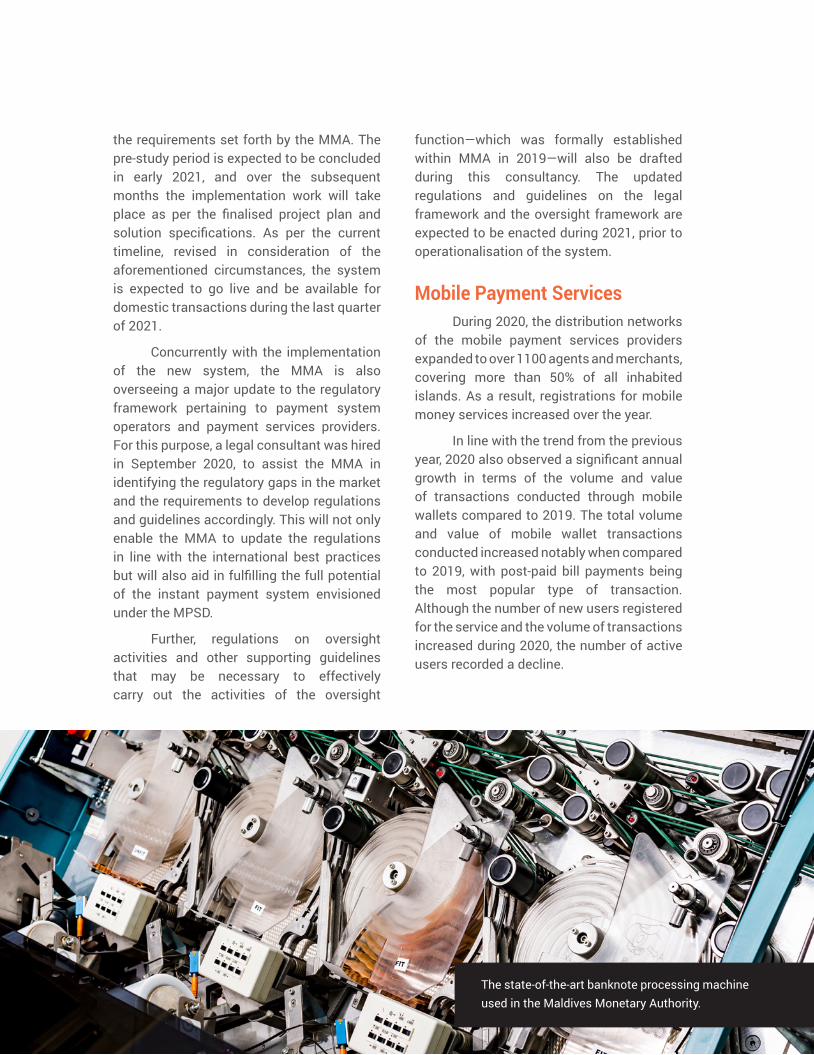
Maldives Monetary AuthorityAnnual Report 2020 97
the requirements set forth by the MMA. The pre-study period is expected to be concluded in early 2021, and over the subsequent months the implementation work will take place as per the finalised project plan and solution specifications. As per the current timeline, revised in consideration of the aforementioned circumstances, the system is expected to go live and be available for domestic transactions during the last quarter of 2021.
Concurrently with the implementation of the new system, the MMA is also overseeing a major update to the regulatory framework pertaining to payment system operators and payment services providers. For this purpose, a legal consultant was hired in September 2020, to assist the MMA in identifying the regulatory gaps in the market and the requirements to develop regulations and guidelines accordingly. This will not only enable the MMA to update the regulations in line with the international best practices but will also aid in fulfilling the full potential of the instant payment system envisioned under the MPSD.
Further, regulations on oversight activities and other supporting guidelines that may be necessary to effectively carry out the activities of the oversight
function—which was formally established within MMA in 2019—will also be drafted during this consultancy. The updated regulations and guidelines on the legal framework and the oversight framework are expected to be enacted during 2021, prior to operationalisation of the system.
Mobile Payment ServicesDuring 2020, the distribution networks
of the mobile payment services providers expanded to over 1100 agents and merchants, covering more than 50% of all inhabited islands. As a result, registrations for mobile money services increased over the year.
In line with the trend from the previous year, 2020 also observed a significant annual growth in terms of the volume and value of transactions conducted through mobile wallets compared to 2019. The total volume and value of mobile wallet transactions conducted increased notably when compared to 2019, with post-paid bill payments being the most popular type of transaction. Although the number of new users registered for the service and the volume of transactions increased during 2020, the number of active users recorded a decline.
The state-of-the-art banknote processing machine used in the Maldives Monetary Authority.
Maldives Monetary AuthorityAnnual Report 202098
Over the course of the year, several new use cases have been explored and implemented by the mobile payment service providers to improve the adoption of the service among the public. Integrating the mobile wallet payment gateway with entities such as the MIRA and insurance companies, and enabling features such as zakat payments in addition to cash-in options via selected banks, have contributed to the high usage. Additional efforts were focused towards increasing new customers and the existing customer base through cash back promotions and discount models implemented by service providers. Meanwhile, additional financial technology features continue to be explored by the service providers to increase the popularity of mobile payment services.
Banking Services to the Government
As the main banker to the government, the MMA continued to operate the government’s Single Treasury Account called the Public Bank Account (PBA), and the accounts related to various government projects. These banking services were provided without disruption, despite the COVID-19 pandemic.
As the fiscal agent of the government in the issuance and effective management of government securities, the MMA continued its advisory role to the government in all aspects related to the issuance of government securities in 2020 as well. Further, the work on the ‘Government Securities Market Development Project’, initiated by the MMA in 2017, aimed at expanding the government securities market, was continued in 2020. Under this project, the user acceptance testing phase of the Central Securities
Depository (CSD) system, initiated in 2019, continued in 2020 as well, with delays due to the challenges related to the COVID-19 pandemic. In addition to this, the commercial banks and other stakeholders were provided with participant training for the CSD system and the Investor Portal.
The fourth amendment to the Law no. 6/81 (Maldives Monetary Authority 1981) passed by the Majlis and enacted in December 2020, facilitated the trading of government securities in the secondary market.
Furthermore, long-term US dollar treasury bonds amounting to US$250 million were issued to raise additional financing needed for the government, due to the COVID-19 pandemic. While no new Islamic securities were issued during the year, those issued over the previous years were rolled over in 2020.

Maldives Monetary AuthorityAnnual Report 2020 99
The MMA conducts research and analysis on economic and financial developments in the domestic and global economy, which is imperative for formulating an effective monetary policy. Such research also provides analytical support to efficiently achieve the objectives of the MMA. Further, the MMA compiles and disseminates macroeconomic statistics on a regular basis.
Economic ResearchDuring 2020, the MMA continued its
work to produce in-depth research into specific areas of the broader economy spanning from monetary policy to other key economic and financial issues. More specifically, work was carried out on the policy-relevant research topics finalised in the research agenda formulated in 2019. Moreover, analysis on topics related to monetary policy, real sector, fiscal sector, financial as well as the external trade sector were disseminated through the Quarterly Economic Bulletin and the Annual Report, published on the MMA website.
The MMA produces forecasts of key macroeconomic indicators by developing medium and long-term econometric models which are applied for providing constructive analytical input, which assists in the
formulation of effective macroeconomic policies. As such, the MMA produces projections for the gross international reserves, inflation and the indicators for the tourism sector. Further, the MMA, in collaboration with the Ministry of Finance also forecast the annual GDP every year. Similar to the previous years, the professional opinion of the MMA was provided to the People’s Majlis regarding the proposed government budget for 2021.
Economic SurveysAs in the previous years, the MMA
conducted sample surveys to complement existing monetary and financial data and in areas where statistics are not available. In this regard, the MMA continued to conduct the Quarterly Business Survey, which aims to obtain a quick assessment of current business trends and expected future economic activity. As part of a broader strategy to improve the response rate of the survey, and to build the relationship between the MMA and the business community, a networking event was held for the business survey participants during March 2020. A total of three sessions were held from 1 to 3 March 2020 for businesses in the
Economic Research and Statistics
The MMA publishes developments in the Maldivian economy on a regular basis.
Maldives Monetary AuthorityAnnual Report 2020100
three surveyed sectors, namely tourism, construction, and wholesale and retail trade. These sessions provided a platform to exchange information between the MMA and the business community, while an overview of the QBS and its findings were also shared in the session. The business representatives discussed their expectations for the short term and highlighted the main issues faced by the businesses during the one-on-one interactions with the Governor Mr. Ali Hashim in the networking session. Furthermore, work was also carried out to develop and enrich the business survey, which included the addition of the transport and communication sector to the survey starting from Q3-2020.
In the year 2020, the MMA revamped the current Bank Credit Survey and conducted the survey every quarter. The key objective of this survey is to gauge banks’ perceptions about the past and expected developments in the credit demand and supply conditions in the domestic banking system to assist the monetary policy formulation.
Statistics Similar to previous years, the primary
responsibilities of compiling monetary and financial statistics and balance of payments statistics in the Maldives were carried out by the MMA during the year 2020. Furthermore, necessary measures were taken during the COVID-19 lockdown period in 2020, to ensure continuity of dissemination of macroeconomic and financial statistics provided to the public and international agencies.
In order to enhance the accessibility of data to users, the MMA developed and launched the MMA Query database and a new version of the MMA ‘Viya’ mobile app during October 2020. The MMA query database portal enables users to customise selection, view and download data from a range of economic time series data. The design of new version of the MMA ‘Viya’ mobile app was enhanced and new features such as a user preference watchlist and advance release dates of the MMA’s publications were made available in the calendar feature of the app. These statistics were also published regularly in the MMA Monthly Statistics publication in line with the Advance Release Calendar which states the expected release dates for statistics and publications of the MMA.
Maldives Monetary AuthorityAnnual Report 2020 101
The Board of Directors is the policy making body of the MMA, which sets out the monetary policy, the policies in relation to the functions of the MMA, and the general policies in relation to the administration and operation of the MMA.
Board of DirectorsThe Board of Directors comprises of
seven members made up of executive and non-executive members, inclusive of the Governor and Deputy Governor. Following the resignation of the private sector member in May 2019, a replacement member was not appointed during 2020. Hence, the Board of Directors composed of six members by the end of 2020 inclusive of the Deputy Governor Mr. Ahmed Imad, appointed to the Board on 9 September 2020, and Ms. Neeza Imad appointed from the economic sector of the government on 23 November 2020.
Board of Directors as at 31 December 2020:
• Mr. Ali Hashim – Chairperson (Governor)
• Mr. Ahmed Imad – Deputy Governor
• Ms. Idham Hussain – Assistant Governor
• Uz. Ashraf Rasheed – Ministry of Finance
• Ms. Neeza Imad – Economic Sector of the Government
• Mr. Ali Ihusaan – Private Sector
Main Resolutions Adopted by the Board of Directors in 2020
During the year 2020, seven meetings of the Board of Directors were held. The main resolutions adopted by the Board were as follows:
• Setting the enterprise risk management policy to be followed by the MMA.
• Issuing the following regulations in order to strengthen the supervisory and regulatory framework of the financial sector, to strengthen the corporate governance of the financial institutions and to prevent financial crimes: • Regulation on Corporate Governance
for Banks, Insurance Companies and Finance Companies.
• Regulation on the First Amendment to the Regulation on Remittance Business.
• Regulation on the Third Amendment to the Regulation on Fees and Charges Payable by Financial Institutions.
• Regulation on Management of Confiscated Funds and Properties Related to Money Laundering and Financing of Terrorism.
• Regulation on the Second Amendment to the Regulation on Cross Border Cash Declaration Amount.
• Adopting the following resolutions in order to mitigate the impact of the COVID-19 pandemic on the financial system and exchange rate stability.
• Resolution to reduce the minimum reserve requirement up to 5% to provide liquidity support to banks, as and when needed.
• Resolution to make available a short-term credit facility to financial institutions, as and when required.
• Resolution to give loan loss provision
Governance
Maldives Monetary AuthorityAnnual Report 2020102
leeway under the Regulation on Asset Classification, Provisioning and Suspension of Interest.
• Resolution to transfer the leasing licence granted to Maldives Finance Leasing Company Private Limited to a financing business licence.
Audit CommitteeThe Audit Committee is a subcommittee
of the Board of Directors of the MMA and consists of three non-executive directors. The main responsibilities of the committee include assisting the Board of Directors in fulfilling its oversight responsibilities for the financial reporting process, the system of internal controls, the audit process and the process for monitoring compliance with laws and regulations.
Executive and Management Committee
According to Law no. 6/81 (Maldives Monetary Authority 1981), the Governor is the executive head of MMA responsible for implementing the policies and decisions undertaken by the Board of Directors and carrying out the day-to-day management and operations of the MMA. Mr. Ali Hashim is the Governor of the MMA since his appointment on 8 September 2019.
Although the Governor remains accountable and responsible for the day-to-day management and operations of the MMA, areas and divisions are created for the implementation of operations. In this regard, the executive committee acts as the highest-level body to carry out the functions of the MMA.
The Executive Committee assists in implementing policies formulated by the Board to achieve key objectives of the MMA and assists the Governor in day-to-day running of the MMA. The Executive Committee consists of the Governor, Deputy Governor and the respective area heads.
Internal AuditThe objective of the MMA’s Internal
Audit is to provide independent and objective assurance and consulting, designed to add value and improve the operations of the MMA. The Internal Audit assists the MMA in accomplishing its objectives by bringing a systematic and disciplined approach to evaluate and improve the effectiveness of the MMA’s risk management, controls, and governance processes.
During the year 2020, the Internal Audit team conducted audits that included audits of reserve management process, AML policy compliance, ERP access controls, SWIFT access controls, exchange rate application and cash counts including the annual cash count audit. Additionally, monitoring logs of the SWIFT system were reviewed by the Internal Audit.
Maldives Monetary AuthorityAnnual Report 2020 103
Shari’ah CouncilThe Shari’ah Council consists of five
members, including the Deputy Governor of the MMA and four Islamic scholars from the private sector. The objective of the MMA’s Shari’ah Council is to ensure that the services accorded by financial institutions, which are permitted to offer Islamic banking and Islamic financing services in the Maldives, are compatible with the Shari’ah principles. The Council also provides technical advice to the MMA to strengthen the regulatory and supervisory function of providing Islamic finance.
Risk ManagementThe MMA uses a coordinated approach
to internal risk management by committing to a business strategy that supports and integrates identification, assessment, measurement, management and reporting of risk. The risk information is used to enhance decision-making and developing appropriate business strategies.
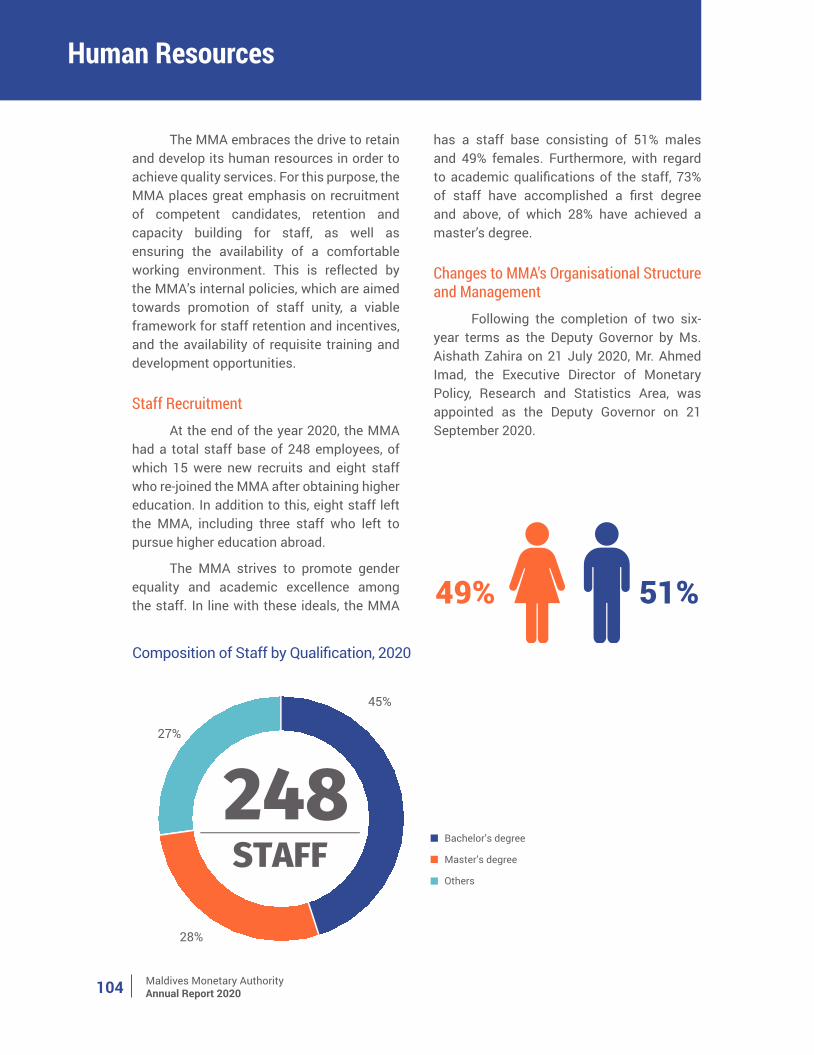
Maldives Monetary AuthorityAnnual Report 2020104
The MMA embraces the drive to retain and develop its human resources in order to achieve quality services. For this purpose, the MMA places great emphasis on recruitment of competent candidates, retention and capacity building for staff, as well as ensuring the availability of a comfortable working environment. This is reflected by the MMA’s internal policies, which are aimed towards promotion of staff unity, a viable framework for staff retention and incentives, and the availability of requisite training and development opportunities.
Staff RecruitmentAt the end of the year 2020, the MMA
had a total staff base of 248 employees, of which 15 were new recruits and eight staff who re-joined the MMA after obtaining higher education. In addition to this, eight staff left the MMA, including three staff who left to pursue higher education abroad.
The MMA strives to promote gender equality and academic excellence among the staff. In line with these ideals, the MMA
has a staff base consisting of 51% males and 49% females. Furthermore, with regard to academic qualifications of the staff, 73% of staff have accomplished a first degree and above, of which 28% have achieved a master’s degree.
Changes to MMA’s Organisational Structure and Management
Following the completion of two six-year terms as the Deputy Governor by Ms. Aishath Zahira on 21 July 2020, Mr. Ahmed Imad, the Executive Director of Monetary Policy, Research and Statistics Area, was appointed as the Deputy Governor on 21 September 2020.
Human Resources
Composition of Staff by Qualification, 2020
248STAFF
45%
Bachelor’s degree
Master’s degree
Others
28%
27%
49% 51%
Composition of Staff by Qualification, 2020
248STAFF
45%
Bachelor’s degree
Master’s degree
Others
28%
27%
49% 51%
Maldives Monetary AuthorityAnnual Report 2020 105
Staff Loan SchemeIn order to retain competent and
dedicated staff of the MMA, the staff loan scheme, introduced in 2017 under the Regulation on Issuing Loans to Employees of the Maldives Monetary Authority, was carried out during 2020 as well. Accordingly, two staff were awarded loans to purchase residential flats and while eight staff were provided with short term loans for various important purposes.
Staff Training and DevelopmentThe COVID-19 pandemic in 2020
brought an unprecedented amount of disruption to the usual work processes. Despite the many challenges faced, the MMA provided valuable trainings and meeting opportunities to staff in the form of online trainings and meetings, as physical attendance became impossible due to the COVID-19 situation. In this regard, a total of 57 staff participated in 27 international trainings and workshops, while 31 staff enjoyed participation in 27 meetings and forums. In addition, seven staff participated in four local trainings hosted by various local institutions.
Compared to the challenges faced globally due to the COVID-19 pandemic, the MMA was able to meet a large variety of training needs of the staff base. The results of such trainings led to increased development and productivity in the key areas.
MMA Scholarship ProgramAlthough the COVID-19 global
pandemic had a significant negative impact in both the countries where the MMA’s scholarship awardees were pursuing their education in, full support and assistance was provided to the awardees, who continued to pursue their education in both virtual and in-
person format. As such, the HRD scholarship programs were continued in an efficient manner despite the pandemic situation.
In 2020, there were no announcements for the ‘MMA Scholarship’, as travel and visa processes in many countries remain severely restricted due to the COVID-19 pandemic.
MMA Training InstituteIn 2020, various training programmes
were conducted by the MMA Training Institute (MMA TI) to address the needs of financial institutions and develop the knowledge and skills of its staff. A total of 345 participants attended these training programmes, mostly officials from the MMA, commercial banks and other financial institutions. The programmes conducted at the Institute include, Financing Small and Medium Scale Enterprises; Risk Management for Financial Institutions; Trade Based Money Laundering and Frauds in International Business; Introduction to Reinsurance; and Implication of IFRS-9 for Banks. In addition to this, the Institute also conducted Macroeconomic Awareness Workshops for secondary school students.
Furthermore, the MMA TI continued to offer professional qualifications for the employees of the MMA and financial institutions in the Maldives. In collaboration with the Asian Institute of Chartered Bankers, Malaysia, the studies continued for the second batch of students for the Professional Banker level of Chartered Banker qualification, which commenced in 2019.
MMA Internship ProgramAmong the university students who
requested for internship opportunities, the MMA provided five university students with the opportunity to complete internships at the MMA.
Maldives Monetary AuthorityAnnual Report 2020106
The MMA continued to place great importance on improving the quality of its operations through modern technological advances and ensuring that the operational improvements adhere to the procedures and standards followed by the information technology (IT) industry. In 2020, the main focus in the area of the Technology Services Department (TSD) of MMA was to instil software development skills and concepts in the various departments of the MMA. In order to reduce the gap between business needs and IT requirements and to produce domain experts that have a clear understanding of IT and programming concepts, the MMA launched an ‘Innovation Hub’ towards the end of the year. The ‘Innovation Hub’ brings together domain experts and developers in the MMA to create innovative solutions using data sets of different domains. Python programming and data analytics was taught to the participants of the Hub.
The COVID-19 pandemic proved to be a formidable challenge for IT operations. While several projects were halted due to
the lockdown, the focus of the MMA was to ensure that the essential services provided by the MMA can be provided without any disruptions during the lockdown period. In this regard, work-from-home was facilitated through the provision of secure VPN access to staff allocated by the management.
The MMA places utmost importance on ensuring a safe and pleasant working environment for its staff. In this regard, the work to upgrade the CCTV system was initiated during the year, to strengthen the security and safety of the MMA premises. In addition to this, a disaster recovery site was completed under Business Continuity Plan. Moreover, work on developing a waiting area for visitors in the first floor, and installation of turnstile gates at the entrance lobby commenced during the year, although progress of these projects was hampered by the COVID-19-related restrictions.
Operational Infrastructure
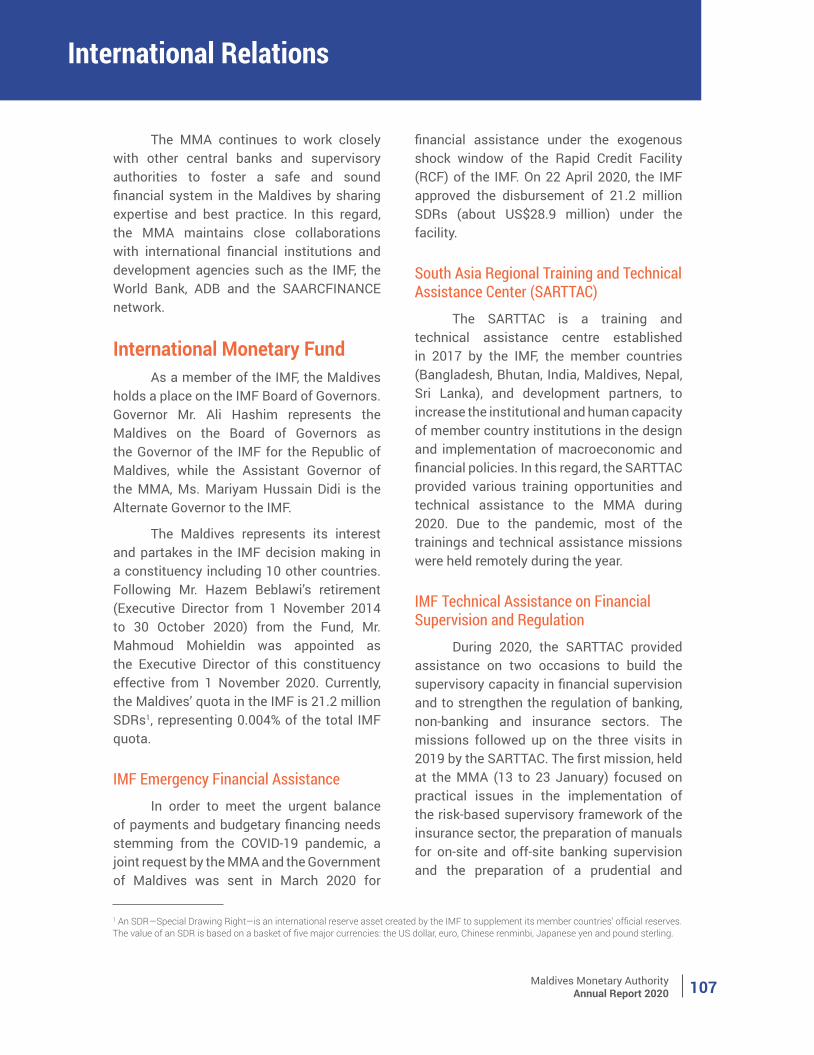
Maldives Monetary AuthorityAnnual Report 2020 107
International Relations
The MMA continues to work closely with other central banks and supervisory authorities to foster a safe and sound financial system in the Maldives by sharing expertise and best practice. In this regard, the MMA maintains close collaborations with international financial institutions and development agencies such as the IMF, the World Bank, ADB and the SAARCFINANCE network.
International Monetary Fund As a member of the IMF, the Maldives
holds a place on the IMF Board of Governors. Governor Mr. Ali Hashim represents the Maldives on the Board of Governors as the Governor of the IMF for the Republic of Maldives, while the Assistant Governor of the MMA, Ms. Mariyam Hussain Didi is the Alternate Governor to the IMF.
The Maldives represents its interest and partakes in the IMF decision making in a constituency including 10 other countries. Following Mr. Hazem Beblawi’s retirement (Executive Director from 1 November 2014 to 30 October 2020) from the Fund, Mr. Mahmoud Mohieldin was appointed as the Executive Director of this constituency effective from 1 November 2020. Currently, the Maldives’ quota in the IMF is 21.2 million SDRs1, representing 0.004% of the total IMF quota.
IMF Emergency Financial AssistanceIn order to meet the urgent balance
of payments and budgetary financing needs stemming from the COVID-19 pandemic, a joint request by the MMA and the Government of Maldives was sent in March 2020 for
financial assistance under the exogenous shock window of the Rapid Credit Facility (RCF) of the IMF. On 22 April 2020, the IMF approved the disbursement of 21.2 million SDRs (about US$28.9 million) under the facility.
South Asia Regional Training and Technical Assistance Center (SARTTAC)
The SARTTAC is a training and technical assistance centre established in 2017 by the IMF, the member countries (Bangladesh, Bhutan, India, Maldives, Nepal, Sri Lanka), and development partners, to increase the institutional and human capacity of member country institutions in the design and implementation of macroeconomic and financial policies. In this regard, the SARTTAC provided various training opportunities and technical assistance to the MMA during 2020. Due to the pandemic, most of the trainings and technical assistance missions were held remotely during the year.
IMF Technical Assistance on Financial Supervision and Regulation
During 2020, the SARTTAC provided assistance on two occasions to build the supervisory capacity in financial supervision and to strengthen the regulation of banking, non-banking and insurance sectors. The missions followed up on the three visits in 2019 by the SARTTAC. The first mission, held at the MMA (13 to 23 January) focused on practical issues in the implementation of the risk-based supervisory framework of the insurance sector, the preparation of manuals for on-site and off-site banking supervision and the preparation of a prudential and
1 An SDR—Special Drawing Right—is an international reserve asset created by the IMF to supplement its member countries’ official reserves. The value of an SDR is based on a basket of five major currencies: the US dollar, euro, Chinese renminbi, Japanese yen and pound sterling.
Maldives Monetary AuthorityAnnual Report 2020108
regulatory framework for the non-banking financial sector. This visit was followed by a remote mission (11 to 24 June) which delivered training on insurance, followed by assistance in the preparation of an initial draft of a regulation on liquidity risk management of the financial institutions, and the finalisation of the corporate governance regulation.
IMF Technical Assistance on Liquidity Monitoring and Forecasting
As a follow-up to technical assistance missions on the monetary policy operations in 2019, a SARTTAC mission (19 to 23 January) provided assistance to improve liquidity monitoring and supported the revamp of liquidity forecasting tools of the MMA. The mission also reviewed the daily liquidity table and provided training on the calibration of the seven-day OMO of the MMA.
IMF Technical Assistance on Seasonal Adjustment of Quarterly Business Survey (QBS)
As part of the ongoing efforts to improve the data series of the MMA, the SARTTAC organised a remote workshop (30 August to 3 September), upon request by the MMA, to assist in the seasonal adjustment of the QBS. This followed a technical assistance mission (6 to 10 September) on the detailed action plan for the publication of seasonally adjusted data series of the QBS in the upcoming year.
SAARCFINANCE NETWORK The MMA is a member of the
SAARCFINANCE Network, which is a regional network of the South Asian Association for Regional Cooperation (SAARC), consisting
of central bank governors and finance secretaries from the region. The main objectives of the SAARCFINANCE Network are to promote cooperation among central banks and finance ministries in the SAARC member countries, and to learn from shared experiences among member countries on macroeconomic policy challenges facing the region.
SAARCFINANCE Group Meeting The MMA participated in the 40th
SAARCFINANCE Group Meeting, held virtually on 4 November 2020 and chaired by the Governor of the RBI, Mr. Shaktikanta Das. The Governor of the MMA, Mr. Ali Hashim; Deputy Governor, Mr. Ahmed Imad; Assistant Governor, Ms. Idham Hussain and Executive Director, Ms. Mariyam Rashfa attended the meeting. The meeting also included the inauguration of the SAARCFINANCE Sync portal and the announcement of two new initiatives, the Financial Inclusion Platform and the Directory of Retired Resource Persons of the SAARC central banks.
Framework on Currency Swap Arrangement for SAARC Countries
The bilateral agreement signed between the MMA and the RBI in July 2019, under the ‘Framework on Currency Swap Arrangement for SAARC Countries’, and its ‘Standby Swap Arrangement’, which allowed the MMA withdrawal from the facility up to US$400 million, was extended for an additional one year in July 2020, in response to the severe impact of COVID-19 on foreign exchange reserves.
Maldives Monetary AuthorityAnnual Report 2020 109
Other Institutions The MMA is a member of the
SAARC Payment Council, the International Association of Insurance Supervisors, the Islamic Financial Services Board, the Asian Clearing Union, the Asia Pacific Group on Money Laundering, and the Alliance for Financial Inclusion. The MMA continues to receive assistance on financial sector development from these institutions.
The MMA is a member of the SAARC Payment Council, the International Association of Insurance Supervisors, the Islamic Financial Services Board, the Asian Clearing Union and the Asia Pacific Group on Money Laundering. The MMA continues to receive assistance on financial sector development from these institutions.
Participation in International Meetings and Forums
Senior officials of the MMA participated and held discussions at various meetings and forums in 2020, as follows:
• Spring Meetings of the IMF/World Bank Group (WBG): Deputy Governor, Ms. Aishath Zahira virtually participated in 2020 Spring Meetings of the IMF and the WBG, held from 14 to 17 April 2020.
• IMF-SARTTAC Steering Committee Meeting: Assistant Governor of Area 1, Ms. Idham Hussain virtually participated in the 4th SARTTAC Steering Committee Meeting, held on 3 June 2020.
• 15th Asian Forum of Insurance Regulators Annual Meeting and Conference: Executive Director, Mr. Hassan Fiyaz; and Deputy Manager, Ms. Mariyam Jailam Mujthaba virtually participated in the forum, held on 14 July 2020.
• 32nd SAARCFINANCE Coordinators Meeting: Assistant Governor, Ms. Idham Hussain and Executive Director, Ms. Mariyam Rashfa virtually participated in the 32nd SAARCFINANCE Coordinators meeting, held on 29 September 2020.
• Annual Meetings of the IMF/WBG: Governor, Mr. Ali Hashim; Deputy Governor, Mr. Ahmed Imad; Assistant Governors, Ms. Mariyam Hussain Didi, Ms. Idham Hussain, and Ms. Mariyam Shifa; and Executive Director, Ms. Mariyam Rashfa virtually participated in the 2020 Annual meetings of the IMF and the WBG, held from 12 to 18 October 2020.
• G-24/AFI Policymakers’ Roundtable Discussion on Financial Inclusion: Assistant Governor, Ms. Mariyam Hussain Didi virtually participated G-24/AFI Policymakers Roundtable Discussion held on 19 October 2020.
• Third Asia-Pacific high-level meeting on Insurance Supervision: Executive Director, Mr. Hassan Fiyaz; and Deputy Manager, Ms. Mariyam Jailam Mujthaba virtually participated in the meeting held on 1 December 2020.
• Annual General Meeting of International Association of Insurance Supervisors: Executive Director, Mr. Hassan Fiyaz; and Deputy Manager, Ms. Mariyam Jailam Mujthaba virtually participated in the meeting held on 2 December 2020.
• SAARCFINANCE Webinar on Financial Inclusion: Deputy Governor, Mr. Ahmed Imad chaired the meeting which was held on 2 December 2020. Senior Manager, Ms. Asna Hamdi and Deputy Manager, Ms. Fathimath Sadiq presented the country paper during this meeting.


Maldives Monetary AuthorityAnnual Report 2020 111
ANNUAL FINANCIALSTATEMENTS
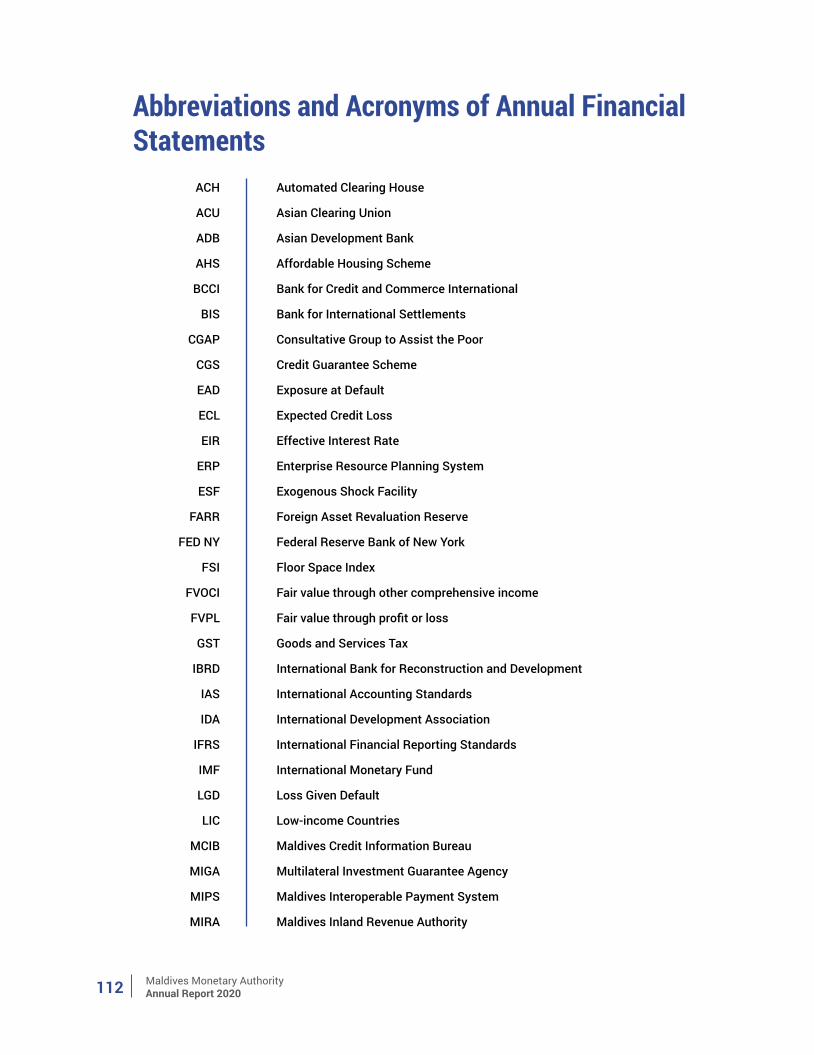
Maldives Monetary AuthorityAnnual Report 2020112
Abbreviations and Acronyms of Annual Financial Statements
ACH
ACU
ADB
AHS
BCCI
BIS
CGAP
CGS
EAD
ECL
EIR
ERP
ESF
FARR
FED NY
FSI
FVOCI
FVPL
GST
IBRD
IAS
IDA
IFRS
IMF
LGD
LIC
MCIB
MIGA
MIPS
MIRA
Automated Clearing House
Asian Clearing Union
Asian Development Bank
Affordable Housing Scheme
Bank for Credit and Commerce International
Bank for International Settlements
Consultative Group to Assist the Poor
Credit Guarantee Scheme
Exposure at Default
Expected Credit Loss
Effective Interest Rate
Enterprise Resource Planning System
Exogenous Shock Facility
Foreign Asset Revaluation Reserve
Federal Reserve Bank of New York
Floor Space Index
Fair value through other comprehensive income
Fair value through profit or loss
Goods and Services Tax
International Bank for Reconstruction and Development
International Accounting Standards
International Development Association
International Financial Reporting Standards
International Monetary Fund
Loss Given Default
Low-income Countries
Maldives Credit Information Bureau
Multilateral Investment Guarantee Agency
Maldives Interoperable Payment System
Maldives Inland Revenue Authority
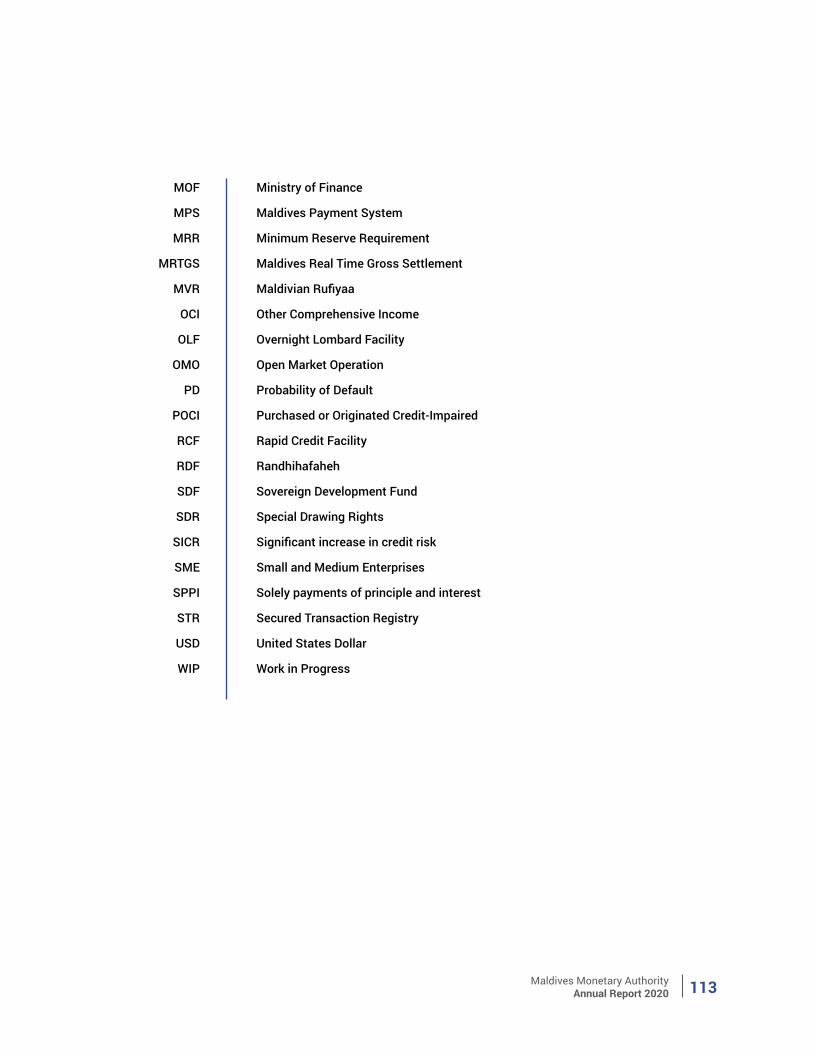
Maldives Monetary AuthorityAnnual Report 2020 113
MOF
MPS
MRR
MRTGS
MVR
OCI
OLF
OMO
PD
POCI
RCF
RDF
SDF
SDR
SICR
SME
SPPI
STR
USD
WIP
Ministry of Finance
Maldives Payment System
Minimum Reserve Requirement
Maldives Real Time Gross Settlement
Maldivian Rufiyaa
Other Comprehensive Income
Overnight Lombard Facility
Open Market Operation
Probability of Default
Purchased or Originated Credit-Impaired
Rapid Credit Facility
Randhihafaheh
Sovereign Development Fund
Special Drawing Rights
Significant increase in credit risk
Small and Medium Enterprises
Solely payments of principle and interest
Secured Transaction Registry
United States Dollar
Work in Progress
Maldives Monetary AuthorityAnnual Report 2020114
Maldives Monetary AuthorityAnnual Report 2020 115
Maldives Monetary AuthorityAnnual Report 2020116
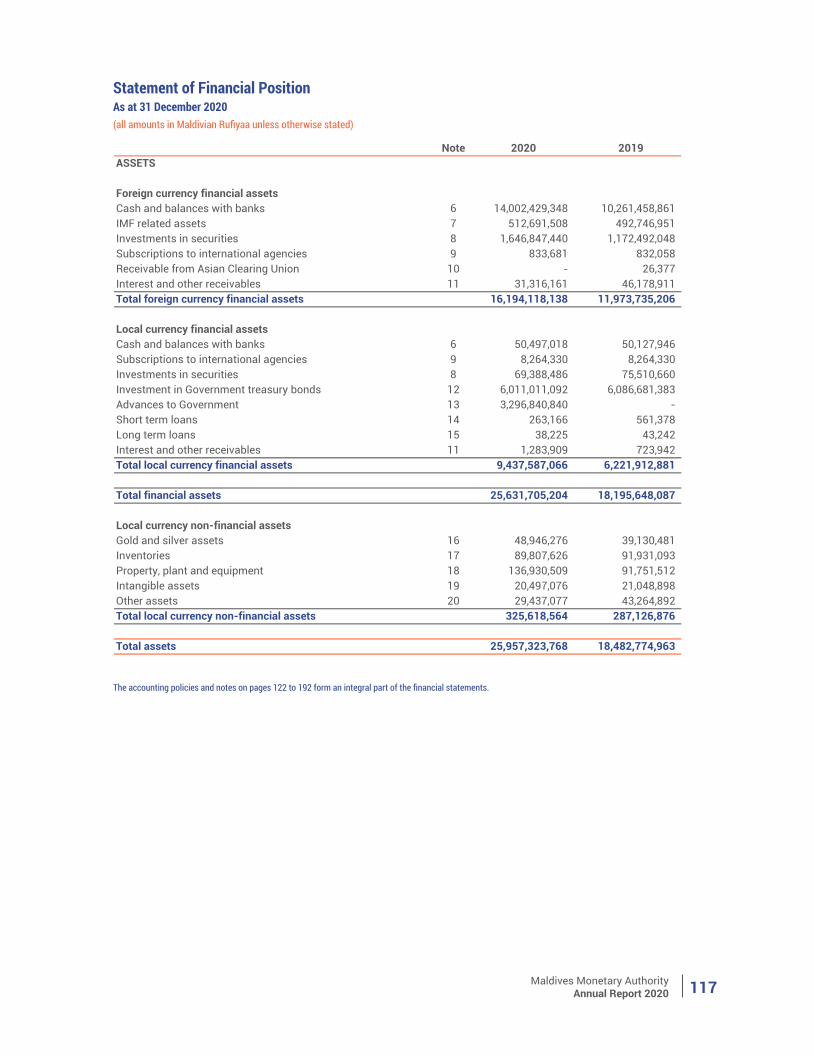
Maldives Monetary AuthorityAnnual Report 2020 117
Statement of Financial PositionAs at 31 December 2020(all amounts in Maldivian Rufiyaa unless otherwise stated)
Note 2020 2019ASSETS
Foreign currency financial assetsCash and balances with banks 6 14,002,429,348 10,261,458,861 IMF related assets 7 512,691,508 492,746,951 Investments in securities 8 1,646,847,440 1,172,492,048 Subscriptions to international agencies 9 833,681 832,058 Receivable from Asian Clearing Union 10 - 26,377 Interest and other receivables 11 31,316,161 46,178,911 Total foreign currency financial assets 16,194,118,138 11,973,735,206
Local currency financial assetsCash and balances with banks 6 50,497,018 50,127,946 Subscriptions to international agencies 9 8,264,330 8,264,330 Investments in securities 8 69,388,486 75,510,660 Investment in Government treasury bonds 12 6,011,011,092 6,086,681,383 Advances to Government 13 3,296,840,840 - Short term loans 14 263,166 561,378 Long term loans 15 38,225 43,242 Interest and other receivables 11 1,283,909 723,942 Total local currency financial assets 9,437,587,066 6,221,912,881
Total financial assets 25,631,705,204 18,195,648,087
Local currency non-financial assetsGold and silver assets 16 48,946,276 39,130,481 Inventories 17 89,807,626 91,931,093 Property, plant and equipment 18 136,930,509 91,751,512 Intangible assets 19 20,497,076 21,048,898 Other assets 20 29,437,077 43,264,892 Total local currency non-financial assets 325,618,564 287,126,876
Total assets 25,957,323,768 18,482,774,963
The accounting policies and notes on pages 122 to 192 form an integral part of the financial statements.
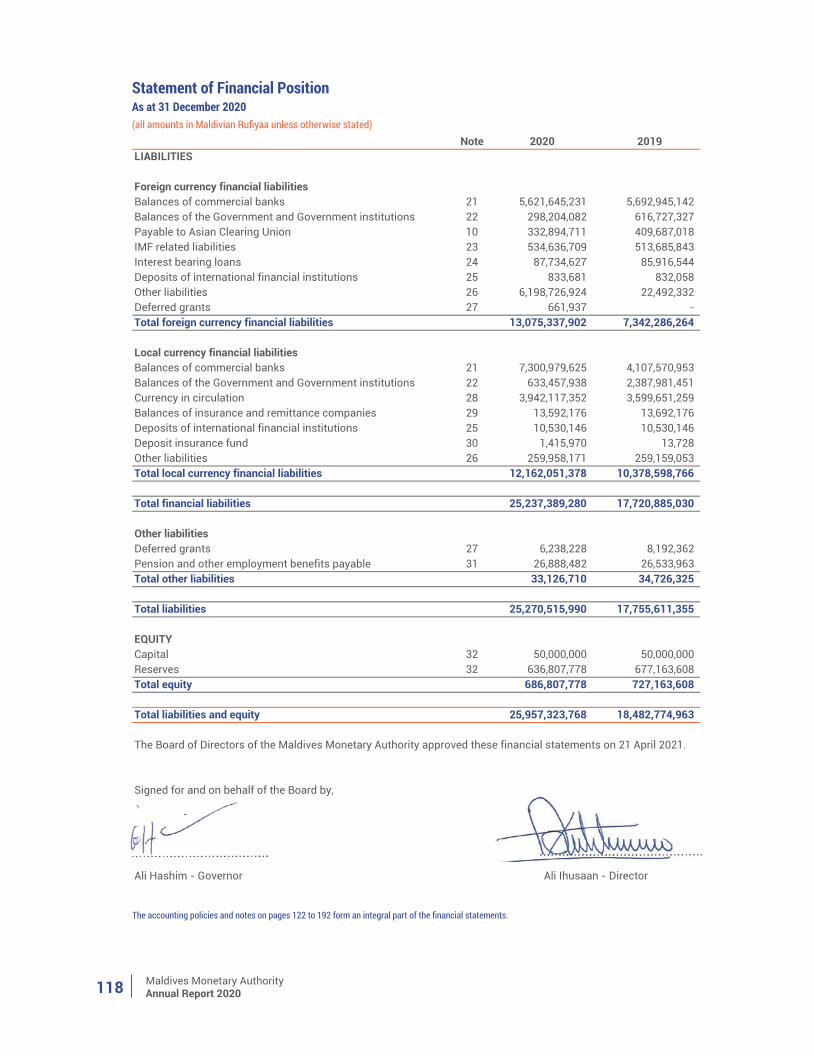
Maldives Monetary AuthorityAnnual Report 2020118
The accounting policies and notes on pages 122 to 192 form an integral part of the financial statements.
Note 2020 2019LIABILITIES
Foreign currency financial liabilitiesBalances of commercial banks 21 5,621,645,231 5,692,945,142 Balances of the Government and Government institutions 22 298,204,082 616,727,327 Payable to Asian Clearing Union 10 332,894,711 409,687,018 IMF related liabilities 23 534,636,709 513,685,843 Interest bearing loans 24 87,734,627 85,916,544 Deposits of international financial institutions 25 833,681 832,058 Other liabilities 26 6,198,726,924 22,492,332 Deferred grants 27 661,937 - Total foreign currency financial liabilities 13,075,337,902 7,342,286,264
Local currency financial liabilitiesBalances of commercial banks 21 7,300,979,625 4,107,570,953 Balances of the Government and Government institutions 22 633,457,938 2,387,981,451 Currency in circulation 28 3,942,117,352 3,599,651,259 Balances of insurance and remittance companies 29 13,592,176 13,692,176 Deposits of international financial institutions 25 10,530,146 10,530,146 Deposit insurance fund 30 1,415,970 13,728 Other liabilities 26 259,958,171 259,159,053 Total local currency financial liabilities 12,162,051,378 10,378,598,766
Total financial liabilities 25,237,389,280 17,720,885,030
Other liabilitiesDeferred grants 27 6,238,228 8,192,362 Pension and other employment benefits payable 31 26,888,482 26,533,963 Total other liabilities 33,126,710 34,726,325
Total liabilities 25,270,515,990 17,755,611,355
EQUITYCapital 32 50,000,000 50,000,000 Reserves 32 636,807,778 677,163,608 Total equity 686,807,778 727,163,608
Total liabilities and equity 25,957,323,768 18,482,774,963
Signed for and on behalf of the Board by,
Ali Hashim - Governor
The Board of Directors of the Maldives Monetary Authority approved these financial statements on 21 April 2021.
Ali Ihusaan - Director
Statement of Financial PositionAs at 31 December 2020(all amounts in Maldivian Rufiyaa unless otherwise stated)
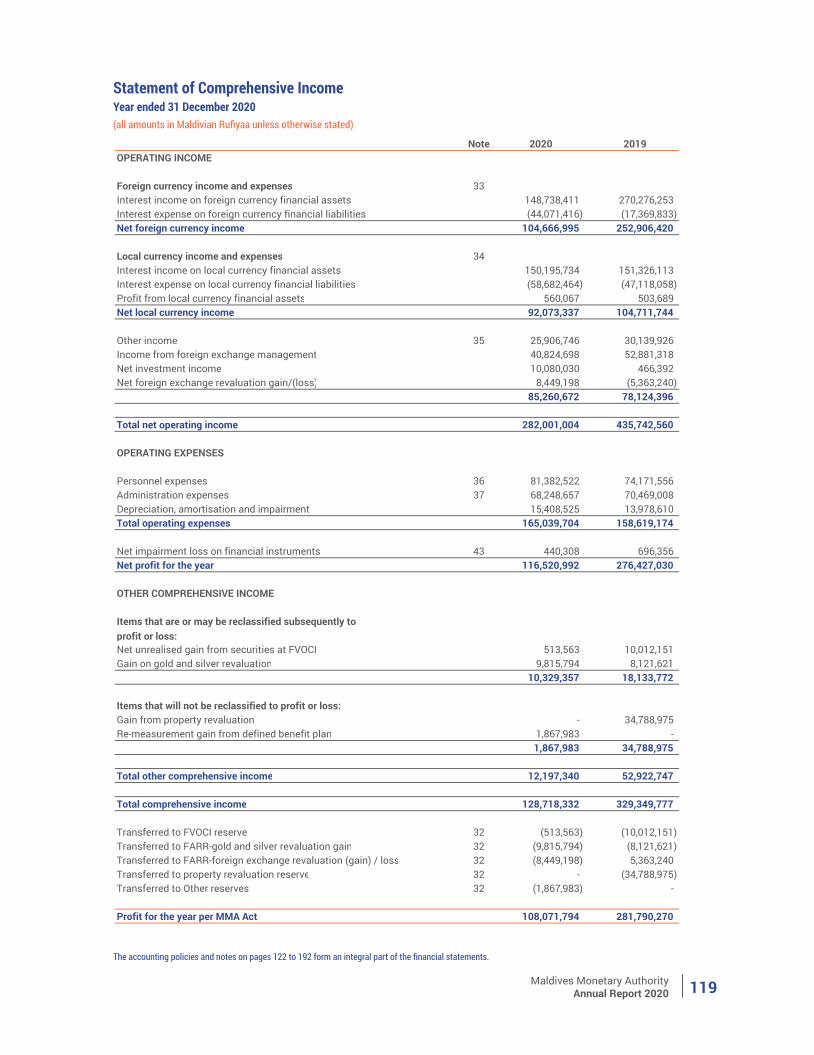
Maldives Monetary AuthorityAnnual Report 2020 119
The accounting policies and notes on pages 122 to 192 form an integral part of the financial statements.
Note 2020 2019OPERATING INCOME
Foreign currency income and expenses 33Interest income on foreign currency financial assets 148,738,411 270,276,253 Interest expense on foreign currency financial liabilities (44,071,416) (17,369,833) Net foreign currency income 104,666,995 252,906,420
Local currency income and expenses 34Interest income on local currency financial assets 150,195,734 151,326,113 Interest expense on local currency financial liabilities (58,682,464) (47,118,058) Profit from local currency financial assets 560,067 503,689 Net local currency income 92,073,337 104,711,744
Other income 35 25,906,746 30,139,926 Income from foreign exchange management 40,824,698 52,881,318 Net investment income 10,080,030 466,392 Net foreign exchange revaluation gain/(loss) 8,449,198 (5,363,240)
85,260,672 78,124,396
Total net operating income 282,001,004 435,742,560
OPERATING EXPENSES
Personnel expenses 36 81,382,522 74,171,556 Administration expenses 37 68,248,657 70,469,008 Depreciation, amortisation and impairment 15,408,525 13,978,610 Total operating expenses 165,039,704 158,619,174
Net impairment loss on financial instruments 43 440,308 696,356 Net profit for the year 116,520,992 276,427,030
OTHER COMPREHENSIVE INCOME
Items that are or may be reclassified subsequently to profit or loss:Net unrealised gain from securities at FVOCI 513,563 10,012,151 Gain on gold and silver revaluation 9,815,794 8,121,621
10,329,357 18,133,772
Items that will not be reclassified to profit or loss:Gain from property revaluation - 34,788,975 Re-measurement gain from defined benefit plan 1,867,983 -
1,867,983 34,788,975
Total other comprehensive income 12,197,340 52,922,747
Total comprehensive income 128,718,332 329,349,777
Transferred to FVOCI reserve 32 (513,563) (10,012,151) Transferred to FARR-gold and silver revaluation gain 32 (9,815,794) (8,121,621) Transferred to FARR-foreign exchange revaluation (gain) / loss 32 (8,449,198) 5,363,240 Transferred to property revaluation reserve 32 - (34,788,975) Transferred to Other reserves 32 (1,867,983) -
Profit for the year per MMA Act 108,071,794 281,790,270
Statement of Comprehensive IncomeYear ended 31 December 2020(all amounts in Maldivian Rufiyaa unless otherwise stated)
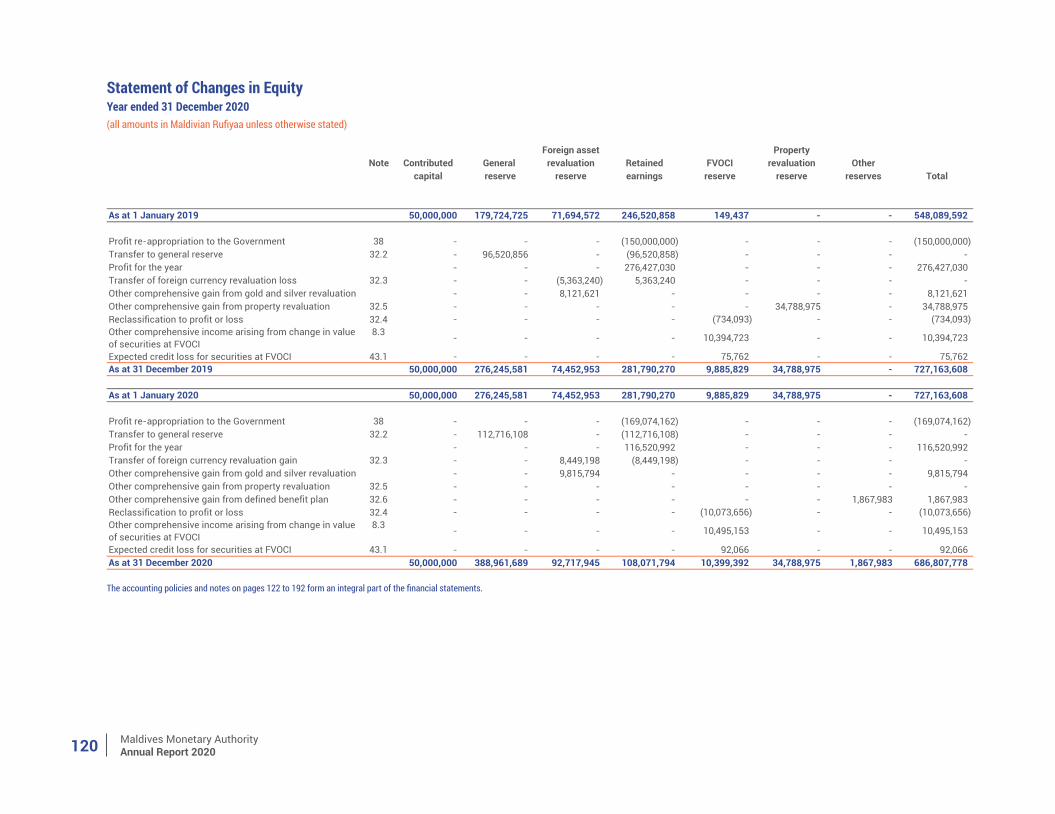
Maldives Monetary AuthorityAnnual Report 2020120
The accounting policies and notes on pages 122 to 192 form an integral part of the financial statements.
Foreign asset PropertyNote Contributed General revaluation Retained FVOCI revaluation Other
capital reserve reserve earnings reserve reserve reserves Total
As at 1 January 2019 50,000,000 179,724,725 71,694,572 246,520,858 149,437 - - 548,089,592
Profit re-appropriation to the Government 38 - - - (150,000,000) - - - (150,000,000) Transfer to general reserve 32.2 - 96,520,856 - (96,520,858) - - - - Profit for the year - - - 276,427,030 - - - 276,427,030 Transfer of foreign currency revaluation loss 32.3 - - (5,363,240) 5,363,240 - - - - Other comprehensive gain from gold and silver revaluation - - 8,121,621 - - - - 8,121,621 Other comprehensive gain from property revaluation 32.5 - - - - - 34,788,975 - 34,788,975 Reclassification to profit or loss 32.4 - - - - (734,093) - - (734,093) Other comprehensive income arising from change in value of securities at FVOCI
8.3 - - - - 10,394,723 - - 10,394,723
Expected credit loss for securities at FVOCI 43.1 - - - - 75,762 - - 75,762 As at 31 December 2019 50,000,000 276,245,581 74,452,953 281,790,270 9,885,829 34,788,975 - 727,163,608
As at 1 January 2020 50,000,000 276,245,581 74,452,953 281,790,270 9,885,829 34,788,975 - 727,163,608
Profit re-appropriation to the Government 38 - - - (169,074,162) - - - (169,074,162) Transfer to general reserve 32.2 - 112,716,108 - (112,716,108) - - - - Profit for the year - - - 116,520,992 - - - 116,520,992 Transfer of foreign currency revaluation gain 32.3 - - 8,449,198 (8,449,198) - - - - Other comprehensive gain from gold and silver revaluation - - 9,815,794 - - - - 9,815,794 Other comprehensive gain from property revaluation 32.5 - - - - - - - - Other comprehensive gain from defined benefit plan 32.6 - - - - - - 1,867,983 1,867,983 Reclassification to profit or loss 32.4 - - - - (10,073,656) - - (10,073,656) Other comprehensive income arising from change in value of securities at FVOCI
8.3 - - - - 10,495,153 - - 10,495,153
Expected credit loss for securities at FVOCI 43.1 - - - - 92,066 - - 92,066 As at 31 December 2020 50,000,000 388,961,689 92,717,945 108,071,794 10,399,392 34,788,975 1,867,983 686,807,778
Statement of Changes in EquityYear ended 31 December 2020(all amounts in Maldivian Rufiyaa unless otherwise stated)
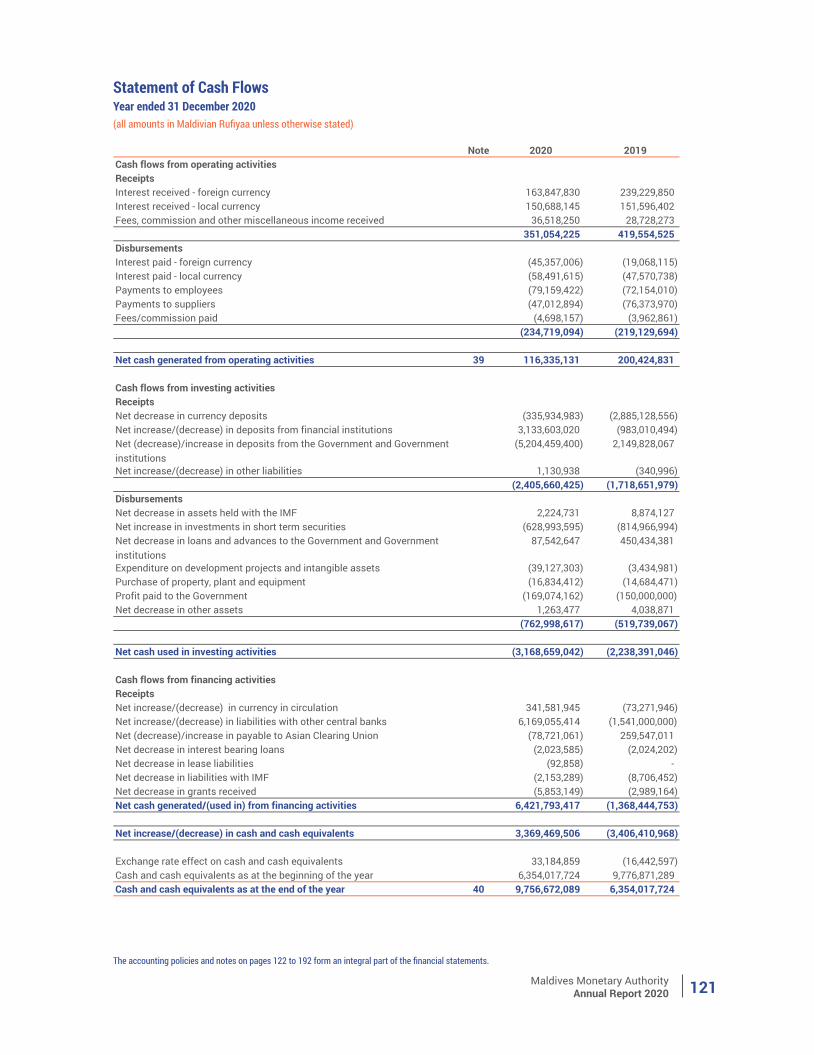
Maldives Monetary AuthorityAnnual Report 2020 121
The accounting policies and notes on pages 122 to 192 form an integral part of the financial statements.
Note 2020 2019Cash flows from operating activitiesReceiptsInterest received - foreign currency 163,847,830 239,229,850 Interest received - local currency 150,688,145 151,596,402 Fees, commission and other miscellaneous income received 36,518,250 28,728,273
351,054,225 419,554,525 DisbursementsInterest paid - foreign currency (45,357,006) (19,068,115) Interest paid - local currency (58,491,615) (47,570,738) Payments to employees (79,159,422) (72,154,010) Payments to suppliers (47,012,894) (76,373,970) Fees/commission paid (4,698,157) (3,962,861)
(234,719,094) (219,129,694)
Net cash generated from operating activities 39 116,335,131 200,424,831
Cash flows from investing activitiesReceiptsNet decrease in currency deposits (335,934,983) (2,885,128,556) Net increase/(decrease) in deposits from financial institutions 3,133,603,020 (983,010,494) Net (decrease)/increase in deposits from the Government and Government institutions
(5,204,459,400) 2,149,828,067
Net increase/(decrease) in other liabilities 1,130,938 (340,996) (2,405,660,425) (1,718,651,979)
DisbursementsNet decrease in assets held with the IMF 2,224,731 8,874,127 Net increase in investments in short term securities (628,993,595) (814,966,994) Net decrease in loans and advances to the Government and Government institutions
87,542,647 450,434,381
Expenditure on development projects and intangible assets (39,127,303) (3,434,981) Purchase of property, plant and equipment (16,834,412) (14,684,471) Profit paid to the Government (169,074,162) (150,000,000) Net decrease in other assets 1,263,477 4,038,871
(762,998,617) (519,739,067)
Net cash used in investing activities (3,168,659,042) (2,238,391,046)
Cash flows from financing activitiesReceiptsNet increase/(decrease) in currency in circulation 341,581,945 (73,271,946) Net increase/(decrease) in liabilities with other central banks 6,169,055,414 (1,541,000,000) Net (decrease)/increase in payable to Asian Clearing Union (78,721,061) 259,547,011 Net decrease in interest bearing loans (2,023,585) (2,024,202) Net decrease in lease liabilities (92,858) - Net decrease in liabilities with IMF (2,153,289) (8,706,452) Net decrease in grants received (5,853,149) (2,989,164) Net cash generated/(used in) from financing activities 6,421,793,417 (1,368,444,753)
Net increase/(decrease) in cash and cash equivalents 3,369,469,506 (3,406,410,968)
Exchange rate effect on cash and cash equivalents 33,184,859 (16,442,597) Cash and cash equivalents as at the beginning of the year 6,354,017,724 9,776,871,289 Cash and cash equivalents as at the end of the year 40 9,756,672,089 6,354,017,724
Statement of Cash FlowsYear ended 31 December 2020(all amounts in Maldivian Rufiyaa unless otherwise stated)
Maldives Monetary AuthorityAnnual Report 2020122 -9-
1. REPORTING ENTITY AND STATUTORY BASE
These are the financial statements of the Maldives Monetary Authority (the Authority); theinstitution established under the Maldives Monetary Authority Act (MMA Act) of 1981 of theRepublic of Maldives. The Authority is domiciled in the Republic of Maldives and is situated atMajeedhee Building, Male’, Republic of Maldives.
The Authority was established in 1981 and has the following primary objectives: -
(a) To maintain price stability conducive to the sustainable growth of the economy;(b) without prejudice to attainment of the objective (a), to maintain financial stability; and,(c) without prejudice to attainment of objectives (a) and (b), to support the Government in
achieving macroeconomic stability and economic growth.
These financial statements for the year ended 31 December 2020 were authorised for issue by the Board of Directors of the Authority in accordance with the Section 35 of MMA Act.
1.1. NATURE AND EXTENT OF ACTIVITIES
In carrying out its mandate as the central bank of the Maldives, the Authority, undertakes the following functions in accordance with Section 22 of MMA Act; -
i. determine and implement monetary policy of Maldives;ii. advise on the exchange rate regime;
iii. determine and implement the exchange rate and exchange rate policies, in order toimplement the exchange rate regime;
iv. maintain and manage External Reserves of Maldives;v. issue and manage the currency of Maldives;
vi. regulate and supervise the financial sector, other than Securities Businesses andSecurities related services regulated under the Law No. 2/2006 (Maldives Securities Act);
vii. organize, operate and participate in payment systems and securities settlement systems;viii. open accounts for, and accept deposits from, the Government, Government agencies,
Government affiliated institutions, Banks in Maldives and other Financial Institutions;ix. provide services as correspondent, banker, agent or depository for any monetary authority,
central bank or Financial Institution;x. open and operate accounts with such Banks or other depositories in or outside Maldives,
and appoint them as correspondents or agents of the Authority, as may be required;xi. purchase, sell or deal in gold coins, Bullion or foreign currency;
xii. purchase, sell, invest, or deal in Treasury Bills, other Securities and financial instrumentsissued or guaranteed by foreign governments or Financial Institutions;
xiii. purchase, sell, invest, or deal in Treasury Bills and other Securities issued or guaranteed bythe Government;
xiv. grant loans, advances and re-discounts to Banks and other Financial Institutions inMaldives for a period not exceeding 90 (ninety) days on such terms and conditions asprescribed by the Board; Upon the expiry of the aforementioned period of 90 (ninety) daysafter considering the circumstances, the term of such a loan, advance or Re-discount maybe extended by additional periods not exceeding 90 (ninety) days and such extensions mayonly be given a maximum of 3 (three) times;
xv. grant temporary advances to the Government upon agreed terms and conditions;xvi. grant advances to the Government on agreed upon terms and conditions, in respect of
subscriptions and other expenses relating to the membership of Maldives in any
Notes to the Financial StatementsYear ended 31 December 2020(all amounts in Maldivian Rufiyaa unless otherwise stated)
Maldives Monetary AuthorityAnnual Report 2020 123
-10-
international Financial Institution, the participation of Maldives in any account thereof, and any transactions and operations undertaken in connection therewith;
xvii. act as a banker to the Government, and as a financial advisor and fiscal agent to theGovernment and to any other public authority in Maldives;
xviii. borrow money and issue guarantees, inside or outside Maldives, on such terms andconditions as the Board may prescribe;
xix. organise and operate a Clearing House, in conjunction with the Banks;xx. collect, compile, analyse and publish statistics and information for the purpose of
achieving the objectives of the Authority;xxi. carry out development projects for the purposes of developing the financial sector of the
Maldives and increasing financial inclusion within the Maldives, and levy fees or chargesfor services provided under such projects;
xxii. acquire, purchase, sell, take hold and hold movable or immovable property such as landand buildings, and may assign, transfer, lease, dispose of and mortgage, any immovable ormovable property or any interest vested in such property;
xxiii. oversee payment, clearing, and securities settlement systems, and regulate and overseepayment instruments;
xxiv. manage funds for the Government and public authoritiesxxv. undertake issuance and management of Securities issued by the Government or a public
authority or a company in which majority shares are held by the Government;xxvi. issue Securities in its own name and purchase, sell, redeem, Discount and Re-discount
such Securities;xxvii. appoint and remove primary dealers of the Securities issued in the name of the Authority;
xxviii. purchase, sell or invest in Securities and financial instruments specified by the Board;xxix. carry out any duties assigned to the Authority by any other statute; andxxx. carry out any activities necessary to achieve the objectives of the Authority or to perform
the functions of the Authority.
The activities carried out in order to achieve its objective of price and financial system stability of the country can be broadly segregated into foreign currency and local currency activities. Results of these activities are classed as operating activities in the context of the statement of comprehensive income.
(a) Foreign currency activities
Foreign currency activities result mainly from the Authority’s holdings of foreign currency assets under its foreign reserves management function. The foreign reserves portfolio comprises foreign currency assets held for investment and settlement purposes. The majority of foreign currency assets are denominated in United States Dollars, Euros, Pound Sterling and Australian Dollars. Investment of the country’s foreign reserves is in investment grade instruments with counter parties with low credit risk and terms to maturity generally less than three years. Investments are held to maturity, other than certain investments that are held to collect contractual cash flow and for sale.
(b) Local currency activities
Local currency activities largely involve the Authority offsetting the daily net flows to or from Government or market by advancing funds to or withdrawing funds from the banking system. Financial operations undertaken in the market with the objective of achieving policy objectives are undertaken at prevailing interest rates with terms to maturity less than thirty days and are fully collateralized with high quality government assets. In cooperation with the government, the
Notes to the Financial StatementsYear ended 31 December 2020(all amounts in Maldivian Rufiyaa unless otherwise stated)
-10-
international Financial Institution, the participation of Maldives in any account thereof, and any transactions and operations undertaken in connection therewith;
xvii. act as a banker to the Government, and as a financial advisor and fiscal agent to theGovernment and to any other public authority in Maldives;
xviii. borrow money and issue guarantees, inside or outside Maldives, on such terms andconditions as the Board may prescribe;
xix. organise and operate a Clearing House, in conjunction with the Banks;xx. collect, compile, analyse and publish statistics and information for the purpose of
achieving the objectives of the Authority;xxi. carry out development projects for the purposes of developing the financial sector of the
Maldives and increasing financial inclusion within the Maldives, and levy fees or chargesfor services provided under such projects;
xxii. acquire, purchase, sell, take hold and hold movable or immovable property such as landand buildings, and may assign, transfer, lease, dispose of and mortgage, any immovable ormovable property or any interest vested in such property;
xxiii. oversee payment, clearing, and securities settlement systems, and regulate and overseepayment instruments;
xxiv. manage funds for the Government and public authoritiesxxv. undertake issuance and management of Securities issued by the Government or a public
authority or a company in which majority shares are held by the Government;xxvi. issue Securities in its own name and purchase, sell, redeem, Discount and Re-discount
such Securities;xxvii. appoint and remove primary dealers of the Securities issued in the name of the Authority;
xxviii. purchase, sell or invest in Securities and financial instruments specified by the Board;xxix. carry out any duties assigned to the Authority by any other statute; andxxx. carry out any activities necessary to achieve the objectives of the Authority or to perform
the functions of the Authority.
The activities carried out in order to achieve its objective of price and financial system stability of the country can be broadly segregated into foreign currency and local currency activities. Results of these activities are classed as operating activities in the context of the statement of comprehensive income.
(a) Foreign currency activities
Foreign currency activities result mainly from the Authority’s holdings of foreign currency assets under its foreign reserves management function. The foreign reserves portfolio comprises foreign currency assets held for investment and settlement purposes. The majority of foreign currency assets are denominated in United States Dollars, Euros, Pound Sterling and Australian Dollars. Investment of the country’s foreign reserves is in investment grade instruments with counter parties with low credit risk and terms to maturity generally less than three years. Investments are held to maturity, other than certain investments that are held to collect contractual cash flow and for sale.
(b) Local currency activities
Local currency activities largely involve the Authority offsetting the daily net flows to or from Government or market by advancing funds to or withdrawing funds from the banking system. Financial operations undertaken in the market with the objective of achieving policy objectives are undertaken at prevailing interest rates with terms to maturity less than thirty days and are fully collateralized with high quality government assets. In cooperation with the government, the
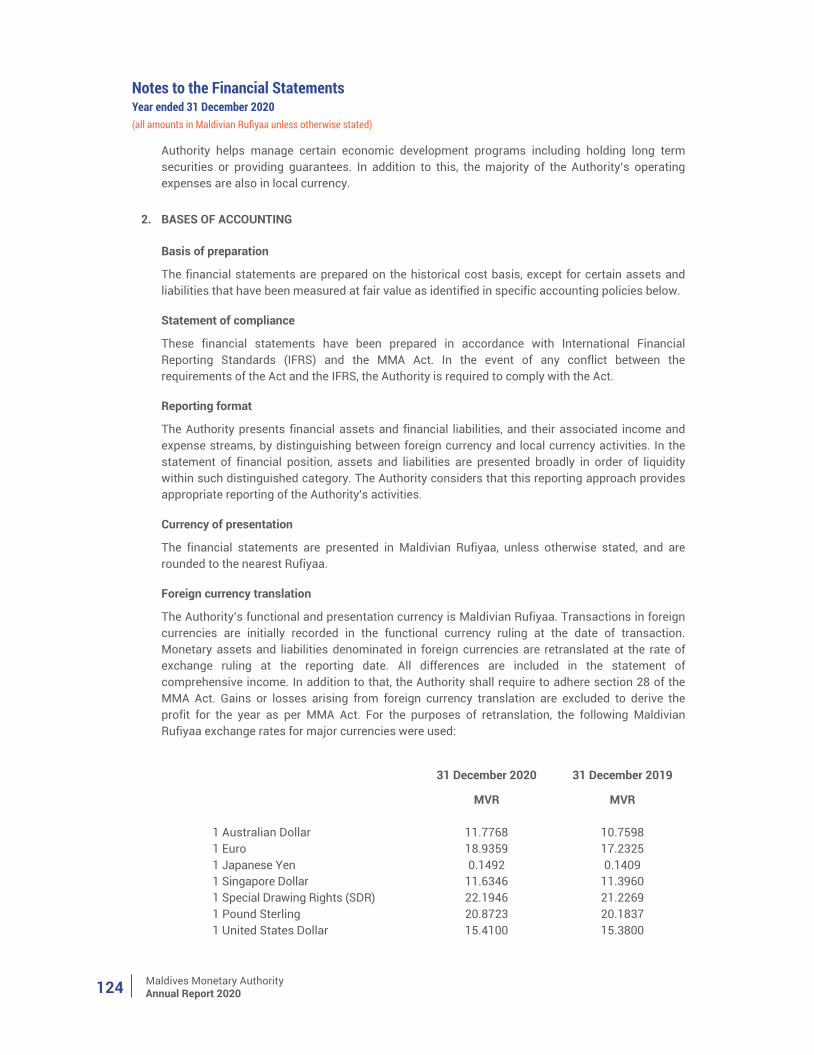
Maldives Monetary AuthorityAnnual Report 2020124 -11-
Authority helps manage certain economic development programs including holding long term securities or providing guarantees. In addition to this, the majority of the Authority’s operating expenses are also in local currency.
2. BASES OF ACCOUNTING
Basis of preparation
The financial statements are prepared on the historical cost basis, except for certain assets andliabilities that have been measured at fair value as identified in specific accounting policies below.
Statement of compliance
These financial statements have been prepared in accordance with International FinancialReporting Standards (IFRS) and the MMA Act. In the event of any conflict between therequirements of the Act and the IFRS, the Authority is required to comply with the Act.
Reporting format
The Authority presents financial assets and financial liabilities, and their associated income andexpense streams, by distinguishing between foreign currency and local currency activities. In thestatement of financial position, assets and liabilities are presented broadly in order of liquiditywithin such distinguished category. The Authority considers that this reporting approach providesappropriate reporting of the Authority's activities.
Currency of presentation
The financial statements are presented in Maldivian Rufiyaa, unless otherwise stated, and arerounded to the nearest Rufiyaa.
Foreign currency translation
The Authority’s functional and presentation currency is Maldivian Rufiyaa. Transactions in foreigncurrencies are initially recorded in the functional currency ruling at the date of transaction.Monetary assets and liabilities denominated in foreign currencies are retranslated at the rate ofexchange ruling at the reporting date. All differences are included in the statement ofcomprehensive income. In addition to that, the Authority shall require to adhere section 28 of theMMA Act. Gains or losses arising from foreign currency translation are excluded to derive theprofit for the year as per MMA Act. For the purposes of retranslation, the following MaldivianRufiyaa exchange rates for major currencies were used:
31 December 2020 31 December 2019
MVR MVR
1 Australian Dollar 11.7768 10.7598 1 Euro 18.9359 17.2325 1 Japanese Yen 0.1492 0.1409 1 Singapore Dollar 11.6346 11.3960 1 Special Drawing Rights (SDR) 22.1946 21.2269 1 Pound Sterling 20.8723 20.1837 1 United States Dollar 15.4100 15.3800
Notes to the Financial StatementsYear ended 31 December 2020(all amounts in Maldivian Rufiyaa unless otherwise stated)
Maldives Monetary AuthorityAnnual Report 2020 125-12-
Non-monetary items that are measured in terms of historical cost in a foreign currency are translated using exchange rates at the dates of initial transactions. Non-monetary items measured at fair value in a foreign currency are translated using the exchange rates at the date when the fair value was determined. The exchange rate of Maldivian Rufiyaa against USD is permitted to fluctuate within a ±20% band of MVR 12.85 per USD. This band took effect from 11 April 2011 and was made in accordance with the Chapter 3, Section 13 of MMA Act prior to the fourth amendment.
3. SIGNIFICANT ACCOUNTING JUDGEMENTS AND ESTIMATES
The application of the Authority’s accounting policies requires management to exercisejudgements. This may involve a higher degree of judgement or complexity, and major sources ofestimation of uncertainty that have a significant risk of resulting in a material adjustment withinthe next financial year are set out in the following paragraphs. Detailed information about each ofthese estimates and judgements is included in the related notes together with information aboutthe basis of calculation for each affected line item in the financial statements.
Classification and measurement of financial assets and financial liabilities and impairment
(i) Classification of assets
The Authority has classified all the foreign currency financial assets at amortised cost, except for those managed externally and fixed income securities which are classified as FVOCI. The Authority has also assessed its holdings of local currency financial assets at amortised cost.
(ii) Measurement of the expected credit loss allowance
The measurement of the expected credit loss (ECL) allowance for financial assets measured at amortised cost and FVOCI is an area that requires the use of complex models and significant assumptions about future economic conditions and credit behaviour (e.g. the likelihood of banks and security issuers defaulting and the resulting losses). Explanation of the inputs, assumptions and estimation techniques used in measuring ECL is further detailed in note 43.1.2.3.
A number of significant judgements are also required in applying the accounting requirements for measuring ECL, such as:
• Determining criteria for significant increase in credit risk;• Choosing appropriate models and assumptions for the measurement of ECL;• Establishing the number and relative weightings of forward-looking scenarios for each
type of instrument and the associated ECL;• Establishing groups of similar financial assets for the purposes of measuring ECL.• Detailed information about the judgements and estimates made by the Authority in the
above areas is set out in note 43.1.2.3.
Fair value of financial instruments
Where the fair values of financial assets and financial liabilities cannot be derived from active markets, they are determined using a variety of valuation techniques that include the use of mathematical models. The inputs to these models are derived from observable market data where possible, but if this is not available, judgment is required to establish fair values. The judgments include considerations of liquidity and inputs such as discount rates.
Notes to the Financial StatementsYear ended 31 December 2020(all amounts in Maldivian Rufiyaa unless otherwise stated)
Maldives Monetary AuthorityAnnual Report 2020126
-13-
Pensions, gratuity and other post-employment benefit plans
The cost of defined benefit plans is determined using an internal valuation. This valuation involves making assumptions about discount rates, rate of compensation and future pension/gratuity increases/decreases. Due to the long-term nature of these plans, such estimates are subject to significant uncertainty. Assumptions used are disclosed separately in the notes to the financial statements (see note 31).
Revaluation of freehold land
The Authority engaged independent professional valuers to determine the fair value of its freehold land. It is determined using valuation techniques that include the use of mathematical models as there is no active market to derive the prices of similar assets. The inputs to these models are derived from observable market data where possible, but if this is not available, judgment is required to establish fair values (see note 18.3).
4. SIGNIFICANT ACCOUNTING POLICIES
The accounting policies applied is consistent with those used in the previous financial year.
4.1 Financial assets and liabilities
Measurement methods
Amortised cost and effective interest rate
The amortised cost is the amount at which the financial asset or financial liability is measured at initial recognition minus the principal repayments, plus or minus the cumulative amortisation using the effective interest method of any difference between that initial amount and the maturity amount and, for financial assets, adjusted for any loss allowance.
The effective interest rate is the rate that exactly discounts estimated future cash payments or receipts through the expected life of the financial asset or financial liability to the gross carrying amount of a financial asset (i.e. its amortised cost before any impairment allowance) or to the amortised cost of a financial liability. The calculation does not consider expected credit losses and includes transaction costs, premiums or discounts and fees and points paid or received that are integral to the effective interest rate, such as origination fees.
When the Authority revises the estimates of future cash flows, the carrying amount of the respective financial assets or financial liability is adjusted to reflect the new estimate discounted using the original effective interest rate. Any changes are recognised in profit or loss.
Interest income
Interest income is calculated by applying the effective interest rate to the gross carrying amount of financial assets, except for:
Financial assets that are not Purchased or Originated Credit-Impaired (POCI) but have subsequently become credit-impaired (or 'stage 3'), for which interest revenue is calculated by applying the effective interest rate to their amortised cost (i.e. net of the expected credit loss provision).
Notes to the Financial StatementsYear ended 31 December 2020(all amounts in Maldivian Rufiyaa unless otherwise stated)
Maldives Monetary AuthorityAnnual Report 2020 127
-14-
Initial recognition and measurement
Financial assets and financial liabilities are recognised when the Authority becomes a party to the contractual provisions of the instrument. Regular way purchases and sales of financial assets are recognised on value-date, the date on which the Authority purchases or sells the asset.
At initial recognition, the Authority measures a financial asset or financial liability at its fair value plus or minus, in the case of a financial asset or financial liability not at fair value through profit or loss (FVPL), transaction costs that are incremental and directly attributable to the acquisition or issue of the financial asset or financial liability, such as fees and commissions. Transaction costs of financial assets and financial liabilities carried at fair value through profit or loss are expensed in the statement of comprehensive income. Immediately after initial recognition, an ECL is recognised for certain financial assets measured at amortised cost and investments in debt instruments measured at FVOCI, as described in note 43.1.5, which results in an accounting loss being recognised in the statement of comprehensive income when an asset is newly originated.
When the fair value of financial assets and liabilities differs from the transaction price on initial recognition, the entity recognises the difference as follows:
(a) When the fair value is evidenced by a quoted price in an active market for an identical asset or liability (i.e. a level 1 input) or based on a valuation technique that uses only data from observable markets, the difference is recognised as a gain or loss.
(b) In all other cases, the difference is deferred, and the timing of recognition of deferred day one gain or loss is determined individually. It is either amortised over the life of the instrument, deferred until the instrument's fair value can be determined using market observable inputs, or realised through settlement.
4.1.1 Financial assets
(i) Classification and subsequent measurement
The Authority classifies its financial assets in the following measurement categories:
• Fair value through other comprehensive income (FVOCI); or • Amortised cost.
The classification requirements for debt and equity instruments are described below:
Debt instruments
Debt instruments are those instruments that meet the definition of a financial liability from the issuer's perspective, such as loans, government and corporate bonds, both foreign and domestic.
Classification and subsequent measurement of debt instruments depends on:
(i) the Authority’s business model for managing the asset; and (ii) the cash flow characteristics of the asset.
Based on these factors, the Authority classifies its debt instruments into one of the following two measurement categories:
• Amortised cost: Assets that are held for collection of contractual cash flows where those cash flows represent solely payments of principal and interest ('SPPI'), and that are not designated at FVPL, are measured at amortised cost. The carrying amount of these assets is adjusted by any expected credit loss allowance recognised and measured as described
Notes to the Financial StatementsYear ended 31 December 2020(all amounts in Maldivian Rufiyaa unless otherwise stated)
Maldives Monetary AuthorityAnnual Report 2020128
-15-
in note 43.1.5. Interest income from these financial assets is included under ‘Operating income’ using the effective interest rate (EIR) method.
• FVOCI: Financial assets that are held for collection of contractual cash flows and for selling the assets, where the assets' cash flows represent SPPI, and that are not designated at FVPL, are measured at FVOCI. Movements in the carrying amount are taken through other comprehensive income (OCI), except for the recognition of impairment gains or losses, interest income and foreign exchange gains and losses on the instrument's amortised cost which are recognised in profit or loss. When the financial asset is derecognised, the cumulative gain or loss previously recognised in OCI is reclassified from equity to profit or loss and recognised in ‘Net Investment Income’. Interest income from these financial assets is included under ‘Operating income’ using the effective interest rate method.
Business model: the business model reflects how the Authority manages the assets in order to generate cash flows. That is, whether the Authority’s objective is solely to collect the contractual cash flows from the assets or is to collect both the contractual cash flows and cash flows arising from the sale of assets. If neither of these is applicable, then the financial assets are classified as part of 'other' business model and measured at FVPL. Factors considered by the Authority in determining the business model for assets include past experience on how the cash flows for these assets were collected, how the asset's performance is evaluated and reported to key management personnel, how risks are assessed and managed and how managers are compensated. The domestic currency portfolios are mostly held for the purpose of collecting the contractual cash flows. The Authority’s regular program of fixed term policy instruments are held until maturity.
SPPI: Where the business model is to hold assets to collect contractual cash flows or to collect contractual cash flows and sell, the Authority assesses whether the financial instruments' meet the 'SPPI test'. In making this assessment, the Authority considers whether the contractual cash flows are consistent with a basic lending arrangement i.e. interest includes only consideration for the time value of money, credit risk, other basic lending risks and a profit margin that is consistent with a basic lending arrangement. Where the contractual terms introduce exposure to risk or volatility that are inconsistent with a basic lending arrangement, the related financial asset is classified and measured at fair value through profit or loss.
Financial assets with embedded derivatives are considered in their entirety when determining whether their cash flows are SPPI.
The Authority reclassifies debt securities when and only when its business model for managing those assets changes. The reclassification takes place from the start of the first reporting period following the change. Such changes are expected to be very infrequent and none occurred during the period.
Equity instruments
Equity instruments are instruments that meet the definition of equity from the issuer's perspective; that is, instruments that do not contain a contractual obligation to pay and that evidence a residual interest in the issuer's net assets. Examples of equity instruments include basic ordinary shares. The Authority does not currently hold any equity holdings.
(ii) Impairment
The Authority assesses, on a forward-looking basis, the ECL associated with its debt instrument assets carried at amortised cost and FVOCI and with the exposure arising from loans, deposits,
Notes to the Financial StatementsYear ended 31 December 2020(all amounts in Maldivian Rufiyaa unless otherwise stated)
Maldives Monetary AuthorityAnnual Report 2020 129
-16-
advances and commitments and financial guarantee contracts. The Authority recognises a loss allowance for such losses at each reporting date. The measurement of ECL reflects:
• An unbiased and probability-weighted amount that is determined by evaluating a range of possible outcomes;
• The time value of money; and • Reasonable and supportable information that is available without undue cost or effort at
the reporting date about past events, current conditions and forecasts of future economic conditions.
Note 43.1.2 provides more detail of how the expected credit loss allowance is measured.
Presentation of allowance for ECL in the statement of financial position
Loss allowance for ECL are presented in the statement of financial position as follows:
• financial assets measured at amortised cost: as a deduction from the gross carrying amount of the assets;
• loan commitments and financial guarantee contracts: as a provision; • debt instruments measured at FVOCI: no allowance is recognised in the statement of
financial position because the carrying amount of these assets is their fair value. However, the loss allowance is recognised in profit or loss and disclosed in Note 43.1.4.
(iii) Modification of loans
The Authority may sometimes renegotiate or otherwise modify the contractual cash flows of loans to banks. When this happens, the Authority will assess whether or not the new terms are substantially different to the original terms. The Authority would do this by considering, among others, the following factors:
• If the borrower is in financial difficulty, whether the modification merely reduces the contractual cash flows to amounts the borrower is expected to be able to pay.
• Whether any substantial new terms are introduced, that substantially affects the risk profile of the loan.
• Significant extension of the loan term when the borrower is not in financial difficulty. • Significant change in the interest rate. • Change in the currency the loan is denominated in. • Insertion of collateral, other security or credit enhancements that significantly affect the
credit risk associated with the loan.
If the terms are substantially different, the Authority would derecognise the original financial asset and recognise a 'new' asset at fair value and recalculate a new EIR for the asset. The date of renegotiation would be consequently considered to be the date of initial recognition for impairment calculation purposes, including for the purpose of determining whether a significant increase in credit risk has occurred. However, the Authority would also assess whether the new financial asset recognised is deemed to be credit-impaired at initial recognition, especially in circumstances where the renegotiation was driven by the debtor being unable to make the originally agreed payments. Differences in the carrying amount would also be recognised in the income statement as a gain or loss on derecognition.
If the terms are not substantially different, the renegotiation or modification does not result in derecognition, and the Authority would recalculate the gross carrying amount based on the revised cash flows of the financial asset and recognise a modification gain or loss in the income
Notes to the Financial StatementsYear ended 31 December 2020(all amounts in Maldivian Rufiyaa unless otherwise stated)
Maldives Monetary AuthorityAnnual Report 2020130
-17-
statement. The new gross carrying amount would be recalculated by discounting the modified cash flows at the original EIR (or credit-adjusted EIR for purchased or originated credit-impaired financial assets).
(iv) Derecognition other than on a modification
Financial assets, or a portion thereof, are derecognised when the contractual rights to receive the cash flows from the assets have expired, or when they have been transferred and either (i) the Authority transfers substantially all the risks and rewards of ownership, or (ii) the Authority neither transfers nor retains substantially all the risks and rewards of ownership and the Authority has not retained control.
4.1.2 Financial liabilities
(i) Classification and subsequent measurement
Financial liabilities are classified and subsequently measured at amortised cost, except for;
• Financial guarantee contracts (see note 4.2)
(ii) Derecognition
Financial liabilities are derecognised when they are extinguished (i.e. when the obligation specified in the contract is discharged, cancelled or expires).
The exchange between the Authority and its original counterparties of debt instruments with substantially different terms, as well as substantial modifications of the terms of existing financial liabilities, are accounted for as an extinguishment of the original financial liability and the recognition of a new financial liability. The terms are substantially different if the discounted present value of the cash flows under the new terms, including any fees paid net of any fees received and discounted using the original EIR, is at least 10% different from the discounted present value of the remaining cash flows of the original financial liability. In addition, other qualitative factors, such as the currency that the instrument is denominated in, changes in the type of interest rate, new conversion features attached to the instrument and change in covenants are also taken into consideration. If an exchange of debt instruments or modification of terms is accounted for as an extinguishment, any costs or fees incurred are recognised as part of the gain or loss on the extinguishment. If the exchange or modification is not accounted for as an extinguishment, any costs or fees incurred adjust the carrying amount of the liability and are amortised over the remaining term of the modified liability.
4.2 Financial guarantee contracts
Financial guarantee contracts are contracts that require the issuer to make specified payments to reimburse the holder for a loss it incurs because a specified debtor fails to make payments when due, in accordance with the terms of a debt instrument.
Financial guarantee contracts are initially measured at fair value and subsequently measured based on the amount of the loss allowance (calculated as described in note 43.1.5). For financial guarantee contracts, the loss allowance is recognised as a provision.
Notes to the Financial StatementsYear ended 31 December 2020(all amounts in Maldivian Rufiyaa unless otherwise stated)
Maldives Monetary AuthorityAnnual Report 2020 131
-18-
4.3 Financial instruments
(a) Cash and balances with banks
Cash and balances with banks comprise foreign currency held at the Authority’s premises, cash and balances held in both domestic and foreign currency in local and foreign banks and financial institutions.
Cash and balances are carried at amortised cost in the statement of financial position.
(b) International Monetary Fund (IMF) related assets and liabilities
In accordance with Section 22 (q) of the MMA Act, the Authority acts as fiscal agent of the Government in its dealings with International Financial Institutions, transact with the International Financial Institutions and undertake financial agency work for the Government. In compliance with the MMA Act, the accounts with International Monetary Fund (IMF), which records all transactions with the IMF, have been included in these financial statements.
The cumulative allocation of SDR by the IMF is treated as a liability. Exchange gains and losses arising on revaluation of IMF assets and liabilities are recognised in the statement of comprehensive income.
All other charges and interest pertaining to balances with the IMF are recorded immediately in the statement of comprehensive income.
(c) Investment in securities
Investment in securities comprise of investment in securities with foreign banks, investment in Government treasury bills and investment in held to collect contractual cash flows and for sale securities. The Authority has classified these debt securities at amortised cost, except for those held to collect contractual cash flows and for sale which are classified as FVOCI.
(d) Loans and advances
Loans and advances include loans and advances to the Authority’s employees; they were initially measured at fair value plus incremental direct transaction costs, and subsequently measured at their amortised cost using the effective interest method.
(e) Deposits and borrowings
Financial liabilities under deposits and borrowings include balances of commercial banks, balances of the government and government institutions, interest bearing loans received from Ministry of Finance (MOF) and balance of insurance and remittance companies that are measured at amortised cost.
Deposits and borrowings are initially measured at fair value minus incremental direct transaction costs, and subsequently measured at their amortised cost using the effective interest method.
Notes to the Financial StatementsYear ended 31 December 2020(all amounts in Maldivian Rufiyaa unless otherwise stated)
Maldives Monetary AuthorityAnnual Report 2020132
-19-
(f) Interest
Effective interest rate
Interest income and expense are recognised in the income statement using the effective interest method. The EIR is the rate that exactly discounts the estimated future cash payments and receipts through the expected life of the financial instrument to:
• the gross carrying amount of the financial asset; or • the amortised cost of the financial liability.
When calculating the EIR for financial instruments other than credit-impaired assets, the Authority estimates future cash flows considering all contractual terms of the financial instrument, but not future credit losses.
For credit-impaired financial assets, a credit-adjusted effective interest rate is calculated using estimated future cash flows including expected credit losses.
The calculation of the EIR includes transaction costs and fees paid or received that are an integral part of the EIR. Transaction costs include incremental costs that are directly attributable to the acquisition or issue of a financial asset or financial liability.
Amortised cost and gross carrying amount
The amortised cost of a financial asset or financial liability is the amount at which the financial asset or financial liability is measured at initial recognition, minus principal repayments, plus or minus the cumulative amortisation using the effective interest method of any difference between that initial amount recognised and the maturity amount and for, financial assets, adjusted for any expected credit loss allowance.
The ‘gross carrying amount of a financial asset’ is the amortised cost of a financial asset before adjusting for any expected credit loss allowance.
Calculation of interest income and expense
In calculating interest income and expense, the EIR is applied to the gross carrying amount of the asset (when the asset is not credit-impaired) or to the amortised cost of the liability. However, for financial assets that have become credit-impaired subsequent to initial recognition, interest income is calculated by applying the EIR to the amortised cost of the financial asset. If the asset is no longer credit-impaired, then the calculation of interest income reverts to the gross basis.
For financial assets that were credit-impaired on initial recognition, interest income is calculated by applying the credit-adjusted effective interest rate to the amortised cost of the asset. The calculation of interest income does not revert to a gross basis, even if the credit risk of the asset improves.
For information on when financial assets are credit-impaired, see Note 43.1.2.2.
Presentation
Interest income and expense presented in the statement of comprehensive income include:
• interest on financial assets and financial liabilities measured at amortised cost calculated on an effective interest basis; and
Notes to the Financial StatementsYear ended 31 December 2020(all amounts in Maldivian Rufiyaa unless otherwise stated)
Maldives Monetary AuthorityAnnual Report 2020 133
-20-
• interest on debt instruments measured at FVOCI calculated on an effective interest basis.
Interest income and expense on all financial assets and financial liabilities are considered to be incidental to the Authority’s trading operations and are presented in the net operating income (see note 33 to 34).
(g) Currency in circulation
MMA is the sole statutory authority to issue currency to the public and is carried out in line with the MMA Act. Currency issued by the Authority represents a claim on the Authority in favour of the holder. The liability for currency in circulation is recorded at the face value in the financial statements and is considered to be its fair value. Movements in circulation currency are included as part of financing activities in line with prevailing industry practices among those central banks which present statement of cash flows.
(h) Leases
At inception of a contract, the Authority assesses whether a contract is, or contains, a lease. A contract is, or contains, a lease if the contract conveys the right to control the use of an identified asset for a period of time in exchange of consideration. To assess whether a contract conveys the right to control the use of an identified asset, the Authority uses the definition of a lease in IFRS 16.
Authority acting as a lessee
The Authority recognises a right-of-use asset and a lease liability at the lease commencement date. The right-of-use asset is initially measured at the amount of the lease liability adjusted for any lease payments made at or before the commencement date, plus any initial direct costs incurred and an estimate of costs to dismantle and remove any improvements made to the lease asset.
The right-of-use asset is subsequently depreciated using straight-line method from the commencement date to the end of the lease term. In addition, the right-of-use asset is periodically reduced by impairment losses, if any, and adjusted for certain re-measurements of the lease liability.
The liability is initially measured at the present value of the lease payments that are not paid at the commencement date, discounted using the interest rate implicated in the lease or if that rate cannot be determined, the lessee’s incremental borrowing rate. The incremental borrowing rate is the rate of interest that a lessee would have to pay to borrow over a similar term, and with a similar security, the funds necessary to obtain an asset of a similar value to the right-of use asset in a similar economic environment. As such, the incremental borrowing rate applied to the Authority’s lease is 5.5%. This is the coupon rate of a Government security with a tenure of 10 years.
The lease liability is re-measured when there is a change in future lease payments arising from change in an index or rate, if there is a change in the Authority’s estimate of the amount expected to be payable under a residual value guarantee, if the Authority changes its assessment of whether it will exercise an extension option, and penalties for early termination option or if there is a revision in substance to fixed lease payment.
When the lease liability is re-measured in this way, a corresponding adjustment is made to the carrying amount of the right-of-use asset, or is recorded in income statement if the carrying amount of the right-of-use asset has been reduced to zero.
Notes to the Financial StatementsYear ended 31 December 2020(all amounts in Maldivian Rufiyaa unless otherwise stated)
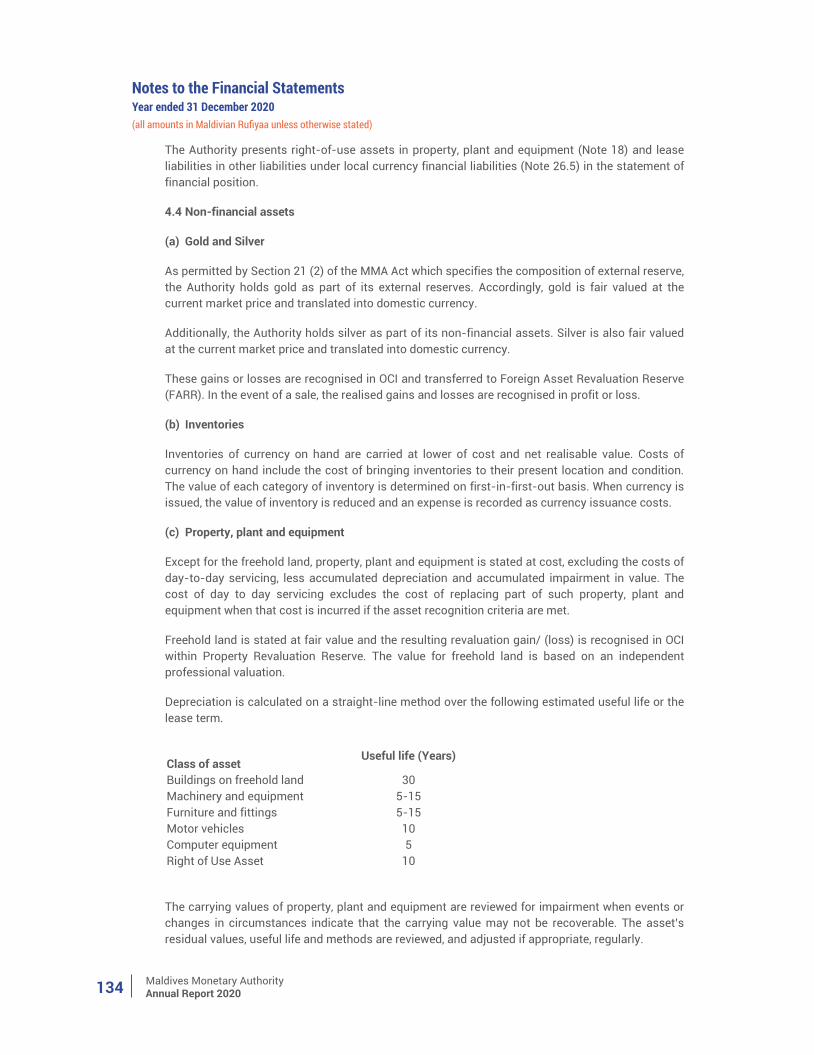
Maldives Monetary AuthorityAnnual Report 2020134
-21-
The Authority presents right-of-use assets in property, plant and equipment (Note 18) and lease liabilities in other liabilities under local currency financial liabilities (Note 26.5) in the statement of financial position.
4.4 Non-financial assets
(a) Gold and Silver
As permitted by Section 21 (2) of the MMA Act which specifies the composition of external reserve, the Authority holds gold as part of its external reserves. Accordingly, gold is fair valued at the current market price and translated into domestic currency.
Additionally, the Authority holds silver as part of its non-financial assets. Silver is also fair valued at the current market price and translated into domestic currency.
These gains or losses are recognised in OCI and transferred to Foreign Asset Revaluation Reserve (FARR). In the event of a sale, the realised gains and losses are recognised in profit or loss.
(b) Inventories
Inventories of currency on hand are carried at lower of cost and net realisable value. Costs of currency on hand include the cost of bringing inventories to their present location and condition. The value of each category of inventory is determined on first-in-first-out basis. When currency is issued, the value of inventory is reduced and an expense is recorded as currency issuance costs.
(c) Property, plant and equipment
Except for the freehold land, property, plant and equipment is stated at cost, excluding the costs of day-to-day servicing, less accumulated depreciation and accumulated impairment in value. The cost of day to day servicing excludes the cost of replacing part of such property, plant and equipment when that cost is incurred if the asset recognition criteria are met.
Freehold land is stated at fair value and the resulting revaluation gain/ (loss) is recognised in OCI within Property Revaluation Reserve. The value for freehold land is based on an independent professional valuation.
Depreciation is calculated on a straight-line method over the following estimated useful life or the lease term.
Class of asset
Useful life (Years)
Buildings on freehold land 30 Machinery and equipment 5-15 Furniture and fittings 5-15 Motor vehicles 10 Computer equipment Right of Use Asset
5 10
The carrying values of property, plant and equipment are reviewed for impairment when events or changes in circumstances indicate that the carrying value may not be recoverable. The asset’s residual values, useful life and methods are reviewed, and adjusted if appropriate, regularly.
Notes to the Financial StatementsYear ended 31 December 2020(all amounts in Maldivian Rufiyaa unless otherwise stated)
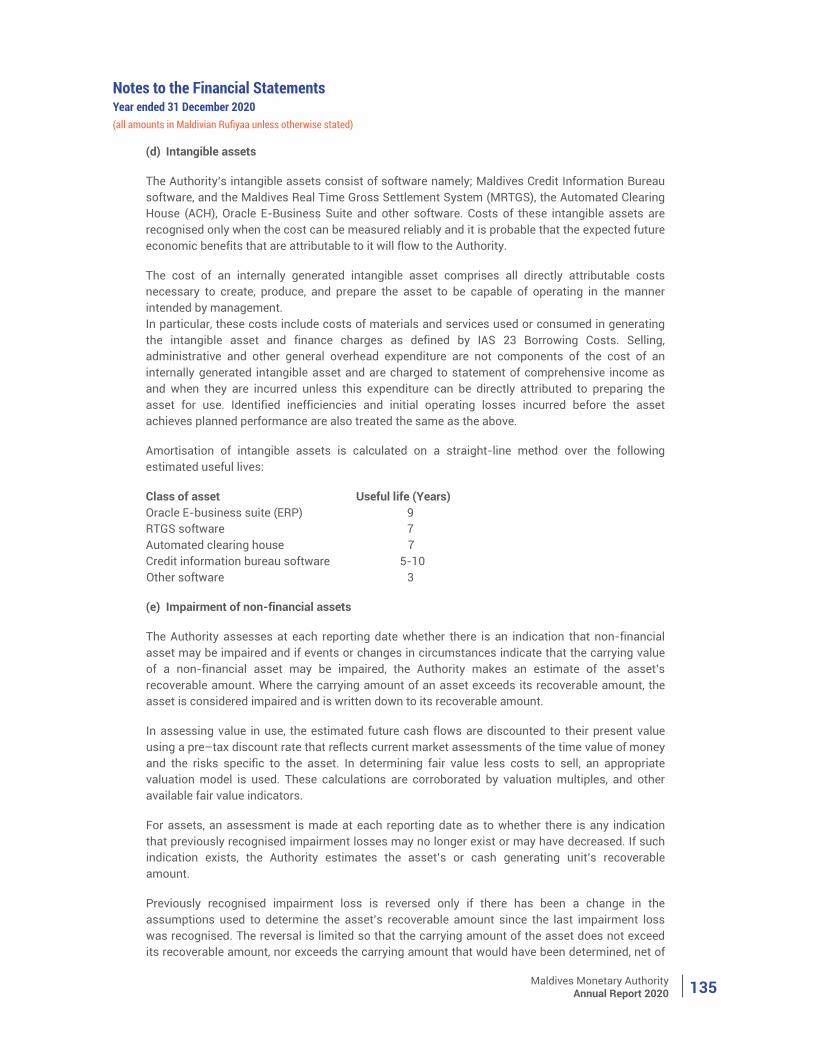
Maldives Monetary AuthorityAnnual Report 2020 135
-22-
(d) Intangible assets
The Authority’s intangible assets consist of software namely; Maldives Credit Information Bureau software, and the Maldives Real Time Gross Settlement System (MRTGS), the Automated Clearing House (ACH), Oracle E-Business Suite and other software. Costs of these intangible assets are recognised only when the cost can be measured reliably and it is probable that the expected future economic benefits that are attributable to it will flow to the Authority.
The cost of an internally generated intangible asset comprises all directly attributable costs necessary to create, produce, and prepare the asset to be capable of operating in the manner intended by management. In particular, these costs include costs of materials and services used or consumed in generating the intangible asset and finance charges as defined by IAS 23 Borrowing Costs. Selling, administrative and other general overhead expenditure are not components of the cost of an internally generated intangible asset and are charged to statement of comprehensive income as and when they are incurred unless this expenditure can be directly attributed to preparing the asset for use. Identified inefficiencies and initial operating losses incurred before the asset achieves planned performance are also treated the same as the above.
Amortisation of intangible assets is calculated on a straight-line method over the following estimated useful lives:
Class of asset Useful life (Years) Oracle E-business suite (ERP) 9 RTGS software 7 Automated clearing house 7 Credit information bureau software 5-10
Other software 3
(e) Impairment of non-financial assets
The Authority assesses at each reporting date whether there is an indication that non-financial asset may be impaired and if events or changes in circumstances indicate that the carrying value of a non-financial asset may be impaired, the Authority makes an estimate of the asset’s recoverable amount. Where the carrying amount of an asset exceeds its recoverable amount, the asset is considered impaired and is written down to its recoverable amount.
In assessing value in use, the estimated future cash flows are discounted to their present value using a pre–tax discount rate that reflects current market assessments of the time value of money and the risks specific to the asset. In determining fair value less costs to sell, an appropriate valuation model is used. These calculations are corroborated by valuation multiples, and other available fair value indicators.
For assets, an assessment is made at each reporting date as to whether there is any indication that previously recognised impairment losses may no longer exist or may have decreased. If such indication exists, the Authority estimates the asset’s or cash generating unit’s recoverable amount.
Previously recognised impairment loss is reversed only if there has been a change in the assumptions used to determine the asset’s recoverable amount since the last impairment loss was recognised. The reversal is limited so that the carrying amount of the asset does not exceed its recoverable amount, nor exceeds the carrying amount that would have been determined, net of
Notes to the Financial StatementsYear ended 31 December 2020(all amounts in Maldivian Rufiyaa unless otherwise stated)
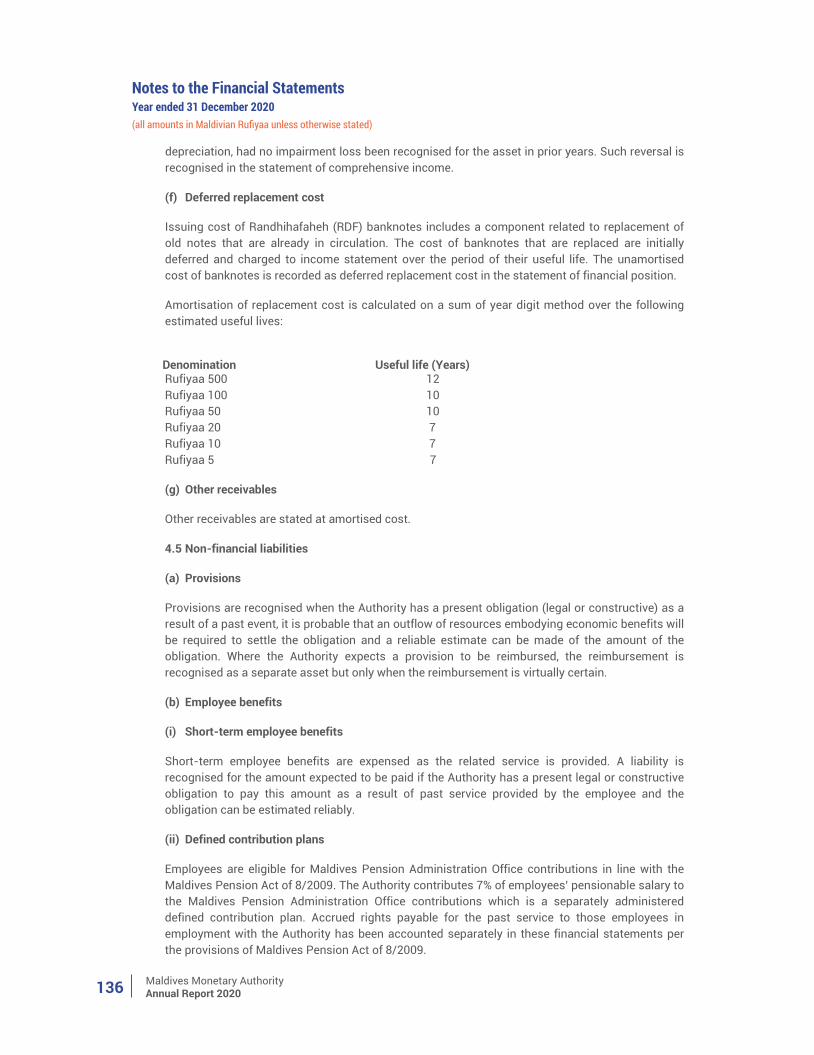
Maldives Monetary AuthorityAnnual Report 2020136
-23-
depreciation, had no impairment loss been recognised for the asset in prior years. Such reversal is recognised in the statement of comprehensive income.
(f) Deferred replacement cost
Issuing cost of Randhihafaheh (RDF) banknotes includes a component related to replacement of old notes that are already in circulation. The cost of banknotes that are replaced are initially deferred and charged to income statement over the period of their useful life. The unamortised cost of banknotes is recorded as deferred replacement cost in the statement of financial position.
Amortisation of replacement cost is calculated on a sum of year digit method over the following estimated useful lives:
Denomination Useful life (Years)
Rufiyaa 500 12 Rufiyaa 100 10 Rufiyaa 50 10 Rufiyaa 20 7 Rufiyaa 10 7 Rufiyaa 5 7
(g) Other receivables
Other receivables are stated at amortised cost.
4.5 Non-financial liabilities
(a) Provisions
Provisions are recognised when the Authority has a present obligation (legal or constructive) as a result of a past event, it is probable that an outflow of resources embodying economic benefits will be required to settle the obligation and a reliable estimate can be made of the amount of the obligation. Where the Authority expects a provision to be reimbursed, the reimbursement is recognised as a separate asset but only when the reimbursement is virtually certain.
(b) Employee benefits
(i) Short-term employee benefits
Short-term employee benefits are expensed as the related service is provided. A liability is recognised for the amount expected to be paid if the Authority has a present legal or constructive obligation to pay this amount as a result of past service provided by the employee and the obligation can be estimated reliably.
(ii) Defined contribution plans
Employees are eligible for Maldives Pension Administration Office contributions in line with the Maldives Pension Act of 8/2009. The Authority contributes 7% of employees’ pensionable salary to the Maldives Pension Administration Office contributions which is a separately administered defined contribution plan. Accrued rights payable for the past service to those employees in employment with the Authority has been accounted separately in these financial statements per the provisions of Maldives Pension Act of 8/2009.
Notes to the Financial StatementsYear ended 31 December 2020(all amounts in Maldivian Rufiyaa unless otherwise stated)
Maldives Monetary AuthorityAnnual Report 2020 137
-24-
(iii) Retirement gratuity
The Authority provides retirement gratuity for all eligible employees under its staff regulation. Employees who have served the authority for a period of 10 years are entitled for this benefit upon retirement at the age of 65 years. These benefits are recognised in other liabilities in respect of employee’s services and are measured at the present value of future payments expected to be made based on services provided by employees up to the reporting date.
Changes in the value of the liability for retirement gratuities and post-retirement benefits are included within the statement of comprehensive income in personnel expenses within operating expenses. The Re-measurement gain or loss is included in other comprehensive income.
(c) Grants
Grants are recognised at their fair value (where there is a reasonable assurance that the grant will be received and all attaching conditions, if any, will be complied with) are shown under other liabilities. When the grant relates to an expense item, it is recognised in the statement of comprehensive income over the periods necessary to match them to the expenses it is intended to compensate on a systematic basis.
Where the grant relates to an asset, including situations where an asset is given to the Authority the fair value is credited to a deferred grant account and is released to the statement of comprehensive income over the expected useful life of the relevant asset on a systematic basis consistent with the depreciation policy of the related asset. Where assets received under a grant are inventory or an operational expense in nature, the grant amount is taken to the statement of comprehensive income when the inventory is issued or the expense is incurred.
(d) Other liabilities
Other liabilities are initially recognised at their fair value and subsequently recognised at amortised cost.
4.6 Current tax
Effective 1 January 2020, Maldives Inland Revenue Authority (MIRA), replaced the prevailing Business Profit Tax (Law number 5/2011) with the Income Tax Act (Law number 25/2019). According to chapter 3, section 12 (e) of the Income Tax Act, the Authority’s income is exempt from tax. Additionally, according to chapter 8, section 54 of the Income Tax Act, the Authority deducted employee withholding tax from the gross amount of each payment made to the employees each month in the manner stipulated in the Act.
4.7 Revenue and expenses
Revenue is recognised to the extent that it is probable that the economic benefits will flow to the Authority and the revenue can be reliably measured. Expenses are recognised in the statement of comprehensive income on the basis of direct association between the cost incurred and the earning of specific items of income.
All expenditure incurred in running the business and in maintaining the property, plant and equipment in a state of efficiency has been charged to statement of comprehensive income in arriving at the result for the year.
Notes to the Financial StatementsYear ended 31 December 2020(all amounts in Maldivian Rufiyaa unless otherwise stated)
Maldives Monetary AuthorityAnnual Report 2020138
-25-
The following specific recognition criteria must also be met before revenue and expenses are recognised:
(a) Interest income and expenses
Interest income and expense are recognised in the statement of comprehensive income on an accrual basis using the effective interest rate method based on the gross carrying amount of the asset (when the asset is not credit impaired) or to the amortised cost of the liability (see note 4.3(g)). Interest income mainly includes interest earned from fixed deposit investments, coupon earned from fixed income securities, discount accrued from treasury bills and other discounted instruments.
(b) Miscellaneous
Miscellaneous income and expenses are recognised on an accrual basis.
Net gains and losses of a revenue nature on the disposal of property, plant and equipment have been accounted for in the statement of comprehensive income, having deducted from proceeds on disposal, the carrying amount of the assets and related selling expenses.
Gains and losses arising from incidental activities to the main revenue generating activities and those that are not material are aggregated, reported and presented on a net basis.
4.8 Contingent liabilities and commitments including off balance sheet items
All guarantees of indebtedness, forward foreign exchange transactions, foreign currency swaps and other commitments which represents off balance sheet items are shown under respective headings. Where applicable, such amounts are measured at best estimates.
4.9 Cash flow statement
The statement of cash flows has been prepared by using the ‘Direct Method’ in accordance with IAS 7 on statement of cash flows, whereby gross cash receipts and gross cash payments of operating activities, financing activities and investing activities have been recognised. Cash and cash equivalents comprise mainly cash balances, money at overnight placements and highly liquid investments that has original maturity of three months or less.
4.10 Comparatives
Where necessary, comparatives figures have been adjusted to confirm with changes in presentation in the current year.
5. ACCOUNTING STANDARDS, AMENDMENTS AND INTERPRETATIONS NOT YET EFFECTIVE
Certain new accounting standards and interpretations have been published that are not mandatory for 31 December 2020 reporting periods and have not been early adopted by the Authority.
The Authority is currently assessing the impact of the following amendments:
• Disclosure of Accounting Policies (Amendments to IAS 1 and IFRS Practice Statement 2) • Definition of Accounting Estimates (Amendments to IAS 8)
Notes to the Financial StatementsYear ended 31 December 2020(all amounts in Maldivian Rufiyaa unless otherwise stated)
Maldives Monetary AuthorityAnnual Report 2020 139
-26-
Additionally, the following new and revised standards are not expected to have a material impact on the Authority’s financial statements in the current or future reporting periods and on foreseeable future transactions:
• Interest Rate Benchmark Reform Phase 2 (Amendments to IFRS 9, IAS 39, IFRS 7, IFRS 4 and IFRS 16).
• Classification of Liabilities as Current or Non-current (Amendments to IAS 1) • Property, Plant and Equipment – Proceeds before Intended Use (Amendments to IAS 16) • Onerous Contracts – Cost of Fulfilling a Contract (Amendments to IAS 37) • COVID-19 Related Rent Concessions (Amendment to IFRS 16) • IFRS 17 - Insurance Contracts and amendments to IFRS 17 Insurance Contracts • References to Conceptual Framework (Amendments to IFRS 3) • Annual Improvements to IFRS Standards 2018-2020 (IFRS 1, IFRS 9, IFRS 16 and IAS 41)
Notes to the Financial StatementsYear ended 31 December 2020(all amounts in Maldivian Rufiyaa unless otherwise stated)
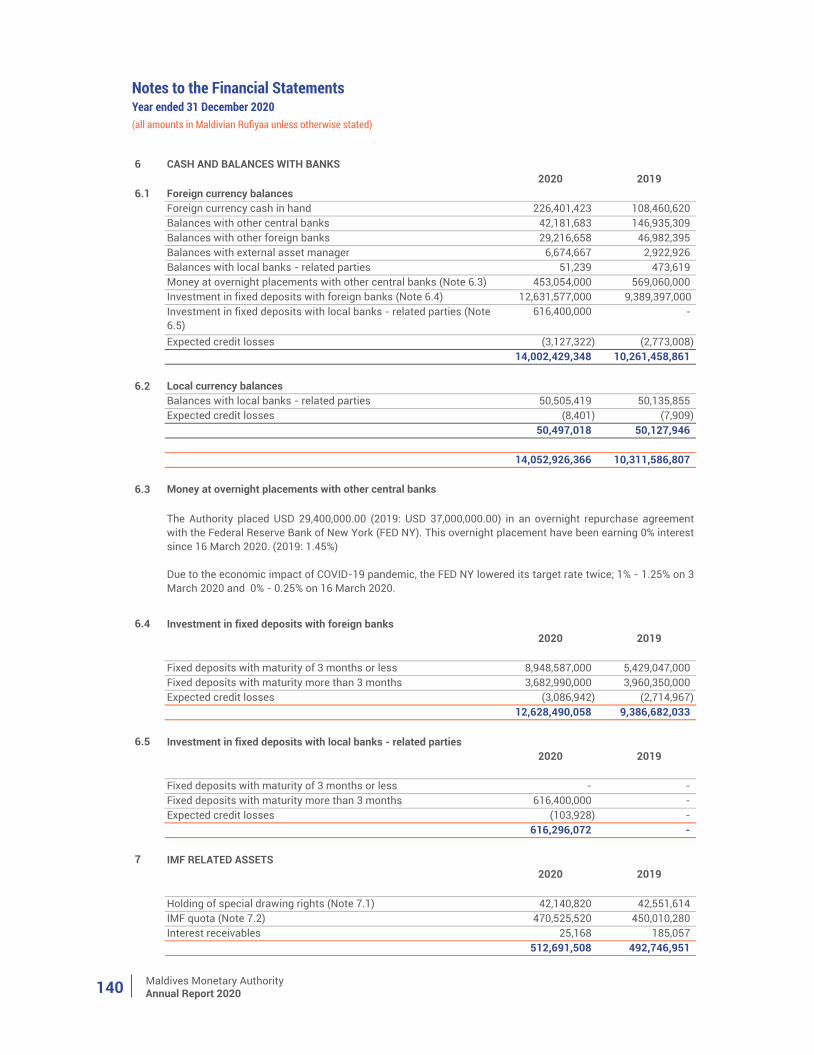
Maldives Monetary AuthorityAnnual Report 2020140
Notes to the Financial StatementsYear ended 31 December 2020(all amounts in Maldivian Rufiyaa unless otherwise stated)
6 CASH AND BALANCES WITH BANKS2020 2019
6.1 Foreign currency balancesForeign currency cash in hand 226,401,423 108,460,620 Balances with other central banks 42,181,683 146,935,309 Balances with other foreign banks 29,216,658 46,982,395 Balances with external asset manager 6,674,667 2,922,926 Balances with local banks - related parties 51,239 473,619 Money at overnight placements with other central banks (Note 6.3) 453,054,000 569,060,000 Investment in fixed deposits with foreign banks (Note 6.4) 12,631,577,000 9,389,397,000
616,400,000 -
Expected credit losses (3,127,322) (2,773,008) 14,002,429,348 10,261,458,861
6.2 Local currency balancesBalances with local banks - related parties 50,505,419 50,135,855 Expected credit losses (8,401) (7,909)
50,497,018 50,127,946
14,052,926,366 10,311,586,807
6.3 Money at overnight placements with other central banks
6.4 Investment in fixed deposits with foreign banks2020 2019
Fixed deposits with maturity of 3 months or less 8,948,587,000 5,429,047,000 Fixed deposits with maturity more than 3 months 3,682,990,000 3,960,350,000 Expected credit losses (3,086,942) (2,714,967)
12,628,490,058 9,386,682,033
6.5 Investment in fixed deposits with local banks - related parties2020 2019
Fixed deposits with maturity of 3 months or less - - Fixed deposits with maturity more than 3 months 616,400,000 - Expected credit losses (103,928) -
616,296,072 -
7 IMF RELATED ASSETS2020 2019
Holding of special drawing rights (Note 7.1) 42,140,820 42,551,614 IMF quota (Note 7.2) 470,525,520 450,010,280 Interest receivables 25,168 185,057
512,691,508 492,746,951
The Authority placed USD 29,400,000.00 (2019: USD 37,000,000.00) in an overnight repurchase agreementwith the Federal Reserve Bank of New York (FED NY). This overnight placement have been earning 0% interestsince 16 March 2020. (2019: 1.45%)
Due to the economic impact of COVID-19 pandemic, the FED NY lowered its target rate twice; 1% - 1.25% on 3March 2020 and 0% - 0.25% on 16 March 2020.
Investment in fixed deposits with local banks - related parties (Note 6.5)
Maldives Monetary AuthorityAnnual Report 2020 141
Notes to the Financial StatementsYear ended 31 December 2020(all amounts in Maldivian Rufiyaa unless otherwise stated)7 IMF RELATED ASSETS (CONTINUED)
7.1 Holding of special drawing rights (SDR)
7.2 IMF Quota
SDR is an international reserve asset, created by the IMF to supplement its member countries' officialreserves. Its value is based on a basket of five key international currencies and SDRs can be exchangedfor freely usable currencies.
As at 31 December 2020, the IMF Quota of Maldives is SDR 21.2 million (2019: SDR 21.2 million).
Holding of SDRs is potentially a claim on freely usable currencies of IMF members, in that holders ofSDRs can exchange their currencies for SDRs. The SDRs value as a reserve asset derives from thecommitments of members to hold and accept SDRs and to honor various obligations connected with theoperation of the SDR system. The IMF ensures that the SDRs claim on freely usable currencies is beinghonored in two ways: by designating IMF members with a strong external position to purchase SDRsfrom members with weak external positions, and through the arrangement of voluntary exchangesbetween participating members in a managed market. The amount shown above represents the totalholdings of SDRs by the Authority as at the respective reporting dates.
The International Monetary Fund (IMF) is an international organization of 190 member countries. It wasestablished to promote international monetary cooperation, exchange stability, and orderly exchangearrangements; to foster economic growth and high levels of employment; and to provide temporaryfinancial assistance to countries to help ease balance of payments adjustment. The IMF receives itsresources from its member countries and quota subscriptions are a central source of IMF's financialresources. Each country's subscription, or quota, is determined broadly on the basis of the economicsize of the country, and taking into account quotas of similar countries.
A member's subscription to IMF resources is equal to its quota and determines the maximum amount offinancial resources the member is obliged to provide to the IMF. A member must pay its subscription infull. A country must pay 25% of its quota in widely accepted foreign currencies or SDRs, and theremaining 75% in its own currency.
The quota defines a member's voting power in IMF decisions. Each IMF member has IMF basic votesplus one additional vote for each SDR 0.1 millions of quota. IMF basic votes are fixed at 5.502% of thetotal votes. As at 31 December 2020, The Republic of Maldives has 1,670 votes representing 0.03% oftotal votes. The amount of financing a member can obtain from the IMF (access limits) is also based onits quota. Under Stand-By and Extended Arrangements, for instance, a member can currently borrow upto 145% of its quota annually and 435% cumulatively. Access may be higher in exceptionalcircumstances and to meet specific problems.
The Republic of Maldives has been a member of the IMF since 1978. The Maldives Monetary Authorityacts as both fiscal agent and the depository for the IMF. As fiscal agent the Authority is authorised tocarry out all operations and transactions with IMF. As depository the Authority maintains IMF’s currencyholdings and ensures that the assets and liabilities of IMF membership are properly reflected in itsaccounts and presented in its financial statements. The quota of the Maldives is its membershipsubscription which is granted mainly by the issue of promissory notes in favour of the IMF and partly byforeign currency payments by the Government of Maldives.
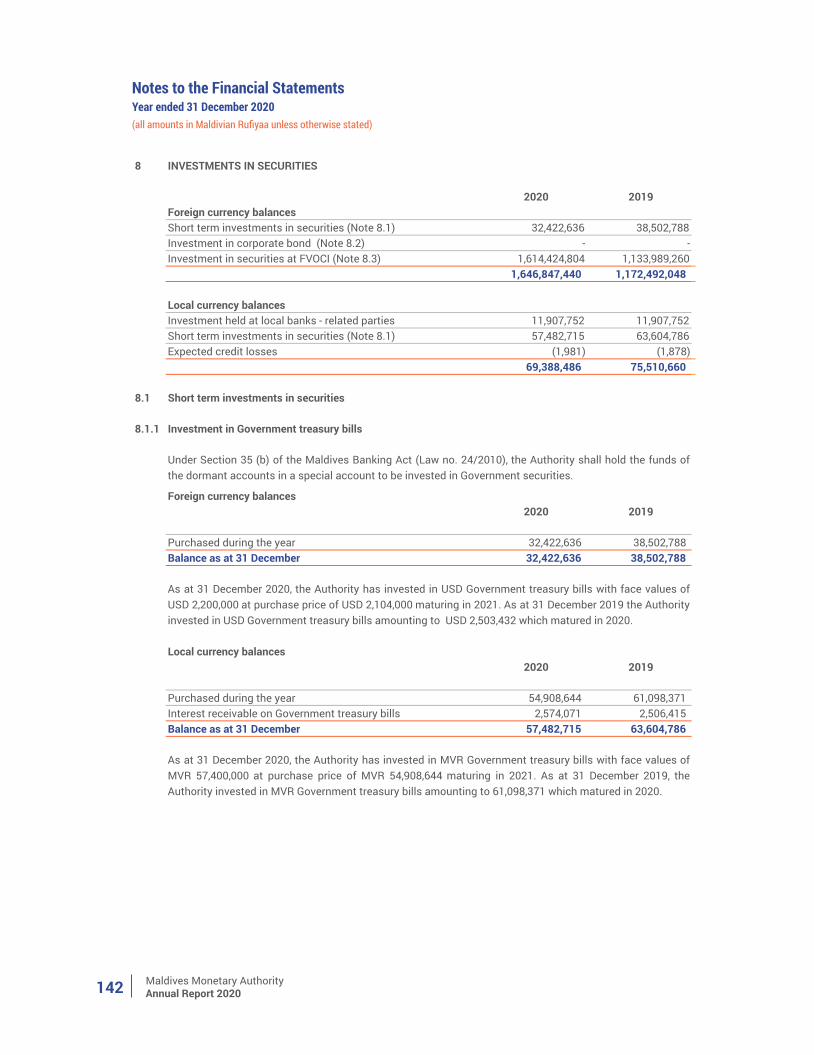
Maldives Monetary AuthorityAnnual Report 2020142
Notes to the Financial StatementsYear ended 31 December 2020(all amounts in Maldivian Rufiyaa unless otherwise stated)
8 INVESTMENTS IN SECURITIES
2020 2019Foreign currency balancesShort term investments in securities (Note 8.1) 32,422,636 38,502,788 Investment in corporate bond (Note 8.2) - - Investment in securities at FVOCI (Note 8.3) 1,614,424,804 1,133,989,260
1,646,847,440 1,172,492,048
Local currency balancesInvestment held at local banks - related parties 11,907,752 11,907,752 Short term investments in securities (Note 8.1) 57,482,715 63,604,786 Expected credit losses (1,981) (1,878)
69,388,486 75,510,660
8.1 Short term investments in securities
8.1.1 Investment in Government treasury bills
Foreign currency balances2020 2019
Purchased during the year 32,422,636 38,502,788 Balance as at 31 December 32,422,636 38,502,788
Local currency balances2020 2019
Purchased during the year 54,908,644 61,098,371 Interest receivable on Government treasury bills 2,574,071 2,506,415 Balance as at 31 December 57,482,715 63,604,786
As at 31 December 2020, the Authority has invested in MVR Government treasury bills with face values ofMVR 57,400,000 at purchase price of MVR 54,908,644 maturing in 2021. As at 31 December 2019, theAuthority invested in MVR Government treasury bills amounting to 61,098,371 which matured in 2020.
Under Section 35 (b) of the Maldives Banking Act (Law no. 24/2010), the Authority shall hold the funds ofthe dormant accounts in a special account to be invested in Government securities.
As at 31 December 2020, the Authority has invested in USD Government treasury bills with face values ofUSD 2,200,000 at purchase price of USD 2,104,000 maturing in 2021. As at 31 December 2019 the Authorityinvested in USD Government treasury bills amounting to USD 2,503,432 which matured in 2020.
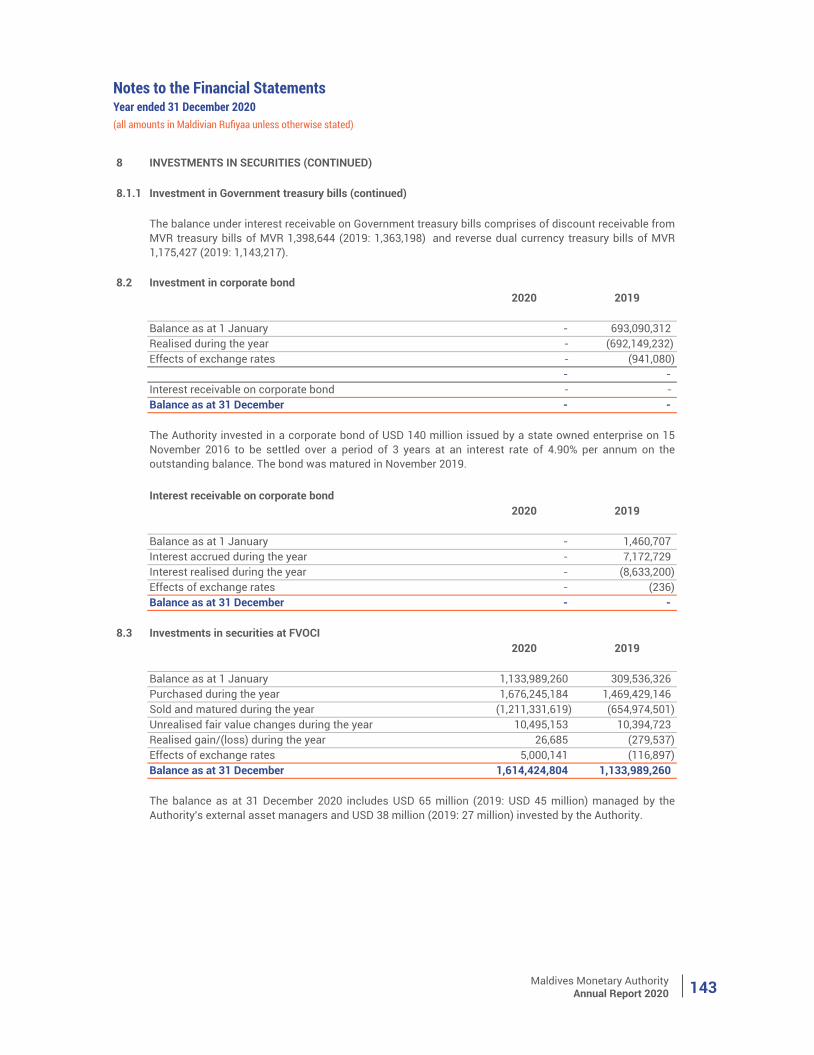
Maldives Monetary AuthorityAnnual Report 2020 143
(all amounts in Maldivian Rufiyaa unless otherwise stated)
Notes to the Financial StatementsYear ended 31 December 2020
8 INVESTMENTS IN SECURITIES (CONTINUED)
8.1.1 Investment in Government treasury bills (continued)
8.2 Investment in corporate bond2020 2019
Balance as at 1 January - 693,090,312 Realised during the year - (692,149,232)Effects of exchange rates - (941,080)
- - Interest receivable on corporate bond - - Balance as at 31 December - -
Interest receivable on corporate bond2020 2019
Balance as at 1 January - 1,460,707 Interest accrued during the year - 7,172,729 Interest realised during the year - (8,633,200) Effects of exchange rates - (236) Balance as at 31 December - -
8.3 Investments in securities at FVOCI2020 2019
Balance as at 1 January 1,133,989,260 309,536,326 Purchased during the year 1,676,245,184 1,469,429,146 Sold and matured during the year (1,211,331,619) (654,974,501) Unrealised fair value changes during the year 10,495,153 10,394,723 Realised gain/(loss) during the year 26,685 (279,537) Effects of exchange rates 5,000,141 (116,897) Balance as at 31 December 1,614,424,804 1,133,989,260
The Authority invested in a corporate bond of USD 140 million issued by a state owned enterprise on 15November 2016 to be settled over a period of 3 years at an interest rate of 4.90% per annum on theoutstanding balance. The bond was matured in November 2019.
The balance as at 31 December 2020 includes USD 65 million (2019: USD 45 million) managed by theAuthority's external asset managers and USD 38 million (2019: 27 million) invested by the Authority.
The balance under interest receivable on Government treasury bills comprises of discount receivable fromMVR treasury bills of MVR 1,398,644 (2019: 1,363,198) and reverse dual currency treasury bills of MVR1,175,427 (2019: 1,143,217).
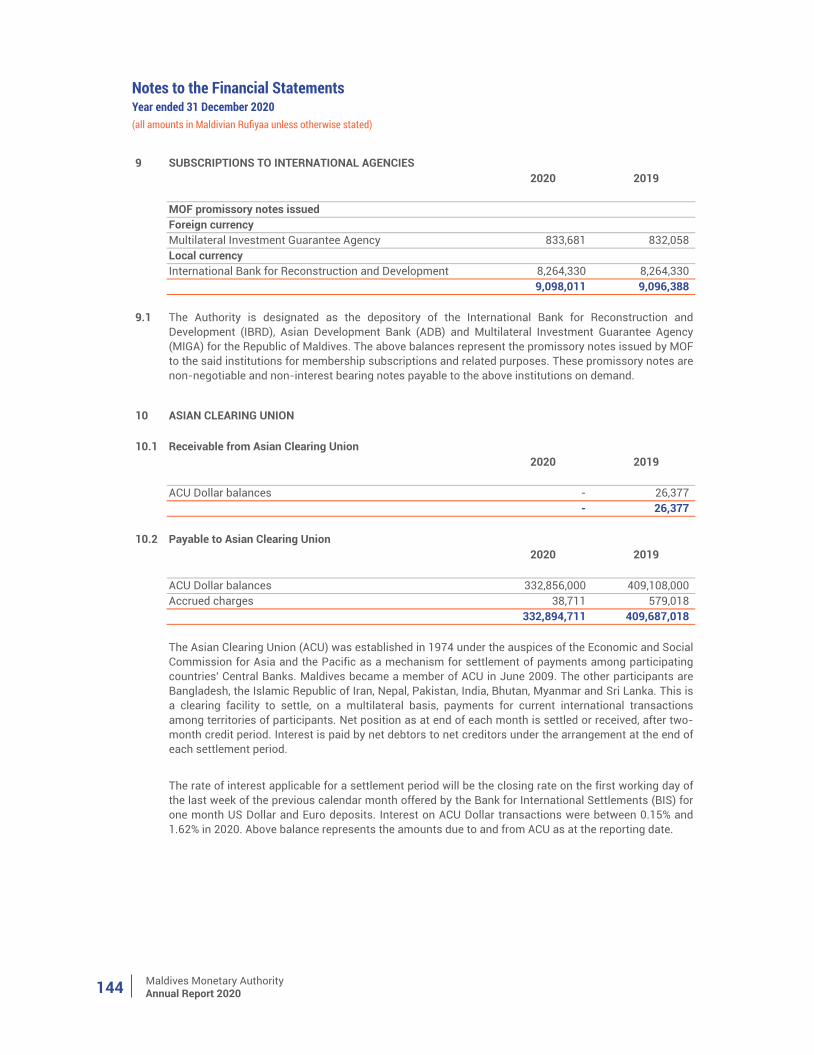
Maldives Monetary AuthorityAnnual Report 2020144
Notes to the Financial StatementsYear ended 31 December 2020(all amounts in Maldivian Rufiyaa unless otherwise stated)
9 SUBSCRIPTIONS TO INTERNATIONAL AGENCIES2020 2019
MOF promissory notes issuedForeign currencyMultilateral Investment Guarantee Agency 833,681 832,058 Local currencyInternational Bank for Reconstruction and Development 8,264,330 8,264,330
9,098,011 9,096,388
9.1
10 ASIAN CLEARING UNION
10.1 Receivable from Asian Clearing Union2020 2019
ACU Dollar balances - 26,377 - 26,377
10.2 Payable to Asian Clearing Union2020 2019
ACU Dollar balances 332,856,000 409,108,000 Accrued charges 38,711 579,018
332,894,711 409,687,018
The rate of interest applicable for a settlement period will be the closing rate on the first working day ofthe last week of the previous calendar month offered by the Bank for International Settlements (BIS) forone month US Dollar and Euro deposits. Interest on ACU Dollar transactions were between 0.15% and1.62% in 2020. Above balance represents the amounts due to and from ACU as at the reporting date.
The Asian Clearing Union (ACU) was established in 1974 under the auspices of the Economic and SocialCommission for Asia and the Pacific as a mechanism for settlement of payments among participatingcountries' Central Banks. Maldives became a member of ACU in June 2009. The other participants areBangladesh, the Islamic Republic of Iran, Nepal, Pakistan, India, Bhutan, Myanmar and Sri Lanka. This isa clearing facility to settle, on a multilateral basis, payments for current international transactionsamong territories of participants. Net position as at end of each month is settled or received, after two-month credit period. Interest is paid by net debtors to net creditors under the arrangement at the end ofeach settlement period.
The Authority is designated as the depository of the International Bank for Reconstruction andDevelopment (IBRD), Asian Development Bank (ADB) and Multilateral Investment Guarantee Agency(MIGA) for the Republic of Maldives. The above balances represent the promissory notes issued by MOFto the said institutions for membership subscriptions and related purposes. These promissory notes arenon-negotiable and non-interest bearing notes payable to the above institutions on demand.
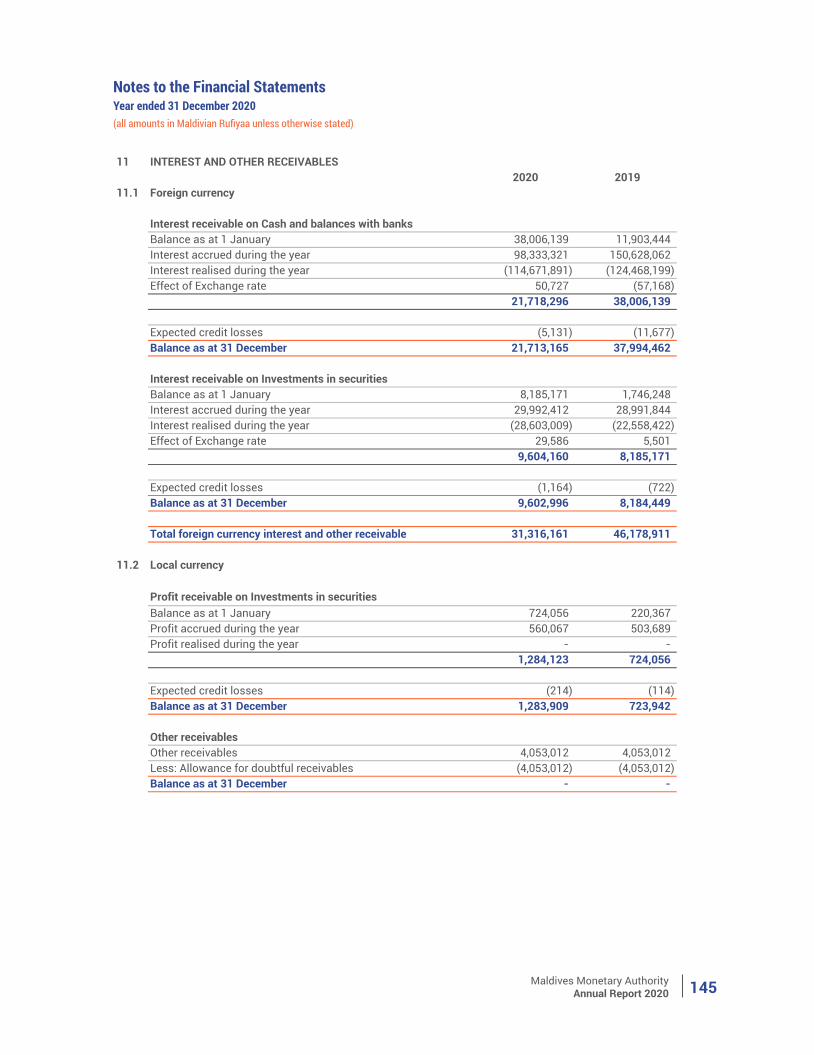
Maldives Monetary AuthorityAnnual Report 2020 145
(all amounts in Maldivian Rufiyaa unless otherwise stated)
Notes to the Financial StatementsYear ended 31 December 2020
11 INTEREST AND OTHER RECEIVABLES2020 2019
11.1 Foreign currency
Interest receivable on Cash and balances with banksBalance as at 1 January 38,006,139 11,903,444 Interest accrued during the year 98,333,321 150,628,062 Interest realised during the year (114,671,891) (124,468,199) Effect of Exchange rate 50,727 (57,168)
21,718,296 38,006,139
Expected credit losses (5,131) (11,677) Balance as at 31 December 21,713,165 37,994,462
Interest receivable on Investments in securitiesBalance as at 1 January 8,185,171 1,746,248 Interest accrued during the year 29,992,412 28,991,844 Interest realised during the year (28,603,009) (22,558,422) Effect of Exchange rate 29,586 5,501
9,604,160 8,185,171
Expected credit losses (1,164) (722) Balance as at 31 December 9,602,996 8,184,449
31,316,161 46,178,911
11.2 Local currency
Profit receivable on Investments in securitiesBalance as at 1 January 724,056 220,367 Profit accrued during the year 560,067 503,689 Profit realised during the year - -
1,284,123 724,056
Expected credit losses (214) (114) Balance as at 31 December 1,283,909 723,942
Other receivablesOther receivables 4,053,012 4,053,012 Less: Allowance for doubtful receivables (4,053,012) (4,053,012) Balance as at 31 December - -
Total foreign currency interest and other receivable
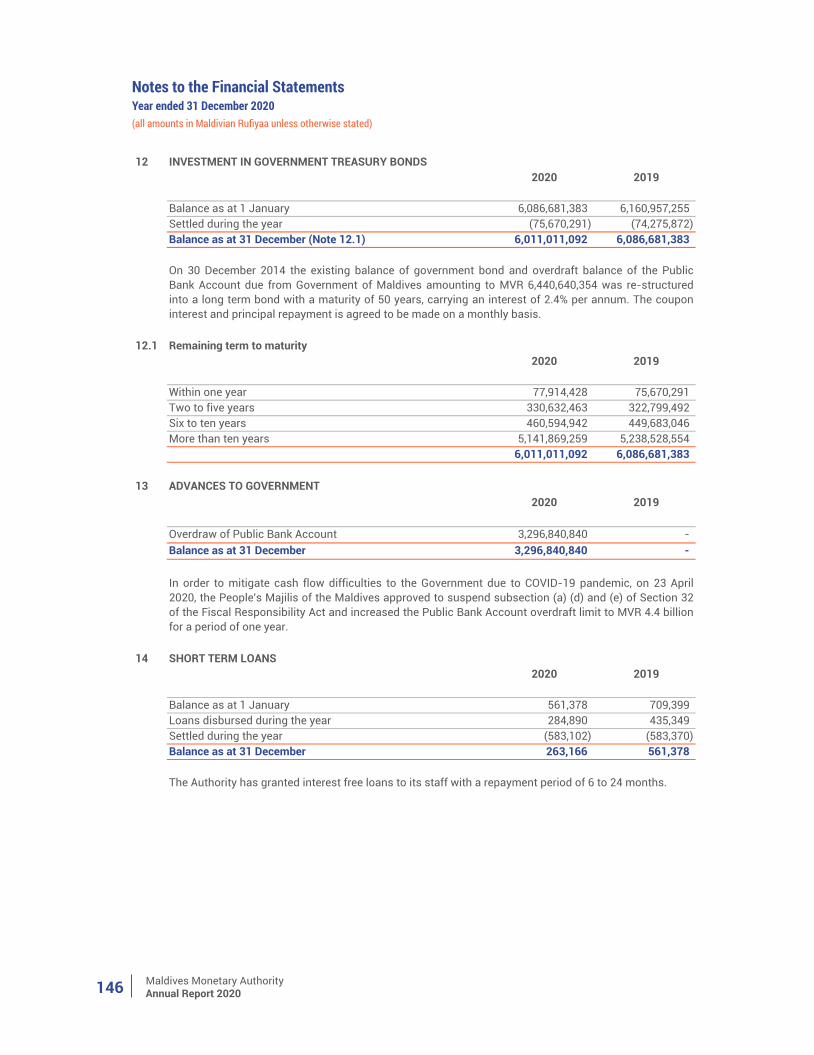
Maldives Monetary AuthorityAnnual Report 2020146
Notes to the Financial StatementsYear ended 31 December 2020(all amounts in Maldivian Rufiyaa unless otherwise stated)
12 INVESTMENT IN GOVERNMENT TREASURY BONDS2020 2019
Balance as at 1 January 6,086,681,383 6,160,957,255 Settled during the year (75,670,291) (74,275,872) Balance as at 31 December (Note 12.1) 6,011,011,092 6,086,681,383
12.1 Remaining term to maturity2020 2019
Within one year 77,914,428 75,670,291 Two to five years 330,632,463 322,799,492 Six to ten years 460,594,942 449,683,046 More than ten years 5,141,869,259 5,238,528,554
6,011,011,092 6,086,681,383
13 ADVANCES TO GOVERNMENT2020 2019
Overdraw of Public Bank Account 3,296,840,840 - Balance as at 31 December 3,296,840,840 -
14 SHORT TERM LOANS2020 2019
Balance as at 1 January 561,378 709,399 Loans disbursed during the year 284,890 435,349 Settled during the year (583,102) (583,370) Balance as at 31 December 263,166 561,378
On 30 December 2014 the existing balance of government bond and overdraft balance of the PublicBank Account due from Government of Maldives amounting to MVR 6,440,640,354 was re-structuredinto a long term bond with a maturity of 50 years, carrying an interest of 2.4% per annum. The couponinterest and principal repayment is agreed to be made on a monthly basis.
In order to mitigate cash flow difficulties to the Government due to COVID-19 pandemic, on 23 April2020, the People's Majilis of the Maldives approved to suspend subsection (a) (d) and (e) of Section 32of the Fiscal Responsibility Act and increased the Public Bank Account overdraft limit to MVR 4.4 billionfor a period of one year.
The Authority has granted interest free loans to its staff with a repayment period of 6 to 24 months.
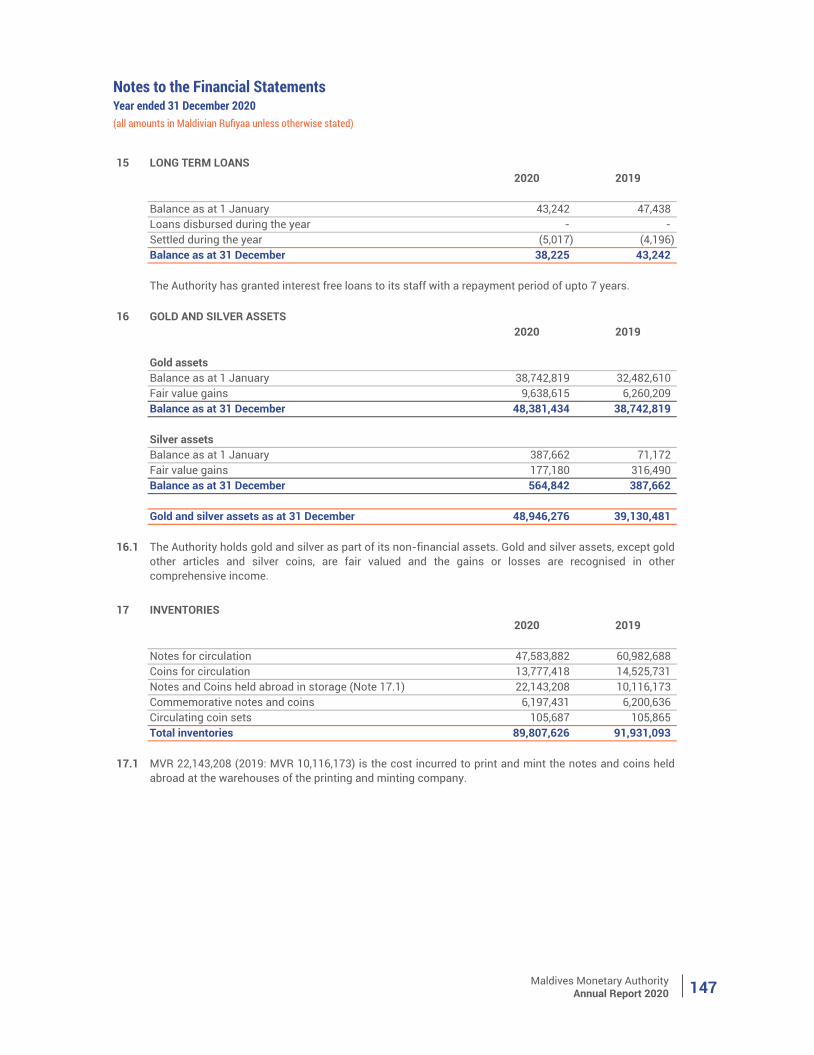
Maldives Monetary AuthorityAnnual Report 2020 147
15 LONG TERM LOANS2020 2019
Balance as at 1 January 43,242 47,438 Loans disbursed during the year - - Settled during the year (5,017) (4,196) Balance as at 31 December 38,225 43,242
16 GOLD AND SILVER ASSETS2020 2019
Gold assetsBalance as at 1 January 38,742,819 32,482,610 Fair value gains 9,638,615 6,260,209 Balance as at 31 December 48,381,434 38,742,819
Silver assetsBalance as at 1 January 387,662 71,172 Fair value gains 177,180 316,490 Balance as at 31 December 564,842 387,662
Gold and silver assets as at 31 December 48,946,276 39,130,481
16.1
17 INVENTORIES2020 2019
Notes for circulation 47,583,882 60,982,688 Coins for circulation 13,777,418 14,525,731 Notes and Coins held abroad in storage (Note 17.1) 22,143,208 10,116,173 Commemorative notes and coins 6,197,431 6,200,636 Circulating coin sets 105,687 105,865 Total inventories 89,807,626 91,931,093
17.1
The Authority has granted interest free loans to its staff with a repayment period of upto 7 years.
The Authority holds gold and silver as part of its non-financial assets. Gold and silver assets, except goldother articles and silver coins, are fair valued and the gains or losses are recognised in othercomprehensive income.
MVR 22,143,208 (2019: MVR 10,116,173) is the cost incurred to print and mint the notes and coins heldabroad at the warehouses of the printing and minting company.
(all amounts in Maldivian Rufiyaa unless otherwise stated)
Notes to the Financial StatementsYear ended 31 December 2020
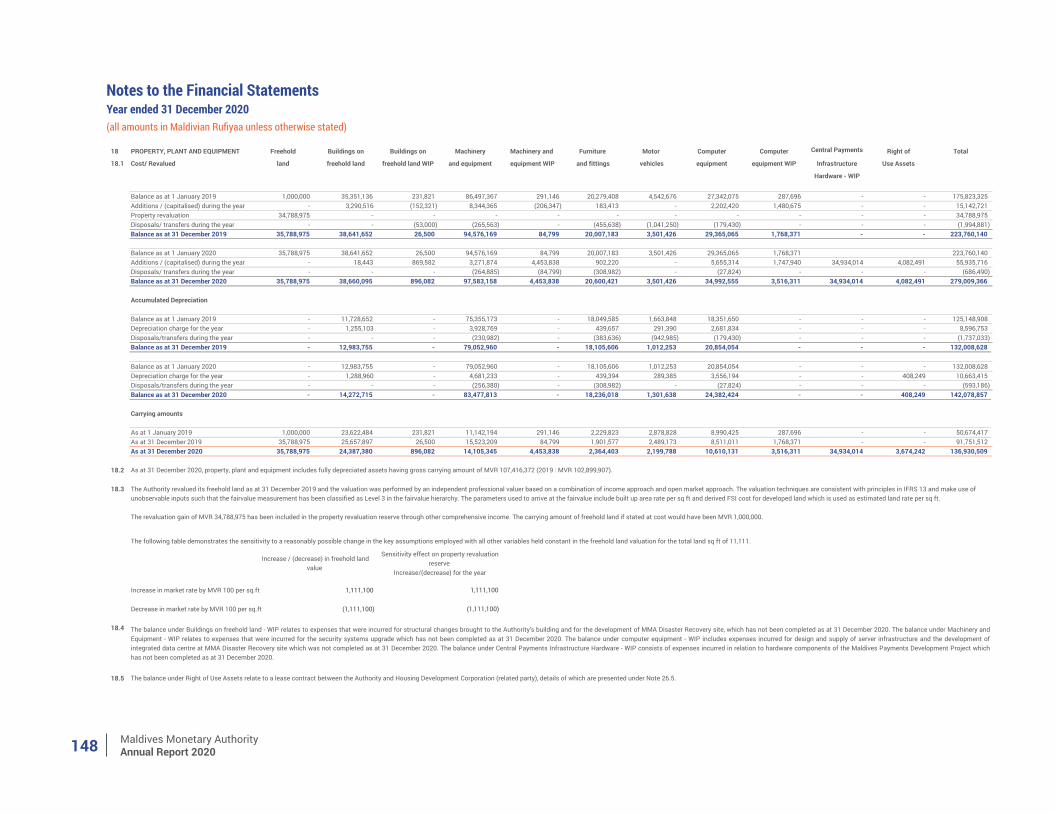
Maldives Monetary AuthorityAnnual Report 2020148
18 PROPERTY, PLANT AND EQUIPMENT Freehold Buildings on Buildings on Machinery Machinery and Furniture Motor Computer Computer Central Payments Right of Total
18.1 Cost/ Revalued land freehold land freehold land WIP and equipment equipment WIP and fittings vehicles equipment equipment WIP Infrastructure Use Assets
Hardware - WIP
Balance as at 1 January 2019 1,000,000 35,351,136 231,821 86,497,367 291,146 20,279,408 4,542,676 27,342,075 287,696 - - 175,823,325 Additions / (capitalised) during the year - 3,290,516 (152,321) 8,344,365 (206,347) 183,413 - 2,202,420 1,480,675 - - 15,142,721 Property revaluation 34,788,975 - - - - - - - - - - 34,788,975 Disposals/ transfers during the year - - (53,000) (265,563) - (455,638) (1,041,250) (179,430) - - - (1,994,881) Balance as at 31 December 2019 35,788,975 38,641,652 26,500 94,576,169 84,799 20,007,183 3,501,426 29,365,065 1,768,371 - - 223,760,140
Balance as at 1 January 2020 35,788,975 38,641,652 26,500 94,576,169 84,799 20,007,183 3,501,426 29,365,065 1,768,371 223,760,140 Additions / (capitalised) during the year - 18,443 869,582 3,271,874 4,453,838 902,220 - 5,655,314 1,747,940 34,934,014 4,082,491 55,935,716 Disposals/ transfers during the year - - - (264,885) (84,799) (308,982) - (27,824) - - - (686,490) Balance as at 31 December 2020 35,788,975 38,660,095 896,082 97,583,158 4,453,838 20,600,421 3,501,426 34,992,555 3,516,311 34,934,014 4,082,491 279,009,366
Accumulated Depreciation
Balance as at 1 January 2019 - 11,728,652 - 75,355,173 - 18,049,585 1,663,848 18,351,650 - - - 125,148,908 Depreciation charge for the year - 1,255,103 - 3,928,769 - 439,657 291,390 2,681,834 - - - 8,596,753 Disposals/transfers during the year - - - (230,982) - (383,636) (942,985) (179,430) - - - (1,737,033) Balance as at 31 December 2019 - 12,983,755 - 79,052,960 - 18,105,606 1,012,253 20,854,054 - - - 132,008,628
Balance as at 1 January 2020 - 12,983,755 - 79,052,960 - 18,105,606 1,012,253 20,854,054 - - - 132,008,628 Depreciation charge for the year - 1,288,960 - 4,681,233 - 439,394 289,385 3,556,194 - - 408,249 10,663,415 Disposals/transfers during the year - - - (256,380) - (308,982) - (27,824) - - - (593,186) Balance as at 31 December 2020 - 14,272,715 - 83,477,813 - 18,236,018 1,301,638 24,382,424 - - 408,249 142,078,857
Carrying amounts
As at 1 January 2019 1,000,000 23,622,484 231,821 11,142,194 291,146 2,229,823 2,878,828 8,990,425 287,696 - - 50,674,417 As at 31 December 2019 35,788,975 25,657,897 26,500 15,523,209 84,799 1,901,577 2,489,173 8,511,011 1,768,371 - - 91,751,512 As at 31 December 2020 35,788,975 24,387,380 896,082 14,105,345 4,453,838 2,364,403 2,199,788 10,610,131 3,516,311 34,934,014 3,674,242 136,930,509
18.2
18.3
Increase in market rate by MVR 100 per sq.ft 1,111,100
Decrease in market rate by MVR 100 per sq.ft (1,111,100)
18.4
18.5
The Authority revalued its freehold land as at 31 December 2019 and the valuation was performed by an independent professional valuer based on a combination of income approach and open market approach. The valuation techniques are consistent with principles in IFRS 13 and make use of unobservable inputs such that the fairvalue measurement has been classified as Level 3 in the fairvalue hierarchy. The parameters used to arrive at the fairvalue include built up area rate per sq ft and derived FSI cost for developed land which is used as estimated land rate per sq ft. The revaluation gain of MVR 34,788,975 has been included in the property revaluation reserve through other comprehensive income. The carrying amount of freehold land if stated at cost would have been MVR 1,000,000.
As at 31 December 2020, property, plant and equipment includes fully depreciated assets having gross carrying amount of MVR 107,416,372 (2019 : MVR 102,899,907).
The following table demonstrates the sensitivity to a reasonably possible change in the key assumptions employed with all other variables held constant in the freehold land valuation for the total land sq ft of 11,111.
Increase / (decrease) in freehold land value
Sensitivity effect on property revaluation reserve
Increase/(decrease) for the year
1,111,100
(1,111,100)
The balance under Buildings on freehold land - WIP relates to expenses that were incurred for structural changes brought to the Authority's building and for the development of MMA Disaster Recovery site, which has not been completed as at 31 December 2020. The balance under Machinery andEquipment - WIP relates to expenses that were incurred for the security systems upgrade which has not been completed as at 31 December 2020. The balance under computer equipment - WIP includes expenses incurred for design and supply of server infrastructure and the development ofintegrated data centre at MMA Disaster Recovery site which was not completed as at 31 December 2020. The balance under Central Payments Infrastructure Hardware - WIP consists of expenses incurred in relation to hardware components of the Maldives Payments Development Project whichhas not been completed as at 31 December 2020.
The balance under Right of Use Assets relate to a lease contract between the Authority and Housing Development Corporation (related party), details of which are presented under Note 26.5.
(all amounts in Maldivian Rufiyaa unless otherwise stated)
Notes to the Financial StatementsYear ended 31 December 2020
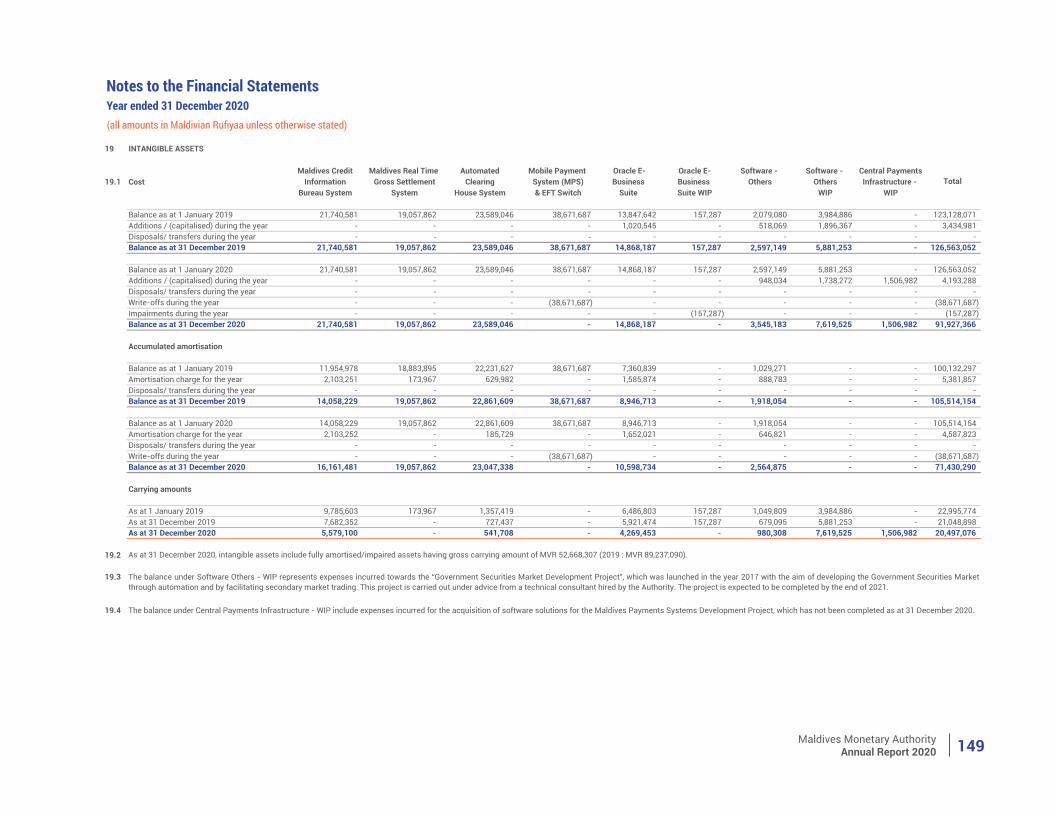
Maldives Monetary AuthorityAnnual Report 2020 149
Notes to the Financial StatementsYear ended 31 December 2020(all amounts in Maldivian Rufiyaa unless otherwise stated)
19 INTANGIBLE ASSETS
Maldives Credit Maldives Real Time Automated Mobile Payment Oracle E- Oracle E- Software - Software - Central Payments19.1 Cost Information Gross Settlement Clearing System (MPS) Business Business Others Others Infrastructure -
Bureau System System House System & EFT Switch Suite Suite WIP WIP WIP
Balance as at 1 January 2019 21,740,581 19,057,862 23,589,046 38,671,687 13,847,642 157,287 2,079,080 3,984,886 - 123,128,071 Additions / (capitalised) during the year - - - - 1,020,545 - 518,069 1,896,367 - 3,434,981 Disposals/ transfers during the year - - - - - - - - - - Balance as at 31 December 2019 21,740,581 19,057,862 23,589,046 38,671,687 14,868,187 157,287 2,597,149 5,881,253 - 126,563,052
Balance as at 1 January 2020 21,740,581 19,057,862 23,589,046 38,671,687 14,868,187 157,287 2,597,149 5,881,253 - 126,563,052 Additions / (capitalised) during the year - - - - - - 948,034 1,738,272 1,506,982 4,193,288 Disposals/ transfers during the year - - - - - - - - - - Write-offs during the year - - - (38,671,687) - - - - - (38,671,687) Impairments during the year - - - - - (157,287) - - - (157,287) Balance as at 31 December 2020 21,740,581 19,057,862 23,589,046 - 14,868,187 - 3,545,183 7,619,525 1,506,982 91,927,366
Accumulated amortisation
Balance as at 1 January 2019 11,954,978 18,883,895 22,231,627 38,671,687 7,360,839 - 1,029,271 - - 100,132,297 Amortisation charge for the year 2,103,251 173,967 629,982 - 1,585,874 - 888,783 - - 5,381,857 Disposals/ transfers during the year - - - - - - - - - - Balance as at 31 December 2019 14,058,229 19,057,862 22,861,609 38,671,687 8,946,713 - 1,918,054 - - 105,514,154
Balance as at 1 January 2020 14,058,229 19,057,862 22,861,609 38,671,687 8,946,713 - 1,918,054 - - 105,514,154 Amortisation charge for the year 2,103,252 - 185,729 - 1,652,021 - 646,821 - - 4,587,823 Disposals/ transfers during the year - - - - - - - - - - Write-offs during the year - - - (38,671,687) - - - - - (38,671,687) Balance as at 31 December 2020 16,161,481 19,057,862 23,047,338 - 10,598,734 - 2,564,875 - - 71,430,290
Carrying amounts
As at 1 January 2019 9,785,603 173,967 1,357,419 - 6,486,803 157,287 1,049,809 3,984,886 - 22,995,774 As at 31 December 2019 7,682,352 - 727,437 - 5,921,474 157,287 679,095 5,881,253 - 21,048,898 As at 31 December 2020 5,579,100 - 541,708 - 4,269,453 - 980,308 7,619,525 1,506,982 20,497,076
19.2
19.3
19.4
Total
As at 31 December 2020, intangible assets include fully amortised/impaired assets having gross carrying amount of MVR 52,668,307 (2019 : MVR 89,237,090).
The balance under Software Others - WIP represents expenses incurred towards the “Government Securities Market Development Project”, which was launched in the year 2017 with the aim of developing the Government Securities Marketthrough automation and by facilitating secondary market trading. This project is carried out under advice from a technical consultant hired by the Authority. The project is expected to be completed by the end of 2021.
The balance under Central Payments Infrastructure - WIP include expenses incurred for the acquisition of software solutions for the Maldives Payments Systems Development Project, which has not been completed as at 31 December 2020.
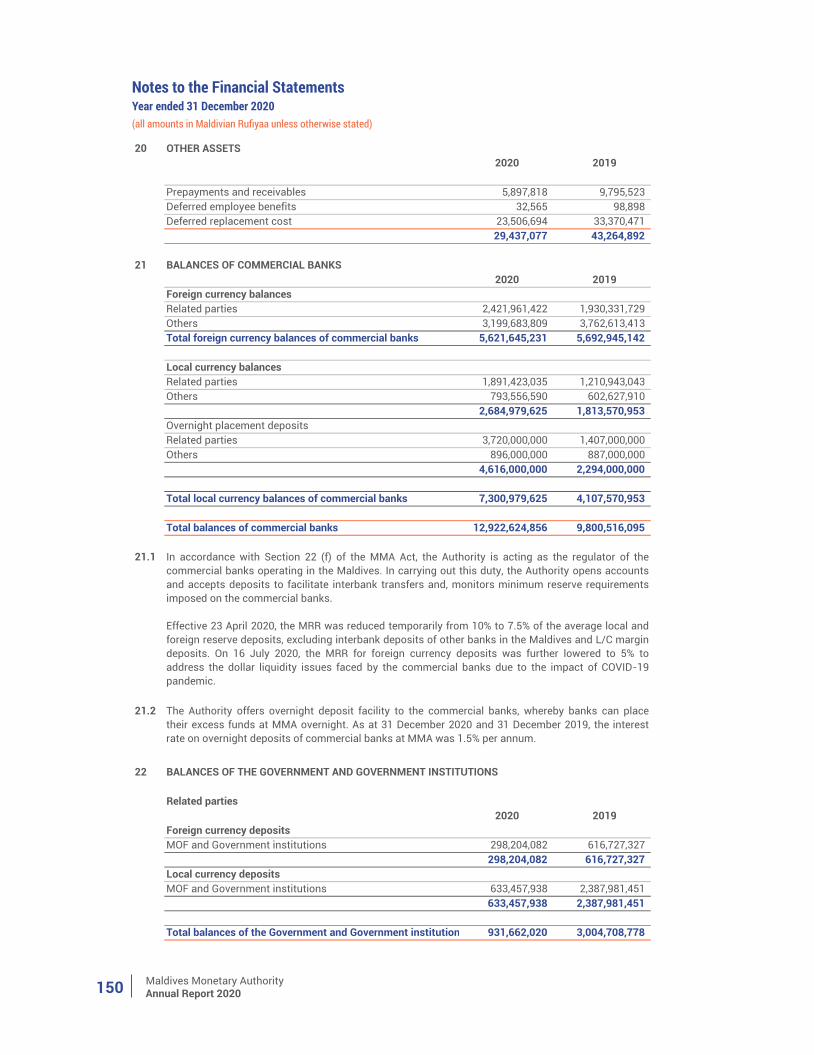
Maldives Monetary AuthorityAnnual Report 2020150
20 OTHER ASSETS2020 2019
Prepayments and receivables 5,897,818 9,795,523 Deferred employee benefits 32,565 98,898 Deferred replacement cost 23,506,694 33,370,471
29,437,077 43,264,892
21 BALANCES OF COMMERCIAL BANKS2020 2019
Foreign currency balancesRelated parties 2,421,961,422 1,930,331,729 Others 3,199,683,809 3,762,613,413 Total foreign currency balances of commercial banks 5,621,645,231 5,692,945,142
Local currency balancesRelated parties 1,891,423,035 1,210,943,043 Others 793,556,590 602,627,910
2,684,979,625 1,813,570,953 Overnight placement depositsRelated parties 3,720,000,000 1,407,000,000 Others 896,000,000 887,000,000
4,616,000,000 2,294,000,000
Total local currency balances of commercial banks 7,300,979,625 4,107,570,953
Total balances of commercial banks 12,922,624,856 9,800,516,095
21.1
21.2
22 BALANCES OF THE GOVERNMENT AND GOVERNMENT INSTITUTIONS
Related parties2020 2019
Foreign currency depositsMOF and Government institutions 298,204,082 616,727,327
298,204,082 616,727,327 Local currency depositsMOF and Government institutions 633,457,938 2,387,981,451
633,457,938 2,387,981,451
Total balances of the Government and Government institution 931,662,020 3,004,708,778
In accordance with Section 22 (f) of the MMA Act, the Authority is acting as the regulator of thecommercial banks operating in the Maldives. In carrying out this duty, the Authority opens accountsand accepts deposits to facilitate interbank transfers and, monitors minimum reserve requirementsimposed on the commercial banks.
Effective 23 April 2020, the MRR was reduced temporarily from 10% to 7.5% of the average local andforeign reserve deposits, excluding interbank deposits of other banks in the Maldives and L/C margindeposits. On 16 July 2020, the MRR for foreign currency deposits was further lowered to 5% toaddress the dollar liquidity issues faced by the commercial banks due to the impact of COVID-19pandemic.
The Authority offers overnight deposit facility to the commercial banks, whereby banks can placetheir excess funds at MMA overnight. As at 31 December 2020 and 31 December 2019, the interestrate on overnight deposits of commercial banks at MMA was 1.5% per annum.
(all amounts in Maldivian Rufiyaa unless otherwise stated)
Notes to the Financial StatementsYear ended 31 December 2020
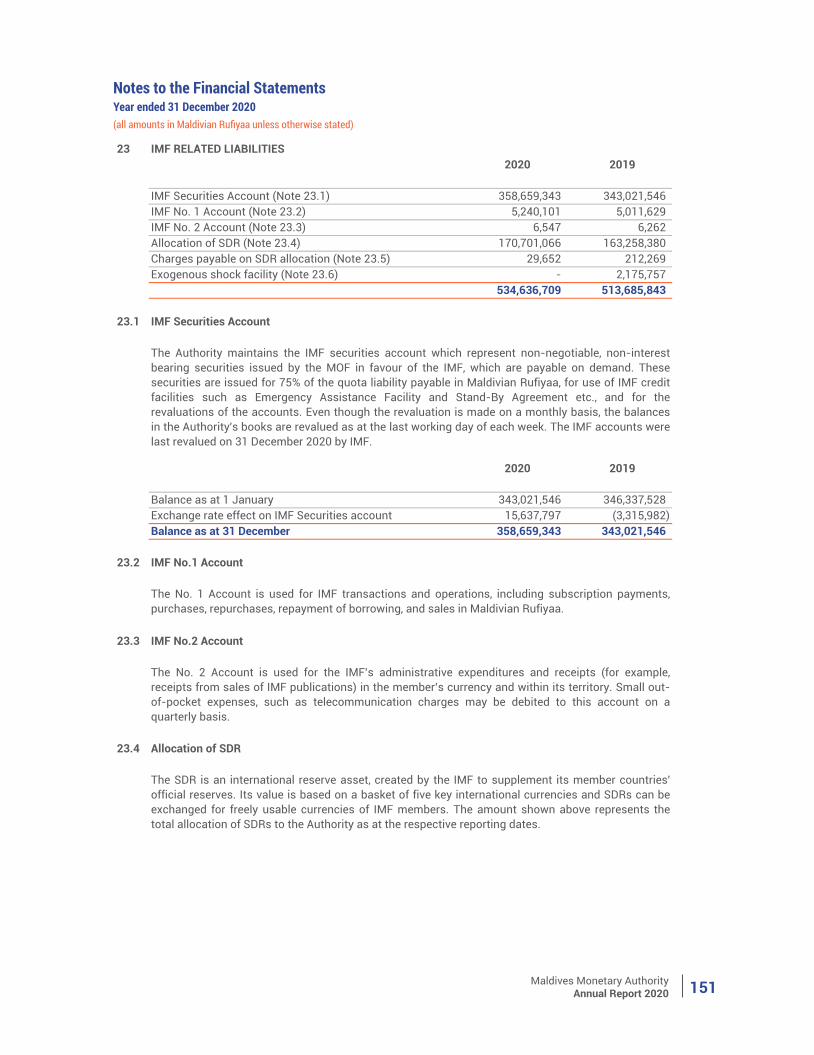
Maldives Monetary AuthorityAnnual Report 2020 151
(all amounts in Maldivian Rufiyaa unless otherwise stated)
Notes to the Financial StatementsYear ended 31 December 2020
23 IMF RELATED LIABILITIES2020 2019
IMF Securities Account (Note 23.1) 358,659,343 343,021,546 IMF No. 1 Account (Note 23.2) 5,240,101 5,011,629 IMF No. 2 Account (Note 23.3) 6,547 6,262 Allocation of SDR (Note 23.4) 170,701,066 163,258,380 Charges payable on SDR allocation (Note 23.5) 29,652 212,269 Exogenous shock facility (Note 23.6) - 2,175,757
534,636,709 513,685,843
23.1 IMF Securities Account
2020 2019
Balance as at 1 January 343,021,546 346,337,528 Exchange rate effect on IMF Securities account 15,637,797 (3,315,982) Balance as at 31 December 358,659,343 343,021,546
23.2 IMF No.1 Account
23.3 IMF No.2 Account
23.4 Allocation of SDR
The Authority maintains the IMF securities account which represent non-negotiable, non-interestbearing securities issued by the MOF in favour of the IMF, which are payable on demand. Thesesecurities are issued for 75% of the quota liability payable in Maldivian Rufiyaa, for use of IMF creditfacilities such as Emergency Assistance Facility and Stand-By Agreement etc., and for therevaluations of the accounts. Even though the revaluation is made on a monthly basis, the balancesin the Authority's books are revalued as at the last working day of each week. The IMF accounts werelast revalued on 31 December 2020 by IMF.
The No. 1 Account is used for IMF transactions and operations, including subscription payments,purchases, repurchases, repayment of borrowing, and sales in Maldivian Rufiyaa.
The No. 2 Account is used for the IMF’s administrative expenditures and receipts (for example,receipts from sales of IMF publications) in the member’s currency and within its territory. Small out-of-pocket expenses, such as telecommunication charges may be debited to this account on aquarterly basis.
The SDR is an international reserve asset, created by the IMF to supplement its member countries'official reserves. Its value is based on a basket of five key international currencies and SDRs can beexchanged for freely usable currencies of IMF members. The amount shown above represents thetotal allocation of SDRs to the Authority as at the respective reporting dates.
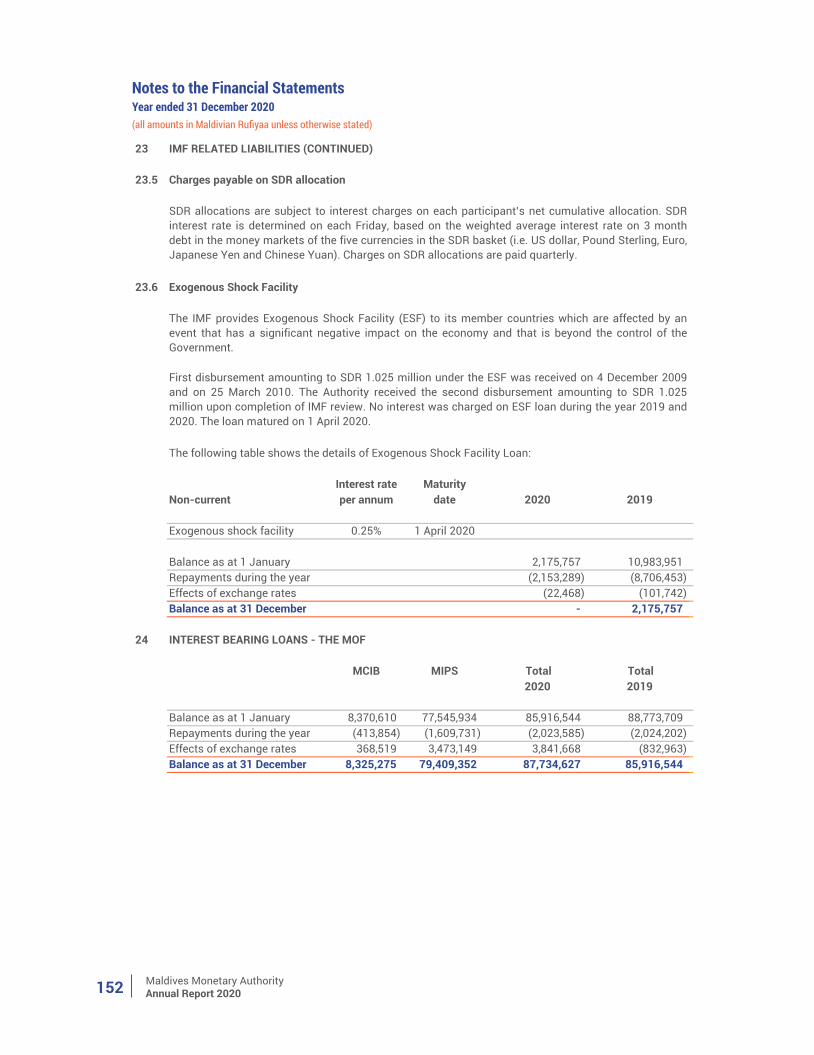
Maldives Monetary AuthorityAnnual Report 2020152
Notes to the Financial StatementsYear ended 31 December 2020(all amounts in Maldivian Rufiyaa unless otherwise stated)
23 IMF RELATED LIABILITIES (CONTINUED)
23.5 Charges payable on SDR allocation
23.6 Exogenous Shock Facility
Interest rate MaturityNon-current per annum date 2020 2019
Exogenous shock facility 0.25% 1 April 2020
Balance as at 1 January 2,175,757 10,983,951 Repayments during the year (2,153,289) (8,706,453) Effects of exchange rates (22,468) (101,742) Balance as at 31 December - 2,175,757
24 INTEREST BEARING LOANS - THE MOF
MCIB MIPS Total Total 2020 2019
Balance as at 1 January 8,370,610 77,545,934 85,916,544 88,773,709 Repayments during the year (413,854) (1,609,731) (2,023,585) (2,024,202) Effects of exchange rates 368,519 3,473,149 3,841,668 (832,963) Balance as at 31 December 8,325,275 79,409,352 87,734,627 85,916,544
First disbursement amounting to SDR 1.025 million under the ESF was received on 4 December 2009and on 25 March 2010. The Authority received the second disbursement amounting to SDR 1.025million upon completion of IMF review. No interest was charged on ESF loan during the year 2019 and2020. The loan matured on 1 April 2020.
The IMF provides Exogenous Shock Facility (ESF) to its member countries which are affected by anevent that has a significant negative impact on the economy and that is beyond the control of theGovernment.
The following table shows the details of Exogenous Shock Facility Loan:
SDR allocations are subject to interest charges on each participant’s net cumulative allocation. SDRinterest rate is determined on each Friday, based on the weighted average interest rate on 3 monthdebt in the money markets of the five currencies in the SDR basket (i.e. US dollar, Pound Sterling, Euro,Japanese Yen and Chinese Yuan). Charges on SDR allocations are paid quarterly.
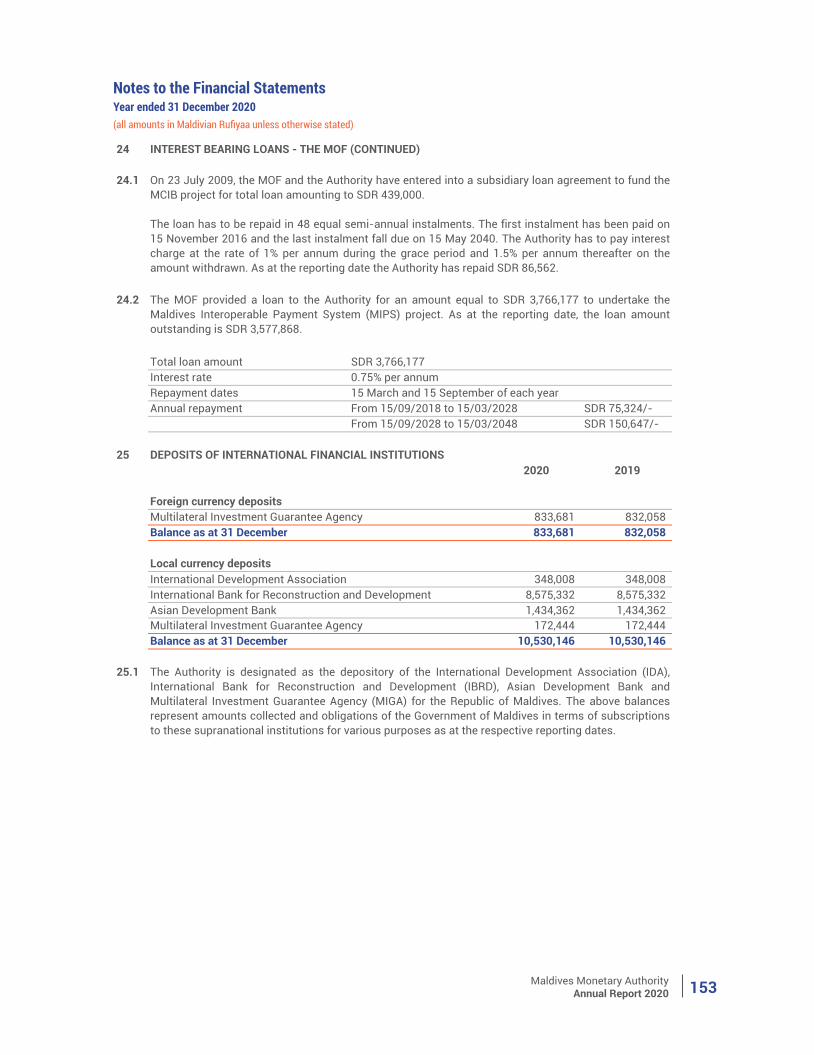
Maldives Monetary AuthorityAnnual Report 2020 153
(all amounts in Maldivian Rufiyaa unless otherwise stated)
Notes to the Financial StatementsYear ended 31 December 2020
24 INTEREST BEARING LOANS - THE MOF (CONTINUED)
24.1
24.2
Total loan amount SDR 3,766,177Interest rate 0.75% per annumRepayment dates 15 March and 15 September of each yearAnnual repayment From 15/09/2018 to 15/03/2028 SDR 75,324/-
From 15/09/2028 to 15/03/2048 SDR 150,647/-
252020 2019
Foreign currency depositsMultilateral Investment Guarantee Agency 833,681 832,058 Balance as at 31 December 833,681 832,058
Local currency depositsInternational Development Association 348,008 348,008 International Bank for Reconstruction and Development 8,575,332 8,575,332 Asian Development Bank 1,434,362 1,434,362 Multilateral Investment Guarantee Agency 172,444 172,444 Balance as at 31 December 10,530,146 10,530,146
25.1
The MOF provided a loan to the Authority for an amount equal to SDR 3,766,177 to undertake theMaldives Interoperable Payment System (MIPS) project. As at the reporting date, the loan amountoutstanding is SDR 3,577,868.
On 23 July 2009, the MOF and the Authority have entered into a subsidiary loan agreement to fund theMCIB project for total loan amounting to SDR 439,000.
The loan has to be repaid in 48 equal semi-annual instalments. The first instalment has been paid on15 November 2016 and the last instalment fall due on 15 May 2040. The Authority has to pay interestcharge at the rate of 1% per annum during the grace period and 1.5% per annum thereafter on theamount withdrawn. As at the reporting date the Authority has repaid SDR 86,562.
DEPOSITS OF INTERNATIONAL FINANCIAL INSTITUTIONS
The Authority is designated as the depository of the International Development Association (IDA),International Bank for Reconstruction and Development (IBRD), Asian Development Bank andMultilateral Investment Guarantee Agency (MIGA) for the Republic of Maldives. The above balancesrepresent amounts collected and obligations of the Government of Maldives in terms of subscriptionsto these supranational institutions for various purposes as at the respective reporting dates.
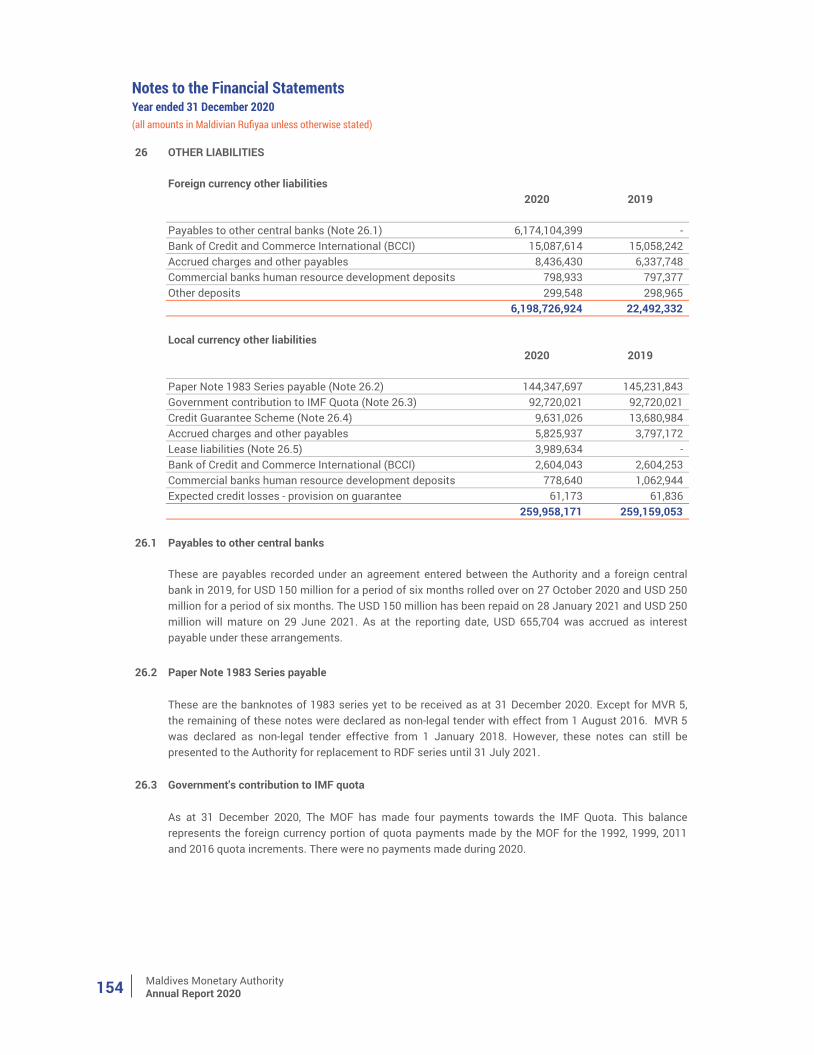
Maldives Monetary AuthorityAnnual Report 2020154
Notes to the Financial StatementsYear ended 31 December 2020(all amounts in Maldivian Rufiyaa unless otherwise stated)
26 OTHER LIABILITIES
Foreign currency other liabilities2020 2019
Payables to other central banks (Note 26.1) 6,174,104,399 - Bank of Credit and Commerce International (BCCI) 15,087,614 15,058,242 Accrued charges and other payables 8,436,430 6,337,748 Commercial banks human resource development deposits 798,933 797,377 Other deposits 299,548 298,965
6,198,726,924 22,492,332
Local currency other liabilities2020 2019
Paper Note 1983 Series payable (Note 26.2) 144,347,697 145,231,843 Government contribution to IMF Quota (Note 26.3) 92,720,021 92,720,021 Credit Guarantee Scheme (Note 26.4) 9,631,026 13,680,984 Accrued charges and other payables 5,825,937 3,797,172 Lease liabilities (Note 26.5) 3,989,634 - Bank of Credit and Commerce International (BCCI) 2,604,043 2,604,253 Commercial banks human resource development deposits 778,640 1,062,944 Expected credit losses - provision on guarantee 61,173 61,836
259,958,171 259,159,053
26.1 Payables to other central banks
26.2 Paper Note 1983 Series payable
26.3 Government's contribution to IMF quota
These are payables recorded under an agreement entered between the Authority and a foreign centralbank in 2019, for USD 150 million for a period of six months rolled over on 27 October 2020 and USD 250million for a period of six months. The USD 150 million has been repaid on 28 January 2021 and USD 250million will mature on 29 June 2021. As at the reporting date, USD 655,704 was accrued as interestpayable under these arrangements.
As at 31 December 2020, The MOF has made four payments towards the IMF Quota. This balancerepresents the foreign currency portion of quota payments made by the MOF for the 1992, 1999, 2011and 2016 quota increments. There were no payments made during 2020.
These are the banknotes of 1983 series yet to be received as at 31 December 2020. Except for MVR 5,the remaining of these notes were declared as non-legal tender with effect from 1 August 2016. MVR 5was declared as non-legal tender effective from 1 January 2018. However, these notes can still bepresented to the Authority for replacement to RDF series until 31 July 2021.
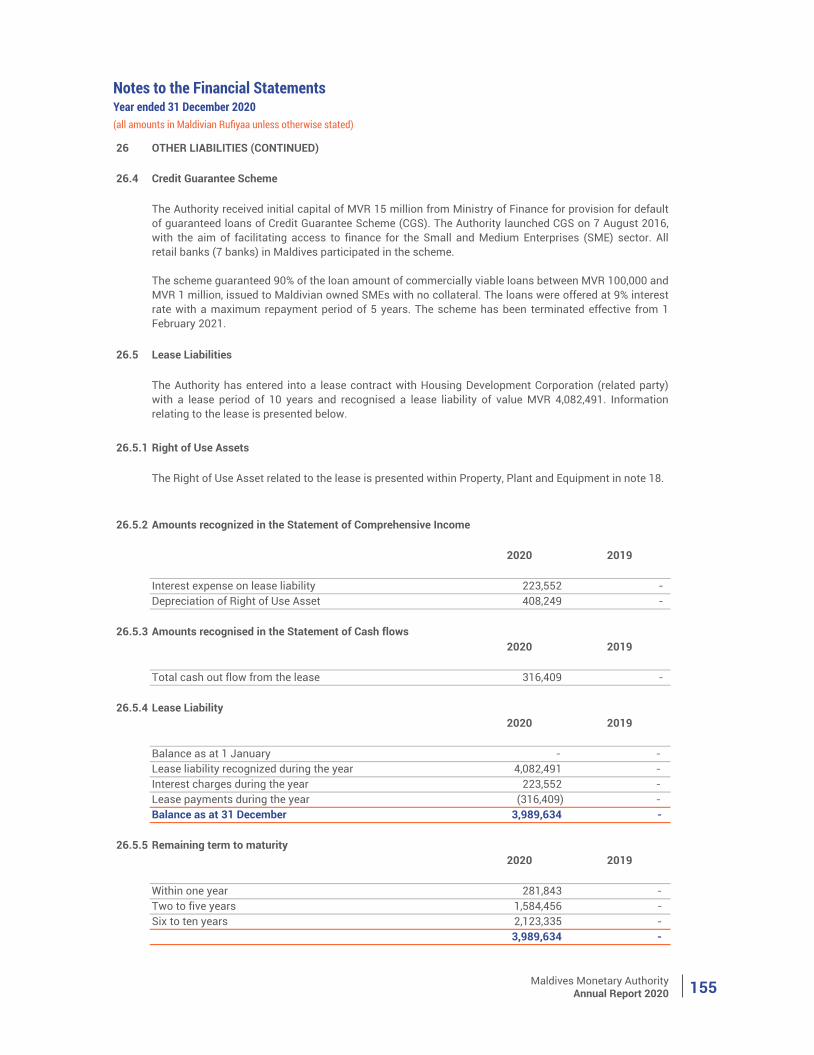
Maldives Monetary AuthorityAnnual Report 2020 155
(all amounts in Maldivian Rufiyaa unless otherwise stated)
Notes to the Financial StatementsYear ended 31 December 2020
26 OTHER LIABILITIES (CONTINUED)
26.4 Credit Guarantee Scheme
26.5 Lease Liabilities
26.5.1 Right of Use Assets
26.5.2 Amounts recognized in the Statement of Comprehensive Income
2020 2019
Interest expense on lease liability 223,552 - Depreciation of Right of Use Asset 408,249 -
26.5.3 Amounts recognised in the Statement of Cash flows2020 2019
Total cash out flow from the lease 316,409 -
26.5.4 Lease Liability2020 2019
Balance as at 1 January - - Lease liability recognized during the year 4,082,491 - Interest charges during the year 223,552 - Lease payments during the year (316,409) - Balance as at 31 December 3,989,634 -
26.5.5 Remaining term to maturity2020 2019
Within one year 281,843 - Two to five years 1,584,456 - Six to ten years 2,123,335 -
3,989,634 -
The Authority received initial capital of MVR 15 million from Ministry of Finance for provision for defaultof guaranteed loans of Credit Guarantee Scheme (CGS). The Authority launched CGS on 7 August 2016,with the aim of facilitating access to finance for the Small and Medium Enterprises (SME) sector. Allretail banks (7 banks) in Maldives participated in the scheme.
The scheme guaranteed 90% of the loan amount of commercially viable loans between MVR 100,000 andMVR 1 million, issued to Maldivian owned SMEs with no collateral. The loans were offered at 9% interestrate with a maximum repayment period of 5 years. The scheme has been terminated effective from 1February 2021.
The Authority has entered into a lease contract with Housing Development Corporation (related party)with a lease period of 10 years and recognised a lease liability of value MVR 4,082,491. Informationrelating to the lease is presented below.
The Right of Use Asset related to the lease is presented within Property, Plant and Equipment in note 18.
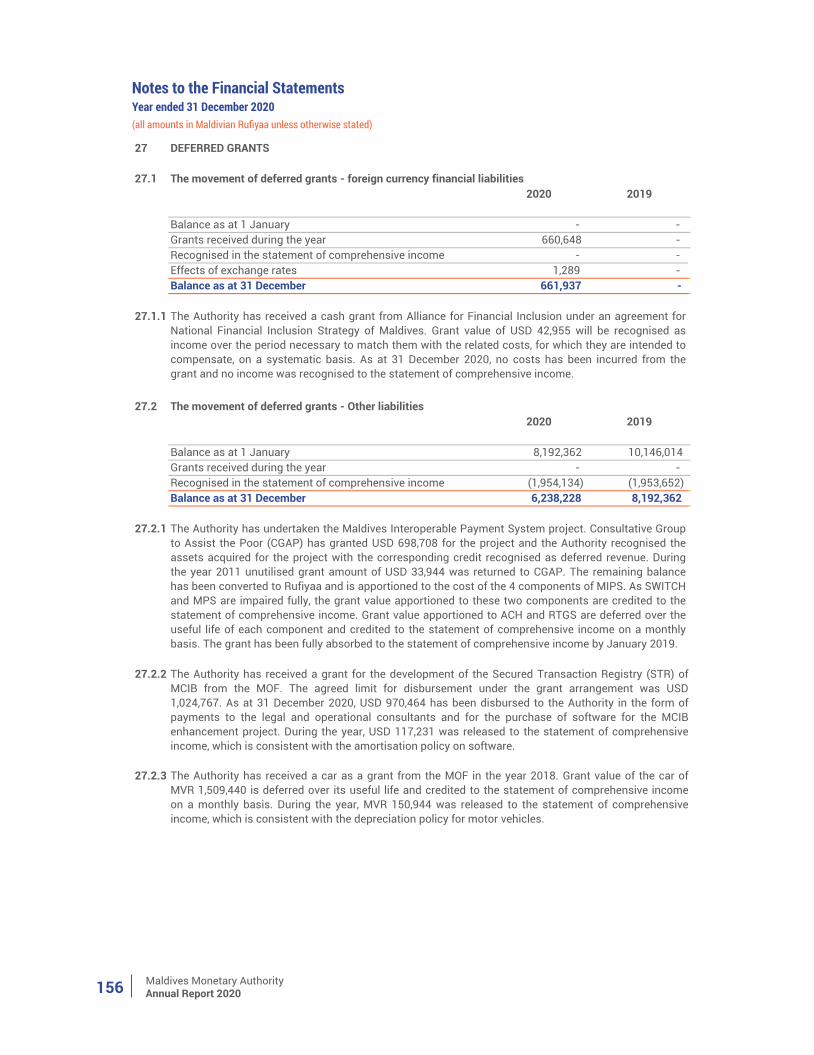
Maldives Monetary AuthorityAnnual Report 2020156
Notes to the Financial StatementsYear ended 31 December 2020(all amounts in Maldivian Rufiyaa unless otherwise stated)
27 DEFERRED GRANTS
27.1 The movement of deferred grants - foreign currency financial liabilities2020 2019
Balance as at 1 January - - Grants received during the year 660,648 - Recognised in the statement of comprehensive income - - Effects of exchange rates 1,289 - Balance as at 31 December 661,937 -
27.1.1
27.2 The movement of deferred grants - Other liabilities2020 2019
Balance as at 1 January 8,192,362 10,146,014 Grants received during the year - - Recognised in the statement of comprehensive income (1,954,134) (1,953,652)Balance as at 31 December 6,238,228 8,192,362
27.2.1
27.2.2
27.2.3 The Authority has received a car as a grant from the MOF in the year 2018. Grant value of the car ofMVR 1,509,440 is deferred over its useful life and credited to the statement of comprehensive incomeon a monthly basis. During the year, MVR 150,944 was released to the statement of comprehensiveincome, which is consistent with the depreciation policy for motor vehicles.
The Authority has received a cash grant from Alliance for Financial Inclusion under an agreement forNational Financial Inclusion Strategy of Maldives. Grant value of USD 42,955 will be recognised asincome over the period necessary to match them with the related costs, for which they are intended tocompensate, on a systematic basis. As at 31 December 2020, no costs has been incurred from thegrant and no income was recognised to the statement of comprehensive income.
The Authority has undertaken the Maldives Interoperable Payment System project. Consultative Groupto Assist the Poor (CGAP) has granted USD 698,708 for the project and the Authority recognised theassets acquired for the project with the corresponding credit recognised as deferred revenue. Duringthe year 2011 unutilised grant amount of USD 33,944 was returned to CGAP. The remaining balancehas been converted to Rufiyaa and is apportioned to the cost of the 4 components of MIPS. As SWITCHand MPS are impaired fully, the grant value apportioned to these two components are credited to thestatement of comprehensive income. Grant value apportioned to ACH and RTGS are deferred over theuseful life of each component and credited to the statement of comprehensive income on a monthlybasis. The grant has been fully absorbed to the statement of comprehensive income by January 2019.
The Authority has received a grant for the development of the Secured Transaction Registry (STR) ofMCIB from the MOF. The agreed limit for disbursement under the grant arrangement was USD1,024,767. As at 31 December 2020, USD 970,464 has been disbursed to the Authority in the form ofpayments to the legal and operational consultants and for the purchase of software for the MCIBenhancement project. During the year, USD 117,231 was released to the statement of comprehensiveincome, which is consistent with the amortisation policy on software.
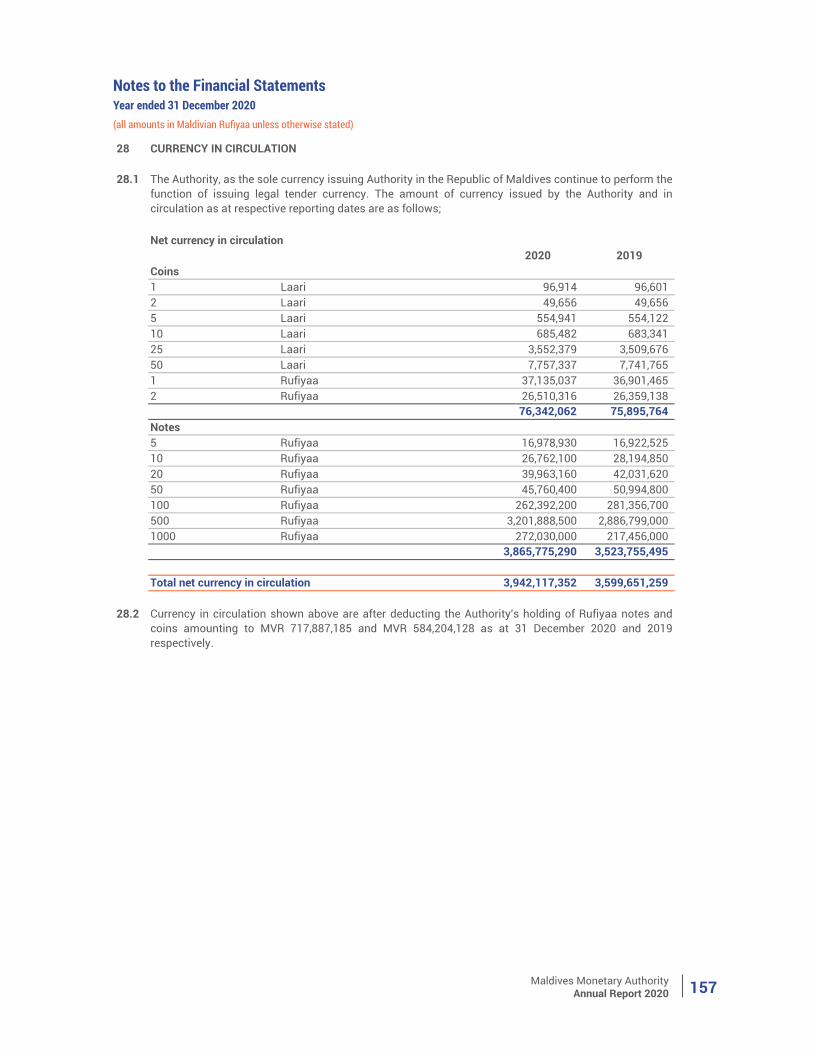
Maldives Monetary AuthorityAnnual Report 2020 157
Notes to the Financial StatementsYear ended 31 December 2020(all amounts in Maldivian Rufiyaa unless otherwise stated)
28 CURRENCY IN CIRCULATION
28.1
Net currency in circulation2020 2019
Coins1 Laari 96,914 96,601 2 Laari 49,656 49,656 5 Laari 554,941 554,122 10 Laari 685,482 683,341 25 Laari 3,552,379 3,509,676 50 Laari 7,757,337 7,741,765 1 Rufiyaa 37,135,037 36,901,465 2 Rufiyaa 26,510,316 26,359,138
76,342,062 75,895,764 Notes5 Rufiyaa 16,978,930 16,922,525 10 Rufiyaa 26,762,100 28,194,850 20 Rufiyaa 39,963,160 42,031,620 50 Rufiyaa 45,760,400 50,994,800 100 Rufiyaa 262,392,200 281,356,700 500 Rufiyaa 3,201,888,500 2,886,799,000 1000 Rufiyaa 272,030,000 217,456,000
3,865,775,290 3,523,755,495
Total net currency in circulation 3,942,117,352 3,599,651,259
28.2
The Authority, as the sole currency issuing Authority in the Republic of Maldives continue to perform the function of issuing legal tender currency. The amount of currency issued by the Authority and incirculation as at respective reporting dates are as follows;
Currency in circulation shown above are after deducting the Authority's holding of Rufiyaa notes andcoins amounting to MVR 717,887,185 and MVR 584,204,128 as at 31 December 2020 and 2019respectively.
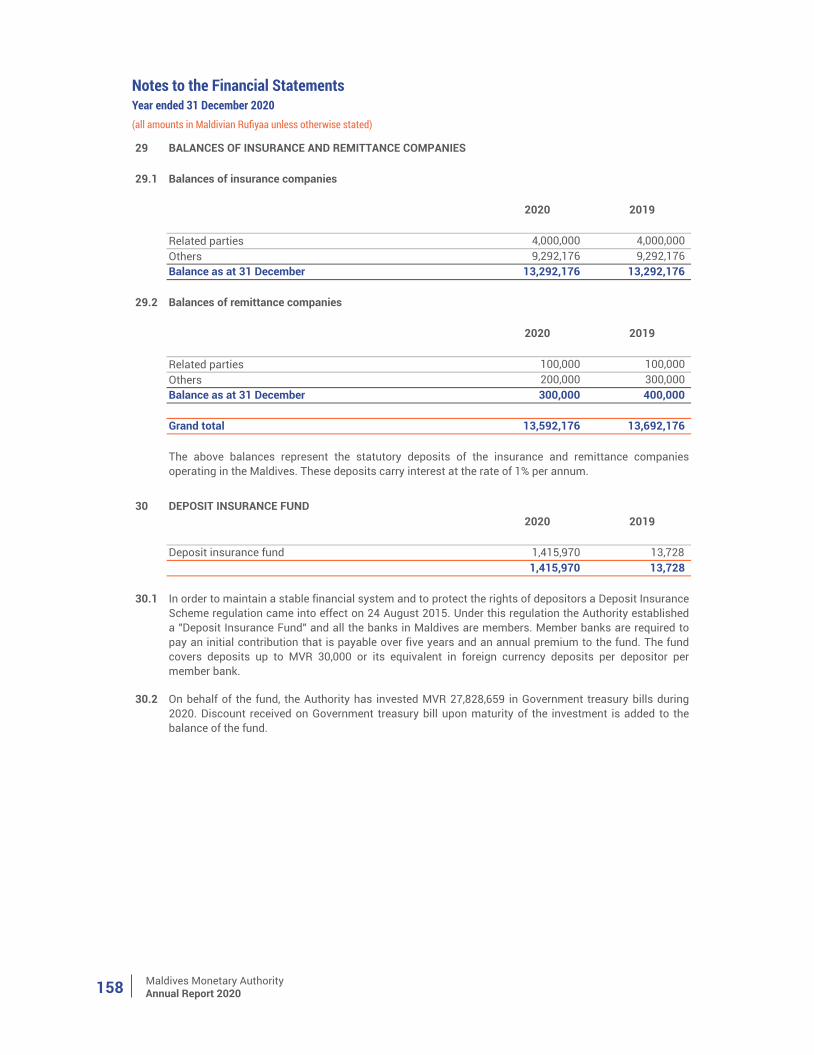
Maldives Monetary AuthorityAnnual Report 2020158
Notes to the Financial StatementsYear ended 31 December 2020(all amounts in Maldivian Rufiyaa unless otherwise stated)
29 BALANCES OF INSURANCE AND REMITTANCE COMPANIES
29.1 Balances of insurance companies
2020 2019
Related parties 4,000,000 4,000,000 Others 9,292,176 9,292,176 Balance as at 31 December 13,292,176 13,292,176
29.2 Balances of remittance companies
2020 2019
Related parties 100,000 100,000 Others 200,000 300,000 Balance as at 31 December 300,000 400,000
Grand total 13,592,176 13,692,176
302020 2019
Deposit insurance fund 1,415,970 13,728 1,415,970 13,728
30.1
30.2
The above balances represent the statutory deposits of the insurance and remittance companiesoperating in the Maldives. These deposits carry interest at the rate of 1% per annum.
DEPOSIT INSURANCE FUND
In order to maintain a stable financial system and to protect the rights of depositors a Deposit InsuranceScheme regulation came into effect on 24 August 2015. Under this regulation the Authority establisheda "Deposit Insurance Fund" and all the banks in Maldives are members. Member banks are required topay an initial contribution that is payable over five years and an annual premium to the fund. The fundcovers deposits up to MVR 30,000 or its equivalent in foreign currency deposits per depositor permember bank.
On behalf of the fund, the Authority has invested MVR 27,828,659 in Government treasury bills during2020. Discount received on Government treasury bill upon maturity of the investment is added to thebalance of the fund.
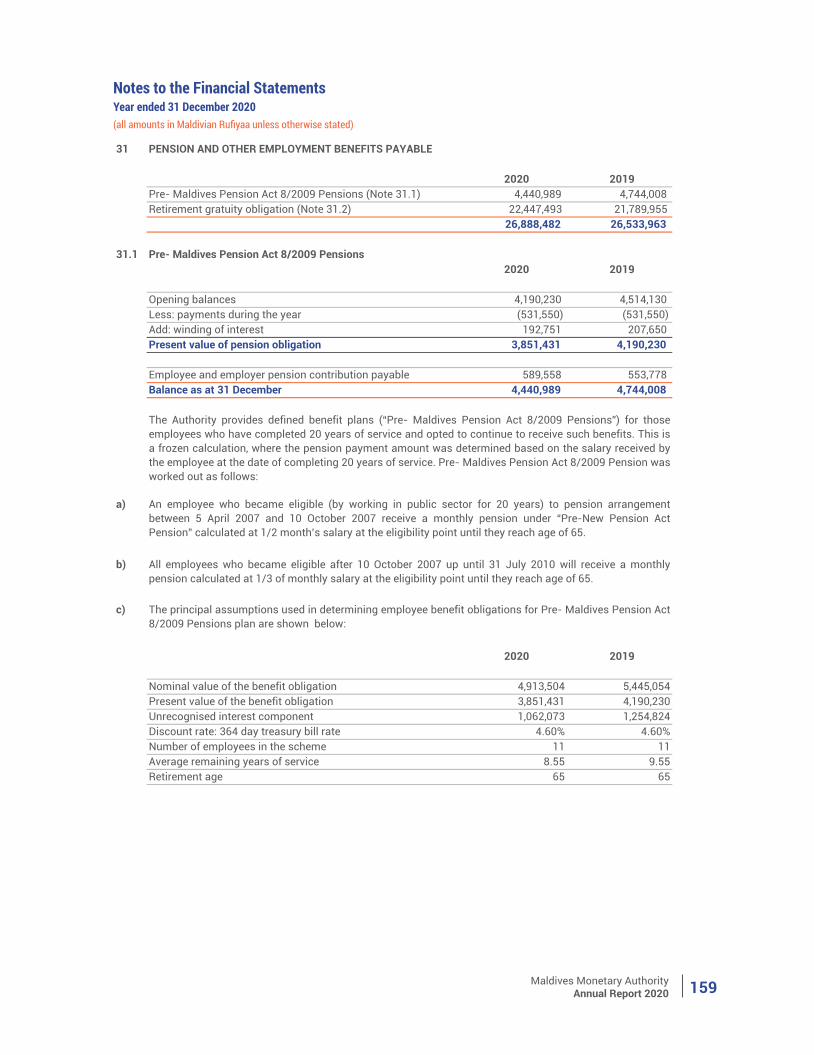
Maldives Monetary AuthorityAnnual Report 2020 159
(all amounts in Maldivian Rufiyaa unless otherwise stated)
Notes to the Financial StatementsYear ended 31 December 2020
31 PENSION AND OTHER EMPLOYMENT BENEFITS PAYABLE
2020 2019Pre- Maldives Pension Act 8/2009 Pensions (Note 31.1) 4,440,989 4,744,008 Retirement gratuity obligation (Note 31.2) 22,447,493 21,789,955
26,888,482 26,533,963
31.1 Pre- Maldives Pension Act 8/2009 Pensions2020 2019
Opening balances 4,190,230 4,514,130 Less: payments during the year (531,550) (531,550)Add: winding of interest 192,751 207,650 Present value of pension obligation 3,851,431 4,190,230
Employee and employer pension contribution payable 589,558 553,778 Balance as at 31 December 4,440,989 4,744,008
a)
b)
c)
2020 2019
Nominal value of the benefit obligation 4,913,504 5,445,054 Present value of the benefit obligation 3,851,431 4,190,230 Unrecognised interest component 1,062,073 1,254,824 Discount rate: 364 day treasury bill rate 4.60% 4.60%Number of employees in the scheme 11 11Average remaining years of service 8.55 9.55Retirement age 65 65
The Authority provides defined benefit plans (“Pre- Maldives Pension Act 8/2009 Pensions”) for thoseemployees who have completed 20 years of service and opted to continue to receive such benefits. This isa frozen calculation, where the pension payment amount was determined based on the salary received bythe employee at the date of completing 20 years of service. Pre- Maldives Pension Act 8/2009 Pension wasworked out as follows:
An employee who became eligible (by working in public sector for 20 years) to pension arrangementbetween 5 April 2007 and 10 October 2007 receive a monthly pension under “Pre-New Pension ActPension” calculated at 1/2 month’s salary at the eligibility point until they reach age of 65.
All employees who became eligible after 10 October 2007 up until 31 July 2010 will receive a monthlypension calculated at 1/3 of monthly salary at the eligibility point until they reach age of 65.
The principal assumptions used in determining employee benefit obligations for Pre- Maldives Pension Act8/2009 Pensions plan are shown below:
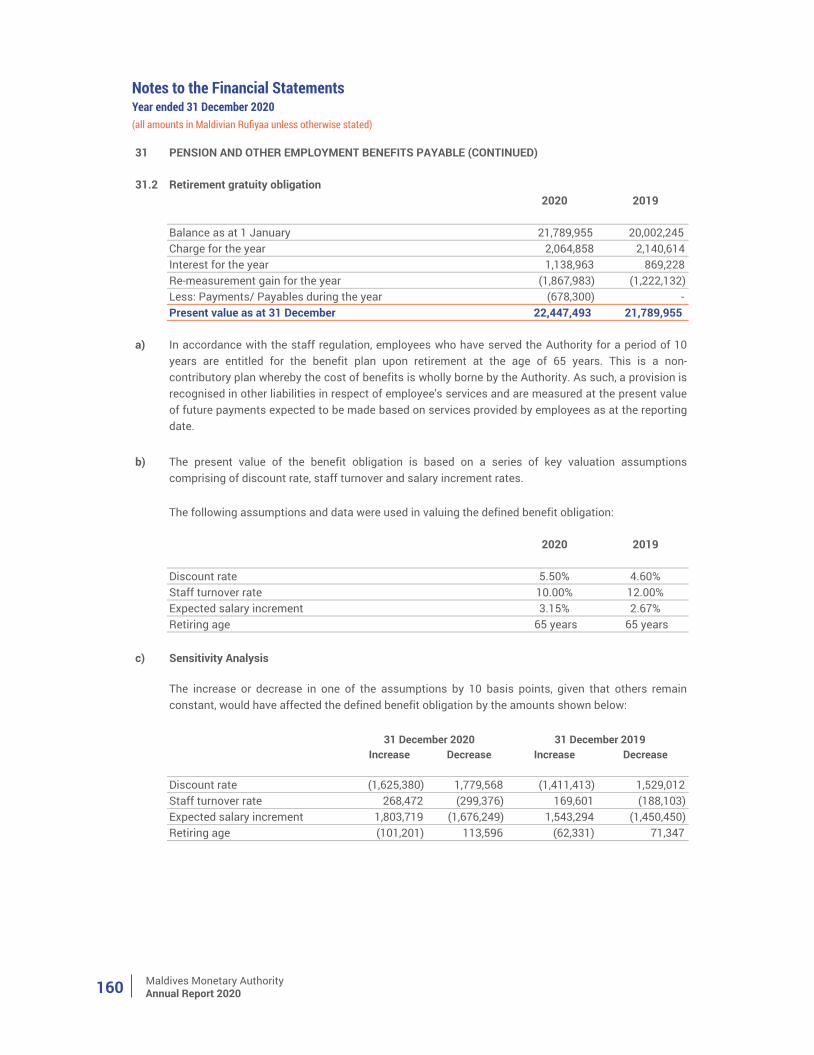
Maldives Monetary AuthorityAnnual Report 2020160
Notes to the Financial StatementsYear ended 31 December 2020(all amounts in Maldivian Rufiyaa unless otherwise stated)
31 PENSION AND OTHER EMPLOYMENT BENEFITS PAYABLE (CONTINUED)
31.2 Retirement gratuity obligation2020 2019
Balance as at 1 January 21,789,955 20,002,245 Charge for the year 2,064,858 2,140,614 Interest for the year 1,138,963 869,228 Re-measurement gain for the year (1,867,983) (1,222,132)Less: Payments/ Payables during the year (678,300) - Present value as at 31 December 22,447,493 21,789,955
a)
b)
2020 2019
Discount rate 5.50% 4.60%Staff turnover rate 10.00% 12.00%Expected salary increment 3.15% 2.67%Retiring age 65 years 65 years
c)
Increase Decrease Increase Decrease
Discount rate (1,625,380) 1,779,568 (1,411,413) 1,529,012 Staff turnover rate 268,472 (299,376) 169,601 (188,103)Expected salary increment 1,803,719 (1,676,249) 1,543,294 (1,450,450)Retiring age (101,201) 113,596 (62,331) 71,347
In accordance with the staff regulation, employees who have served the Authority for a period of 10years are entitled for the benefit plan upon retirement at the age of 65 years. This is a non-contributory plan whereby the cost of benefits is wholly borne by the Authority. As such, a provision isrecognised in other liabilities in respect of employee's services and are measured at the present valueof future payments expected to be made based on services provided by employees as at the reportingdate.
The present value of the benefit obligation is based on a series of key valuation assumptionscomprising of discount rate, staff turnover and salary increment rates.
Sensitivity Analysis
The increase or decrease in one of the assumptions by 10 basis points, given that others remainconstant, would have affected the defined benefit obligation by the amounts shown below:
31 December 2020 31 December 2019
The following assumptions and data were used in valuing the defined benefit obligation:
Maldives Monetary AuthorityAnnual Report 2020 161
Notes to the Financial StatementsYear ended 31 December 2020(all amounts in Maldivian Rufiyaa unless otherwise stated)
32 EQUITY AND RESERVES
32.1 Capital
In addition to the retained earnings, reserves comprise the following;
32.2 General Reserve
32.3 Foreign Asset Revaluation Reserve
32.4 FVOCI Reserve
32.5 Property Revaluation Reserve
32.6 Other Reserves
Other reserves comprises of re-measurement gains related to defined benefit plan arising from changes inunderlying assumptions of retirement gratuity obligation. Re-measurement gain and losses arerecognised in Other comprehensive income and the accumulated gain and losses are accounted withinother reserves.
Property Revaluation Reserve comprises of revaluation gains arising from valuation of property. Anyrevaluation decrease arising from a valuation will be recognised as an expense to the extent that itexceeds any amount previously credited to the Property Revaluation Reserve relating to the same asset.
When a revalued asset is disposed of, any revaluation surplus may be transferred directly to the GeneralReserve, or it may be left in Property Revaluation Reserve. The transfer to General Reserve shall not bemade through statement of comprehensive income.
The Authority established Foreign Asset Revaluation Reserve (FARR) in accordance with Chapter V,Section 28 of the MMA Act. In accordance with the provision of the Act, gains and losses arising from anychange in the valuation of the Authority's assets or liabilities in gold, foreign currencies or other units ofaccount, as a result of alterations of the external value of the Rufiyaa, or of any change in the values,parities, or exchange rates in respect of such assets in relation to the Rufiyaa shall be credited to FARR.
These gains or the losses from change in valuation of foreign currency assets, liabilities, gold or otherunits of account should not be included in the computation of net profit or loss as per MMA Act.
FVOCI Reserve comprises of unrealised gains and losses arising from the valuation of investmentsclassified under held to collect contractual cash flows and for sale which will be reclassified to profit andloss account in subsequent periods, when the associated assets are sold, impaired or matured.
The Authority's authorised and contributed capital is MVR 50 million.
The General Reserve is established in accordance with Chapter V, section 27 of the MMA Act. Inaccordance with provisions of the Act, the Authority shall allocate 50% of the net profit of the Authority, toGeneral Reserve account until the General Reserve is equal to the authorised capital of the Authority, afterwhich the Authority shall allocate 25% of its net profit to the General Reserve account until the GeneralReserve is equal to twice of the authorised capital.
Section 27 (1) of the MMA Act, states that once the General Reserve is equal to twice the amount of theauthorised capital, the Authority shall credit to the General Reserve such amount determined by the Boardof Directors of the Authority. During the year MVR 112,716,108 was transferred to General Reserve fromthe Authority's net profit for the year 2019.
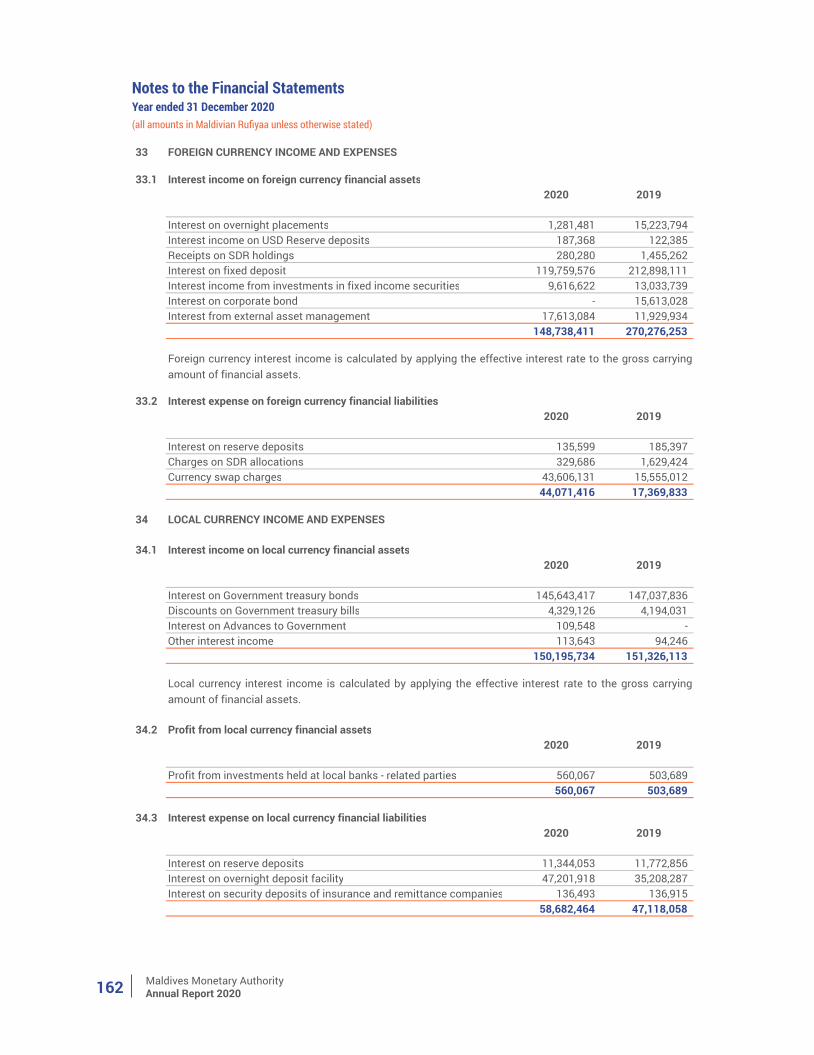
Maldives Monetary AuthorityAnnual Report 2020162
Notes to the Financial StatementsYear ended 31 December 2020(all amounts in Maldivian Rufiyaa unless otherwise stated)
33 FOREIGN CURRENCY INCOME AND EXPENSES
33.1 Interest income on foreign currency financial assets2020 2019
Interest on overnight placements 1,281,481 15,223,794 Interest income on USD Reserve deposits 187,368 122,385 Receipts on SDR holdings 280,280 1,455,262 Interest on fixed deposit 119,759,576 212,898,111 Interest income from investments in fixed income securities 9,616,622 13,033,739 Interest on corporate bond - 15,613,028 Interest from external asset management 17,613,084 11,929,934
148,738,411 270,276,253
33.2 Interest expense on foreign currency financial liabilities2020 2019
Interest on reserve deposits 135,599 185,397 Charges on SDR allocations 329,686 1,629,424 Currency swap charges 43,606,131 15,555,012
44,071,416 17,369,833
34 LOCAL CURRENCY INCOME AND EXPENSES
34.1 Interest income on local currency financial assets2020 2019
Interest on Government treasury bonds 145,643,417 147,037,836 Discounts on Government treasury bills 4,329,126 4,194,031 Interest on Advances to Government 109,548 - Other interest income 113,643 94,246
150,195,734 151,326,113
34.2 Profit from local currency financial assets2020 2019
Profit from investments held at local banks - related parties 560,067 503,689 560,067 503,689
34.3 Interest expense on local currency financial liabilities2020 2019
Interest on reserve deposits 11,344,053 11,772,856 Interest on overnight deposit facility 47,201,918 35,208,287 Interest on security deposits of insurance and remittance companies 136,493 136,915
58,682,464 47,118,058
Foreign currency interest income is calculated by applying the effective interest rate to the gross carryingamount of financial assets.
Local currency interest income is calculated by applying the effective interest rate to the gross carryingamount of financial assets.
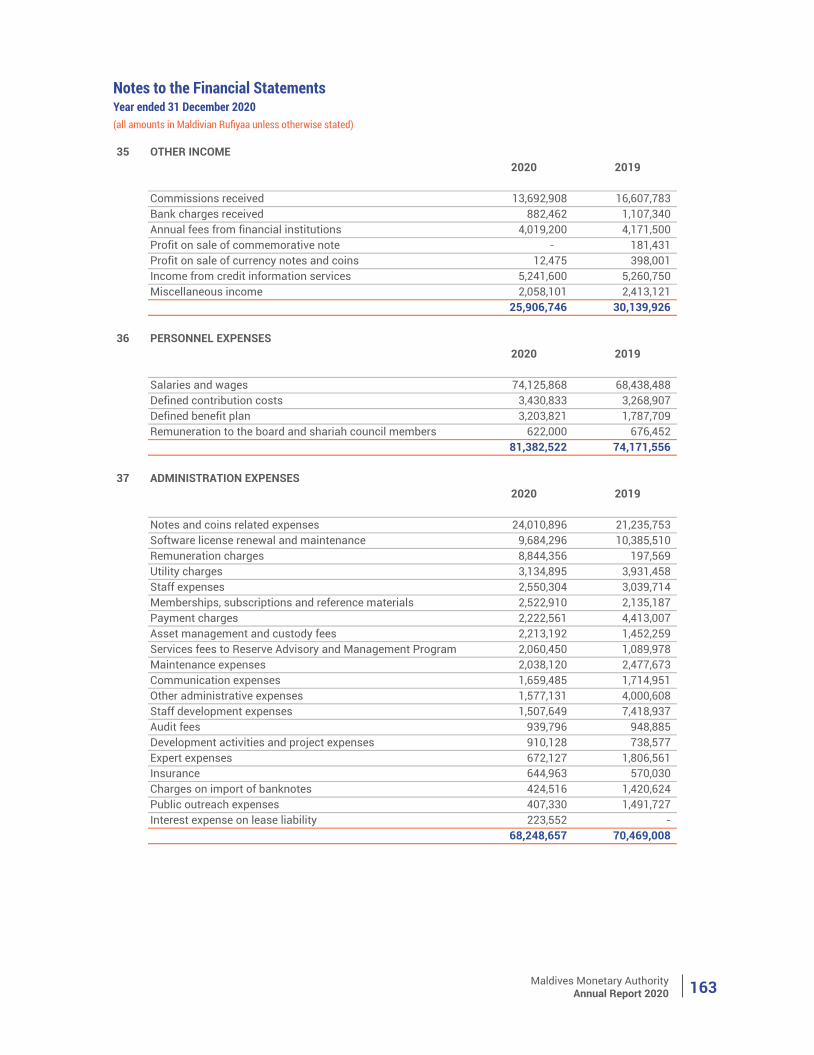
Maldives Monetary AuthorityAnnual Report 2020 163
(all amounts in Maldivian Rufiyaa unless otherwise stated)
Notes to the Financial StatementsYear ended 31 December 2020
35 OTHER INCOME2020 2019
Commissions received 13,692,908 16,607,783 Bank charges received 882,462 1,107,340 Annual fees from financial institutions 4,019,200 4,171,500 Profit on sale of commemorative note - 181,431 Profit on sale of currency notes and coins 12,475 398,001 Income from credit information services 5,241,600 5,260,750 Miscellaneous income 2,058,101 2,413,121
25,906,746 30,139,926
36 PERSONNEL EXPENSES2020 2019
Salaries and wages 74,125,868 68,438,488 Defined contribution costs 3,430,833 3,268,907 Defined benefit plan 3,203,821 1,787,709 Remuneration to the board and shariah council members 622,000 676,452
81,382,522 74,171,556
37 ADMINISTRATION EXPENSES2020 2019
Notes and coins related expenses 24,010,896 21,235,753 Software license renewal and maintenance 9,684,296 10,385,510 Remuneration charges 8,844,356 197,569 Utility charges 3,134,895 3,931,458 Staff expenses 2,550,304 3,039,714 Memberships, subscriptions and reference materials 2,522,910 2,135,187 Payment charges 2,222,561 4,413,007 Asset management and custody fees 2,213,192 1,452,259 Services fees to Reserve Advisory and Management Program 2,060,450 1,089,978 Maintenance expenses 2,038,120 2,477,673 Communication expenses 1,659,485 1,714,951 Other administrative expenses 1,577,131 4,000,608 Staff development expenses 1,507,649 7,418,937 Audit fees 939,796 948,885 Development activities and project expenses 910,128 738,577 Expert expenses 672,127 1,806,561 Insurance 644,963 570,030 Charges on import of banknotes 424,516 1,420,624 Public outreach expenses 407,330 1,491,727 Interest expense on lease liability 223,552 -
68,248,657 70,469,008
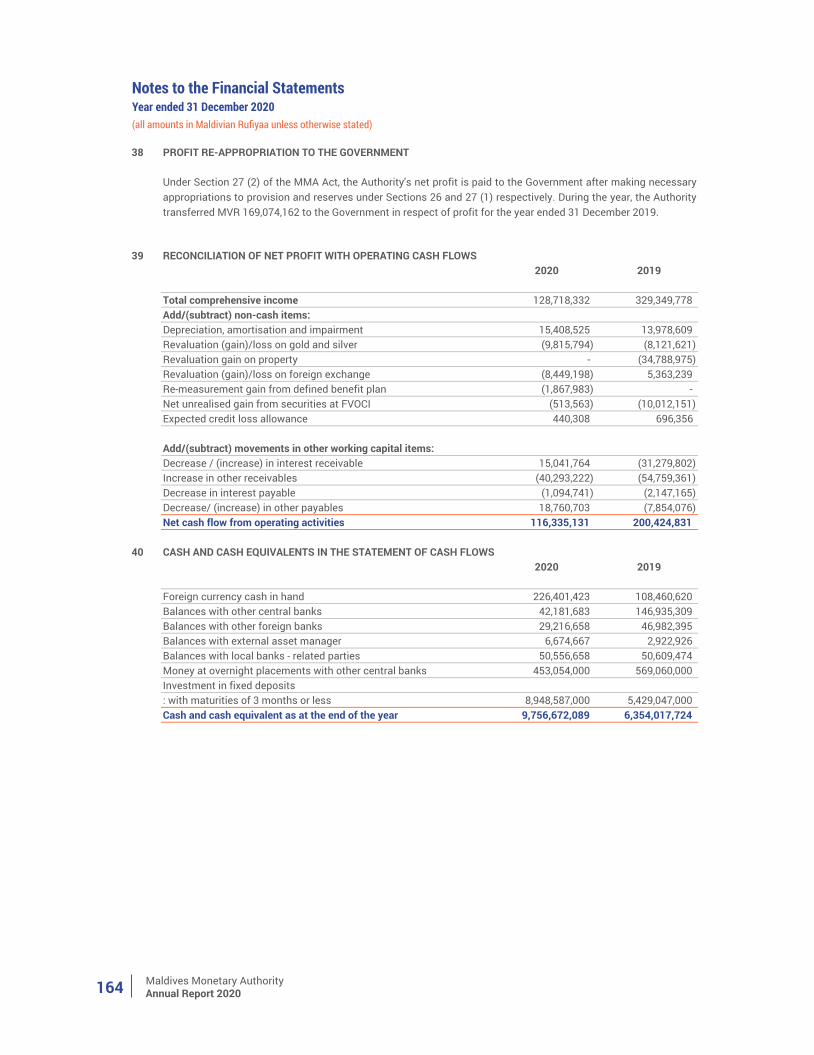
Maldives Monetary AuthorityAnnual Report 2020164
(all amounts in Maldivian Rufiyaa unless otherwise stated)
Notes to the Financial StatementsYear ended 31 December 2020
38 PROFIT RE-APPROPRIATION TO THE GOVERNMENT
39 RECONCILIATION OF NET PROFIT WITH OPERATING CASH FLOWS2020 2019
Total comprehensive income 128,718,332 329,349,778 Add/(subtract) non-cash items:Depreciation, amortisation and impairment 15,408,525 13,978,609 Revaluation (gain)/loss on gold and silver (9,815,794) (8,121,621) Revaluation gain on property - (34,788,975) Revaluation (gain)/loss on foreign exchange (8,449,198) 5,363,239 Re-measurement gain from defined benefit plan (1,867,983) -
(513,563) (10,012,151)440,308 696,356
Add/(subtract) movements in other working capital items:Decrease / (increase) in interest receivable 15,041,764 (31,279,802) Increase in other receivables (40,293,222) (54,759,361) Decrease in interest payable (1,094,741) (2,147,165) Decrease/ (increase) in other payables 18,760,703 (7,854,076) Net cash flow from operating activities 116,335,131 200,424,831
40 CASH AND CASH EQUIVALENTS IN THE STATEMENT OF CASH FLOWS2020 2019
Foreign currency cash in hand 226,401,423 108,460,620 Balances with other central banks 42,181,683 146,935,309 Balances with other foreign banks 29,216,658 46,982,395 Balances with external asset manager 6,674,667 2,922,926 Balances with local banks - related parties 50,556,658 50,609,474 Money at overnight placements with other central banks 453,054,000 569,060,000 Investment in fixed deposits : with maturities of 3 months or less 8,948,587,000 5,429,047,000 Cash and cash equivalent as at the end of the year 9,756,672,089 6,354,017,724
Net unrealised gain from securities at FVOCIExpected credit loss allowance
Under Section 27 (2) of the MMA Act, the Authority's net profit is paid to the Government after making necessaryappropriations to provision and reserves under Sections 26 and 27 (1) respectively. During the year, the Authoritytransferred MVR 169,074,162 to the Government in respect of profit for the year ended 31 December 2019.
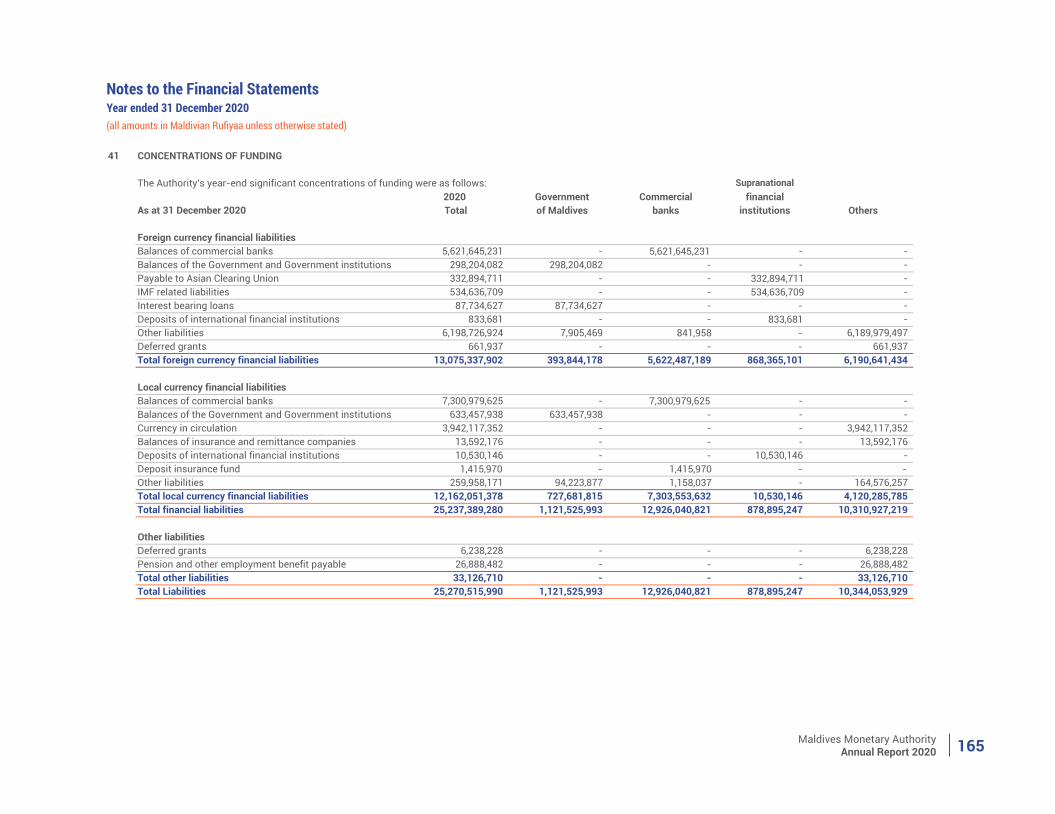
Maldives Monetary AuthorityAnnual Report 2020 165
Notes to the Financial StatementsYear ended 31 December 2020(all amounts in Maldivian Rufiyaa unless otherwise stated)
41 CONCENTRATIONS OF FUNDING
The Authority's year-end significant concentrations of funding were as follows: Supranational 2020 Government Commercial financial
As at 31 December 2020 Total of Maldives banks institutions Others
Foreign currency financial liabilitiesBalances of commercial banks 5,621,645,231 - 5,621,645,231 - - Balances of the Government and Government institutions 298,204,082 298,204,082 - - - Payable to Asian Clearing Union 332,894,711 - - 332,894,711 - IMF related liabilities 534,636,709 - - 534,636,709 - Interest bearing loans 87,734,627 87,734,627 - - - Deposits of international financial institutions 833,681 - - 833,681 - Other liabilities 6,198,726,924 7,905,469 841,958 - 6,189,979,497 Deferred grants 661,937 - - - 661,937 Total foreign currency financial liabilities 13,075,337,902 393,844,178 5,622,487,189 868,365,101 6,190,641,434
Local currency financial liabilitiesBalances of commercial banks 7,300,979,625 - 7,300,979,625 - - Balances of the Government and Government institutions 633,457,938 633,457,938 - - - Currency in circulation 3,942,117,352 - - - 3,942,117,352 Balances of insurance and remittance companies 13,592,176 - - - 13,592,176 Deposits of international financial institutions 10,530,146 - - 10,530,146 - Deposit insurance fund 1,415,970 - 1,415,970 - - Other liabilities 259,958,171 94,223,877 1,158,037 - 164,576,257 Total local currency financial liabilities 12,162,051,378 727,681,815 7,303,553,632 10,530,146 4,120,285,785 Total financial liabilities 25,237,389,280 1,121,525,993 12,926,040,821 878,895,247 10,310,927,219
Other liabilitiesDeferred grants 6,238,228 - - - 6,238,228 Pension and other employment benefit payable 26,888,482 - - - 26,888,482 Total other liabilities 33,126,710 - - - 33,126,710 Total Liabilities 25,270,515,990 1,121,525,993 12,926,040,821 878,895,247 10,344,053,929
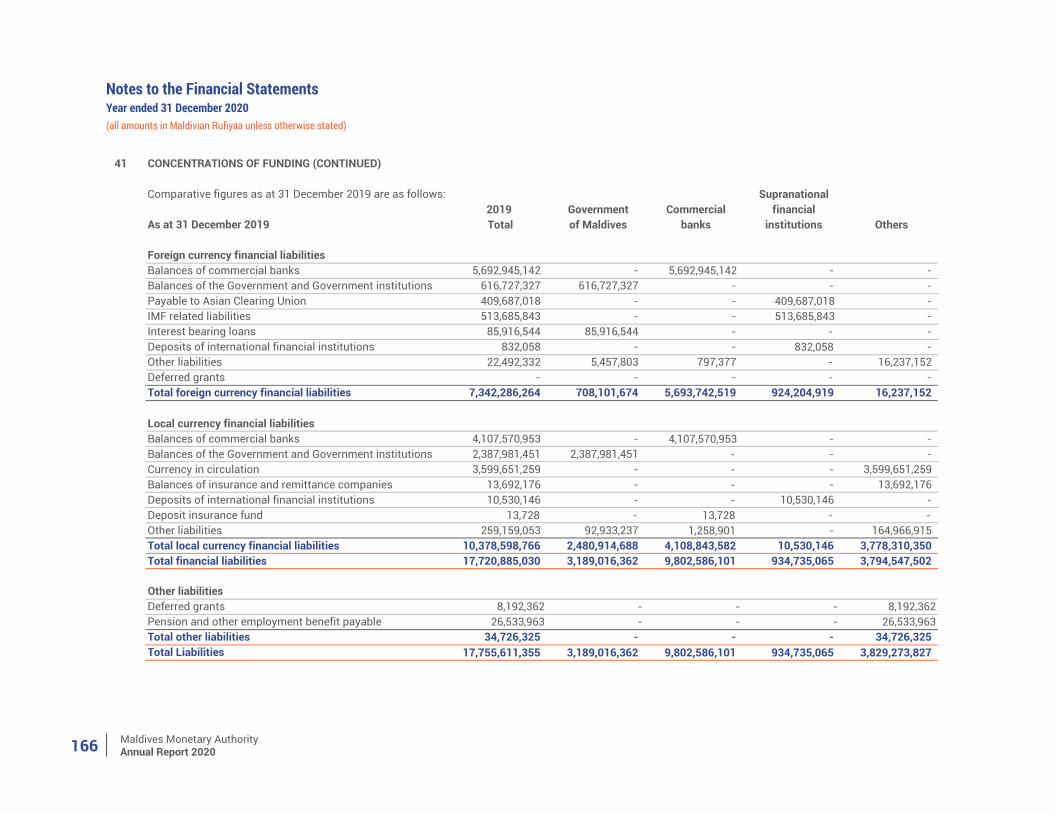
Maldives Monetary AuthorityAnnual Report 2020166
Notes to the Financial StatementsYear ended 31 December 2020(all amounts in Maldivian Rufiyaa unless otherwise stated)
41 CONCENTRATIONS OF FUNDING (CONTINUED)
Comparative figures as at 31 December 2019 are as follows: Supranational 2019 Government Commercial financial
As at 31 December 2019 Total of Maldives banks institutions Others
Foreign currency financial liabilitiesBalances of commercial banks 5,692,945,142 - 5,692,945,142 - - Balances of the Government and Government institutions 616,727,327 616,727,327 - - - Payable to Asian Clearing Union 409,687,018 - - 409,687,018 - IMF related liabilities 513,685,843 - - 513,685,843 - Interest bearing loans 85,916,544 85,916,544 - - - Deposits of international financial institutions 832,058 - - 832,058 - Other liabilities 22,492,332 5,457,803 797,377 - 16,237,152 Deferred grants - - - - - Total foreign currency financial liabilities 7,342,286,264 708,101,674 5,693,742,519 924,204,919 16,237,152
Local currency financial liabilitiesBalances of commercial banks 4,107,570,953 - 4,107,570,953 - - Balances of the Government and Government institutions 2,387,981,451 2,387,981,451 - - - Currency in circulation 3,599,651,259 - - - 3,599,651,259 Balances of insurance and remittance companies 13,692,176 - - - 13,692,176 Deposits of international financial institutions 10,530,146 - - 10,530,146 - Deposit insurance fund 13,728 - 13,728 - - Other liabilities 259,159,053 92,933,237 1,258,901 - 164,966,915 Total local currency financial liabilities 10,378,598,766 2,480,914,688 4,108,843,582 10,530,146 3,778,310,350 Total financial liabilities 17,720,885,030 3,189,016,362 9,802,586,101 934,735,065 3,794,547,502
Other liabilitiesDeferred grants 8,192,362 - - - 8,192,362 Pension and other employment benefit payable 26,533,963 - - - 26,533,963 Total other liabilities 34,726,325 - - - 34,726,325 Total Liabilities 17,755,611,355 3,189,016,362 9,802,586,101 934,735,065 3,829,273,827
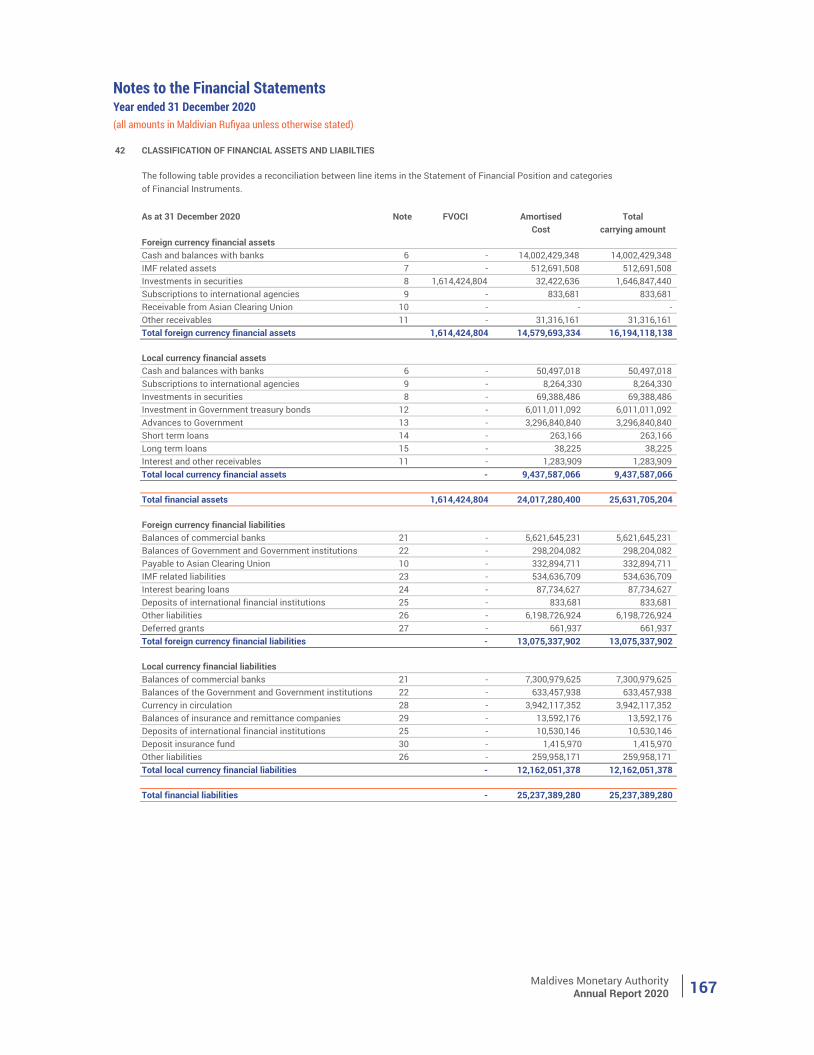
Maldives Monetary AuthorityAnnual Report 2020 167
Notes to the Financial StatementsYear ended 31 December 2020(all amounts in Maldivian Rufiyaa unless otherwise stated)
42 CLASSIFICATION OF FINANCIAL ASSETS AND LIABILTIES
As at 31 December 2020 Note FVOCI Amortised Total Cost carrying amount
Foreign currency financial assetsCash and balances with banks 6 - 14,002,429,348 14,002,429,348 IMF related assets 7 - 512,691,508 512,691,508 Investments in securities 8 1,614,424,804 32,422,636 1,646,847,440 Subscriptions to international agencies 9 - 833,681 833,681 Receivable from Asian Clearing Union 10 - - - Other receivables 11 - 31,316,161 31,316,161 Total foreign currency financial assets 1,614,424,804 14,579,693,334 16,194,118,138
Local currency financial assetsCash and balances with banks 6 - 50,497,018 50,497,018 Subscriptions to international agencies 9 - 8,264,330 8,264,330 Investments in securities 8 - 69,388,486 69,388,486 Investment in Government treasury bonds 12 - 6,011,011,092 6,011,011,092 Advances to Government 13 - 3,296,840,840 3,296,840,840 Short term loans 14 - 263,166 263,166 Long term loans 15 - 38,225 38,225 Interest and other receivables 11 - 1,283,909 1,283,909 Total local currency financial assets - 9,437,587,066 9,437,587,066
Total financial assets 1,614,424,804 24,017,280,400 25,631,705,204
Foreign currency financial liabilitiesBalances of commercial banks 21 - 5,621,645,231 5,621,645,231 Balances of Government and Government institutions 22 - 298,204,082 298,204,082 Payable to Asian Clearing Union 10 - 332,894,711 332,894,711 IMF related liabilities 23 - 534,636,709 534,636,709 Interest bearing loans 24 - 87,734,627 87,734,627 Deposits of international financial institutions 25 - 833,681 833,681 Other liabilities 26 - 6,198,726,924 6,198,726,924 Deferred grants 27 - 661,937 661,937 Total foreign currency financial liabilities - 13,075,337,902 13,075,337,902
Local currency financial liabilitiesBalances of commercial banks 21 - 7,300,979,625 7,300,979,625 Balances of the Government and Government institutions 22 - 633,457,938 633,457,938 Currency in circulation 28 - 3,942,117,352 3,942,117,352 Balances of insurance and remittance companies 29 - 13,592,176 13,592,176 Deposits of international financial institutions 25 - 10,530,146 10,530,146 Deposit insurance fund 30 - 1,415,970 1,415,970 Other liabilities 26 - 259,958,171 259,958,171 Total local currency financial liabilities - 12,162,051,378 12,162,051,378
Total financial liabilities - 25,237,389,280 25,237,389,280
The following table provides a reconciliation between line items in the Statement of Financial Position and categoriesof Financial Instruments.
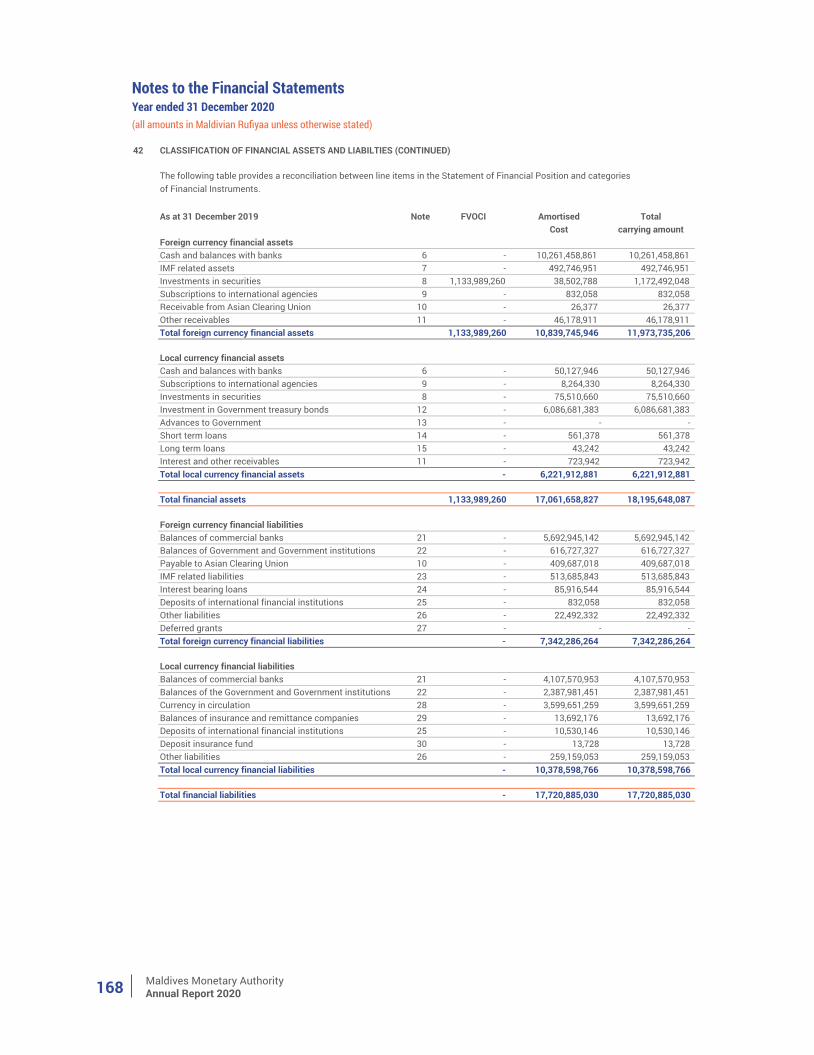
Maldives Monetary AuthorityAnnual Report 2020168
Notes to the Financial StatementsYear ended 31 December 2020(all amounts in Maldivian Rufiyaa unless otherwise stated)
42 CLASSIFICATION OF FINANCIAL ASSETS AND LIABILTIES (CONTINUED)
As at 31 December 2019 Note FVOCI Amortised Total Cost carrying amount
Foreign currency financial assetsCash and balances with banks 6 - 10,261,458,861 10,261,458,861 IMF related assets 7 - 492,746,951 492,746,951 Investments in securities 8 1,133,989,260 38,502,788 1,172,492,048 Subscriptions to international agencies 9 - 832,058 832,058 Receivable from Asian Clearing Union 10 - 26,377 26,377 Other receivables 11 - 46,178,911 46,178,911 Total foreign currency financial assets 1,133,989,260 10,839,745,946 11,973,735,206
Local currency financial assetsCash and balances with banks 6 - 50,127,946 50,127,946 Subscriptions to international agencies 9 - 8,264,330 8,264,330 Investments in securities 8 - 75,510,660 75,510,660 Investment in Government treasury bonds 12 - 6,086,681,383 6,086,681,383 Advances to Government 13 - - - Short term loans 14 - 561,378 561,378 Long term loans 15 - 43,242 43,242 Interest and other receivables 11 - 723,942 723,942 Total local currency financial assets - 6,221,912,881 6,221,912,881
Total financial assets 1,133,989,260 17,061,658,827 18,195,648,087
Foreign currency financial liabilitiesBalances of commercial banks 21 - 5,692,945,142 5,692,945,142 Balances of Government and Government institutions 22 - 616,727,327 616,727,327 Payable to Asian Clearing Union 10 - 409,687,018 409,687,018 IMF related liabilities 23 - 513,685,843 513,685,843 Interest bearing loans 24 - 85,916,544 85,916,544 Deposits of international financial institutions 25 - 832,058 832,058 Other liabilities 26 - 22,492,332 22,492,332 Deferred grants 27 - - - Total foreign currency financial liabilities - 7,342,286,264 7,342,286,264
Local currency financial liabilitiesBalances of commercial banks 21 - 4,107,570,953 4,107,570,953 Balances of the Government and Government institutions 22 - 2,387,981,451 2,387,981,451 Currency in circulation 28 - 3,599,651,259 3,599,651,259 Balances of insurance and remittance companies 29 - 13,692,176 13,692,176 Deposits of international financial institutions 25 - 10,530,146 10,530,146 Deposit insurance fund 30 - 13,728 13,728 Other liabilities 26 - 259,159,053 259,159,053 Total local currency financial liabilities - 10,378,598,766 10,378,598,766
Total financial liabilities - 17,720,885,030 17,720,885,030
The following table provides a reconciliation between line items in the Statement of Financial Position and categoriesof Financial Instruments.
Maldives Monetary AuthorityAnnual Report 2020 169
Notes to the Financial StatementsYear ended 31 December 2020(all amounts in Maldivian Rufiyaa unless otherwise stated)
43 FINANCIAL RISK MANAGEMENT
43.1 Credit risk
The following section discusses the Authority's risk management policies. The measurement of ECLunder IFRS 9 uses the information and approaches that Authority uses to manage credit risk, thoughcertain adjustments are made in order to comply with the requirements of IFRS 9. The approach taken forIFRS 9 measurement purposes is discussed separately in Note 43.1.1.
Maldives Monetary Authority as the banker of the Government ensures that its reserves are safeguarded.To this effect, the Authority issues currency, regulates the availability of the Maldivian Rufiyaa andpromotes its stability, licenses, supervises and regulates institutions in the financial sector, formulatesand implements monetary policy, and advises the Government on issues relating to the economy andfinancial system in order to foster an environment conducive to the orderly and balanced economicdevelopment of the Maldives.
The Authority’s principal financial liabilities comprise of amounts payable to commercial banks,Government, public entities, international financial institutions and currency in circulation while foreigncurrency cash and cash equivalents, investment in securities, Government bond and IMF related assetsare its main financial assets.
The Authority's most significant risk exposures are considered to be in the areas of credit risk, countryrisk, operational risk, liquidity risk and market risk.
Financial risk is normally any risk associated with any form of financing. Risk is probability ofunfavourable condition if actual returns are less than expected return. The principal risk for the Authorityis credit risk.
Risk Management is an integral part of the Authority's daily operations. The Authority closely monitorsthe possible impacts of the COVID-19 pandemic on the Authority's financial assets and liabilities. TheAuthority's existing measures were deemed fit to manage any possible financial risks during the year.
Credit risk is the risk of suffering financial loss, should any of the customers, clients or marketcounterparties fail to fulfill their contractual obligations to the Authority. Credit risk arises mainly fromfinancial assets and financial guarantees.
For the management of credit risk related to foreign exposures, the Authority has established basecriteria of exposure to counterparties and issuers of fixed income securities.
The evaluation and monitoring process of the eligible counterparties is based on the analysis and therating determined by the principal rating agencies; Standard & Poor’s, Moody’s and Fitch. This processalso includes reviewing performance of several other market indicators.
The Authority has established other qualitative and/or quantitative limits on the exposure level for theissuer/financial institution on an individual basis, category, or combined category and instrument basis.
The Authority does not actively manage credit risk for financial assets originated for the purposes ofmonetary policy operations. For these financial assets, which are mainly short term (3 months or less),the primary consideration is the need of monetary policy. Further, the principal policy of the Authority isto require high quality collateral and these assets are subject to management approval.
Maldives Monetary AuthorityAnnual Report 2020170
Notes to the Financial StatementsYear ended 31 December 2020(all amounts in Maldivian Rufiyaa unless otherwise stated)
43 FINANCIAL RISK MANAGEMENT (CONTINUED)
43.1 Credit risk (Continued)
43.1.1 Credit risk measurement
a) Foreign currency financial assets held abroad
b) Foreign currency financial assets held locally
c) Local currency financial assets
d) Guarantees
Foreign currency financial assets that are held abroad includes deposits held in foreign banks, investmentsin fixed deposits, investments in fixed income securities and IMF related assets. As a general guideline, theAuthority's investments are made within the investment grade. The Authority has a minimum eligible creditrating limit set in the investment guideline.
Credit risk and liquidity risk are closely linked to the investment strategy of the Authority whereby theAuthority's investment strategy prioritises capital maintenance over return. The Authority reviews thecounterparty's eligibility on a frequent basis for any material change in the financial standing.
Foreign currency financial assets that are held locally include cash and balances with banks andinvestment in securities with local counterparties. As at 31 December 2020, these financial assets includeinvestment in Government treasury bills, and balances held with local banks, which are either sovereignguaranteed or an exposure with a related party.
Local currency financial assets include cash and balances with banks, investment in Governmentsecurities and loans provided to staff. It also includes facilities such as Open Market Operation (OMO) andOvernight Lombard Facility (OLF) which require prior approval from the management. These facilities arefully collateralized with high grade Government securities.
Guarantees include financial guarantees the Authority has committed to as at 31 December 2020. As perIFRS 9, the Authority has assessed the credit risk of these financial guarantees.
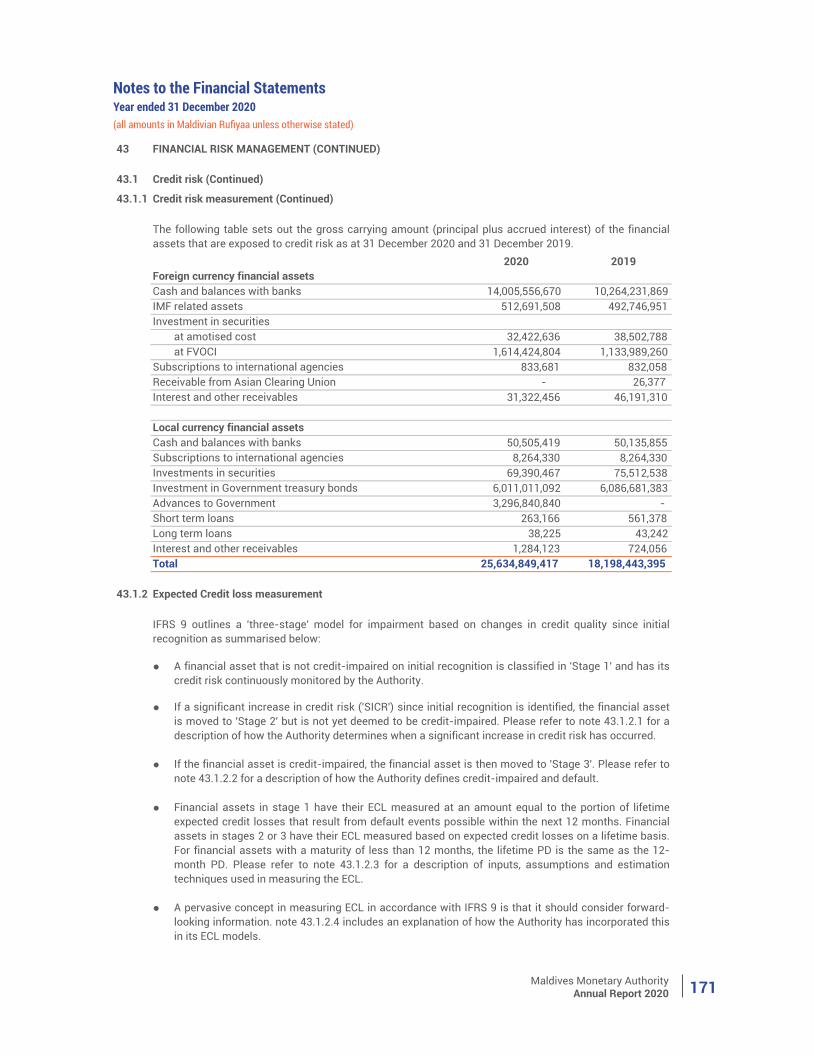
Maldives Monetary AuthorityAnnual Report 2020 171
Notes to the Financial StatementsYear ended 31 December 2020(all amounts in Maldivian Rufiyaa unless otherwise stated)
43 FINANCIAL RISK MANAGEMENT (CONTINUED)
43.1 Credit risk (Continued)
43.1.1 Credit risk measurement (Continued)
2020 2019Foreign currency financial assetsCash and balances with banks 14,005,556,670 10,264,231,869 IMF related assets 512,691,508 492,746,951 Investment in securities
at amotised cost 32,422,636 38,502,788 at FVOCI 1,614,424,804 1,133,989,260
Subscriptions to international agencies 833,681 832,058 Receivable from Asian Clearing Union - 26,377 Interest and other receivables 31,322,456 46,191,310
Local currency financial assetsCash and balances with banks 50,505,419 50,135,855 Subscriptions to international agencies 8,264,330 8,264,330 Investments in securities 69,390,467 75,512,538 Investment in Government treasury bonds 6,011,011,092 6,086,681,383 Advances to Government 3,296,840,840 - Short term loans 263,166 561,378 Long term loans 38,225 43,242 Interest and other receivables 1,284,123 724,056 Total 25,634,849,417 18,198,443,395
43.1.2 Expected Credit loss measurement
●
●
●
●
● A pervasive concept in measuring ECL in accordance with IFRS 9 is that it should consider forward-looking information. note 43.1.2.4 includes an explanation of how the Authority has incorporated thisin its ECL models.
Financial assets in stage 1 have their ECL measured at an amount equal to the portion of lifetimeexpected credit losses that result from default events possible within the next 12 months. Financialassets in stages 2 or 3 have their ECL measured based on expected credit losses on a lifetime basis.For financial assets with a maturity of less than 12 months, the lifetime PD is the same as the 12-month PD. Please refer to note 43.1.2.3 for a description of inputs, assumptions and estimationtechniques used in measuring the ECL.
The following table sets out the gross carrying amount (principal plus accrued interest) of the financialassets that are exposed to credit risk as at 31 December 2020 and 31 December 2019.
IFRS 9 outlines a 'three-stage' model for impairment based on changes in credit quality since initialrecognition as summarised below:
A financial asset that is not credit-impaired on initial recognition is classified in 'Stage 1' and has itscredit risk continuously monitored by the Authority.
If a significant increase in credit risk ('SICR') since initial recognition is identified, the financial assetis moved to 'Stage 2' but is not yet deemed to be credit-impaired. Please refer to note 43.1.2.1 for adescription of how the Authority determines when a significant increase in credit risk has occurred.
If the financial asset is credit-impaired, the financial asset is then moved to 'Stage 3'. Please refer tonote 43.1.2.2 for a description of how the Authority defines credit-impaired and default.
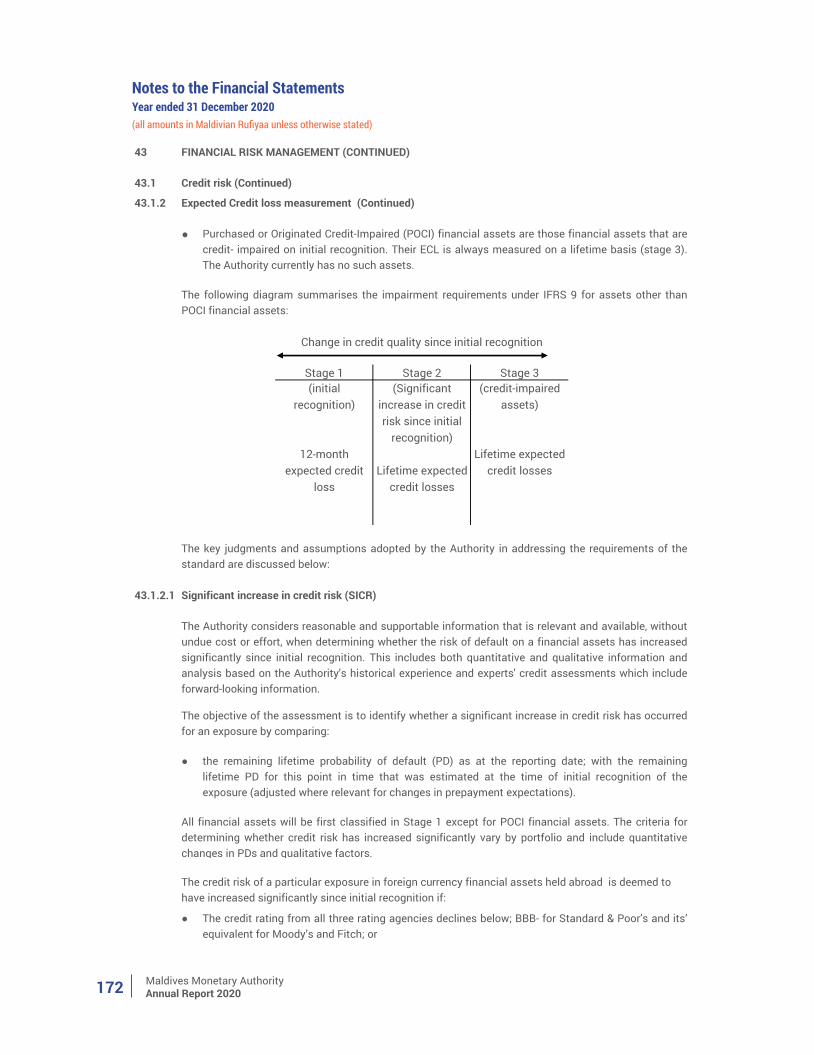
Maldives Monetary AuthorityAnnual Report 2020172
Notes to the Financial StatementsYear ended 31 December 2020(all amounts in Maldivian Rufiyaa unless otherwise stated)
43 FINANCIAL RISK MANAGEMENT (CONTINUED)
43.1 Credit risk (Continued)
43.1.2 Expected Credit loss measurement (Continued)
●
Stage 1 Stage 2 Stage 3(initial
recognition)
12-month expected credit
loss
(Significant increase in credit risk since initial
recognition)
Lifetime expected credit losses
(credit-impaired assets)
Lifetime expected credit losses
43.1.2.1 Significant increase in credit risk (SICR)
●
● The credit rating from all three rating agencies declines below; BBB- for Standard & Poor’s and its’equivalent for Moody’s and Fitch; or
All financial assets will be first classified in Stage 1 except for POCI financial assets. The criteria fordetermining whether credit risk has increased significantly vary by portfolio and include quantitativechanges in PDs and qualitative factors.
The objective of the assessment is to identify whether a significant increase in credit risk has occurredfor an exposure by comparing:
the remaining lifetime probability of default (PD) as at the reporting date; with the remaininglifetime PD for this point in time that was estimated at the time of initial recognition of theexposure (adjusted where relevant for changes in prepayment expectations).
The credit risk of a particular exposure in foreign currency financial assets held abroad is deemed to have increased significantly since initial recognition if:
Purchased or Originated Credit-Impaired (POCI) financial assets are those financial assets that arecredit- impaired on initial recognition. Their ECL is always measured on a lifetime basis (stage 3).The Authority currently has no such assets.
The following diagram summarises the impairment requirements under IFRS 9 for assets other thanPOCI financial assets:
Change in credit quality since initial recognition
The key judgments and assumptions adopted by the Authority in addressing the requirements of thestandard are discussed below:
The Authority considers reasonable and supportable information that is relevant and available, withoutundue cost or effort, when determining whether the risk of default on a financial assets has increasedsignificantly since initial recognition. This includes both quantitative and qualitative information andanalysis based on the Authority's historical experience and experts' credit assessments which includeforward-looking information.
Maldives Monetary AuthorityAnnual Report 2020 173
Notes to the Financial StatementsYear ended 31 December 2020(all amounts in Maldivian Rufiyaa unless otherwise stated)
43 FINANCIAL RISK MANAGEMENT (CONTINUED)
43.1 Credit risk (Continued)
43.1.2 Expected Credit loss measurement (Continued)
●
●
●
43.1.2.2 Definition of default and credit-impaired assets
Definition of default
Quantitative Criteria
●
●
●
●
Qualitative Criteria
●
●
●
● ● ● The purchase or origination of a financial asset at a deep discount that reflects incurred credit
losses.
A breach of contract, such as a default or past-due event;
It becoming probable that the borrower will enter bankruptcy or other financial reorganisation;The disappearance of an active market for the financial asset because of financial difficulties;
The lenders for economic or contractual reasons relating to the borrower’s financial difficultygranted the borrower a concession that would not otherwise be considered;
Significant financial difficulty of the issuer or borrower;
There is a delay in the repayment of an obligation to the Authority by a counterparty by 90 calendardays or more.
The authority considers a financial asset as credit-impaired when any of the following instances areobserved:
The credit risk of a particular exposure in foreign and local currency financial assets held locally andfinancial guarantees are deemed to have increased significantly since initial recognition depending onthe repayment period if:
There is a delay in the repayment of an obligation to the Authority by 30 calendar days or more.
The Authority considers an exposure as a default when a classification of a financial asset falls to stage3. In the event of a default the financial asset would be considered as a provisional exposure where theasset would be individually assessed and impairment losses recognized.
To classify foreign currency financial assets held abroad in stage 3, there should be an even highercredit risk whereby the borrower is essentially in default and shall be assessed based on the following:
The credit rating from all three rating agencies declines below; CCC- for Standard & Poor’s and its’equivalent for Moody’s and Fitch; or
The credit rating from one of the agencies goes to BB-; or
There is a delay in the repayment of an obligation to the Authority by 30 calendar days or more.
The credit rating from one of the agencies goes to D; or
There is a delay in the repayment of an obligation to the Authority by 90 calendar days or more.
To classify foreign and local currency financial assets held locally and financial guarantees in stage 3,there should be a higher credit risk whereby the borrower is essentially in default and is assessed basedon the following:
Maldives Monetary AuthorityAnnual Report 2020174
Notes to the Financial StatementsYear ended 31 December 2020(all amounts in Maldivian Rufiyaa unless otherwise stated)
43 FINANCIAL RISK MANAGEMENT (CONTINUED)
43.1 Credit risk (Continued)
43.1.2 Expected Credit loss measurement (Continued)
43.1.2.3 Measuring ECL - Explanation of inputs, assumptions and estimation techniques
●
●
●
●
●
For secured financial assets, LGD is primarily based on collateral type and projected collateralvalues. Since the Authority requires a significant margin on the collateral provided for these assetssuch as repos, the LGD is taken as zero. For other secured financial assets such as staff loans theloss is assessed on an individual case basis.
For unsecured financial assets, such as foreign securities, LGD's are based on Basel II approach orcredit rating agency's research calculations.
The ECL is measured on either a 12-month or lifetime basis depending on whether a significantincrease in credit risk has occurred since initial recognition or whether an asset is considered to becredit-impaired. Expected credit losses are the discounted product of the PD, Exposure at Default (EAD),and Loss Given Default (LGD), defined as follows:
The PD represents the likelihood of a borrower defaulting on its financial obligation (as per"Definition of default and credit-impaired" above), either over the next 12-month PD, or over theremaining lifetime PD of the obligation. As most of the Authority's financial assets has a maturityof less than 12 months, the lifetime and 12-month PDs are the same.
EAD is based on the amounts the Authority expects to be owed at the time of default, over the next12 months EAD or over the remaining lifetime EAD.
LGD represents the Authority's expectation of the extent of loss on a defaulted exposure. LGDvaries by type of counterparty, type and seniority of claim and availability of collateral or othercredit support. LGD is expressed as a percentage loss per unit of EAD. LGD is calculated on a 12-month or lifetime basis, where 12-month LGD is the percentage of loss expected to be made if thedefault occurs in the next 12 months and lifetime LGD is the percentage of loss expected to bemade if the default occurs over the remaining expected lifetime of the loan.
The ECL is determined by projecting the PD, LGD and EAD for each future year, or period to maturity ifless, and for each individual exposure or collective segment. These three components are multipliedtogether and adjusted for the likelihood of survival. This effectively calculates an ECL for each futuremonth, which is then discounted back to the reporting date and summed. The discount rate used in theECL calculation is the original effective interest rate or an approximation thereof.
The lifetime PD, where applicable, is developed by applying a maturity profile to the current 12-monthPD. The maturity profile looks at how defaults develop on a portfolio from the point of initial recognitionthroughout the lifetime of the loans.
For assessing the risk of default, at initial recognition, the Authority assigns the rating from credit ratingagencies for that particular counterparty. The Authority reviews the counterparty's credit ratings on afrequent basis.
The 12-month and lifetime LGDs are determined based on the factors which impact the recoveriesmade post default. These vary by financial asset type.
Maldives Monetary AuthorityAnnual Report 2020 175
Notes to the Financial StatementsYear ended 31 December 2020(all amounts in Maldivian Rufiyaa unless otherwise stated)
43 FINANCIAL RISK MANAGEMENT (CONTINUED)
43.1 Credit risk (Continued)
43.1.2 Expected Credit loss measurement (Continued)
43.1.2.4 Forward-looking information incorporated in the ECL models
For sovereign issuances in foreign currency, forward-looking economic variable are incorporated in thedetermination of the PD through respective rating in transition matrices published by external ratingagencies.
For financial assets held locally, various other forward-looking considerations are incorporated such asthe impact of any regulatory, legislative or political changes. This is reviewed and monitored forappropriateness on a regular basis.
Forward-looking economic information is also included in determining the 12-month and lifetime PD,EAD and LGD. These assumptions vary by financial asset type. Refer to Note 43.1.2.4 for an explanationof forward-looking information.
The assumptions underlying the ECL calculation are monitored and reviewed on an annual basis. Therehave been no significant changes in estimation techniques or significant assumptions made during thereporting period.
The calculation of ECL incorporates forward-looking information. The Authority has performed historicalanalysis for key economic variables impacting credit risk and expected credit losses for each portfolio.However, the Authority generally does not have any experience of credit loss.
For the foreign currency assets held abroad, the Authority generally relies on the rating agency's defaultstudy, as forward looking information is already incorporated in the transition tables used.
As the Authority has responsibilities in relation to the Maldivian economy, including forecasts, thepotential impact on the Authority's domestic assets are monitored. The Authority takes necessarymeasures to mitigate its own exposures from the policy operations.
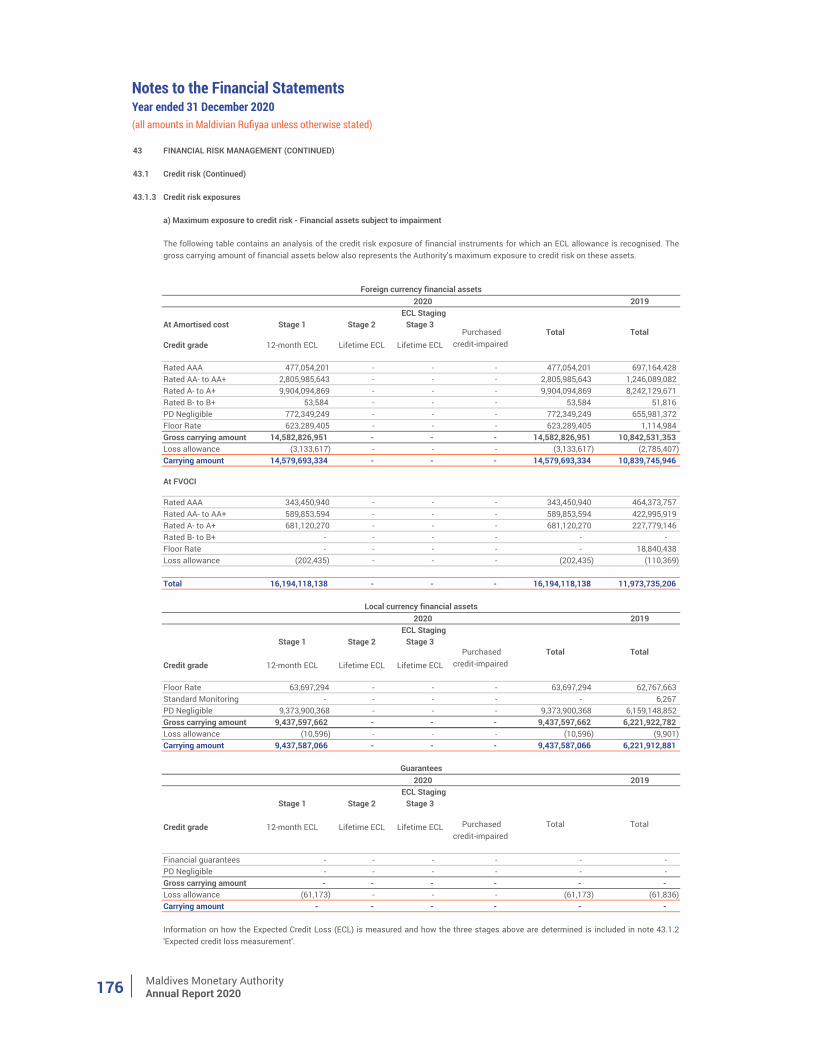
Maldives Monetary AuthorityAnnual Report 2020176
Notes to the Financial StatementsYear ended 31 December 2020(all amounts in Maldivian Rufiyaa unless otherwise stated)
43 FINANCIAL RISK MANAGEMENT (CONTINUED)
43.1 Credit risk (Continued)
43.1.3 Credit risk exposures
a) Maximum exposure to credit risk - Financial assets subject to impairment
2019
At Amortised cost Stage 1 Stage 2 Stage 3
Credit grade 12-month ECL Lifetime ECL Lifetime ECL
Rated AAA 477,054,201 - - - 477,054,201 697,164,428 Rated AA- to AA+ 2,805,985,643 - - - 2,805,985,643 1,246,089,082 Rated A- to A+ 9,904,094,869 - - - 9,904,094,869 8,242,129,671 Rated B- to B+ 53,584 - - - 53,584 51,816 PD Negligible 772,349,249 - - - 772,349,249 655,981,372 Floor Rate 623,289,405 - - - 623,289,405 1,114,984 Gross carrying amount 14,582,826,951 - - - 14,582,826,951 10,842,531,353 Loss allowance (3,133,617) - - - (3,133,617) (2,785,407) Carrying amount 14,579,693,334 - - - 14,579,693,334 10,839,745,946
At FVOCI
Rated AAA 343,450,940 - - - 343,450,940 464,373,757 Rated AA- to AA+ 589,853,594 - - - 589,853,594 422,995,919 Rated A- to A+ 681,120,270 - - - 681,120,270 227,779,146 Rated B- to B+ - - - - - - Floor Rate - - - - - 18,840,438 Loss allowance (202,435) - - - (202,435) (110,369)
Total 16,194,118,138 - - - 16,194,118,138 11,973,735,206
2019
Stage 1 Stage 2 Stage 3
Credit grade 12-month ECL Lifetime ECL Lifetime ECL
Floor Rate 63,697,294 - - - 63,697,294 62,767,663 Standard Monitoring - - - - - 6,267 PD Negligible 9,373,900,368 - - - 9,373,900,368 6,159,148,852 Gross carrying amount 9,437,597,662 - - - 9,437,597,662 6,221,922,782 Loss allowance (10,596) - - - (10,596) (9,901) Carrying amount 9,437,587,066 - - - 9,437,587,066 6,221,912,881
2019
Stage 1 Stage 2 Stage 3
Credit grade 12-month ECL Lifetime ECL Lifetime ECL
Financial guarantees - - - - - - PD Negligible - - - - - - Gross carrying amount - - - - - - Loss allowance (61,173) - - - (61,173) (61,836) Carrying amount - - - - - -
Information on how the Expected Credit Loss (ECL) is measured and how the three stages above are determined is included in note 43.1.2'Expected credit loss measurement'.
2020 ECL Staging
Purchased credit-impaired
Total Total
Guarantees
2020 ECL Staging
Purchased credit-impaired
Total Total
Local currency financial assets
Purchased credit-impaired
Total Total
The following table contains an analysis of the credit risk exposure of financial instruments for which an ECL allowance is recognised. Thegross carrying amount of financial assets below also represents the Authority's maximum exposure to credit risk on these assets.
2020 ECL Staging
Foreign currency financial assets
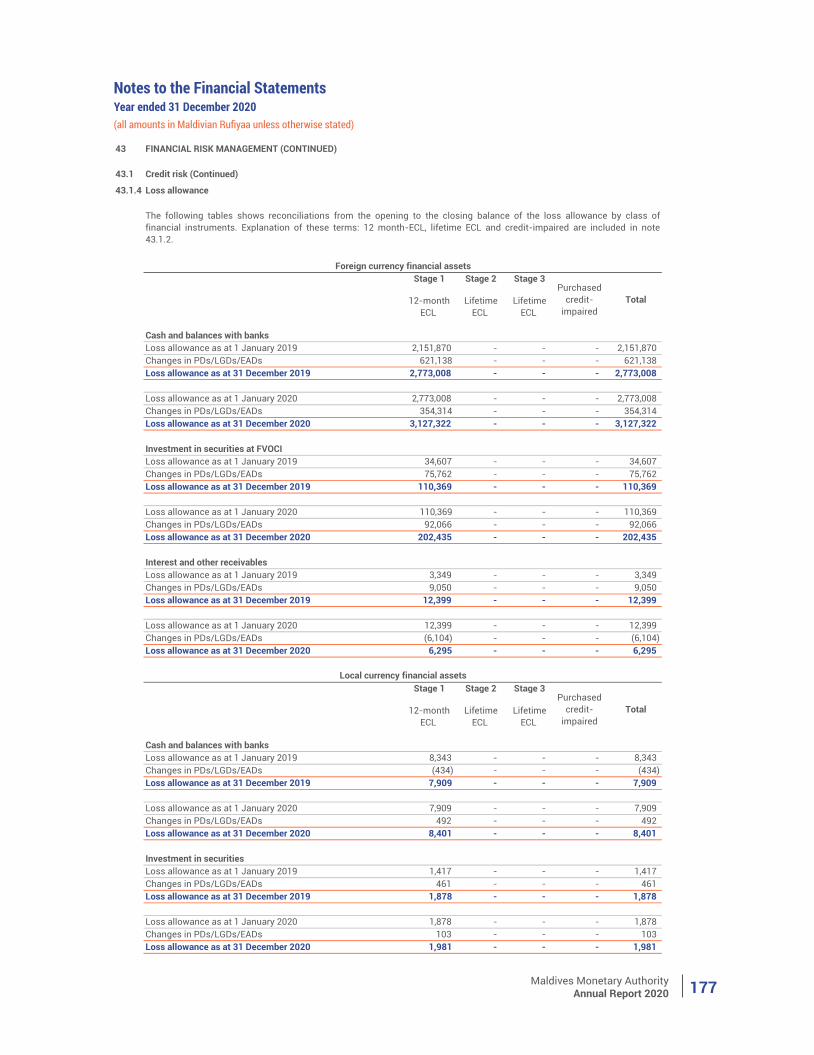
Maldives Monetary AuthorityAnnual Report 2020 177
Notes to the Financial StatementsYear ended 31 December 2020(all amounts in Maldivian Rufiyaa unless otherwise stated)
43 FINANCIAL RISK MANAGEMENT (CONTINUED)
43.1 Credit risk (Continued)
43.1.4 Loss allowance
Stage 1 Stage 2 Stage 3
12-month ECL
Lifetime ECL
Lifetime ECL
Cash and balances with banksLoss allowance as at 1 January 2019 2,151,870 - - - 2,151,870 Changes in PDs/LGDs/EADs 621,138 - - - 621,138 Loss allowance as at 31 December 2019 2,773,008 - - - 2,773,008
Loss allowance as at 1 January 2020 2,773,008 - - - 2,773,008 Changes in PDs/LGDs/EADs 354,314 - - - 354,314 Loss allowance as at 31 December 2020 3,127,322 - - - 3,127,322
Investment in securities at FVOCILoss allowance as at 1 January 2019 34,607 - - - 34,607 Changes in PDs/LGDs/EADs 75,762 - - - 75,762 Loss allowance as at 31 December 2019 110,369 - - - 110,369
Loss allowance as at 1 January 2020 110,369 - - - 110,369 Changes in PDs/LGDs/EADs 92,066 - - - 92,066 Loss allowance as at 31 December 2020 202,435 - - - 202,435
Interest and other receivablesLoss allowance as at 1 January 2019 3,349 - - - 3,349 Changes in PDs/LGDs/EADs 9,050 - - - 9,050 Loss allowance as at 31 December 2019 12,399 - - - 12,399
Loss allowance as at 1 January 2020 12,399 - - - 12,399 Changes in PDs/LGDs/EADs (6,104) - - - (6,104) Loss allowance as at 31 December 2020 6,295 - - - 6,295
Stage 1 Stage 2 Stage 3
12-month ECL
Lifetime ECL
Lifetime ECL
Cash and balances with banksLoss allowance as at 1 January 2019 8,343 - - - 8,343 Changes in PDs/LGDs/EADs (434) - - - (434) Loss allowance as at 31 December 2019 7,909 - - - 7,909
Loss allowance as at 1 January 2020 7,909 - - - 7,909 Changes in PDs/LGDs/EADs 492 - - - 492 Loss allowance as at 31 December 2020 8,401 - - - 8,401
Investment in securitiesLoss allowance as at 1 January 2019 1,417 - - - 1,417 Changes in PDs/LGDs/EADs 461 - - - 461 Loss allowance as at 31 December 2019 1,878 - - - 1,878
Loss allowance as at 1 January 2020 1,878 - - - 1,878 Changes in PDs/LGDs/EADs 103 - - - 103 Loss allowance as at 31 December 2020 1,981 - - - 1,981
The following tables shows reconciliations from the opening to the closing balance of the loss allowance by class offinancial instruments. Explanation of these terms: 12 month-ECL, lifetime ECL and credit-impaired are included in note43.1.2.
Purchased
credit-impaired
Total
Local currency financial assets
Foreign currency financial assets
Purchased
credit-impaired
Total
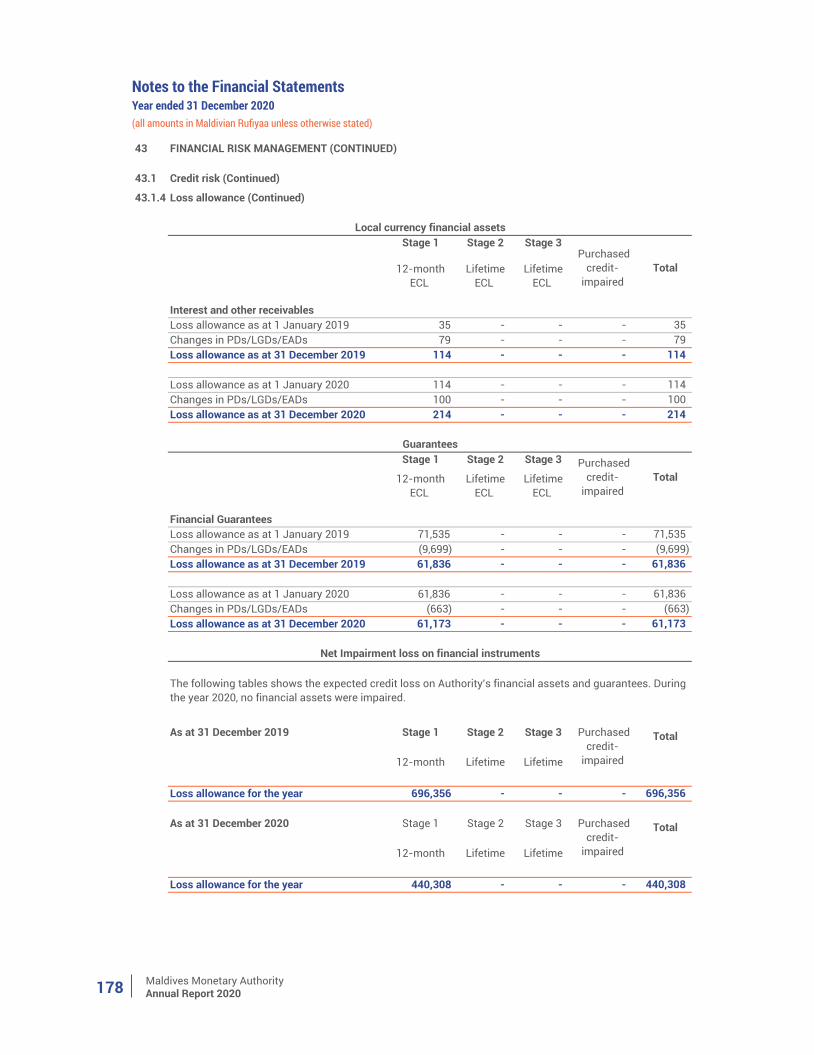
Maldives Monetary AuthorityAnnual Report 2020178
Notes to the Financial StatementsYear ended 31 December 2020(all amounts in Maldivian Rufiyaa unless otherwise stated)
43 FINANCIAL RISK MANAGEMENT (CONTINUED)
43.1 Credit risk (Continued)
43.1.4 Loss allowance (Continued)
Stage 1 Stage 2 Stage 3
12-month ECL
Lifetime ECL
Lifetime ECL
Interest and other receivablesLoss allowance as at 1 January 2019 35 - - - 35 Changes in PDs/LGDs/EADs 79 - - - 79 Loss allowance as at 31 December 2019 114 - - - 114
Loss allowance as at 1 January 2020 114 - - - 114 Changes in PDs/LGDs/EADs 100 - - - 100 Loss allowance as at 31 December 2020 214 - - - 214
Stage 1 Stage 2 Stage 3
12-month ECL
Lifetime ECL
Lifetime ECL
Financial GuaranteesLoss allowance as at 1 January 2019 71,535 - - - 71,535 Changes in PDs/LGDs/EADs (9,699) - - - (9,699) Loss allowance as at 31 December 2019 61,836 - - - 61,836
Loss allowance as at 1 January 2020 61,836 - - - 61,836 Changes in PDs/LGDs/EADs (663) - - - (663) Loss allowance as at 31 December 2020 61,173 - - - 61,173
As at 31 December 2019 Stage 1 Stage 2 Stage 3
12-month Lifetime Lifetime
Loss allowance for the year 696,356 - - - 696,356
As at 31 December 2020 Stage 1 Stage 2 Stage 3
12-month Lifetime Lifetime
Loss allowance for the year 440,308 - - - 440,308
Purchased credit-
impaired Total
Purchased credit-
impaired
Total
Purchased credit-
impaired
Total
Local currency financial assets
Purchased credit-
impaired Total
Net Impairment loss on financial instruments
The following tables shows the expected credit loss on Authority's financial assets and guarantees. During the year 2020, no financial assets were impaired.
Guarantees
Maldives Monetary AuthorityAnnual Report 2020 179
Notes to the Financial StatementsYear ended 31 December 2020(all amounts in Maldivian Rufiyaa unless otherwise stated)
43 FINANCIAL RISK MANAGEMENT (CONTINUED)
43.1 Credit risk (Continued)
43.1.5 Calculation of ECL
Foreign currency financial assets held abroad
43.1.6 Write off policy
43.1.7 Modification of financial assets
●
●
The contractual terms of a financial asset may be modified for a number of reasons, including changingmarket conditions, and other factors that are not related to a current or potential credit deterioration of thecounterparty. An existing asset whose terms have been modified may be derecognised and the renegotiatedasset recognised as a new one at fair value in accordance with the accounting policy set out in 4.1.1. Whenthe terms of a financial asset are modified and the modification does not result in derecognition, thedetermination of whether the asset’s credit risk has increased significantly reflects comparison of:
The Authority considers country rating while assigning a PD for financial assets backed by sovereignguarantees and financial assets issued by the Government.
The Authority does not consider that it has any credit exposure on its holdings of securities issued by theGovernment. Although a PD is assigned, LGD is deemed negligible for such assets. As it is required underIFRS 9, the Authority has looked at alternative scenarios on the Maldivian economy.
The Authority uses different methodologies for assessing the ECLs on its different portfolios.
For the purposes of estimating the ECL on foreign currency financial assets held abroad, the Authority usesratings published by the rating agencies. For the ECL calculation the PDs are based on one year transitionrates published by the rating agency. The Authority assigns floor rate (a minimum PD) based on Basel IIframework, for financial institutions, corporates and sovereign counterparties where the transition tablesindicate a lower PD than the floor rate. The Authority applies practical expedient option due to high creditquality of its financial assets, whereby ECL is calculated only for 12 months. However, when necessary,lifetime PD would be computed using information provided by rating agencies for ECL.
Foreign currency and local currency financial assets held locally and financial guarantees
its remaining lifetime PD at the reporting date based on the modified terms; with
the remaining lifetime PD estimated based on data at initial recognition and the original contractual terms.
The Authority would only write-off its financial assets, in whole or in part, when it has exhausted all practicalrecovery efforts and has concluded there is no reasonable expectation of recovery. Indicators that there is noreasonable expectation of recovery include:
(i) ceasing enforcement activity and
(ii) where the Authority's recovery method is foreclosing on collateral and the value of the collateral is suchthat there is no reasonable expectation of recovering in full.
The Authority has used historical loss rate and market rates for non-performing loans as the basis forcalculating PD for its exposures towards guarantees provided for affordable housing scheme during the year2020.
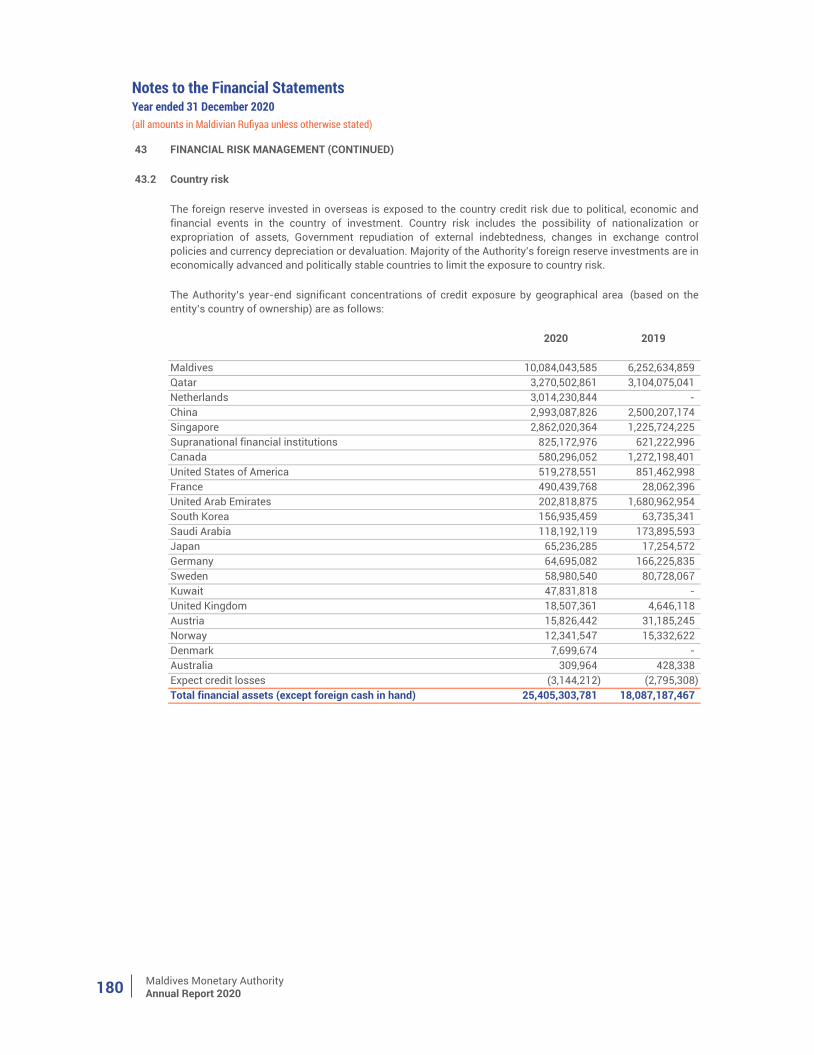
Maldives Monetary AuthorityAnnual Report 2020180
Notes to the Financial StatementsYear ended 31 December 2020(all amounts in Maldivian Rufiyaa unless otherwise stated)
43 FINANCIAL RISK MANAGEMENT (CONTINUED)
43.2 Country risk
2020 2019
Maldives 10,084,043,585 6,252,634,859 Qatar 3,270,502,861 3,104,075,041 Netherlands 3,014,230,844 - China 2,993,087,826 2,500,207,174 Singapore 2,862,020,364 1,225,724,225 Supranational financial institutions 825,172,976 621,222,996 Canada 580,296,052 1,272,198,401 United States of America 519,278,551 851,462,998 France 490,439,768 28,062,396 United Arab Emirates 202,818,875 1,680,962,954 South Korea 156,935,459 63,735,341 Saudi Arabia 118,192,119 173,895,593 Japan 65,236,285 17,254,572 Germany 64,695,082 166,225,835 Sweden 58,980,540 80,728,067 Kuwait 47,831,818 - United Kingdom 18,507,361 4,646,118 Austria 15,826,442 31,185,245 Norway 12,341,547 15,332,622 Denmark 7,699,674 - Australia 309,964 428,338 Expect credit losses (3,144,212) (2,795,308) Total financial assets (except foreign cash in hand) 25,405,303,781 18,087,187,467
The foreign reserve invested in overseas is exposed to the country credit risk due to political, economic andfinancial events in the country of investment. Country risk includes the possibility of nationalization orexpropriation of assets, Government repudiation of external indebtedness, changes in exchange controlpolicies and currency depreciation or devaluation. Majority of the Authority's foreign reserve investments are ineconomically advanced and politically stable countries to limit the exposure to country risk.
The Authority’s year-end significant concentrations of credit exposure by geographical area (based on theentity’s country of ownership) are as follows:
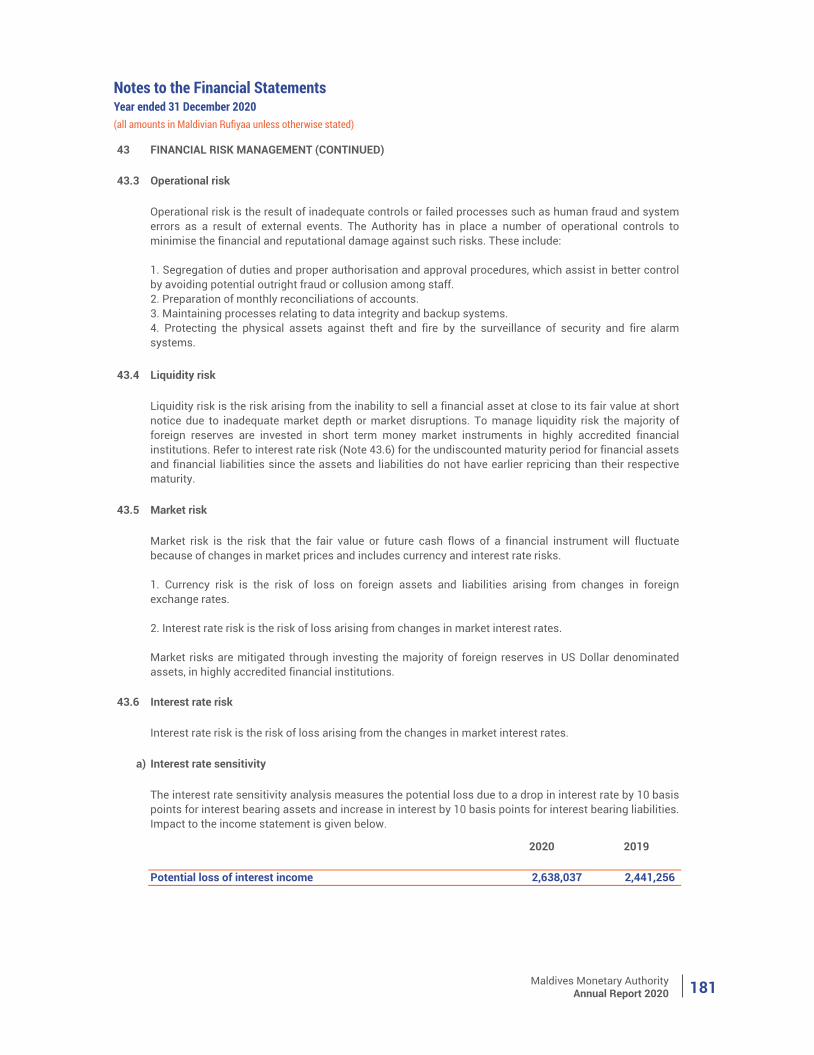
Maldives Monetary AuthorityAnnual Report 2020 181
Notes to the Financial StatementsYear ended 31 December 2020(all amounts in Maldivian Rufiyaa unless otherwise stated)
43 FINANCIAL RISK MANAGEMENT (CONTINUED)
43.3 Operational risk
43.4 Liquidity risk
43.5 Market risk
43.6 Interest rate risk
a) Interest rate sensitivity
2020 2019
Potential loss of interest income 2,638,037 2,441,256
Market risk is the risk that the fair value or future cash flows of a financial instrument will fluctuatebecause of changes in market prices and includes currency and interest rate risks.
1. Currency risk is the risk of loss on foreign assets and liabilities arising from changes in foreignexchange rates.
2. Interest rate risk is the risk of loss arising from changes in market interest rates.
Market risks are mitigated through investing the majority of foreign reserves in US Dollar denominatedassets, in highly accredited financial institutions.
The interest rate sensitivity analysis measures the potential loss due to a drop in interest rate by 10 basispoints for interest bearing assets and increase in interest by 10 basis points for interest bearing liabilities.Impact to the income statement is given below.
Operational risk is the result of inadequate controls or failed processes such as human fraud and systemerrors as a result of external events. The Authority has in place a number of operational controls tominimise the financial and reputational damage against such risks. These include:
1. Segregation of duties and proper authorisation and approval procedures, which assist in better controlby avoiding potential outright fraud or collusion among staff. 2. Preparation of monthly reconciliations of accounts.3. Maintaining processes relating to data integrity and backup systems. 4. Protecting the physical assets against theft and fire by the surveillance of security and fire alarmsystems.
Liquidity risk is the risk arising from the inability to sell a financial asset at close to its fair value at shortnotice due to inadequate market depth or market disruptions. To manage liquidity risk the majority offoreign reserves are invested in short term money market instruments in highly accredited financialinstitutions. Refer to interest rate risk (Note 43.6) for the undiscounted maturity period for financial assets and financial liabilities since the assets and liabilities do not have earlier repricing than their respectivematurity.
Interest rate risk is the risk of loss arising from the changes in market interest rates.
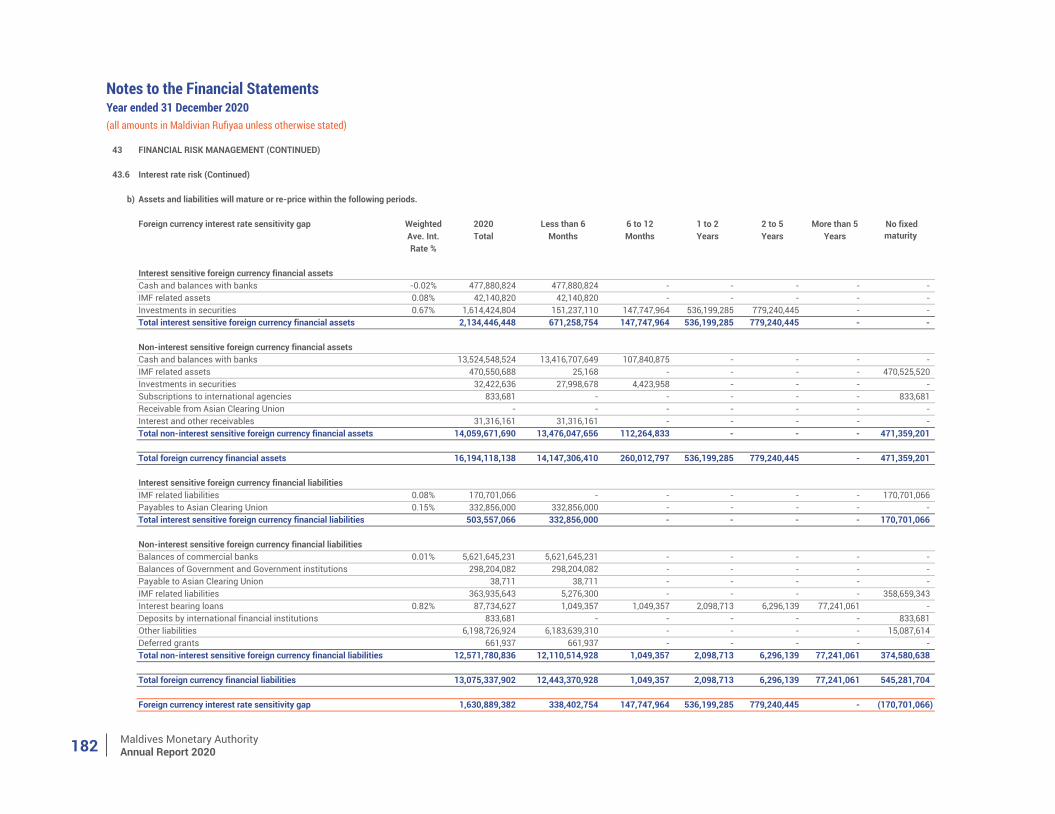
Maldives Monetary AuthorityAnnual Report 2020182
Notes to the Financial StatementsYear ended 31 December 2020(all amounts in Maldivian Rufiyaa unless otherwise stated)
43 FINANCIAL RISK MANAGEMENT (CONTINUED)
43.6 Interest rate risk (Continued)
b) Assets and liabilities will mature or re-price within the following periods.
Foreign currency interest rate sensitivity gap Weighted 2020 Less than 6 6 to 12 1 to 2 2 to 5 More than 5Ave. Int. Total Months Months Years Years YearsRate %
Interest sensitive foreign currency financial assetsCash and balances with banks -0.02% 477,880,824 477,880,824 - - - - - IMF related assets 0.08% 42,140,820 42,140,820 - - - - - Investments in securities 0.67% 1,614,424,804 151,237,110 147,747,964 536,199,285 779,240,445 - - Total interest sensitive foreign currency financial assets 2,134,446,448 671,258,754 147,747,964 536,199,285 779,240,445 - -
Non-interest sensitive foreign currency financial assetsCash and balances with banks 13,524,548,524 13,416,707,649 107,840,875 - - - - IMF related assets 470,550,688 25,168 - - - - 470,525,520 Investments in securities 32,422,636 27,998,678 4,423,958 - - - - Subscriptions to international agencies 833,681 - - - - - 833,681 Receivable from Asian Clearing Union - - - - - - - Interest and other receivables 31,316,161 31,316,161 - - - - - Total non-interest sensitive foreign currency financial assets 14,059,671,690 13,476,047,656 112,264,833 - - - 471,359,201
Total foreign currency financial assets 16,194,118,138 14,147,306,410 260,012,797 536,199,285 779,240,445 - 471,359,201
Interest sensitive foreign currency financial liabilitiesIMF related liabilities 0.08% 170,701,066 - - - - - 170,701,066 Payables to Asian Clearing Union 0.15% 332,856,000 332,856,000 - - - - - Total interest sensitive foreign currency financial liabilities 503,557,066 332,856,000 - - - - 170,701,066
Non-interest sensitive foreign currency financial liabilitiesBalances of commercial banks 0.01% 5,621,645,231 5,621,645,231 - - - - - Balances of Government and Government institutions 298,204,082 298,204,082 - - - - - Payable to Asian Clearing Union 38,711 38,711 - - - - - IMF related liabilities 363,935,643 5,276,300 - - - - 358,659,343 Interest bearing loans 0.82% 87,734,627 1,049,357 1,049,357 2,098,713 6,296,139 77,241,061 - Deposits by international financial institutions 833,681 - - - - - 833,681 Other liabilities 6,198,726,924 6,183,639,310 - - - - 15,087,614 Deferred grants 661,937 661,937 - - - - - Total non-interest sensitive foreign currency financial liabilities 12,571,780,836 12,110,514,928 1,049,357 2,098,713 6,296,139 77,241,061 374,580,638
Total foreign currency financial liabilities 13,075,337,902 12,443,370,928 1,049,357 2,098,713 6,296,139 77,241,061 545,281,704
Foreign currency interest rate sensitivity gap 1,630,889,382 338,402,754 147,747,964 536,199,285 779,240,445 - (170,701,066)
No fixed maturity
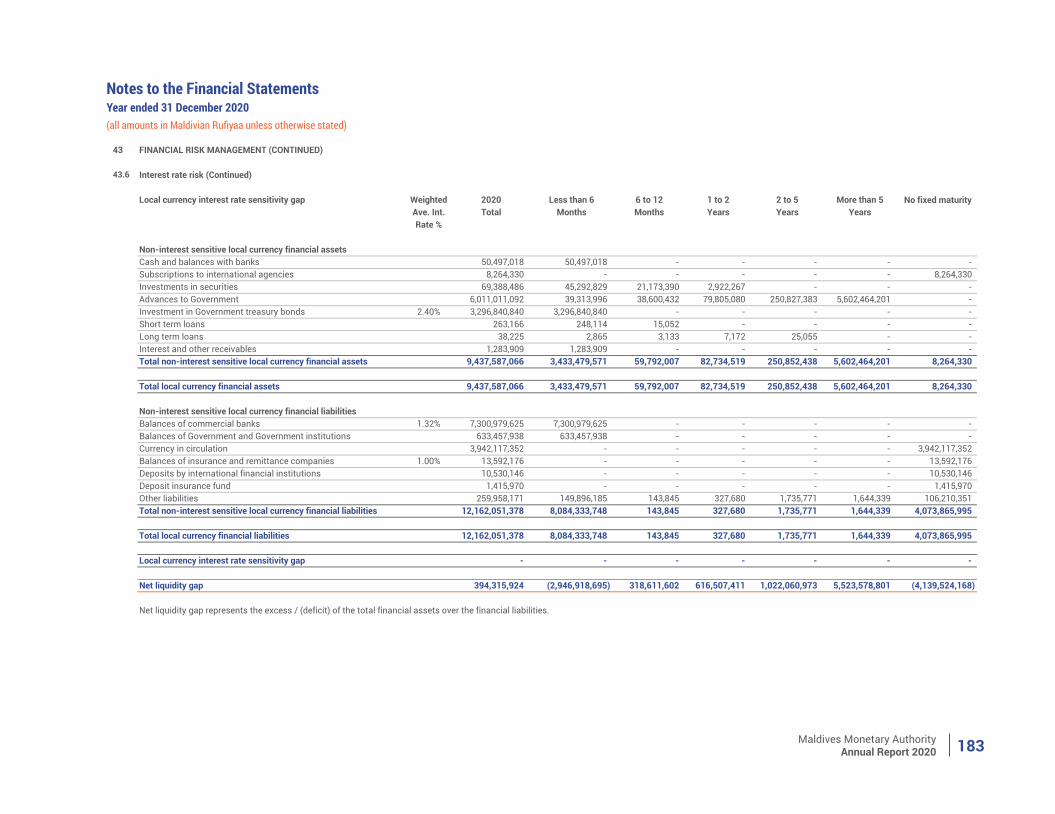
Maldives Monetary AuthorityAnnual Report 2020 183
Notes to the Financial StatementsYear ended 31 December 2020(all amounts in Maldivian Rufiyaa unless otherwise stated)
43 FINANCIAL RISK MANAGEMENT (CONTINUED)
43.6 Interest rate risk (Continued)
Local currency interest rate sensitivity gap Weighted 2020 Less than 6 6 to 12 1 to 2 2 to 5 More than 5Ave. Int. Total Months Months Years Years YearsRate %
Non-interest sensitive local currency financial assetsCash and balances with banks 50,497,018 50,497,018 - - - - - Subscriptions to international agencies 8,264,330 - - - - - 8,264,330 Investments in securities 69,388,486 45,292,829 21,173,390 2,922,267 - - - Advances to Government 6,011,011,092 39,313,996 38,600,432 79,805,080 250,827,383 5,602,464,201 - Investment in Government treasury bonds 2.40% 3,296,840,840 3,296,840,840 - - - - - Short term loans 263,166 248,114 15,052 - - - - Long term loans 38,225 2,865 3,133 7,172 25,055 - - Interest and other receivables 1,283,909 1,283,909 - - - - - Total non-interest sensitive local currency financial assets 9,437,587,066 3,433,479,571 59,792,007 82,734,519 250,852,438 5,602,464,201 8,264,330
Total local currency financial assets 9,437,587,066 3,433,479,571 59,792,007 82,734,519 250,852,438 5,602,464,201 8,264,330
Non-interest sensitive local currency financial liabilitiesBalances of commercial banks 1.32% 7,300,979,625 7,300,979,625 - - - - - Balances of Government and Government institutions 633,457,938 633,457,938 - - - - - Currency in circulation 3,942,117,352 - - - - - 3,942,117,352 Balances of insurance and remittance companies 1.00% 13,592,176 - - - - - 13,592,176 Deposits by international financial institutions 10,530,146 - - - - - 10,530,146 Deposit insurance fund 1,415,970 - - - - - 1,415,970 Other liabilities 259,958,171 149,896,185 143,845 327,680 1,735,771 1,644,339 106,210,351 Total non-interest sensitive local currency financial liabilities 12,162,051,378 8,084,333,748 143,845 327,680 1,735,771 1,644,339 4,073,865,995
Total local currency financial liabilities 12,162,051,378 8,084,333,748 143,845 327,680 1,735,771 1,644,339 4,073,865,995
Local currency interest rate sensitivity gap - - - - - - -
Net liquidity gap 394,315,924 (2,946,918,695) 318,611,602 616,507,411 1,022,060,973 5,523,578,801 (4,139,524,168)
Net liquidity gap represents the excess / (deficit) of the total financial assets over the financial liabilities.
No fixed maturity
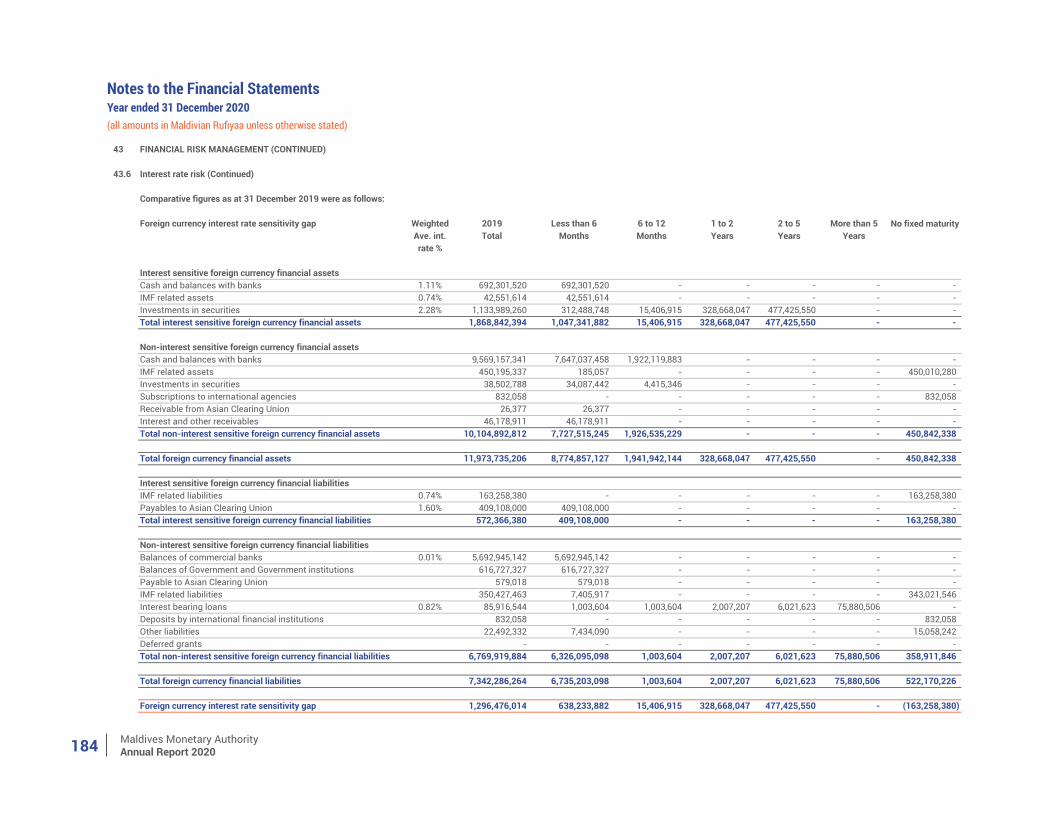
Maldives Monetary AuthorityAnnual Report 2020184
Notes to the Financial StatementsYear ended 31 December 2020(all amounts in Maldivian Rufiyaa unless otherwise stated)
43 FINANCIAL RISK MANAGEMENT (CONTINUED)
43.6 Interest rate risk (Continued)
Comparative figures as at 31 December 2019 were as follows:
Foreign currency interest rate sensitivity gap Weighted 2019 Less than 6 6 to 12 1 to 2 2 to 5 More than 5Ave. int. Total Months Months Years Years Yearsrate %
Interest sensitive foreign currency financial assetsCash and balances with banks 1.11% 692,301,520 692,301,520 - - - - - IMF related assets 0.74% 42,551,614 42,551,614 - - - - - Investments in securities 2.28% 1,133,989,260 312,488,748 15,406,915 328,668,047 477,425,550 - - Total interest sensitive foreign currency financial assets 1,868,842,394 1,047,341,882 15,406,915 328,668,047 477,425,550 - -
Non-interest sensitive foreign currency financial assetsCash and balances with banks 9,569,157,341 7,647,037,458 1,922,119,883 - - - - IMF related assets 450,195,337 185,057 - - - - 450,010,280 Investments in securities 38,502,788 34,087,442 4,415,346 - - - - Subscriptions to international agencies 832,058 - - - - - 832,058 Receivable from Asian Clearing Union 26,377 26,377 - - - - - Interest and other receivables 46,178,911 46,178,911 - - - - - Total non-interest sensitive foreign currency financial assets 10,104,892,812 7,727,515,245 1,926,535,229 - - - 450,842,338
Total foreign currency financial assets 11,973,735,206 8,774,857,127 1,941,942,144 328,668,047 477,425,550 - 450,842,338
Interest sensitive foreign currency financial liabilitiesIMF related liabilities 0.74% 163,258,380 - - - - - 163,258,380 Payables to Asian Clearing Union 1.60% 409,108,000 409,108,000 - - - - - Total interest sensitive foreign currency financial liabilities 572,366,380 409,108,000 - - - - 163,258,380
Non-interest sensitive foreign currency financial liabilitiesBalances of commercial banks 0.01% 5,692,945,142 5,692,945,142 - - - - - Balances of Government and Government institutions 616,727,327 616,727,327 - - - - - Payable to Asian Clearing Union 579,018 579,018 - - - - - IMF related liabilities 350,427,463 7,405,917 - - - - 343,021,546 Interest bearing loans 0.82% 85,916,544 1,003,604 1,003,604 2,007,207 6,021,623 75,880,506 - Deposits by international financial institutions 832,058 - - - - - 832,058 Other liabilities 22,492,332 7,434,090 - - - - 15,058,242 Deferred grants - - - - - - - Total non-interest sensitive foreign currency financial liabilities 6,769,919,884 6,326,095,098 1,003,604 2,007,207 6,021,623 75,880,506 358,911,846
Total foreign currency financial liabilities 7,342,286,264 6,735,203,098 1,003,604 2,007,207 6,021,623 75,880,506 522,170,226
Foreign currency interest rate sensitivity gap 1,296,476,014 638,233,882 15,406,915 328,668,047 477,425,550 - (163,258,380)
No fixed maturity
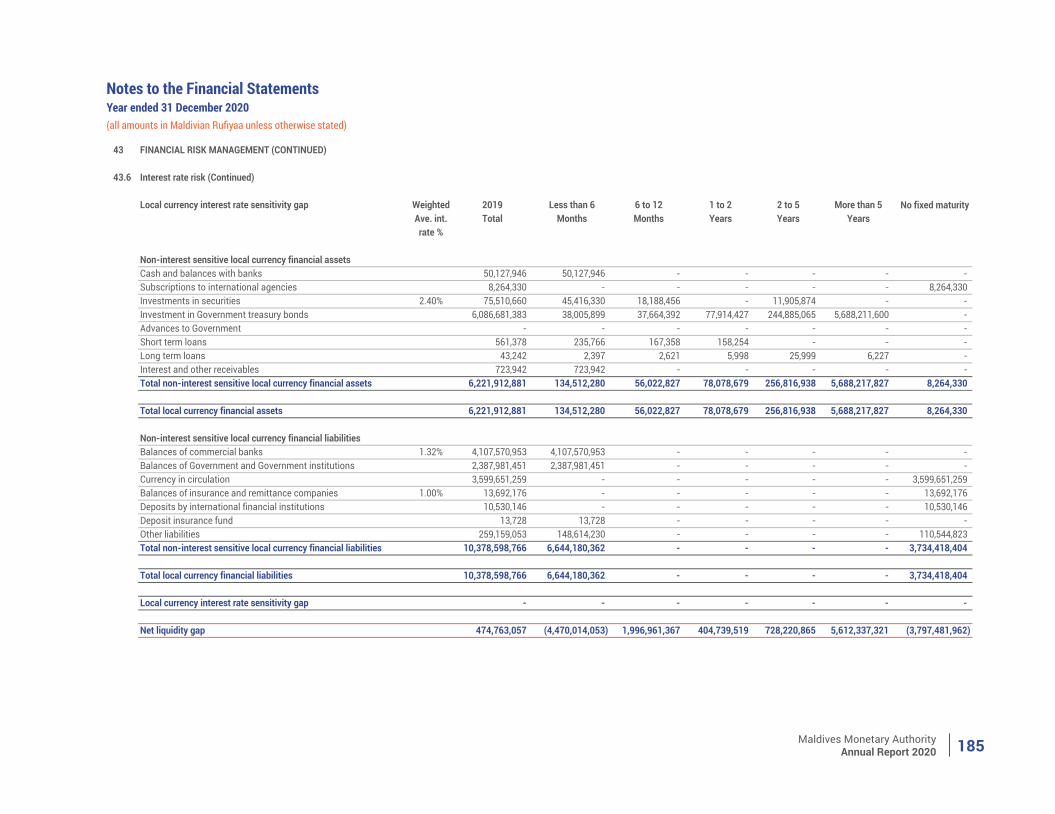
Maldives Monetary AuthorityAnnual Report 2020 185
Notes to the Financial StatementsYear ended 31 December 2020(all amounts in Maldivian Rufiyaa unless otherwise stated)
43 FINANCIAL RISK MANAGEMENT (CONTINUED)
43.6 Interest rate risk (Continued)
Local currency interest rate sensitivity gap Weighted 2019 Less than 6 6 to 12 1 to 2 2 to 5 More than 5Ave. int. Total Months Months Years Years Yearsrate %
Non-interest sensitive local currency financial assetsCash and balances with banks 50,127,946 50,127,946 - - - - - Subscriptions to international agencies 8,264,330 - - - - - 8,264,330 Investments in securities 2.40% 75,510,660 45,416,330 18,188,456 - 11,905,874 - - Investment in Government treasury bonds 6,086,681,383 38,005,899 37,664,392 77,914,427 244,885,065 5,688,211,600 - Advances to Government - - - - - - - Short term loans 561,378 235,766 167,358 158,254 - - - Long term loans 43,242 2,397 2,621 5,998 25,999 6,227 - Interest and other receivables 723,942 723,942 - - - - - Total non-interest sensitive local currency financial assets 6,221,912,881 134,512,280 56,022,827 78,078,679 256,816,938 5,688,217,827 8,264,330
Total local currency financial assets 6,221,912,881 134,512,280 56,022,827 78,078,679 256,816,938 5,688,217,827 8,264,330
Non-interest sensitive local currency financial liabilitiesBalances of commercial banks 1.32% 4,107,570,953 4,107,570,953 - - - - - Balances of Government and Government institutions 2,387,981,451 2,387,981,451 - - - - - Currency in circulation 3,599,651,259 - - - - - 3,599,651,259 Balances of insurance and remittance companies 1.00% 13,692,176 - - - - - 13,692,176 Deposits by international financial institutions 10,530,146 - - - - - 10,530,146 Deposit insurance fund 13,728 13,728 - - - - - Other liabilities 259,159,053 148,614,230 - - - - 110,544,823 Total non-interest sensitive local currency financial liabilities 10,378,598,766 6,644,180,362 - - - - 3,734,418,404
Total local currency financial liabilities 10,378,598,766 6,644,180,362 - - - - 3,734,418,404
Local currency interest rate sensitivity gap - - - - - - -
Net liquidity gap 474,763,057 (4,470,014,053) 1,996,961,367 404,739,519 728,220,865 5,612,337,321 (3,797,481,962)
No fixed maturity
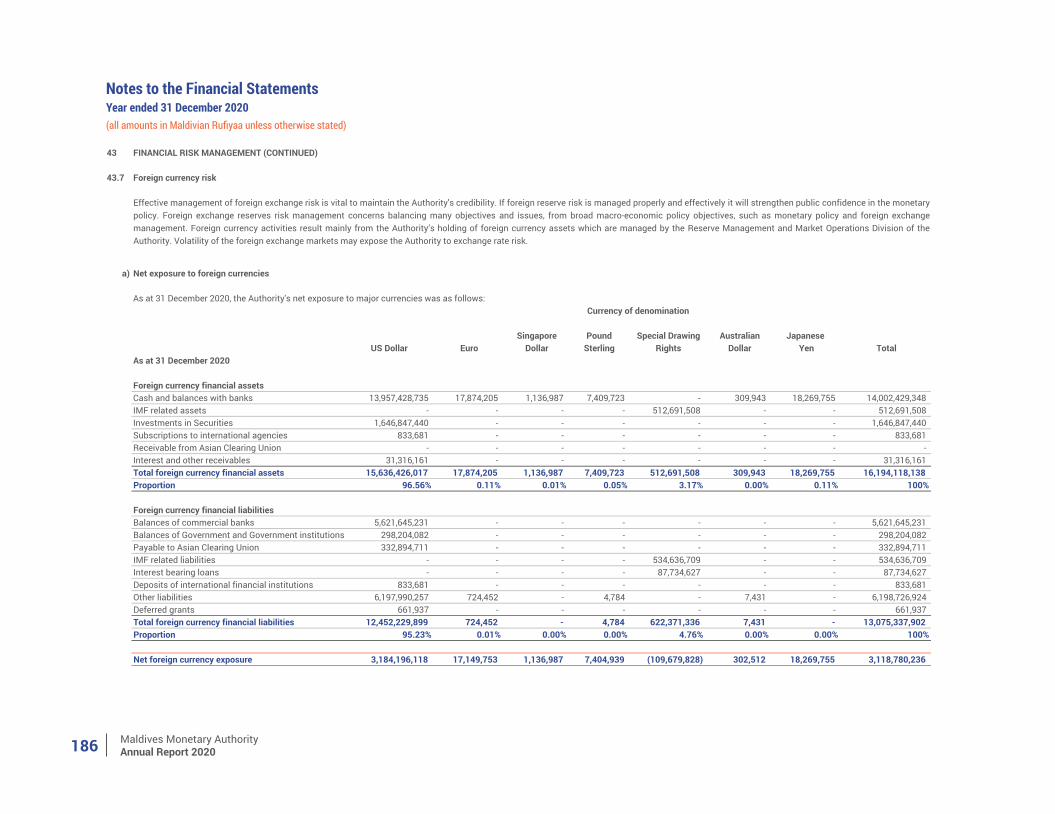
Maldives Monetary AuthorityAnnual Report 2020186
Notes to the Financial StatementsYear ended 31 December 2020(all amounts in Maldivian Rufiyaa unless otherwise stated)
43 FINANCIAL RISK MANAGEMENT (CONTINUED)
43.7 Foreign currency risk
a) Net exposure to foreign currencies
As at 31 December 2020, the Authority's net exposure to major currencies was as follows:
Singapore Pound Special Drawing Australian Japanese US Dollar Euro Dollar Sterling Rights Dollar Yen Total
As at 31 December 2020
Foreign currency financial assetsCash and balances with banks 13,957,428,735 17,874,205 1,136,987 7,409,723 - 309,943 18,269,755 14,002,429,348 IMF related assets - - - - 512,691,508 - - 512,691,508 Investments in Securities 1,646,847,440 - - - - - - 1,646,847,440 Subscriptions to international agencies 833,681 - - - - - - 833,681 Receivable from Asian Clearing Union - - - - - - - - Interest and other receivables 31,316,161 - - - - - - 31,316,161 Total foreign currency financial assets 15,636,426,017 17,874,205 1,136,987 7,409,723 512,691,508 309,943 18,269,755 16,194,118,138 Proportion 96.56% 0.11% 0.01% 0.05% 3.17% 0.00% 0.11% 100%
Foreign currency financial liabilitiesBalances of commercial banks 5,621,645,231 - - - - - - 5,621,645,231 Balances of Government and Government institutions 298,204,082 - - - - - - 298,204,082 Payable to Asian Clearing Union 332,894,711 - - - - - - 332,894,711 IMF related liabilities - - - - 534,636,709 - - 534,636,709 Interest bearing loans - - - - 87,734,627 - - 87,734,627 Deposits of international financial institutions 833,681 - - - - - - 833,681 Other liabilities 6,197,990,257 724,452 - 4,784 - 7,431 - 6,198,726,924 Deferred grants 661,937 - - - - - - 661,937 Total foreign currency financial liabilities 12,452,229,899 724,452 - 4,784 622,371,336 7,431 - 13,075,337,902 Proportion 95.23% 0.01% 0.00% 0.00% 4.76% 0.00% 0.00% 100%
Net foreign currency exposure 3,184,196,118 17,149,753 1,136,987 7,404,939 (109,679,828) 302,512 18,269,755 3,118,780,236
Currency of denomination
Effective management of foreign exchange risk is vital to maintain the Authority's credibility. If foreign reserve risk is managed properly and effectively it will strengthen public confidence in the monetarypolicy. Foreign exchange reserves risk management concerns balancing many objectives and issues, from broad macro-economic policy objectives, such as monetary policy and foreign exchangemanagement. Foreign currency activities result mainly from the Authority’s holding of foreign currency assets which are managed by the Reserve Management and Market Operations Division of theAuthority. Volatility of the foreign exchange markets may expose the Authority to exchange rate risk.
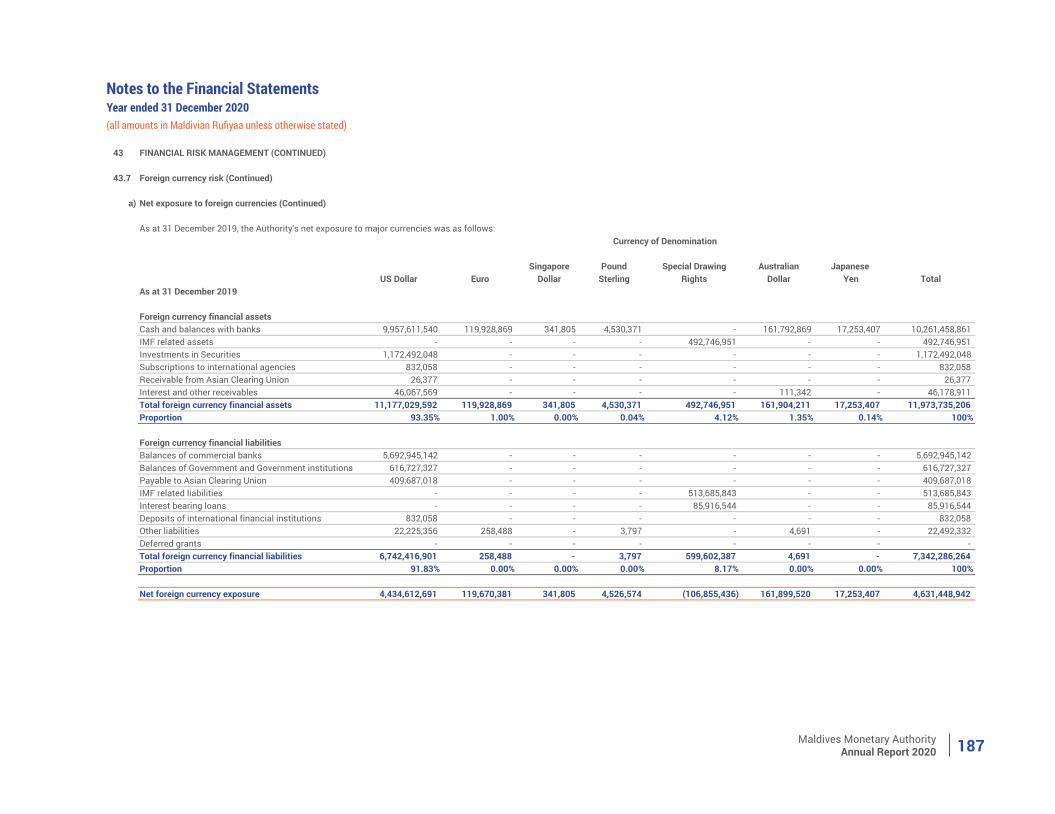
Maldives Monetary AuthorityAnnual Report 2020 187
Notes to the Financial StatementsYear ended 31 December 2020(all amounts in Maldivian Rufiyaa unless otherwise stated)
43 FINANCIAL RISK MANAGEMENT (CONTINUED)
43.7 Foreign currency risk (Continued)
a) Net exposure to foreign currencies (Continued)
As at 31 December 2019, the Authority's net exposure to major currencies was as follows:
Singapore Pound Special Drawing Australian Japanese US Dollar Euro Dollar Sterling Rights Dollar Yen Total
As at 31 December 2019
Foreign currency financial assetsCash and balances with banks 9,957,611,540 119,928,869 341,805 4,530,371 - 161,792,869 17,253,407 10,261,458,861 IMF related assets - - - - 492,746,951 - - 492,746,951 Investments in Securities 1,172,492,048 - - - - - - 1,172,492,048 Subscriptions to international agencies 832,058 - - - - - - 832,058 Receivable from Asian Clearing Union 26,377 - - - - - - 26,377 Interest and other receivables 46,067,569 - - - - 111,342 - 46,178,911 Total foreign currency financial assets 11,177,029,592 119,928,869 341,805 4,530,371 492,746,951 161,904,211 17,253,407 11,973,735,206 Proportion 93.35% 1.00% 0.00% 0.04% 4.12% 1.35% 0.14% 100%
Foreign currency financial liabilitiesBalances of commercial banks 5,692,945,142 - - - - - - 5,692,945,142 Balances of Government and Government institutions 616,727,327 - - - - - - 616,727,327 Payable to Asian Clearing Union 409,687,018 - - - - - - 409,687,018 IMF related liabilities - - - - 513,685,843 - - 513,685,843 Interest bearing loans - - - - 85,916,544 - - 85,916,544 Deposits of international financial institutions 832,058 - - - - - - 832,058 Other liabilities 22,225,356 258,488 - 3,797 - 4,691 - 22,492,332 Deferred grants - - - - - - - - Total foreign currency financial liabilities 6,742,416,901 258,488 - 3,797 599,602,387 4,691 - 7,342,286,264 Proportion 91.83% 0.00% 0.00% 0.00% 8.17% 0.00% 0.00% 100%
Net foreign currency exposure 4,434,612,691 119,670,381 341,805 4,526,574 (106,855,436) 161,899,520 17,253,407 4,631,448,942
Currency of Denomination
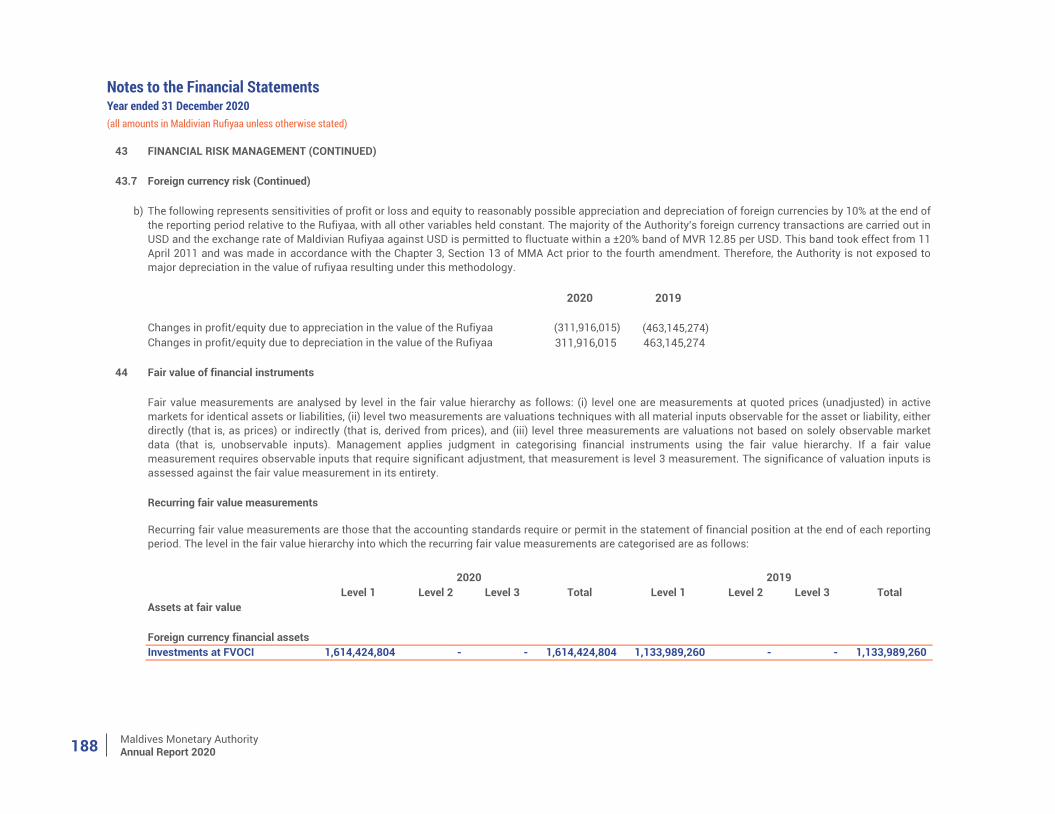
Maldives Monetary AuthorityAnnual Report 2020188
Notes to the Financial StatementsYear ended 31 December 2020(all amounts in Maldivian Rufiyaa unless otherwise stated)
43 FINANCIAL RISK MANAGEMENT (CONTINUED)
43.7 Foreign currency risk (Continued)
b)
2020 2019
Changes in profit/equity due to appreciation in the value of the Rufiyaa (311,916,015) (463,145,274) Changes in profit/equity due to depreciation in the value of the Rufiyaa 311,916,015 463,145,274
44 Fair value of financial instruments
Recurring fair value measurements
Level 1 Level 2 Level 3 Total Level 1 Level 2 Level 3 TotalAssets at fair value
Foreign currency financial assetsInvestments at FVOCI 1,614,424,804 - - 1,614,424,804 1,133,989,260 - - 1,133,989,260
The following represents sensitivities of profit or loss and equity to reasonably possible appreciation and depreciation of foreign currencies by 10% at the end ofthe reporting period relative to the Rufiyaa, with all other variables held constant. The majority of the Authority's foreign currency transactions are carried out inUSD and the exchange rate of Maldivian Rufiyaa against USD is permitted to fluctuate within a ±20% band of MVR 12.85 per USD. This band took effect from 11April 2011 and was made in accordance with the Chapter 3, Section 13 of MMA Act prior to the fourth amendment. Therefore, the Authority is not exposed tomajor depreciation in the value of rufiyaa resulting under this methodology.
Fair value measurements are analysed by level in the fair value hierarchy as follows: (i) level one are measurements at quoted prices (unadjusted) in activemarkets for identical assets or liabilities, (ii) level two measurements are valuations techniques with all material inputs observable for the asset or liability, eitherdirectly (that is, as prices) or indirectly (that is, derived from prices), and (iii) level three measurements are valuations not based on solely observable marketdata (that is, unobservable inputs). Management applies judgment in categorising financial instruments using the fair value hierarchy. If a fair valuemeasurement requires observable inputs that require significant adjustment, that measurement is level 3 measurement. The significance of valuation inputs isassessed against the fair value measurement in its entirety.
Recurring fair value measurements are those that the accounting standards require or permit in the statement of financial position at the end of each reportingperiod. The level in the fair value hierarchy into which the recurring fair value measurements are categorised are as follows:
2020 2019
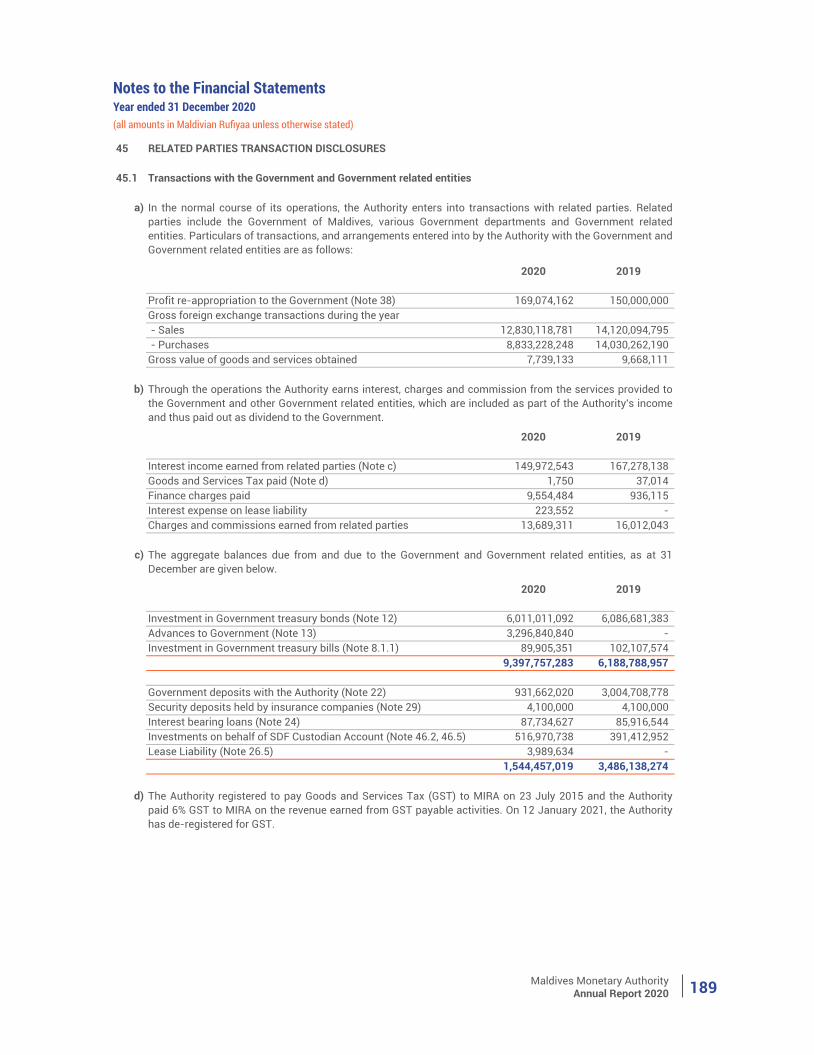
Maldives Monetary AuthorityAnnual Report 2020 189
Notes to the Financial StatementsYear ended 31 December 2020(all amounts in Maldivian Rufiyaa unless otherwise stated)
45 RELATED PARTIES TRANSACTION DISCLOSURES
45.1 Transactions with the Government and Government related entities
a)
2020 2019
Profit re-appropriation to the Government (Note 38) 169,074,162 150,000,000 Gross foreign exchange transactions during the year - Sales 12,830,118,781 14,120,094,795 - Purchases 8,833,228,248 14,030,262,190 Gross value of goods and services obtained 7,739,133 9,668,111
b)
2020 2019
Interest income earned from related parties (Note c) 149,972,543 167,278,138 Goods and Services Tax paid (Note d) 1,750 37,014 Finance charges paid 9,554,484 936,115 Interest expense on lease liability 223,552 - Charges and commissions earned from related parties 13,689,311 16,012,043
c)
2020 2019
Investment in Government treasury bonds (Note 12) 6,011,011,092 6,086,681,383 Advances to Government (Note 13) 3,296,840,840 - Investment in Government treasury bills (Note 8.1.1) 89,905,351 102,107,574
9,397,757,283 6,188,788,957
Government deposits with the Authority (Note 22) 931,662,020 3,004,708,778 Security deposits held by insurance companies (Note 29) 4,100,000 4,100,000 Interest bearing loans (Note 24) 87,734,627 85,916,544 Investments on behalf of SDF Custodian Account (Note 46.2, 46.5) 516,970,738 391,412,952 Lease Liability (Note 26.5) 3,989,634 -
1,544,457,019 3,486,138,274
d)
In the normal course of its operations, the Authority enters into transactions with related parties. Relatedparties include the Government of Maldives, various Government departments and Government relatedentities. Particulars of transactions, and arrangements entered into by the Authority with the Government andGovernment related entities are as follows:
Through the operations the Authority earns interest, charges and commission from the services provided tothe Government and other Government related entities, which are included as part of the Authority's incomeand thus paid out as dividend to the Government.
The aggregate balances due from and due to the Government and Government related entities, as at 31December are given below.
The Authority registered to pay Goods and Services Tax (GST) to MIRA on 23 July 2015 and the Authoritypaid 6% GST to MIRA on the revenue earned from GST payable activities. On 12 January 2021, the Authorityhas de-registered for GST.
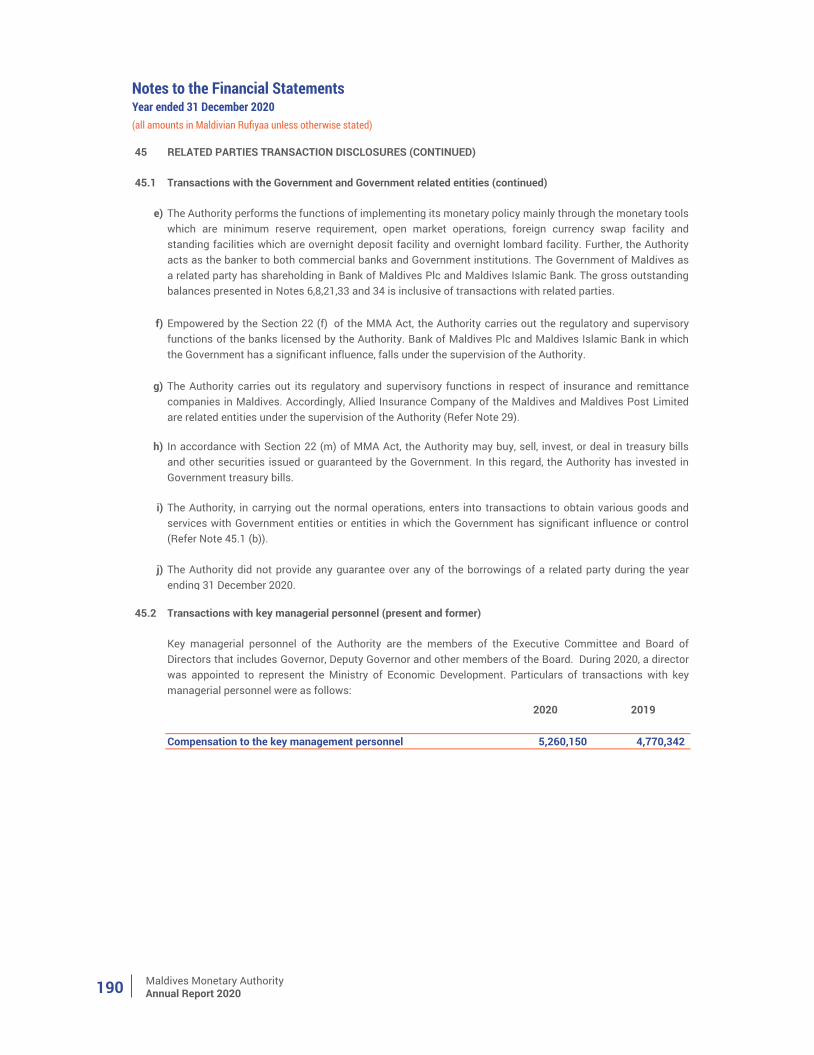
Maldives Monetary AuthorityAnnual Report 2020190
Notes to the Financial Statements
(all amounts in Maldivian Rufiyaa unless otherwise stated)
45 RELATED PARTIES TRANSACTION DISCLOSURES (CONTINUED)
45.1 Transactions with the Government and Government related entities (continued)
e)
f)
g)
h)
i)
j)
45.2
2020 2019
Compensation to the key management personnel 5,260,150 4,770,342
The Authority performs the functions of implementing its monetary policy mainly through the monetary toolswhich are minimum reserve requirement, open market operations, foreign currency swap facility andstanding facilities which are overnight deposit facility and overnight lombard facility. Further, the Authorityacts as the banker to both commercial banks and Government institutions. The Government of Maldives asa related party has shareholding in Bank of Maldives Plc and Maldives Islamic Bank. The gross outstandingbalances presented in Notes 6,8,21,33 and 34 is inclusive of transactions with related parties.
Transactions with key managerial personnel (present and former)
Key managerial personnel of the Authority are the members of the Executive Committee and Board ofDirectors that includes Governor, Deputy Governor and other members of the Board. During 2020, a directorwas appointed to represent the Ministry of Economic Development. Particulars of transactions with keymanagerial personnel were as follows:
The Authority carries out its regulatory and supervisory functions in respect of insurance and remittancecompanies in Maldives. Accordingly, Allied Insurance Company of the Maldives and Maldives Post Limitedare related entities under the supervision of the Authority (Refer Note 29).
Empowered by the Section 22 (f) of the MMA Act, the Authority carries out the regulatory and supervisoryfunctions of the banks licensed by the Authority. Bank of Maldives Plc and Maldives Islamic Bank in whichthe Government has a significant influence, falls under the supervision of the Authority.
In accordance with Section 22 (m) of MMA Act, the Authority may buy, sell, invest, or deal in treasury billsand other securities issued or guaranteed by the Government. In this regard, the Authority has invested inGovernment treasury bills.
The Authority, in carrying out the normal operations, enters into transactions to obtain various goods andservices with Government entities or entities in which the Government has significant influence or control(Refer Note 45.1 (b)).
The Authority did not provide any guarantee over any of the borrowings of a related party during the yearending 31 December 2020.
Year ended 31 December 2020
Maldives Monetary AuthorityAnnual Report 2020 191
Notes to the Financial Statements
(all amounts in Maldivian Rufiyaa unless otherwise stated)
46
46.1 Guarantees
46.2 Fiduciary activities
46.3 Legal claims
46.4 Commitments
46.5 Off balance sheet items
46.5.1 Investments by Sovereign Development Fund (SDF) custodian account
In accordance with section 22 (r) of the ammended MMA Act, the Authority could borrow money or issueguarantees, inside or outside Maldives, on such terms and conditions as the Board may prescribe.
As at 31 December 2020 the Authority has given guarantees to the following schemes:
Credit Guarantee Scheme introduced by the Authority on 7 August 2016 (refer to note 28.6), a total valueof MVR 44,993,435 was guaranteed as at 31 December 2020. The scheme has been terminated effectivefrom 1 February 2021.
CONTINGENT LIABILITIES, CAPITAL COMMITMENTS AND OFF-BALANCE SHEET ITEMS
On behalf of the SDF custodian account, the Authority holds and manages its investments in both foreignand local currency. These investments are payable to the fund upon maturity with its return. As at thereporting date, the Authority holds investment value of MVR 505,180,275 (2019: MVR 350,633,950) andprofit/interest accrued of MVR 11,790,463 (2019: MVR 40,779,002).
The Affordable Housing Scheme (AHS) regulation was published in the August 2017 and as per the AHSregulation, the scheme is to be operated for a period of three years. A fund of MVR 30 million was set up toguarantee the down payment or equity component of the loans under the scheme.As at December 2020,guarantee in lieu of equity/down payment was issued by the Authority to the amount of MVR 23,965,000for loans approved under the phase one of AHS. As the tenor of the regulation lapsed in August 2020, theScheme was discontinued as per the regulation.
As at the reporting date, investments made by the Sovereign Development Fund (SDF) custodian accountunder Ministry of Finance (refer to note 46.2) are carried off-balance sheet.
On the request made by the MOF, with reference to the loan agreements signed between the Governmentand the Islamic Development Bank, the Authority undertakes to provide the foreign exchange required torepay the loans inclusive of service fees when repayment instalments and service fees fall due. Inconsideration, the MOF on behalf of the Government has counter guaranteed to repay the Authority, theequivalent Rufiyaa for the aforesaid payments.
The Authority carries out fiduciary activities under the provisions of the MMA Act. Acting in such capacityresults in holding or placing of funds on behalf of various parties. However, the Authority does not expectany liability to arise on account of such activities.
There are no on-going legal proceedings against the Authority as of 31 December 2020.
Year ended 31 December 2020
Maldives Monetary AuthorityAnnual Report 2020192
Notes to the Financial StatementsYear ended 31 December 2020(all amounts in Maldivian Rufiyaa unless otherwise stated)
46
46.5 Off balance sheet items (Continued)
46.5.2 Other IMF related obligations - Rapid Credit Facility
47 EVENTS OCCURRING SUBSEQUENT TO REPORTING DATE
47.1
47.2
47.3
Maintaining financial and monetary stability
The IMF provides Rapid Credit Facility (RCF) as a concessional financial assistance with limitedconditionality to low-income countries (LICs) facing an urgent balance of payment need, including intimes of crisis.
Under the RCF, the Government of Maldives received a disbursement of SDR 21.2 million (USD 28.9million) on 24 April 2020, to help cover balance of payments and fiscal needs, stemming from the COVID-19 pandemic. The loan which carries a zero percent interest rate will mature on 24 April 2030 and the firstrepayment is due on 23 October 2025. The Authority undertakes it's responsbility as the fiscal agent inensuring timely servicing of financial obligations to the IMF. As per the Memorandum of Understandingsigned between the Authority and MOF, repayments and all costs related to the RCF disbursement, arethe responsibility of MOF.
CONTINGENT LIABILITIES, CAPITAL COMMITMENTS AND OFF-BALANCE SHEET ITEMS (CONTINUED)
Corresponding to the market volatility and uncertainty due to COVID-19, the Management has consideredthe key areas of the Authority’s operations and financial statements, as well as policy actions takenwhich, subsequent to year end, are impacted by the pandemic. Operational impacts the Authority has putin place measures to enable it to continue functioning operationally, further details of these have beenincluded in the Annual Report.
Financial impacts Financial assets and liabilities
IFRS 9 Financial Instruments: Recognition and Measurement outlines the requirements for the recognitionand measurement of financial assets and liabilities. For financial instruments measured at fair value, theAuthority has assessed the year end valuations to be appropriate as they reflect the market prices at thatdate as determined in an active market.
Expected credit loss
IFRS 9 Financial Instruments requires that in determining the Expected Credit Loss (ECL), estimates offorward-looking macroeconomic factors are incorporated about the future economy. A sensitivityanalysis of the ECL provision calculation has been performed taking into account the Authority’s currentassessment of the possible impacts of COVID-19.
There have been no other material events, occurring after the reporting date that require adjustments to ordisclosure in the financial statements.
Maldives Monetary AuthorityAnnual Report 2020 193
STATISTICAL APPENDIX
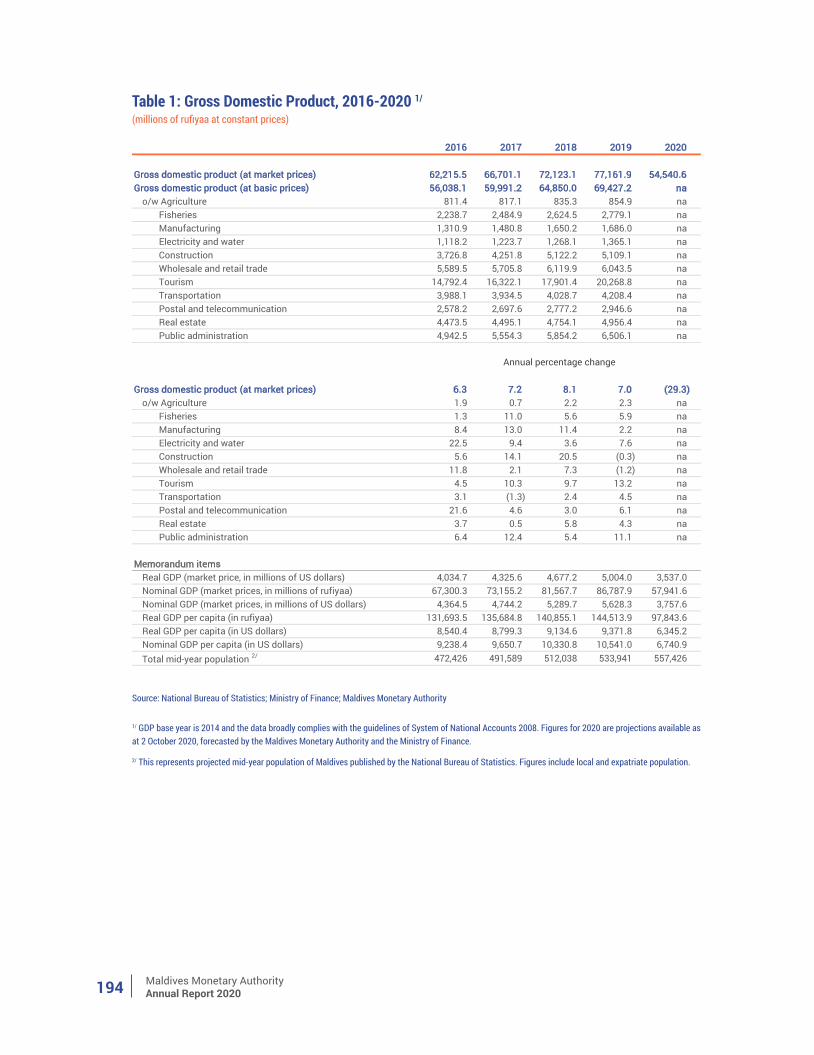
Maldives Monetary AuthorityAnnual Report 2020194
Table 1: Gross Domestic Product, 2016-2020 1/
(millions of rufiyaa at constant prices)
Source: National Bureau of Statistics; Ministry of Finance; Maldives Monetary Authority
1/ GDP base year is 2014 and the data broadly complies with the guidelines of System of National Accounts 2008. Figures for 2020 are projections available as at 2 October 2020, forecasted by the Maldives Monetary Authority and the Ministry of Finance.
2/ This represents projected mid-year population of Maldives published by the National Bureau of Statistics. Figures include local and expatriate population.
2016 2017 2018 2019 2020
Gross domestic product (at market prices) 62,215.5 66,701.1 72,123.1 77,161.9 54,540.6 Gross domestic product (at basic prices) 56,038.1 59,991.2 64,850.0 69,427.2 na
o/w Agriculture 811.4 817.1 835.3 854.9 naFisheries 2,238.7 2,484.9 2,624.5 2,779.1 naManufacturing 1,310.9 1,480.8 1,650.2 1,686.0 naElectricity and water 1,118.2 1,223.7 1,268.1 1,365.1 naConstruction 3,726.8 4,251.8 5,122.2 5,109.1 naWholesale and retail trade 5,589.5 5,705.8 6,119.9 6,043.5 naTourism 14,792.4 16,322.1 17,901.4 20,268.8 naTransportation 3,988.1 3,934.5 4,028.7 4,208.4 naPostal and telecommunication 2,578.2 2,697.6 2,777.2 2,946.6 naReal estate 4,473.5 4,495.1 4,754.1 4,956.4 naPublic administration 4,942.5 5,554.3 5,854.2 6,506.1 na
Gross domestic product (at market prices) 6.3 7.2 8.1 7.0 (29.3) o/w Agriculture 1.9 0.7 2.2 2.3 na
Fisheries 1.3 11.0 5.6 5.9 naManufacturing 8.4 13.0 11.4 2.2 naElectricity and water 22.5 9.4 3.6 7.6 naConstruction 5.6 14.1 20.5 (0.3) naWholesale and retail trade 11.8 2.1 7.3 (1.2) naTourism 4.5 10.3 9.7 13.2 naTransportation 3.1 (1.3) 2.4 4.5 naPostal and telecommunication 21.6 4.6 3.0 6.1 naReal estate 3.7 0.5 5.8 4.3 naPublic administration 6.4 12.4 5.4 11.1 na
Memorandum itemsReal GDP (market price, in millions of US dollars) 4,034.7 4,325.6 4,677.2 5,004.0 3,537.0 Nominal GDP (market prices, in millions of rufiyaa) 67,300.3 73,155.2 81,567.7 86,787.9 57,941.6 Nominal GDP (market prices, in millions of US dollars) 4,364.5 4,744.2 5,289.7 5,628.3 3,757.6 Real GDP per capita (in rufiyaa) 131,693.5 135,684.8 140,855.1 144,513.9 97,843.6 Real GDP per capita (in US dollars) 8,540.4 8,799.3 9,134.6 9,371.8 6,345.2 Nominal GDP per capita (in US dollars) 9,238.4 9,650.7 10,330.8 10,541.0 6,740.9 Total mid-year population 2/ 472,426 491,589 512,038 533,941 557,426
Annual percentage change
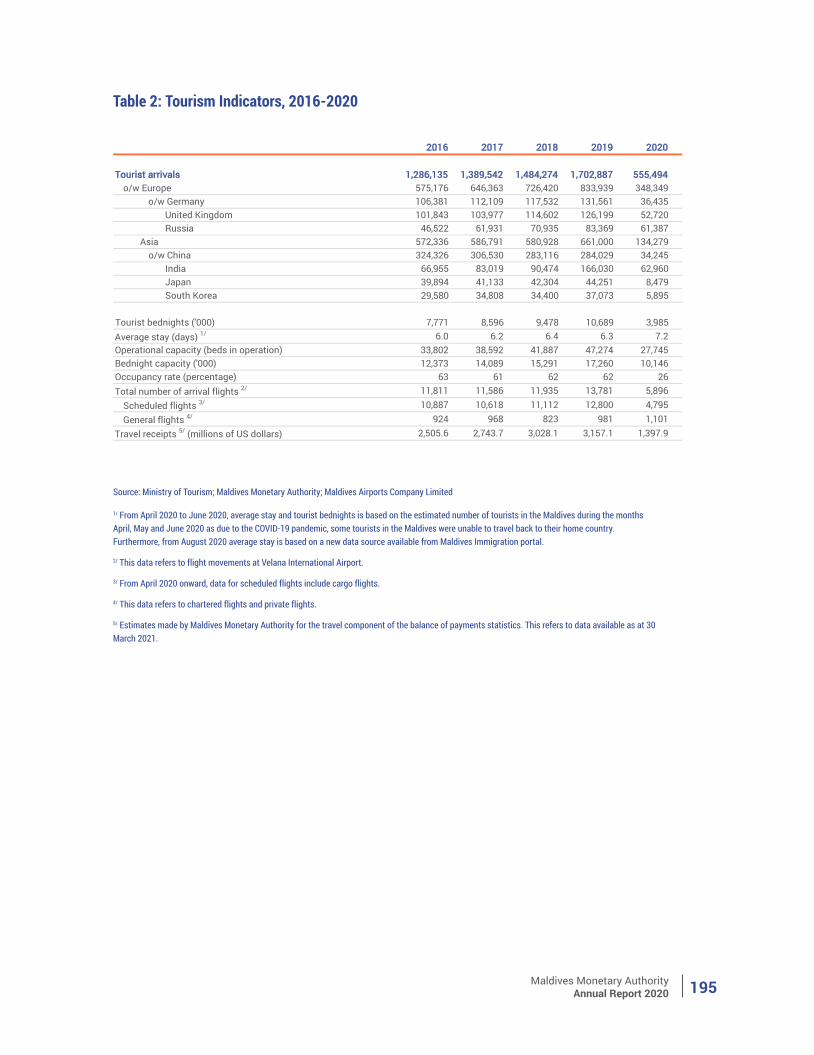
Maldives Monetary AuthorityAnnual Report 2020 195
Table 2: Tourism Indicators, 2016-2020
Source: Ministry of Tourism; Maldives Monetary Authority; Maldives Airports Company Limited
1/ From April 2020 to June 2020, average stay and tourist bednights is based on the estimated number of tourists in the Maldives during the months April, May and June 2020 as due to the COVID-19 pandemic, some tourists in the Maldives were unable to travel back to their home country. Furthermore, from August 2020 average stay is based on a new data source available from Maldives Immigration portal.
2/ This data refers to flight movements at Velana International Airport.
3/ From April 2020 onward, data for scheduled flights include cargo flights.
4/ This data refers to chartered flights and private flights.
5/ Estimates made by Maldives Monetary Authority for the travel component of the balance of payments statistics. This refers to data available as at 30 March 2021.
2016 2017 2018 2019 2020
Tourist arrivals 1,286,135 1,389,542 1,484,274 1,702,887 555,494 o/w Europe 575,176 646,363 726,420 833,939 348,349
o/w Germany 106,381 112,109 117,532 131,561 36,435 United Kingdom 101,843 103,977 114,602 126,199 52,720 Russia 46,522 61,931 70,935 83,369 61,387
Asia 572,336 586,791 580,928 661,000 134,279 o/w China 324,326 306,530 283,116 284,029 34,245
India 66,955 83,019 90,474 166,030 62,960 Japan 39,894 41,133 42,304 44,251 8,479 South Korea 29,580 34,808 34,400 37,073 5,895
Tourist bednights ('000) 7,771 8,596 9,478 10,689 3,985 Average stay (days) 1/ 6.0 6.2 6.4 6.3 7.2 Operational capacity (beds in operation) 33,802 38,592 41,887 47,274 27,745 Bednight capacity ('000) 12,373 14,089 15,291 17,260 10,146 Occupancy rate (percentage) 63 61 62 62 26 Total number of arrival flights 2/ 11,811 11,586 11,935 13,781 5,896
Scheduled flights 3/ 10,887 10,618 11,112 12,800 4,795 General flights 4/ 924 968 823 981 1,101
Travel receipts 5/ (millions of US dollars) 2,505.6 2,743.7 3,028.1 3,157.1 1,397.9
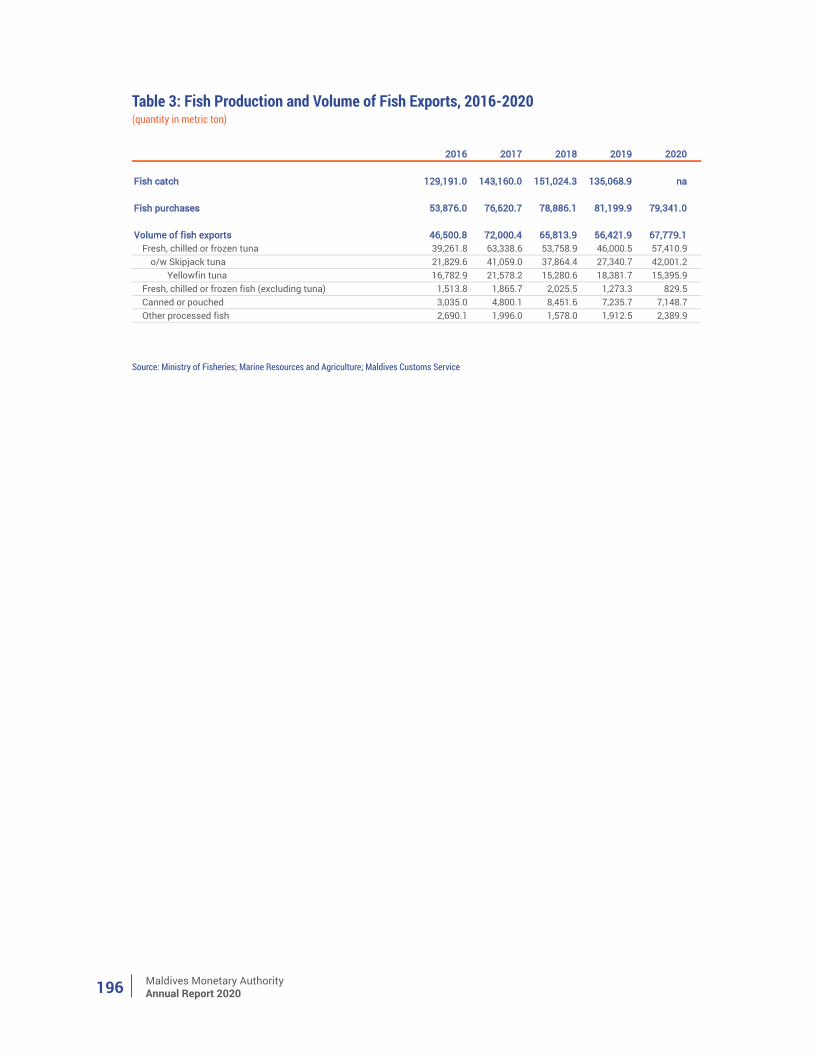
Maldives Monetary AuthorityAnnual Report 2020196
Table 3: Fish Production and Volume of Fish Exports, 2016-2020(quantity in metric ton)
Source: Ministry of Fisheries; Marine Resources and Agriculture; Maldives Customs Service
2016 2017 2018 2019 2020
Fish catch 129,191.0 143,160.0 151,024.3 135,068.9 na
Fish purchases 53,876.0 76,620.7 78,886.1 81,199.9 79,341.0
Volume of fish exports 46,500.8 72,000.4 65,813.9 56,421.9 67,779.1 Fresh, chilled or frozen tuna 39,261.8 63,338.6 53,758.9 46,000.5 57,410.9
o/w Skipjack tuna 21,829.6 41,059.0 37,864.4 27,340.7 42,001.2 Yellowfin tuna 16,782.9 21,578.2 15,280.6 18,381.7 15,395.9
Fresh, chilled or frozen fish (excluding tuna) 1,513.8 1,865.7 2,025.5 1,273.3 829.5 Canned or pouched 3,035.0 4,800.1 8,451.6 7,235.7 7,148.7 Other processed fish 2,690.1 1,996.0 1,578.0 1,912.5 2,389.9
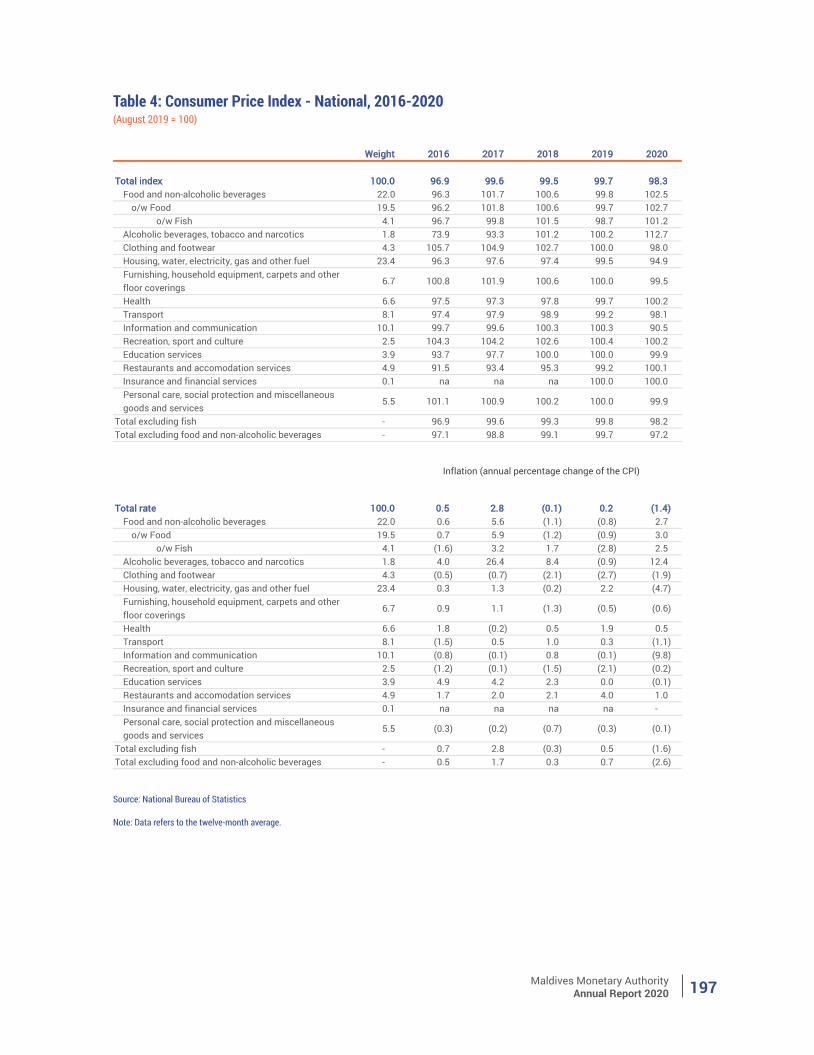
Maldives Monetary AuthorityAnnual Report 2020 197
Table 4: Consumer Price Index - National, 2016-2020(August 2019 = 100)
Source: National Bureau of Statistics
Note: Data refers to the twelve-month average.
Weight 2016 2017 2018 2019 2020
Total index 100.0 96.9 99.6 99.5 99.7 98.3 Food and non-alcoholic beverages 22.0 96.3 101.7 100.6 99.8 102.5
o/w Food 19.5 96.2 101.8 100.6 99.7 102.7 o/w Fish 4.1 96.7 99.8 101.5 98.7 101.2
Alcoholic beverages, tobacco and narcotics 1.8 73.9 93.3 101.2 100.2 112.7 Clothing and footwear 4.3 105.7 104.9 102.7 100.0 98.0 Housing, water, electricity, gas and other fuel 23.4 96.3 97.6 97.4 99.5 94.9 Furnishing, household equipment, carpets and other floor coverings
6.7 100.8 101.9 100.6 100.0 99.5
Health 6.6 97.5 97.3 97.8 99.7 100.2 Transport 8.1 97.4 97.9 98.9 99.2 98.1 Information and communication 10.1 99.7 99.6 100.3 100.3 90.5 Recreation, sport and culture 2.5 104.3 104.2 102.6 100.4 100.2 Education services 3.9 93.7 97.7 100.0 100.0 99.9 Restaurants and accomodation services 4.9 91.5 93.4 95.3 99.2 100.1 Insurance and financial services 0.1 na na na 100.0 100.0 Personal care, social protection and miscellaneous goods and services
5.5 101.1 100.9 100.2 100.0 99.9
Total excluding fish - 96.9 99.6 99.3 99.8 98.2 Total excluding food and non-alcoholic beverages - 97.1 98.8 99.1 99.7 97.2
Total rate 100.0 0.5 2.8 (0.1) 0.2 (1.4) Food and non-alcoholic beverages 22.0 0.6 5.6 (1.1) (0.8) 2.7
o/w Food 19.5 0.7 5.9 (1.2) (0.9) 3.0 o/w Fish 4.1 (1.6) 3.2 1.7 (2.8) 2.5
Alcoholic beverages, tobacco and narcotics 1.8 4.0 26.4 8.4 (0.9) 12.4 Clothing and footwear 4.3 (0.5) (0.7) (2.1) (2.7) (1.9) Housing, water, electricity, gas and other fuel 23.4 0.3 1.3 (0.2) 2.2 (4.7) Furnishing, household equipment, carpets and other floor coverings
6.7 0.9 1.1 (1.3) (0.5) (0.6)
Health 6.6 1.8 (0.2) 0.5 1.9 0.5 Transport 8.1 (1.5) 0.5 1.0 0.3 (1.1) Information and communication 10.1 (0.8) (0.1) 0.8 (0.1) (9.8) Recreation, sport and culture 2.5 (1.2) (0.1) (1.5) (2.1) (0.2) Education services 3.9 4.9 4.2 2.3 0.0 (0.1) Restaurants and accomodation services 4.9 1.7 2.0 2.1 4.0 1.0 Insurance and financial services 0.1 na na na na - Personal care, social protection and miscellaneous goods and services
5.5 (0.3) (0.2) (0.7) (0.3) (0.1)
Total excluding fish - 0.7 2.8 (0.3) 0.5 (1.6) Total excluding food and non-alcoholic beverages - 0.5 1.7 0.3 0.7 (2.6)
Inflation (annual percentage change of the CPI)
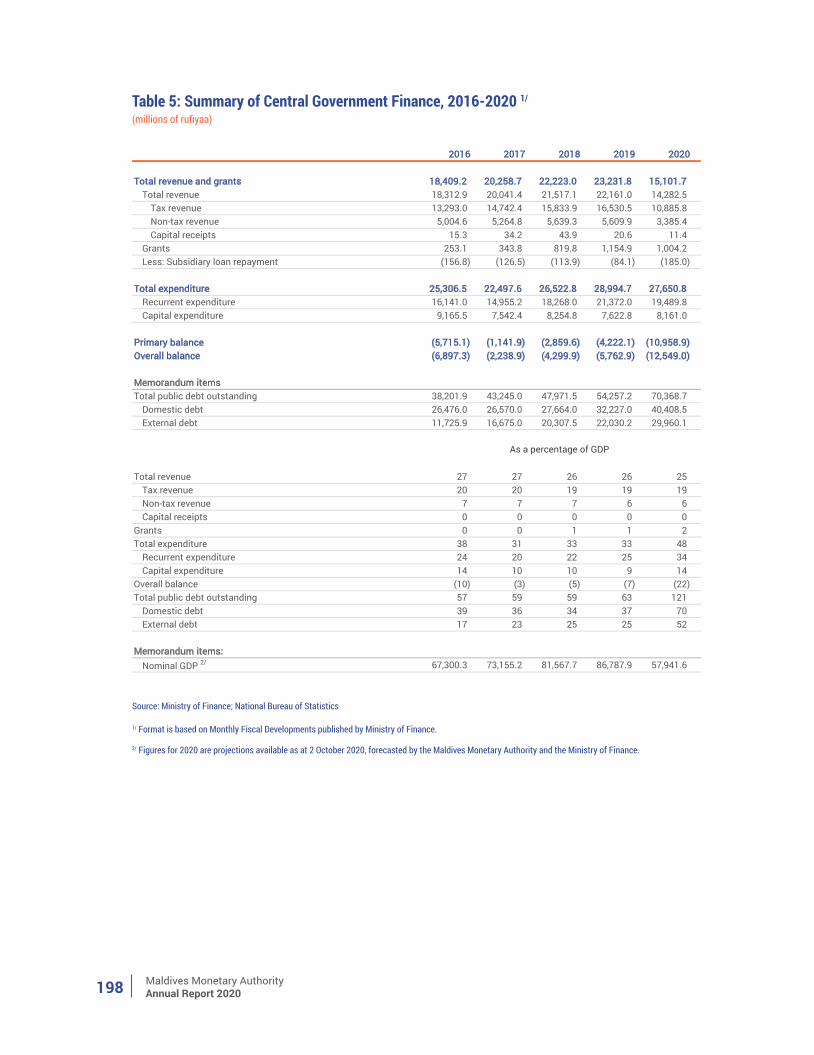
Maldives Monetary AuthorityAnnual Report 2020198
Table 5: Summary of Central Government Finance, 2016-2020 1/
(millions of rufiyaa)
Source: Ministry of Finance; National Bureau of Statistics
1/ Format is based on Monthly Fiscal Developments published by Ministry of Finance.
2/ Figures for 2020 are projections available as at 2 October 2020, forecasted by the Maldives Monetary Authority and the Ministry of Finance.
2016 2017 2018 2019 2020
Total revenue and grants 18,409.2 20,258.7 22,223.0 23,231.8 15,101.7 Total revenue 18,312.9 20,041.4 21,517.1 22,161.0 14,282.5
Tax revenue 13,293.0 14,742.4 15,833.9 16,530.5 10,885.8 Non-tax revenue 5,004.6 5,264.8 5,639.3 5,609.9 3,385.4 Capital receipts 15.3 34.2 43.9 20.6 11.4
Grants 253.1 343.8 819.8 1,154.9 1,004.2 Less: Subsidiary loan repayment (156.8) (126.5) (113.9) (84.1) (185.0)
Total expenditure 25,306.5 22,497.6 26,522.8 28,994.7 27,650.8 Recurrent expenditure 16,141.0 14,955.2 18,268.0 21,372.0 19,489.8 Capital expenditure 9,165.5 7,542.4 8,254.8 7,622.8 8,161.0
Primary balance (5,715.1) (1,141.9) (2,859.6) (4,222.1) (10,958.9) Overall balance (6,897.3) (2,238.9) (4,299.9) (5,762.9) (12,549.0)
Memorandum itemsTotal public debt outstanding 38,201.9 43,245.0 47,971.5 54,257.2 70,368.7
Domestic debt 26,476.0 26,570.0 27,664.0 32,227.0 40,408.5 External debt 11,725.9 16,675.0 20,307.5 22,030.2 29,960.1
Total revenue 27 27 26 26 25 Tax revenue 20 20 19 19 19 Non-tax revenue 7 7 7 6 6 Capital receipts 0 0 0 0 0
Grants 0 0 1 1 2 Total expenditure 38 31 33 33 48
Recurrent expenditure 24 20 22 25 34 Capital expenditure 14 10 10 9 14
Overall balance (10) (3) (5) (7) (22) Total public debt outstanding 57 59 59 63 121
Domestic debt 39 36 34 37 70 External debt 17 23 25 25 52
Memorandum items:Nominal GDP 2/ 67,300.3 73,155.2 81,567.7 86,787.9 57,941.6
As a percentage of GDP
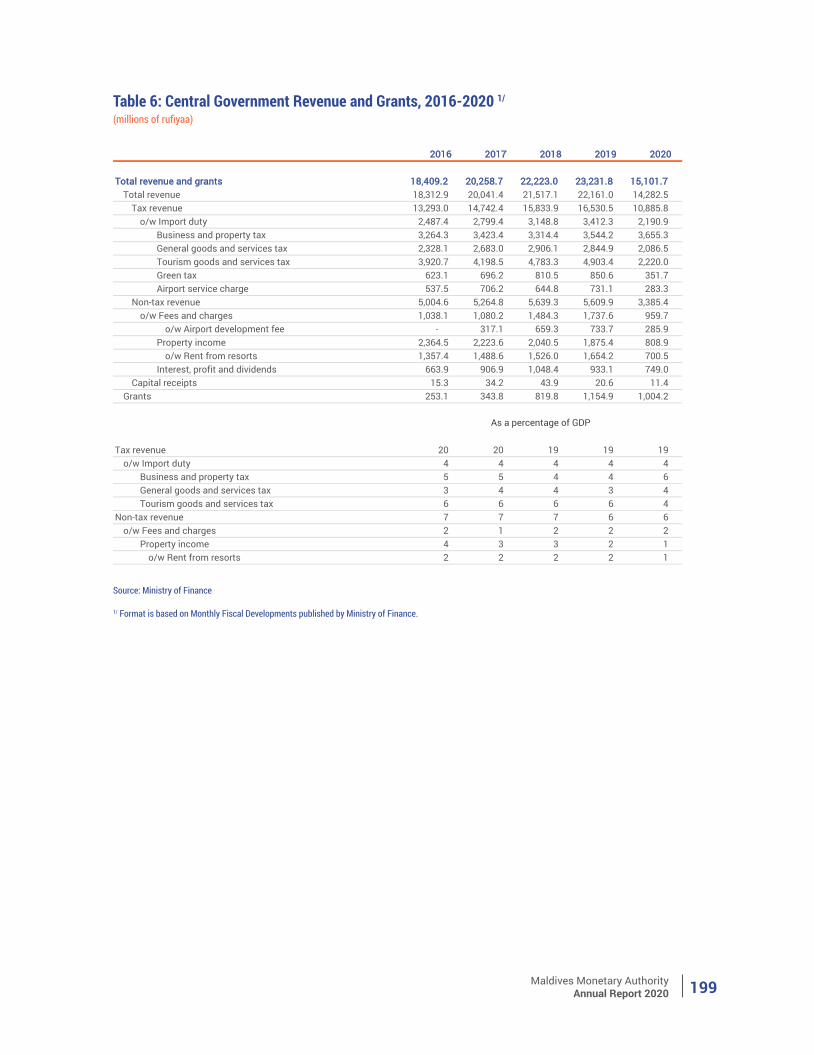
Maldives Monetary AuthorityAnnual Report 2020 199
Table 6: Central Government Revenue and Grants, 2016-2020 1/
(millions of rufiyaa)
Source: Ministry of Finance
1/ Format is based on Monthly Fiscal Developments published by Ministry of Finance.
2016 2017 2018 2019 2020
Total revenue and grants 18,409.2 20,258.7 22,223.0 23,231.8 15,101.7 Total revenue 18,312.9 20,041.4 21,517.1 22,161.0 14,282.5
Tax revenue 13,293.0 14,742.4 15,833.9 16,530.5 10,885.8 o/w Import duty 2,487.4 2,799.4 3,148.8 3,412.3 2,190.9
Business and property tax 3,264.3 3,423.4 3,314.4 3,544.2 3,655.3 General goods and services tax 2,328.1 2,683.0 2,906.1 2,844.9 2,086.5 Tourism goods and services tax 3,920.7 4,198.5 4,783.3 4,903.4 2,220.0 Green tax 623.1 696.2 810.5 850.6 351.7 Airport service charge 537.5 706.2 644.8 731.1 283.3
Non-tax revenue 5,004.6 5,264.8 5,639.3 5,609.9 3,385.4 o/w Fees and charges 1,038.1 1,080.2 1,484.3 1,737.6 959.7
o/w Airport development fee - 317.1 659.3 733.7 285.9 Property income 2,364.5 2,223.6 2,040.5 1,875.4 808.9
o/w Rent from resorts 1,357.4 1,488.6 1,526.0 1,654.2 700.5 Interest, profit and dividends 663.9 906.9 1,048.4 933.1 749.0
Capital receipts 15.3 34.2 43.9 20.6 11.4 Grants 253.1 343.8 819.8 1,154.9 1,004.2
Tax revenue 20 20 19 19 19 o/w Import duty 4 4 4 4 4
Business and property tax 5 5 4 4 6 General goods and services tax 3 4 4 3 4 Tourism goods and services tax 6 6 6 6 4
Non-tax revenue 7 7 7 6 6 o/w Fees and charges 2 1 2 2 2
Property income 4 3 3 2 1 o/w Rent from resorts 2 2 2 2 1
As a percentage of GDP
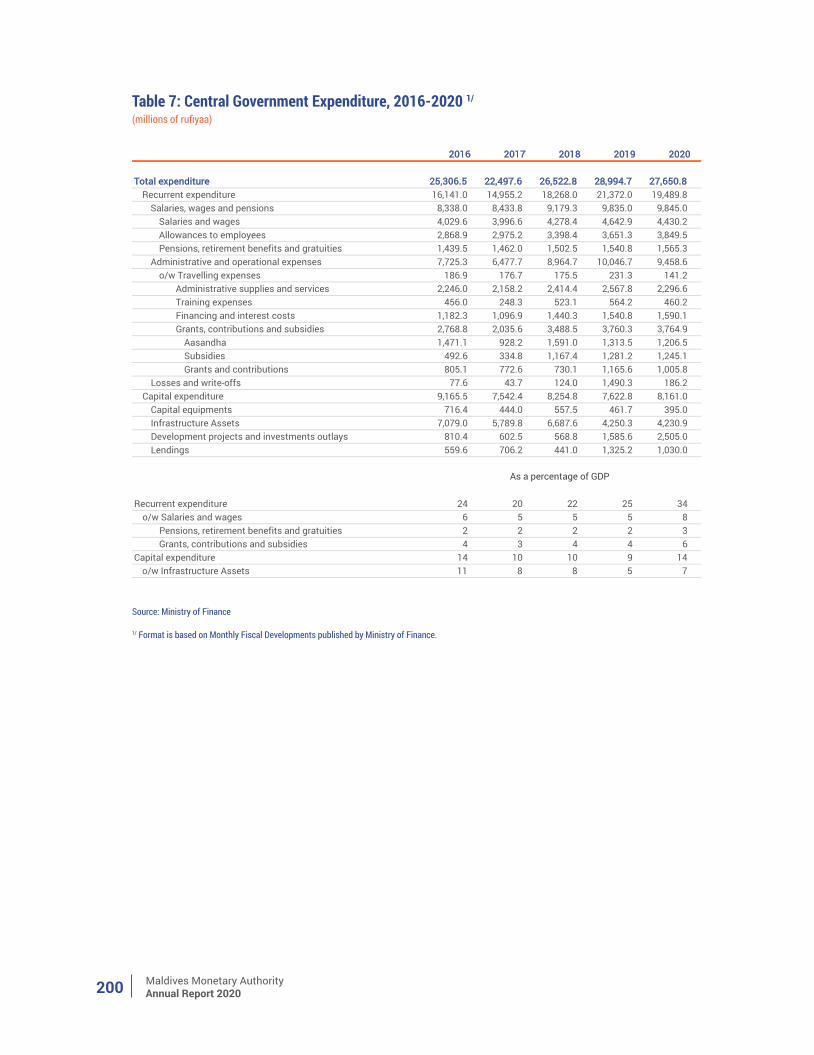
Maldives Monetary AuthorityAnnual Report 2020200
Table 7: Central Government Expenditure, 2016-2020 1/
(millions of rufiyaa)
Source: Ministry of Finance
1/ Format is based on Monthly Fiscal Developments published by Ministry of Finance.
2016 2017 2018 2019 2020
Total expenditure 25,306.5 22,497.6 26,522.8 28,994.7 27,650.8 Recurrent expenditure 16,141.0 14,955.2 18,268.0 21,372.0 19,489.8
Salaries, wages and pensions 8,338.0 8,433.8 9,179.3 9,835.0 9,845.0 Salaries and wages 4,029.6 3,996.6 4,278.4 4,642.9 4,430.2 Allowances to employees 2,868.9 2,975.2 3,398.4 3,651.3 3,849.5 Pensions, retirement benefits and gratuities 1,439.5 1,462.0 1,502.5 1,540.8 1,565.3
Administrative and operational expenses 7,725.3 6,477.7 8,964.7 10,046.7 9,458.6 o/w Travelling expenses 186.9 176.7 175.5 231.3 141.2
Administrative supplies and services 2,246.0 2,158.2 2,414.4 2,567.8 2,296.6 Training expenses 456.0 248.3 523.1 564.2 460.2 Financing and interest costs 1,182.3 1,096.9 1,440.3 1,540.8 1,590.1 Grants, contributions and subsidies 2,768.8 2,035.6 3,488.5 3,760.3 3,764.9
Aasandha 1,471.1 928.2 1,591.0 1,313.5 1,206.5 Subsidies 492.6 334.8 1,167.4 1,281.2 1,245.1 Grants and contributions 805.1 772.6 730.1 1,165.6 1,005.8
Losses and write-offs 77.6 43.7 124.0 1,490.3 186.2 Capital expenditure 9,165.5 7,542.4 8,254.8 7,622.8 8,161.0
Capital equipments 716.4 444.0 557.5 461.7 395.0 Infrastructure Assets 7,079.0 5,789.8 6,687.6 4,250.3 4,230.9 Development projects and investments outlays 810.4 602.5 568.8 1,585.6 2,505.0 Lendings 559.6 706.2 441.0 1,325.2 1,030.0
Recurrent expenditure 24 20 22 25 34 o/w Salaries and wages 6 5 5 5 8
Pensions, retirement benefits and gratuities 2 2 2 2 3 Grants, contributions and subsidies 4 3 4 4 6
Capital expenditure 14 10 10 9 14 o/w Infrastructure Assets 11 8 8 5 7
As a percentage of GDP
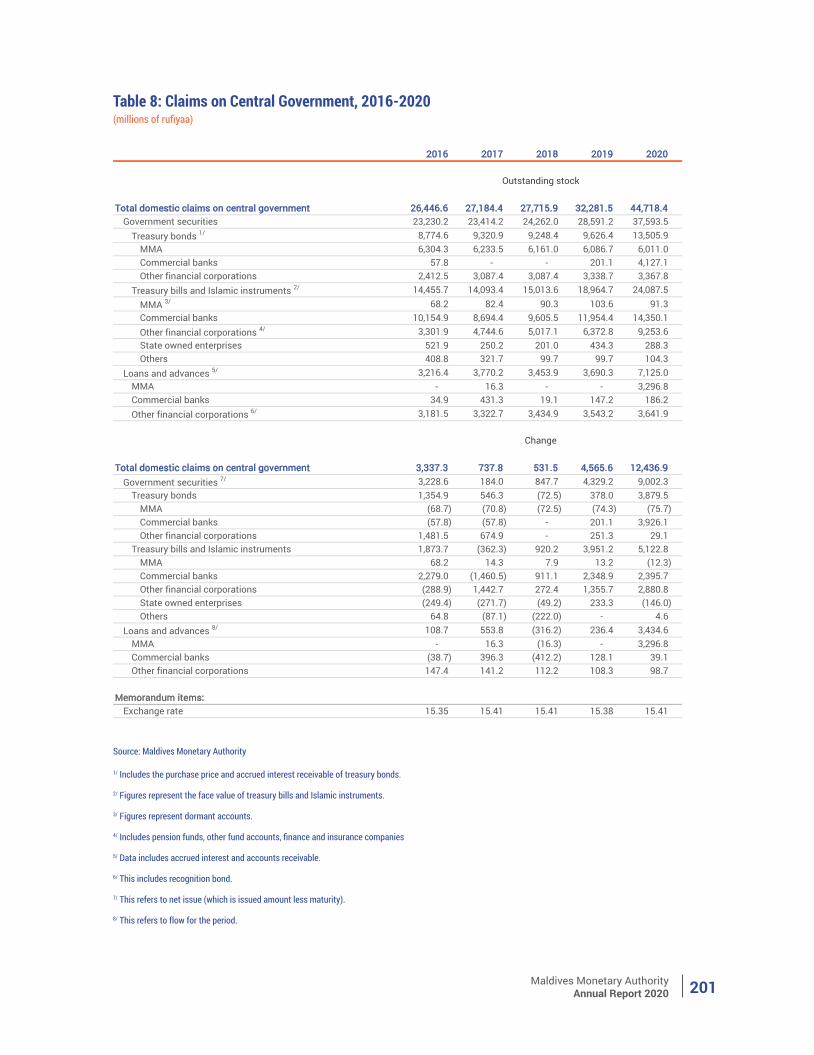
Maldives Monetary AuthorityAnnual Report 2020 201
Table 8: Claims on Central Government, 2016-2020(millions of rufiyaa)
Source: Maldives Monetary Authority
1/ Includes the purchase price and accrued interest receivable of treasury bonds.
2/ Figures represent the face value of treasury bills and Islamic instruments.
3/ Figures represent dormant accounts.
4/ Includes pension funds, other fund accounts, finance and insurance companies
5/ Data includes accrued interest and accounts receivable.
6/ This includes recognition bond.
7/ This refers to net issue (which is issued amount less maturity).
8/ This refers to flow for the period.
2016 2017 2018 2019 2020
Total domestic claims on central government 26,446.6 27,184.4 27,715.9 32,281.5 44,718.4 Government securities 23,230.2 23,414.2 24,262.0 28,591.2 37,593.5
Treasury bonds 1/ 8,774.6 9,320.9 9,248.4 9,626.4 13,505.9 MMA 6,304.3 6,233.5 6,161.0 6,086.7 6,011.0 Commercial banks 57.8 - - 201.1 4,127.1 Other financial corporations 2,412.5 3,087.4 3,087.4 3,338.7 3,367.8
Treasury bills and Islamic instruments 2/ 14,455.7 14,093.4 15,013.6 18,964.7 24,087.5 MMA 3/ 68.2 82.4 90.3 103.6 91.3 Commercial banks 10,154.9 8,694.4 9,605.5 11,954.4 14,350.1 Other financial corporations 4/ 3,301.9 4,744.6 5,017.1 6,372.8 9,253.6 State owned enterprises 521.9 250.2 201.0 434.3 288.3 Others 408.8 321.7 99.7 99.7 104.3
Loans and advances 5/ 3,216.4 3,770.2 3,453.9 3,690.3 7,125.0 MMA - 16.3 - - 3,296.8 Commercial banks 34.9 431.3 19.1 147.2 186.2 Other financial corporations 6/ 3,181.5 3,322.7 3,434.9 3,543.2 3,641.9
Total domestic claims on central government 3,337.3 737.8 531.5 4,565.6 12,436.9 Government securities 7/ 3,228.6 184.0 847.7 4,329.2 9,002.3
Treasury bonds 1,354.9 546.3 (72.5) 378.0 3,879.5 MMA (68.7) (70.8) (72.5) (74.3) (75.7) Commercial banks (57.8) (57.8) - 201.1 3,926.1 Other financial corporations 1,481.5 674.9 - 251.3 29.1
Treasury bills and Islamic instruments 1,873.7 (362.3) 920.2 3,951.2 5,122.8 MMA 68.2 14.3 7.9 13.2 (12.3) Commercial banks 2,279.0 (1,460.5) 911.1 2,348.9 2,395.7 Other financial corporations (288.9) 1,442.7 272.4 1,355.7 2,880.8 State owned enterprises (249.4) (271.7) (49.2) 233.3 (146.0) Others 64.8 (87.1) (222.0) - 4.6
Loans and advances 8/ 108.7 553.8 (316.2) 236.4 3,434.6 MMA - 16.3 (16.3) - 3,296.8 Commercial banks (38.7) 396.3 (412.2) 128.1 39.1 Other financial corporations 147.4 141.2 112.2 108.3 98.7
Memorandum items:Exchange rate 15.35 15.41 15.41 15.38 15.41
Change
Outstanding stock
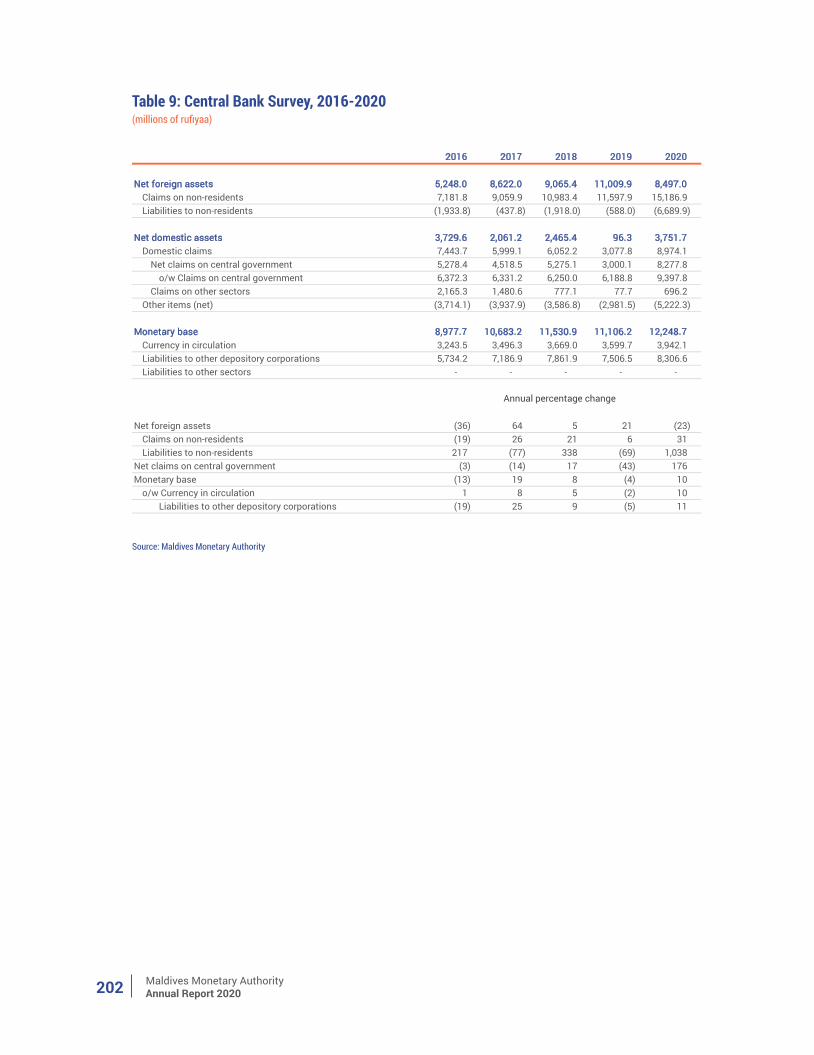
Maldives Monetary AuthorityAnnual Report 2020202
Table 9: Central Bank Survey, 2016-2020(millions of rufiyaa)
Source: Maldives Monetary Authority
2016 2017 2018 2019 2020
Net foreign assets 5,248.0 8,622.0 9,065.4 11,009.9 8,497.0 Claims on non-residents 7,181.8 9,059.9 10,983.4 11,597.9 15,186.9 Liabilities to non-residents (1,933.8) (437.8) (1,918.0) (588.0) (6,689.9)
Net domestic assets 3,729.6 2,061.2 2,465.4 96.3 3,751.7 Domestic claims 7,443.7 5,999.1 6,052.2 3,077.8 8,974.1
Net claims on central government 5,278.4 4,518.5 5,275.1 3,000.1 8,277.8 o/w Claims on central government 6,372.3 6,331.2 6,250.0 6,188.8 9,397.8
Claims on other sectors 2,165.3 1,480.6 777.1 77.7 696.2 Other items (net) (3,714.1) (3,937.9) (3,586.8) (2,981.5) (5,222.3)
Monetary base 8,977.7 10,683.2 11,530.9 11,106.2 12,248.7 Currency in circulation 3,243.5 3,496.3 3,669.0 3,599.7 3,942.1 Liabilities to other depository corporations 5,734.2 7,186.9 7,861.9 7,506.5 8,306.6 Liabilities to other sectors - - - - -
Net foreign assets (36) 64 5 21 (23) Claims on non-residents (19) 26 21 6 31 Liabilities to non-residents 217 (77) 338 (69) 1,038
Net claims on central government (3) (14) 17 (43) 176 Monetary base (13) 19 8 (4) 10
o/w Currency in circulation 1 8 5 (2) 10 Liabilities to other depository corporations (19) 25 9 (5) 11
Annual percentage change
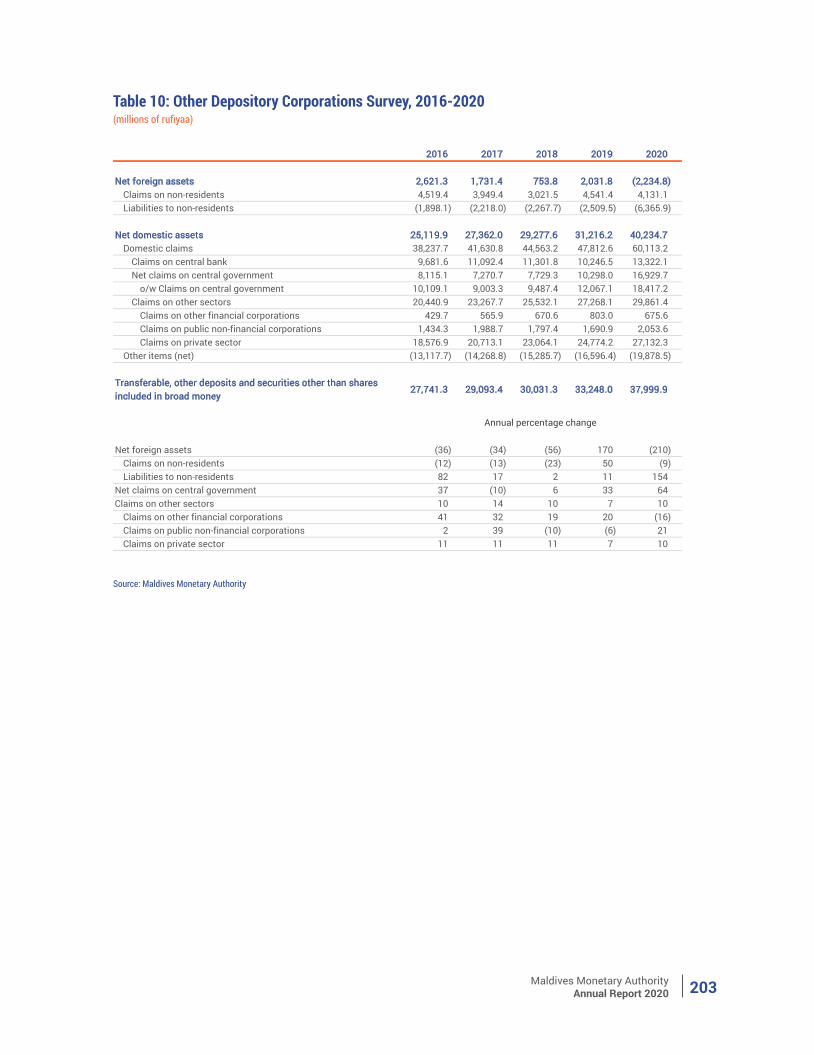
Maldives Monetary AuthorityAnnual Report 2020 203
Table 10: Other Depository Corporations Survey, 2016-2020(millions of rufiyaa)
Source: Maldives Monetary Authority
2016 2017 2018 2019 2020
Net foreign assets 2,621.3 1,731.4 753.8 2,031.8 (2,234.8) Claims on non-residents 4,519.4 3,949.4 3,021.5 4,541.4 4,131.1 Liabilities to non-residents (1,898.1) (2,218.0) (2,267.7) (2,509.5) (6,365.9)
Net domestic assets 25,119.9 27,362.0 29,277.6 31,216.2 40,234.7 Domestic claims 38,237.7 41,630.8 44,563.2 47,812.6 60,113.2
Claims on central bank 9,681.6 11,092.4 11,301.8 10,246.5 13,322.1 Net claims on central government 8,115.1 7,270.7 7,729.3 10,298.0 16,929.7
o/w Claims on central government 10,109.1 9,003.3 9,487.4 12,067.1 18,417.2 Claims on other sectors 20,440.9 23,267.7 25,532.1 27,268.1 29,861.4
Claims on other financial corporations 429.7 565.9 670.6 803.0 675.6 Claims on public non-financial corporations 1,434.3 1,988.7 1,797.4 1,690.9 2,053.6 Claims on private sector 18,576.9 20,713.1 23,064.1 24,774.2 27,132.3
Other items (net) (13,117.7) (14,268.8) (15,285.7) (16,596.4) (19,878.5)
Transferable, other deposits and securities other than shares included in broad money
27,741.3 29,093.4 30,031.3 33,248.0 37,999.9
Net foreign assets (36) (34) (56) 170 (210) Claims on non-residents (12) (13) (23) 50 (9) Liabilities to non-residents 82 17 2 11 154
Net claims on central government 37 (10) 6 33 64 Claims on other sectors 10 14 10 7 10
Claims on other financial corporations 41 32 19 20 (16) Claims on public non-financial corporations 2 39 (10) (6) 21 Claims on private sector 11 11 11 7 10
Annual percentage change
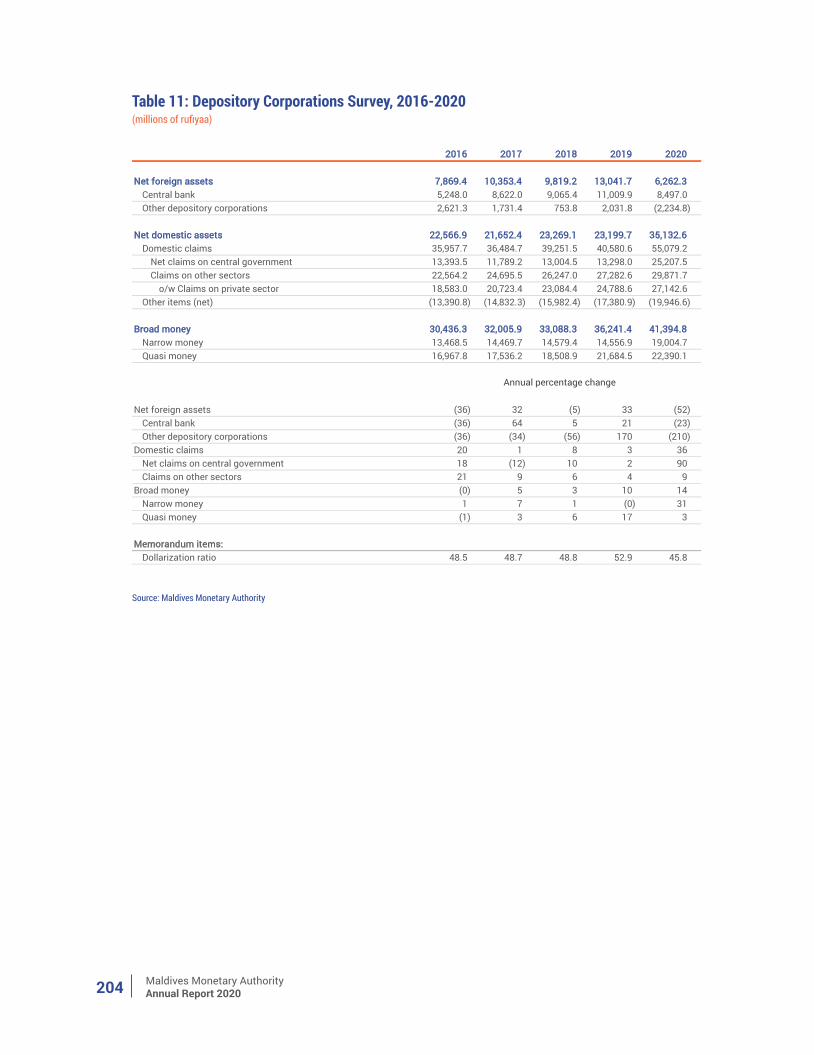
Maldives Monetary AuthorityAnnual Report 2020204
Source: Maldives Monetary Authority
2016 2017 2018 2019 2020
Net foreign assets 7,869.4 10,353.4 9,819.2 13,041.7 6,262.3 Central bank 5,248.0 8,622.0 9,065.4 11,009.9 8,497.0 Other depository corporations 2,621.3 1,731.4 753.8 2,031.8 (2,234.8)
Net domestic assets 22,566.9 21,652.4 23,269.1 23,199.7 35,132.6 Domestic claims 35,957.7 36,484.7 39,251.5 40,580.6 55,079.2
Net claims on central government 13,393.5 11,789.2 13,004.5 13,298.0 25,207.5 Claims on other sectors 22,564.2 24,695.5 26,247.0 27,282.6 29,871.7
o/w Claims on private sector 18,583.0 20,723.4 23,084.4 24,788.6 27,142.6 Other items (net) (13,390.8) (14,832.3) (15,982.4) (17,380.9) (19,946.6)
Broad money 30,436.3 32,005.9 33,088.3 36,241.4 41,394.8 Narrow money 13,468.5 14,469.7 14,579.4 14,556.9 19,004.7 Quasi money 16,967.8 17,536.2 18,508.9 21,684.5 22,390.1
Net foreign assets (36) 32 (5) 33 (52) Central bank (36) 64 5 21 (23) Other depository corporations (36) (34) (56) 170 (210)
Domestic claims 20 1 8 3 36 Net claims on central government 18 (12) 10 2 90 Claims on other sectors 21 9 6 4 9
Broad money (0) 5 3 10 14 Narrow money 1 7 1 (0) 31 Quasi money (1) 3 6 17 3
Memorandum items:Dollarization ratio 48.5 48.7 48.8 52.9 45.8
Annual percentage change
Table 11: Depository Corporations Survey, 2016-2020(millions of rufiyaa)
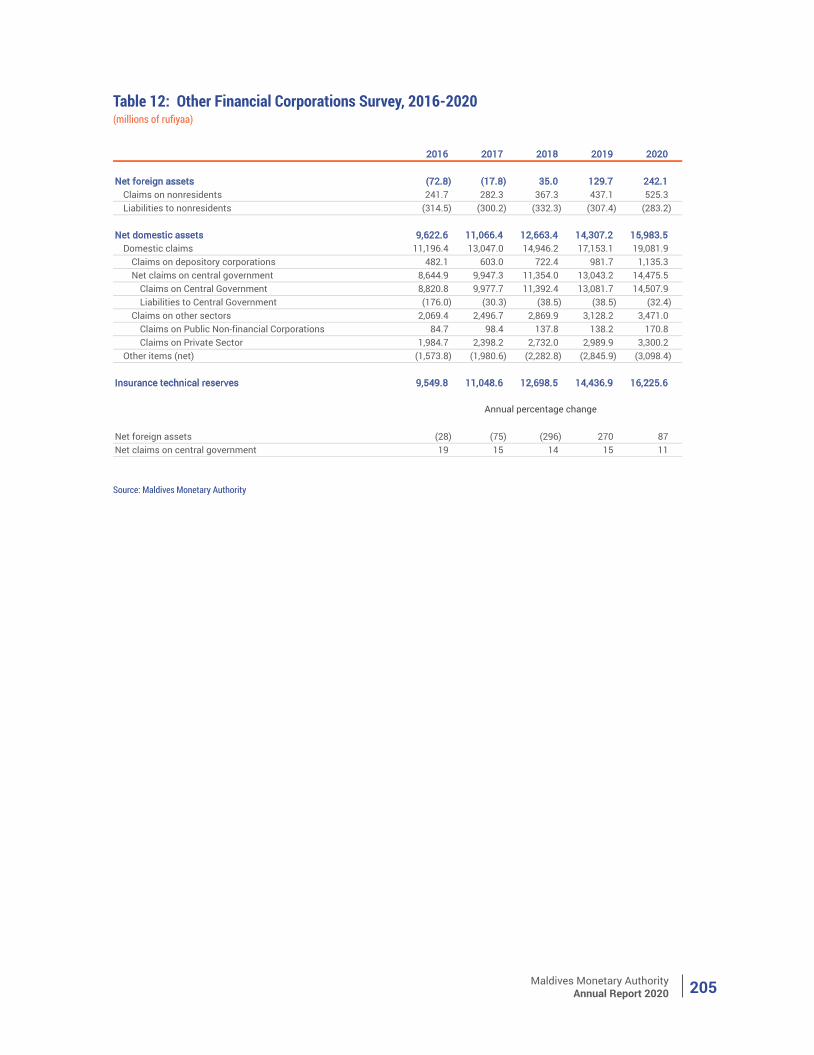
Maldives Monetary AuthorityAnnual Report 2020 205
Source: Maldives Monetary Authority
2016 2017 2018 2019 2020
Net foreign assets (72.8) (17.8) 35.0 129.7 242.1 Claims on nonresidents 241.7 282.3 367.3 437.1 525.3 Liabilities to nonresidents (314.5) (300.2) (332.3) (307.4) (283.2)
Net domestic assets 9,622.6 11,066.4 12,663.4 14,307.2 15,983.5 Domestic claims 11,196.4 13,047.0 14,946.2 17,153.1 19,081.9
Claims on depository corporations 482.1 603.0 722.4 981.7 1,135.3 Net claims on central government 8,644.9 9,947.3 11,354.0 13,043.2 14,475.5
Claims on Central Government 8,820.8 9,977.7 11,392.4 13,081.7 14,507.9 Liabilities to Central Government (176.0) (30.3) (38.5) (38.5) (32.4)
Claims on other sectors 2,069.4 2,496.7 2,869.9 3,128.2 3,471.0 Claims on Public Non-financial Corporations 84.7 98.4 137.8 138.2 170.8 Claims on Private Sector 1,984.7 2,398.2 2,732.0 2,989.9 3,300.2
Other items (net) (1,573.8) (1,980.6) (2,282.8) (2,845.9) (3,098.4)
Insurance technical reserves 9,549.8 11,048.6 12,698.5 14,436.9 16,225.6
Net foreign assets (28) (75) (296) 270 87 Net claims on central government 19 15 14 15 11
Annual percentage change
Table 12: Other Financial Corporations Survey, 2016-2020(millions of rufiyaa)
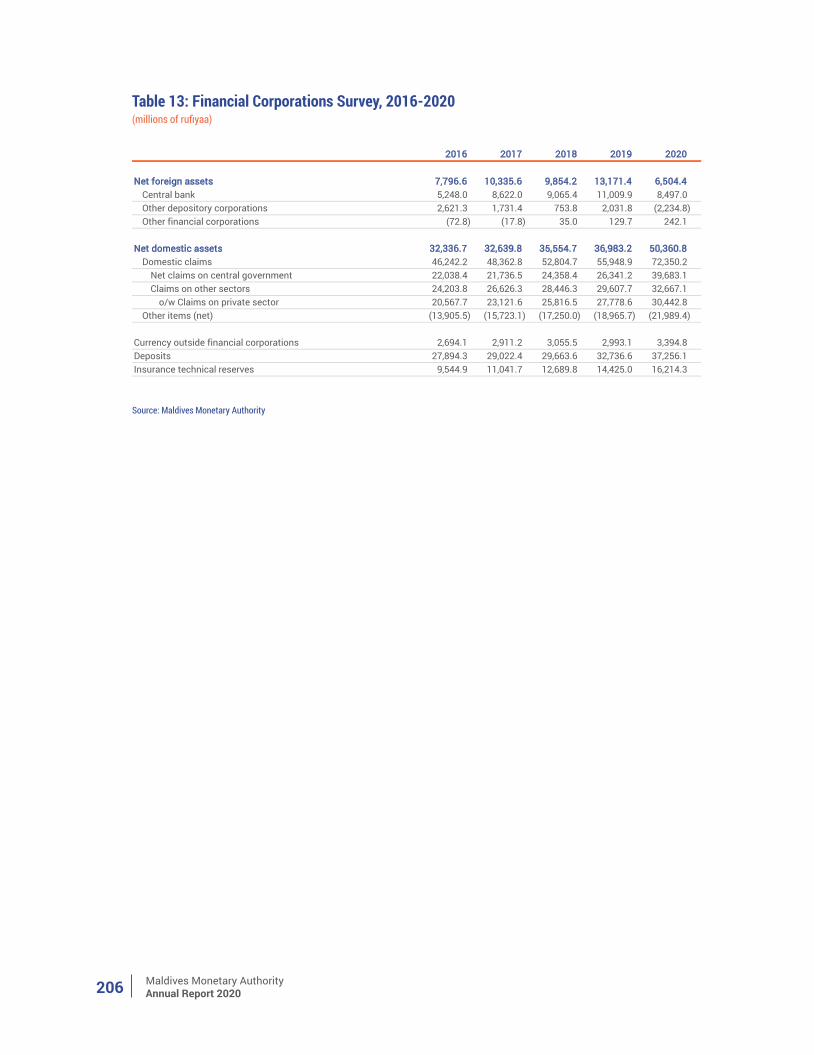
Maldives Monetary AuthorityAnnual Report 2020206
Source: Maldives Monetary Authority
2016 2017 2018 2019 2020
Net foreign assets 7,796.6 10,335.6 9,854.2 13,171.4 6,504.4 Central bank 5,248.0 8,622.0 9,065.4 11,009.9 8,497.0 Other depository corporations 2,621.3 1,731.4 753.8 2,031.8 (2,234.8) Other financial corporations (72.8) (17.8) 35.0 129.7 242.1
Net domestic assets 32,336.7 32,639.8 35,554.7 36,983.2 50,360.8 Domestic claims 46,242.2 48,362.8 52,804.7 55,948.9 72,350.2
Net claims on central government 22,038.4 21,736.5 24,358.4 26,341.2 39,683.1 Claims on other sectors 24,203.8 26,626.3 28,446.3 29,607.7 32,667.1
o/w Claims on private sector 20,567.7 23,121.6 25,816.5 27,778.6 30,442.8 Other items (net) (13,905.5) (15,723.1) (17,250.0) (18,965.7) (21,989.4)
Currency outside financial corporations 2,694.1 2,911.2 3,055.5 2,993.1 3,394.8 Deposits 27,894.3 29,022.4 29,663.6 32,736.6 37,256.1 Insurance technical reserves 9,544.9 11,041.7 12,689.8 14,425.0 16,214.3
Table 13: Financial Corporations Survey, 2016-2020(millions of rufiyaa)
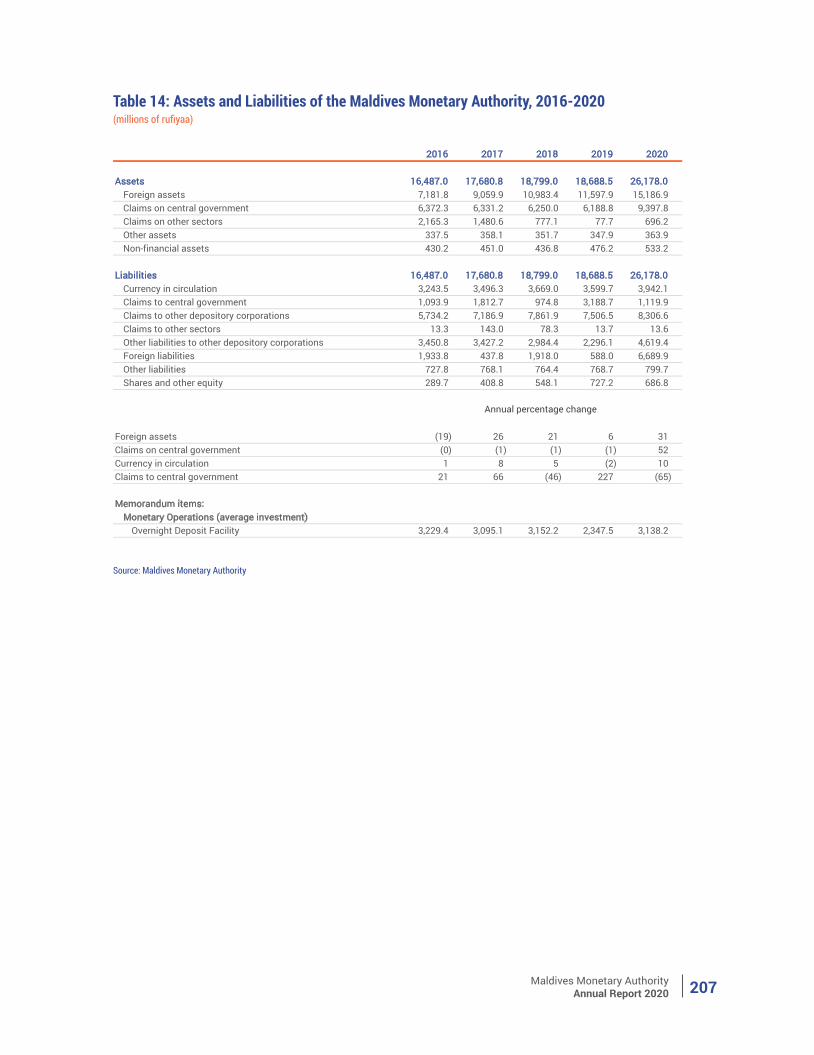
Maldives Monetary AuthorityAnnual Report 2020 207
Source: Maldives Monetary Authority
2016 2017 2018 2019 2020
Assets 16,487.0 17,680.8 18,799.0 18,688.5 26,178.0 Foreign assets 7,181.8 9,059.9 10,983.4 11,597.9 15,186.9 Claims on central government 6,372.3 6,331.2 6,250.0 6,188.8 9,397.8 Claims on other sectors 2,165.3 1,480.6 777.1 77.7 696.2 Other assets 337.5 358.1 351.7 347.9 363.9 Non-financial assets 430.2 451.0 436.8 476.2 533.2
Liabilities 16,487.0 17,680.8 18,799.0 18,688.5 26,178.0 Currency in circulation 3,243.5 3,496.3 3,669.0 3,599.7 3,942.1 Claims to central government 1,093.9 1,812.7 974.8 3,188.7 1,119.9 Claims to other depository corporations 5,734.2 7,186.9 7,861.9 7,506.5 8,306.6 Claims to other sectors 13.3 143.0 78.3 13.7 13.6 Other liabilities to other depository corporations 3,450.8 3,427.2 2,984.4 2,296.1 4,619.4 Foreign liabilities 1,933.8 437.8 1,918.0 588.0 6,689.9 Other liabilities 727.8 768.1 764.4 768.7 799.7 Shares and other equity 289.7 408.8 548.1 727.2 686.8
Foreign assets (19) 26 21 6 31 Claims on central government (0) (1) (1) (1) 52 Currency in circulation 1 8 5 (2) 10 Claims to central government 21 66 (46) 227 (65)
Memorandum items:Monetary Operations (average investment)
Overnight Deposit Facility 3,229.4 3,095.1 3,152.2 2,347.5 3,138.2
Annual percentage change
Table 14: Assets and Liabilities of the Maldives Monetary Authority, 2016-2020(millions of rufiyaa)
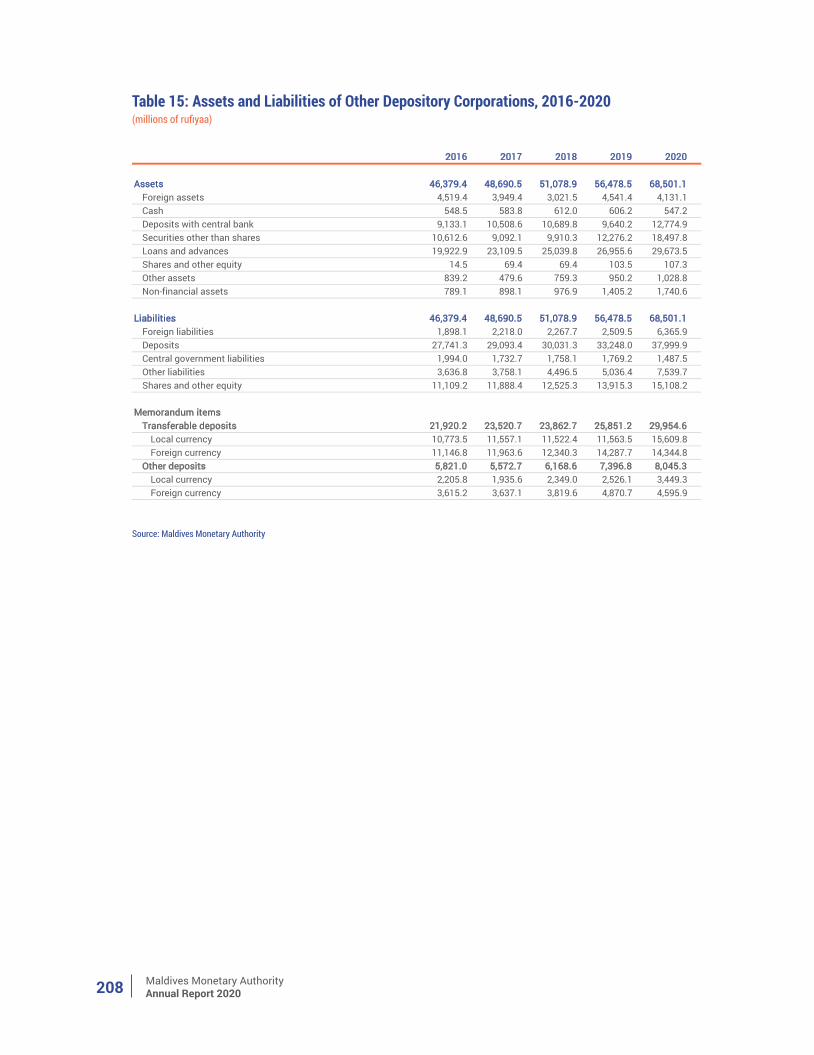
Maldives Monetary AuthorityAnnual Report 2020208
Table 15: Assets and Liabilities of Other Depository Corporations, 2016-2020(millions of rufiyaa)
Source: Maldives Monetary Authority
2016 2017 2018 2019 2020
Assets 46,379.4 48,690.5 51,078.9 56,478.5 68,501.1 Foreign assets 4,519.4 3,949.4 3,021.5 4,541.4 4,131.1 Cash 548.5 583.8 612.0 606.2 547.2 Deposits with central bank 9,133.1 10,508.6 10,689.8 9,640.2 12,774.9 Securities other than shares 10,612.6 9,092.1 9,910.3 12,276.2 18,497.8 Loans and advances 19,922.9 23,109.5 25,039.8 26,955.6 29,673.5 Shares and other equity 14.5 69.4 69.4 103.5 107.3 Other assets 839.2 479.6 759.3 950.2 1,028.8 Non-financial assets 789.1 898.1 976.9 1,405.2 1,740.6
Liabilities 46,379.4 48,690.5 51,078.9 56,478.5 68,501.1 Foreign liabilities 1,898.1 2,218.0 2,267.7 2,509.5 6,365.9 Deposits 27,741.3 29,093.4 30,031.3 33,248.0 37,999.9 Central government liabilities 1,994.0 1,732.7 1,758.1 1,769.2 1,487.5 Other liabilities 3,636.8 3,758.1 4,496.5 5,036.4 7,539.7 Shares and other equity 11,109.2 11,888.4 12,525.3 13,915.3 15,108.2
Memorandum itemsTransferable deposits 21,920.2 23,520.7 23,862.7 25,851.2 29,954.6
Local currency 10,773.5 11,557.1 11,522.4 11,563.5 15,609.8 Foreign currency 11,146.8 11,963.6 12,340.3 14,287.7 14,344.8
Other deposits 5,821.0 5,572.7 6,168.6 7,396.8 8,045.3 Local currency 2,205.8 1,935.6 2,349.0 2,526.1 3,449.3 Foreign currency 3,615.2 3,637.1 3,819.6 4,870.7 4,595.9
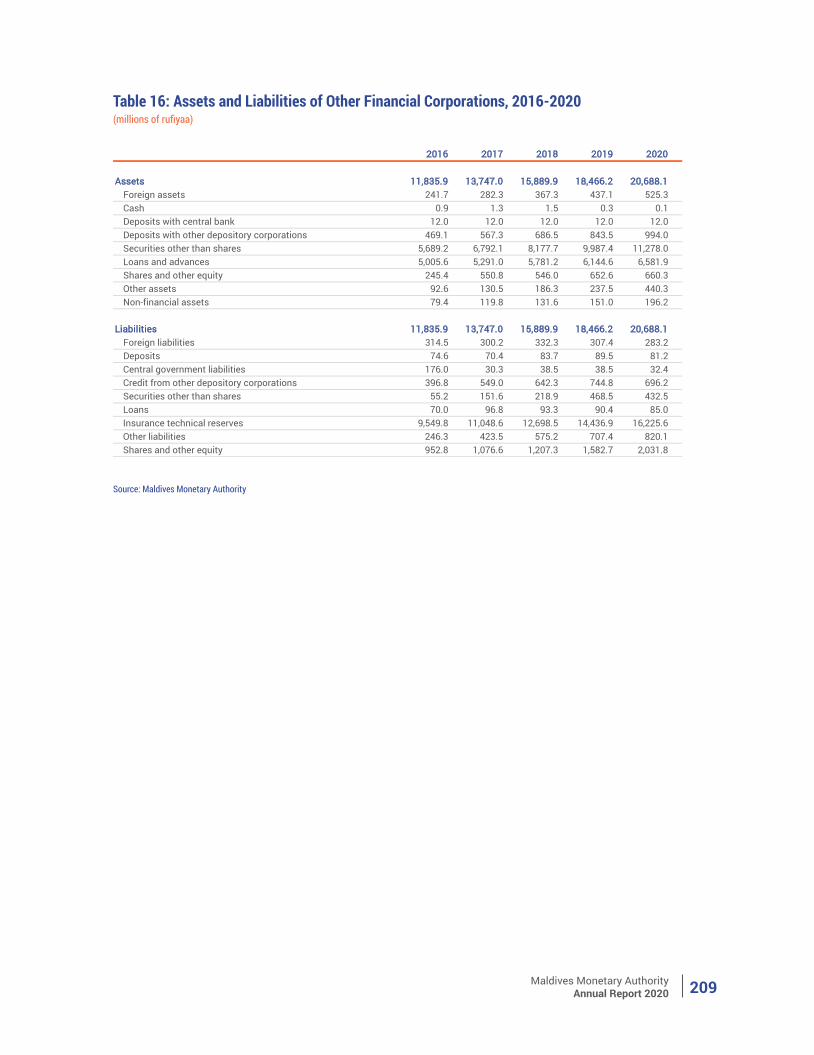
Maldives Monetary AuthorityAnnual Report 2020 209
Table 16: Assets and Liabilities of Other Financial Corporations, 2016-2020(millions of rufiyaa)
Source: Maldives Monetary Authority
2016 2017 2018 2019 2020
Assets 11,835.9 13,747.0 15,889.9 18,466.2 20,688.1 Foreign assets 241.7 282.3 367.3 437.1 525.3 Cash 0.9 1.3 1.5 0.3 0.1 Deposits with central bank 12.0 12.0 12.0 12.0 12.0 Deposits with other depository corporations 469.1 567.3 686.5 843.5 994.0 Securities other than shares 5,689.2 6,792.1 8,177.7 9,987.4 11,278.0 Loans and advances 5,005.6 5,291.0 5,781.2 6,144.6 6,581.9 Shares and other equity 245.4 550.8 546.0 652.6 660.3 Other assets 92.6 130.5 186.3 237.5 440.3 Non-financial assets 79.4 119.8 131.6 151.0 196.2
Liabilities 11,835.9 13,747.0 15,889.9 18,466.2 20,688.1 Foreign liabilities 314.5 300.2 332.3 307.4 283.2 Deposits 74.6 70.4 83.7 89.5 81.2 Central government liabilities 176.0 30.3 38.5 38.5 32.4 Credit from other depository corporations 396.8 549.0 642.3 744.8 696.2 Securities other than shares 55.2 151.6 218.9 468.5 432.5 Loans 70.0 96.8 93.3 90.4 85.0 Insurance technical reserves 9,549.8 11,048.6 12,698.5 14,436.9 16,225.6 Other liabilities 246.3 423.5 575.2 707.4 820.1 Shares and other equity 952.8 1,076.6 1,207.3 1,582.7 2,031.8
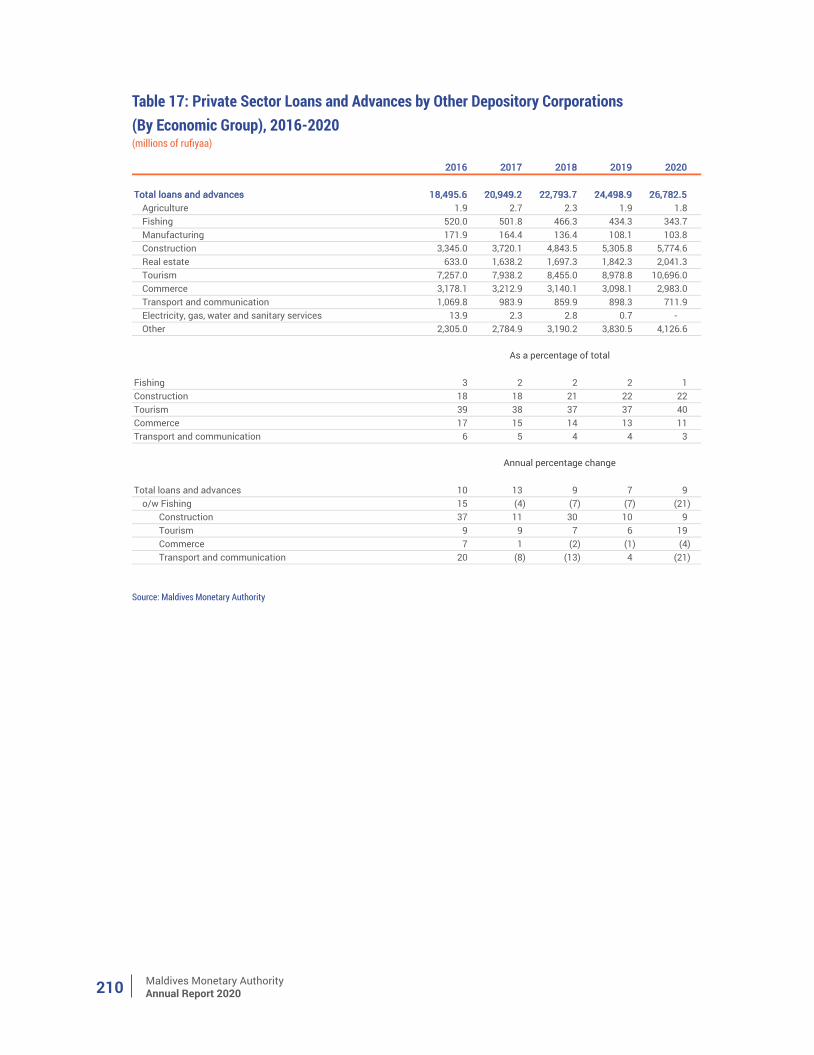
Maldives Monetary AuthorityAnnual Report 2020210
Table 17: Private Sector Loans and Advances by Other Depository Corporations (By Economic Group), 2016-2020(millions of rufiyaa)
Source: Maldives Monetary Authority
2016 2017 2018 2019 2020
Total loans and advances 18,495.6 20,949.2 22,793.7 24,498.9 26,782.5 Agriculture 1.9 2.7 2.3 1.9 1.8 Fishing 520.0 501.8 466.3 434.3 343.7 Manufacturing 171.9 164.4 136.4 108.1 103.8 Construction 3,345.0 3,720.1 4,843.5 5,305.8 5,774.6 Real estate 633.0 1,638.2 1,697.3 1,842.3 2,041.3 Tourism 7,257.0 7,938.2 8,455.0 8,978.8 10,696.0 Commerce 3,178.1 3,212.9 3,140.1 3,098.1 2,983.0 Transport and communication 1,069.8 983.9 859.9 898.3 711.9 Electricity, gas, water and sanitary services 13.9 2.3 2.8 0.7 - Other 2,305.0 2,784.9 3,190.2 3,830.5 4,126.6
Fishing 3 2 2 2 1 Construction 18 18 21 22 22 Tourism 39 38 37 37 40 Commerce 17 15 14 13 11 Transport and communication 6 5 4 4 3
Total loans and advances 10 13 9 7 9 o/w Fishing 15 (4) (7) (7) (21)
Construction 37 11 30 10 9 Tourism 9 9 7 6 19 Commerce 7 1 (2) (1) (4) Transport and communication 20 (8) (13) 4 (21)
Annual percentage change
As a percentage of total
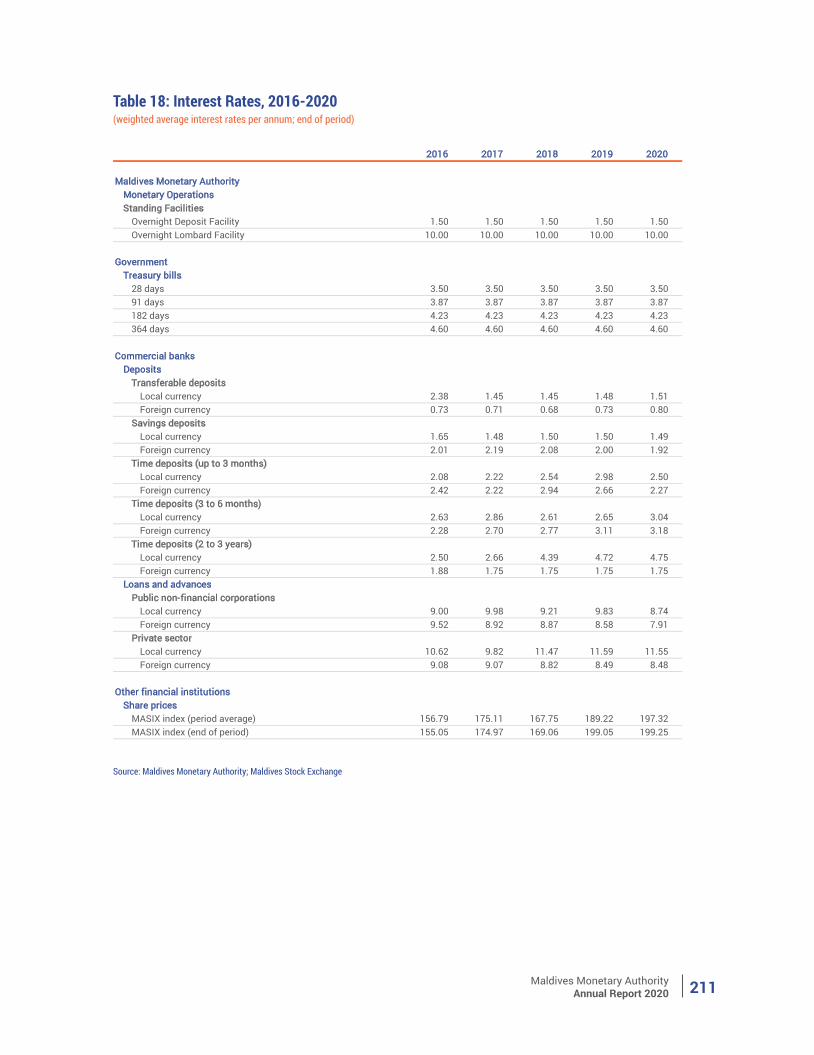
Maldives Monetary AuthorityAnnual Report 2020 211
Table 18: Interest Rates, 2016-2020(weighted average interest rates per annum; end of period)
Source: Maldives Monetary Authority; Maldives Stock Exchange
2016 2017 2018 2019 2020
Maldives Monetary AuthorityMonetary OperationsStanding Facilities
Overnight Deposit Facility 1.50 1.50 1.50 1.50 1.50 Overnight Lombard Facility 10.00 10.00 10.00 10.00 10.00
GovernmentTreasury bills
28 days 3.50 3.50 3.50 3.50 3.50 91 days 3.87 3.87 3.87 3.87 3.87 182 days 4.23 4.23 4.23 4.23 4.23 364 days 4.60 4.60 4.60 4.60 4.60
Commercial banksDeposits
Transferable depositsLocal currency 2.38 1.45 1.45 1.48 1.51 Foreign currency 0.73 0.71 0.68 0.73 0.80
Savings deposits Local currency 1.65 1.48 1.50 1.50 1.49 Foreign currency 2.01 2.19 2.08 2.00 1.92
Time deposits (up to 3 months)Local currency 2.08 2.22 2.54 2.98 2.50 Foreign currency 2.42 2.22 2.94 2.66 2.27
Time deposits (3 to 6 months)Local currency 2.63 2.86 2.61 2.65 3.04 Foreign currency 2.28 2.70 2.77 3.11 3.18
Time deposits (2 to 3 years)Local currency 2.50 2.66 4.39 4.72 4.75 Foreign currency 1.88 1.75 1.75 1.75 1.75
Loans and advancesPublic non-financial corporations
Local currency 9.00 9.98 9.21 9.83 8.74 Foreign currency 9.52 8.92 8.87 8.58 7.91
Private sectorLocal currency 10.62 9.82 11.47 11.59 11.55 Foreign currency 9.08 9.07 8.82 8.49 8.48
Other financial institutionsShare prices
MASIX index (period average) 156.79 175.11 167.75 189.22 197.32 MASIX index (end of period) 155.05 174.97 169.06 199.05 199.25
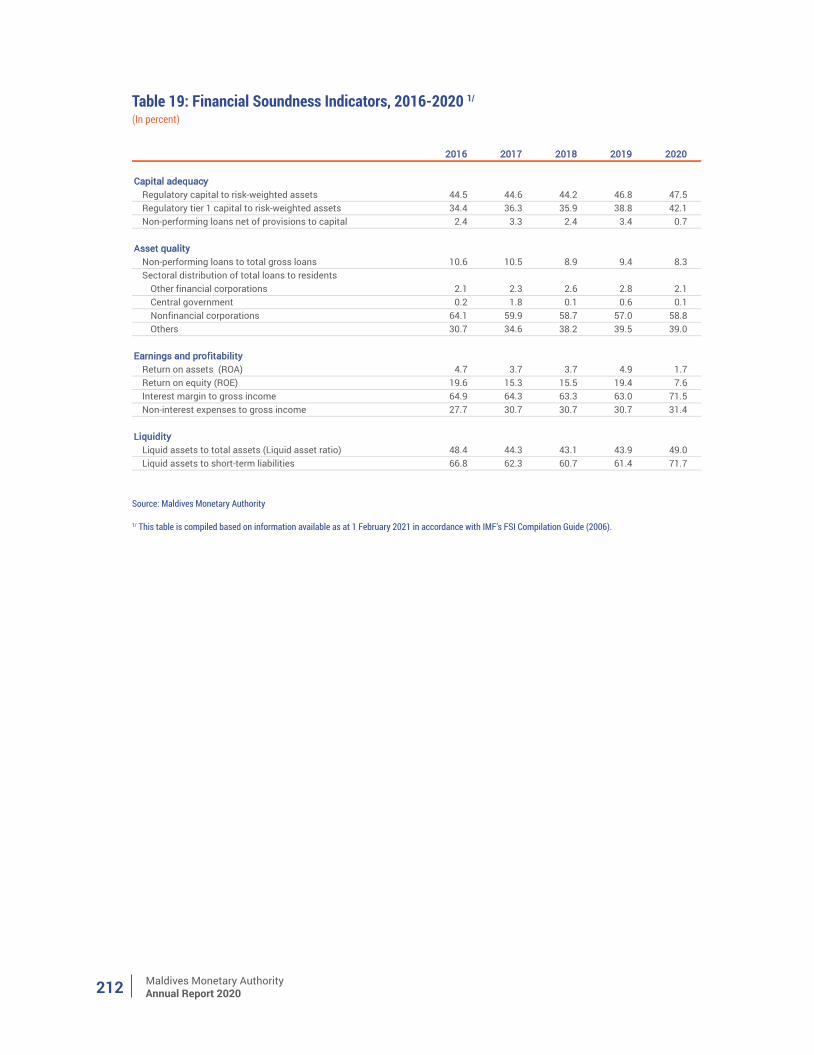
Maldives Monetary AuthorityAnnual Report 2020212
Table 19: Financial Soundness Indicators, 2016-2020 1/
(In percent)
Source: Maldives Monetary Authority
1/ This table is compiled based on information available as at 1 February 2021 in accordance with IMF’s FSI Compilation Guide (2006).
2016 2017 2018 2019 2020
Capital adequacyRegulatory capital to risk-weighted assets 44.5 44.6 44.2 46.8 47.5 Regulatory tier 1 capital to risk-weighted assets 34.4 36.3 35.9 38.8 42.1 Non-performing loans net of provisions to capital 2.4 3.3 2.4 3.4 0.7
Asset qualityNon-performing loans to total gross loans 10.6 10.5 8.9 9.4 8.3 Sectoral distribution of total loans to residents
Other financial corporations 2.1 2.3 2.6 2.8 2.1 Central government 0.2 1.8 0.1 0.6 0.1 Nonfinancial corporations 64.1 59.9 58.7 57.0 58.8 Others 30.7 34.6 38.2 39.5 39.0
Earnings and profitabilityReturn on assets (ROA) 4.7 3.7 3.7 4.9 1.7 Return on equity (ROE) 19.6 15.3 15.5 19.4 7.6 Interest margin to gross income 64.9 64.3 63.3 63.0 71.5 Non-interest expenses to gross income 27.7 30.7 30.7 30.7 31.4
LiquidityLiquid assets to total assets (Liquid asset ratio) 48.4 44.3 43.1 43.9 49.0 Liquid assets to short-term liabilities 66.8 62.3 60.7 61.4 71.7
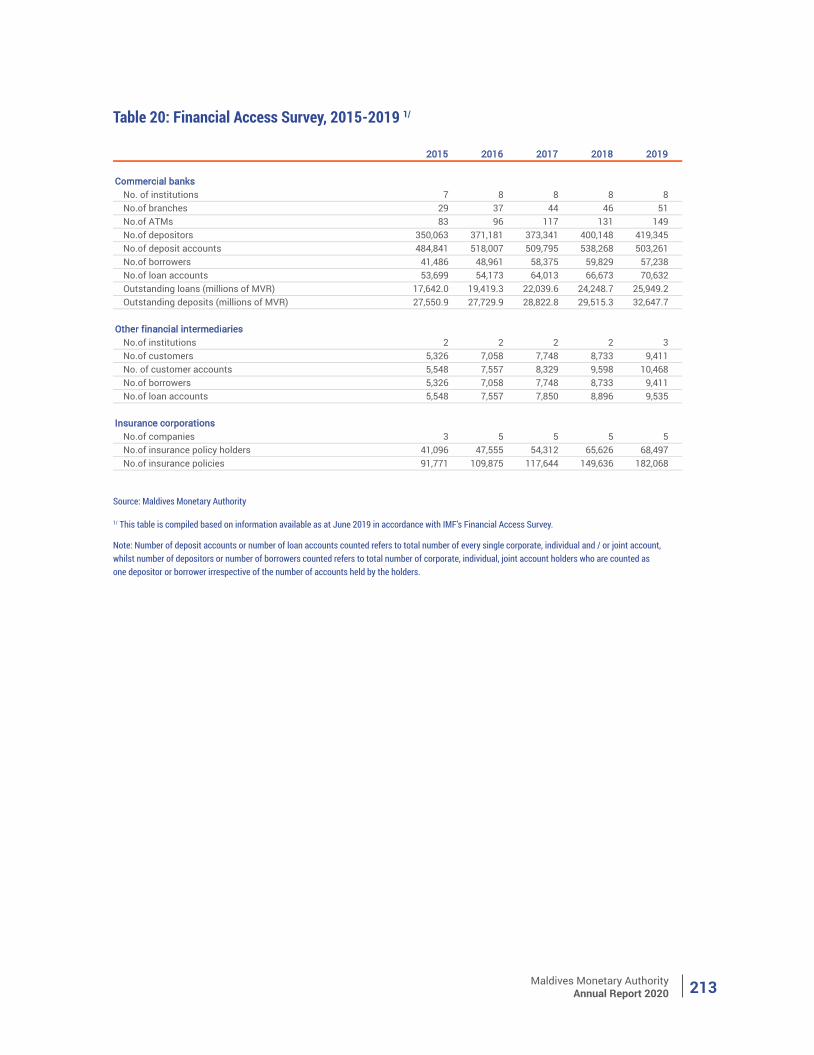
Maldives Monetary AuthorityAnnual Report 2020 213
Table 20: Financial Access Survey, 2015-2019 1/
Source: Maldives Monetary Authority
1/ This table is compiled based on information available as at June 2019 in accordance with IMF’s Financial Access Survey.
Note: Number of deposit accounts or number of loan accounts counted refers to total number of every single corporate, individual and / or joint account, whilst number of depositors or number of borrowers counted refers to total number of corporate, individual, joint account holders who are counted as one depositor or borrower irrespective of the number of accounts held by the holders.
2015 2016 2017 2018 2019
Commercial banksNo. of institutions 7 8 8 8 8 No.of branches 29 37 44 46 51 No.of ATMs 83 96 117 131 149 No.of depositors 350,063 371,181 373,341 400,148 419,345 No.of deposit accounts 484,841 518,007 509,795 538,268 503,261 No.of borrowers 41,486 48,961 58,375 59,829 57,238 No.of loan accounts 53,699 54,173 64,013 66,673 70,632 Outstanding loans (millions of MVR) 17,642.0 19,419.3 22,039.6 24,248.7 25,949.2 Outstanding deposits (millions of MVR) 27,550.9 27,729.9 28,822.8 29,515.3 32,647.7
Other financial intermediariesNo.of institutions 2 2 2 2 3 No.of customers 5,326 7,058 7,748 8,733 9,411 No. of customer accounts 5,548 7,557 8,329 9,598 10,468 No.of borrowers 5,326 7,058 7,748 8,733 9,411 No.of loan accounts 5,548 7,557 7,850 8,896 9,535
Insurance corporationsNo.of companies 3 5 5 5 5 No.of insurance policy holders 41,096 47,555 54,312 65,626 68,497 No.of insurance policies 91,771 109,875 117,644 149,636 182,068
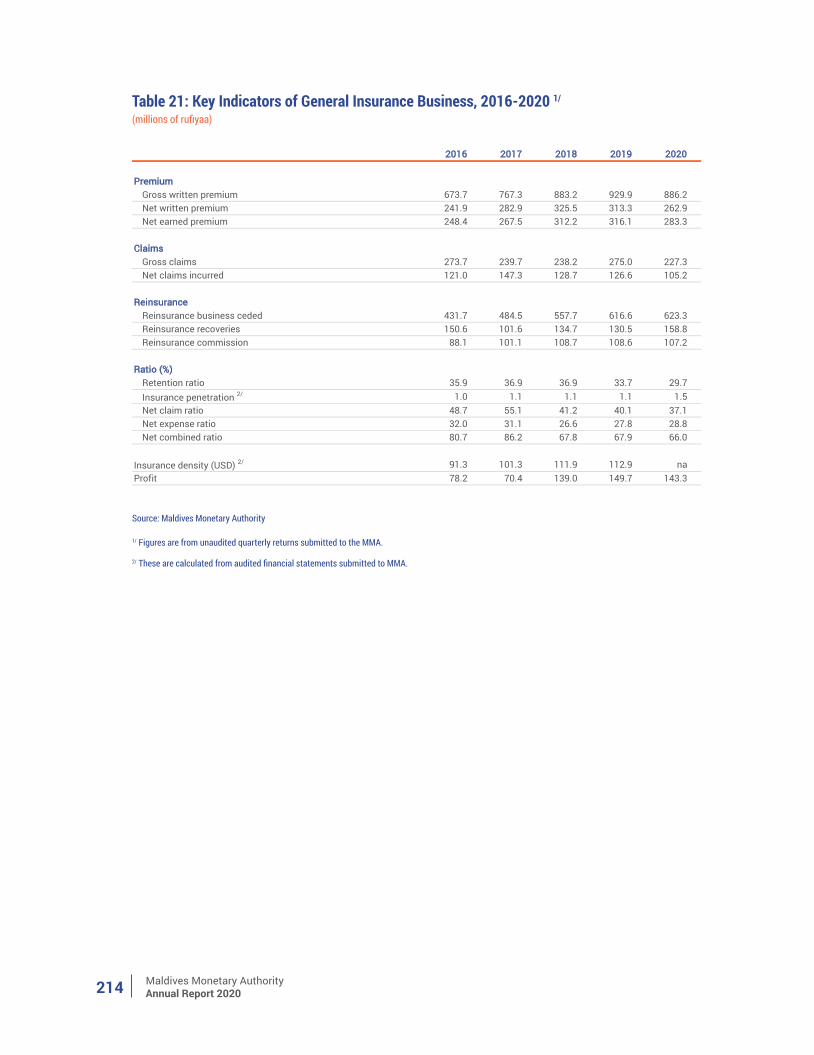
Maldives Monetary AuthorityAnnual Report 2020214
Table 21: Key Indicators of General Insurance Business, 2016-2020 1/
(millions of rufiyaa)
Source: Maldives Monetary Authority
1/ Figures are from unaudited quarterly returns submitted to the MMA.
2/ These are calculated from audited financial statements submitted to MMA.
2016 2017 2018 2019 2020
Premium Gross written premium 673.7 767.3 883.2 929.9 886.2 Net written premium 241.9 282.9 325.5 313.3 262.9 Net earned premium 248.4 267.5 312.2 316.1 283.3
ClaimsGross claims 273.7 239.7 238.2 275.0 227.3 Net claims incurred 121.0 147.3 128.7 126.6 105.2
ReinsuranceReinsurance business ceded 431.7 484.5 557.7 616.6 623.3 Reinsurance recoveries 150.6 101.6 134.7 130.5 158.8 Reinsurance commission 88.1 101.1 108.7 108.6 107.2
Ratio (%)Retention ratio 35.9 36.9 36.9 33.7 29.7 Insurance penetration 2/ 1.0 1.1 1.1 1.1 1.5 Net claim ratio 48.7 55.1 41.2 40.1 37.1 Net expense ratio 32.0 31.1 26.6 27.8 28.8 Net combined ratio 80.7 86.2 67.8 67.9 66.0
Insurance density (USD) 2/ 91.3 101.3 111.9 112.9 naProfit 78.2 70.4 139.0 149.7 143.3
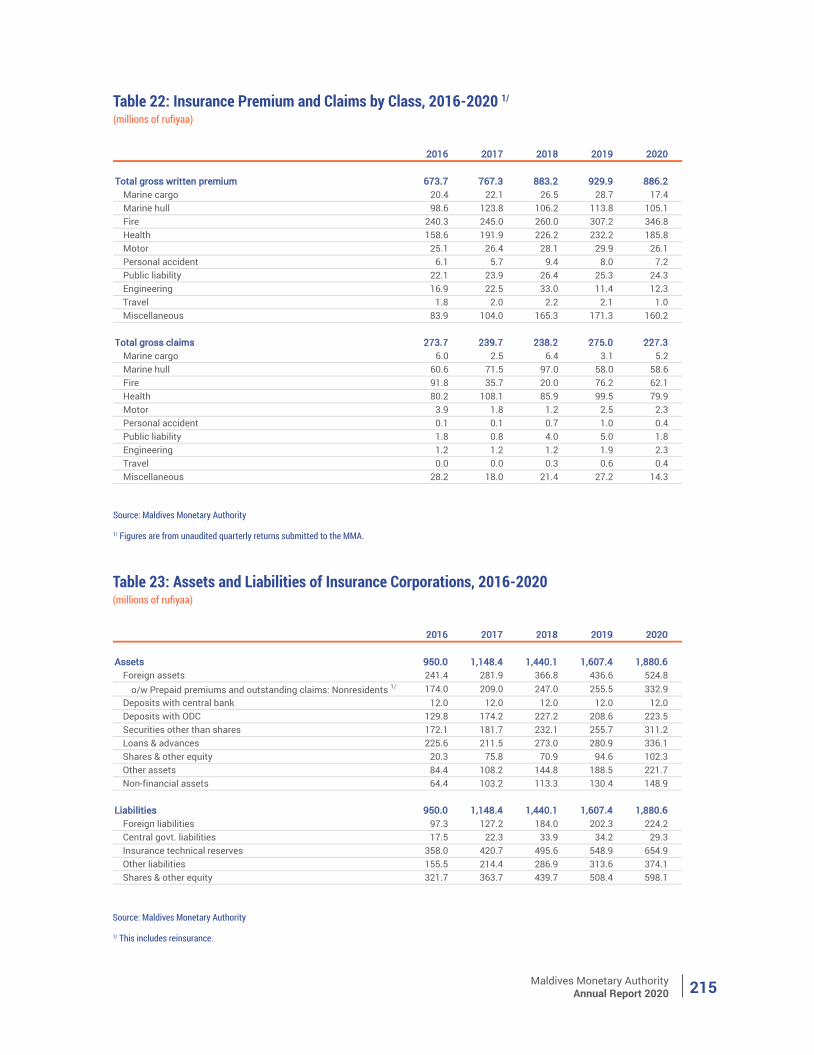
Maldives Monetary AuthorityAnnual Report 2020 215
Table 22: Insurance Premium and Claims by Class, 2016-2020 1/
(millions of rufiyaa)
Source: Maldives Monetary Authority
1/ Figures are from unaudited quarterly returns submitted to the MMA.
2016 2017 2018 2019 2020
Total gross written premium 673.7 767.3 883.2 929.9 886.2 Marine cargo 20.4 22.1 26.5 28.7 17.4 Marine hull 98.6 123.8 106.2 113.8 105.1 Fire 240.3 245.0 260.0 307.2 346.8 Health 158.6 191.9 226.2 232.2 185.8 Motor 25.1 26.4 28.1 29.9 26.1 Personal accident 6.1 5.7 9.4 8.0 7.2 Public liability 22.1 23.9 26.4 25.3 24.3 Engineering 16.9 22.5 33.0 11.4 12.3 Travel 1.8 2.0 2.2 2.1 1.0 Miscellaneous 83.9 104.0 165.3 171.3 160.2
Total gross claims 273.7 239.7 238.2 275.0 227.3 Marine cargo 6.0 2.5 6.4 3.1 5.2 Marine hull 60.6 71.5 97.0 58.0 58.6 Fire 91.8 35.7 20.0 76.2 62.1 Health 80.2 108.1 85.9 99.5 79.9 Motor 3.9 1.8 1.2 2.5 2.3 Personal accident 0.1 0.1 0.7 1.0 0.4 Public liability 1.8 0.8 4.0 5.0 1.8 Engineering 1.2 1.2 1.2 1.9 2.3 Travel 0.0 0.0 0.3 0.6 0.4 Miscellaneous 28.2 18.0 21.4 27.2 14.3
Table 23: Assets and Liabilities of Insurance Corporations, 2016-2020(millions of rufiyaa)
Source: Maldives Monetary Authority
1/ This includes reinsurance.
2016 2017 2018 2019 2020
Assets 950.0 1,148.4 1,440.1 1,607.4 1,880.6 Foreign assets 241.4 281.9 366.8 436.6 524.8
o/w Prepaid premiums and outstanding claims: Nonresidents 1/ 174.0 209.0 247.0 255.5 332.9 Deposits with central bank 12.0 12.0 12.0 12.0 12.0 Deposits with ODC 129.8 174.2 227.2 208.6 223.5 Securities other than shares 172.1 181.7 232.1 255.7 311.2 Loans & advances 225.6 211.5 273.0 280.9 336.1 Shares & other equity 20.3 75.8 70.9 94.6 102.3 Other assets 84.4 108.2 144.8 188.5 221.7 Non-financial assets 64.4 103.2 113.3 130.4 148.9
Liabilities 950.0 1,148.4 1,440.1 1,607.4 1,880.6 Foreign liabilities 97.3 127.2 184.0 202.3 224.2 Central govt. liabilities 17.5 22.3 33.9 34.2 29.3 Insurance technical reserves 358.0 420.7 495.6 548.9 654.9 Other liabilities 155.5 214.4 286.9 313.6 374.1 Shares & other equity 321.7 363.7 439.7 508.4 598.1
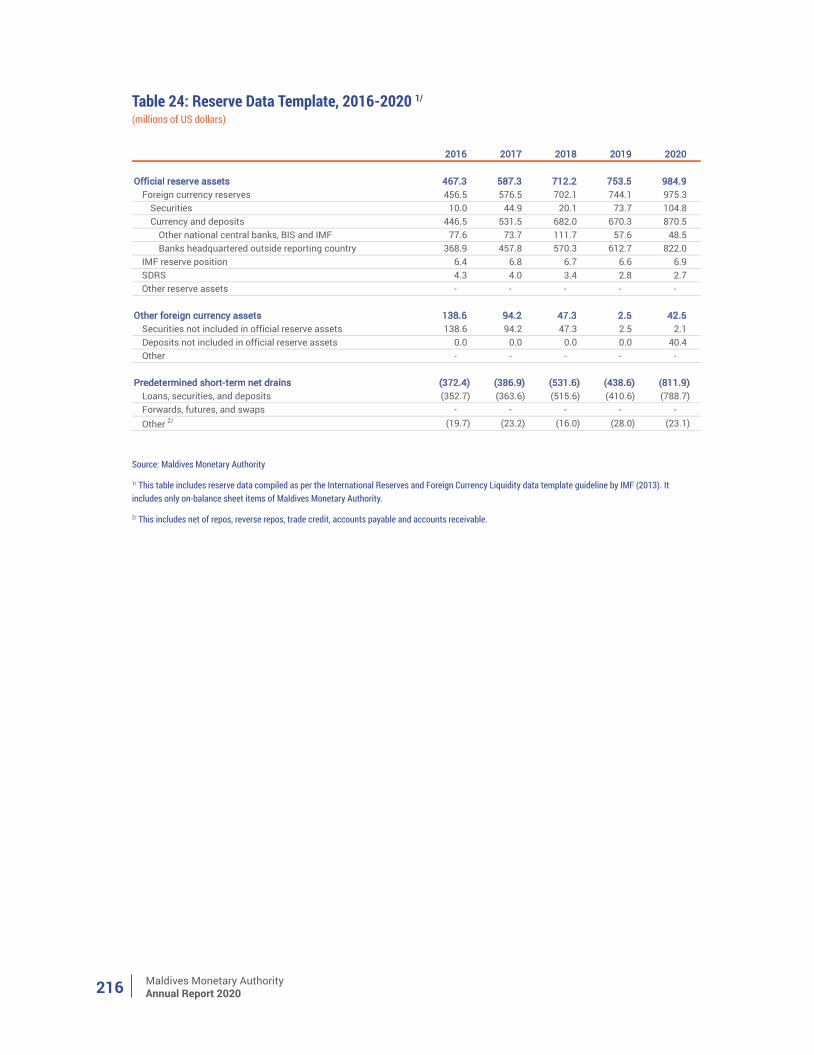
Maldives Monetary AuthorityAnnual Report 2020216
Table 24: Reserve Data Template, 2016-2020 1/
(millions of US dollars)
Source: Maldives Monetary Authority
1/ This table includes reserve data compiled as per the International Reserves and Foreign Currency Liquidity data template guideline by IMF (2013). It includes only on-balance sheet items of Maldives Monetary Authority.
2/ This includes net of repos, reverse repos, trade credit, accounts payable and accounts receivable.
2016 2017 2018 2019 2020
Official reserve assets 467.3 587.3 712.2 753.5 984.9 Foreign currency reserves 456.5 576.5 702.1 744.1 975.3
Securities 10.0 44.9 20.1 73.7 104.8 Currency and deposits 446.5 531.5 682.0 670.3 870.5
Other national central banks, BIS and IMF 77.6 73.7 111.7 57.6 48.5 Banks headquartered outside reporting country 368.9 457.8 570.3 612.7 822.0
IMF reserve position 6.4 6.8 6.7 6.6 6.9 SDRS 4.3 4.0 3.4 2.8 2.7 Other reserve assets - - - - -
Other foreign currency assets 138.6 94.2 47.3 2.5 42.5 Securities not included in official reserve assets 138.6 94.2 47.3 2.5 2.1 Deposits not included in official reserve assets 0.0 0.0 0.0 0.0 40.4 Other - - - - -
Predetermined short-term net drains (372.4) (386.9) (531.6) (438.6) (811.9) Loans, securities, and deposits (352.7) (363.6) (515.6) (410.6) (788.7) Forwards, futures, and swaps - - - - - Other 2/ (19.7) (23.2) (16.0) (28.0) (23.1)
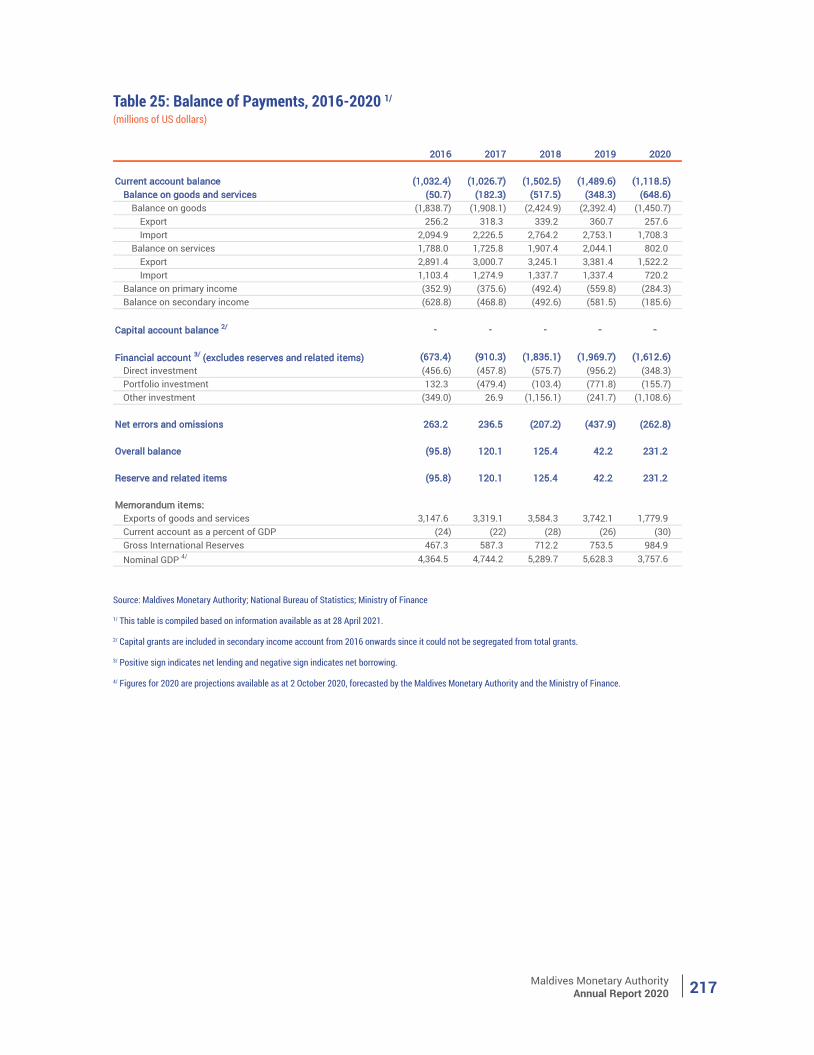
Maldives Monetary AuthorityAnnual Report 2020 217
Table 25: Balance of Payments, 2016-2020 1/
(millions of US dollars)
Source: Maldives Monetary Authority; National Bureau of Statistics; Ministry of Finance
1/ This table is compiled based on information available as at 28 April 2021.
2/ Capital grants are included in secondary income account from 2016 onwards since it could not be segregated from total grants.
3/ Positive sign indicates net lending and negative sign indicates net borrowing.
4/ Figures for 2020 are projections available as at 2 October 2020, forecasted by the Maldives Monetary Authority and the Ministry of Finance.
2016 2017 2018 2019 2020
Current account balance (1,032.4) (1,026.7) (1,502.5) (1,489.6) (1,118.5) Balance on goods and services (50.7) (182.3) (517.5) (348.3) (648.6)
Balance on goods (1,838.7) (1,908.1) (2,424.9) (2,392.4) (1,450.7) Export 256.2 318.3 339.2 360.7 257.6 Import 2,094.9 2,226.5 2,764.2 2,753.1 1,708.3
Balance on services 1,788.0 1,725.8 1,907.4 2,044.1 802.0 Export 2,891.4 3,000.7 3,245.1 3,381.4 1,522.2 Import 1,103.4 1,274.9 1,337.7 1,337.4 720.2
Balance on primary income (352.9) (375.6) (492.4) (559.8) (284.3) Balance on secondary income (628.8) (468.8) (492.6) (581.5) (185.6)
Capital account balance 2/ - - - - -
Financial account 3/ (excludes reserves and related items) (673.4) (910.3) (1,835.1) (1,969.7) (1,612.6) Direct investment (456.6) (457.8) (575.7) (956.2) (348.3) Portfolio investment 132.3 (479.4) (103.4) (771.8) (155.7) Other investment (349.0) 26.9 (1,156.1) (241.7) (1,108.6)
Net errors and omissions 263.2 236.5 (207.2) (437.9) (262.8)
Overall balance (95.8) 120.1 125.4 42.2 231.2
Reserve and related items (95.8) 120.1 125.4 42.2 231.2
Memorandum items:Exports of goods and services 3,147.6 3,319.1 3,584.3 3,742.1 1,779.9 Current account as a percent of GDP (24) (22) (28) (26) (30) Gross International Reserves 467.3 587.3 712.2 753.5 984.9 Nominal GDP 4/ 4,364.5 4,744.2 5,289.7 5,628.3 3,757.6
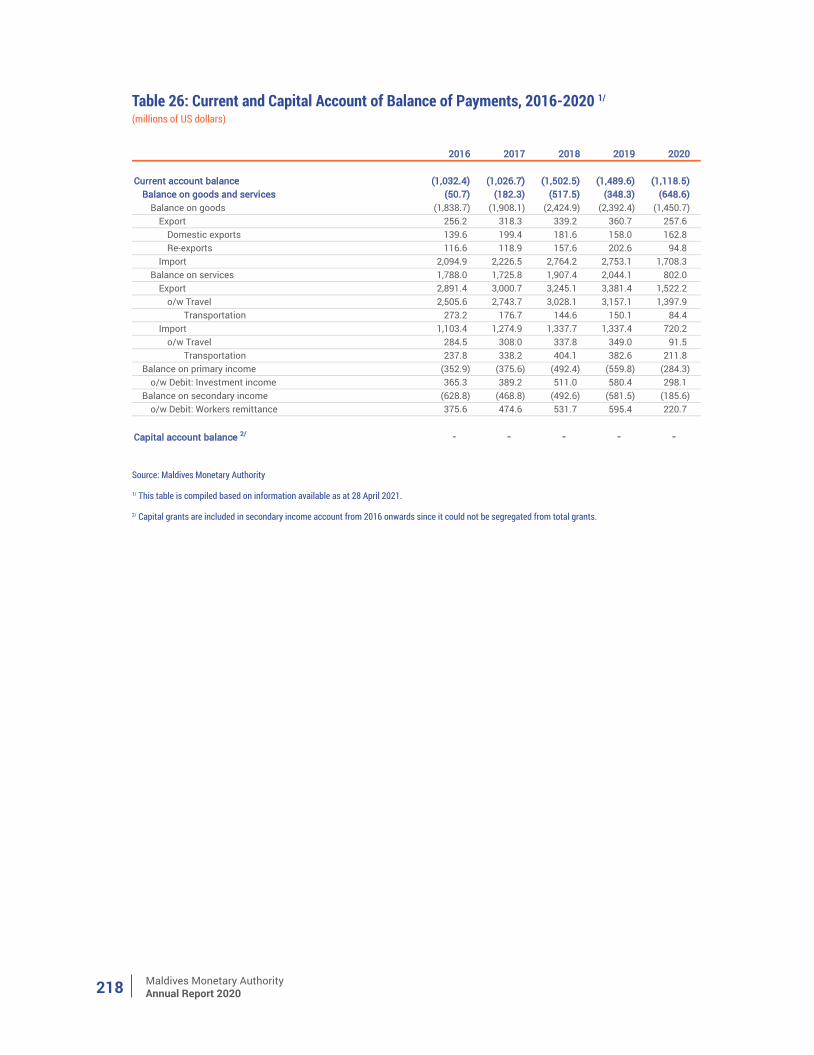
Maldives Monetary AuthorityAnnual Report 2020218
Table 26: Current and Capital Account of Balance of Payments, 2016-2020 1/
(millions of US dollars)
Source: Maldives Monetary Authority
1/ This table is compiled based on information available as at 28 April 2021.
2/ Capital grants are included in secondary income account from 2016 onwards since it could not be segregated from total grants.
2016 2017 2018 2019 2020
Current account balance (1,032.4) (1,026.7) (1,502.5) (1,489.6) (1,118.5) Balance on goods and services (50.7) (182.3) (517.5) (348.3) (648.6)
Balance on goods (1,838.7) (1,908.1) (2,424.9) (2,392.4) (1,450.7) Export 256.2 318.3 339.2 360.7 257.6
Domestic exports 139.6 199.4 181.6 158.0 162.8 Re-exports 116.6 118.9 157.6 202.6 94.8
Import 2,094.9 2,226.5 2,764.2 2,753.1 1,708.3 Balance on services 1,788.0 1,725.8 1,907.4 2,044.1 802.0
Export 2,891.4 3,000.7 3,245.1 3,381.4 1,522.2 o/w Travel 2,505.6 2,743.7 3,028.1 3,157.1 1,397.9
Transportation 273.2 176.7 144.6 150.1 84.4 Import 1,103.4 1,274.9 1,337.7 1,337.4 720.2
o/w Travel 284.5 308.0 337.8 349.0 91.5 Transportation 237.8 338.2 404.1 382.6 211.8
Balance on primary income (352.9) (375.6) (492.4) (559.8) (284.3) o/w Debit: Investment income 365.3 389.2 511.0 580.4 298.1
Balance on secondary income (628.8) (468.8) (492.6) (581.5) (185.6) o/w Debit: Workers remittance 375.6 474.6 531.7 595.4 220.7
Capital account balance 2/ - - - - -
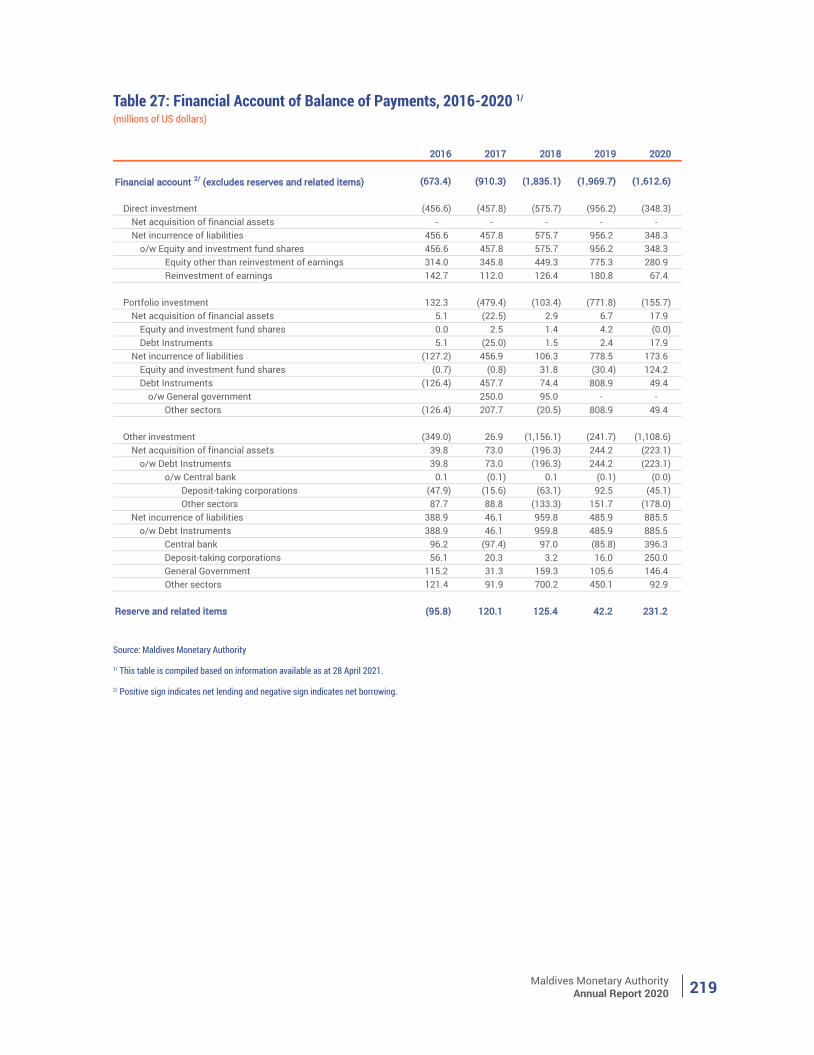
Maldives Monetary AuthorityAnnual Report 2020 219
Table 27: Financial Account of Balance of Payments, 2016-2020 1/
(millions of US dollars)
Source: Maldives Monetary Authority
1/ This table is compiled based on information available as at 28 April 2021.
2/ Positive sign indicates net lending and negative sign indicates net borrowing.
2016 2017 2018 2019 2020
Financial account 2/ (excludes reserves and related items) (673.4) (910.3) (1,835.1) (1,969.7) (1,612.6)
Direct investment (456.6) (457.8) (575.7) (956.2) (348.3) Net acquisition of financial assets - - - - - Net incurrence of liabilities 456.6 457.8 575.7 956.2 348.3
o/w Equity and investment fund shares 456.6 457.8 575.7 956.2 348.3 Equity other than reinvestment of earnings 314.0 345.8 449.3 775.3 280.9 Reinvestment of earnings 142.7 112.0 126.4 180.8 67.4
Portfolio investment 132.3 (479.4) (103.4) (771.8) (155.7) Net acquisition of financial assets 5.1 (22.5) 2.9 6.7 17.9
Equity and investment fund shares 0.0 2.5 1.4 4.2 (0.0) Debt Instruments 5.1 (25.0) 1.5 2.4 17.9
Net incurrence of liabilities (127.2) 456.9 106.3 778.5 173.6 Equity and investment fund shares (0.7) (0.8) 31.8 (30.4) 124.2 Debt Instruments (126.4) 457.7 74.4 808.9 49.4
o/w General government 250.0 95.0 - - Other sectors (126.4) 207.7 (20.5) 808.9 49.4
Other investment (349.0) 26.9 (1,156.1) (241.7) (1,108.6) Net acquisition of financial assets 39.8 73.0 (196.3) 244.2 (223.1)
o/w Debt Instruments 39.8 73.0 (196.3) 244.2 (223.1) o/w Central bank 0.1 (0.1) 0.1 (0.1) (0.0)
Deposit-taking corporations (47.9) (15.6) (63.1) 92.5 (45.1) Other sectors 87.7 88.8 (133.3) 151.7 (178.0)
Net incurrence of liabilities 388.9 46.1 959.8 485.9 885.5 o/w Debt Instruments 388.9 46.1 959.8 485.9 885.5
Central bank 96.2 (97.4) 97.0 (85.8) 396.3 Deposit-taking corporations 56.1 20.3 3.2 16.0 250.0 General Government 115.2 31.3 159.3 105.6 146.4 Other sectors 121.4 91.9 700.2 450.1 92.9
Reserve and related items (95.8) 120.1 125.4 42.2 231.2
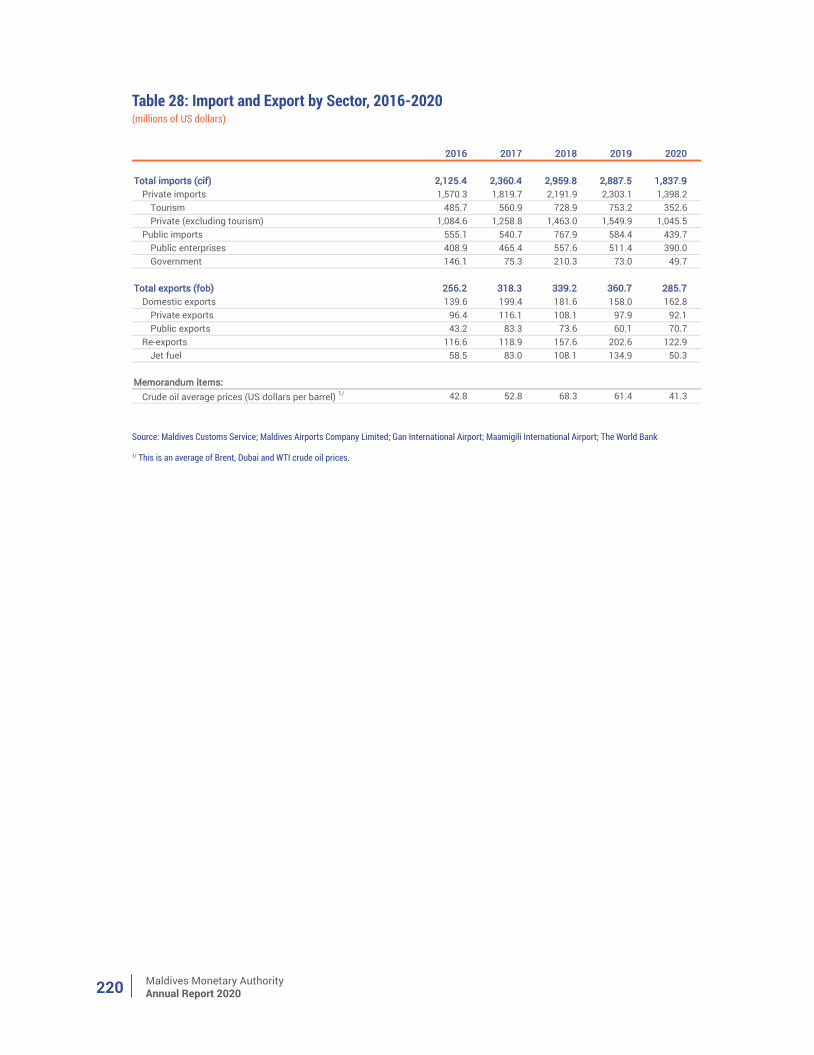
Maldives Monetary AuthorityAnnual Report 2020220
Table 28: Import and Export by Sector, 2016-2020(millions of US dollars)
Source: Maldives Customs Service; Maldives Airports Company Limited; Gan International Airport; Maamigili International Airport; The World Bank
1/ This is an average of Brent, Dubai and WTI crude oil prices.
2016 2017 2018 2019 2020
Total imports (cif) 2,125.4 2,360.4 2,959.8 2,887.5 1,837.9 Private imports 1,570.3 1,819.7 2,191.9 2,303.1 1,398.2
Tourism 485.7 560.9 728.9 753.2 352.6 Private (excluding tourism) 1,084.6 1,258.8 1,463.0 1,549.9 1,045.5
Public imports 555.1 540.7 767.9 584.4 439.7 Public enterprises 408.9 465.4 557.6 511.4 390.0 Government 146.1 75.3 210.3 73.0 49.7
Total exports (fob) 256.2 318.3 339.2 360.7 285.7 Domestic exports 139.6 199.4 181.6 158.0 162.8
Private exports 96.4 116.1 108.1 97.9 92.1 Public exports 43.2 83.3 73.6 60.1 70.7
Re-exports 116.6 118.9 157.6 202.6 122.9 Jet fuel 58.5 83.0 108.1 134.9 50.3
Memorandum items:Crude oil average prices (US dollars per barrel) 1/ 42.8 52.8 68.3 61.4 41.3
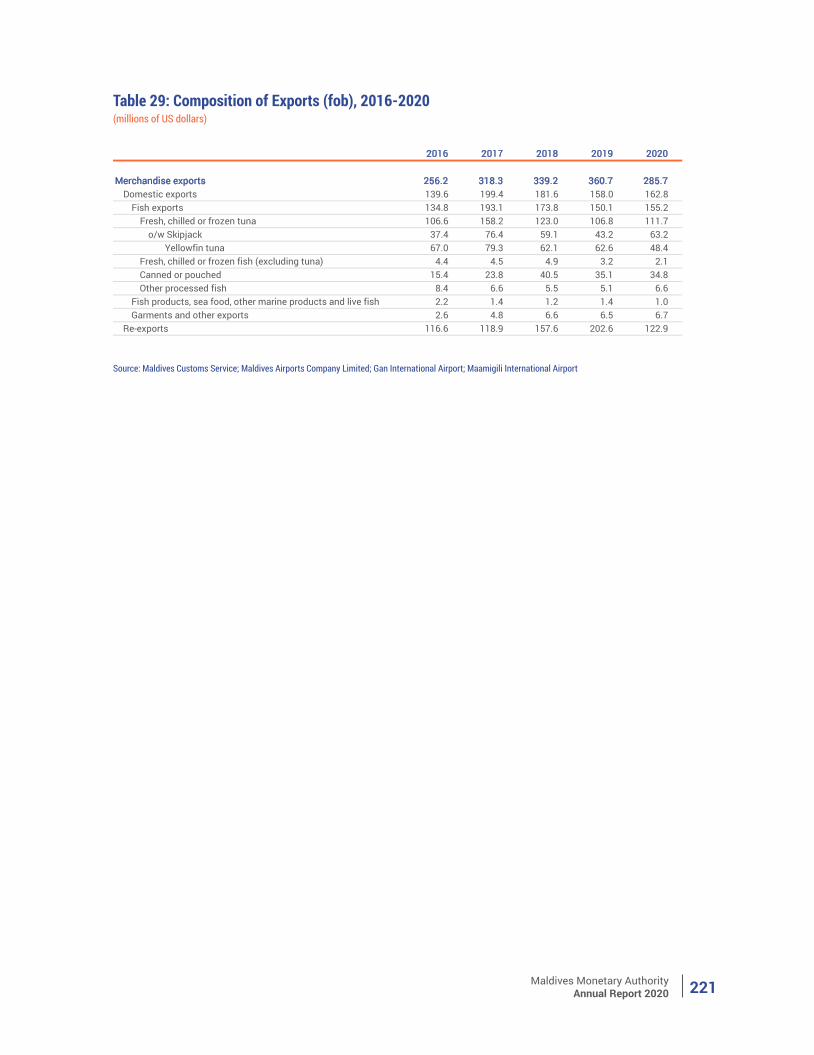
Maldives Monetary AuthorityAnnual Report 2020 221
Table 29: Composition of Exports (fob), 2016-2020(millions of US dollars)
Source: Maldives Customs Service; Maldives Airports Company Limited; Gan International Airport; Maamigili International Airport
2016 2017 2018 2019 2020
Merchandise exports 256.2 318.3 339.2 360.7 285.7 Domestic exports 139.6 199.4 181.6 158.0 162.8
Fish exports 134.8 193.1 173.8 150.1 155.2 Fresh, chilled or frozen tuna 106.6 158.2 123.0 106.8 111.7
o/w Skipjack 37.4 76.4 59.1 43.2 63.2 Yellowfin tuna 67.0 79.3 62.1 62.6 48.4
Fresh, chilled or frozen fish (excluding tuna) 4.4 4.5 4.9 3.2 2.1 Canned or pouched 15.4 23.8 40.5 35.1 34.8 Other processed fish 8.4 6.6 5.5 5.1 6.6
Fish products, sea food, other marine products and live fish 2.2 1.4 1.2 1.4 1.0 Garments and other exports 2.6 4.8 6.6 6.5 6.7
Re-exports 116.6 118.9 157.6 202.6 122.9
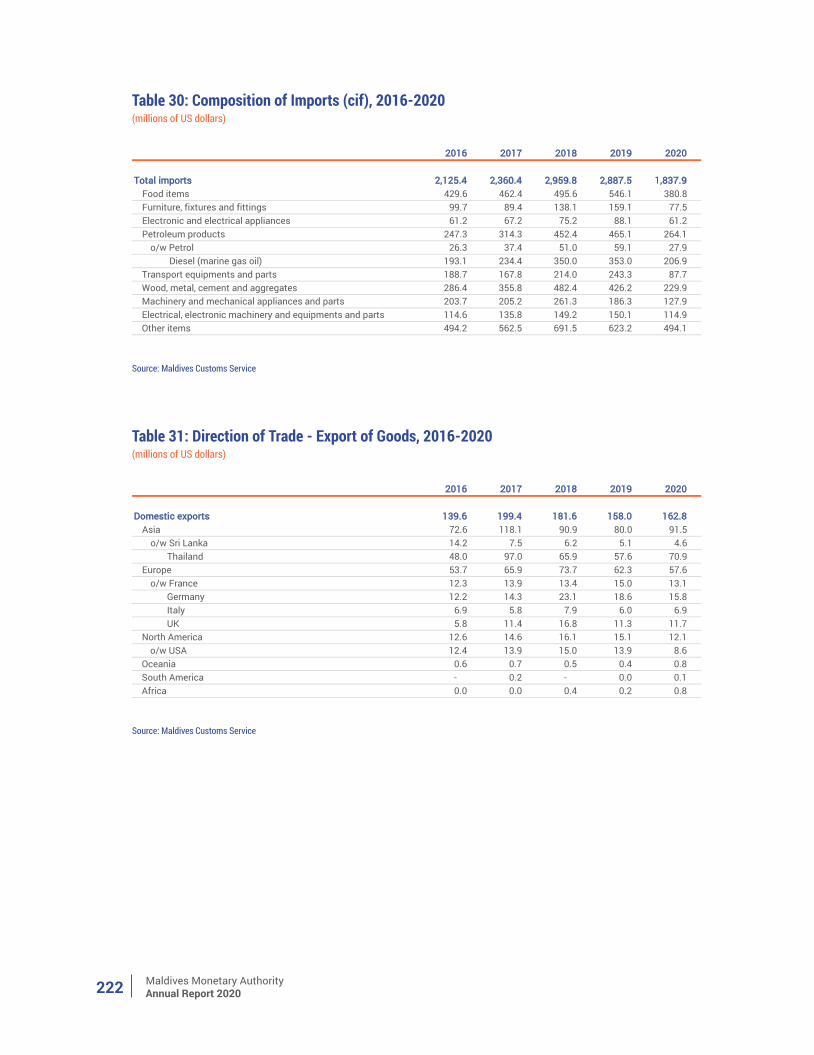
Maldives Monetary AuthorityAnnual Report 2020222
Table 31: Direction of Trade - Export of Goods, 2016-2020
Table 30: Composition of Imports (cif), 2016-2020
(millions of US dollars)
(millions of US dollars)
Source: Maldives Customs Service
Source: Maldives Customs Service
2016 2017 2018 2019 2020
Domestic exports 139.6 199.4 181.6 158.0 162.8 Asia 72.6 118.1 90.9 80.0 91.5
o/w Sri Lanka 14.2 7.5 6.2 5.1 4.6 Thailand 48.0 97.0 65.9 57.6 70.9
Europe 53.7 65.9 73.7 62.3 57.6 o/w France 12.3 13.9 13.4 15.0 13.1
Germany 12.2 14.3 23.1 18.6 15.8 Italy 6.9 5.8 7.9 6.0 6.9 UK 5.8 11.4 16.8 11.3 11.7
North America 12.6 14.6 16.1 15.1 12.1 o/w USA 12.4 13.9 15.0 13.9 8.6
Oceania 0.6 0.7 0.5 0.4 0.8 South America - 0.2 - 0.0 0.1 Africa 0.0 0.0 0.4 0.2 0.8
2016 2017 2018 2019 2020
Total imports 2,125.4 2,360.4 2,959.8 2,887.5 1,837.9 Food items 429.6 462.4 495.6 546.1 380.8 Furniture, fixtures and fittings 99.7 89.4 138.1 159.1 77.5 Electronic and electrical appliances 61.2 67.2 75.2 88.1 61.2 Petroleum products 247.3 314.3 452.4 465.1 264.1
o/w Petrol 26.3 37.4 51.0 59.1 27.9 Diesel (marine gas oil) 193.1 234.4 350.0 353.0 206.9
Transport equipments and parts 188.7 167.8 214.0 243.3 87.7 Wood, metal, cement and aggregates 286.4 355.8 482.4 426.2 229.9 Machinery and mechanical appliances and parts 203.7 205.2 261.3 186.3 127.9 Electrical, electronic machinery and equipments and parts 114.6 135.8 149.2 150.1 114.9 Other items 494.2 562.5 691.5 623.2 494.1
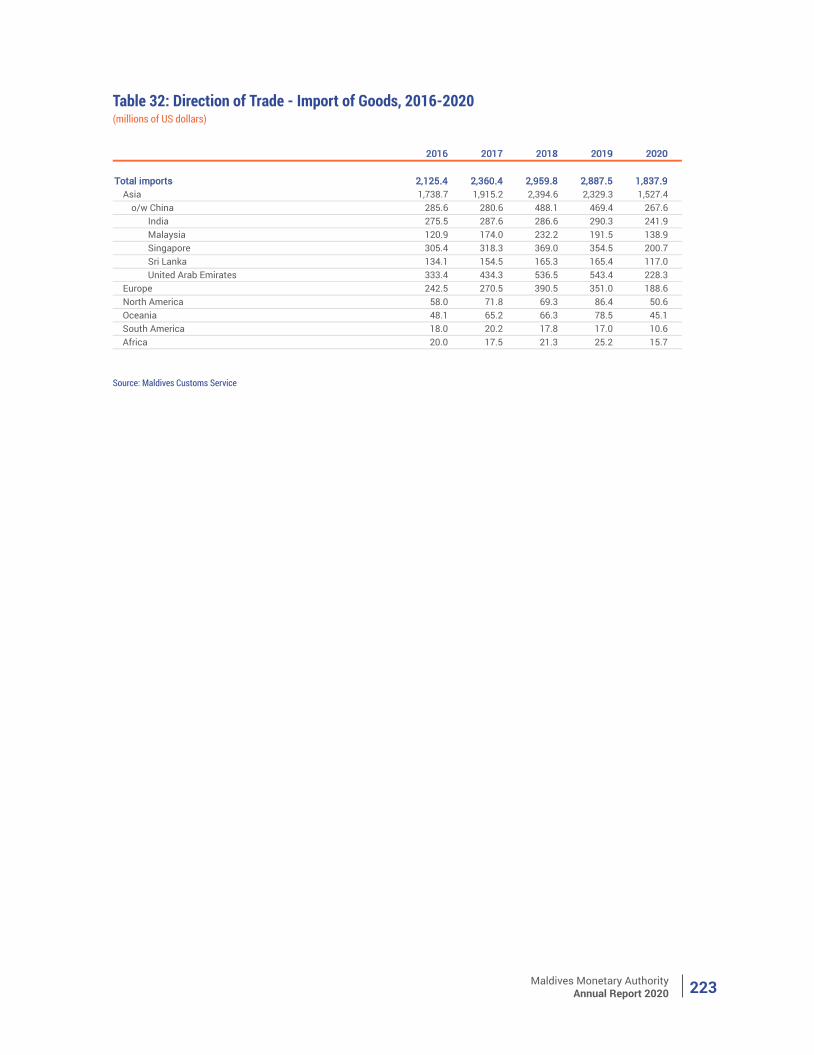
Maldives Monetary AuthorityAnnual Report 2020 223
Table 32: Direction of Trade - Import of Goods, 2016-2020(millions of US dollars)
Source: Maldives Customs Service
2016 2017 2018 2019 2020
Total imports 2,125.4 2,360.4 2,959.8 2,887.5 1,837.9 Asia 1,738.7 1,915.2 2,394.6 2,329.3 1,527.4
o/w China 285.6 280.6 488.1 469.4 267.6 India 275.5 287.6 286.6 290.3 241.9 Malaysia 120.9 174.0 232.2 191.5 138.9 Singapore 305.4 318.3 369.0 354.5 200.7 Sri Lanka 134.1 154.5 165.3 165.4 117.0 United Arab Emirates 333.4 434.3 536.5 543.4 228.3
Europe 242.5 270.5 390.5 351.0 188.6 North America 58.0 71.8 69.3 86.4 50.6 Oceania 48.1 65.2 66.3 78.5 45.1 South America 18.0 20.2 17.8 17.0 10.6 Africa 20.0 17.5 21.3 25.2 15.7
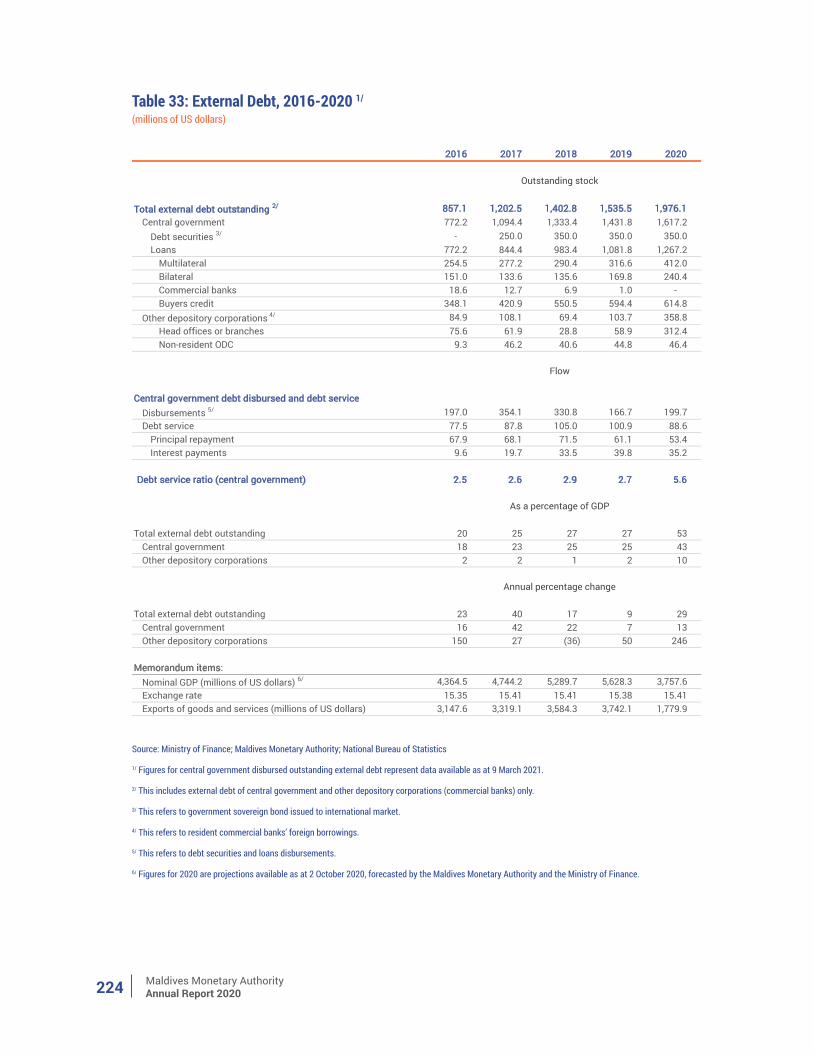
Maldives Monetary AuthorityAnnual Report 2020224
Table 33: External Debt, 2016-2020 1/
(millions of US dollars)
Source: Ministry of Finance; Maldives Monetary Authority; National Bureau of Statistics
1/ Figures for central government disbursed outstanding external debt represent data available as at 9 March 2021.
2/ This includes external debt of central government and other depository corporations (commercial banks) only.
3/ This refers to government sovereign bond issued to international market.
4/ This refers to resident commercial banks’ foreign borrowings.
5/ This refers to debt securities and loans disbursements.
6/ Figures for 2020 are projections available as at 2 October 2020, forecasted by the Maldives Monetary Authority and the Ministry of Finance.
2016 2017 2018 2019 2020
Total external debt outstanding 2/ 857.1 1,202.5 1,402.8 1,535.5 1,976.1 Central government 772.2 1,094.4 1,333.4 1,431.8 1,617.2
Debt securities 3/ - 250.0 350.0 350.0 350.0 Loans 772.2 844.4 983.4 1,081.8 1,267.2
Multilateral 254.5 277.2 290.4 316.6 412.0 Bilateral 151.0 133.6 135.6 169.8 240.4 Commercial banks 18.6 12.7 6.9 1.0 - Buyers credit 348.1 420.9 550.5 594.4 614.8
Other depository corporations 4/ 84.9 108.1 69.4 103.7 358.8 Head offices or branches 75.6 61.9 28.8 58.9 312.4 Non-resident ODC 9.3 46.2 40.6 44.8 46.4
Central government debt disbursed and debt serviceDisbursements 5/ 197.0 354.1 330.8 166.7 199.7 Debt service 77.5 87.8 105.0 100.9 88.6
Principal repayment 67.9 68.1 71.5 61.1 53.4 Interest payments 9.6 19.7 33.5 39.8 35.2
Debt service ratio (central government) 2.5 2.6 2.9 2.7 5.6
Total external debt outstanding 20 25 27 27 53 Central government 18 23 25 25 43 Other depository corporations 2 2 1 2 10
Total external debt outstanding 23 40 17 9 29 Central government 16 42 22 7 13 Other depository corporations 150 27 (36) 50 246
Memorandum items:Nominal GDP (millions of US dollars) 6/ 4,364.5 4,744.2 5,289.7 5,628.3 3,757.6 Exchange rate 15.35 15.41 15.41 15.38 15.41 Exports of goods and services (millions of US dollars) 3,147.6 3,319.1 3,584.3 3,742.1 1,779.9
Outstanding stock
Flow
As a percentage of GDP
Annual percentage change
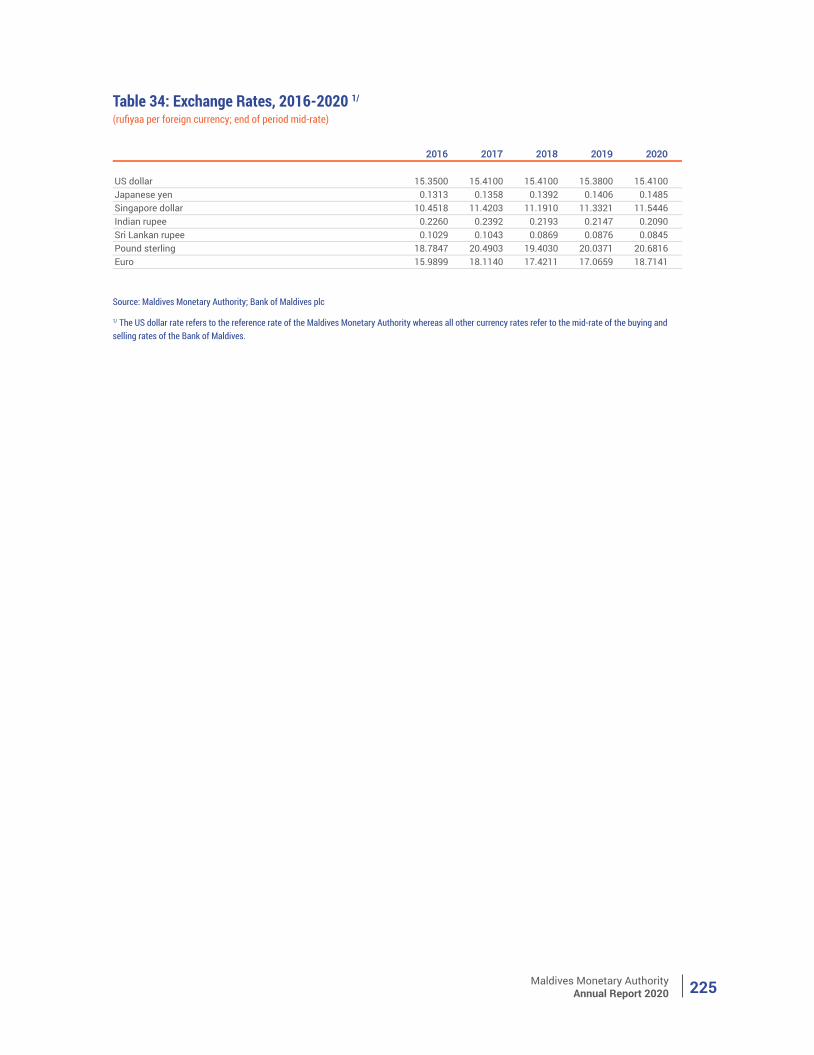
Maldives Monetary AuthorityAnnual Report 2020 225
Table 34: Exchange Rates, 2016-2020 1/
(rufiyaa per foreign currency; end of period mid-rate)
Source: Maldives Monetary Authority; Bank of Maldives plc
1/ The US dollar rate refers to the reference rate of the Maldives Monetary Authority whereas all other currency rates refer to the mid-rate of the buying and selling rates of the Bank of Maldives.
2016 2017 2018 2019 2020
US dollar 15.3500 15.4100 15.4100 15.3800 15.4100 Japanese yen 0.1313 0.1358 0.1392 0.1406 0.1485 Singapore dollar 10.4518 11.4203 11.1910 11.3321 11.5446 Indian rupee 0.2260 0.2392 0.2193 0.2147 0.2090 Sri Lankan rupee 0.1029 0.1043 0.0869 0.0876 0.0845 Pound sterling 18.7847 20.4903 19.4030 20.0371 20.6816 Euro 15.9899 18.1140 17.4211 17.0659 18.7141


Maldives Monetary Authority
Boduthakurufaanu Magu
Male’ 20182
Republic of Maldives
Email: [email protected]