Latent class count models of total visitation demand: days out hiking in the eastern Alps
19
Latent class count models of total visitation demand: days out in the eastern Alps Riccardo Scarpa Economics Department Waikato Management School University of Waikato Hamilton New Zealand Mara Thiene (presenting author) Dipartimento Territorio e Sistemi Agroforestali University of Padua Italy Tiziano Tempesta Dipartimento Territorio e Sistemi Agroforestali University of Padua Italy PLEASE DO NOT QUOTE WITHOUT PERMISSION Abstract We report preliminary results on the investigation of the hypothesis of the existence of la- tent classes in the total demand for days out in a vast section of the Italian Eastern Alps. Fi- nite mixing is informed by socioeconomic variables and it is limited to the demand portion of a hurdle model of visitation. Gradually more flexible count models are estimated moving from the Poisson to the Negative Binomial-1 and -2, to the generalized negative binomial. We find that information criteria identify different number of classes across specifications. Entropy indices are quite discordant across specifications, while likelihood-based criteria such as the Akaike Information Criteria and the Bayesian Information Criteria are concor- dant. The implications of addressing heterogeneity by means of latent classes stretches to derivation of expected consumers surplus, predicted visitation and response to access fees. JEL classification: Q26, C25 Key words: travel cost method, latent class analysis, destination choice modelling, preference heterogeneity, count models. 1
Transcript of Latent class count models of total visitation demand: days out hiking in the eastern Alps

Latent class count models of total visitationdemand: days out in the eastern Alps
Riccardo ScarpaEconomics Department
Waikato Management SchoolUniversity of Waikato
HamiltonNew Zealand
Mara Thiene (presenting author)Dipartimento Territorio e Sistemi Agroforestali
University of PaduaItaly
Tiziano TempestaDipartimento Territorio e Sistemi Agroforestali
University of PaduaItaly
PLEASE DO NOT QUOTE WITHOUT PERMISSION
Abstract
We report preliminary results on the investigation of the hypothesis of the existence of la-tent classes in the total demand for days out in a vast section of the Italian Eastern Alps. Fi-nite mixing is informed by socioeconomic variables and it is limited to the demand portionof a hurdle model of visitation. Gradually more flexible count models are estimated movingfrom the Poisson to the Negative Binomial-1 and -2, to the generalized negative binomial.We find that information criteria identify different number of classes across specifications.Entropy indices are quite discordant across specifications, while likelihood-based criteriasuch as the Akaike Information Criteria and the Bayesian Information Criteria are concor-dant. The implications of addressing heterogeneity by means of latent classes stretchesto derivation of expected consumers surplus, predicted visitation and response to accessfees. JEL classification: Q26, C25 Key words: travel cost method, latent class analysis,destination choice modelling, preference heterogeneity, count models.
1

1 Introduction 2
1 Introduction
Recent empirical work has found evidence in support of finite mixing models ofdestination choice (Shonkwiler & Shaw 2003, Provencher et al. 2002, Provencher& Bishop 2004, Scarpa & Thiene 2004, 2005, Morey et al. 2005). However, nomuch work has been done on the effects of heterogeneous preferences in modellingtotal demand for recreation.
Outdoor recreation to the Alps is articulated in a vast number of more or lessspecialized activities. With this study we intend to model a generic type of demand,in terms of number of days out to each destination. In particular we intend to testif demand intensity across sites endogenously segregates into latent groups.
We apply finite mixing (see for example Langeheine & Rost 1988, Leroux1992, McLachlan & Peel 2000, for a theoretical treatment) to a zero-inflated countdemand model for number of days out in the North-Eastern Alps, and estimatea number of models from a sample of 866 members of the Alpine Club of Italy(CAI) residents of the Veneto Region. A total of 9,922 days out to 18 mountaindestinations were recorded over a recreational season.
We specify and derive probability estimates for class membership for total de-mand and express these as logit probabilities explained by age of the respondent,number of family members and a constant. The idea behind it is that age and fam-ily size explain some membership probability, and the rest is semi-parametricallydetermined by a constant effect.
It is well-known that the most theoretically-consistent way to conceptually op-erationalize zero trip demand is via the Kuhn-Tucker model developed in Phaneufet al. (2000) (see Von Haefen & Phaneuf 2005, for a recent review). However, inour case the data quality is insufficient to estimate such a model. Furthermore, weare interested in exploring how much better a finite mixing approach can performin a stylized context of zero-inflated count regression.
Count models allocate a probability to observed zero count, which is ofteninsufficient to account for the vast number of zero demand points observed in em-pirical data (Gurmu & Trivedi 1996, Cameron & Trivedi 1998). So we inflate thezero count probability by a logit inflator, which is common across sites and acrossgroups. Additional probability of not to participating into the market of days out ata given site is modelled as a stylized binary logit probability and explained usinga constant, travel-cost to the site, travel-cost to the nearest substitute site, age ofrespondent and number of family members. The last variable is used as a proxy forvalue of time within the family production function, and it is expected to positivelyaffect non-participation.
The “natural” count (inclusive of the share of zero counts accommodated nat-urally by count specifications) of seasonal demand for days out is also stylized

2 Latent class models in outdoor recreation studies 3
and includes travel-cost to the site, travel-cost to the nearest substitute site, andage of the respondent. This last variable is included because it is often maintainedthat members of older generations—many of whom did their national service inthe Alps in the Alpine Corp—make more use of the mountains for recreation. Weestimate a set of coefficients for the count regression for each latent class.
The rest of the paper is organized as follows. In section 2 we review the ap-plications of finite mixing in the recreation demand literature. In section 3 weillustrate our methodology. The data employed are described in 4 and 6, while insection 5 we present and discuss the results. We draw our conclusions in section 7.
2 Latent class models in outdoor recreation studies
The issue of heterogeneity of preference and its informative value in recreationdemand was first explored in the context of destination choice modelling by Train(1998) and implemented by continuous mixed logit model.
In a later paper, still in the context of destination choice Provencher et al. (2002)showed that finite mixing compared well with continuous mixing, and had the ad-vantage of ease of interpretation and estimation. In a more recent paper Provencher& Bishop (2004) also explore the contribution of such approach to modelling des-tination choice. In both these studies membership probabilities were informed bysocio-economic covariates and trip-related variables.
Shonkwiler & Shaw (2003) also used finite mixing in the context of destina-tion choice modelling and emphasized how different cost coefficient across groupscould accommodate heterogeneity in marginal utility of income.
Scarpa & Thiene (2004) and Scarpa & Thiene (2005) emphasized the implica-tions of destination choice models based on finite mixing in terms of equity issuefor policy analysis. They studied destination choices of alpine climbers in the samegeographical area of the present study.
More recently, Morey et al. (2005) illustrated how finite mixing in destinationchoice models for sport-angling can be constructed around membership probabili-ties derived from responses to attitudinal questions.
It would appear that that this is the first paper extending the finite class mod-elling approach to estimation of total demand model by means of count data. Inthis respect this is a novel contribution in environmental economics.
3 Methods
3.1 The latent class count model with zero inflation
Let the number of trips taken by respondent n to site j be denoted by ynj .

3 Methods 4
For K − 1 classes define the probability of respondent n to belong to class kas:
πnk =(1 + exp(−θksn)−1
), (1)
where sn are socio-economic covariates, such as years of experience and age inour specification, and θ is a conformable parameter vector, while for the last classK the residual membership probability is given by the complement:
πnK = 1−K−1∑k=1
πnk. (2)
Let the probability of observing zero trips at mountain destination j by individualn in class k with covariates wnj and xnj be defined by:
πnj(y = 0|k) = [1 + exp(γwnj)]−1 + Ξ(ynj = 0|βk, xnj), (3)
where the first term is just a zero-inflation factor dependent on estimable parame-ters γ and variables wnj . And Ξ(y = 0|β, xnj) is the expression of the countprocess (for specific functional forms for Poisson, NB-1, NB-2 see Cameron &Trivedi (1998) while for generalized NB see Grijalva et al. (2002))1 for πnj(y = 0),and βk is a conformable vector of estimable parameters for each class k.
Finally, let the probability of observing a number of days out y > 0 to site jconditional on respondent n being in class k be denoted by:
πnj(y > 0|k) =Ξ(y > 0|βk, xnj)1− πnj(y = 0|k)
, (4)
where xnj includes determinants of trip demand, such as travel cost, cost to substi-tute sites, and respondent’s age. Notice that for each latent class k one can derivemeasures of consumer surplus by means of the per-trip CS estimator for semi-logspecifications of E[y], which is CSk = −1/βk. The estimated expected numberof trips though must be computed accounting for the zero inflation.
1 In NB models the variance of the count variable can be expressed as a function of the mean andan additional dispersion parameter α, which frequently takes a linear form : V ar(y) = E(y)(1 +α−ω). Commonly employed values for ω are 1 and 2, which imply respectively a linear in the mean(NB1) and quadratic in the mean (NB2) variance function. However, generalised forms (GNB) withhybrid properties between these two may also be estimated by allowing an extra parameter to takeup optimal values. Grijalva et al. (2002) (eq. 5, page 406) show that setting ω = 2 − κ, the extraparameter κ may be estimated from the data using full information maximum likelihood procedures.NB1 variance function is equivalent to restricting κ = 1, while NB2 one to restricting κ = 0, withhybrid forms for values within the [0, 1] interval.

3 Methods 5
The marginal probability of observing y ∈ Z for respondent n and site j isgiven by:
πnj(y) =K∑
k=1
πnk [πnj(y = 0|k) + πnj(y > 0|k)] , (5)
giving rise—under independence—to the sample likelihood:
L =N∏
n=1
18∏j=1
πnj(y), (6)
Estimation can be conducted by maximum likelihood, although the log-likelihoodfunction to maximize is not globally concave and there is no certainty of a uniquemaximum. For this reason during the estimation various starting point were em-ployed, and we retained the estimates associate with the highest log-likelihoodvalue.
3.2 Number of latent classes
The number of classes with different preferences is not part of the maximizationprocess from which the parameter estimates are derived. In other words it is out-side the space of the estimable parameters. The conventional specification testsused for maximum likelihood estimates (likelihood ratio, Lagrange multipliers andWald tests) are not valid in this context because they do not satisfy the regularityconditions for a limiting chi-square distribution under the null. This because theparameter values under the null are at the boundary of the parameter space.
Resampling from the empirical distribution is feasible but very impractical be-cause of the computational complexity it involves (Wedel and Kamakura 2000,page 91). As a guidance some authors have used a variety of information criteriaC = – 2lnL + Jκ where lnL is the log-likelihood of the model at convergence, Jis the number of estimated parameters in the model, and κ is a penalty constant.
For κ = 2 we obtain the Akaike Information Criteria (AIC); for κ =(lnN ) we obtain the Bayesian Information Criteria (BIC). Finally, for κ =2+2(J+1)(J+2)/(NJ2) we have the corrected AIC (crAIC) (Hurvich & Tsai 1989),which increases the penalty for the number of extra parameters estimated. The low-est the value of these criteria the better the model fits that choice of class number.
However, these criteria also fail some of the regularity conditions for a validtest under the null (Leroux 1992). Asymptotically the AIC is reported to be biasedtowards an over-estimate of the number of preference classes, while the BIC is not,although in small sample sizes the BIC tends to favour too few classes (McLachlan& Peel 2000).

4 Survey data 6
Furthermore, as the number of classes increases the significance of parameterestimates in the utility function gradually decreases, especially in classes with lowprobability of membership. Therefore the chosen number of classes must alsoaccount for significance of parameter estimates and be tempered by the analyst’sown judgment on the meaningfulness of the parameter signs.
Another measure of good segregation across classes is the entropy index pro-posed by Wedel & Kamakura (2000) and used by Morey et al. (2005):
E = 1−∑N
n=1
∑Kk=1 −πnk ln(πnk)N ln(K)
, (7)
the higher this value the better the segregation of respondents into classes pre-dicted by the model.
4 Survey data
4.1 The North East Alps
The eighteen mountain destinations are quite diverse from both a morphologicaland mountaineering point of view, but they can provide non-specialist outdoorrecreation, and so are all potential destinations for day trips. Two broad geograph-ically determined groups can be distinguished. Destinations 1-6 (Table 1) belongto the pre-Alps, which are mountains with gentler slopes and lower peaks separat-ing the plane from the proper Alps. Because of their closeness to the main urbancentres, and the presence of relative high difficulty hiking routes - even though thelength of the paths is limited - the pre-Alps are the final destination of many localday trips.
Destinations 7-18 are in the North-Eastern Alps, in the mountain chain of theDolomites, which is an extended rocky area mostly made of dolomite rocks. Thisrare and distinguished rock type is geologically well-defined as it originates fromcoral reefs. Mountains made of this rock are scenically quite attractive as they tendto show orange-pink reflections at sunset. These create those dramatic scenes forwhich the Dolomites are well-known all over the world.
4.2 Sample and its characteristics
Because a great fraction of the Italian alpine visitors belong to the CAI,2 and our in-terest was defining the benefits enjoyed by the local users, the sampling frame was
2 Some previous studies highlighted that about 25% of the day trips in the studied area werecompleted by CAI members.

4 Survey data 7
based on the Veneto chapter of CAI members. This membership is quite popularacross regular mountain users as the Club provides a great deal of locally relevantservices, such as training courses, activity maps, guides, rescue services etc. Thedata for the study was collected with a survey from a sample of 904 members ofthe local chapter of the Italian Alpine Club (or CAI), who reported on their moun-tain visits for the year 1999. The total number of trips reported is 10,391, somedescriptive statistics along with the list of destination are reported in Table 1.
Data were collected using a questionnaire. Typically a group of respondentswere given the questionnaire along with an explanation of how to interpret andanswer several questions. Then, each member of the group would fill the question-naire independently on their own. Respondents were asked questions about theirmountain abilities and experience, whether they attended mountaineering trainingcourses; regularly trained in cliffs and indoor climbing walls; since when they hadbeen hiking; other activities practised such as ski-mountaineering etc.
They were also asked the total number of day trips in the last twelve months toeach of the 18 sites. Finally, they provided socio-economic information about thestate of their households. Round-trip distances from own residence to each of thedestinations in the choice set were calculated using the software package “Straded’Italia e d’Europa”. This data was used to estimate the individual travel cost foreach trip.
Distance costs were converted into monetary values in tenths of Euros. Eachreported visit was a “one day trip”, as customary for this form of local outdoorrecreation. Usually in Italy, there is no cost attributed to travel time, mainly becausethe opportunity of producing extra-income using spare time is very limited, and sothe opportunity cost of time is assumed to be zero. A breakdown of the travel costto destinations and to closest substitutes are reported in Table 2.
The definition of a complete set of substitute destinations for this kind of recre-ation is a thorny issue to resolve. However, in this instance, because of the proxim-ity of these sites to the residence of the interviewed sample, we believe it is safe toassume that all the 18 destinations are substitutes, although this set is certainly notexhaustive. The short nature of the visits (day trips) makes the existence of com-plement sites unlikely, while the large number of destinations considered clearlyinduce a large non-participation rate.
The majority of the respondents in the sample are male (70%) and quite young:half of them are under 40 years old. Most of them attended high-school (52%) andalmost 16% graduated from university programs. About 45% of the sample has atake-home income ranging from 17,500 to 22,500 Euro. The average family sizeis 3.1 people.
Other sample statistics show that, at the time of the survey, 48% of respondentshad been hiking for at least eleven years, therefore a sizeable portion in the sample
5 Estimation Results 8
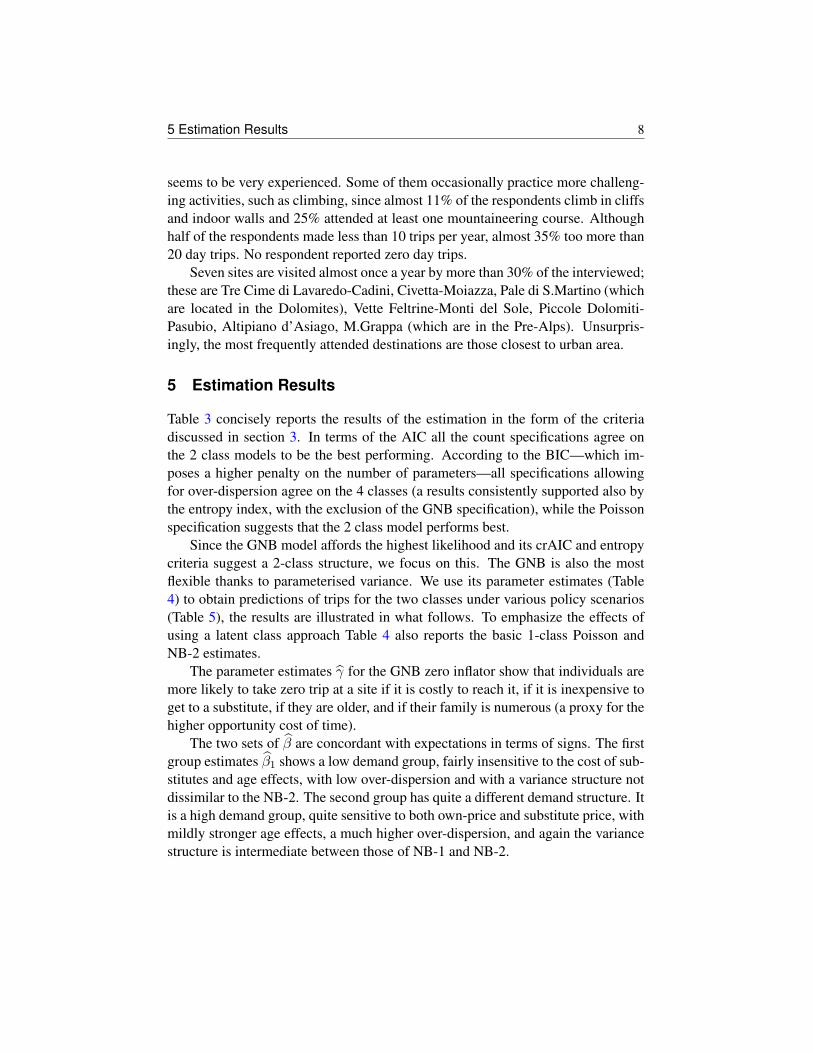
seems to be very experienced. Some of them occasionally practice more challeng-ing activities, such as climbing, since almost 11% of the respondents climb in cliffsand indoor walls and 25% attended at least one mountaineering course. Althoughhalf of the respondents made less than 10 trips per year, almost 35% too more than20 day trips. No respondent reported zero day trips.
Seven sites are visited almost once a year by more than 30% of the interviewed;these are Tre Cime di Lavaredo-Cadini, Civetta-Moiazza, Pale di S.Martino (whichare located in the Dolomites), Vette Feltrine-Monti del Sole, Piccole Dolomiti-Pasubio, Altipiano d’Asiago, M.Grappa (which are in the Pre-Alps). Unsurpris-ingly, the most frequently attended destinations are those closest to urban area.
5 Estimation Results
Table 3 concisely reports the results of the estimation in the form of the criteriadiscussed in section 3. In terms of the AIC all the count specifications agree onthe 2 class models to be the best performing. According to the BIC—which im-poses a higher penalty on the number of parameters—all specifications allowingfor over-dispersion agree on the 4 classes (a results consistently supported also bythe entropy index, with the exclusion of the GNB specification), while the Poissonspecification suggests that the 2 class model performs best.
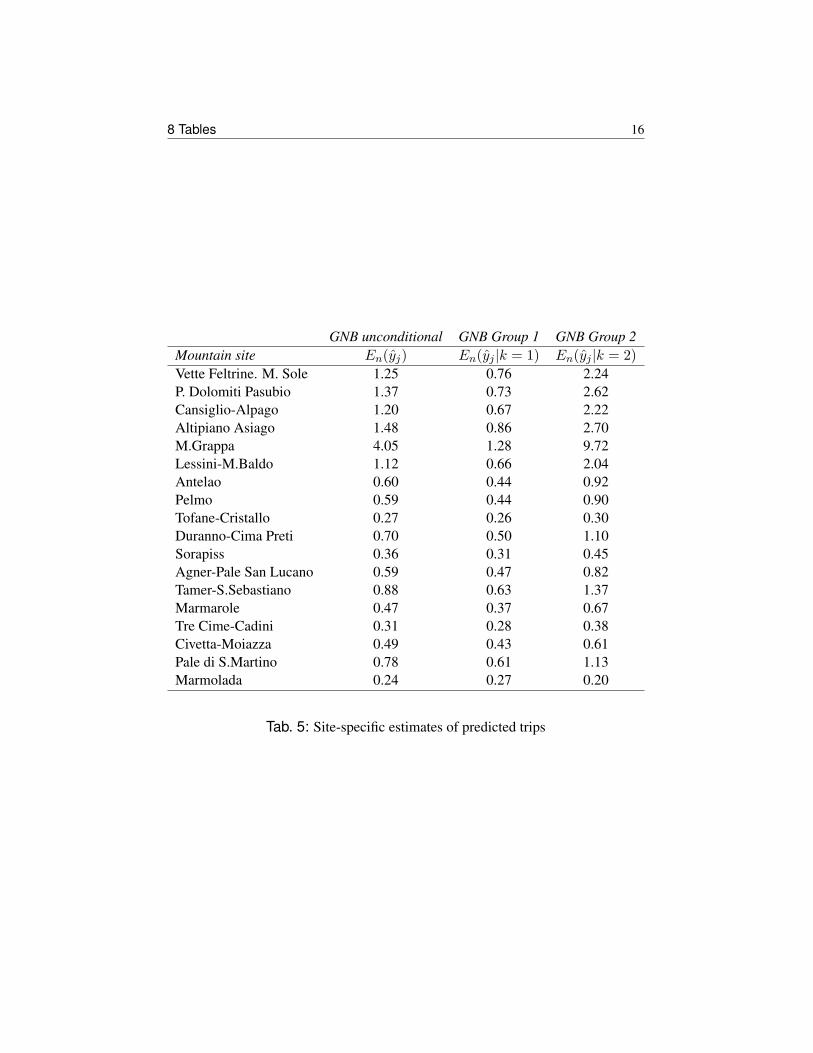
Since the GNB model affords the highest likelihood and its crAIC and entropycriteria suggest a 2-class structure, we focus on this. The GNB is also the mostflexible thanks to parameterised variance. We use its parameter estimates (Table4) to obtain predictions of trips for the two classes under various policy scenarios(Table 5), the results are illustrated in what follows. To emphasize the effects ofusing a latent class approach Table 4 also reports the basic 1-class Poisson andNB-2 estimates.
The parameter estimates γ for the GNB zero inflator show that individuals aremore likely to take zero trip at a site if it is costly to reach it, if it is inexpensive toget to a substitute, if they are older, and if their family is numerous (a proxy for thehigher opportunity cost of time).
The two sets of β are concordant with expectations in terms of signs. The firstgroup estimates β1 shows a low demand group, fairly insensitive to the cost of sub-stitutes and age effects, with low over-dispersion and with a variance structure notdissimilar to the NB-2. The second group has quite a different demand structure. Itis a high demand group, quite sensitive to both own-price and substitute price, withmildly stronger age effects, a much higher over-dispersion, and again the variancestructure is intermediate between those of NB-1 and NB-2.

6 Policy for Simulation 9
6 Policy for Simulation
Quite often access fees are considered an important tool to fund the maintenance offacilities for outdoor recreation in mountain sites. Therefore, it is of some interestto analyze their implications in terms of expected changes in visitation rates atvarious sites. We first simulated the implementation of a flat access fee across allthe eighteen sites. Next we computed the value of the fee inducing zero visits inthe sample to each of the sites. This was done for each class separately, so as toemphasize the policy repercussions of two separate demand segments, versus theconventional results obtained from 1-class.
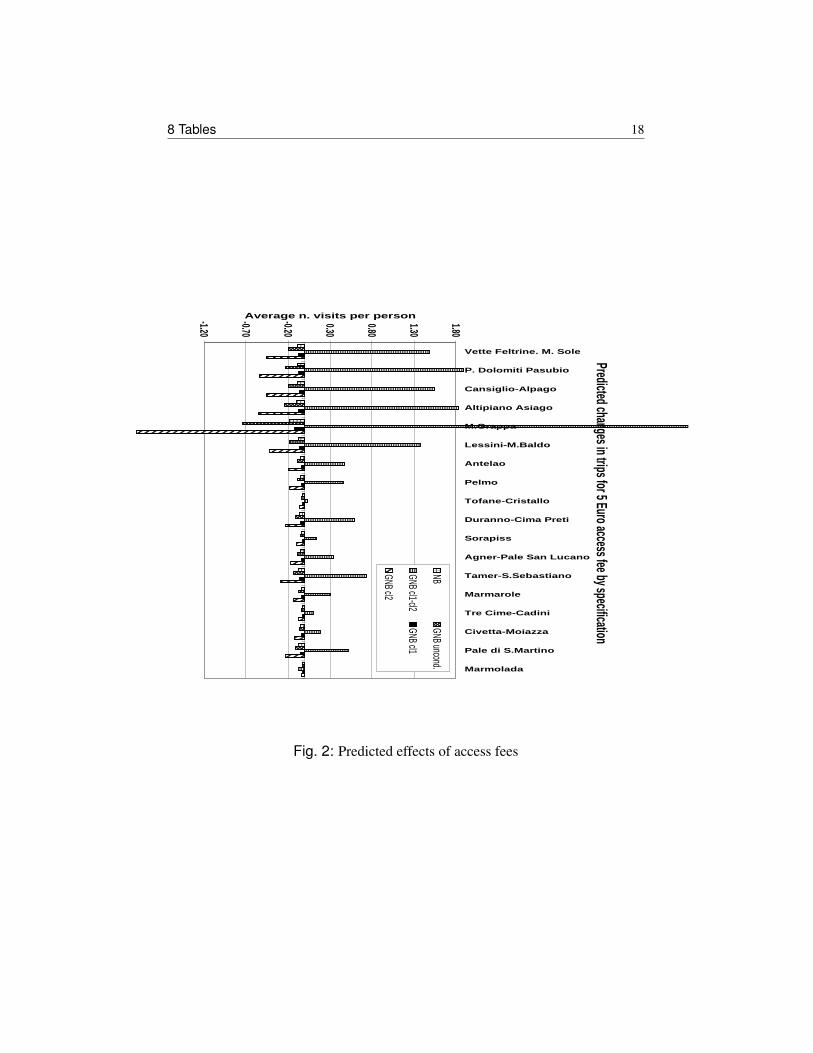
Results from the first simulation are summarized in figure 2, which shows thepredicted changes in trips for 5 Euro access fee. We applied this policy simulationin order to compare the fee effect for 1-class NB-2 and 2-class GNB. For the latterwe report both, changes in expected visits unconditionally and conditionally onclass membership.
The results in figure 2 show that estimates obtained with the conventional NB-2specification seem to underestimate the decrease of visits at all the mountain sites.
In figure 2 histogram bars representing positive variations describe the pre-dicted differences in trips between class 2 and 1 from the GNB specification. Itis interesting to notice that, visitors belonging to group 2 (0.33% probabilities ofmembership, that is the smaller group) make on average a higher number of trips tothe sites as a whole. The largest group, 0.67% probabilities of membership, displaya lower demand. Secondly, by focussing on the single sites, we can observe thatdestination sites in the pre-Alps (the first six sites from the left), are more visitedthan Dolomites for both the classes, this because of their proximity to the urbancenters of the plain, where most of the sample respondents are resident. Differ-ences in terms of visits are over 1.4 per individual for all the sites and reach thevalue of 8.4 for a Mount Grappa, which is one of the most visited sites because ofthe First World War heritage.
Comparing predicted changes in trips due to access fee in group 1 and 2 (seeGNB cl1 and GNB cl2 in figure 2) suggests two different issues. People belongingto group 2 have a higher elasticity to price compared to those in group 1. Becauseof this, the predicted change is different depending on the mountain destinations.The decrease in predicted trips is at least three times higher in group 2 than ingroup 1 for sites in the Dolomites, but it is at least six times higher in the pre-Alpssites.
Finally, the consequences of allowing for preference heterogeneity with latentclasses is well illustrated in figure 3. With the exception of Mount Grappa, anaccess fee of 140 Euro would reduce to zero the trip demand to all mountain sitesfor people of group 2. Predictions for the larger group 1, though, show a higher

7 Conclusions 10
willingness to pay for trips to the Veneto mountains, with an access fee of 200 Eurothere would still be a very small level of demand.
7 Conclusions
In this paper we explore the issue of the existence of latent groups in the totaldemand for days out in the eastern Italian Alps. We develop a stylized zero-inflatedcount model and estimate this using different variance assumptions, from the rigidPoisson, to the most flexible generalized negative binomial.
The empirical evidence seems to indicate that even with a stylized model suchas our latent classes are present. The identification of how many exactly theseclasses are remains an issue which is in part arbitrarily defined.
Amongst the determinants of zero trips at sites we find family size, which wetake to be a proxy for the opportunity cost of leisure time.
An important determinant of demand appears to be the years of experience asan outdoor excursionist in the Alps. In other words it seems to be that the Alps arean “acquired taste”.
The implications of addressing heterogeneity by means of latent classesstretches to derivation of expected consumers surplus, predicted visitation and re-sponse to access fees.
We conclude that the finite mixing approach already usefully employed in des-tination choice models might be fruitfully extended to total demand analysis ofoutdoor recreation activities.
References
Cameron, A. & Trivedi, P. (1998), Regression Analysis of Count Data, Economet-rics Society Monograph, Cambridge University Press, United Kingdom.
Grijalva, T., Berrens, R. & Shaw, W. (2002), ‘Testing the validity of contingent be-haviour trip responses’, American Journal of Agricultural Economics 84, 401–414.
Gurmu, S. & Trivedi, P. (1996), ‘Excess zero count models for recreational trips’,Journal of Business and Economic Statistics 75, 469–477.
Hurvich, M. & Tsai, C. (1989), ‘Regression and Time Series Model Selection inSmall Samples’, Biometrika 76, 297–307.
Langeheine, R. & Rost, J. (1988), Latent trait and latent class models, PlenumPress, Ney York.

7 Conclusions 11
Leroux, B. (1992), ‘Consistent estimation of mixing distributions’, Annal of Sta-tistics 20, 1350–1360.
McLachlan, G. & Peel, D. (2000), Finite Mixture Models, Jon Wiley and Sons,New York.
Morey, E., Thacher, J. & Breffle, W. (2005), ‘Using Angler Characteristics andAttitudinal Data to Identify Environmental Preference Classes: A Latent-ClassModel’, Environmental and Resource Economics forthcoming.
Phaneuf, D., Kling, C. & Herriges, J. (2000), ‘Estimation and welfare calcula-tions in a generalized corner solution model with an application to recreationdemand’, Review of Economic and Statistics 82, 83–92.
Provencher, B., Barenklau, K. & Bishop, R. (2002), ‘A finite mixture logit model ofrecreational angling with serially correlated random utility’, American Journalof Agricultural Economics 84, 1066–1075.
Provencher, B. & Bishop, R. (2004), ‘Does accounting for preference heterogene-ity improve the forecasting of a random utility model? A case study’, Journal ofEnvironmental Economics and Management 48, 793–810.
Scarpa, R. & Thiene, M. (2004), ‘Destination Choice Models for Rock-Climbingin the North-Eastern Alps: a Latent-Class Approach Based on Intensity of Pref-erence’, Paper presented at the EAERE Conference Budapest, June 25th-28th.
Scarpa, R. & Thiene, M. (2005), ‘Destination choice models for rock climbing inthe Northeastern Alps: a latent-class approach based on intensity of preference’,Land Economics 85(3), 426–44.
Shonkwiler, J. & Shaw, W. (2003), A finite Mixture Approach to Analyzing IncomeEffects in Random Utility Models: Reservoir Recreation Along the ColumbiaRiver, in N. Hanley, W. Shaw & R. Wright, eds, ‘The New Economics of Out-door Recreation’, Edward Elgar, U.K.
Train, K. (1998), ‘Recreation demand models with taste variation’, Land Eco-nomics 74, 230–239.
Von Haefen, R. & Phaneuf, D. (2005), Kuhn-tucker demand system approaches tonon-market valuation, in R. Scarpa & A. Alberini, eds, ‘Applications of simu-lation methods in environmental and resource economics’, Springer Publisher,Dordrecht, The Netherlands, chapter 8, pp. 135–158.
Wedel, M. & Kamakura, W. A. (2000), Market Segmentation: Conceptual Method-ological Foundations, second edn, Kluwer Academic Publishers, Boston.

8 Tables 12
8 Tables
Mountain groups Mean St.Dev. Median 90th perc. Day trips
1. Vette Feltrine M. Sole 2.59 3.53 2 5 3042. P.Dolomiti Pasubio 4.91 5.64 3 11 4213. Cansiglio Alpago 2.18 3.02 1 4 1974. Altipiano Asiago 3.64 4.22 2 10 1915. M. Grappa 2.70 2.99 2 5 3126. Lessini Baldo 5.03 8.68 2 13 2557. Antelao 1.39 0.94 1 2 1788. Pelmo 1.35 0.69 1 2 1869. Tofane-Cristallo 1.86 1.42 1 3 13010. Duranno-Cima Preti 1.45 0.05 1 2 3111. Sorapiss 1.35 0.82 1 2 10012. Agner-Pale San Lucano 1.31 0.05 1 2 8913. Tamer-S.Sebastiano 1.64 1.06 1 3 12714. Marmarole 1.07 1.66 1 3 10415. Tre Cime-Cadini 1.08 1.29 1 3 31916. Civetta-Moiazza 1.86 1.07 1 3 32217. Pale di S.Martino 2.05 1.63 1 4 29918. Marmolada 1.61 1.22 1 3 154
Tab. 1: Descriptive Statistics of day trips per Head by Destinations

8 Tables 13
Cost to Destination Cost to Closest SubstituteDestinations Mean St.Dev. Median Mean St.Dev. Median
1. Vette Feltrine M. Sole 5.93 2.41 6.10 2.98 1.41 2.902. P. Dolomiti Pasubio 5.80 3.16 5.70 3.06 1.31 2.903. Cansiglio-Alpago 6.06 2.65 5.70 3.48 1.46 3.304. Altipiano Asiago 4.96 2.34 5.80 2.90 1.31 2.905. M. Grappa 3.36 1.86 8.80 2.90 1.76 4.106. Lessini-M. Baldo 5.96 2.38 5.00 3.63 1.68 3.207. Antelao 7.90 3.88 8.80 3.13 1.67 3.308. Pelmo 8.40 3.66 8.80 3.21 1.66 2.909. Tofane-Cristallo 10.97 4.61 0.46 2.77 1.63 2.9010. Duranno-Cima Preti 5.50 3.45 6.60 2.68 1.92 2.9011. Sorapiss 9.60 4.29 0.42 3.13 1.72 3.2512. Agner-Pale San Lucano 8.76 3.16 9.10 3.14 1.45 2.9013. Tamer-S. Sebastiano 6.07 2.52 7.40 2.30 1.56 2.9014. Marmarole 8.24 4.22 9.50 2.85 1.78 2.9015. Tre Cime-Cadini 11.63 4.52 0.46 3.06 1.57 2.9016. Civetta-Moiazza 9.25 2.78 0.38 3.23 1.51 2.9017. Pale di S.Martino 7.09 1.09 0.29 3.30 1.04 2.9018. Marmolada 12.42 2.73 0.54 3.30 1.45 3.10
Tab. 2: Sample Statistics of Travel Cost to site and Closest Substitute (Euro)

8 Tables 14
LCM groups Parameters lnL AIC BIC crAIC EPoisson
2 16 –14148.9 28329.8 28445.19 28297.86 0.2333 23 –13853.7 27753.4 27919.28 27707.52 0.3774 30 –13801.2 27662.4 27878.76 27602.60 0.523
Neg. Bin. 12 21 –13764.3 27570.6 27722.05 27528.70 0.0103 32 –13746.5 27557.0 27787.79 27493.22 0.3464 43 –13740.1 27566.2 27876.32 27480.60 0.552
Neg. Bin. 22 21 –13778.7 27599.4 27750.85 27557.50 0.0403 32 –13745.1 27554.2 27784.99 27490.42 0.1134 43 –13744.1 27574.2 27884.32 27488.60 0.113
GNB2 22 –13757.1 27558.2 27716.87 27514.31 0.9663 33 –13740.4 27546.8 27784.80 27481.04 0.2794 44 –13730.0 27548.0 27865.33 27460.42 0.274
Tab. 3: Criteria for number of classes

8 Tables 15
Poisson Neg. Bin GNBVariable Estimate and z-value
γ
Constant 0.084 (0.8) -4.486 (7.3) 0.155 (1.6)TCM 0.011 (17.3) 0.002 (0.6) 0.018 (32.5)TC sub -0.002 (1.2) 0.040 (7.4) -0.008 (5.9)Age -0.006 (3.9) -0.018 (2.4) -0.009 (6.7)Fam SZ 0.030 (1.8) 0.278 (4.0) 0.028 (1.8)
β1
Constant 1.165 (58.0) 0.353 (5.3) 0.587 (2.6)TCM -0.017 (80.7) -0.022 (53.2) -0.020 4.2TC sub 0.011 (32.5) 0.014 (11.5) 0.004 (1.1)Age 0.008 (23.9) 0.010 (8.0) 0.005 (1.2)α1 3.261 (36.2) 0.563 (2.9)κ1 0.912 (3.9)Membership 0.67CS (Euro) 5.95 (80.7) 4.56 (53.2) 5.06 (4.2)
β2
Constant 1.928 ( 5.7)TCM -0.046 (9.3)TC sub 0.037 (6.9)Age 0.008 (1.2)α2 3.894 (8.8)κ2 0.809 (17.4)Membership 0.33CS (Euro) 5.95 (80.7) 4.56 (53.2) 2.16 (9.3)
θ
Constant 1.247 (2.7)Age -0.006 (0.6)YrsExp -0.014 (1.94)
Tab. 4: Model estimates. Absolute values of t-statistics.
8 Tables 16
GNB unconditional GNB Group 1 GNB Group 2Mountain site En(yj) En(yj |k = 1) En(yj |k = 2)Vette Feltrine. M. Sole 1.25 0.76 2.24P. Dolomiti Pasubio 1.37 0.73 2.62Cansiglio-Alpago 1.20 0.67 2.22Altipiano Asiago 1.48 0.86 2.70M.Grappa 4.05 1.28 9.72Lessini-M.Baldo 1.12 0.66 2.04Antelao 0.60 0.44 0.92Pelmo 0.59 0.44 0.90Tofane-Cristallo 0.27 0.26 0.30Duranno-Cima Preti 0.70 0.50 1.10Sorapiss 0.36 0.31 0.45Agner-Pale San Lucano 0.59 0.47 0.82Tamer-S.Sebastiano 0.88 0.63 1.37Marmarole 0.47 0.37 0.67Tre Cime-Cadini 0.31 0.28 0.38Civetta-Moiazza 0.49 0.43 0.61Pale di S.Martino 0.78 0.61 1.13Marmolada 0.24 0.27 0.20
Tab. 5: Site-specific estimates of predicted trips

8 Tables 17
Fig. 1: Location of mountain sites
8 Tables 18
Predicted changes in trips for 5 Euro access fee by specification
-1.20
-0.70
-0.20
0.30
0.80
1.30
1.80Vette Feltrine. M. Sole
P. Dolomiti Pasubio
Cansiglio-Alpago
Altipiano Asiago
M.Grappa
Lessini-M.Baldo
Antelao
Pelmo
Tofane-Cristallo
Duranno-Cima Preti
Sorapiss
Agner-Pale San Lucano
Tamer-S.Sebastiano
Marmarole
Tre Cime-Cadini
Civetta-Moiazza
Pale di S.Martino
Marmolada
Average n. visits per person
NBGNB uncond.
GNB cl1-cl2GNB cl1
GNB cl2
Fig. 2: Predicted effects of access fees

8 Tables 19
Access fee reducing visits to zero in class1 and 2
50
100
150
200
250
300
Vette Feltrine. M. Sole
P. Dolomiti Pasubio
Cansiglio-Alpago
Altipiano Asiago
M.Grappa
Lessini-M.Baldo
Antelao
Pelmo
Tofane-Cristallo
Duranno-Cima Preti
Sorapiss
Agner-Pale San Lucano
Tamer-S.Sebastiano
Marmarole
Tre Cime-Cadini
Civetta-Moiazza
Pale di S.Martino
Marmolada
� � � � � � � � � � � �
Class 1Class 2
Fig. 3: Choke prices