High diversity of root associated fungi in both alpine and arctic Dryas octopetala
Upload
independentCategory
view
4download
0
Late Younger Dryas and early Holocene palaeoenvironments in theSkagerrak, eastern North Atlantic: a multiproxy study
DORTHE RENG ERBS-HANSEN, KAREN LUISE KNUDSEN, ANTHONY CAVEDO GARY, EYSTEIN JANSEN,RICHARD GYLLENCREUTZ, VINCENT SCAO AND KURT LAMBECK
BOREAS Erbs-Hansen, D. R., Knudsen, K. L., Gary, A. C., Jansen, E., Gyllencreutz, R., Scao, V. & Lambeck, K. 2011:Late Younger Dryas and early Holocene palaeoenvironments in the Skagerrak, eastern North Atlantic: a multi-proxy study. Boreas, Vol. 40, pp. 660–680. 10.1111/j.1502-3885.2011.00205.x. ISSN 0300-9843
A high-resolution study of palaeoenvironmental changes through the late Younger Dryas and early Holocene inthe Skagerrak, the eastern North Atlantic, is based on multiproxy analyses of core MD99-2286 combined withpalaeowater depth modelling for the area. The late Younger Dryas was characterized by a cold ice-distal benthicforaminiferal fauna. After the transition to the Preboreal (c. 11 650 cal. a BP) this fauna was replaced by a Cassi-dulina neoteretis-dominated fauna, indicating the influence of chilled Atlantic Water at the sea floor. Persistingrelatively cold bottom-water conditions until c. 10 300 cal. a BP are presumably a result of an outflow of glacialmeltwater from the Baltic area across south-central Sweden, which led to a strong stratification of the water col-umn at MD99-2286, as also indicated by C. neoteretis. A short-term peak in the C/N ratio at c. 10 200 cal. a BP issuggested to indicate input of terrestrial material, which may represent the drainage of an ice-dammed lake insouthern Norway, the Glomma event. After the last drainage route across south-central Sweden closed, c.10 300 cal. a BP, the meltwater influence diminished, and the Skagerrak resembled a fjord with a stable inflow ofwaters from the North Atlantic through the Norwegian Trench and a gradual increase in boreal species. Full in-terglacial conditions were established at the sea floor from c. 9250 cal. a BP. Subsequent warm stable conditionswere interrupted by a short-term cooling around 8300–8200 cal. a BP, representing the 8.2 ka event.
Dorthe Reng Erbs-Hansen (e-mail: [email protected]) and Karen Luise Knudsen (e-mail: [email protected]), Department of Earth Sciences, Aarhus University, DK-8000 Aarhus C, Denmark; An-thony Gary (e-mail: [email protected]), Energy and Geoscience Institute, University of Utah, 84108 Salt LakeCity, USA; Eystein Jansen (e-mail: [email protected]) and Vincent Scao (e-mail: [email protected]),Bjerknes Centre for Climate Research, University of Bergen, NO-5007 Bergen, Norway; Richard Gyllencreutz(e-mail: [email protected]), Department of Geological Sciences, Stockholm University, SE-106 91Stockholm, Sweden; Kurt Lambeck (e-mail: [email protected]), Research School of Earth Science, TheAustralian National University, ACT 0200 Canbarra, Australia; received 28th September 2010, accepted 9th Feb-ruary 2011.
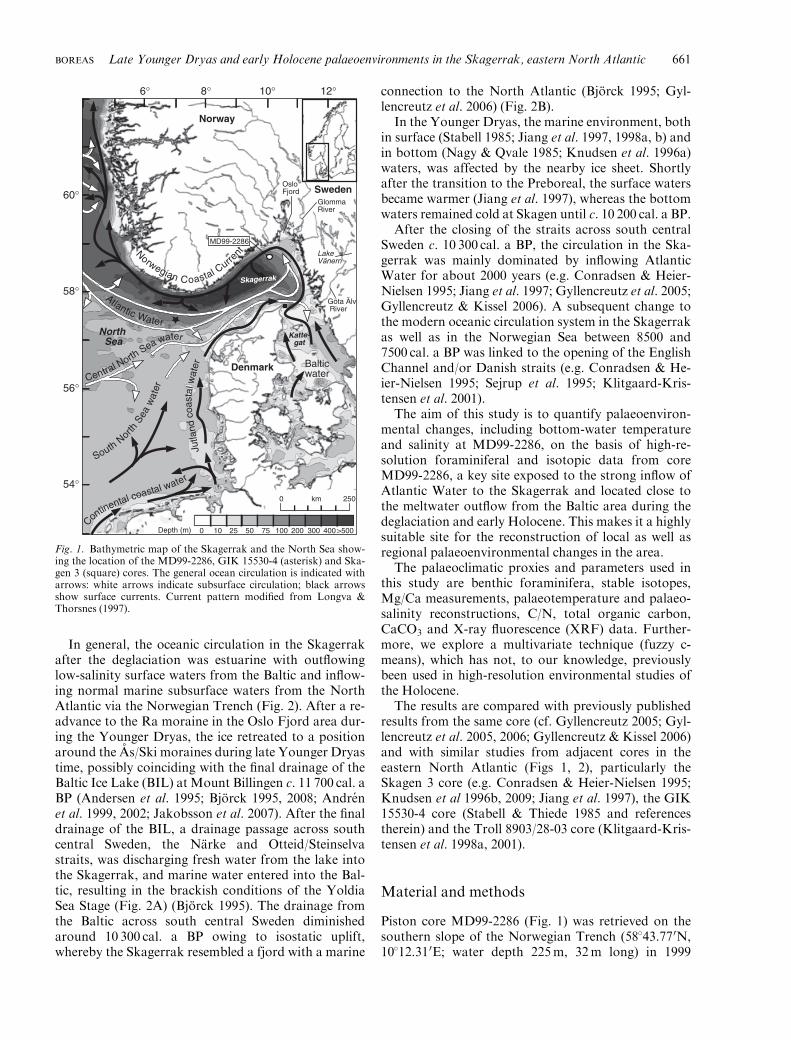
The present current system in the Skagerrak, easternNorth Atlantic, is complex and affected by local me-teorological parameters. The water mass is stratifiedwith a rather shallow halocline, at a few metres to 25mdepth, which separates highly variable surface currentsfrom a more stable subsurface circulation (e.g. NorthSea Task Force 1993a,b; Danielssen et al. 1997). TheAtlantic water enters the Skagerrak as a subsurfacecurrent along the southern flank of the NorwegianTrench above the 150-m bottom contour (Rise et al.1996; Rodhe 1996 and references therein) (Fig. 1). Itturns westwards at the Swedish west coast and exits theSkagerrak along the Norwegian coast, forming an an-ticlockwise circulation pattern. Another branch ofAtlantic water, called Central North Sea Water, entersthe Skagerrak along the 70-m bottom contour (Riseet al. 1996).
Jutland coastal water flows northwards along theDanish west coast. It is a mixture of water from theCentral North Sea, the English Channel and river run-off from mainly German rivers. It follows the north-western coast of Denmark into the Skagerrak, where itconstitutes the surface layer. The inflow of Jutlandcoastal water is highly variable and is sometimes
blocked by the Norwegian Coastal Current (NCC)during periods with north-northwesterly winds (Gus-tafsson & Stigebrandt 1996; Rodhe 1996; Danielssenet al. 1997). The NCC is a coastal surface currentflowing along the Swedish and Norwegian coasts. Itconsists mainly of low-salinity waters from the Baltic,which have been mixed with higher-salinity subsurfacewater in the Kattegat, and when it reaches theSkagerrak, the salinity is about 25 (North Sea TaskForce 1993b; Danielssen et al. 1997). The cycloniccirculation system slows current speeds sufficiently forsediments to settle out of suspension, and the sedi-mentation rate is therefore high in the Skagerrak(Rodhe & Holt 1996).
The Skagerrak has been a marine embayment sincethe onset of the Weichselian deglaciation, and the con-tinuous marine sedimentation, often with a high accu-mulation rate, makes it a suitable area for the study ofpalaeoenvironmental and climatic changes during thedeglaciation, as well as during the Holocene (e.g. Sta-bell & Thiede 1985 and references therein; Lykke-An-dersen 1987; Conradsen & Heier-Nielsen 1995;Knudsen et al. 1996a, b; Gyllencreutz et al. 2005; Gyl-lencreutz & Kissel 2006).
r 2011 The AuthorsBoreasr 2011 The Boreas Collegium
DOI 10.1111/j.1502-3885.2011.00205.x
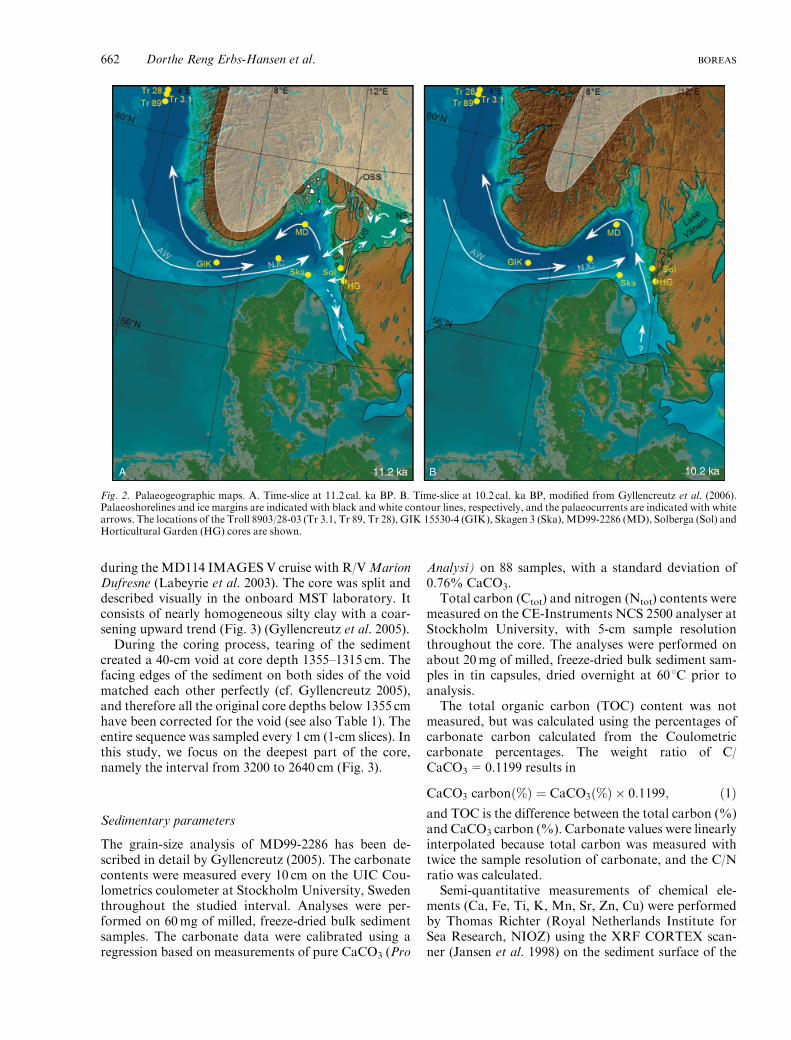
In general, the oceanic circulation in the Skagerrakafter the deglaciation was estuarine with outflowinglow-salinity surface waters from the Baltic and inflow-ing normal marine subsurface waters from the NorthAtlantic via the Norwegian Trench (Fig. 2). After a re-advance to the Ra moraine in the Oslo Fjord area dur-ing the Younger Dryas, the ice retreated to a positionaround the As/Ski moraines during late Younger Dryastime, possibly coinciding with the final drainage of theBaltic Ice Lake (BIL) at Mount Billingen c. 11 700 cal. aBP (Andersen et al. 1995; Bjorck 1995, 2008; Andrenet al. 1999, 2002; Jakobsson et al. 2007). After the finaldrainage of the BIL, a drainage passage across southcentral Sweden, the Narke and Otteid/Steinselvastraits, was discharging fresh water from the lake intothe Skagerrak, and marine water entered into the Bal-tic, resulting in the brackish conditions of the YoldiaSea Stage (Fig. 2A) (Bjorck 1995). The drainage fromthe Baltic across south central Sweden diminishedaround 10 300 cal. a BP owing to isostatic uplift,whereby the Skagerrak resembled a fjord with a marine
connection to the North Atlantic (Bjorck 1995; Gyl-lencreutz et al. 2006) (Fig. 2B).
In the Younger Dryas, the marine environment, bothin surface (Stabell 1985; Jiang et al. 1997, 1998a, b) andin bottom (Nagy & Qvale 1985; Knudsen et al. 1996a)waters, was affected by the nearby ice sheet. Shortlyafter the transition to the Preboreal, the surface watersbecame warmer (Jiang et al. 1997), whereas the bottomwaters remained cold at Skagen until c. 10 200 cal. a BP.
After the closing of the straits across south centralSweden c. 10 300 cal. a BP, the circulation in the Ska-gerrak was mainly dominated by inflowing AtlanticWater for about 2000 years (e.g. Conradsen & Heier-Nielsen 1995; Jiang et al. 1997; Gyllencreutz et al. 2005;Gyllencreutz & Kissel 2006). A subsequent change tothe modern oceanic circulation system in the Skagerrakas well as in the Norwegian Sea between 8500 and7500 cal. a BP was linked to the opening of the EnglishChannel and/or Danish straits (e.g. Conradsen & He-ier-Nielsen 1995; Sejrup et al. 1995; Klitgaard-Kris-tensen et al. 2001).
The aim of this study is to quantify palaeoenviron-mental changes, including bottom-water temperatureand salinity at MD99-2286, on the basis of high-re-solution foraminiferal and isotopic data from coreMD99-2286, a key site exposed to the strong inflow ofAtlantic Water to the Skagerrak and located close tothe meltwater outflow from the Baltic area during thedeglaciation and early Holocene. This makes it a highlysuitable site for the reconstruction of local as well asregional palaeoenvironmental changes in the area.
The palaeoclimatic proxies and parameters used inthis study are benthic foraminifera, stable isotopes,Mg/Ca measurements, palaeotemperature and palaeo-salinity reconstructions, C/N, total organic carbon,CaCO3 and X-ray fluorescence (XRF) data. Further-more, we explore a multivariate technique (fuzzy c-means), which has not, to our knowledge, previouslybeen used in high-resolution environmental studies ofthe Holocene.
The results are compared with previously publishedresults from the same core (cf. Gyllencreutz 2005; Gyl-lencreutz et al. 2005, 2006; Gyllencreutz & Kissel 2006)and with similar studies from adjacent cores in theeastern North Atlantic (Figs 1, 2), particularly theSkagen 3 core (e.g. Conradsen & Heier-Nielsen 1995;Knudsen et al 1996b, 2009; Jiang et al. 1997), the GIK15530-4 core (Stabell & Thiede 1985 and referencestherein) and the Troll 8903/28-03 core (Klitgaard-Kris-tensen et al. 1998a, 2001).
Material and methods
Piston core MD99-2286 (Fig. 1) was retrieved on thesouthern slope of the Norwegian Trench (58143.770N,10112.310E; water depth 225m, 32m long) in 1999
Jutla
ndco
asta
l wat
er
Continental coastal water
BalticwaterCentral North
Sea water
Norwegian Coastal Curre
nt
Atlantic Water
SouthNor
thSe
aw
ater
NorthSea
10°6° 8° 12°
54°
56°
58°
60°
Norway
Denmark
Sweden
Fig. 1. Bathymetric map of the Skagerrak and the North Sea show-ing the location of the MD99-2286, GIK 15530-4 (asterisk) and Ska-gen 3 (square) cores. The general ocean circulation is indicated witharrows: white arrows indicate subsurface circulation; black arrowsshow surface currents. Current pattern modified from Longva &Thorsnes (1997).
BOREAS Late Younger Dryas and early Holocene palaeoenvironments in the Skagerrak, eastern North Atlantic 661
during theMD114 IMAGES V cruise with R/VMarionDufresne (Labeyrie et al. 2003). The core was split anddescribed visually in the onboard MST laboratory. Itconsists of nearly homogeneous silty clay with a coar-sening upward trend (Fig. 3) (Gyllencreutz et al. 2005).
During the coring process, tearing of the sedimentcreated a 40-cm void at core depth 1355–1315 cm. Thefacing edges of the sediment on both sides of the voidmatched each other perfectly (cf. Gyllencreutz 2005),and therefore all the original core depths below 1355 cmhave been corrected for the void (see also Table 1). Theentire sequence was sampled every 1 cm (1-cm slices). Inthis study, we focus on the deepest part of the core,namely the interval from 3200 to 2640 cm (Fig. 3).
Sedimentary parameters
The grain-size analysis of MD99-2286 has been de-scribed in detail by Gyllencreutz (2005). The carbonatecontents were measured every 10 cm on the UIC Cou-lometrics coulometer at Stockholm University, Swedenthroughout the studied interval. Analyses were per-formed on 60mg of milled, freeze-dried bulk sedimentsamples. The carbonate data were calibrated using aregression based on measurements of pure CaCO3 (Pro
Analysi) on 88 samples, with a standard deviation of0.76% CaCO3.
Total carbon (Ctot) and nitrogen (Ntot) contents weremeasured on the CE-Instruments NCS 2500 analyser atStockholm University, with 5-cm sample resolutionthroughout the core. The analyses were performed onabout 20mg of milled, freeze-dried bulk sediment sam-ples in tin capsules, dried overnight at 601C prior toanalysis.
The total organic carbon (TOC) content was notmeasured, but was calculated using the percentages ofcarbonate carbon calculated from the Coulometriccarbonate percentages. The weight ratio of C/CaCO3=0.1199 results in
CaCO3 carbonð%Þ ¼ CaCO3ð%Þ � 0:1199; ð1Þand TOC is the difference between the total carbon (%)and CaCO3 carbon (%). Carbonate values were linearlyinterpolated because total carbon was measured withtwice the sample resolution of carbonate, and the C/Nratio was calculated.
Semi-quantitative measurements of chemical ele-ments (Ca, Fe, Ti, K, Mn, Sr, Zn, Cu) were performedby Thomas Richter (Royal Netherlands Institute forSea Research, NIOZ) using the XRF CORTEX scan-ner (Jansen et al. 1998) on the sediment surface of the
A B11.2 ka 10.2 ka
Fig. 2. Palaeogeographic maps. A. Time-slice at 11.2 cal. ka BP. B. Time-slice at 10.2 cal. ka BP, modified from Gyllencreutz et al. (2006).Palaeoshorelines and ice margins are indicated with black and white contour lines, respectively, and the palaeocurrents are indicated with whitearrows. The locations of the Troll 8903/28-03 (Tr 3.1, Tr 89, Tr 28), GIK 15530-4 (GIK), Skagen 3 (Ska),MD99-2286 (MD), Solberga (Sol) andHorticultural Garden (HG) cores are shown.
662 Dorthe Reng Erbs-Hansen et al. BOREAS

split core sections, with 2-cm resolution throughoutcore MD99-2286. The reliability of core-scanner XRFdata rests on an assumption of sample homogeneity andfine uniform grain-size distribution (Jansen et al. 1998),which makes the homogenous and consistent silty clayofMD99-2286 (Gyllencreutz 2005) suitable material forreliable core-scanner results. The intensities of theelements Fe, Ti and Ca are included in this study andreported as ratios between counts per second.
Age model
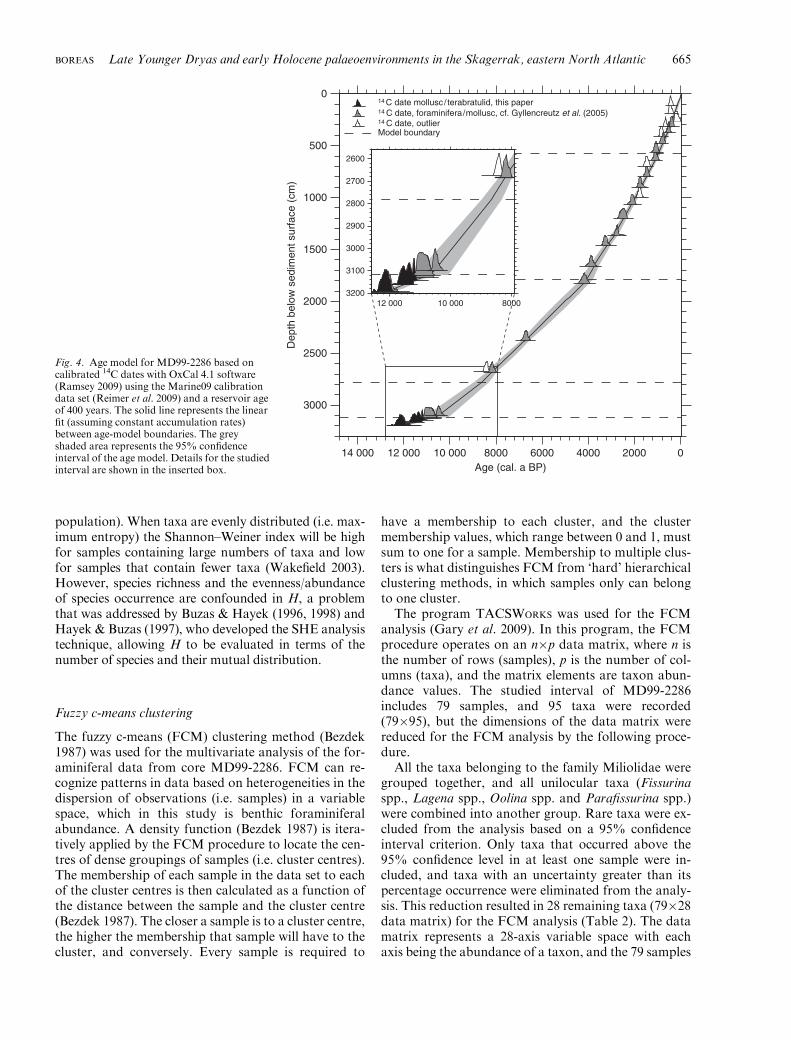
The age model for MD99-2286 is based on 27 AMS 14Cage determinations performed at the Institute of Parti-cle Physics, ETH, Zurich, Switzerland (Gyllencreutzet al. 2005), and on three age determinations from theAMS 14C Laboratory, Aarhus University, Denmark(Table 1; Fig. 4). Each dated sample consisted of eithermollusc shells of known species or mixed benthic for-aminifera. The 14C dates have been calibrated using theMarine09 calibration curve (Reimer et al. 2009) withthe OXCAL 4.1 software (Ramsey 2009). All ages arereported in calibrated years before present (cal. a BP),with present being AD 1950.
The age–depth model was constructed using deposi-tional models in OXCAL 4.1. To detect possible outliers,a general outlier model was built into the depositional
model for the core (Ramsey 2008, 2009). Additionalboundaries at 3118 cm, 2780 cm, 1789 cm and 578 cm(Fig. 4) were added to the depositional model to takepossible changes in accumulation rates into account asinferred from variations in grain size (cf. Gyllencreutz2005). The top of the core was estimated at AD 1999,the year of coring (cf. Gyllencreutz et al. 2005). Thedepositional model was constructed using a k-value of20, resulting in Amodel=69.6 (cf. Ramsey 2008, 2009).The constructed age model yields age uncertainties withan average of �95 years. The outlier analysis suggestseight samples as outliers, all except one being too old,probably as a result of reworking (Table 1).
In previously published results from MD99-2286(Gyllencreutz 2005; Gyllencreutz et al. 2005, 2006;Gyllencreutz & Kissel 2006; Hebbeln et al. 2006), theMarine98 calibration curve was used. The two modelsare similar within the uncertainties, even though some ofthe outliers in the Marine98 model are regarded as validsamples in the Marine09 model and vice versa. Forcomparison, the majority of the previously publisheddata have been re-plotted on the revised age scale.
Palaeowater depth reconstruction
The palaeowater depth at site MD99-2286 (Fig. 5) wasreconstructed using an improved glacial loading and
0
1000
2000
3000
Dep
th (
cm)
0 10 20
Sortable silt10-63 μm
Lithologiclog
3000
20 30 40
Fine silt2-10 μm
50 60 70
Clay<2 μm
2900
3100
2800
2700
1
2
3
4
5
3200
Shell broken, dated
Benthic foraminifera, dated
Silty clay
Ice Rafted Debris intervals
Shell whole, dated
(%) (%) (%)
Fig. 3. Lithologic log and grain-size distributions in core MD99-2286 (cf. Gyllencreutz 2005). The study interval (3200–2640 cm) is expandedfor percentages of fine silt and sand.
BOREAS Late Younger Dryas and early Holocene palaeoenvironments in the Skagerrak, eastern North Atlantic 663

crustal rebound theory and improved numerical meth-ods that include the water loading of ice-marginal lakessuch as the Baltic Ice Lake as part of the total ice-oceanload (cf. Lambeck et al. 2010). All 14C dates for thechronology of the maximum ice margins and the sub-sequent ice retreat, as well as for sea-level observations,were converted to a consistent calibrated time scale,using Reimer et al. (2004). The model is here extendedinto the Holocene, and the palaeowater depth has beencalculated for theMD99-2286 site (Fig. 5), as well as forsome neighboring sites (Skagen 3 and GIK 15530-4).The palaeowater depth is important to consider whencomparing core sites around the Skagerrak, because theisostatic rebound differs within the area, and differ-ences in water depth and therefore circulation patternaffect the foraminiferal assemblages present at the var-ious core sites.
Foraminifera
The material was processed for foraminiferal analysisaccording to standard methods as described by Feyling-Hanssen et al. (1971) and Knudsen (1998). The driedsamples were wet-sieved through 1000-, 100- and 63-mmsieves. In the 100–1000 mm size fraction, a minimum of
300 benthic foraminifera were identified and counted.Foraminifera were generally analysed at every 10 cm,but in the deepest part of the core, where the sedi-mentation rate was low (Fig. 4), one sample at every5 cm was analysed.
A total of 72 benthic foraminiferal species wereidentified, and in addition 23 benthic taxa were identi-fied to genus level only. The two species Cassidulinalaevigata and C. neoteretis are morphologically similar.In core MD99-2286, the distinction between the twospecies is further complicated by an apparent inter-mediate form, which is here called C. cf. laevigata. Onlya few planktonic foraminifera were observed in thecore, and they have not been treated in this study.
The benthic foraminiferal flux (number ofspecimens cm�2 a�1) was calculated using a constant drybulk density of 0.8 g cm�2, because such data were notavailable for the core. The diversity was evaluated usingthe SHE analysis technique (Hayek & Buzas 1997; Buzas& Hayek 1998), which decomposes the informationfunction, also called the Shannon–Weiner index (H)(Shannon 1948), into a richness component (S) and anevenness component (E) (Buzas & Gibson 1969).
The Shannon–Weiner index is a measure of theaverage amount of information associated with asource (e.g. a sample of a benthic foraminiferal
Table 1. AMS 14C age determinations for core MD99-2286. The 14C dates are calibrated with OxCal 4.1 software (Ramsey 2009) using theMarine09 calibration curve (Reimer et al. 2009).
Laboratorynumber
Originaldepth (cm)
Void-correcteddepth (cm)
14C age�1s (a BP)
Modelled age(cal. a BP)
Outlierprobability (%)
Dated taxa
ETH-24953 115.5 115.5 785�50 100 Scaphander sp.ETH-25546 185.5 185.5 800�55 100 Yoldiella lucidaETH-24001 268.0 268.0 535�50 100 Ennucula tenuisETH-24397 319.5 319.5 730�45 446 (414–478) 8 Thyasira equalisETH-26937 319.5 319.5 1095�55 100 Foraminifera (mixed fauna)ETH-25547 370.5 370.5 900�60 543 (508–578) 2 Nucula tumidulaETH-26388 410.5 410.5 1270�50 100 Foraminifera (mixed fauna)ETH-26938 481.5 481.5 1225�55 775 (733–817) 2 Foraminifera (mixed fauna)ETH-26939 561.0 561.0 1510�50 943 (894–991) 19 Foraminifera (mixed fauna)ETH-26940 640.5 640.5 1530�50 1111 (1067–1155) 2 Foraminifera (mixed fauna)ETH-25955 700.5 700.5 1915�55 100 Foraminifera (mixed fauna)ETH-25956 801.0 801.0 1915�55 1483 (1440–1527) 2 Foraminifera (mixed fauna)ETH-26389 901.0 901.0 2155�50 1724 (1680–1769) 2 Foraminifera (mixed fauna)ETH-26390 1001.0 1001.0 2175�50 100 Foraminifera (mixed fauna)ETH-26941 1070.5 1070.5 2440�55 2118 (2065–2171) 3 Foraminifera (mixed fauna)ETH-26418 1200.5 1200.5 2765�60 2454 (2394–2513) 3 Foraminifera (mixed fauna)ETH-27241 1400.5 1360.5 2975�55 2855 (2785–2925) 12 Foraminifera (mixed fauna)ETH-26419 1500.5 1460.5 3390�60 3187 (3112–3263) 4 Foraminifera (mixed fauna)ETH-27242 1700.5 1660.5 3895�60 3759 (3654–3864) 7 Foraminifera (mixed fauna)ETH-26137 1866.0 1826.0 4120�60 4223 (4093–4354) 3 Polinices montaguiETH-24003 2417.0 2377.0 6255�65 6727 (6643–6810) 4 Portlandia intermediaETH-25548 2716.5 2676.5 7955�70 100 Pseudamusium septemradiatumETH-25549 2721.5 2681.5 7710�60 8188 (8082–8295) 4 Pseudamusium septemradiatumETH-25550 3140.5 3100.5 9620�70 10 508 (10 240–10 777) 7 Pseudamusium septemradiatumETH-24004 3159.0 3119.0 9955�85 10 721 (10 635–10 808) 6 Bathyarca glacialisETH-25551 3169.5 3129.5 9910�70 10 905 (10 809–11 002) 3 Cryptonautica affinisAAR-13305 3183.0 3143.0 10 205�55 11 189 (11 145–11 232) 3 Terabratulina sp.AAR-13306 3203.0 3163.0 10 395�60 11 504 (11 395–11 614) 4 Yoldiella lenticulaAAR-13307 3233.0 3193.0 10 730�60 12 079 (11 985–12 172) 4 Yoldiella lenticulaETH-24005 3238.0 3198.0 10 715�80 12 148 (12 045–12 251) 4 Portlandia intermedia
664 Dorthe Reng Erbs-Hansen et al. BOREAS
population). When taxa are evenly distributed (i.e. max-imum entropy) the Shannon–Weiner index will be highfor samples containing large numbers of taxa and lowfor samples that contain fewer taxa (Wakefield 2003).However, species richness and the evenness/abundanceof species occurrence are confounded in H, a problemthat was addressed by Buzas & Hayek (1996, 1998) andHayek & Buzas (1997), who developed the SHE analysistechnique, allowing H to be evaluated in terms of thenumber of species and their mutual distribution.
Fuzzy c-means clustering
The fuzzy c-means (FCM) clustering method (Bezdek1987) was used for the multivariate analysis of the for-aminiferal data from core MD99-2286. FCM can re-cognize patterns in data based on heterogeneities in thedispersion of observations (i.e. samples) in a variablespace, which in this study is benthic foraminiferalabundance. A density function (Bezdek 1987) is itera-tively applied by the FCM procedure to locate the cen-tres of dense groupings of samples (i.e. cluster centres).The membership of each sample in the data set to eachof the cluster centres is then calculated as a function ofthe distance between the sample and the cluster centre(Bezdek 1987). The closer a sample is to a cluster centre,the higher the membership that sample will have to thecluster, and conversely. Every sample is required to
have a membership to each cluster, and the clustermembership values, which range between 0 and 1, mustsum to one for a sample. Membership to multiple clus-ters is what distinguishes FCM from ‘hard’ hierarchicalclustering methods, in which samples only can belongto one cluster.
The program TACSWORKS was used for the FCManalysis (Gary et al. 2009). In this program, the FCMprocedure operates on an n�p data matrix, where n isthe number of rows (samples), p is the number of col-umns (taxa), and the matrix elements are taxon abun-dance values. The studied interval of MD99-2286includes 79 samples, and 95 taxa were recorded(79�95), but the dimensions of the data matrix werereduced for the FCM analysis by the following proce-dure.
All the taxa belonging to the family Miliolidae weregrouped together, and all unilocular taxa (Fissurinaspp., Lagena spp., Oolina spp. and Parafissurina spp.)were combined into another group. Rare taxa were ex-cluded from the analysis based on a 95% confidenceinterval criterion. Only taxa that occurred above the95% confidence level in at least one sample were in-cluded, and taxa with an uncertainty greater than itspercentage occurrence were eliminated from the analy-sis. This reduction resulted in 28 remaining taxa (79�28data matrix) for the FCM analysis (Table 2). The datamatrix represents a 28-axis variable space with eachaxis being the abundance of a taxon, and the 79 samples
0200040006000800010 00012 00014 000
0
500
1000
1500
2000
2500
3000
Age (cal. a BP)
Dep
th b
elow
sed
imen
t sur
face
(cm
)
Model boundary
C date, foraminifera/mollusc, cf. Gyllencreutz et al. (2005)C date, outlier
C date mollusc / terabratulid, this paper
10 00012 000
2600
2700
2800
2900
3000
3100
32008000
Fig. 4. Age model for MD99-2286 based oncalibrated 14C dates with OxCal 4.1 software(Ramsey 2009) using the Marine09 calibrationdata set (Reimer et al. 2009) and a reservoir ageof 400 years. The solid line represents the linearfit (assuming constant accumulation rates)between age-model boundaries. The greyshaded area represents the 95% confidenceinterval of the age model. Details for the studiedinterval are shown in the inserted box.
BOREAS Late Younger Dryas and early Holocene palaeoenvironments in the Skagerrak, eastern North Atlantic 665

are located in the variable space based on the abun-dances of their constituent taxa.
When running the FCM analysis, the fuzzy exponent(mA(1,1)) and the number of clusters (c) have to bedetermined subjectively. Bezdek (1987) recommendsthat m be set to a value of 2.0, but the selection of m isdata-dependent, and Gary et al. (2009) found that an mof 1.5 is generally more appropriate for biostrati-graphical data, as also supported by this study aftertrying solutions for a range ofm values (1.3, 1.4, 1.5, 1.6and 1.7) and evaluating the results.
A range of possible cluster solutions, from 2 to 7,were then evaluated to determine which number ofclusters produced distinct faunal compositions withadequate stratigraphic coherence. We found that FCMsolutions with 3 to 4 clusters resulted in well-separatedassemblage compositions (i.e. cluster centre vectors),whereas the clusters added for solutions above 4 ex-hibited generally minor differences to already existingclusters. Therefore, we selected c=4.
Transfer functions
Palaeotemperature and palaeosalinity estimates weremade using the transfer function for benthic for-
aminifera developed by Sejrup et al. (2004). TheMD99-2286 data set was modified to correspond to that of themodern database of Sejrup et al. (2004). Two taxa weredeleted from the MD99-2286 data set, C. cf. laevigatabecause of taxonomical uncertainty, and N. iridea be-cause it is a tiny thin-shelled form, and its distributionin the samples may be a result of preservation ratherthan actual abundance, both in the modern and in thefossil data set. Hereafter, our dataset is recalculated to100%, and no transformation of the data is performed.Sites with a water depth of less than 75m were deletedfrom the modern database of Sejrup et al. (2004) in or-der to avoid modern samples affected by the highlyvariable surface layer in the Skagerrak. The minimumwater depth at the location of MD99-2286 was about330m throughout the late Younger Dryas and earlyHolocene (Fig. 5).
The palaeotemperature and palaeosalinity estimateswere calculated from this reduced database (209 modernsamples) with the program C2 (Juggins 2007). A three-component weighted averaging partial least squares(WA-PLS) transfer function, using a bootstrappingcross-validation method, was applied for the tempera-ture calculation, and a two-component WA-PLS, usingbootstrapping cross-validation, for the palaeosalinity.
Age (cal. ka BP)
800010 00012 000
–360
–340
–320
–300
–280
–260
Pal
aeow
ater
dep
th (
m)
0510152025–600
–500
–400
–300
Pal
aeow
ater
dep
th (
m)
HolocenePleistocene
YD (GS-1) Preboreal Boreal Atlantic
Age (cal. a BP)
A
B
Fig. 5. A. Reconstructed palaeowater depthfor the Late Weichselian and Holocene at siteMD99-2286 in the Skagerrak. B. Details for thestudied interval for late Younger Dryas (YD;GS-1) and early Holocene. See also text. Thechronozones are based on Mangerud et al.(1974); the ages have been re-calibrated withOxCal 4.1 software (Ramsey 2009) using theIntCal09 calibration curve (Reimer et al. 2009).The Younger Dryas–Preboreal boundary is,however, based on the ice-core chronologyGICC05 of Rasmussen et al. (2006). GS-1=Greenland Stadial 1 of the INTIMATEevent stratigraphy (cf. Bjorck et al. 1998).
666 Dorthe Reng Erbs-Hansen et al. BOREAS

Stable isotopes
Stable isotope measurements were performed at theBjerknes Centre for Climate Research, University ofBergen, Norway. The samples were run on a FinniganMAT 253 mass spectrometer coupled to an automatedKiel III device and calibrated via NBS18 to the ViennaPeeDee Belemnite (VPDB) standard reference. All va-lues are given in d-notation versus VPDB. The long-term precision (1s) for samples between 10 and 100micrograms is �0.03% and �0.08% for carbon andoxygen isotopes, respectively, based on the long-termreproducibility of the internal standard CM03 (CarreraMarble) (U. Ninnemann, pers. comm. 2008).
Isotopic measurements were performed at every 2 cmon two taxa, C. neoteretis from 3200 to 3048 cm andUvigerina mediterranea from 3106 to 2642 cm, with anoverlap of 30 samples. According to Jansen et al.(1988), Andrews & Dunhill (2004) and Lubinski et al.(2001 and references therein), C. neoteretis shows nosignificant vital effect, and therefore no correction hasbeen made for that species. Uvigerina mediterranea,however, has been shown to calcify in disequilibriumwith the ambient water (Fontanier et al. 2006; Schmiedlet al. 2004). Therefore, the d18O values for U. medi-terranea have been normalized to C. neoteretis with acorrection of the mean offset value (0.22%) between thetwo species, which is equal to the correction factor
suggested by Fontanier et al. (2006) within 1s. Thed18O record has been further corrected for the ice-volume effect using the Fairbanks (1989) sea-level curveas dated by Bard et al. (1990) with a correction of0.11% d18O per 10-m sea-level change.
Palaeotemperature estimates were performed fromthe corrected d18O record using the equation of Shack-leton (1974). The d18Owater was calculated using thesalinity: d18O mixing line representing Atlantic Waterin the Skagerrak with salinities Z35 (Austin et al.2006). We used the �0.27% conversion of Hut (1987)to convert d18Owater,VSMOW to d18Owater,VPDB.
The present salinity of the incoming Atlantic Waterin the deep Skagerrak is around 35 (e.g. Danielssenet al. 1997; McClimans et al. 2000), and we assume,based on previous studies (e.g. Gyllencreutz 2005; Gyl-lencreutz & Kissel 2006; Gyllencreutz et al. 2006), thatthe water mass originated mainly in the Atlantic Oceanfor the majority of the time interval considered in thisstudy. Therefore, the salinity: d18O mixing line forAtlantic Water and a salinity of 35 can be used.
Mg/Ca measurements
As an independent proxy for palaeotemperature, Mg/Ca measurements were carried out on the benthic spe-ciesMelonis barleeanus in the interval 3104–2760 cm. Inthe deepest part of the core (3200–3104 cm), this specieswas not sufficiently abundant for the measurements.Approximately 30 specimens of M. barleeanus werepicked at 2-cm intervals for the analysis. In the case oftoo few available specimens, neighbouring sampleswere combined if possible.
All cleaning preparation and Mg/Ca analyses wereperformed at Bjerknes Centre for Climate Researchand Bergen Geoanalytical Facility, University of Ber-gen, Norway. The samples were cleaned using the oxi-dative cleaning method (Barker et al. 2003) and weremeasured with a Thermo TJA Iris ICP-OES radial viewusing the intensity calibration method of de Villierset al. (2002). We ran in parallel a standard solution ofMg/Ca=1.02mmolmol�1 with an analytical error of0.026mmolmol�1 (1s). To reconstruct bottom-watertemperatures in the Skagerrak from the measured Mg/Ca ratios, we used the species-specific exponentialequation for M. barleeanus following the convention(Kristjansdottir et al. 2007 and references therein):
Mg=Ca ¼ 0:658� 0:07� expð0:137� TÞ: ð2Þ
The equation for reconstructing bottom-water tem-peratures from M. barleeanus was derived from mea-surements on samples, which were cleaned using areductive treatment (Boyle & Keigwin 1985) leading to abias in theMg/Ca data of 8–15%weaker compared withthe oxidative method (Barker et al. 2003; Rosenthal et al.2004). In order to validate the choice of the calibration,
Table 2. List of foraminiferal taxa used in the fuzzy-c means (FCM)analysis. The original references and description of the taxa are re-ported in Ellis & Messina (1949 and Supplements including 2009).
Alabaminoides exigus (Brady, 1884)Bolivina albatrossi Cushman, 1922Bolivina skagerrakensis Qvale & Nigam, 1985Bulimina marginata d’Orbigny, 1826Cassidulina laevigata d’Orbigny, 1826Cassidulina cf. laevigata d’Orbigny, 1826Cassidulina neoteretis Seidenkrantz, 1995Cassidulina reniformeNørvang, 1945Cibicides lobatulus (Walker & Jacob, 1798)Cibicides pseudoungerianus (Cushman, 1922)Elphidium excavatum (Terquem, 1875)Elphidium excavatum (Terquem, 1875) f. clavata Cushman, 1930Globobulimina auriculata arctica Hoglund, 1964Globobulimina turgida (Bailey, 1947)Hyalina balthica (Schroeter, 1964)Melonis barleeanus (Williamson, 1858)MiliolidaeNonionella irideaHeron-Allen & Earland, 1932Nonionella turgida (Williamson, 1858)Nonionellina labradorica (Dawson, 1860)Pullenia bulloides (d’Orbigny, 1826)Pullenia osloensis Feyling-Hanssen, 1954Stainforthia fusiformis (Williamson, 1858)Stainforthia loeblichi (Feyling-Hanssen, 1954)Stainforthia skagerakensis (Hoglund, 1947)Trifarina angulosa (Williamson, 1858)Unilocular speciesUvigerina mediterranea Hofker, 1932
BOREAS Late Younger Dryas and early Holocene palaeoenvironments in the Skagerrak, eastern North Atlantic 667
core-top Mg/Ca values with a cleaning correction factorof�15% and the present-day bottom-water temperatureof 61C (North Sea Task Force 1993b) were used. Ourcalibrated data set fits reasonably well with theKristjansdottir et al. (2007) calibration. The temperaturereconstruction made here is therefore based on that ca-libration after a correction of 15%.
The potential for silicate and Mn-oxide coating con-tamination has been checked. This turned out to be in-significant, as only Mn/Ca ratios show values higherthan 0.1mmolmol�1 but with a weak correlation(r2=0.19) with Mg/Ca ratios, probably owing to thepresence of some manganese micro-nodules in thesamples. Because M. barleeanus is a deep infaunalbenthic species, the Mg incorporation should not beaffected by the water carbonate saturation state.
Results
Assemblages and palaeoenvironments
The FCM analysis recognized four clusters in the for-aminiferal assemblages, and on the basis of this, the lateYounger Dryas to early Holocene record has been di-vided into four assemblage zones (Fig. 6). The dis-tribution of species in the cluster centres is shown inFig. 7.
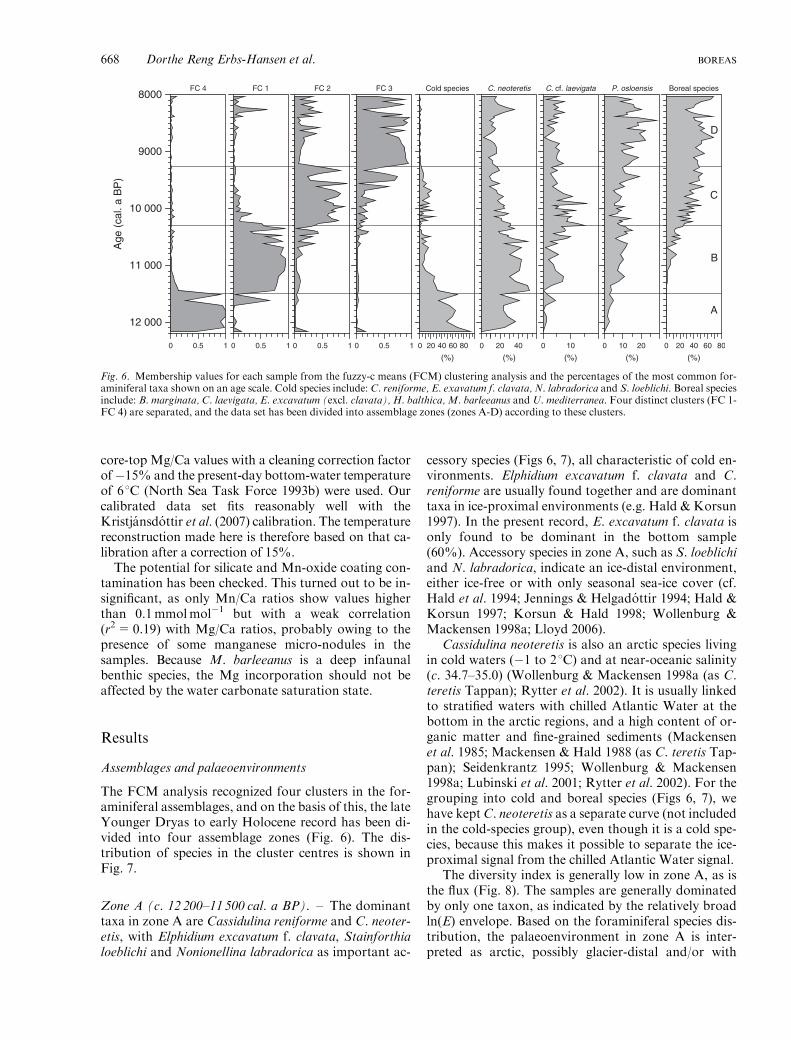
Zone A (c. 12 200–11 500 cal. a BP). – The dominanttaxa in zone A are Cassidulina reniforme and C. neoter-etis, with Elphidium excavatum f. clavata, Stainforthialoeblichi and Nonionellina labradorica as important ac-
cessory species (Figs 6, 7), all characteristic of cold en-vironments. Elphidium excavatum f. clavata and C.reniforme are usually found together and are dominanttaxa in ice-proximal environments (e.g. Hald & Korsun1997). In the present record, E. excavatum f. clavata isonly found to be dominant in the bottom sample(60%). Accessory species in zone A, such as S. loeblichiand N. labradorica, indicate an ice-distal environment,either ice-free or with only seasonal sea-ice cover (cf.Hald et al. 1994; Jennings & Helgadottir 1994; Hald &Korsun 1997; Korsun & Hald 1998; Wollenburg &Mackensen 1998a; Lloyd 2006).
Cassidulina neoteretis is also an arctic species livingin cold waters (�1 to 21C) and at near-oceanic salinity(c. 34.7–35.0) (Wollenburg & Mackensen 1998a (as C.teretis Tappan); Rytter et al. 2002). It is usually linkedto stratified waters with chilled Atlantic Water at thebottom in the arctic regions, and a high content of or-ganic matter and fine-grained sediments (Mackensenet al. 1985; Mackensen & Hald 1988 (as C. teretis Tap-pan); Seidenkrantz 1995; Wollenburg & Mackensen1998a; Lubinski et al. 2001; Rytter et al. 2002). For thegrouping into cold and boreal species (Figs 6, 7), wehave keptC. neoteretis as a separate curve (not includedin the cold-species group), even though it is a cold spe-cies, because this makes it possible to separate the ice-proximal signal from the chilled Atlantic Water signal.
The diversity index is generally low in zone A, as isthe flux (Fig. 8). The samples are generally dominatedby only one taxon, as indicated by the relatively broadln(E) envelope. Based on the foraminiferal species dis-tribution, the palaeoenvironment in zone A is inter-preted as arctic, possibly glacier-distal and/or with
(%) (%) (%) (%) (%)
8000
9000
10 000
11 000
12 000
Age
(ca
l. a
BP
)
A
B
C
D
Fig. 6. Membership values for each sample from the fuzzy-c means (FCM) clustering analysis and the percentages of the most common for-aminiferal taxa shown on an age scale. Cold species include: C. reniforme, E. exavatum f. clavata, N. labradorica and S. loeblichi. Boreal speciesinclude: B. marginata, C. laevigata, E. excavatum (excl. clavata), H. balthica, M. barleeanus and U. mediterranea. Four distinct clusters (FC 1-FC 4) are separated, and the data set has been divided into assemblage zones (zones A-D) according to these clusters.
668 Dorthe Reng Erbs-Hansen et al. BOREAS
seasonal ice cover. This interval corresponds approxi-mately in time to the late Younger Dryas.
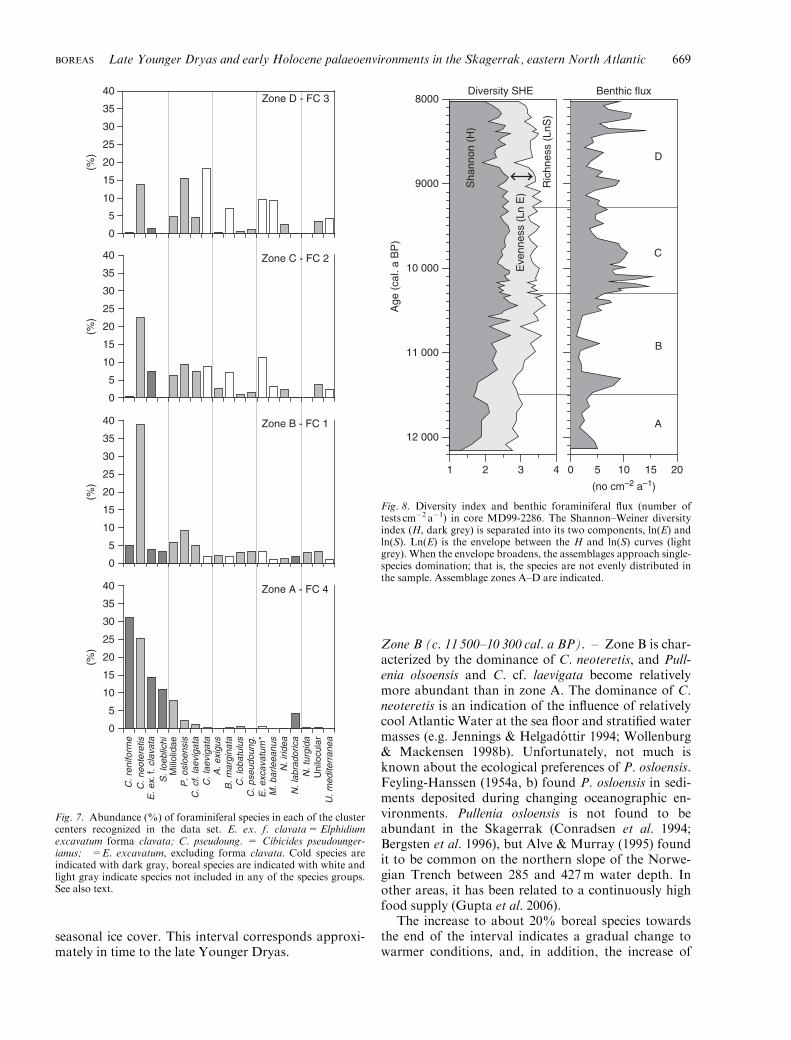
Zone B (c. 11 500–10 300 cal. a BP). – Zone B is char-acterized by the dominance of C. neoteretis, and Pull-enia olsoensis and C. cf. laevigata become relativelymore abundant than in zone A. The dominance of C.neoteretis is an indication of the influence of relativelycool Atlantic Water at the sea floor and stratified watermasses (e.g. Jennings & Helgadottir 1994; Wollenburg& Mackensen 1998b). Unfortunately, not much isknown about the ecological preferences of P. osloensis.Feyling-Hanssen (1954a, b) found P. osloensis in sedi-ments deposited during changing oceanographic en-vironments. Pullenia osloensis is not found to beabundant in the Skagerrak (Conradsen et al. 1994;Bergsten et al. 1996), but Alve & Murray (1995) foundit to be common on the northern slope of the Norwe-gian Trench between 285 and 427m water depth. Inother areas, it has been related to a continuously highfood supply (Gupta et al. 2006).
The increase to about 20% boreal species towardsthe end of the interval indicates a gradual change towarmer conditions, and, in addition, the increase of
0
5
10
15
20
25
30
35
40 Zone B - FC 1
0
5
10
15
20
25
30
35
40Zone D - FC 3
0
5
10
15
20
25
30
35
40 Zone C - FC 2
0
5
10
15
20
25
30
35
40 Zone A - FC 4
U. m
edite
rran
eaU
nilo
cula
rN
. tur
gida
N. l
abra
doric
aN
. irid
eaM
. bar
leea
nus
E. e
xcav
atum
*C
. pse
udou
ng.
C. l
obat
ulus
B. m
argi
nata
A. e
xigu
sC
. lae
viga
taC
. cf.
laev
igat
aP
. osl
oens
isM
iliol
idae
S. l
oebl
ichi
E. e
x. f.
cla
vata
C. n
eote
retis
C. r
enifo
rme
(%)
(%)
(%)
(%)
Fig. 7. Abundance (%) of foraminiferal species in each of the clustercenters recognized in the data set. E. ex. f. clavata=Elphidiumexcavatum forma clavata; C. pseudoung. = Cibicides pseudounger-ianus; �=E. excavatum, excluding forma clavata. Cold species areindicated with dark gray, boreal species are indicated with white andlight gray indicate species not included in any of the species groups.See also text.
8000
9000
10 000
11 000
12 000
Age
(ca
l. a
BP
)
1 2 3 4
Ric
hnes
s (L
nS)
Sha
nnon
(H
)
Eve
nnes
s (L
n E
)
0 5 10 15 20
Benthic fluxDiversity SHE
(no cm–2 a–1)
A
B
C
D
Fig. 8. Diversity index and benthic foraminiferal flux (number oftests cm�2 a�1) in core MD99-2286. The Shannon–Weiner diversityindex (H, dark grey) is separated into its two components, ln(E) andln(S). Ln(E) is the envelope between the H and ln(S) curves (lightgrey). When the envelope broadens, the assemblages approach single-species domination; that is, the species are not evenly distributed inthe sample. Assemblage zones A–D are indicated.
BOREAS Late Younger Dryas and early Holocene palaeoenvironments in the Skagerrak, eastern North Atlantic 669
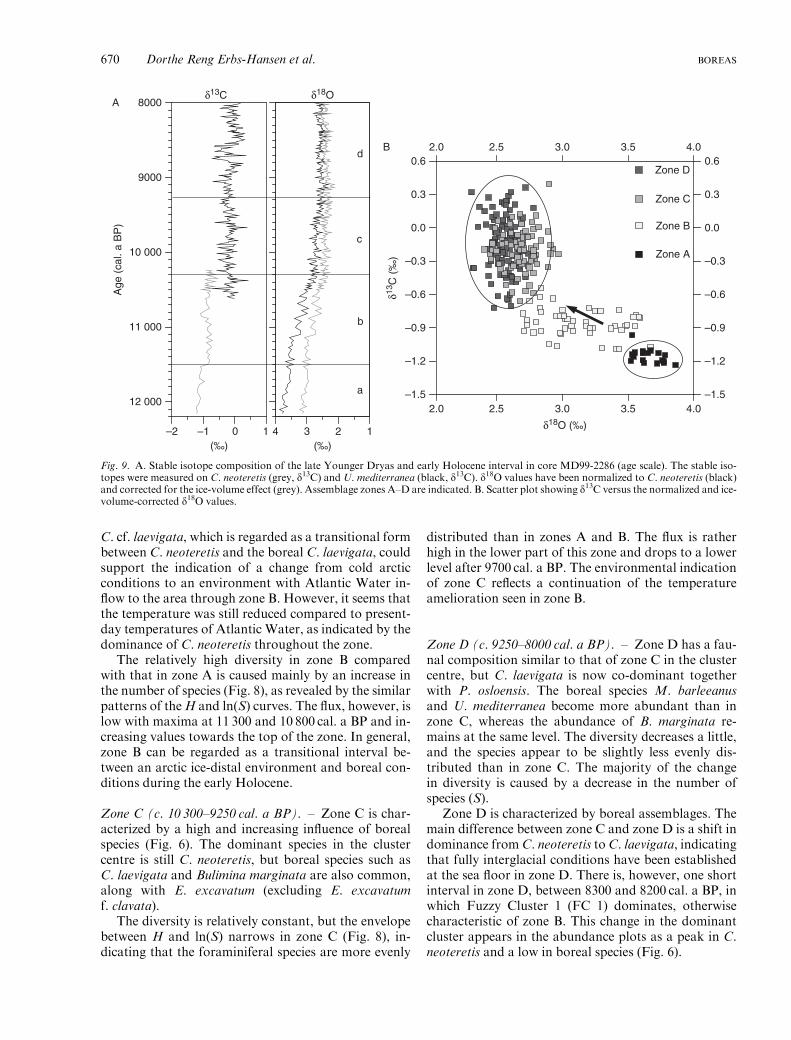
C. cf. laevigata, which is regarded as a transitional formbetween C. neoteretis and the boreal C. laevigata, couldsupport the indication of a change from cold arcticconditions to an environment with Atlantic Water in-flow to the area through zone B. However, it seems thatthe temperature was still reduced compared to present-day temperatures of Atlantic Water, as indicated by thedominance of C. neoteretis throughout the zone.
The relatively high diversity in zone B comparedwith that in zone A is caused mainly by an increase inthe number of species (Fig. 8), as revealed by the similarpatterns of theH and ln(S) curves. The flux, however, islow with maxima at 11 300 and 10 800 cal. a BP and in-creasing values towards the top of the zone. In general,zone B can be regarded as a transitional interval be-tween an arctic ice-distal environment and boreal con-ditions during the early Holocene.
Zone C (c. 10 300–9250 cal. a BP). – Zone C is char-acterized by a high and increasing influence of borealspecies (Fig. 6). The dominant species in the clustercentre is still C. neoteretis, but boreal species such asC. laevigata and Bulimina marginata are also common,along with E. excavatum (excluding E. excavatumf. clavata).
The diversity is relatively constant, but the envelopebetween H and ln(S) narrows in zone C (Fig. 8), in-dicating that the foraminiferal species are more evenly
distributed than in zones A and B. The flux is ratherhigh in the lower part of this zone and drops to a lowerlevel after 9700 cal. a BP. The environmental indicationof zone C reflects a continuation of the temperatureamelioration seen in zone B.
Zone D (c. 9250–8000 cal. a BP). – Zone D has a fau-nal composition similar to that of zone C in the clustercentre, but C. laevigata is now co-dominant togetherwith P. osloensis. The boreal species M. barleeanusand U. mediterranea become more abundant than inzone C, whereas the abundance of B. marginata re-mains at the same level. The diversity decreases a little,and the species appear to be slightly less evenly dis-tributed than in zone C. The majority of the changein diversity is caused by a decrease in the number ofspecies (S).
Zone D is characterized by boreal assemblages. Themain difference between zone C and zone D is a shift indominance fromC. neoteretis toC. laevigata, indicatingthat fully interglacial conditions have been establishedat the sea floor in zone D. There is, however, one shortinterval in zone D, between 8300 and 8200 cal. a BP, inwhich Fuzzy Cluster 1 (FC 1) dominates, otherwisecharacteristic of zone B. This change in the dominantcluster appears in the abundance plots as a peak in C.neoteretis and a low in boreal species (Fig. 6).
δ18O (‰)
δ13C
(‰
)
–2 –1 0 1 1234
8000A
9000
10 000
11 000
12 000
Age
(ca
l. a
BP
)
2.0 2.5 3.0 3.5 4.0
2.0 2.5 3.0 3.5 4.0
–1.5
–1.2
–0.9
–0.6
–0.3
0.0
0.3
–1.5
–1.2
–0.9
–0.6
–0.3
0.0
0.3
Zone D
Zone C
Zone B
Zone A
0.60.6B
a
b
c
d
δ13C δ18O
(‰) (‰)
Fig. 9. A. Stable isotope composition of the late Younger Dryas and early Holocene interval in core MD99-2286 (age scale). The stable iso-topes were measured on C. neoteretis (grey, d13C) and U. mediterranea (black, d13C). d18O values have been normalized to C. neoteretis (black)and corrected for the ice-volume effect (grey). Assemblage zones A–D are indicated. B. Scatter plot showing d13C versus the normalized and ice-volume-corrected d18O values.
670 Dorthe Reng Erbs-Hansen et al. BOREAS

Stable isotopes
The d13C values are relatively constant throughout thestudied interval of MD99-2286, with the exception of ashort interval of depleted, but fluctuating, values fromc. 8800 to 8500 cal. a BP terminated by an increase topre-8800 cal. a BP values. From c. 8500 cal. a BP, thed13C values have a weak but stable decreasing trend.The d18O values show an increasing trend throughzones A and B, a slight increase in zone C, and they re-main at an almost stable level in zone D.
A scatter plot of d13C against the sea-level-correctedd18O values (Fig. 9) reveals three distinct groups, onecorresponding to zone A, one to zone B, and one tozones C and D. This indicates that three different watermasses may have been represented in the area duringthe studied time interval, although part of the variationseen in the scatter plot may also be caused by the factthat we have been unable to correct for carbon isotopevital effects. Unfortunately, little is known about theincorporation of d13C in the tests of different for-aminiferal species (i.e. about vital effects).
Palaeotemperature and palaeosalinity estimates
The palaeotemperature was estimated based on threetechniques: stable oxygen isotopes, Mg/Ca measure-ments and transfer function calculations. Each techni-que has its uncertainties, but used together they give astrong indication of the palaeotemperature develop-ment. In addition, palaeosalinity estimates were derivedfrom the transfer function.
The d18O-based palaeotemperature estimate in-dicates low bottom-water temperatures in zone A, anincreasing temperature in zone B and a stabilization ofthe values in zones C and D. Minor fluctuations areobserved, the most pronounced being a decrease intemperature around 8200 cal. a BP (Fig. 10).
The Mg/Ca-based temperature estimates, coveringthe very top of zone B, the entire zone C and most ofzone D (Fig. 10), show relatively stable palaeo-temperatures of around 5–61C, corresponding to thed18O-based results. These values are close to the pre-sent-day temperature at the core site (Ljøen & Svansson1972; North Sea Task Force 1993a, b). There are
8000
9000
10 000
11 000
12 000
Age
(ca
l. a
BP
)
1 3 5 7 91 3 5 7 9 34.5 35.0 35.5(°C) (°C)
SBT, δ18O SBT, TF SBS, TF
A
B
C
D
1 3 5 7 9
SBT, Mg/Ca
(°C)
Fig. 10. Summer bottom temperature (SBT) estimates based on oxygen isotopes, Mg/Ca ratios and transfer functions. Standard errors for thestable isotopes and Mg/Ca ratios are reported in the text. Temperature estimates are shown with a 5-point weighted running average. Summerbottom salinity (SBS) estimates are based on a transfer function calculation. Assemblage zones A–D are indicated.
BOREAS Late Younger Dryas and early Holocene palaeoenvironments in the Skagerrak, eastern North Atlantic 671

relatively large fluctuations in the Mg/Ca-based tem-perature estimates, but the extreme values consistmainly of single-sample peaks. The overall trend isshown by a smoothed weighted average curve (Fig. 10).
The transfer function-based temperature shows rela-tively low temperatures in zone A, an increase in zone Band a near-stable temperature through zones C and D.There is, however, a slight temperature decrease to-wards the top of zone C and relatively large variationsin zone D (see also the smoothed weighted averagecurve, Fig. 10).
In general, the different temperature reconstructionsagree well; however, it is notable that the transfer func-tion temperatures are higher in zones A and B than thed18O-based temperatures. This might be caused by thesalinity estimate used for calculation of the isotope-based temperatures, because the area seems to havebeen heavily affected by meltwater in zone B. However,as seen in the transfer function-based salinity re-construction (Fig. 10), the salinity only changes from34.85 in zone A to around 35.1 in zone D. This minorchange supports the choice of a salinity of 35 for thed18O-based temperature calculation, and suggests thatthe isotopic changes in the foraminifera are causedmainly by temperature variations. A salinity of around35 is also supported by previous studies from the area(e.g. Jiang et al. 1998b; Gyllencreutz & Kissel 2006),which suggest that the water came from a westerly
source, namely the North Atlantic, during this time in-terval. Thus, the transfer function appears to estimatetoo high temperatures for zones A and B.
A similar pattern of the transfer function-based tem-perature curve and the C. neoteretis curve (Figs 6, 10)through zones A and B may be an indication that toomuch emphasis has been placed on C. neoteretis forthe palaeotemperature calculation. In zones C andD, where C. neoteretis is less common, the threepalaeotemperature estimates coincide extremely well.Examination of the modern database used for thetransfer function calculation reveals a lack of a modernanalogue for environments with high percentagesof C. neoteretis, Therefore, a transfer function-based temperature reconstruction for samples rich inC. neoteretis has to be used with caution.
Sedimentary parameters
The C/N ratio, illustrated together with the carbonateand TOC content in Fig. 11, varies between about 5 and9 throughout the investigated time interval, except fortwo major and one minor maxima in zone C and threeminor minima in zone D. C/N ratios of 5–9 can be ap-plied as an indication of marine sedimentation, marinephytoplankton having C/N ratios of o10 (Lamb et al.2006). The C/N peaks in zone C are suggested to
8000
9000
10 000
11 000
12 000
Age
(ca
l. a
BP
)
0 1 2
TOC
0 10 20
C/N
5 52
A
B
C
D
(%)8 10 12 14
(% weight)
CaCO3
Fig. 11. Selected sedimentological parameters:carbonate, total organic carbon (TOC) and C/Nratio. Numbers in TOC and C/N plots indicatevalues for peaks exceeding the scale. Assem-blage zones A–D are indicated.
672 Dorthe Reng Erbs-Hansen et al. BOREAS
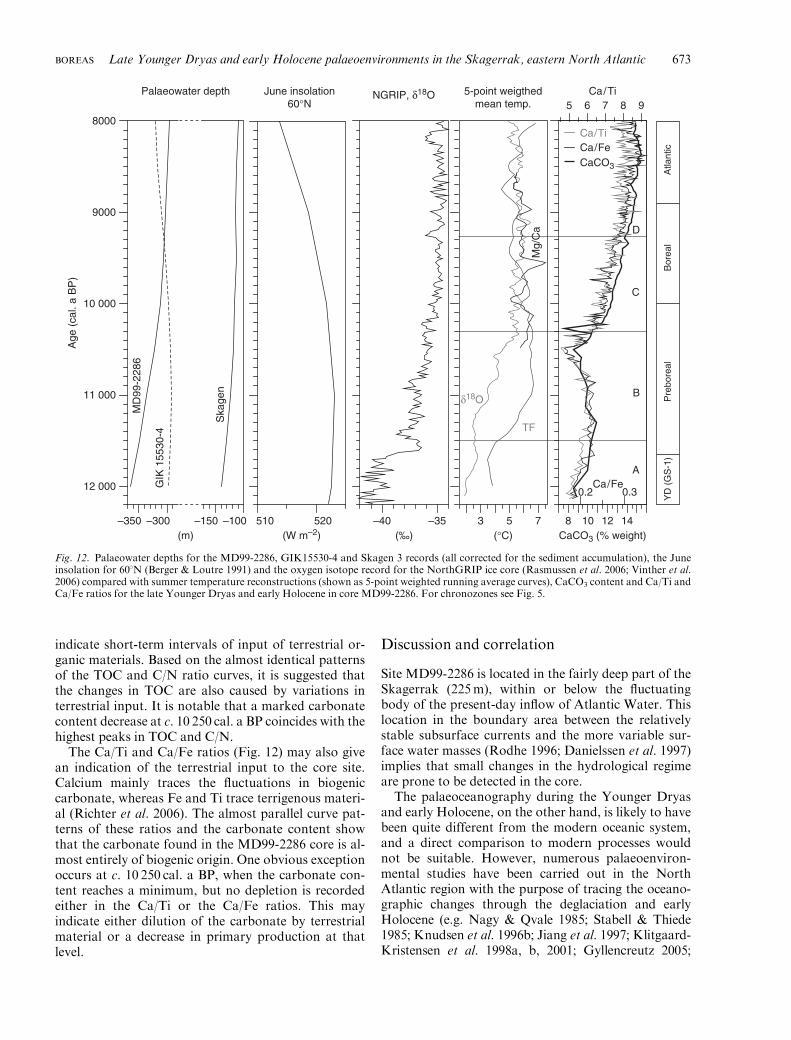
indicate short-term intervals of input of terrestrial or-ganic materials. Based on the almost identical patternsof the TOC and C/N ratio curves, it is suggested thatthe changes in TOC are also caused by variations interrestrial input. It is notable that a marked carbonatecontent decrease at c. 10 250 cal. a BP coincides with thehighest peaks in TOC and C/N.
The Ca/Ti and Ca/Fe ratios (Fig. 12) may also givean indication of the terrestrial input to the core site.Calcium mainly traces the fluctuations in biogeniccarbonate, whereas Fe and Ti trace terrigenous materi-al (Richter et al. 2006). The almost parallel curve pat-terns of these ratios and the carbonate content showthat the carbonate found in the MD99-2286 core is al-most entirely of biogenic origin. One obvious exceptionoccurs at c. 10 250 cal. a BP, when the carbonate con-tent reaches a minimum, but no depletion is recordedeither in the Ca/Ti or the Ca/Fe ratios. This mayindicate either dilution of the carbonate by terrestrialmaterial or a decrease in primary production at thatlevel.
Discussion and correlation
Site MD99-2286 is located in the fairly deep part of theSkagerrak (225m), within or below the fluctuatingbody of the present-day inflow of Atlantic Water. Thislocation in the boundary area between the relativelystable subsurface currents and the more variable sur-face water masses (Rodhe 1996; Danielssen et al. 1997)implies that small changes in the hydrological regimeare prone to be detected in the core.
The palaeoceanography during the Younger Dryasand early Holocene, on the other hand, is likely to havebeen quite different from the modern oceanic system,and a direct comparison to modern processes wouldnot be suitable. However, numerous palaeoenviron-mental studies have been carried out in the NorthAtlantic region with the purpose of tracing the oceano-graphic changes through the deglaciation and earlyHolocene (e.g. Nagy & Qvale 1985; Stabell & Thiede1985; Knudsen et al. 1996b; Jiang et al. 1997; Klitgaard-Kristensen et al. 1998a, b, 2001; Gyllencreutz 2005;
–40 –35
NGRIP, δ18O
3 5 7
5-point weigthedmean temp.
δ18O
TF
Mg/
Ca
(°C)
A
B
C
D
(‰)8 10 12 14
CaCO3 (% weight)
Ca/TiCa/Fe
0.2 0.3
CaCO3
5 6 7 8 9Ca/Ti
Ca/Fe
510 520
June insolation60°N
8000
9000
10 000
11 000
12 000
Age
(ca
l. a
BP
)
–350 –300 –150 –100
MD
99-2
286
Ska
gen
GIK
155
30-4
(m)
Palaeowater depth
(W m–2)
YD
(G
S-1
)P
rebo
real
Bor
eal
Atla
ntic
Fig. 12. Palaeowater depths for the MD99-2286, GIK15530-4 and Skagen 3 records (all corrected for the sediment accumulation), the Juneinsolation for 601N (Berger & Loutre 1991) and the oxygen isotope record for the NorthGRIP ice core (Rasmussen et al. 2006; Vinther et al.2006) compared with summer temperature reconstructions (shown as 5-point weighted running average curves), CaCO3 content and Ca/Ti andCa/Fe ratios for the late Younger Dryas and early Holocene in core MD99-2286. For chronozones see Fig. 5.
BOREAS Late Younger Dryas and early Holocene palaeoenvironments in the Skagerrak, eastern North Atlantic 673

Gyllencreutz et al. 2005, 2006; Gyllencreutz & Kissel2006), and a comparison of MD99-2286 with some ofthe results of these studies is given in the following.
There is particular emphasis on comparisons with thetwo nearest cores in the Skagerrak, namely the Skagen3 and GIK 15530-4 cores (Bjorklund et al. 1985 andreferences therein; Knudsen et al. 1996b). A revised agemodel on a calibrated time scale for Skagen 3, whichwas recently published by Knudsen et al. (2009), can beused directly for the comparison with MD99-2286 (Fig.13), whereas a calibration of zone boundaries has beencarried out for our comparison with GIK 15530-4. Forcomparison, the palaeowater depths for the MD99-2286, Skagen 3 and GIK 15530-4 sites have been re-constructed (Fig. 12).
Late Younger Dryas (c. 12 200–11 500 cal. a BP)
The foraminiferal fauna and the temperature estimatesfor zone A (late Younger Dryas) all show cold condi-tions at the sea floor, corresponding to the generalpalaeoenvironmental indication for the Skagerrak atthat time. For example, subzone E3 of Skagen 3(Knudsen et al. 1996a), which corresponds approxi-mately in time to zone A in MD99-2286, has a similararctic faunal composition (Fig. 13). Assemblages witha dominance of C. reniforme and with E. excavatumf. clavata, N. labradorica and S. loeblichi as accessoryspecies appear to be found practically everywhere
around the Skagerrak basin during the Younger Dryas(e.g. Knudsen 1982; Nagy & Qvale 1985; Knudsen et al.1996a).
Zone A is part of the sedimentary Unit 1 in MD99-2286 (cf. Gyllencreutz 2005), which is characterized byboth high clay content and ice rafted debris (IRD),indicating the influence of glacial meltwater, icebergcalving and/or sea ice (Fig. 3). Diatom evidence fromthe Skagen 3 and GIK 15530-4 cores also supports thepresence of sea ice in the area (Stabell 1985; Knudsenet al. 1996b; Jiang et al. 1997, 1998b). Thus, theYounger Dryas palaeoenvironment in the Skagerrakrepresents the outer part of an arctic fjord with coldmarine conditions at the sea floor and cold meltwater/glacial-influenced surface waters.
The final drainage of the Baltic Ice Lake (BIL) oc-curred c. 11 700 cal. a BP, at the Younger Dryas/Pre-boral transition, based on a correlation of Baltic Seaclay varve records with the GRIP core 18O record (An-dren et al. 1999, 2002), together with shoreline andmodel studies (Bjorck 1995; Lambeck 1999; Tikkanen& Oksanen 2002; Jakobsson et al. 2007). Considerabledepletions in oxygen isotope values have been observedalong the Swedish west coast (Sol, HG cores, Fig. 2)and in the Skagerrak (GIK 15530-4), coinciding withthe drainage of the BIL and indicating the presence oflarge amounts of fresh water (Erlenkeuser 1985; Bjorck1995; Boden et al. 1997). In contrast to this, the event isnot clearly revealed in our data from MD99-2286.There is only a slight increase in C. neoteretis, which is
8000
9000
10 000
11 000
12 000
Age
(ca
l. a
BP
)
0 50(%)
Cold species
0 50(%)
Borealspecies, deep
0 50(%)
Cold species
0 50(%)
Boreal species
MD99-2286 Skagen 3
E3
E2
C
B
A
D
A
B
C
D
E1
0 50(%)
shallowdeep
0 20 40(%)
C. neoteretis
0 20(%)
C. laevigata
0 20 40(%)
C. laevigata
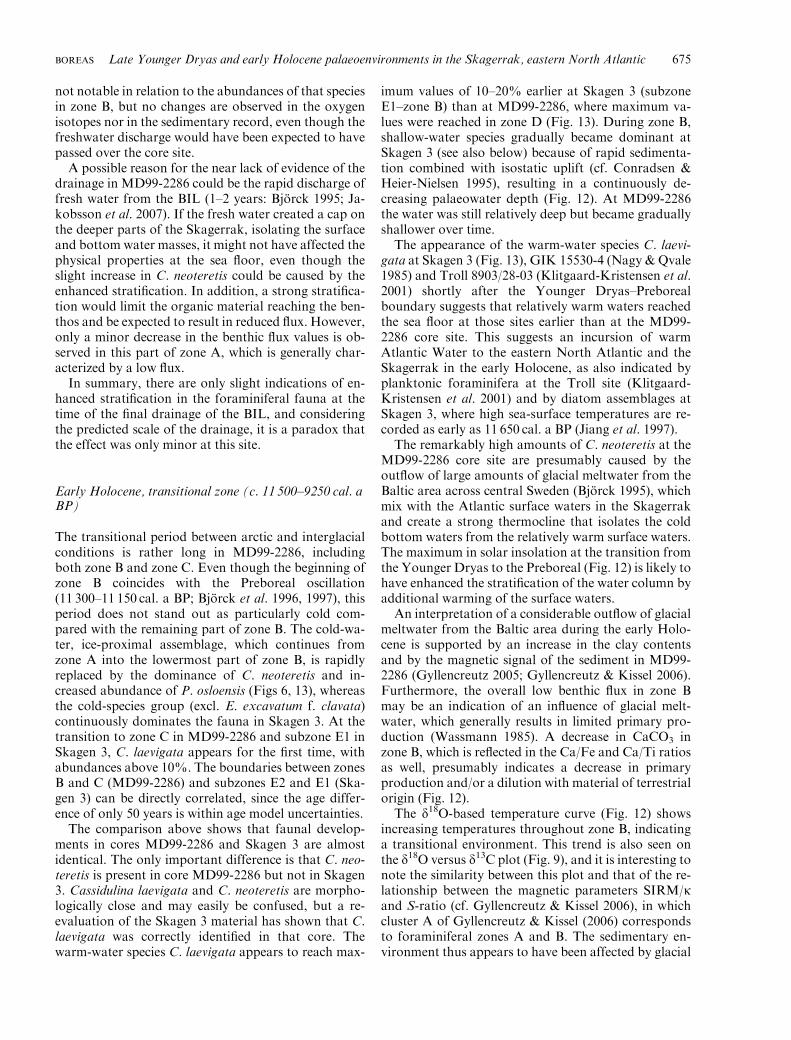
Fig. 13. Correlation of faunal groups and selected species for MD99-2286 (see Fig. 5) and Skagen 3. The overall environmental interpretationsare indicated for MD99-2286. The faunal groups ‘Cold species’ and ‘Boreal species, deep’ in Skagen 3 contain the same species as the corre-sponding faunal groups in MD99-2286, with the exception that E. excavatum is not included in any of the environmental groups for Skagen 3,because its different forms were not identified. The ‘Boreal species, shallow’ group of Skagen 3 contains Ammonia beccarii, Elphidium gerthi,E. incertum, E. magellanicum, E. margaritaceum, E. williamsoni andHaynesina germanica. For chronozones see Fig. 5.
674 Dorthe Reng Erbs-Hansen et al. BOREAS
not notable in relation to the abundances of that speciesin zone B, but no changes are observed in the oxygenisotopes nor in the sedimentary record, even though thefreshwater discharge would have been expected to havepassed over the core site.
A possible reason for the near lack of evidence of thedrainage in MD99-2286 could be the rapid discharge offresh water from the BIL (1–2 years: Bjorck 1995; Ja-kobsson et al. 2007). If the fresh water created a cap onthe deeper parts of the Skagerrak, isolating the surfaceand bottom water masses, it might not have affected thephysical properties at the sea floor, even though theslight increase in C. neoteretis could be caused by theenhanced stratification. In addition, a strong stratifica-tion would limit the organic material reaching the ben-thos and be expected to result in reduced flux. However,only a minor decrease in the benthic flux values is ob-served in this part of zone A, which is generally char-acterized by a low flux.
In summary, there are only slight indications of en-hanced stratification in the foraminiferal fauna at thetime of the final drainage of the BIL, and consideringthe predicted scale of the drainage, it is a paradox thatthe effect was only minor at this site.
Early Holocene, transitional zone (c. 11 500–9250 cal. aBP)
The transitional period between arctic and interglacialconditions is rather long in MD99-2286, includingboth zone B and zone C. Even though the beginning ofzone B coincides with the Preboreal oscillation(11 300–11 150 cal. a BP; Bjorck et al. 1996, 1997), thisperiod does not stand out as particularly cold com-pared with the remaining part of zone B. The cold-wa-ter, ice-proximal assemblage, which continues fromzone A into the lowermost part of zone B, is rapidlyreplaced by the dominance of C. neoteretis and in-creased abundance of P. osloensis (Figs 6, 13), whereasthe cold-species group (excl. E. excavatum f. clavata)continuously dominates the fauna in Skagen 3. At thetransition to zone C in MD99-2286 and subzone E1 inSkagen 3, C. laevigata appears for the first time, withabundances above 10%. The boundaries between zonesB and C (MD99-2286) and subzones E2 and E1 (Ska-gen 3) can be directly correlated, since the age differ-ence of only 50 years is within age model uncertainties.
The comparison above shows that faunal develop-ments in cores MD99-2286 and Skagen 3 are almostidentical. The only important difference is that C. neo-teretis is present in core MD99-2286 but not in Skagen3. Cassidulina laevigata and C. neoteretis are morpho-logically close and may easily be confused, but a re-evaluation of the Skagen 3 material has shown that C.laevigata was correctly identified in that core. Thewarm-water species C. laevigata appears to reach max-
imum values of 10–20% earlier at Skagen 3 (subzoneE1–zone B) than at MD99-2286, where maximum va-lues were reached in zone D (Fig. 13). During zone B,shallow-water species gradually became dominant atSkagen 3 (see also below) because of rapid sedimenta-tion combined with isostatic uplift (cf. Conradsen &Heier-Nielsen 1995), resulting in a continuously de-creasing palaeowater depth (Fig. 12). At MD99-2286the water was still relatively deep but became graduallyshallower over time.
The appearance of the warm-water species C. laevi-gata at Skagen 3 (Fig. 13), GIK 15530-4 (Nagy & Qvale1985) and Troll 8903/28-03 (Klitgaard-Kristensen et al.2001) shortly after the Younger Dryas–Preborealboundary suggests that relatively warm waters reachedthe sea floor at those sites earlier than at the MD99-2286 core site. This suggests an incursion of warmAtlantic Water to the eastern North Atlantic and theSkagerrak in the early Holocene, as also indicated byplanktonic foraminifera at the Troll site (Klitgaard-Kristensen et al. 2001) and by diatom assemblages atSkagen 3, where high sea-surface temperatures are re-corded as early as 11 650 cal. a BP (Jiang et al. 1997).
The remarkably high amounts of C. neoteretis at theMD99-2286 core site are presumably caused by theoutflow of large amounts of glacial meltwater from theBaltic area across central Sweden (Bjorck 1995), whichmix with the Atlantic surface waters in the Skagerrakand create a strong thermocline that isolates the coldbottom waters from the relatively warm surface waters.The maximum in solar insolation at the transition fromthe Younger Dryas to the Preboreal (Fig. 12) is likely tohave enhanced the stratification of the water column byadditional warming of the surface waters.
An interpretation of a considerable outflow of glacialmeltwater from the Baltic area during the early Holo-cene is supported by an increase in the clay contentsand by the magnetic signal of the sediment in MD99-2286 (Gyllencreutz 2005; Gyllencreutz & Kissel 2006).Furthermore, the overall low benthic flux in zone Bmay be an indication of an influence of glacial melt-water, which generally results in limited primary pro-duction (Wassmann 1985). A decrease in CaCO3 inzone B, which is reflected in the Ca/Fe and Ca/Ti ratiosas well, presumably indicates a decrease in primaryproduction and/or a dilution with material of terrestrialorigin (Fig. 12).
The d18O-based temperature curve (Fig. 12) showsincreasing temperatures throughout zone B, indicatinga transitional environment. This trend is also seen onthe d18O versus d13C plot (Fig. 9), and it is interesting tonote the similarity between this plot and that of the re-lationship between the magnetic parameters SIRM/kand S-ratio (cf. Gyllencreutz & Kissel 2006), in whichcluster A of Gyllencreutz & Kissel (2006) correspondsto foraminiferal zones A and B. The sedimentary en-vironment thus appears to have been affected by glacial
BOREAS Late Younger Dryas and early Holocene palaeoenvironments in the Skagerrak, eastern North Atlantic 675
meltwater and a resulting change in isotopic composi-tion, until the closing of the Otteid-Stenselva Strait incentral Sweden c. 10 300 cal. a BP (cf. Bjorck 1995;Lambeck 1999; Gyllencreutz 2005; Gyllencreutz &Kissel 2006).
After the closing of the passage route for meltwaterfrom the Baltic across south central Sweden at aroundthe zone B/C boundary, the sedimentation appears tohave had the same source for a period of around 2000years, and similar stable characteristics are seen bothfor d18O/d13C values (Fig. 9; zones C and D) and formagnetic properties (Gyllencreutz & Kissel 2006). Themagnetic properties point to the North Atlantic as thesource area in the time period c. 10 300–8500 cal. a BP,covering foraminiferal zone C and part of zone D.
The regional differences in the timing of the warmingof bottom waters in the early Holocene for the Ska-gerrak might be explained by differences in water depthat the different sites. The MD99-2286 core site had apalaeowater depth of around 320–330m for zone C,whereas the Skagen 3 site had a water depth of around120m for the same time interval (Fig. 12). This differ-ence could have caused the stratification to break upearlier at Skagen than at the deeper MD99-2286. To-day, stratification also occurs in the deep Skagerrak,and the bottom waters are only renewed during coldwinters, when water becomes dense enough to cascadedown-slope to the deepest part of the Skagerrak (NorthSea Task Force 1993a, b; Rodhe 1996).
The water depth at the GIK 15530-4 site is similar tothat at MD99-2286. As seen for Skagen 3, C. laevigatawas also found in the early Preboreal at that site (Nagy& Qvale 1985). Other boreal species such as U. medi-terranea (as U. peregrina), M. barleeanus and B. mar-ginata became slightly more abundant in Boreal timesand fairly abundant in Atlantic times. Thus, with theexception of the distribution of C. laevigata, the devel-opment in GIK 15530-4 and in MD99-2286 is similar.As previously discussed, C. laevigata and C. neoteretisare morphologically similar to each other, and it hasnot been possible to re-evaluate the GIK 15530-4material.
The Glomma event. – Evidence has been found for thedrainage of an ice-dammed lake (‘Nedre Glamsjø’) incentral Norway c. 10 200 cal. a BP (Longva & Thoresen1991). The drainage has been documented by icebergscours and gravity craters in the central Norwegianlandscape (Longva & Bakkejord 1990; Longva &Thoresen 1991), and the outlet is believed to have beeninto the Skagerrak through the Oslo Fjord, amongstothers (Longva & Thoresen 1991). To our knowledge,this drainage was not recognized in any cores from theSkagerrak until Gyllencreutz (2005) found an increasein IRD at c. 10 200 cal. a BP in MD99-2286 (Fig. 3),which was linked to this drainage, called the Glommaevent.
Neither the foraminifera nor the stable isotopesshow any changes around the time of the drainage, butthe C/N ratio shows a pronounced and abrupt changec. 10 200 cal. a BP. It has a peak value of around 52,corresponding in time to a decrease in CaCO3 and anincrease in IRD, suggesting a large input of terrestrialmaterial, which could have been transported to the areaby flood waters from ‘Nedre Glamsjø’. Because thedrainage probably lasted only days (Longva & Thor-esen 1991), it may have been too short-lived to enableany significant change at the sea floor to be recorded bythe foraminifera.
Early Holocene, full interglacial (c. 9250–8000 cal. a BP)
The dominance of the boreal species C. laevigata in-dicates that full interglacial conditions are obtained atthe sea floor in zone D at MD99-2286. As discussedabove, a similar fauna was found at the end of theBoreal and the beginning of Atlantic times in GIK15530-4, corresponding to zone D in MD99-2286. Aslightly different fauna is found in this time interval atSkagen 3, where B. marginata initially dominates, andthere is a subsequent change to the dominance of shal-low boreal species from around 8900 cal. a BP, coin-ciding with an increase in the sedimentation rate atSkagen 3 (Knudsen et al. 2009). The faunal differencesuggests a different hydrological regime at Skagen 3than at MD99-2286, presumably at least partly causedby a shallower water depth at Skagen 3.
Uvigerina mediterranea, which is a species linked to astrong influence of Atlantic Water and high content oforganic matter (Klitgaard-Kristensen et al. 2002), be-comes abundant in zone D of MD99-2286. This specieswas also found in high numbers in Troll 8903/28-03between 8500 and 7500 cal. a BP by Klitgaard-Kris-tensen et al. (2001), who suggest that a strengthening ofAtlantic Water inflow to the Norwegian Trench around9000 cal. a BP was linked to a change in the hydro-logical system connected to the opening of the EnglishChannel and/or Danish straits, giving rise to the devel-opment of the modern circulation system.
In different studies, this oceanographic change hasbeen reported to occur at different times between 9000and 7700 cal. a BP (cf. Gyllencreutz et al. 2006). InMD99-2286, a change in the sedimentation c. 8500 cal. aBP has been attributed to this major hydrological change(Gyllencreutz 2005; Gyllencreutz & Kissel 2006). Theforaminiferal distribution in MD99-2286, however, doesnot show any change around 8500 cal. a BP, whereas amajor faunal change is observed just after 8000 cal. a BP,presumably as a result of the hydrological change causedby the opening of the English Channel and Danishstraits (Erbs-Hansen, unpublished data).
The 8.2 ka event. – Around 8300–8200 cal. a BP, thereis a shift in the cluster membership values of zone D
676 Dorthe Reng Erbs-Hansen et al. BOREAS

from the boreal cluster FC 3 back to cluster FC 1(Fig. 6). The characteristic assemblage of FC 1 isdominated by C. neoteretis and interpreted to be a coldtransitional fauna. The change in cluster dominancecoincides with a slight decrease in the d18O palaeo-temperature and in the transfer function-based palaeo-salinity estimates (Fig. 10).
This short interval of cooling corresponds in time tothe 8.2 ka cold event (Alley et al. 1997; Alley & Agusts-dottir 2005), as reported in numerous studies from theNorth Atlantic region. The timing of the 8.2 ka event interrestrial records (e.g. Panizzo et al. 2008; Seppa et al.2009; Hede et al. 2010) is generally in good accordancewith the registered temperature drop in the Greenlandice cores (Rasmussen et al. 2007). Several marine re-cords in the northern North Atlantic also show a coldinterval around 8200 cal. a BP (e.g. Klitgaard-Kris-tensen et al. 1998a; Kleiven et al. 2008; Knudsen et al.2008), but the timing of the 8.2 ka event in the marineenvironment appears to vary more than in the terres-trial records. This is probably caused by differences inreservoir ages for the ocean in early Holocene times, asalso suggested by Klitgaard-Kristensen et al. (1998a),Kleiven et al. (2008) and Knudsen et al. (2008).
The estimated decrease in the palaeosalinity at the8.2 ka event (Fig. 10), together with the increase in C.neoteretis, could be an indication of enhanced stratifi-cation as a result of relatively humid summers, as in-ferred from lake-level studies for this time interval(Hammarlund et al. 2005). However, as previouslymentioned, there is a high degree of uncertainty fortransfer function estimates based on samples rich in C.neoteretis.
The 8.2 ka event, which clearly affected the bottomwaters at MD99-2286, has not been recorded in theSkagen 3 (Conradsen & Heier-Nielsen 1995) andGIK15530-4 cores (Bjorklund et al. 1985; Nagy &Qvale 1985). However, only low-resolution studies areavailable from these two sites, and the identification ofthe event could therefore easily have been missed.
Conclusions
This study shows that the multivariate analysis techni-que fuzzy c-means clustering (FCM) is a valuable toolfor analysing high-resolution foraminiferal data. It re-veals clear patterns in the foraminiferal abundances ofthe record, and assemblage zones have been establishedon the basis of this analysis.
The foraminiferal abundances indicate that theSkagerrak during the late Younger Dryas was char-acterized by a marine arctic ice-distal environment,with iceberg calving and/or seasonal sea ice. In earlyPreboreal time, the high-arctic species gradually dis-appeared, but the fauna was still dominated by thecold-water species C. neoteretis, which is associated
with chilled Atlantic Water. Boreal species becamegradually more abundant but did not accountfor more than about 20% of the fauna at c. 10 300 cal.a BP.
Between the Younger Dryas–Preboreal boundary(11 650 cal. a BP) and c. 10 300 cal. a BP, the outflow ofglacial meltwater from the Baltic area across southcentral Sweden appears to have caused a strong stra-tification of the waters in the Skagerrak, preventingthe relatively warm Atlantic surface waters fromreaching the deeper parts of the basin. It is surprising,however, that the large-scale catastrophic drainagethat was reported to occur prior to this meltwater-in-fluenced interval is not clearly evidenced in our record.Further investigations are needed to locate probablesubmarine sediment fans from this large drainage intothe deep basin of the Skagerrak and the Norwegianshelf.
After c. 10 300 cal. a BP, the last drainage routeacross south central Sweden became closed, and theSkagerrak resembled a fjord with a stable inflow ofwater from the North Atlantic, as indicated by thestable isotope values and by previous studies of themagnetic properties of the sediments. A short-term in-crease in terrestrial input to the core site (decrease inCaCO3, increase in C/N ratio and in IRD) at 10 200 cal.a BP may be evidence of the drainage of an ice-dammedlake in Norway, the Glomma event.
The foraminiferal fauna was still under the influenceof relatively cold bottom waters between 10 300and 9300 cal. a BP, but there was a gradual increase ofboreal species, and full interglacial conditions wereobtained at the sea floor from c. 9250 cal. a BP.The subsequent relatively stable environment wasinterrupted by a short-term cooling at c. 8300–8200 cal.a BP, which is correlated with the so-called 8.2 kaevent.
Acknowledgements. – The core material was obtained from theMD114 IMAGES V cruise in 1999. We are grateful to the InstitutPaul-Emile Victor (IPEV) for the IMAGES coring operations on-board R/VMarion Dufresne. The late SvendMeldgaard Christiansen,Aarhus University, Denmark, is thanked for the laboratory proces-sing for the foraminiferal analysis, as are Ulysses S. Ninnemann andRune E. Søraas, University of Bergen, Norway, for the stable isotopemeasurements. The total carbon and nitrogen measurements wereobtained by Heike Siegmund and Paul Frogner Kockum, and thecoulometric carbonate measurements were obtained by Asa Wallinand Klara Hajnal, all at Stockholm University, Sweden. We thankThomas Richter (NIOZ, the Netherlands) for performing the XRFmeasurements and sharing the data with us, as well as Bob Koster(NIOZ, the Netherlands) and numerous students at Bergen Uni-versity for technical assistance during the measurements. We alsothank Jesper Olsen, Queen’s University Belfast, UK, for age model-ling, and Glenn W. Johnson, University of Utah, USA, for fruitfulstatistical discussions. The work has been funded as a Ph.D. project(for DREH) by the Faculty of Science, Aarhus University and bySOAS (International School of Aquatic Sciences), and it is a con-tribution to the Danish Natural Science Research Council projects272-06-0566 (SKAGIS) and 09-072321 (GREEN-ICE). Finally, wewould like to thank Svante Bjorck and an anonymous reviewer, as
BOREAS Late Younger Dryas and early Holocene palaeoenvironments in the Skagerrak, eastern North Atlantic 677

well as the editor Jan A. Piotrowski, for extremely helpful suggestionsthat resulted in improvements to the manuscript. Original data can befound at: doi:10.1594/PANGAEA.756234.
References
Alley, R. B. & Agustsdottir, A. M. 2005: The 8k event: Cause andconsequences of a major Holocene abrupt climate change. Qua-ternary Science Reviews 24, 1123–1149.
Alley, R. B., Mayewski, P. A., Sowers, T., Stuiver, M., Taylor, K. C.& Clark, P. U. 1997: Holocene climatic instability: A prominent,widespread event 8200 yr ago. Geology 25, 483–486.
Alve, E. & Murray, J. W. 1995: Benthic foraminiferal distributionand abundance changes in Skagerrak surface sediments: 1937(Hoglund) and 1992/1993 data compared. Marine Micro-paleontology 25, 269–288.
Andersen, B. G., Mangerud, J., Sørensen, R., Reite, A., Sveian, H.,Thoresen, M. & Bergstrom, B. 1995: Younger Dryas ice-marginaldeposits in Norway. Quaternary International 28, 147–169.
Andren, T., Bjorck, J. & Johnsen, S. 1999: Correlation of Swedishglacial varves with the Greenland (GRIP) oxygen isotope record.Journal of Quaternary Science 14, 361–371.
Andren, T., Lindeberg, G. & Andren, E. 2002: Evidence of the finaldrainage of the Baltic Ice Lake and the brackish phase of the YoldiaSea in glacial varves from the Baltic Sea. Boreas 31, 226–238.
Andrews, J. T. & Dunhill, G. 2004: Early to mid-Holocene Atlanticwater influx and deglacial meltwater events, Beaufort Sea slope,Arctic Ocean. Quaternary Research 61, 14–21.
Austin, W. E. N., Cage, A. G. & Scourse, J. D. 2006: Mid-latitudeshelf seas: a NWEuropean perspective on the seasonal dynamics oftemperature, salinity and oxygen isotopes.Holocene 16, 937–947.
Bard, E., Hamelin, B., Fairbanks, R. G. & Zindler, A. 1990: Calibra-tion of the 14C timescale over the past 30,000 years using mass-spectrometric U-Th ages from Barbados corals. Nature 345,405–410.
Barker, S., Greaves, M. & Elderfield, H. 2003: A study of cleaningprocedures used for foraminiferal Mg/Ca paleothermometry. Geo-chemistry, Geophysics, Geosystems 4, 8407, doi: 10.1029/2003GC000559.
Berger, A. & Loutre, M. F. 1991: Insolation values for the climate ofthe last 10 million years. Quaternary Science Reviews 10, 297–317.
Bergsten, H., Nordberg, K. & Malmgren, B. 1996: Recent benthicforaminifera as tracers of water masses along a transect in the Ska-gerrak, north-eastern North Sea. Journal of Sea Research 35,111–121.
Bezdek, J. C. 1987: Pattern Recognition with Fuzzy Objective FunctionAlgorithms. 256 pp. New York Plenum Press, New York.
Bjorck, S. 1995: A review of the history of the Baltic Sea, 13.0–8.0KaBP. Quaternary International 27, 19–40.
Bjorck, S. 2008: The late Quaternary development of the Baltic Seabasin. In The BACC Author Team (eds.): Assessment of ClimateChange for the Baltic Sea Basin, 398–407. Springer-Verlag, Berlinand Heidelberg.
Bjorck, S., Kromer, B., Johnsen, S., Bennike, O., Hammarlund, D.,Lemdahl, G., Possnert, G., Rasmussen, T. L., Wohlfarth, B.,Hammer, C. U. & Spurk, M. 1996: Synchronized terrestrial-atmo-spheric deglacial records around the North Atlantic. Science 274,1155–1160.
Bjorck, S., Rundgren, M., Ingolfsson, O. & Funder, S. 1997: ThePreboreal oscillation around the Nordic Seas: terrestrial and lacus-trine responses. Journal of Quaternary Science 12, 455–465.
Bjorck, S., Walker, M. J. C., Cwynae, L. C., Johnsen, S., Knudsen,K.-L., Lowe, J. J., Wohlfarth, B. & the INTIMATE Members1998: An event stratigraphy for the Last Termination in the NorthAtlantic region based on the Greenland icecore record: A proposalby the INTIMATE Group. Journal of Quaternary Sciences 13,283–292.
Bjorklund, K. R., Bjørnstad, H., Dale, B., Erlenkeuser, H., Hen-ningsmoen, K. E., Høeg, H. I., Johnson, K., Manum, S. B., Mik-kelsen, N., Nagy, J., Pederstad, K., Qvale, G., Rosenqvist, I. T.,
Salbu, B., Schoenharting, G., Stabell, B., Thiede, J., Thorndsen, I.,Wassmann, P. & Werner, F. 1985: Evolution of the Upper Qua-ternary depositional environment in the Skagerrak: a synthesis.Norsk Geologisk Tidsskrift 65, 139–149.
Boden, P., Fairbanks, R. G., Wright, J. D. & Burckle, L. H. 1997:High-resolution stable isotope records from southwest Sweden:The drainage of the Baltic Ice Lake and Younger Dryas ice marginoscillations. Paleoceanography 12, 39–49.
Boyle, E. A. & Keigwin, L. D. 1985: Comparison of Atlantic and Pa-cific paleochemical records for the last 215,000 years: Changes indeep ocean circulation and chemical inventories. Earth PlanetarySciences Letters 76, 135–150.
Buzas, M. A. & Gibson, T. G. 1969: Species diversity: benthonic for-aminifera in Western North Atlantic. Science 163, 72–75.
Buzas, M. A. & Hayek, L. A. C. 1996: Biodiversity resolution: an in-tegrated approach. Biodiversity Letters 3, 40–43.
Buzas, M. A. & Hayek, L. A. C. 1998: SHE analysis for biofaciesidentification. Journal of Foraminiferal Research 28, 233–239.
Conradsen, K. &Heier-Nielsen, S. 1995: Holocene paleoceanographyand paleoenvironments of the Skagerrak-Kattegat, Scandinavia.Paleoceanography 10, 801–813.
Conradsen, K., Bergsten, H., Knudsen, K. L., Nordberg, K. & Sei-denkrantz, M.-S. 1994: Recent benthic foraminiferal distribution inthe Kattegat and the Skagerrak, Scandinavia. Cushman FoundationSpecial Publication 32, 53–68.
Danielssen, D. S., Edler, L., Fonselius, S., Hernroth, L., Ostrowski,M., Svendsen, E. & Talpsepp, L. 1997: Oceanographic variability inthe Skagerrak and Northern Kattegat, May–June, 1990. ICESJournal of Marine Science 54, 753–773.
Ellis, B. F. & Messina, A. 1949: Catalogue of Foraminifera (Supple-ments, including 2009). American Museum of Natural History andMicropaleontology Press, New York.
Erlenkeuser, H. 1985: Stable isotopes in benthic foraminifers of Ska-gerrak core GIK 15530-4: High resolution record of the YoungerDryas and the Holocene. Norsk Geologisk Tidsskrift 65, 49–57.
Fairbanks, R. G. 1989: A 17,000-year glacio-eustatic sea-level record– influence of glacial melting rates on the Younger Dryas event anddeep-ocean circulation. Nature 342, 637–642.
Feyling-Hanssen, R. W. 1954a: Late-Pleistocene foraminifera fromthe Oslofjord area, Southeast Norway. Norsk Geologisk Tidsskrift33, 109–152.
Feyling-Hanssen, R. W. 1954b: The stratigraphic position of theQuick Clay at Bekkelaget, Oslo. Norsk Geologisk Tidsskrift 33,185–196.
Feyling-Hanssen, R. W., Jørgensen, J. A., Knudsen, K. L. & Lykke-Andersen, A.-L. 1971: Late Quaternary foraminifera from Vend-syssel, Denmark and Sandnes, Norway. Bulletin of the GeologicalSociety of Denmark 21, 67–314.
Fontanier, C., Mackensen, A., Jorissen, F. J., Anschutz, P., Licari, L.& Griveaud, C. 2006: Stable oxygen and carbon isotopes of livebenthic foraminifera from the Bay of Biscay: Microhabitat impactand seasonal variability.Marine Micropaleontology 58, 159–183.
Gary, A. C., Wakefield, M. I., Johnson, G. W. & Ekart, D. D. 2009:Application of fuzzy c-means clustering to paleoenvironmentalanalysis: example from the Jurassic, central North Sea, UK. Societyfor Sedimentary Geology, Special Publication 93, 9–20.
Gupta, A. K., Sarkar, S. & Mukherjee, B. 2006: Paleoceanographicchanges during the past 1.9Myr at DSDP Site 238, Central IndianOcean Basin: Benthic foraminiferal proxies. Marine Micro-paleontology 60, 157–166.
Gustafsson, B. & Stigebrandt, A. 1996: Dynamics of the freshwater-influenced surface layers in the Skagerrak. Journal of Sea Research35, 39–53.
Gyllencreutz, R. 2005: Late Glacial and Holocene paleoceanographyin the Skagerrak from high-resolution grain size records. Palaeo-geography, Palaeoclimatology, Palaeoecology 222, 344–369.
Gyllencreutz, R. & Kissel, C. 2006: Lateglacial and Holocene sedi-ment sources and transport patterns in the Skagerrak interpretedfrom high-resolution magnetic properties and grain size data. Qua-ternary Science Reviews 25, 1247–1263.
Gyllencreutz, R., Backman, J., Jakobsson, M., Kissel, C. & Arnold,E. 2006: Postglacial palaeoceanography in the Skagerrak.Holocene16, 975–985.
678 Dorthe Reng Erbs-Hansen et al. BOREAS

Gyllencreutz, R., Jakobsson, M. & Backman, J. 2005: Holocene se-dimentation in the Skagerrak interpreted from chirp sonar and coredata. Journal of Quaternary Science 20, 21–32.
Hald, M. & Korsun, S. 1997: Distribution of modern benthic for-aminifera from fjords of Svalbard, European Arctic. Journal ofForaminiferal Research 27, 101–122.
Hald, M., Steinsund, P. I., Dokken, T., Korsun, S., Polyak, L. & As-peli, R. 1994: Recent and late Quaternary distribution of the El-phidium excavatum f. clavata in Arctic Seas. Cushman FoundationSpecial Publication 32, 141–153.
Hammarlund, D., Bjorck, S., Buchardt, B. & Thomsen, C. T. 2005:Limnic responses to increased effective humidity during the8200 cal. yr BP cooling event in southern Sweden. Journal of Pa-leolimnology 34, 471–480.
Hayek, L. A. C. & Buzas, M. A. 1997: Surveying Natural Populations.563 pp. Columbia University Press, New York.
Hebbeln, D., Knudsen, K. L., Gyllencreutz, R., Kristensen, P., Klit-gaard-Kristensen, D., Backman, J., Scheurle, C., Jiang, H., Gil, I.,Smelror, M., Jones, P. D. & Sejrup, H. P. 2006: Late Holocenecoastal hydrographic and climate changes in the eastern North Sea.Holocene 16, 987–1001.
Hede, M. U., Rasmussen, P., Noe-Nygaard, N., Clarke, A. L., Vi-nebrooke, R. D. & Olsen, J. 2010: Multiproxy evidence for terres-trial and aquatic ecosystem responses during the 8.2 ka cold eventas recorded at Højby Sø, Denmark. Quaternary Research 73,485–496.
Hut, G. 1987: Consultants group meeting on stable isotope referencesamples for geochemical and hydrological investigations, Interna-tional Atomic Energy Agency (IAEA). Report to the Director Gen-eral, IAEA, Vienna, 42 pp.
Jakobsson, M., Bjorck, S., Alm, G., Andren, T., Lindeberg, G. &Svensson, N.-O. 2007: Reconstructing the Younger Dryas icedammed lake in the Baltic Basin: Bathymetry, area and volume.Global and Planetary Change 57, 355–370.
Jansen, E., Bleil, U., Henrich, R., Kringstad, L. & Slettemark, B.1988: Paleoenvironmental changes in the Norwegian Sea and theNortheast Atlantic during the last 2.8m.y.: Deep Sea Drilling Pro-ject/Ocean Drilling Program Sites 610, 642, 643 and 644. Paleocea-nography 3, 563–581.
Jansen, J. H. F., van der Gaast, S. J., Koster, B. & Vaars, A. 1998:CORTEX, a shipboard XRF-scanner for element analyses in splitsediment cores.Marine Geology 151, 143–153.
Jennings, A. E. & Helgadottir, G. 1994: Foraminiferal assemblagesfrom the fjords and shelf of eastern Greenland. Journal of For-aminiferal Research 24, 123–144.
Jiang, H., Bjorck, S. & Knudsen, K. L. 1997: A palaeoclimatic andpalaeoceanographic record of the last 11,000 C-14 years from theSkagerrak–Kattegat, northeastern Atlantic margin. Holocene 7,301–310.
Jiang, H., Bjorck, S. & Svensson, N.-O. 1998b: Reconstruction ofHolocene sea-surface salinity in the Skagerrak–Kattegat: A cli-matic and environmental record of Scandinavia. Journal of Qua-ternary Science 13, 107–114.
Jiang, H., Svensson, N.-O. & Bjorck, S. 1998a: Meltwater dischargeto the Skagerrak–Kattegat from the Baltic Ice Lake during theYounger Dryas interval. Quaternary Research 49, 264–270.
Juggins, S. 2007: C2, Software for Ecological and PalaeoecologicalData Analysis and Visualisation. User Guide Version 1.5. 73 pp.University of Newcastle, Newcastle upon Tyne.
Kleiven, H. F., Kissel, C., Laj, C., Ninnemann, U. S., Richter, T. O. &Cortijo, E. 2008: Reduced North Atlantic deep water coeval withthe glacial lake agassiz freshwater outburst. Science 319, 60–64.
Klitgaard-Kristensen, D., Rasmussen, T. L., Sejrup, H. P., Ha-flidason, H. & van Weering, T. C. E. 1998b: Rapid changes in theoceanic fronts in the Norwegian Sea during the last deglaciation:Implications for the Younger Dryas cooling event.Marine Geology152, 177–188.
Klitgaard-Kristensen, D., Sejrup, H. P. & Haflidason, H. 2001: Thelast 18 kyr fluctuations in Norwegian Sea surface conditions andimplications for the magnitude of climatic change: Evidence fromthe North Sea. Paleoceanography 16, 455–467.
Klitgaard-Kristensen, D., Sejrup, H. P. & Haflidason, H. 2002: Dis-tribution of recent calcareous benthic foraminifera in the northern
North Sea and relation to the environment. Polar Research 21,275–282.
Klitgaard-Kristensen, D., Sejrup, H. P., Haflidason, H., Johnsen, S.& Spurk, M. 1998a: A regional 8200 cal. yr BP coolingevent in northwest Europe, induced by final stages of the Lauren-tide ice-sheet deglaciation? Journal of Quaternary Science 13,165–169.
Knudsen, K. L. 1982. 14. Foraminifera. In Olausson, E. (ed.): ThePleistocene/Holocene boundary in south-western Sweden, 148–177.Sveriges Geologiska Undersokning, Serie C 794.
Knudsen, K. L. 1998: Foraminiferer i Kvartær stratigrafi: Labor-atorie- og fremstillingsteknik samt udvalgte eksempler. GeologiskTidskrift 3, 1–25.
Knudsen, K. L., Conradsen, K., Heier-Nielsen, S. & Seidenkrantz,M.-S. 1996a: Palaeoenvironments in the Skagerrak-Kattegat basinin the eastern North Sea during the last deglaciation. Boreas 25,65–77.
Knudsen, K. L., Conradsen, K., Heier-Nielsen, S. & Seidenkrantz,M.-S. 1996b: Quaternary palaeoceanography and palaeogeographyin northern Denmark: a review of results from the Skagen cores.Bulletin of the Geological Society of Denmark 43, 22–31.
Knudsen, K. L., Kristensen, P. & Larsen, N. K. 2009: Marine glacialand interglacial stratigraphy in Vendsyssel, northern Denmark:Foraminifera and stable isotopes. Boreas 38, 787–810.
Knudsen, K. L., Søndergaard, M. K. B., Eirıksson, J. & Jiang, H.2008: Holocene thermal maximum off North Iceland: Evidencefrom benthic and planktonic foraminifera in the 8600–5200 cal yearBP time slice.Marine Micropaleontology 67, 120–142.
Korsun, S. & Hald, M. 1998: Modern benthic foraminifera off No-vaya Zemlya tidewater glaciers, Russian Arctic. Arctic and AlpineResearch 30, 61–77.
Kristjansdottir, G. B., Lea, D. W., Jennings, A. E., Pak, D. K. & Be-langer, C. 2007: New spatial Mg/Ca-temperature calibrations forthree Arctic, benthic foraminifera and reconstruction of northIceland shelf temperature for the past 4000 years. Geochemistry,Geophysics, Geosystems 8, Q03P21, doi: 10.1029/2006GC001425.
Labeyrie, L., Jansen, E. & Cortijo, E. & Shipboard participants 2003:Ginna Cruise, MD114-IMAGES V, Scientific Report. 850 pp. InstitutPolaire Francais-Paul-Emile Victor (IPEV), Plouzane, France.
Lamb, A. L., Wilson, G. P. & Leng, M. J. 2006: A review of coastalpalaeoclimate and relative sea-level reconstructions using d13C andC/N ratios in organic material. Earth-Science Reviews 75, 29–57.
Lambeck, K. 1999: Shoreline displacements in southern-central Swe-den and the evolution of the Baltic Sea since the last maximumglaciation. Journal of the Geological Society 156, 465–486.
Lambeck, K., Purcell, A., Zhao, J. & Svensson, N.-O. 2010: TheScandinavian Ice Sheet: from MIS 4 to the end of the Last GlacialMaximum. Boreas 39, 410–435.
Ljøen, R. & Svansson, A. 1972: Long-term variations of subsurfacetemperatures in the Skagerrak. Deep-Sea Research and Oceano-graphic Abstracts 19, 277–288.
Lloyd, J. M. 2006: Modern distribution of benthic foraminifera fromDisko Bugt, west Greenland. Journal of Foraminiferal Research 36,315–331.
Longva, O. & Bakkejord, K. J. 1990: Iceberg deformation and erosionin soft sediments, southeast Norway.Marine Geology 92, 87–104.
Longva, O. & Thoresen, M. K. 1991: Iceberg scours, iceberg gravitycraters and current erosion marks from a gigantic Preboreal floodin southeastern Norway. Boreas 20, 47–62.
Longva, O. & Thorsnes, T. 1997, Skagerrak in the past and the pre-sent – an integrated study of geology, chemistry, hydrology andmicrofossil ecology. Norges Geologiske Undersøkelse, Special Pub-lication 8, 98 pp.
Lubinski, D. J., Polyak, L. & Forman, S. L. 2001: Freshwater andAtlantic Water inflows to the deep northern Barents and Kara seassince ca 13 14C ka: Foraminifera and stable isotopes. QuaternaryScience Reviews 20, 1851–1879.
Lykke-Andersen, H. 1987: Thickness of Quaternary deposits andtheir relation to the pre-Quaternary in the Fennoscandian borderzone in Kattegat and Vendsyssel. Boreas 16, 369–371.
Mackensen, A. & Hald, M. 1988: Cassidulina teretis Tappan andC. laevigata d’Orbigny: their modern and late Quaternary distribu-tion in northern seas. Journal of Foraminiferal Research 18, 16–24.
BOREAS Late Younger Dryas and early Holocene palaeoenvironments in the Skagerrak, eastern North Atlantic 679

Mackensen, A., Sejrup, H. P. & Jansen, E. 1985: The distribution ofliving benthic foraminifera on the continental slope and rise offsouthwest Norway.Marine Micropaleontology 9, 275–306.
Mangerud, J., Andersen, S. T., Berglund, B. E. & Donner, J. J. 1974:Quaternary stratigraphy of Norden, a proposal for terminologyand classification. Boreas 3, 109–126.
McClimans, T. A., Pietrzak, J. D., Huess, V., Kliem, N., Nilsen, J. H.& Johannessen, B. O. 2000: Laboratory and numerical simulationof the Skagerrak circulation. Continental Shelf Research 20,941–974.
Nagy, J. & Qvale, G. 1985: Benthic foraminifers in Upper QuaternarySkagerrak deposits. Norsk Geologisk Tidsskrift 65, 107–113.
North Sea Task Force 1993a: North Sea Quality Report 1993. 132 pp.Oslo and Paris Commisions, London.
North Sea Task Force 1993b: North Sea Subregion 8, Assessment Re-port 1993. 79 pp. State Pollution Control Authority (SFT), Oslo.
Panizzo, V. N., Jones, V. J., Birks, H. J. B., Boyle, J. F., Brooks, S. J.& Leng, M. J. 2008: A multiproxy palaeolimnological investigationof Holocene environmental change, between c. 10 700 and 7200years BP, at Holebudalen, southern Norway. Holocene 18,805–817.
Ramsey, C. B. 2008: Deposition models for chronological records.Quaternary Science Reviews 27, 42–60.
Ramsey, C. B. 2009: Bayesian analysis of radiocarbon dates. Radio-carbon 51, 337–360.
Rasmussen, S. O., Andersen, K. K., Svensson, A. M., Steffensen, J.P., Vinther, B. M., Clausen, H. B., Siggaard-Andersen, M.-L.,Johnsen, S. J., Larsen, L. B., Dahl-Jensen, D., Bigler, M.,Rothlisberger, R., Fischer, H., Goto-Azuma, K., Hansson, M. E. &Ruth, U. 2006: A new Greenland ice core chronology for the lastglacial termination. Journal of Geophysical Research D 111,D06102, doi: 10.1029/2005JD006079.
Rasmussen, S. O., Vinther, B. M., Clausen, H. B. & Andersen, K. K.2007: Early Holocene climate oscillations recorded in three Green-land ice cores. Quaternary Science Reviews 26, 1907–1914.
Reimer, P. J., Baillie, M. G. L. & Bard, E. et al. 2004: IntCal04 ter-restrial radiocarbon age calibration, 0–26 cal kyr BP. Radiocarbon46, 1029–1058.
Reimer, P. J., Baillie, M. G. L. & Bard, E. et al. 2009: Intcal09 andMarine09 Radiocarbon Age Calibration Curves, 0–50,000 YearsCal Bp. Radiocarbon 51, 1111–1150.
Richter, T. O., van der Gaast, S., Koster, B., Vaars, A., Gieles, R., deStigter, H. C., de Haas, H. & van Weering, T. C. E. 2006: TheAvaatech XRF Core Scanner: Technical description and applica-tions to NE Atlantic sediments. Geological Society of London. Spe-cial Publication 267, 39–50.
Rise, L., Olsen, H. A., Reidulv, B. & Ottensen, D. 1996: Thickness,distribution and depositional environment of Holocene sedimentsin the Norwegian part of the Skagerrak. Norges Geologiske Under-søkelse, Bulletin 430, 5–16.
Rodhe, J. 1996: On the dynamics of the large-scale circulation of theSkagerrak. Journal of Sea Research 35, 9–21.
Rodhe, J. & Holt, N. 1996: Observations of the transport of sus-pended matter into the Skagerrak along the western and northernCoast of Jutland. Journal of Sea Research 35, 91–98.
Rosenthal, Y., Perron-Cashman, S. & Lear, C. H. et al. 2004: Inter-laboratory comparison study of Mg/Ca and Sr/Ca measurementsin planktonic foraminifera for paleoceanographic research. Geo-chemistry, Geophysics, Geosystems 5, Q04D09, doi: 10.1029/2003GC000650.
Rytter, F., Knudsen, K. L., Seidenkrantz, M.-S. & Eirıksson, J. 2002:Modern distribution of benthic foraminifera on the northIcelandic shelf and slope. Journal of Foraminiferal Research 32,217–244.
Schmiedl, G., Pfeilsticker, M., Hemleben, C. & Mackensen, A. 2004:Environmental and biological effects on the stable isotope compo-sition of recent deep-sea benthic foraminifera from the westernMediterranean Sea.Marine Micropaleontology 51, 129–152.
Seidenkrantz, M.-S. 1995: Cassidulina teretis Tappan and Cassidulinaneoteretis new species (Foraminifera): Stratigraphic markers fordeep sea and outer shelf areas. Journal of Micropalaeontology 14,145–157.
Sejrup, H. P., Birks, H. J. B., Kristensen, D. K. & Madsen, H. 2004:Benthonic foraminiferal distributions and quantitative transferfunctions for the northwest European continental margin. MarineMicropaleontology 53, 197–226.
Sejrup, H. P., Haflidason, H., Kristensen, D. K. & Johnsen, S. J. 1995:Last interglacial and Holocene climatic development in the Nor-wegian Sea region: ocean front movements and ice-core data.Journal of Quaternary Science 10, 385–390.
Seppa, H., Bjune, A. E., Telford, R. J., Birks, H. J. B. & Veski, S.2009: Last nine-thousand years of temperature variability inNorthern Europe. Climate of the Past, Discussions 5, 1521–1552.
Shackleton, N. J. 1974: Attainment of isotopic equilibrium betweenocean water and the benthonic foraminifera genusUvigerina: Isotopicchanges in the ocean during the last glacial. Colloques Internationauxdu Centre national de la Recherche Scientifique 219, 203–209.
Shannon, C. E. 1948: A mathematical theory of communication. BellSystem Technical Journal 27, 379–423.
Stabell, B. 1985: Diatoms in Upper Quaternary Skaggerak sediments.Norsk Geologisk Tidsskrift 65, 91–95.
Stabell, B. & Thiede, J. 1985: Upper Quaternary marine Skagerrak(NE North Sea) deposits: Stratigraphy and depositional environ-ment. Norsk Geologisk Tidsskrift 65, 1–149.
Tikkanen, M. & Oksanen, J. 2002: Late Weichselian and Holoceneshore displacement history of the Baltic Sea in Finland. Fennia 180,9–20.
de Villiers, S., Graves, M. & Elderfield, H. 2002: An intensity ratiocalibration method for the accurate determination of Mg/Ca andSr/Ca of marine carbonates by ICP-AES. Geochemistry, Geo-physics, Geosystems 3, 1001, doi: 10.1029/2001GC000169.
Vinther, B. M., Clausen, H. B., Johnsen, S. J., Rasmussen, S. O.,Andersen, K. K., Buchardt, S. L., Dahl-Jensen, D., Seierstad, I. K.,Siggaard-Andersen, M.-L., Steffensen, J. P., Svensson, A., Olsen, J.& Heinemeier, J. 2006: A synchronized dating of three Greenlandice cores throughout the Holocene. Journal of Geophysical ResearchD 111, D13102, doi: 10.1029/2005JD006921.
Wakefield, M. I. 2003: Bio-sequence stratigraphic utility of SHE di-versity analysis. Society for Sedimentary Geology, Special Publica-tion 75, 81–87.
Wassmann, P. 1985: Accumulation of organic matter in core GIK15530-4 and the Upper Quaternary paleo-productivity in the Ska-gerrak. Norsk Geologisk Tidsskrift 65, 131–137.
Wollenburg, J. E. & Mackensen, A. 1998a: On the vertical distribu-tion of living (Rose Bengal stained) benthic foraminifers in theArctic Ocean. Journal of Foraminiferal Research 28, 268–285.
Wollenburg, J. E. & Mackensen, A. 1998b: Living benthic for-aminifers from the central Arctic Ocean: Faunal composition,standing stock and diversity. Marine Micropaleontology 34,153–185.
680 Dorthe Reng Erbs-Hansen et al. BOREAS
Copyright © 2022 FDOKUMEN