Multiproxy study of anthropogenic and climatic changes in the last two millennia from a small mire...
18
PALAEOLIMNOLOGY Multiproxy study of anthropogenic and climatic changes in the last two millennia from a small mire in central Poland Mariusz Lamentowicz Zofia Balwierz Jacek Forysiak Mateusz Plo ´ciennik Piotr Kittel Marek Kloss Juliusz Twardy Slawomir _ Zurek Jacek Pawlyta Published online: 19 May 2009 Ó Springer Science+Business Media B.V. 2009 Abstract The _ Zabieniec kettle hole is the first peatland in central Poland analyzed quantitatively with four biotic proxies (plant macrofossils, pollen, testate amoebae and chironomids) to reconstruct the past environmental change. Palaeoecological data were supported by historical and archaeological records. We focused on autogenic vegetation change and human impact in relation to climatic effects. The aims of our study were (a) to describe the development history of the mire during the last 2,000 years, (b) to date and reconstruct the anthro- pogenic land-use changes and (c) to discuss a possible climatic signal in the peat archive. The combination of proxies revealed dramatic shifts that took place in the peatland since the Roman Period. _ Zabieniec was a very wet telmatic habitat until ca. AD 600. Then, the water table declined, and the site transformed into a Sphagnum-dominated mire. This dry shift took place mainly during the Early Medieval Period. Human impact was gradually increasing, and it was particularly emphasized by deforestation since AD 1250 (beginning of the Late Medieval Period). Consequently, surface run-off and aeolian transport Guest editors: K. Buczko ´, J. Korponai, J. Padisa ´k & S. W. Starratt Palaeolimnological Proxies as Tools of Environmental Reconstruction in Fresh Water M. Lamentowicz (&) Department of Biogeography and Palaeoecology, Faculty of Geosciences, Adam Mickiewicz University, Dzie ˛gielowa 27, 61-680 Poznan, Poland e-mail: [email protected] M. Lamentowicz Ecosystem Boundaries Research Unit, Wetlands Research Group Station 2, Swiss Federal Institute for Forest Snow and Landscape Research (WSL), 1015 Lausanne, Switzerland M. Lamentowicz Laboratoire des Syste `mes Ecologiques Station 2, Ecole Polytechnique Fe ´de ´rale de Lausanne (EPFL), 1015 Lausanne, Switzerland Z. Balwierz Á J. Forysiak Á P. Kittel Á J. Twardy University of Lo ´dz ´, Faculty of Geographical Sciences, Narutowicza 88, 90-139 Lodz, Poland M. Plo ´ciennik University of Lo ´dz ´, Faculty of Biology and Environment Protection, Banacha 12/16, 90-237 Lodz, Poland M. Kloss Centre for Ecological Research, Polish Academy of Sciences, Dziekano ´w Les ´ny, 05-092 Lomianki, Poland S. _ Zurek Department of Quaternary Studies and Nature Conservation, University of Humanistic and Nature Science of Kielce, Institute of Geography, S ´ wie ˛tokrzyska 15, 25-406 Kielce, Poland J. Pawlyta Department of Radioisotopes, Silesian University of Technology, Krzywoustego 2, 44-100 Gliwice, Poland 123 Hydrobiologia (2009) 631:213–230 DOI 10.1007/s10750-009-9812-y
Transcript of Multiproxy study of anthropogenic and climatic changes in the last two millennia from a small mire...

PALAEOLIMNOLOGY
Multiproxy study of anthropogenic and climatic changesin the last two millennia from a small mire in central Poland
Mariusz Lamentowicz Æ Zofia Balwierz Æ Jacek Forysiak ÆMateusz Płociennik Æ Piotr Kittel Æ Marek Kloss ÆJuliusz Twardy Æ Sławomir _Zurek Æ Jacek Pawlyta
Published online: 19 May 2009
� Springer Science+Business Media B.V. 2009
Abstract The _Zabieniec kettle hole is the first
peatland in central Poland analyzed quantitatively
with four biotic proxies (plant macrofossils, pollen,
testate amoebae and chironomids) to reconstruct the
past environmental change. Palaeoecological data
were supported by historical and archaeological
records. We focused on autogenic vegetation change
and human impact in relation to climatic effects. The
aims of our study were (a) to describe the
development history of the mire during the last
2,000 years, (b) to date and reconstruct the anthro-
pogenic land-use changes and (c) to discuss a
possible climatic signal in the peat archive. The
combination of proxies revealed dramatic shifts that
took place in the peatland since the Roman Period._Zabieniec was a very wet telmatic habitat until ca.
AD 600. Then, the water table declined, and the site
transformed into a Sphagnum-dominated mire. This
dry shift took place mainly during the Early Medieval
Period. Human impact was gradually increasing, and
it was particularly emphasized by deforestation since
AD 1250 (beginning of the Late Medieval Period).
Consequently, surface run-off and aeolian transport
Guest editors: K. Buczko, J. Korponai, J. Padisak
& S. W. Starratt
Palaeolimnological Proxies as Tools of Environmental
Reconstruction in Fresh Water
M. Lamentowicz (&)
Department of Biogeography and Palaeoecology,
Faculty of Geosciences, Adam Mickiewicz University,
Dziegielowa 27, 61-680 Poznan, Poland
e-mail: [email protected]
M. Lamentowicz
Ecosystem Boundaries Research Unit, Wetlands Research
Group Station 2, Swiss Federal Institute for Forest Snow
and Landscape Research (WSL), 1015 Lausanne,
Switzerland
M. Lamentowicz
Laboratoire des Systemes Ecologiques Station 2, Ecole
Polytechnique Federale de Lausanne (EPFL), 1015
Lausanne, Switzerland
Z. Balwierz � J. Forysiak � P. Kittel � J. Twardy
University of Łodz, Faculty of Geographical Sciences,
Narutowicza 88, 90-139 Lodz, Poland
M. Płociennik
University of Łodz, Faculty of Biology and Environment
Protection, Banacha 12/16, 90-237 Lodz, Poland
M. Kloss
Centre for Ecological Research, Polish Academy of
Sciences, Dziekanow Lesny, 05-092 Łomianki, Poland
S. _Zurek
Department of Quaternary Studies and Nature
Conservation, University of Humanistic and Nature
Science of Kielce, Institute of Geography, Swietokrzyska
15, 25-406 Kielce, Poland
J. Pawlyta
Department of Radioisotopes, Silesian University
of Technology, Krzywoustego 2, 44-100 Gliwice, Poland
123
Hydrobiologia (2009) 631:213–230
DOI 10.1007/s10750-009-9812-y

from the exposed soils caused the eutrophication of
the mire. Furthermore, chironomids and testate
amoebae reveal the beginning of a wet shift ca. AD
1350. Openness considerably increased in the Late
Medieval and the Modern Periods. The highest water
table during the last 1,000 years was recorded
between AD 1500 and 1800. This wet event is
connected with deforestation, but it could be also
associated with the Little Ice Age. Our study shows
plant succession in the _Zabieniec peatland, which can
be explained with the recent landscape transforma-
tion. However, such changes are also possibly linked
with the major climatic episodes during the last two
millennia, such as the Medieval Warm Period and the
Little Ice Age.
Keywords Central Poland � Kettle hole � Testate
amoebae � Pollen � Macrofossils � Human impact �Climate � Environmental archaeology
Introduction
Peatlands are very sensitive to climate change and
human impact (Blackford, 1993; Charman, 2002;
Rydin & Jeglum, 2006). They record the hydrological
and trophic variations within the peatland ecosystem
as well as changes in the catchment area (Bragg,
2002). Many records from peat archives have proven
to be useful for reconstructing the climatic changes
(Schoning et al., 2005; Booth et al., 2006; Oksanen &
Valiranta, 2006; Chambers et al., 2007; Charman &
Blundell, 2007). However, other studies have con-
centrated mainly on the signal of human impact
(Warner et al., 1989; Chambers & Charman, 2004;
Lamentowicz et al., 2007; Amesbury et al., 2008).
Wetland ecosystems function under various kinds
of anthropogenic stress. Their present state is a result
of a long history of changes. Disturbance was
gradually increasing along with economic develop-
ment in central Poland during the last 2,000 years.
This period was also very important because of the
phases of considerable climatic changes such as the
Medieval Warm Period and Little Ice Age. Recovery
of a disturbed peatland ecosystem is often not
possible after it has passed a critical threshold.
Therefore, it is important to assess the present
condition and naturalness of peatlands. Moreover,
the importance of human influence and climate
should be estimated to understand the state of a mire
ecosystem and the methods available for active
nature conservation (Willis et al., 2007).
One of the major aims of late Quaternary palae-
oecology is to answer the question: what is the
proportion of the climatic to anthropogenic signal
revealed in proxies? Late Holocene deposits are
particularly challenging for palaeoclimatic inferences
(Yeloff et al., 2007; van der Linden et al., 2008).
Human activity not only transformed the forest
vegetation in many parts of the world but also
triggered indirect physical and chemical changes in
peatlands. Since the Early Medieval period, the
vegetation of European forests was considerably
transformed (Ralska-Jasiewiczowa & Latałowa,
1996; Williams, 2000; Ralska-Jasiewiczowa et al.,
2004). Deforestations that progressed since the
Medieval Age caused increased run-off and abrupt
hydrological fluctuations. Furthermore, most of the
European peatlands were drained (Joosten & Clarke,
2002), which disturbed or eliminated the climatic
signal from the peat archive. Consequently, multi-
disciplinary studies made at many sites are necessary
to reconstruct spatially past environmental changes.
Recently, most palaeoenvironmental peatland
studies have focused on ombrotrophic mires (Yeloff
& Mauquoy, 2006; Hughes et al., 2007; Sillasoo
et al., 2007; Blundell et al., 2008), and a minority has
been carried out in fens and kettle-hole mires
(Lagerback & Robertsson, 1988; Warner, 1993; Yu,
2006; Lamentowicz et al., 2008b), which can also
provide interesting palaeoenvironmental data.
A typical feature of a kettle-hole peatland is the
presence of a telmatic fen–bog transition in the
stratigraphic sequence. The autogenic terrestrializa-
tion makes the reconstruction of a palaeoclimatic
signal very difficult, although it is not impossible to
detect it in subsequent stages of growth. _Zabieniec in
Central Poland is an example of a peatland where
Sphagnum appeared and dominated in the following
successive hydroseral stages. This may result from a
natural trajectory to acidification (Hughes & Barber,
2004) or even land-use change in the surroundings
(Lamentowicz et al., 2007). Multiproxy palaeoenvi-
ronmental studies from peatlands with relation to
historical and archaeological sources are not common
in this part of Europe. They are particularly rare in
the central part of our country, located in periglacial
214 Hydrobiologia (2009) 631:213–230
123

conditions during the last Ice Age. This is because
most wetlands are concentrated within the former
range of the last Vistulian (=Weichselian) Glaciation
in the northern half of Poland, where a majority of
studies were carried out.
The _Zabieniec kettle hole is the first peatland in
Poland and this part of Europe analyzed with four
biotic proxies (plant macrofossils, pollen, chironomids
and testate amoebae), which we compare with archae-
ological records in this study. Results of Cladocera and
analyses of diatoms are currently being prepared for
future publication. We focused mainly on the period of
the last 2,000 years to track the increasing human
disturbance that should have been recorded in the
peatland. It was assumed that the most important
hydrological and trophic change in the studied mire
was initiated along with the beginning of the defores-
tation in the mire catchment in the Medieval Period.
For this reason, the aims of our study were (a) to
describe the development history of the mire during the
last 2,000 years, (b) to date and reconstruct the
anthropogenic land-use change and (c) to discuss a
possible climatic signal in the analyzed peat archive.
Study site
The _Zabieniec mire is situated in Central Poland,
25 km east of Łodz, in an area of morainic upland
(Fig. 1). The mire is located in a closed oval basin,
which is 1.5-km long, in a watershed between the
rivers Mro _zyca (to the west) and Mroga (to the east).
This basin was formed during the ice melting of the
Warta Glacier as a melt-out depression with a highly
varied bottom configuration. _Zabieniec is situated in
the central part of this glacial depression. The mire
area is ca. 2.5 ha. Peat and lake sediments were
deposited within this depression probably from the
end of the Warta (=Saalian) Glaciation until the upper
Plenivistulian (=late Weichselian). Biogenic deposits
of the Late Vistulian and Holocene were formed only
in the deepest part of the depression, i.e. in the_Zabieniec mire basin.
A B
C
D
Fig. 1 Setting of the study site at the background of A Europe, B Poland, C central Poland and D map showing archaeological sites
around the peatland
Hydrobiologia (2009) 631:213–230 215
123

Climate in this region of Poland is rather conti-
nental and drier than in the northern part of the
country, which is more influenced by the wet air
masses from the Baltic and northern Atlantic.
According to the climatic typology of Poland, this
area has a transitional climate (Wos, 1999).
The average annual temperature in 1931–1989 was
7.7�C, while the mean of the warmest month (July)
was 18�C and that of the coldest month (January) was
-3.3�C. However, these annual and monthly tem-
peratures are highly variable, which is probably
caused by the influence of oceanic and continental
climate. Average annual precipitation in 1951–1989
was 590 mm, but in this case also, a high variability
(ca. 30%) was observed (Kłysik, 2001).
Methods
Fieldwork
One core (Z-2) was sampled from the central part of
the mire (Fig. 2). In addition, a 60-cm peat monolith
was extracted for the study of the last millennium. The
main core was taken with a piston corer. Furthermore,
a geological survey of the mire was done with a
Russian sampler (diameter—50 mm). Samples for
phosphorus analyses were collected by geological
drilling at depths of ca. 90–100 cm. Distance between
drillings was 50–100 m. One hundred samples were
collected for the analysis. Phosphorus analysis was
realized according to the methodology described by
Eidt (1973) and Arrhennius (1950).
Laboratory
An age-depth model for the peat profile was con-
structed by radiocarbon dating of the organic material
(Table 1). Samples prefixed with ‘Poz’ in the labora-
tory code were dated with accelerator mass spectrom-
etry (AMS), whereas all the other samples were dated
with radiometric methods. All the AMS dates were
obtained on the basis of several Sphagnum stems
carefully selected for radiocarbon dating, avoiding
any rootlets and other contamination (Table 1). All
the other dates were obtained on the basis of bulk
Z2
Samplingsite
Fig. 2 Geological profile (WE) of the _Zabieniec peatland.
Warta Glaciation (=Saalian): 1—glacial till, 2—fluvioglacial
sand and gravel, and 3—mineral silt; Eem Interglacial: 4—
organic silt; Vistulian (=Weichselian): 5—mineral-organic silt
with fine sand, 6—organic-mineral silt, 7—sand, 8—mineral
and organic silt, 9—gyttja with silt, 10—detritus-clay gyttja;
Holocene: 11—fine detritus gyttja, 12—coarse detritus gyttja,
13—brown-moss peat, 14—sedge-moss peat, 15—Sphagnumpeat, 16—sedge-moss peat, 17—Sphagnum cuspidatum peat,
18—sedge-moss peat and brown moss peat, 19—organic-
mineral silt with detritus, 20—silt, 21—deposits disturbed by
exploitation
216 Hydrobiologia (2009) 631:213–230
123
organic matter of peat. Both AMS and radiometric
methods used the standard alkali–acid–alkali pre-
treatment procedure. Sample pre-treatment, graphite
target preparation and 14C concentration measure-
ments for ‘Poz’ samples were done in the AMS
facility of the Poznan Radiocarbon Laboratory.
Radiometric dating for ‘Lod’ prefixed samples were
done in the Łodz Radiocarbon Laboratory.
For the analysis of testate amoebae, 4-cm3 samples
were taken in 2.5-cm intervals for the upper 60 cm
and in 5-cm intervals for the section of 60–125 cm.
Samples were prepared according to the sieving and
back-sieving procedure described by Hendon and
Charman (1997). Testate amoebae were identified
and counted to a total of 150 individuals per sample,
at a magnification of 200–4009. Their identification
was based on the available literature (Grospietsch,
1958; Ogden & Hedley, 1980; Charman et al., 2000;
Clarke, 2003; Mitchell, 2003).
For pollen analysis, 2-cm3 samples were taken in
5-cm intervals and treated with 10% KOH and then
acetolyzed for 3 min (Berglund & Ralska-Jasiewicz-
owa, 1986; Faegri & Iversen, 1989). Minerogenic
matter was removed with hydrofluoric acid. In
general, a minimum of 500 pollen grains of trees
and shrubs (arboreal pollen = AP) was counted in
each sample, but in samples where their frequency
was very low, all the pollen grains from the two slides
22 9 22 mm2 were identified. The sum of arboreal
and non-arboreal pollen was the basis of percentage
calculation (AP ? NAP = 100%).
The material for plant macrofossil analysis was
composed of samples taken in 10-cm intervals, and the
sample volume was 20 cm3. The material was rinsed
with water onto sieves with mesh sizes of 0.25 and
0.5 mm. The residue was identified under a stereo-
scopic microscope at a magnification of 10–1009. One
slide from each sample was examined under a micro-
scope at 200–4009 to determine the peat composition.
Macrofossils were identified with the use of available
guides (e.g. Katz et al., 1965, 1977; Berggren, 1968;
Tobolski, 2000; Mauquoy & van Geel, 2007).
Chironomid fossil analysis was performed accord-
ing to the methods described by Brooks et al. (2007)
using a 63-lm mesh size sieve. In samples where a
small number of head capsules were present, kero-
sene floatation on a bigger volume of sediment (up to
80 cm3) was used for the extraction of chironomid
subfossils (Rolland & Larocque, 2007). Head cap-
sules were identified by using mainly the taxonomic
keys by Wiederholm (1983), Klink & Moller Pillot
(2003) and Brooks et al. (2007). Water quality
classification based on the proportions of tolerant
and intolerant taxa follows Wilson and Ruse (2005).
Table 1 Results of
radiocarbon datingSample name Depth (cm) 14C age (BP) Calibrated age (95.40% probability)
Poz-19019 45 645 ± 50 1276 AD (95.4%) 1405 AD
Poz-17117 60 1085 ± 30 894 AD (95.4%) 1016 AD
Poz-17116 120 1475 ± 35 535 AD (95.4%) 652 AD
Lod-1391 305 3010 ± 50 1410 BC (95.4%) 1114 BC
Lod-1390 375 3690 ± 50 2271 BC (0.8%) 2259 BC
2206 BC (94.6%) 1937 BC
Poz-23658 436 4580 ± 35 3499 BC (18.2%) 3436 BC
3379 BC (42.8%) 3318 BC
3292 BC (0.2%) 3290 BC
3274 BC (0.5%) 3268 BC
3236 BC (33.8%) 3108 BC
Poz-23638 531 6270 ± 40 5325 BC (86.4%) 5204 BC
5168 BC (9.0%) 5076 BC
Poz-23639 826 9130 ± 50 8530 BC (1.2%) 8519 BC
8474 BC (94.2%) 8255 BC
Poz-23640 1,036 11,860 ± 60 11921 BC (95.4%) 11609 BC
Poz-23659 1,290 14,120 ± 70 15286 BC (95.4%) 14450 BC
Hydrobiologia (2009) 631:213–230 217
123
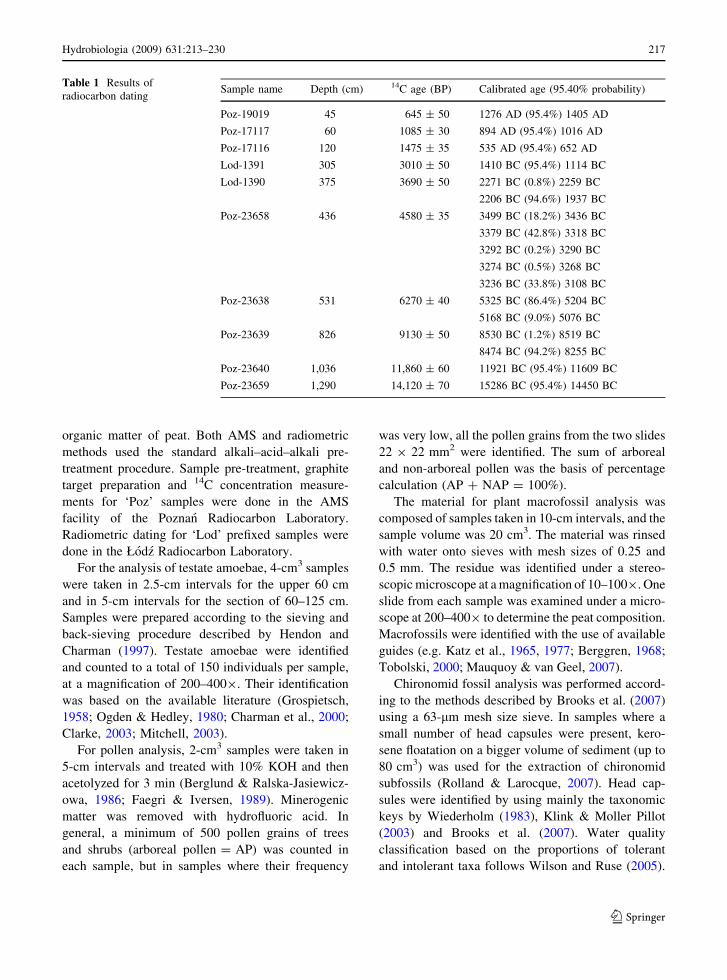
Numerical analyses and graphical presentation
Conventional radiocarbon dates were calibrated by
using OxCal 4.05 (Bronk Ramsey, 2001) and the
IntCal04 calibration curve (Reimer et al., 2004).
Five-year smoothing was chosen for the calibration.
Probability distributions for 10 calibrated dates were
used for the estimation of an age-depth model. In
addition, the calendar year 2006 was attributed to the
top of the core. The age-depth model was built by
using the P_Sequence deposition model procedure of
OxCal 4.05 (Bronk Ramsey, 2008). Parameter k of
the P_Sequence function was set to 0.1, and the
interpolation parameter was set to 2. The resulting
expected values modelled for each dated depth were
then interpolated by the Akima spline algorithm
(Akima, 1970) to give the date for each centimetre of
depth (Fig. 3). In addition, normalized probability
distributions for each calibrated radiocarbon date
used for age-depth modelling are also presented in
Fig. 3. The grey shaded area in Fig. 3 represents the
68% probability range of the model.
For the summary diagram, general zones were
delimited mainly on the basis of archaeological
-16000 -14000 -12000 -10000 -8000 -6000 -4000 -2000 1BC/1AD 2000
Modelled calendar year (BC/AD)
0
200
400
600
800
1000
1200
Dep
th (
cm)
1 200 400 600 800 1000 1200 1400 1600 1800 2000
Modelled calendar year (AD)
0
20
40
60
80
100
120
140
160
180
200
Dep
th (
cm)
A
B
Fig. 3 Age-depth model,
(A) entire profile, (B) last
2,000 years
218 Hydrobiologia (2009) 631:213–230
123

periods (Kaczanowski & Kozłowski, 1998), but an
additional zone Z6 was created because of a signif-
icant, abrupt change in all proxies.
In order to reconstruct quantitatively the water
table and pH in the mire, we applied a training set
consisting of 123 surface samples taken from natural
Sphagnum mires in Pomerania (Lamentowicz &
Mitchell, 2005; Lamentowicz et al., 2008b), western
Poland (Lamentowicz et al., 2008a) as well as in_Zabieniec in 2005. In the publications mentioned
above, the performance of four models was tested:
partial least squares (PLS), weighted averaging
(WA), tolerance down-weighted weighted averaging
(WAtol) and weighted averaging partial least squares
(WA-PLS), by using the program C2 (Juggins, 2003).
The root mean square error of prediction (RMSEP)
was calculated by using the jackknifing cross-valida-
tion procedure (Crowley, 1992). For depth to the
water table (DWT) (range of modern samples
min = -3 cm; max = 70 cm, SD = 14 cm), the
model with the lowest RMSEP was WAtol, with a
maximum prediction bias of 8.9 cm and a jacknived
root mean square error of prediction (RMSEP(jack))
of 4.3 cm. For pH, the model with the lowest RMSEP
was WA-PLS (range of modern samples min = 3.14;
max = 7.27, SD = 1.11), the maximum bias of the
prediction was 0.5 pH units and the RMSEP(jack)
was 0.41 pH units (Lamentowicz et al., 2008b;
Lamentowicz & Mitchell, 2005). Reconstruction of
the general trophic status of the peatland was based
on the quantitative pH reconstruction as well as
qualitative attributes of testate amoebae and plant
macrofossils data.
Results
Chronology and peat accumulation rates
The age-depth model presented in Fig. 3 shows that
accumulation rate throughout the history of the peat
bog was approximately constant. The average accu-
mulation rate calculated by linear approximation of
the age-depth model curve is about 0.74 mm/year.
However, some small variations of accumulation rate
can be observed. Small decreases in the accumulation
rate during 12000–7000 BC and 5000–2000 BC as
well as a small increase during 8000–5000 BC are
apparent.
Biological records
Proxies analyzed in this study allowed reconstructing
the history of the peatland and its surroundings,
spanning the last two millennia. Initially, we devel-
oped a zonation for each proxy. However, because
zones for the particular proxies did not remain in
agreement, we presented the development history in
the context of human impact, which is a useful
criterion from the point of view of the aim of this
study. Low agreement between zonations might be
caused by different resolution of sampling, especially
in the case of pollen analysis.
Detailed diagrams of each proxy are presented in
separate figures for plant macrofossils (Fig. 4), pollen
(Fig. 5), chironomids (Fig. 6) and testate amoebae
(Fig. 7).
A summary diagram with a short interpretation is
presented in Fig. 8. The development history of the_Zabieniec mire was divided into six stages (Z1–Z6)
according to the archaeological periods.
History of the _Zabieniec peatland
Roman Period, ca. 0 BC–AD 375 (Z1)
(Figs. 4, 5, 6, 7)
During this period, the _Zabieniec peatland was a
mesotrophic–telmatic habitat with shallow water, as
indicated by brown mosses, Scheuchzeria palustris,
Carex spp., and remains of Pediastrum and Botryo-
coccus (Fig. 4–5). Between AD 100 and AD 200,
Sphagnum spp. of the section Sphagnum became
more abundant, whereas Scheuchzeria palustris and
Cyperaceae declined, which suggests a temporal
acidification (van Breemen, 1995; Tallis, 1983). At
about AD 400, the peatland became mesotrophic
again, which was probably connected with a rise in
the water table. All proxies show relatively stable
hydrological conditions. Testate amoebae were
absent. Human impact was insignificant, but infre-
quent pollen of Rumex acetosa, Plantago lanceolata
and cereals (including Secale) shows human presence
(Behre, 1981) in more distant areas.
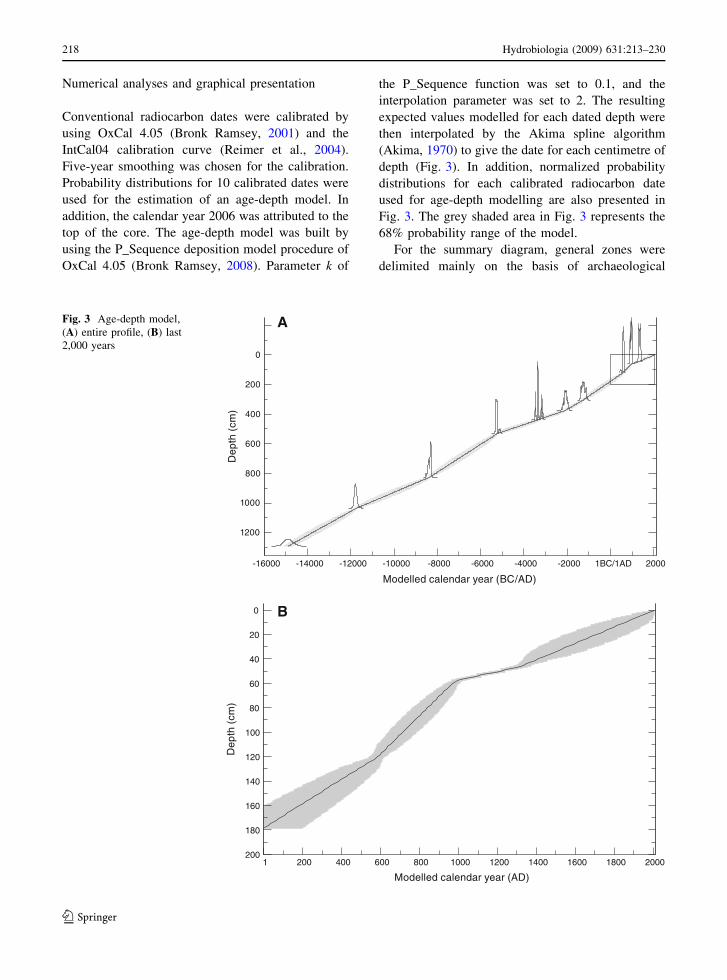
Chironomid analysis indicates that _Zabieniec in
the Roman Period was a mire with a shallow water
body overgrown with macrophytes. The dominant
species was Paratendipes nudisquama. Paratendipes
larvae often occur in small standing water bodies like
Hydrobiologia (2009) 631:213–230 219
123

ponds and bogs (Wiederholm, 1983). Chironomid
communities were relatively rich in taxa, with high
dominance of macrophyte-related taxa characteristic
of small acid water bodies with dense vegetation such
as Monopelopia tenuicalcar and Lauterborniella
agrayloides (ecological preferences after Klink &
Moller Pillot (2003) and Vallenduuk & Moller Pillot
(2007)).
Migration period, ca. AD 375–568 (Z2)
(Figs. 4, 5, 6, 7)
This stage was characterized by indicators of wet and
mesotrophic habitats. Scheuchzeria palustris and
Carex spp. dominated among vascular plants. Pedia-
strum and Botryococcus increased, representing open
water surface. There was no decline in AP. During this
Sphag
num
mag
ellan
icum
20
Sphag
num
palu
stre
20 40 60
Sphag
num
sec.
Sphag
num
20
Sphag
num
falla
x
Sphag
num
cusp
idatu
m
Sphag
num
obt
usum
Sphag
num
sec.
Cuspid
ata
Sphag
num
sec.
Acutifo
lia
+
+ +
+
+
+ +
+++
++++
++++
+
+
+ +
++
+ +
++
+
+ +
+
++++
+
+
+
20
Sphag
num
subs
ecun
dum
Oxyco
ccus
palu
stris
Ledu
m p
alustr
e
Andro
med
a po
lifolia
Ericac
eae
Erioph
orum
vagin
atum
Erioph
orum
ang
ustifo
lium
Carex
limos
a
20
Carex
lasio
carp
a
Carex
cane
scen
s
20 40
Carex
nigr
a
Carex
dian
dra
20
Carex
rostr
ata
20
Carex
elat
a
Carex
sp.
20
Scheu
chze
ria p
alustr
is
Men
yant
hes t
rifoli
ata
++
+
+
+
+
+
+ +
+ ++
++
+
+
+
+
+++
+ ++
+
+
++++
+
++ + +
+
+
++
+
+
+
Drepa
nocla
dus i
nter
med
ius
Drepa
nocla
dus a
dunc
us
Drepa
nocla
dus s
p.
Stram
inerg
on st
ram
ineum
Callier
gone
lla cu
spida
ta
Mee
sia lo
ngise
ta
Brach
ythec
ium sp
.
+
+
+
+
++
+
+
++
Bryop
sida
+
+
+
+
+
Polypo
diales
Equise
tum
fluvia
tile
Junc
us e
ffusu
s
Pinus s
ylves
tris
Betula
pub
esce
ns
Salix s
p.
Uniden
tified
Org
anic
Mat
ter
+ + ++
+
+
+ +
+++
++++
+
Analyst: M. Kloss
% plant macrofossils diagram
0 100 200 300 400 500 600 700 800 900 1000 1100 1200 1300 1400 1500 1600 1700 1800 1900 2000
40
80
120
160
Depth
(cm
)
AD
20
60
100
140
%+
Z1
Z2
Z3
Z4
Z5
ZONES
Z6
Fig. 4 Percentage plant macrofossil diagram. Zonation based on archaeological periods
20 40 60 80 100
AP NAP
Poa
ceae
Pin
usB
etul
a
20 40
Alnus
SalixCor
ylus
20
Querc
us
Tilia Ulmus
Fraxin
us
Viburn
um o
pulus
20
Carpin
us
Fagus
Picea
abies
AbiesCall
una
vulga
ris
Ledu
m
Vaccin
ium
Pterid
ium
Herba
ceou
s plan
ts of
wet
hab
itats
Herba
ceou
s plan
ts of
dry
hab
itats
Herba
ceou
s plan
ts of
fres
h an
d m
oist h
abita
ts
Rumex
ace
tosa
Planta
go la
nceo
lata
20
Anthr
opog
enic
indica
tors
with
out c
erea
ls
20
Cerea
ls
20 40
Cyper
acea
e
100 200 300
Sphag
num
Phrag
mite
s
Typha
ang
ust./
Sparg
anium
20
Typha
latifo
lia
100 200 300 400
Wet
land
plant
s
Pedias
trum
sum
Botry
ococ
cus s
um
Various Local aquatic and mire plantsAnth. Ind.Trees and shrubs
% pollen diagramAnalyst: Zofia Balwierz
0
100
200
300
400
500
600
700
800
900
1000
1100
1200
1300
1400
1500
1600
1700
1800
1900
2000
40
80
120
160
Depth
(cm
)
AD
20
60
100
140
Z1
Z2
Z3
Z4
Z5
Z6
ZONES
Fig. 5 Percentage pollen diagram. Zonation based on archaeological periods
220 Hydrobiologia (2009) 631:213–230
123
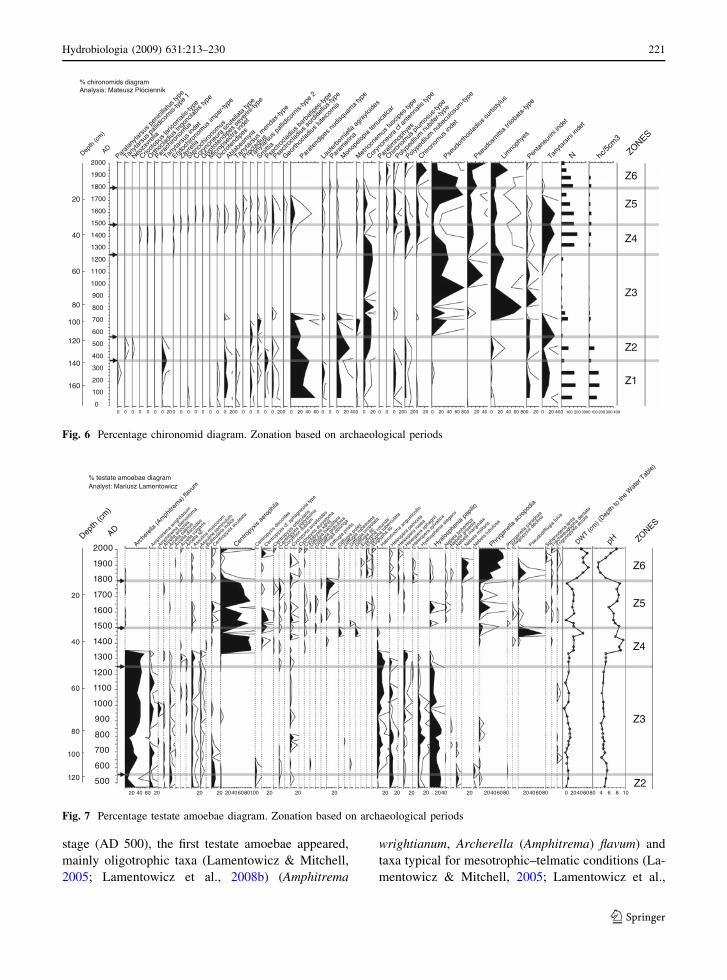
stage (AD 500), the first testate amoebae appeared,
mainly oligotrophic taxa (Lamentowicz & Mitchell,
2005; Lamentowicz et al., 2008b) (Amphitrema
wrightianum, Archerella (Amphitrema) flavum) and
taxa typical for mesotrophic–telmatic conditions (La-
mentowicz & Mitchell, 2005; Lamentowicz et al.,
0
Parat
anyta
rsus
pen
icilla
tus t
ype
0
Tanyta
rsus
pall
idico
rnis-
type
1
0
Neoza
vreli
a
0
Cricot
opus
laric
omali
s-typ
e
Orthoc
ladius
trigo
nolab
is typ
e
0 0
Parac
hiron
omus
0 20
Tanyta
rsus
inde
t
0
Endoc
hiron
omus
impa
r-typ
e
0
Zavre
lia
0
Steno
chiro
nom
us
0
Coryn
oneu
ra sc
utell
ata
type
0
Glypto
tend
ipes s
ever
ini-ty
pe
0
Micr
opse
ctra
indet
0
Dicrot
endip
es
0 20
Ablabe
smyia
0
Tanyta
rsus
men
dax-
type
0
Procla
dius
0
Tanyta
rsus
pall
idico
rnis-
type
2
0
Smitti
a
0
Psectr
oclad
ius b
arba
tipes
-type
0 20
Psectr
oclad
ius so
rdide
llus-
type
0
Georth
oclad
ius lu
teico
rnis
0 20 40 60
Parat
endip
es n
udisq
uam
a typ
e
0
Laut
erbo
rniel
la ag
raylo
ides
0
Param
erina
0 20 40
Mon
opelo
pia te
nuica
lcar
0
Met
riocn
emus
fusc
ipes t
ype
0 20
Coryn
oneu
ra cf
ant
enna
lis ty
pe
0
Parali
mno
phye
s
0
Chiron
omus
plum
osus
-type
0 20
Polype
dilum
nub
ifer-t
ype
0 20
Polype
dilum
nub
eculo
sum
-type
0 20
Chiron
omus
inde
t
0 20 40 60 80
Pseud
orth
oclad
ius cu
rtisty
lus
0 20 40
Pseud
osm
ittia
trilob
ata-
type
0 20 40 60 80
Limno
phye
s
0 20
Penta
neur
ini in
det
0 20 40
Tanyta
rsini
inde
t
0 100 200 300
N
0 100 200 300 400
hc/5
cm3
% chironomids diagramAnalysis: Mateusz Płóciennik
0
100
200
300
400
500
600
700
800
900
1000
1100
1200
1300
1400
1500
1600
1700
1800
1900
2000
40
80
120
160
Depth
(cm
)
AD
20
60
100
140
Z1
Z2
Z3
Z4
Z5
Z6
ZONES
Fig. 6 Percentage chironomid diagram. Zonation based on archaeological periods
20 40 60
Arche
rella
(Am
phitr
ema)
flavu
m
20
Amph
itrem
a wrig
htian
um
Amph
itrem
a ste
nosto
ma
Arcell
a ar
tocr
ea
Arcell
a ca
tinus
Arcell
a dis
coide
s
Arcell
a vu
lgaris
Arcell
a sp
.
20
Assuli
na m
usco
rum
Assuli
ne se
minu
lum
Bullinu
laria
indica
20
Centro
pyxis
acu
leata
20406080100
Centro
pyxis
aer
ophil
a
Centro
pyxis
disc
oides
20
Centro
pyxis
cf. s
phag
nicola
type
Centro
pyxis
orb
icular
is
Centro
pyxis
plat
ysto
ma
Coryth
ion d
ubium
20
Cyclop
yxis
arce
lloide
s
Cyclop
yxis
eury
stom
a
Cyclop
yxis
kahli
i
Difflug
ia ba
ccilif
era
Difflug
ia glo
bulos
a
Difflug
ia ob
longa
20
Difflug
ia pr
istis
Difflug
ia pu
lex
Difflug
ia ru
besc
ens
Difflug
ia ur
ceola
ta
Difflug
ia sp
.
Euglyp
ha ro
tund
a
Euglyp
ha tu
berc
ulata
Euglyp
ha sp
.
20
Habro
troch
a an
gusti
collis
20
Heleop
era
petri
cola
Heleop
era
rose
a
20
Heleop
era
spha
gnii
Heleop
era
sylva
tica
20
Hyalos
phen
ia ele
gans
2040
Hyalos
phen
ia pa
pilio
Nebela
boh
emica
Nebela
gris
eola
Nebela
mar
ginat
a
20
Nebela
milit
aris
Nebela
tubu
losa
20406080
Phryg
anell
a ac
ropo
dia
Phryg
anell
a pa
rado
xa
Plagiop
yxis
decli
vis
20406080
Pseud
odiffl
ugia
fulva
Sphen
oder
ia len
ta
Trach
eleug
lypha
den
tata
Trigon
opyx
is ar
cula
0 20406080
DWT (c
m) (
Depth
to th
e W
ater
Tab
le)
4 6 8 10
pH
% testate amoebae diagramAnalyst: Mariusz Lamentowicz
500
600
700
800
900
1000
1100
1200
1300
1400
1500
1600
1700
1800
1900
2000
40
80
120
Depth
(cm
)
AD
20
60
100
Z2
Z3
Z4
Z5
Z6
ZONES
Fig. 7 Percentage testate amoebae diagram. Zonation based on archaeological periods
Hydrobiologia (2009) 631:213–230 221
123
2008b) (such as Centropyxis aculeata and C. disco-
ides). Testate amoebae appeared abruptly, which
suggests their rapid establishment. Their presence
was connected with an increasing abundance of
Sphagnum. The resolution of plant macrofossil anal-
ysis does not make it possible to determine the exact
date of Sphagnum expansion, but remains of testate
amoebae reveal that it was not a gradual process.
The composition of chironomid assemblages
changed and diversity decreased, which indicates a
shift in the ecosystem. The terrestrial Smittia appeared
(Brooks et al., 2007), the domination of Paratendipes
nudisquama decreased, while shares of some acido-
philic taxa—Monopelopia tenuicalcar, Limnophyes—
briefly increased. Furthermore, Corynoneura cf. an-
tennalis increased; this species is usually associated
with streams but frequent also in acidic waters (Klink
& Moller Pillot, 2003). Larvae in this morphotype
in _Zabieniec seem to be associated with acidic
conditions.
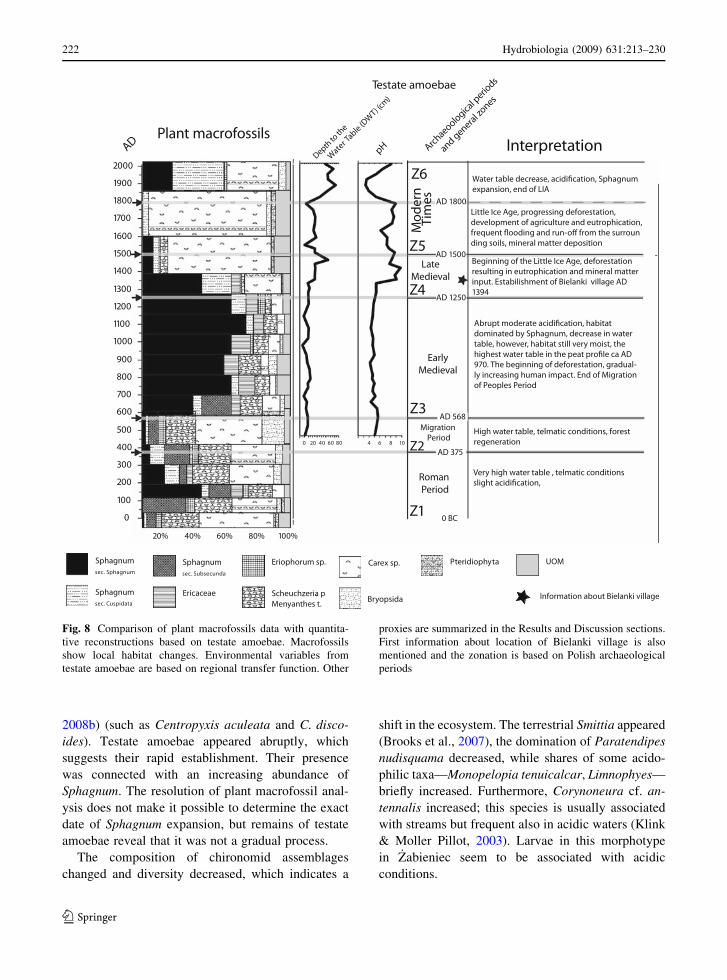
Fig. 8 Comparison of plant macrofossils data with quantita-
tive reconstructions based on testate amoebae. Macrofossils
show local habitat changes. Environmental variables from
testate amoebae are based on regional transfer function. Other
proxies are summarized in the Results and Discussion sections.
First information about location of Bielanki village is also
mentioned and the zonation is based on Polish archaeological
periods
222 Hydrobiologia (2009) 631:213–230
123

Early Medieval Period, ca. AD 568–1250 (Z3)
(Figs. 4, 5, 6, 7)
From ca. AD 600, oligotrophic Sphagnum peatland
developed. This is roughly concurrent with the end
of the Migration Period. However, during the entire
Early Medieval Period, anthropogenic pollen indi-
cators were low, but gradually increasing. There
were no direct changes in the peatland surround-
ings, but distant transport of some pollen taxa
(Rumex acetosa, Plantago lanceolata and cereals)
represents the Early Medieval economy. Between
AD 700 and AD 850, Carpinus forest regenerated.
Carpinus shows a constant decline since AD 850,
along with an increase in pollen indicators of
human activity. Furthermore, the proportion of
NAP gradually increased, representing landscape
openness. The testate amoebae assemblage was
composed mainly of species characteristic for the
moist Sphagnum lawn (Lamentowicz & Mitchell,
2005; Lamentowicz et al., 2008b), e.g. Amphitrema
flavum and Hyalosphenia papilio; however, an
important moisture indicator Amphitrema wrightia-
num (Charman et al., 2000; Lamentowicz &
Mitchell, 2005; Lamentowicz et al., 2008b) shows
wetter episodes during ca. AD 690, ca. AD 1000
and ca. AD 1150. Reconstructed values of depth to
the water table fluctuate between 0 and 20 cm.
Average pH was around 4.5. These stable hydro-
logical conditions in the peatland were maintained
until ca. AD 1350.
From ca. AD 750 to ca. AD 1250, only four
chironomid taxa were present. The abundance of
larve was low from ca. AD 750 to ca. AD 1200,
which may indicate water table decrease and
Sphagnum expansion. A rapid decline and disap-
pearance of nearly all shallow-water taxa (including
Paratendipes nudisquama) up to AD 750 and their
replacement by semiterrestrial ones tolerant to low
pH such as Pseudorthocladius curtistylus and
Limnophyes (Klink & Moller Pillot, 2003; Brooks
et al., 2007), may indicate semiterrestrial conditions
and coincide with those having a pH below 5.0 as
inferred by testate amoebae (Fig. 8). Only the
percentage of Corynoneura cf. antennalis increased.
This species is not a terrestrial one (Klink &
Moller Pillot, 2003) which suggests the presence of
at least temporally open water table on the mire
surface.
Late Medieval Period, AD 1250–1500 (Z4)
(Figs. 4, 5, 6, 7)
Historically, year ca. AD 1250 marks the end of the
Early Medieval Period, but the most important
transition in the peatland record is dated to ca. AD
1350. Up to this date, conditions were relatively
stable, with rapid peat accumulation by Sphagnum.
The beginning of the Late Medieval Period is marked
by ca. AD 1250, and the probable deforestation in the
immediate vicinity of the _Zabieniec mire is marked
by ca. AD 1350, which might have triggered a change
in the _Zabieniec peatland vegetation and peat com-
position. The closeness of the deforestation can be
estimated indirectly by testate amoebae and chiron-
omids, as the pollen record possesses a lower
sampling resolution. Peat-forming vegetation became
dominated by Cyperaceae, indicating habitat eutro-
phication (Fig. 8). The curve of depth to the water
table shows a decrease in the water table, with the
lowest value ca. AD 1450, but pH increased to
unusual value ([9). This very high pH value is hard
to explain; it may be caused by the co-occurrence of
minerotrophic indicators in fossil testate amoebae
data. However, it reveals the instability of the
peatland ecosystem, caused by change in the sur-
roundings. Pollen data show an increase in human
impact and NAP percentage, and a decline in pollen
of all trees. Furthermore, an increase of anthropo-
genic indicators is apparent, e.g. of cereals, Rumex
acetosa and Plantago lanceolata. Remains of Bot-
ryococcus represent increased wetness. However, this
peak is visible in only one sample. This wet shift is
also reflected in the pH curve, representing eutrophi-
cation. Testate amoebae show a dramatic change in
the community composition. Centropyxis aerophila
reached abundances over 90% from ca. AD 1350
when the peat consisted of mineral matter, whereas
before ca. AD 1350, nearly no mineral particles were
recorded in the peat. Most testate amoebae occurring
during this phase represent the genera Centropyxis,
Cyclopyxis and Difflugia. At about AD 1400, the
highest value of pH was recorded. The presence of
Phryganella acropodia indicates short dry shifts
(Mitchell et al. 2001).
Non-biting midges also revealed a sudden shift in
the mire in the Late Medieval Period, associated with
human influence on the bog. Human impact increased
the abundance and diversity of chironomid
Hydrobiologia (2009) 631:213–230 223
123
communities, with the maximum ca. AD 1510. Most
of the 31 taxa from the Late Medieval Period were
represented also in the Roman Period and during the
Migration Period. The factors that seemed to have
determined the composition of assemblages in this
period were pH and moderate eutrophication. Also, the
water level was higher than that in the Early Medieval
Period, which was crucial for the existence of rich
assemblages of littoral species and decreased the
dominance of terrestrial ones. While semiterrestrial
taxa typical for acidified habitats (e.g. Pseudorthocla-
dius curtistylus) and Corynoneura cf. antennalis were
less abundant, others considered as eurytopic, occur-
ring in neutral waters (Klink & Moller Pillot, 2003;
Brooks et al., 2007) (Psectrocladius sordidellus-type,
Dicrotendipes, Polypedilum nubeculosum-type) were
more abundant. Lower percentage of intolerant taxa
(following the classification in Wilson & Ruse, 2005)
than that in the Roman Period indicates higher trophy
coinciding with higher pH inferred from testate
amoebae.
Modern period, ca. AD 1500–1800 (Z5)
(Figs. 4, 5, 6, 7)
During this phase, the decline in NAP and the
increase in anthropogenic indicators continued. Local
vegetation remained dominated by Cyperaceae, with
an even lower percentage of Sphagnum. Cereals
reached over 30% of the total pollen during ca. AD
1750, and such high percentages should be inter-
preted as indicating the cultivation in the direct
surroundings of the peatland. The landscape became
more and more open, as all tree taxa declined in
abundance through the interval. Macrofossils and
pollen of wetland plants, including Botryococcus,
indicate shallow water conditions. Also, testate
amoebae reveal a high water table and high pH.
Centropyxis aerophila was accompanied by other
species present at lower abundance, e.g. Centropyxis
cf. sphagnicola type, C. platystoma, Cyclopyxis ar-
celloides and Phryganella acropodia.
Abundant chironomid assemblages existed to AD
1670, whereas later only 10 mainly acidophilic and
terrestrial ones remained. The percentage of Pseud-
orthocladius curtistylus sharply increased during ca.
AD 1700, indicating the return of the mire habitat to
conditions preceding human influence on the mire in
the Late Medieval Period.
Modern period, ca. AD 1800–2006 (Z6)
(Figs. 4, 5, 6, 7)
The last phase of _Zabieniec mire development is
characterized by the reappearance of Sphagnum,
afforestation and an abrupt increase in Alnus. Human
indicators and cereals slightly decreased. From ca.
AD 1800, a second complete transformation of the
habitat took place. Among testate amoebae, Phryga-
nella acropodia, which prefers dry conditions,
reached a very high percentage ([70%). This reflects
a decrease in the water table. Also, Nebela militaris, a
good dry indicator according to the existing transfer
function of Lamentowicz et al. (2008c), confirmed
this dry shift. Typha latifolia appeared during ca. AD
1900 in the peatland margins and has persisted there
up to the present days.
Chironomids reveal a similar successional shift
from the aquatic to terrestrial environment. Disap-
pearance of nearly all littoral taxa and the dominance
of Pseudorthocladius curtistylus, later also the ter-
restrial taxa Pseudosmittia trilobata-type and Limn-
ophyes (Klink & Moller Pillot, 2003), may indicate a
low water level and terrestrial character of the bog.
Polypedilum and Chironomus, which occur in sam-
ples from ca. AD 1890–2006, may indicate at least
temporary water pools on the mire in the last century
of the _Zabieniec history, as these taxa are eurytopic
and not terrestrial (Brooks et al., 2007). The number
of head capsules was at first higher than those in the
previous sections, but later it declined. Diversity of
the assemblages decreased to ca. AD 1890 as well,
and then slightly increased.
Archaeological data
In the immediate vicinity of the _Zabieniec mire, only
one archaeological site was discovered during an
archaeological surface survey (Fig. 1D). It is the site
Syberia Dolna no. 1, located ca. 350 m north of the
mire, on the surface of a western slope of a dry
valley. Results of an archaeological study in 2007 did
not confirm the occurrence of any relics at this site. In
the area of 150 km2, in the surroundings of the mire,
84 archaeological sites (with 119 archaeological
relics) have been registered. Half of them date to
the Late Medieval Period and Modern Period, and
only five to the Early Medieval Period (not earlier
than the eleventh century). In the group of 13
224 Hydrobiologia (2009) 631:213–230
123
prehistoric sites, five date to the Mesolithic, two to
the Mesolithic or the Neolithic, 13 to the Bronze Age,
seven to the Late Bronze Age/Early Iron Age, one to
the Early Iron Age (Hallstatt Period), one to the
Hallstatt Period/La Tene Period and 10 to the Roman
period. Most of these were documented by few
archaeological relics. The sites are located mainly in
or near valleys of the rivers Mroga and Mro _zyca.
Most of the sites are up to 5 km away from the mire
(AZP, unpublished data).
In the area of the _Zabieniec village and of the nearby
Bielanki village, we uncovered only few fragments of
pottery during an intensive surface survey, dated to the
Modern Period and probably to the Late Medieval. In
the same area, we recorded the highest quantity of
phosphorus in the ground, detected by a field method in
the surface layer (90–100-cm thick). Simultaneously,
in preliminary archaeological excavations, no evi-
dence of human activity was found. The oldest
historical sources were recorded in the close vicinity
of the _Zabieniec mire two villages, Kołacinek and
Bielanki. Both were noted in the Early Middle Ages—
Bielanki in 1394 (in Ksiegi Łeczyckie), and Kołacinek
in 1257 and 1334 as the Kuyavian Duke’s possessions.
In the sixteenth century, the former village existed
within the borders of the Brzeziny parish as Bylanowo
and in 1576 as Bilianovo (noblemen’s possessions). In
records from the nineteenth century, we can find the
name Bielanki. In the sixteenth century, Kołacinek was
found among noblemen’s possessions as well
(Zajaczkowski & Zajaczkowski, 1966).
The nineteenth century cartographic sources (i.e.
Gilly’s Map 1803 and the so-called Topographic Map
of the Polish Kingdom 1839) show continuous wood-
lands in the surroundings of _Zabieniec. In the late
nineteenth century (according to Gilly’s Map), we can
find open areas only in proximity to the rivers Mroga
and Mro _zyca, near the village Wola Cyrusowa (north
of _Zabieniec), and probably in the vicinity of Bielanki.
The _Zabieniec village was present in AD 1825. The
Topographic Map of the Polish Kingdom presents the
increasing deforestation in the first half of the
nineteenth century, in the surroundings of Bielanki as
well. The _Zabieniec mire was still forested at that time.
In the nineteenth century, in the area of the
Brzeziny district, most arable land was moderately
fertile, suitable for growing rye and potatoes. In this
region, the extensive woodlands were administered or
possessed by the state. In 1820–1853, the forest area
declined in this region by ca. 30%. In 1820, wood-
lands occupied 40% of the district area, and in 1853,
only 28% (Ohryzko-Włodarska, 1972).
Based on the results of former (AZP, unpublished
data) and our archaeological field research, we can
conclude that the human impact near the _Zabieniec
mire was insignificant almost until just prior to the
Modern Period. Only a few relics, which are uncov-
ered by archaeological research and dated to the Late
Medieval Period, have been discovered. Older settle-
ments occupied the areas close to the Mroga and
Mro _zyca river valleys.
Discussion
The multiproxy approach to the study of the _Zabie-
niec peat archive allowed us to look at many aspects
of the past change of the peatland and the surround-
ing landscape. This site may be regarded as an
important reference point for higher resolution stud-
ies. All proxies give a very clear and sharp signal of
abrupt changes in the peatland ecosystem and its
surroundings. Two main questions arose during the
investigation: (1) How and when did the anthropo-
genic land-use change affect the autogenic processes,
and (2) How did the climate modify human activities
and the natural signal provided by proxies?
Land-use change and autogenic processes
Our study shows that the direct human impact
appeared in the Late Medieval Period, although
settlements existed in the Bronze Age and the Iron
Age in the nearby river valleys of Mroga and
Mro _zyca. Only one archaeological site was discov-
ered in the immediate neighbourhood of the mire.
Despite the late human influences, the peatland
ecosystem completely changed since ca. AD 1350
together with the transformation of the landscape.
The _Zabieniec mire is a classical example of plant
succession in a former lake, which has progressed
since the Late Glacial. In our study, we concentrated
on the last stages of the terrestrialization process.
During most of its history, this site was not directly
disturbed by human activity. Human impact began to
affect the peatland ecosystem quite recently. Defor-
estation and development of agriculture may lead to
various trophic states and various types of vegetation.
Hydrobiologia (2009) 631:213–230 225
123

One very important study was realized on floating
bogs of southern Ontario by Warner et al. (1989).
These authors showed an influence of deforestations
on peatland ecosystems (water table fluctuations and
vegetation change). Magyari et al. (2001) also
interpreted the transition to higher mire water table
as at least partly induced by gradually intensifying
human activity in northeastern Hungary. The authors
state that the periodic supply of nutrients together
with human-induced water table increases may have
delayed the autogenic succession. Other example of
human impact to peatlands (vegetation change) was
provided by Rybnıcek and Rybnıckova (1974).
What is more important is that we can incorrectly
believe that present peatland systems are on their
natural path of development (Warner, 1996). The_Zabieniec peatland (and possibly most other peat-
lands in central Poland) represents altered ecosys-
tems, disturbed in the past by, e.g. draining,
agriculture and exploitation. However, past defores-
tation has been an underestimated factor, because no
precise palaeoenvironmental data of the recent peat
deposits are available for most of the sites.
The habitat in _Zabieniec was very wet and telmatic
until ca. AD 600. Then, the water table decreased and
the site transformed into a Sphagnum-dominated mire.
This drying took place during the Early Medieval
Period and might be interpreted as a decrease in the
water table leading to oligotrophication.
The strongest evidence for the gradual increase in
Human impact on the region was post-AD 1350
deforestation (beginning of the Late Medieval Period).
Consequently, run-off and aeolian transport from
exposed soils caused eutrophication which can be
tracked through changes in pH. Geochemical results
(increased values of magnesium, iron, potassium, zinc,
as well as decrease of organic matter) obtained from
the same core (Borowka et al., unpublished data)
confirm our assumptions of soil erosion. Furthermore,
chironomids and testate amoebae also clearly
responded to the change in AD 1350. Centropyxis
aerophila domination indicates minerotrophic condi-
tions. The shell morphology of this taxon allows living
in mineral soil (Foissner, 1987, 2000); therefore, its
dominance can be an indicator of mineral deposition
on a peatland surface. The date of ca. AD 1350 may be
connected with the first mention about the Bielanki
village in AD 1394 when forest exploitation became
more intensive in the direct vicinity of the mire.
Openness increased considerably through the Late
Medieval and Modern Periods. During these periods,
intensive development of agriculture was observed in
central Poland, mainly in uplands (Twardy, 2008).
Other Polish studies of the recent peat cover (past
1–3 millennia) show how multidirectional peatland
development can result in the development of differ-
ent types of peatlands. One study from the Tuchola
Forest (Lamentowicz et al., 2007) revealed an
opposite (to the present study) response of peatland
ecosystem to deforestations. In that case, forest
cutting resulted in acidification and Sphagnum
expansion during the last 200 years. This kettle-hole
peatland is located in a sandy outwash plain covered
by pine forest, where run-off from the acid soils led to
pH decrease, which promoted Sphagnum establish-
ment. Human impact appeared much later in this
peatland than in the _Zabieniec mire. Unfortunately,
there is a shortage of high-resolution studies from this
part of Europe to compare with the results from_Zabieniec.
Climate—human or autogenic change?
Despite very pronounced human impact, it is probable
that the _Zabieniec peatland has also responded to
climatic change. Until AD 600, the peatland was very
wet, and then Sphagnum expanded (testate amoebae
also increase rapidly in abundance at this time). This
could have been a result of autogenic tendencies of the
peatland to oligotrophication (Zobel, 1988) or of a
decrease in the water table, caused by climatic change
(Hughes & Barber, 2003, 2004). The location of this
peatland in an area of continental climate influences
suggests that temperature might be the most important
parameter governing the peatland hydrology (Schon-
ing et al., 2005; Charman, 2007), and the increase in
temperature during the Medieval Warm Period may
have influenced the water table. At present, the
surface of the _Zabieniec mire is flooded in wet years.
Our proxies show that such flooding occurred also in
the past. A good example for comparison is the
previously mentioned kettle-hole peatland in Tuchola
(Lamentowicz et al., 2008b), where such flooding
took place in the past and is still observed today.
However, the pattern of changes in Tuchola is
different, as this mire acidified much earlier, ca.
5000 BP. In the case of kettle holes such as the ones in_Zabieniec and Tuchola, acidification is not a synonym
226 Hydrobiologia (2009) 631:213–230
123
of ombrotrophication and it may have depended on
soil leaching during the Holocene.
We suggest that during most of the history of_Zabieniec, climate was a very important factor, but the
signal was more recognizable as terrestrialization
progressed. The dry shift during ca. AD 600 and
relatively stable hydrological conditions were proba-
bly related to climate. However, this was too early for
the Medieval Warm Period (which is usually dated to
AD 800–1300), although during this time also, many
other areas of the world experienced drought episodes
(Bradley et al., 2003). Nevertheless, it is possible that
in this part of Europe, the situation was different, and
the Medieval Warm Period started earlier. Having no
data from this part of Poland, we can compare our
results with those obtained from northern Poland,
from a Baltic bog in Sta _zki (Lamentowicz et al.,
2009). At this site, the water table remained high until
AD 1000–1100, and later, it decreased and became
very unstable. The last part of the Early Medieval Age
and the Late Medieval Age were very dry at Sta _zki,
and this multiproxy study shows that at the beginning
of the Little Ice Age, the record of climate change may
have been modified human impact.
In the case of _Zabieniec, intensified human impact
was synchronous with that of the Little Ice Age (LIA).
This causes difficulties in identifying the climate
signal. Pronounced human impact occurs during the
LIA, which is dated differently in various parts of the
world. The LIA was recorded in many environmental
archives in Europe (Mauquoy et al., 2002; Matthews,
2005; Weckstrom et al., 2006; Blass et al., 2007; van
der Linden et al., 2008), and it is commonly dated to
AD 1550–1850 (Bradley & Jones, 1992). In Poland,
this important event is not well documented, but
records of it may be more common than we suppose.
A comparison of our wet shift dated to ca. 1350 AD
can also be made with other European data such as
those of Magny (2004) for central Europe, who dates a
final phase of lake level increase to AD 1394.
The major hydrological shift at _Zabieniec at AD
1350 corresponds to the Wolf minimum, suggesting
that the shift was in response to reduced solar activity.
The impact of the Maunder minimum (Shindell et al.,
2001) is well documented because all proxies show
that a very wet period occurred between AD 1500 and
AD 1800. It is possible that climate was the decisive
factor for human settlement in the vicinity of _Zabie-
niec that is located on the morainic plateau. Formerly,
settlements were only recorded in the river valleys.
Due to the increase in wetland areas, people may have
been forced to search for more suitable places for
colonization.
The openness of the vegetation significantly
increased in the period AD 1800–2006, which is well
documented in the historical sources, but the water
table decreased in the peatland. This intriguing dry
shift may be interpreted as the end of the Little Ice
Age. Until the early twentieth century, no peatland
exploitation took place which indicates that any
changes in the peatland were due to climate variabil-
ity. This also confirms that not only did deforestation
influence the water table in the peatland, but also that
climate played a crucial role in the past. We excluded
autogenic change as the reason of water table decrease
because there are no Sphagnum hummocks in the mire
surface. At present, Sphagnum fallax dominates in the
moss layer. This species tolerates a very wide range of
trophic conditions, and even a high input of phospho-
rus may not be disturbing (Limpens et al., 2003).
Acknowledgements The study was supported by a grant
from the Polish Ministry of Science and Higher Education, No.
2P04E02228, ‘Changes in the Environment of the Łodz Hills
(Wzniesienia Łodzkie) during the Vistulian (Weichselian) and
Holocene in the light of interdisciplinary palaeoecological
research of the _Zabieniec mire’ (Principal Investigator: Jacek
Forysiak). Mariusz Lamentowicz’s activity was funded by the
above-mentioned grant, as well as, a second grant from the
Polish Ministry of Science and Higher Education, No.
2PO4G03228, ‘Climatic changes in Pomerania (northwestern
Poland) in the last millennium, based on the multiproxy high-
resolution studies’. We thank Milena Obremska for her help in
pollen diagram preparation and Sylwia Ufnalska for improving
the English language. We also thank the three anonymous
referees for their valuable comments.
References
Akima, H., 1970. A new method of interpolation and smooth
curve fitting based on local procedures. Journal of the
Association for Computing Machinery 17: 589–602.
Amesbury, M. J., D. J. Charman, R. M. Fyfe, P. G. Langdon &
S. West, 2008. Bronze Age upland settlement decline in
southwest England: testing the climate change hypothesis.
Journal of Archaeological Science 35: 87–98.
Arrhennius, O., 1950. F}orhistorisk bebyggeise antydd genom
kemisk analys. Fornvannen 45: 59–62.
Behre, K. E., 1981. The interpretation of anthopogenic indi-
cators in pollen diagrams. Pollen and Spores 23: 225–245.
Berggren, G., 1968. Atlas of Seeds and Fruits of North-
European Plant Species (Sweden, Norway, Denmark,
East Fennoscandia and Iceland) with Morphological
Hydrobiologia (2009) 631:213–230 227
123

Descriptions. Part 2, Cyperaceae. Swedish Natural Sci-
ence Research Council, Stockholm.
Berglund, B. E. & M. Ralska-Jasiewiczowa, 1986. Pollen
analysis and pollen diagrams. In Berglund, B. E. (ed.),
Handbook of Holocene Paleoecology and Paleohydrolo-
gy. Wiley, Chichester-Toronto: 455–484.
Blackford, J., 1993. Peat bogs as sources of proxy climatic
data: past approaches and future research. In Chambers, F.
M. (ed.), Climate Change and Human Impact on the
Landscape. Chapman and Hall, New York: 47–56.
Blass, A., M. Grosjean, A. Troxler & M. Sturm, 2007. How
stable are twentieth-century calibration models? A high-
resolution summer temperature reconstruction for the
eastern Swiss Alps back to AD 1580 derived from pro-
glacial varved sediments. The Holocene 17: 51–63.
Blundell, A., D. J. Charman & K. Barber, 2008. Multiproxy late
Holocene peat records from Ireland: Towards a regional
palaeoclimate curve. Journal of Quaternary Science 23:
59–71.
Booth, R. K., M. Notaro, S. T. Jackson & J. E. Kutzbach, 2006.
Widespread drought episodes in the western Great Lakes
region during the past 2000 years: Geographic extent and
potential mechanisms. Earth and Planetary Science Let-
ters 242: 415–427.
Bradley, R. S. & P. D. Jones, 1992. When was the ‘‘Little Ice
Age’’? In Mikami, T. (ed.), International Symposium on
the Little Ice Age Climate. Tokyo Metropolitan Univer-
sity, Tokyo, Japan: 1–4.
Bradley, R. S., K. R. Briffa, J. E. Cole, M. K. Hughes & T. J.
Osborn, 2003. The Climate of the Last Millennium. In
Alverson, K., R. Bradley & T. Pedersen (eds.), Paleocli-
mate, Global Change, and the Future. Springer-Verlag,
Berlin, Heidelberg, New York: 105–142.
Bragg, O. M., 2002. Hydrology and peat-forming wetlands in
Scotland. The Science of the Total Environment 294:
111–129.
Bronk Ramsey, C., 2001. Development of the Radiocarbon
Program OxCal. Radiocarbon 43: 355–363.
Bronk Ramsey, C., 2008. Deposition models for chronological
records. Quaternary Science Reviews 27(1–2): 42–60.
doi:10.1016/j.quascirev.2007.01.019.
Brooks, S. J., P. G. Langdon & O. Heiri, 2007. The identifi-
cation and use of Palaearctic chironomidae larvae in
palaeoecology. QRA Technical Guide No. 10. Quaternary
Research Association, London.
Chambers, F. M. & D. J. Charman, 2004. Holocene environ-
mental change: contributions from the peatland archive.
The Holocene 14: 1–6.
Chambers, F. M., D. Mauquoy, S. A. Brain, M. Blaauw & J. R.
G. Daniell, 2007. Globally synchronous climate change
2800 years ago: proxy data from peat in South America.
Earth and Planetary Science Letters 253: 439–444.
Charman, D. J., 2002. Peatlands and Environmental Change.
Wiley, Chichester: 301 pp.
Charman, D. J., 2007. Summer water deficit variability controls
on peatland water-table changes: implications for Holocene
palaeoclimate reconstructions. The Holocene 17: 217–227.
Charman, D. & A. Blundell, 2007. A new European testate
amoebae transfer function for palaeohydrological recon-
struction on ombrotrophic peatlands. Journal of Quater-
nary Science 22: 209–221.
Charman, D. J., D. Hendon & W. A. Woodland, 2000. The
Identification of Testate Amoebae (Protozoa: Rhizopoda)
in Peats. Technical Guide No. 9. Quaternary Research
Association, London: 147 pp.
Clarke, K. J., 2003. Guide to Identification of Soil Protozoa—
Testate Amoebae. Freshwater Biological Association,
Ambleside: 40 pp.
Crowley, P. H., 1992. Resampling methods for data analysis in
computation-intensive ecology and evolution. Annual
Review of Ecology and Systematics 23: 405–447.
Eidt, R., 1973. A rapid chemical field test for archaeological
site surveying. American Antiquity 38: 207–209.
Faegri, K. & J. Iversen, 1989. Textbook of Pollen Analysis.
Wiley, Chichester-Toronto.
Foissner, W., 1987. Soil protozoa: fundamental problems.
Ecological significance, adaptations in ciliates and testa-
ceans, bioindicators, and guide to literature. Progress in
Protistology 2: 69–212.
Foissner, W., 2000. The Centropyxis aerophila complex
(Protozoa: Testacea). Acta Protozoologica 39: 257–273.
Grospietsch, T., 1958. Wechseltierchen (Rhizopoden). Kos-
mos, Stuttgart: 1–86.
Hendon, D. & D. J. Charman, 1997. The preparation of testate
amoebae (Protozoa: Rhizopoda) samples from peat. The
Holocene 7: 199–205.
Hughes, P. D. M. & K. E. Barber, 2003. Mire development
across the fen-bog transition on the Teifi floodplain at
Tregaron Bog, Ceredigion, Wales, and a comparison with
13 other raised bogs. Journal of Ecology 91:253–264.
Hughes, P. D. M. & K. E. Barber, 2004. Contrasting pathways
to ombrotrophy in three raised bogs from Ireland and
Cumbria, England. The Holocene 14: 65–77.
Hughes, P. D. M., S. H. Lomas-Clarke, J. Schulz & P. Jones,
2007. The declining quality of late-Holocene ombro-
trophic communities and the loss of Sphagnum austinii
(Sull. ex Aust.) on raised bogs in Wales. The Holocene
17: 613–625.
Joosten, H. & D. Clarke, 2002. Wise Use of Mires and Peat-
lands—Background and Principles Including a Frame-
work for Decision-making. International Mire
Conservation Group and International Peat Society,
Saarijarvi.
Juggins, S., 2003. C2 User guide. Software for Ecological and
Palaeoecological Data Analysis and Visualisation. Uni-
versity of Newcastle, Newcastle upon Tyne, UK: 69 pp.
Kaczanowski, P. & J. K. Kozłowski, 1998. Great History of
Poland, Vol. 1. The Oldest History of Poland Area (to VII
Century). Fogra, Krakow: 382 pp.
Katz, N. J., S. V. Katz & M. G. Kipiani, 1965. Atlas and Keys
of Fruits and Seeds Occurring in the Quaternary Deposits
of the USSR. Nauka, Moskva: 367 pp.
Katz, N. J., S. V. Katz & E. I. Skobiejeva, 1977. Atlas of
Macrofossils from Peats. Nedra, Moskva: 370 pp.
Klink, A. G. & H. K. M. Moller Pillot, 2003. Chironomidae
Larvae. Key to the Higher Taxa and Species of the
Lowlands of Northwestern Europe 1.0 CD-ROM. ETI.
Kłysik, K., 2001. Climatic conditions. In Liszewski, S. (ed.),
Monograph of Łodz Voivodeship. Łodzkie Towarzystwo
Naukowe, Łodz. (in Polish).
Lagerback, R. & A. N. N. M. Robertsson, 1988. Kettle
holes: stratigrafical archives for Weichselian geology and
228 Hydrobiologia (2009) 631:213–230
123
palaeoenvironment in nothernmost Sweden. Boreas 17:
439–468.
Lamentowicz, M. & E. A. D. Mitchell, 2005. The ecology of
testate amoebae (Protists) in Sphagnum in north-western
Poland in relation to peatland ecology. Microbial Ecology
50: 48–63.
Lamentowicz, M., K. Tobolski & E. A. D. Mitchell, 2007.
Palaeoecological evidence for anthropogenic acidification
of a kettle-hole peatland in northern Poland. The Holo-
cene 17: 1185–1196.
Lamentowicz, Ł., M. Lamentowicz & M. Gabka, 2008a. Tes-
tate amoebae ecology and a local transfer function from a
peatland in western Poland. Wetlands 28: 164–175.
Lamentowicz, M., M. Obremska & E. A. D. Mitchell, 2008b.
Autogenic succession, land-use change, and climatic
influences on the Holocene development of a kettle hole
mire in Northern Poland (Northern Poland). Review of
Palaeobotany & Palynology 151: 21–40.
Lamentowicz, M., A. Cedro, G. Miotk-Szpiganowicz, E. A. D.
Mitchell, J. Pawlyta & T. Goslar, 2008c. Last millennium
palaeoenvironmental changes from a Baltic bog (Poland)
inferred from stable isotopes, pollen, plant macrofossils
and testate amoebae Palaeogeography, Palaeoclimatology.
Palaeoecology 265: 93–106.
Lamentowicz, M., K. Milecka, M. Gałka, A. Cedro, J. Pawlyta,
N. Piotrowska, Ł. Lamentowicz & W. O. van der Knaap,
2009. Climate- and human-induced hydrological change
since AD 800 in an ombrotrophic mire in Pomerania (N
Poland) tracked by testate amoebae, macro-fossils, pollen,
and tree-rings of pine. Boreas 38: 214–229.
Limpens, J., B. M. Hilde & F. Berendse, 2003. Expansion of
Sphagnum fallax in bogs: striking the balance between N
and P availability. Journal of Bryology 25: 83–90.
Magny, M., 2004. Holocene climate variability as reflected by
mid-European lake-level fluctuations and its probable
impact on prehistoric human settlements. Quaternary
International 113: 65–79.
Magyari, E., P. Sumegi, M. Braun, G. Jakab & M. Molnar,
2001. Retarded wetland succession: anthropogenic and
climatic signals in a Holocene peat bog profile from north-
east Hungary. Journal of Ecology 89: 1019–1032.
Matthews, J. A., 2005. ‘Little Ice Age’ glacier variations in
Jotunheimen, southern Norway: a study in regionally
controlled lichenometric dating of recessional moraines
with implications for climate and lichen growth rates. The
Holocene 15: 1–19.
Mauquoy, D. & B. van Geel, 2007. Mire and Peat Macros. In
A., E. S. (ed.), Vol. 3. p. 2315–2336, Elsevier.
Mauquoy, D., B. van Geel, M. Blaauw & J. van der Plicht,
2002. Evidence from northwest European bogs shows
‘Little Ice Age’ climatic changes driven by variations in
solar activity. The Holocene 12: 1–6.
Mitchell, E. A. D., 2003. Identification keys for testate amoe-
bae. http://wslar.epfl.ch/mitchell/edward/Identification_
keys/Keys.htm.
Mitchell, E. A. D., W. O. van der Knaap, J. F. N. Leeuwen, A.
Buttler, B. G. Warner & J. M. Gobat, 2001. The palaeo-
ecological history of the Praz-Rodet bog (Swiss Jura)
based on pollen, plant macrofossils and testate amoebae
(Protozoa). The Holocene 11: 65–80.
Ogden, C. G. & R. H. Hedley, 1980. An Atlas of Freshwater
Testate Amoebae. British Museum (Natural History) and
Oxford University Press, (London and Oxford), London:
222 pp.
Ohryzko-Włodarska, C., 1972. Transformation of the Village
of the Polish Kingdom in Years 1846–1870. An Example
of Brzeziny District. Ludowa Społdzielnia Wydawnicza,
Warszawa: 364 pp. (in Polish).
Oksanen, P. O. & M. Valiranta, 2006. Palsa mires in a
changing climate. Suoseura 57: 33–43.
Ralska-Jasiewiczowa, M. & M. Latałowa, 1996. Poland. In
Berglund, B. E., H. J. B. Birks, M. Ralska-Jasiewiczowa
& H. E. Wright Jr (eds.), Palaeoecological Events During
the Last 15000 years: Regional Syntheses of Palaeoeco-
logical Studies of Lakes and Mires in Europe. Wiley,
Chichester: 403–472.
Ralska-Jasiewiczowa, M., M. Latałowa, K. Wasylikowa, K.
Tobolski, T. Madeyska, H. E. Wright & C. Turner Jr,
2004. Late Glacial and Holocene History of Vegetation in
Poland Based on Isopollen Maps. W. Szafer Institute of
Botany, Polish Academy of Sciences, Krakow.
Reimer, P. J., M. G. L. Baillie, E. Bard, A. Bayliss, J. W. Beck,
C. J. H. Bertrand, P. G. Blackwell, C. E. Buck, G. S. Burr,
K. B. Cutler, P. E. Damon, R. L. Edwards, R. G. Fair-
banks, M. Friedrich, T. P. Guilderson, A. G. Hogg, K. A.
Hughen, B. Kromer, G. McCormac, S. Manning, C. B.
Ramsey, R. W. Reimer, S. Remmele, J. R. Southon, M.
Stuiver, S. Talamo, F. Taylor, J. van der Plicht & C.
Weyhenmeyer, 2004. IntCal04 terrestrial radiocarbon age
calibration, 0–26 cal kyr BP. Radiocarbon 46: 1029–1058.
Rolland, N. & I. Larocque, 2007. The efficiency of kerosene
flotation for extraction of chironomid head capsules from
lake sediments samples. Journal of Paleolimnology 37:
565–572.
Rybnıcek, K. & E. Rybnıckova, 1974. The origin and devel-
opment of waterlogged meadows in the central part of the
Sumava Foothills. Folia Geobotanica & Phytotaxonomica.
9: 45–70.
Rydin, H. & J. Jeglum, 2006. The Biology of Peatlands. Oxford
University Press, Oxford: 343 pp.
Schoning, K., D. J. Charman & S. Wastegard, 2005. Recon-
structed water tables from two ombrotrophic mires in
eastern central Sweden compared with instrumental
meteorological data. The Holocene 15: 111–118.
Shindell, D. T., G. A. Schmidt, M. E. Mann, D. Rind & A.
Waple, 2001. Solar forcing of regional climate change
during the Maunder Minimum. Science 294: 2149–2152.
Sillasoo, U., D. Mauquoy, A. Blundell, D. Charman, M. Bla-
auw, J. R. G. Daniell, P. Toms, J. Newberry, F. M.
Chambers & E. Karofeld, 2007. Peat multi-proxy data
from Mannikjarve bog as indicators of late Holocene
climate changes in Estonia. Boreas 36: 20–37.
Tallis, J. H., 1983. Changes in wetland communities. In Gore,
A. J. P. (ed.), Mires: Swamp, Bog, Fen and Moor. Else-
vier, Amsterdam: 311–347.
Tobolski, K. 2000. Przewodnik do oznaczania torfow i osadow
jeziornych (A guide for identification of peat and lake sed-
iments). Wydawnictwo Naukowe PWN, Warszawa, 508 pp.
Twardy, J., 2008. Transformacja rzezby centralnej czesci Polski
Srodkowej w warunkach antropopresji. Transformation of
Hydrobiologia (2009) 631:213–230 229
123

the Relief of the Central Poland in Conditions of the
Human Impact. Wydawnictwo Uniwersytetu Łodzkiego,
Łodz. (in Polish).
Vallenduuk, H. J. & H. K. M. Moller Pillot, 2007. Chiro-
nomidae Larvae of the Netherlands and Adjacent Low-
lands. General Ecology and Tanypodinae. KNNV
Publishing, Zeist, The Netherlands: 144 pp.
van Breemen, N., 1995. How Sphagnum bogs down other
plants. Trends in Ecology and Evolution 10: 270–275.
van der Linden, M., J. Barke, E. Vickery, D. J. Charman & B.
van Geel, 2008. Late Holocene human impact and climate
change recorded in a North Swedish peat deposit. Palae-
ogeography, Palaeoclimatology, Palaeoecology 258: 1–27.
Warner, B. G., 1993. Palaeoecology of floating bogs and
landscape change in the Great Lakes drainage basin of
North America. In Chambers, F. M. (ed.), Climate Change
and Human Impact on the Landscape. Chapman and Hall,
New York: 237–245.
Warner, B. G., 1996. Vertical gradients in peatlands. In Mu-
lamoottil, G., B. G. Warner & A. E. McBean (eds.),
Wetlands. Environmental Gradients, Boundaries, and
Buffers. Lewis Publisher, Waterloo: 45–66.
Warner, B. G., H. J. Kubiw & K. I. Hanf, 1989. An anthro-
pogenic cause for quaking mire formation in southwestern
Ontario. Nature 340: 380–384.
Weckstrom, J., A. Korhola, P. Erasto & L. Holmstrom, 2006.
Temperature patterns over the past eight centuries in
Northern Fennoscandia inferred from sedimentary dia-
toms. Quaternary Research 66: 78–86.
Wiederholm, T., 1983. Chironomidae of the Holarctic Region.
Keys and Diagnoses. Larvae, Vol. 1. Entomological
Society of Lund, Sweden: 457 pp.
Williams, M., 2000. Dark ages and dark areas: global defor-
estation in the deep past. Journal of Historical Geography
26: 28–46.
Willis, K. J., M. B. Araujo, K. D. Bennett, B. Figueroa-Rangel,
C. A. Froyd & N. Myers, 2007. How can a knowledge of
the past help to conserve the future? Biodiversity con-
servation and the relevance of long-term ecological
studies. Phil Trans R Soc 362: 175–186.
Wilson, R. S. & L. P. Ruse, 2005. A guide to the identification
of genera of chironomid pupal exuviae occurring in
Britain and Ireland (including common genera from
Northern Europe) and their use in monitoring lotic and
lentic fresh waters. Freshwater Biological Association
Special Publications 13, 176 pp.
Wos, A., 1999. Klimat Polski. Climate of Poland. Wydaw-
nictwo Naukowe PWN, Warszawa: 302 pp. (in Polish).
Yeloff, D. & D. Mauquoy, 2006. The influence of vegetation
composition on peat humification: implications for pal-
aeoclimatic studies. Boreas 35: 662–673.
Yeloff, D., P. Broekens, J. Innes & B. v. Geel, 2007. Late
Holocene vegetation and land-use history in Denmark: a
multi-decadally resolved record from Lille Vildmose,
northeast Jutland. Review of Palaeobotany and Palynol-
ogy 146: 182–192.
Yu, Z., 2006. Holocene carbon accumulation of fen peatlands in
boreal western Canada: a complex ecosystem response
to climate variation and disturbance. Ecosystems 9:
1278–1288.
Zajaczkowski, S. & S. M. Zajaczkowski, 1966. Materiały do
słownika geograficzno-historycznego dawnych ziem
łeczyckiej i sieradzkiej do 1400 roku, Czesc I. (Materials
for geographical–historical dictionary of old Łeczyce and
Sieradz lands until AD 1400. Part I (Abramowice –
Mzurki)) Łodz (in Polish).
Zobel, M., 1988. Autogenic succession in boreal mires–a
review. Folia Geobotanica & Phytotaxonomica 23:
417–445.
230 Hydrobiologia (2009) 631:213–230
123