Pollen and macrofossil analyses of Pliocene lacustrine sediments (Salto river valley, Central Italy)

Late Pliocene Faunal Turnoverin the Turkana Basin, Kenya
and EthiopiaAnna K. Behrensmeyer, Nancy E. Todd, Richard Potts,
Geraldine E. McBrinn*
Analysis of a large sample of well-dated fossil mammals from localities in the TurkanaBasin of Kenya and Ethiopia revealed sampling biases that affect patterns of faunalturnover during the late Pliocene. When these biases were accounted for, results indi-cated that 58 to 77 percent of the mammal species were replaced between 3.0 and 1.8million years ago (Ma). Overall diversity increased from 3.0 to 2.0 Ma but then declined.No distinct turnover pulse is seen between 2.8 and 2.5 Ma; instead, the most significantperiod of faunal change began after 2.5 Ma and continued through 1.8 Ma.
A major biotic turnover event for Africanland mammals has been proposed for thetime interval from 2.8 to 2.5 Ma and linkedto a global change toward cooler, drier, andmore variable climates associated with theonset of Northern Hemisphere glaciation(1–6). The late Pliocene radiation of hom-inid species and the emergence of the genusHomo have also been attributed to globalclimate forcing (2, 4, 5, 7). The Africanturnover event can be viewed as part of abroader “turnover pulse” hypothesis, inwhich climate change results in brief peri-ods of significant evolutionary change (1–4,8). In this article, we provide evidence thatfaunal turnover between 2.5 and 1.8 Mawas a prolonged rather than pulsed responseto late Pliocene climate change in EastAfrica.
Central issues in demonstrating climateforcing in the geological record are (i)whether observed changes in faunas or flo-ras can be linked to climate change and (ii)whether information from the preserved or-ganisms is sufficient to allow biological sig-nals coincident with climate change to bedistinguished from sampling biases. Previ-ous studies of late Pliocene faunal change inAfrica have focused on individual groupssuch as bovids (1–4), suids (9, 10), equids(11), cercopithecids (12), and hominids (4,9) or provided multilineage overviews (13,14) with biostratigraphic range data of vary-ing quality and resolution for the continentas a whole. Here, we use the publishedrecords of all mammal groups from oneAfrican late Pliocene basin to separate sam-pling biases from original biological signals
and to examine evolutionary patterns inrelation to climate change.
The Turkana Basin fauna. We focusedour study on the Turkana Basin because thePliocene-Pleistocene strata there are welldated and highly fossiliferous and the tim-ing of faunal change elsewhere in Africa hasbeen correlated to these strata (4, 14–17).We compiled and analyzed a data set con-sisting of 425 referenced fossil localitiesfrom three regions in the northern TurkanaBasin from 4.4 to 0 Ma. This data set pro-vides 3574 records of fossil mammal occur-rences based on over 10,000 specimens (Fig.1 and Table 1), representing 246 namedtaxa (18).
The three regions in the Turkana Basinare the Omo Valley, Ethiopia (ShunguraFormation); East Turkana, Kenya (KoobiFora Formation); and West Turkana, Kenya(Nachukui Formation) (Fig. 1 and Table 1).The geochronology of these deposits is pri-marily based on radiometric dates on volca-nic strata that mark the boundaries betweenstratigraphic members or submembers. Theconservative estimate of maximum andminimum ages for fossil localities is thesame as for the stratigraphic member orsubmember in which they occur, and thesedates provide the first appearance datums
(FADs) and last appearance datums(LADs) used in this article (19). The onlyexception is the fossiliferous portion of theupper Burgi Member of East Turkana,which lies unconformably above a majorerosion surface and thus is likely to be sig-nificantly younger than the Lokalalei Tuff(dated at 2.52 Ma) at the boundary betweenthe upper and lower Burgi members (15).The upper Burgi fauna is generally acceptedas close to, if not slightly younger than, 2.0Ma (20), and we use a maximum date of 2.0Ma for this fauna.
In our analysis, it was necessary to decidehow to use published identifications (21–27) of the mammal taxa to create rangecharts that could be analyzed for samplingbiases. Most of the named taxa provideadequate range information at the specieslevel, but for some we used the genericlevel. For example, the range for Potomo-
The authors are in the Evolution of Terrestrial EcosystemsProgram, National Museum of Natural History, NHB MRC121, Smithsonian Institution, Washington, DC 20560,USA.
*To whom correspondence should be addressed. E-mail:[email protected]
Fig. 1. Map showing the Turkana Basin and thelocations of the three major fossil producing for-mations spanning the late Pliocene (3.0 to 1.8Ma). A, Omo Valley; B, West Turkana; and C, EastTurkana. The paleo–Omo River was a major agentof deposition in all three areas during much of thisinterval (16, 17, 41).
Table 1. Summary results for the northern Turkana Basin data set, which consists of 3574 mammalrecords from localities dated between 4.4 and 0.0 Ma. This data set includes faunal data from alllocalities that can be assigned to stratigraphic members on the basis of published information for thistime interval. The number of specimens (NISP) includes a minimum estimate of 1 for locality records thatotherwise included no data on number of specimens.
Region Total numberof localities
Percentagein basin
TotalNISP
Percentagein basin
Omo Valley, Ethiopia 254 60 5,218 52East Turkana, Kenya 120 28 3,731 37West Turkana, Kenya 51 12 1,173 12Total 425 10,092
RESEARCH ARTICLE
www.sciencemag.org z SCIENCE z VOL. 278 z 28 NOVEMBER 1997 1589
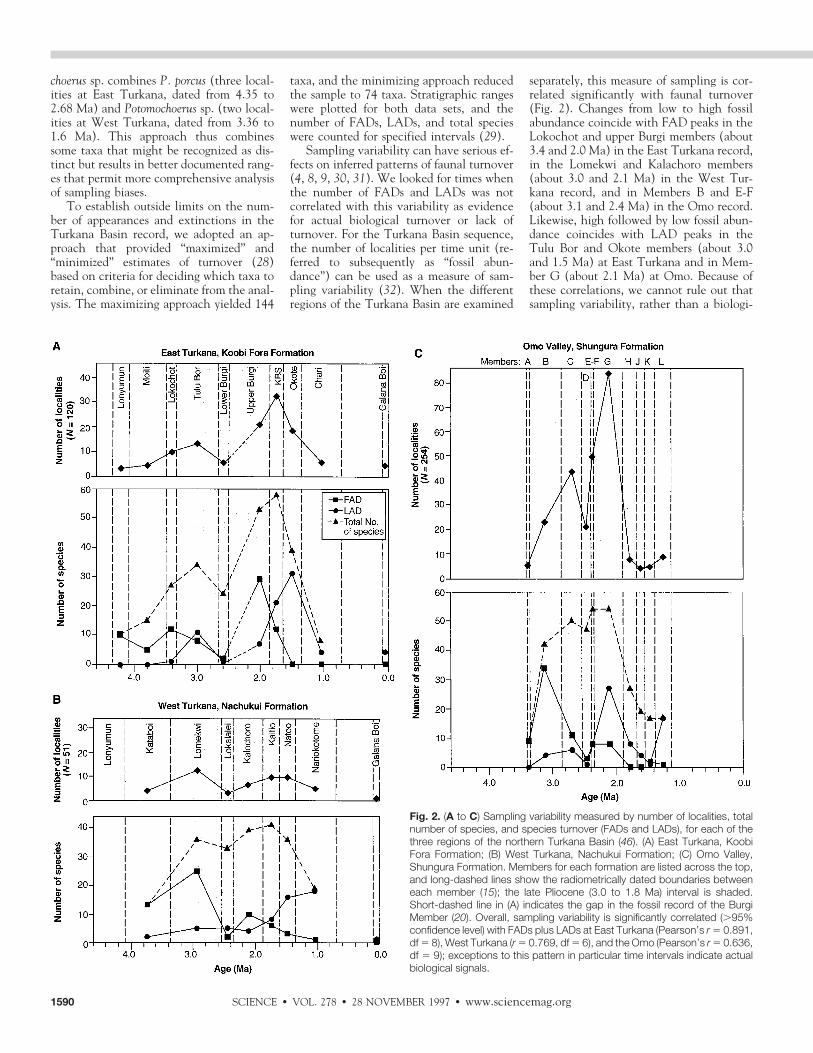
choerus sp. combines P. porcus (three local-ities at East Turkana, dated from 4.35 to2.68 Ma) and Potomochoerus sp. (two local-ities at West Turkana, dated from 3.36 to1.6 Ma). This approach thus combinessome taxa that might be recognized as dis-tinct but results in better documented rang-es that permit more comprehensive analysisof sampling biases.
To establish outside limits on the num-ber of appearances and extinctions in theTurkana Basin record, we adopted an ap-proach that provided “maximized” and“minimized” estimates of turnover (28)based on criteria for deciding which taxa toretain, combine, or eliminate from the anal-ysis. The maximizing approach yielded 144
taxa, and the minimizing approach reducedthe sample to 74 taxa. Stratigraphic rangeswere plotted for both data sets, and thenumber of FADs, LADs, and total specieswere counted for specified intervals (29).
Sampling variability can have serious ef-fects on inferred patterns of faunal turnover(4, 8, 9, 30, 31). We looked for times whenthe number of FADs and LADs was notcorrelated with this variability as evidencefor actual biological turnover or lack ofturnover. For the Turkana Basin sequence,the number of localities per time unit (re-ferred to subsequently as “fossil abun-dance”) can be used as a measure of sam-pling variability (32). When the differentregions of the Turkana Basin are examined
separately, this measure of sampling is cor-related significantly with faunal turnover(Fig. 2). Changes from low to high fossilabundance coincide with FAD peaks in theLokochot and upper Burgi members (about3.4 and 2.0 Ma) in the East Turkana record,in the Lomekwi and Kalachoro members(about 3.0 and 2.1 Ma) in the West Tur-kana record, and in Members B and E-F(about 3.1 and 2.4 Ma) in the Omo record.Likewise, high followed by low fossil abun-dance coincides with LAD peaks in theTulu Bor and Okote members (about 3.0and 1.5 Ma) at East Turkana and in Mem-ber G (about 2.1 Ma) at Omo. Because ofthese correlations, we cannot rule out thatsampling variability, rather than a biologi-
Fig. 2. (A to C) Sampling variability measured by number of localities, totalnumber of species, and species turnover (FADs and LADs), for each of thethree regions of the northern Turkana Basin (46). (A) East Turkana, KoobiFora Formation; (B) West Turkana, Nachukui Formation; (C) Omo Valley,Shungura Formation. Members for each formation are listed across the top,and long-dashed lines show the radiometrically dated boundaries betweeneach member (15); the late Pliocene (3.0 to 1.8 Ma) interval is shaded.Short-dashed line in (A) indicates the gap in the fossil record of the BurgiMember (20). Overall, sampling variability is significantly correlated (.95%confidence level) with FADs plus LADs at East Turkana (Pearson’s r 5 0.891,df 5 8), West Turkana (r 5 0.769, df 5 6), and the Omo (Pearson’s r 5 0.636,df 5 9); exceptions to this pattern in particular time intervals indicate actualbiological signals.
SCIENCE z VOL. 278 z 28 NOVEMBER 1997 z www.sciencemag.org1590

cally mediated increase or decrease in spe-cies, is responsible for the turnover peaks.However, in the Omo record, the numberof FADs per member is relatively constantfrom 3.0 to 2.0 Ma (with the exception ofMember D) in spite of the wide fluctuationsin the sample sizes, indicating a consistentlevel of faunal turnover throughout thisinterval. In the East Turkana record, theoverall increase in number of species couldresult primarily from increased fossil abun-dance up to about 2.0 Ma, but between 2.0and about 1.8 Ma, continued high produc-tivity in the KBS Member accompanied bydecreased FADs and increased LADs indi-cates a period of real faunal turnover. Thisturnover is also evident between about 2.1and 1.8 Ma at West Turkana.
When the data for each region werecombined in 200,000-year intervals, the ef-fects of uneven sampling were reduced butnot eliminated (Figs. 3 and 4). For theinterval between 3.3 and 1.5 Ma, which isrelatively well sampled with .15 localitiesper 200,000-year interval, there is no over-all correlation between fossil abundanceand total FADs plus LADs for either themaximizing or minimizing approach (Fig.4), indicating that the turnover pattern rep-resents a biological signal rather than sam-pling variability. However, the marked in-crease in fossil abundance between 2.5 and2.1 Ma, which reflects increased numbers of
localities from Omo Members E through G,corresponds to the peaks in FADs andLADs between 2.4 and 2.2 Ma (Figs. 2Cand 4), and it is not possible to resolve afiner scale pattern of biological turnoverbecause of this sampling effect.
Patterns of fauna change. Vrba (4, 8)has specified criteria for testing the turn-over pulse hypothesis that can be applied tothe African fauna, including (i) significantand synchronous increases in the number ofFADs and LADs of species, with the exis-tence of a turnover pulse determined by astatistically significant change in the turn-over rate during a specified, relatively shorttime interval between 2.8 and 2.5 Ma; (ii)concurrent increase in turnover rate acrossdifferent taxonomic groups; (iii) differentialtiming of turnover depending on ecologicaltolerances of the group(s); and (iv) corre-spondence in time with independently doc-umented environmental change, that is, theonset of Northern Hemisphere glaciation.
The Turkana Basin data show that al-though significant species turnover oc-curred during the 3.0- to 1.8-Ma interval,there is no marked pulse affecting differenttaxonomic groups between 2.8 and 2.5 Ma.The highest turnover [represented here as(FADs 1 LADs/total number of species) 3100 (%)] for any 200,000-year interval be-tween 3.0 and 1.8 Ma is 24 to 32% for theinterval from 2.4 to 2.2 Ma (the range is for
the minimizing versus maximizing ap-proaches, respectively) and 19 to 28% forthe interval from 2.0 to 1.8 Ma. The changein turnover is significant between 2.5 and2.1 Ma but not between 2.9 and 2.5 Ma(Fig. 5). The peak in turnover between 2.4and 2.2 Ma is about 15% above that of theprevious interval (based on the increaserelative to the total number of species ineach interval for both approaches) (Fig. 5).However, because of the sharp increase infossil abundance (Fig. 4), species appear-ances that may have occurred before 2.2and 2.4 Ma were concentrated in this in-terval, and it is not possible to distinguishthe pattern of faunal change from this sam-pling bias for the interval from 2.5 to 2.1Ma. This sampling effect may also extendbefore 2.5 Ma and include species that ac-tually appeared between 2.8 and 2.5 Ma (4),but the pattern of relative faunal stability inthe well-sampled Omo fauna (Fig. 2C) aswell in the combined data (Fig. 4) indicatesno major turnover event between 3.0 and2.5 Ma. Between about 2.1 and 1.7 Ma,during a period of continuing high fossilproductivity, the pattern of FADs andLADs provides evidence for acceleratedfaunal turnover. The duration of this periodof increased turnover is uncertain becauseof the sharp drop-off in fossil abundanceafter 1.7 Ma.
From 3.0 to 2.0 Ma, total species turn-
Fig. 3. Species rangechart for the northernTurkana Basin fauna,based on the minimizingapproach (see text) (28,47 ) and organized alpha-betically by order andthen by family and genus.The late Pliocene timeinterval (3.0 to 1.8 Ma) isshaded. Numbers afterthe species names arethe total number of lo-calities at which thespecies was recorded.Tabular data for boththe minimizing andmaximizing approachesare available at eteweb.lscf.uscb.edu and www.sciencemag.org/feature/data/973775.shl
RESEARCH ARTICLE
www.sciencemag.org z SCIENCE z VOL. 278 z 28 NOVEMBER 1997 1591

over was between 41 and 59% (minimizingand maximizing approaches, respectively)(Fig. 4 and Table 2). This rate is similar tothe estimate of about 42%/Ma for NorthAmerican Pliocene-Pleistocene mammals(31). First appearances represent 82% of thetotal turnover in the minimizing approach,and total diversity increases by about 35%,from 48 species before 3.0 Ma to 65 speciesat 2.0 Ma. This increase represents the ad-dition of 23 species in seven different fam-ilies and the loss of 5 species in four families(Table 2). Most of this change appears tohave occurred from 2.5 to 2.0 Ma. At theend of the Pliocene, between 2.0 and 1.8Ma, the rate of turnover per 200,000-yearinterval increased, and disappearances out-numbered appearances. Thus, overall,FADs increased between 2.5 and 2.0 Ma,leading to higher species diversity, followedby a period of turnover with low FADs andincreased LADs resulting in a diversity de-cline by 1.8 Ma.
Vrba (4) has suggested that responses toenvironmental change toward cooler anddrier climatic conditions from 2.8 to 2.5 Mapromoted more open habitats in tropicalAfrica and led to a turnover pulse repre-
sented in the records of the Bovidae, Ro-dentia, and Hominidae. A number of bovidspecies (8 out of a total of 25 in the mini-mizing approach and 17 out of 46 in themaximizing approach) appeared between 3and 2 Ma in the Turkana Basin, but theseappearances were not clustered between 2.8and 2.5 Ma (Fig. 3). The bovid tribes An-tilopini and Alcelaphini are generally re-garded as indicative of open habitats, andtheir increase has been used as an index ofvegetational change toward grasslands (1,2). The maximizing approach includes 15species in these two tribes; 7 have FADsbetween 3 and 2 Ma, and 5 of these appearbetween 2.5 and 2.0 Ma. The minimizingapproach includes nine species in thesegroups, with three FADs, all between 2.5 and2.0 Ma (Fig. 3). The presence of dry or open(or both) habitats is indicated by a numberof species that originated before 3 Ma andsurvived through 2 Ma, such as the anti-lopines Gazella praethomsoni and G. janen-schi, as well as the alcelaphine genera Con-nochaetes and Damaliscus (1, 33). The rangedata for these two bovid tribes indicate thatopen or dry (or both) habitats provided op-portunities for new species throughout the
interval from 3 to 2 Ma and support thehypothesis that ecological change was pro-longed in the Turkana Basin.
The persistence of woodland to forestspecies from 3 to 2 Ma provides furtherevidence of stability in some parts of theecosystem. Primate species requiring arbo-real substrates in woodlands or forests, suchas Paracolobus mutiwa and Rhinocolobus tur-kanaensis (34), were present from about 3.4to 1.9 Ma. The extinct baboon Theropithe-cus was abundant in the basin, and Thero-pithecus brumpti, which was associated withwoodland habitats, appeared at 3.4 and dis-appeared at about 2.0 Ma (35). Tragelaphusstrepsiceros (greater kudu), which today pre-fers woodland and bush habitats, appearedbetween 2.5 and 2.3 Ma and was present atmany localities in all three regions.
In the northern Turkana Basin, the
Fig. 4. Number of localities representing fossilabundance (A) and the results of the minimizingand maximizing approaches (B and C), showingthe turnover pattern through time and total num-bers of species, combined for all three regions(46, 48). FAD or LAD records that fall precisely onthe time lines in Fig. 3 are counted in the olderinterval to derive the totals plotted here. The cor-relation between fossil abundance and turnoverbetween 3.3 and 1.5 Ma is not significant at the95% confidence level [Pearson’s r 5 0.271 (max-imizing) and r 5 0.355 (minimizing), 9 df in bothcases]. The sharp peak in (A) between 2.5 and 2.1Ma primarily reflects an increase in fossil abun-dance in Members E to G in the Omo (Fig. 2C),which is centered at 2.3 Ma in this figure as a resultof the method for distributing localities in 200,000-year intervals (48). Totals for FADs, LADs, andcontinuing taxa for each interval were counteddirectly from the maximizing and minimizing rangecharts.
Table 2. Summary of late Pliocene faunal turnover in the northern Turkana Basin, showing overallturnover rates and species diversity for the maximizing and minimizing approaches and breakdown ofspecies turnover and continuity in the fossil record of different mammal groups for the time intervalbetween 3 and 2 Ma (Fig. 3) (18, 19, 28, 29, 36).
3.0 to 2.0 MaSpeciesdiversity
at 3.0 Ma
Speciesdiversity
at 2.0 Ma
Speciesdiversity
at 1.8 MaFAD LAD Total numberof species
Percentageof turnover
FAD 1 LAD
Maximizing 50 28 132 59 82 104 86Minimizing 23 6 71 41 48 65 56
Maximizing Minimizing
FAD LAD Total numberof species FAD LAD Total number
of species
ArtiodactylaBovidae 17 7 46 8 2 25Camelidae 0 0 1 0 0 1Giraffidae 0 0 4 0 0 2Hippopotamidae 5 1 7 3 0 5Suidae 4 2 12 3 1 9
Carnivora 3 3 8 0 1 1Chiroptera 0 1 1 0 0 0Hyracoidea 0 2 1 0 0 0Insectivora 0 1 2 0 1 2Lagomorpha 1 0 1 0 0 0Perissodactyla
Chalicotheriidae 1 0 1 0 0 0Equidae 6 0 9 2 0 4Rhinocerotidae 0 1 3 0 0 2
PrimatesCercopithecidae 2 1 8 1 0 4Hominidae 5 0 6 3 0 4Lorisidae 0 1 1 0 0 0
Proboscidea 1 2 5 0 1 4Rodentia 5 8 16 3 0 8
SCIENCE z VOL. 278 z 28 NOVEMBER 1997 z www.sciencemag.org1592

record for rodents and lagomorphs is docu-mented by 362 published specimens at only18 localities, 13 of which are in the Omodeposits (27). Some species that indicatedrier habitats, such as Jaculus orientalis (jer-boa), Heterocephalus atikoi (naked mole rat),and Lepus capensis (Cape hare), appeared atabout 2.5 Ma, but sampling of microfaunabefore that time is sparse (seven localities inthe whole northern basin, only two of whichhave multiple taxa). As with the Bovidae,taxa affiliated with open or drier habitatswere present before 3 Ma and persistedthrough 2 Ma [such as Tatera inclusa (largenaked-soled gerbil) and Xerus erythropus(African ground squirrel)], but closed habi-tat to mesic savanna species [such as Croci-dura cf. dolichura (white-toothed shrew) andThryonomys gregorianus (cane rat)] also con-tinued through this interval. In general,however, the microfaunal record is too in-complete to provide adequate evidence forturnover patterns in the late Pliocene.
Six hominid taxa were represented inthe region from 3 to 2 Ma: Australopithecus(Paranthropus) boisei, A. cf. boisei [includingA. (P.) aethiopicus], a “nonrobust” Australo-pithecus species less megadont than A. boi-sei, Homo habilis, H. cf. habilis (including H.rudolfensis), and Homo sp. (36). We countedall six in the maximizing approach, and, inthe minimizing approach, we combined A.cf. boisei with A. boisei and H. cf. habilis withH. habilis, for a total of four taxa. Five of thesix (maximizing) or three of the four (min-imizing) taxa first appeared during the 3- to2-Ma interval, with FADs for H. habilis and
Homo sp. between 2.4 and 2.2 Ma (Fig. 3).Because of the region’s ecological diversity,the first appearances of Homo and robustaustralopithecines do not necessarily implythat these hominids preferred open habi-tats. Global (37) and regional (38, 39) cli-mate records indicate that the period be-tween 3 and 2 Ma was cooler and drier butwas also characterized by wide environmen-tal fluctuations. On the basis of the tempo-ral correlation alone, it is not possible todetermine whether turnover and adaptivechange in hominids were a response to theoverall environmental change or to thelong series of high-amplitude habitat varia-tions in the vegetational mosaic (40).
The different records of faunal turnoverin the three regions of the Turkana Basin(Fig. 2) thus result from a mix of samplingeffects and actual biological stasis andchange. Combined records for the threeparts of the basin (Figs. 4 and 5) reflectfaunal change as well as the persistence ofspecies representing a spectrum of open toclosed habitats. We propose that a fluctu-ating but overall expansion of open habitatscombined with the persistence of woodlandand forest initially provided increased op-portunities for mammals and led to a rise indiversity from 3.0 to 2.0 Ma, followed by adiversity decline as open habitats becamemore dominant at the end of the Pliocene.This two-part interval of turnover lastedabout 0.7 million years.
Feibel et al. (41) have attributed theapparent absence of a turnover pulsearound 2.5 Ma in the Turkana Basin tothe effect of permanent water supplied bythe ancestral Omo River, implying thatriverine and lacustrine environments inthe basin were buffered from continental-scale changes by regional conditions. Be-tween 3 and 2 Ma, there were shifts inabundance within some groups of mam-mals within the Omo sequence (42), sug-gesting that habitat changes affected localpopulations but were not severe enough tocause their extinction. The basin includeda range of habitats from forest to bushlandand grassland, some of which were consid-erably drier than areas proximal to thepaleo–Omo River (38, 41), but speciesrepresenting the drier habitats do not pro-vide evidence for a short-term turnoverevent. Thus, although a pulse of speciesturnover may have occurred elsewhere onthe continent between 2.8 and 2.5 Ma,the absence of evidence for such a pulsefrom the best calibrated, fossil-rich depos-its for this time period weakens the casefor rapid climatic forcing of continent-scale ecological change and faunal turn-over. Instead, our data indicate that latePliocene evolution in East Africa was af-fected by the cumulative ecological con-
sequences of cooler, drier, and more vari-able climatic conditions rather than by asudden change toward open habitats.
REFERENCES AND NOTES___________________________
1. E. S. Vrba, in Ancestors: The Hard Evidence, E. Del-son, Ed. (Liss, New York, 1985), pp. 63–71.
2. iiii, in (43), pp. 405–426.3. iiii, J. Mammal. 73, 1 (1992).4. iiii, in (44), pp. 385–424.5. P. B. deMenocal, Science 270, 53 (1995); P. B. de-
Menocal and J. Bloemendal, in (44), pp. 262–288.6. M. L. Prentice and G. H. Denton, in (43), pp. 383–
403.7. S. Stanley, Paleobiology, 18, 237 (1992).8. E. S. Vrba, in (44), pp. 24–48.9. T. D. White, in (44), pp. 369–384.
10. L. Bishop, thesis, Yale University, New Haven, CT(1994).
11. R. Bernor and M. Armour-Chelu, in African Biogeog-raphy, Climate Change and Early Hominid Evolution,T. Bromage and F. Schrenk, Eds. (Oxford Univ.Press, Oxford, UK, in press).
12. E. Delson, Courier Forschungsinst. Senkenb. 69,199 (1984).
13. A. Turner, Acta Zool. Cracov. 38, 45 (1995).14. iiii and B. Wood, J. Hum. Evol. 24, 147 (1995).15. C. S. Feibel, F. H. Brown, I. McDougall, Am. J. Phys.
Anthropol. 78, 595 (1989).16. F. H. Brown and C. S. Feibel, in (43), pp. 325–341;
F. H. Brown, in (44), pp. 319–330.17. F. H. Brown and C. S. Feibel, in (25 ), pp. 1–30.18. We included available published information on iden-
tifications of mammals from Pliocene-Pleistocene lo-calities of the northern Turkana Basin but excludedinformation on biostratigraphic ranges from other re-gions (we recognize that in some cases these rangesprovide different FADs or LADs for Africa as a whole).Some taxonomic groups, such as the Elephantidae[N. Todd, thesis, George Washington University,Washington, DC (1997)], the Suidae (10), and theEquidae (11), are being revised, and ongoing workwas incorporated where there is reference to north-ern Turkana Basin localities and specimens. TheEvolution of Terrestrial Ecosystems (ETE) Programdatabase is explained by J. Damuth [ETE DatabaseManual (ETE Consortium, Washington, DC, 1997)],and data relevant to this report are available ateteweb.lscf.ucsb.edu and www.sciencemag.org/feature/data/973775.shl
19. The end points of each species range were estab-lished as follows: (i) a table of taxa was constructedwith the use of all northern Turkana Basin localityrecords in the ETE database, (ii) bounding dates forthe age of a locality were transferred to the table asminimum and maximum dates for each taxonomicrecord, and (iii) all the records for each taxon frommultiple localities were sorted, and the oldest andyoungest dates were used to establish the biostrati-graphic range; thus, range lines in Fig. 3 are plottedbetween the maximum older date for the stratigraph-ic member or submember of first occurrence and theminimum younger date for the member or submem-ber of last occurrence. These dates represent theoldest date at which a taxon could have appearedand the youngest date at which it could have disap-peared based on currently available information.Nearly all species have continuous records throughthe members in each region between their FAD andLAD; that is, there are few breaks in the biostrati-graphic records based on this data set. Species firstrecorded in the upper, middle, or lower parts of thesame member are assigned the same FAD agebased on the date for the lower boundary or, forspecies last recorded in a member, a LAD age basedon the date for the upper boundary (unless there areintermediate dated horizons within the member). Wedid not interpolate dates for localities on the basis ofstratigraphic distance below or above dated tuffsbecause of the variability of sediment accumulationrates in fluvial and lacustrine deposits [P. M. Sadler,J. Geol. 89, 569 (1981)] and because the deposits in
Fig. 5. Plot of percentage of turnover (FADs plusLADs divided by the total number of species foreach interval) for the late Pliocene of the TurkanaBasin for the minimizing (solid line) and maximizing(dashed line) approaches. x2 values for each pairof points are shown below the turnover plots, withthe relative significance of changes in turnoverindicated by the horizontal dashed lines. Themarked peak between 2.5 and 2.1 Ma is at leastpartly a result of increased fossil abundance (Fig.4), but, between 2.1 and 1.7 Ma, the pattern rep-resents faunal turnover during a period of continu-ing high fossil abundance.
RESEARCH ARTICLE
www.sciencemag.org z SCIENCE z VOL. 278 z 28 NOVEMBER 1997 1593

the Turkana Basin have major disconformities repre-senting significant periods of time that may not beapparent in any particular stratigraphic section (15).
20. Geological and paleomagnetic analysis shows that120 m of lacustrine deposits below the KBS Tuff(dated at 1.88 6 0.02 Ma) and above the unconfor-mity are normally magnetized and thus younger thanthe base of the Olduvai Subchron (1.91 Ma). Feibel etal. (15 ) also correlate these lacustrine deposits to theShungura Formation in the Omo region, wherelacustrine sedimentation begins around 2.0 Ma. Onthe basis of both lines of evidence, they place thebase of the lacustrine deposits at East Turkana at 2.0Ma, which then requires a gap on the order of450,000 years between the upper and lower Burgimembers [this interpretation was reconfirmed byC. S. Feibel (personal communication)].
21. M. Beden, Les Faunes Plio-Pleistocenes de la Valleede l’Omo (Ethiopie), vol. 2, Les Elephantides (Cahiersde Palaeontologie, Editions du CNRS, Paris, 1987).
22. Y. Coppens and F. C. Howell, Les Faunes Plio-Pleis-tocenes de la Basse Vallee de l’Omo (Ethiopie), vol.1, Perissodactyles, Artiodactyles (Bovidae) (Cahiersde Palaeontologie, Editions du CNRS, Paris, 1985).
23. Y. Coppens and F. C. Howell, Les Faunes Plio-Pleis-tocenes de la Vallee de l’Omo (Ethiopie), vol. 3, Cer-copithecidae de la Formation de Shungura (Cahiersde Palaeontologie, Editions du CNRS, Paris, 1987).
24. J. M. Harris, Koobi Fora Research Project, vol. II, TheFossil Ungulates: Proboscidea, Perissodactyla, andSuidae (Oxford Univ. Press, New York, 1983).
25. J. M. Harris, Koobi Fora Research Project, vol. III,The Fossil Ungulates: Geology, Fossil Artiodactylsand Paleoenvironments (Oxford Univ. Press, NewYork, 1991).
26. J. M. Harris, F. H. Brown, M. G. Leakey, Contrib. Sci.399, 1 (1988).
27. H. B. Wesselman, Contrib. Vertebr. Evol. 7, 1 (1984).28. The maximizing approach ( Table 2) gives reasonable
benefit of doubt to all published taxonomic designa-tions and thereby maximizes the sample of rangescontributing to the analysis of faunal turnover. Themaximizing approach (i) treats each named taxonwith a distinct range as a separate entity but com-bines “Genus species” with Genus cf. species (samenames) if the range of one completely includes therange of the other; (ii) includes taxa designated bytribe or genus as species “A,” “B,” and so forth (forexample, Kobus sp. D, West Turkana); (iii) excludesrecords referred to only as “indet. sp.” under a familyor tribe name (for example, “indet. sp. Cercopitheci-dae”); (iv) retains taxa designated only as Genus“sp.” if this taxon provides unique range information,even when there are other named species of thesame genus; and (v) includes taxa from any of thethree regions. The minimizing approach representsour conservative assessment of the actual numbersof distinct taxa. The minimizing approach (i) com-bines named taxa that are likely to represent thesame species (for example, one range for Con-nochaetes gentryi and Connochaetes cf. gentryi ); (ii)eliminates all taxa referred to only as “sp. nov. A”; (iii)retains taxa identified only to genus (for example,Oryx sp.) if it is the only occurrence of that genus or ifit provides unique range information; (iv) combinesrecords for a genus under “Genus sp.” if this genusprovides a unique record of the range of that genus(for example, if the genus occurs in more than oneregion, but none of the species do); and (v) includesonly taxa that occur in more than one of the threefossiliferous regions (to reduce the effects of regionalsedimentation and taphonomy on FADs and LADs).{Similar conventions for the use of taxonomic infor-mation have been described by B. Van Valkenburghand C. Janis [in Species Diversity in Ecological Com-munities, R. E. Ricklefs and D. Schluter, Eds. (Univ.of Chicago Press, Chicago, IL, 1993), pp. 330–340],A. Turner and B. Wood (14), and J. Alroy (31).} Inspite of the differences between the maximizing andminimizing approaches, both approaches show es-sentially the same pattern between 3.3 and 1.5 Ma;correlation between the turnover percentages wassignificant at the 99% confidence interval [Pearson’s
correlation coefficient r 5 0.958 with 9 degrees offreedom (df )].
29. The range charts do not include taxa that were rep-resented at only one locality in the Turkana Basin(amounting to 80 out of the original 246 taxa in theraw data) because a sample size of one occurrenceis too small to contribute reliable information on thebeginning or end of a species’ range. To test whetherthis omission biased the analysis against FADscaused by short-lived migrations or evolutionaryevents connected with a turnover pulse between 2.8and 2.5 Ma, we analyzed turnover in the subset of 80single-locality taxa. Although there is a peak of 70%in FADs between 2.4 and 2.2 Ma (primarily the resultof rare taxa occurring in Omo Members E through G),there is an even distribution of 15 to 20% FADs from2.4 Ma back to 3 Ma. This even distribution arguesagainst a bias affecting turnover between 2.8 and2.5 Ma.
30. P. W. Signor and J. H. Lipps, Geol. Soc. Am. Spec.Pap. 190, 291 (1982); C. R. Marshall, Paleobiology23, 165 (1997).
31. J. Alroy, Palaeogeogr. Palaeoclimatol. Palaeoecol.127, 285 (1996); personal communication.
32. A Turkana Basin locality typically consists of a geo-graphically delimited concentration of fossils fromone or more source horizons. Number of localitiesrather than number of specimens (NISP) is used as ameasure of overall fossil abundance because NISP issubject to taphonomic biases that may have seriouseffects on relative abundance, such as inflationcaused by counting multiple bones from the sameskeleton [A. K. Behrensmeyer, in Taphonomy: Re-leasing the Data Locked in the Fossil Record, P.Allison and D. E. G. Briggs, Eds. (Plenum, New York,1991), pp. 291–335].
33. E. S. Vrba, in Fossils in the Making, A. K. Behrens-meyer and A. P. Hill, Eds. (Univ. of Chicago Press,Chicago, IL, 1980), pp. 247–271; (1); P. Shipmanand J. M. Harris, in (43), pp. 343–381; L. M. Spencer,J. Hum. Evol. 32, 201 (1997).
34. E. Delson, in Cambridge Encyclopedia of HumanEvolution, J. S. Jones, R. D. Martin, D. Pilbeam, S.Bunney, Eds. (Cambridge Univ. Press, Cambridge,UK, 1992), pp. 220–221; in Colobine Monkeys: TheirEcology, Behavior and Evolution, A. G. Davies andJ. F. Oates, Eds. (Cambridge Univ. Press, Cam-bridge, UK, 1985), pp. 11–43.
35. M. G. Leakey, in Theropithecus: The Rise and Fall ofa Primate Genus, N. Jablonski, Ed. (Cambridge Univ.Press, Cambridge, UK, 1993), pp. 85–123.
36. Taxonomic designations follow B. A. Wood [KoobiFora Research Project, vol. IV, Hominid Cranial Re-mains (Clarendon, Oxford, UK, 1991); G. Suwa, T. D.White, and F. C. Howell [Am. J. Phys. Anthropol.101, 247 (1996)]; and B. Wood et al. (45). AlthoughA. (P.) aethiopicus and H. rudolfensis are represent-ed by unusually complete crania, almost all othertaxonomically identified specimens in the 3- to 2-Mainterval are fragmentary maxillae or mandibulae orisolated teeth. On the basis of the latter specimens,these two taxa cannot easily be distinguished fromA. boisei and H. habilis, respectively. In the rangecharts used for this study, H. rudolfensis was thusplaced in H. cf. habilis, and, following Wood et al.(45), megadont hominid specimens older than 2.3Ma, most of which could represent A. (P.) aethiopi-cus, were placed in A. (P.) cf. boisei. In Table 2, A.aethiopicus would represent an additional LAD with-in the Hominidae at about 2.3 Ma, when it is replacedby A. boisei, if it were not included in the taxon “A. (P.)cf. boisei” (maximizing) or in “A.(P.) boisei” (minimiz-ing) to facilitate analysis of sampling biases.
37. R. Tiedemann, M. Sarnthein, N. J. Shackleton, Pa-leoceanography 9, 619 (1994).
38. R. Bonnefille and A. Vincens, in Recherches Fran-caises sur le Quaternaire Hors de France (Supple-mentary Bulletin 50/1, Association Francaise pourl’Etude du Quaternaire, Paris, 1977); R. Bonnefilleand R. Dechamps, in The Omo Group: Archives ofthe International Omo Research Expedition, J. deHeinzelin, Ed. (Musee Royal de l’Afrique Central, Ter-vuren, Belgium, 1983), pp. 191–207; R. Bonnefille, in
(44), pp. 299–310.39. T. E. Cerling, J. R. Bowman, J. R. O’Neil, Palaeo-
geogr. Palaeoclimatol. Palaeoecol. 63, 335 (1988);T. E. Cerling, Global Planet. Change 5, 241 (1992).
40. R. Potts, Humanity’s Descent: The Consequencesof Ecological Instability (Morrow, New York, 1996),pp. 114–124.
41. C. S. Feibel, J. M. Harris, F. H. Brown, in (25), pp.321–346.
42. R. Bobe, J. Vertebr. Paleontol. 16, 23A (1996); the-sis, University of Washington, Seattle (1997).
43. F. E. Grine, Ed., The Evolutionary History of the “Ro-bust” Australopithecines (Aldine, New York, 1988).
44. E. S. Vrba, G. H. Denton, T. C. Partridge, L. H.Burckle, Eds., Paleoclimate and Evolution, with Em-phasis on Human Origins ( Yale Univ. Press, NewHaven, CT, 1995).
45. B. Wood, C. Wood, L. Konigsberg, Am. J. Phys.Anthropol. 95, 117 (1994).
46. In plotting the pattern of FADs and LADs throughtime, we used the midpoint of each member (Fig. 2)and the midpoint of each 200,000-year interval (Fig.4) as the most objective representation of summeddata that are scattered throughout the time repre-sented by these intervals. This convention compen-sates in part for the clustering of FADs and LADs atthe beginnings and ends of members, which resultsfrom the use of member boundaries as estimates onspecies ranges. The total number of species for eachmember is based on counts of the continuing spe-cies plus any that appear or disappear in that mem-ber; species with a FAD and a LAD in the samemember are counted once. The same method ap-plies to the 200,000-year intervals in Fig. 4. Totalturnover was calculated with the cumulative recordsof FADs and LADs compared with the total numberof species for the entire time interval under consid-eration (3.0 to 1.8 Ma or 3.0 to 2.0 Ma) ( Table 2).
47. The FAD for Equus sp. is based on a lower first orsecond molar from Area 102, East Turkana, which isreported to be from “Zone C,” between the HasumaTuff (2.85 6 0.08 Ma) and the Lokalalei Tuff (2.52 60.05 Ma) [V. Eisenmann, in (24), pp. 156–214]. Thisearly date for Equus disagrees with other evidencethat places the FAD at about 2.3 Ma [Member G,Omo sequence (22)].
48. Member boundaries in each area do not fall at200,000-year intervals or at the same absolutetimes, and to construct the running fossil abundancetotals on the basis of numbers of localities, we usedthe proportion of total time spanned by a member foreach 200,000-year interval that it crossed. Thus, amember with 30 localities that covers 1/3 of one200,000-year interval and 2/3 of the adjacent intervalcontributes 10 localities to the first and 20 to thesecond of these intervals. The total for each intervalis then the sum of localities contributed by each ofthe three regions.
49. We thank P. San Miguel for assistance with the datainput; A. Cutler and R. Chapman for help with thestatistical tests; J. Alroy and C. Feibel for advice andaccess to unpublished data; J. Harris, B. Cooke, E.Weston, and L. Bishop for taxonomic information onthe Turkana Basin faunas; R. Bernor, R. Bobe, A.Gentry, E. Vrba, B. Wood, S. Suter, and severalanonymous reviewers for providing comments onthe manuscript; the governments of Kenya and Ethi-opia; research project leaders Y. Coppens and F. C.Howell (Omo) and R. E. Leakey and M. G. Leakey(East and West Turkana); and the many skilled anddedicated individuals who contributed to the docu-mentation, collection, curation, and publication ofthe fossil specimens on which this study is based.We gratefully acknowledge the National Museum ofNatural History and the Smithsonian Institution forsupport of the Evolution of Terrestrial EcosystemsProgram (ETE). This is publication 59 of the ETEProgram. Information on the ETE Database, includ-ing data relevant to this report, is available at eteweb.lscf.ucsb.edu and www.sciencemag.org/feature/data/973775.shl
14 July 1997; accepted 22 October 1997
SCIENCE z VOL. 278 z 28 NOVEMBER 1997 z www.sciencemag.org1594
Copyright © 2022 FDOKUMEN


![[ATR] Harmony In Turkana: A Case Of Faith Suffix gg Faith Root](https://static.fdokumen.com/doc/165x107/6325a4ed852a7313b70e9908/atr-harmony-in-turkana-a-case-of-faith-suffix-gg-faith-root.jpg)