Late Pleistocene vegetation and climate history of Lake Selina, western Tasmania
19
Quaternary International 57/58 (1999) 5—23 Late Pleistocene vegetation and climate history of Lake Selina, western Tasmania Eric A. Colhoun!,*, Jeremy S. Pola!, Charles E. Barton", Henk Heijnis# !Department of Geography and Environmental Science, The University of Newcastle, University Drive, Callaghan, NSW 2308, Australia "Australian Geological Survey Organisation, GPO Box 378, Canberra, ACT 2601, Australia #Environmental Radiochemistry Laboratory, Australian Nuclear Science and Technology Organisation, PMB 1, Menai, NSW 2234, Australia Abstract Analysis of pollen, NRM intensity of sediments, and dating of a 397 cm core from Lake Selina in western Tasmania provides a detailed record of vegetation and climate changes for the Last Interglacial—Last Glacial cycle. The vegetation record shows that cool temperate rainforest was present during Isotope Substage 5e and during the Holocene. Wet montane forest and subalpine shrublands dominated the early Last Glacial interstades; subalpine—alpine heathlands and herbfield the stadials. Stages 4—2 mainly had grassland, herbland and heath vegetation. There is close correlation between phases of maximum magnetic intensity in the sediments with pollen zones indicating presence of herbaceous vegetation. This suggests erosion of the catchment was greater in the absence of forest or woodland. Climate may have been slightly cooler than present during Substage 5e but the evidence is not definitive. Climate was colder at all times during the Last Glacial Stage until after ca. 14 kyr BP. Maximum temperature depression from present during Stage 2 was ' 3.5°C at Lake Selina, but probably as much as 6.5°C in the West Coast Range. Holocene climate was cool and wet. Comparison of the Lake Selina record, with others in western Tasmania and Victoria, indicate that variations in vegetation during the Last Interglacial—Last Glacial cycle were primarily responses to temperature changes in western Tasmania, and to precipitation changes, particularly summer drought, in western Victoria. ( 1999 INQUA/Elsevier Science Ltd. All rights reserved. 1. Introduction Long records of Australian pollen sequences have been obtained mainly in regions considerably removed from the direct effects of glaciation, viz., the humid to sub- humid regions of the Atherton Tableland in Queensland (Kershaw, 1986, 1994), the sub-humid Canberra area, at Lake George (Singh and Geissler, 1985), the western plains area of Victoria, at Lake Terang and at Lake Wangoom (Edney et al., 1990; Kershaw et al., 1991; D’Costa and Kershaw, 1995) and southeastern South Australia, at Lake Leake and Wyrie Swamp (Dodson, 1975, 1977). In these regions, variation in precipitation through time seems to be the primary factor that induces vegetation changes, and, by inference, climatic changes. Between western Victoria and Tasmania two sites bridge the gap, and provide information from the western part of Bass Strait on vegetation and climate changes * Corresponding author. from the Penultimate glaciation to present. One is mar- ine core E55-6, from 200 m depth 40 km southwest off Cape Bridgewater, near Portland (Harle, 1996). The second is a sequence of cores from Egg Lagoon in north- ern King Island (D’Costa et al., 1993). In humid northwestern Tasmania, several sediment sequences at Pulbeena, Mowbray, and Broadmeadows swamps provide relatively long climatic histories, but, unfortu- nately, the changes in regional forest vegetation are largely masked by those of the local swamp vegetation (Colhoun et al., 1982; van de Geer et al., 1986). Contrasting with mainland Australia, and the western Bass Strait region, the mountains of the West Coast Range had local ice caps, valley, and cirque glaciers during several periods of Quaternary glaciation (Colhoun, 1985a; Colhoun and Fitzsimons, 1990). Re- cords of Last Interglacial vegetation and climate have been described from Pieman Damsite (Colhoun, 1980), and Smelter Creek (Colhoun et al., 1992). Relatively long sequences, recording terrestrial vegetation and climate changes, occur at Tullabardine Dam, and Newall Creek 1040-6182/99/$20.00 ( 1999 INQUA/Elsevier Science Ltd. All rights reserved. PII: S 1 0 4 0 - 6 1 8 2 ( 9 8 ) 0 0 0 4 6 - 9
Transcript of Late Pleistocene vegetation and climate history of Lake Selina, western Tasmania

Quaternary International 57/58 (1999) 5—23
Late Pleistocene vegetation and climate history of Lake Selina,western Tasmania
Eric A. Colhoun!,*, Jeremy S. Pola!, Charles E. Barton", Henk Heijnis#
!Department of Geography and Environmental Science, The University of Newcastle, University Drive, Callaghan, NSW 2308, Australia"Australian Geological Survey Organisation, GPO Box 378, Canberra, ACT 2601, Australia
#Environmental Radiochemistry Laboratory, Australian Nuclear Science and Technology Organisation, PMB 1, Menai, NSW 2234, Australia
Abstract
Analysis of pollen, NRM intensity of sediments, and dating of a 397 cm core from Lake Selina in western Tasmania providesa detailed record of vegetation and climate changes for the Last Interglacial—Last Glacial cycle. The vegetation record shows that cooltemperate rainforest was present during Isotope Substage 5e and during the Holocene. Wet montane forest and subalpine shrublandsdominated the early Last Glacial interstades; subalpine—alpine heathlands and herbfield the stadials. Stages 4—2 mainly had grassland,herbland and heath vegetation. There is close correlation between phases of maximum magnetic intensity in the sediments with pollenzones indicating presence of herbaceous vegetation. This suggests erosion of the catchment was greater in the absence of forest orwoodland. Climate may have been slightly cooler than present during Substage 5e but the evidence is not definitive. Climate wascolder at all times during the Last Glacial Stage until after ca. 14 kyr BP. Maximum temperature depression from present duringStage 2 was '3.5°C at Lake Selina, but probably as much as 6.5°C in the West Coast Range. Holocene climate was cool and wet.Comparison of the Lake Selina record, with others in western Tasmania and Victoria, indicate that variations in vegetation during theLast Interglacial—Last Glacial cycle were primarily responses to temperature changes in western Tasmania, and to precipitationchanges, particularly summer drought, in western Victoria. ( 1999 INQUA/Elsevier Science Ltd. All rights reserved.
1. Introduction
Long records of Australian pollen sequences have beenobtained mainly in regions considerably removed fromthe direct effects of glaciation, viz., the humid to sub-humid regions of the Atherton Tableland in Queensland(Kershaw, 1986, 1994), the sub-humid Canberra area, atLake George (Singh and Geissler, 1985), the westernplains area of Victoria, at Lake Terang and at LakeWangoom (Edney et al., 1990; Kershaw et al., 1991;D’Costa and Kershaw, 1995) and southeastern SouthAustralia, at Lake Leake and Wyrie Swamp (Dodson,1975, 1977). In these regions, variation in precipitationthrough time seems to be the primary factor that inducesvegetation changes, and, by inference, climatic changes.
Between western Victoria and Tasmania two sitesbridge the gap, and provide information from the westernpart of Bass Strait on vegetation and climate changes
*Corresponding author.
from the Penultimate glaciation to present. One is mar-ine core E55-6, from 200 m depth 40 km southwest offCape Bridgewater, near Portland (Harle, 1996). Thesecond is a sequence of cores from Egg Lagoon in north-ern King Island (D’Costa et al., 1993). In humidnorthwestern Tasmania, several sediment sequences atPulbeena, Mowbray, and Broadmeadows swampsprovide relatively long climatic histories, but, unfortu-nately, the changes in regional forest vegetation arelargely masked by those of the local swamp vegetation(Colhoun et al., 1982; van de Geer et al., 1986).
Contrasting with mainland Australia, and the westernBass Strait region, the mountains of the West CoastRange had local ice caps, valley, and cirque glaciersduring several periods of Quaternary glaciation(Colhoun, 1985a; Colhoun and Fitzsimons, 1990). Re-cords of Last Interglacial vegetation and climate havebeen described from Pieman Damsite (Colhoun, 1980),and Smelter Creek (Colhoun et al., 1992). Relatively longsequences, recording terrestrial vegetation and climatechanges, occur at Tullabardine Dam, and Newall Creek
1040-6182/99/$20.00 ( 1999 INQUA/Elsevier Science Ltd. All rights reserved.PII: S 1 0 4 0 - 6 1 8 2 ( 9 8 ) 0 0 0 4 6 - 9

Fig. 1. Location of Lake Selina, western Tasmania, showing the last glacial maximum ice limits north of the Tyndall Mountains and southeast ofMount Murchison.
(Colhoun and van de Geer, 1986; van de Geer et al.,1989). Recently, van de Geer et al. (1994) have describedthe vegetation and climate change for western Tasmaniaduring the last 75 kyr from marine core SO 36-7SL,
50 km west of the entrance to Macquarie Harbour.The Lake Selina core, to be described, provides a re-cord from ca. 130—0 kyr without sedimentary break,and provides a sequence of pollen, inferred vegetation,
6 E.A. Colhoun et al. / Quaternary International 57/58 (1999) 5—23

palaeomagnetic, and climatic changes that are moreclearly defined than at most Australian sites.
In February 1993, a core was taken from the centre ofLake Selina (41° 53@S; 145° 36@E). Lake Selina lies at516 m altitude in the West Coast Range, 2.5 km beyondthe terminal moraines marking the Late Wisconsin(Margaret) Glaciation ice limits, north of Lake Rolleston(Fig. 1). The core was analysed for sediment and pollencharacteristics in the Palynology Laboratory of theGeography Department, University of Newcastle, NSW,and for downcore magnetic variations at the Geomag-netic Laboratory of the Australian Geological SurveyOrganisation. The sediments were dated at the Mac-intosh Centre for Quaternary Dating, Sydney University,and at the Australian Nuclear Science and TechnologyOrganisation, Lucas Heights.
This paper reports and discusses the results of the strati-graphic, dating, pollen analytic, and palaeomagnetic in-vestigations in the regional setting of formerly glaciatedwestern Tasmania, and suggests their implications forlate Quaternary climate changes. The pollen, vegetation,palaeomagnetic and palaeoclimatic records are corre-lated with the isotope calibrated marine core SO 36-7SL,taken 50 km off the entrance to Macquarie Harbour (vande Geer et al., 1994), with the Vostok ice core, Antarctica,and with marine core RC11-120, from the southwestern,sub-polar, Indian Ocean (Jouzel et al., 1987, 1989;Martinson et al., 1987). The vegetation and climate his-tory are compared with records from selected sites inwestern Tasmania and western Victoria.
2. Environment
Lake Selina occurs at 516 m in the West Coast Range,which attains altitudes of 1100—1268 m. Glaciers, fromTyndall and Huntley cirques (Fig. 1), flowed northwardsthrough the Anthony Valley, and northwestwards acrossLake Selina during the Pleistocene (Bowden, 1974;Colhoun, 1985a). During the Late Wisconsin ((25,000and '14,000 yr BP, or Last Glacial Maximum, LGM),ice extended only to the Rolleston and Tyndall endmoraines. Moraines southeast of Mt Murchison are con-sidered to be the same age. There are no dated depositsassociated with these moraines. A radiocarbon assayfrom Newton Creek Valley of '33,950 yr BP. (Beta21759), on wood from an organic bed, shows it was notice covered during the Late Wisconsin, and that it wasglaciated earlier (Colhoun, 1985a; Colhoun et al., 1993).Thus, deposits in Lake Selina should contain a palaeoen-vironmental record that extends through Late Wisconsintime and perhaps to the Penultimate (Henty) Glaciation.
Lake Selina occupies a small basin eroded in Or-dovician Owen Conglomerate that forms the WestCoast Range. The conglomerates have produced acid,nutrient-deficient, podzol and peaty podzol soils on
the slopes, and peat on the poorly drained floor of thebasin.
The climate of the West Coast Range is very humidwith over 3600 mm/yr at Lake Margaret on the exposedwestern slopes. Protection, by 700—800 m-high hills, re-duces precipitation at Lake Selina to about 3200 mm/yr.Precipitation falls on about 230—240 days per year. Morethan 100 mm falls in all months, and more than 250 mmin July and August. Snow falls frequently in the moun-tains during winter, but lies only for a few days at a time.At Lake Selina mean February temperature is ca. 13.5°Cand July ca. 5°C. On the adjacent 1000 m-high TyndallPlateau, temperatures would be ca. 10°C in Februaryand ca. 1.6°C in July. Cold air drainage, frosts, and fogscan occur any time of year.
Lake Selina lies within the region of western Tasmaniathat would, in the absence of fire, be climatic climaxNothofagus cunninghamii temperate rainforest (Jackson,1965, 1968). N. cunninghamii lowland forest, with Phyl-locladus aspleniifolius, Athrotaxis selaginoides, Athero-sperma moschatum and Eucryphia lucida, can occur toca. 610—620 m altitude. Between 610—620 and 850 m, themontane forest has more Phyllocladus, Athrotaxis andEucryphia. Above 850 m, subalpine forest, which maycontain several species of endemic conifer, includingDiselma archeri, Athrotaxis cupressoides, Athrotaxis laxi-folia, A. selaginoides, and ¸agarostrobos franklinii occurs.There are also areas of Eucalyptus nitida woodland,scrub, and heath that extend to an irregular treelinebetween 950 and 1030 m. Above 950—1030 m, alpineherbland, conifer heath, and bolster plants occur. Donatianovae-zelandiae forms 90% of bolster plants, and Micro-cachrys tetragona and Diselma archeri are widespreadalpine shrubs. Interestingly, Microstrobos niphophilous,which is recorded abundantly in pollen diagrams, is notrecorded by Kirkpatrick (1977a) in the West Coastregion, though it occurs in central and east-centralTasmania.
Around much of Lake Selina poor drainage and burn-ing by aborigines and mineral prospectors (Kirkpatrick,1977b) has produced disclimax scrub and heath. Thescrub is up to 5 m high, and contains ¸eptospermumnitidum, Melaleuca squamea, Acacia mucronata, Monotocaglauca, Bauera rubioides, Agastachys odorata, Cenar-rhenes nitida and ¹elopea truncata. The heath is 1 m high,and consists mainly of Sprengelia incarnata, ¸. nitidum,M. squamea, and the sedge Gymnoschoenus sphaero-cephalus. Eucryphia milligania, the subalpine variant ofE. lucida, occurs on the western shore of the lake, whereit has been protected from fire.
East of the lake, 15—20 m-high wet forest occurs on lowrocky promontories, and consists of E. nitida and ¸.nitidum, with an understorey of M. glauca, A. mucronata,Banksia marginata, C. nitida, and Allocasuarina monili-fera, plus Gahnia grandis and Pteridium esculentum.Southwest of the lake a 15—20 m-high ¸. nitidum
E.A. Colhoun et al. / Quaternary International 57/58 (1999) 5—23 7

swamp forest occurs. The forested areas have probablynot been burnt for 40—50 yr, but the scrub and heath havebeen burnt about every 10 and 5 yr, respectively.
Lake fringe vegetation is restricted to Eleocharissphacelata in the southwest, and Restionaceae spp.in the west and north. Aquatics comprise mainly Juncussp., Isoetes cunninghamii, Myriophyllum amphibium,M. elatinoides, and Carex fluitans.
3. Stratigraphy, dating, and sedimentation
A 347 cm core of sediment was taken from the centre ofthe lake in a depth of 6.5 m water using a 6 m Mackerethcorer. Allowing for no recovery of the surface sedimentby the Mackereth, a depth of 50 cm was assumed for thetop of the long core. To recover the near-surface sedi-mentary record, a short, 40 cm deep core was also taken.Thus, a total of 387 cm of sediment was extracted fromthe lake and an assumed gap of 10 cm separates the shortand long core records. Apart from the gap, we considerthat the entire Holocene sediment record has been ob-tained. The Mackereth corer bottomed in a hard, basalhorizon of humate-and-iron-cemented clay with a blockyangular structure, which presumably directly overliesmorainic deposits or conglomerate. This was taken to bethe base of the lake sediments.
The upper deposits (Fig. 2) consist of black-to-darkbrown coloured, gelatinous, organic-rich lake mud fromthe surface to 132.5 cm depth. The combustible organicmatter varies from 13—40%. These muds are underlain bymedium-to-dark grey coloured, markedly laminated,weakly organic silts to 300 cm depth. Thin horizons ofdetrital charcoal are observable in the silts, but the com-bustible organic matter is usually only 1—3%. From 300to 352 cm, the deposits consist of very dark grey-to-blackorganic silts weakly laminated in places; the combustibleorganic matter varies from 2—8%. The basal horizons ofthe core, between 352 and 397 cm, consist of very darkbrown-to-black massive organic silt. Except near thesurface, this section contains the highest quantity of or-ganic matter in the core, that varies from 14 to 31%.
Radiocarbon dating of the sediment has been difficult.Samples were extracted from 123—127, 294—296, 352—55and 395—397 cm depths, and assayed by the conventionalradiocarbon method after acid—alkali—acid pretreatment.An assay of 14,200$230 yr BP (SUA 3040) dates thecommencement of deposition of the surface organic-richmud. Assays at lower levels are reversed. The oldestassay, from 294—296 cm, was 52,110$5800 yr BP (SUA3041), corresponding to an age of between 40,510 and63,710 at the 95% probability level, though the trends ofthe magnetic intensity curve (Fig. 5) and the ratio-curveof woody to herb taxa (Fig. 6) suggest correlation withIsotope Substage 5b. The deposits below this level areconsidered to be beyond the range of radiocarbon dating
Fig. 2. Stratigraphy and combustible organic content of the LakeSelina core.
and the low assays are attributed to contamination. Thehumus-iron hardened clay in the basal horizons indicatesdownward movement of humic acid and perching on theimpermeable till or conglomerate substratum. Down-profile movement of humic acids to give basal sampleassays younger than higher sample assays is common inhumid western Tasmania (Colhoun, 1986).
To improve the dating of the middle part of the core,similar samples were taken, within 1 cm core length,at 150, 165, and 230 cm depth, and assayed at theANTARES Mass Spectrometry Laboratory of theAustralian Nuclear Science and Technology Organisa-tion, Lucas Heights. The samples were pretreated beforeAMS assay as follows. The silt samples were crushed toa fine powder, treated with 10% HCl (5 ml) and heated at60°C for 1 h. The acid was decanted and the silt waswashed 3 times with deionised water before drying over-night in an oven at 80°C. one gram of the sample from150 cm depth was combusted at 900°C in a flow of
8 E.A. Colhoun et al. / Quaternary International 57/58 (1999) 5—23

Table 1Radiometric data obtained from lake selina sediments
Sample LH-no. Sample depth (cm) U-234 (dpm/g) U-238 (dpm/g) Th-232 (dpm/g) Th-230 (dpm/g)
4261 283 0.581$0.023 0.297$0.01 0.392$0.023 0.501$0.0274262 323 0.497$0.022 0.284$0.01 0.399$0.021 0.427$0.0234263 375 0.702$0.046 0.426$0.03 1.776$0.027 0.637$0.030
Fig. 3. Regression of 14C sample ages with depth in core.
oxygen and the CO2
was purified by passing throughsolutions of potassium iodide/iodine, silver nitrate andpotassium dichromate. The small samples from 165 and230 cm depths were combusted in a sealed tube in thepresence of CuO, Cu and Ag wire. The samples weregraphitised using iron at 600°C in the presence of zinc at400°C.
We consider that the results of 18,250$200 yr BP(OZA 236U) and 18,900$220 yr BP (OZA 237U) pro-vide good estimates of the age of what is interpreted fromthe vegetation history as the phase of maximum coldduring the Late Wisconsin Glaciation. The result for230 cm depth is 33,800$1100 yr BP (OZA 238U),though the age could be older because both the magneticintensity curve and the ratio-curve of woody to herb taxaindicate an early Isotope Stage 3 age.
A plot of the 14C values versus depth, not allowing forcompaction, produces a straight line, which suggests thatthe top of the deposit dated at 0 yr BP lies at ca. 65 cmdepth and that the base of the deposit has an age of ca.70 kyr BP (Fig. 3). However, the surface organic muds,which have not been dated, are much less compact thanthe underlying silts, being very fluid in the top 5 cm andcontaining considerable moisture throughout. Thus, sedi-mentation rates for the near-surface organic silts musthave been greater than for the underlying silts, and exten-sion of the regression line through 65 cm is not correct.
Conversely, extrapolation of the regression line to in-tercept the y-axis at 70 kyr BP is likely to under-repre-sent the age of the base of the deposit, as the organic-richbasal silts have been compressed by the lake silts. Thecomparability in form of both the magnetic intensity
curve (Fig. 5), and the ratio-curve of woody to herb taxa(Fig. 6), with the d18O curve for the Vostok ice core,indicates that the strong increase in herbaceous taxabetween 240 and 270 cm depth probably occurred duringIsotope Stage 4, the early Last Glacial cold stadial. Sim-ilarly, the five fluctuations below 270 cm in the ratio-curve of woody to herb taxa probably occurred duringIsotope Substages 5a—5e, the earliest part of the LastGlacial (5a—5d) and the Last Interglacial Stage (Jouzelet al., 1987, 1989; Vostok Project Members, 1995).
Six samples were taken for Uranium-series dating andsubmitted to the Environmental Radiochemistry Labor-atory of ANSTO at Lucas Heights. Samples were com-busted and the ashes leached. The leachate was putthrough ion-exchange columns to separate uranium fromthorium. Radioactive sources were prepared by electro-plating the uranium and thorium salts onto stainless-steel disks. The sources were counted in high-resolutionalpha-spectrometers for at lest three days to get goodcounting statistics. Rsults are shown in Table 1.
Series of three samples were taken from layers of ap-proximate identical ages to correct for envronmentalthorium (i.e. Th at the time of deposition) Heijnis and vander Plicht, 1992). The top three samples, taken at 88, 112,and 168 cm depths did not provide age assays, appar-ently because of movement of uranium/thorium in theupper part of the Selina core. Samples taken from 283,323 and 375 cm depths (estimated as Isotope Substages5a, 5c and 5e) generated a positive slope line on theregression of 234U/232Th against 238U/232Th, and230Th/232Th against 234U/232Th (Fig. 4a and b)indicating that the system was geochemically closedwith regard to uranium and thorium. The slopes area measure of the environmental-thorium-corrected ratios(Schwarcz and Latham, 1988). The slopes allowed us tocalculate a corrected composite age of 160$20 ka.
Although the dating has not produced an age of highprecision, the results confirm Lake Selina was not occu-pied by ice during the LGM, and that the Rolleston andTyndall end moraines mark the LGM ice limit. Thedating also shows that the base of the Lake Selina core isolder than indicated by the regression fitted to theradiocarbon dates, and is compatible with the lowersediments being of Isotope Substages 5a—5e in age. Thus,Lake Selina provides the longest continuous record ofvegetation and climate history to date for the West CoastRange region of Tasmania.
E.A. Colhoun et al. / Quaternary International 57/58 (1999) 5—23 9

Fig. 4. (a) Isochron plot for smaples 283, 323 and 375 cm depths and 234U/232Th against 238U/232Th. (b) Isochron plot for smaples 283, 323 and375 cm depths and 230U/232Th against 234U/232Th.
Estimation of sedimentation quantities versus age inthe core (Table 2) can be inferred from the type of sedi-ment and its field characterisitics, the regression of Fig. 3,and correlation of the magnetic intensity and ratio-curveof woody to herb taxa (Figs. 5 and 6) with the curve forisotope stages, and age estimates of the stage boundaries(Martinson et al., 1987).
Each sedimentation quantity versus age was calculatedby taking the inter-sample core length and dividing it bythe difference between the bracketing 14C assays, to givean average value in cm/kyr. The results show that the lateglacial and Holocene organic-rich deposits, which con-tain considerable water, are much less compact than theunderlying sediments. The values for the underlying silts
10 E.A. Colhoun et al. / Quaternary International 57/58 (1999) 5—23

Table 2Estimated sedimentation quantity versus ages
Depth 14C Assay Isotope Stage and Sample assay Sediment quantity(cm) (kyr BP) lower boundary relative to cm/kyr.
(kyr BP) isotope stage Martinson et al.(kyr BP) (1987) curve
0 0.01, 12 8.1 (8.8 ex.core gap)
125 14.2150 18.25 2, 24 6.2165 18.9 20.0230 33.8 57.65 4.4 (1.68)
3, 594, 745a, 795b, 96
295 52.1 83.25 3.55 (2.0 or 2.54)
decrease with depth, except around the time of the LGMabout 18—19 kyr BP. The data suggest high rates ofmineral input during the LGM, due to erosion of thecatchment, which probably explains the strong peak inmagnetic intensity. Although, Fig. 2 shows a linear rela-tionship between 14C asssay and depth, the sedimenta-tion quantity versus assay values show evidence of eithervariation in rate of sedimentation, or increase in compac-tion with depth. The low organic content (Fig. 2), andsimilar quartz-rich lithology, throughout the silt indi-cates compaction is the more likely explanation. As thecurve of magnetic intensity (Fig. 5) and the ratio-curve ofwoody to herb taxa co-vary with the d18O Vostok icecore, and the basal sediments are seen to be compacted,some further measure of compaction can be obtained byrecalculating the sediment quantities in cm/kyr by lin-early interpolating an assay-age estimate for samples 230and 295 cm depth from Indian Ocean Core RC11-120(Martinson et al., 1987). The first quantity in bracketsgives the quantity per 103 yr that accumulated between18.9 kyr BP and the estimated isotope age, and thesecond quantity at 295 cm depth gives the quantity thataccumulated between the two estimated isotope ages.Either way, the quantity per kyr is much less than thatcalculated by using the bracketing 14C assays. The dataindicate, that although sedimentation rates are not deter-minable absolutely, the lower part of the core spansa longer period of time than indicated by the 14Cassays, the lower two of which are near the limit ofdetermination.
4. Palaeomagnetic record
Downcore measurements of the intensity of the naturalremanent magnetisation (NRM) of the core were made asa prelude to later palaeomagnetic analysis. The results
(Fig. 5) show relatively close correspondence betweenmagnetic intensity and the nature of the sediments, withlow intensities in the more organic surface and basalsediments. Between 135 and 270 cm depths, magneticintensities fluctuate considerably. The highest peaksmainly reflect the occurrence of more mineralogenic sedi-ments and the lows more organic-rich sediments. Thestrongest peak coincides with the dated LGM at18—19 kyr BP. This is not an unique occurrence, as asimilar strong peak occurs at Lake Echo in easternTasmania. The fluctuations of NRM intensity (Fig. 4)coincide closely with the pollen zones, and values seem tovary inversely with the quantity of pollen of woody taxapresent. The pattern suggests least erosion during theHolocene and Last Interglacial, and most during IsotopeStages 2—4, and 4, and Substages 5b and 5d times.
5. Pollen analysis
Sediment samples of 1 cm3 were taken at 5 cm inter-vals. Spore tablets of ¸ycopodium clavatum were added tothe samples to control processing and to provide a nu-merical estimate of concentration (Stockmarr, 1971). Thesamples were processed using the Faegri and Iversenmethod (1975). The pollen, ¸ycopodium clavatum spores,and black opaque fragments of '20 lm size (cf. char-coal) were identified and counted using a Zeiss Axiophotmicroscope at 200], and at 400] and 1000] under oilfor closer identification. Pollen types were determinedusing the reference collection in the Department ofGeography, University of Newcastle; a duplicate of thatin the School of Plant Science, University of Tasmaniaprepared by M.K. Macphail. The pollen sum comprises'300 grains of dryland terrestrial taxa. Pollen of sedges,aquatic plants, spores of ferns, mosses, and lycopods,and fossil algae were excluded. The pollen counts were
E.A. Colhoun et al. / Quaternary International 57/58 (1999) 5—23 11

Fig. 5. Whole-core natural remanent magnetisation (NRM) intensitywith depth in core. Pollen zones indicated
computed using the POLLDATA MK 5 program (Birksand Huntley, 1978) to produce the relative pollen dia-gram (Fig. 6). The diagram has been divided into localpollen zones on the basis of importance of rainforest treetaxa, and herb-plus-alpine and subalpine shrub taxa.Taxonomy of the modern vegetation follows Curtis(1963, 1967), and Curtis and Morris (1975), with updatingto Buchanan (1995).
The key pollen/vegetation assemblages represented areas follows
Pollen Zone LS 1 (355—397 cm): The zone is dominatedby pollen of rainforest taxa (peak 73%), with Nothofagusand Phyllocladus more abundant than during Zone LS10 in the Holocene. ¸agarostrobos attains its maximumfor the profile. In addition, mesic and sclerophyll smalltrees including Cenarrhenes, Banksia, Agastachys, Cas-uarina, probably (Allocasuarina monilifera), ¹elopea, otherProteaceae and Monotoca are also important. There arevery few herbs.
Pollen Zone LS 2 (325—355 cm): The relative abund-ance of rainforest pollen ((25%) is much reduced fromZone LS 1, and consists almost entirely of Nothofagusand Phyllocladus. Casuarina, together with Epacrida-ceous shrubs, ¸eptospermum, and Melaleuca comprise theother shrub/tree taxa. A peak of the upper subalpine-alpine shrub conifer Microstrobos, and peaks ofAsteraceae, Chenopodiaceae and Poaceae occur.
Pollen Zone LS 3 (310—325 cm): Phyllocladus pollenbecomes equal to or relatively more abundant thanNothofagus, and both increase from Zone LS 2. There isa small peak of ¸agarostrobos, which adds to the totalpollen (40—45%) of rainforest taxa. Other prominentwoody taxa include Casuarina, Epacridaceae, ¸eptosper-mum and Melaleuca. Pollen of Microstrobos niphophilus,Asteraceae and Poaceae are less well represented than inZone LS 2.
Pollen Zone LS 4 (290—310 cm): The relative abund-ance of rainforest pollen, notably Nothofagus and Phyl-locladus, is much less than in Zone LS 3, and varies from18—27%. Casuarina, Epacridaceae, ¸eptospermum andMelaleuca remain prominent. Strong peaks of Micro-strobos and N. gunnii, both indicative of cold alpine-subalpine climate, are important. In addition, Asteraceaeforms a very strong peak, and Poaceae are more abun-dant than in Zone LS 3.
Pollen Zone LS 5 (270—290 cm):In Zone LS 5 pollen ofthe rainforest taxa Phyllocladus and Nothofagus increaseagain, and with a strong peak of ¸agarostrobos attaina maximum of 45%. The treefern Cyathea australis, Cas-uarina, ¸eptospermum and Melaleuca become important,but Epacridaceae are less abundant than in Zone LS 4.Asteraceae, Chenopodiaceae and Poaceae are low, butMicrostrobos is important.
Pollen Zone LS 6 (235—270 cm): Rainforest, treefernand mesic tree pollen types are reduced to trace amounts,with Casuarina being the most important at (5%.The zone is dominated by herbs (47%) with Asteraceae,Gramineae and Chenopodiaceae important. There isa strong peak of the cold climate umbel Dichosciadiumranunculaceum. Epacridaceae, ¸eptospermum andMelaleuca are consistently present at (10%. In addi-tion, the podocarp Microstrobos is strongly representedthroughout the zone, while Nothofagus gunnii is stronglyrepresented in the lower half, and small peaks of ¹asman-nia lanceolata and Microcachrys tetragona occur. The fossilAsteraceae pollen species ¹ubulifloridites pleistocenicus
12 E.A. Colhoun et al. / Quaternary International 57/58 (1999) 5—23
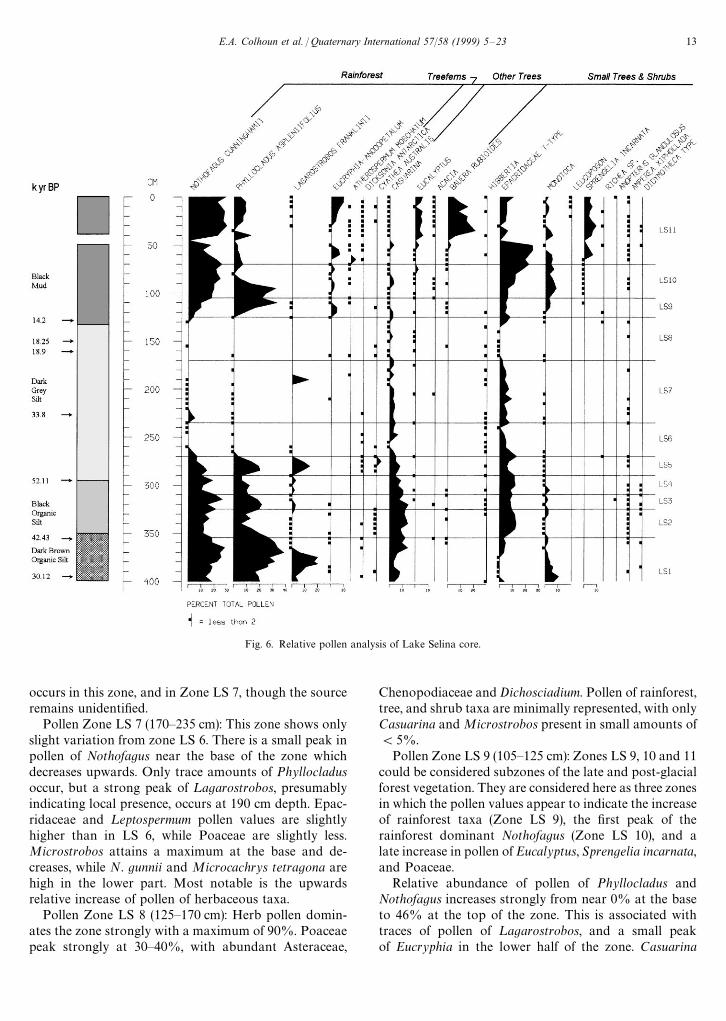
Fig. 6. Relative pollen analysis of Lake Selina core.
occurs in this zone, and in Zone LS 7, though the sourceremains unidentified.
Pollen Zone LS 7 (170—235 cm): This zone shows onlyslight variation from zone LS 6. There is a small peak inpollen of Nothofagus near the base of the zone whichdecreases upwards. Only trace amounts of Phyllocladusoccur, but a strong peak of ¸agarostrobos, presumablyindicating local presence, occurs at 190 cm depth. Epac-ridaceae and ¸eptospermum pollen values are slightlyhigher than in LS 6, while Poaceae are slightly less.Microstrobos attains a maximum at the base and de-creases, while N. gunnii and Microcachrys tetragona arehigh in the lower part. Most notable is the upwardsrelative increase of pollen of herbaceous taxa.
Pollen Zone LS 8 (125—170 cm): Herb pollen domin-ates the zone strongly with a maximum of 90%. Poaceaepeak strongly at 30—40%, with abundant Asteraceae,
Chenopodiaceae and Dichosciadium. Pollen of rainforest,tree, and shrub taxa are minimally represented, with onlyCasuarina and Microstrobos present in small amounts of(5%.
Pollen Zone LS 9 (105—125 cm): Zones LS 9, 10 and 11could be considered subzones of the late and post-glacialforest vegetation. They are considered here as three zonesin which the pollen values appear to indicate the increaseof rainforest taxa (Zone LS 9), the first peak of therainforest dominant Nothofagus (Zone LS 10), and alate increase in pollen of Eucalyptus, Sprengelia incarnata,and Poaceae.
Relative abundance of pollen of Phyllocladus andNothofagus increases strongly from near 0% at the baseto 46% at the top of the zone. This is associated withtraces of pollen of ¸agarostrobos, and a small peakof Eucryphia in the lower half of the zone. Casuarina
E.A. Colhoun et al. / Quaternary International 57/58 (1999) 5—23 13

Fig. 6. Contd.
decreases and the mesic tree Pomaderris apetala increasesmarkedly in mid-zone, as does Monotoca. Epacridaceae,¸eptospermum and Melaleuca all increase, but the alpineshrubs Microcachrys, Microstrobos, and N. gunnii de-crease, as do Asteraceae and Poaceae.
Pollen Zone LS 10 (70—105 cm): Rainforest pollen,especially Phyllocladus, attains a maximum (55%) in thelower part while Nothofagus increases to its maximum atthe top. Pomaderris, Monotoca, and Banksia attain maxi-ma while Poaceae is scarcely present. Asteraceae de-crease, but may represent shrubs or small trees ratherthan herbs. ¸eptospermum, probably ¸. nitidum, isstrongly represented.
Pollen Zone LS 11 (0—40; 50—70): Zone 11 differs fromZone 10 by the presence of pollen and spores of a numberof taxa not present in Zone 10 in any quantity. Traces of¸agarostrobos occur in the upper part while small
amounts of the treefern Dicksonia antarctica occurthroughout. Eucalyptus, and Bauera contribute about5—10% and 20% of the pollen, while Poaceae is higherthan in Zone LS 10. Pollen of Pomaderris, Monotoca andBanksia is less than in Zone LS 10. Pollen of heath plantsin the families Epacridaceae, including notably Spren-gelia, and Restionaceae increase.
6. Pollen concentration
There are large differences in the pollen concentrationsin the different zones that could relate to sediment com-paction (Fig. 6). Table 1 suggests that compaction in-creases downwards in the dark grey silt, and that thebasal more organic-rich silts are strongly compacted.The maximum concentration of 65—100]103 grains/cm3
14 E.A. Colhoun et al. / Quaternary International 57/58 (1999) 5—23

Fig. 6. Contd.
occurs in Zone LS 1 which probably expresses compac-tion of the basal sediment as much as greater pollenproduction. There is an overall decrease in the curve ofpollen concentration from Zones LS 1—LS 8 with minimaoccurring in Zones LS 2, LS 4, and LS 6. The curveprobably indicates both an inverse relationship to degreeof compaction and less pollen production when woodytaxa are reduced. The minimum concentration of (10]103 grains/cm3 occurs in Zones LS 9 and 10, and isfollowed by a considerable increase in Zone LS 11.
7. Interpretation of vegetation and climate history
The vegetation of Zone LS 1 consisted of Phyllocladusand Nothofagus with considerable¸agarostrobos, variousspecies of Proteaceae, and Monotoca. The abundance of
¸agarostrobos, marked presence of Casuarina, and ab-sence of Eucalyptus and Eucryphia contrasts with post-glacial Zones LS 9—11. Pollen of taxa that usually occurin alpine vegetation, such as Microcachrys and Micro-strobos, is very low. This indicates that most of the 95%pollen of woody taxa is probably derived from low-land forest and scrub vegetation. Pollen percentages of¸eptospermum and Melaleuca are low compared to thepost-glacial. Very few herbs are present. The pollenassemblage suggests that the vegetation was a form ofcool temperate rainforest. The large quantities of pollenof small tree and shrub taxa indicate considerable diver-sity, which could be related to low soil fertility. This issuggested by low values of Dicksonia and relative abund-ance of Monotoca, Proteaceae, Agastachys and Banksia.It is difficult to determine the climatic conditions fromthe vegetation assemblage. All that can be concluded is
E.A. Colhoun et al. / Quaternary International 57/58 (1999) 5—23 15

Fig. 6. Contd.
that the climate was wet and cool enough for the growthof temperate rainforest, and the region did not sufferprolonged summer drought. Such conditions are similarto those of today and suggest that the vegetation ofZone 1 was fully interglacial (West, 1984).
The marked increase in Poaceae, Asteraceae (whichmay include both herbs and shrubs), the endemic uppersubalpine—alpine conifer Microstrobos, and the strongreduction in rainforest pollen types and shrub taxa indi-cate that the vegetation of Zone LS 2 was a subalpine toalpine mosaic of heathland and herbfield. The strongmaxima for Casuarina and Epacridaceae suggestsheathland was predominant. The vegetation indicatesa community that now occurs altitudinally well abovethe present site, and probably above climatic treeline.The climate is interpreted as being much colder thanduring Zone LS 1, and during postglacial Zones LS 9—11.It appears to represent cold, probably stadial conditions.
The increase in rainforest tree/shrub taxa, includingMicrostrobos, decrease in sclerophyll taxa, particularlyCasuarina and Epacridaceae, and low Asteraceae andPoaceae in Zone LS 3, implies conditions remained coldbut probably warmer and wetter than in Zone LS 2. The
vegetation probably consisted of components of mon-tane-subalpine rainforest, and subalpine shrublands andheathlands. Such assemblages would naturally occurabove 600 m and below climatic treeline at around950—1050 m today. The vegetation thus reflects wet cli-matic conditions and suggests temperature conditionscooler than today. Since pollen of total woody taxa is lessthan in Zones LS 1 and LS 9—11, and more than in ZoneLS 2, the assemblage reflects a stratigraphic and probableclimatic interstadial.
Decreases in Nothofagus and Phyllocladus tree/shrubpollen, and increases in Epacridaceae, Asteraceae, andPoaceae show that the vegetation of Zone LS 4 wassimilar to that in Zone LS 2. A strong peak of Micro-strobos, and the first appearance of N. gunnii, a subalpine—alpine shrub of locally sheltered sites, indicates that thevegetation occurred close to or slightly above climatictreeline. The climate would have been colder than duringZone LS 3 and similar to Zone LS 2; i.e. a cold stadial.
The rainforest taxa increase again in Zone LS 5, witha very strong peak of ¸agarostrobos. Poaceae and As-teraceae decrease, though N. gunnii and Microstrobosremain important. Treeferns of Dicksonia and Cyathea
16 E.A. Colhoun et al. / Quaternary International 57/58 (1999) 5—23

australis had significant presence. The pollen assemblageinfers the vegetation was similar to that of Zone LS 3, butwith increase in the more localised ¸agarostrobos and N.gunnii. The vegetation was probably a mosaic ofmontane-subalpine rainforest, shrubland and heathland.The climatic conditions represented were slightly warmerthan during Zone LS4 and similar to Zone LS3; i.e. a coolinterstadial.
The vegetation of Zones LS 6—8 have broad similarityin that rainforest and mesic shrub taxa are minimallyrepresented, while herbs and high subalpine—alpine shrubtaxa are maximal throughout. Nevertheless, there aredifferences that allow division into three pollen zones,and interpretation of changes and differences in the veg-etation of the zones.
Reduction in pollen of rainforest taxa to trace quanti-ties, coupled with a gradual decline in Epacridaceae anda decrease followed by a rise in Casuarina indicate thepresence of very few tree and below-climatic-treelineheath species. The relatively high amounts of Micro-strobos, ¹asmannia, and local N. gunnii at the base ofZone LS 6 suggests cold climatic conditions. This issupported by the presence of abundant Poaceae, As-teraceae, Chenopodiaceae, and ¹ubuliflorites, a pollentype without a known source plant. How much pollen ofthese taxa has been derived from low shrubs, or how farthe pollen has been transported is not known. Macphail(1975) considered that Chenopodiaceae and ¹ubuli-florites pollen in western Tasmania had been transportedlong distances, perhaps from southern mainlandAustralia. At Lake Selina the first appearance of thealpine herb Dichosciadium (shown as Apiaceae in Fig. 6)suggests the vegetation was predominantly alpine herb-land, with local areas of coniferous heathland and shrubs.The composition of the alpine shrub vegetation indicatesthe climate was wet and considerably colder than duringZones LS 2 and LS 4. The climate appears to have beena cold stadial, during which ice may have been present inthe mountains.
Early in Zone LS 7 there is more pollen of Nothofagusand Phyllocladus than during Zone LS 6, though it de-creases up-zone and the quantities are not enough toindicate presence of significant quantites of rainforesttrees/shrubs. A spike of ¸agarostrobos indicates its localpresence, which can occur up to climatic treeline. Largerquantities of Casuarina, Epacridaceae, and ¸eptosper-mum indicate the presence of more sclerophyll scrub andheath, particularly early in the zone. An inverse relation-ship between decreasing Microstrobos, Microcachrys,and N. gunnii with increasing Poaceae and the alpineherb Dichosciadium suggests that alpine herbfield vegeta-tion increases at the expense of heath. The climate washigh-subalpine to alpine throughout Zone LS 7. Condi-tions may have been slightly warmer than during ZoneLS 6 early in the zone, but were cold and near alpinethroughout most of the zone.
The vegetation of Zone LS 8 consists almost entirely ofherbs including abundant Poaceae, and only traces ofwoody taxa present. The most abundant are Casuarina,which could have been transported upslope, andMelaleuca and Microstrobos. The vegetation appears tohave been mainly alpine herbland with minor heath. Thevegetation assemblage indicates that the coldest climaticconditions occurred during Zone LS 8. This zone is datedat Lake Selina to the Last Glacial Maximum when gla-ciers advanced to the Rolleston and Tyndall end mo-raines 2.5 km to the southeast. The climate was cold andglacial.
Following the Last Glacial Maximum Zone LS 9 re-flects the development of rainforest during the earlypostglacial, and is marked by the re-establishment ofPhyllocladus, Nothofagus, and Eucryphia (probably E.milliganii), and by decrease of Poaceae and the alpineshrubs Microcachrys, Microstrobos, and N. gunnii in thelower half of the zone. This is also supported by theincrease of Monotoca, and particularly the mesic treePomaderris, typical in the understorey of early postglacialforests (Macphail, 1983). Phyllocladus attains its peakprior to the full development of Nothofagus, a suc-cessional trait found in other early postglacial forests inTasmania. The climate was probably cool and humid.The strong change from predominantly alpine herbs torainforest pollen taxa during the zone probably reflectsa time lag in the local establishment of forest speciesfollowing a rapid climatic change from glacial to inter-glacial conditions around 14—13 ka BP rather thana gradual warming (Colhoun et al., 1991).
Zone LS 10 represents the local presence ofNothofagus—Phyllocladus cool temperate rainforest atLake Selina, associated with sclerophyll communitiesof Monotoca, Banksia and the mesic understorey treePomaderris. Alpine taxa and Poaceaee are rare to absent,and Asteraceae (probably shrub species) decrease. Theinferred presence of extensive temperate rainforest sug-gests that the climate immediately following the forestexpansion was the warmest and wettest in the LakeSelina pollen record.
The succeeding zone LS 11, while still characterised bya dominance of rainforest taxa, contains a greater pro-portion of Eucalyptus, Bauera, and Epacridaceae includ-ing S. incarnata. These taxa reflect a greater sclerophyll,and minor wet scrub and heath component in the vegeta-tion. This may reflect either slight cooling or drying,depletion of soil nutrients during profile development orincreased burning in the catchment. Charcoal values,which were low in Zones LS 1—3, increased during ZonesLS 4—8, and high throughout Zones LS 9—11, indicate fireaffected the vegetation throughout the lateglacial andHolocene. Eucalyptus, Acacia, and Sprengelia, each pro-moted by fire, are more common in Zones LS 9—11 thanin any other zone. In addition, increases in Cyperaceae,Restionaceae and the fire-indicator sedge Gymnoschoenus
E.A. Colhoun et al. / Quaternary International 57/58 (1999) 5—23 17

Table 3Estimated temperature depression °C at Lake Selina indicated by the vegetation of pollen zones
Pollen zone Temperature depression Comment
LS 1 $present Cool, wet, temperate climateLS 2 2.2 to '3.5 Cold stadialLS 3 0.6 to 2.2 Cool interstadialLS 4 2.2 to '3.5 Cold stadialLS 5 0.6 to 2.2 Cool interstadialLS 6 '3.5 Glacial stadialLS 7 2.8 to '3.5 Cool-to-cold interstadialLS 8 '3.5 Glacial stadial of LGMLS 9 (0.6 Below presentLS 10 ? 'to $ present Possibly warmerLS 11 $present Cool, wet, temperate climate
sphaerocephalus shows that fire was important duringZones LS 9—11. Thus, a combination of cooler conditionscombined with soil degradation and fire may have causeddeterioration of the temperate rainforest (Macphail,1979), though the evidence for cooler conditions is notcompelling.
The strong altitudinal zonation of vegetation in theWest Coast Range region with lowland rainforest below610 m, montane forest, scrub and heath to 850 m, sub-alpine forest, scrub and heath to climatic treeline at950—1050 m, and alpine heath, herbfield and grasslandover 1050 m allows estimates of minimum values of tem-perature depression from present to be calculated. InTable 3 the values are determined by relating the inferredvegetation communities and their altitudinal limits to theclimatic treeline. Climatic treeline is taken to representthe 10°C summer isotherm, and an environmental lapserate of 0.65°C/100 m altitude is applied (Nunez andColhoun, 1986).
The inferred values, though largely minimal, suggestthat Zone LS 1 was similar to that of LS 11, and thatZones LS 2—5 represent fluctuations between cold stadialand cool interstadials. Zone LS 6 and LS 8 represent thecoldest periods, the latter being dated to the Last GlacialMaximum. In Zones LS 9—11 it is difficult to differentiatechanges that could be '1°C from present.
8. Correlations and comparisons with other sites.
Climatically, the treeline represents the summer 10°Cisotherm. The ratio curves of woody to herb taxa, or ofwoody to subalpine shrub-plus-herb taxa, for LakeSelina, therefore, simulate the pattern of climatic changesduring the last 125 kyr BP. The curves correspondclosely to the orbitally based chronostratigraphy of thesub-polar, southwest, Indian Ocean, marine coreRC11—120 analysed by Martinson et al. (1987) (Fig. 7).Similarly, the fluctuations in the Lake Selina ratio curvesare closely comparable with the variations of d18O in the
Vostok ice core from ca. 125 kyr BP to present, includingthe four fluctuations in Isotope Stage 3 (Jouzel et al.,1987, 1989). The Selina ratio curves also compare withthe d18O isotope curve of marine core SO 36-7SL, taken50 km west of the entrance to Macquarie Harbour, whichcovers the last 75 kyr BP (van de Geer et al., 1994).Together with the dating, sedimentary and palaeomag-netic evidence presented, there can be little doubt that thevegetation and climate history of Lake Selina extendsfrom Isotope Substage 5e, the Last Interglacial to thepresent, with pollen Zones LS 2—5 reflecting the EarlyWisconsin stadial and interstadial fluctuations of climate(Isotope Substages 5a—5d). Zones LS 6 and 8 representthe Early and Late Wisconsin glacial stades, and areseparated by a cold, Zone LS 7, interstade (Isotope Stage3). Zones LS 9—11 represent the lateglacial and Holoceneof Isotope Stage 1.
Pollen and vegetation data from Tullabardine Dam at230 m altitude, and at Henty Bridge 115 m altitude, byvirtue of being further below treeline, allow better esti-mates of near maximum temperature depression duringIsotope Stages 3 and 2. At Tullabardine Dam temper-ature is estimated to have been 4—5.3°C lower duringStage 3 and 5.3°C in Stage 2 when subalpine shrublandand grassland vegetation was present (Table 3). At HentyBridge temperature was 4.8—5.7°C below present duringStage 3 and at least 5.7°C lower during Stage 2, whensubalpine—alpine shrubland and alpine herbland vegeta-tion was present (Colhoun, 1985b).
During the LGM a small ice cap and valley glaciersdeveloped on and east of the central West Coast Range.Temperature at glacial maximum, estimated from de-pression of regional snowline, was 6.5°C lower than pre-sent (Colhoun, 1985). During Stage 4 ice developed in theupper King Valley (Fitzsimons et al., 1992), and temper-ature was probably depressed by a similar amount toStage 2.
The pollen, vegetation, and climate history given bythe Lake Selina core, makes it suitable for comparisonwith other shorter records from western Tasmania, and
18 E.A. Colhoun et al. / Quaternary International 57/58 (1999) 5—23

Fig. 7. Comparison of curves (a) orbitally based chronostratigraphy (Martinson et al., 1987). (b) Vostok icc core (Jouzel et al., 1987), (c) marine core SO36-7SL off Maquarie Harbour, western Tasmania (van de Geer et al., 1994), (d) curve separaing sums of woody and herb taxa at Lake Selina, and(e) curve separating sums of woody and herb taxa at Tullabardine Dam (Colhoun and van de Geer, 1986).
long records from King Island, off the west Victoriancoast, and in the western plains of Victoria where thesedimentary records are less complete and less well dated(Table 4).
The nearest site, Tullabardine Dam, lies 22 km northof Lake Selina, and the sediment and pollen record spansca. 50—0 kyr BP (Colhoun and van de Geer, 1986). TheTullabardine Dam record shows subalpine shrub, heath
E.A. Colhoun et al. / Quaternary International 57/58 (1999) 5—23 19

Tab
le4
Com
par
ison
oflo
ng
polle
nre
cord
sfrom
wes
tern
Tas
man
iaan
dw
este
rnV
icto
ria
20 E.A. Colhoun et al. / Quaternary International 57/58 (1999) 5—23

and herbland was present as low as 230 m altitude untilca. 26—25 kyr BP when it was replaced by an herbaceouscommunity, dominated by Poaceae, Asteraceae, andChenopodiaceae, during the LGM. After ca. 13 kyr BP,an Eucalyptus—Casuarina heath phase was replaced bycool temperate Nothofagus-Phyllocladus rainforest. Theclimate varied sequentially from cold subalpine to glacialto interglacial during Isotope Stages 3, 2 and 1.
The broad vegetation changes implied for west-centralTasmania by marine core SO 36-7SL can also be relatedto those at Lake Selina for the last 75 kyr. At the end ofStage 5 (? 5a) the vegetation consisted mainly of Euca-lyptus forest. Only small amounts of Nothofagus andPhyllocladus were present. Asteraceae, Poaceae, andChenopodiaceae dominate Isotope Stages 2, 3, and 4,though 3 has significant Eucalyptus. In Stage 2 the grass-land and herbland contains significant quantities ofnative conifers, including ¸agarostrobos, Athrotaxis,Microstrobos, and Podocarpus lawrencii. The Holocene ischaracterised by expansion of Eucalyptus, Phyllocladusand Nothofagus, indicating presence of cool temperate,wet, mixed forest and rainforest. The climate varied fromcool to cold, largely subalpine, conditions near sea levelduring Isotope Stages 4, 3, and 2, to interglacial duringStage 1 (van de Geer et al., 1994).
Egg Lagoon on King Island is a freshwater swamp inwhich deposition of the sediment sequence has beenlargely controlled by groundwater fluctuations, and inwhich pollen of local swamp vegetation tends to maskthe regional component (D’Costa et al., 1993). It has beena difficult site to date, like similar sites at Pulbeena,Mowbray, and Broadmeadows swamps in northwesternTasmania, which exceed radiocarbon age-assay at shal-low depths (Colhoun et al., 1982; van de Geer et al., 1986).At Egg Lagoon, the Holocene vegetation was probablyEucalyptus and Casuarina woodland with a grass andshrub understorey. During the LGM, the vegetation wascomposed predominantly of Poaceae and Asteraceae,with some Eucalyptus. Before the LGM, Eucalyptus andCasuarina woodland was predominant with traces ofPhyllocladus (D’Costa, 1996, pers. comm.).
Off the western Victorian coast Marine Core E55-6provides a long record extending to Isotope Stage 6, butwith Stage 1 missing. Grassland dominated the LGM,and was preceded by grass with heath and shrub veg-etation, perhaps of mallee form, during Stage 3, andEucalyptus early in the stage. During Stage 4 and thelater part of Stage 5, the vegetation was dry open wood-land, herb and shrubland. Early in Stage 5 wet scler-ophyll forest with minor representation of cool temperaterainforest existed during Substage 5e, the peak of theLast Interglacial (Harle, 1997).
The plains of western Victoria have provided recordsfrom a number of volcanic maar and swamp sites. Mosthave been difficult to date accurately, and the vegetationhistory record is largely controlled by a combination of
14C dates from shallow depths and suggested correlationof pollen zones with marine Isotope Stages.
Lake Wangoom is the longest record, which is nowthought to extend back through the Penultimate Gla-ciation, and to include the full Last Interglacial—LastGlacial cycle. The vegetation of Isotope Stage 5 was wetsclerophyll Eucalyptus forest, with significant quantitiesof Cupressaceae, and cool temperate rainforest trees.During Stages 2—4 the vegetation was grassland andherbland, with varying but low quantities of Casuarinaand Eucalyptus. Stage 1 vegetation was Casuarina andEucalyptus (Edney et al., 1990; Kershaw et al., 1991;Harle, 1996, pers. comm.)
Nearby, at Lake Terang, vegetation change was sim-ilar. Open woodland, or shrubland, in which Casuarinawas more important than Eucalyptus occurred duringStage 3. Stage 2 is largely devoid of pollen. Stage 1 wascharacterised by mixed Casuarina—Eucalyptus woodlandand forest (D’Costa and Kershaw, 1995).
The western Tasmanian sites contrast partly with thewestern Bass Strait sites, in a way that suggests changealong temperature and precipitation gradients. In west-ern Tasmania temperature appears to have been the mostimportant control, while in western Bass Strait andVictoria precipitation was the most important control ofvegetation change. In Tasmania cool temperate rainfor-est dominated warmer, and presumably wetter, periods,while temperature-influenced subalpine and alpine heath,herb and grass vegetation communities dominated colderperiods. In western Bass Strait, warmer and wetter peri-ods had sclerophyll forest with minor cool temperaterainforest vegetation, and colder and drier periods weredominated by grasssland with Eucalyptus and Casuarina.
The climate of western Victoria appears to have beendrier at all times than the climate of western Tasmania.Only during Isotope Stage 5 are significant quantities ofcool temperate rainforest taxa present, which suggeststhe Last Interglacial may have been cooler and wetterthan the Holocene. The open woodland, shrubland andgrassland vegetation of Stages 4—2 is consistent withgenerally drier and colder conditions during much of theLast Glacial Stage, with the driest conditions occurringduring Stage 2 times.
Acknowledgements
The authors thank The University of Newcastle Re-search Management Committee, the Australian ResearchGrants Committee and the Australian Geological SurveyOrganisation for financial support of this project.They also thank Dr Mike Barbetti of the MacintoshCentre for Quaternary Dating, Sydney University andDr H. Heijnis and Robert Chisari of the EnvironmentalRadiochemistry Laboratory, Australian Nuclear Scienceand Technology Organisation, Lucas Heights for help
E.A. Colhoun et al. / Quaternary International 57/58 (1999) 5—23 21

with dating. Drs Michael Macphail and Geoffrey Hopeof the Department of Archaeology and Natural History,Australian National University, are thanked for helpfulcomments on the manuscript. Dr C. E. Barton publisheswith permission of the Director of AGSO, Canberra.This paper is contribution number 7 of the Departmentof Geography and Environmental Science, University ofNewcastle Research Unit of Geomorphology andQuaternary Science.
References
Birks, H.J.B., Huntley, B., 1978. Program Polldata MK5, Sub-depart-ment of Quaternary Research, University of Cambridge, Cambridge.
Bowden, A.R., 1974. The glacial geomorphology of the Tyndall Moun-tains, Western Tasmania B.Sc. Hons. Thesis, Department of Geogra-phy, University of Tasmania.
Buchanan, A.M., 1995. A census of the vascular plants of Tasmania.Tasmanian Herbarium Occasional Paper No. 5.
Colhoun, E.A., 1980. Quaternary Fluviatile Deposits from the PiemanDam site, Western Tasmania. Proceedings of the Royal Society ofLondon B207, 355—384.
Colhoun, E.A., 1985a. Glaciations of the West Coast Range, Tasmania.Quaternary Research 24, 39—59.
Colhoun, E.A., 1985b. Pre-last glaciation vegetation history at HentyBridge, Western Tasmania. New Phytologist 100, 681—690.
Colhoun, E.A., 1986. Field problems of radiocarbon dating in Tasmania.Papers and Proceedings of the Royal Society of Tasmania 120, 1—6.
Colhoun, E.A., Fitzsimons, S.J., 1990. Late Cainozoic Glaciation inWestern Tasmania, Australia. Quaternary Science Reviews 9, 199—216.
Colhoun, E.A., van de Geer, G., 1986 Holocene to middle last glaciationvegetation history at Tullabardine Dam, western Tasmania. Pro-ceedings of the Royal Society of London B29, 177—207.
Colhoun, E.A., Benger, S.N., Fitzsimons, S.J., van de Geer, G., Hill, R.S.,1993. Quaternary organic deposit from Newton Creek Valley, West-ern Tasmania. Australian Geographical Studies 31, 26—38.
Colhoun, E.A., van de Geer, G., Fitzsimons, S.J., 1991. Late glacial andHolocene vegetation history at Governor Bog, King Valley, westernTasmania. Journal of Quaternary Science 6, 55—66.
Colhoun, E.A., van de Geer., G., Fitzsimons, S.J., 1992. Late Quater-nary organic deposits at Smelter Creek and vegetation history of theMiddle King Valley, western Tasmania. Journal of Biogeography 19,217—227.
Colhoun, E.A., van de Geer, G., Mook, W.G., 1982. Stratigraphy,Pollen Analysis, and Palaeoclimatic Interpretation of PulbeenaSwamp, Northwestern Tasmania. Quaternary Research 18, 108—126.
Curtis, W.M., 1963. The Student’s Flora of Tasmania, Part 2. Govern-ment Printer, Hobart, Tasmania.
Curtis, W.M., 1967. The Student’s Flora of Tasmania, Part 3. Govern-ment Printer, Hobart, Tasmania.
Curtis, W.M., Morris, D.I., 1975. The Student’s Flora of Tasmania, 2ndEd. Part 1. Government Printer, Hobart, Tasmania.
D’Costa, D.M., Kershaw, A.P., 1995. A Late Pleistocene and Holocenepollen record from Lake Terang, western Plains of Victoria, Austra-lia. Palaeogeography, Palaeoclimatology and Palaeoecology 113,57—67.
D’Costa, D.M., Grindrod, J., Ogden, R., 1993. Preliminary environ-mental reconstructions from late Quaternary pollen and molluscassemblages at Egg Lagoon, King Island, Bass Strait. AustralianJournal of Ecology 18, 351—366.
Dodson, J.R., 1975. Vegetation history and water fluctuations at LakeLeake, South-eastern South Australia. II 50,000 BP to 10,000 BPAustralian Journal of Botany 23, 815—831.
Dodson, J.R., 1977. Late Quaternary Palaeoecology of WyrieSwamp, Southeastern South Australia. Quaternary Research 8,97—114.
Edney, P.A., Kershaw, A.P., De Deckker, P., 1990. A Late Pleistoceneand Holocene vegetation and environmental record from Lake Wan-goom, Western Plains of Victoria. Palaeogeography, Palaeoclimatol-ogy and Palaeoecology 80, 325—343.
Faegri, K., Iversen, J., 1975. Textbook of Pollen Analysis, 3rd ed.Munksgaard, Copenhagen.
Fitzsimons, S.J., Colhoun, E.A., van de Geer, G., Pollington, M.J.,1992. The Quaternary geology and glaciation of the KingValley, western Tasmania. Geological Survey of Tasmania Bulletin68, 1—56.
Harle, K.J., 1997. Late Quaternary vegetation and climate change insoutheastern Australia: palynological evidence from marine coreE55-6. Palaeogeography, Palaeoecology and Palaeoclimatology 131,465—483.
Heijnis, H., van der Plicht, J., 1992. Uranium/thorium dating of LatePleistocene peat deposits in NW Europe, uranium/thorium isotopesystematics and open system behaviour of peat layes. ChemicalGeology (Isotope Geoscience Section) 94, 161—171.
Jackson, W.D., 1965. Vegetation. In: Davies, J.L. (Ed.), Atlas ofTasmania, Lands and Surveys Department, Hobart, pp. 30—35.
Jackson, W.D., 1968. Fire, Air, Water and Earth — an elemental ecologyof Tasmania. Proceedings of the Ecological Society of Australia 3,4—16.
Jouzel, J., Lorius, C., Petit, J.R., Genthon, C., Barkov, N.I., Kotlyakov,V.M., Petrov, V.M., 1987. Vostok ice core: a continuous isotopetemperature record over the last climatic cycle (160,000 yr). Nature329, 403—408.
Jouzel, J., Raisbeck, G., Benoist, J.P., Yiou, F., Lorius, C., Raynaud, D.,Petit, J.R., Barkov, N.I., Korotkevitch, Y.S., Kotlyakov, V.M., 1989.Comparison of Deep Antarctic Ice Cores and Their Implications forClimate Between 65,000 and 15,000 Years Ago. Quaternary Research31, 135—150.
Kershaw, A.P., 1986. The last two glacial— interglacial cycles fromnortheastern Australia: implications for climatic change and Aborig-inal burning. Nature 322, 47—49.
Kershaw, A.P., 1994. Pleistocene vegetation of the humid tropics ofnortheastern Queensland, Australia. Palaeogeography, Palaeoecol-ogy and Palaeoclimatology 109, 399—412.
Kershaw, A.P., D’Costa, D.M., Mc Ewan Mason, J.R.C., Wagstaff, B.E.,1991. Palynological evidence for Quaternary vegetation and environ-ments of mainland southeastern Australia. Quaternary ScienceReviews 10, 391—404.
Kirkpatrick, J.B., 1977a. Native vegetation of the west coast region ofTasmania. In: Banks, M.R., Kirkpatrick, J.B. (Eds), Landscape andMan. Royal Society of Tasmania, Hobart, pp. 55—80.
Kirkpatrick, J.B., 1977b. The impact of man on the vegetation of thewest coast region. In: Banks, M.R., Kirkpatrick, J.B. (Eds), Land-scape and Man. Royal Society of Tasmania, Hobart, 151—156.
Macphail, M.K., 1975. Late Pleistocene environments in Tasmania.Search 6(7), 295—299.
Macphail, M.K., 1979. Vegetation and Climates in Southern TasmaniaSince the Last Glaciation. Quaternary Research 11, 306—341.
Macphail, M.K., 1983. The early to middle Holocene Pomaderris max-imum in southeastern Australia. Proceedings First Climanz, 1981,vol. 1. Department Biogeography and Geomorphology, ResearchSchool of Pacific Studies, Australian National University, Canberra,pp. 105—106.
Martinson, D.G., Pisias, N.G., Hays, J.D., Imbrie, J., Moore T.C. Jr.,Shackleton, N.J., 1987. Age Dating and the Orbital Theory of the IceAges: Development of a High-Resolution 0—300,000-yr Chrono-stratigraphy. Quaternary Research 27, 1—29.
Nunez, M., Colhoun, E.A., 1986. A note on air temperature lapse rateson Mount Wellington. Papers and Proceedings of the Royal Societyof Tasmania 120, 11—15.
22 E.A. Colhoun et al. / Quaternary International 57/58 (1999) 5—23

Schwarcz, H.P., Latham, A.G., 1989. Dirty calcites; 1. Uranium seriesdating of contaminated calcite using leachates alone. Chemical Geol-ogy 80, 35—43.
Singh, G., Geissler, E.A., 1985. Late Cenozoic history of vegetation, fire,lake levels and climate at Lake George, NSW, Australia. Philosophi-cal Transactions of the Royal Society of London B311, 379—447.
Stockmarr, J., 1971. Tablets with spores used in absolute pollen analy-sis. Pollen et Spores 13, 615—621.
van de Geer, G., Colhoun, E.A., Mook, W.G., 1986. Stratigraphy, pollenanalysis and palaeoclimatic Interpretation of Mowbray and Broad-meadows swamps, North Western Tasmania. Australian Geographer17, 121—133.
van de Geer, G., Fitzsimons, S.J., Colhoun, E.A., 1989. Holocene tomiddle last glaciation vegetation history at Newall Creek, westernTasmania. New Phytologist 111, 549—558.
van de Geer, G., Heusser, L.E., Lynch-Stieglitz, J., Charles, C.D., 1994.Palaeoenvironments of Tasmania inferred from a 5—75 ka marinepollen record. Palynology 18, 33—40.
Vostok Project Members, 1995. International effort helps deciphermysteries of paleoclimate from Antarctic ice cores. Eos, Transactions,American Geophysical Union 76 (17), 169 and 179.
West, R.G., 1984. Interglacial, interstadial and oxygen isotope stages.Dissertationes Botanisches 72, 345—357.
E.A. Colhoun et al. / Quaternary International 57/58 (1999) 5—23 23