MATHS BOOKS SELINA MATHS (ENGLISH) MEASURES OF ...
57
MATHS BOOKS SELINA MATHS (ENGLISH) MEASURES OF CENTRAL TENDENCY (MEAN, MEDIAN, QUARTILES AND MODE) Questions
-
Upload
khangminh22 -
Category
Documents
-
view
1 -
download
0
Transcript of MATHS BOOKS SELINA MATHS (ENGLISH) MEASURES OF ...

MATHS
BOOKS SELINA MATHS (ENGLISH)
MEASURES OF CENTRAL TENDENCY
(MEAN, MEDIAN, QUARTILES AND
MODE)
Questions

1. The weights (in kilogram) of 5 persons are
67, 65, 71, 57 and 45. Find the arithmetic mean
of their weights.
Watch Video Solution
2. The mean weight of 15 boys is 43 kg. If two
boys with weights 34 kg and 35 kg join them,
�n the new mean weight.
Watch Video Solution

3. Mean of 40 numbers is 37.5. If one of these
numbers is taken as 53 instead of 35, �nd the
correct mean.
Watch Video Solution
4. In the half yearly examination of class IX of a
school, the mean marks scored by the boys is
52 and the mean marks scored by the girls is
48. If on the whole, the mean marks of the
calss is 50.5, �nd the ratio of the number of
boys to the number of girls in the class.

Watch Video Solution
5. Using direct method, �nd the mean of
following frequency distribution:
Watch Video Solution
6. The weights of 25 students of a class are
given in the following table:

Using short-cut method, �nd the mean weight.
Watch Video Solution
7. Using step deviation method, �nd the mean
of following frequency distribution:
Watch Video Solution

8. If the mean of the following distribution is
7.5, �nd the missing frequency f
Watch Video Solution
9. Find the value of p, if the mean of following
distribution is 20.
Watch Video Solution

10. Find the mean of
Watch Video Solution
11. Find mean of the following distribution
using short cut method:
Watch Video Solution

12. The weights of 50 apples were recorded as
given below. Calculate the mean weight, to the
nearest gram, by the step Deviation Method.
Watch Video Solution
13. Find the mean of the following
distribution:
A. 49.6

B.
C.
D. None
Answer: A
Watch Video Solution
40
42.6
14. The total number of observations in the
following distribution tale is 120 and their
mean is 50. Find the values of missing
frequencies and f1 f2

Watch Video Solution
15. Find the median of 7,8,4,3 and 10.
A. 6
B. 8
C. 9
D. 5
Answer: Median =7
Watch Video Solution
16. Find the median of 7,12,15,6,20,8,4 and 10
Watch Video Solution
17. The following numbers are written in
descending order of their values:
and 20.
If their median is 39, �nd the value of x.
Watch Video Solution
68, 60, 42, x − 3, x − 8, x − 11, 30, 25, 22

18. Find the median weight for following Data
weight in kg 45,46,48,50,52,54,55
Watch Video Solution
19. Find the median for the following
distribution: Class 5−10 10−15 15−20 20−25
25−30 30−35 35−40 40−45 Frequency 5 6 15 10
5 4 2 2
Watch Video Solution

20. If ∆ABC ~ ∆PQR, perimeter of ∆ABC = 32 cm,
perimeter of ∆PQR = 48 cm and PR = 6 cm, then
�nd the length of AC.
Watch Video Solution
21. ∆ABC ~ ∆DEF. If AB = 4 cm, BC = 3.5 cm, CA =
2.5 cm and DF = 7.5 cm, �nd the perimeter of
∆DEF
Watch Video Solution

22. Find the lower quartile, upper quartile and
inter quartile range for the date:
9,11,15,19,17,13,7
Watch Video Solution
23. From the following frequency distribution
table �nd
(i) Lower quartile (ii) Upper quartile (iii) Inter
quartile range
Watch Video Solution

24. In ∆DEW, AB || EW. If AD = 4 cm, DE = 12 cm
and DW = 24 cm, then �nd the value of DB.
Watch Video Solution
25. Find the mode of data 4,7,4,3,2,7,7,6,4,7 and
8
Watch Video Solution

26. Find the mode from the following
frequency distribution: Class 0-10 10-20 20-30
30-40 40-50 50-60 60-70 Frequency 8 10 10 16
12 6 7
Watch Video Solution
27. Find the mode of the following frequency
distribution of marks obtained by 50 students.
Marks obtained 0−10 10−20 20−30 30−40
40−50 No. of students 5 12 20 10 3

Exercise 24 A
Watch Video Solution
1. Find the mean of the following set of
numbers:
6,9,11,12 and 7
Watch Video Solution
2. Find the mean of the following set of
numbers:

11,14,23,25,10,12,18 and 6
Watch Video Solution
3. Marks obtained (in mathematics) by 9
students are given below: 60, 67, 52, 76, 50, 51,
74, 45 and 56
a. Find the arithmetic mean.
b. If marks of each student be increased by 4,
what will be the new value of arithmetic
mean?
Watch Video Solution

4. Find the mean of natural numbers from 3 to
12.
Watch Video Solution
5. (a) Find the mean of 7, 11, 6, 5, and 6. (b) If
each number given in (a) is diminished by 2,
�nd the new value of mean.
Watch Video Solution

6. (a) Find the mean of 7, 11, 6, 5, and 6. (b) If
each number given in (a) is diminished by 2,
�nd the new value of mean.
Watch Video Solution
7. If the mean of 6, 4, 7, p and 10 is 8, �nd the
value of p.
Watch Video Solution

8. If the mean of the number 6,y,7,x and 14 is 8.
Express y in terms of x.
Watch Video Solution
9. The ages of 40 students are given in the
following table: Age(in yrs) 12 13 14 15 16 17 18
Frequency 2 4 6 9 8 7 4 Find the arithmetic
mean.
Watch Video Solution

10. If 69.5 is the mean of 72, 70, x, 62, 50, 71, 90,
64, 58 and 82, �nd the value of x.
A.
B.
C.
D. None
Answer: A
Watch Video Solution
76
72
56

11. The following table gives the height of
plants in centrimetre. If the mean height of
plants is 60.95 cm, �nd the value of f.
Watch Video Solution
12. From the data, give below, calculate the
mean wage, correct to the nearest rupee.
(i) If the number of workers in each category is
doubled, what would be the new mean wage?

(ii) If the wages per day in each category are
increased by 60%. What is the new mean
wage?
(iii) If the number of workers in each category
is doubled and the wages per day per worker
are reduced by 40%, what would be the new
mean wage?
Watch Video Solution
13. The contents of 100 match boxes were
checked to determine the number of matches

they contain.
(i) Calculate, correct to one decimal place, the
mean number of matches per box.
(ii) Determine, how many extra matches would
have to be added to the total contents o the
100 boxes to bring the mean up to exactly 39
matches?
Watch Video Solution
14. If the mean of the following distribution is
3 �nd the value of p.

Watch Video Solution
15. In the following table ad mean
=73. Find the missing frequencies , and
Watch Video Solution
∑ f = 200
f1 f2
16. Find the arithmetic mean (correct to the
nearest whole number ) by using step

Exercise 24 B
deviation method.
Watch Video Solution
17. Find the mean (correct to one place of
decimal) by using short -cut method.
Watch Video Solution

1. The following table gives the ages of 50
students of a class. Find the arithmetic mean
of their ages.
Watch Video Solution
2. The following table gives the weekly wages
of workers in a factory. Weekly wages(Rs) 50-55
55-60 60-65 65-70 70-75 75-80 80-85 85-90 No.

of workers 5 20 10 10 9 6 12 18 Calculate the
mean, by using Short Cut Method.
Watch Video Solution
3. Find the mean of the following frequency
distribution using step-deviation method.
Class 0-10 10-20 20-30 30-40 40-50 Frequency 7
10 15 8 10
Watch Video Solution
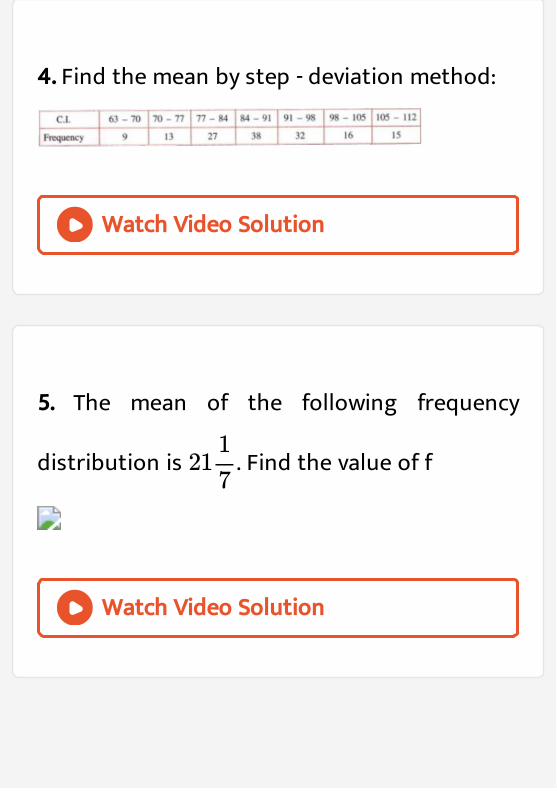
4. Find the mean by step - deviation method:
Watch Video Solution
5. The mean of the following frequency
distribution is . Find the value of f
Watch Video Solution
211
7

6. Using step deviation method, calculate the
mean marks of the following distribution.
Watch Video Solution
7. Using the information given in the adjoining
histogram, calculate the mean.

Watch Video Solution
8. If the mean of the following observation is
54, �nd the value of p.
Watch Video Solution

9. The mean of the following distribution is
62.8 and the sum of all the frequencies is 50.
Find the missing frequencies and
Watch Video Solution
f1 f2
10. Calculate the mean of the distribution,
given below, using the short cut method:
Watch Video Solution

Exercise 24 C
1. A student got the following marks in 9
questions of a question paper.
3,5,7,3,8,0,1,4 and 6. Find the median of these
marks.
Watch Video Solution
2. The weights (in kg) of 10 students of a class
are given below:

21,28.5,20.5,24,25.5, 22, 27.5,28,21 and 24. Find
the median of their weights.
Watch Video Solution
3. The marks obtained by 19 students of a class
are given below:
27,36,22,31,25,26,33,24,37,32,29,28,36,35,27,26,32,35
and 28. Find
(i) Median (ii) Lower quartile
(iii) Upper quartile (iv) Inter quartile range
Watch Video Solution

4. From the following data: �nd
(i) Median (ii) Upper quartile (iii) Inter quartile
range:
25, 10,40,88,45,60,77,36,18,95,56,65,7,0,38 and 83
Watch Video Solution
5. The ages of 37 students in a class are given
in the following table: Find the median
Watch Video Solution

6. The weights of 60 boys are given in the
following distribution table:Find
(i) Median (ii) Lower quartile (iii) Upper
quartile (iv) Inter quartile range
Watch Video Solution
7. X and Y are points on the sides AB and AC
respectively of a triangle ABC such that
AX/AB=1/4, AY = 2 cm and YC = 6 cm. Find
whether XY || BC or not

Watch Video Solution
8. A 6.5 m long ladder is placed against a wall
such that its foot is at a distance of 2.5 m from
the wall. Find the height of the wall where the
top of the ladder touches it
Watch Video Solution
9. If the perimeters of two similar triangles
ABC and DEF are 50 cm and 70 cm respectively

and one side of ∆ABC = 20 cm, then �nd the
corresponding side of ∆DEF
Watch Video Solution
10. A vertical pole of length 8 m casts a
shadow 6 cm long on the ground and at the
same time a tower casts a shadow 30 m long.
Find the height of tower
Watch Video Solution

Exercise 24 D
1. Find the mode of the following data:
(i) 7,9,8,7,7,6,8,10,7 and 6 (ii) 9,11,8,11,16,9,11,53,11,17
and 8
Watch Video Solution
2. The following table shows the frequency
distribution of heights of 50 boys: Find the
mode of heights
Watch Video Solution
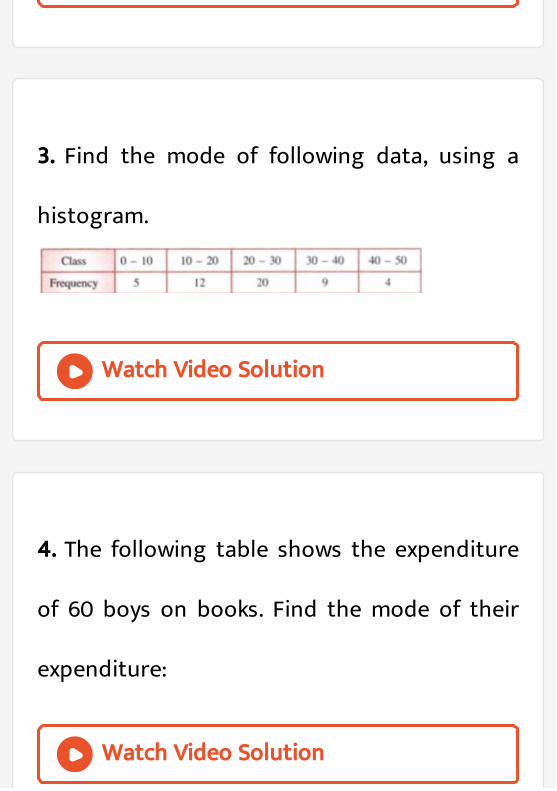
3. Find the mode of following data, using a
histogram.
Watch Video Solution
4. The following table shows the expenditure
of 60 boys on books. Find the mode of their
expenditure:
Watch Video Solution

5. Find the median and the mode for the set of
numbers : 2,2,3,5,5,5,6,8 and 9.
Watch Video Solution
6. A boy scored the following marks in various
class tests during a term, each test being
marked out of 20.
15,17,16,7,10,12,14,16,19,12 and 16.
(i) What are his modal marks. (ii) What are his

median marks?
(iii) What are his total marks? (iv) What are his
mean marks?
Watch Video Solution
7. Find the mean, median and mode of the
following marks obtained by 16 students in a
class test marked out of 10 marks:
0,0,2,2,3,3,3,4,5,5,5,5,6,6,7 and 8
Watch Video Solution

Exercise 24 E
8. At a shooting competition the scores of a
competitor were as given below: (i) What was
his modal score?
(ii) What was his median score?
(iii) What was his total score? (iv) What was his
mean score?
Watch Video Solution

1. ∆ABC ~ ∆PQR. AD is the median to BC and
PM is the median to QR. Prove that
AB/PQ=AD/PM
Watch Video Solution
2. In the given �gure, if DE || BC, AE = 8 cm, EC =
2 cm and BC = 6 cm, then �nd DE
Watch Video Solution

3. The mean of 1,7,5,3,4 and 4 is m. The
numbers 3,2,4,2,3,3 and p have mean m-1 and
median q. Find p and q
Watch Video Solution
4. In a malaria epidemic, the number of cases
diagnosed were as follows:
On what days do the mode, the upper and the
lower quartiles occur?

Watch Video Solution
5. In the given �gure, XY || QR, PQ/XQ=7/3 and
PR = 6.3 cm, �nd YR
Watch Video Solution
6. The marks of 20 students in a test were as
follows,
2,6,8,9,10,11,11,12,13,13,14,14,15,15,15,16,16,18,19 and
20.

Calculate (i) the mean (ii) the median (iii) the
mode.
Watch Video Solution
7. If PQR is an equilateral triangle and PX ⊥
QR, �nd the value of PX^2.
Watch Video Solution
8. The sides AB and AC and the perimeter P, of
∆ABC are respectively three times the

corresponding sides DE and DF and the
perimeter P, of ∆DEF. Are the two triangles
similar? If yes, �nd ar(△ABC)/ar(△DEF)
Watch Video Solution
9. The distribution given below, shows the
marks obtained by 25 students in an aptitude
test. Find the median and mode of the
distribution.
Watch Video Solution

10. The mean of the following distribution is
52 and the frequency of class interval 30-40 is
f. Find f.
Watch Video Solution
11. In the �gure, EF || AC, BC = 10 cm, AB = 13 cm
and EC = 2 cm, �nd AF
Watch Video Solution

12. A Mathematics aptitude test of 50 students
was recorded as follows:
Draw a histogram for the above data using a
graph paper and locate the mode:
Watch Video Solution
13. In the �gure ABC and DBC are two right
triangles. Prove that AP × PC = BP × PD
Watch Video Solution

14. Marks obtaind by 40 students in a short
assessment is given below, where a and b are
two missing data. If the mean of the
distribution is 7.2 �nd a and b
Watch Video Solution
15. Find the mode and the median of the
following data 13, 16, 12, 14, 19, 12, 14, 13, 14
Watch Video Solution

16. The median of the following observation 11,
12, 14, (x - 2), (x + 4), (x + 9), 32, 38, 47 arranged
in ascending order is 24. Find the value of x
and hence �nd the mean.
Watch Video Solution
17. The numbers 6, 8, 10 ,12, 13, and x are
arranged in an ascending order. If the mean of
the observation is equal to the median, �nd
the value of x.

Watch Video Solution
18. (Use a graph paper for this question). The
daily pocket expenses of 200 students in a
school are given below:
Draw a histogram representing the above
distribution and estimate the mode from the
graph.
Watch Video Solution

19. In the given �gure, QA ⊥ AB and PB ⊥ AB. If
AO = 20 cm, BO = 12 cm, PB = 18 cm, �nd AQ
Watch Video Solution
20. The mean of the following numbers is 68.
Find the value of 'x'.
45, 52, 60, x, 69, 70, 26, 81 and 94.
Hence, estimate the median.
Watch Video Solution

21. The marks of 10 students of a class in an
examination arranged in ascending order are
as follows :
13, 35, 43, 46, x, x + 4, 55, 61, 71, 80
If the median marks is 48, �nd the value of x.
Hence �nd the mode of the given data.
Watch Video Solution
22. In the given �gure, CD || LA and DE || AC.
Find the length of CL if BE = 4 cm and EC = 2

cm
Watch Video Solution
23. The histogram below represents the scores
obtained by 25 students in a Mathematics
mental test. Use the data to,
(i) Frame a frequency distribution table
(ii) To calculate mean
Watch Video Solution