Lithofacies of the Amasiri Sandstone, Southern Benue Trough, Nigeria

RESEARCH COMMUNICATIONS
CURRENT SCIENCE, VOL. 107, NO. 6, 25 SEPTEMBER 2014 1032
*For correspondence. (e-mail: [email protected])
5. Venkatesan, T. R., Pande, K. and Gopalan, K., Did Deccan volcanism pre-date the Cretaceous/Tertiary transition? Earth Planet. Sci. Lett., 1993, 119, 181–189.
6. Sheth, H. C., Mahoney, J. J. and Chandrasekharam, D., Geoche-mical stratigraphy of Deccan flood basalts of the Bijasan Ghat sec-tion, Satpura Range, India. J. Asian Earth Sci., 2004, 23, 127–139.
7. Rama, S. N. I., Potassium–argon dates of some samples from Dec-can Traps. Report of the 22nd International Geological Congress, New Delhi, 1964, Rep. 7, pp. 64–68.
8. Wellman, P. and Mc Elhinny, M. W., K–Ar ages of the Deccan traps, India. Nature, 1970, 227, 595–596.
9. Kaneoka, I., Ar/Ar dating on volcanic rocks of the Deccan Traps, India. Earth Planet. Sci. Lett., 1980, 46, 233–243.
10. Alexander, P. O., Age and duration of Deccan volcanism: K–Ar evidence. Mem. Geol. Soc. India, 1981, 3, 244–258.
11. Hofmann, C., Féraud, G. and Courtillot, V., 40Ar/39Ar dating of mineral separates and whole rocks from the Western Ghats lava pile: further constraints on duration and age of the Deccan traps. Earth Planet. Sci. Lett., 2000, 180, 13–27.
12. Knight, K. B., Renne, P. R., Halkett, A. and White, N., 40Ar/39Ar dating of the Rajahmundry Traps, eastern India and their relationship to the Deccan traps. Earth Planet. Sci. Lett., 2003, 208, 85–99.
13. Kerr, A. C., Khan, M., Mahoney, J. J., Nicholson, K. N. and Hall, C. M., Late Cretaceous alkaline sills of the south Tethyan suture zone, Pakistan: initial melts of the Réunion hotspot? Lithos, 2010; doi:10.1016/j.lithos.2010.02.010.
14. Widdowson, M., Pringle, M. S. and Fernandez, O. A., A post K–T boundary (Early Palaeocene) age for the Deccan-type feeder dykes, Goa, India. J. Petrol., 2000, 41(7), 1177–1194.
15. Duncan, R. A. and Pyle, D. G., Rapid eruption of the Deccan basalts at the Cretaceous/Tertiary boundary. Nature, 1988, 333, 841–843.
16. Kent, R. W., Saunders, A. D., Kempton, P. D. and Ghose, N. C., Rajmahal basalts, eastern India: mantle sources and melt distribu-tion in a rifted margin. In Large Igneous Province: Continental, Oceanic and Planetary Volcanism, Geophysical Monograph, American Geophysical Union, 1997, vol. 100, pp. 145–182.
17. Baksi, A. K., Ray Barman, T., Paul, D. K. and Farrar, E., Geochronological and geochemical studies of samples from Rajmahal and Sylhet traps, India; preliminary results. EOS, 1984, 65, 303.
18. Ray, J. S., Pattanayak, S. K. and Pande, K., Rapid emplacement of the Kerguelen plume-related Sylhet Traps, eastern India: evidence from 40Ar–39Ar geochronology. Geophys. Res. Lett., 2005; DOI: 10.1029/2005GL022586.
19. Geological Survey of India, Geological map of Murwara Quad-rangle, Madhya Pradesh. GSI, Hyderabad, 2004.
20. Melluso, L. and Sethna, S. F., Mineral compositions in the Deccan igneous rocks of India: an overview. In Topics in Igneous Petro-logy (eds Ray, J., Sen, G. and Ghosh, B.), Springer, Heidelberg, 2011, pp. 135–160.
21. Renne, P. R., Swisher, C. C., Deino, A. L., Karner, D. B., Owens, T. L. and DePaolo, D. J., Intercalibration of standards, absolute ages and uncertainties in 40Ar/39Ar dating. Chem. Geol., 1998, 145, 117–152.
22. Ludwig, K. R., Isoplot/Ex, v. 3.75, Berkeley Geochronology Center Special Publication No. 5, Berkeley, USA, 2012.
23. Kelley, S., Excess argon in K–Ar and Ar–Ar geochronology. Chem. Geol., 2002, 188, 1–22.
24. Chalapathi Rao, N. V., Burgess, R., Lehmann, B., Mainkar, D., Pande, S. K., Hari, K. R. and Bodhankar, N., 40Ar/39Ar ages of ma-fic dykes from the Mesoproterozoic Chhattisgarh basin, Bastar craton, Central India: implication for the origin and spatial extent of the Deccan Large Igneous Province. Lithos, 2011, 125, 995–1004.
25. Lala, T., Chaudhary, A. K., Patil, S. K. and Paul, D. K., Mafic dykes of Rewa Basin, central India: implications on magma
dispersal and petrogenesis. In Dyke Swarms (ed. Srivastava, R. K.), Springer-Verlag, Berlin, 2011, pp. 141–162.
ACKNOWLEDGEMENTS. We thank the Department of Science and Technology, New Delhi for financial assistance to D.K.P. (No. ESS/ 16/213/2003) and to K.P. towards the development of the IIT Bombay–DST National Facility for Ar–Ar Geothermochronology. We also thank the anonymous reviewer for critical and constructive comments on the manuscript. Received 21 January 2014; revised accepted 1 July 2014
Late Cretaceous diurnal tidal system: a study from Nimar Sandstone, Bagh Group, Narmada Valley, Central India Biplab Bhattacharya* and Suparna Jha Department of Earth Sciences, Indian Institute of Technology, Roorkee 247 667, India Tidalites from the Cenomanian Nimar Sandstone, Bagh Group, Central India, are represented by (i) laterally accreted tidal bundles, (ii) herringbone cross-strata, (iii) sigmoidal cross-strata and (iv) tidal rhythmites with lenticular/wavy bedding. These indi-cate sedimentation in an upper subtidal to lower inter-tidal setting within fluvio marine interactive system. Time-series analysis of continuous rhythmic foreset bundles (sub-annual scale) manifests neap–spring tidal cycles within a diurnal tidal system with synodic and sidereal month lengths of ~28.4 lunar days and ~26.28 solar days respectively. Estimated Earth–Moon system parameters of the Late Cretaceous reveal no significant changes during the last ~100 Ma. Keywords: Cenomanian, Cross-strata, lamina thick-ness, lunar orbital cyclicity, tidal bundles. TIDALITES, represented by vertically accreted planar deposits (tidal rhythmites) and laterally accreted foreset bed forms (tidal bundles), within sandstone–mudstone heterolithic units preserve the records of past tidal activi-ties. Analysis of the laterally and vertically continuous cyclic tidal successions provides an opportunity for pre-cise estimation of lunar orbital periodicities and Earth–Moon parameters through geological ages1–3. Biological chronometers, such as growth lines on corals and bivalves, have failed to come up as an alternative method for their lack of precision due to complex environmental and biogenetic factors4. Report of tidalites and interpreta-tion of the corresponding Earth–Moon parameters is

RESEARCH COMMUNICATIONS
CURRENT SCIENCE, VOL. 107, NO. 6, 25 SEPTEMBER 2014 1033
available from the Precambrian5,6, the Carboniferous3,7 and the Holocene8. The present study describes tide generated features from the Late Cretaceous and attempts to delineate the then Earth–Moon parameters. Nimar Sandstone (Cenomanian, ~99.0–93.5 Ma), the basal unit of the Bagh Group in Narmada valley, Central India (Figure 1), has been well studied since long in terms of its rich content of fossil dinosaur bones, dino-saur egg shells, marine invertebrate body fossils and marine trace fossils9. The sedimentological aspects, how-ever, have remained neglected so far, apart from some minor facies descriptions and report of some wave-generated primary sedimentary structures from selected localities10,11. This communication describes various tidal bundles, including herringbone cross-strata, laterally accreted foresets with reactivation surfaces and mud drapes, climbing ripples, sigmoidal bundles, etc. and tidal rhymites, viz. heterolithic pinstripe sand–mud laminae, wavy and lenticular bedding, etc. from the Nimar Sand-stone in Narmada Valley. Thickness variation of foresets within the tidal bundles has been used here subsequently to quantify the lunar tidal periodicities and the Earth–Moon distance during the Late Cretaceous. Such records of the Earth–Moon parameters during the Cretaceous are not available till date. Bagh Group of rocks (Cenomanian–Coniacian) in Central India is constituted of basal Nimar Sandstone (Cenomanian), overlain by Nodular Limestone (Turo-nian) and Coralline Limestone (Coniacian), and signifi-cantly bears records of Cretaceous marine transgression in Central India11. The Bagh Group of sediments is undeformed, unmetamorphosed, nearly horizontal and
Figure 1. a, Geographic map showing the location of the Narmada Valley and the occurrence of the Bagh Group of rocks in peninsular India. b, Detailed geological map of the Bagh area showing occurrence of the Nimar Sandstone (modified after Khosla et al.9). The present study was carried out along the Bagh River and the Man River sections.
unconformably overlies the granite-granulites of the Pre-cambrian Bijawar Group. These are commonly overlain by Deccan Trap volcanics (Late Cretaceous) in majority of the areas. Facies architecture of Nimar Sandstone (~35–40 m thick) depicts (i) an association of channel filling pebbly sandstone facies, lenticular conglomerate facies grading to sandstone and trough cross-stratified sandstone facies in the lower part, indicating a fluvial depositional system; (ii) followed upward by abundant sandstone–mudstone heterolithic facies with well-pre-served tide- and wave-generated sedimentary features, in-tervened by multiple thin-bedded, trough, cross-stratified, sandstone facies, indicating a fluvio-marine interactive depositional system in the middle part, and (iii) an oyster-bearing sandstone facies intercalated with mudstone facies in the upper part of the succession, overlain by Nodular Limestone, indicating marginal marine deposi-tional condition. The present study focuses on documenting the tide-influenced attributes within the sandstone–mudstone heterolithic facies from the Nimar Sandstone exposed in the Bagh River section and the Man River section near Bagh and Manawar areas respectively (Fig-ure 1). The sandstone–mudstone heterolithic facies (Figures 2 and 3) is represented by 2–25 cm thick sandstone beds alternating with 1–10 cm thick mudstone beds. Maximum thickness of this facies is up to 12 m in the Bagh area, where vertical cliffs exposed excellent sections of this facies. Individual sandstone beds are characterized by abundant ripple cross-laminae with development of bundled foresets (Figure 2 a–c). The shift from sand to mud is commonly gradational, whereas the contact bet-ween mud and overlying sand is abrupt. Foreset thickness and inclination vary laterally in cyclic pattern within one strata set (Figure 2 c). Foreset geometry often changes laterally from straight, truncating, to concave up with asymptotic toe, to sigmoidal. Different foresets are accreted laterally against prominent reactivation surfaces (Figure 2 a and c). Successive mud drapes on the sand foresets become flat and merge together in the bottom region, to produce thin mud veneers along the set boundaries (Figure 3 a). The abundance and thickness of mudstone drapes vary across the sets, showing an inverse relation-ship to the foreset thickness in sandstone: drapes are thinner and relatively rare in intervals of thicker foresets, while they are abundant and thicker in intervals of thinner foresets. Apparent bi-directional strata bundles in verti-cally adjacent sets are common (Figures 2 a–c and 3 a, b). Locally, preservation of individual ripple form with mu-tually opposite flow direction has led to development of herringbone cross-strata (Figures 2 a and 3 a). Climbing ripples are also common (Figure 2 b). Characteristically, majority of the ripple forms are often symmetrical in section and show well-rounded, broad crest with thin sand/ mud drapes (Figure 2 b). Tidal rhythmites are developed within near-horizontal, centimetre thin sandstone–mudstone

RESEARCH COMMUNICATIONS
CURRENT SCIENCE, VOL. 107, NO. 6, 25 SEPTEMBER 2014 1034
Figure 2. a, Mutually opposite cross-strata with preserved ripple forms within the sandstone beds of the sandstone–mudstone heterolithic facies. Lateral accretions of strata bundles against reactivation surfaces (R) are common. Note the presence of small sand drapes on ripple tops. b, Bi-directional strata bundles with development of small climbing ripples (C) and reactiva-tion surfaces (R). Ripples show rounded, symmetrical crests. c, Cross-stratified sandstone showing mutually opposite foreset orientations in adjacent strata sets. d, Tidal rhythmites showing development of lenticular and wavy bedding. For (a–c), diameter of the coin is 2.5 cm and P represents plane lamination.
Figure 3. a, Vertically stacked tidal bundles showing alternate thick–thin cycles. Lamina thicknesses in each of the strata sets are measured. The portion within the white box is enlarged in (b). Note the develop-ment of herringbone cross-strata (arrows indicate apparent flow direc-tions). b, Detailed view of tidal bundles. Thickness of the foreset is measured in a direction perpendicular to the foreset inclination (indi-cated by arrow).
alternations, commonly characterized by lenticular and wavy bedding (Figure 2 d), and multimetre-thin sand–mud alternations (pinstripe laminae), resembling inclined heterolithic strata (IHS). Quantification of tidal cyclicity is based on the consi-deration that the variation of foreset thickness of tidal bundles is directly related to the tidal strength, which is dominantly controlled by lunar orbital periodicity and other Earth–Moon parameters12. Lamina thickness is measured perpendicular to the dip of the foresets along a straight line between the upper and lower bounding surfaces (Figure 3 b). Lamina thickness measurements from these separate but laterally and vertically continuous cross-strata sets are plotted in lamina thickness versus lamina number plot (Figure 4 a), which indicates apparent cyclicity. To quantify the cyclicity and overcome any noise due to other natural influences or marine controls, a Fast Fourier transformation (FFT) is performed on a plot of approximately 252 continuous foresets (Figure 4 b). The data obtained are plotted in power spectral density versus frequency curves, which provide a cycle/event chain with one major peak corresponding to cyclicity value of 28.4 laminae/cycle and with several minor peaks having cyclicity values ranging between 1.15 and 0.83 lamina/cycle (Figure 4 b). The studied sandstone–mudstone heterolithic facies is interpreted as tidal sediment due to the presence of (i) bundled sediment couplets (one sand foreset followed by

RESEARCH COMMUNICATIONS
CURRENT SCIENCE, VOL. 107, NO. 6, 25 SEPTEMBER 2014 1035
a mud drape) with lateral thickness variation, (ii) bipolar strata bundles with development of herringbone cross-strata, (iii) frequent reactivation surfaces, (iv) lenticular/ wavy bedding and pinstripe heterolithic strata, which are the hallmark of tidal deposits13,14. The sandstone–mudstone couplets indicate dominant tidal current follo-wed by a slack phase between two successive tides13,14. Frequent changes in tidal current intensity and direction are manifested by abundant reactivation surfaces (inter-mittent velocity asymmetry). Downcurrent changes in thickness and grain size across the laterally accreted strata bundles record systematic variation in tidal strength15. Sigmoidal bundles are generated by migration of linguoid ripples, formed at higher tidal flow velocity than the laterally accreted bundles15,16. Low-angle topset that characterizes these cross-strata is also produced by migration of humpback ripples, in which the area bet-ween the crest point and the brink point represents a zone of non-flow separation, and flow separation occurs near the brink point16. Vertically accreted tidal bundles with thinly laminated sand–mud veneer indicate periodic flow fluctuations with sand-depositing traction current alter-nating with mud-depositing suspension sedimentation during quiescent phases. Alternate sand-dominant and mud-dominant units with variation in thicknesses of the sandstone foresets and mudstone drapes suggest alternate spring–neap–spring tidal cycles17. Bi-polar arrangements
Figure 4. a, Lamina thickness versus lamina number plot showing rhythmic thickness variations in tidal bundles within the sandstone–mudstone heterolithic facies, Nimar Sandstone. b, Fast Fourier transformation power spectral–density plots of 252 continuous data presented in (a).
of strata bundles with development of herringbone cross-strata indicate mutually opposite flow directions. Pre-dominance of sandstone beds over mudstone and abun-dance of mutually opposite cross-strata sets suggest deposition in subtidal channels. Locally, some horizons showing dominance of mudstone over sandstone with development of wavy/lenticular bedding suggest deposi-tion in lower intertidal setting, which prevailed at certain phases during the depositional processes. Thus, an overall upper subtidal to lower intertidal set-up is inferred for the deposition of the studied tidalites. Ripples with rounded crests and symmetrical profiles with sand/mud drapes on top indicate reworking of these sediments by shallow-water waves. The power spectral density plot of ~252 continuous laminae shows spectral periods of 28.4 events with thicker and thinner bundled sets corresponding to alter-nate neap and spring cycles, analogous to those derived from the modern tides and from the ancient records. The power spectra exhibit a consistent spectral period of ~1, which corroborates a dominantly diurnal tidal system with one tidal bundle developed by one dominant tidal current during a day. Absence of double mud drapes within the tidalites also manifests a diurnal tidal system. The upper cyclicity value of 28.4 indicates the number of tidal bundles within one cycle. Under diurnal system, each tidal bundle corresponds to a lunar day and thus, the number of days in one lunar (synodic) month during the Late Cretaceous is calculated as 28.4 days, which is less than the present-day value (29.53 days). However, spec-tral density plots of other discontinuous bundle sets (~112, ~83 and ~62 bundles) from the study area show varying periods between 30.4 and 27.5 laminae per cycle. We consider the value 28.4 laminae with an error level of 0.053 per cycle as more authentic, since under diurnal system 252 continuous tidal bundles represent the time-span between semi-annual and annual period3. The lunar sidereal orbital period cannot be determined directly through measuring the lamina thickness. The pre-sent-day conversion value of Psynodic/Psidereal is 1.0808, whereas the same for Precambrian and post-Precambrian tidalites is ~1.069 to 1.07 respectively12. Using Psynodic/ Psidereal value as 1.07 (ref. 5) and applying the methodol-ogy proposed by Kvale et al.2, the lunar sidereal month length during the Nimar sedimentation is calculated as 28.4/1.07 = 26.28 solar days (present-day value is 27.32 days). Assuming that (i) the total length of the year has not changed significantly2 from the present length of 31.56 106 sec and (ii) there is no secular change in the value of universal gravitational constant (g) throughout the geological time5,18, the number of sidereal months in a year during the Cenomanian time is calculated as 13.9 (present-day value is 13.37 months/yr). Calculated length of the lunar sidereal month is intermediate between those calculated from the Archaean and the Proterozoic tidalites5. Using Kepler’s third law of Earth–Moon
RESEARCH COMMUNICATIONS
CURRENT SCIENCE, VOL. 107, NO. 6, 25 SEPTEMBER 2014 1036
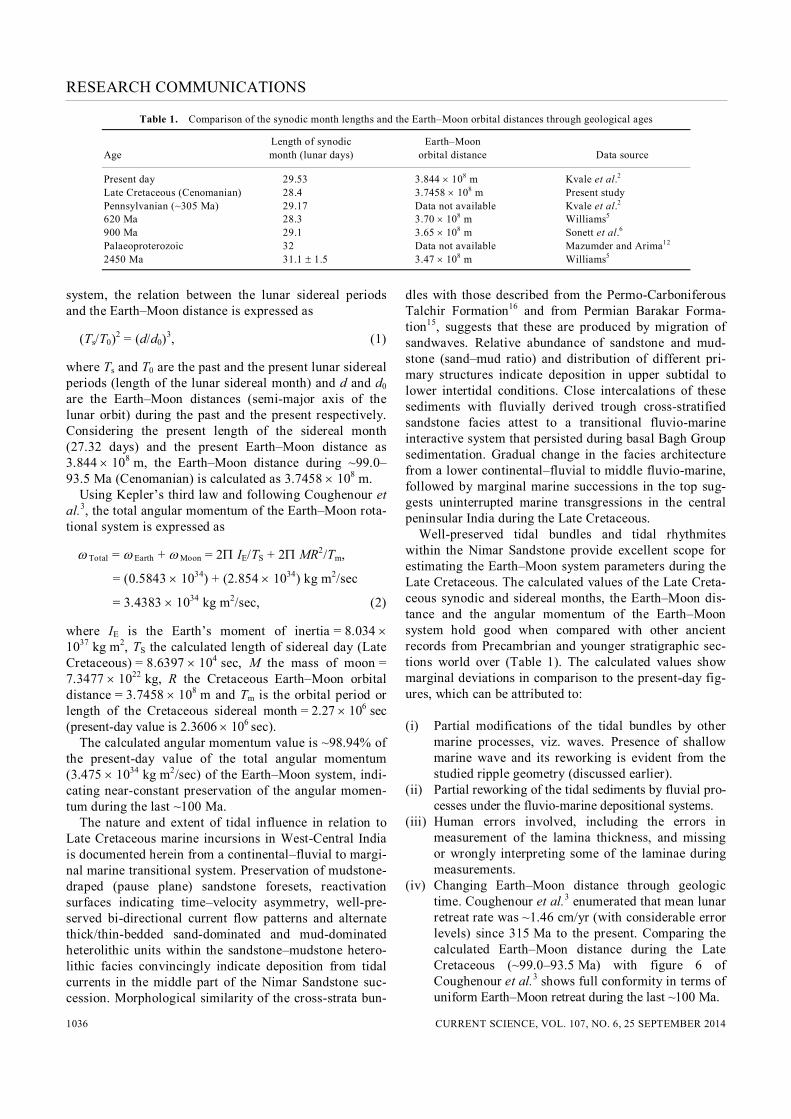
Table 1. Comparison of the synodic month lengths and the Earth–Moon orbital distances through geological ages
Length of synodic Earth–Moon Age month (lunar days) orbital distance Data source
Present day 29.53 3.844 108 m Kvale et al.2 Late Cretaceous (Cenomanian) 28.4 3.7458 108 m Present study Pennsylvanian (~305 Ma) 29.17 Data not available Kvale et al.2 620 Ma 28.3 3.70 108 m Williams5 900 Ma 29.1 3.65 108 m Sonett et al.6 Palaeoproterozoic 32 Data not available Mazumder and Arima12 2450 Ma 31.1 1.5 3.47 108 m Williams5
system, the relation between the lunar sidereal periods and the Earth–Moon distance is expressed as (Ts/T0)2 = (d/d0)3, (1) where Ts and T0 are the past and the present lunar sidereal periods (length of the lunar sidereal month) and d and d0 are the Earth–Moon distances (semi-major axis of the lunar orbit) during the past and the present respectively. Considering the present length of the sidereal month (27.32 days) and the present Earth–Moon distance as 3.844 108 m, the Earth–Moon distance during ~99.0–93.5 Ma (Cenomanian) is calculated as 3.7458 108 m. Using Kepler’s third law and following Coughenour et al.3, the total angular momentum of the Earth–Moon rota-tional system is expressed as
Total = Earth +
Moon = 2 IE/TS + 2 MR2/Tm,
= (0.5843 1034) + (2.854 1034) kg m2/sec
= 3.4383 1034 kg m2/sec, (2) where IE is the Earth’s moment of inertia = 8.034 1037 kg m2, TS the calculated length of sidereal day (Late Cretaceous) = 8.6397 104 sec, M the mass of moon = 7.3477 1022 kg, R the Cretaceous Earth–Moon orbital distance = 3.7458 108 m and Tm is the orbital period or length of the Cretaceous sidereal month = 2.27 106 sec (present-day value is 2.3606 106 sec). The calculated angular momentum value is ~98.94% of the present-day value of the total angular momentum (3.475 1034 kg m2/sec) of the Earth–Moon system, indi-cating near-constant preservation of the angular momen-tum during the last ~100 Ma. The nature and extent of tidal influence in relation to Late Cretaceous marine incursions in West-Central India is documented herein from a continental–fluvial to margi-nal marine transitional system. Preservation of mudstone-draped (pause plane) sandstone foresets, reactivation surfaces indicating time–velocity asymmetry, well-pre-served bi-directional current flow patterns and alternate thick/thin-bedded sand-dominated and mud-dominated heterolithic units within the sandstone–mudstone hetero-lithic facies convincingly indicate deposition from tidal currents in the middle part of the Nimar Sandstone suc-cession. Morphological similarity of the cross-strata bun-
dles with those described from the Permo-Carboniferous Talchir Formation16 and from Permian Barakar Forma-tion15, suggests that these are produced by migration of sandwaves. Relative abundance of sandstone and mud-stone (sand–mud ratio) and distribution of different pri-mary structures indicate deposition in upper subtidal to lower intertidal conditions. Close intercalations of these sediments with fluvially derived trough cross-stratified sandstone facies attest to a transitional fluvio-marine interactive system that persisted during basal Bagh Group sedimentation. Gradual change in the facies architecture from a lower continental–fluvial to middle fluvio-marine, followed by marginal marine successions in the top sug-gests uninterrupted marine transgressions in the central peninsular India during the Late Cretaceous. Well-preserved tidal bundles and tidal rhythmites within the Nimar Sandstone provide excellent scope for estimating the Earth–Moon system parameters during the Late Cretaceous. The calculated values of the Late Creta-ceous synodic and sidereal months, the Earth–Moon dis-tance and the angular momentum of the Earth–Moon system hold good when compared with other ancient records from Precambrian and younger stratigraphic sec-tions world over (Table 1). The calculated values show marginal deviations in comparison to the present-day fig-ures, which can be attributed to: (i) Partial modifications of the tidal bundles by other
marine processes, viz. waves. Presence of shallow marine wave and its reworking is evident from the studied ripple geometry (discussed earlier).
(ii) Partial reworking of the tidal sediments by fluvial pro-cesses under the fluvio-marine depositional systems.
(iii) Human errors involved, including the errors in measurement of the lamina thickness, and missing or wrongly interpreting some of the laminae during measurements.
(iv) Changing Earth–Moon distance through geologic time. Coughenour et al.3 enumerated that mean lunar retreat rate was ~1.46 cm/yr (with considerable error levels) since 315 Ma to the present. Comparing the calculated Earth–Moon distance during the Late Cretaceous (~99.0–93.5 Ma) with figure 6 of Coughenour et al.3 shows full conformity in terms of uniform Earth–Moon retreat during the last ~100 Ma.

RESEARCH COMMUNICATIONS
CURRENT SCIENCE, VOL. 107, NO. 6, 25 SEPTEMBER 2014 1037
*For correspondence. (e-mail: [email protected])
1. Archer, A. W., Kuecher, G. J. and Kvale, E. P., The role of tidal velocity asymmetries in the deposition of silty tidal rhythmites (Carboniferous, Eastern Interior Coal Basin, USA). J. Sediment. Res. A, 1995, 65, 408–416.
2. Kvale, E. P., Johnson, H. W., Sonett, C. P., Archer, A. W. and Zawistoski, A., Calculating lunar retreat rates using tidal rhyth-mites. J. Sediment. Res., 1999, 69, 1154–1168.
3. Coughenour, L. C., Archer, A. W. and Lacovara, J. K., Calculating Earth–Moon system parameters from sub-yearly tidal deposit records: an example from the carboniferous trade water formation. Sediment. Geol., 2013, 295, 67–76.
4. Berry, W. B. N. and Barker, R. M., Fossil bivalve shells indicate longer month and year in Cretaceous than present. Nature, 1968, 217, 938–939.
5. Williams, G. E., Geological constraints on the Precambrian history of Earth’s rotation and the Moon’s orbit. Rev. Geophys., 2000, 38, 37–59.
6. Sonett, C. P., Kvale, E. P., Zakharian, A., Chan, M. A. and Demko, T. M., Late Proterozoic and Paleozoic tides, retreat of the Moon, and rotation of the Earth. Science, 1996, 273, 100–104.
7. Archer, A. W. and Greb, S. W., Hyper tidal facies from the Penn-sylvanian Period, Eastern and Western Interior Coal Basins, USA. In Principles of Tidal Sedimentology (eds Davis, R. A. and Dal-rymple, R. W.), Springer, 2012.
8. Visser, R., Neap–spring cycles reflected in Holocene sub tidal large-scale bed form deposits: a preliminary note. Geology, 1980, 8, 543–546.
9. Khosla, A. et al., First dinosaur remains from the Cenomanian–Turonian Nimar Sandstone (Bagh Beds), District Dhār, Madhya Pradesh, India. J. Paleontol. Soc. India, 2003, 48, 115–127.
10. Singh, S. K. and Srivastava, H. K., Lithostratigraphy of Bagh Beds and its correlation with Lameta Beds. J. Paleontol. Soc. India, 1981, 26, 77–85.
11. Bose, P. K. and Das, N. G., A transgressive storm and fair weather wave dominated shelf sequence, Cretaceous Nimar Formation, Chakrud, Madhya Pradesh, India. Sediment. Geol., 1986, 46(1–2), 147–167.
12. Mazumder, R. and Arima, M., Tidal rhythmites and their implica-tions. Earth–Sci. Rev., 2005, 69, 79–95.
13. Allen, J. R. L., Lower cretaceous tides revealed by cross-bedding with mud drapes. Nature, 1981, 289, 579–581.
14. Terwindt, J. H. J., Origin and sequences of sedimentary structures in onshore mesotidal deposits of the North Sea. In Holocene Marine Sedimentation in the North Sea Basin (eds Nio, S. D., Shuttenhelm, R. T. E. and van Weering, Tj. C. E.), Special Publi-cation No. 5, International Association of Sedimentologists, Blackwell Scientific Publications, Boston, 1981, pp. 4–26.
15. Bhattacharya, B., Bandyopadhyay, S., Mahapatra, S. and Banerjee, S., Record of tide wave influence on the coal-bearing Permian Barakar Formation. Sediment. Geol., 2012, 267–268, 25–35.
16. Bhattacharya, H. N. and Bhattacharya, B., A Permo-Carboniferous tide–storm interactive system, Talchir Formation, Raniganj Basin, India. J. Asian Earth Sci., 2006, 27, 303–311.
17. Greb, S. F. and Archer, A. W., Rhythmite sedimentation in a mixed tide and wave deposit: Hazel Patch Sandstone (Pennsylvanian) Eastern Kentucky Coalfield. J. Sediment. Res. B, 1995, 65, 96–106.
18. Guenther, D. B., Krauss, L. M. and Demarque, P., Testing the constancy of the gravitational constant using helioseismology. Astrophys. J., 1998, 498, 871–876.
ACKNOWLEDGEMENTS. We thank the Department of Earth Sci-ences, IIT Roorkee, for providing infrastructural facilities. Constructive suggestions by anonymous reviewers are gratefully acknowledged. Received 21 May 2014; revised accepted 4 July 2014
Natural base isolation system for earthquake protection Srijit Bandyopadhyay1, Aniruddha Sengupta1,* and G. R. Reddy2 1Department of Civil Engineering, Indian Institute of Technology, Kharagpur 721 302, India 2Structural and Seismic Engineering Section, Homi Bhaba National Institute, Mumbai 400 094, India The performance of a well-designed layer of sand, geo-grid, geo-textiles and composites like layer of sand mixed with shredded tyre (rubber) as low-cost base isolators is studied in shake table tests in the labora-tory. The building foundation is modelled by a 200 mm 200 mm and 40 mm thick, rigid plexi-glass block. The block is placed in the middle of a 1 m 1 m tank filled with sand. The selected base isolator is placed between the block and the sand foundation. Accelerometers are placed on top of the footing and foundation sand layer. The displacement of the footing is also measured by transducers. The whole set-up is mounted on the shake table and subjected to sinusoi-dal motion with varying amplitude and frequency. Sand is found to be effective only at very high ampli-tude (>0.65 g) of motion. Among all the different materials tested, the performance of a composite con-sisting of sand and 50% shredded rubber tyre placed under the footing is found to be the most promising as a low-cost, effective base isolator. Keywords: Base isolation, earthquake protection, shake table test, shredded rubber tyre. TO find an economical and feasible way of designing new structures or strengthening existing ones for protection from damages during an earthquake is one of the chal-lenges in civil engineering. The conventional approach to seismic hazard mitigation is to design structures with adequate strength and ability to deform in a ductile manner. Over the past two decades, newer concepts of structural vibration control, including seismic isolation, installation of passive and active/semi-active devices1–4 have been growing in acceptance. Traditionally, earth-quake-resistant design of low- to medium-rise buildings is particularly important, as their fundamental frequencies of vibration are within the range where earthquake-induced force (acceleration) is the highest as found dur-ing the Mexico City Earthquake5,6. One possible means to reduce the degree of amplification is to make the building more flexible7. In low to medium-rise buildings, this nec-essary flexibility can be achieved by the use of base isolation techniques. The primary mechanism for the reduction of shaking level in a base isolation method is energy dissipation.
Copyright © 2022 FDOKUMEN