Last shall be first: A field study of biases in sequential ...
29
HAL Id: hal-00728417 https://hal.archives-ouvertes.fr/hal-00728417 Submitted on 6 Sep 2012 HAL is a multi-disciplinary open access archive for the deposit and dissemination of sci- entific research documents, whether they are pub- lished or not. The documents may come from teaching and research institutions in France or abroad, or from public or private research centers. L’archive ouverte pluridisciplinaire HAL, est destinée au dépôt et à la diffusion de documents scientifiques de niveau recherche, publiés ou non, émanant des établissements d’enseignement et de recherche français ou étrangers, des laboratoires publics ou privés. Last shall be first: A field study of biases in sequential performance evaluation on the Idol series Lionel Page, Katie Page To cite this version: Lionel Page, Katie Page. Last shall be first: A field study of biases in sequential performance evaluation on the Idol series. Journal of Economic Behavior and Organization, Elsevier, 2009, 73 (2), pp.186. 10.1016/j.jebo.2009.08.012. hal-00728417
-
Upload
khangminh22 -
Category
Documents
-
view
0 -
download
0
Transcript of Last shall be first: A field study of biases in sequential ...
HAL Id: hal-00728417https://hal.archives-ouvertes.fr/hal-00728417
Submitted on 6 Sep 2012
HAL is a multi-disciplinary open accessarchive for the deposit and dissemination of sci-entific research documents, whether they are pub-lished or not. The documents may come fromteaching and research institutions in France orabroad, or from public or private research centers.
L’archive ouverte pluridisciplinaire HAL, estdestinée au dépôt et à la diffusion de documentsscientifiques de niveau recherche, publiés ou non,émanant des établissements d’enseignement et derecherche français ou étrangers, des laboratoirespublics ou privés.
Last shall be first: A field study of biases in sequentialperformance evaluation on the Idol series
Lionel Page, Katie Page
To cite this version:Lionel Page, Katie Page. Last shall be first: A field study of biases in sequential performance evaluationon the Idol series. Journal of Economic Behavior and Organization, Elsevier, 2009, 73 (2), pp.186.10.1016/j.jebo.2009.08.012. hal-00728417
Accepted Manuscript
Title: Last shall be first: A field study of biases in sequentialperformance evaluation on the Idol series
Authors: Lionel Page, Katie Page
PII: S0167-2681(09)00211-XDOI: doi:10.1016/j.jebo.2009.08.012Reference: JEBO 2442
To appear in: Journal of Economic Behavior & Organization
Received date: 30-6-2008Revised date: 18-8-2009Accepted date: 18-8-2009
Please cite this article as: Page, L., Page, K., Last shall be first: A field study of biasesin sequential performance evaluation on the Idol series, Journal of Economic Behaviorand Organization (2008), doi:10.1016/j.jebo.2009.08.012
This is a PDF file of an unedited manuscript that has been accepted for publication.As a service to our customers we are providing this early version of the manuscript.The manuscript will undergo copyediting, typesetting, and review of the resulting proofbefore it is published in its final form. Please note that during the production processerrors may be discovered which could affect the content, and all legal disclaimers thatapply to the journal pertain.
Page 1 of 27
Accep
ted
Man
uscr
iptLast shall be first:
A field study of biases in sequential performance
evaluation on the Idol series.
Lionel Page∗
Westminster Business School
University of Westminster
35, Marylebone Road
NW1 5LS, London, UK
Katie Page
Heythrop College
University of London
Kensington Square
W8 5HQ, London, UK
∗Corresponding author. Tel: +44 2 07911 5000 (2706)
1
* Title Page (with Full Author Details)
Page 2 of 27
Accep
ted
Man
uscr
iptLast shall be first:
A field study of biases in sequential performance
evaluation on the Idol series.
Abstract
When performances are evaluated they are very often presented in asequential order. Previous research suggests that the sequential presen-tation of alternatives may induce systematic biases in the way perfor-mances are evaluated. Such a phenomenon has been scarcely studied ineconomics. Using a large data set of performance evaluation in the Idolseries (N=1522), this paper presents new evidence about the systematicbiases in sequential evaluation of performances and the psychological phe-nomena at the origin of these biases.JEL codes: D81, Z1Keywords: order effects, memory, television show
We frequently make judgements and decisions about information which is pre-sented to us in a sequential manner. This in particular is the case when we haveto quickly assess the performance of individuals within a pool of contestants:job interviews, singing auditions, political debates, or even dating evenings.
The psychological literature suggests that sequential presentation of informa-tion may influence the way each piece of information is processed and recorded.Studies in economics (Neilson, 1998) and marketing (Novemsky and Dhar, 2005)have also found that a choice among situations of sequential choices may be de-pendent on the history of the sequence. This issue is of special importancefor situations of performance evaluation. If there is any effect of the order inwhich people are assessed on the final evaluation of individual performances,it means that the evaluation process is biased. Stated simply, what should becompletely irrelevant information (the passing order) plays a significant role inthe evaluation process.
The issue of potential bias in performance evaluation raises two main con-cerns: efficiency and fairness. First, from the perspective of the assessor, anybias in the evaluation process results in a loss in terms of efficiency becausethe best options may eventually not be selected. Second, from the perspectiveof the contestant, any bias in the evaluation process raises the question of thefairness of the selection process: are some contestants disadvantaged relative toothers for irrelevant reasons?
1
Blinded Manuscript (NO Author Details)
Page 3 of 27
Accep
ted
Man
uscr
ipt
If there are biases in evaluation processes involving a sequential ordering ofcontestants/options, we need to be aware of these in order to design strategies tominimize their adverse effects and ensure that outcomes are as fair and efficientas possible.
Paradoxically, few studies have attempted to assess empirically the pres-ence of systematic biases in the sequential evaluation of performance (Bruine deBruin, 2005). In economics, the fairness and efficiency of performance evaluationprocedures have mostly been studied relative to the possible biases arising fromthe judges’ incentives (Prendergast and Topel, 1993; Clerides and Stengos, 2006)and from discriminating preferences (Goldin and Rouse, 2000; Segrest Purkisset al., 2006). The economic literature has largely ignored the possible distor-tions arising from the pure cognitive biases in the evaluation of performance.Such biases, if significant and of practical importance, must however be studiedcarefully in order to limit their detrimental effects on the efficiency and fairnessof selection procedures which rely on the evaluation of performances.
Using a unique dataset on the Idol series spanning competitions from eightcountries (Australia, Brazil, Canada, Germany, India, Netherlands, United King-dom, USA), this paper contributes to our understanding of order biases in per-formance evaluation in a naturalistic setting. Because of their generic format,the Idol shows provide a large set of identical situations where a group of indi-viduals have to perform sequentially and are assessed by television viewers whovote for them.
The statistical analysis of this large dataset of 1,522 performances over 165shows confirms some of the previous empirical literature on ordering effects andcontributes to furthering our understanding of the underlying psychological phe-nomena of these effects. Our results suggest that systematic biases in sequentialevaluation of performance arise through two parallel processes: the effect of theordering on the propensity to remember each candidate, and the propensity toassess a contestant by comparing him or her to the previous contestant(s).
The remainder of the paper is organized as follows, Section 1 presents theliterature on sequential biases in performance evaluation, Section 2 presents ourdataset and Section 3 our results. Section 4 concludes.
1 Sequential biases in performance evaluation
There are two main reasons why biases may result from sequential ordering. Thefirst is that judges may not remember equally well the different performances inthe sequence, and second, the criteria/benchmark of the evaluation may changeover time. For example, the evaluation of a performance may be dependent onthe history of previous performance(s).
These potential caveats may produce two types of biases. First, orderingbiases may result because your performance evaluation is conditional on yourpassing order. The second potential bias is that the evaluation of one’s per-formance may directly depend on the quality of the previous performance(s).We will call these two types of biases respectively “sequential order bias” and
2
Page 4 of 27
Accep
ted
Man
uscr
ipt
“sequential history bias”.
1.1 Sequential order bias
Few studies have addressed the effect of order on judgments of performance.Generally the research evidence indicates that later serial positions benefit frommore positive evaluations . The evidence comes from several naturalistic studieson performance in competitions, including a study on international synchronizedswimming competitions (Wilson, 1977), work on the Queen Elizabeth Contestfor violin and piano (Flores and Ginsburgh, 1996; Glejser and Heyndels, 2001),and studies of the Eurovision song contest (Bruine de Bruin, 2005) and iceskating competitions (Bruine de Bruin, 2005, 2006).
Wilson (1977) showed that there was a significant negative correlation be-tween serial positions and final ranks in the 1973 World Championship synchro-nized swimming championships and an amateur meet held in the same year suchthat better rankings tended to be in later serial positions. An evaluation of thejudgments by 15 experts in the Queen Elizabeth Contest for classical violin andpiano by Glejser and Heyndels (2001) showed that musicians who performedon a later day in the competition received better judgments. Moreover, higheroverall rankings were also given for performances scheduled later in the weekand later in the evening (Glejser and Heyndels, 2001). Bruine de Bruin (2005)examined the effect of order in both the Eurovision song contest and ice skat-ing judgments. She found an increasing linear trend such that contestants whowere in the later serial positions had significantly higher ratings than those inthe earlier positions. This effect was also found in her follow up study on iceskating with a larger data set (Bruine de Bruin, 2006).
Two potential explanations exist in the literature for this observed orderbias. First, there is a well established literature on the effects of order onmemory. The serial position effect is the phenomenon demonstrating that recallaccuracy (usually for words) varies as a function of an item’s position within alist (Murdock, 1962). Specifically, there are two main effects: the primacy effectand the recency effect. When asked to free recall items from a list participantsgenerally remember better those stimuli at both the beginning (primacy effect)and end (recency effect) of a sequence, resulting in a roughly u-shaped curve.The serial position effect is a robust well researched phenomenon in the cognitivepsychological literature (Glanzer and Cunitz, 1966; Burgess and Hitch, 1999;Gershberg and Shimamura, 1994).
These serial position effects have been demonstrated both in the laboratory(Singh and Cole, 1993; Snyder and Harrison, 1997) and in naturalistic settings(Terry, 2005; Pieters and Bijmolt, 1997). Different memory mechanisms havebeen proposed to underlie the primacy and recency effects, with primacy effectslinked to long term memory and recency effects explained through short termmemory mechanisms (Glanzer and Cunitz, 1966). Moreover, several factors havebeen found to influence or alter their effects, for example distinctiveness (Neathand Crowder, 1996), emotional content (Rubin and Friendly, 1986; Maratoset al., 2000; Snyder and Harrison, 1997), prolonged distraction (Glenberg et al.,
3
Page 5 of 27
Accep
ted
Man
uscr
ipt
1980) and the length of the series (Anderson et al., 1998). Generally though,holding other factors constant, first and last items are remembered better.
The interest in the role of memory and its limitations in economic decisionmaking has grown recently (Dow, 1991; Piccione and Rubinstein, 1997; Benabouand Tirole, 2002; Mullainathan, 2002; Devetag and Warglien, 2003; Bernheimand Thomadsen, 2005; Devetag and Warglien, 2007). For instance Mullainathan(2002) proposes an exponential decay of recall probabilities, compatible with arecency effect:
E(fk) = f1− ρ−k
1− ρwhere fk is the probability to forget the event and ρ ∈ 0, 1 a parameterrepresenting the propensity to remember an event from one period to the next.Recently, such a recency effect has been integrated by Sarafidis (2007) in a modelwhere individuals can anticipate such biases and use them strategically. Moregenerally a recency effect will be compatible with ∂E(fk)/∂k ≥ 0 for k ≥ k′,and a primacy effect with ∂E(fk)/∂k ≤ 0 for k < k′′.
These memory explanations have been seldom linked to the evaluation ofsequential performance, and this issue has not yet been studied in economics.If we extend the idea suggested by Mullainathan (2002) to model memory limi-tations as the effect of time on the probability to remember an event, it is clearthat contestants whose performance/qualities are less likely to be rememberedare less likely to be positively selected. The primacy and recency effect wouldtherefore suggest that contestants who are in earlier and later positions willbenefit positively as a result of their performances being remembered better.
A second possible explanation for the empirical results is proposed by Bru-ine de Bruin (2005). They explain their results through a direction of com-parison effect. Specifically, they posit that as each new option is presentedjudges search for unique features (positive or negative) in the performance and,if found, these influence upwardly (for positive unique features) and down-wardly (for unique negative features) the judgments, because more weight isgiven to these unique aspects rather than any overlapping (similar) features ofthe performance. Overall, they conclude that the direction-of-comparison effectis most prominent in tasks that promote sequential judgment, and in optionswith unique positive features (Bruine de Bruin and Keren, 2003). They furtherspeculate that the direction-of-comparison effect may have contributed to thelinear order effects found in jury evaluations of world-level figure skating con-tests (Bruine de Bruin and Keren, 2003), international synchronized swimmingcompetitions (Wilson, 1977), the Eurovision Song Contest for popular music(Bruine de Bruin, 2005), and the Queen Elizabeth Contest (Glejser and Heyn-dels, 2001). However, this would only be the case if the judges were focused onthe unique positive features of each performance, which may or may not havebeen the case.
Fundamentally, the idea of a direction-of-comparison effect relies on a specificform of reference dependent preferences which is one of the most importanthypotheses in modern behavioural economics (Bruni and Sugden, 2007). The
4
Page 6 of 27
Accep
ted
Man
uscr
ipt
direction of comparison effect supposes that performances are evaluated for theirdifferences relative to a previous set of performances. If contestants presentpositive and negative differences relative to previous ones, and if the judgesfocus on the positive ones, then a systematic positive trend in the evaluation ofcontestants should appear. It is, however, not clear why judges would focus onpositive differences, while not taking into account negative differences.
1.2 Sequential history bias
The second possible bias in the sequential evaluation of performance is thateach person’s performance evaluation may depend on the performance of theprevious person relative to whom they are often implicitly compared. For eachjudgment in a given sequence (with the exception of the first judgment), it isthe case that the judge has already very recently evaluated another target onthat same dimension. Therefore, the knowledge the judge has activated to makethat previous judgment is highly accessible at the time the next judgment hasto be made. Consequently, this knowledge of the previous judgment is likely toinfluence the subsequent judgment (Damisch et al., 2006).Thus, the evaluationof a target at almost any point of the sequence is likely to be affected by theinformation that was activated during the preceding judgment of another targeton that dimension (Damisch et al., 2006, p. 167).
Mussweiler’s 2003 selective accessibility model outlines two main compari-son processes - contrast and assimilation - that take place during the assessmentof two consecutive stimuli. These comparison processes are, from an economicpoint of view, two different forms of reference dependent evaluation. Contrastoccurs when judges focus on differences in the stimuli, and assimilation occurswhen the focus is on similarities. More precisely, the direction of the influenceis determined by the perceived similarity between the two sequential stimuli.A priori it is not clear what phenomenon is likely to be at work in a sequen-tial performance evaluation, but regardless of its nature it is likely to createbiases in the individual evaluation of performances because the evaluation of acontestant’s performance will be depend on the performances of the previouscontestant.
Damisch et al. (2006) examined sequential performance judgments in boththe 2004 Olympic Games and data gathered in a laboratory setting. Theiraim was to apply the concepts in the selective accessibility model (Mussweiler,2003; Mussweiler et al., 2004) to sequential judgments in sport. Their resultsdemonstrated that the score of an athlete increases with increasing scores ofhis or her immediate predecessor and decreases with decreasing scores of hisor her predecessor, showing assimilation rather than contrast. Moreover, thiseffect carries on after the first person such that the correlation between a targetand subsequent targets, whom are not immediately after the target (but secondthird etc), are also significant. According to research by Mussweiler et al. (2004)and Gentner and Markman (1994) unless otherwise instructed judges tend tosearch for similarities in the performances of people, that is, assimilation oftenappears to be the default judgmental outcome, resulting in significant positive
5
Page 7 of 27
Accep
ted
Man
uscr
ipt
correlations between performances.This paper investigates these two potential form of biases in the sequential
evaluation of performance in a large data set from a naturalistic setting. Itsunique contribution is twofold. First, no previous work has evaluated these twobiases concurrently, therefore this paper adds to the existing work by enablinga direct comparison of these two processes in sequential order effects on per-formance evaluation. This is extremely important because it will enable us toisolate what factors are contributing to an observed ordering effect in perfor-mance and provide clearer theoretical implications.
Second, this paper uses a large, multicultural dataset which has the advan-tage of ecological validity and generalisbility. A large majority of the previousstudies of these order biases tend to be laboratory based or naturalistic studiesusing much smaller or restricted datasets. Our paper is unique in this respectand hence provides a strong base for testing the theoretical predictions.
2 The data
Our data consist of observations of the ranking of contestants in live showsfor several pop Idol series: Australia (Australian Idol: 2003, 2004, 2006, 2007;X-factor: 2005), Brazil (Idolos Brazil: 2007), Canada (Canadian Idol: 2003,2004, 2005, 2006, 2007), Germany (Deutschland sucht den Superstar: 2003,2004, 2006, 2007), India (Indian Idol: 2006, 2007), Netherlands (Idols: 2005; Xfactor: 2006), UK (X-factor: 2004, 2005, 2006, 2007), and the USA (AmericanIdol: 2002, 2003, 2004, 2005, 2006, 2007). All of these shows share the sameformat in their final stage, specifically, the final set of contestants (10 to 13depending on the series) are progressively eliminated one by one after each show.In each show participants have to perform a new song. Their performance isthen assessed by television viewers who can vote for their preferred performanceby telephone (as many times as they want). The votes are tallied and one ofthe last two (or three) contestants who have received the fewest votes from thepublic is then eliminated (sometimes this last step is determined by a choicefrom the judges).
The generic format of these shows, which is almost identical across countriesand seasons, provides a unique opportunity to study the effects of ordering onthe evaluation of individual performance. In addition, the variety of countriesin our sample ensures that our results are not idiosyncratic to a given cultureor to a given series.
For each season we observe the final shows where candidates have to performone song one after the other before the public is allowed to vote for them. We donot analyse the very final stage of the competition, when four or five competitorsare left and they each sing two or more songs. We therefore only observe showswhere there are between 5 and 13 competitors singing one song and one or twocompetitors being voted off at the end of each show. These data have beencollected from various online sources: wikipedia.org, tv.com and the shows’websites.
6
Page 8 of 27
Accep
ted
Man
uscr
ipt
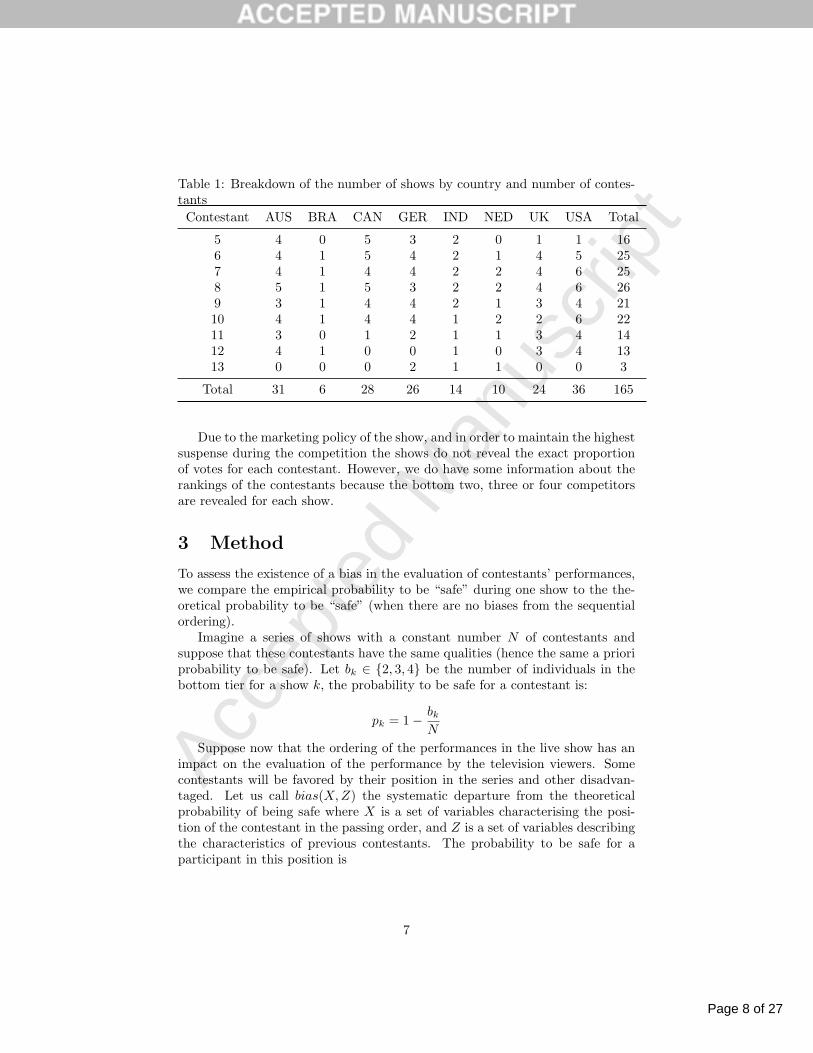
Table 1: Breakdown of the number of shows by country and number of contes-tants
Contestant AUS BRA CAN GER IND NED UK USA Total
5 4 0 5 3 2 0 1 1 166 4 1 5 4 2 1 4 5 257 4 1 4 4 2 2 4 6 258 5 1 5 3 2 2 4 6 269 3 1 4 4 2 1 3 4 2110 4 1 4 4 1 2 2 6 2211 3 0 1 2 1 1 3 4 1412 4 1 0 0 1 0 3 4 1313 0 0 0 2 1 1 0 0 3
Total 31 6 28 26 14 10 24 36 165
Due to the marketing policy of the show, and in order to maintain the highestsuspense during the competition the shows do not reveal the exact proportionof votes for each contestant. However, we do have some information about therankings of the contestants because the bottom two, three or four competitorsare revealed for each show.
3 Method
To assess the existence of a bias in the evaluation of contestants’ performances,we compare the empirical probability to be “safe” during one show to the the-oretical probability to be “safe” (when there are no biases from the sequentialordering).
Imagine a series of shows with a constant number N of contestants andsuppose that these contestants have the same qualities (hence the same a prioriprobability to be safe). Let bk ∈ 2, 3, 4 be the number of individuals in thebottom tier for a show k, the probability to be safe for a contestant is:
pk = 1− bkN
Suppose now that the ordering of the performances in the live show has animpact on the evaluation of the performance by the television viewers. Somecontestants will be favored by their position in the series and other disadvan-taged. Let us call bias(X,Z) the systematic departure from the theoreticalprobability of being safe where X is a set of variables characterising the posi-tion of the contestant in the passing order, and Z is a set of variables describingthe characteristics of previous contestants. The probability to be safe for aparticipant in this position is
7
Page 9 of 27
Accep
ted
Man
uscr
iptpi = 1− bk
N+ bias(X,Z)
Suppose that, in this simple situation, we want to estimate the bias linkedwith every position i in the order, E(bias(i, Z)|i), we could compare the the-oretical probability to be safe pT = 1 − bk/N to the actual frequency of safecontestants in each position i, pi =
∑1i is safe/Ns, where Ns is the number
of shows observed:
E(bias(i, Z)|i) =∑ 1i is safe
Ns−(
1− bkN
)Our data are slightly more complex than this example because the number
of contestants varies across the shows. To estimate E(bias(X,Z)|X,Z), wecalculate the variable biasjk, which, for a participant j performing in the showk takes the value:
biasjk = 1j is safe −(
1− bkNk
)By definition, we have E(bias(X,Z)|X,Z) = E(biasjk|X,Z). We can then
define the two biases found in the literature as:
Definition 1 (Sequential order bias) There is a sequential order bias assoon as for any variable xj characterising the position of a performance j inthe passing order:
E(biasjk|xj) 6= 0
Definition 2 (Sequential history bias) There is a sequential history bias assoon as for any variable z characterising the previous candidates:
E(biasjk|z) 6= 0
The following sections will consecutively study these two possible biases.
4 Sequential order bias
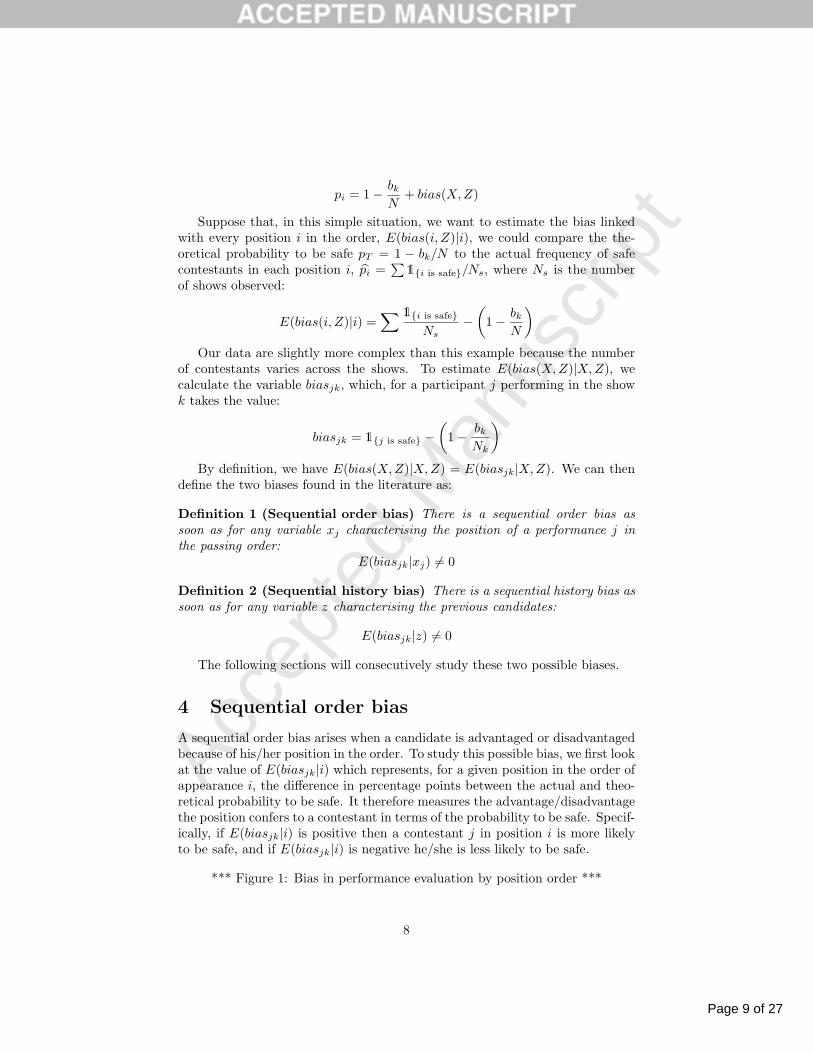
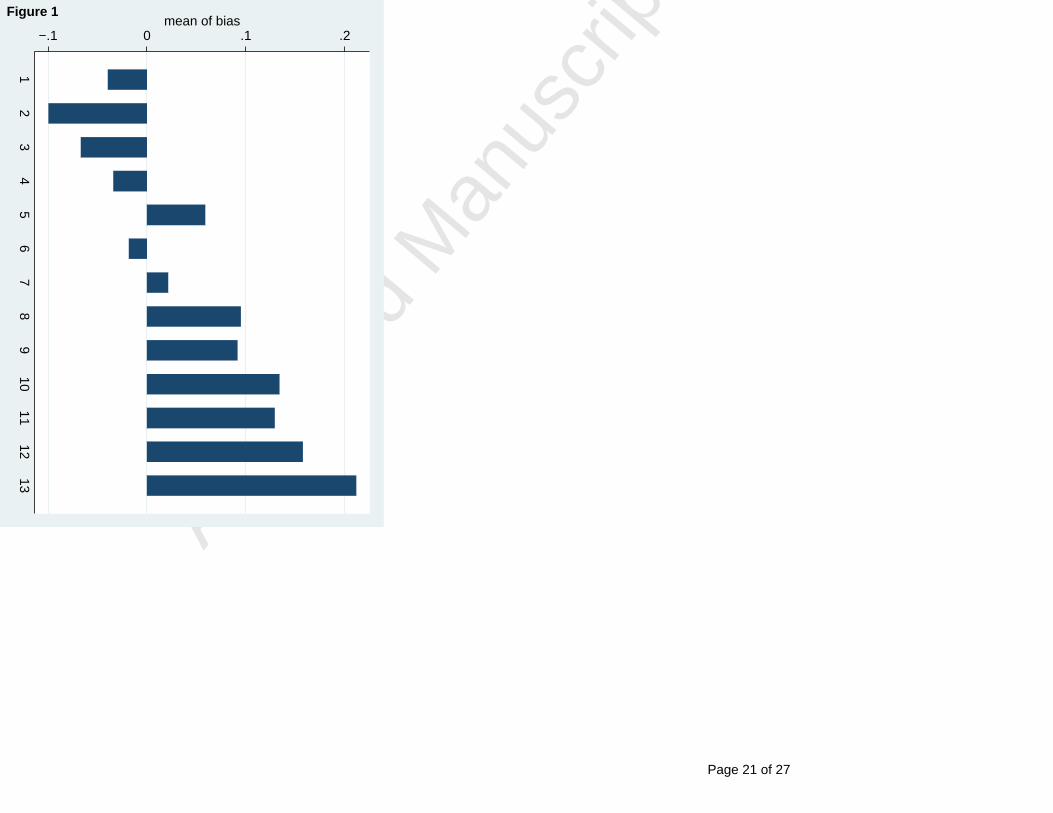
A sequential order bias arises when a candidate is advantaged or disadvantagedbecause of his/her position in the order. To study this possible bias, we first lookat the value of E(biasjk|i) which represents, for a given position in the order ofappearance i, the difference in percentage points between the actual and theo-retical probability to be safe. It therefore measures the advantage/disadvantagethe position confers to a contestant in terms of the probability to be safe. Specif-ically, if E(biasjk|i) is positive then a contestant j in position i is more likelyto be safe, and if E(biasjk|i) is negative he/she is less likely to be safe.
*** Figure 1: Bias in performance evaluation by position order ***
8
Page 10 of 27
Accep
ted
Man
uscr
ipt
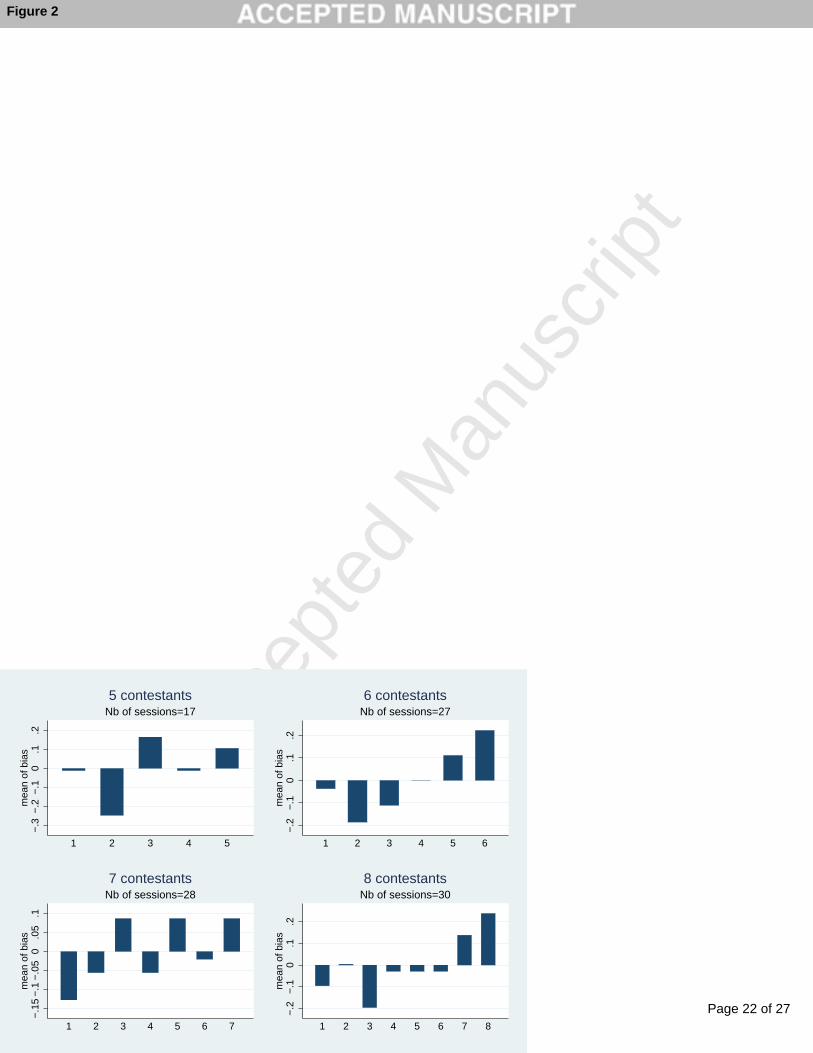
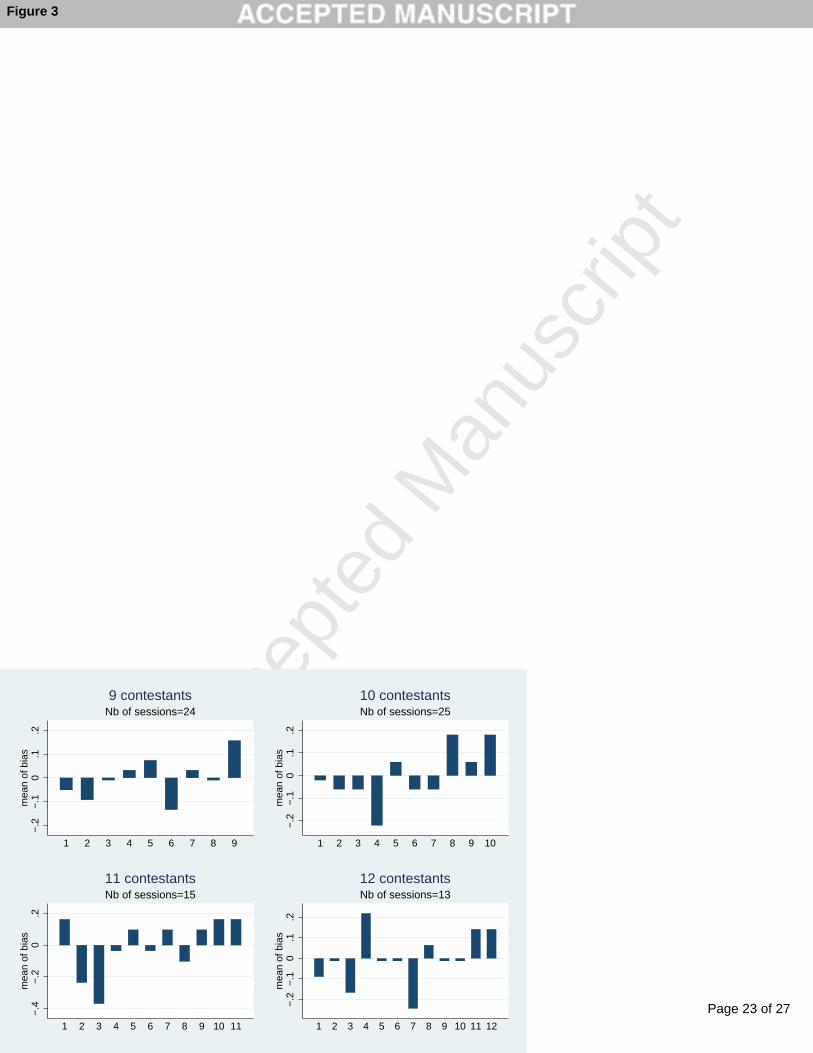
Figure 1 presents the mean bias per position over the whole set of positions.A clear pattern emerges which shows a positive trend as the order increases.However, this graph is slightly inaccurate because the relative location of eachposition may be different. For example, the 5th position will be the last onein some situations, while in other situations it will be located in the middlebetween the beginning and the end of the series. In this graph the last positionalso consists of different positions, for example, sometimes it is 5th, 9th or11th. Figures 2 and 3 present the decomposition of the ordering effect for theshows which have between 5 and 12 contestants. The last contestants appearto benefit from a positive bias, while contestants in the middle of the order(especially closer to the beginning) seem to be disadvantaged.
*** Figure 2: Order effect for each type of show ****** Figure 3: Order effect for each type of show ***
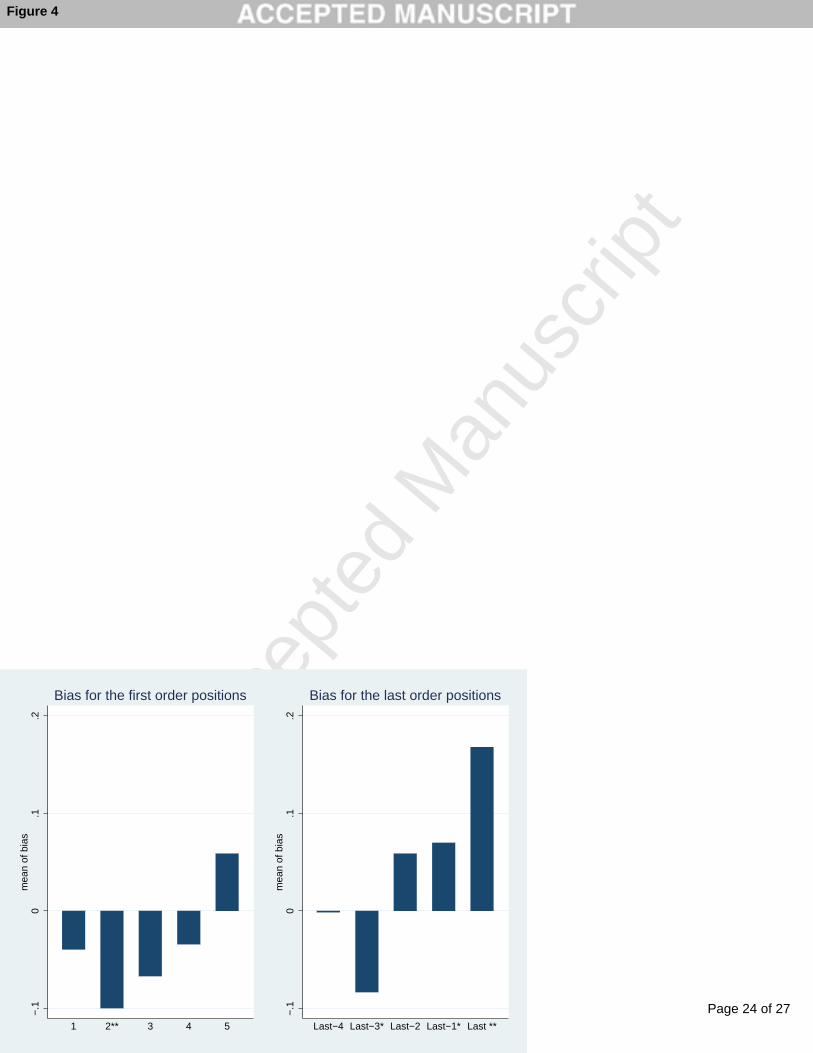
In order to summarize the effects at the beginning and at the end of thesequence, Figure 4 compares the evolution from the beginning of the order tothe evolution when looking at the reverse order. The last contestants appear tohave a significant advantage relative to the contestants in other positions.
*** Figure 4: Bias in performance evaluation at the beginning and the end ofthe series ***
Overall, these results suggest that there seems to be an increasing lineartrend such that contestants in the later positions have an advantage relative tothose contestants in earlier positions. The worst positions in terms of bias seemto be positions two and three.
One potential caveat of the research concerns the allocation process of thecontestants. The above analysis assumes the random ordering of contestants topositions. What if this is not the case? In fact, there are two main reasons tothink that the ordering is not random.
First, the goal of the production is to maximise the entertainment valueand, if there is not a strict rule about the random allocation of contestants, thiscould produce a spurious correlation between the ordering and the results. Forexample, better quality contestants could be more likely to be placed in somespecific positions (like the beginning or the end) just for production purposes.This implies that even if there were no ordering effect at all, a selection biascould induce some differences between the probability of success of differentpositions.
Second, the production company could have an agenda regarding the con-testants, and therefore be willing to keep good contestants longer because theywill attract more viewers in later shows. So, if there is any ordering effect, theycould use it to advantage/disadvantage some contestants. This implies that ifthere is an ordering effect, the magnitude of this effect could be biased by aselection effect. In order to control for this potential caveat, we implement fixedeffect models and estimate the ordering effects while controlling for the abilityof the contestant.
9
Page 11 of 27
Accep
ted
Man
uscr
ipt
To analyse the effect of the ordering on the evaluation of the performanceof contestants, it is possible to use a linear regression model with the variablebias as a dependent variable. Contestants in general perform more than oncein the shows, we can therefore write:
biasjk = β0 +Xjkβ + uj + εjk (1)
where Xjk is a vector of variables relative to the order i of the participant j inthe show k. The term uj is an individual effect specific to the individual j rep-resenting his/her ability. If the allocation of contestants is random, contestantsperforming at different positions in the order do not tend to have, on average,differences in ability: E(uj |Xjk) = 0. In such a situation, the OLS estimator isunbiased but not efficient and a random effect model must be used instead.
However, one may doubt the hypothesis of random allocation of contestants.One could suspect, for instance, the production company to select, on average,better contestants to perform at the end of the show. In this case, we haveE(uj |Xjk) 6= 0 and the random effect estimation will be biased. To control forsuch a possibility we use a fixed effect estimator to estimate equation (1). Thefixed effect estimator is a within estimator which uses only the variations in re-sults observed within each contestant when they perform in different positions1.
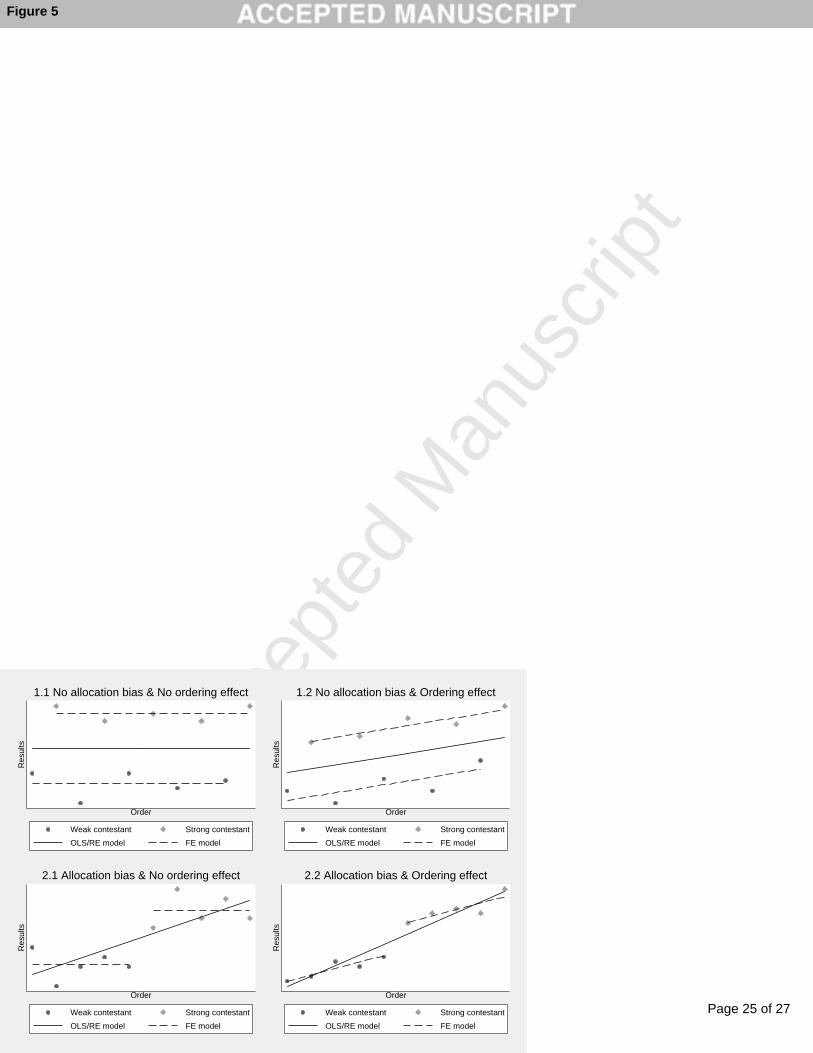
Using hypothetical contestants, Figure 5 presents the intuition of this esti-mator and demonstrates how it corrects for a possible bias in the allocation ofcontestants. Part 1.1 and 1.2 of Figure 5 show that when there is no allocationbias, the fixed effect (FE) estimator is identical to the OLS or random effect(RE) estimator. If, on the contrary, there is an allocation bias such that strongcontestants are allocated to better positions in the passing order (2.1 and 2.2)the FE estimator corrects appropriately for the selection bias. Part 2.1 of Figure5 shows that if there is no ordering effect the FE estimator will accurately showthat ordering does not impact on each contestant’s results. Part 2.2 shows asituation where there is an ordering effect and an allocation bias. In this casethe RE estimation is biased upward, while the FE estimation gives the correctestimate of the ordering effect.
*** Figure 5: Identification strategy: using within variations in results toeliminate a possible systematic bias in the allocation of contestants ***
If there is no order effect, no variable x from Xjk should have a significantcoefficient. Given that the result for each contestant is not independent of theresults of other contestants within a given show, these models are estimatedwith a clustered robust variance matrix with the shows as clusters.
For all shows the order variable was normalised between 0 (first) and 1 (last).A dummy variable was created to capture the difference between being the first
1It is the equivalent of an ANCOVA in psychology and other social sciences with thecontestant playing the role of the grouping variable. While psychologists use ANCOVA tostudy the between groups effect controlling for covariates, economists use the fixed effect modelto study the effect of the covariates controlling for systematic differences between groups (herethe contestants).
10
Page 12 of 27
Accep
ted
Man
uscr
ipt
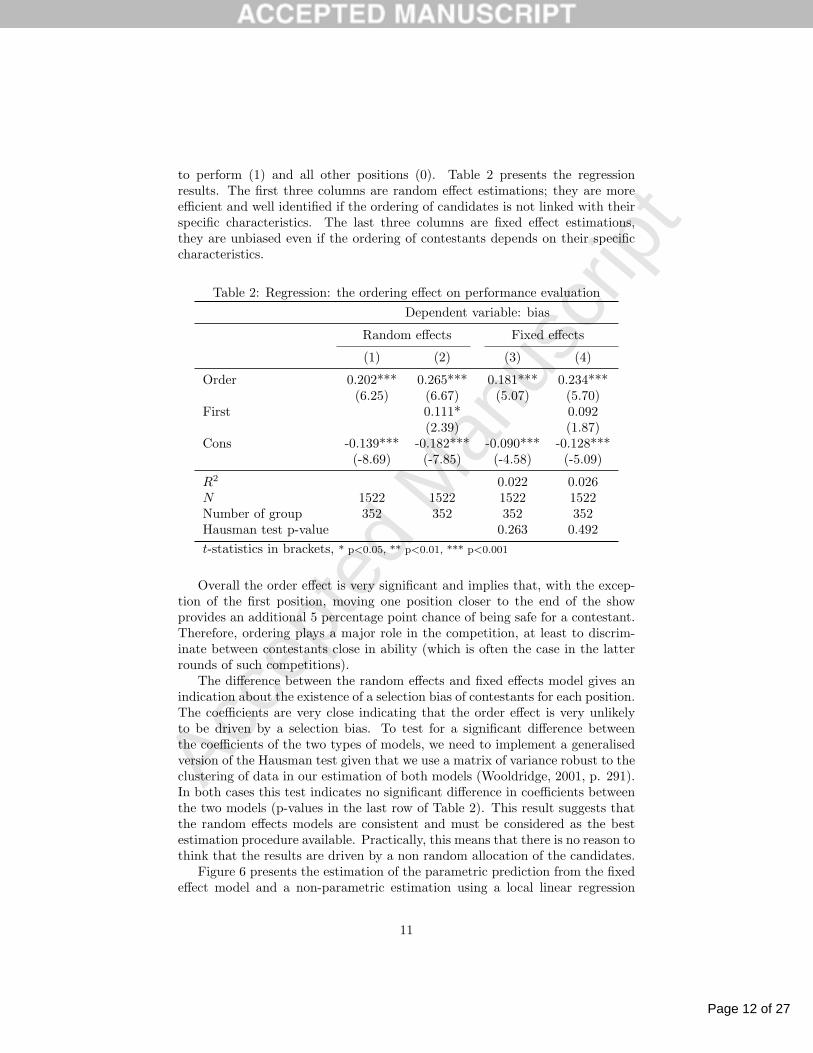
to perform (1) and all other positions (0). Table 2 presents the regressionresults. The first three columns are random effect estimations; they are moreefficient and well identified if the ordering of candidates is not linked with theirspecific characteristics. The last three columns are fixed effect estimations,they are unbiased even if the ordering of contestants depends on their specificcharacteristics.
Table 2: Regression: the ordering effect on performance evaluationDependent variable: bias
Random effects Fixed effects
(1) (2) (3) (4)
Order 0.202*** 0.265*** 0.181*** 0.234***(6.25) (6.67) (5.07) (5.70)
First 0.111* 0.092(2.39) (1.87)
Cons -0.139*** -0.182*** -0.090*** -0.128***(-8.69) (-7.85) (-4.58) (-5.09)
R2 0.022 0.026N 1522 1522 1522 1522Number of group 352 352 352 352Hausman test p-value 0.263 0.492t-statistics in brackets, * p<0.05, ** p<0.01, *** p<0.001
Overall the order effect is very significant and implies that, with the excep-tion of the first position, moving one position closer to the end of the showprovides an additional 5 percentage point chance of being safe for a contestant.Therefore, ordering plays a major role in the competition, at least to discrim-inate between contestants close in ability (which is often the case in the latterrounds of such competitions).
The difference between the random effects and fixed effects model gives anindication about the existence of a selection bias of contestants for each position.The coefficients are very close indicating that the order effect is very unlikelyto be driven by a selection bias. To test for a significant difference betweenthe coefficients of the two types of models, we need to implement a generalisedversion of the Hausman test given that we use a matrix of variance robust to theclustering of data in our estimation of both models (Wooldridge, 2001, p. 291).In both cases this test indicates no significant difference in coefficients betweenthe two models (p-values in the last row of Table 2). This result suggests thatthe random effects models are consistent and must be considered as the bestestimation procedure available. Practically, this means that there is no reason tothink that the results are driven by a non random allocation of the candidates.
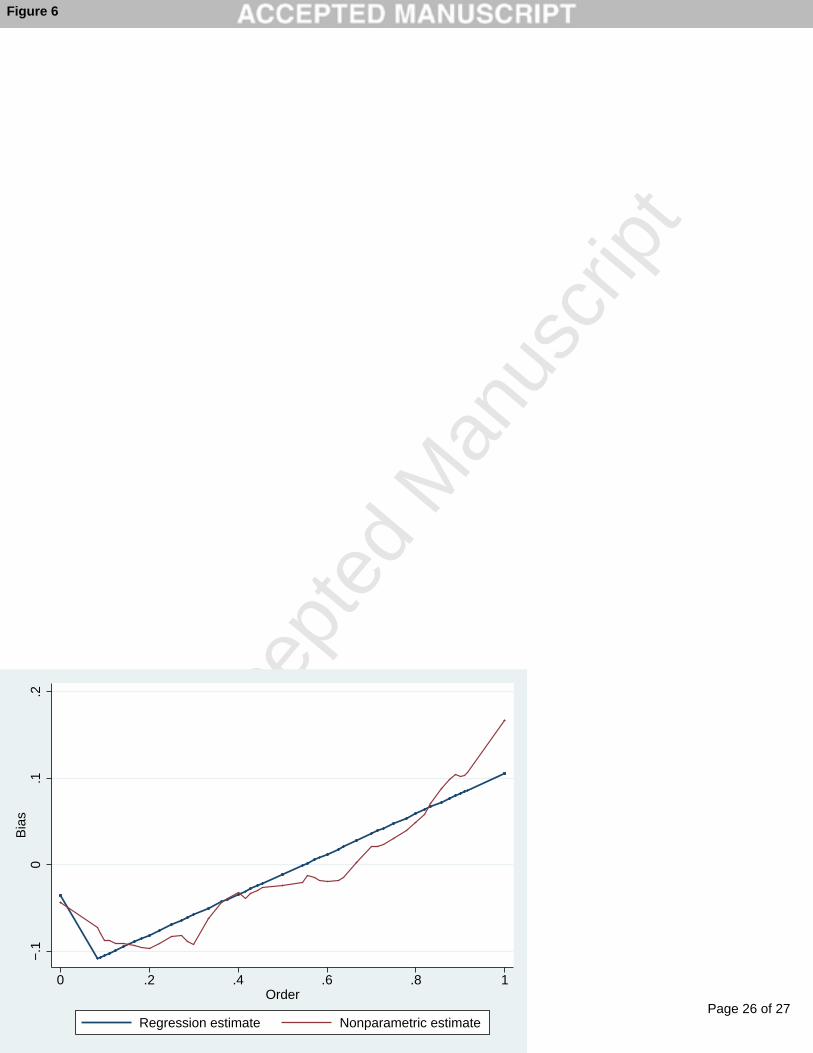
Figure 6 presents the estimation of the parametric prediction from the fixedeffect model and a non-parametric estimation using a local linear regression
11
Page 13 of 27
Accep
ted
Man
uscr
ipt
for greater flexibility. The two curves match very well and this confirms thegood calibration of the linear models. The results for the effect of ordering onperformance evaluation show a J-shaped curve rather than a U-shaped curveindicating both primacy and recency effects, with a stronger recency effect.
*** Figure 6: Effect of the relative order on performance evaluation ***
5 Sequential history bias
Another bias possibly arising from the sequential ordering of contestants is thatthe evaluation of a contestant’s performance may be influenced by the perfor-mance of the previous contestant to whom they may be compared. If there isan assimilation process, we would expect that contestants performing just aftera good contestant are more likely to be highly evaluated and to be safe. Onthe contrary, if there is a contrast effect, we would expect it to be a disadvan-tage to perform after a good contestant as this is likely to negatively affect theevaluation of the contestant’s performance.
It is possible to have an indicator of the quality of the contestant using theprevious results of each contestant. We calculate the indicator strong whichis a binary variable indicating if the candidate has always been safe in theprevious shows. While some contestants are in the bottom only once whenthey are eliminated, there are other contestants who are in the bottom severaltimes before being eliminated. For every show after the first one, there are twocategories of contestants: those who have always been safe before and those whohave been in the bottom tier in a previous show. Arguably, for a given show, acontestant who has never been in the bottom tier previously is less likely to bein the lower range of the ranking than contestants who have previously been inthe bottom tier.
Using the variable strong, we examine the effect of being preceded by strongcontestants on the probability to be safe. We therefore estimate the model:
biasjk = β0 +Xjkβ +6∑
h=1
strongi−h + uj + εjk (2)
Where strongi−h is the dummy variable indicating if the contestant who passedh positions before has always been safe in previous shows.
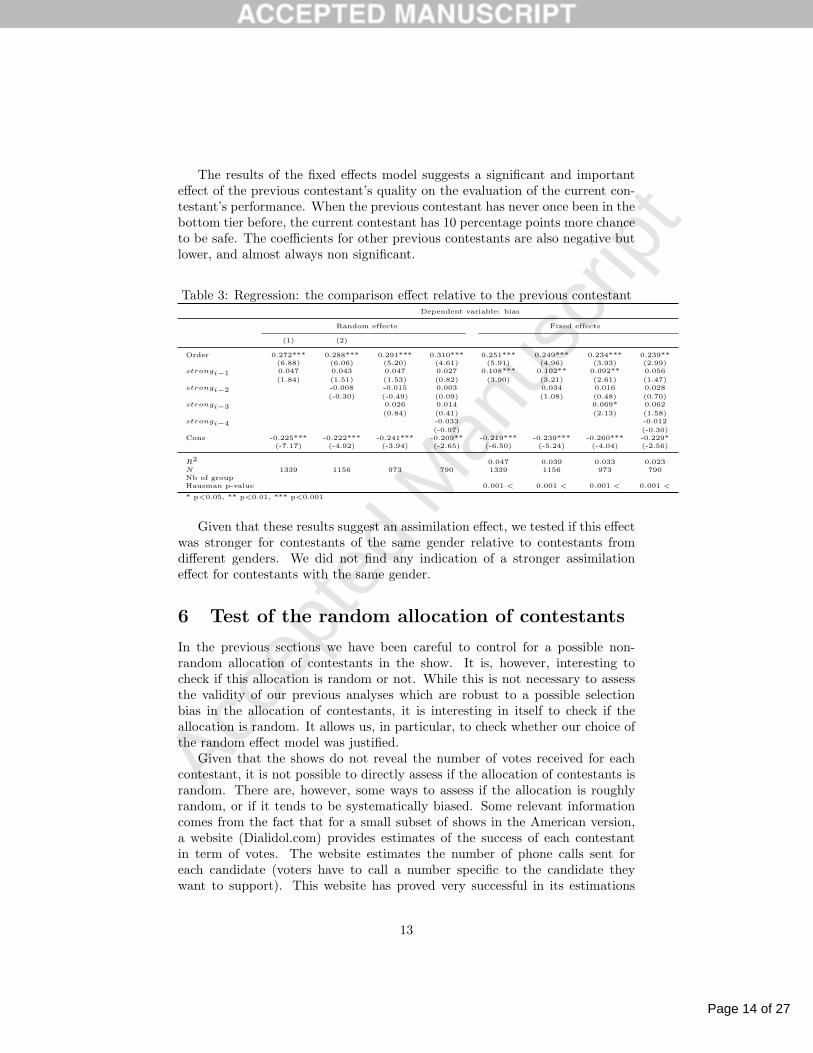
Table 3 displays the results of this model. The estimation of the randomeffect model does not indicate any effect of the quality of previous contestants.However, the fixed effects model suggests a strong effect of the previous contes-tant. The Hausman test indicates that the coefficients in the fixed effects modelare significantly different from the coefficients in the random effects model. Thissuggests that the random effects model is inconsistent. This may be the caseif, for instance, the producers of the shows tend to prevent placing two weakcandidates consecutively. The effect estimated in the fixed effects model is thenunderestimated in the random effects model.
12
Page 14 of 27
Accep
ted
Man
uscr
ipt
The results of the fixed effects model suggests a significant and importanteffect of the previous contestant’s quality on the evaluation of the current con-testant’s performance. When the previous contestant has never once been in thebottom tier before, the current contestant has 10 percentage points more chanceto be safe. The coefficients for other previous contestants are also negative butlower, and almost always non significant.
Table 3: Regression: the comparison effect relative to the previous contestantDependent variable: bias
Random effects Fixed effects
(1) (2)
Order 0.272*** 0.288*** 0.291*** 0.310*** 0.251*** 0.249*** 0.234*** 0.239**(6.88) (6.06) (5.20) (4.61) (5.91) (4.96) (3.93) (2.99)
strongi−1 0.047 0.043 0.047 0.027 0.108*** 0.102** 0.092** 0.056(1.84) (1.51) (1.53) (0.82) (3.90) (3.21) (2.61) (1.47)
strongi−2 -0.008 -0.015 0.003 0.034 0.016 0.028(-0.30) (-0.49) (0.09) (1.08) (0.48) (0.70)
strongi−3 0.026 0.014 0.069* 0.062(0.84) (0.41) (2.13) (1.58)
strongi−4 -0.033 -0.012(-0.97) (-0.30)
Cons -0.225*** -0.222*** -0.241*** -0.209** -0.219*** -0.239*** -0.260*** -0.229*(-7.17) (-4.92) (-3.94) (-2.65) (-6.50) (-5.24) (-4.04) (-2.56)
R2 0.047 0.039 0.033 0.023N 1339 1156 973 790 1339 1156 973 790Nb of groupHausman p-value 0.001 < 0.001 < 0.001 < 0.001 <
* p<0.05, ** p<0.01, *** p<0.001
Given that these results suggest an assimilation effect, we tested if this effectwas stronger for contestants of the same gender relative to contestants fromdifferent genders. We did not find any indication of a stronger assimilationeffect for contestants with the same gender.
6 Test of the random allocation of contestants
In the previous sections we have been careful to control for a possible non-random allocation of contestants in the show. It is, however, interesting tocheck if this allocation is random or not. While this is not necessary to assessthe validity of our previous analyses which are robust to a possible selectionbias in the allocation of contestants, it is interesting in itself to check if theallocation is random. It allows us, in particular, to check whether our choice ofthe random effect model was justified.
Given that the shows do not reveal the number of votes received for eachcontestant, it is not possible to directly assess if the allocation of contestants israndom. There are, however, some ways to assess if the allocation is roughlyrandom, or if it tends to be systematically biased. Some relevant informationcomes from the fact that for a small subset of shows in the American version,a website (Dialidol.com) provides estimates of the success of each contestantin term of votes. The website estimates the number of phone calls sent foreach candidate (voters have to call a number specific to the candidate theywant to support). This website has proved very successful in its estimations
13
Page 15 of 27
Accep
ted
Man
uscr
ipt
Table 4: Test of the random allocation of the contestantsConditional logit
Strong candidate
Order -0.0299(0.22)
First -0.0939(0.22)
Observations 1153R-squared <0.001
Robust standard errors in parentheses*** p<0.01, ** p<0.05, * p¡<.1
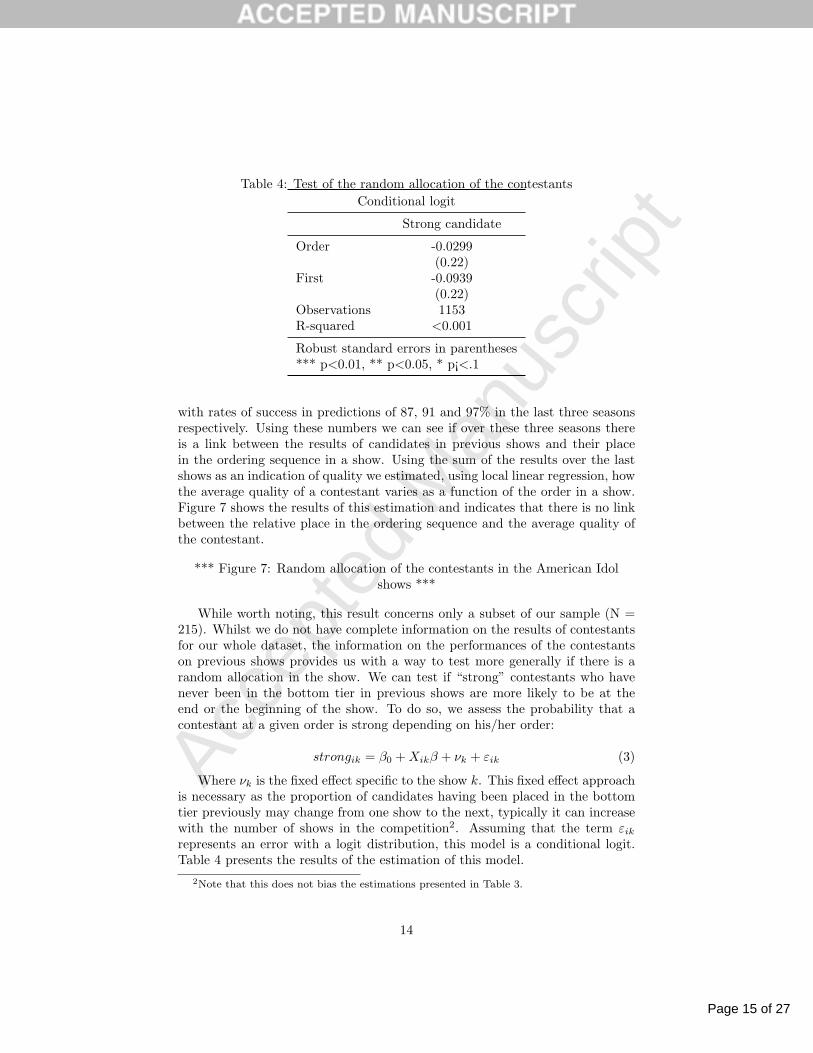
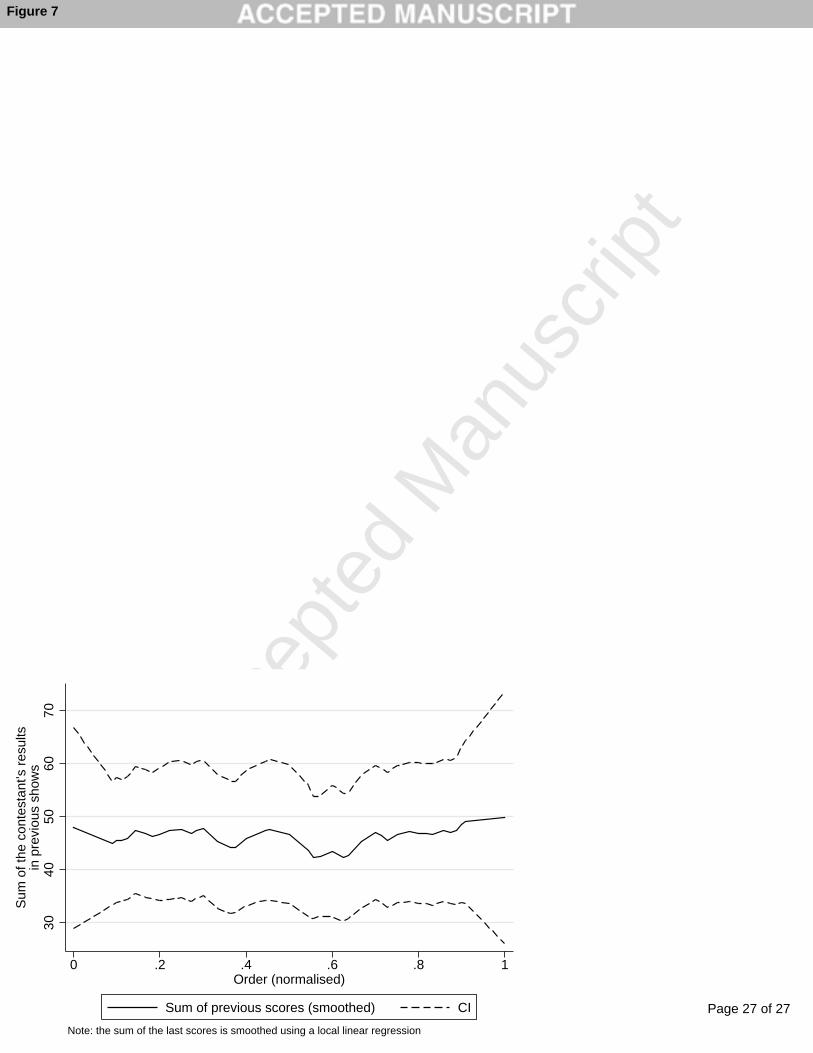
with rates of success in predictions of 87, 91 and 97% in the last three seasonsrespectively. Using these numbers we can see if over these three seasons thereis a link between the results of candidates in previous shows and their placein the ordering sequence in a show. Using the sum of the results over the lastshows as an indication of quality we estimated, using local linear regression, howthe average quality of a contestant varies as a function of the order in a show.Figure 7 shows the results of this estimation and indicates that there is no linkbetween the relative place in the ordering sequence and the average quality ofthe contestant.
*** Figure 7: Random allocation of the contestants in the American Idolshows ***
While worth noting, this result concerns only a subset of our sample (N =215). Whilst we do not have complete information on the results of contestantsfor our whole dataset, the information on the performances of the contestantson previous shows provides us with a way to test more generally if there is arandom allocation in the show. We can test if “strong” contestants who havenever been in the bottom tier in previous shows are more likely to be at theend or the beginning of the show. To do so, we assess the probability that acontestant at a given order is strong depending on his/her order:
strongik = β0 +Xikβ + νk + εik (3)
Where νk is the fixed effect specific to the show k. This fixed effect approachis necessary as the proportion of candidates having been placed in the bottomtier previously may change from one show to the next, typically it can increasewith the number of shows in the competition2. Assuming that the term εik
represents an error with a logit distribution, this model is a conditional logit.Table 4 presents the results of the estimation of this model.
2Note that this does not bias the estimations presented in Table 3.
14
Page 16 of 27
Accep
ted
Man
uscr
ipt
These results confirm what our previous analyses suggest: there is no sys-tematic bias in the allocation of contestants relative to the passing order. Thatis, better contestants are not more likely to be toward the end or the beginningof the show.
7 Discussion
Our results indicate that in a competition the order of contestants may havea decisive role in the evaluation of their performance. Given the importanceof job interviews or oral examination competitions in allocating positions andrewards, these results should raise concerns about the necessary awareness ofthese potential biases in the evaluation process.
More specifically, our analyses suggest that two mechanisms, memory anddirect comparison, both play a role in the order bias. With respect to memory itappears that both primacy and recency effects are implicated when sequentiallyevaluating performance. Irrespective of ability, contestants who perform firstare more likely to be positively evaluated than those who come in second andthird positions, which provides evidence of a primacy effect. Contestants whoperform in the later serial positions (particularly last position) have the largestadvantage with respect to positive evaluations, implying a strong recency effect.The curve showing performance evaluation by serial positions is J-shaped forthis dataset implying a much stronger recency effect. These results are partiallyconsistent with those of Bruine de Bruin (2005) who found an increasing lineartrend. However, we find evidence of a small primacy effect while Bruine deBruin (2005) found no benefit to being in first position. A close reading of herresults indicates that she actually found a positive effect for the first contestantbut this was not significant at 5% (t=1.72). Given that her sample size includedonly 47 shows while ours includes 165 shows, the non-significance of her resultwas quite possibly due to a limited sample size.
Our results seems to indicate that memory limitations do play a role in thesequential evaluation of performance. In addition, they also suggest that theprimacy effect could receive more attention in economics. The economic modelsof memory limitation like those of Mullainathan (2002) and Sarafidis (2007)only integrate a recency effect.
The second bias we demonstrate is a direct comparison effect with the pre-vious contestant. Specifically, one’s performance evaluation is influenced by theevaluation of the previous contestant. If you perform after a weak contestantthere is a bias such that you are more likely to be evaluated poorly than if youperform after a strong contestant. Therefore, we find evidence for an assimila-tion effect with respect to sequential judgements. These findings lend furthersupport to the selective accessibility model of Mussweiler (2003) and Mussweileret al. (2004). Specifically, our results indicate that judges tend to assess perfor-mances based on similarities with the previous contestant and not differences.This also concurs with evidence from Damisch et al. (2006). Overall, we showthat these two effects both operate and are important explanatory mechanisms
15
Page 17 of 27
Accep
ted
Man
uscr
ipt
in the evaluation of sequential performance.One factor which could influence these findings concerns the changing per-
formance as a result of being privy to the performance of others. Specifically,it could be plausible that people change their performance (increase level ofeffort, motivation) after having witnessed the previous performance(s). Thismechanism could work in one of two ways. If the task is novel the contestantscould learn from the previous performances. However, this is not the case inmost tasks which have been studied in the literature (sport and singing compe-titions) as the task is known in advance. Second, previous performances couldact as a benchmark or goal for which the future contestant can aim. Exactlyhow this process works is unclear and not easy to predict. It could, however, bean explanation for the apparent dominance of assimilation over contrast becausethe actual performance is changing rather than the criteria of the judges. Oneway to test this idea would be to investigate these biases in cases where perfor-mances are not seen by the contestants, for example in job interviews or privateauditions and compare these effects to those cases where the performances areable to be witnessed.
A limitation of the current study is that we do not have information aboutthe number of people who are watching the shows throughout the broadcasts.It is possible, although unlikely in our opinion, that more people are watchingthe show toward the end of the program and these very same people who missthe beginning of the show also decide to vote. First, it seems likely that thepeople who are voting are the more ardent fanatics and are less likely to missthe beginning of the show. Second, even if there was a large enough proportionof people voting who miss the early performance(s) then this would mean thatwe should just see an increasing monotonic trend (assuming people do not votefor people they do not see). Having found a significant primacy effect thisresult is contrary to this prediction. If anything, these “late voters” would biasdownwards the primacy effect which means our estimate of the initial memoryeffect is likely to be conservative.
Relatively speaking the magnitude of the effect is quite large and thereforeis likely to have a significant impact on both the contestants and the judges.Specifically, it is significant enough to raise questions about the fairness of theprocess from the contestants’ perspective and to pose problems in relation tothe efficiency of the process from the perspective of the judges. These findingshave implications for the way in which performances should be evaluated. Atthe very least judges (and perhaps contestants) could be made aware of theseeffects. What they do with this information and how best they assimilate itinto their judgments (performances) remains to be studied.
This work also suggests that future research is definitely needed in this areato study in depth these effects. For example, questions that need to be addressedinclude which is the stronger of these two mechanisms? Do these biases dependof the type of competition and the delay before judging? Also, does makingpeople aware of these biases eliminate them? Moreover, future work needs tostudy the conditions under which assimilation and contrast are likely to occurin the evaluation of sequential performance. Are certain types of performances
16
Page 18 of 27
Accep
ted
Man
uscr
ipt
(those that are judged on a tight set of criteria) more likely to lead to assimilationeffects?
References
Anderson, J., Bothell, D., Lebiere, C., Matessa, M., 1998. An Integrated Theoryof List Memory. Journal of Memory and Language 38, 341–380.
Benabou, R., Tirole, J., 2002. Self-Confidence and Personal Motivation. Quar-terly Journal of Economics 117, 871–915.
Bernheim, B., Thomadsen, R., 2005. Memory and Anticipation. The EconomicJournal 115, 271–304.
Bruine de Bruin, W., 2005. Save the last dance for me: unwanted serial positioneffects in jury evaluations. Acta Psychologica 118, 245–260.
Bruine de Bruin, W., 2006. Save the last dance II: Unwanted serial positioneffects in figure skating judgments. Acta Psychologica 123, 299–311.
Bruine de Bruin, W., Keren, G., 2003. Order effects in sequentially judged op-tions due to the direction of comparison. Organizational Behavior and HumanDecision Processes 92, 91–101.
Bruni, L., Sugden, R., 2007. The road not taken: how psychology was removedfrom economics, and how it might be brought back. The Economic Journal117, 146–173.
Burgess, N., Hitch, G., 1999. Memory for serial order: A network model of thephonological loop and its timing. Psychological review 106, 551–581.
Clerides, S., Stengos, T., 2006. Love Thy Neighbour, Love Thy Kin: Strat-egy and Bias in the Eurovision Song Contest. Centre for Economic PolicyResearch.
Damisch, L., Mussweiler, T., Plessner, H., 2006. Olympic Medals as Fruits ofComparison? Assimilation and Contrast in Sequential Performance Judg-ments. Journal of Experimental Psychology Applied 12, 166.
Devetag, G., Warglien, M., 2003. Games and phone numbers: Do short-termmemory bounds affect strategic behavior?. Journal of Economic Psychology24, 189–202.
Devetag, G., Warglien, M., 2007. Playing the wrong game: An experimentalanalysis of relational complexity and strategic misrepresentation. Games andEconomic Behavior .
Dow, J., 1991. Search Decisions with Limited Memory. Review of EconomicStudies 58, 1–14.
17
Page 19 of 27
Accep
ted
Man
uscr
ipt
Flores, R. G., Ginsburgh, V. A., 1996. The Queen Elisabeth Musical Competi-tion How fair is the final ranking. The Statistician 45, 97-104.
Gentner, D., Markman, A., 1994. Structural alignment in comparison: No dif-ference without similarity. Psychological Science 5, 152–158.
Gershberg, F., Shimamura, A., 1994. Serial position effects in implicit and ex-plicit tests of memory. Learning, Memory 20, 1370–1378.
Glanzer, M., Cunitz, A., 1966. Two storage mechanisms in free recall. Journalof Verbal Learning and Verbal Behavior 5, 1–360.
Glejser, H., Heyndels, B., 2001. Efficiency and Inefficiency in the Ranking inCompetitions: the Case of the Queen Elisabeth Music Contest. Journal ofCultural Economics 25, 109–129.
Glenberg, A., Bradley, M., Stevenson, J., Kraus, T., Tkachuk, M., Gretz, A.,et al., 1980. A two-process account of long-term serial position effects. Journalof Experimental Psychology: Human Learning and Memory 6.
Goldin, C., Rouse, C., 2000. Orchestrating Impartiality: The Impact of” Blind”Auditions on Female Musicians. The American Economic Review 90, 715–741.
Maratos, E., Allan, K., Rugg, M., 2000. Recognition memory for emotionallynegative and neutral words: an ERP study. Neuropsychologia 38, 1452–1465.
Mullainathan, S., 2002. A Memory-Based Model of Bounded Rationality. Quar-terly Journal of Economics 117, 735–774.
Murdock, B., 1962. The serial position effect of free recall. Journal of Experi-mental Psychology 64, 482–488.
Mussweiler, T., 2003. Comparison Processes in Social Judgment: Mechanismsand Consequences. Psychological Review 110(3), 472–489.
Mussweiler, T., Ruter, K., Epstude, K., 2004. The ups and downs of socialcomparison: Mechanisms of assimilation and contrast. Journal of Personalityand Social Psychology 87, 832–844.
Neath, I., Crowder, R., 1996. Distinctiveness and very short-term serial positioneffects. Memory 4, 1–18.
Neilson, W., 1998. Reference Wealth Effects in Sequential Choice. Journal ofRisk and Uncertainty 17, 27–48.
Novemsky, N., Dhar, R., 2005. Goal Fulfillment and Goal Targets in SequentialChoice. Journal of Consumer Research 32, 396–404.
Piccione, M.,, Rubinstein, A., 1997. On the Interpretation of Decision Problemswith Imperfect Recall. Games and Economic Behavior 20, 3–24.
18
Page 20 of 27
Accep
ted
Man
uscr
ipt
Pieters, R., Bijmolt, T., 1997. Consumer Memory for Television Advertising: AField Study of Duration, Serial Position, and Competition Effects. Journal ofConsumer Research 23, 362.
Prendergast, C., Topel, R., 1993. Discretion and bias in performance evaluation.European Economic Review 37, 355–65.
Rubin, D. C., Friendly, M., 1986. Predicting which words get recalled: measuresof free recall, availability, goodness, emotionality, and pronunciability for 925nouns. Memory and cognition 14, 79–94.
Sarafidis, Y., 2007. What Have you Done for me Lately? Release of Informationand Strategic Manipulation of Memories. The Economic Journal 117, 307–326.
Segrest Purkiss, S., P. Perrewe, T. Gillespie, B. Mayes, and G. Ferris, 2006.Implicit sources of bias in employment interview judgments and decisions,Organizational Behavior and Human Decision Processes 101, 152–167.
Singh, S., Cole, C., 1993. The Effects of Length, Content, and Repetition onTelevision Commercial Effectiveness. Journal of Marketing Research 30, 91–104.
Snyder, K., Harrison, D., 1997. The affective auditory verbal learning test.Archives of Clinical Neuropsychology 12, 477–482.
Terry, W., 2005. Serial Position Effects in Recall of Television Commercials. TheJournal of General Psychology 132, 151–164.
Wilson, V., 1977. Objectivity and effect of order of appearance in judging ofsynchronized swimming meets. Perceptual and Motor Skills 44, 295–298.
Wooldridge, J., 2001. Econometric Analysis of Cross Section and Panel Data:MIT Press.
19
Page 21 of 27
Accep
ted
Man
uscr
ipt
−.1 0 .1 .2mean of bias
12
34
56
78
910
1112
13
Figure 1
Page 22 of 27
Accep
ted
Man
uscr
ipt
−.3
−.2
−.1
0.1
.2m
ean
of b
ias
1 2 3 4 5
Nb of sessions=175 contestants
−.2
−.1
0.1
.2m
ean
of b
ias
1 2 3 4 5 6
Nb of sessions=276 contestants
−.1
5−
.1−
.05
0.0
5.1
mea
n of
bia
s
1 2 3 4 5 6 7
Nb of sessions=287 contestants
−.2
−.1
0.1
.2m
ean
of b
ias
1 2 3 4 5 6 7 8
Nb of sessions=308 contestants
Figure 2
Page 23 of 27
Accep
ted
Man
uscr
ipt
−.2
−.1
0.1
.2m
ean
of b
ias
1 2 3 4 5 6 7 8 9
Nb of sessions=249 contestants
−.2
−.1
0.1
.2m
ean
of b
ias
1 2 3 4 5 6 7 8 9 10
Nb of sessions=2510 contestants
−.4
−.2
0.2
mea
n of
bia
s
1 2 3 4 5 6 7 8 9 10 11
Nb of sessions=1511 contestants
−.2
−.1
0.1
.2m
ean
of b
ias
1 2 3 4 5 6 7 8 9 10 11 12
Nb of sessions=1312 contestants
Figure 3
Page 24 of 27
Accep
ted
Man
uscr
ipt
−.1
0.1
.2m
ean
of b
ias
1 2** 3 4 5
Bias for the first order positions
−.1
0.1
.2m
ean
of b
ias
Last−4 Last−3* Last−2 Last−1* Last **
Bias for the last order positions
Figure 4
Page 25 of 27
Accep
ted
Man
uscr
ipt
Res
ults
Order
Weak contestant Strong contestant
OLS/RE model FE model
1.1 No allocation bias & No ordering effect
Res
ults
Order
Weak contestant Strong contestant
OLS/RE model FE model
1.2 No allocation bias & Ordering effect
Res
ults
Order
Weak contestant Strong contestant
OLS/RE model FE model
2.1 Allocation bias & No ordering effect
Res
ults
Order
Weak contestant Strong contestant
OLS/RE model FE model
2.2 Allocation bias & Ordering effect
Figure 5
Page 26 of 27
Accep
ted
Man
uscr
ipt
−.1
0.1
.2B
ias
0 .2 .4 .6 .8 1Order
Regression estimate Nonparametric estimate
Figure 6
Page 27 of 27
Accep
ted
Man
uscr
ipt
3040
5060
70
Sum
of t
he c
onte
stan
t’s r
esul
tsin
pre
viou
s sh
ows
0 .2 .4 .6 .8 1Order (normalised)
Sum of previous scores (smoothed) CI
Note: the sum of the last scores is smoothed using a local linear regression
Figure 7