Laser frequency stabilization and measurement of optical ...
74
Ph.D. Thesis Petr Balling Laser frequency stabilization and measurement of optical frequencies supervisor Prof. RNDr. Petr Malý, DrSc., UK MFF KCHFO Department of Chemical Physics and Optics
-
Upload
khangminh22 -
Category
Documents
-
view
0 -
download
0
Transcript of Laser frequency stabilization and measurement of optical ...
Ph.D. Thesis
Petr Balling
Laser frequency stabilization and measurement of optical frequencies
supervisor
Prof. RNDr. Petr Malý, DrSc., UK MFF KCHFO Department of Chemical Physics and Optics
Název práce: Frekvenční stabilizace laserů a měření optických frekvencí Autor: Petr Balling Katedra (ústav): Katedra chemické fyziky a optiky Školitel: Prof. RNDr. Petr Malý, DrSc. e-mail vedoucího: [email protected] Abstrakt: Práce se zabývá měřením optických frekvencí a aplikacemi v metrologii.
Současná SI definice metru - “Metr je vzdálenost, kterou proběhne světlo ve vakuu za 1/299 792 458 sekundy” může být realizována s pomocí stabilizace a změření/znalosti frekvence laseru: známe-li frekvenci/periodu, můžeme spočítat vakuovou vlnovou délku λ0=c/f (kde c=299 792 458 m/s) [6]. Takto určená vlnová délka může být použita jako reference pro interferometrické měření délky nebo pro spektroskopii. Příkladem takové aplikace je primární etalon vlnové délky pro optické telekomunikace vyvinutý v první části této práce: polovodičový laser s rozloženou zpětnou vazbou (DFB) frekvenčně stabilizovaný na sub-Dopplerovsky detekovanou spektrální čáru acetylénu ~1540nm. Podrobně je popsán jeho vývoj, výzkum vlastností a výsledky relativních i absolutních měření frekvence. Pro přesné absolutní měření frekvence laseru je třeba fázově koherentně porovnat optické frekvence (stovky terahertz) s SI etalonem času a frekvence - cesiovými atomovými hodinami (pracujícími v radiofrekvenční oblasti ~9.2 GHz a obvykle poskytujícími výstupní frekvenci 10 MHz). Toto měření je do značné míry usnadněno využitím pravidelného hřebene optických frekvencí, generovaného stabilizovaným femtosekundovým laserem [7],[8]. Zprovoznění, testy a využití komerčního femtosekundového hřebene tvoří druhou část této práce. Její součástí jsou i některé doplňky a zlepšení - tvorba programu pro vyhodnocení aktuálně měřené frekvence, testy kvality čítání a frekvenční stabilizace hřebene na optický etalon frekvence - jódem stabilizovaný laser Nd:YAG.
Klíčová slova: frekvenční stabilizace laserů, femtosekundový generátor hřebene
optických frekvencí, acetylén, absolutní měření frekvencí, primární etalon délky
Prohlašuji, že jsem svou disertační práci napsal samostatně a že použité zdroje informací jsou řádně citovány. Souhlasím se zapůjčováním práce. V Praze dne 9. prosince 2009 RNDr. Petr Balling
1
1 Abstract
This thesis is dedicated to measurement of optical frequencies with applications in metrology. Current SI definition of metre - “The metre is the length of the path travelled by light in vacuum during a time interval of 1/299 792 458 of a second” can be practically realized by stabilization and measurement/knowledge of laser frequency: when the frequency/period is known, one can calculate the vacuum wavelength as λ0=c/f (where c=299 792 458 m/s) [6]. The wavelength estimated in this way can then be used as a reference for interferometric measurement of length or for spectroscopy. As an example, primary wavelength standard for optical communications was developed in the first part of this work: the DFB laser diode was frequency stabilized to sub-Doppler spectral line of acetylene at ~1540nm and its research, investigation of properties and absolute frequency measurements are described in detail.
Precise absolute measurement of laser frequency is done by the phase coherent comparison of optical frequencies (hundreds of terahertz) with SI time/frequency standard - caesium atomic clock (working in radiofrequency domain ~9.2GHz and usually distributing 10MHz). This measurement was made easier by using of the optical frequency comb generated by stabilized femtosecond laser [7],[8]. The implementation and testing of commercial femtosecond comb makes second part of this work. The minor improvements - software for online frequency evaluation, tests of counting quality and frequency stabilization of the comb to optical frequency standard - iodine stabilized Nd:YAG laser - are also described.
Keywords: frequency stabilized laser, optical frequency comb, acetylene, absolute frequency
measurement, primary standards of length
2 Acknowledgements When I count the people I am obliged to thank for supporting my studies I have to start with my parents and grand parents for inspiring my will to learn and to teachers in basic school and gymnasium Jaroslav Vozáb, Josef Kubát and Pavel Pochobradský for showing me some elegant clever solutions of problems which seem difficult at first sight. My leading teacher at Charles University - Petr Malý and Jaroslav Pantoflíček played this role during my studies of optics. I am also very grateful to Jan Blabla for kind introducing me the realm of stabilized lasers and length standards in Czech Metrology Institute. It was always my pleasure and inspiration to cooperate with colleagues in CMI, namely Josef Šmydke, Miroslav Ziegler, Jan Bareš, Petr Křen and Pavel Mašika. My thanks go also to CMI management - Pavel Klenovský, Michal Bartoš, František Jelínek and Jiří Tesař for enabling and supporting the research work. I am obliged to colleagues from BIPM - Jean-Marie Chartier, Lennart Robertsson, Susanne Picard and Long Sheng Ma for “information transfer” and kind collaboration during many comparisons and absolute frequency measurement. Special thank goes to my colleague Petr Křen for everyday fruitful discussions and help with editing this report.
I would like to thank Marc Fischer, Michael Mei and Ronald Holzwarth from Menlo Systems and MPQ for help with installation of comb system and for frequency measurement of acetylene stabilized laser by fibre comb in MPQ. I am grateful also to Josef Lazar and Ondřej Číp from ISI for cooperation in the project of development of acetylene stabilized laser, especially for providing and filling the acetylene cells; this project was also supported by the Grant Agency of the ASCR under Contract S2508201.
My thanks also go to Michael Matus from BEV for collaboration in several EURAMET projects, especially for transporting the fibre comb to Prague for comparison.
In the end I want to thank my wife Ivana and sons Adam, Vojtěch and Tomáš Hynek for showing me other pleasures in addition to physics.
2
Table of Contents 1 Abstract .......................................................................................................................... 1 2 Acknowledgements ........................................................................................................ 1 List of abbreviations................................................................................................................... 3 3 Introduction .................................................................................................................... 4
3.1 Laser linewidth......................................................................................................... 5 3.2 Sub-Doppler detection.............................................................................................. 6 3.3 Laser frequency tuning............................................................................................. 6 3.4 Reference quantum transitions - Mise en pratique and optical frequency standards7 3.5 State of the art in the field of frequency stabilized lasers in CMI and CR............. 11
4 Acetylene stabilized laser............................................................................................. 11 4.1 Acetylene MeP 2001 .............................................................................................. 12 4.2 Selection of laser, cell filling, preliminary tests, linear detection .......................... 12 4.3 Experimental arrangement for sub-Doppler detection ........................................... 19 4.4 Electronics.............................................................................................................. 21 4.5 Frequency comparison equipment ......................................................................... 22 4.6 Non linear detection and frequency stabilization, internal comparisons, sensitivity
coefficients ............................................................................................................. 24 4.7 Absolute frequency measurement of acetylene stabilized laser............................. 27 4.8 CCL 2005 ............................................................................................................... 29
5 Femtosecond frequency comb...................................................................................... 30 5.1 Introduction ............................................................................................................ 30 5.2 Description of comb in CMI .................................................................................. 33
5.2.1 Selection of laser .............................................................................................. 33 5.2.2 Main components ............................................................................................. 34 5.2.3 Setup and working parameters ......................................................................... 34 5.2.4 Modifications ................................................................................................... 39
5.2.4.1 Auxiliary power monitor .............................................................................. 39 5.2.4.2 Data processing software ............................................................................. 40 5.2.4.3 Counting quality test .................................................................................... 41 5.2.4.4 Autocontrol software improvement ............................................................. 44 5.2.4.5 Autocorrelator .............................................................................................. 45
5.3 Absolute frequency measurements......................................................................... 46 5.3.1 Iodine stabilized He-Ne lasers 633nm ............................................................. 46 5.3.2 Iodine stabilized He-Ne lasers 543nm ............................................................. 49 5.3.3 Iodine stabilized Nd:YAG laser 532nm ........................................................... 51 5.3.4 Acetylene stabilized DFB lasers ~1540 nm ..................................................... 55
5.4 Clockwork for optical frequency standard ............................................................. 56 5.5 Comparisons and uncertainty evaluation ............................................................... 58
6 Applications ................................................................................................................. 62 7 Conclusions .................................................................................................................. 65 References ................................................................................................................................ 66 List of figures ........................................................................................................................... 70
3
List of abbreviations AOM ....................... acousto-optic modulator BEV ........................ national metrology institute of Austria (Bundesamt für Eich- und Vermessungswesen
www.bev.gv.at) BIPM....................... International Bureau of Weights and Measures (Bureau International des Poids et Mesures
Sèvres, France, www.bipm.org ) CCL......................... Consultative Committee of CIPM for Length/Comité Consultatif des Longueurs (till 1997
Consultative Committee for the Definition of the Metre (CCDM) www.bipm.org/en/committees/cc/ccl/
CGPM ..................... General Conference on Weights and Measures (Conférence Générale des Poids et Mesures, www.bipm.org/en/convention/cgpm/ )
CIPM....................... International Committee for Weights and Measures (Comité International des Poids et Mesures), The principal task of the CIPM is to ensure worldwide uniformity in units of measurement. It does this by direct action or by submitting proposals to the CGPM.
CMC........................ calibration measurement capability (see KCDB and [65]) CMI......................... Czech Metrology Institute (www.cmi.cz) cw............................ continuous wave (not pulsed) mode of laser operation DFB......................... distributed feedback laser diode EMRP...................... European Metrology Research Program coordinated by EURAMET, www.emrponline.eu EUROMET/EURAMET European regional metrology organization, www.euramet.org ECDL ...................... extended cavity diode laser Ethyn-1, -2 .............. appellations of CMI wavelength standards of 1542nm - acetylene stabilized DFB lasers fs comb.................... ultra fast (femtosecond) laser generating dense and regular comb of stabilized optical
frequencies. Fs comb can be used for precise mutual comparison of radiofrequency and optical frequency standards
ISI............................ Institute of Scientific instruments of Czech Academy of Science in Brno, (www.isibrno.cz) KCDB ..................... database of internationally recognized key comparisons and calibration measurement
capabilities related to MRA (kcdb.bipm.org) LPM ........................ Laboratories of fundamental metrology of CMI (Prague 5) MeP.........................Mise en Pratique, here recommendation of CCL / CIPM for the realization of the SI
definition of the metre [6] MPQ........................ Max Planck Institute of Quantum Optics, Garching (Max-Planck-Institut für Quantenoptik,
www.mpq.mpg.de) MRA ....................... CIPM arrangement Mutual recognition of national measurement standards and certificates
issued by national metrology institutes (see KCDB) Nd:YAG.................. neodymium doped yttrium aluminium garnet (laser crystal) NMIJ ....................... national metrology institute of Japan www.nmij.jp/english/ NPL......................... National Physical Laboratory, Teddington, Great Britain, www.npl.co.uk/ NRC ........................ National Research Centre, Ottawa, Canada www.nrc-cnrc.gc.ca/eng/ibp/inms.html PCF ......................... microstructure photonics crystal fibre PPLN....................... periodically poled lithium niobate (quasi phase matched nonlinear optical crystal) SHG ........................ second harmonic generation - generation of double frequency/half wavelength by nonlinear
optical process UFE......................... Institute of Photonics and Electronics of Czech Academy of Science, Prague, (www.ufe.cz)
4
3 Introduction This thesis is dedicated to measurement of optical frequencies with applications in metrology.
The frequency/time interval is the best measurable quantity - the uncertainty of best caesium clocks improves by about one order of magnitude per decade: from ~10-10 in 1950s to ~10-15 in year 2000, when laser cooling enabled longer interaction time / higher resolution of Ramsey fringes in atomic fountain clocks.
Many measurements are done by means of frequency/time interval measurements - from electronic A/D (or D/A) converters to complex experiments e.g. for measurement of the hydrogen atom spectra (Rydberg constant R∞=10 973 731.568 527(73) m-1 is currently the best measured physical constant [1],[2]), laboratory experiments for estimation of the “ageing of universe” by looking at the stability of the fine structure constant [3], which is suspected to vary according to astronomical observation [4]. Other examples of experiments with precision wavelength/frequency sources are gravity wave detectors or tests of general relativity effects [5]. Several Nobel prizes are connected with precision spectroscopy, laser spectroscopy and precise frequency measurements; but the time/frequency measurement has also important practical applications like data network synchronization, distance measurement (radars, navigation systems, length metrology) and time keeping itself.
The caesium clocks (realising SI definition of the second) operate in radiofrequency domain (9.19263177 GHz). The stability and precision of frequency standards working in optical domain are improving rapidly during last years and now already exceed that of caesium fountains. These standards take advantage of higher quality of selected (forbidden) optical transitions, i.e. smaller ratio of linewidth to the frequency. But until recently it was quite difficult to count the very high optical frequencies (hundreds of terahertz) - the complicated, expensive and bulky chain of stabilized sources gradually linking still higher frequencies through higher harmonics generation had to be used. This “counting” was greatly simplified by invention of the femtosecond frequency comb technique, which enables linking the radio-frequency and the optical-frequency standards with table top equipment.
The measurement of length/wavelength is obligatory linked with time/frequency measurement since 1983 when the SI definition of the metre by multiple of krypton wavelengths was replaced by current definition “The metre is the length of the path travelled by light in vacuum during a time interval of 1/299 792 458 of a second”. One way for realization of this definition is “direct” measurement of time needed for travel of electromagnetic impulse - but this method is used rather for long distance measurement or navigation, where resolution of current technique (hundreds of femtoseconds - corresponding to tens of micrometres in distance) is sufficient. The other way of realization of metre definition is using interferometry with radiation of known frequency - the short period of e.g. optical radiation gives fine scale for “travelling time” measurement; the frequency of radiation (typically frequency stabilized laser) is estimated by absolute frequency measurement as mentioned above or primary standard listed in Mise en Pratique for the realization of the definition of the metre (MeP) [6] may be used.
The goal of this work is to collect information and select and realize suitable system as wavelength standard for the optical telecommunication and implement system for absolute measurement of optical frequencies and perform experimental studies of their performance.
Primary wavelength standard for optical communications was developed in the first part of this work: the distributed feedback (DFB) laser diode was frequency stabilized to sub-Doppler spectral line of acetylene at ~1540 nm and its research, investigation of properties and absolute frequency measurements are described.
The implementation and testing of commercial femtosecond comb makes second part of this work. It includes development of software for online frequency evaluation, tests of counting quality and frequency stabilization of the comb to optical frequency standard - iodine stabilized Nd:YAG laser.
5
3.1 Laser linewidth Lasers are generally recognized as possible sources of very spectrally narrow radiation. The fundamental limit of the linewidth (full width at half maximum, FWHM) is proportional to the square of the resonator bandwidth divided by the output power (assuming that there are no parasitic resonator losses) according to Schawlow-Townes formula [9]
(1) ( )
out
claser P
h 2ννπν ∆= ∆
where ν is the mean laser frequency h is the Planck constant Pout is the output power ∆νc is the resonator bandwidth. The resonator bandwidth is
(2) t
tFSRc
−∆= ∆ 1
πνν
where t is geometric mean value of cavity mirror reflectivities 21RR and ∆νFSR is the free spectral
range
(3) O
FSR L
c
2= ∆ν
where c is the speed of light in vacuum and LO the optical length of the cavity) For the 0.3 mW red helium-neon laser 633 nm, 0.2m long, with mirror reflectivities of 99% and
98% this limit is only 0.043 Hz. For laser diode with the same wavelength and power but cavity length 0.1 mm and mirror reflectivities of 99% and 90% this limit is 2.4 MHz.
But actually observed laser linewidths are much broader due to instabilities in power (pumping, relaxation oscillations, etc.), and wavelength (cavity length changes - vibrations, pressure and temperature variations) and because wavelength generally changes in time the measured linewidth depends on integration time. Typical linewidth of He-Ne laser observed by interference (beating) with similar laser for 0.1s is 100 kHz - corresponding to coherence length of 3 kilometres. When observing the beat of two longitudinal modes of one He-Ne laser it is clearly seen that the linewidth is much narrower ~Hz even for long periods. It was also proved long ago [10] that it is possible to phase-lock two independent lasers to different modes of reference cavity or to synthesized offset frequency reference signal (in radiofrequency domain) by phase lock loop. In these cases the linewidth can be measured by spectral analysis of the beat because the mean frequency of the beat is stable in time - the frequencies (of two modes of one laser or of two lasers frequency locked one to another) are relatively stable. But the absolute frequency of both may (simultaneously) vary in time. To stabilize also the absolute value of frequency, suitable quantum transition is taken as a reference. It could be the lasing transition itself (narrow transition of gas lasers) or some other (narrower) transition.
The first approach (referring to laser transition) is most simple and is used in secondary wavelength standards - industrial interferometers and wave meters. The most common example is helium-neon laser. The frequency/wavelength tuning range is given by Doppler broadened line of neon (in some cases combination of Doppler broadened lines of two isotopes 20Ne and 22Ne), strictly speaking by the part of Doppler broadened line for which the gain is higher than losses. So, frequency of He-Ne laser, without any stabilization is always within the range of about ±1×10⁻⁶rel. around rest frequency of neon transition. Even this non stabilized (free running) He-Ne laser can be used as reference in cases where 1 or 2 ppm uncertainty is sufficient - for example in many wave meters. Frequency stabilization to balance of Zeeman splitting components, orthogonally polarized longitudinal modes or the Lamb dip (saturated gain) is used in industrial interferometers and improves the uncertainty of frequency by two or three orders of magnitude.
Further improvement is possible by stabilization to narrower, sub Doppler resolved transition. One example of such stabilized laser is described in chapter 4.
6
3.2 Sub-Doppler detection Doppler effect causes the relative shift of frequency proportional to ratio of relative speed v to the speed of light c
(4) c
v= −
0
0
ννν
Accidental movement of particles (atoms or molecules) in gas at temperature T results in uncertainty of average frequency of their spectral line - the Doppler width
(5) m
Tk
c
v BD ⋅= ∆ 2ln2
2 0ν
where m is the mass of the particle and kb the Boltzmann constant. For example at 20°C the widths of 20Ne, resp. 127I2, are (2.7 resp. 0.77)×10-6 in relative, for
radiation at wavelength 633 nm it corresponds to (1.3 resp. 0.365) GHz. Conventional cooling to cryogenic temperature 4 K does not help much - it would decrease the width only 10 times - the sub-Doppler detection is easier way to detect narrow spectral lines. It uses optical non-linear effect for ensuring interaction only with molecules with certain (zero) velocity. This non-linear interaction could be for example saturated absorption (used for standard in chapter 4) or two-photon absorption.
The linewidth detected in experiment with gas cell is wider compared to “natural” linewidth due to pressure and transient time broadening. Both these effects limit the unperturbed interaction time and according to time-energy uncertainty principle they increase the linewidth. Increasing pressure decreases average time between collisions; the time the particle spends in the interaction volume decreases with decreasing volume (beam diameter). Decreasing signal to noise ratio sets the limit for reasonable decreasing of the pressure (long integration length is advantage), increasing the beam diameter is limited by increasing price of components and available power needed for threshold power density across larger beam cross section.
For illustration, the linewidths of hyperfine spectral components of iodine molecule are in the range from 4 MHz down to 100 kHz (depending on transition). To have both pressure and transient time broadening twice lower (from 2 MHz down to 50 kHz) at 20°C the pressure has to be lower than (20 down to 0.5) Pa and the beam diameter higher than (0.07 to 3) mm.
Further improvement of detected linewidth is not easily possible in gas cells. Instead of using cells at room temperature the particle(s) has to be cooled close to absolute zero (µK or BEC) and confined/trapped for longer integration time [11]. These techniques are beyond the scope of these theses.
3.3 Laser frequency tuning The lasers used for building wavelength/frequency standards are generally required to operate in single transversal and longitudinal mode i.e. to generate single frequency. Few exceptions are lasers generating two easily separable modes - longitudinal modes with orthogonal (linear/circular) polarization (orthogonal modes stabilized or Zeeman stabilized lasers), the other exception is femtosecond generator of the comb of optical frequencies described in chapter 5.
The optical frequency ν generated by continuous wave (cw) laser is given by optical length of the laser cavity (resonator) so as the generated (resonant) wavelength λ fits integer N times in the round trip optical length 2LO=2nL
(6) nL
cN
L
cNncc
O 220
==== λλ
ν
where L is the length of the cavity, n the refractive index (at the frequency ν, for inhomogeneous cavity n is the mean refractive index), λ0 vacuum wavelength and N integer number. Laser generates single frequency (single longitudinal mode) if there is only one N for which ν fits into the lasing range (the spectral band where gain is higher than losses) - the cavity has to be short enough (for the free spectral range (3) is higher than (half of the) lasing range) or the lasing range has to be restricted by some spectral filtering (additional Fabry-Perot cavity, grating, narrow band dielectric mirror,...).
Formula (6) shows that the actual frequency of the laser changes with changing optical length - with changing mechanical length and/or mean refractive index of cavity. The unwanted changes of the
7
cavity are mainly due to thermal expansion and vibrations. If these most common influences are suppressed, the other less obvious effects - like compressions or material aging - become apparent. The unwanted changes of the refractive index are due to temperature changes, changes of pump power and in case of open cavity also due to turbulences in air or acoustic pressure changes.
For creating the laser wavelength/frequency standard one needs the laser which can be tuned to the frequency of reference transition then stabilized there for correcting above mentioned unwanted frequency changes. The most common way for fine laser frequency tuning is changing the length of cavity (position of one of the mirrors) by piezoelectric transducer (PZT). Alternative ways are: changing the cavity temperature, changing driving current of semiconductor laser, magnetostriction or compression of the cavity suspended in pressure bottle [12]. Electro- or acousto- optic modulators are seldom used for frequency tuning of cw laser - the first for limited range and the other for limited efficiency. In some cases stable frequency is generated by correcting the drifting laser frequency by external acousto-optical frequency shifter which compensates unwanted drifts - one example is using the radiation of the laser frequency pre-stabilized to very slowly drifting high finesse cavity maintained in vacuum chamber at temperature close to the thermal expansion turning point [13].
The stability of frequency standard is characterized by a plot of Allan standard deviation σy(τ) defined by mean value of difference of two consecutive samples y of given length τ taken with no dead-time [14]
(7) )( 212
1)( nny yy −= +τσ
(unlike standard deviation which describes deviation from mean value). The examples of Allan standard deviation charts are shown later e.g. in Figure 24 or Figure 42.
3.4 Reference quantum transitions - Mise en pratique and optical frequency standards
There are many possible sufficiently narrow quantum transitions which could serve as reference for laser frequency locking. Some of them are interesting for easy detection and spectral coincidence with conveniently available lasers, the others for very narrow linewidth and little sensitivity to ambient/working conditions (like low Stark and Zeeman shift). Several such transitions are approved as “primary” standards for realization of SI definition of the metre or secondary standards of the second. For explaining, let me briefly introduce history SI definitions of these units [15].
The first Decimal Metric System was created in 1791 at the time of the French Revolution based on metre and kilogram; two platinum standards representing the metre and the kilogram were deposited in the Archives de la République in Paris in 1799. In 1832 Gauss promoted the application of this Metric System together with the second defined in astronomy “c g s”. In 1860s Maxwell and Thomson in British Association for the Advancement of Science (BAAS) formulated the requirement for a coherent system of units with base units and derived units. In 1874 the BAAS introduced the CGS system and prefixes micro .. mega.
The sizes of the coherent CGS units in the fields of electricity and magnetism were found inconvenient 1880s, the BAAS and the International Electrical Congress (later International Electrotechnical Commission IEC), approved a mutually coherent set of practical units including the ohm volt and ampere.
On the 20th May 1875 delegates of 20 member states signed Convention du Mètre and founded Bureau International des Poids et Mesures (BIPM) in Sèvres, France. BIPM is supervised by Comité International des Poids et Mesures (CIPM) which itself comes under the authority of the Conférence Générale des Poids et Mesures (CGPM). Formal definitions of all SI base units are approved by the CGPM. The first such definition was approved in 1889 and the most recent in 1983. These definitions are modified from time to time as techniques of measurement evolve and allow more accurate realizations of the base units [15]. New prototypes of metre and kilogram were constructed after the foundation of BIPM; international prototypes were kept in BIPM and national prototypes compared with them and delivered to member states. In 1889 the 1st CGPM sanctioned the international prototypes for the metre and the kilogram. Together with the astronomical second as unit of time,
8
these units constituted a three-dimensional mechanical unit system MKS (similar to the CGS). The base units for other quantities were introduced later - the ampere in 1946, the kelvin and the candela in 1954 and the mol in 1971.
Even at the time of founding the Metre convention it was proposed (by James Clerk Maxwell) that universal, stable and imperishable units should not be derived from sizes or motions of planets but from elementary particles1. But it took a long time before such change become practical, i.e. before the uncertainty of realization of this standard was the same or better than uncertainty of classical one. The first SI unit changed this way was new definition of the metre, adopted by 11th CGPM in 1960: “The metre is the length equal to 1 650 763.73 wavelengths in vacuum of the radiation corresponding to the transition between the levels 2p10 and 5d5 of the krypton 86 atom”. The astronomical definition of the second (defined first as 1/86 400 of the mean solar day then as 1/31 556 925.9747 of the tropical year for 1900 January 0 at 12 hours ephemeris time) was replaced by quantum definition “The second is the duration of 9 192 631 770 periods of the radiation corresponding to the transition between the two hyperfine levels of the ground state of the caesium 133 atom” by 13th CGPM in 1967-19682. The quantum standards of electrical units of voltage (based on Josephson effect) or resistance (based on von Klitzing / quantum Hall resistance effect) already reach better repeatability and reproducibility than realization of current SI definition of the ampere, but change of SI definition is postponed until remaining questions of uncertainty will be solved. The quantum definition of the kilogram is under discussion these years, in spite of the fact that no quantum standard available to reach the required relative uncertainty of ~10-8 for macroscopic objects was realized yet - the definition based on fixing the value of the Planck constant would be useful for improving the uncertainty of many other fundamental constants, so it is proposed and supported by CODATA committee [16] (but would not improve the uncertainty in mass metrology).
The first quantum definition of time unit is still valid; the replacement of caesium atomic clock working in radiofrequency domain 9.2 GHz by optical clocks working at ~105 higher frequencies may be possible in coming years, the uncertainty of such clocks already exceeded that of caesium ones and is improving rapidly [11],[17].
But the quantum definition of the metre based on wavelength of krypton transition (realized usually and most precisely by standard spectral lamp) came just before first lasers were developed. Lasers are much better sources for interferometry because of higher brightness and coherence length and soon were also stabilized with reproducibility exceeding the krypton lamp. So there were discussions whether select new definition of the metre based on one type of such stabilized lasers or whether to fix the value of the speed of light and in fact derive length measurements from measurement of time [18]. The second approach was wisely chosen and 17th CGPM adopted in 1983 current SI definition of the metre “The metre is the length of the path travelled by light in vacuum during a time interval of 1/299 792 458 of a second”3.
Using this definition is straightforward in astronomy, radar or GPS technologies, but not so clear when one wants to provide traceable measurements of smaller dimensions or nanotechnology. In such cases it is not possible to measure the time interval needed for travelling of some light pulse with sufficient precision. In such cases, very fine time scale is needed - and very short periods of optical radiation are useful as a reference. Above mentioned SI definition of the metre is supplemented by Mise en pratique - three methods for its realization:
a) by means of the length l of the path travelled in vacuum by a plane electromagnetic wave in a time t; this length is obtained from the measured time t , using the relation l = c0 · t and the value of the speed of light in vacuum c0 = 299 792 458 m / s,
1 „If we wish to obtain standards of length, time and mass which shall be absolutely permanent, we must seek them not in the dimensions or motion or mass of our planet, but in the wavelength, period of vibration and the absolute mass of these imperishable unalterable and perfectly similar molecules.“ 2 This definition was very successful - it allowed for continuous improvement of realization of primary standards from 10-10 relative uncertainty of the first atomic clocks to 10-16 relative uncertainty of current caesium fountain clocks. The time is by far the most precisely measurable quantity. 3 SI definitions of base units are implemented in legislation of most countries, e.g. in the Czech Republic see Zákon 505/1990 Sb., o metrologii § 2
9
b) by means of the wavelength in vacuum λ of a plane electromagnetic wave of frequency f; this wavelength is obtained from the measured frequency f using the relation λ = c0/f and the value of the speed of light in vacuum c0 = 299 792 458 m / s,
c) by means of one of the radiations from the list below, whose stated wavelength in vacuum or whose stated frequency can be used with the uncertainty shown, provided that the given specifications and accepted good practice are followed;
In all cases any necessary corrections should be applied to take account of actual conditions such as diffraction, gravitation or imperfection in the vacuum. In the context of general relativity, the metre is considered a unit of proper length. Its definition, therefore, applies only within a spatial extent sufficiently small that the effects of the non-uniformity of the gravitational field can be ignored (note that, at the surface of the Earth, this effect in the vertical direction is about 1 part in 1016 per metre). In this case, the effects to be taken into account are those of special relativity only. The local methods for the realization of the metre recommended in b) and c) provide the proper metre but not necessarily that given in a). Method a) should therefore be restricted to lengths l which are sufficiently short for the effects predicted by general relativity to be negligible with respect to the uncertainties of realization. For advice on the interpretation of measurements in which this is not the case, see the report of the Consultative Committee for Time and Frequency (CCTF) Working Group on the Application of General Relativity to Metrology (Application of general relativity to metrology, Metrologia, 1997, 34, 261-290); [15]
Briefly said - method a) means measurement of time, methods b) and c) mean using interferometry, in case b) completed by measurement of frequency of used radiation, in case c) using known / primary standard radiation from the list.
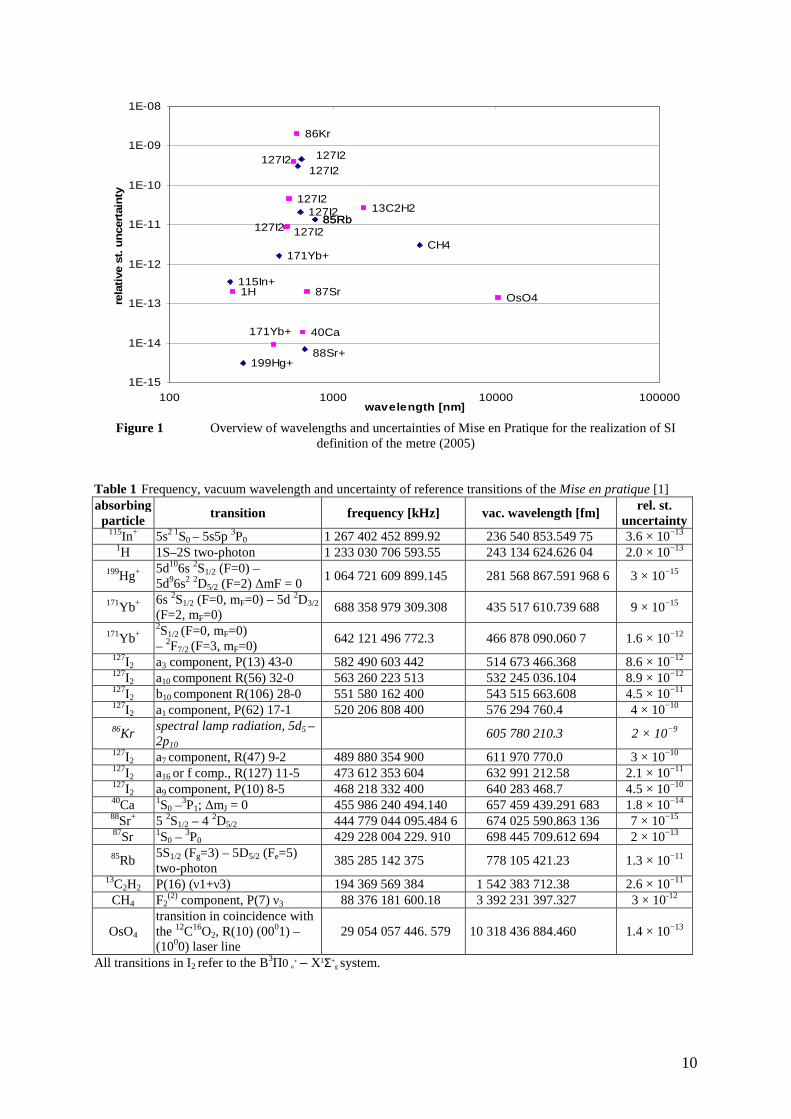
The list of recommended radiation is revised regularly and updated if necessary by working group for Mise en pratique of the Comité Consultatif des Longueurs (CCL) and then approved by CIPM; the last version [6] contains 20 reference transitions from ultraviolet 236.5 nm to infrared 10.318 µm with relative standard uncertainties from 2×10⁻⁹ to 3×10-15. The values are shown in Table 1 and Figure 1. The list also contains other relative frequencies of other nearby transitions and hyperfine components and other spectral lamp lines. Most of values are valid for specified working conditions of the standard like pressure, power, detection method, modulation amplitude, ...; the uncertainties are set so that they should cover the range of values obtained by any standard developed and operated according to stated conditions and good practise. For the standards which were realized in less than three independent laboratories, the uncertainty in MeP is expanded by factor of three to cover also possible not yet known influences.
The list of radiation for realization of the SI definition of the metre according to method c) is important, because absolute measurement of frequency of optical radiation (hundreds of terahertz) by phase coherent frequency chain was very difficult and possible only in a few laboratories, but creation of some standard of the list is much more affordable. The femtosecond frequency comb technology (chapter 5) made measurement of optical frequencies easier and possible in tens of laboratories.
10
115In+1H
199Hg+
171Yb+
127I2127I2
86Kr
85Rb
87Sr
40Ca
85Rb13C2H2
CH4
OsO4
171Yb+
127I2 127I2
127I2127I2
127I2
88Sr+
1E-15
1E-14
1E-13
1E-12
1E-11
1E-10
1E-09
1E-08
100 1000 10000 100000wavelength [nm]
rela
tive
st.
un
cert
ain
ty
Figure 1 Overview of wavelengths and uncertainties of Mise en Pratique for the realization of SI
definition of the metre (2005)
Table 1 Frequency, vacuum wavelength and uncertainty of reference transitions of the Mise en pratique [1] absorbing particle
transition frequency [kHz] vac. wavelength [fm] rel. st.
uncertainty 115In+ 5s2 1S0 – 5s5p 3P0 1 267 402 452 899.92 236 540 853.549 75 3.6 × 10⁻¹³
1H 1S–2S two-photon 1 233 030 706 593.55 243 134 624.626 04 2.0 × 10⁻¹³ 199Hg+
5d106s 2S1/2 (F=0) – 5d96s2 2D5/2 (F=2) ∆mF = 0
1 064 721 609 899.145 281 568 867.591 968 6 3 × 10⁻¹⁵
171Yb+ 6s 2S1/2 (F=0, mF=0) – 5d 2D3/2 (F=2, mF=0)
688 358 979 309.308 435 517 610.739 688 9 × 10⁻¹⁵
171Yb+ 2S1/2 (F=0, mF=0) – 2F7/2 (F=3, mF=0)
642 121 496 772.3 466 878 090.060 7 1.6 × 10⁻¹² 127I2 a3 component, P(13) 43-0 582 490 603 442 514 673 466.368 8.6 × 10⁻¹² 127I2 a10 component R(56) 32-0 563 260 223 513 532 245 036.104 8.9 × 10⁻¹² 127I2 b10 component R(106) 28-0 551 580 162 400 543 515 663.608 4.5 × 10⁻¹¹ 127I2 a1 component, P(62) 17-1 520 206 808 400 576 294 760.4 4 × 10⁻¹⁰ 86Kr
spectral lamp radiation, 5d5 – 2p10
605 780 210.3 2 × 10⁻⁹ 127I2 a7 component, R(47) 9-2 489 880 354 900 611 970 770.0 3 × 10⁻¹⁰ 127I2 a16 or f comp., R(127) 11-5 473 612 353 604 632 991 212.58 2.1 × 10⁻¹¹ 127I2 a9 component, P(10) 8-5 468 218 332 400 640 283 468.7 4.5 × 10⁻¹⁰ 40Ca 1S0 –
3P1; ∆mJ = 0 455 986 240 494.140 657 459 439.291 683 1.8 × 10⁻¹⁴ 88Sr+ 5 2S1/2 – 4 2D5/2 444 779 044 095.484 6 674 025 590.863 136 7 × 10⁻¹⁵ 87Sr 1S0 – 3P0 429 228 004 229. 910 698 445 709.612 694 2 × 10⁻¹³ 85Rb
5S1/2 (Fg=3) – 5D5/2 (Fe=5) two-photon
385 285 142 375 778 105 421.23 1.3 × 10⁻¹¹ 13C2H2 P(16) (ν1+ν3) 194 369 569 384 1 542 383 712.38 2.6 × 10⁻¹¹ CH4 F2
(2) component, P(7) ν3 88 376 181 600.18 3 392 231 397.327 3 × 10-12
OsO4 transition in coincidence with the 12C16O2, R(10) (0001) – (1000) laser line
29 054 057 446. 579 10 318 436 884.460 1.4 × 10⁻¹³
All transitions in I2 refer to the B3Π0 u+ – X1Σ+
g system.
11
3.5 State of the art in the field of frequency stabilized lasers in CMI and CR
Metre convention is implemented in our country since its foundation in time of Austro-Hungarian Empire. In times of Czechoslovakia new Pt-Ir standards of metre and kilogram were obtained from BIPM in 1930 (metre No.7). These standards and later also krypton lamp were maintained in Czechoslovak metrology institute (CSMU) in Prague. Later, headquarters of this institute moved to Bratislava, Slovakia. The frequency stabilized lasers, first iodine stabilized red He-Ne lasers 633 nm were developed more or less independently in three laboratories - Quantum metrology of CSMU in Prague (team led by Jan Blabla), Institute of Scientific Instruments (ISI, Coherence Optics section) of the Academy of Science in Brno (team lead by Jan Petrů) and Length laboratory of CSMU in Bratislava (V. Navrátil). All developments were successful, which was proved by many international comparisons.
ISI cooperated with industrial company Metra Blansko (Dr. Zeman) which produced hundreds of industrial interferometers with Lamb-dip stabilized He-Ne lasers, that cooperation later continued with Limtek company in Blansko which produces good quality and user friendly interferometers.
Iodine stabilized He-Ne lasers PL1 and PL2, developed in CSMU Prague in late 1970s were declared National standards of wavelength 633 nm in 1984 and maintained in CSMU Prague, the interferometers and other equipment were maintained in CSMU Bratislava.
ISI developed several generations of iodine stabilized He-Ne lasers 633 nm, new method for frequency stabilization of secondary standards 543 nm and 633 nm, absolute air refractometers and iodine stabilized ECDL 633 nm [19]. ISI also fills high quality gas cells, among others acetylene cells used in work described in chapter 4.
In CSMU Prague (after splitting of Czechoslovakia in 1993 CMI-LPM Prague) the iodine cells and He-Ne laser tubes were filled till late 1980s. Several versions of iodine stabilized He-Ne lasers 633 nm were developed and new method of combined third- and fifth- harmonic detection technique was developed, analyzed and used in international comparisons [20], the measurement of relative frequency differences of hyperfine components and their corrections according to numerical model led to the best fit of the constants of hyperfine Hamiltonian of iodine molecule of that time [21]. We have developed iodine stabilized He-Ne lasers of other colours: orange 612 nm [22] and green 543 nm, which reached world leading stability and reproducibility and was absolutely measured as first of its kind by fs comb in BIPM in 2002 [23]. Iodine stabilized diode pumped solid state Nd:YVO4 [24] and Nd:YAG [25], [26] were developed in 2000-2001, the latter reaches best stability of all wavelength standards in CMI (Allan standard deviation below 2×10-14 rel. for 200 to 2000 second samples).
Above mentioned primary wavelength standards 633 nm (group of four iodine stabilized lasers) and 543 nm (two iodine stabilized lasers) were declared Czech National Standard of wavelength. These standards took part in many (10+) international comparisons, most of them directly with BIPM. Standards are used for providing metrological traceability to interferometers used in CMI and in industry.
Jan Blabla, head of Quantum metrology department of CSMU (later CMI), took part in work and international comparisons prior to new definition of SI metre and took part in related CCDM meeting 1982 as an observer. Later, CMI became full member of CCL; author of this thesis was delegate to CCL in 2001, 2003, 2005, 2007 and 2009.
4 Acetylene stabilized laser Above mentioned wavelength standards serve well for providing traceability for length measurements. But wave-meters and spectrum analysers used in important field of optical telecommunications often cannot be calibrated by visible sources. So there appeared a need for development/acquirement of wavelength standard in relevant spectral range.
12
CMI and ISI proposed in 2001 project “Research and development of frequency (wavelength) standard for optical communications” and it was selected for support by the Grant Agency of the ASCR under Contract S2508201 in the years 2002-2004. Author of this thesis was coordinator of this project.
In preparation stage we searched for possible reference quantum transition, like acetylene (1516 nm-1552 nm), CO (1560.5 nm), Ne (1523.488 nm), hydrogen iodide (HI), ammonia (NH3), methane CH4 (1650 nm), OH-, water vapours (1340 nm-1390 nm); other possibility is to stabilize high power infrared laser through its second- or third- harmonic e.g. to 85Rb at 778 nm (Table 1) [27] or iodine [28], because higher harmonic generation became possible recently for cw lasers in periodically poled crystals / quasi phase matching.
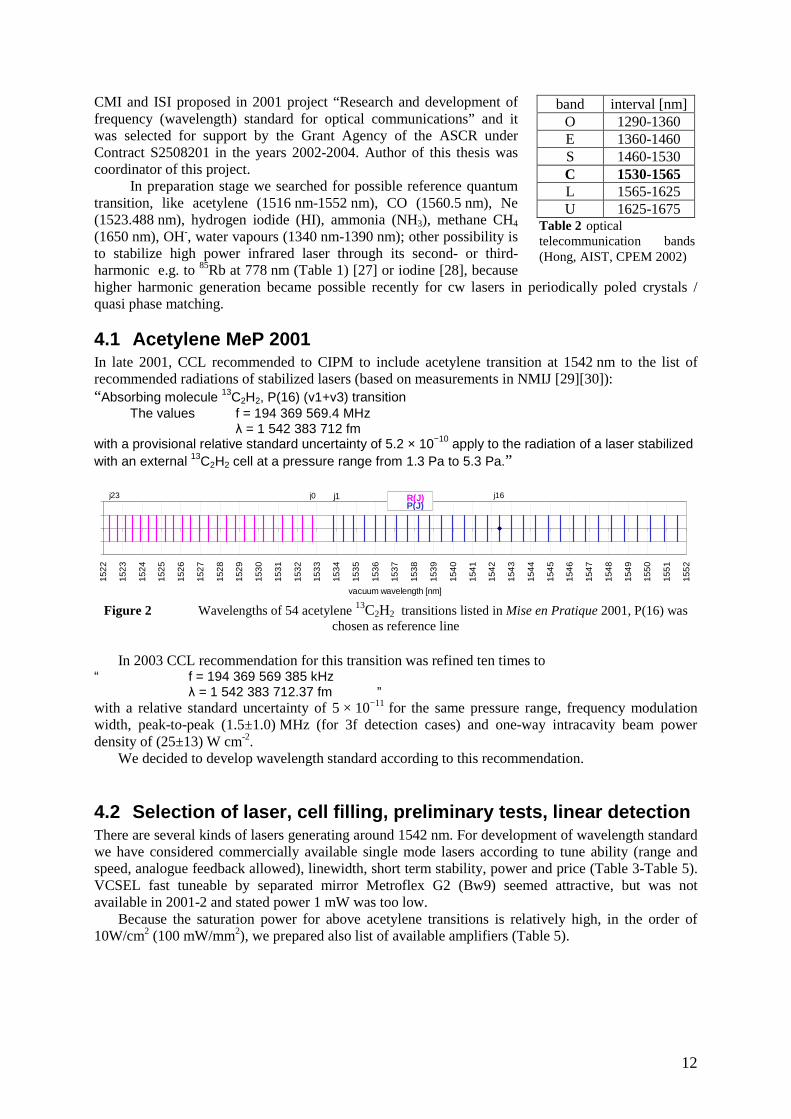
4.1 Acetylene MeP 2001 In late 2001, CCL recommended to CIPM to include acetylene transition at 1542 nm to the list of recommended radiations of stabilized lasers (based on measurements in NMIJ [29][30]): “Absorbing molecule 13C2H2, P(16) (ν1+ν3) transition
The values f = 194 369 569.4 MHz λ = 1 542 383 712 fm
with a provisional relative standard uncertainty of 5.2 × 10⁻¹⁰ apply to the radiation of a laser stabilized with an external 13C2H2 cell at a pressure range from 1.3 Pa to 5.3 Pa.”
152
2
152
3
152
4
152
5
152
6
152
7
152
8
152
9
153
0
153
1
153
2
153
3
153
4
153
5
153
6
153
7
153
8
153
9
154
0
154
1
154
2
154
3
154
4
154
5
154
6
154
7
154
8
154
9
155
0
155
1
155
2
vacuum wavelength [nm]
R(J)P(J)
j0j23 j1 j16
Figure 2 Wavelengths of 54 acetylene 13C2H2 transitions listed in Mise en Pratique 2001, P(16) was
chosen as reference line
In 2003 CCL recommendation for this transition was refined ten times to “ f = 194 369 569 385 kHz
λ = 1 542 383 712.37 fm ” with a relative standard uncertainty of 5 × 10⁻¹¹ for the same pressure range, frequency modulation width, peak-to-peak (1.5±1.0) MHz (for 3f detection cases) and one-way intracavity beam power density of (25±13) W cm-2.
We decided to develop wavelength standard according to this recommendation.
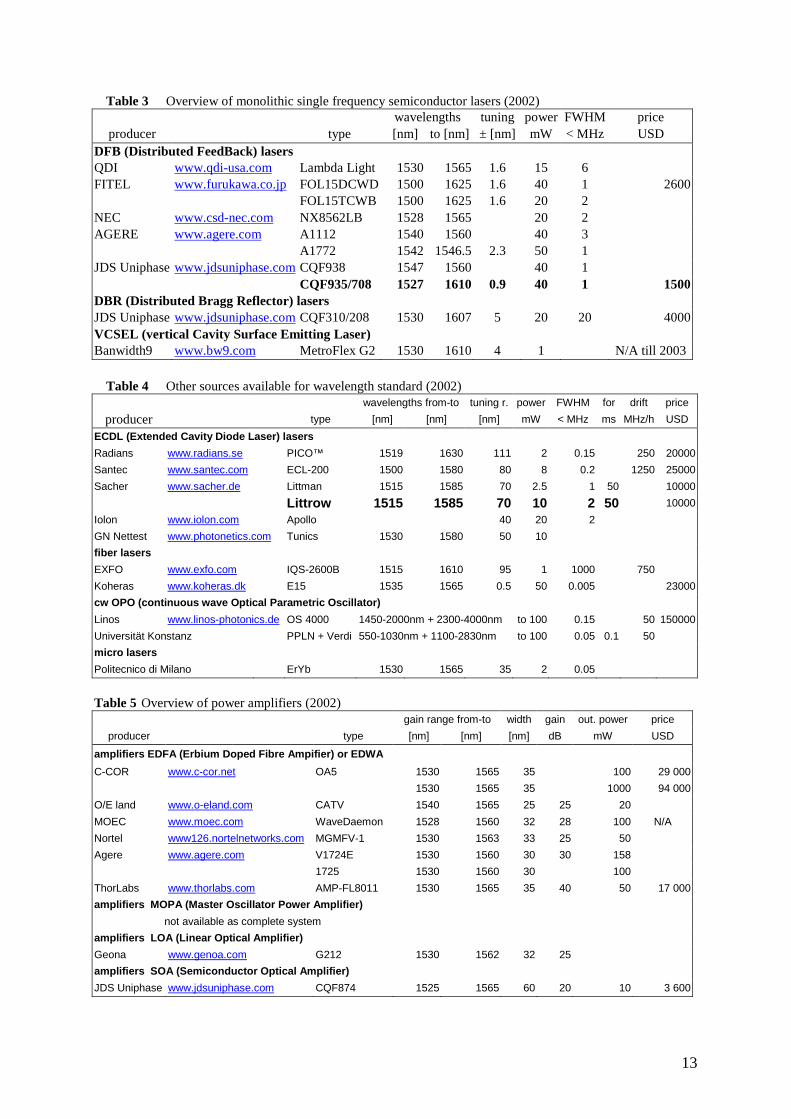
4.2 Selection of laser, cell filling, preliminary tests, linear detection There are several kinds of lasers generating around 1542 nm. For development of wavelength standard we have considered commercially available single mode lasers according to tune ability (range and speed, analogue feedback allowed), linewidth, short term stability, power and price (Table 3-Table 5). VCSEL fast tuneable by separated mirror Metroflex G2 (Bw9) seemed attractive, but was not available in 2001-2 and stated power 1 mW was too low.
Because the saturation power for above acetylene transitions is relatively high, in the order of 10W/cm2 (100 mW/mm2), we prepared also list of available amplifiers (Table 5).
band interval [nm] O 1290-1360 E 1360-1460 S 1460-1530 C 1530-1565 L 1565-1625 U 1625-1675
Table 2 optical telecommunication bands (Hong, AIST, CPEM 2002)
13
Table 3 Overview of monolithic single frequency semiconductor lasers (2002) wavelengths tuning power FWHM price
producer type [nm] to [nm] ± [nm] mW < MHz USD DFB (Distributed FeedBack) lasers QDI www.qdi-usa.com Lambda Light 1530 1565 1.6 15 6 FITEL www.furukawa.co.jp FOL15DCWD 1500 1625 1.6 40 1 2600
FOL15TCWB 1500 1625 1.6 20 2 NEC www.csd-nec.com NX8562LB 1528 1565 20 2 AGERE www.agere.com A1112 1540 1560 40 3
A1772 1542 1546.5 2.3 50 1 JDS Uniphase www.jdsuniphase.com CQF938 1547 1560 40 1
CQF935/708 1527 1610 0.9 40 1 1500 DBR (Distributed Bragg Reflector) lasers JDS Uniphase www.jdsuniphase.com CQF310/208 1530 1607 5 20 20 4000 VCSEL (vertical Cavity Surface Emitting Laser) Banwidth9 www.bw9.com MetroFlex G2 1530 1610 4 1 N/A till 2003
Table 4 Other sources available for wavelength standard (2002)
wavelengths from-to tuning r. power FWHM for drift price
producer type [nm] [nm] [nm] mW < MHz ms MHz/h USD
ECDL (Extended Cavity Diode Laser) lasers
Radians www.radians.se PICO™ 1519 1630 111 2 0.15 250 20000
Santec www.santec.com ECL-200 1500 1580 80 8 0.2 1250 25000
Sacher www.sacher.de Littman 1515 1585 70 2.5 1 50 10000
Littrow 1515 1585 70 10 2 50 10000
Iolon www.iolon.com Apollo 40 20 2
GN Nettest www.photonetics.com Tunics 1530 1580 50 10
fiber lasers
EXFO www.exfo.com IQS-2600B 1515 1610 95 1 1000 750
Koheras www.koheras.dk E15 1535 1565 0.5 50 0.005 23000
cw OPO (continuous wave Optical Parametric Oscillator)
Linos www.linos-photonics.de OS 4000 1450-2000nm + 2300-4000nm to 100 0.15 50 150000
Universität Konstanz PPLN + Verdi 550-1030nm + 1100-2830nm to 100 0.05 0.1 50
micro lasers
Politecnico di Milano ErYb 1530 1565 35 2 0.05
Table 5 Overview of power amplifiers (2002)
gain range from-to width gain out. power price
producer type [nm] [nm] [nm] dB mW USD
amplifiers EDFA (Erbium Doped Fibre Ampifier) or EDWA
C-COR www.c-cor.net OA5 1530 1565 35 100 29 000
1530 1565 35 1000 94 000
O/E land www.o-eland.com CATV 1540 1565 25 25 20
MOEC www.moec.com WaveDaemon 1528 1560 32 28 100 N/A
Nortel www126.nortelnetworks.com MGMFV-1 1530 1563 33 25 50
Agere www.agere.com V1724E 1530 1560 30 30 158
1725 1530 1560 30 100
ThorLabs www.thorlabs.com AMP-FL8011 1530 1565 35 40 50 17 000
amplifiers MOPA (Master Oscillator Power Amplifier)
not available as complete system
amplifiers LOA (Linear Optical Amplifier)
Geona www.genoa.com G212 1530 1562 32 25
amplifiers SOA (Semiconductor Optical Amplifier)
JDS Uniphase www.jdsuniphase.com CQF874 1525 1565 60 20 10 3 600
14
We decided to purchase one broadly tuneable ECDL (Sacher Littrow TEC100-1550-10) and two DFB lasers (JDS Uniphase CQF935/708).
For identification of spectral lines and for measurement of laser tuning sensitivities we use wave meter (Burleigh WA-20VIS), calibrated by visible wavelength standards (chapter 3.5) with uncertainty 2×10⁻⁶ rel. The wave meter counts the number of fringes of the reference and the measured laser during periodic movement of interferometer with double retro reflector. Reference laser is non-stabilized He-He laser 633nm. We have installed infrared detector module and tested measurement of cw YAG laser 1064 nm - successfully after careful adjustment - but measurement of He-Ne laser 1523 nm was not possible. The reason seemed to be in low efficiency of beam splitter at longer wavelengths. We have purchased pellicle beam splitter Melles Griot 03BPL001/05 and adapted its holder so as beams overlap as in case of glass beam splitter. The contrast of fringes was improved, but even after best adjustment the counter did not work for 1523 nm laser. After several experiments (additional amplifier, external counter) we found that the cause was in low speed of original photodiode - the signal dropped below counter threshold value when harmonically moved retro reflectors reached highest speed. So we used well tried visible detector module with new InGaAs infrared photodiode Hamamatsu G3476-03 (950 to 1650) nm; the wave meter works reliably since then, the measured value for He-Ne laser 1523 nm is (1523.488±0.003) nm, in agreement with value published in [27]. We do not evacuate the wave-meter for measurement, but apply correction for dispersion in air between 633nm and measured value of wavelength [31].
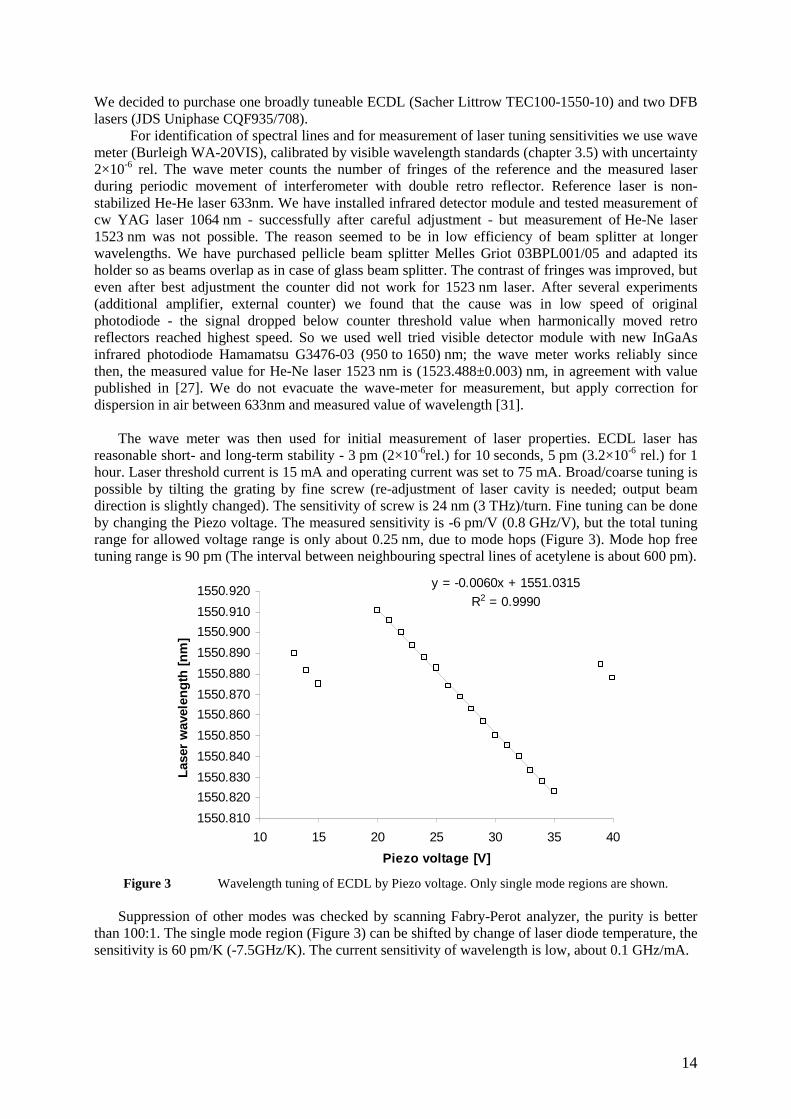
The wave meter was then used for initial measurement of laser properties. ECDL laser has reasonable short- and long-term stability - 3 pm (2×10⁻⁶rel.) for 10 seconds, 5 pm (3.2×10⁻⁶ rel.) for 1 hour. Laser threshold current is 15 mA and operating current was set to 75 mA. Broad/coarse tuning is possible by tilting the grating by fine screw (re-adjustment of laser cavity is needed; output beam direction is slightly changed). The sensitivity of screw is 24 nm (3 THz)/turn. Fine tuning can be done by changing the Piezo voltage. The measured sensitivity is -6 pm/V (0.8 GHz/V), but the total tuning range for allowed voltage range is only about 0.25 nm, due to mode hops (Figure 3). Mode hop free tuning range is 90 pm (The interval between neighbouring spectral lines of acetylene is about 600 pm).
y = -0.0060x + 1551.0315
R2 = 0.9990
1550.810
1550.820
1550.830
1550.840
1550.850
1550.860
1550.870
1550.880
1550.890
1550.900
1550.910
1550.920
10 15 20 25 30 35 40
Piezo voltage [V]
Las
er w
avel
eng
th [
nm
]
Figure 3 Wavelength tuning of ECDL by Piezo voltage. Only single mode regions are shown.
Suppression of other modes was checked by scanning Fabry-Perot analyzer, the purity is better
than 100:1. The single mode region (Figure 3) can be shifted by change of laser diode temperature, the sensitivity is 60 pm/K (-7.5GHz/K). The current sensitivity of wavelength is low, about 0.1 GHz/mA.
15
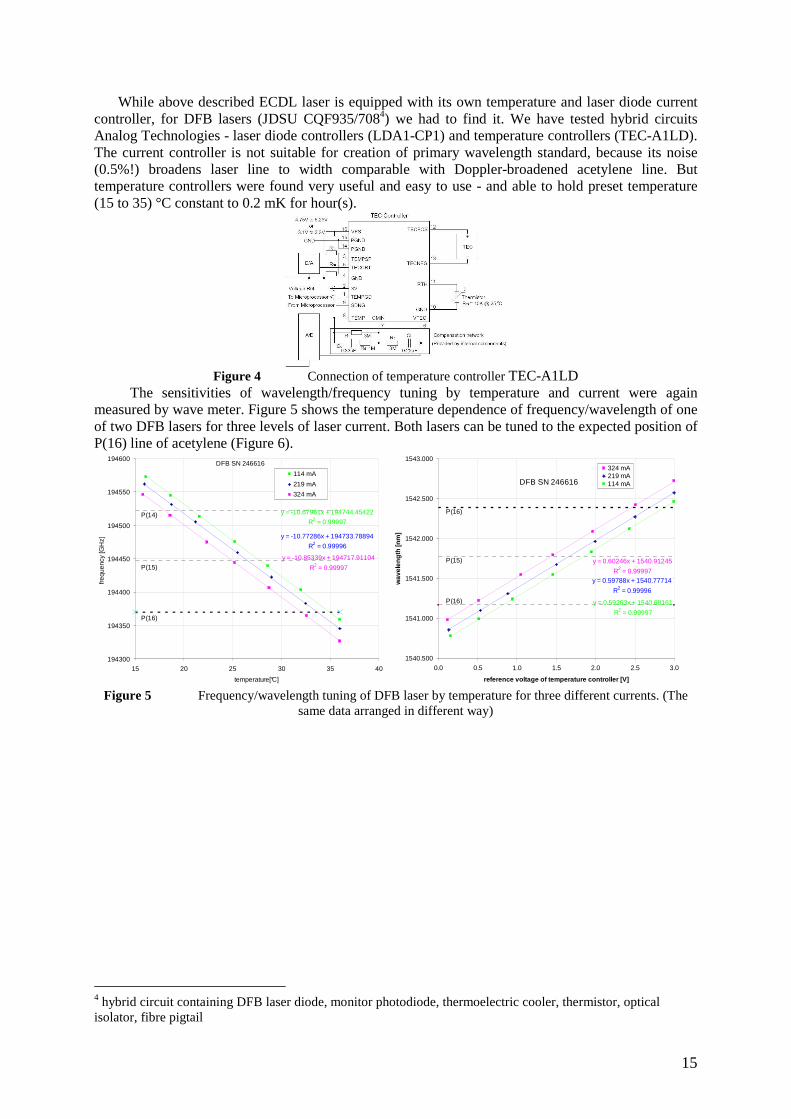
While above described ECDL laser is equipped with its own temperature and laser diode current controller, for DFB lasers (JDSU CQF935/7084) we had to find it. We have tested hybrid circuits Analog Technologies - laser diode controllers (LDA1-CP1) and temperature controllers (TEC-A1LD). The current controller is not suitable for creation of primary wavelength standard, because its noise (0.5%!) broadens laser line to width comparable with Doppler-broadened acetylene line. But temperature controllers were found very useful and easy to use - and able to hold preset temperature (15 to 35) °C constant to 0.2 mK for hour(s).
Figure 4 Connection of temperature controller TEC-A1LD
The sensitivities of wavelength/frequency tuning by temperature and current were again measured by wave meter. Figure 5 shows the temperature dependence of frequency/wavelength of one of two DFB lasers for three levels of laser current. Both lasers can be tuned to the expected position of P(16) line of acetylene (Figure 6).
DFB SN 246616
y = -10.85339x + 194717.91104
R2 = 0.99997
y = -10.77286x + 194733.78894
R2 = 0.99996
y = -10.67961x + 194744.45422
R2 = 0.99997
194300
194350
194400
194450
194500
194550
194600
15 20 25 30 35 40
temperature[°C]
frequ
ency
[GH
z] .
114 mA
219 mA
324 mA
P(16)
P(15)
P(14)
DFB SN 246616
y = 0.60246x + 1540.91245
R2 = 0.99997y = 0.59788x + 1540.77714
R2 = 0.99996
y = 0.59263x + 1540.68161
R2 = 0.99997
1540.500
1541.000
1541.500
1542.000
1542.500
1543.000
0.0 0.5 1.0 1.5 2.0 2.5 3.0
reference voltage of temperature controller [V]
wav
elen
gth
[nm
]
324 mA219 mA114 mA
P(16)
P(15)
P(16)
Figure 5 Frequency/wavelength tuning of DFB laser by temperature for three different currents. (The
same data arranged in different way)
4 hybrid circuit containing DFB laser diode, monitor photodiode, thermoelectric cooler, thermistor, optical isolator, fibre pigtail
16
194300
194350
194400
194450
194500
194550
194600
15 20 25 30 35 40temperature [°C]
frequ
ency
[GH
z] .
DFB1542 SN 246608 40mW
DFB1542 SN 246616 40mW
P(16)
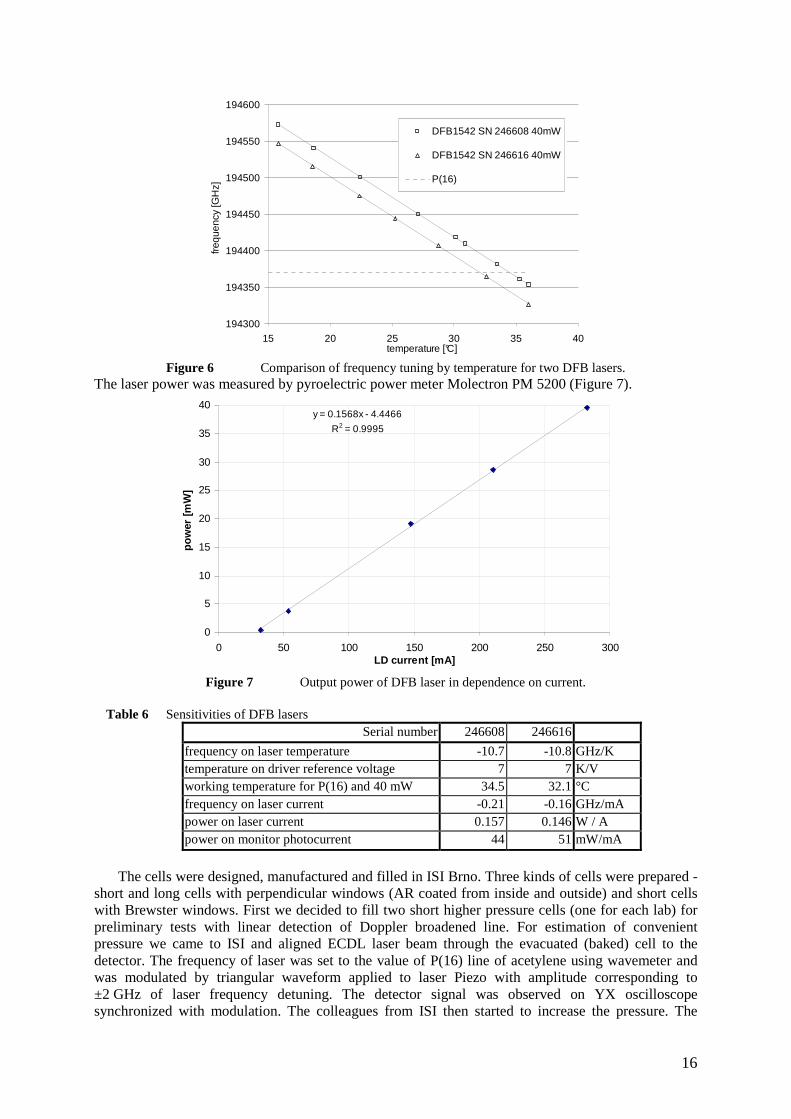
Figure 6 Comparison of frequency tuning by temperature for two DFB lasers.
The laser power was measured by pyroelectric power meter Molectron PM 5200 (Figure 7).
y = 0.1568x - 4.4466
R2 = 0.9995
0
5
10
15
20
25
30
35
40
0 50 100 150 200 250 300LD current [mA]
po
wer
[m
W]
Figure 7 Output power of DFB laser in dependence on current.
Table 6 Sensitivities of DFB lasers
Serial number 246608 246616
frequency on laser temperature -10.7 -10.8 GHz/K temperature on driver reference voltage 7 7 K/V working temperature for P(16) and 40 mW 34.5 32.1 °C frequency on laser current -0.21 -0.16 GHz/mA power on laser current 0.157 0.146 W / A power on monitor photocurrent 44 51 mW/mA
The cells were designed, manufactured and filled in ISI Brno. Three kinds of cells were prepared -
short and long cells with perpendicular windows (AR coated from inside and outside) and short cells with Brewster windows. First we decided to fill two short higher pressure cells (one for each lab) for preliminary tests with linear detection of Doppler broadened line. For estimation of convenient pressure we came to ISI and aligned ECDL laser beam through the evacuated (baked) cell to the detector. The frequency of laser was set to the value of P(16) line of acetylene using wavemeter and was modulated by triangular waveform applied to laser Piezo with amplitude corresponding to ±2 GHz of laser frequency detuning. The detector signal was observed on YX oscilloscope synchronized with modulation. The colleagues from ISI then started to increase the pressure. The
17
absorption lines were successfully detected since about 50 Pa (single path absorption in 9 cm cells about 3%) and both P(16) and P(17) lines were found (Figure 8).
0.50
0.55
0.60
0.65
0.70
0.75
0.80
0.85
0.90
0.95
1.00
-1 -0.5 0 0.5 1 1.5 2 2.5 3
frequency rel. to P(16) [GHz]
linea
r tr
ansm
isio
n 9
cm [
rel.]
-3 -2.5 -2 -1.5 -1 -0.5 0 0.5 1
frequency rel. to P(17) [GHz]
50 Pa, P(16), cell 2
100 Pa, P(16), cell 3
500 Pa, P(16), cell 3
1000 Pa, P(16), cell 2
Gaussian f it
77GHz
Figure 8 Linear absorption in 9 cm cells for several acetylene 13C2H2 pressures, P(16) and P(17)
transitions.
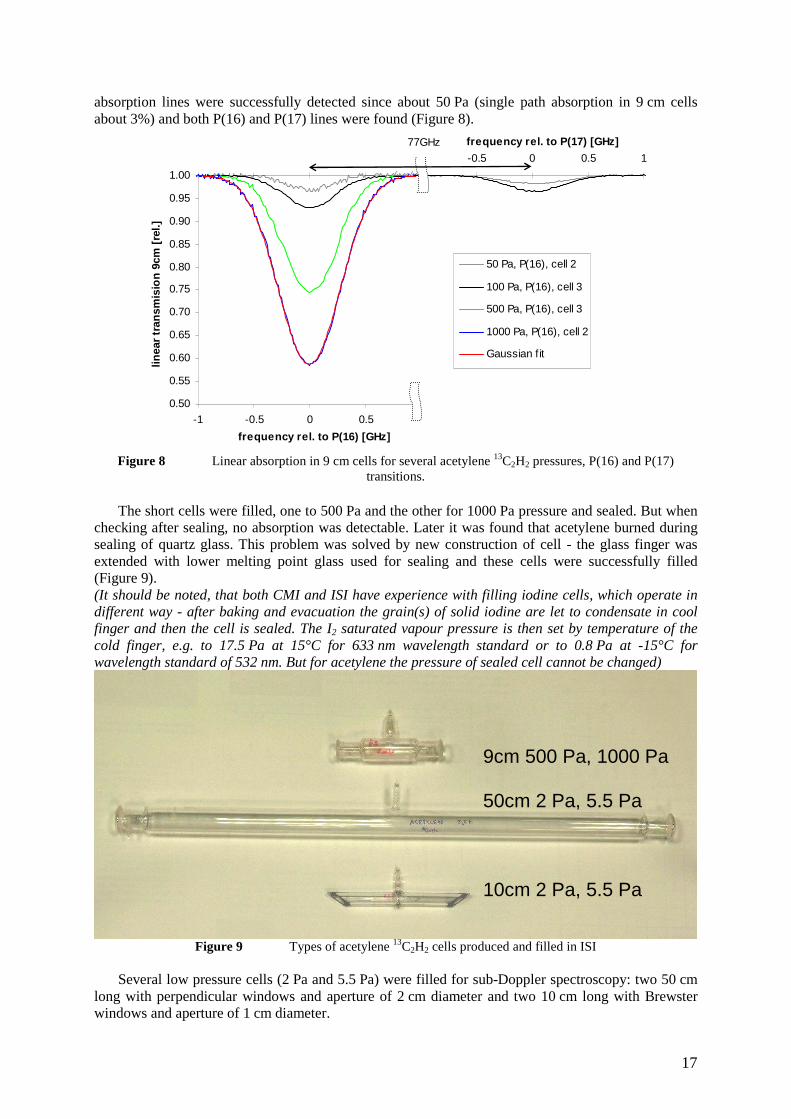
The short cells were filled, one to 500 Pa and the other for 1000 Pa pressure and sealed. But when checking after sealing, no absorption was detectable. Later it was found that acetylene burned during sealing of quartz glass. This problem was solved by new construction of cell - the glass finger was extended with lower melting point glass used for sealing and these cells were successfully filled (Figure 9). (It should be noted, that both CMI and ISI have experience with filling iodine cells, which operate in different way - after baking and evacuation the grain(s) of solid iodine are let to condensate in cool finger and then the cell is sealed. The I2 saturated vapour pressure is then set by temperature of the cold finger, e.g. to 17.5 Pa at 15°C for 633 nm wavelength standard or to 0.8 Pa at -15°C for wavelength standard of 532 nm. But for acetylene the pressure of sealed cell cannot be changed)
Figure 9 Types of acetylene 13C2H2 cells produced and filled in ISI
Several low pressure cells (2 Pa and 5.5 Pa) were filled for sub-Doppler spectroscopy: two 50 cm
long with perpendicular windows and aperture of 2 cm diameter and two 10 cm long with Brewster windows and aperture of 1 cm diameter.
9cm 500 Pa, 1000 Pa
50cm 2 Pa, 5.5 Pa
10cm 2 Pa, 5.5 Pa
18
Even lines of 13C2H2 (like P(16) selected as reference in MeP) are more intense that odd ones,
contrary to 12C2H2, where odd ones are more intense. For tested pressures up to 1 kPa the shape of (linearly) detected line remains similar to Gaussian. Figure 23 shows that pressure broadening is about 130 MHz per kPa5. The absorption maxima increase with pressure becomes slower for higher pressures, due to pressure broadening (total absorption is approximately linear function of pressure).
Absorption of acetylene 13C2H2 transition P(16) (1542.3837 nm) for temperature about 20°C was estimated from measurement of transmitted power for laser tuned to the peak of line profile and tuned away from it6 for several cell lengths and pressures. The peak linear absorption coefficient estimated this way is
α= 0.0066*(1±0.1) Pa-1m-1. The absorption in cells is introduced in Table 7.
Table 7 Peak linear absorption of P(16) transition in 13C2H2 for several cells length pressure absorption
m Pa 1 pass 2 passes 0.09 1000 44.6% 69.3% 0.09 500 25.6% 44.6% 0.50 5 1.63% 3.23% 0.50 2 0.65% 1.30% 0.10 2 0.13% 0.26%
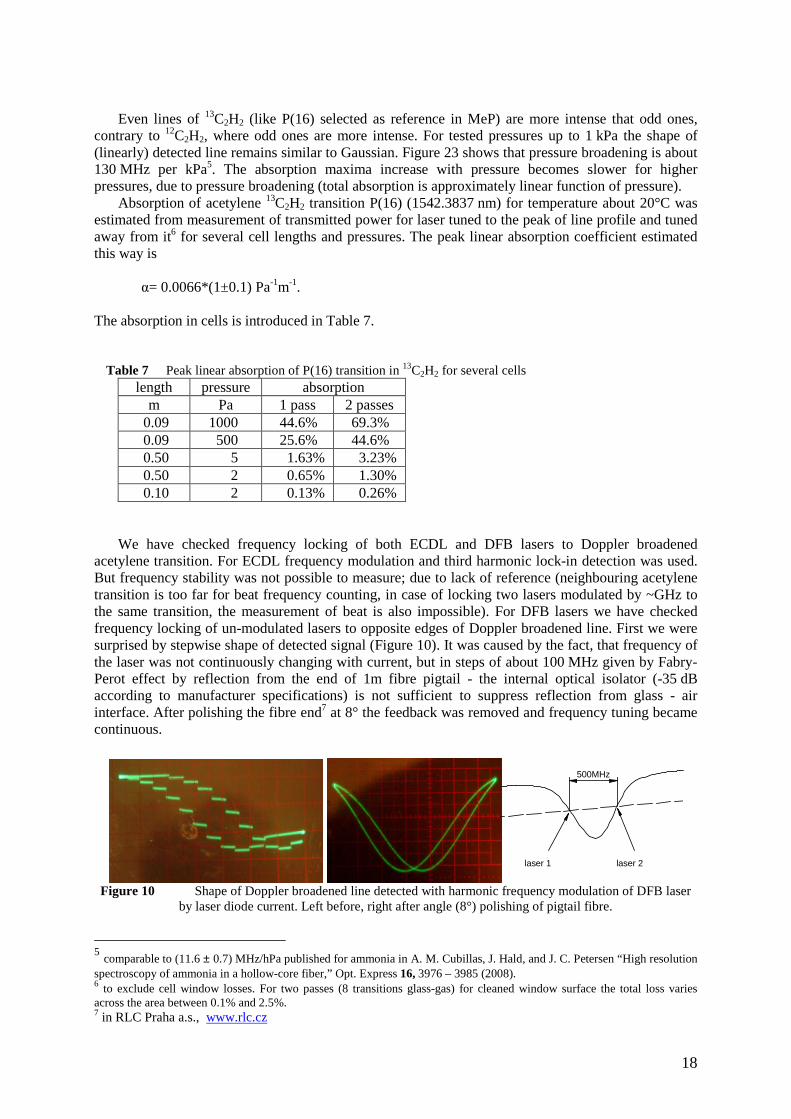
We have checked frequency locking of both ECDL and DFB lasers to Doppler broadened acetylene transition. For ECDL frequency modulation and third harmonic lock-in detection was used. But frequency stability was not possible to measure; due to lack of reference (neighbouring acetylene transition is too far for beat frequency counting, in case of locking two lasers modulated by ~GHz to the same transition, the measurement of beat is also impossible). For DFB lasers we have checked frequency locking of un-modulated lasers to opposite edges of Doppler broadened line. First we were surprised by stepwise shape of detected signal (Figure 10). It was caused by the fact, that frequency of the laser was not continuously changing with current, but in steps of about 100 MHz given by Fabry-Perot effect by reflection from the end of 1m fibre pigtail - the internal optical isolator (-35 dB according to manufacturer specifications) is not sufficient to suppress reflection from glass - air interface. After polishing the fibre end7 at 8° the feedback was removed and frequency tuning became continuous.
500MHz
laser 1 laser 2
Figure 10 Shape of Doppler broadened line detected with harmonic frequency modulation of DFB laser
by laser diode current. Left before, right after angle (8°) polishing of pigtail fibre.
5 comparable to (11.6 ± 0.7) MHz/hPa published for ammonia in A. M. Cubillas, J. Hald, and J. C. Petersen “High resolution spectroscopy of ammonia in a hollow-core fiber,” Opt. Express 16, 3976 – 3985 (2008). 6 to exclude cell window losses. For two passes (8 transitions glass-gas) for cleaned window surface the total loss varies across the area between 0.1% and 2.5%. 7 in RLC Praha a.s., www.rlc.cz
19
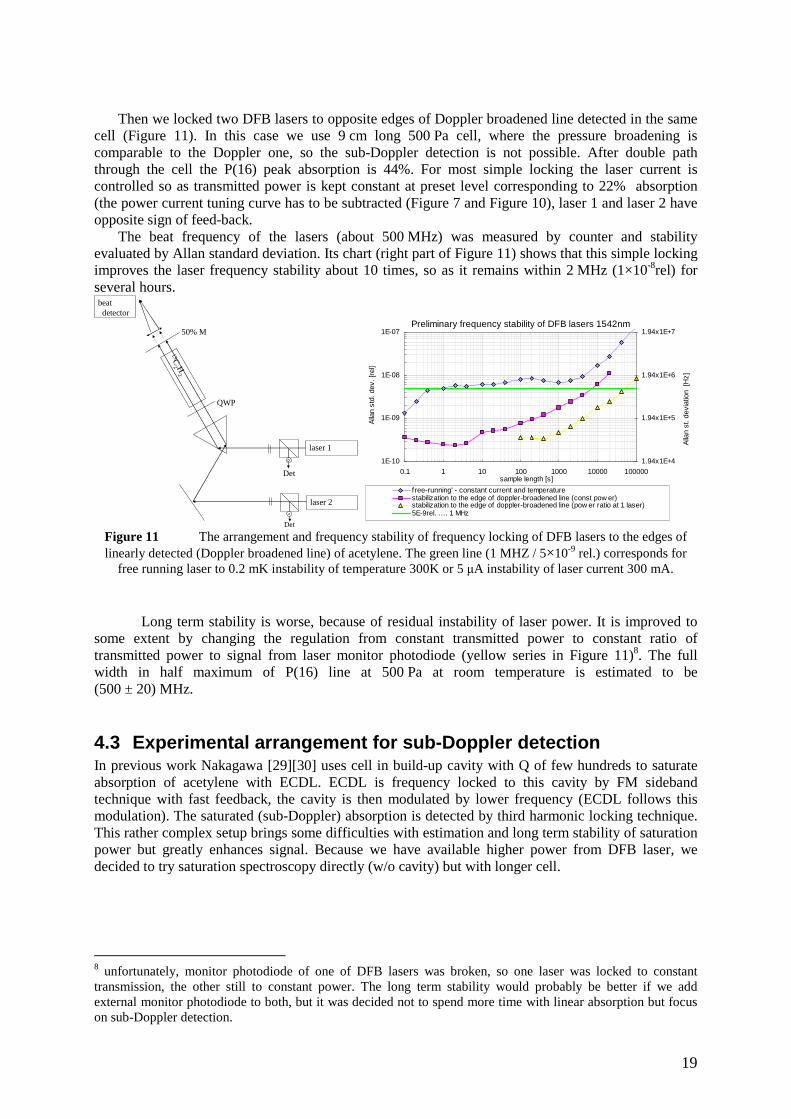
Then we locked two DFB lasers to opposite edges of Doppler broadened line detected in the same
cell (Figure 11). In this case we use 9 cm long 500 Pa cell, where the pressure broadening is comparable to the Doppler one, so the sub-Doppler detection is not possible. After double path through the cell the P(16) peak absorption is 44%. For most simple locking the laser current is controlled so as transmitted power is kept constant at preset level corresponding to 22% absorption (the power current tuning curve has to be subtracted (Figure 7 and Figure 10), laser 1 and laser 2 have opposite sign of feed-back.
The beat frequency of the lasers (about 500 MHz) was measured by counter and stability evaluated by Allan standard deviation. Its chart (right part of Figure 11) shows that this simple locking improves the laser frequency stability about 10 times, so as it remains within 2 MHz (1×10⁻⁸rel) for several hours.
13C2 H
2
laser 1
QWP
Det
laser 2
Det
beatdetector
50% M
Preliminary frequency stability of DFB lasers 1542nm
1E-10
1E-09
1E-08
1E-07
0.1 1 10 100 1000 10000 100000sample length [s]
Alla
n st
d. d
ev. [
rel]
1.94x1E+4
1.94x1E+5
1.94x1E+6
1.94x1E+7
Alla
n st
. dev
iatio
n [H
z]
f ree-running' - constant current and temperaturestabilization to the edge of doppler-broadened line (const pow er)stabilization to the edge of doppler-broadened line (pow er ratio at 1 laser)5E-9rel. …. 1 MHz
Figure 11 The arrangement and frequency stability of frequency locking of DFB lasers to the edges of linearly detected (Doppler broadened line) of acetylene. The green line (1 MHZ / 5×10⁻⁹ rel.) corresponds for
free running laser to 0.2 mK instability of temperature 300K or 5 µA instability of laser current 300 mA.
Long term stability is worse, because of residual instability of laser power. It is improved to some extent by changing the regulation from constant transmitted power to constant ratio of transmitted power to signal from laser monitor photodiode (yellow series in Figure 11)8. The full width in half maximum of P(16) line at 500 Pa at room temperature is estimated to be (500 ± 20) MHz.
4.3 Experimental arrangement for sub-Doppler detection In previous work Nakagawa [29][30] uses cell in build-up cavity with Q of few hundreds to saturate absorption of acetylene with ECDL. ECDL is frequency locked to this cavity by FM sideband technique with fast feedback, the cavity is then modulated by lower frequency (ECDL follows this modulation). The saturated (sub-Doppler) absorption is detected by third harmonic locking technique. This rather complex setup brings some difficulties with estimation and long term stability of saturation power but greatly enhances signal. Because we have available higher power from DFB laser, we decided to try saturation spectroscopy directly (w/o cavity) but with longer cell.
8 unfortunately, monitor photodiode of one of DFB lasers was broken, so one laser was locked to constant transmission, the other still to constant power. The long term stability would probably be better if we add external monitor photodiode to both, but it was decided not to spend more time with linear absorption but focus on sub-Doppler detection.
20
laser
laser
electronics
electronics
D
D
PBS
PBS
AOM
70 MHz
ISOL.
ISOL. λ/4
λ/4
cell 50cm 5.5Pa
cell 50cm 2Pa
cell 10cm 2Pa
M 50%
M 50%
output beam
output beam
counterPC
RF sp. an.
amplifier
detectorbeat
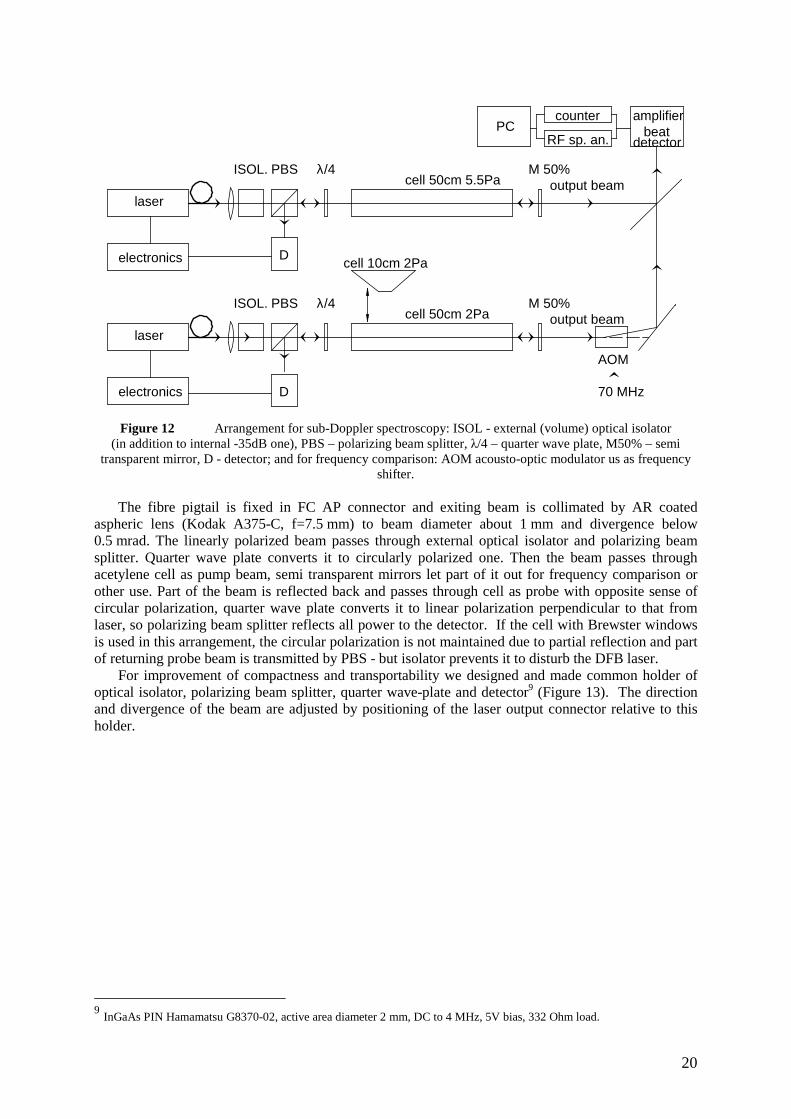
Figure 12 Arrangement for sub-Doppler spectroscopy: ISOL - external (volume) optical isolator
(in addition to internal -35dB one), PBS – polarizing beam splitter, λ/4 – quarter wave plate, M50% – semi transparent mirror, D - detector; and for frequency comparison: AOM acousto-optic modulator us as frequency
shifter.
The fibre pigtail is fixed in FC AP connector and exiting beam is collimated by AR coated aspheric lens (Kodak A375-C, f=7.5 mm) to beam diameter about 1 mm and divergence below 0.5 mrad. The linearly polarized beam passes through external optical isolator and polarizing beam splitter. Quarter wave plate converts it to circularly polarized one. Then the beam passes through acetylene cell as pump beam, semi transparent mirrors let part of it out for frequency comparison or other use. Part of the beam is reflected back and passes through cell as probe with opposite sense of circular polarization, quarter wave plate converts it to linear polarization perpendicular to that from laser, so polarizing beam splitter reflects all power to the detector. If the cell with Brewster windows is used in this arrangement, the circular polarization is not maintained due to partial reflection and part of returning probe beam is transmitted by PBS - but isolator prevents it to disturb the DFB laser.
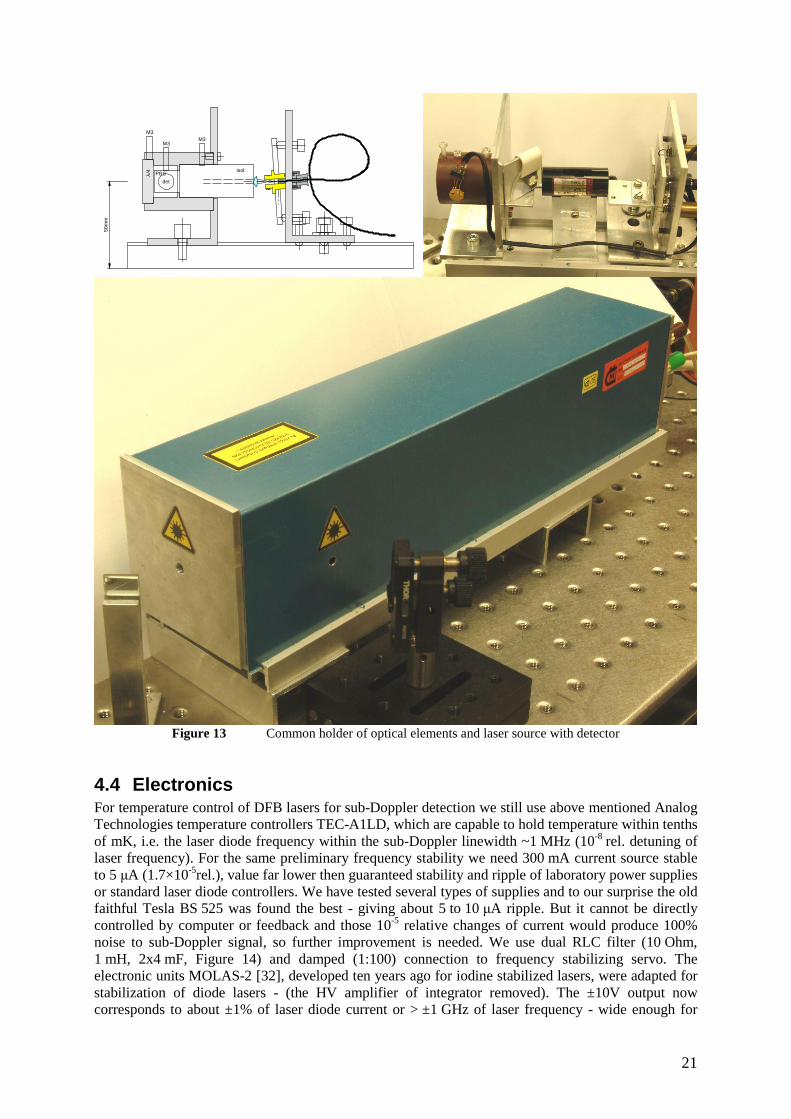
For improvement of compactness and transportability we designed and made common holder of optical isolator, polarizing beam splitter, quarter wave-plate and detector9 (Figure 13). The direction and divergence of the beam are adjusted by positioning of the laser output connector relative to this holder.
9 InGaAs PIN Hamamatsu G8370-02, active area diameter 2 mm, DC to 4 MHz, 5V bias, 332 Ohm load.
21
M3
M3M3
λ/4 isol.
PBS
det
50m
m
Figure 13 Common holder of optical elements and laser source with detector
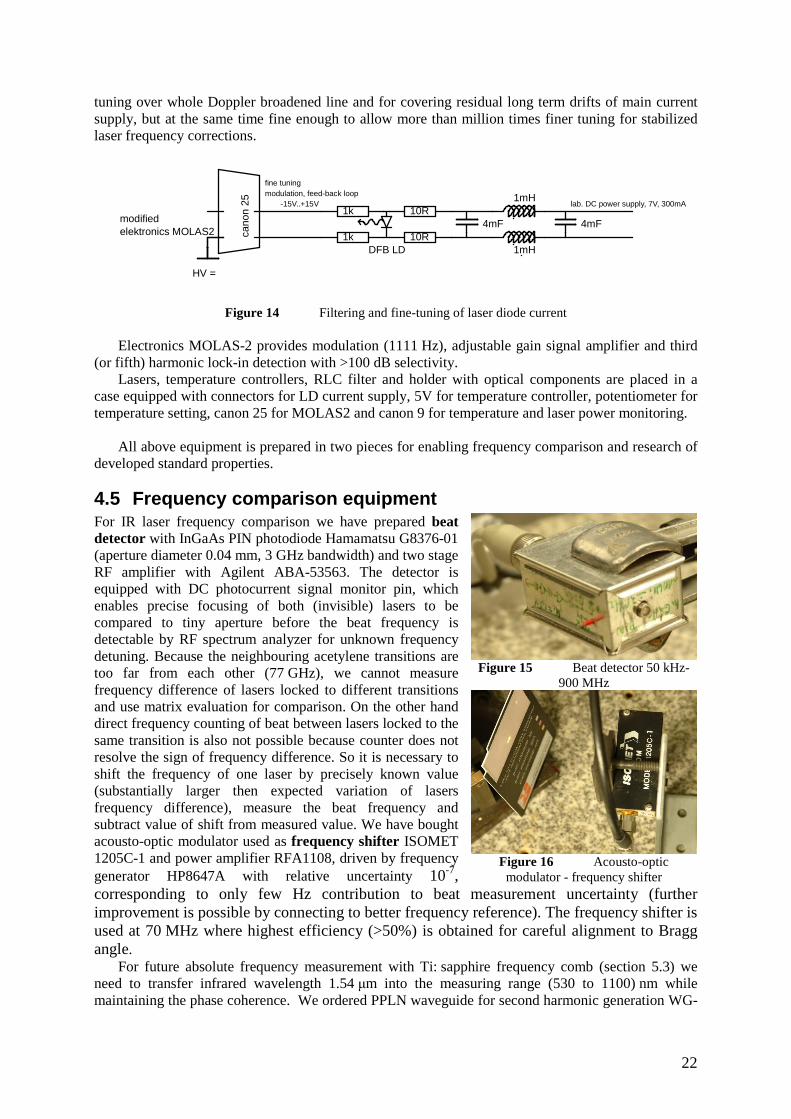
4.4 Electronics For temperature control of DFB lasers for sub-Doppler detection we still use above mentioned Analog Technologies temperature controllers TEC-A1LD, which are capable to hold temperature within tenths of mK, i.e. the laser diode frequency within the sub-Doppler linewidth ~1 MHz (10-8 rel. detuning of laser frequency). For the same preliminary frequency stability we need 300 mA current source stable to 5 µA (1.7×10⁻⁵rel.), value far lower then guaranteed stability and ripple of laboratory power supplies or standard laser diode controllers. We have tested several types of supplies and to our surprise the old faithful Tesla BS 525 was found the best - giving about 5 to 10 µA ripple. But it cannot be directly controlled by computer or feedback and those 10-5 relative changes of current would produce 100% noise to sub-Doppler signal, so further improvement is needed. We use dual RLC filter (10 Ohm, 1 mH, 2x4 mF, Figure 14) and damped (1:100) connection to frequency stabilizing servo. The electronic units MOLAS-2 [32], developed ten years ago for iodine stabilized lasers, were adapted for stabilization of diode lasers - (the HV amplifier of integrator removed). The ±10V output now corresponds to about ±1% of laser diode current or > ±1 GHz of laser frequency - wide enough for
22
tuning over whole Doppler broadened line and for covering residual long term drifts of main current supply, but at the same time fine enough to allow more than million times finer tuning for stabilized laser frequency corrections.
1k-15V..+15V
modulation, feed-back looplab. DC power supply, 7V, 300mA
fine tuning
10R4mF 4mF
1mH
1mH1k 10Relektronics MOLAS2
modified
cano
n 25
HV =
DFB LD
Figure 14 Filtering and fine-tuning of laser diode current
Electronics MOLAS-2 provides modulation (1111 Hz), adjustable gain signal amplifier and third
(or fifth) harmonic lock-in detection with >100 dB selectivity. Lasers, temperature controllers, RLC filter and holder with optical components are placed in a
case equipped with connectors for LD current supply, 5V for temperature controller, potentiometer for temperature setting, canon 25 for MOLAS2 and canon 9 for temperature and laser power monitoring.
All above equipment is prepared in two pieces for enabling frequency comparison and research of developed standard properties.
4.5 Frequency comparison equipment For IR laser frequency comparison we have prepared beat detector with InGaAs PIN photodiode Hamamatsu G8376-01 (aperture diameter 0.04 mm, 3 GHz bandwidth) and two stage RF amplifier with Agilent ABA-53563. The detector is equipped with DC photocurrent signal monitor pin, which enables precise focusing of both (invisible) lasers to be compared to tiny aperture before the beat frequency is detectable by RF spectrum analyzer for unknown frequency detuning. Because the neighbouring acetylene transitions are too far from each other (77 GHz), we cannot measure frequency difference of lasers locked to different transitions and use matrix evaluation for comparison. On the other hand direct frequency counting of beat between lasers locked to the same transition is also not possible because counter does not resolve the sign of frequency difference. So it is necessary to shift the frequency of one laser by precisely known value (substantially larger then expected variation of lasers frequency difference), measure the beat frequency and subtract value of shift from measured value. We have bought acousto-optic modulator used as frequency shifter ISOMET 1205C-1 and power amplifier RFA1108, driven by frequency generator HP8647A with relative uncertainty 10-7, corresponding to only few Hz contribution to beat measurement uncertainty (further improvement is possible by connecting to better frequency reference). The frequency shifter is used at 70 MHz where highest efficiency (>50%) is obtained for careful alignment to Bragg angle.
For future absolute frequency measurement with Ti: sapphire frequency comb (section 5.3) we need to transfer infrared wavelength 1.54 µm into the measuring range (530 to 1100) nm while maintaining the phase coherence. We ordered PPLN waveguide for second harmonic generation WG-
Figure 15 Beat detector 50 kHz-
900 MHz
Figure 16 Acousto-optic modulator - frequency shifter
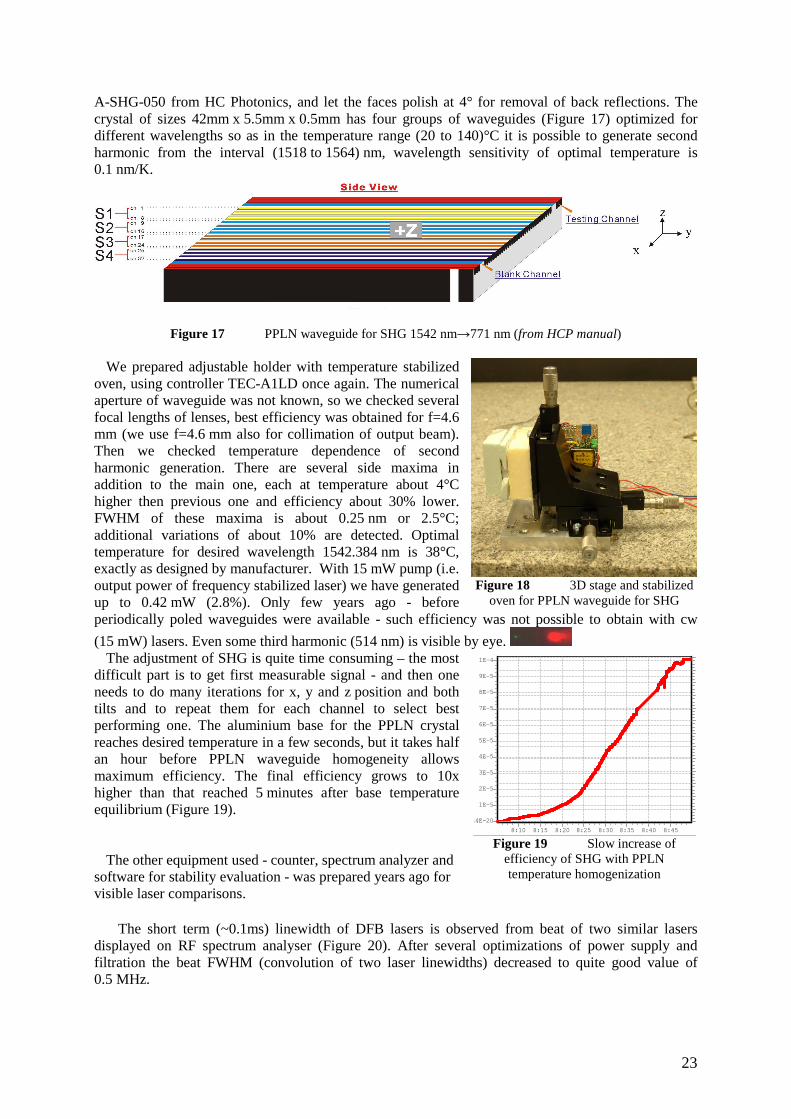
23
A-SHG-050 from HC Photonics, and let the faces polish at 4° for removal of back reflections. The crystal of sizes 42mm x 5.5mm x 0.5mm has four groups of waveguides (Figure 17) optimized for different wavelengths so as in the temperature range (20 to 140)°C it is possible to generate second harmonic from the interval (1518 to 1564) nm, wavelength sensitivity of optimal temperature is 0.1 nm/K.
Figure 17 PPLN waveguide for SHG 1542 nm→771 nm (from HCP manual)
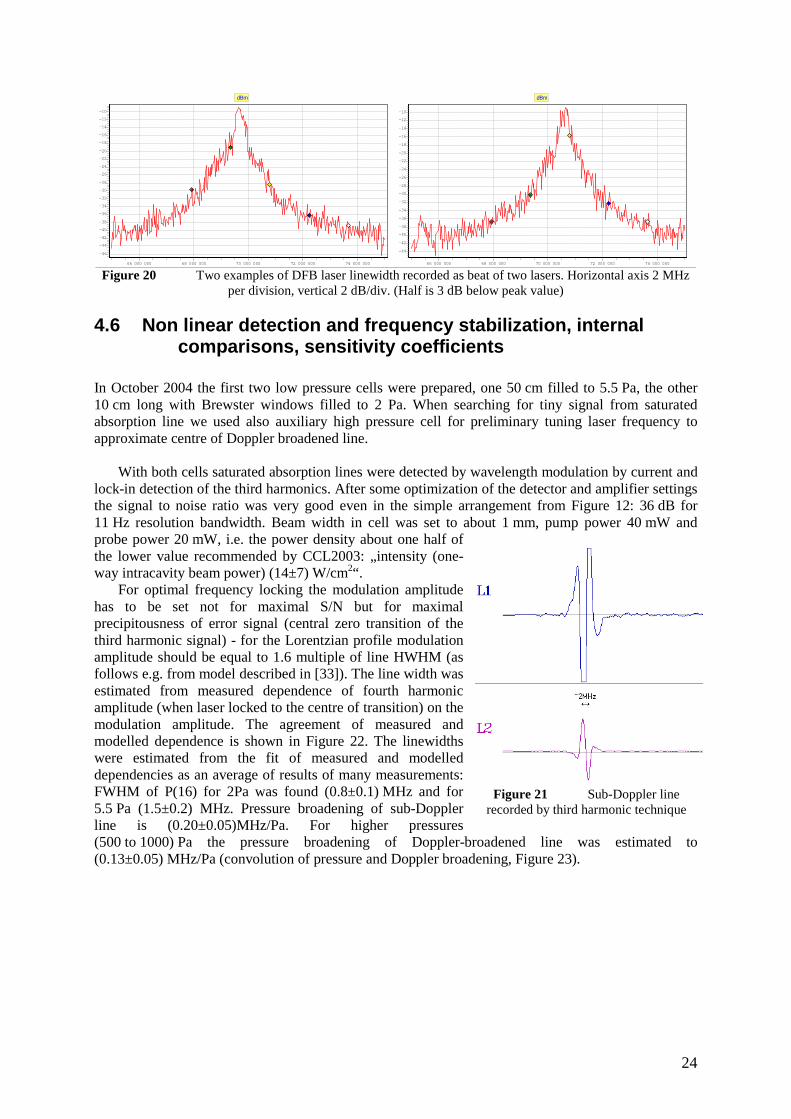
We prepared adjustable holder with temperature stabilized oven, using controller TEC-A1LD once again. The numerical aperture of waveguide was not known, so we checked several focal lengths of lenses, best efficiency was obtained for f=4.6 mm (we use f=4.6 mm also for collimation of output beam). Then we checked temperature dependence of second harmonic generation. There are several side maxima in addition to the main one, each at temperature about 4°C higher then previous one and efficiency about 30% lower. FWHM of these maxima is about 0.25 nm or 2.5°C; additional variations of about 10% are detected. Optimal temperature for desired wavelength 1542.384 nm is 38°C, exactly as designed by manufacturer. With 15 mW pump (i.e. output power of frequency stabilized laser) we have generated up to 0.42 mW (2.8%). Only few years ago - before periodically poled waveguides were available - such efficiency was not possible to obtain with cw
(15 mW) lasers. Even some third harmonic (514 nm) is visible by eye. The adjustment of SHG is quite time consuming – the most
difficult part is to get first measurable signal - and then one needs to do many iterations for x, y and z position and both tilts and to repeat them for each channel to select best performing one. The aluminium base for the PPLN crystal reaches desired temperature in a few seconds, but it takes half an hour before PPLN waveguide homogeneity allows maximum efficiency. The final efficiency grows to 10x higher than that reached 5 minutes after base temperature equilibrium (Figure 19).
The other equipment used - counter, spectrum analyzer and
software for stability evaluation - was prepared years ago for visible laser comparisons.
The short term (~0.1ms) linewidth of DFB lasers is observed from beat of two similar lasers
displayed on RF spectrum analyser (Figure 20). After several optimizations of power supply and filtration the beat FWHM (convolution of two laser linewidths) decreased to quite good value of 0.5 MHz.
Figure 18 3D stage and stabilized
oven for PPLN waveguide for SHG
8:458:408:358:308:258:208:158:10
1E-4
9E-5
8E-5
7E-5
6E-5
5E-5
4E-5
3E-5
2E-5
1E-5
1.01644E-20
Figure 19 Slow increase of
efficiency of SHG with PPLN temperature homogenization
24
dBm
74 000 00072 000 00070 000 00068 000 00066 000 000
-10
-12
-14
-16
-18
-20
-22
-24
-26
-28
-30
-32
-34
-36
-38
-40
-42
-44
-46
dBm
74 000 00072 000 00070 000 00068 000 00066 000 000
-10
-12
-14
-16
-18
-20
-22
-24
-26
-28
-30
-32
-34
-36
-38
-40
-42
-44
Figure 20 Two examples of DFB laser linewidth recorded as beat of two lasers. Horizontal axis 2 MHz
per division, vertical 2 dB/div. (Half is 3 dB below peak value)
4.6 Non linear detection and frequency stabilization, internal comparisons, sensitivity coefficients
In October 2004 the first two low pressure cells were prepared, one 50 cm filled to 5.5 Pa, the other 10 cm long with Brewster windows filled to 2 Pa. When searching for tiny signal from saturated absorption line we used also auxiliary high pressure cell for preliminary tuning laser frequency to approximate centre of Doppler broadened line.
With both cells saturated absorption lines were detected by wavelength modulation by current and lock-in detection of the third harmonics. After some optimization of the detector and amplifier settings the signal to noise ratio was very good even in the simple arrangement from Figure 12: 36 dB for 11 Hz resolution bandwidth. Beam width in cell was set to about 1 mm, pump power 40 mW and probe power 20 mW, i.e. the power density about one half of the lower value recommended by CCL2003: „intensity (one-way intracavity beam power) (14±7) W/cm2“.
For optimal frequency locking the modulation amplitude has to be set not for maximal S/N but for maximal precipitousness of error signal (central zero transition of the third harmonic signal) - for the Lorentzian profile modulation amplitude should be equal to 1.6 multiple of line HWHM (as follows e.g. from model described in [33]). The line width was estimated from measured dependence of fourth harmonic amplitude (when laser locked to the centre of transition) on the modulation amplitude. The agreement of measured and modelled dependence is shown in Figure 22. The linewidths were estimated from the fit of measured and modelled dependencies as an average of results of many measurements: FWHM of P(16) for 2Pa was found (0.8±0.1) MHz and for 5.5 Pa (1.5±0.2) MHz. Pressure broadening of sub-Doppler line is (0.20±0.05)MHz/Pa. For higher pressures (500 to 1000) Pa the pressure broadening of Doppler-broadened line was estimated to (0.13±0.05) MHz/Pa (convolution of pressure and Doppler broadening, Figure 23).
Figure 21 Sub-Doppler line
recorded by third harmonic technique
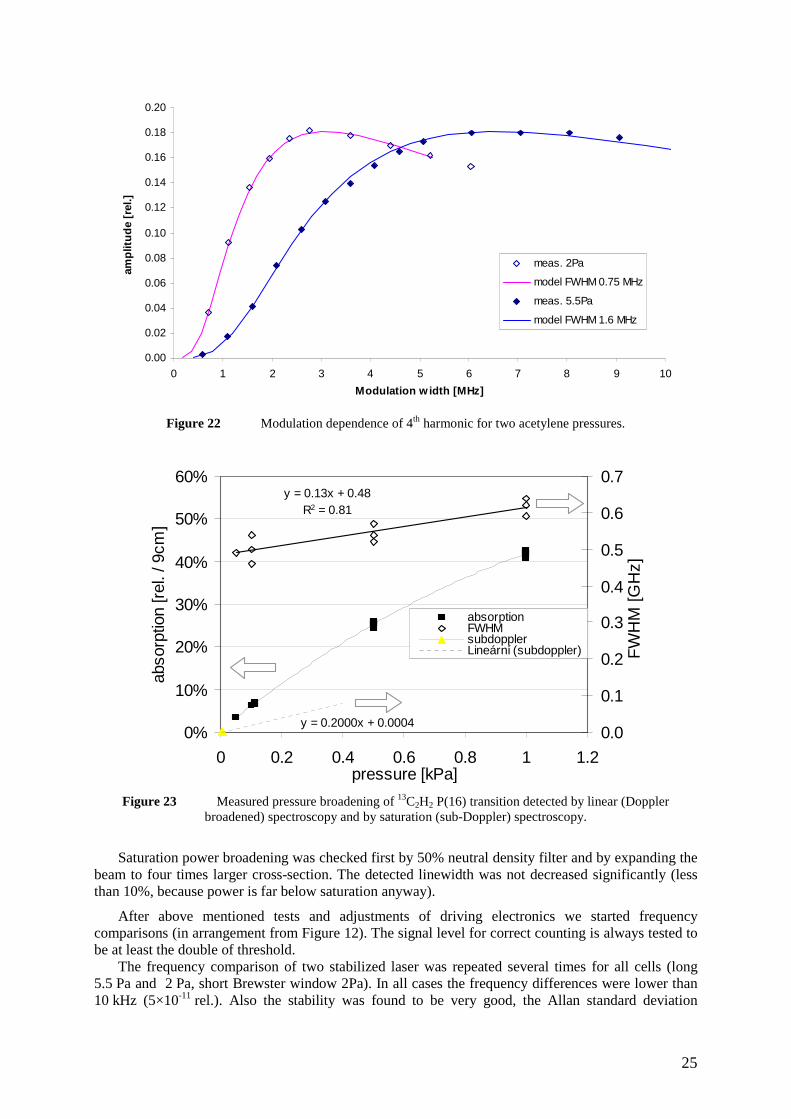
25
0.00
0.02
0.04
0.06
0.08
0.10
0.12
0.14
0.16
0.18
0.20
0 1 2 3 4 5 6 7 8 9 10
Modulation w idth [MHz]
amp
litu
de
[rel
.]
meas. 2Pa
model FWHM 0.75 MHz
meas. 5.5Pa
model FWHM 1.6 MHz
Figure 22 Modulation dependence of 4th harmonic for two acetylene pressures.
y = 0.13x + 0.48R2 = 0.81
y = 0.2000x + 0.00040%
10%
20%
30%
40%
50%
60%
0 0.2 0.4 0.6 0.8 1 1.2pressure [kPa]
abso
rptio
n [r
el. /
9cm
]
0.0
0.1
0.2
0.3
0.4
0.5
0.6
0.7
FW
HM
[GH
z] .
absorptionFWHMsubdopplerLineární (subdoppler)
Figure 23 Measured pressure broadening of 13C2H2 P(16) transition detected by linear (Doppler
broadened) spectroscopy and by saturation (sub-Doppler) spectroscopy.
Saturation power broadening was checked first by 50% neutral density filter and by expanding the beam to four times larger cross-section. The detected linewidth was not decreased significantly (less than 10%, because power is far below saturation anyway).
After above mentioned tests and adjustments of driving electronics we started frequency comparisons (in arrangement from Figure 12). The signal level for correct counting is always tested to be at least the double of threshold.
The frequency comparison of two stabilized laser was repeated several times for all cells (long 5.5 Pa and 2 Pa, short Brewster window 2Pa). In all cases the frequency differences were lower than 10 kHz (5×10-11 rel.). Also the stability was found to be very good, the Allan standard deviation
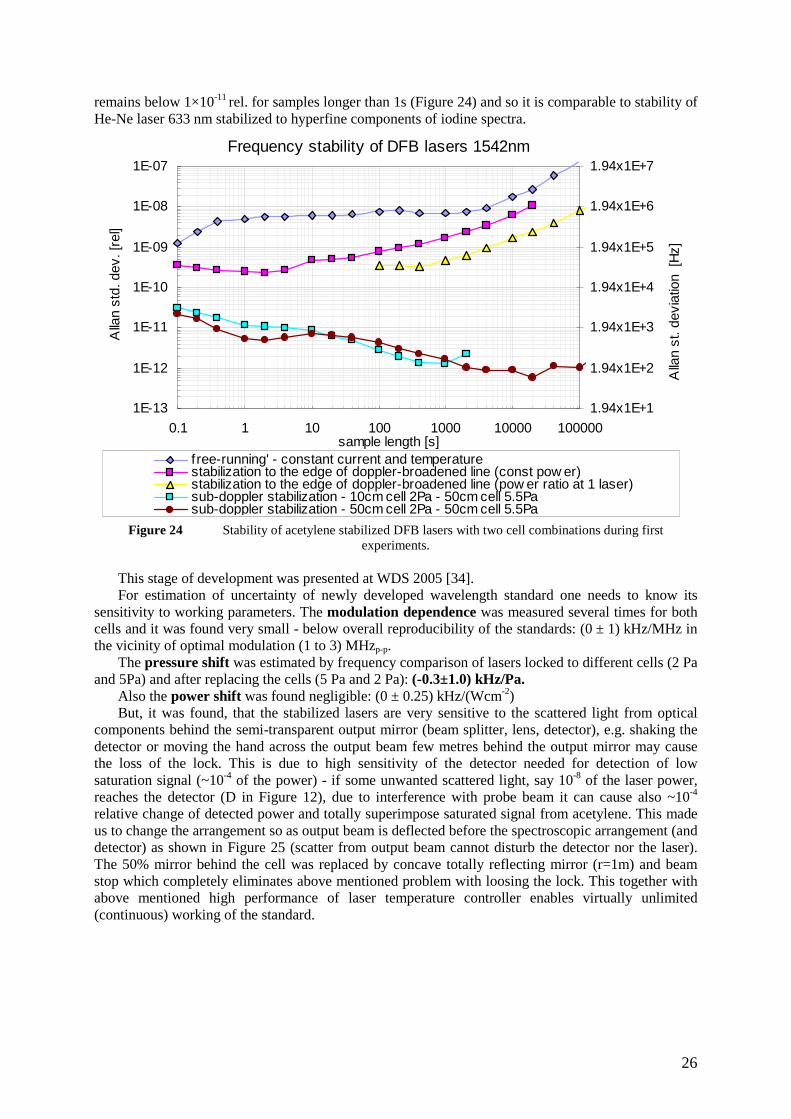
26
remains below 1×10-11 rel. for samples longer than 1s (Figure 24) and so it is comparable to stability of He-Ne laser 633 nm stabilized to hyperfine components of iodine spectra.
Frequency stability of DFB lasers 1542nm
1E-13
1E-12
1E-11
1E-10
1E-09
1E-08
1E-07
0.1 1 10 100 1000 10000 100000sample length [s]
Alla
n st
d. d
ev. [
rel]
1.94x1E+1
1.94x1E+2
1.94x1E+3
1.94x1E+4
1.94x1E+5
1.94x1E+6
1.94x1E+7
Alla
n st
. dev
iatio
n [H
z]
f ree-running' - constant current and temperaturestabilization to the edge of doppler-broadened line (const pow er)stabilization to the edge of doppler-broadened line (pow er ratio at 1 laser)sub-doppler stabilization - 10cm cell 2Pa - 50cm cell 5.5Pasub-doppler stabilization - 50cm cell 2Pa - 50cm cell 5.5Pa
Figure 24 Stability of acetylene stabilized DFB lasers with two cell combinations during first experiments.
This stage of development was presented at WDS 2005 [34]. For estimation of uncertainty of newly developed wavelength standard one needs to know its
sensitivity to working parameters. The modulation dependence was measured several times for both cells and it was found very small - below overall reproducibility of the standards: (0 ± 1) kHz/MHz in the vicinity of optimal modulation (1 to 3) MHzp-p.
The pressure shift was estimated by frequency comparison of lasers locked to different cells (2 Pa and 5Pa) and after replacing the cells (5 Pa and 2 Pa): (-0.3±1.0) kHz/Pa.
Also the power shift was found negligible: (0 ± 0.25) kHz/(Wcm-2) But, it was found, that the stabilized lasers are very sensitive to the scattered light from optical
components behind the semi-transparent output mirror (beam splitter, lens, detector), e.g. shaking the detector or moving the hand across the output beam few metres behind the output mirror may cause the loss of the lock. This is due to high sensitivity of the detector needed for detection of low saturation signal (~10-4 of the power) - if some unwanted scattered light, say 10-8 of the laser power, reaches the detector (D in Figure 12), due to interference with probe beam it can cause also ~10-4 relative change of detected power and totally superimpose saturated signal from acetylene. This made us to change the arrangement so as output beam is deflected before the spectroscopic arrangement (and detector) as shown in Figure 25 (scatter from output beam cannot disturb the detector nor the laser). The 50% mirror behind the cell was replaced by concave totally reflecting mirror (r=1m) and beam stop which completely eliminates above mentioned problem with loosing the lock. This together with above mentioned high performance of laser temperature controller enables virtually unlimited (continuous) working of the standard.
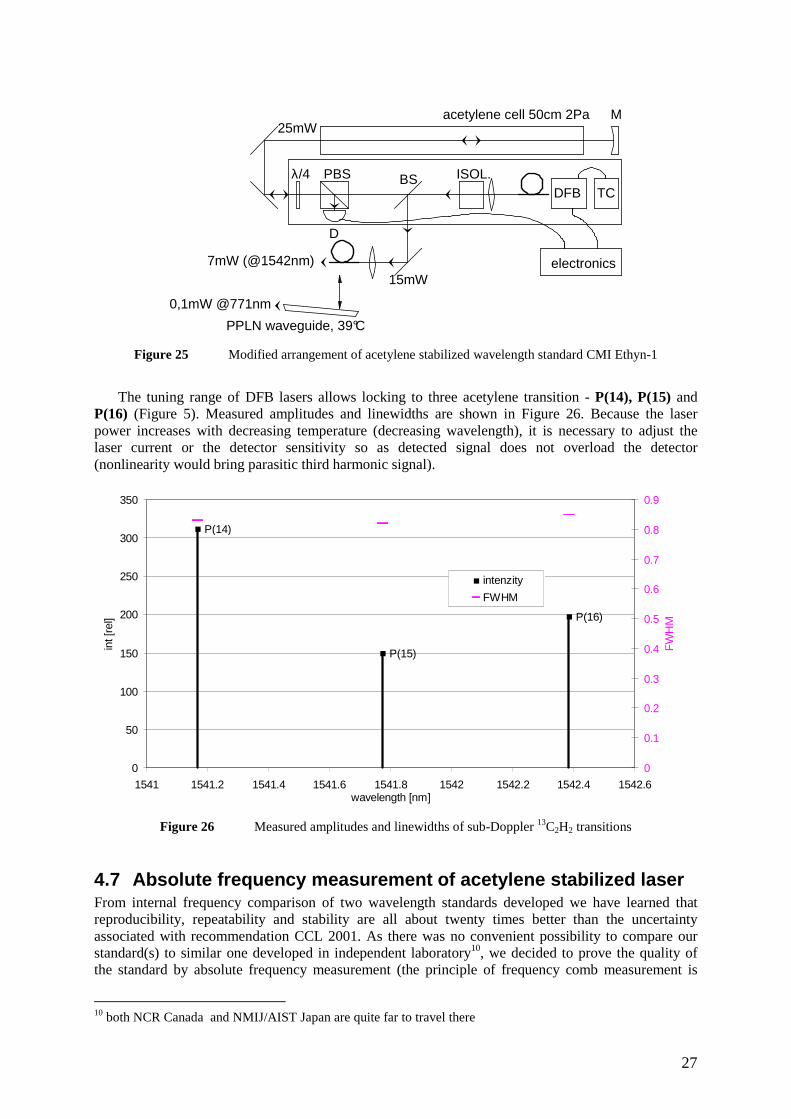
27
electronics
PBS
D
15mW7mW (@1542nm)
0,1mW @771nm
25mWM
BS ISOL.DFB TC
λ/4
acetylene cell 50cm 2Pa
PPLN waveguide, 39°C
Figure 25 Modified arrangement of acetylene stabilized wavelength standard CMI Ethyn-1
The tuning range of DFB lasers allows locking to three acetylene transition - P(14), P(15) and P(16) (Figure 5). Measured amplitudes and linewidths are shown in Figure 26. Because the laser power increases with decreasing temperature (decreasing wavelength), it is necessary to adjust the laser current or the detector sensitivity so as detected signal does not overload the detector (nonlinearity would bring parasitic third harmonic signal).
P(14)
P(15)
P(16)
0
50
100
150
200
250
300
350
1541 1541.2 1541.4 1541.6 1541.8 1542 1542.2 1542.4 1542.6wavelength [nm]
int [
rel]
0
0.1
0.2
0.3
0.4
0.5
0.6
0.7
0.8
0.9
FW
HM
intenzity
FWHM
Figure 26 Measured amplitudes and linewidths of sub-Doppler 13C2H2 transitions
4.7 Absolute frequency measurement of acetylene stabilized laser From internal frequency comparison of two wavelength standards developed we have learned that reproducibility, repeatability and stability are all about twenty times better than the uncertainty associated with recommendation CCL 2001. As there was no convenient possibility to compare our standard(s) to similar one developed in independent laboratory10, we decided to prove the quality of the standard by absolute frequency measurement (the principle of frequency comb measurement is
10 both NCR Canada and NMIJ/AIST Japan are quite far to travel there
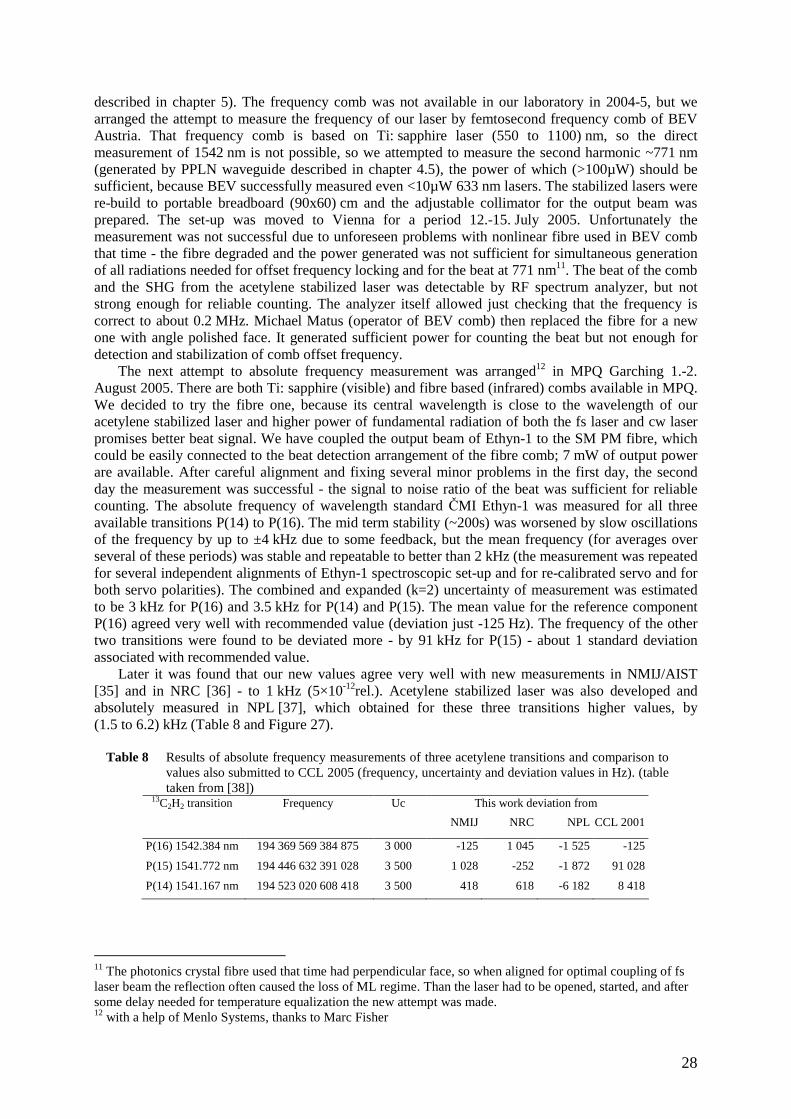
28
described in chapter 5). The frequency comb was not available in our laboratory in 2004-5, but we arranged the attempt to measure the frequency of our laser by femtosecond frequency comb of BEV Austria. That frequency comb is based on Ti: sapphire laser (550 to 1100) nm, so the direct measurement of 1542 nm is not possible, so we attempted to measure the second harmonic ~771 nm (generated by PPLN waveguide described in chapter 4.5), the power of which (>100µW) should be sufficient, because BEV successfully measured even <10µW 633 nm lasers. The stabilized lasers were re-build to portable breadboard (90x60) cm and the adjustable collimator for the output beam was prepared. The set-up was moved to Vienna for a period 12.-15. July 2005. Unfortunately the measurement was not successful due to unforeseen problems with nonlinear fibre used in BEV comb that time - the fibre degraded and the power generated was not sufficient for simultaneous generation of all radiations needed for offset frequency locking and for the beat at 771 nm11. The beat of the comb and the SHG from the acetylene stabilized laser was detectable by RF spectrum analyzer, but not strong enough for reliable counting. The analyzer itself allowed just checking that the frequency is correct to about 0.2 MHz. Michael Matus (operator of BEV comb) then replaced the fibre for a new one with angle polished face. It generated sufficient power for counting the beat but not enough for detection and stabilization of comb offset frequency.
The next attempt to absolute frequency measurement was arranged12 in MPQ Garching 1.-2. August 2005. There are both Ti: sapphire (visible) and fibre based (infrared) combs available in MPQ. We decided to try the fibre one, because its central wavelength is close to the wavelength of our acetylene stabilized laser and higher power of fundamental radiation of both the fs laser and cw laser promises better beat signal. We have coupled the output beam of Ethyn-1 to the SM PM fibre, which could be easily connected to the beat detection arrangement of the fibre comb; 7 mW of output power are available. After careful alignment and fixing several minor problems in the first day, the second day the measurement was successful - the signal to noise ratio of the beat was sufficient for reliable counting. The absolute frequency of wavelength standard ČMI Ethyn-1 was measured for all three available transitions P(14) to P(16). The mid term stability (~200s) was worsened by slow oscillations of the frequency by up to ±4 kHz due to some feedback, but the mean frequency (for averages over several of these periods) was stable and repeatable to better than 2 kHz (the measurement was repeated for several independent alignments of Ethyn-1 spectroscopic set-up and for re-calibrated servo and for both servo polarities). The combined and expanded (k=2) uncertainty of measurement was estimated to be 3 kHz for P(16) and 3.5 kHz for P(14) and P(15). The mean value for the reference component P(16) agreed very well with recommended value (deviation just -125 Hz). The frequency of the other two transitions were found to be deviated more - by 91 kHz for P(15) - about 1 standard deviation associated with recommended value.
Later it was found that our new values agree very well with new measurements in NMIJ/AIST [35] and in NRC [36] - to 1 kHz (5×10-12rel.). Acetylene stabilized laser was also developed and absolutely measured in NPL [37], which obtained for these three transitions higher values, by (1.5 to 6.2) kHz (Table 8 and Figure 27).
Table 8 Results of absolute frequency measurements of three acetylene transitions and comparison to
values also submitted to CCL 2005 (frequency, uncertainty and deviation values in Hz). (table taken from [38])
13C2H2 transition Frequency Uc This work deviation from NMIJ NRC NPL CCL 2001
P(16) 1542.384 nm 194 369 569 384 875 3 000 -125 1 045 -1 525 -125
P(15) 1541.772 nm 194 446 632 391 028 3 500 1 028 -252 -1 872 91 028
P(14) 1541.167 nm 194 523 020 608 418 3 500 418 618 -6 182 8 418
11 The photonics crystal fibre used that time had perpendicular face, so when aligned for optimal coupling of fs laser beam the reflection often caused the loss of ML regime. Than the laser had to be opened, started, and after some delay needed for temperature equalization the new attempt was made. 12 with a help of Menlo Systems, thanks to Marc Fisher
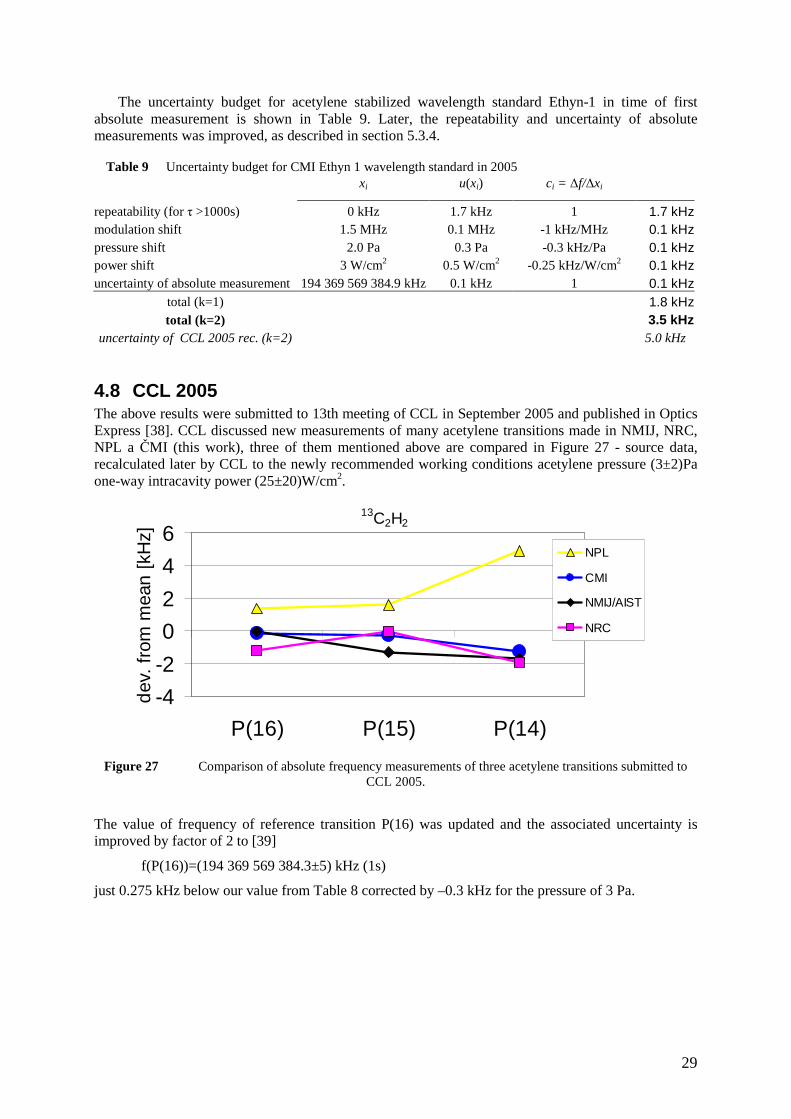
29
The uncertainty budget for acetylene stabilized wavelength standard Ethyn-1 in time of first absolute measurement is shown in Table 9. Later, the repeatability and uncertainty of absolute measurements was improved, as described in section 5.3.4.
Table 9 Uncertainty budget for CMI Ethyn 1 wavelength standard in 2005
xi u(xi) ci = ∆f/∆xi
repeatability (for τ >1000s) 0 kHz 1.7 kHz 1 1.7 kHz modulation shift 1.5 MHz 0.1 MHz -1 kHz/MHz 0.1 kHz pressure shift 2.0 Pa 0.3 Pa -0.3 kHz/Pa 0.1 kHz power shift 3 W/cm2 0.5 W/cm2 -0.25 kHz/W/cm2 0.1 kHz uncertainty of absolute measurement 194 369 569 384.9 kHz 0.1 kHz 1 0.1 kHz
total (k=1) 1.8 kHz total (k=2) 3.5 kHz
uncertainty of CCL 2005 rec. (k=2) 5.0 kHz
4.8 CCL 2005 The above results were submitted to 13th meeting of CCL in September 2005 and published in Optics Express [38]. CCL discussed new measurements of many acetylene transitions made in NMIJ, NRC, NPL a ČMI (this work), three of them mentioned above are compared in Figure 27 - source data, recalculated later by CCL to the newly recommended working conditions acetylene pressure (3±2)Pa one-way intracavity power (25±20)W/cm2.
13C2H2
-4
-2
0
2
4
6
P(16) P(15) P(14)
dev
. fr
om m
ean
[kH
z]
NPL
CMI
NMIJ/AIST
NRC
Figure 27 Comparison of absolute frequency measurements of three acetylene transitions submitted to
CCL 2005.
The value of frequency of reference transition P(16) was updated and the associated uncertainty is improved by factor of 2 to [39]
f(P(16))=(194 369 569 384.3±5) kHz (1s)
just 0.275 kHz below our value from Table 8 corrected by –0.3 kHz for the pressure of 3 Pa.
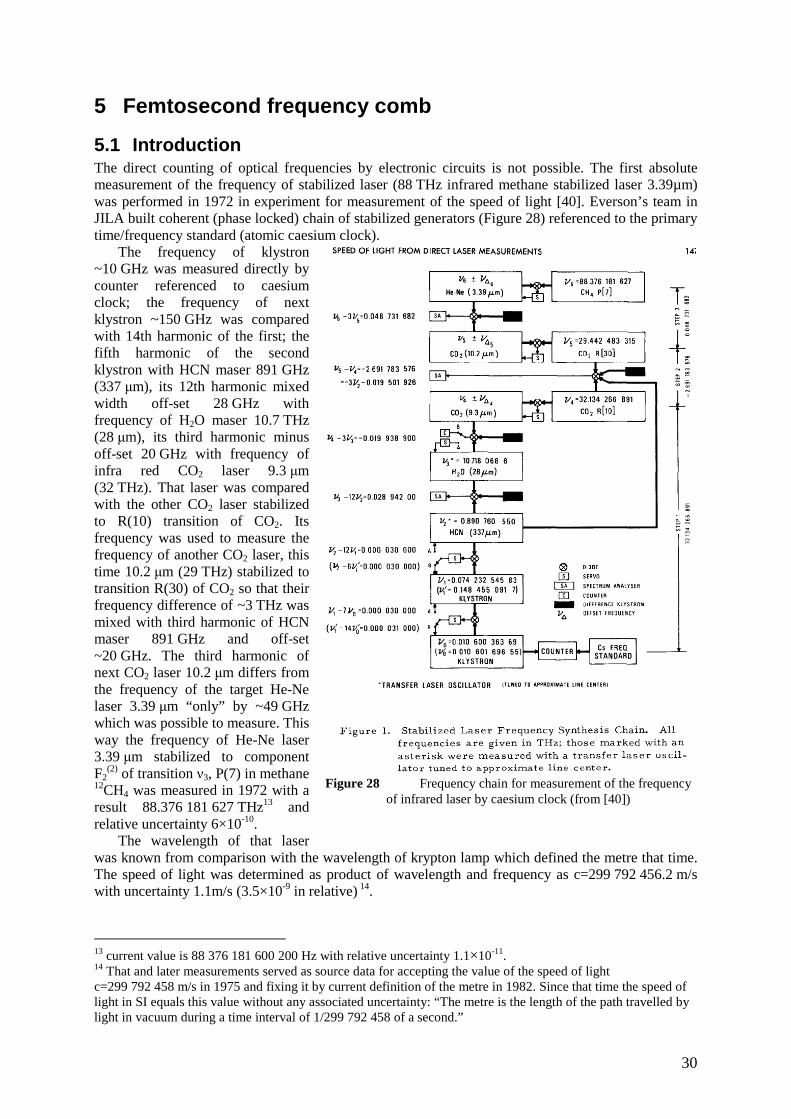
30
5 Femtosecond frequency comb
5.1 Introduction The direct counting of optical frequencies by electronic circuits is not possible. The first absolute measurement of the frequency of stabilized laser (88 THz infrared methane stabilized laser 3.39µm) was performed in 1972 in experiment for measurement of the speed of light [40]. Everson’s team in JILA built coherent (phase locked) chain of stabilized generators (Figure 28) referenced to the primary time/frequency standard (atomic caesium clock).
The frequency of klystron ~10 GHz was measured directly by counter referenced to caesium clock; the frequency of next klystron ~150 GHz was compared with 14th harmonic of the first; the fifth harmonic of the second klystron with HCN maser 891 GHz (337 µm), its 12th harmonic mixed width off-set 28 GHz with frequency of H2O maser 10.7 THz (28 µm), its third harmonic minus off-set 20 GHz with frequency of infra red CO2 laser 9.3 µm (32 THz). That laser was compared with the other CO2 laser stabilized to R(10) transition of CO2. Its frequency was used to measure the frequency of another CO2 laser, this time 10.2 µm (29 THz) stabilized to transition R(30) of CO2 so that their frequency difference of ~3 THz was mixed with third harmonic of HCN maser 891 GHz and off-set ~20 GHz. The third harmonic of next CO2 laser 10.2 µm differs from the frequency of the target He-Ne laser 3.39 µm “only” by ~49 GHz which was possible to measure. This way the frequency of He-Ne laser 3.39 µm stabilized to component F2
(2) of transition ν3, P(7) in methane 12CH4 was measured in 1972 with a result 88.376 181 627 THz13 and relative uncertainty 6×10⁻¹⁰.
The wavelength of that laser was known from comparison with the wavelength of krypton lamp which defined the metre that time. The speed of light was determined as product of wavelength and frequency as c=299 792 456.2 m/s with uncertainty 1.1m/s (3.5×10⁻⁹ in relative) 14.
13 current value is 88 376 181 600 200 Hz with relative uncertainty 1.1×10⁻¹¹. 14 That and later measurements served as source data for accepting the value of the speed of light c=299 792 458 m/s in 1975 and fixing it by current definition of the metre in 1982. Since that time the speed of light in SI equals this value without any associated uncertainty: “The metre is the length of the path travelled by light in vacuum during a time interval of 1/299 792 458 of a second.”
Figure 28 Frequency chain for measurement of the frequency
of infrared laser by caesium clock (from [40])
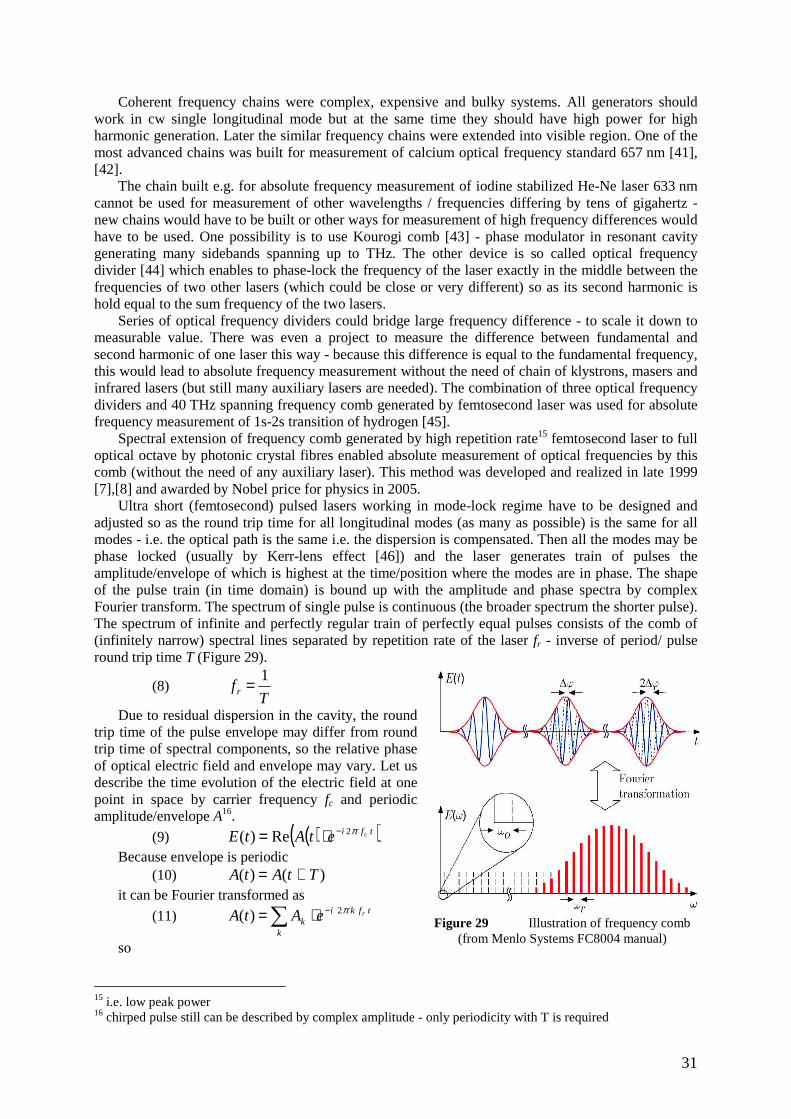
31
Coherent frequency chains were complex, expensive and bulky systems. All generators should work in cw single longitudinal mode but at the same time they should have high power for high harmonic generation. Later the similar frequency chains were extended into visible region. One of the most advanced chains was built for measurement of calcium optical frequency standard 657 nm [41], [42].
The chain built e.g. for absolute frequency measurement of iodine stabilized He-Ne laser 633 nm cannot be used for measurement of other wavelengths / frequencies differing by tens of gigahertz - new chains would have to be built or other ways for measurement of high frequency differences would have to be used. One possibility is to use Kourogi comb [43] - phase modulator in resonant cavity generating many sidebands spanning up to THz. The other device is so called optical frequency divider [44] which enables to phase-lock the frequency of the laser exactly in the middle between the frequencies of two other lasers (which could be close or very different) so as its second harmonic is hold equal to the sum frequency of the two lasers.
Series of optical frequency dividers could bridge large frequency difference - to scale it down to measurable value. There was even a project to measure the difference between fundamental and second harmonic of one laser this way - because this difference is equal to the fundamental frequency, this would lead to absolute frequency measurement without the need of chain of klystrons, masers and infrared lasers (but still many auxiliary lasers are needed). The combination of three optical frequency dividers and 40 THz spanning frequency comb generated by femtosecond laser was used for absolute frequency measurement of 1s-2s transition of hydrogen [45].
Spectral extension of frequency comb generated by high repetition rate15 femtosecond laser to full optical octave by photonic crystal fibres enabled absolute measurement of optical frequencies by this comb (without the need of any auxiliary laser). This method was developed and realized in late 1999 [7],[8] and awarded by Nobel price for physics in 2005.
Ultra short (femtosecond) pulsed lasers working in mode-lock regime have to be designed and adjusted so as the round trip time for all longitudinal modes (as many as possible) is the same for all modes - i.e. the optical path is the same i.e. the dispersion is compensated. Then all the modes may be phase locked (usually by Kerr-lens effect [46]) and the laser generates train of pulses the amplitude/envelope of which is highest at the time/position where the modes are in phase. The shape of the pulse train (in time domain) is bound up with the amplitude and phase spectra by complex Fourier transform. The spectrum of single pulse is continuous (the broader spectrum the shorter pulse). The spectrum of infinite and perfectly regular train of perfectly equal pulses consists of the comb of (infinitely narrow) spectral lines separated by repetition rate of the laser fr - inverse of period/ pulse round trip time T (Figure 29).
(8) T
f r
1=
Due to residual dispersion in the cavity, the round trip time of the pulse envelope may differ from round trip time of spectral components, so the relative phase of optical electric field and envelope may vary. Let us describe the time evolution of the electric field at one point in space by carrier frequency fc and periodic amplitude/envelope A16.
(9) ( )( )tfi cetAtE 2 Re)( π−⋅= Because envelope is periodic
(10) )()( TtAtA += it can be Fourier transformed as
(11) ∑ −⋅= k
tfkik
reAtA 2 )( π
so
15 i.e. low peak power 16 chirped pulse still can be described by complex amplitude - only periodicity with T is required
Figure 29 Illustration of frequency comb (from Menlo Systems FC8004 manual)
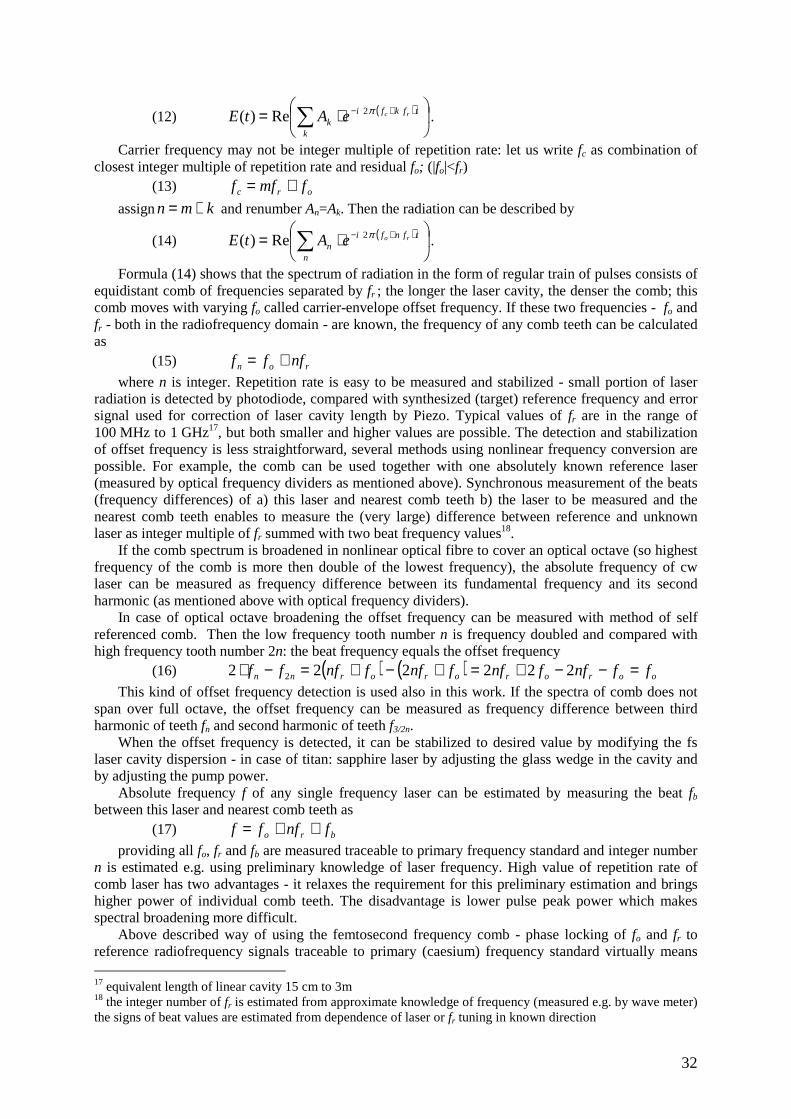
32
(12) ( )
⋅= ∑ +−
k
tfkfik
rceAtE 2 Re)( π .
Carrier frequency may not be integer multiple of repetition rate: let us write fc as combination of closest integer multiple of repetition rate and residual fo; (|fo|<fr)
(13) orc fmff +=
assign kmn += and renumber An=Ak. Then the radiation can be described by
(14) ( )
⋅= ∑ +−
n
tfnfin
roeAtE 2 Re)( π .
Formula (14) shows that the spectrum of radiation in the form of regular train of pulses consists of equidistant comb of frequencies separated by fr ; the longer the laser cavity, the denser the comb; this comb moves with varying fo called carrier-envelope offset frequency. If these two frequencies - fo and fr - both in the radiofrequency domain - are known, the frequency of any comb teeth can be calculated as
(15) ron nfff +=
where n is integer. Repetition rate is easy to be measured and stabilized - small portion of laser radiation is detected by photodiode, compared with synthesized (target) reference frequency and error signal used for correction of laser cavity length by Piezo. Typical values of fr are in the range of 100 MHz to 1 GHz17, but both smaller and higher values are possible. The detection and stabilization of offset frequency is less straightforward, several methods using nonlinear frequency conversion are possible. For example, the comb can be used together with one absolutely known reference laser (measured by optical frequency dividers as mentioned above). Synchronous measurement of the beats (frequency differences) of a) this laser and nearest comb teeth b) the laser to be measured and the nearest comb teeth enables to measure the (very large) difference between reference and unknown laser as integer multiple of fr summed with two beat frequency values18.
If the comb spectrum is broadened in nonlinear optical fibre to cover an optical octave (so highest frequency of the comb is more then double of the lowest frequency), the absolute frequency of cw laser can be measured as frequency difference between its fundamental frequency and its second harmonic (as mentioned above with optical frequency dividers).
In case of optical octave broadening the offset frequency can be measured with method of self referenced comb. Then the low frequency tooth number n is frequency doubled and compared with high frequency tooth number 2n: the beat frequency equals the offset frequency
(16) ( ) ( ) oorororornn ffnffnffnffnfff =−−+=+−+= −⋅ 222222 2
This kind of offset frequency detection is used also in this work. If the spectra of comb does not span over full octave, the offset frequency can be measured as frequency difference between third harmonic of teeth fn and second harmonic of teeth f3/2n.
When the offset frequency is detected, it can be stabilized to desired value by modifying the fs laser cavity dispersion - in case of titan: sapphire laser by adjusting the glass wedge in the cavity and by adjusting the pump power.
Absolute frequency f of any single frequency laser can be estimated by measuring the beat fb between this laser and nearest comb teeth as
(17) bro fnfff ++=
providing all fo, fr and fb are measured traceable to primary frequency standard and integer number n is estimated e.g. using preliminary knowledge of laser frequency. High value of repetition rate of comb laser has two advantages - it relaxes the requirement for this preliminary estimation and brings higher power of individual comb teeth. The disadvantage is lower pulse peak power which makes spectral broadening more difficult.
Above described way of using the femtosecond frequency comb - phase locking of fo and fr to reference radiofrequency signals traceable to primary (caesium) frequency standard virtually means 17 equivalent length of linear cavity 15 cm to 3m 18 the integer number of fr is estimated from approximate knowledge of frequency (measured e.g. by wave meter) the signs of beat values are estimated from dependence of laser or fr tuning in known direction
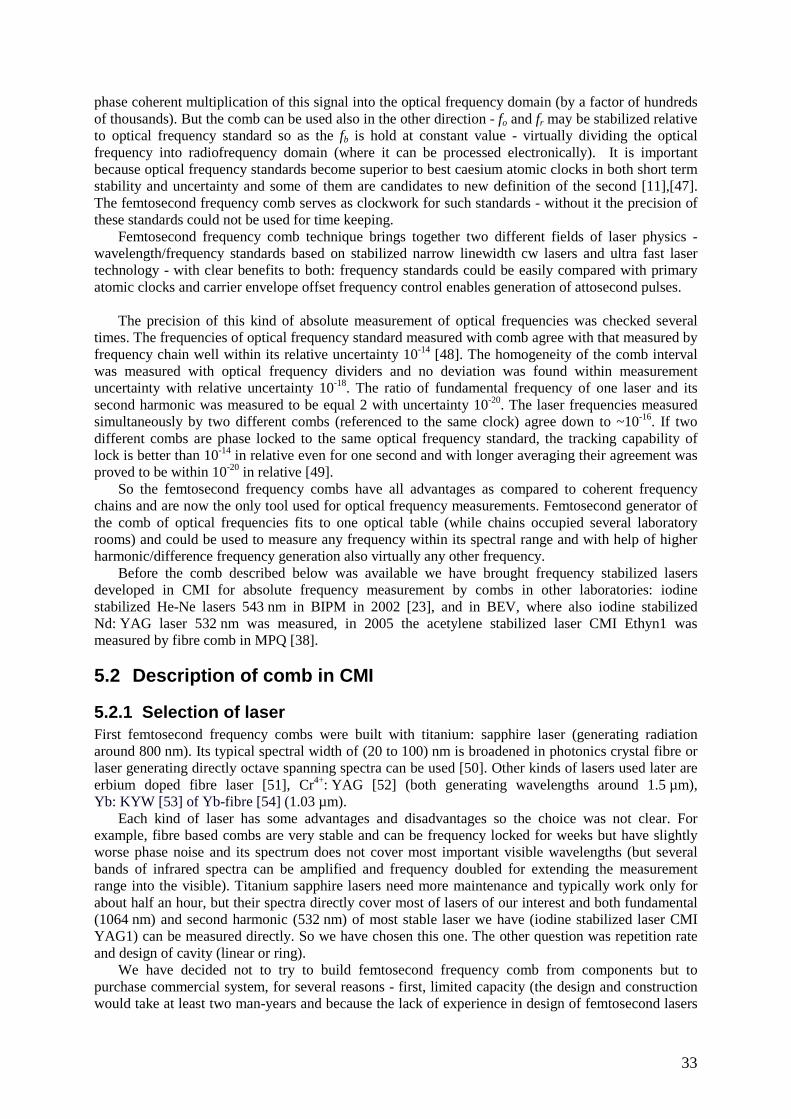
33
phase coherent multiplication of this signal into the optical frequency domain (by a factor of hundreds of thousands). But the comb can be used also in the other direction - fo and fr may be stabilized relative to optical frequency standard so as the fb is hold at constant value - virtually dividing the optical frequency into radiofrequency domain (where it can be processed electronically). It is important because optical frequency standards become superior to best caesium atomic clocks in both short term stability and uncertainty and some of them are candidates to new definition of the second [11],[47]. The femtosecond frequency comb serves as clockwork for such standards - without it the precision of these standards could not be used for time keeping.
Femtosecond frequency comb technique brings together two different fields of laser physics - wavelength/frequency standards based on stabilized narrow linewidth cw lasers and ultra fast laser technology - with clear benefits to both: frequency standards could be easily compared with primary atomic clocks and carrier envelope offset frequency control enables generation of attosecond pulses.
The precision of this kind of absolute measurement of optical frequencies was checked several
times. The frequencies of optical frequency standard measured with comb agree with that measured by frequency chain well within its relative uncertainty 10-14 [48]. The homogeneity of the comb interval was measured with optical frequency dividers and no deviation was found within measurement uncertainty with relative uncertainty 10-18. The ratio of fundamental frequency of one laser and its second harmonic was measured to be equal 2 with uncertainty 10-20. The laser frequencies measured simultaneously by two different combs (referenced to the same clock) agree down to ~10-16. If two different combs are phase locked to the same optical frequency standard, the tracking capability of lock is better than 10-14 in relative even for one second and with longer averaging their agreement was proved to be within 10-20 in relative [49].
So the femtosecond frequency combs have all advantages as compared to coherent frequency chains and are now the only tool used for optical frequency measurements. Femtosecond generator of the comb of optical frequencies fits to one optical table (while chains occupied several laboratory rooms) and could be used to measure any frequency within its spectral range and with help of higher harmonic/difference frequency generation also virtually any other frequency.
Before the comb described below was available we have brought frequency stabilized lasers developed in CMI for absolute frequency measurement by combs in other laboratories: iodine stabilized He-Ne lasers 543 nm in BIPM in 2002 [23], and in BEV, where also iodine stabilized Nd: YAG laser 532 nm was measured, in 2005 the acetylene stabilized laser CMI Ethyn1 was measured by fibre comb in MPQ [38].
5.2 Description of comb in CMI
5.2.1 Selection of laser First femtosecond frequency combs were built with titanium: sapphire laser (generating radiation around 800 nm). Its typical spectral width of (20 to 100) nm is broadened in photonics crystal fibre or laser generating directly octave spanning spectra can be used [50]. Other kinds of lasers used later are erbium doped fibre laser [51], Cr4+: YAG [52] (both generating wavelengths around 1.5 µm), Yb: KYW [53] of Yb-fibre [54] (1.03 µm).
Each kind of laser has some advantages and disadvantages so the choice was not clear. For example, fibre based combs are very stable and can be frequency locked for weeks but have slightly worse phase noise and its spectrum does not cover most important visible wavelengths (but several bands of infrared spectra can be amplified and frequency doubled for extending the measurement range into the visible). Titanium sapphire lasers need more maintenance and typically work only for about half an hour, but their spectra directly cover most of lasers of our interest and both fundamental (1064 nm) and second harmonic (532 nm) of most stable laser we have (iodine stabilized laser CMI YAG1) can be measured directly. So we have chosen this one. The other question was repetition rate and design of cavity (linear or ring).
We have decided not to try to build femtosecond frequency comb from components but to purchase commercial system, for several reasons - first, limited capacity (the design and construction would take at least two man-years and because the lack of experience in design of femtosecond lasers
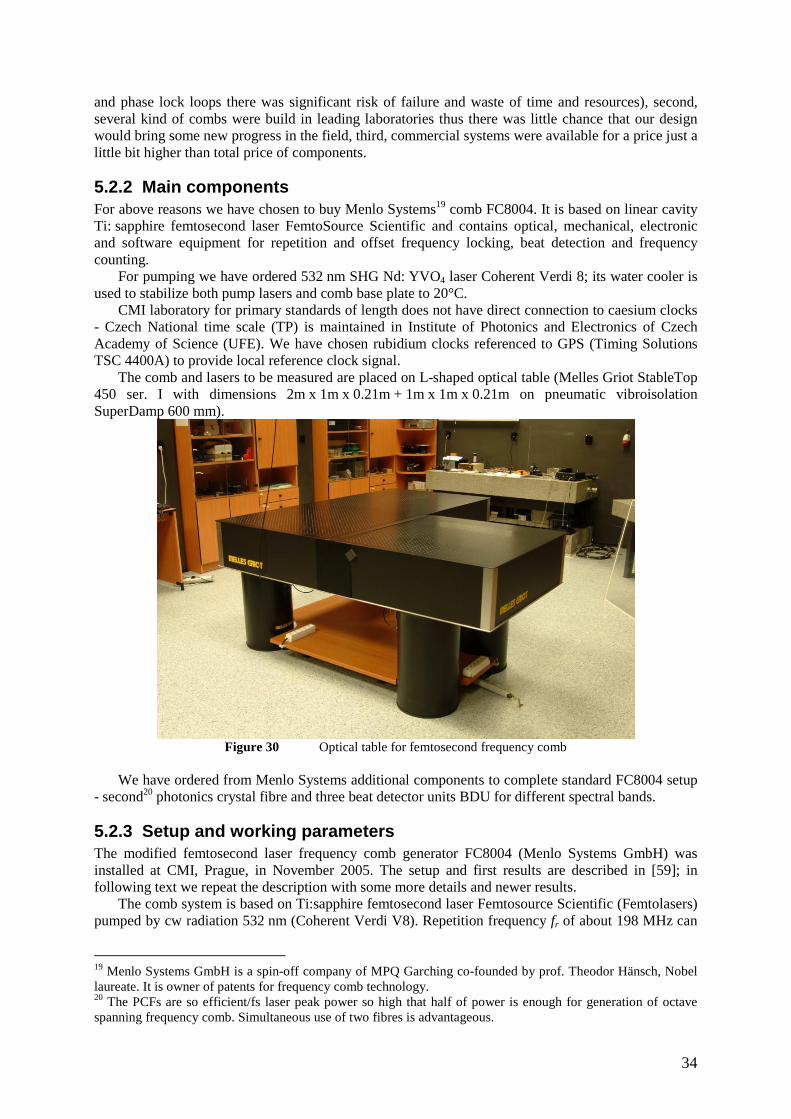
34
and phase lock loops there was significant risk of failure and waste of time and resources), second, several kind of combs were build in leading laboratories thus there was little chance that our design would bring some new progress in the field, third, commercial systems were available for a price just a little bit higher than total price of components.
5.2.2 Main components For above reasons we have chosen to buy Menlo Systems19 comb FC8004. It is based on linear cavity Ti: sapphire femtosecond laser FemtoSource Scientific and contains optical, mechanical, electronic and software equipment for repetition and offset frequency locking, beat detection and frequency counting.
For pumping we have ordered 532 nm SHG Nd: YVO4 laser Coherent Verdi 8; its water cooler is used to stabilize both pump lasers and comb base plate to 20°C.
CMI laboratory for primary standards of length does not have direct connection to caesium clocks - Czech National time scale (TP) is maintained in Institute of Photonics and Electronics of Czech Academy of Science (UFE). We have chosen rubidium clocks referenced to GPS (Timing Solutions TSC 4400A) to provide local reference clock signal.
The comb and lasers to be measured are placed on L-shaped optical table (Melles Griot StableTop 450 ser. I with dimensions 2m x 1m x 0.21m + 1m x 1m x 0.21m on pneumatic vibroisolation SuperDamp 600 mm).
Figure 30 Optical table for femtosecond frequency comb
We have ordered from Menlo Systems additional components to complete standard FC8004 setup
- second20 photonics crystal fibre and three beat detector units BDU for different spectral bands.
5.2.3 Setup and working parameters The modified femtosecond laser frequency comb generator FC8004 (Menlo Systems GmbH) was installed at CMI, Prague, in November 2005. The setup and first results are described in [59]; in following text we repeat the description with some more details and newer results.
The comb system is based on Ti:sapphire femtosecond laser Femtosource Scientific (Femtolasers) pumped by cw radiation 532 nm (Coherent Verdi V8). Repetition frequency fr of about 198 MHz can
19 Menlo Systems GmbH is a spin-off company of MPQ Garching co-founded by prof. Theodor Hänsch, Nobel laureate. It is owner of patents for frequency comb technology. 20 The PCFs are so efficient/fs laser peak power so high that half of power is enough for generation of octave spanning frequency comb. Simultaneous use of two fibres is advantageous.
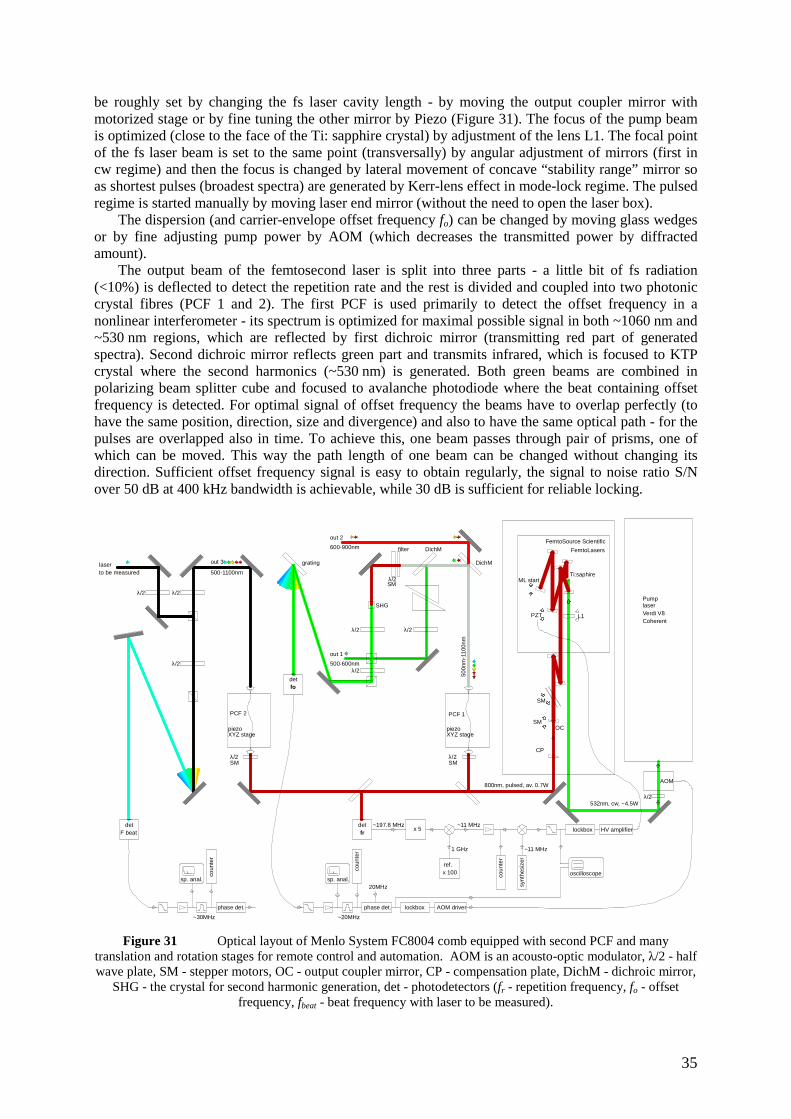
35
be roughly set by changing the fs laser cavity length - by moving the output coupler mirror with motorized stage or by fine tuning the other mirror by Piezo (Figure 31). The focus of the pump beam is optimized (close to the face of the Ti: sapphire crystal) by adjustment of the lens L1. The focal point of the fs laser beam is set to the same point (transversally) by angular adjustment of mirrors (first in cw regime) and then the focus is changed by lateral movement of concave “stability range” mirror so as shortest pulses (broadest spectra) are generated by Kerr-lens effect in mode-lock regime. The pulsed regime is started manually by moving laser end mirror (without the need to open the laser box).
The dispersion (and carrier-envelope offset frequency fo) can be changed by moving glass wedges or by fine adjusting pump power by AOM (which decreases the transmitted power by diffracted amount).
The output beam of the femtosecond laser is split into three parts - a little bit of fs radiation (<10%) is deflected to detect the repetition rate and the rest is divided and coupled into two photonic crystal fibres (PCF 1 and 2). The first PCF is used primarily to detect the offset frequency in a nonlinear interferometer - its spectrum is optimized for maximal possible signal in both ~1060 nm and ~530 nm regions, which are reflected by first dichroic mirror (transmitting red part of generated spectra). Second dichroic mirror reflects green part and transmits infrared, which is focused to KTP crystal where the second harmonics (~530 nm) is generated. Both green beams are combined in polarizing beam splitter cube and focused to avalanche photodiode where the beat containing offset frequency is detected. For optimal signal of offset frequency the beams have to overlap perfectly (to have the same position, direction, size and divergence) and also to have the same optical path - for the pulses are overlapped also in time. To achieve this, one beam passes through pair of prisms, one of which can be moved. This way the path length of one beam can be changed without changing its direction. Sufficient offset frequency signal is easy to obtain regularly, the signal to noise ratio S/N over 50 dB at 400 kHz bandwidth is achievable, while 30 dB is sufficient for reliable locking.
Pump
FemtoSource Scientific
FemtoLasers
CoherentVerdi V8laser
PZT L1
out 1
out 3laser
out 2
500-600nm
500-1100nmto be measured
det
det ~197.8 MHzx 5
ref.x 100 co
unte
r
500n
m-1
100n
m
coun
ter
coun
ter
synt
hesi
zer
1 GHz ~11 MHz
~11 MHzlockbox
lockboxphase det.phase det.
sp. anal. sp. anal.oscilloscope
~20MHz
20MHz
~30MHz
HV amplifier
AOM driver
det
fo
frF beat
600-900nm
ML start
DichMfilter
SM
SHG
grating
SMSM
DichM
Ti:saphire
SM
OC
532nm, cw, ~4.5W
800nm, pulsed, av. 0.7W
SMPCF 1PCF 2
piezopiezoXYZ stageXYZ stage
AOM
CPλ/2
λ/2
λ/2
λ/2λ/2
λ/2λ/2
λ/2λ/2
λ/2
Figure 31 Optical layout of Menlo System FC8004 comb equipped with second PCF and many
translation and rotation stages for remote control and automation. AOM is an acousto-optic modulator, λ/2 - half wave plate, SM - stepper motors, OC - output coupler mirror, CP - compensation plate, DichM - dichroic mirror,
SHG - the crystal for second harmonic generation, det - photodetectors (fr - repetition frequency, fo - offset frequency, fbeat - beat frequency with laser to be measured).
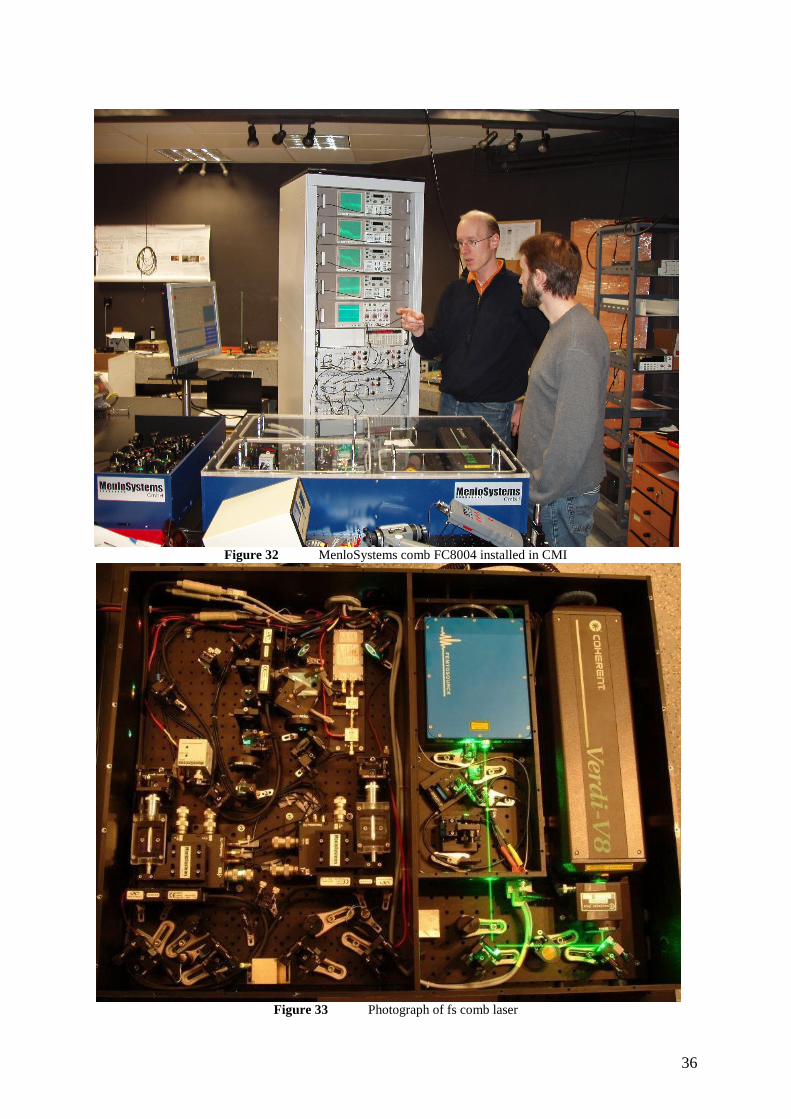
36
Figure 32 MenloSystems comb FC8004 installed in CMI
Figure 33 Photograph of fs comb laser
sshhoorraa
Pump laser 8W,
~4,4W
AOM (fine Fofs)
Femtosecond laser ~0,8W, 18fs
200MHz
Prism pair (rough Fofs), st. m.
Output coupler mirror (rough Frep, st.m.)
Dichroic mirror
SHG
Det Fofs
Det Frep
PCF PCF 2
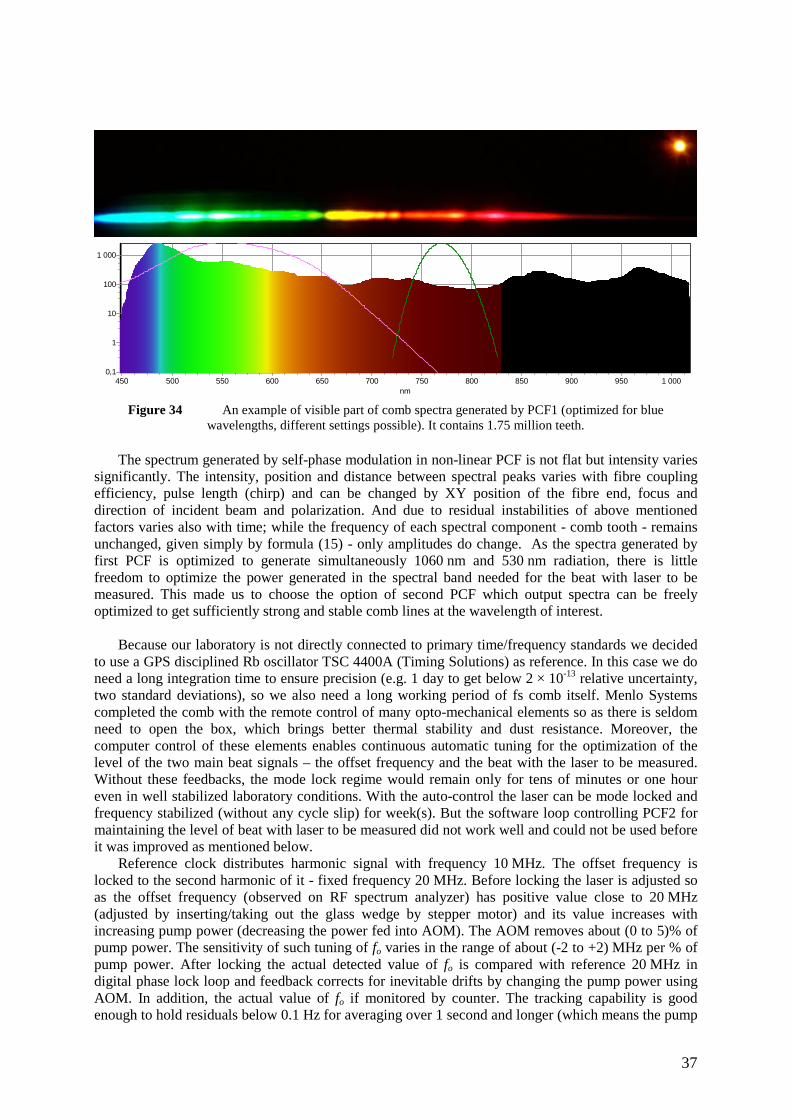
37
Figure 34 An example of visible part of comb spectra generated by PCF1 (optimized for blue
wavelengths, different settings possible). It contains 1.75 million teeth.
The spectrum generated by self-phase modulation in non-linear PCF is not flat but intensity varies significantly. The intensity, position and distance between spectral peaks varies with fibre coupling efficiency, pulse length (chirp) and can be changed by XY position of the fibre end, focus and direction of incident beam and polarization. And due to residual instabilities of above mentioned factors varies also with time; while the frequency of each spectral component - comb tooth - remains unchanged, given simply by formula (15) - only amplitudes do change. As the spectra generated by first PCF is optimized to generate simultaneously 1060 nm and 530 nm radiation, there is little freedom to optimize the power generated in the spectral band needed for the beat with laser to be measured. This made us to choose the option of second PCF which output spectra can be freely optimized to get sufficiently strong and stable comb lines at the wavelength of interest.
Because our laboratory is not directly connected to primary time/frequency standards we decided
to use a GPS disciplined Rb oscillator TSC 4400A (Timing Solutions) as reference. In this case we do need a long integration time to ensure precision (e.g. 1 day to get below 2 × 10-13 relative uncertainty, two standard deviations), so we also need a long working period of fs comb itself. Menlo Systems completed the comb with the remote control of many opto-mechanical elements so as there is seldom need to open the box, which brings better thermal stability and dust resistance. Moreover, the computer control of these elements enables continuous automatic tuning for the optimization of the level of the two main beat signals – the offset frequency and the beat with the laser to be measured. Without these feedbacks, the mode lock regime would remain only for tens of minutes or one hour even in well stabilized laboratory conditions. With the auto-control the laser can be mode locked and frequency stabilized (without any cycle slip) for week(s). But the software loop controlling PCF2 for maintaining the level of beat with laser to be measured did not work well and could not be used before it was improved as mentioned below.
Reference clock distributes harmonic signal with frequency 10 MHz. The offset frequency is locked to the second harmonic of it - fixed frequency 20 MHz. Before locking the laser is adjusted so as the offset frequency (observed on RF spectrum analyzer) has positive value close to 20 MHz (adjusted by inserting/taking out the glass wedge by stepper motor) and its value increases with increasing pump power (decreasing the power fed into AOM). The AOM removes about (0 to 5)% of pump power. The sensitivity of such tuning of fo varies in the range of about (-2 to +2) MHz per % of pump power. After locking the actual detected value of fo is compared with reference 20 MHz in digital phase lock loop and feedback corrects for inevitable drifts by changing the pump power using AOM. In addition, the actual value of fo if monitored by counter. The tracking capability is good enough to hold residuals below 0.1 Hz for averaging over 1 second and longer (which means the pump
nm1 000950900850800750700650600550500450
0,1
1
10
100
1 000
38
power is adjusted with relative precision 5×10⁻¹⁰). If the AOM driver gets close to any of its limits, the auto-control software initiates coarse dispersion adjustment - moves the glass wedge so as the AOM driver works again in the vicinity of the centre of its range.
The repetition rate is stabilized to value in the range (196.3 to 197.8) MHz by another phase lock loop. For increasing resolution, the fifth harmonic of detected repetition rate is first subtracted from 1 GHz (100th harmonic of 10 MHz reference) in mixer and then compared with synthesized value. The counter measures that difference frequency frc with values (11..18) MHz (schematic in bottom of Figure 31) with resolution 1 mHz for 1 second gate time, i.e. 1×10-12 in relative (only), the tracking capability of phase lock loop is a little bit better (as described in section 5.5). The repetition rate is calculated from counter value frc as
(18) ( ) 5/1 rcr fGHzf −=
The repetition and the offset frequency adjustments are not independent - for free running laser any change of one frequency induces the change of the other; but when the comb is stabilized, the coarse change of repetition rate by stepper motor does not prevent maintaining the offset frequency by AOM at precise value and vice versa - the movement of wedge by stepper motor changes the optical length of the laser, but it is automatically corrected by moving the mirror by Piezo.
The detailed description of the comb system and its components can be found in manufacturer manual [55]. Its use for measurement of optical frequencies within quality system of CMI is described in written procedure [56].
Working parameters of the comb system pump power 4.4 W pulse length (without compression) 18 fs pulse train average power in ML regime 0.7 W peak power 2×10⁵ W repetition frequency 197.8 MHz average intensity in fibre 2×10¹¹W/m2 peak intensity in fibre 6×10¹⁶W/m2 first PCF input/output power 350/125 mW comb spectra from <500 nm to >1100 nm average power in comb tooth 50 nW fo S/N @400kHz bw >50dB beat S/N with 35µW He-Ne 633nm 30dB continuous measurement time >24h tracking stability to RF signal @1s fr (198 MHz) 0.001Hz 1×10-12rel. fo (20 MHz) 0.1Hz 5×10⁻⁹rel.
The comb system worked very reliably since its installation. Even the very next day after moving the parts to the laboratory it was possible to perform first absolute frequency measurement of iodine stabilized He-Ne laser 633 nm. When measuring low power iodine stabilized He-Ne lasers 633 (frequency modulated), only 35µW were delivered to beat detection unit and mixed with a comb produced by the second PCF. Good care has to be taken when aligning beams and maximizing comb power at the desired wavelength. The possibility of freely optimizing input polarization and input coupling into the second photonic crystal fiber (PCF) greatly aids in obtaining a sufficiently large beat S/N ratio.
During six months the only adjustments needed were fs laser power tweaking by pump beam direction adjustment. Later the power of laser decreased and it started to be difficult to get sufficient signal for offset frequency detection and locking. This was improved by cleaning the fs laser mirror on Piezo, which slowly gains contamination probably by attracting it due to high voltage. Later again the comb laser had to be re-adjusted completely by iterations of output coupler - end mirror, pump focus - crystal position - stability range. PCF had to be replaced three times; first PCF1 was replaced within warranty period and after two years another PCF was purchased from Menlo Systems. In 2009 new PCF was purchased from Crystal Fibre - FemtoWhite 800. Both types of PCF are joined to standard
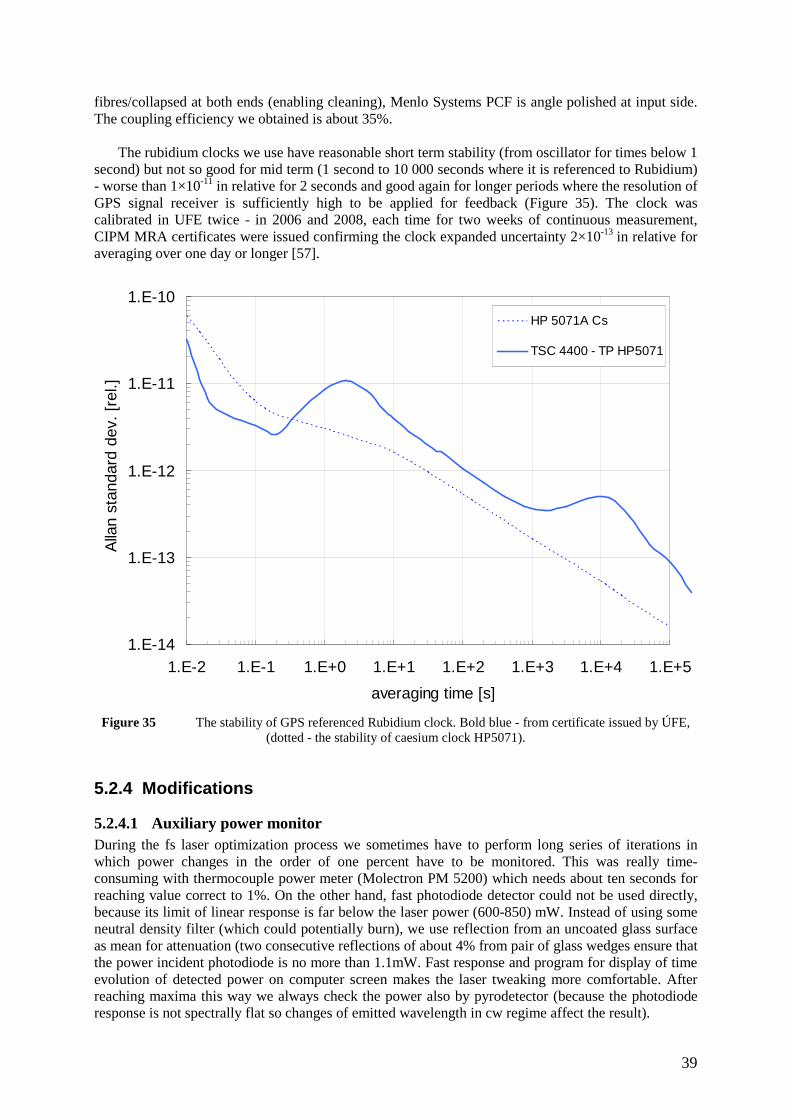
39
fibres/collapsed at both ends (enabling cleaning), Menlo Systems PCF is angle polished at input side. The coupling efficiency we obtained is about 35%.
The rubidium clocks we use have reasonable short term stability (from oscillator for times below 1
second) but not so good for mid term (1 second to 10 000 seconds where it is referenced to Rubidium) - worse than 1×10-11 in relative for 2 seconds and good again for longer periods where the resolution of GPS signal receiver is sufficiently high to be applied for feedback (Figure 35). The clock was calibrated in UFE twice - in 2006 and 2008, each time for two weeks of continuous measurement, CIPM MRA certificates were issued confirming the clock expanded uncertainty 2×10-13 in relative for averaging over one day or longer [57].
1.E-14
1.E-13
1.E-12
1.E-11
1.E-10
1.E-2 1.E-1 1.E+0 1.E+1 1.E+2 1.E+3 1.E+4 1.E+5
averaging time [s]
Alla
n st
anda
rd d
ev.
[rel
.]
HP 5071A Cs
TSC 4400 - TP HP5071
Figure 35 The stability of GPS referenced Rubidium clock. Bold blue - from certificate issued by ÚFE,
(dotted - the stability of caesium clock HP5071).
5.2.4 Modifications
5.2.4.1 Auxiliary power monitor During the fs laser optimization process we sometimes have to perform long series of iterations in which power changes in the order of one percent have to be monitored. This was really time-consuming with thermocouple power meter (Molectron PM 5200) which needs about ten seconds for reaching value correct to 1%. On the other hand, fast photodiode detector could not be used directly, because its limit of linear response is far below the laser power (600-850) mW. Instead of using some neutral density filter (which could potentially burn), we use reflection from an uncoated glass surface as mean for attenuation (two consecutive reflections of about 4% from pair of glass wedges ensure that the power incident photodiode is no more than 1.1mW. Fast response and program for display of time evolution of detected power on computer screen makes the laser tweaking more comfortable. After reaching maxima this way we always check the power also by pyrodetector (because the photodiode response is not spectrally flat so changes of emitted wavelength in cw regime affect the result).
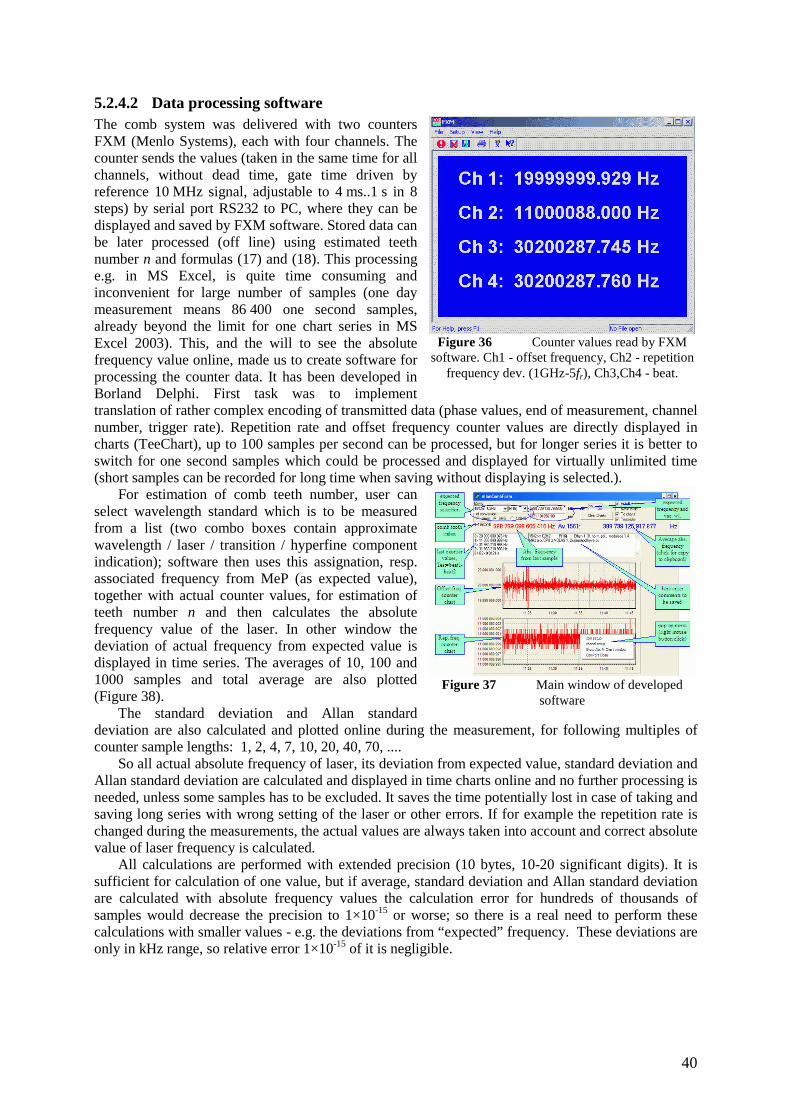
40
5.2.4.2 Data processing software The comb system was delivered with two counters FXM (Menlo Systems), each with four channels. The counter sends the values (taken in the same time for all channels, without dead time, gate time driven by reference 10 MHz signal, adjustable to 4 ms..1 s in 8 steps) by serial port RS232 to PC, where they can be displayed and saved by FXM software. Stored data can be later processed (off line) using estimated teeth number n and formulas (17) and (18). This processing e.g. in MS Excel, is quite time consuming and inconvenient for large number of samples (one day measurement means 86 400 one second samples, already beyond the limit for one chart series in MS Excel 2003). This, and the will to see the absolute frequency value online, made us to create software for processing the counter data. It has been developed in Borland Delphi. First task was to implement translation of rather complex encoding of transmitted data (phase values, end of measurement, channel number, trigger rate). Repetition rate and offset frequency counter values are directly displayed in charts (TeeChart), up to 100 samples per second can be processed, but for longer series it is better to switch for one second samples which could be processed and displayed for virtually unlimited time (short samples can be recorded for long time when saving without displaying is selected.).
For estimation of comb teeth number, user can select wavelength standard which is to be measured from a list (two combo boxes contain approximate wavelength / laser / transition / hyperfine component indication); software then uses this assignation, resp. associated frequency from MeP (as expected value), together with actual counter values, for estimation of teeth number n and then calculates the absolute frequency value of the laser. In other window the deviation of actual frequency from expected value is displayed in time series. The averages of 10, 100 and 1000 samples and total average are also plotted (Figure 38).
The standard deviation and Allan standard deviation are also calculated and plotted online during the measurement, for following multiples of counter sample lengths: 1, 2, 4, 7, 10, 20, 40, 70, ....
So all actual absolute frequency of laser, its deviation from expected value, standard deviation and Allan standard deviation are calculated and displayed in time charts online and no further processing is needed, unless some samples has to be excluded. It saves the time potentially lost in case of taking and saving long series with wrong setting of the laser or other errors. If for example the repetition rate is changed during the measurements, the actual values are always taken into account and correct absolute value of laser frequency is calculated.
All calculations are performed with extended precision (10 bytes, 10-20 significant digits). It is sufficient for calculation of one value, but if average, standard deviation and Allan standard deviation are calculated with absolute frequency values the calculation error for hundreds of thousands of samples would decrease the precision to 1×10-15 or worse; so there is a real need to perform these calculations with smaller values - e.g. the deviations from “expected” frequency. These deviations are only in kHz range, so relative error 1×10-15 of it is negligible.
Figure 36 Counter values read by FXM
software. Ch1 - offset frequency, Ch2 - repetition frequency dev. (1GHz-5fr), Ch3,Ch4 - beat.
Figure 37 Main window of developed
software
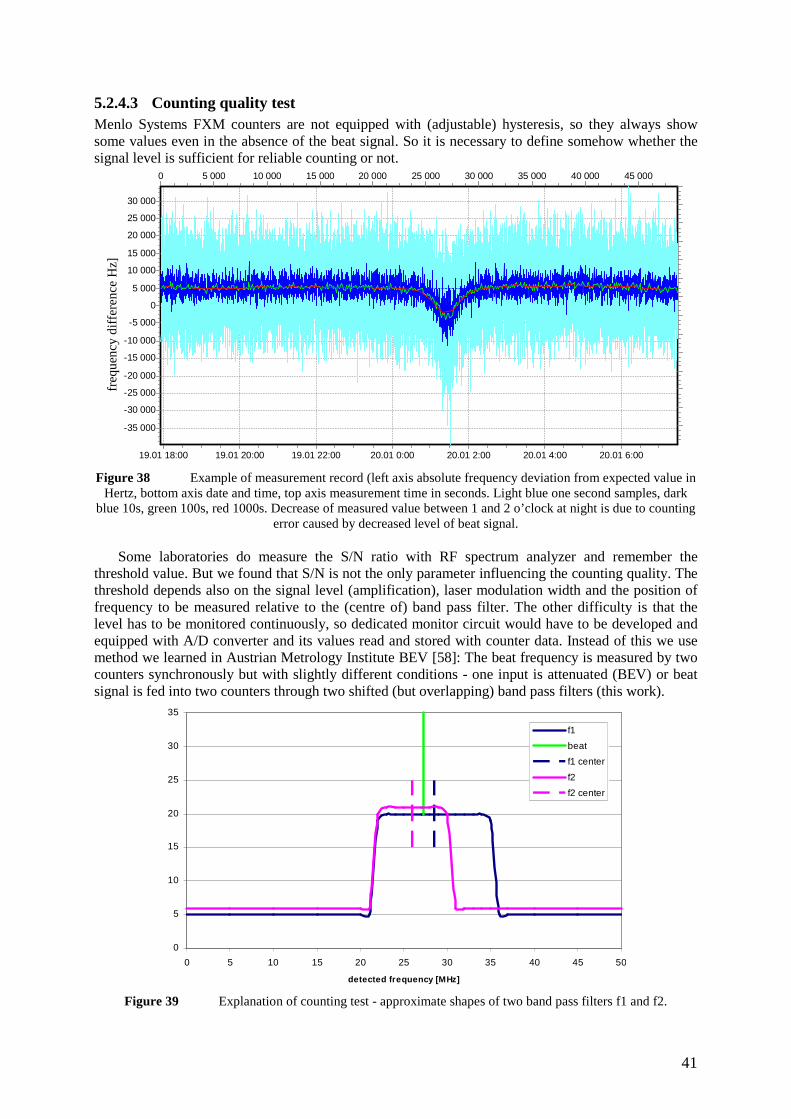
41
5.2.4.3 Counting quality test Menlo Systems FXM counters are not equipped with (adjustable) hysteresis, so they always show some values even in the absence of the beat signal. So it is necessary to define somehow whether the signal level is sufficient for reliable counting or not.
20.01 6:0020.01 4:0020.01 2:0020.01 0:0019.01 22:0019.01 20:0019.01 18:00
45 00040 00035 00030 00025 00020 00015 00010 0005 0000
30 000
25 000
20 000
15 000
10 000
5 000
0
-5 000
-10 000
-15 000
-20 000
-25 000
-30 000
-35 000
Figure 38 Example of measurement record (left axis absolute frequency deviation from expected value in
Hertz, bottom axis date and time, top axis measurement time in seconds. Light blue one second samples, dark blue 10s, green 100s, red 1000s. Decrease of measured value between 1 and 2 o’clock at night is due to counting
error caused by decreased level of beat signal.
Some laboratories do measure the S/N ratio with RF spectrum analyzer and remember the threshold value. But we found that S/N is not the only parameter influencing the counting quality. The threshold depends also on the signal level (amplification), laser modulation width and the position of frequency to be measured relative to the (centre of) band pass filter. The other difficulty is that the level has to be monitored continuously, so dedicated monitor circuit would have to be developed and equipped with A/D converter and its values read and stored with counter data. Instead of this we use method we learned in Austrian Metrology Institute BEV [58]: The beat frequency is measured by two counters synchronously but with slightly different conditions - one input is attenuated (BEV) or beat signal is fed into two counters through two shifted (but overlapping) band pass filters (this work).
0
5
10
15
20
25
30
35
0 5 10 15 20 25 30 35 40 45 50
detected frequency [MHz]
f1
beat
f1 center
f2
f2 center
Figure 39 Explanation of counting test - approximate shapes of two band pass filters f1 and f2.
freq
uen
cy d
iffer
ence
Hz]
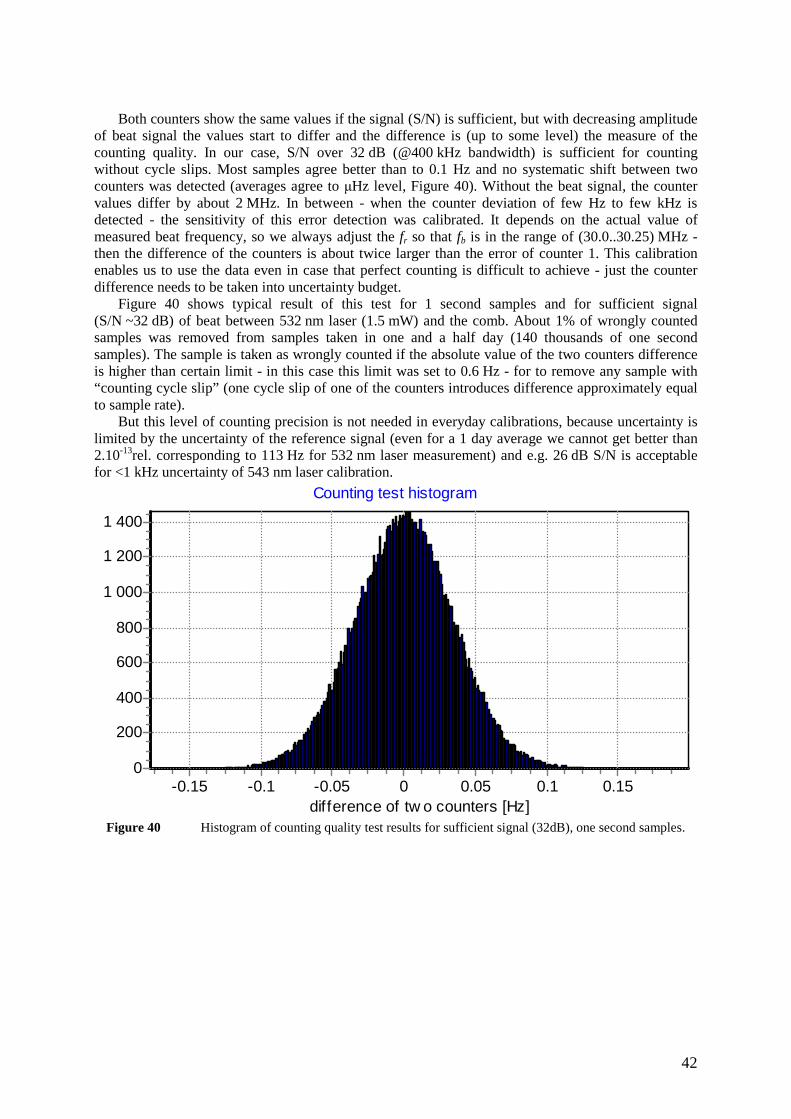
42
Both counters show the same values if the signal (S/N) is sufficient, but with decreasing amplitude
of beat signal the values start to differ and the difference is (up to some level) the measure of the counting quality. In our case, S/N over 32 dB (@400 kHz bandwidth) is sufficient for counting without cycle slips. Most samples agree better than to 0.1 Hz and no systematic shift between two counters was detected (averages agree to µHz level, Figure 40). Without the beat signal, the counter values differ by about 2 MHz. In between - when the counter deviation of few Hz to few kHz is detected - the sensitivity of this error detection was calibrated. It depends on the actual value of measured beat frequency, so we always adjust the fr so that fb is in the range of (30.0..30.25) MHz - then the difference of the counters is about twice larger than the error of counter 1. This calibration enables us to use the data even in case that perfect counting is difficult to achieve - just the counter difference needs to be taken into uncertainty budget.
Figure 40 shows typical result of this test for 1 second samples and for sufficient signal (S/N ~32 dB) of beat between 532 nm laser (1.5 mW) and the comb. About 1% of wrongly counted samples was removed from samples taken in one and a half day (140 thousands of one second samples). The sample is taken as wrongly counted if the absolute value of the two counters difference is higher than certain limit - in this case this limit was set to 0.6 Hz - for to remove any sample with “counting cycle slip” (one cycle slip of one of the counters introduces difference approximately equal to sample rate).
But this level of counting precision is not needed in everyday calibrations, because uncertainty is limited by the uncertainty of the reference signal (even for a 1 day average we cannot get better than 2.10-13rel. corresponding to 113 Hz for 532 nm laser measurement) and e.g. 26 dB S/N is acceptable for <1 kHz uncertainty of 543 nm laser calibration.
Counting test histogram
difference of tw o counters [Hz]0.150.10.050-0.05-0.1-0.15
1 400
1 200
1 000
800
600
400
200
0
Figure 40 Histogram of counting quality test results for sufficient signal (32dB), one second samples.
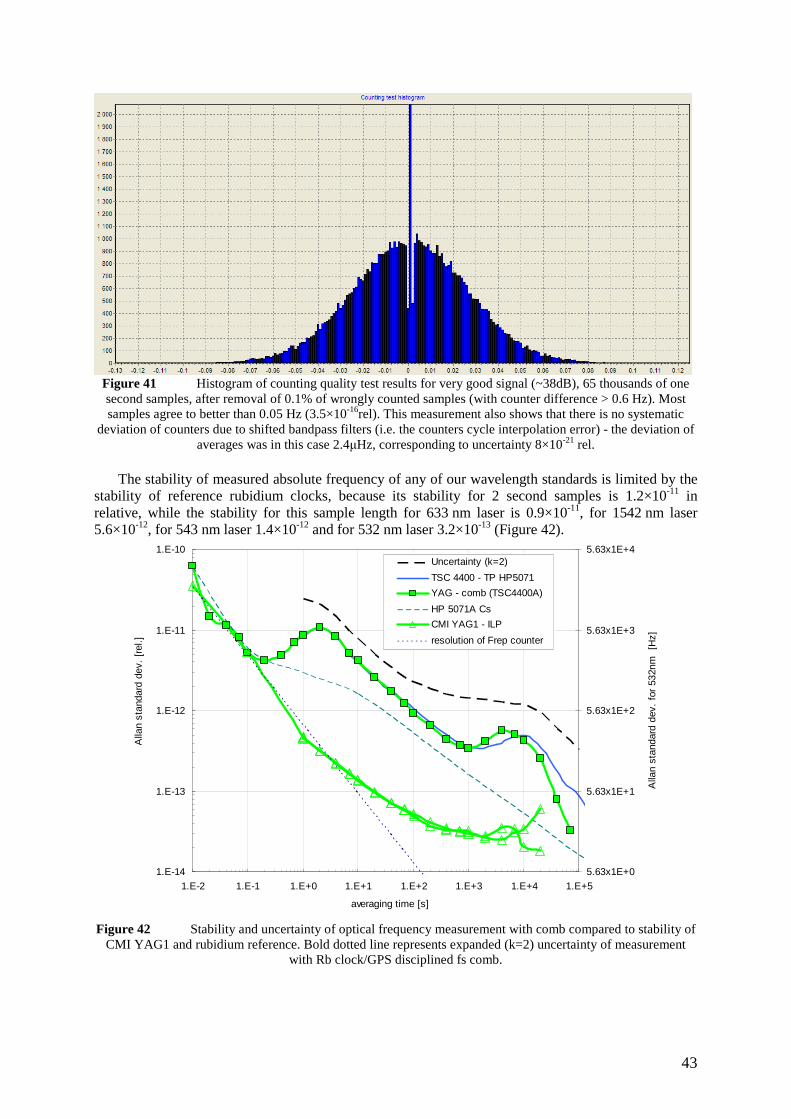
43
Figure 41 Histogram of counting quality test results for very good signal (~38dB), 65 thousands of one second samples, after removal of 0.1% of wrongly counted samples (with counter difference > 0.6 Hz). Most samples agree to better than 0.05 Hz (3.5×10⁻¹⁶rel). This measurement also shows that there is no systematic
deviation of counters due to shifted bandpass filters (i.e. the counters cycle interpolation error) - the deviation of averages was in this case 2.4µHz, corresponding to uncertainty 8×10-21 rel.
The stability of measured absolute frequency of any of our wavelength standards is limited by the
stability of reference rubidium clocks, because its stability for 2 second samples is 1.2×10⁻¹¹ in relative, while the stability for this sample length for 633 nm laser is 0.9×10⁻¹¹, for 1542 nm laser 5.6×10⁻¹², for 543 nm laser 1.4×10⁻¹² and for 532 nm laser 3.2×10⁻¹³ (Figure 42).
1.E-14
1.E-13
1.E-12
1.E-11
1.E-10
1.E-2 1.E-1 1.E+0 1.E+1 1.E+2 1.E+3 1.E+4 1.E+5
averaging time [s]
Alla
n st
anda
rd d
ev.
[rel
.]
5.63x1E+0
5.63x1E+1
5.63x1E+2
5.63x1E+3
5.63x1E+4
Alla
n st
anda
rd d
ev.
for
532n
m
[Hz]
Uncertainty (k=2)
TSC 4400 - TP HP5071
YAG - comb (TSC4400A)
HP 5071A Cs
CMI YAG1 - ILP
resolution of Frep counter
Figure 42 Stability and uncertainty of optical frequency measurement with comb compared to stability of
CMI YAG1 and rubidium reference. Bold dotted line represents expanded (k=2) uncertainty of measurement with Rb clock/GPS disciplined fs comb.
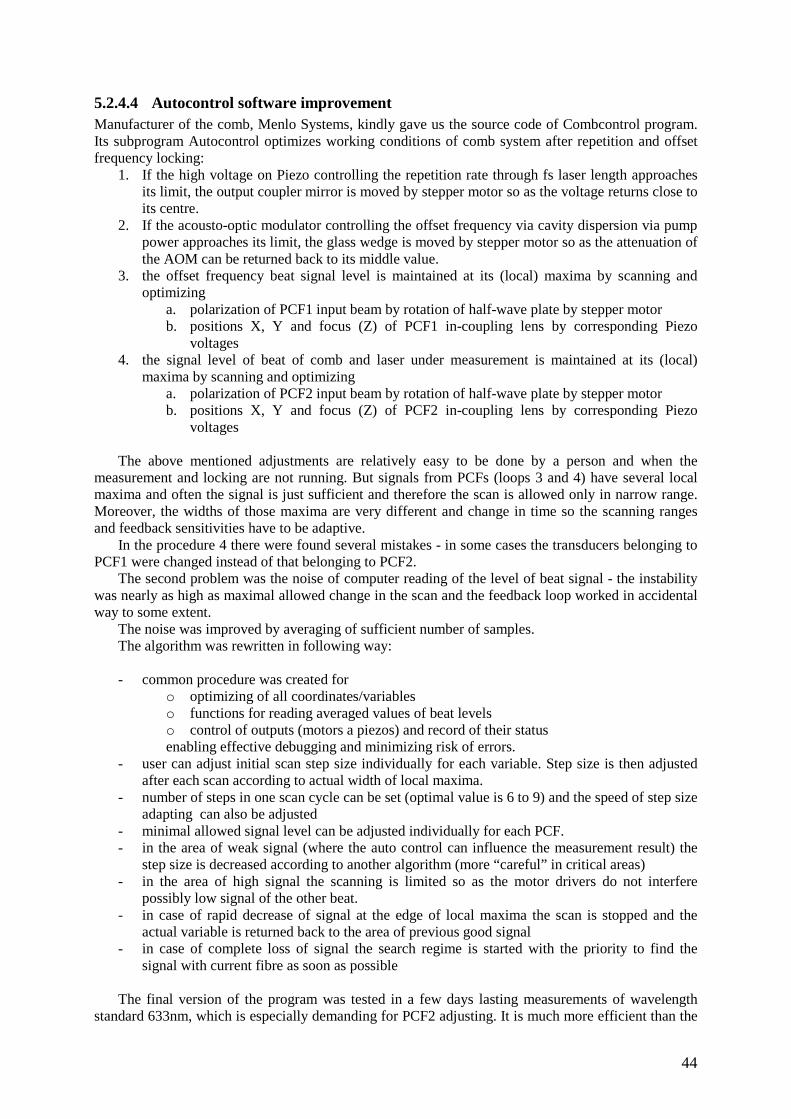
44
5.2.4.4 Autocontrol software improvement Manufacturer of the comb, Menlo Systems, kindly gave us the source code of Combcontrol program. Its subprogram Autocontrol optimizes working conditions of comb system after repetition and offset frequency locking:
1. If the high voltage on Piezo controlling the repetition rate through fs laser length approaches its limit, the output coupler mirror is moved by stepper motor so as the voltage returns close to its centre.
2. If the acousto-optic modulator controlling the offset frequency via cavity dispersion via pump power approaches its limit, the glass wedge is moved by stepper motor so as the attenuation of the AOM can be returned back to its middle value.
3. the offset frequency beat signal level is maintained at its (local) maxima by scanning and optimizing
a. polarization of PCF1 input beam by rotation of half-wave plate by stepper motor b. positions X, Y and focus (Z) of PCF1 in-coupling lens by corresponding Piezo
voltages 4. the signal level of beat of comb and laser under measurement is maintained at its (local)
maxima by scanning and optimizing a. polarization of PCF2 input beam by rotation of half-wave plate by stepper motor b. positions X, Y and focus (Z) of PCF2 in-coupling lens by corresponding Piezo
voltages
The above mentioned adjustments are relatively easy to be done by a person and when the measurement and locking are not running. But signals from PCFs (loops 3 and 4) have several local maxima and often the signal is just sufficient and therefore the scan is allowed only in narrow range. Moreover, the widths of those maxima are very different and change in time so the scanning ranges and feedback sensitivities have to be adaptive.
In the procedure 4 there were found several mistakes - in some cases the transducers belonging to PCF1 were changed instead of that belonging to PCF2.
The second problem was the noise of computer reading of the level of beat signal - the instability was nearly as high as maximal allowed change in the scan and the feedback loop worked in accidental way to some extent.
The noise was improved by averaging of sufficient number of samples. The algorithm was rewritten in following way:
- common procedure was created for
o optimizing of all coordinates/variables o functions for reading averaged values of beat levels o control of outputs (motors a piezos) and record of their status enabling effective debugging and minimizing risk of errors.
- user can adjust initial scan step size individually for each variable. Step size is then adjusted after each scan according to actual width of local maxima.
- number of steps in one scan cycle can be set (optimal value is 6 to 9) and the speed of step size adapting can also be adjusted
- minimal allowed signal level can be adjusted individually for each PCF. - in the area of weak signal (where the auto control can influence the measurement result) the
step size is decreased according to another algorithm (more “careful” in critical areas) - in the area of high signal the scanning is limited so as the motor drivers do not interfere
possibly low signal of the other beat. - in case of rapid decrease of signal at the edge of local maxima the scan is stopped and the
actual variable is returned back to the area of previous good signal - in case of complete loss of signal the search regime is started with the priority to find the
signal with current fibre as soon as possible
The final version of the program was tested in a few days lasting measurements of wavelength standard 633nm, which is especially demanding for PCF2 adjusting. It is much more efficient than the
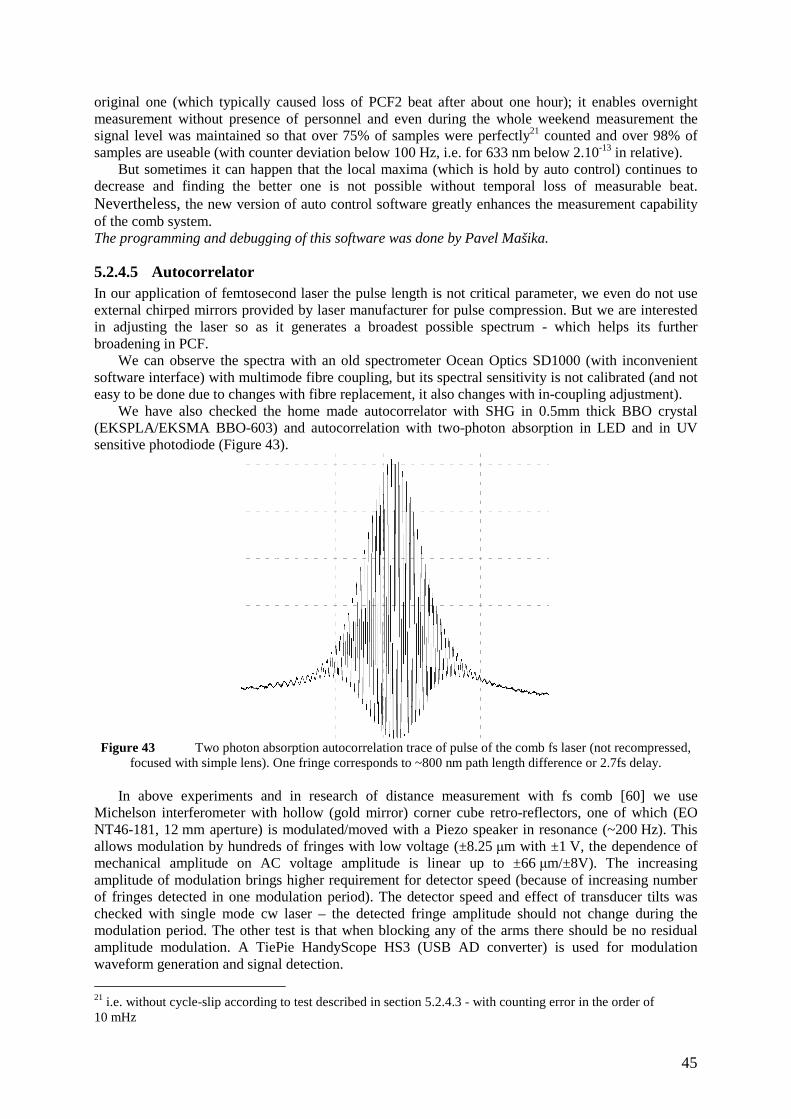
45
original one (which typically caused loss of PCF2 beat after about one hour); it enables overnight measurement without presence of personnel and even during the whole weekend measurement the signal level was maintained so that over 75% of samples were perfectly21 counted and over 98% of samples are useable (with counter deviation below 100 Hz, i.e. for 633 nm below 2.10-13 in relative).
But sometimes it can happen that the local maxima (which is hold by auto control) continues to decrease and finding the better one is not possible without temporal loss of measurable beat. Nevertheless, the new version of auto control software greatly enhances the measurement capability of the comb system. The programming and debugging of this software was done by Pavel Mašika.
5.2.4.5 Autocorrelator In our application of femtosecond laser the pulse length is not critical parameter, we even do not use external chirped mirrors provided by laser manufacturer for pulse compression. But we are interested in adjusting the laser so as it generates a broadest possible spectrum - which helps its further broadening in PCF.
We can observe the spectra with an old spectrometer Ocean Optics SD1000 (with inconvenient software interface) with multimode fibre coupling, but its spectral sensitivity is not calibrated (and not easy to be done due to changes with fibre replacement, it also changes with in-coupling adjustment).
We have also checked the home made autocorrelator with SHG in 0.5mm thick BBO crystal (EKSPLA/EKSMA BBO-603) and autocorrelation with two-photon absorption in LED and in UV sensitive photodiode (Figure 43).
Figure 43 Two photon absorption autocorrelation trace of pulse of the comb fs laser (not recompressed,
focused with simple lens). One fringe corresponds to ~800 nm path length difference or 2.7fs delay.
In above experiments and in research of distance measurement with fs comb [60] we use Michelson interferometer with hollow (gold mirror) corner cube retro-reflectors, one of which (EO NT46-181, 12 mm aperture) is modulated/moved with a Piezo speaker in resonance (~200 Hz). This allows modulation by hundreds of fringes with low voltage (±8.25 µm with ±1 V, the dependence of mechanical amplitude on AC voltage amplitude is linear up to ±66 µm/±8V). The increasing amplitude of modulation brings higher requirement for detector speed (because of increasing number of fringes detected in one modulation period). The detector speed and effect of transducer tilts was checked with single mode cw laser – the detected fringe amplitude should not change during the modulation period. The other test is that when blocking any of the arms there should be no residual amplitude modulation. A TiePie HandyScope HS3 (USB AD converter) is used for modulation waveform generation and signal detection.
21 i.e. without cycle-slip according to test described in section 5.2.4.3 - with counting error in the order of 10 mHz
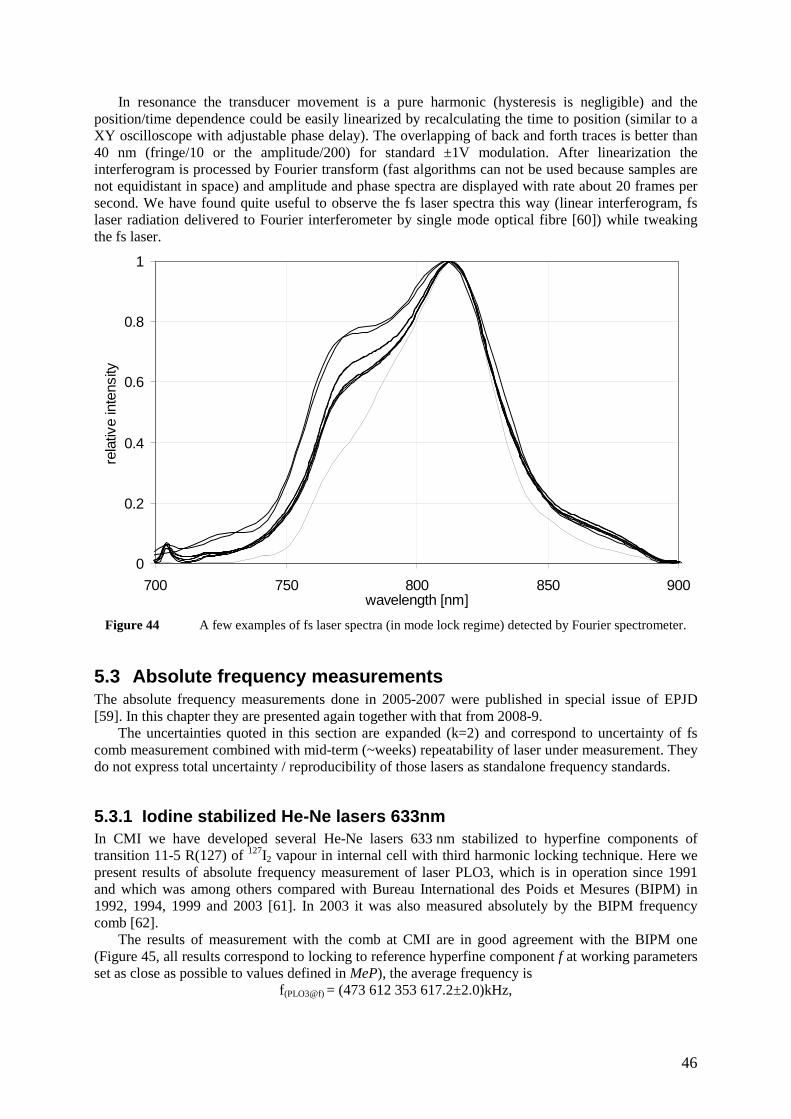
46
In resonance the transducer movement is a pure harmonic (hysteresis is negligible) and the position/time dependence could be easily linearized by recalculating the time to position (similar to a XY oscilloscope with adjustable phase delay). The overlapping of back and forth traces is better than 40 nm (fringe/10 or the amplitude/200) for standard ±1V modulation. After linearization the interferogram is processed by Fourier transform (fast algorithms can not be used because samples are not equidistant in space) and amplitude and phase spectra are displayed with rate about 20 frames per second. We have found quite useful to observe the fs laser spectra this way (linear interferogram, fs laser radiation delivered to Fourier interferometer by single mode optical fibre [60]) while tweaking the fs laser.
0
0.2
0.4
0.6
0.8
1
700 750 800 850 900wavelength [nm]
rela
tive
inte
nsity
Figure 44 A few examples of fs laser spectra (in mode lock regime) detected by Fourier spectrometer.
5.3 Absolute frequency measurements The absolute frequency measurements done in 2005-2007 were published in special issue of EPJD [59]. In this chapter they are presented again together with that from 2008-9.
The uncertainties quoted in this section are expanded (k=2) and correspond to uncertainty of fs comb measurement combined with mid-term (~weeks) repeatability of laser under measurement. They do not express total uncertainty / reproducibility of those lasers as standalone frequency standards.
5.3.1 Iodine stabilized He-Ne lasers 633nm In CMI we have developed several He-Ne lasers 633 nm stabilized to hyperfine components of transition 11-5 R(127) of 127I2 vapour in internal cell with third harmonic locking technique. Here we present results of absolute frequency measurement of laser PLO3, which is in operation since 1991 and which was among others compared with Bureau International des Poids et Mesures (BIPM) in 1992, 1994, 1999 and 2003 [61]. In 2003 it was also measured absolutely by the BIPM frequency comb [62].
The results of measurement with the comb at CMI are in good agreement with the BIPM one (Figure 45, all results correspond to locking to reference hyperfine component f at working parameters set as close as possible to values defined in MeP), the average frequency is
f(PLO3@f) = (473 612 353 617.2±2.0)kHz,
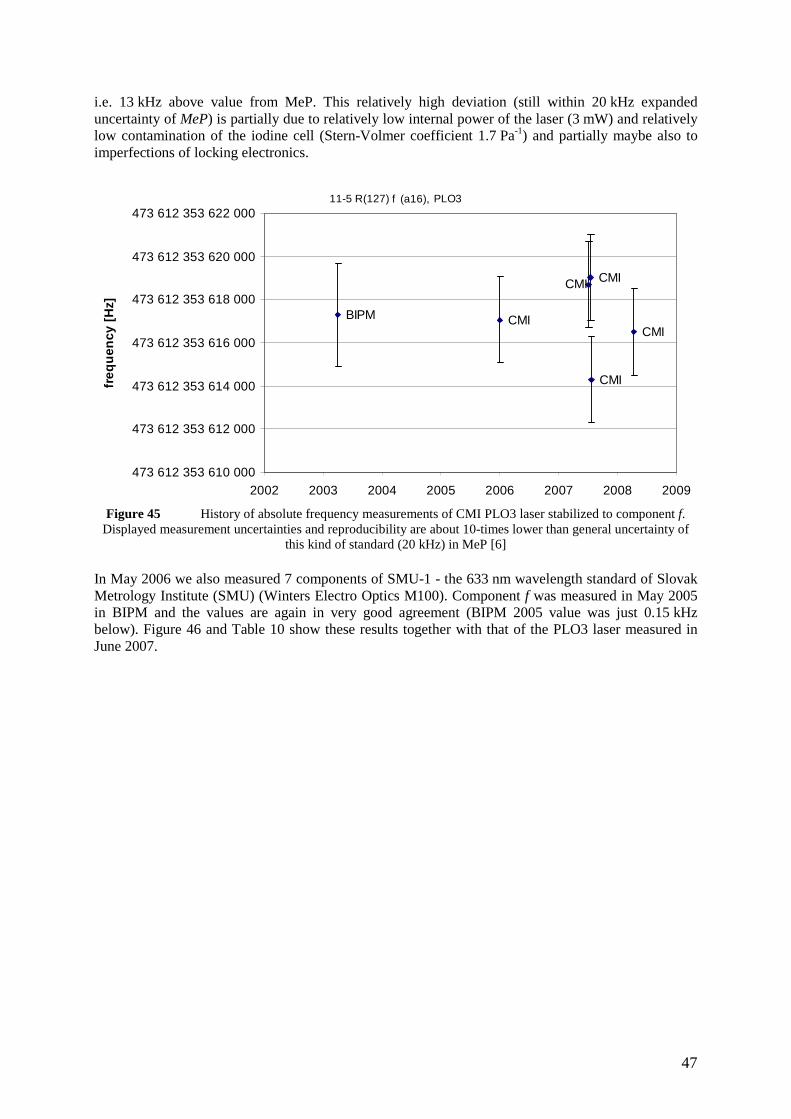
47
i.e. 13 kHz above value from MeP. This relatively high deviation (still within 20 kHz expanded uncertainty of MeP) is partially due to relatively low internal power of the laser (3 mW) and relatively low contamination of the iodine cell (Stern-Volmer coefficient 1.7 Pa-1) and partially maybe also to imperfections of locking electronics.
11-5 R(127) f (a16), PLO3
CMI
CMI
BIPM CMI
CMI CMI
473 612 353 610 000
473 612 353 612 000
473 612 353 614 000
473 612 353 616 000
473 612 353 618 000
473 612 353 620 000
473 612 353 622 000
2002 2003 2004 2005 2006 2007 2008 2009
freq
uen
cy [
Hz]
Figure 45 History of absolute frequency measurements of CMI PLO3 laser stabilized to component f. Displayed measurement uncertainties and reproducibility are about 10-times lower than general uncertainty of
this kind of standard (20 kHz) in MeP [6]
In May 2006 we also measured 7 components of SMU-1 - the 633 nm wavelength standard of Slovak Metrology Institute (SMU) (Winters Electro Optics M100). Component f was measured in May 2005 in BIPM and the values are again in very good agreement (BIPM 2005 value was just 0.15 kHz below). Figure 46 and Table 10 show these results together with that of the PLO3 laser measured in June 2007.
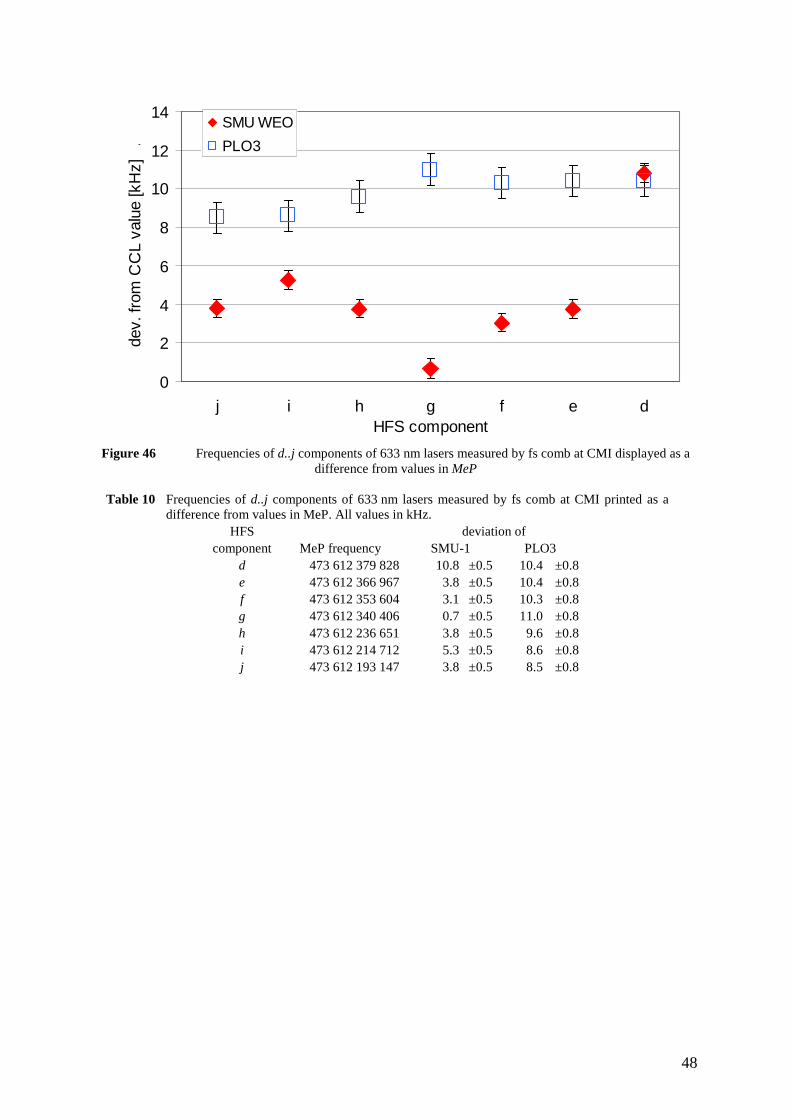
48
0
2
4
6
8
10
12
14
defghijHFS component
dev.
from
CC
L va
lue
[kH
z]
.SMU WEO
PLO3
Figure 46 Frequencies of d..j components of 633 nm lasers measured by fs comb at CMI displayed as a
difference from values in MeP
Table 10 Frequencies of d..j components of 633 nm lasers measured by fs comb at CMI printed as a difference from values in MeP. All values in kHz.
HFS deviation of component MeP frequency SMU-1 PLO3
d 473 612 379 828 10.8 ±0.5 10.4 ±0.8 e 473 612 366 967 3.8 ±0.5 10.4 ±0.8 f 473 612 353 604 3.1 ±0.5 10.3 ±0.8 g 473 612 340 406 0.7 ±0.5 11.0 ±0.8 h 473 612 236 651 3.8 ±0.5 9.6 ±0.8 i 473 612 214 712 5.3 ±0.5 8.6 ±0.8 j 473 612 193 147 3.8 ±0.5 8.5 ±0.8
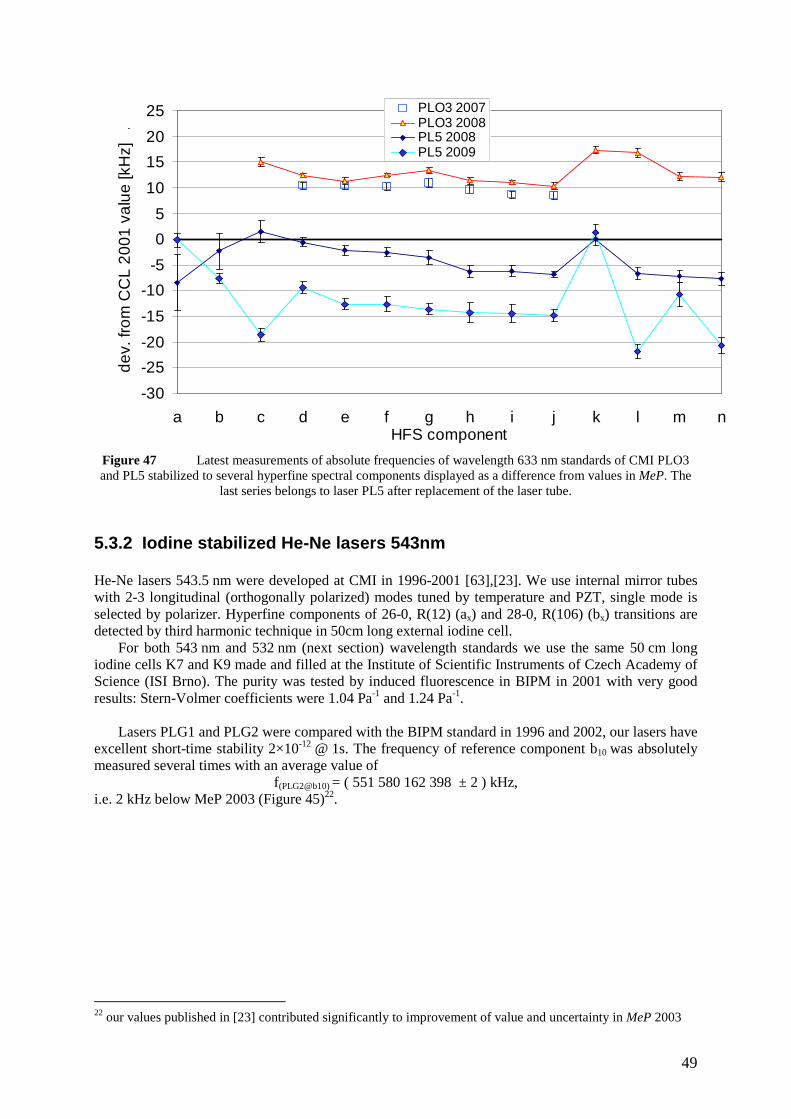
49
-30
-25
-20
-15
-10
-5
0
5
10
15
20
25
a b c d e f g h i j k l m nHFS component
de
v. fr
om
CC
L 2
001
va
lue
[kH
z]
.PLO3 2007PLO3 2008PL5 2008PL5 2009
Figure 47 Latest measurements of absolute frequencies of wavelength 633 nm standards of CMI PLO3 and PL5 stabilized to several hyperfine spectral components displayed as a difference from values in MeP. The
last series belongs to laser PL5 after replacement of the laser tube.
5.3.2 Iodine stabilized He-Ne lasers 543nm He-Ne lasers 543.5 nm were developed at CMI in 1996-2001 [63],[23]. We use internal mirror tubes with 2-3 longitudinal (orthogonally polarized) modes tuned by temperature and PZT, single mode is selected by polarizer. Hyperfine components of 26-0, R(12) (ax) and 28-0, R(106) (bx) transitions are detected by third harmonic technique in 50cm long external iodine cell.
For both 543 nm and 532 nm (next section) wavelength standards we use the same 50 cm long iodine cells K7 and K9 made and filled at the Institute of Scientific Instruments of Czech Academy of Science (ISI Brno). The purity was tested by induced fluorescence in BIPM in 2001 with very good results: Stern-Volmer coefficients were 1.04 Pa-1 and 1.24 Pa-1.
Lasers PLG1 and PLG2 were compared with the BIPM standard in 1996 and 2002, our lasers have
excellent short-time stability 2×10-12 @ 1s. The frequency of reference component b10 was absolutely measured several times with an average value of
f(PLG2@b10) = ( 551 580 162 398 ± 2 ) kHz, i.e. 2 kHz below MeP 2003 (Figure 45)22.
22 our values published in [23] contributed significantly to improvement of value and uncertainty in MeP 2003
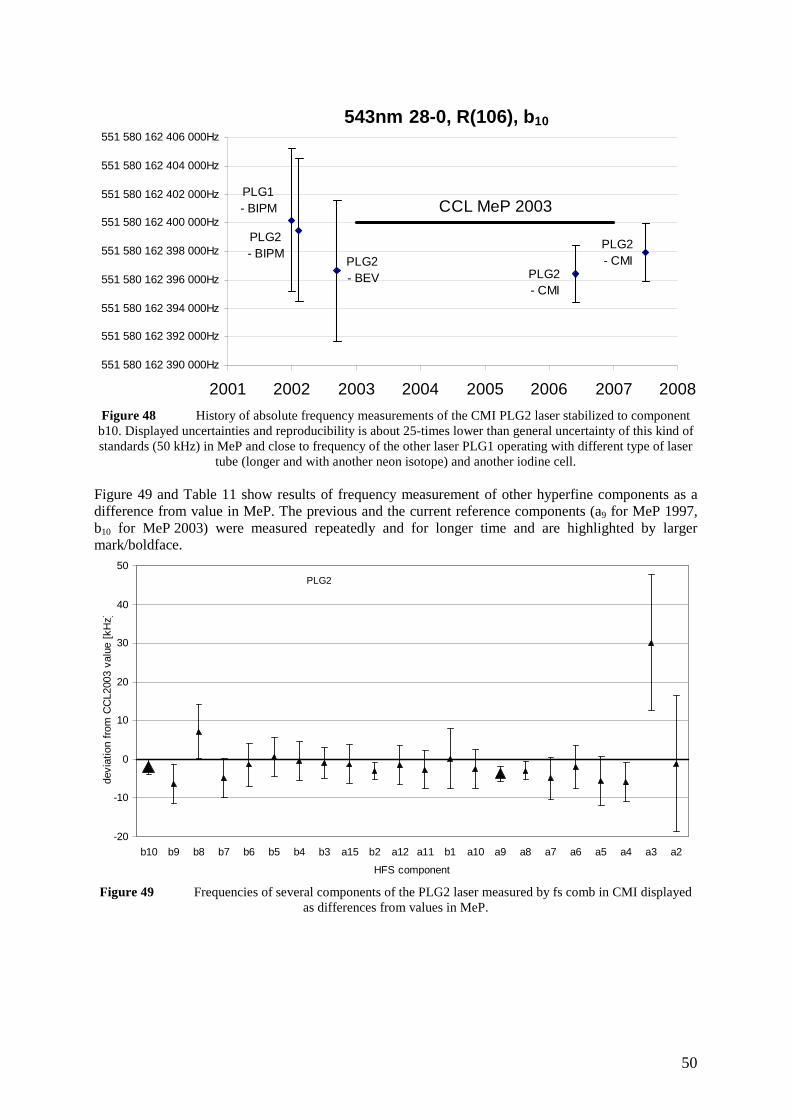
50
543nm 28-0, R(106), b10
PLG2 - CMI
PLG1 - BIPM
PLG2 - BIPM
PLG2 - BEV PLG2
- CMI
CCL MeP 2003
551 580 162 390 000Hz
551 580 162 392 000Hz
551 580 162 394 000Hz
551 580 162 396 000Hz
551 580 162 398 000Hz
551 580 162 400 000Hz
551 580 162 402 000Hz
551 580 162 404 000Hz
551 580 162 406 000Hz
2001 2002 2003 2004 2005 2006 2007 2008
Figure 48 History of absolute frequency measurements of the CMI PLG2 laser stabilized to component b10. Displayed uncertainties and reproducibility is about 25-times lower than general uncertainty of this kind of standards (50 kHz) in MeP and close to frequency of the other laser PLG1 operating with different type of laser
tube (longer and with another neon isotope) and another iodine cell. Figure 49 and Table 11 show results of frequency measurement of other hyperfine components as a difference from value in MeP. The previous and the current reference components (a9 for MeP 1997, b10 for MeP 2003) were measured repeatedly and for longer time and are highlighted by larger mark/boldface.
PLG2
-20
-10
0
10
20
30
40
50
b10 b9 b8 b7 b6 b5 b4 b3 a15 b2 a12 a11 b1 a10 a9 a8 a7 a6 a5 a4 a3 a2
HFS component
devi
atio
n fr
om C
CL2
003
valu
e [k
Hz]
Figure 49 Frequencies of several components of the PLG2 laser measured by fs comb in CMI displayed
as differences from values in MeP.
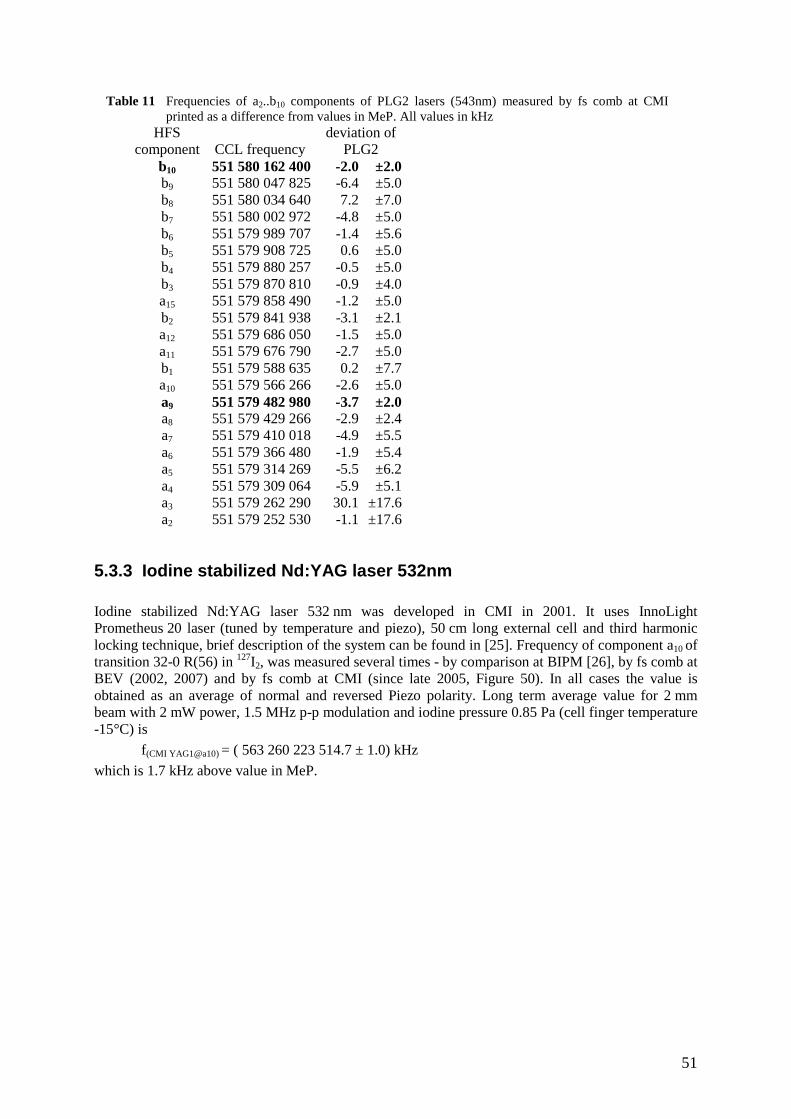
51
Table 11 Frequencies of a2..b10 components of PLG2 lasers (543nm) measured by fs comb at CMI printed as a difference from values in MeP. All values in kHz
HFS deviation of component CCL frequency PLG2
b10 551 580 162 400 -2.0 ±2.0 b9 551 580 047 825 -6.4 ±5.0 b8 551 580 034 640 7.2 ±7.0 b7 551 580 002 972 -4.8 ±5.0 b6 551 579 989 707 -1.4 ±5.6 b5 551 579 908 725 0.6 ±5.0 b4 551 579 880 257 -0.5 ±5.0 b3 551 579 870 810 -0.9 ±4.0 a15 551 579 858 490 -1.2 ±5.0 b2 551 579 841 938 -3.1 ±2.1 a12 551 579 686 050 -1.5 ±5.0 a11 551 579 676 790 -2.7 ±5.0 b1 551 579 588 635 0.2 ±7.7 a10 551 579 566 266 -2.6 ±5.0 a9 551 579 482 980 -3.7 ±2.0 a8 551 579 429 266 -2.9 ±2.4 a7 551 579 410 018 -4.9 ±5.5 a6 551 579 366 480 -1.9 ±5.4 a5 551 579 314 269 -5.5 ±6.2 a4 551 579 309 064 -5.9 ±5.1 a3 551 579 262 290 30.1 ±17.6 a2 551 579 252 530 -1.1 ±17.6
5.3.3 Iodine stabilized Nd:YAG laser 532nm Iodine stabilized Nd:YAG laser 532 nm was developed in CMI in 2001. It uses InnoLight Prometheus 20 laser (tuned by temperature and piezo), 50 cm long external cell and third harmonic locking technique, brief description of the system can be found in [25]. Frequency of component a10 of transition 32-0 R(56) in 127I2, was measured several times - by comparison at BIPM [26], by fs comb at BEV (2002, 2007) and by fs comb at CMI (since late 2005, Figure 50). In all cases the value is obtained as an average of normal and reversed Piezo polarity. Long term average value for 2 mm beam with 2 mW power, 1.5 MHz p-p modulation and iodine pressure 0.85 Pa (cell finger temperature -15°C) is
f(CMI YAG1@a10) = ( 563 260 223 514.7 ± 1.0) kHz
which is 1.7 kHz above value in MeP.
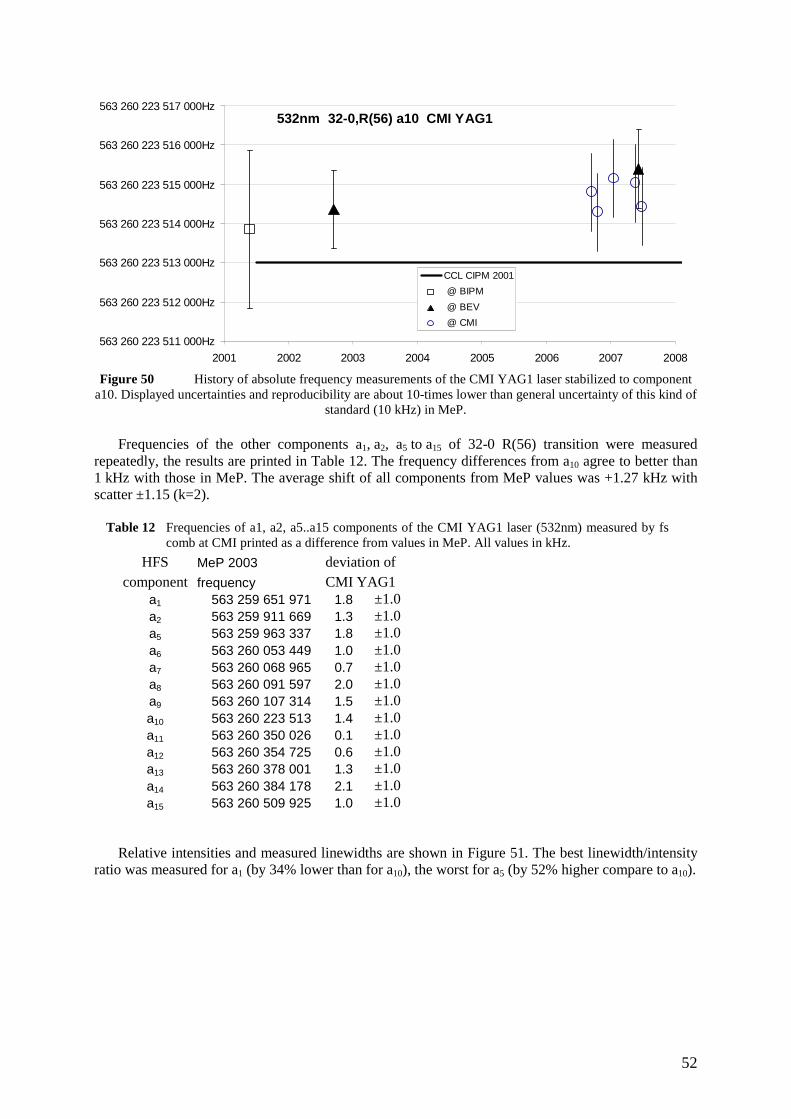
52
532nm 32-0,R(56) a10 CMI YAG1
563 260 223 511 000Hz
563 260 223 512 000Hz
563 260 223 513 000Hz
563 260 223 514 000Hz
563 260 223 515 000Hz
563 260 223 516 000Hz
563 260 223 517 000Hz
2001 2002 2003 2004 2005 2006 2007 2008
CCL CIPM 2001
@ BIPM
@ BEV
@ CMI
Figure 50 History of absolute frequency measurements of the CMI YAG1 laser stabilized to component
a10. Displayed uncertainties and reproducibility are about 10-times lower than general uncertainty of this kind of standard (10 kHz) in MeP.
Frequencies of the other components a1, a2, a5 to a15 of 32-0 R(56) transition were measured
repeatedly, the results are printed in Table 12. The frequency differences from a10 agree to better than 1 kHz with those in MeP. The average shift of all components from MeP values was +1.27 kHz with scatter ±1.15 (k=2).
Table 12 Frequencies of a1, a2, a5..a15 components of the CMI YAG1 laser (532nm) measured by fs comb at CMI printed as a difference from values in MeP. All values in kHz.
HFS MeP 2003 deviation of component frequency CMI YAG1
a1 563 259 651 971 1.8 ±1.0 a2 563 259 911 669 1.3 ±1.0 a5 563 259 963 337 1.8 ±1.0 a6 563 260 053 449 1.0 ±1.0 a7 563 260 068 965 0.7 ±1.0 a8 563 260 091 597 2.0 ±1.0 a9 563 260 107 314 1.5 ±1.0 a10 563 260 223 513 1.4 ±1.0 a11 563 260 350 026 0.1 ±1.0 a12 563 260 354 725 0.6 ±1.0 a13 563 260 378 001 1.3 ±1.0 a14 563 260 384 178 2.1 ±1.0 a15 563 260 509 925 1.0 ±1.0
Relative intensities and measured linewidths are shown in Figure 51. The best linewidth/intensity ratio was measured for a1 (by 34% lower than for a10), the worst for a5 (by 52% higher compare to a10).
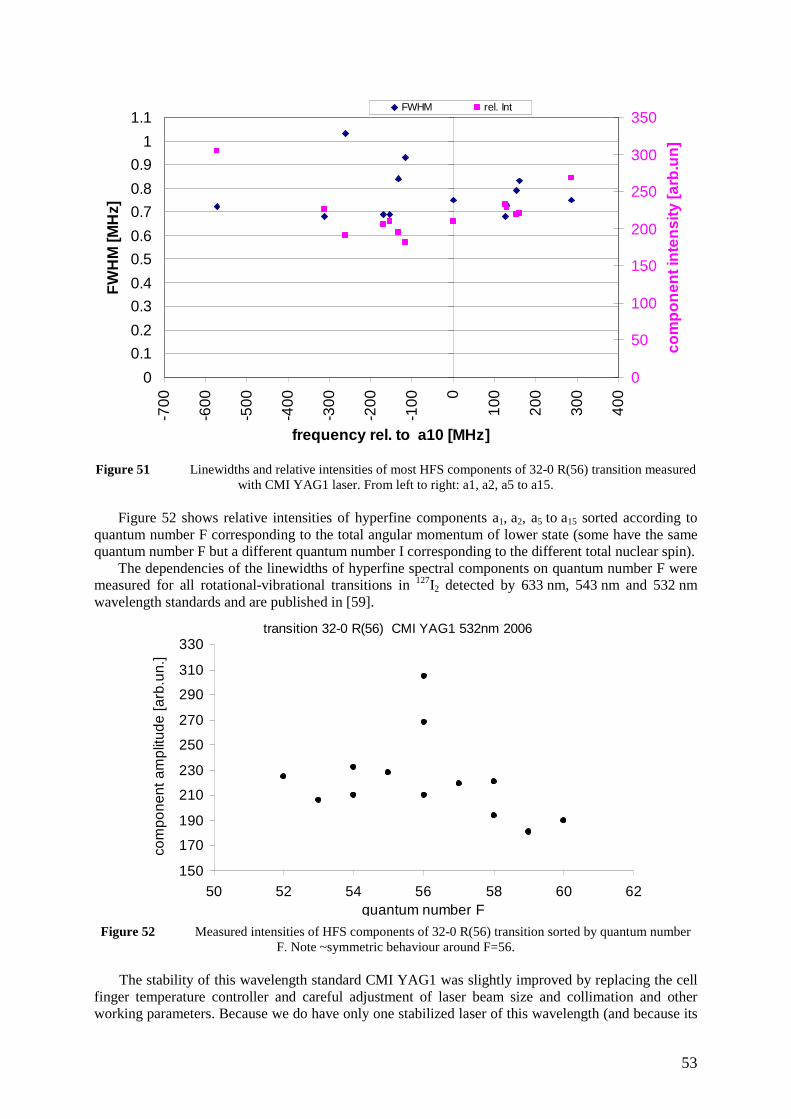
53
0
0.1
0.2
0.3
0.4
0.5
0.6
0.7
0.8
0.9
1
1.1
-700
-600
-500
-400
-300
-200
-100 0
100
200
300
400
frequency rel. to a10 [MHz]
FW
HM
[MH
z]
0
50
100
150
200
250
300
350
com
po
nen
t in
ten
sity
[arb
.un
]
FWHM rel. Int
Figure 51 Linewidths and relative intensities of most HFS components of 32-0 R(56) transition measured
with CMI YAG1 laser. From left to right: a1, a2, a5 to a15.
Figure 52 shows relative intensities of hyperfine components a1, a2, a5 to a15 sorted according to quantum number F corresponding to the total angular momentum of lower state (some have the same quantum number F but a different quantum number I corresponding to the different total nuclear spin).
The dependencies of the linewidths of hyperfine spectral components on quantum number F were measured for all rotational-vibrational transitions in 127I2 detected by 633 nm, 543 nm and 532 nm wavelength standards and are published in [59].
transition 32-0 R(56) CMI YAG1 532nm 2006
150
170
190
210
230
250
270
290
310
330
50 52 54 56 58 60 62quantum number F
com
pone
nt a
mp
litud
e [a
rb.u
n.]
Figure 52 Measured intensities of HFS components of 32-0 R(56) transition sorted by quantum number
F. Note ~symmetric behaviour around F=56. The stability of this wavelength standard CMI YAG1 was slightly improved by replacing the cell
finger temperature controller and careful adjustment of laser beam size and collimation and other working parameters. Because we do have only one stabilized laser of this wavelength (and because its
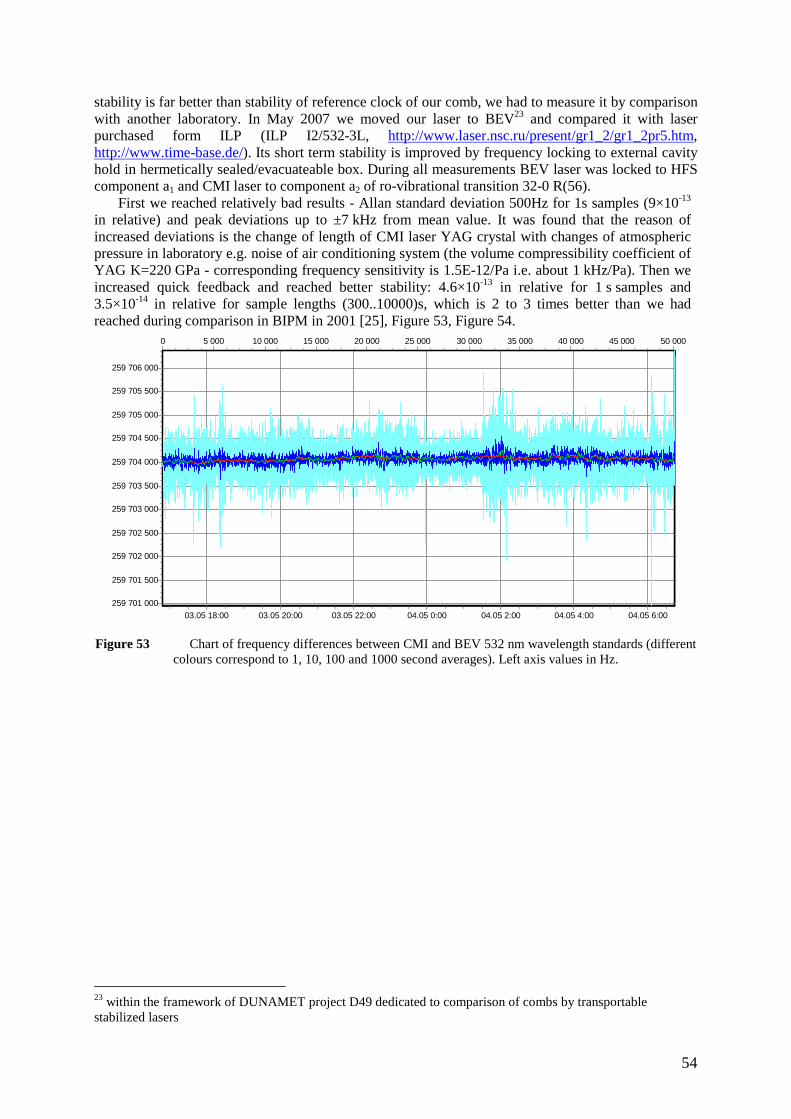
54
stability is far better than stability of reference clock of our comb, we had to measure it by comparison with another laboratory. In May 2007 we moved our laser to BEV23 and compared it with laser purchased form ILP (ILP I2/532-3L, http://www.laser.nsc.ru/present/gr1_2/gr1_2pr5.htm, http://www.time-base.de/). Its short term stability is improved by frequency locking to external cavity hold in hermetically sealed/evacuateable box. During all measurements BEV laser was locked to HFS component a1 and CMI laser to component a2 of ro-vibrational transition 32-0 R(56).
First we reached relatively bad results - Allan standard deviation 500Hz for 1s samples (9×10-13 in relative) and peak deviations up to ±7 kHz from mean value. It was found that the reason of increased deviations is the change of length of CMI laser YAG crystal with changes of atmospheric pressure in laboratory e.g. noise of air conditioning system (the volume compressibility coefficient of YAG K=220 GPa - corresponding frequency sensitivity is 1.5E-12/Pa i.e. about 1 kHz/Pa). Then we increased quick feedback and reached better stability: 4.6×10⁻¹³ in relative for 1 s samples and 3.5×10⁻¹⁴ in relative for sample lengths (300..10000)s, which is 2 to 3 times better than we had reached during comparison in BIPM in 2001 [25], Figure 53, Figure 54.
04.05 6:0004.05 4:0004.05 2:0004.05 0:0003.05 22:0003.05 20:0003.05 18:00
50 00045 00040 00035 00030 00025 00020 00015 00010 0005 0000
259 706 000
259 705 500
259 705 000
259 704 500
259 704 000
259 703 500
259 703 000
259 702 500
259 702 000
259 701 500
259 701 000
2
1
0
-1
Figure 53 Chart of frequency differences between CMI and BEV 532 nm wavelength standards (different
colours correspond to 1, 10, 100 and 1000 second averages). Left axis values in Hz.
23 within the framework of DUNAMET project D49 dedicated to comparison of combs by transportable stabilized lasers
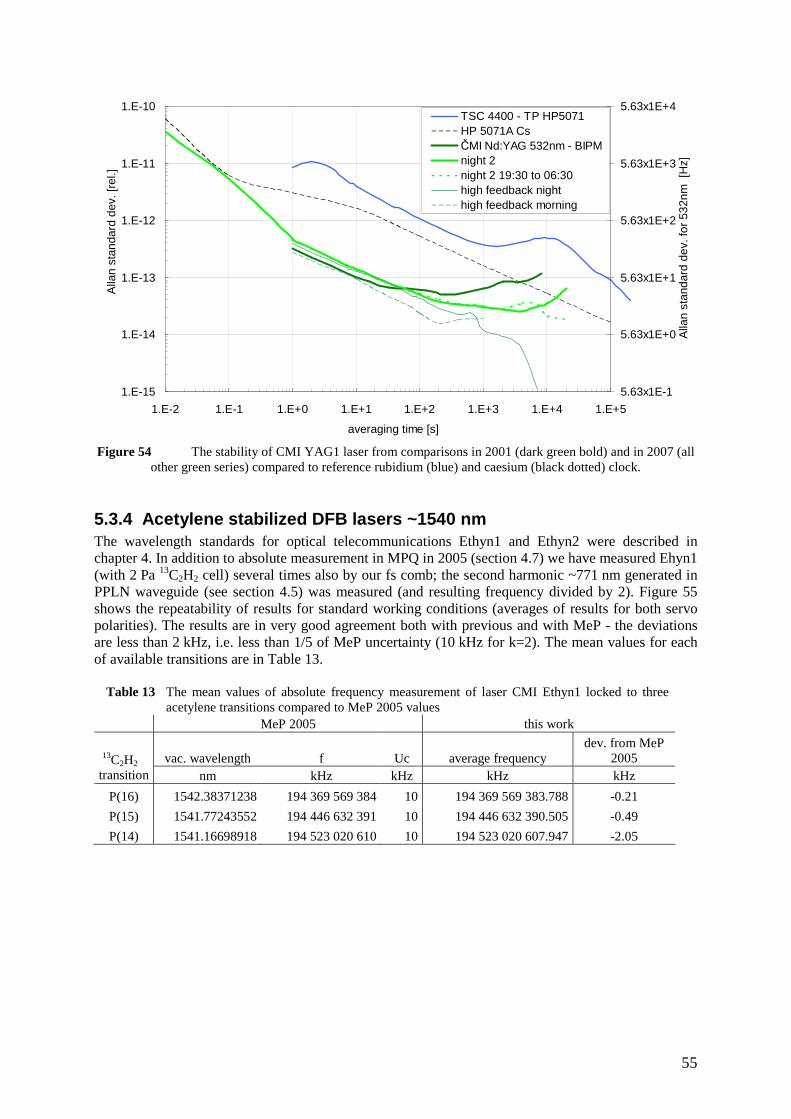
55
1.E-15
1.E-14
1.E-13
1.E-12
1.E-11
1.E-10
1.E-2 1.E-1 1.E+0 1.E+1 1.E+2 1.E+3 1.E+4 1.E+5
averaging time [s]
Alla
n st
anda
rd d
ev. [
rel.]
5.63x1E-1
5.63x1E+0
5.63x1E+1
5.63x1E+2
5.63x1E+3
5.63x1E+4
Alla
n st
anda
rd d
ev. f
or 5
32nm
[H
z]
TSC 4400 - TP HP5071HP 5071A CsČMI Nd:YAG 532nm - BIPMnight 2night 2 19:30 to 06:30high feedback nighthigh feedback morning
Figure 54 The stability of CMI YAG1 laser from comparisons in 2001 (dark green bold) and in 2007 (all
other green series) compared to reference rubidium (blue) and caesium (black dotted) clock.
5.3.4 Acetylene stabilized DFB lasers ~1540 nm The wavelength standards for optical telecommunications Ethyn1 and Ethyn2 were described in chapter 4. In addition to absolute measurement in MPQ in 2005 (section 4.7) we have measured Ehyn1 (with 2 Pa 13C2H2 cell) several times also by our fs comb; the second harmonic ~771 nm generated in PPLN waveguide (see section 4.5) was measured (and resulting frequency divided by 2). Figure 55 shows the repeatability of results for standard working conditions (averages of results for both servo polarities). The results are in very good agreement both with previous and with MeP - the deviations are less than 2 kHz, i.e. less than 1/5 of MeP uncertainty (10 kHz for k=2). The mean values for each of available transitions are in Table 13.
Table 13 The mean values of absolute frequency measurement of laser CMI Ethyn1 locked to three acetylene transitions compared to MeP 2005 values
MeP 2005 this work
vac. wavelength f Uc average frequency dev. from MeP
2005 13C2H2
transition nm kHz kHz kHz kHz
P(16) 1542.38371238 194 369 569 384 10 194 369 569 383.788 -0.21
P(15) 1541.77243552 194 446 632 391 10 194 446 632 390.505 -0.49
P(14) 1541.16698918 194 523 020 610 10 194 523 020 607.947 -2.05
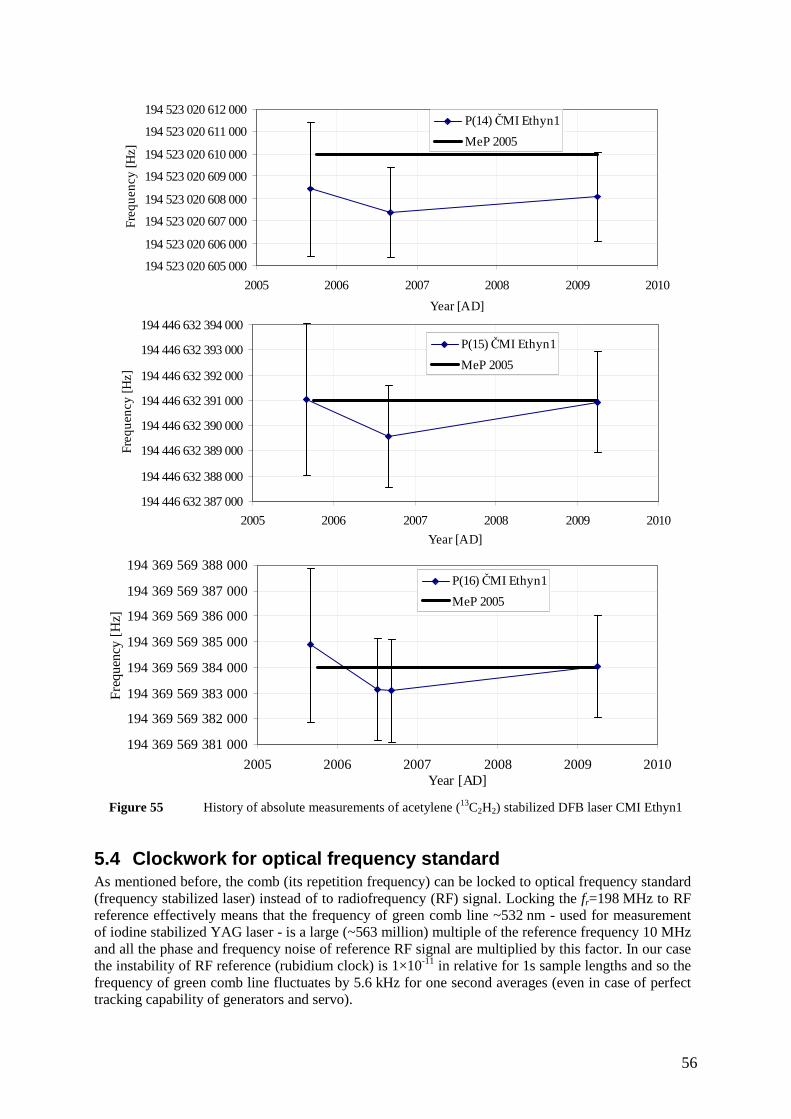
56
Figure 55 History of absolute measurements of acetylene (13C2H2) stabilized DFB laser CMI Ethyn1
5.4 Clockwork for optical frequency standard As mentioned before, the comb (its repetition frequency) can be locked to optical frequency standard (frequency stabilized laser) instead of to radiofrequency (RF) signal. Locking the fr=198 MHz to RF reference effectively means that the frequency of green comb line ~532 nm - used for measurement of iodine stabilized YAG laser - is a large (~563 million) multiple of the reference frequency 10 MHz and all the phase and frequency noise of reference RF signal are multiplied by this factor. In our case the instability of RF reference (rubidium clock) is 1×10-11 in relative for 1s sample lengths and so the frequency of green comb line fluctuates by 5.6 kHz for one second averages (even in case of perfect tracking capability of generators and servo).
194 446 632 387 000
194 446 632 388 000
194 446 632 389 000
194 446 632 390 000
194 446 632 391 000
194 446 632 392 000
194 446 632 393 000
194 446 632 394 000
2005 2006 2007 2008 2009 2010
Year [AD]
Fre
que
ncy
[Hz]
P(15) ČMI Ethyn1
MeP 2005
194 446 632 387 000
194 446 632 388 000
194 446 632 389 000
194 446 632 390 000
194 446 632 391 000
194 446 632 392 000
194 446 632 393 000
194 446 632 394 000
2005 2006 2007 2008 2009 2010
Year [AD]
Fre
qu
en
cy [H
z]
P(15) ČMI Ethyn1
MeP 2005
194 523 020 605 000
194 523 020 606 000
194 523 020 607 000
194 523 020 608 000
194 523 020 609 000
194 523 020 610 000
194 523 020 611 000
194 523 020 612 000
2005 2006 2007 2008 2009 2010
Year [AD]
Fre
qu
en
cy [H
z]P(14) ČMI Ethyn1
MeP 2005
194 369 569 381 000
194 369 569 382 000
194 369 569 383 000
194 369 569 384 000
194 369 569 385 000
194 369 569 386 000
194 369 569 387 000
194 369 569 388 000
2005 2006 2007 2008 2009 2010Year [AD]
Fre
qu
ency
[H
z]
P(16) ČMI Ethyn1
MeP 2005
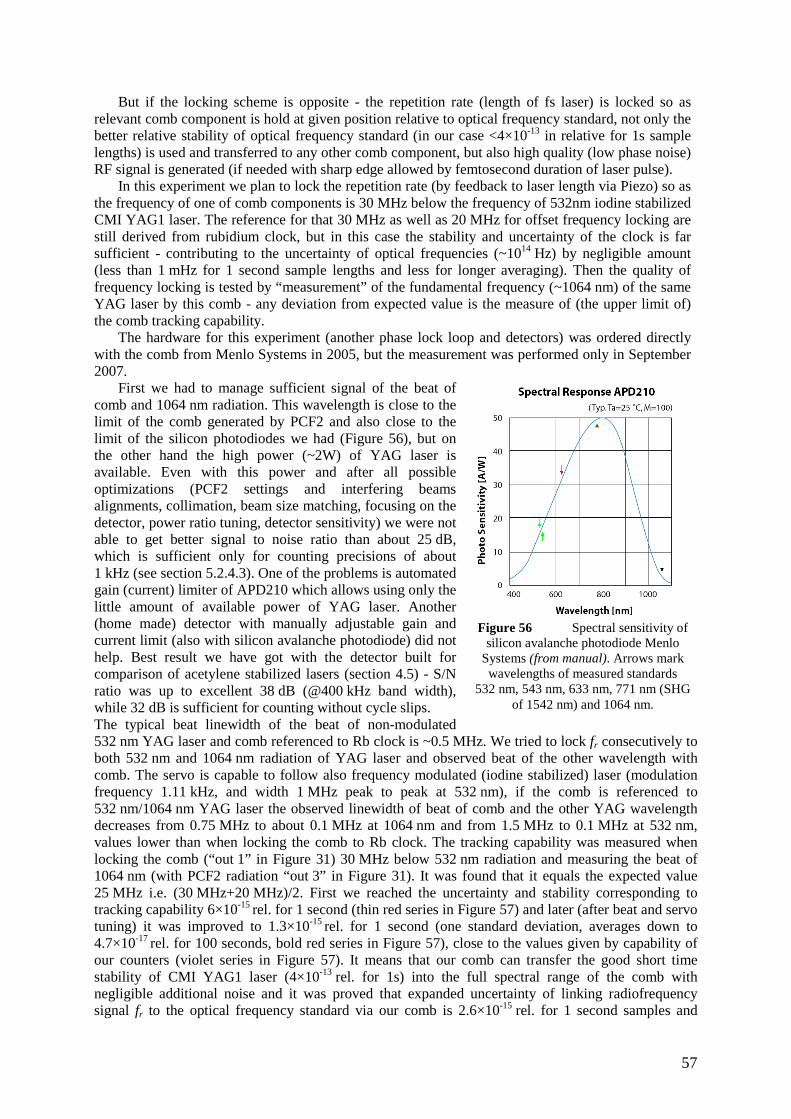
57
But if the locking scheme is opposite - the repetition rate (length of fs laser) is locked so as relevant comb component is hold at given position relative to optical frequency standard, not only the better relative stability of optical frequency standard (in our case <4×10-13 in relative for 1s sample lengths) is used and transferred to any other comb component, but also high quality (low phase noise) RF signal is generated (if needed with sharp edge allowed by femtosecond duration of laser pulse).
In this experiment we plan to lock the repetition rate (by feedback to laser length via Piezo) so as the frequency of one of comb components is 30 MHz below the frequency of 532nm iodine stabilized CMI YAG1 laser. The reference for that 30 MHz as well as 20 MHz for offset frequency locking are still derived from rubidium clock, but in this case the stability and uncertainty of the clock is far sufficient - contributing to the uncertainty of optical frequencies (~1014 Hz) by negligible amount (less than 1 mHz for 1 second sample lengths and less for longer averaging). Then the quality of frequency locking is tested by “measurement” of the fundamental frequency (~1064 nm) of the same YAG laser by this comb - any deviation from expected value is the measure of (the upper limit of) the comb tracking capability.
The hardware for this experiment (another phase lock loop and detectors) was ordered directly with the comb from Menlo Systems in 2005, but the measurement was performed only in September 2007.
First we had to manage sufficient signal of the beat of comb and 1064 nm radiation. This wavelength is close to the limit of the comb generated by PCF2 and also close to the limit of the silicon photodiodes we had (Figure 56), but on the other hand the high power (~2W) of YAG laser is available. Even with this power and after all possible optimizations (PCF2 settings and interfering beams alignments, collimation, beam size matching, focusing on the detector, power ratio tuning, detector sensitivity) we were not able to get better signal to noise ratio than about 25 dB, which is sufficient only for counting precisions of about 1 kHz (see section 5.2.4.3). One of the problems is automated gain (current) limiter of APD210 which allows using only the little amount of available power of YAG laser. Another (home made) detector with manually adjustable gain and current limit (also with silicon avalanche photodiode) did not help. Best result we have got with the detector built for comparison of acetylene stabilized lasers (section 4.5) - S/N ratio was up to excellent 38 dB (@400 kHz band width), while 32 dB is sufficient for counting without cycle slips. The typical beat linewidth of the beat of non-modulated 532 nm YAG laser and comb referenced to Rb clock is ~0.5 MHz. We tried to lock fr consecutively to both 532 nm and 1064 nm radiation of YAG laser and observed beat of the other wavelength with comb. The servo is capable to follow also frequency modulated (iodine stabilized) laser (modulation frequency 1.11 kHz, and width 1 MHz peak to peak at 532 nm), if the comb is referenced to 532 nm/1064 nm YAG laser the observed linewidth of beat of comb and the other YAG wavelength decreases from 0.75 MHz to about 0.1 MHz at 1064 nm and from 1.5 MHz to 0.1 MHz at 532 nm, values lower than when locking the comb to Rb clock. The tracking capability was measured when locking the comb (“out 1” in Figure 31) 30 MHz below 532 nm radiation and measuring the beat of 1064 nm (with PCF2 radiation “out 3” in Figure 31). It was found that it equals the expected value 25 MHz i.e. (30 MHz+20 MHz)/2. First we reached the uncertainty and stability corresponding to tracking capability 6×10-15 rel. for 1 second (thin red series in Figure 57) and later (after beat and servo tuning) it was improved to 1.3×10⁻¹⁵ rel. for 1 second (one standard deviation, averages down to 4.7×10⁻¹⁷ rel. for 100 seconds, bold red series in Figure 57), close to the values given by capability of our counters (violet series in Figure 57). It means that our comb can transfer the good short time stability of CMI YAG1 laser (4×10-13 rel. for 1s) into the full spectral range of the comb with negligible additional noise and it was proved that expanded uncertainty of linking radiofrequency signal fr to the optical frequency standard via our comb is 2.6×10⁻¹⁵ rel. for 1 second samples and
Figure 56 Spectral sensitivity of
silicon avalanche photodiode Menlo Systems (from manual). Arrows mark wavelengths of measured standards
532 nm, 543 nm, 633 nm, 771 nm (SHG of 1542 nm) and 1064 nm.
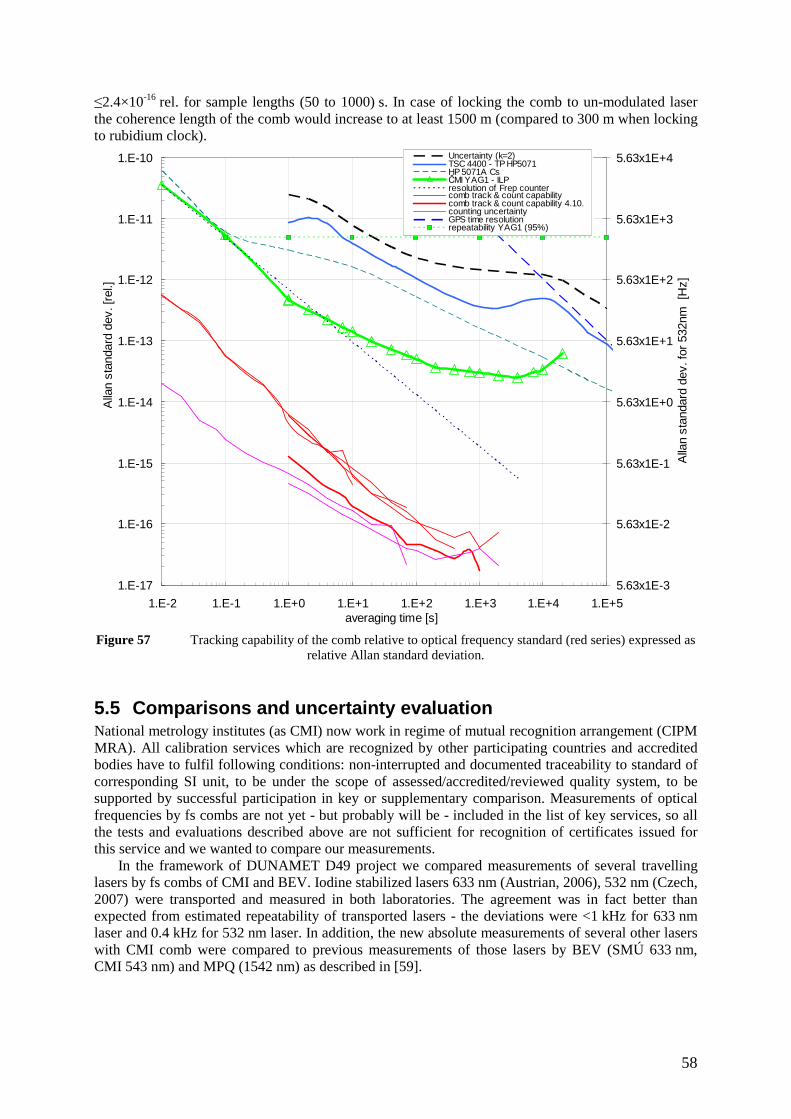
58
≤2.4×10⁻¹⁶ rel. for sample lengths (50 to 1000) s. In case of locking the comb to un-modulated laser the coherence length of the comb would increase to at least 1500 m (compared to 300 m when locking to rubidium clock).
1.E-17
1.E-16
1.E-15
1.E-14
1.E-13
1.E-12
1.E-11
1.E-10
1.E-2 1.E-1 1.E+0 1.E+1 1.E+2 1.E+3 1.E+4 1.E+5averaging time [s]
Alla
n st
anda
rd d
ev. [
rel.]
5.63x1E-3
5.63x1E-2
5.63x1E-1
5.63x1E+0
5.63x1E+1
5.63x1E+2
5.63x1E+3
5.63x1E+4
Alla
n st
anda
rd d
ev. f
or 5
32nm
[H
z]
Uncertainty (k=2)TSC 4400 - TP HP5071HP 5071A CsČMI YAG1 - ILPresolution of Frep countercomb track & count capabilitycomb track & count capability 4.10.counting uncertaintyGPS time resolutionrepeatability YAG1 (95%)
Figure 57 Tracking capability of the comb relative to optical frequency standard (red series) expressed as
relative Allan standard deviation.
5.5 Comparisons and uncertainty evaluation National metrology institutes (as CMI) now work in regime of mutual recognition arrangement (CIPM MRA). All calibration services which are recognized by other participating countries and accredited bodies have to fulfil following conditions: non-interrupted and documented traceability to standard of corresponding SI unit, to be under the scope of assessed/accredited/reviewed quality system, to be supported by successful participation in key or supplementary comparison. Measurements of optical frequencies by fs combs are not yet - but probably will be - included in the list of key services, so all the tests and evaluations described above are not sufficient for recognition of certificates issued for this service and we wanted to compare our measurements.
In the framework of DUNAMET D49 project we compared measurements of several travelling lasers by fs combs of CMI and BEV. Iodine stabilized lasers 633 nm (Austrian, 2006), 532 nm (Czech, 2007) were transported and measured in both laboratories. The agreement was in fact better than expected from estimated repeatability of transported lasers - the deviations were <1 kHz for 633 nm laser and 0.4 kHz for 532 nm laser. In addition, the new absolute measurements of several other lasers with CMI comb were compared to previous measurements of those lasers by BEV (SMÚ 633 nm, CMI 543 nm) and MPQ (1542 nm) as described in [59].
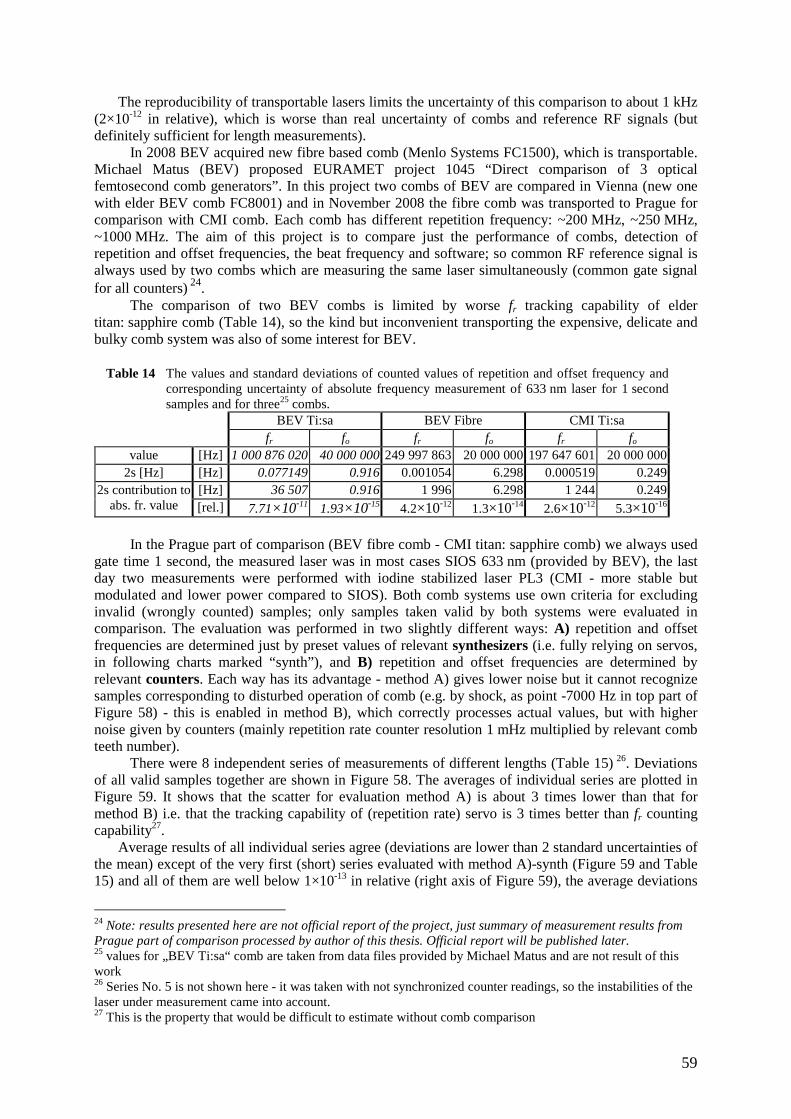
59
The reproducibility of transportable lasers limits the uncertainty of this comparison to about 1 kHz (2×10-12 in relative), which is worse than real uncertainty of combs and reference RF signals (but definitely sufficient for length measurements).
In 2008 BEV acquired new fibre based comb (Menlo Systems FC1500), which is transportable. Michael Matus (BEV) proposed EURAMET project 1045 “Direct comparison of 3 optical femtosecond comb generators”. In this project two combs of BEV are compared in Vienna (new one with elder BEV comb FC8001) and in November 2008 the fibre comb was transported to Prague for comparison with CMI comb. Each comb has different repetition frequency: ~200 MHz, ~250 MHz, ~1000 MHz. The aim of this project is to compare just the performance of combs, detection of repetition and offset frequencies, the beat frequency and software; so common RF reference signal is always used by two combs which are measuring the same laser simultaneously (common gate signal for all counters) 24.
The comparison of two BEV combs is limited by worse fr tracking capability of elder titan: sapphire comb (Table 14), so the kind but inconvenient transporting the expensive, delicate and bulky comb system was also of some interest for BEV.
Table 14 The values and standard deviations of counted values of repetition and offset frequency and
corresponding uncertainty of absolute frequency measurement of 633 nm laser for 1 second samples and for three25 combs.
BEV Ti:sa BEV Fibre CMI Ti:sa fr fo fr fo fr fo
value [Hz] 1 000 876 020 40 000 000 249 997 863 20 000 000 197 647 601 20 000 000 2s [Hz] [Hz] 0.077149 0.916 0.001054 6.298 0.000519 0.249
[Hz] 36 507 0.916 1 996 6.298 1 244 0.249 2s contribution to abs. fr. value [rel.] 7.71×10⁻¹¹ 1.93×10⁻¹⁵ 4.2×10⁻¹² 1.3×10⁻¹⁴ 2.6×10⁻¹² 5.3×10⁻¹⁶
In the Prague part of comparison (BEV fibre comb - CMI titan: sapphire comb) we always used
gate time 1 second, the measured laser was in most cases SIOS 633 nm (provided by BEV), the last day two measurements were performed with iodine stabilized laser PL3 (CMI - more stable but modulated and lower power compared to SIOS). Both comb systems use own criteria for excluding invalid (wrongly counted) samples; only samples taken valid by both systems were evaluated in comparison. The evaluation was performed in two slightly different ways: A) repetition and offset frequencies are determined just by preset values of relevant synthesizers (i.e. fully relying on servos, in following charts marked “synth”), and B) repetition and offset frequencies are determined by relevant counters. Each way has its advantage - method A) gives lower noise but it cannot recognize samples corresponding to disturbed operation of comb (e.g. by shock, as point -7000 Hz in top part of Figure 58) - this is enabled in method B), which correctly processes actual values, but with higher noise given by counters (mainly repetition rate counter resolution 1 mHz multiplied by relevant comb teeth number).
There were 8 independent series of measurements of different lengths (Table 15) 26. Deviations of all valid samples together are shown in Figure 58. The averages of individual series are plotted in Figure 59. It shows that the scatter for evaluation method A) is about 3 times lower than that for method B) i.e. that the tracking capability of (repetition rate) servo is 3 times better than fr counting capability27.
Average results of all individual series agree (deviations are lower than 2 standard uncertainties of the mean) except of the very first (short) series evaluated with method A)-synth (Figure 59 and Table 15) and all of them are well below 1×10-13 in relative (right axis of Figure 59), the average deviations
24 Note: results presented here are not official report of the project, just summary of measurement results from Prague part of comparison processed by author of this thesis. Official report will be published later. 25 values for „BEV Ti:sa“ comb are taken from data files provided by Michael Matus and are not result of this work 26 Series No. 5 is not shown here - it was taken with not synchronized counter readings, so the instabilities of the laser under measurement came into account. 27 This is the property that would be difficult to estimate without comb comparison
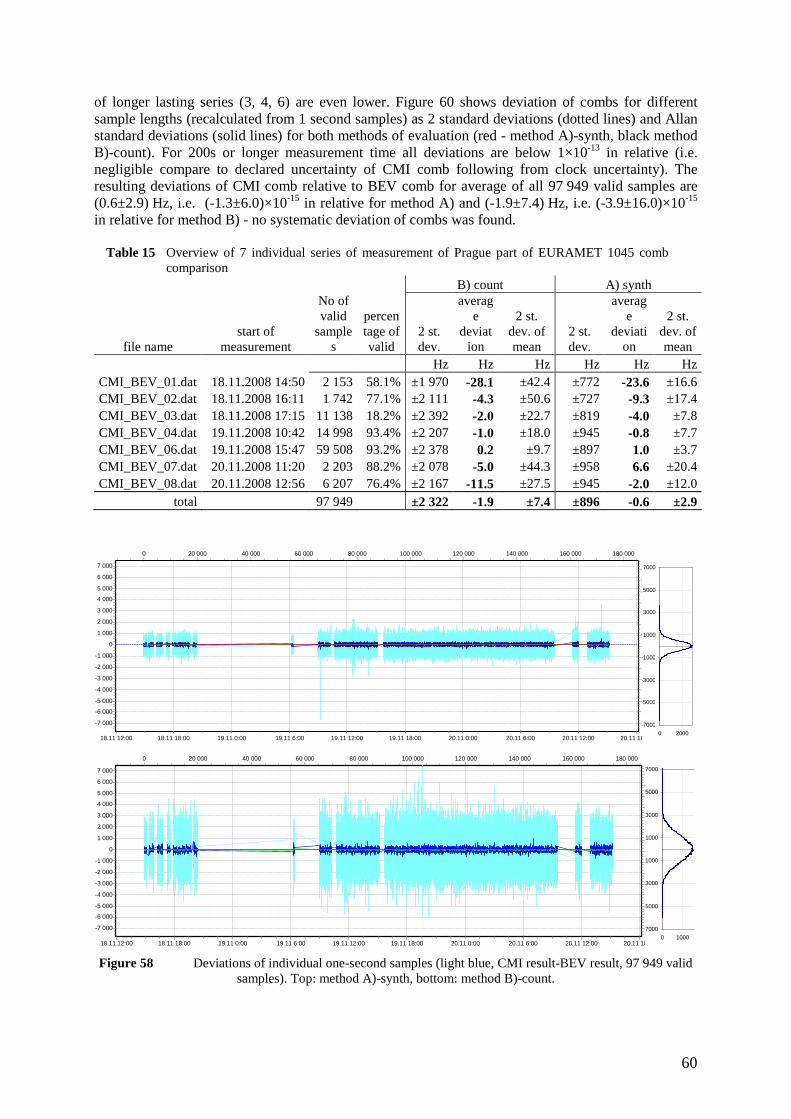
60
of longer lasting series (3, 4, 6) are even lower. Figure 60 shows deviation of combs for different sample lengths (recalculated from 1 second samples) as 2 standard deviations (dotted lines) and Allan standard deviations (solid lines) for both methods of evaluation (red - method A)-synth, black method B)-count). For 200s or longer measurement time all deviations are below 1×10-13 in relative (i.e. negligible compare to declared uncertainty of CMI comb following from clock uncertainty). The resulting deviations of CMI comb relative to BEV comb for average of all 97 949 valid samples are (0.6±2.9) Hz, i.e. (-1.3±6.0)×10-15 in relative for method A) and (-1.9±7.4) Hz, i.e. (-3.9±16.0)×10-15 in relative for method B) - no systematic deviation of combs was found.
Table 15 Overview of 7 individual series of measurement of Prague part of EURAMET 1045 comb comparison
B) count A) synth
file name start of
measurement
No of valid
samples
percentage of valid
2 st. dev.
average
deviation
2 st. dev. of mean
2 st. dev.
average
deviation
2 st. dev. of mean
Hz Hz Hz Hz Hz Hz CMI_BEV_01.dat 18.11.2008 14:50 2 153 58.1% ±1 970 -28.1 ±42.4 ±772 -23.6 ±16.6 CMI_BEV_02.dat 18.11.2008 16:11 1 742 77.1% ±2 111 -4.3 ±50.6 ±727 -9.3 ±17.4 CMI_BEV_03.dat 18.11.2008 17:15 11 138 18.2% ±2 392 -2.0 ±22.7 ±819 -4.0 ±7.8 CMI_BEV_04.dat 19.11.2008 10:42 14 998 93.4% ±2 207 -1.0 ±18.0 ±945 -0.8 ±7.7 CMI_BEV_06.dat 19.11.2008 15:47 59 508 93.2% ±2 378 0.2 ±9.7 ±897 1.0 ±3.7 CMI_BEV_07.dat 20.11.2008 11:20 2 203 88.2% ±2 078 -5.0 ±44.3 ±958 6.6 ±20.4 CMI_BEV_08.dat 20.11.2008 12:56 6 207 76.4% ±2 167 -11.5 ±27.5 ±945 -2.0 ±12.0
total 97 949 ±2 322 -1.9 ±7.4 ±896 -0.6 ±2.9
20.11 18:0020.11 12:0020.11 6:0020.11 0:0019.11 18:0019.11 12:0019.11 6:0019.11 0:0018.11 18:0018.11 12:00
180 000160 000140 000120 000100 00080 00060 00040 00020 0000
7 000
6 000
5 000
4 000
3 000
2 000
1 000
0
-1 000
-2 000
-3 000
-4 000
-5 000
-6 000
-7 000
6
5
4
3
2
1
0
-1
-2
-3
-4
-5
-6
-7
-8-7000
-5000
-3000
-1000
1000
3000
5000
7000
0 2000
20.11 18:0020.11 12:0020.11 6:0020.11 0:0019.11 18:0019.11 12:0019.11 6:0019.11 0:0018.11 18:0018.11 12:00
180 000160 000140 000120 000100 00080 00060 00040 00020 0000
7 000
6 000
5 000
4 000
3 000
2 000
1 000
0
-1 000
-2 000
-3 000
-4 000
-5 000
-6 000
-7 000
6
5
4
3
2
1
0
-1
-2
-3
-4
-5
-6
-7
-8-7000
-5000
-3000
-1000
1000
3000
5000
7000
0 1000
Figure 58 Deviations of individual one-second samples (light blue, CMI result-BEV result, 97 949 valid
samples). Top: method A)-synth, bottom: method B)-count.
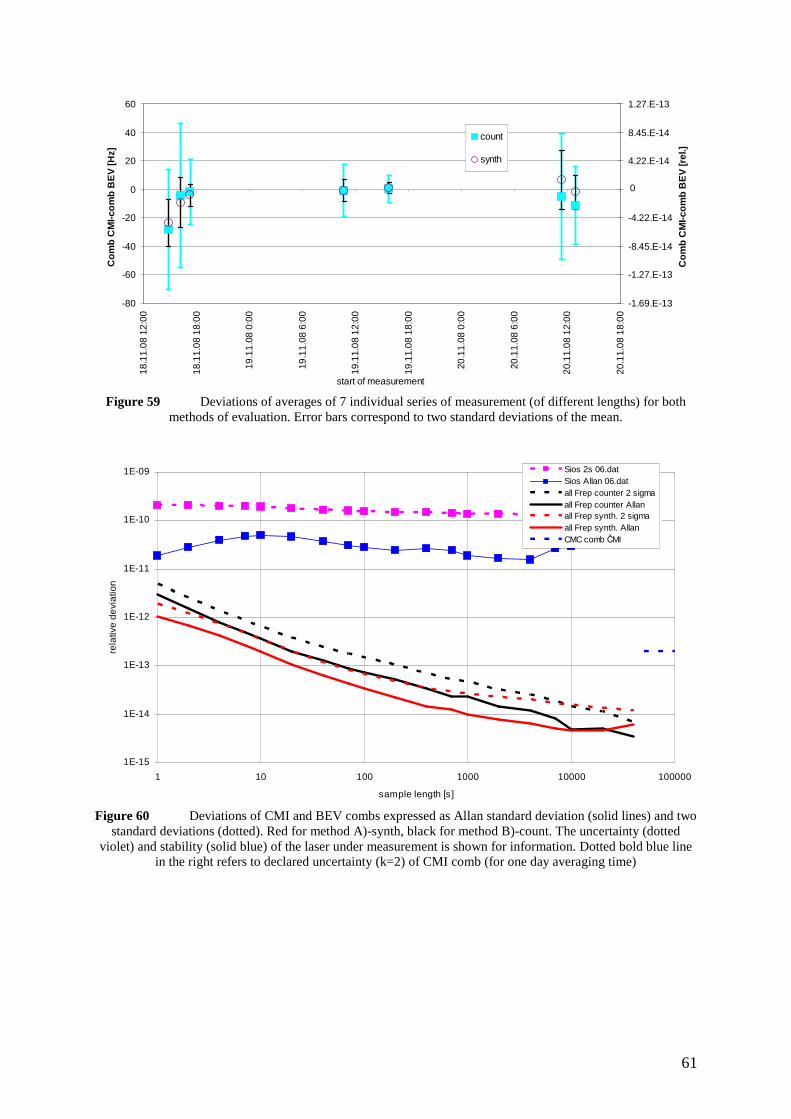
61
-80
-60
-40
-20
0
20
40
60
18.1
1.08
12:
00
18.1
1.08
18:
00
19.1
1.08
0:0
0
19.1
1.08
6:0
0
19.1
1.08
12:
00
19.1
1.08
18:
00
20.1
1.08
0:0
0
20.1
1.08
6:0
0
20.1
1.08
12:
00
20.1
1.08
18:
00
start of measurement
Co
mb
CM
I-co
mb
BE
V [H
z] .
-1.69.E-13
-1.27.E-13
-8.45.E-14
-4.22.E-14
4.53.E-19
4.22.E-14
8.45.E-14
1.27.E-13
Co
mb
CM
I-co
mb
BE
V [r
el.]
.count
synth
0
Figure 59 Deviations of averages of 7 individual series of measurement (of different lengths) for both
methods of evaluation. Error bars correspond to two standard deviations of the mean.
1E-15
1E-14
1E-13
1E-12
1E-11
1E-10
1E-09
1 10 100 1000 10000 100000
sample length [s]
rela
tive
de
via
tion
Sios 2s 06.datSios Allan 06.datall Frep counter 2 sigmaall Frep counter Allanall Frep synth. 2 sigmaall Frep synth. AllanCMC comb ČMI
Figure 60 Deviations of CMI and BEV combs expressed as Allan standard deviation (solid lines) and two
standard deviations (dotted). Red for method A)-synth, black for method B)-count. The uncertainty (dotted violet) and stability (solid blue) of the laser under measurement is shown for information. Dotted bold blue line
in the right refers to declared uncertainty (k=2) of CMI comb (for one day averaging time)
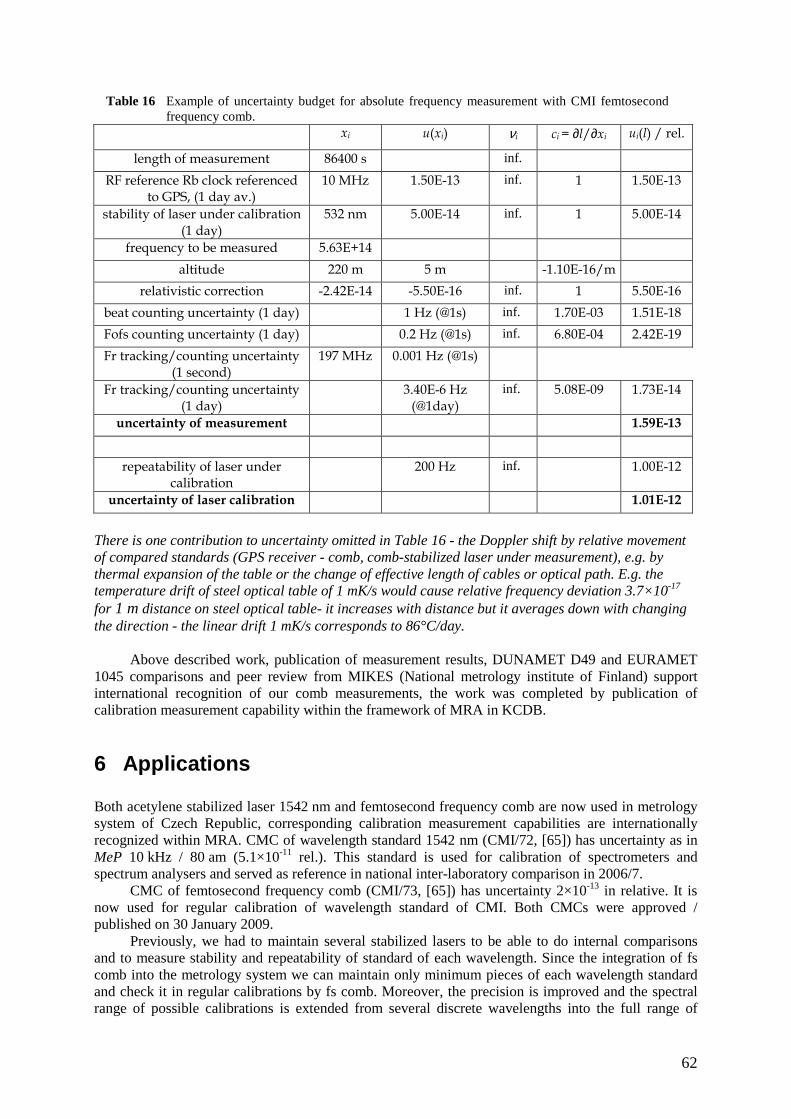
62
Table 16 Example of uncertainty budget for absolute frequency measurement with CMI femtosecond frequency comb.
xi u(xi) νi ci = ∂l/∂xi ui(l) / rel.
length of measurement 86400 s inf.
RF reference Rb clock referenced to GPS, (1 day av.)
10 MHz 1.50E-13 inf. 1 1.50E-13
stability of laser under calibration (1 day)
532 nm 5.00E-14 inf. 1 5.00E-14
frequency to be measured 5.63E+14
altitude 220 m 5 m -1.10E-16/m relativistic correction -2.42E-14 -5.50E-16 inf. 1 5.50E-16
beat counting uncertainty (1 day) 1 Hz (@1s) inf. 1.70E-03 1.51E-18
Fofs counting uncertainty (1 day) 0.2 Hz (@1s) inf. 6.80E-04 2.42E-19
Fr tracking/counting uncertainty (1 second)
197 MHz 0.001 Hz (@1s)
Fr tracking/counting uncertainty (1 day)
3.40E-6 Hz (@1day)
inf. 5.08E-09 1.73E-14
uncertainty of measurement 1.59E-13
repeatability of laser under
calibration 200 Hz inf. 1.00E-12
uncertainty of laser calibration 1.01E-12
There is one contribution to uncertainty omitted in Table 16 - the Doppler shift by relative movement of compared standards (GPS receiver - comb, comb-stabilized laser under measurement), e.g. by thermal expansion of the table or the change of effective length of cables or optical path. E.g. the temperature drift of steel optical table of 1 mK/s would cause relative frequency deviation 3.7×10⁻¹⁷ for 1 m distance on steel optical table- it increases with distance but it averages down with changing the direction - the linear drift 1 mK/s corresponds to 86°C/day.
Above described work, publication of measurement results, DUNAMET D49 and EURAMET 1045 comparisons and peer review from MIKES (National metrology institute of Finland) support international recognition of our comb measurements, the work was completed by publication of calibration measurement capability within the framework of MRA in KCDB.
6 Applications Both acetylene stabilized laser 1542 nm and femtosecond frequency comb are now used in metrology system of Czech Republic, corresponding calibration measurement capabilities are internationally recognized within MRA. CMC of wavelength standard 1542 nm (CMI/72, [65]) has uncertainty as in MeP 10 kHz / 80 am (5.1×10⁻¹¹ rel.). This standard is used for calibration of spectrometers and spectrum analysers and served as reference in national inter-laboratory comparison in 2006/7.
CMC of femtosecond frequency comb (CMI/73, [65]) has uncertainty 2×10-13 in relative. It is now used for regular calibration of wavelength standard of CMI. Both CMCs were approved / published on 30 January 2009.
Previously, we had to maintain several stabilized lasers to be able to do internal comparisons and to measure stability and repeatability of standard of each wavelength. Since the integration of fs comb into the metrology system we can maintain only minimum pieces of each wavelength standard and check it in regular calibrations by fs comb. Moreover, the precision is improved and the spectral range of possible calibrations is extended from several discrete wavelengths into the full range of
63
(520..1064) nm and with help of nonlinear coherent frequency conversion virtually any other frequency would be possible to measure (similarly to acetylene stabilized DFB laser 1542 nm).
This resulted in proposed change of national standards of length - before we had National standard of wavelength 633 nm (group of four iodine stabilized He-Ne lasers) and National standard of wavelength 543 nm (group of two iodine stabilized He-Ne lasers), completed by several reference standard (other wavelength standards, interferometers and measuring machines or artefacts). We have prepared all necessary documentation for quality system (written procedures, report and others) and proposed new National Standard of Length consisting of
- femtosecond frequency comb - wavelength standards 633 nm, 543 nm, 532/1064 nm and 1542 nm - interferometric comparator IK-1 (system for calibration of counting laser interferometers and
displacement measuring devices) - interferometer for long gauge blocks IDKM
This proposal was approved in late 2007 and in February 2008 new National standard of length
was officially declared [66] and now it serves as a basis of national metrology system in the field of length and most of measurements provided by CMI, accredited laboratories and industry are traceable to it (Figure 61), as well as several foreign customers of us.
The femtosecond frequency comb is also used for experiments with distance measurement in
EMRP Long Distance research project [67], [60] and for research of Fourier spectroscopy with comb radiation and precise measurement of air dispersion.
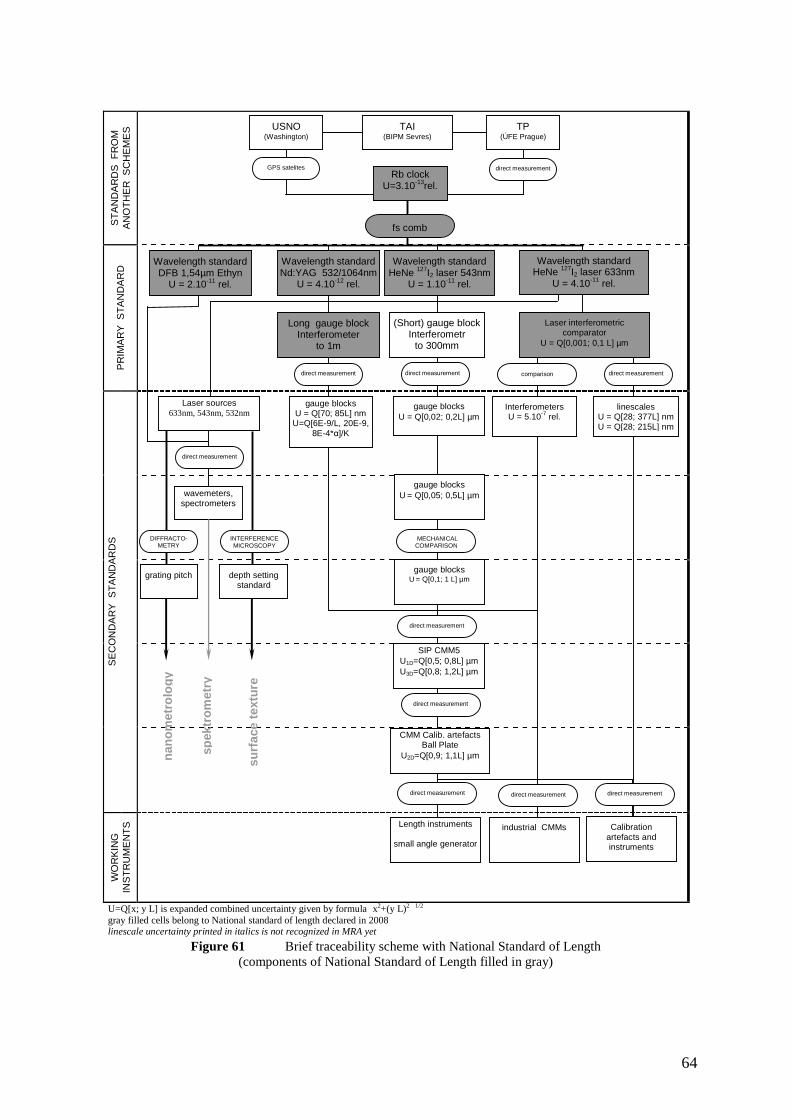
64
U=Q[x; y L] is expanded combined uncertainty given by formula x2+(y L)2 1/2 gray filled cells belong to National standard of length declared in 2008 linescale uncertainty printed in italics is not recognized in MRA yet
ST
AN
DA
RD
S F
RO
M
AN
OT
HE
R S
CH
EM
ES
P
RIM
AR
Y S
TA
ND
AR
D
SE
CO
ND
AR
Y S
TA
ND
AR
DS
WO
RK
ING
IN
ST
RU
ME
NT
S
Wavelength standard HeNe 127I2 laser 633nm
U = 4.10-11 rel.
Wavelength standard HeNe 127I2 laser 543nm
U = 1.10-11 rel.
Laser interferometric comparator
U = Q[0,001; 0,1 L] µm
comparison
(Short) gauge block Interferometr
to 300mm
Interferometers U = 5.10-7 rel.
gauge blocks U = Q[0,02; 0,2L] µm
Laser sources 633nm, 543nm, 532nm
gauge blocks U = Q[0,05; 0,5L] µm
MECHANICAL COMPARISON
gauge blocks U = Q[0,1; 1 L] µm
direct measurement
direct measurement
direct measurement
direct measurement
Length instruments
small angle generator
Calibration artefacts and instruments
Wavelength standard Nd:YAG 532/1064nm
U = 4.10-12 rel.
fs comb
TAI (BIPM Sevres)
Long gauge block Interferometer
to 1m
gauge blocks U = Q[70; 85L] nm
U=Q[6E-9/L, 20E-9, 8E-4*α]/K
depth setting standard
INTERFERENCE MICROSCOPY
DIFFRACTO-METRY
wavemeters, spectrometers
direct measurement
SIP CMM5 U1D=Q[0,5; 0,8L] µm U3D=Q[0,8; 1,2L] µm
CMM Calib. artefacts Ball Plate
U2D=Q[0,9; 1,1L] µm
industrial CMMs
grating pitch
direct measurement
spek
tro
met
ry
nan
om
etro
log
y
surf
ace
text
ure
direct measurement direct measurement
Rb clock U=3.10-13rel.
TP (ÚFE Prague)
GPS satelites direct measurement
USNO (Washington)
Wavelength standard DFB 1,54µm Ethyn
U = 2.10-11 rel.
linescales U = Q[28; 377L] nm U = Q[28; 215L] nm
direct measurement
Figure 61 Brief traceability scheme with National Standard of Length
(components of National Standard of Length filled in gray)
65
7 Conclusions In the thesis, the work done towards improvement of optical frequency (wavelength) standards available in Czech Republic is described in detail. The author was in charge of design, realization and research of primary wavelength standard based on frequency stabilized laser and of selection, implementing, improving and detail testing of system for absolute measurement of optical frequencies - the femtosecond frequency comb. He in particular
- prepared tuneable laser and designed experimental setup for sub-Doppler spectroscopy of acetylene at (1540-1542)nm
- participated in design and production of acetylene cells - detected and identified acetylene transitions - stabilized the frequency of DFB lasers to that transition - prepared instrumentation for infrared laser frequency comparison including frequency shifting
by acousto-optic modulator - prepared and optimized the second harmonic generation of cw infrared radiation - tested and optimized frequency stability of acetylene stabilized lasers - measured sensitivities of stabilized laser frequency on modulation, pressure and power - measured linewidths and its pressure broadening - arranged and participated in absolute frequency measurement of developed wavelength
standard in Max Planck Institute for Quantum Optics in Garching and published the results - selected femtosecond frequency comb system, arranged its installation and learned its
operation and maintenance - wrote a new software for data acquisition and online processing and evaluation - designed and performed detailed and precise test of measurement uncertainty - managed improvement of software for automatic adjustments of comb system leading to
increased length of continuous measurement which enables improved accuracy of frequency measurement
- performed and evaluated absolute frequency measurement of wavelength standards 633 nm, 543 nm, 532 nm/1064 nm and (second harmonic of) 1542 nm for many reference transition/hyperfine components and published the results
- improved the long-term stability of wavelength standard of 532 nm and participated in related international comparison
- realized, tested and optimized the stabilization of frequency comb to the optical frequency standard leading to improved short term stability compared to rubidium or caesium clocks
- took part in both indirect and direct international comparison of femtosecond frequency combs There are two priorities associated with this work
- first wavelength standard stabilized to sub-Doppler acetylene transitions without build up cavity was created and the first with DFB laser
- this wavelength was measured for the first time directly by infrared femtosecond comb. As a result,
- pair of primary wavelength standards - acetylene stabilized lasers 1542 nm - is available for calibrations of wave-meters, spectrum analysers or secondary stabilized lasers in the spectral range of optical telecommunications with internationally recognized relative uncertainty 5.1×10⁻¹¹ (k=2)
- the value and uncertainty of international recommendation for the realization of the definition of the metre were improved in section concerning 1542 nm wavelength standard
- the femtosecond generator of the comb of optical frequencies is available for precise measurement of optical frequencies with internationally recognized relative uncertainty 2×10-13 (k=2)
- the new Czech National Standard of Length including wavelength standard of 1542 nm and fs comb is approved and used for providing traceability of Czech metrology and industry to the SI metre.
66
Further possible applications of developed systems are: (long) distance measurement using femtosecond frequency comb radiation, new version of Fourier transform spectroscopy which resolves and identifies fs comb “teeth” and application of stable and robust DFB lasers in interferometry.
Author of these thesis contributed to improvement of uncertainties of several standards listed in Mise en pratique [6]in the years 2001, 2003 and 2005, by development, international comparison and absolute frequency measurement of wavelength standards of 532 nm [25][26], 543 nm [23] and 1542 nm (chapter 4, [34], [38]), he is guarantor of Czech National Standard of Length.
References [1] Peter J. Mohr, Barry N. Taylor, and David B. Newell, „The Fundamental Physical Constants“,
Phys. Today 60, 52 (2007), or http://physics.nist.gov/cuu/Constants/index.html [2] F. Biraben, „Spectroscopy of atomic hydrogen“, Eur. Phys. J. Special Topics 172, 109–119
(2009) [3] Th. Udem, R. Holzwarth, and Th. Hänsch, „Femtosecond optical frequency combs“, Eur. Phys.
J. Special Topics 172, 69–79 (2009) [4] J. K. Webb, M. T. Murphy, V. V. Flambaum, V. A. Dzuba, J. D. Barrow, C. W. Churchill, J. X.
Prochaska, and A. M. Wolfe, „Further Evidence for Cosmological Evolution of the Fine Structure Constant“, Phys. Rev. Lett. 87, 091301 (2001)
[5] L. Cacciapuoti,and Ch. Salomon, „Space clocks and fundamental tests: The ACES experiment“, Eur. Phys. J. Special Topics 172, 57–68 (2009)
[6] Quinn, T.J.: „Practical realization of the definition of the metre, including recommended radiations of other optical frequency standards (2001)“, Metrologia 40, 103-133 (2003)
and R. Felder “Practical realization of the definition of the metre…”, Metrologia 42, 323-325 (2005) http://www.bipm.org/en/committees/cc/ccl/mep.html
[7] J. Reichert, M. Niering, R. Holzwarth, M. Weitz, Th. Udem, and T. W. Hänsch „Phase Coherent Vacuum-Ultraviolet to Radio Frequency Comparison with a Mode-Locked Laser”, Phys. Rev. Lett. 84, 3232 (2000)
[8] D. J. Jones, S. A. Diddams, J. K. Ranka, A. Stentz, R. S. Windeler, J. L. Hall, and S. T. Cundiff „Carrier-Envelope Phase Control of Femtosecond Mode-Locked Lasers and Direct Optical Frequency Synthesis” Science, 288, 635 (2000)
[9] A. L. Schawlow and C. H. Townes „Infrared and Optical Masers”, Phys. Rev. 112, 1940 (1958).
[10] Ch. Salomon, D. Hils, and J. L. Hall „Laser stabilization at the millihertz level” J. Opt. Soc. Am. B 5, 1576-1587 (1988).
[11] T. Rosenband, D. B. Hume, P. O. Schmidt, C. W. Chou, A. Brusch, L. Lorini, W. H. Oskay, R. E. Drullinger, T.M. Fortier, J. E. Stalnaker, S. A. Diddams, W. C. Swann, N. R. Newbury, W. M. Itano, D. J. Wineland, and J. C.Bergquist, „Frequency ratio of Al+ and Hg+ single-ion optical clocks; metrology at the 17th decimal place”, Science 319(5871), 1808–1812 (2008).
[12] F Dybała, A Bercha, B Piechal, W Trzeciakowski, R Bohdan, M Mrozowicz, A Klehr, P Ressel, H Wenzel, B Sumpf and G Erbert „Pressure and temperature tuning of an external cavity InGaAsP laser diode”, Semicond. Sci. Technol. 23, 12 (2008) 125012
[13] Y. N. Zhao, J. Zhang, A. Stejskal, T. Liu, V. Elman, Z. H. Lu, and L. J. Wang, „A vibration-insensitive optical cavity and absolute determination of its ultrahigh stability,” Opt. Express 17, 8970-8982 (2009) http://www.opticsinfobase.org/abstract.cfm?URI=oe-17-11-8970
[14] D.W. Allan, „Statistics of Atomic Frequency Standard”, Proceedings of the IEEE, 54, 2, 221-231, (1966)
[15] The International System of Units (SI) „SI brochure“, 8th edition 2006, BIPM, http://www.bipm.org/utils/common/pdf/si_brochure_8_en.pdf
67
[16] Mills I.M., Mohr P.J., Quinn T.J., Taylor B.N., Williams E.R. „Redefinition of the kilogram: a decision whose time has come”, Metrologia, 42, n°2 (2005) 71-80
[17] Gretchen K Campbell, Andrew D Ludlow, Sebastian Blatt, Jan W Thomsen, Michael J Martin, Marcio H G de Miranda, Tanya Zelevinsky, Martin M Boyd, Jun Ye, Scott A Diddams, Thomas P Heavner, Thomas E Parker and Steven R Jefferts, „The absolute frequency of the 87Sr optical clock transition”, Metrologia 45 539-548 (2008)
[18] J Helmcke „Realization of the metre by frequency-stabilized lasers“, Meas. Sci. Technol. 14 1187–1199,(2003)
[19] Zarka A., Abou-Zeid A., Chagniot D., Chartier J.-M., Cip O., Cliche J.-F., Edwards C.S., Imkenberg F., Jedlicka P., Kabel B., Lassila A., Lazar J., Merimaa M., Millerioux Y., Simonsen H., Têtu M., Wallerand J.-P., „International Comparison: International comparison of eight semiconductor lasers stabilized on 127I2 at λ= 633 nm” Metrologia, 37, 4, 329-339 (2000,)
[20] Balling P., Blabla J., Chartier A., Chartier J.-M., Ziegler M.: "International Comparison of 127I2 - Stabilized He-Ne Lasers at λ≈633nm Using the Third and the Fifth Harmonic Locking Technique", IEEE Transactions on Instrumentation and Measurement, 44, 2,173-176, (1995)
[21] Blabla J., Picard-Fredin S., Razet A.: "On the Fifth-Derivative Spectrum of the Hyperfine Structure of 127I2 at the 633nm Wavelength of the Helium-Neon Laser", Journal of Molecular Spectroscopy 159, 282-285 (1993)
[22] Balling P., Blabla J.: „612 nm helium-neon lasers stabilized to the hyperfine structure of iodine molecule”. Photonics’99 Prague, Proceedings of SPIE, vol. 4016, Photonics, Devices, and Systems, pp.24-29
[23] Long Sheng Ma, Susanne Picard, Massimo Zucco, Jean-Marie Chartier and Lennart Robertsson, Petr Balling and Petr Kren, Jin Qian, Zhong You Lin, Chunying Shi, Miguel Viliesid Alonso,Gan Xu and Siew Leng Tan, Kaj Nyholm, Jes Henningsen and Jan Hald, Robert Windeler „Absolute Frequency Measurement of the R(12) 26-0 and R(106) 28-0 Transitions in 127I2 at λ=543 nm”, IEEE Transactions on Instrumentation and Measurement., 55, 3, (2006)
[24] Oleg Orlov, Lennart Robertsson, Leonid Vitushkin, Petr Balling, Petr Kren „Measurement of frequency differences between the components of R(56)32-0 line using a portable Nd :YVO4/KTP/I2 laser at 532 nm”, Poster (SPIE 4401-30) on “Lasers In Metrology And Art Conservation, Recent Developments in Traceable Dimensional Measurements“, Munchen, (2001)
[25] S. Picard, L. Robertsson, L.-S. Ma, K. Nyholm, M. Merimaa, T. E. Ahola, P. Balling, P. Křen, J.-P. Wallerand „A comparison of 127I2-stabilized frequency-doubled Nd:YAG lasers at the BIPM, comparison in May 2001, 20 February 2003” Applied Optics, 42, 1019-1028 (2003)
[26] S. Picard, L. Robertsson, L.-S. Ma, Y. Millerioux, P. Juncar, J.-P. Wallerand, P. Balling, P. Křen,K. Nyholm, M. Merimaa, T. Ahola, and F.-L. Hong, „Results From International Comparisons at the BIPM Providing a World-Wide Reference Network Of 127I2 – Stabilized Frequency-Doubled Nd:YAG Lasers”, - CPEM 2002, digest and poster Tu P29, - IEEE Transactions on Instrumentation and Measurement, 52, 2, 236-239, (2003)
[27] Knight D.J.E., Pharaoh K.I., Barwood G.P., Humphreys D.A., „Frequency standards at 1.523µm based on 20Ne at 1.56 µm derived from the 0.780µm Rb frequency standard”, SPIE Proc. 1837-17 (Frequency stabilized lasers and their applications, Boston 1992)
[28] R. Klein, A. Arie, „Observation of iodine transitions using the second and third harmonics of a 1.5-µm laser” Appl. Phys. B 75, 79-83 (2002)
[29] Sugiyama K., Onae A., Hong F.-L., Inaba H., Slyusarev S.N., Ikegami T., Ishikawa J., Minoshima K., Matsumoto H., Knight J.C., Wadsworth W.J., Russel P.St.J., „Optical frequency measurement using an ultrafast mode-locked laser at NMIJ/AIST”, 6th Symposium on Frequency Standards and Metrology (P. Gill ed.), World Scientific, 427-434, (2002)
[30] Nakagawa K., de Labachelerie M., Awaji Y., Kourogi M., „Accurate optical frequency atlas of the 1.5 µm bands of acetylene”, J. Opt. Soc. Am. B, 13, 2708-2714 (1996)
[31] „Měření vlnových délek laserů vlnoměrem“(Measurement of laser wavelengths by wave meter), written procedure of CMI No.814-MP-C407 (in Czech)
[32] Balling P. „Driving electronics for modulated He-Ne/I2 lasers”, internal report ČMI-KM-56/95, Prague, October 1995 (in Czech)
68
[33] Balling P., Blabla J.: "Properties of Iodine Cells Contaminated by the Heteromolecule 127I129I , IEEE Transactions on Instrumentation and Measurement, 47, 6, 1481-1486, (1998)
[34] P. Balling and P. Křen, „Development of Wavelength Standard at 1542 nm: Acetylene Stabilized DFB Laser”, WDS'05 Proceedings of Contributed Papers: Part III - Physics (ed. J. Safrankova), Prague, Matfyzpress,. 590-594, (2005). ISBN 80-86732-59-2 http://www.mff.cuni.cz/veda/konference/wds/contents/pdf05/WDS05_104_f6_Balling.pdf
[35] Jiang J., Onae A., Matsumoto H., Hong F.-L. „Frequency Measurement of Acetylene-Stabilized Lasers using a Femtosecond Optical Comb Without Carrier-Envelope Offset Frequency Control”, Opt. Express, 13, 6, 1958-65, (2005)
[36] Madej A. A., Bernard J. E., Alcock A. J., Czajkowski A., Chepurov S. „Accurate Absolute Frequencies of the ν1 +ν3 Band of 13C2H2 Determined Using an Infrared Mode-Locked Cr:YAG Laser Frequency Comb”, J. Opt. Soc. Am. B, 23, 4, 741-749, (2006)
[37] Edwards C. S., Margolis H. S., Barwood G. P., Lea S. N., Gill P., Rowley W. R. C. „High-Accuracy Frequency Atlas of 13C2H2 in the 1.5 µm Region” Appl. Phys. B, 80, 977-83 (2005)
[38] P. Balling, M. Fischer, P. Kubina, and R. Holzwarth, „Absolute frequency measurement of wavelength standard at 1542nm: acetylene stabilized DFB laser" Opt. Express 13, 9196-9201 (2005), http://www.opticsexpress.org/abstract.cfm?URI=OPEX-13-23-9196
[39] Consultative Committee for Length (CCL), „Report of the 12th meeting (15 – 16 September 2005) to the International Committee for Weights and Measures”, Bureau International des Poids et Mesures
[40] K. M. Evenson, J. S. Wells, F. R. Petersen, B. L. Danielson, G. W. Day, R. L. Barger, and J. L. Hall, „Speed of Light from Direct Frequency and Wavelength Measurements of the Methane-Stabilized Laser”, Phys. Rev. Lett. 29, 1346-1349 (1972).
[41] Riehle F, Schnatz H, Lipphardt B, Zinner G, Trebst T, Helmcke J „The optical calcium frequency standard”, IEEE Transactions on Instrumentation and Measurement, 48, 2, 613-617 (1999)
[42] Jun Ye, Harald Schnatz, and Leo W. Hollberg, „Optical Frequency Combs: From Frequency Metrology to Optical Phase Control”, IEEE Journal Of Selected Topics in Quantum Electronics, 9, 4, 1041 (2003),
[43] M.Kourogi, K. Nakagawa, and M.Ohtsu, „Wide span optical frequency comb generator for accurate optical frequency difference measurement”, IEEE J. Quantum Electronics, 29, 10, 2693-2701, (1993)
[44] H.R. Telle, D. Meschede, and T.W. Hänsch „Realization of a New Concept for Visible Frequency Division: Phase Locking of Harmonic and Sum Frequencies”, Opt. Lett., 15, 532 (1990)
[45] Th. Udem, J. Reichert, R. Holzwarth, M. Kourogi, and T.W. Hänsch „The Measurement of Large Optical Frequency Differences and the Design of a new Type of Frequency Chain”, Joint Meeting of the EFTF-FCS, Besançon 1999 IEEE Proceedings, pp. 620-625.
[46] D. E. Spence, P. N. Kean, and W. Sibbett, „60-fsec pulse generation from a self-mode-locked Ti:sapphire laser," Opt. Lett. 16, 42-44 (1991)
[47] CIPM “RECOMMENDATION ADOPTED BY THE INTERNATIONAL COMMITTEE FOR WEIGHTS AND MEASURES” RECOMMENDATION 1 (CI-2006): Concerning secondary representations of the second, http://www.bipm.org/cc/CIPM/Allowed/95/REC1_CIPM_2006.pdf, http://www.bipm.org/cc/CCTF/Allowed/17/Proposal2-CCTF2006.pdf
[48] Jun Ye, Harald Schnatz, and Leo W. Hollberg „Optical Frequency Combs: From Frequency Metrology to Optical Phase Control”, IEEE Journal of Selected Topics in Quantum Electronics, 9, 4, 1041 (2003)
[49] Long-Sheng Ma, Zhiyi Bi, Albrecht Bartels, Lennart Robertsson, Massimo Zucco, Robert S. Windeler, Guido Wilpers, Chris Oates, Leo Hollberg, and Scott A. Diddams „Optical Frequency Synthesis and Comparison with Uncertainty at the 10-19 Level”, Science 19, 303, (2004) 1843-1845
[50] A. Bartels and H. Kurz „A New, Simpler Tool:1 GHz Ti:sapphire Octave-Spanning Oscillator” Opt. Lett. 27, 1839 (2002)
69
[51] P. Kubina, P. Adel, F. Adler, G. Grosche, T. W. Hänsch, R. Holzwarth, A. Leitenstorfer, B. Lipphardt, and H. Schnatz, „Long term comparison of two fiber based frequency comb systems”, Opt. Express 13, 904-909 (2005), http://www.opticsexpress.org/abstract.cfm?URI=OPEX-13-3-904
[52] A. Alcock, P. Ma, P. Poole, S. Chepurov, A. Czajkowski, J. Bernard, A. Madej, J. Fraser, I. Mitchell, I. Sorokina, and E. Sorokin „Ultrashort pulse Cr4+:YAG laser for high precision infrared frequency interval measurements”, Opt. Express 13, 8837-8844 (2005)
[53] S. A. Meyer, J. A. Squier and S. A. Diddams, „Diode-pumped Yb:KYW femtosecond laser frequency comb with stabilized carrier-envelope offset frequency”, Eur. Phys. J. D 48, 19-26 (2008)
[54] Parama Pal, Wayne H. Knox, Ingmar Hartl, and Martin E. Fermann, „Self referenced Yb-fiber-laser frequency comb using a dispersion micromanaged tapered holey fiber," Opt. Express 15, 12161-12166 (2007)
[55] „Optical Frequency Synthesizer FC 8004 Manual”, Vers 1.3 March 2006, Menlo Systems GmbH, Munich, Germany
[56] „Measurement of optical frequencies with fs comb”, CMI procedure 814-MP-C409, (in Czech) [57] Calibration certificates URE KL 3/2006 and UFE 1/2008 [58] M. Matus, The CCL Workshop on Comb Technology 2003,
http://www.bipm.org/utils/en/pdf/Michael_Matus.pdf [59] P. Balling, P. Křen „Absolute frequency measurements of wavelength standards 532 nm, 543 nm,
633 nm and 1540 nm”, European Physical Journal D, 48, 3-10 (2008) [60] Petr Balling, Petr Křen, Pavel Mašika, and S. A. van den Berg, „Femtosecond frequency comb
based distance measurement in air" Opt. Express 17, 9300-9313 (2009) http://www.opticsinfobase.org/oe/abstract.cfm?URI=oe-17-11-9300
[61] M. Matus, P. Balling, M. Šmíd, J. Walczuk, E. Bánréti, K. Tomanyiczka, GH. Popescu, A. Chartier and J.-M. Chartier „International comparisons of He-Ne lasers stabilized with 127I2 at λ≈633 nm (September 1999)”, Metrologia, 39, 83 (2002)
[62] Calibration Certificate No. 61, 2003 August 20, Bureau International des Poids et Mesures, Pavillon de Breteuil, 92312 SEVRES, France
[63] P. Balling, P. Křen „ Iodine Frequency Stabilized Lasers in CMI”, digest of the Conference on Precision Electromagnetic Measurement 2004, ISBN 0-7803-8493-8,. 215-216, (poster Tu4c33)
[64] Direct comparison of 3 optical femtosecond comb generators, EURAMET project 1045 (http://www.euramet.org, http://www.euramet.org/index.php?id=tc-projects)
[65] CIPM Mutual recognition of national measurement standards http://www.bipm.org/en/cipm-mra/mra_main_text.html, Calibration and Measurement Capabilities – CMCs (Appendix C) http://kcdb.bipm.org/, CMI CMCs for 1542nm standard and com can be found under service identifiers CMI/72 and CMI/73 in http://kcdb.bipm.org/AppendixC/L/CZ/L_CZ.pdf .
[66] Approval proceeding of National Standard of Length, ÚNMZ (COSMT) No. 36, ECM 110-1/08-036, Prague, 1st February 2008. Věstník Úřadu pro normalizaci a měření, Číslo 4 Duben 2008, OZNÁMENÍ č. 08/08, str 118 http://web.unmz.cz/v/vest0804.pdf (in Czech)
[67] Jean-Pierre Wallerand, Ahmed Abou-Zeid, Thomas Badr, Petr Balling, Jorma Jokela, Rupert Kugler, Michael Matus, Mikko Merimaa, Markku Poutanen, Emilio Prieto, Steven van den Berg, Massimo Zucco, „Towards new absolute long distance measurement in air ,” 2008 NCSL International Workshop and Symposium, Orlando (USA) http://www.longdistanceproject.eu/files/towards_new_absolute.pdf
70
List of figures Figure 1 Overview of wavelengths and uncertainties of Mise en Pratique for the realization
of SI definition of the metre (2005) .................................................................... 10 Figure 2 Wavelengths of 54 acetylene 13C2H2 transitions listed in Mise en Pratique 2001,
P(16) was chosen as reference line...................................................................... 12 Figure 3 Wavelength tuning of ECDL by Piezo voltage. Only single mode regions are
shown. ................................................................................................................. 14 Figure 4 Connection of temperature controller TEC-A1LD .............................................. 15 Figure 5 Frequency/wavelength tuning of DFB laser by temperature for three different
currents. (The same data arranged in different way)........................................... 15 Figure 6 Comparison of frequency tuning by temperature for two DFB lasers. ................ 16 Figure 7 Output power of DFB laser in dependence on current......................................... 16 Figure 8 Linear absorption in 9 cm cells for several acetylene 13C2H2 pressures, P(16) and
P(17) transitions. ................................................................................................. 17 Figure 9 Types of acetylene 13C2H2 cells produced and filled in ISI ................................. 17 Figure 10 Shape of Doppler broadened line detected with harmonic frequency modulation
of DFB laser by laser diode current. Left before, right after angle (8°) polishing of pigtail fibre...................................................................................................... 18
Figure 11 The arrangement and frequency stability of frequency locking of DFB lasers to the edges of linearly detected (Doppler broadened line) of acetylene. The green line (1 MHZ / 5×10⁻⁹ rel.) corresponds for free running laser to 0.2 mK instability of temperature 300K or 5 µA instability of laser current 300 mA. .... 19
Figure 12 Arrangement for sub-Doppler spectroscopy: ISOL - external (volume) optical isolator (in addition to internal -35dB one), PBS – polarizing beam splitter, λ/4 – quarter wave plate, M50% – semi transparent mirror, D - detector; and for frequency comparison: AOM acousto-optic modulator us as frequency shifter. 20
Figure 13 Common holder of optical elements and laser source with detector................... 21 Figure 14 Filtering and fine-tuning of laser diode current................................................... 22 Figure 15 Beat detector 50 kHz-900 MHz .......................................................................... 22 Figure 16 Acousto-optic modulator - frequency shifter ...................................................... 22 Figure 17 PPLN waveguide for SHG 1542 nm→771 nm (from HCP manual).................. 23 Figure 18 3D stage and stabilized oven for PPLN waveguide for SHG ............................. 23 Figure 19 Slow increase of efficiency of SHG with PPLN temperature homogenization .. 23 Figure 20 Two examples of DFB laser linewidth recorded as beat of two lasers. Horizontal
axis 2 MHz per division, vertical 2 dB/div. (Half is 3 dB below peak value) .... 24 Figure 21 Sub-Doppler line recorded by third harmonic technique .................................... 24 Figure 22 Modulation dependence of 4th harmonic for two acetylene pressures. ............... 25 Figure 23 Measured pressure broadening of 13C2H2 P(16) transition detected by linear
(Doppler broadened) spectroscopy and by saturation (sub-Doppler) spectroscopy. ....................................................................................................... 25
Figure 24 Stability of acetylene stabilized DFB lasers with two cell combinations during first experiments. ................................................................................................. 26
Figure 25 Modified arrangement of acetylene stabilized wavelength standard CMI Ethyn-1............................................................................................................................. 27
Figure 26 Measured amplitudes and linewidths of sub-Doppler 13C2H2 transitions ........... 27 Figure 27 Comparison of absolute frequency measurements of three acetylene transitions
submitted to CCL 2005. ...................................................................................... 29 Figure 28 Frequency chain for measurement of the frequency of infrared laser by caesium
clock (from [40]) ................................................................................................. 30
71
Figure 29 Illustration of frequency comb (from Menlo Systems FC8004 manual) ............ 31 Figure 30 Optical table for femtosecond frequency comb .................................................. 34 Figure 31 Optical layout of Menlo System FC8004 comb equipped with second PCF and
many translation and rotation stages for remote control and automation. AOM is an acousto-optic modulator, λ/2 - half wave plate, SM - stepper motors, OC - output coupler mirror, CP - compensation plate, DichM - dichroic mirror, SHG - the crystal for second harmonic generation, det - photodetectors (fr - repetition frequency, fo - offset frequency, fbeat - beat frequency with laser to be measured).............................................................................................................................. 35
Figure 32 MenloSystems comb FC8004 installed in CMI .................................................. 36 Figure 33 Photograph of fs comb laser................................................................................ 36 Figure 34 An example of visible part of comb spectra generated by PCF1 (optimized for
blue wavelengths, different settings possible). It contains 1.75 million teeth. ... 37 Figure 35 The stability of GPS referenced Rubidium clock. Bold blue - from certificate
issued by ÚFE, (dotted - the stability of caesium clock HP5071). ..................... 39 Figure 36 Counter values read by FXM software. Ch1 - offset frequency, Ch2 - repetition
frequency dev. (1GHz-5fr), Ch3,Ch4 - beat. ....................................................... 40 Figure 37 Main window of developed software .................................................................. 40 Figure 38 Example of measurement record (left axis absolute frequency deviation from
expected value in Hertz, bottom axis date and time, top axis measurement time in seconds. Light blue one second samples, dark blue 10s, green 100s, red 1000s. Decrease of measured value between 1 and 2 o’clock at night is due to counting error caused by decreased level of beat signal. ................................................... 41
Figure 39 Explanation of counting test - approximate shapes of two band pass filters f1 and f2.......................................................................................................................... 41
Figure 40 Histogram of counting quality test results for sufficient signal (32dB), one second samples. ................................................................................................... 42
Figure 41 Histogram of counting quality test results for very good signal (~38dB), 65 thousands of one second samples, after removal of 0.1% of wrongly counted samples (with counter difference > 0.6 Hz). Most samples agree to better than 0.05 Hz (3.5×10⁻¹⁶rel). This measurement also shows that there is no systematic deviation of counters due to shifted bandpass filters (i.e. the counters cycle interpolation error) - the deviation of averages was in this case 2.4µHz, corresponding to uncertainty 8×10-21 rel. ............................................................ 43
Figure 42 Stability and uncertainty of optical frequency measurement with comb compared to stability of CMI YAG1 and rubidium reference. Bold dotted line represents expanded (k=2) uncertainty of measurement with Rb clock/GPS disciplined fs comb. ................................................................................................................... 43
Figure 43 Two photon absorption autocorrelation trace of pulse of the comb fs laser (not recompressed, focused with simple lens). One fringe corresponds to ~800 nm path length difference or 2.7fs delay. .................................................................. 45
Figure 44 A few examples of fs laser spectra (in mode lock regime) detected by Fourier spectrometer. ....................................................................................................... 46
Figure 45 History of absolute frequency measurements of CMI PLO3 laser stabilized to component f. Displayed measurement uncertainties and reproducibility are about 10-times lower than general uncertainty of this kind of standard (20 kHz) in MeP [6] ........................................................................................................................ 47
Figure 46 Frequencies of d..j components of 633 nm lasers measured by fs comb at CMI displayed as a difference from values in MeP..................................................... 48
72
Figure 47 Latest measurements of absolute frequencies of wavelength 633 nm standards of CMI PLO3 and PL5 stabilized to several hyperfine spectral components displayed as a difference from values in MeP. The last series belongs to laser PL5 after replacement of the laser tube...............................................................49
Figure 48 History of absolute frequency measurements of the CMI PLG2 laser stabilized to component b10. Displayed uncertainties and reproducibility is about 25-times lower than general uncertainty of this kind of standards (50 kHz) in MeP and close to frequency of the other laser PLG1 operating with different type of laser tube (longer and with another neon isotope) and another iodine cell. ................ 50
Figure 49 Frequencies of several components of the PLG2 laser measured by fs comb in CMI displayed as differences from values in MeP. ............................................ 50
Figure 50 History of absolute frequency measurements of the CMI YAG1 laser stabilized to component a10. Displayed uncertainties and reproducibility are about 10-times lower than general uncertainty of this kind of standard (10 kHz) in MeP.52
Figure 51 Linewidths and relative intensities of most HFS components of 32-0 R(56) transition measured with CMI YAG1 laser. From left to right: a1, a2, a5 to a15.............................................................................................................................. 53
Figure 52 Measured intensities of HFS components of 32-0 R(56) transition sorted by quantum number F. Note ~symmetric behaviour around F=56. ......................... 53
Figure 53 Chart of frequency differences between CMI and BEV 532 nm wavelength standards (different colours correspond to 1, 10, 100 and 1000 second averages). Left axis values in Hz.......................................................................................... 54
Figure 54 The stability of CMI YAG1 laser from comparisons in 2001 (dark green bold) and in 2007 (all other green series) compared to reference rubidium (blue) and caesium (black dotted) clock............................................................................... 55
Figure 55 History of absolute measurements of acetylene (13C2H2) stabilized DFB laser CMI Ethyn1......................................................................................................... 56
Figure 56 Spectral sensitivity of silicon avalanche photodiode Menlo Systems (from manual). Arrows mark wavelengths of measured standards 532 nm, 543 nm, 633 nm, 771 nm (SHG of 1542 nm) and 1064 nm.............................................. 57
Figure 57 Tracking capability of the comb relative to optical frequency standard (red series) expressed as relative Allan standard deviation. ....................................... 58
Figure 58 Deviations of individual one-second samples (light blue, CMI result-BEV result, 97 949 valid samples). Top: method A)-synth, bottom: method B)-count. ........ 60
Figure 59 Deviations of averages of 7 individual series of measurement (of different lengths) for both methods of evaluation. Error bars correspond to two standard deviations of the mean......................................................................................... 61
Figure 60 Deviations of CMI and BEV combs expressed as Allan standard deviation (solid lines) and two standard deviations (dotted). Red for method A)-synth, black for method B)-count. The uncertainty (dotted violet) and stability (solid blue) of the laser under measurement is shown for information. Dotted bold blue line in the right refers to declared uncertainty (k=2) of CMI comb (for one day averaging time) .................................................................................................................... 61
Figure 61 Brief traceability scheme with National Standard of Length.............................. 64