Large-scale migration into Britain during the Middle to Late ...
Upload
khangminh22Category
view
0download
0
Large-Scale Migration into Southern Britain During the Middle to Late Bronze Age
Nick Patterson1,2,*, Michael Isakov3,*, Thomas Booth4,*, Lindsey Büster5,*, Claire-Elise Fischer5,*, Iñigo Olalde6,7,8, Harald Ringbauer1,2, Ali Akbari1,6, Olivia Cheronet9, Madeleine Bleasdale5, Nicole Adamski6,10, Eveline Altena11, Rebecca Bernardos6, Selina Brace12, Nasreen Broomandkhoshbacht6,10, Kimberly Callan6,10, Francesca Candilio13, Brendan Culleton14, Elizabeth Curtis6,10, Lea Demetz9, Kellie Sara Duffett Carlson9, Daniel M. Fernandes9,15, M. George B. Foody16, Suzanne Freilich9, Helen Goodchild5, Aisling Kearns6, Ann Marie Lawson6,10, Iosif Lazaridis1,6, Matthew Mah2,6,10, Swapan Mallick2,6,10, Kirsten Mandl9, Adam Micco2,6, Megan Michel6,10, Guillermo Bravo Morante9, Jonas Oppenheimer6,10, Kadir Toykan Özdoğan9, Lijun Qiu6, Constanze Schattke9, Kristin Stewardson6,10, J. Noah Workman6, Fatma Zalzala6,10, Zhao Zhang6, Bibiana Agustí17, Tim Allen18, Katalin Almássy19, Luc Amkreutz20,21, Abigail Ash22, Christèle Baillif-Ducros23, Alistair Barclay24, László Bartosiewicz25, Katherine Baxter26, Zsolt Bernert27, Jan Blažek28, Mario Bodružić29, Philippe Boissinot30, Clive Bonsall31, Pippa Bradley24, Marcus Brittain32, Alison Brookes33, Fraser Brown18, Lisa Brown34, Richard Brunning35, Chelsea Budd36, Josip Burmaz37, Sylvain Canet23, Silvia Carnicero-Cáceres38, Morana Čaušević-Bully39, Andrew Chamberlain40, Sébastien Chauvin23, Sharon Clough24, Natalija Čondić41, Alfredo Coppa6,9,42, Oliver Craig5, Matija Črešnar43,44, Vicki Cummings45, Szabolcs Czifra46, Alžběta Danielisová47, Robin Daniels48, Alex Davies18, Philip de Jersey49, Jody Deacon50, Csilla Deminger51, Peter W. Ditchfield52, Marko Dizdar53, Miroslav Dobeš47, Miluše Dobisíková54, László Domboróczki55, Gail Drinkall56, Ana Đukić57, Ceiridwen J. Edwards16, Michal Ernée47, Christopher Evans32, Jane Evans58, Manuel Fernández-Götz31, Slavica Filipović59, Andrew Fitzpatrick60, Harry Fokkens21, Chris Fowler61, Allison Fox62, Zsolt Gallina63, Michelle Gamble64, Manuel R. González Morales65, Borja González-Rabanal66, Adrian Green67, Katalin Gyenesei68, Diederick Habermehl69, Tamás Hajdu27,70, Derek Hamilton71, James Harris33, Chris Hayden18, Joep Hendriks72, Bénédicte Hernu73, Gill Hey18, Milan Horňák43, Gábor Ilon74, Eszter Istvánovits75, Andy M. Jones76, Martina Blečić Kavur77, Kevin Kazek78, Robert A. Kenyon79, Amal Khreisheh35, Viktória Kiss80, Jos Kleijne81, Mark Knight32, Lisette M. Kootker82, Péter F. Kovács83, Anita Kozubová84, Gabriella Kulcsár85, Valéria Kulcsár86, Christophe Le Pennec87, Michael Legge88, Matt Leivers89, Louise Loe18, Olalla López-Costas90, Tom Lord91, Dženi Los37, James Lyall92, Ana B. Marín-Arroyo66, Philip Mason44, Damir Matošević93, Andy Maxted94, Lauren McIntyre18, Jacqueline McKinley89, Kathleen McSweeney31, Bernard Meijlink95, Balázs G. Mende80, Marko Menđušić96, Milan Metlička97, Sophie Meyer98, Kristina Mihovilić99, Lidija Milasinovic100, Steve Minnitt35, Joanna Moore101, Geoff Morley102, Graham Mullan103, Margaréta Musilová104, Benjamin Neil32, Rebecca Nicholls105, Mario Novak106, Maria Pala16, Martin Papworth107, Cécile Paresys23, Ricky Patten32, Domagoj Perkić108, Krisztina Pesti109, Alba Petit110, Katarína Petriščáková111, Coline Pichon112, Catriona Pickard31, Zoltán Pilling113, T. Douglas Price114, Siniša Radović115, Rebecca Redfern116, Branislav Resutík104, Daniel T. Rhodes117, Martin B. Richards16, Amy Roberts118, Jean Roefstra119, Pavel Sankot120, Alena Šefčáková121, Alison Sheridan122, Sabine Skae123, Miroslava Šmolíková111, Krisztina Somogyi124, Ágnes Somogyvári125, Mark Stephens126, Géza Szabó127, Anna Szécsényi-Nagy80, Tamás Szeniczey27,70, Jonathan Tabor32, Károly Tankó128, Clenis Tavarez Maria129, Rachel Terry130, Biba Teržan43, Maria Teschler-Nicola9,131, Jesús F. Torres-Martínez132, Julien Trapp78, Ross Turle133, Ferenc Ujvári109, Menno van der Heiden134, Petr Veleminsky54, Barbara Veselka135,136, Zdeněk Vytlačil54, Clive Waddington137, Paula Ware126, Paul Wilkinson138, Linda Wilson103, Rob Wiseman32, Eilidh Young139, Joško Zaninović140, Andrej Žitňan141, Carles Lalueza-Fox142, Peter de Knijff11, Ian Barnes12, Peter Halkon143, Mark G. Thomas144, Douglas J. Kennett145, Barry Cunliffe146, Malcolm Lillie36,147, Nadin Rohland2,6, Ron Pinhasi9, Ian Armit5, David Reich1,2,6,10 * Co-lead authors: N. Patterson, M. Isakov, T. Booth, L. Büster, C.-E. Fischer
Correspondence to: R. Pinhasi ([email protected]), I. Armit ([email protected]), and D. Reich ([email protected])
2
1Department of Human Evolutionary Biology, Harvard University, Cambridge, MA 02138 2Broad Institute of MIT and Harvard, Cambridge, MA 02142, USA 3Harvard College, Cambridge, MA 02138, USA 4The Francis Crick Institute, London, NW1 1AT, UK 5Department of Archaeology, University of York, York YO1 7EP, UK 6Department of Genetics, Harvard Medical School, Boston, Massachusetts 02115, USA 7BIOMICs Research Group, University of the Basque Country UPV/EHU, 01006 Vitoria-Gasteiz, Spain 8Ikerbasque – Basque Foundation of Science, 48009 Bilbao, Spain 9Department of Evolutionary Anthropology, University of Vienna, 1090 Vienna, Austria 10Howard Hughes Medical Institute, Boston, MA 02115, USA 11Department of Human Genetics, Leiden University Medical Center, Leiden 2333 ZC, The Netherlands 12Department of Earth Sciences, Natural History Museum, London SW7 5BD, UK 13Servizio di Bioarcheologia, Museo delle Civiltà, 00144, Rome, Italy 14Institutes of Energy and the Environment, The Pennsylvania State University, University Park, PA 16802, USA 15CIAS, Department of Life Sciences, University of Coimbra, 3000-456 Coimbra, Portugal 16Department of Biological and Geographical Sciences, School of Applied Sciences, University of Huddersfield, Queensgate, Huddersfield, HD1 3DH, UK 17INSITU S.C.P. Centelles, 08540 Barcelona, Spain 18Oxford Archaeology, Oxford, OX2 0ES, UK 19Městské Muzeum v Čelákovicích, 250 88 Čelákovice, Czech Republic 20National Museum of Antiquities, Leiden, Netherlands 21Faculty of Archaeology, Leiden University, 2333 CC Leiden, The Netherlands 22Independent Researcher, Soham, Ely, CB7 5DG, UK 23Institut National de Recherches Archéologiques Préventives (INRAP), 75685 Paris cedex 14, France 24Cotswold Archaeology, Cirencester, Gloucestershire, GL7 6BQ, UK 25Department of Archaeology and Classical Studies, Stockholm University, 106 91 Stockholm, Sweden 26Leeds Museums and Galleries, Leeds Discovery Centre, Leeds LS10 1LB, UK 27Department of Anthropology, Hungarian Natural History Museum, H-1083 Budapest, Hungary 28Institute of Preservation of Archaeological Heritage of Northwest Bohemia, 43401 Most, Czech Republic 29Stratum Ltd., 21218 Seget Donji, Croatia 30TRACES, Ecole des Hautes Etudes en Sciences Sociales, 31058 Toulouse, France 31School of History, Classics and Archaeology, University of Edinburgh, Edinburgh EH8 9AG, UK 32Cambridge Archaeological Unit, Department of Archaeology, University of Cambridge, Cambridge CB2 3DZ, UK 33Corinium Museum, Park Street, Cirencester, GL7 2BX, UK 34Wiltshire Museum, Devizes SN10 1NS, UK 35South West Heritage Trust, Somerset Heritage Centre, Norton Fitzwarren, Taunton, TA2 6SF, UK 36Department of Historical, Philosophical and Religious Studies, Umeå University 901 87, Umeå, Sweden 37Kaducej Ltd., 21000 Split, Croatia 38Instituto de Medicina Legal y Ciencias Forenses de Cantabria, Santander, Spain
3
39Université de Franche Comté / UMR Chrono-Environnement, 25030 Besançon, France 40School of Earth and Environmental Sciences, University of Manchester, Manchester, M13 9PL, UK 41Archaeological Museum Zadar, 23000 Zadar, Croatia 42Department of Environmental Biology, University of Rome, La Sapienza, 00185 Rome, Italy 43Department of Archaeology, Centre for Interdisciplinary Research in Archaeology, Faculty of Arts, 1000 Ljubljana, Slovenija 44Institute for the Protection of Cultural Heritage of Slovenia, Conservation Centre, Centre for Preventive Archaeology, SI-1000 Ljubljana, Slovenia 45School of Natural Sciences, University of Central Lancashire, Preston, Lancashire PR1 2HE, UK 46Hungarian National Museum, 1113 Budapest, Hungary 47Institute of Archaeology of the Czech Academy of Sciences, Prague, 11801 Prague 1, Czech Republic 48Tees Archaeology, Hartlepool, TS24 8BT, UK 49Guernsey Museums & Galleries, Candie Gardens, St Peter Port, Guernsey, GY1 1UG, UK 50Amgueddfa Cymru – National Museum Wales, Cardiff CF10 3NP, UK 51Kuny Domokos Museum, H-2890 Tata, Hungary 52Research Laboratory for Archaeology, School of Archaeology, University of Oxford, Oxford OX1 3TG, UK 53Institute of Archaeology, 10000 Zagreb, Croatia 54Department of Anthropology, The National Museum, Prague, Prague 9, 19300 Horní Počernice, Czech Republic 55Department of Archaeology, Dobó István Castle Museum, 3300 Eger, Hungary 56The Orkney Museum, Kirkwall KW15 1DH, UK 57Archaeological Museum in Zagreb, 10000 Zagreb, Croatia 58British Geological Survey, Keyworth Nottingham, Nottinghamshire NG12 5GG, UK 59Archaeological Museum Osijek, 31000 Osijek, Croatia 60Archaeology and Ancient History, University of Leicester, Leicester, LE1 7RH, UK 61School of History, Classics and Archaeology, Newcastle University, Newcastle upon Tyne NE1 7RU, UK 62Manx National Heritage, Eiraght Ashoonagh Vannin, Manx Museum, Douglas IM1 3LY, Isle of Man 63Ásatárs Ltd., 6000 Kecskemét, Hungary 64Heritage and Archaeological Research Practice (HARP), Edinburgh, EH2 3JG 65Instituto Internacional de Investigaciones Prehistóricas de Cantabria, Universidad de Cantabria, 39005 Santander, Cantabria, Spain 66Grupo EvoAdapta, Departamento de Ciencias Históricas, Universidad de Cantabria, Santander, Spain 67The Salisbury Museum, Salisbury SP1 2EN, UK 68Department of Biological Anthropology, Institute of Biology, Faculty of Science, Eötvös Loránd University, Hungary 69VUhbs Archaeology, VU University, 1081 HV Amsterdam, The Netherlands 70Department of Biological Anthropology, Eötvös Loránd University, H-1117 Budapest, Hungary 71Scottish Universities Environmental Research Centre (SUERC), East Kilbride, G75 0QF, UK 72Bureau Archeologie en Bodemkwaliteit, Gemeente Nijmegen, 6500 HG Nijmegen, The Netherlands 73Musée Saint-Remi, Ville de Reims, 51000 Reims, France 74Savaria Museum, 9700 Szombathely, Hungary

4
75Jósa András Museum, H-4400 Nyíregyháza, Hungary 76Cornwall Archaeology Unit, The, Truro TR1 3AY, UK 77Faculty of Humanities, University of Primorska, 6000 Koper, Slovenia 78Musée de La Cour d'Or, 57000 Metz, France 79East Dorset Antiquarian Society (EDAS), Merrow, West Bexington, Dorset, DT2 9DG, UK 80Institute of Archaeogenomics, Research Centre for the Humanities, Eötvös Loránd Research Network, 1097 Budapest, Hungary 81Groningen Institute of Archaeology, Groningen University, Groningen, Netherlands 82Geology and Geochemistry Cluster, Vrije Universiteit Amsterdam, 1081 HV Amsterdam, The Netherlands 83Damjanich János Museum, H-5000 Szolnok, Hungary 84Archaeological Institute of the Slovak Academy of Sciences, 949 21 Nitra, Slovakia 85Institute of Archaeology, Research Centre for the Humanities, Eötvös Loránd Research Network, 1097 Budapest, Hungary 86University of Szeged, Faculty of Arts, Department of Archaeology, 6722 Szeged, Hungary 87Musee d'Histoire et d'Archeologie, 56000 Vannes, France 88School of History, Archaeology and Religion, Cardiff University, Cardiff, CF10 3EU, UK 89Wessex Archaeology, Salisbury SP4 6EB, UK 90Group EcoPast. CRETUS. Area of Archaeology, Department of History, Universidade de Santiago de Compostela, 15782 Santiago de Compostela, Spain 91Lower Winskill Farm, Langcliffe, Settle, BD24 9PZ, UK 92Geophiz.biz, West Heslerton, North Yorkshire, YO17 8RQ, UK 93Zavičajni Muzej Grada Rovinja, 52210 Rovinj, Croatia 94Royal Pavillion and Museums, Brighton BN1 1EE, UK 95Walcherse Archeologische Dienst, 4331 CK Middelburg, The Netherlands 96Conservation Department in Šibenik, Ministry of Culture of the Republic of Croatia, 22000 Šibenik, Croatia 97Museum of West Bohemia, Department of Prehistory, 30100, Czech Republic 98Royal Cornwall Museum, Truro, Cornwall TR1 2SJ, UK 99Archaeological Museum of Istria, 52100 Pula, Croatia 100National Museum of Kikinda, 23300 Kikinda, Serbia 101Department of Archaeology, Durham University, Durham, DH1 3LE, UK 102MOLES Archaeology, Courtwood House, Silver Street Head, Sheffield, S1 2DD, UK 103University of Bristol Spelaeological Society, University of Bristol Student Union Building, Queens Road, Bristol, BS8 1LN, UK 104Municipal Monument Preservation Institute Bratislava, 811 01, Bratislava, Slovakia 105Archaeological and Forensic Sciences, University of Bradford, Bradford, BD7 1DP, UK 106Centre for Applied Bioanthropology, Institute for Anthropological Research, 10000 Zagreb, Croatia 107National Trust, Dorset & Wiltshire, Tisbury, Wiltshire SP3 6LW, UK 108Archaeological Museum, Dubrovnik Museums, 20000 Dubrovnik, Croatia 109Rómer Flóris Museum of Art and History, 9021 Győr, Hungary 110Departament de Biologia Animal, de Biologia Vegetal i d’Ecologia, Universitat Autònoma de Barcelona, Bellaterra, Cerdanyola del Vallés, Spain 111The City of Prague Museum, 11000 Prague 1, Czech Republic 112Musée Le Vergeur, 51100 Reims, France 113Independent researcher, H 1097 Budapest, Hungary 114Department of Anthropology, University of Wisconsin-Madison, Madison, Wisconsin 53706, USA

5
115Institute for Quaternary Palaeontology and Geology, Croatian Academy of Sciences and Arts, 10000 Zagreb, Croatia 116Centre for Human Bioarchaeology, Museum of London, 150 London Wall, London EC2Y 5HN, UK 117National Trust For Scotland, Hermiston Quay, Edinburgh EH11 4DF, UK 118The Novium Museum, Chichester, PO19 1QH, UK 119Provinciaal Archeologisch Depot Noord-Holland, 1901 Castricum, The Netherlands 120Department of Prehistory and Classical Antiquity, The National Museum, Prague, 11579 Prague 1, Czech Republic 121Slovak National Museum – Natural History Museum, 810 06 Bratislava 16, Slovakia 122National Museums Scotland, Edinburgh EH1 1JF, UK 123The Dock Museum, Barrow-in-Furness, Cumbria LA14 2PW, UK 124Rippl-Rónai Museum, 7400 Kaposvár, Hungary 125Katona József Museum Hungary, Kecskemét, H-6000, HUNGARY 126MAP Archaeological Practice, Showfield Lane, Malton, North Yorkshire, YO17 6BT, UK 127Wosinsky Mór Museum, 7100 Szekszárd, Hungary 128MTA - ELTE Research Group for Interdisciplinary Archaeology, Eötvös Loránd University, 1088 Budapest, Hungary 129Museo del Hombre Dominicano, Santo Domingo 10204, Dominican Republic 130Craven Museum and Gallery, Skipton, BD23 1AH, UK 131Department of Anthropology, Natural History Museum Vienna, 1010 Vienna, Austria 132Instituto Monte Bernorio de Estudios de la Antigüedad del Cantábrico (IMBEAC) & Universidad Complutense de Madrid, Facultad de Geografía e Historia, Departamento de Prehistoria, Historia Antigua y Arqueología, 28040, Madrid, Spain 133Hampshire Cultural Trust, Winchester, SO23 8RB, UK 134Rijksdienst voor het Cultureel Erfgoed, Amersfoort, Netherlands 135Maritime Cultures Research Institute, Department of Art, Sciences, and Archaeology, Vrije Universiteit Brussel, 1050 Brussels, Belgium 136Research Unit: Analytical, Environmental & Geo-Chemistry, Department of Chemistry, Vrije Universiteit Brussel, 1050 Brussels, Belgium 137Archaeological Research Services, Angel House, Portland Square, Bakewell, Derbyshire, DE45 1HB, UK 138Swale and Thames Archaeological Survey Company, Faversham, Kent, ME13 8UP, UK 139Keswick Museum, Keswick CA12 4NF, UK 140Krka National Park, 22000 Šibenik, Croatia 141AA AVALA s.r.o., 821 04 Bratislava, Slovakia 142Institute of Evolutionary Biology, CSIC-Universitat Pompeu Fabra, 08003 Barcelona, Spain 143Department of History, University of Hull, Hull, HU6 7RX, UK 144Research Department of Genetics, Evolution and Environment, University College London, London WC1E 6BT, UK 145Department of Anthropology, University of California, Santa Barbara, CA 93106, USA 146Institute of Archaeology, University of Oxford, Oxford OX1 2PG, UK 147Department of Geography, Geology and Environment, University of Hull, Hull, HU6 7RX, UK

6
Present-day populations from England and Wales harbour more ancestry derived from 1
Early European Farmers (EEF) than did people of the Early Bronze Age. To study how 2
this occurred, we generated genome-wide data from 803 individuals, almost all from the 3
Middle to Late Bronze Age and the Iron Age, increasing data in this period from Britain 4
by 12-fold, and from Western and Central Europe by more than two-fold. Between 1000-5
875 BCE, EEF ancestry increased in southern Britain (England and Wales) but not in 6
northern Britain (Scotland), due to incorporation into the population of a stream of 7
migrants who arrived at this time and in previous centuries and who were genetically most 8
similar to ancient individuals from France. These migrants cumulatively contributed 9
about half the ancestry of Iron Age people of England and Wales, thereby documenting a 10
previously unknown demographic process that is a plausible vector for the spread of early 11
Celtic languages into Britain. These patterns are part of a broader trend of EEF ancestry 12
proportions becoming more similar across Central and Western Europe in the Middle to 13
Late Bronze Age, coincident with intensification of cultural exchange and highlighting this 14
period as a peak of interaction and mobility. We find no evidence of a comparable rate of 15
migration into Britain in the Iron Age. The distinct genetic trajectories of Britain and 16
continental Europe in the Iron Age are also exemplified by the fact that the allele 17
conferring lactase persistence rose to ~50% frequency in Britain by this time whereas it 18
was only ~7% in Central Europe and underwent a comparable rise in frequency only a 19
millennium later, a pattern that could only occur if there were qualitative differences in 20
how dairy products were used in Britain and in Central Europe. 21
“Migration” is a central concept in both population genetics and archaeology, but its meaning 22
has evolved in divergent ways in the course of the development of these disciplines1. Population 23
geneticists use “migration” to refer to any movement of genetic material from one region to 24
another, but from an archaeological perspective this can be too broad, since this definition 25
would see even low-level symmetrical exchanges of mates between adjacent communities as 26
representing migration. Archaeologists generally use “migration” to refer to processes that 27
result in significant demographic change due to directed and permanent translocation of people 28
from one region to another2,3. In European archaeology, discussions of prehistoric migrations 29
have become fraught due to the ways in which theories of migration were exploited for political 30
purposes in the early-mid twentieth century—when movement of large numbers of people over 31
a short period of time was sometimes argued to be a primary mechanism for the spread of ethnic 32
groups4 and archaeological reconstructions of such events were used to justify claims on 33
territory5. Setting a high bar for theorizing migration, however—for example by only using it 34

7
when there is clear evidence for organized movements of people over a short period of time—35
minimizes the important effects that cumulatively large-scale movements are likely to have had 36
in shaping prehistory2, such as the westward migration of people from the Steppe beginning in 37
the third millennium BCE that genetic data have unambiguously shown contributed much of the 38
ancestry of later Europeans including eventually people from Britain6,7,8,9. We emphasize that 39
the large-scale Middle to Late Bronze Age migrations we document here unfolded over 40
hundreds of years as attested by our radiocarbon dating data and so cannot all be explained by 41
movement over a short time. 42
Whole genome ancient DNA studies have shown that the first Neolithic farmers of the island of 43
Great Britain (hereafter Britain) who lived 3950-2450 BCE derived roughly 80% of their 44
ancestry from Early European Farmers (EEF) who originated in Anatolia more than two 45
millennia earlier, and 20% from Mesolithic hunter-gatherers (Western European Hunter-46
Gatherers: WHG)8-10. The WHG ancestry in the first British farmers was almost entirely due to 47
admixture in continental Europe, indicating that migrants in the Neolithic brought this WHG 48
ancestry with them and local WHG contributed negligibly to the ancestry of later people in 49
Britain. The Neolithic population of Britain was genetically similar to, and almost certainly 50
derived from, contemporaneous populations from continental Europe, especially Iberia and 51
France. This ancestry profile remained stable for about a millennium and a half. From around 52
2450 BCE, the onset of the Chalcolithic period, there was another substantial movement of 53
people into Britain (minimum 90% of ancestry from the new migrants) coinciding with the 54
spread of Bell Beaker traditions from continental Europe which brought a third major 55
component: ‘Steppe ancestry’ derived originally from people living on the Pontic-Caspian 56
Steppe ~3000 BCE8. In the original study8 reporting this ancestry shift in Britain, no significant 57
average change in the proportion of EEF ancestry was detected from the Chalcolithic/Early 58
Bronze Age (C/EBA; 2450-1550 BCE), through the Middle Bronze Age (MBA; 1550-1150 59
BCE) and Late Bronze Age (LBA; 1150-750 BCE), to the pre-Roman Iron Age (IA; 750 BCE-60
43 CE). However, that study contained little data after 1300 BCE (Figure 1). Today, however, 61
EEF ancestry is significantly higher on average in southern Britain (defined here as England and 62
Wales although we recognize modern boundaries are arbitrary) than in northern Britain 63
(Scotland), raising the question of when this increase in EEF ancestry occurred8,11. The rise in 64
EEF ancestry in England and Wales cannot be explained by migration from northern continental 65
Europe in the early medieval period12,13, as early medieval migrant groups harboured less EEF 66
ancestry than was present in Bronze Age Britain and hence would have decreased EEF ancestry 67
instead of increasing it as we observe8. 68
8
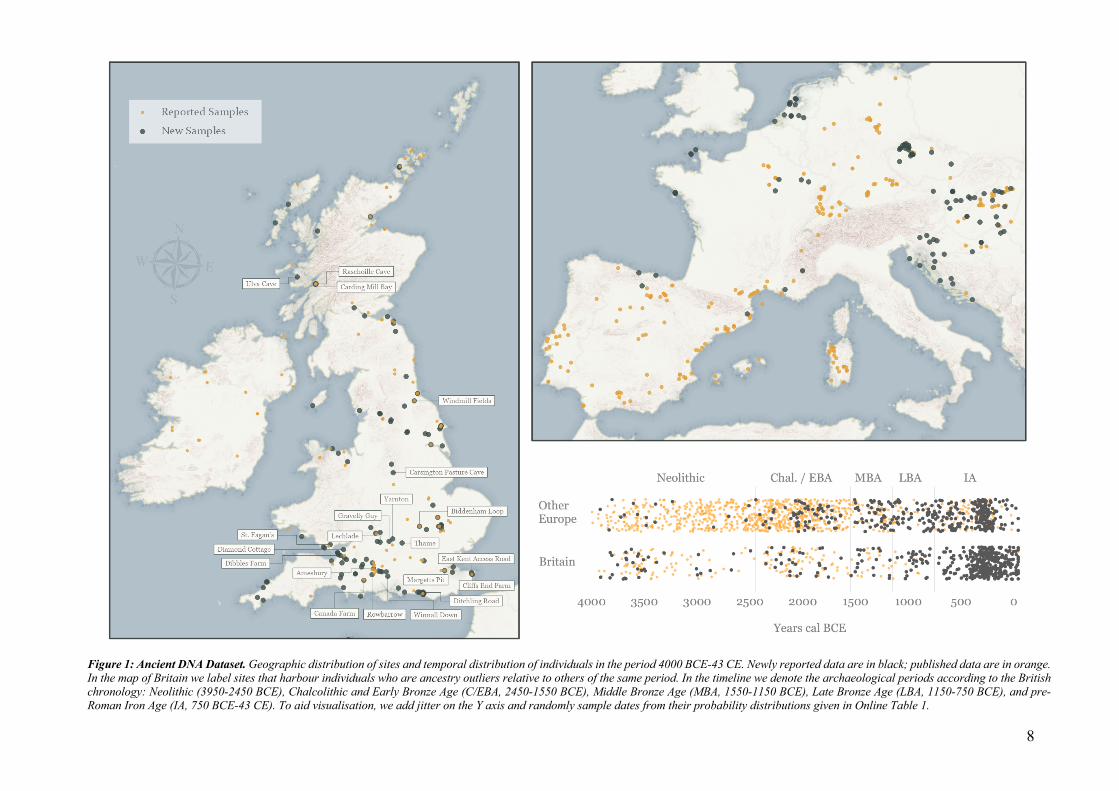
Figure 1: Ancient DNA Dataset. Geographic distribution of sites and temporal distribution of individuals in the period 4000 BCE-43 CE. Newly reported data are in black; published data are in orange. In the map of Britain we label sites that harbour individuals who are ancestry outliers relative to others of the same period. In the timeline we denote the archaeological periods according to the British chronology: Neolithic (3950-2450 BCE), Chalcolithic and Early Bronze Age (C/EBA, 2450-1550 BCE), Middle Bronze Age (MBA, 1550-1150 BCE), Late Bronze Age (LBA, 1150-750 BCE), and pre-Roman Iron Age (IA, 750 BCE-43 CE). To aid visualisation, we add jitter on the Y axis and randomly sample dates from their probability distributions given in Online Table 1.
9
We generated new ancient DNA data from 426 previously unanalysed individuals from Britain, 69
increasing the number of pre-Roman individuals to 608 and multiplying by 28-fold the number 70
from the combined period of the LBA and IA (from 13 to 365) (Fig. 1, Supplementary 71
Information section 1, Online Table 1). We also report data from previously unanalysed ancient 72
individuals mostly dating to the LBA and IA from the Czech Republic (n=160), Hungary 73
(n=54), France (n=52), the Netherlands (n=28), Slovakia (n=25), Croatia (n=21), Slovenia 74
(n=14), Spain (n=10), Serbia (n=8) and Austria (n=3). We increased data quality on 33 75
previously published individuals (Online Table 1). To generate these data, we prepared powder 76
from bones and teeth, extracted DNA14-16, and generated 1033 sequencing libraries all 77
pretreated with the enzyme uracil-DNA glycosylase to reduce characteristic cytosine-to-thymine 78
errors of ancient DNA (Online Table 2)14,15,17. We enriched libraries in solution and sequenced 79
them.18-20 We co-analysed with previously reported data for a total of 5928 ancient and present-80
day individuals (Online Table 3). We clustered by time and geography aided by 126 newly 81
reported radiocarbon dates (Online Table 4). We separately labelled individuals that were 82
significantly different in ancestry from the majority cluster from each time period and region 83
(Supplementary Information section 2, Online Table 5). Although we report data from all 84
individuals, we removed a subset from the main analysis: those with evidence of contamination 85
based on finding variation in parts of their genome where they are expected to have DNA from 86
only one parent21,22, those with a rate of damage in the final nucleotide lower than is typical for 87
authentic ancient DNA15, those that were first degree relatives of other higher coverage 88
individuals in the dataset23, or those that had too little data for accurate ancestry inference 89
(<30,000 single nucleotide polymorphisms (SNPs) covered at least once) (Online Table 5). 90
Figure 1 shows a map of analysed individuals. We identified 127 individuals from 50 families 91
as related (within the third degree) to at least one other newly reported individual in the dataset 92
(Online Table 6). 93
We computed symmetry-f4 statistics24,25 between all pairs of temporal groupings of individuals 94
in Britain, testing for differences in the rate of allele sharing (genetic drift) with the two major 95
source populations (Steppe and EEF); we computed standard errors using a Block Jackknife. 96
We document a significant increase in the degree of allele sharing with EEF populations in 97
England and Wales over the Middle to Late Bronze Age (M-LBA) and into the IA (Extended 98
Data Table 1). To estimate the proportions of EEF, Steppe, and WHG ancestry in any “Target” 99
population26, we leveraged the fact that the magnitudes of f4-statistics can be interpreted in 100
terms of mixture fractions. Specifically, qpAdm models the f4-statistics in each “Target” 101
10
population as a linear combination of the f4-statistics in populations we use as proxies for the 102
mixing “Sources.” qpAdm computes statistics of the form f4(Target, Sourcei; Outgroupj, 103
Outgroupk) that compare Target and Sources to a set of four “Outgroups” that we optimized to 104
provide more precise estimates of ancestry proportions than previous qpAdm setups 105
(Supplementary Information section 2). Here, our proxies for the “Sources” are 22 early Balkan 106
Neolithic farmers with minimal hunter-gatherer admixture (EEF); 20 Yamnaya and Poltavka 107
pastoralists (Steppe); and 18 Mesolithic hunter-gatherers from across Western Europe (WHG). 108
A
B
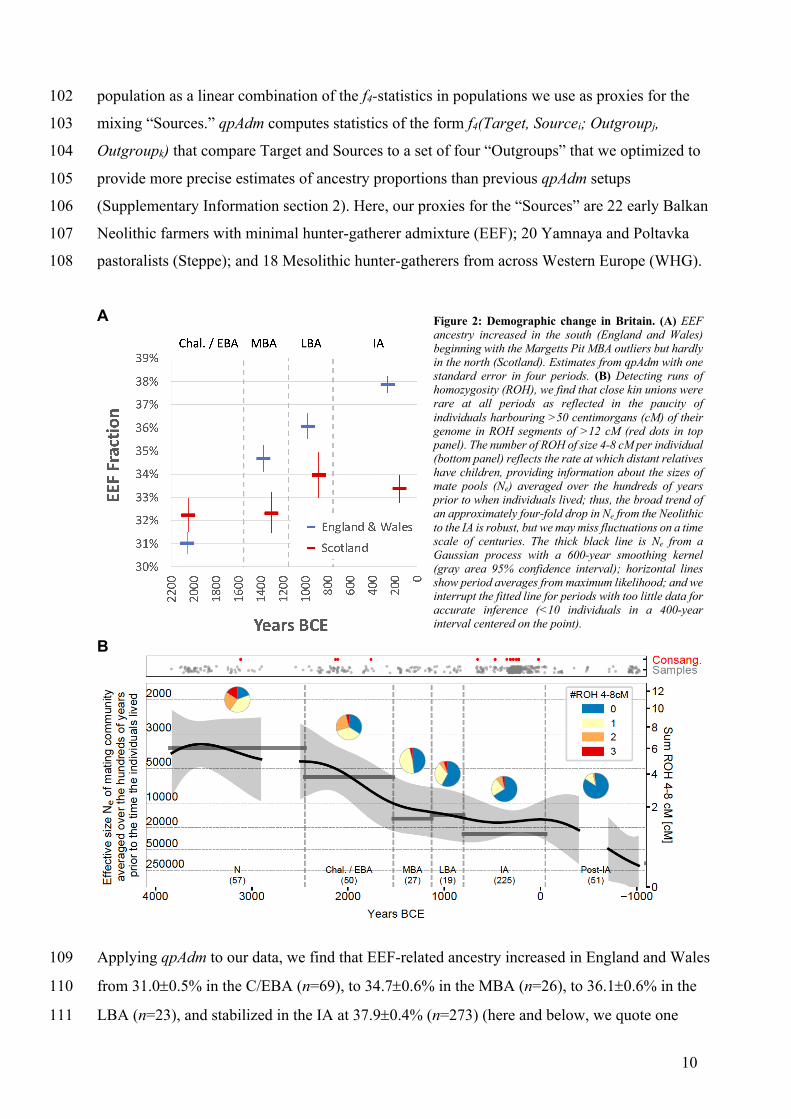
Applying qpAdm to our data, we find that EEF-related ancestry increased in England and Wales 109
from 31.0±0.5% in the C/EBA (n=69), to 34.7±0.6% in the MBA (n=26), to 36.1±0.6% in the 110
LBA (n=23), and stabilized in the IA at 37.9±0.4% (n=273) (here and below, we quote one 111
Figure 2: Demographic change in Britain. (A) EEF ancestry increased in the south (England and Wales) beginning with the Margetts Pit MBA outliers but hardly in the north (Scotland). Estimates from qpAdm with one standard error in four periods. (B) Detecting runs of homozygosity (ROH), we find that close kin unions were rare at all periods as reflected in the paucity of individuals harbouring >50 centimorgans (cM) of their genome in ROH segments of >12 cM (red dots in top panel). The number of ROH of size 4-8 cM per individual (bottom panel) reflects the rate at which distant relatives have children, providing information about the sizes of mate pools (Ne) averaged over the hundreds of years prior to when individuals lived; thus, the broad trend of an approximately four-fold drop in Ne from the Neolithic to the IA is robust, but we may miss fluctuations on a time scale of centuries. The thick black line is Ne from a Gaussian process with a 600-year smoothing kernel (gray area 95% confidence interval); horizontal lines show period averages from maximum likelihood; and we interrupt the fitted line for periods with too little data for accurate inference (<10 individuals in a 400-year interval centered on the point).

11
standard error). There is no statistically significant change in Scotland (Figure 2 and Extended 112
Data Table 1). EEF ancestry was widespread in southern Britain by the IA, averaging 36.0-113
38.8% in eight regions of England (Table 1, Extended Data Table 2) (IA Wales sample sizes are 114
too small to provide accurate inference). Within England, EEF ancestry proportions inferred 115
over the mostly later IA individuals do not correlate to latitude (Table 1). We considered the 116
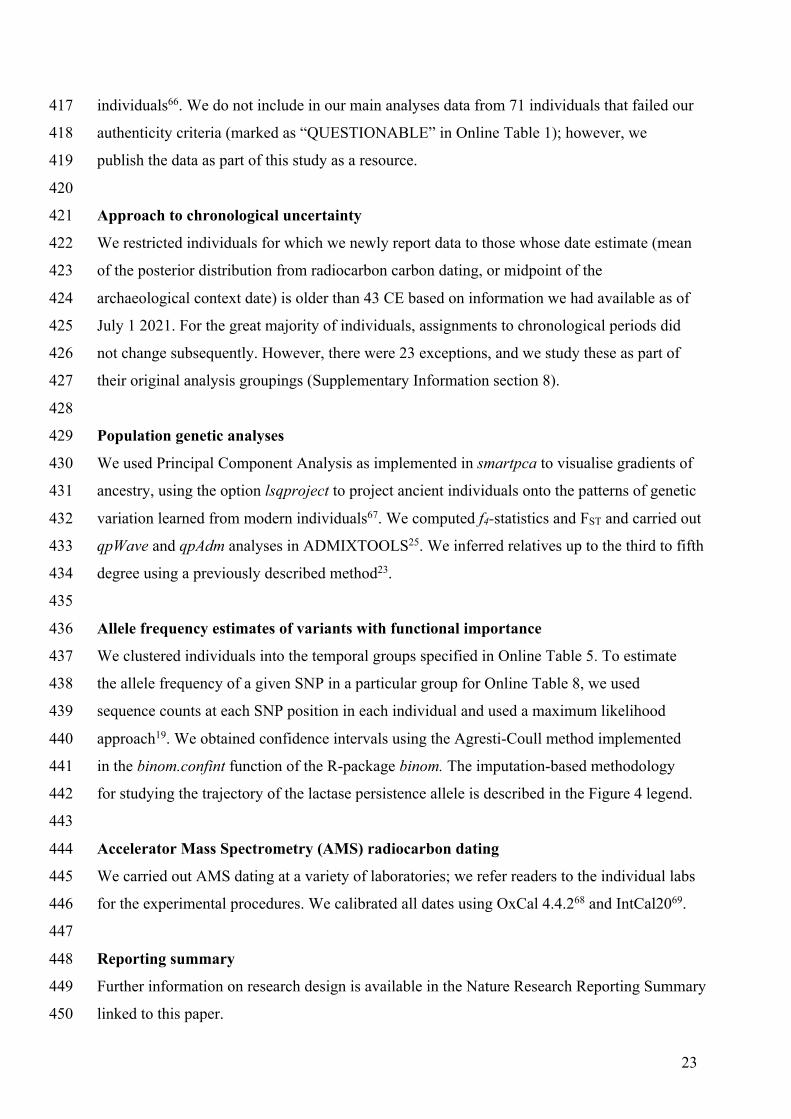
possibility that the rise in EEF ancestry in southern Britain was due to a resurgence of 117
archaeologically less visible populations with more ancestry from people living in Britain 118
during the Neolithic. However, our attempts to model IA populations of England and Wales as a 119
mixture of groups who lived in Neolithic and C/EBA Britain failed at high significance 120
(Extended Data Figure 1). This is due to LBA and IA populations in Britain sharing excess 121
alleles with Neolithic populations from continental Europe not seen in earlier groups from 122
Britain (Supplementary Information section 3). The most plausible explanation is migration 123
from outside Britain into southern Britain in the M-LBA. 124
We modelled each individual from Britain using qpAdm, labelling significant ancestry outliers 125
relative to most individuals of their period as candidates for migrants or their recent descendants 126
(Figure 3, Extended Data Figure 2). We discuss each group of outliers from earliest to latest. 127
Table 1: Regional variation in ancestry in Iron Age Britain Lat-
it-ude
Modeling Ancestry With Pre-Bronze Age Sources
Modeling Ancestry with Middle to Late Bronze Age Sources
Region N P-value WHG EEF Steppe P-
value Margetts Pit and Cliffs End Farm-like ancestry
Scotland Orkney 2 59 0.22 14.2 ± 1.1% 34.1 ± 1.2% 51.6 ± 1.6% 0.10 20 ± 9% Scotland West 4 58 0.12 13.0 ± .8% 32.3 ± 1.0% 54.7 ± 1.2% 0.19 8 ± 7% Scotland Southeast 12 56 0.67 12.1 ± .6% 33.9 ± .7% 54.0 ± .9% 0.39 16 ± 5% England North 10 54 0.35 13.4 ± .6% 36.3 ± .8% 50.3 ± 1.0% 0.76 35 ± 5% England East Yorkshire 47 54 0.61 13.2 ± .4% 37.0 ± .5% 49.8 ± .6% 0.86 44 ± 4% England Midlands 18 53 0.66 12.6 ± .5% 36.0 ± .6% 51.4 ± .8% 0.77 36 ± 4% England Southwest 84 53 0.30 13.7 ± .4% 38.7 ± .4% 47.6 ± .6% 0.56 55 ± 5% England East Anglia 21 52 0.44 13.5 ± .5% 37.0 ± .5% 49.5 ± .7% 0.52 44 ± 4% England Southcentral 38 52 0.32 13.9 ± .4% 38.8 ± .5% 47.2 ± .6% 0.35 56 ± 5% England Southeast 3 51 0.13 13.9 ± .5% 38.3 ± .5% 47.8 ± .6% 0.40 52 ± 5% England Cornwall 16 50 0.40 13.5 ± .5% 36.4 ± .7% 50.1 ± .8% 0.64 39 ± 5% Wales North 1 53 0.20 12.1 ± 1.6% 34.7 ± 2.0% 53.2 ± 2.5% 0.53 22 ± 14% Wales South 2 51 0.66 14.2 ± 1.2% 38.6 ± 1.5% 47.2 ± 1.8% 0.57 53 ± 11% Notes: Regions are ordered first by large grouping (Scotland-England-Wales), then reverse order of latitude. For modeling ancestry with pre-Bronze Age sources the right set is (OldAfrica, WHGA, Balkan_N, OldSteppe); for modeling of ancestry with M-LBA sources it is OldAfrica, OldSteppe, Turkey_N, Netherlands_C.EBA, Poland_Globular_Amphora, Spain.Portugal_4425.to.3800BP, CzechRepublic.Slovakia.Germany_3800.to.2700BP, Sardinia_8100.to.4100BP, CzechRepublic.Slovakia.Germany_4465.to.3800.BP, Sardinia_4100.to.2700BP, Spain.Portugal_6500.to.4425BP. We separate “England East Yorkshire” from “England North” because of East Yorkshire’s distinctive cultural context (Arras).
First, replicating previous results8,10, we infer a cluster of Neolithic individuals from western 128
Scotland with high WHG admixture, likely reflecting unions between recent migrants from 129
Europe and descendants of local Mesolithic groups in Britain (Extended Data Figure 2). 130

12
Second, we infer high variability in EEF ancestry in the C/EBA, before EEF ancestry became 131
relatively homogeneous after ~2000 BCE8 (Figure 3). This is apparent at Amesbury Down 132
where EEF ancestry in some burials is significantly below the average of 29.9±0.4% (e.g. I2417 133
at 22.2±1.8%), and in others above the group average (e.g. I2416 at 47.7±2.2% and I14200 at 134
45.3±2.2%). The low EEF group are plausibly Beaker-period migrants who mixed with local 135
Neolithic farmers to produce the intermediate EEF ancestry that prevailed by the end of the 136
EBA. Within the Beaker-associated burials, individual I14200 with elevated EEF ancestry is 137
known as the “Amesbury Archer”. He was buried in the most well-furnished grave recovered 138
from the Stonehenge mortuary landscape, and his isotopic profile indicates he spent parts of his 139
childhood outside Britain, possibly in the Alps27. The fact that the Archer was a migrant but had 140
too little Steppe ancestry to be from the population that drove Steppe ancestry to the high level 141
observed in C/EBA Britain, shows that Bell Beaker-associated migrants to Britain were not 142
from a homogeneous population. The ‘Companion’ (I2565), a burial found next to the Archer 143
whose isotopic profile like most others at the site is consistent with a local upbringing, was not 144
an ancestry outlier for C/EBA Britain (32.7±3.0% EEF; P=0.47 for consistency with the period 145
average; Figure 3). The Archer and the Companion shared a rare tarsal morphology and similar 146
grave goods that have been hypothesized to reflect a close genetic relationship (Supplementary 147
Information section 4)28, but our results rule out first- or second-degree genetic relatedness. 148
Third, we observe four outliers with high EEF ancestry in the late MBA and LBA who are 149
candidates for being first generation migrants or the offspring of recent migrants from 150
continental Europe, all of whom were buried in Kent in the southeasternmost part of Britain. 151
The earlier two are from the site of Margetts Pit: 47.8±1.8% in individual I13716 (1391-1129 152
calBCE) and 43.6±1.8% ancestry in I13617 (1214-1052 calBCE). The latter two are from Cliffs 153
End Farm: 43.2±2.0% in individual I14865 (967-811 calBCE) and 43.4±1.8% in individual 154
I14861 (912-808 calBCE). We considered the possibility that we are observing the effect of a 155
short burst of migration in the MBA, explaining the Margetts Pit outliers, followed by co-156
existence of separate communities with different proportions of EEF ancestry for at least a 157
couple of hundred years, thereby explaining the Cliffs End Farm outliers. However, strontium 158
and oxygen isotope analyses identify multiple individuals of non-local origin at Cliffs End 159
Farm29 including the genetic outlier I14861, suggesting that the stream of migrants continued 160
into the second half of the LBA (Supplementary Information section 5). 161

13
Figure 3: By-individual analysis of the England and Wales time transect. (A) Estimates of EEF ancestry and one standard error for all individuals that fit a three-way admixture model (EEF + WHG + Yamnaya) at p>0.01 using qpAdm and date to 2450 BCE-43 CE (we plot the mean of the posterior interval of the 14C date or the mean of the archaeological context range). Most individuals are shown in blue while significant outliers at the ancestry tails are in red with a horizontal error bar to show one standard error for the date (outliers are identified either as p<0.005 based on a qpWave test from the main cluster from their period and |Z|>3 for a difference in EEF proportion, or p<0.1 and |Z|>3.5) (Online Table 5). Outliers like the four MBA and LBA individuals at Margetts Pit and Cliffs End Farm fit as the source for the increase in EEF ancestry in the IA. The black line shows an estimate of population-wide EEF ancestry proportion at each time obtained by weighting each individual’s EEF estimate by the inverse square of their standard error as well as the probability that their date falls at each point in time (based on the date mean and error given in Online Table 5; we filter out individuals with date errors >120 years). The incorporation of increased EEF ancestry into the majority of samples occurred ~1000-875 BCE. (B) Proportion of outliers measured over 300-year sliding windows centered on each point; to estimate this we randomly sample dates of all individuals 100 times assuming normality and their mean and standard deviation in Online Table 5 (we remove individuals with EEF errors >0.022 and date standard errors >120 years). Major periods of migration into Britain are evident as periods when elevated proportions of individuals are outliers: between 2450-1800 BCE (17% outliers) and 1300-750 BCE (17% outliers again). Our ability to temporally resolve the period of outliers is poorer than our ability to resolve the period of incorporation of increased EEF ancestry into the broader population; thus, for example, the earliest outlier with elevated EEF ancestry in the M-LBA at Margetts Pit I13716 could have died as late as 1129 BCE based on the uncertainty of her 14C date.
14
Fourth, the fraction of individuals whose ancestry is significantly different from the main group 162
is 17% over the first part of the C/EBA (2450-1800 BCE), much lower at 4% from the end of 163
the EBA through the beginning of the MBA (1800-1300 BCE), high again at 17% between the 164
end of the MBA through the LBA (1300-750 BCE), and low again at 3% through the IA (Figure 165
3). This is consistent with two major periods of migration into southern Britain in the 166
Chalcolithic and then again in the M-LBA. We considered the possibility that our failure to 167
observe a high rate of outliers in the IA compared with the immediately preceding period was 168
because ancestry had homogenized to an extent between northern and southern Europe by this 169
time, which could make outliers more difficult to detect. However, the average EEF ancestry in 170
Britain in the IA was 37.9±0.4%, which is substantially different from much of contemporary 171
Western and Central Europe—52.6±0.6% in Iberia, 49.8±0.4% in Austria, Hungary, and 172
Slovenia, 45.4±0.5% in the Czech Republic, Slovakia and Germany, 45.6±0.5% in France and 173
Switzerland, and 34.4±1.2% in the Netherlands (Figure 4A)—which would have made the 174
majority of migrants from these regions detectable given the small standard errors in most 175
individual ancestry estimates of <2% (Online Table 5). Our sampling from western France and 176
Belgium is poor, and it is possible that EEF ancestry proportions there were similar to Britain, 177
so we cannot rule out migration from this region in the IA. Nevertheless, the lack of a change in 178
EEF ancestry proportion in the IA is consistent with reduced migration from continental Europe 179
and suggests relatively closed and self-sustaining social communities in Britain during the IA30. 180
Demographic change in Britain over our period of study is also evident from another aspect of 181
the data: the rate of observations of runs of homozygosity (ROH), which can occur when a 182
person’s parents are relatively closely related. The larger the pool of people from which 183
individuals draw their mates, the less likely it is for parents to be closely related, and thus we 184
can average the number of 4-8 centimorgan (cM) ROH segments to estimate the effective size 185
of the pool of people within which people were mating in the ~600 year period prior to the time 186
when the analysed individuals lived31. We find that the size of the mating pool increased by 187
roughly four-fold from the Neolithic to the IA, but we caution that this inference should not be 188
interpreted as an estimate of population size changes over this period as mating pool sizes are 189
also affected by changing social customs. First, if the distance over which people ranged to find 190
their mates was higher in some cultural contexts than in others it would cause the mating pool 191
sizes to be different even if there was no difference in actual population size; for example, 192
mating pool size may be less than the island-wide population size if members of communities 193
mixed little with their neighbours as is plausible in the British IA where there was high regional 194

15
variation in material culture30, or larger if individuals mated not only with people outside their 195
local communities but also outside Britain. Second, we have a major gap in sampling at the end 196
of the Neolithic (roughly 3000-2450 BCE) and thin sampling at the beginning of the IA, which 197
means that demographic processes in these periods may be missed. Third, due to the method 198
effectively averaging over centuries, this analysis may also fail to detect major population 199
declines over the space of a few decades, if these were followed by rapid population recovery. 200
Future work that complements measurement of changing degree of parental relatedness over 201
time with estimates of changing degree of relatedness of individuals across communities32 202
should make it possible to examine how much of this signal of increasing size over time was 203
driven by true growth in population size, and how much by increasing rates of gene exchange 204
across geographically dispersed communities. 205
We co-analysed our ancient DNA time transect in Britain alongside European transects (Figure 206
4A, Online Tables 5 and 7). Average EEF ancestry increased in this period in North-Central 207
Europe and the Netherlands, just as in Britain. The first individuals from North-Central Europe 208
(Czech Republic/Slovakia/Germany) with greatly increased EEF ancestry are associated with 209
artefacts traditionally classified as part of the LBA Knoviz culture, a component of the broader 210
Urnfield cultural complex (1300-800 BCE) that spread across much of Central Europe. This is 211
especially striking as the Knoviz individuals are genetically consistent with being from a very 212
similar population as the Margetts Pit and Cliffs End Farm outliers (Supplementary Information 213
section 6). Later individuals in North-Central Europe have similar EEF proportions, consistent 214
with continuity through the LBA-IA with earlier Urnfield-associated groups. By contrast, in 215
MBA and LBA France/Switzerland and South-Central Europe (Austria/Hungary/Slovenia) there 216
was little change in average EEF ancestry, while EEF ancestry decreased in MBA and LBA 217
Iberia (Spain/Portugal). There are also two exceptions to this broad European pattern of 218
ancestry convergence in Europe—Scotland in the far north, and Sardinia in the far south33,34—219
both of which have extreme proportions of EEF ancestry (Scotland low and Sardinia high) 220
relative to the European average across this period (Online Table 7). 221
Placing Britain within the broader context of Europe is also illuminating with respect to the 222
frequency trajectories of genetic variants of phenotypic importance. This study multiplies by 223
almost eight-fold the number of IA individuals with genome-wide data from Western and 224
Central Europe (from 80 to 624; Online Table 5), making it possible for the first time to 225
accurately track the frequency change of genetic variants into the IA (Online Table 8). In 226

16
addition to showing how variants associated with light skin pigmentation, such as SLC45A2, 227
became more common in the IA throughout Europe19, we obtain an unexpected result for the 228
derived allele at the polymorphism MCM6-LCT rs4988235 correlated with lactase persistence 229
into adulthood19 (Extended Data Figure 3). Previous work showed that the frequency of this 230
allele in IA Iberia was only a small fraction of its present-day incidence35, which we confirm by 231
showing that its frequency was ~9% in the IA compared to ~40% today. Similarly, in a pool of 232
individuals from Central Europe (Austria, Hungary, Slovenia, Czech Republic, Slovakia and 233
Germany) its frequency was ~7% in the IA compared to ~48% today. However, in Britain, most 234
of the rise in frequency had occurred by the IA (50% compared to the current 73%), suggesting 235
that intense selection acted earlier and the main rise in frequency occurred about a millennium 236
earlier than in Central Europe (Figure 4B, Extended Data Figure 3). We find no evidence that 237
the main rise in frequency of the lactase persistence allele occurred in continental Europe and 238
that its frequency rise in Britain was due to M-LBA migration. Thus, the Margetts Pit and Cliffs 239
End Farm outliers who are plausible members (or recent offspring) of the migrating population 240
did not carry the allele, and most of its frequency rise in Britain occurred after the M-LBA 241
(Figure 4B, Online Table 8). This raises questions about whether dairy products were consumed 242
in a qualitatively different way or were economically more important in LBA-IA Britain than in 243
Central Europe. 244
The ancestry change in Britain we document during the M-LBA was more subtle than the one 245
that occurred during the Neolithic and Beaker-period migrations. In England and Wales, fpr 246
example, allele frequency differentiation between the Neolithic and C/EBA was FST~0.02, but 247
between the C/EBA and the IA it was an order of magnitude smaller at FST~0.002 (Extended 248
Data Table 1). The pre-LBA population in Britain also made a substantial genetic contribution 249
to the IA population—its genetic signature was not even close to being completely replaced—250
which contrasts with the two earlier major Holocene ancestry shifts8,10. Direct evidence for a 251
substantial contribution from the earlier population specifically on the male line comes from Y 252
chromosome haplogroup R1b-P312 L21/M529 (R1b1a1a2a1a2c1), which was present at 89±5% 253
in sampled individuals from C/EBA Britain and has always been nearly absent on the continent 254
(Online Table 9), and today occurs much more frequently in Britain and Ireland (frequency of 255
14-71% depending on region36) than in continental Europe (Extended Data Figure 4). 256

17
A B
Figure 4: Genetic change in Britain in the context of Europe-wide trends. (A) North-south ancestry convergence. We show eight ancient DNA time transects for up to four periods, using the average of dates of individuals in periods defined for each region as in Online Table 5 (we use the N/C/EBA/MBA/LBA/IA division into archaeological periods for Britain, but avoid using it for most of the rest of Europe because chronological boundaries differ). Dotted lines show which points are regionally grouped and should not be interpreted as implying a smooth change over time. (B) The allele conferring lactase persistence made its major rise about a millennium earlier in Britain than in Central Europe suggesting different selection regimes and possibly cultural differences in the use of dairy products in the two regions in the IA. We visualise the frequency trajectory of the lactase persistence allele at SNP rs4988235 by using the GaussianProcessRegressor function from the Scikit-learn library in Python with parameter alpha=0.1 and 1*RationalQuadratic kernel with parameter length_scale_bounds=(1, 1000). We use the GLIMPSE37 software to impute diploid genotype posterior probabilities (GP), restricting to samples with max(GP)>0.9 for this SNP. The analysis includes 459 ancient individuals from Britain and 468 from Central Europe (Czech Republic, Slovakia, Croatia, Hungary, Austria, Germany and Slovenia); to represent modern Britain we use a pool of 190 CEU and GBR individuals from the 1000 Genomes Project38, and to represent modern Central Europe we use 288 individuals from the modern Czech Republic39. Each vertical bar represents the derived allele frequency for each individual with values [0, 0.5, 1]; we use jitter on the x-axis for each vertical bar, and we show in shading the inferred 95% confidence interval for the allele frequency at each time point.

18
To gain insight into the possible sources of the ancestry that spread across southern Britain by 257
the end of the LBA, we fit the pooled IA individuals from England and Wales in qpAdm as a 258
mixture of a group related to the main C/EBA cluster, and a second source. We tested 65 second 259
sources—63 from continental Europe and 2 from Britain (the Margetts Pit outlier pool, and the 260
Cliffs End Farm outlier pool)—and found that 20 fit at p>0.05; we then pooled the genetically 261
similar Margetts Pit and Cliffs End Farm individuals and performed further qpAdm testing with 262
more stringent qpAdm setups, leaving eight second sources that consistently fit well with 263
modest standard errors (Table 2, Supplementary Information section 6). The Margetts Pit and 264
Cliffs End Farm pool fit as contributing 49.4±3.0% of the ancestry of IA southern Britons, 265
providing our best estimate of the degree of genetic turnover. The seven continental populations 266
that fit as sources are estimated to contribute 24-69%; thus, even without results from 267
representatives of the putative source population living in Britain itself, we infer large genetic 268
turnovers. Although only 20% of the continental candidate populations we tested are from 269
France, 86% of the fitting populations are: the fitting populations are four from Occitanie in 270
southern France (600-200 BCE), two from Grand Est in northeastern France (800-200 BCE), 271
and one from Spain (a ~600 BCE group). These fitting second sources all post-date the ancestry 272
change in Britain by hundreds of years and hence they cannot be the true sources; however, they 273
are plausibly descended from earlier local populations. An origin in France is also suggested by 274
the fact that all of the high EEF outliers in Britain in the M-LBA, and all of the 1000-875 BCE 275
individuals that track the ramp-up of EEF ancestry from MBA to IA levels, are from Kent in far 276
southeastern Britain (Extended Data Figure 5). Southwestern individual I12624 from 277
Blackberry Field, Potterne in Wiltshire (950-750 BCE) had a typical EEF proportion for the IA 278
of southern Britain, suggesting the spread of descendants of the migrant stream throughout 279
southern Britain may have already begun by this time, although we caution that this is the only 280
datapoint we have in the second half of the LBA from outside Kent, and so more sampling is 281
needed to understand the geographic and temporal course of the spread of this ancestry. Our 282
data point to the new ancestry being ubiquitous in southern Britain by the beginning of the IA. 283
Table 2: Populations fitting as proxies for the new ancestry in IA southern Britain Surrogate for source of the new ancestry N Mean
date p-value Ancestry
Margetts Pit and Cliffs End Farm MLBA 4 1036 BCE 0.07 49.4 ± 3.0% Spain IA Tartessian 2 629 BCE 0.16 23.7 ± 1.2% France GrandEst IA1 (shotgun data) 5 620 BCE 1.00 48.9 ± 3.7% France Occitanie IA2 (high EEF subgroup, shotgun data) 1 450 BCE 0.85 25.8 ± 1.7% France Occitanie IA2 (high WHG subgroup, shotgun data) 1 450 BCE 0.39 33.5 ± 4.1% France Occitanie IA2 (shotgun data) 2 400 BCE 0.25 53.3 ± 5.4% France Occitanie IA2 (low Steppe subgroup, shotgun data) 2 363 BCE 0.33 36.5 ± 2.6% France GrandEst IA2 12 250 BCE 0.09 68.5 ± 3.3%

19
We can fully explain the significant regional variation in ancestry in IA England and Wales 284
(Table 1 and Extended Data Table 2) as driven by different proportions of ancestry from the 285
population to which the Margetts Pit and Cliffs End Farm individuals belonged, obtaining 286
estimates ranging from 35±5% in northern England to 56±5% in south-central England (Table 287
1). Archaeological data show that the IA was a period when material culture was increasingly 288
regional in character30; as we show here, this was accompanied by subtle genetic structure. We 289
highlight the case of East Yorkshire, where most individuals we analysed are associated with 290
‘Arras Culture’ contexts comprising square-ditched barrows and occasional chariot burials40,41; 291
similarities between Arras funerary traditions and those of IA societies in the Paris Basin and 292
the Ardennes/Champagne regions of France and Belgium have led to suggestions that East 293
Yorkshire was influenced by direct migration from continental Europe in the IA42. Our estimate 294
of the Margetts Pit/Cliffs End Farm ancestry source for East Yorkshire burials is 44±4% (Table 295
1) which is typical for middle latitudes of Britain at this time (East Anglia is similar). However, 296
the East Yorkshire burials are distinctive in another way: regional differentiation in IA Britain, 297
as measured by FST, is higher between East Yorkshire and other groups than between any other 298
pairs of IA populations in England and Wales (Extended Data Table 2). Without ancient DNA 299
from the putative IA sources for the Arras culture in continental Europe, we cannot determine if 300
the genetic differentiation we observe of people in Arras burial contexts is attributable to the 301
subsequent isolation in the IA of the population from the rest of southern Britain, or later 302
streams of migration specifically affecting East Yorkshire that we have limited power to detect. 303
The period from 1500-1150 BCE has long been recognized as a time when cultural connections 304
between Britain and regions of continental Europe intensified, and when societies on both sides 305
of the Channel shared cultural features including domestic pottery, metalwork and ritual 306
depositional practices43-47. From around 750 BCE there is more limited archaeological evidence 307
of contact between Britain and the continent, with little that would suggest the significant 308
movement of people43. Both the genetic and archaeological data concur in showing that, by the 309
beginning of the IA, there is little evidence of demographically significant migration into 310
Britain. Our findings do not establish whether the population movements we infer were a cause 311
or consequence of M-LBA exchange networks, but they do suggest that interactions between 312
local populations of Britain and new migrants bringing ideas from continental Europe could 313
have been a vector for some of the cultural change we see in M-LBA England and Wales. Much 314
of northern and central France is currently almost entirely unsampled, and thus we cannot at 315
present test if the gene flow between the two regions in this period was largely unidirectional. 316

20
Population movements are often a significant driver of cultural change, including in the 317
languages people speak. While periods of intense migration such as the one we infer here do not 318
always result in language shifts35, genetic evidence of significant migration is important because 319
it documents demographic processes that are plausible conduits for language spread48,49. Several 320
researchers have interpreted linguistic data as providing evidence for early Celtic languages 321
spreading into Britain from France at the end of the Bronze Age or in the Early Iron Age50,51. 322
Our identification of substantial migration into Britain from sources that best fit populations in 323
France provides an independent line of evidence in support of this, and points to the M-LBA as 324
a prime candidate for the period of this language spread. While the lack of evidence for M-LBA 325
EEF ancestry change in Scotland (Figure 2A) could be interpreted as a concern for the case that 326
Celtic language spread into Britain at this time, in fact a later arrival of Celtic languages in 327
Scotland is entirely consistent with evidence that non-Celtic and Celtic languages coexisted 328
there into the first millennium CE52. Our finding of a decrease of EEF ancestry in Iberia, where 329
the proportion was relatively high in the EBA, and a roughly simultaneous increase in Britain 330
where the proportion was relatively low in the EBA (Figure 4a), could, in theory, reflect a 331
Celtic-speaking group of people with intermediate EEF ancestry spreading into both regions, 332
although such a simple model cannot explain all the north-south ancestry convergence in 333
Europe (Supplementary Information section 7); the true gene flows were more complex. 334
Nevertheless, the fact that the Margetts Pit and Cliffs End Farm outliers are genetically very 335
similar to our Knoviz culture sample (Supplementary Information section 6) is striking in light 336
of the fact that some scholars have hypothesized Central European Urnfield groups to have links 337
to Celtic language spread53. In contrast, our failure to find evidence of large-scale migration into 338
Britain from continental Europe in the IA suggests that, if Celtic language spread was driven by 339
large-scale movement of people, it is unlikely to have occurred at this time. The adoption in IA 340
Britain of cultural practices originating in continental Europe—particularly those linked to the 341
La Tène tradition54—were also evidently independent of large-scale population movements, 342
although there certainly were smaller movements of people, attested by individual IA outliers 343
with high EEF ancestry such as those at Thame or Winnall Down (Figure 3). 344
An important direction for future work is to generate new ancient DNA data from continental 345
contexts especially in central and western France—and also Ireland—to test the alternative 346
scenarios of population history consistent with the finding in this study, and to develop theories 347
integrating the genetic findings within archaeological frameworks. 348
21
Methods 349
350
Ancient DNA laboratory work 351
All ancient human skeletons analysed in this study were sampled with written permission of 352
the stewards of the samples and every sample is represented by at least one co-author. 353
Researchers who wish to obtain further information about specific samples should write to 354
the corresponding authors and/or the authors who provided the archaeological 355
contextualization for those samples in Supplementary Material section 1. In dedicated clean 356
rooms at Harvard Medical School, the University of Vienna, the Natural History Museum in 357
London, and the University of Huddersfield, as well as during sampling trips, we obtained 358
powder from ancient bones and teeth using methods including fine sandblasting, drilling and 359
milling55,56. We extracted DNA using a variety of methods57-59, and prepared double- or 360
single-stranded libraries treated with the enzyme Uracil DNA Glycosylase (UDG) to reduce 361
characteristic errors associated with ancient DNA degradation15-17,60. We enriched these 362
sequences manually or in multiplex using automated liquid handlers for sequences 363
overlapping the mitochondrial genome20,61 as well as about 1.24 million single nucleotide 364
polymorphisms (“1240K capture”)18. We pooled enriched libraries which we had marked 365
with unique 7-base pair internal barcodes and/or 7- to 8-base pair indices and sequenced on 366
Illumina NextSeq500 or HiSeqX10 instruments using paired-end reads of either 76 base pairs 367
or 101 base pairs in length (Online Table 2). 368
369
Bioinformatic analysis 370
After trimming barcodes and adapters6, we merged read pairs with at least 15 base pairs of 371
overlap allowing no more than one mismatch if base quality was at least 20, or up to three 372
mismatches if base qualities were <20; we chose the nucleotide of the higher quality in case 373
of a conflict while setting the local base quality to the minimum of the two (for these steps we 374
used a custom toolkit at https://github.com/DReichLab/ADNA-Tools). We aligned merged 375
sequences to the mitochondrial genome RSRS62 or the human genome hg19 (GRCh37, 376
https://www.ncbi.nlm.nih.gov/assembly/GCF_000001405.13/), and aligned these sequences 377
using the samse command63 of BWA version 0.7.15-r1140 with parameters -n 0.01, -o 2, and -378
l 16500. After identifying PCR duplicates by tagging all aligned sequences with the same 379
start and stop positions and orientation and in some cases in-line barcodes using Picard 380
MacDuplicates (http://broadinstitute.Github.io/picard/), and restricting to sequences that 381
spanned at least 30 base pairs, we selected a single copy of each such sequence that had the 382

22
highest base quality score. For subsequent analysis, we trimmed the last 2 bases of each 383
sequence for UDG-treated libraries and the last 5 for non-UDG-treated libraries to reduce the 384
effects of characteristic errors associated with ancient DNA degradation. We built 385
mitochondrial consensus sequences, determined haplogroups using HaploGrep264 and 386
Phylotree version 17, and estimated the match rate to the consensus sequence using 387
contamMix v.1.0-1221 when coverage was at least two-fold. To represent the nuclear data, we 388
randomly sampled a single sequence covering each of the 1.24 million SNP targets, and 389
estimated coverage based on the subset of these targeted SNPs on the autosomes. We used 390
ANGSD to estimate contamination based on polymorphism on the X chromosome in males 391
with at least 200 SNPs covered twice (males should be non-polymorphic if their data are 392
uncontaminated)22. We automatically determined Y chromosome haplogroups using both 393
targeted SNPs and off-target sequences aligning to the Y chromosome based on comparisons 394
to the Y chromosome phylogenetic tree from Yfull version 8.09 (https://www.yfull.com/), 395
providing two alternative notations for Y chromosome haplogroups: the first using a label 396
based on the terminal mutation, and the second describing all the associated branches of the 397
Y chromosome tree based on the notation of the International Society of Genetic Genealogy 398
(ISOGG) database version 15.73. (http://www.isogg.org). 399
400
Determination of ancient DNA authenticity 401
We determined ancient DNA authenticity based on five criteria. First, we required that the 402
lower bound of the 95% confidence interval for contamination from ANGSD (if we were able 403
to compute it) was <1%. Second, we required that the upper bound of the 95% confidence 404
interval for match rate to mitochondrial consensus sequence (if we were able to compute it) 405
was >95%. Third, we required that the average rate of cytosine-to-thymine errors at the 406
terminal nucleotide for all sequences passing filters was >3% for double-stranded partially 407
UDG-treated libraries15 and >10% for single-stranded USER-treated libraries and double-408
stranded non-UDG-treated libraries (the latter libraries are all from previously published data 409
that we reanalysed here)65. Fourth, we required the ratio of sequences mapping to the Y 410
chromosome to the sum of sequences mapping to the X and Y chromosome for the 1240K 411
data to be less than 3% (consistent with a female) or >35% (consistent with a male). Fifth, to 412
report an individual we required the number of SNPs covered at least once to be at least 5,000 413
(for most actual population genetic analyses, we required at least 30,000). For some 414
individuals with evidence of contamination, we analysed only sequences with terminal 415
damage to enrich for genuine ancient DNA using pmdtools, allowing us to study more 416
23
individuals66. We do not include in our main analyses data from 71 individuals that failed our 417
authenticity criteria (marked as “QUESTIONABLE” in Online Table 1); however, we 418
publish the data as part of this study as a resource. 419
420
Approach to chronological uncertainty 421
We restricted individuals for which we newly report data to those whose date estimate (mean 422
of the posterior distribution from radiocarbon carbon dating, or midpoint of the 423
archaeological context date) is older than 43 CE based on information we had available as of 424
July 1 2021. For the great majority of individuals, assignments to chronological periods did 425
not change subsequently. However, there were 23 exceptions, and we study these as part of 426
their original analysis groupings (Supplementary Information section 8). 427
428
Population genetic analyses 429
We used Principal Component Analysis as implemented in smartpca to visualise gradients of 430
ancestry, using the option lsqproject to project ancient individuals onto the patterns of genetic 431
variation learned from modern individuals67. We computed f4-statistics and FST and carried out 432
qpWave and qpAdm analyses in ADMIXTOOLS25. We inferred relatives up to the third to fifth 433
degree using a previously described method23. 434
435
Allele frequency estimates of variants with functional importance 436
We clustered individuals into the temporal groups specified in Online Table 5. To estimate 437
the allele frequency of a given SNP in a particular group for Online Table 8, we used 438
sequence counts at each SNP position in each individual and used a maximum likelihood 439
approach19. We obtained confidence intervals using the Agresti-Coull method implemented 440
in the binom.confint function of the R-package binom. The imputation-based methodology 441
for studying the trajectory of the lactase persistence allele is described in the Figure 4 legend. 442
443
Accelerator Mass Spectrometry (AMS) radiocarbon dating 444
We carried out AMS dating at a variety of laboratories; we refer readers to the individual labs 445
for the experimental procedures. We calibrated all dates using OxCal 4.4.268 and IntCal2069. 446
447
Reporting summary 448
Further information on research design is available in the Nature Research Reporting Summary 449
linked to this paper. 450
24
Data availability 451
The raw data are available as aligned sequences (bam files) through the European Nucleotide 452
Archive under accession number [to be made available on publication]. Less processed versions 453
of the data (fastq files) are available from the corresponding authors on request, whereas more 454
processed versions of the data (the genotype data obtained by random allele sampling used in 455
analysis) are available at https://reich.hms.harvard.edu/datasets. Any other relevant data are 456
available from the corresponding authors upon reasonable request. 457
Acknowledgments We thank T. de Rider, M. Giesen, E. Melis, A. Parkin, and A. Schmitt for 458
their contribution to sample selection and collection of archaeological data. We thank R. 459
Crellin, J. Koch, K. Kristiansen, and G. Kroonen for comments on the manuscript. We thank A. 460
Williamson for manually revising Y chromosome haplogroup determinations and making 461
corrections to nine. We thank M. Lee for assistance with data entry. This work was funded by 462
the European Research Council (ERC) under the European Union’s Horizon 2020 research and 463
innovation programme (grant agreement No. 834087; the COMMIOS Project to I.A.). M.N. was 464
supported by the Croatian Science Fund grant (HRZZ IP-2016-06-1450). P.V., M.D., and Z.V. 465
were supported by the Ministry of Culture of the Czech Republic (DKRVO 2019-2023/7.I.c, 466
00023272). M.E. was supported by Czech Academy of Sciences award Praemium Academiae. 467
M.Dob. and A.Da. were supported by the grant RVO 67985912 of the Institute of Archaeology 468
of the Czech Academy of Sciences. M.B.G.F. was funded by The Leverhulme Trust via a 469
Doctoral Scholarship scheme awarded to M.P. and M.B.R. M.L. was supported by the South, 470
West & Wales Doctoral Training Partnership. M.G.’s osteological analyses were funded by 471
Culture Vannin. A.S-N. was supported by the János Bolyai Research Scholarship of the 472
Hungarian Academy of Sciences. T.H., T.S.Z. and K.K.’s work was supported by a grant from 473
the Hungarian Research, Development and Innovation Office (project number: FK128013). We 474
acknowledge support for radiocarbon dating and stable isotope analyses as well as access 475
to skeletal material from Manx National Heritage and A. Fox. Dating analysis was funded by 476
Leverhulme Trust grant RPG-388. M.G.T. and I.B. were supported by a Wellcome Trust 477
Investigator Award (project 100713/Z/12/Z). I.O. was supported by a Ramón y Cajal grant from 478
Ministerio de Ciencia e Innovación, Spanish Government (RYC2019-027909-I). The research 479
directed by D.R. was funded by NIH grant GM100233; by John Templeton Foundation grant 480
61220; by a private donation from Jean-François Clin; and by the Allen Discovery Center 481
program, a Paul G. Allen Frontiers Group advised program of the Paul G. Allen Family 482
Foundation. D.R. is also supported as an Investigator of the Howard Hughes Medical Institute. 483
25
Author contributions N.P., I.A. and D.R. conceived the study. N.P., I.O., C.L.-F., P.d.K., I.B., 484
M.G.T., D.J.K., B.Cun., N.R., R.Pi., I.A., and D.R. supervised the study. T.B., L.Bü., C.-E.F., 485
O.Ch., S.B., B.A., T.A., K.A., L.A., A.As., C.B.-D., A.Ba., L.Ba., K.B., Z.B., J.Bl., M.Bo., 486
P.Bo., C.Bo., P.Br., M.Br., A.Br., F.B., L.Br., R.Br., C.Bu., J.Bu., S.Ca., S.C.-C., M.Č.-B., 487
A.Ch., S.Ch., S.Cl., N.Č., A.Co., O.Cr., M.Č., V.C., S.Cz., A.Dan., R.D., A.Dav., P.d.J., J.D., 488
C.D., P.W.D., M.Diz., M.Dobe, M.Dobi, L.Do., G.D., A.Đuk., C.J.E., M.E., C.E., J.E., M.F.-G., 489
S.Fi., A.Fi., H.F., C.F., A.Fo., Z.G., M.G., M.R.G.M., B.G.-R., A.G., K.G., D.Hab., T.H., 490
D.Ham., J.Ha., C.H., J.He., B.H., G.H., M.H., E.I., A.M.J., M.B.K., K.K., R.A.K., A.Kh., V.Ki., 491
J.K., M.K., L.K., P.F.K., A.Ko., G.K., V.K., C.L.P., M.Leg., M.Lei., L.L., O.L.-C., T.L., D.L., 492
J.L., A.B.M.-A., P.M., D.M., A.Ma., L.Mc., J.Mc., K.Mc., B.M., B.G.M., M.Men., M.Met., 493
S.Me., K.Mi., L.Mi., S.Mi., J.Mo., G.Mo., G.Mu., M.Mu., B.N., R.N., M.N., M.Pal., M.Pap., 494
C.Pa., R.Pa., D.P., K.Pes., A.P., K.Pet., C.Pich., C.Pick., Z.P., T.D.P., S.R., R.R., B.R., D.T.R., 495
M.B.R., A.R., J.R., P.S., A.Še., A.Sh., S.S., Á.S., M.Šm., Á.So., M.St., G.S., A.S.-N., T.S., 496
J.Ta., C.T.M., R.Te., B.T., M.T.-N., J.F.T.-M., J.Tr., R.Tu., F.U., M.v.d.H., P.V., B.V., Z.V., 497
C.W., P.Wa., P.Wi., L.W., R.W., E.Y., J.Z., A.Ž., C.L.-F., P.H., B.Cun., M.Lil., R.Pi, and I.A. 498
excavated or curated samples and provided archaeological contextualization. T.B., O.Ch., 499
M.Bl., N.A., E.A., S.B., N.B., K.C., F.C., B.Cul., E.C., L.De., K.S.D.C., D.M.F., M.G.B.F., 500
S.Fr., A.Ke., A.M.L., K.Ma., M.Mi., G.B.M., J.O., K.T.Ö., L.Q., C.S., K.St., J.N.W., F.Z., 501
C.J.E., D.J.K. and N.R. generated the data through sample preparation or laboratory work. N.P., 502
M.I., L.Bü., C.-E.F., I.O., H.R., A.Ak., O.Ch., M.Bl., R.Be., H.G., I.L., M.Mah., S.Ma., A.Mi., 503
Z.Z. and D.R. curated and analysed the data. N.P., M.I., T.B., L.Bü., C.-E.F., I.O., M.Bl., I.A. 504
and D.R. wrote significant sections of the paper. 505
506
Competing interests The authors declare no competing interests. 507

26
Extended Data Table 1: Ancestry change over time in Britain
Note: We pool all individuals from each period and region removing those failing qpAdm modeling at p<0.01 according to Online Table 5). In the left columns are qpAdm estimates of ancestry for each group. Below diagonal are Z-scores from f4(Row population, Column population; Turkey_N, OldSteppe) (highlighted in red if |Z|>3). Above diagonal are inbreeding-corrected FST values (highlighted in yellow if FST>0.005).
Sam
ple
size
P-v
alue
WH
G
EEF
Step
pe
WH
G e
rror
EEF
erro
r
Step
pe
Engl
and.
and.
Wal
es_N
Engl
and.
and.
Wal
es_C
.EBA
Engl
and.
and.
Wal
es_M
BA
Engl
and.
and.
Wal
es_L
BA
Engl
and.
and.
Wal
es_I
A
Engl
and.
and.
Wal
es_P
ostIA
Engl
and.
and.
Wal
es_M
oder
n
Scot
land
_N
Scot
land
_C.E
BA
Scot
land
_MBA
Scot
land
_LBA
Scot
land
_IA
Scot
land
_Pos
tIA
Scot
land
_Mod
ern
Irela
nd_N
Irela
nd_C
.EBA
Irela
nd_P
ostIA
Irela
nd_M
oder
n
Chan
nel.I
slan
ds_8
100.
to.5
700B
P
Chan
nel.I
slan
ds_5
700.
to.4
450B
P
Chan
nel.I
slan
ds_I
A
England.and.Wales_N 37 0.7597 20.8% 76.7% 2.6% 0.5% 0.5% 0.6% 0 0.02 0.0176 0.0171 0.0161 0.0219 0.0226 0.0013 0.0192 0.0188 0.0188 0.0197 0.0206 0.0239 0.0046 0.0275 0.0233 0.0225 0.0177 0.0073 0.0153England.and.Wales_C.EBA 69 0.3840 12.6% 31.0% 56.4% 0.4% 0.5% 0.6% -65.7 0 0.0007 0.0012 0.0017 0.0084 0.0107 0.0204 0.0013 0.0002 0.0013 0.0019 0.006 0.0109 0.0259 0.0112 0.0091 0.0085 0.0357 0.0173 0.0055England.and.Wales_MBA 26 0.0918 13.5% 34.7% 51.8% 0.5% 0.6% 0.7% -58.2 -7.3 0 0.0004 0.0008 0.0066 0.0088 0.0181 0.0011 0.0009 0.0013 0.0016 0.004 0.009 0.0227 0.0099 0.0064 0.0071 0.0333 0.0151 0.0043England.and.Wales_LBA 23 0.4609 13.6% 36.1% 50.4% 0.5% 0.6% 0.7% -52.3 -9.9 2.9 0 0.0006 0.0056 0.007 0.0179 0.0028 0.0012 0.0017 0.0022 0.0037 0.0077 0.0209 0.0089 0.0065 0.0052 0.0319 0.0141 0.0037England.and.Wales_IA 273 0.3637 13.6% 37.9% 48.5% 0.3% 0.4% 0.5% -63.9 -19.4 7 2.3 0 0.0053 0.0073 0.0175 0.0027 0.0011 0.0016 0.0018 0.0035 0.0076 0.0204 0.0099 0.0064 0.0049 0.0306 0.0136 0.0032England.and.Wales_PostIA 38 0.0002 15.0% 36.6% 48.3% 0.4% 0.5% 0.6% 61 -11 -2.5 1 5.8 0 0.003 0.0239 0.0085 0.0051 0.0074 0.0076 0.0014 0.0037 0.0188 0.0069 4E-05 0.0024 0.0333 0.017 0.0049England.and.Wales_Modern 62 0.6315 14.1% 40.0% 45.9% 0.4% 0.4% 0.6% -61.3 -19.5 -8.8 -4 -3.5 8.5 0 0.0243 0.0107 0.0071 0.0094 0.0097 0.0034 0.0016 0.0184 0.0083 0.0029 0.0021 0.034 0.0175 0.0072Scotland_N 44 0.6642 23.1% 74.3% 2.5% 0.4% 0.5% 0.6% 2.7 -65.1 -55.5 -51.3 -64.4 -61.3 -61.6 0 0.0184 0.0186 0.0182 0.0197 0.0227 0.026 0.0079 0.0296 0.0243 0.0248 0.0196 0.0084 0.0164Scotland_C.EBA 10 0.1517 13.5% 32.2% 54.3% 0.6% 0.7% 1.0% 52 -3 1.6 4.3 6.4 3.5 7.8 -50.6 0 0.0011 0.002 0.0022 0.0064 0.0107 0.0243 0.0099 0.0079 0.0098 0.0338 0.0194 0.0067Scotland_MBA 5 0.5635 14.0% 32.3% 53.7% 0.8% 0.9% 1.1% 45.2 -1.7 2 4.1 6.2 3.9 7.4 -44.8 0.5 0 0.0009 0.0013 0.0032 0.0074 0.0216 0.0078 0.007 0.0061 0.032 0.0132 0.0036Scotland_LBA 4 0.8346 12.4% 34.0% 53.7% 0.8% 1.0% 1.2% 39.8 -4 -0.1 1.3 3.2 1 4.2 -40.4 -1.1 1.7 0 0.0002 0.0047 0.0098 0.0239 0.0101 0.0084 0.0074 0.0357 0.0152 0.007Scotland_IA 18 0.1850 12.7% 33.4% 54.0% 0.6% 0.6% 0.8% 56.1 -3.8 1.7 4.1 8.4 4.3 10.2 -56 0.2 1.1 -1.4 0 0.0047 0.0095 0.0251 0.0108 0.0083 0.0069 0.035 0.0178 0.0044Scotland_PostIA 10 0.4713 12.9% 36.4% 50.7% 0.6% 0.7% 0.9% 50.4 -7.4 -1.5 1.2 3.7 0.3 5.1 48.3 -2.5 -3 -0.6 -2.9 0 0.0034 0.0189 0.0068 0.0021 0.0015 0.0331 0.0162 0.0037Scotland_Modern 78 0.7341 14.3% 37.5% 48.2% 0.4% 0.4% 0.6% 62.1 -12.9 -3.5 0.2 5.1 -1.2 7.9 -62.4 -4.2 -4.5 -1.5 -5.5 1 0 0.0201 0.0089 0.0032 0.001 0.0352 0.0179 0.0078Ireland_N 51 0.6505 21.6% 77.9% 0.5% 0.4% 0.5% 0.5% -0.5 -69.3 -59 -54.9 -69.3 -65.8 -65.9 3.3 51.4 45.4 40.9 57.2 52 67.2 0 0.0238 0.0189 0.019 0.0183 0.0081 0.0158Ireland_C.EBA 3 0.4166 13.6% 30.5% 55.9% 0.9% 1.2% 1.5% 37.9 1.5 4.7 6.4 8 5.9 9 -38 -3.3 -2.8 -4.3 -3.9 -5.4 -6.6 -38.8 0 0.0056 0.0068 0.0408 0.0256 0.0094Ireland_PostIA 3 0.0109 14.0% 34.9% 51.1% 0.9% 1.1% 1.3% 37.6 -3.8 -0.3 1.5 3.1 1.1 4.1 -37.5 1.4 1.8 0 1.3 -0.8 -1.5 38.6 -3.9 0 0.0027 0.0336 0.0166 0.0049Ireland_Modern 30 0.6461 12.9% 36.8% 50.3% 0.4% 0.5% 0.7% 57.6 -8.7 0 3.2 7.3 1.3 10.6 -56.8 1.8 1.7 0.5 3.6 -1.2 -3.7 -61.1 -5.5 -0.5 0 0.0346 0.0161 0.005Channel.Islands_8100.to.5700BP 3 0.7577 16.1% 82.3% 1.6% 1.3% 1.4% 1.6% 3.5 36.4 33.7 31.8 32.7 33.2 31.8 4.4 33.8 30.8 28.6 33.9 32 33 3.3 29.8 29.3 30.3 0 0.0126 0.0266Channel.Islands_5700.to.4450BP 3 0.4611 31.0% 67.1% 1.9% 1.2% 1.3% 1.4% -7.9 28.1 24.7 23.7 23.8 24.4 22.7 -7 24.1 23.3 20.8 24.9 23.4 24.4 -8.3 23 20.5 21.1 -8.4 0 0.0099Channel.Islands_IA 4 0.8603 15.4% 43.9% 40.7% 0.9% 1.2% 1.4% -28.3 11.3 7.5 6 5.3 6.7 4.2 -27.3 7.3 7.8 6.5 8.5 6.7 6.4 -29.3 9.3 5.9 5.9 22.4 13.8 0
qpAdm results (3-way model) Tests for difference in ancestry between row & column (below diagonal f 4-statistic Z-score, above-diagonal F ST)

27
Extended Data Table 2: Fine structure in Iron Age Britain.
Note: This is an expanded version of Table 1 including not just ancestry estimates for each group but also pairwise population comparisons. We pool all individuals from each period and region removing those failing qpAdm modeling at p<0.01 according to Online Table 5). In the left columns are qpAdm estimates of ancestry for each group. Below diagonal are Z-scores from f4(Row population, Column population; Turkey_N, OldSteppe) (highlighted in red if |Z|>3). Above diagonal are inbreeding-corrected FST values (highlighted in yellow if FST>0.0025).
N P-va
lue
for q
pAdm
(3-w
ay
mod
el)
WH
G (3
-way
mod
el)
EEF
(3-w
ay m
odel
)
Step
pe (3
-way
mod
el)
WH
G e
rr. (
3-w
ay m
odel
)
EEF
err.
(3-w
ay m
odel
)
Step
pe e
rr. (
3-w
ay m
odel
)
Scot
land
Wes
t
Scot
land
Sou
thea
st
Scot
land
Ork
ney
Engl
and
Mid
land
s
Engl
and
Nor
th
Engl
and
Corn
wal
l
Engl
and
East
Ang
lia
Engl
and
East
Yor
kshi
re
Engl
and
Sout
heas
t
Engl
and
Sout
hwes
t
Engl
and
Sout
hcen
tral
Wal
es N
orth
Wal
es S
outh
Scotland West 4 0.12 13.0% 32.3% 54.7% 0.8% 1.0% 1.2% 0 0.0007 0.0006 0.0032 0.0035 0.0052 0.0035 0.0046 0.0034 0.004 0.0034 n/a 0.0038Scotland Southeast 12 0.67 12.1% 33.9% 54.0% 0.6% 0.7% 0.9% 0.3 0.0 0.001 0.0012 0.0008 0.0028 0.0017 0.003 0.0014 0.0015 0.0019 n/a 0.0018Scotland Orkney 2 0.22 14.2% 34.1% 51.6% 1.1% 1.2% 1.6% 0.7 1.1 0 0.0018 0.0013 0.0037 0.0007 0.0029 0.0014 0.0021 0.0021 n/a 0.0074England Midlands 18 0.66 12.6% 36.0% 51.4% 0.5% 0.6% 0.8% 2.8 3.4 0.9 0.0 0.0001 0.0022 0.001 0.0028 0.0008 0.0009 0.0013 n/a 0.0016England North 10 0.35 13.4% 36.3% 50.3% 0.6% 0.8% 1.0% 2.4 2.6 0.9 0.1 0 0.0027 0.0005 0.0016 0.0002 0.0007 0.0009 n/a 0.0019England Cornwall 16 0.40 13.5% 36.4% 50.1% 0.5% 0.7% 0.8% 3.0 3.8 1.1 0.9 0.9 0.0 0.0025 0.0041 0.002 0.0021 0.0024 n/a 0.0024England East Anglia 21 0.44 13.5% 37.0% 49.5% 0.5% 0.5% 0.7% 3.7 4.8 1.7 0.9 1.1 0.1 0 0.002 0.0007 0.0011 0.0013 n/a 0.0012England East Yorkshire 47 0.61 13.2% 37.0% 49.8% 0.4% 0.5% 0.6% 4.1 5.4 2.1 1.5 1.7 -0.6 -0.5 0.0 0.0022 0.0026 0.0023 n/a 0.0028England Southeast 36 0.13 13.9% 38.3% 47.8% 0.5% 0.5% 0.6% 5.4 7.2 2.8 -3.8 -3.2 -2.5 -3.4 -3.2 0 0.0008 0.0005 n/a 0.0008England Southwest 84 0.30 13.7% 38.7% 47.6% 0.4% 0.4% 0.6% 5.6 8.4 3.3 -4.5 -4.3 -3.3 -3.7 -3.4 0.2 0.0 0.0009 n/a 0.0013England Southcentral 38 0.32 13.9% 38.8% 47.2% 0.4% 0.5% 0.6% 5.6 7.5 3.3 -4.6 -3.6 -2.7 -3.0 -3.3 0.0 -0.2 0 n/a 0.0013Wales North 1 0.20 12.1% 34.7% 53.2% 1.6% 2.0% 2.5% 0.8 1.1 2.0 1.9 2.0 2.5 2.9 3.1 3.6 3.6 3.5 0.0 n/aWales South 2 0.66 14.2% 38.6% 47.2% 1.2% 1.5% 1.8% -2.7 -3.1 -1.5 -1.6 -1.3 -1.2 -1.0 -0.9 0.0 0.4 0.3 -1.9 0
qpAdm results (3-way model) Tests for difference in ancestry between row & column (below diagonal f 4-statistic Z-score, above-diagonal F ST)
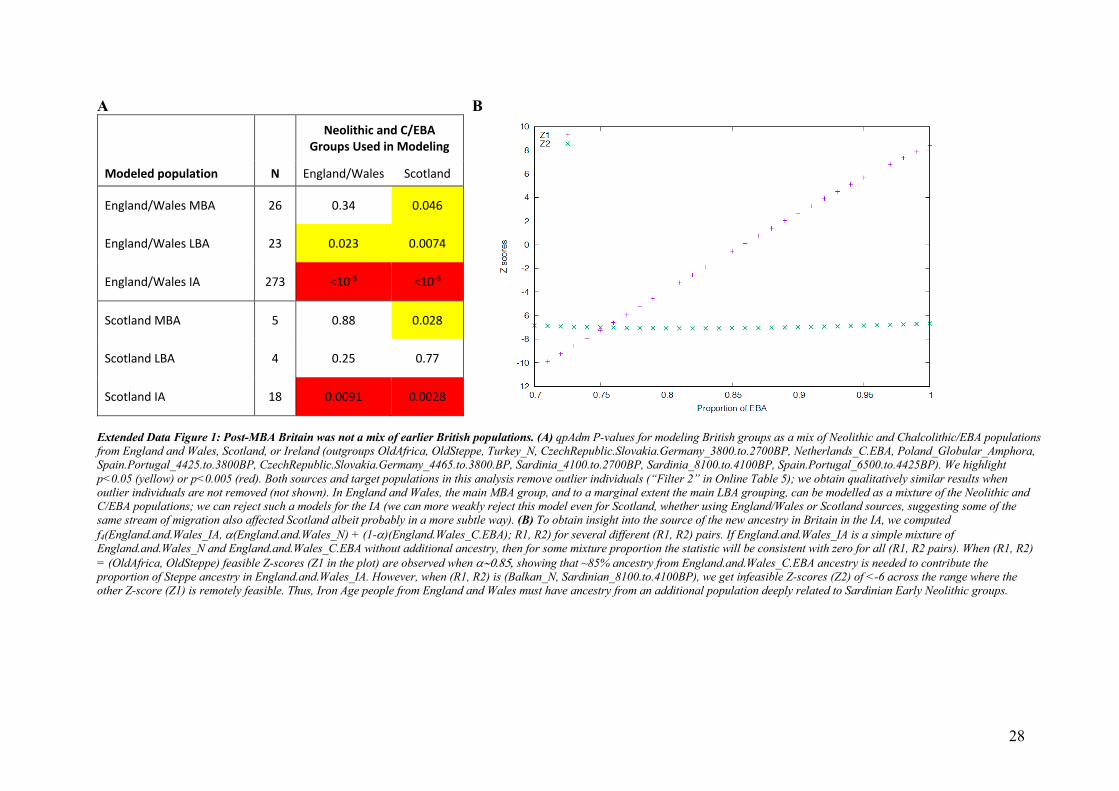
28
A B Neolithic and C/EBA
Groups Used in Modeling
Modeled population N England/Wales Scotland
England/Wales MBA 26 0.34 0.046
England/Wales LBA 23 0.023 0.0074
England/Wales IA 273 <10-6 <10-6
Scotland MBA 5 0.88 0.028
Scotland LBA 4 0.25 0.77
Scotland IA 18 0.0091 0.0028
Extended Data Figure 1: Post-MBA Britain was not a mix of earlier British populations. (A) qpAdm P-values for modeling British groups as a mix of Neolithic and Chalcolithic/EBA populations from England and Wales, Scotland, or Ireland (outgroups OldAfrica, OldSteppe, Turkey_N, CzechRepublic.Slovakia.Germany_3800.to.2700BP, Netherlands_C.EBA, Poland_Globular_Amphora, Spain.Portugal_4425.to.3800BP, CzechRepublic.Slovakia.Germany_4465.to.3800.BP, Sardinia_4100.to.2700BP, Sardinia_8100.to.4100BP, Spain.Portugal_6500.to.4425BP). We highlight p<0.05 (yellow) or p<0.005 (red). Both sources and target populations in this analysis remove outlier individuals (“Filter 2” in Online Table 5); we obtain qualitatively similar results when outlier individuals are not removed (not shown). In England and Wales, the main MBA group, and to a marginal extent the main LBA grouping, can be modelled as a mixture of the Neolithic and C/EBA populations; we can reject such a models for the IA (we can more weakly reject this model even for Scotland, whether using England/Wales or Scotland sources, suggesting some of the same stream of migration also affected Scotland albeit probably in a more subtle way). (B) To obtain insight into the source of the new ancestry in Britain in the IA, we computed f4(England.and.Wales_IA, a(England.and.Wales_N) + (1-a)(England.Wales_C.EBA); R1, R2) for several different (R1, R2) pairs. If England.and.Wales_IA is a simple mixture of England.and.Wales_N and England.and.Wales_C.EBA without additional ancestry, then for some mixture proportion the statistic will be consistent with zero for all (R1, R2 pairs). When (R1, R2) = (OldAfrica, OldSteppe) feasible Z-scores (Z1 in the plot) are observed when a~0.85, showing that ~85% ancestry from England.and.Wales_C.EBA ancestry is needed to contribute the proportion of Steppe ancestry in England.and.Wales_IA. However, when (R1, R2) is (Balkan_N, Sardinian_8100.to.4100BP), we get infeasible Z-scores (Z2) of <-6 across the range where the other Z-score (Z1) is remotely feasible. Thus, Iron Age people from England and Wales must have ancestry from an additional population deeply related to Sardinian Early Neolithic groups.

29
Extended Data Figure 2: By-individual analysis of the British time transect. Version of Figure 3 with the time transect extended into the Neolithic, and showing the individuals from Scotland. Estimates of EEF ancestry and one standard error are shown for all individuals in the British time transect that pass basic quality control, that fit to a three-way admixture model (EEF + WHG + Yamnaya) at p>0.01 using qpAdm, and for the Neolithic period that fit a two-way admixture model (EEF + WHG) at p>0.01. Blue and green show individuals from southern and northern Britain that fit the average for the main cluster of their time, while red and orange show outliers at the ancestry tails (identified either as p<0.005 based on a qpWave test from the main cluster of individuals from their period and |Z|>3 for a difference in their EEF ancestry proportion from the period, or alternatively p<0.1 and |Z|>3.5). The averages for the main clusters in both southern and northern Britain in each archaeological period (Neolithic, C/EBA, MBA, LBA and IA) are shown in dashed lines.

30
Extended Data Figure 3: Frequency change over time at two phenotypically important alleles. Present-day frequency is shown by the red line. (A-D/Top) Lactase persistence allele at rs4988235. (E-H/Bottom) Light skin pigmentation allele at rs16891982. In Britain the rise in frequency of the lactase persistence allele occurred earlier than in Central Europe. This analysis is based on direct observation of alleles; imputation results are consistent (Figure 4B). Online Table 8 gives full numerical results for 107 phenotypically important alleles.
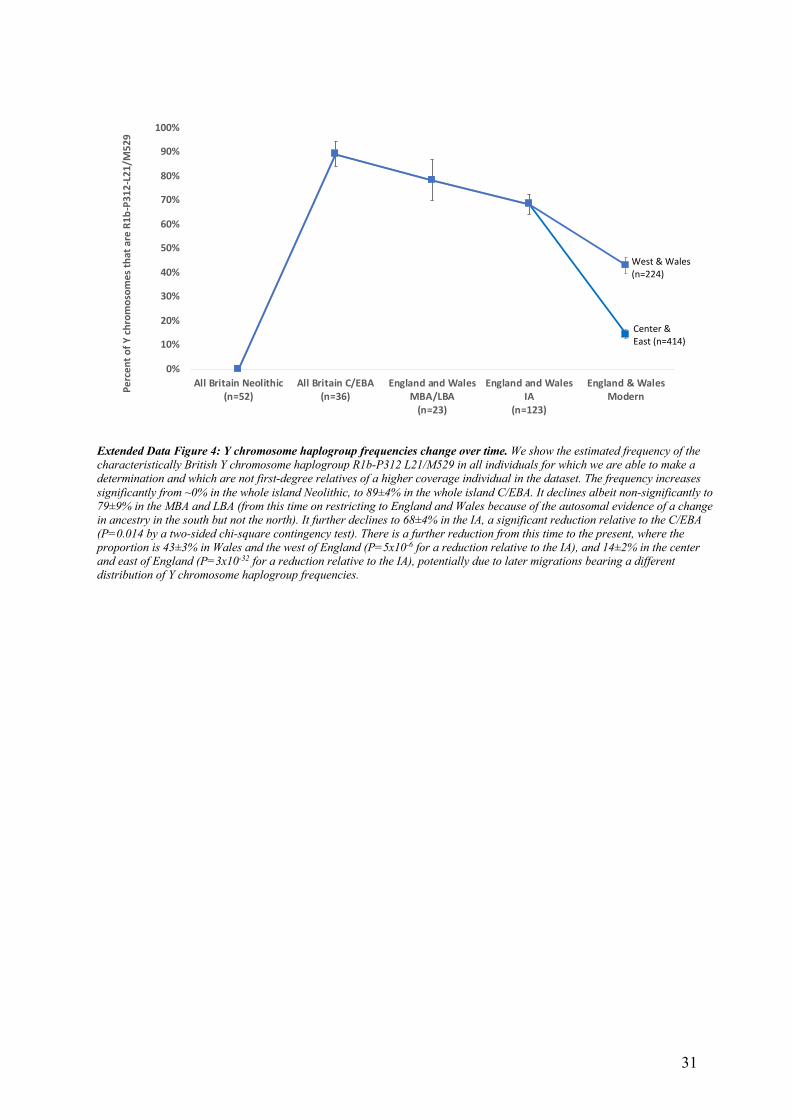
31
Extended Data Figure 4: Y chromosome haplogroup frequencies change over time. We show the estimated frequency of the characteristically British Y chromosome haplogroup R1b-P312 L21/M529 in all individuals for which we are able to make a determination and which are not first-degree relatives of a higher coverage individual in the dataset. The frequency increases significantly from ~0% in the whole island Neolithic, to 89±4% in the whole island C/EBA. It declines albeit non-significantly to 79±9% in the MBA and LBA (from this time on restricting to England and Wales because of the autosomal evidence of a change in ancestry in the south but not the north). It further declines to 68±4% in the IA, a significant reduction relative to the C/EBA (P=0.014 by a two-sided chi-square contingency test). There is a further reduction from this time to the present, where the proportion is 43±3% in Wales and the west of England (P=5x10⁻⁶ for a reduction relative to the IA), and 14±2% in the center and east of England (P=3x10-32 for a reduction relative to the IA), potentially due to later migrations bearing a different distribution of Y chromosome haplogroup frequencies.
0%
10%
20%
30%
40%
50%
60%
70%
80%
90%
100%
All Britain Neolithic(n=52)
All Britain C/EBA(n=36)
England and WalesMBA/LBA
(n=23)
England and WalesIA
(n=123)
England & WalesModern
Perc
ent o
f Y c
hrom
osom
es th
at a
re R
1b-P
312-
L21/
M52
9
Center & East (n=414)
West & Wales (n=224)

32
Extended Data Figure 5: Version of Figure 3A contrasting Kent to the rest of southern Britain. We show the period 2450-1 BCE. All the high EEF outliers at the M-LBA are from Kent—the part of the island closest to France—and in addition all the individuals from 1000-875 BCE from the group of samples showing the ramp-up from MBA to IA levels of EEF ancestry are from Kent (5 from Cliffs End Farm and 3 from East Kent Access Road). This suggests the possibility that this small region was the gateway for migration to Britain at the M-LBA. Further sampling from the rest of Britain at the M-LBA is critical in order to understand the dynamics of how this ancestry spread more broadly, but the fact that only sample from the LBA that is not from Kent, I12624 from Blackberry Field in Potterne in Wiltshire at 950-750 BCE, already has IA levels of EEF ancestry, suggests that this ancestry began spreading more broadly by the date of this individual.

33
References 1 Booth, T. J. A stranger in a strange land: a perspective on archaeological responses 508
to the palaeogenetic revolution from an archaeologist working amongst 509 palaeogeneticists. World Archaeology 51, 586-601, 510 doi:10.1080/00438243.2019.1627240 (2019). 511
2 Anthony, D. W. Migration in archeology: The baby and the bathwater. American 512 Anthropologist 92, 895-914 (1990). 513
3 Altschul, J. H. et al. Opinion: To understand how migrations affect human securities, 514 look to the past. Proc Natl Acad Sci U S A 117, 20342-20345, 515 doi:10.1073/pnas.2015146117 (2020). 516
4 Kossinna, G. Die Herkunft der Germanen: Zur Methode der Siedlungsarchäologie. 517 (Kabitzsch, 1911). 518
5 Vander Linden, M. Population history in third-millennium-BC Europe: assessing the 519 contribution of genetics. World Archaeology, doi:10.1080/00438243.2016.1209124 520 (2016). 521
6 Haak, W. et al. Massive migration from the steppe was a source for Indo-European 522 languages in Europe. Nature 522, 207-211, doi:10.1038/nature14317 (2015). 523
7 Allentoft, M. E. et al. Population genomics of Bronze Age Eurasia. Nature 522, 167-+, 524 doi:10.1038/nature14507 (2015). 525
8 Olalde, I. et al. The Beaker phenomenon and the genomic transformation of 526 northwest Europe. Nature 555, 190-196, doi:10.1038/nature25738 (2018). 527
9 Cassidy, L. M. et al. Neolithic and Bronze Age migration to Ireland and establishment 528 of the insular Atlantic genome. Proc Natl Acad Sci U S A 113, 368-373, 529 doi:10.1073/pnas.1518445113 (2016). 530
10 Brace, S. et al. Ancient genomes indicate population replacement in Early Neolithic 531 Britain. Nat Ecol Evol 3, 765-771, doi:10.1038/s41559-019-0871-9 (2019). 532
11 Galinsky, K. J., Loh, P. R., Mallick, S., Patterson, N. J. & Price, A. L. Population 533 structure of UK Biobank and ancient Eurasians reveals adaptation at genes 534 influencing blood pressure. Am J Hum Genet 99, 1130-1139, 535 doi:10.1016/j.ajhg.2016.09.014 (2016). 536
12 Leslie, S. et al. The fine-scale genetic structure of the British population. Nature 519, 537 309-314, doi:10.1038/nature14230 (2015). 538
13 Schiffels, S. et al. Iron Age and Anglo-Saxon genomes from East England reveal 539 British migration history. Nat Commun 7, 10408, doi:10.1038/ncomms10408 (2016). 540
14 Briggs, A. W. et al. Removal of deaminated cytosines and detection of in vivo 541 methylation in ancient DNA. Nucleic Acids Res 38, e87, doi:10.1093/nar/gkp1163 542 (2010). 543
15 Rohland, N., Harney, E., Mallick, S., Nordenfelt, S. & Reich, D. Partial uracil-DNA-544 glycosylase treatment for screening of ancient DNA. Philosophical transactions of the 545 Royal Society of London. Series B, Biological sciences 370, 20130624, 546 doi:10.1098/rstb.2013.0624 (2015). 547
16 Gansauge, M.-T., Aximu-Petri, A., Nagel, S. & Meyer, M. Manual and automated 548 preparation of single-stranded DNA libraries for the sequencing of DNA from ancient 549 biological remains and other sources of highly degraded DNA. Nature Protocols 15, 550 2279-2300, doi:10.1038/s41596-020-0338-0 (2020). 551
17 Gansauge, M. T. et al. Single-stranded DNA library preparation from highly degraded 552 DNA using T4 DNA ligase. Nucleic Acids Res 45, e79, doi:10.1093/nar/gkx033 553 (2017). 554
18 Fu, Q. et al. An early modern human from Romania with a recent Neanderthal 555 ancestor. Nature 524, 216-219, doi:10.1038/nature14558 (2015). 556
19 Mathieson, I. et al. Genome-wide patterns of selection in 230 ancient Eurasians. 557 Nature 528, 499-503, doi:10.1038/nature16152 (2015). 558
20 Fu, Q. et al. DNA analysis of an early modern human from Tianyuan Cave, China. 559 Proc Natl Acad Sci U S A 110, 2223-2227, doi:10.1073/pnas.1221359110 (2013). 560

34
21 Fu, Q. et al. A revised timescale for human evolution based on ancient mitochondrial 561 genomes. Curr Biol 23, 553-559, doi:10.1016/j.cub.2013.02.044 (2013). 562
22 Korneliussen, T. S., Albrechtsen, A. & Nielsen, R. ANGSD: Analysis of Next 563 Generation Sequencing Data. BMC Bioinformatics 15, 356, doi:10.1186/s12859-014-564 0356-4 (2014). 565
23 Kennett, D. J. et al. Archaeogenomic evidence reveals prehistoric matrilineal 566 dynasty. Nat Commun 8, 14115, doi:10.1038/ncomms14115 (2017). 567
24 Reich, D., Thangaraj, K., Patterson, N., Price, A. L. & Singh, L. Reconstructing Indian 568 population history. Nature 461, 489-494, doi:10.1038/nature08365 (2009). 569
25 Patterson, N. et al. Ancient admixture in human history. Genetics 192, 1065-1093, 570 doi:10.1534/genetics.112.145037 (2012). 571
26 Lazaridis, I. et al. Ancient human genomes suggest three ancestral populations for 572 present-day Europeans. Nature 513, 409-413, doi:10.1038/nature13673 (2014). 573
27 Evans, J. A., Chenery, C. A. & Montgomery, J. A summary of strontium and oxygen 574 isotope variation in archaeological human tooth enamel excavated from Britain. 575 Journal of Analytical Atomic Spectrometry 27, 754-764, doi:10.1039/C2JA10362A 576 (2012). 577
28 Fitzpatrick, A. P. The Amesbury Archer and the Boscombe Bowmen: Early Bell 578 Beaker burials at Boscombe Down, Amesbury, Wiltshire, Great Britain: Excavations 579 at Boscombe Down. Vol. 1 (Wessex Archaeology, 2011). 580
29 Millard, A. R. in Cliffs End Farm, Isle of Thanet, Kent: A Mortuary and Ritual Site of 581 the Bronze Age, Iron Age and Anglo-Saxon Period With Evidence for Long-Distance 582 Maritime Mobility (eds J. I. McKinley et al.) 135-146 (Wessex Archaeology, 2014). 583
30 Champion, T. C., Haselgrove, C., Armit, I., Creighton, J. & Gwilt, A. Understanding 584 the British Iron Age: An Agenda for Action. A Report for the Iron Age Research 585 Seminar and the Council of the Prehistoric Society. (Trust for Wessex Archaeology, 586 2001). 587
31 Ringbauer, H., Novembre, J. & Steinrücken, M. Human Parental Relatedness 588 through Time - Detecting Runs of Homozygosity in Ancient DNA. bioRxiv, 589 2020.2005.2031.126912, doi:10.1101/2020.05.31.126912 (2020). 590
32 Fernandes, D. M. et al. A genetic history of the pre-contact Caribbean. Nature 590, 591 103-110, doi:10.1038/s41586-020-03053-2 (2021). 592
33 Fernandes, D. M. et al. The spread of steppe and Iranian-related ancestry in the 593 islands of the western Mediterranean. Nat Ecol Evol 4, 334-345, doi:10.1038/s41559-594 020-1102-0 (2020). 595
34 Marcus, J. H. et al. Genetic history from the Middle Neolithic to present on the 596 Mediterranean island of Sardinia. Nat Commun 11, 939, doi:10.1038/s41467-020-597 14523-6 (2020). 598
35 Olalde, I. et al. The genomic history of the Iberian Peninsula over the past 8000 599 years. Science 363, 1230-1234, doi:10.1126/science.aav4040 (2019). 600
36 Busby, G. B. J. et al. The peopling of Europe and the cautionary tale of Y 601 chromosome lineage R-M269. Proceedings of the Royal Society B: Biological 602 Sciences 279, 884-892, doi:10.1098/rspb.2011.1044 (2012). 603
37 Rubinacci, S., Ribeiro, D. M., Hofmeister, R. & Delaneau, O. Efficient phasing and 604 imputation of low-coverage sequencing data using large reference panels. bioRxiv, 605 2020.2004.2014.040329, doi:10.1101/2020.04.14.040329 (2020). 606
38 Auton, A. et al. A global reference for human genetic variation. Nature 526, 68-74, 607 doi:10.1038/nature15393 (2015). 608
39 Hubacek, J. A. et al. Frequency of adult type-associated lactase persistence LCT-609 13910C/T genotypes in the Czech/Slav and Czech Roma/Gypsy populations. Genet 610 Mol Biol 40, 450-452, doi:10.1590/1678-4685-GMB-2016-0071 (2017). 611
40 Stead, I. M. The Arras Culture. (Yorkshire Philosophical Society, 1979). 612 41 Halkon, P. The Arras Culture of Eastern Yorkshire: Celebrating the Iron Age. 613
(Oxbow Books, 2020). 614

35
42 Jay, M., Montgomery, J., Nehlich, O., Towers, J. & Evans, J. British Iron Age chariot 615 burials of the Arras culture: a multi-isotope approach to investigating mobility levels 616 and subsistence practices. World Archaeology 45, 473-491, 617 doi:10.1080/00438243.2013.820647 (2013). 618
43 Cunliffe, B. Britain Begins. (Oxford University Press, 2013). 619 44 Koch, J. T., Cunliffe, B.W. Celtic from the West 2: Rethinking the Bronze Age and the 620
Arrival of Indo-European in Atlantic Europe. (Oxbow Books, 2013). 621 45 Needham, S. & Bowman, S. Flesh-hooks, technological complexity and the Atlantic 622
Bronze Age feasting complex. European Journal of Archaeology 8, 93-136, 623 doi:10.1177/1461957105066936 (2005). 624
46 Marcigny, C., Bourgeois, J. & Talon, M. in Rythmes et contours de la geographie 625 culturelle sur le littoral de la Manche entre le IIIe et le debut du Ier millenaire (chapter 626 title: Movement, exchange and identity in Europe in the 2nd and 1st millennia BC: 627 beyond frontiers (eds A. Lehoerff & M. Talon) 63-78 (Oxbow Books, 2017). 628
47 Marcigny, C. in Les Anglais in Normandie (chapter title: Les relations transmanche 629 durant l’age du Bronze entre 2300 et 800 avant notre ère) 47–54 (2011). 630
48 McConvell, P. in Migration History in World History (chapter title: The archaeo-631 linguistics of migration) 153-186 (Brill, 2010). 632
49 Bellwood, P. S. & Renfrew, C. Examining the Farming/Language Dispersal 633 Hypothesis. (McDonald Institute for Archaeological Research, 2002). 634
50 Sims-Williams, P. An Alternative to ‘Celtic from the East’ and ‘Celtic from the West’. 635 Cambridge Archaeological Journal 30, 511-529, doi:10.1017/S0959774320000098 636 (2020). 637
51 Mallory, J. P. The Origins of the Irish. (Thames & Hudson Inc., 2013). 638 52 Rodway, S. The Ogham inscriptions of Scotland and Brittonic Pictish. Journal of 639
Celtic Linguistics 21, 173-234, doi:10.16922/jcl.21.6 (2020). 640 53 Herm, G. The Celts: The people who came out of the darkness. (Weidenfeld and 641
Nicolson, 1976). 642 54 Guggisberg, M. in Oxford Handbook of the European Iron Age (ed K. Rebay-643
Sailsbury C. Haselgrove, P. Wells) (Oxford University Press, 2018). 644 55 Pinhasi, R., Fernandes, D. M., Sirak, K. & Cheronet, O. Isolating the human cochlea 645
to generate bone powder for ancient DNA analysis. Nature Protocols 14, 1194-1205, 646 doi:10.1038/s41596-019-0137-7 (2019). 647
56 Sirak, K. A. et al. A minimally-invasive method for sampling human petrous bones 648 from the cranial base for ancient DNA analysis. Biotechniques 62, 283-289, 649 doi:10.2144/000114558 (2017). 650
57 Dabney, J. et al. Complete mitochondrial genome sequence of a Middle Pleistocene 651 cave bear reconstructed from ultrashort DNA fragments. Proc Natl Acad Sci U S A 652 110, 15758-15763, doi:10.1073/pnas.1314445110 (2013). 653
58 Korlevic, P. et al. Reducing microbial and human contamination in DNA extractions 654 from ancient bones and teeth. Biotechniques 59, 87-93, doi:10.2144/000114320 655 (2015). 656
59 Rohland, N., Glocke, I., Aximu-Petri, A. & Meyer, M. Extraction of highly degraded 657 DNA from ancient bones, teeth and sediments for high-throughput sequencing. Nat 658 Protoc 13, 2447-2461, doi:10.1038/s41596-018-0050-5 (2018). 659
60 Briggs, A. & Heyn, P. in Methods in Molecular Biology Vol. 840 143-154 (Springer, 660 2012). 661
61 Maricic, T., Whitten, M. & Paabo, S. Multiplexed DNA sequence capture of 662 mitochondrial genomes using PCR products. PLoS One 5, e14004, 663 doi:10.1371/journal.pone.0014004 (2010). 664
62 Behar, D. M. et al. A "Copernican" reassessment of the human mitochondrial DNA 665 tree from its root. Am J Hum Genet 90, 675-684, doi:10.1016/j.ajhg.2012.03.002 666 (2012). 667
63 Li, H. & Durbin, R. Fast and accurate short read alignment with Burrows-Wheeler 668 transform. Bioinformatics 25, 1754-1760, doi:10.1093/bioinformatics/btp324 (2009). 669

36
64 Weissensteiner, H. et al. HaploGrep 2: mitochondrial haplogroup classification in the 670 era of high-throughput sequencing. Nucleic Acids Res 44, W58-63, 671 doi:10.1093/nar/gkw233 (2016). 672
65 Sawyer, S., Krause, J., Guschanski, K., Savolainen, V. & Paabo, S. Temporal 673 patterns of nucleotide misincorporations and DNA fragmentation in ancient DNA. 674 PLoS One 7, e34131, doi:10.1371/journal.pone.0034131 (2012). 675
66 Skoglund, P. et al. Separating endogenous ancient DNA from modern day 676 contamination in a Siberian Neandertal. Proc Natl Acad Sci U S A 111, 2229-2234, 677 doi:10.1073/pnas.1318934111 (2014). 678
67 Patterson, N., Price, A. L. & Reich, D. Population structure and eigenanalysis. PLoS 679 genetics 2, e190, doi:10.1371/journal.pgen.0020190 (2006). 680
68 Bronk Ramsey, C. Bayesian Analysis of Radiocarbon Dates. Radiocarbon 51, 337-681 360, doi:10.1017/S0033822200033865 (2009). 682
69 Reimer, P. J. et al. The IntCal20 northern hemisphere radiocarbon age calibration 683 curve (0–55 cal kBP). Radiocarbon 62, 725-757, doi:10.1017/RDC.2020.41 (2020). 684
685
Copyright © 2022 FDOKUMEN