Is Britain Fairer - GOV.UK
282
— The state of equality and human rights 2018
-
Upload
khangminh22 -
Category
Documents
-
view
2 -
download
0
Transcript of Is Britain Fairer - GOV.UK

— The state of equality and human rights 2018


— The state of equality and human rights 2018
Presented to Parliament pursuant to Section 12 of the Equality Act 2006 as amended by the Enterprise and Regulatory Reform Act 2013
June 2019

Equality and Human Rights Commission 2019
The text of this document (this excludes, where present, the Royal Arms and all departmental or agency logos) may be reproduced free of charge in any format or medium provided that it is reproduced accurately and not in a misleading context.
The material must be acknowledged as Equality and Human Rights Commission copyright and the document title specified. Where third party material has been identified, permission from the respective copyright holder must be sought.
Any enquiries related to this publication should be sent to us [email protected]
This publication is available at www.gov.uk/official-documents
ISBN 978-1-5286-1280-7
CCS0419112082 06/19
Printed on paper containing 75% recycled fibre content minimum
Printed in the UK by APS Group on behalf of the Controller of Her Majesty's Stationery Office


Contents
Foreword 4
Executive summary 6
1 Introduction 12
1.1 How we reviewed the evidence 13
1.2 Context 14
1.3 Next steps 15
2 Education 16
2.1 Introduction 18
2.2 Key policy and legal developments 18
2.3 Educational attainment of children and young people 24
2.4 School exclusions, bullying and NEET 30
2.5 Higher education and lifelong learning 34
2.6 Conclusion 36
3 Work 37
3.1 Introduction 39
3.2 Key policy and legal developments 40
3.3 Employment 45
3.4 Earnings 52
3.5 Occupational segregation 55
3.6 Conclusion 58
4 Living standards 59
4.1 Introduction 61
4.2 Key policy and legal developments 61
4.3 Housing 69
4.4 Poverty 74
4.5 Social care 80
4.6 Conclusion 87
5 Health 88
5.1 Introduction 91
5.2 Key policy and legal developments 91
5.3 Access to health 96
5.4 Health outcomes 102
5.5 Mental health 108
5.6 Conclusion 119
Is Britain Fairer?
2 www.equalityhumanrights.com/britain-fairer
Contents

6 Justice and personal security 120
6.1 Introduction 122
6.2 Key policy and legal developments 122
6.3 Criminal and civil justice: public confidence and access to justice 130
6.4 Violence and abuse: hate crimes, homicides, and sexual and domestic abuse 134
6.5 Conditions of detention 143
6.6 Conclusion 153
7 Participation 154
7.1 Introduction 156
7.2 Political and civic participation and representation 156
7.3 Access to services 167
7.4 Privacy and surveillance 178
7.5 Social and community cohesion 183
7.6 Conclusion 190
8 Conclusion 192
9 Recommendations for action 200
10 References 211
A Appendix: Methodology 272
A.1 Introduction 273
A.2 Our approach: the MeasurementFramework 273
A.3 Evidence gathering and analysis 274
A.4 The limitations of our approach 275
Contacts 277
Is Britain Fairer?
3www.equalityhumanrights.com/britain-fairer
Contents

Foreword from our Chair
David Isaac CBEChair
‘Is Britain Fairer? 2018’ is our state-of-the-nation report on equality and human rights. As required of us by Parliament, this review covers progress in relation to outcomes in education, health, living standards, justice and security, work and participation in politics and public life.
Is Britain Fairer? Foreword
It is the most comprehensive survey of how England, Scotland and Wales are performing in these areas, and the evidence contained here should help set the agenda for the Britain of the future.
Is Britain fairer? We now have 10 years of data to enable us to answer that question, and measure how far Britain has come in creating a fair and equal society for all. This report makes it clear that as a nation we face a defining moment: across many areas of life there are still too many who are losing out and who feel forgotten or left behind. Unless we take action, the disadvantages that many people face risk becoming entrenched for generations to come.
It is important to note that there have been improvements to celebrate. Westminster and devolved governments have pursued policies to improve attendance at university and more children are meeting the required standards at school.
There are more women in higher pay occupations and on company boards, and the gender pay gap has decreased. The referendums and elections since 2015 meant more people took part in political activities, and we have seen an increase in the diversity of Parliament.
4 www.equalityhumanrights.com/britain-fairer

This comes hand in hand with an obligation not to ignore the growing evidence that for some people, and in some areas of life, opportunities have gone backwards.
Changes to the welfare system since 2010 have made life harder for those in poverty, and this disproportionately affects a large number of disabled people, women, and people from ethnic minorities. Child poverty and homelessness have also continued to rise.
Since our last review in 2015, access to justice has deteriorated. Contributing factors have included cuts to legal aid and the disastrous impact of employment tribunal fees on people’s ability to take on employers who have flouted the law. Our rights are undermined if there is no means of redressing them in our justice system.
Spikes in hate crime and worrying levels of sexual violence and domestic abuse also give cause for concern in relation to the safety of our citizens in their personal lives and on the streets.
Westminster and devolved governments have said that they wish to tackle the injustices in our society, and that everyone should have a chance to succeed, whatever their background. Here we identify significant challenges in the delivery of these aspirations.
It is too easy to identify problems. It is our responsibility to be part of the solution. To that end, we make a series of recommendations based on our findings. We believe that some of these are relatively straightforward. For instance, since poverty is such an important contributor for many of the inequalities people experience, we believe that the UK and Welsh Governments should follow Scotland’s lead and introduce the socio-economic duty in the Equality Act to ensure public bodies work together to reduce this major area of disadvantage.
The referendum and subsequent debates about our future relationship with Europe have left many people feeling uncertain. This has resulted in a change in our political landscape and has created divisions that we have not seen for decades. As we approach Brexit, the UK Government should make a very clear statement that it will continue to safeguard our rights and quickly introduce legislation to plug the gaps left by the decision to remove the protections offered by the EU Charter of Fundamental Rights.
As we leave the EU at the end of March 2019, our review provides an important baseline from which we can measure the impact of Brexit on equality and human rights. The questions posed by ‘Is Britain Fairer?’ are based on deep-rooted British values of open-mindedness, fairness, and respect for people’s dignity. The Brexit conversation is a major opportunity to discuss the type of country we all want Britain to be.
We are committed to standing up for justice, freedom and compassion; important principles, which I believe will always define our country. We have a vital part to play in making Britain fairer – and we are asking everyone who cares about the future of our nation to work with us to act on our recommendations to improve outcomes. In our changing world, society will thrive if everyone has a fair chance in life.
We have a vital part to play in making Britain fairer – and we are asking everyone who cares about the future of our nation to work with us to act on our recommendations to improve outcomes
Is Britain Fairer? Foreword
5www.equalityhumanrights.com/britain-fairer

Executive summary
Our report ‘Is Britain Fairer? 2018’ is the most comprehensive review of how we, as a nation, are performing on equality and human rights. Looking across all areas of life, including education, work, living standards, health, justice and security, and participation in society, it provides a complete picture of people’s life chances in Britain today.
Is Britain Fairer?
6 www.equalityhumanrights.com/britain-fairer
Executive summary

And while there has been some progress – such as improvements in educationalattainment, involvement in politics andequality in the workplace – there are stillserious challenges that must be addressedin respect of access to justice, hate crimeand sexual harassment.
Child poverty has increased and the inequalities resulting from socio-economic disadvantage are seriously affecting many people’s lives. Women are still not benefitting from equality in practice and there are increasingly large gaps between the experiences and outcomes of disabled people and some ethnic minorities and the population as a whole. The persistent disadvantages faced by certain groups raise significant concerns that some people are being forgotten or left behind.
All of this is set in a context of long-term reductions to public spending, spikes in hate crime, and ongoing uncertainty about the impact of leaving the European Union.
Why have we done this, and who is it for?We have a statutory duty under the Equality Act 2006 to report to the UK Parliament on how far everyone in Britain is able to live free from discrimination and abuses of their human rights. Here we not only answer the question ‘is Britain fairer?’ since our last review in 2015, but we also provide clear recommendations for change. We want this report to set the agenda for policy-makers and influencers working in a range of sectors, and anyone interested in social progress in Britain.
‘Is Britain Fairer? 2018’ also provides us with a robust evidence base to inform our own priorities for the next three years, to be set out in our new Strategic Plan. We will work with governments, regulators, parliamentarians, public and private sector employers and non-governmental organisations to press for concerted action to implement our recommendations, and use our own unique powers to drive change where we can. In doing so, we will have a sharp focus on the most pressing issues, bringing the full range of our powers to bear in order to drive progress towards a more equal Britain before we report again. We want everyone to play their role so that, when we next ask the question ‘is Britain fairer?’ in 2021, things have improved significantly.
By 2021, Britain will have left the EU. This review therefore presents a last look at equality and human rights before Brexit happens, providing us with a benchmark against which to measure the effects of this important change on people’s lives.
How have we measured change?We have used our Measurement Framework to collect and analyse the most robust and relevant evidence, and monitor progress in a consistent way, allowing us to measure change over time. The Framework is made up of a series of ‘indicators’ – these enable us to assess the elements of life that are important to all of us, including being healthy, getting a good education, and having an adequate standard of living. We have looked at specific topics within each indicator, such as bullying at school, domestic violence and life expectancy. For each of these, we have gathered information on law, policy and people’s lived experiences, using a range of qualitative and quantitative data, and breaking down the data by the ‘protected characteristics’ of the Equality Act 2010. We have not included research that was published after 31 May 2018, and very little data from before 2015.
Is Britain Fairer? Executive summary
7www.equalityhumanrights.com/britain-fairer

What have we found?
Steps in the right directionOverall, we have found some improvements in education, participation and work. More children who were previously underperforming at school are now achieving the required standards, and there are fewer disparities in university attendance between groups sharing some protected characteristics. There are more women, black and Pakistani people in employment, more people – including women – in higher pay occupations, and the genderpay gap is decreasing.
People are also getting more involved in politics, with more people voting in recent elections. Sixteen- and 17-year-olds are now able to vote in Scottish elections and this is also being considered in Wales. More public and private services are being provided digitally, and these are increasingly being used by disabled and older people, helping ensure easier access.
Socio-economic disadvantage The picture is still bleak for the living standards of Britain’s most at-risk and ‘forgotten’ groups of people, who are in danger of becoming stuck in their current situation for years to come.
Poverty has changed little and for children it has increased; it is particularly prevalent among disabled people and for some ethnic minorities. In line with our 2015 report, UK-wide reforms to welfare and tax since 2010 continue to have a disproportionate impact on the poorest in society. These reforms are pulling more people into poverty, particularly disabled people, people from some ethnic minorities and women, weakening the safety net provided by social security that is vital to those unable to work, or stuck in low-paid or precarious work. Despite rising employment levels, work increasingly does not guarantee an adequate standard of living. Homelessness is also on the rise, putting more people in a precarious position and particularly affecting people from ethnic minorities, disabled people and other at-risk groups.
Socio-economic disadvantage has a knock-on effect across different areas of life, such as education and health. Despite improvements in school attainment for most children over the last few years, those from lower income backgrounds and Gypsy, Roma and Traveller children are getting below-average school exam results. These same children are also more likely to be excluded from school, and poorer young people are less likely to go to university. Infant mortality, the risk of which increases with deprivation, rose in 2016 for the first time in decades.
There are more women, black people and Pakistanis in employment, more people – including women – in higher pay occupations, and the gender pay gap is decreasing
Is Britain Fairer? Executive summary
8 www.equalityhumanrights.com/britain-fairer

Some groups being left behind Disabled people falling further behind
Disabled people are not enjoying the progress experienced by other groups. Their right to an inclusive education is not being fulfilled – in fact, the proportion of disabled children at special rather than mainstream schools has increased in England and Wales – and they are more likely to be excluded from school. This disadvantage continues in later life. The disability pay gap persists, with disabled people earning less per hour on average than non-disabled people. Disabled people are more likely to be in low-pay occupations and this likelihood has increased.
Disabled people are also more likely to be in poverty. Those who can’t work rely on an increasingly restricted welfare regime that is projected to lower their living standards even further. They also face poorer health and lack of access to suitable housing. Safety is another major concern, as fewer disabled people have confidence that the criminal justice system is effective.
Without the fundamental building blocks of good education, an adequate standard of living, and being safe and healthy, disabled people are often unable to participate fully in society.
Challenges to women’s safety and career progression
In some ways women’s equality has progressed significantly. The employment gap and pay gap with men has narrowed, and the number of women in higher pay occupations and represented on company boards has increased. However, full gender equality has not been achieved and there are still many factors holding women back at work – some of which stem from gender stereotypes and emerge from school or earlier. For example, gender differences in career aspirations can be seen at an early age. This trickles through to higher education, where women are under-represented in most science, technology, engineering and maths courses, despite girls performing better than boys in education. Gender segregation is also prominent in apprenticeships. All of these factors contribute to women still being more likely to be in low-pay occupations.
Bullying and sexual harassment are widespread in the workplace and in education, and three-quarters of new mothers have had a negative or potentially discriminatory experience at work as a result of pregnancy or maternity. Sexual and domestic violence is a persistent and growing concern, and affects women and girls disproportionately. These negative experiences and the inequalities we continue to observe relate closely to stereotypes and perceptions of women and girls, and limit women’s choices and opportunities.
The disability pay gap persists, with disabled people earning less per hour on average than non-disabled people
Is Britain Fairer? Executive summary
9www.equalityhumanrights.com/britain-fairer

Some ethnic minority groups falling behind
People from certain ethnic minorities, such as Indian and Chinese people, have continued to succeed in education and at work, and for others there have been marked improvements in these areas of life. However, Black African, Bangladeshi and Pakistani people are still the most likely to live in poverty and deprivation, and – given the damaging effects of poverty on education, work and health – families can become locked into disadvantage for generations. Ethnic minorities are more at risk of becoming homeless, have poorer access to healthcare and higher rates of infant mortality, and some groups have lower trust in the criminal justice system.
Gypsy, Roma and Travellers face multiple disadvantages across different areas of life. They achieve below-average results at school, experience difficulties accessing healthcare, worse health, and often have low standards of housing.
Moving backwards on justice and personal securityWe have seen a marked backwards move in justice and personal security since the improvements we found in our 2015 review. Access to justice enables us to realise our rights to freedom and fairness, but restrictions on legal aid and the introduction of employment tribunal fees – now repealed – have severely reduced people’s ability to secure redress when their rights are breached.
The conditions experienced by people held in detention have also deteriorated, with overcrowding in prisons in England and Wales risking prisoner safety and increases in incidents of self-harm and assaults in prisons. There is still a disproportionate number of ethnic minority detainees in prison and in the youth secure estate in England and Wales, despite fewer young people in custody. Levels of trust in the criminal justice system among black people are far lower than for other groups.
The level of hate crime, sexual violence and domestic abuse is concerning. While increases in reported crime may be the result of better reporting and recording, the level of identity-based violence is worrying, particularly in light of Britain’s impending exit from the EU and the spikes in hate crime we saw around the time of the referendum. The higher rates of domestic abuse and sexual assault experienced by disabled people, LGBT people and women are also of concern.
Gaps in the dataWe have been able to paint a comprehensive picture of equality and human rights for disabled people, people from ethnic minorities, women and men. But gaps in the data available to us mean that we do not yet know as much as we would like about the experiences of groups who share other protected characteristics. Evidence is particularly scarce for LGBT people, people with a religion or belief, and pregnant women and new mothers. We welcome the UK Government’s important 2018 national LGBT survey and action plan and we will continue to work with others to close gaps in readiness for our next review in 2021.
Is Britain Fairer? Executive summary
10 www.equalityhumanrights.com/britain-fairer

What needs to happen next?
Although positive progress has been made in some areas of life for some people, there is still a lot more to do to ensure everyone is free from discrimination and can enjoy their basic human rights.
To stem the increase of child of poverty across Britain, governments across Britain should conduct and publish assessments of the combined impact of tax and welfare reform, and public spending decisions, on people sharing different protected characteristics and the poorest in society, to inform national Budgets and Spending Reviews. The UK Government should also reinstate the binding targets from the Child Poverty Act 2010 for England, and develop a strategy for meeting these.
There should be an acute focus on improving life in Britain for disabled people. Government should remove its reservations to Article 24, the right to inclusive education, of the UN Convention on the Rights of Persons with Disabilities. The UK Government should also regularly report on progress in meeting its commitment to get one million more disabled people into work over the next 10 years, and support flexible and part-time working to help close the employment and pay gap. We want to see more disabled people participating in public and civic life, and to this end political parties should work with governments to ensure funding for disabled candidates’ additional costs related to their impairment.
There is an urgent need to improve the experiences of women across Britain. Schools should record and monitor prejudice-based bullying and sexual harassment in order to tackle these effectively. To reduce the gender pay gap, employers should offer all jobs as open to flexible or part-time working from day one wherever possible. We want to see changes to legislation and a statutory code of practice to deal with all forms of harassment at work. The Government should ratify and implement the Istanbul Convention (the Council of Europe Convention on preventing and combating violence against women and domestic violence).
To improve justice and personal security, Government should assess the impact of cuts to legal aid and develop an action plan to address lack of access to advice. We need an urgent examination of the reasons for increased self-harm and assaults in prisons, and the introduction of a statutory time limit of 28 days for holding anyone in immigration detention, as we continue to be the only country in the EU without one. There should also be swift implementation of all recommendations from the Lammy Review.
This is just a snapshot of our detailed recommendations – there are many others aimed at, for example, helping people to get a better education, to be healthier and to participate in politics and the wider society – and these are underpinned by the need fora robust legal framework to protect people’srights now and after Brexit. We are committedto working with others to achieve furthermeaningful change to ensure that Britainis fairer for everyone.
There is still a lot more to do to ensure everyone is free from discrimination and can enjoy their basic human rights
Is Britain Fairer? Executive summary
11www.equalityhumanrights.com/britain-fairer

1. Introduction The Equality Act 2006 gave the Equality and Human Rights Commission the statutory duty to report regularly to the UK Parliament on the extent to which equality and human rights are improving in Britain.
Is Britain Fairer?
12 www.equalityhumanrights.com/britain-fairer
Introduction
‘How fair is Britain?’ (2010) was our first review and was followed by a companion report on human rights, the ‘Human Rights Review’ (2012), and then ‘Is Britain Fairer?’ (2015). ‘Is Britain Fairer? 2018’ is our latest review and is the only report to bring together in one place the comprehensive range of evidence on how equality and human rights are being realised in practice. We have set out a clear, evidence-based assessment of where Britain has made progress, where we have fallen back, and where things have not changed. This report will be of value to policy-makers and influencers across all sectors, and to anyone with an interest in social progress and inclusion across Britain. Our aims are to:
– report on the progress of equality and human rights, highlighting areas of improvement, as well as those where no progress has been made, or the situation has deteriorated
– provide clear, measurable and achievable recommendations for action to improve people’s lives
– identify gaps in the evidence and how to address them, and
– engage with governments, regulators, parliamentary and assembly representatives, and the public, private and voluntary sectors to highlight the evidence, and agree and put into action those recommendations.
Following consultation with stakeholders, the findings of this review will also inform our next Strategic Plan 2019-2022. ‘Is Britain Fairer? 2018’ will also be the final review before the UK leaves the EU and so should act as a pre-Brexit baseline for measuring the impact of UK withdrawal on equalities and human rights.
At its heart, this review measures the gap between what we think society should be, and what it actually is: between the ideal and reality, between aspiration and attainment. It provides a strong evidence base to be able to answer the question: is Britain fairer today?
1.1 How we reviewed the evidenceThe evidence in this review is based on our Measurement Framework, which measures and monitors progress on equality and human rights across Britain in a systematic and consistent way. We have reported on six major areas of life, using a variety of indicators. Within each indicator we have analysed progress or regress in ‘structure’, ‘process’ and ‘outcome’. Simply put, the structure relates to the law, the process to government policies and the outcome to people’s experiences. The six areas of life, or ‘domains’, are: education, work, living standards, health, justice and personal security, and participation.
The evidence collection involved desk-based research of existing published sources and conducting our own secondary statistical analysis of datasets such as household surveys and administrative data (collected by government agencies such as schools and hospitals). To ensure a consistent comparison between reviews, we have not included evidence that was published after a cut-off date of 31 May 2018.
IntroductionIs Britain Fairer?
13www.equalityhumanrights.com/britain-fairer

In the statistical analysis we compared data from 2010/11, 2013/14 and 2016/17 when this was possible. Where data from some of the measures were not available for these years we used the latest data, with similar three-year gaps for consistency. We have only reported on statistically significant differences for every measure. For some measures, particularly at the level of devolved administrations, for some protected characteristics or ‘at-risk’ groups, sample size breakdowns can be low or data not available, which can limit what we have been able to comment on. The full data tables of our own analysis are available on our website.
Where referring to protected characteristics we recognise that source data and research may use terms in slightly different ways. Protected characteristics are described consistently unless a source uses a slightly different term, in which case we have replicated the term used in the source to avoid misrepresenting the findings.
The Measurement Framework also includes a definition of ‘vulnerable’ people that refers to those who are who are at higher risk of harm, abuse, discrimination or disadvantage. We have generally referred to these groups as ‘at-risk’ in the text but if the source uses ‘vulnerable’ we have retained that term. Similarly, we have retained source terminology relating to the medical model of disability, although we use the social model in our own work.
The Measurement Framework does not cover every issue that has a bearing on equality and human rights. In making our monitoring more concise and easier for people to understand we have reduced the range of evidence we report against. We consulted formally with our partners, however, to arrive at the best balance of issues to paint a comprehensive picture. A full explanation of our methodology is in the appendix.
1.2 Context The period since the last triennial review in 2015 has seen significant changes. There has been continued pressure on public spending and we have seen increased political and economic uncertainty. There have been two UK Governments during the period, following a snap election in 2017, and a referendum on membership of, and subsequent decision to leave, the EU.
Since 2015 the economy has continued to grow. UK economic growth ranged between 2.2% in 2015 and 1.8% in 2017. The UK has experienced relatively low productivity, so although unemployment levels have been low and decreasing over the period, real wage growth has suffered, with potential impact on living standards. The situation is largely the same across England, Scotland and Wales. Annual inflation rose from 0.4% in 2015 to 2.6% in 2017 (although it had reduced to 2.3% for the 12 months to May 2018, the end of our period of reporting), further squeezing real wages and therefore living standards.
The UK and devolved governments have been led by the same political parties as previously but in the UK and Scottish Parliaments those governments lost their majority, while the Welsh Government remained a minority as before.
There has been continued pressure on public spending and we have seen increased political and economic uncertainty
IntroductionIs Britain Fairer?
14 www.equalityhumanrights.com/britain-fairer

The major policy developments affecting equality and human rights within each domain are discussed in detail within the chapters. The UK Government has committed to eliminate the budget deficit, the difference between what the government borrows and spends, and this has mainly been through cuts in public spending. This has particular relevance to equality and human rights as public services are affected by these reductions, and many groups with protected characteristics or ‘at-risk’ groups are particularly dependent on public services. Public spending in Scotland and Wales has also been affected by these reductions, though some aspects of public spending are devolved.
Since 2015 the pace of spending cuts has slowed. UK Government policy continues to exempt spending on healthcare, schools and international aid from cuts in real terms. Welfare spending has decreased and this is of particular concern given that the Government’s welfare reforms (including the Personal Independence Payment and Universal Credit) have had a far greater negative impact on the poorest in society (Portes and Reed, 2018).
Demographically, the population in Britain continues to grow, increasing 1.6% between 2014 and 2016 to reach nearly 64 million people, with the largest component of this increase being international migration. The population is ageing, with the proportion aged over 65 increasing from 15% in 2011 to 18% in 2016 and those aged over 85 increasing from 2.2% to 2.4% in the same period. An ageing population in particular puts more strain on healthcare at a time when the healthcare budget is increasing relatively modestly and a funding gap persists.
Definitions of disability vary but it is estimated that 22% of the British population in 2016/17 reported that they were disabled and this had increased from 19% in 2013/14 (DWP, 2018). Disability increases with age, so 19% of working age people are disabled compared with 45% of those of state pension age. The proportion of the population that identify themselves as White in England and Wales was 86% in the 2011 census and in Scotland it was 96% (ONS, 2012a; NRS, 2013). Just over a quarter (25.1%) of the population in England and Wales reported that they had no religion while in Scotland this was 37%. The largest religions were Christianity and Islam at 59.3% and 4.8% respectively in England and Wales, and 54% and 1.4% in Scotland (ONS, 2012b; NRS, 2013). Estimates of the population identifying as lesbian, gay or bisexual are currently experimental. In 2016, 1.9% of the population in England, 2.2% in Scotland and 1.7% in Wales identified in this way (ONS, 2017).
1.3 Next stepsThe report contains recommendations on how to address many of our findings, with additional recommendations to strengthen the legal and policy framework and to address gaps in evidence. For some issues, we have powers that will enable us to be a catalyst for change; for other issues, we do not have the expertise or powers to address them alone, and aim to influence others to take action, or to work in partnership to achieve change.
We look forward to discussing the findings and recommendations of this report with a wide range of audiences and to working with a range of partners to address the challenges set out within it.
IntroductionIs Britain Fairer?
15www.equalityhumanrights.com/britain-fairer

2. Education The right to an education requires people to be free from discrimination, bullying and abuse in education settings, including in lifelong learning and higher education.
Is Britain Fairer?
16 www.equalityhumanrights.com/britain-fairer
Education

Keyfindings – Attainment at school-leaving age has improved for some groups in recent years. However, inequalities persist:
• On average, boys continue to do worse than girls at school.
• Children with educational support needs,1 poorer children and Gypsy, Roma and Traveller children continue to achieve below-average school exam results.
• Gender differences in career aspirations emerge at an early age. Boys aged 7–11 are 20 times more likely than girls to aspire to be an engineer or architect.
– The overall exclusion rate is on the rise in England and Wales. It is falling in Scotland. There are major differences in the exclusion rate of different groups:
• Boys are more likely than girls to be excluded from school.2
• Children with educational support needs, children from disadvantaged backgrounds and Gypsy and Traveller children have high exclusion rates.
• White children tend to have comparatively high exclusion rates compared with other ethnicities across Britain. But in England, Black and Mixed ethnicity children are more likely to be excluded than their White British peers.
• There has been some progress in Scotland and Wales in enabling children to challenge legal decisions made by education authorities about support needs and school exclusion. There has not been similar progress in England. Concerns remain that looked-after children throughout Britain are not given adequate support to challenge decisions made by education authorities.
• There are also concerns that the law does not adequately protect from discrimination children whose impairment gives rise to a tendency to physically or sexually abuse others.
• In England and Wales, the proportion of children attending special schools, rather than mainstream education, has increased marginally. In Scotland, it has decreased slightly.
– Half of all children report that they are bullied. Certain groups are at greater risk than others:
• Girls are more likely than boys to be bullied; more than a third of young women experience sexist comments online.
• Bullying of lesbian, gay, bisexual or transgender (LGBT) children is highly prevalent and has been linked with mental health conditions and higher risk of suicide.
– The overall proportion of young people who are not in education, employment or training (NEET) has declined:
• Disabled people are around twice as likely as non-disabled people to be NEET.
1 ‘Children with educational support needs’ is used here as a generic term for disabled children, including those with learning difficulties. The term used in England is Special Educational Needs and Disabilities (SEND). In Wales it is Additional Learning Needs (ALN) and in Scotland it is Additional Support Needs.
2 This refers to England and Scotland. There are no data on gender for exclusions in Wales.
EducationIs Britain Fairer?
17www.equalityhumanrights.com/britain-fairer

– The proportion of people holding degree-level qualifications increased between 2013/14 and 2016/17. Some groups are more likely to go to university, and succeed there, than others:
• Women are more likely than men to pursue higher education. However, women continue to be under-represented in most science, technology, engineering and maths (STEM) courses.
• Women perform better than men in higher education, on average.
• In terms of access to higher education, the gap between disadvantaged white men and the average is particularly large.
• Overall, the proportion of higher education students from poor backgrounds is increasing, but remains small.
• White British people are less likely to have a degree than those from ethnic minorities.
• However, white students are much more likely to receive a first or 2:1 than ethnic minority students.
– Disabled people continue to be less likely to hold a degree than non-disabled people and are more likely to drop out; they are also less likely to engage in ongoing, lifelong learning.
2.1 Introduction This domain examines the extent to which the right to an education is met inBritain.Protectingandfulfillingthisright means that everyone, particularly children and young people, can reach their full potential. The right to an education requires people to be free from discrimination, bullying and abuse in education settings, including in lifelong learning and higher education. This chapter examines the legal structures, policies and outcomes in relation to three main indicators: the educational attainment of children and young people; school exclusions, bullying and those who are NEET; and people’s experiences in higher education and lifelong learning. Because education policy is fully devolved across Britain, the evidence is often presented on a nation-by-nation basis. However, UK and GB datasets are also included.
2.2 Key policy and legal developmentsThe UK Government is obliged under international human rights law to implement the right to an education. Various UN treaty bodies (for example, the UN Committee on the Rights of Persons with Disabilities and the UN Committee on Economic, Social and Cultural Rights) have called upon the UK Government to: ensure all disabled children receive an inclusive education; address concerns about access to justice in the education system; tackle bullying in schools; and to progressively provide free higher education (UNCRPD, 2017; UNCESCR, 2016). The governments in England, Scotland and Wales have all developed interventions to address poor attainment in schools and have committed to widening participation in higher education. Those domiciled in Scotland do not pay university tuition fees whereas those in England and Wales do.
EducationIs Britain Fairer?
18 www.equalityhumanrights.com/britain-fairer

National governments have delivered various initiatives to improve the educational attainment of children from poorer backgrounds. Scotland’s ‘Attainment Challenge’ was introduced in 2015. An evaluation of the Attainment Scotland Fund, which is targeted in the most deprived areas, found that it had led to an increased overall commitment to tackle the attainment gap; it is too early to assess long-term outcomes (Scottish Government, 2018). Wales’s ‘Schools Challenge Cymru’ programme, introduced in 2014, met with initial success (Welsh Government, 2017a) but was ended in 2017. In England the Pupil Premium (introduced in 2011) is slowly and consistently closing the attainment gap, though it remains large (Education Policy Institute, 2016).
All three nations across Britain also provide extra support and assistance to disabled school pupils and those with learning disabilities, to enhance their learning.3 However, the UN has voiced concerns about the education of disabled children in the UK. In 2017, it reviewed the UK’s progress against the UN Convention on the Rights of Persons with Disabilities (UNCRPD). It expressed objections to the UK’s growing reliance on special schools (this is more of an issue in England than elsewhere) and claimed that the education system is not yet equipped to deliver high-quality, inclusive education in mainstream settings. According to the UN, the UK should commit to ensuring all disabled children receive an inclusive education (UNCRPD, 2017). In Scotland there already exists a legal presumption that a disabled child will receive a mainstream education.
There are also concerns about the legal framework surrounding disabled children’s rights to redress in the education system. Tribunals in England, Scotland and Wales do not currently have the power to award financial compensation when they make a finding of disability discrimination in schools (unlike cases involving race discrimination, for example). The UN has said that the UK should make sure that tribunals have powers to grant appropriate legal remedies in cases of disability discrimination and/or harassment against schoolchildren, including the power to award compensation (UNCRPD, 2017).
3 Much of the evidence in this paper focuses on educational attainment as the only available consistent measure. However, we recognise that this measure is less meaningful for those with more serious or complex conditions, where a person’s rights, wellbeing, and ability to reach their full potential may not always be represented by academic attainment.
According to the UN, the UK should commit to ensuring all disabled children receive an inclusive education (UNCRPD, 2017)
EducationIs Britain Fairer?
19www.equalityhumanrights.com/britain-fairer

There are concerns that children, especially those that are disabled, are not able to exercise their rights to be heard in matters affecting them. This right is enshrined by Article 12 of the Convention on the Rights of Children (UNCRC). The Joint Committee on Human Rights (2013) said that children should be better able to challenge legal decisions by education authorities and take forward disability discrimination claims. It said this was particularly important for looked-after children, whose legal parent is the local authority – the very body they are challenging. Addressing a recommendation made by the UN Committee on the Rights of the Child, the Education (Scotland) Act 2016 extended rights to children (aged 12–15) regarding additional support needs, including the right to ask for information or challenge a decision. Any rights can be exercised by the child only following an assessment of capacity and consideration of adverse impact on wellbeing. These assessments are carried out in most cases by the education authority involved (or in some cases the Additional Support Needs Tribunal).4 In Wales, the Additional Learning Needs
and Education Tribunal (Wales) Act 2018 also provides rights for children and young people to challenge decisions relating to additional learning needs and bring disability discrimination claims, replacing similar provisions first introduced on a pilot basis by the Wales (Education) Measure 2009. In England, the Government has announced that it does not currently intend to pilot or introduce a right for children under 16 to appeal themselves to the First-tier Tribunal (SEND) because of limited evidence of demand from families or children in England for this right.5
4 Official title is Additional Support Needs jurisdiction of the First-tier Tribunal for Scotland (Health and Education Chamber). The tribunal hears two types of appeals – references regarding the provision of education support under the Education (Additional Support for Learning) (Scotland) Act 2004, and claims in respect of disability discrimination in school education under the Equality Act 2010.
5 HC Deb 20 December 2017 c 376WS.
EducationIs Britain Fairer?
20 www.equalityhumanrights.com/britain-fairer

Children’s rights are equally important when it comes to the issue of school exclusion. The UN has called for the use of formal exclusion as a last resort only and the practice of unlawful exclusion,6 of which disabled children are particularly at risk, to be stopped (UNCRC, 2016). In England, a series of inspections found that children in need of SEND support, but who did not have Education Health and Care plans, were particularly at risk of exclusion in mainstream secondary schools. A number of parents have complained of unlawful exclusions of children with SEND (Ofsted, Care Quality Commission, 2017). In Wales, interventions implemented by some schools, pupil referral units and local authorities, such as effective behaviour management, were found to have reduced the exclusion rate (Estyn, 2015).
In Scotland, the Government published new guidance on school exclusions in 2017. It focuses on prevention, early intervention and tailored support (Scottish Government, 2017a).
The Equality Act 2010 does not provide sufficient protection for disabled children, resulting in excessive use of exclusion against at-risk children. A key factor is the way the courts apply the Equality Act 2010 (Disability) Regulations 2010 (the EAD Regulations). The EAD Regulations set out some health conditions which are not included in the definition of disability under the Equality Act. One of those excluded conditions is having a tendency to physically or sexually abuse other persons (the ‘tendency to abuse’ exception). If a condition is excluded from the definition of ‘disability’ then the disabled person is not protected from a failure to make reasonable adjustments or from other forms of disability discrimination under the Equality Act. 6 Unlawful exclusion typically means sending a child
home without formally recording this as a temporary exclusion.
A group of schoolchildren and their teacher in class.
Children’s rights are equally important when it comes to the issue of school exclusion
EducationIs Britain Fairer?
21www.equalityhumanrights.com/britain-fairer

In the case of X v Governors of a School [2015], the Upper Tribunal (UT) decided that the tendency to abuse exception applies even where that tendency arises from an underlying impairment. X was an autistic child who was excluded from school as a result of behaviour which was caused by a tendency to abuse. The UT decided the tendency to abuse exception meant she could not challenge the exclusions under the Equality Act even though her tendency to physically abuse others was undoubtedly a result of her autism. Tribunals deciding challenges to exclusion decisions for disabled children have had to apply the UT’s interpretation of the tendency to abuse exception. That interpretation has meant that it has not been possible to challenge some discriminatory decisions to exclude disabled children, which would be unlawful if the Equality Act applied.
However, the scope and application of that interpretation are currently being tested in the courts and tribunals. In Scotland, several legal cases have found local authorities discriminated against disabled children by failing to support their return to school or to put in place reasonable adjustments – which led to the child’s exclusion. Glasgow City Council was found to have discriminated against a boy with Asperger Syndrome who had been excluded on the basis of his disability by failing to put in place reasonable adjustments at his primary school (M v Glasgow City Council). City of Edinburgh Council was found on appeal to the Court of Session to have discriminated in their failure to support the return to school education of a child with autism (City of Edinburgh Council v R). The Council had not provided an adequate coordinated support plan for the child, who had sensory processing disorder and complex mental health conditions, and this was found to be discrimination arising from disability. South Lanarkshire Council was found to have discriminated against a child who had autism, sensory impairment and learning disability by excluding him from school as a result of his behaviour (South Lanarkshire Council v M). The Additional Support Needs Tribunal held there had been discrimination arising from disability, indirect discrimination and a failure to make reasonable adjustments by not properly supporting the child’s return to school education and by not providing an adequate coordinated support plan.
In Scotland, several legal cases have found local authorities discriminated against disabled children by failing to support their return to school or to put in place reasonable adjustments – which led to the child’s exclusion
EducationIs Britain Fairer?
22 www.equalityhumanrights.com/britain-fairer

In England, in 2018 the UT heard an appeal in C & C v The Governing Body of a School. In that case it was argued that the interpretation of the ‘tendency to abuse’ exception in X was wrong because it failed to take into account all the relevant human rights-based arguments. If the appeal succeeds, in future schools will need to show that a decision to exclude complies with the Equality Act where it involves a tendency to abuse arising from an underlying impairment.
As in 2015, many children across Britain are bullied because of their protected characteristics. The Scottish Parliament’s Equalities and Human Rights Committee, (2017), the UK Parliament’s Women and Equalities Select Committee (2016) and the Children’s Commissioner for Wales (2017) have called for better evidence on the prevalence of bullying and urged their respective governments to ensure schools take more effective action to counter it.
It is not mandatory in Britain for schools to collect and collate detailed information about prejudice-based bullying. The Scottish Government has introduced a voluntary policy which encourages schools to collect information about bullying incidents, including prejudice-based bullying; the level of uptake is not yet known. England and Wales have not taken such steps to improve data collection, although the Department for Education (DfE) does monitor bullying through the use of omnibus surveys. Guidance in England requires schools to collect data on sexual harassment and violence. The UN has called for all UK governments to strengthen their efforts to record and tackle bullying and harassment in schools.
Many people do not have the education and skills required to keep pace with Britain’s fast-changing economy (SMC, 2016a). Older and low-skilled workers are at particular risk of disengagement from training and lifelong learning (HM Government, 2017a). Access to regular, on-the-job training opportunities is reducing at a time when the importance of lifelong learning is growing (Taylor, 2017). The UK Government has also been urged to do more in England to support young people following completion of compulsory schooling, in order to reduce the number of 16–18 year olds who are NEET to zero by 20227 (SMC, 2016a). As yet, the Government has not adopted this target. Its industrial strategy aims to address the broader challenges facing the UK economy (HM Government, 2017b).
University students in England and Wales pay tuition fees, whereas those who are domiciled in Scotland do not. All three national governments have made commitments to widening participation in higher education. For England and Wales, this includes ensuring tuition fees do not reduce access to university for people from poorer backgrounds. In 2015, the Government set a target of doubling the proportion of young people from disadvantaged backgrounds8 going to university by 2020 and increase numbers of students from ethnic minorities by 20% (Department for Business, Innovation and Skills, 2015). It has been warned it will miss this target (Social Market Foundation, 2016). The Social Mobility Commission has called for more targeted support for female Muslim students and an improvement in access for poor White British and Black Caribbean students (SMC, 2016b).
7 The proportion of 16–18 year olds who were NEET in England in 2016/17 was 8.1%, averaged over the year.
8 Based on the POLAR3 classification, developed by the Higher Education Funding Council for England (HEFCE), which ranks areas based on participation rates in higher education across the UK. Areas with the lowest rates of participation are classified as ‘most disadvantaged’ while those with the highest are termed ‘most advantaged’.
EducationIs Britain Fairer?
23www.equalityhumanrights.com/britain-fairer

The UN Committee on Economic, Social and Cultural Rights has called for the UK to progressively introduce free higher education so that it is accessible to all (UNCESCR, 2016, para 66). Financial barriers to some students accessing higher education in England have raised domestic legal concerns. The UK Supreme Court has said that ‘making it prohibitively expensive for some students to gain access to higher education would make [the right to education in Article 2 of the First Protocol to the European Convention on Human Rights (ECHR)] theoretical or illusory’ (Lady Hale at para 24 of R (on the application of Tigere) v Secretary of State for Business, Innovation and Skills (SC)). In Tigere, restrictions on eligibility for student loans based on immigration status were ruled incompatible with the ECHR. Such barriers to access to higher education are harmful to the individuals affected and to the community as a whole. This is because some of these individuals might be lost to higher education forever and some would not join the higher-skilled work force until much later than they otherwise could have done, reducing their contribution to the economy and society.
Research found that lowering the entry requirements for disadvantaged pupils at the most selective universities would significantly improve access and representation for this group (Sutton Trust, 2017). Universities in Scotland are required to review their entry requirements by 2019, following a commitment by the Scottish Government to enhance access for disadvantaged learners (Commission on Widening Access, 2016). The Russell Group, which comprises 24 leading universities across the UK, has invested in financial support and outreach activities aimed at the most disadvantaged students in England. It will also make additional investments in Scotland and Wales (Russell Group, 2017). The impact of these various pledges remains to be seen.
The Scottish Government has promised to ensure that, by 2030, 20% of all places at Scottish universities are taken by students from the 20% most deprived areas. Currently, the proportion stands at 14% (Scottish Government, 2017d).
2.3 Educational attainment of children and young people
2.3.1 Early years educationAcross Britain there are consistent trends in the performance of young children in school, although attainment measures vary. In England, assessments are made at the Foundation Stage (age five). In Wales, they are made at the Foundation Phase (age seven). There are some common themes regarding early years attainment in both countries (Table EDU.EAT.1):
– Most pupils reach the expected level of development. Attainment has improved for most groups in the period 2013/14 to 2016/17.
– Girls perform better than boys, although boys’ improvement narrowed the gap between 2013/14 and 2016/17.
– Attainment by children with support needs is much lower than those without such needs.
– Children eligible for free school meals (FSM) or from deprived areas perform below the average.
EducationIs Britain Fairer?
24 www.equalityhumanrights.com/britain-fairer

In England, 72.5% of White British children achieved a ‘good level of development’ at Foundation Stage (as assessed by a teacher), higher than Black (69.6%), Bangladeshi (67.1%), Pakistani (64.3%) and Other White (63.9%) children and children of other ethnicities (66.6%). Attainment was lowest, by a large margin, for Gypsy, Roma and Irish Traveller children (33.2%) and highest for Indian children (77.3%). Improvement in the period 2013/14 to 2016/17 was greater for many ethnicities compared with White British children (9.7 percentage points) and greatest for Chinese (16.2 percentage points), Pakistani (14.0 percentage points) and Other White children (14.0 percentage points).
In Wales, 87.7% of White British children reached a good stage of development. The lowest percentage achievement was by Gypsy, Roma and Irish Traveller children (56.2%). Black (83.1%), Other White (78.1%) and other children (79.6%) also had attainment lower than White British children. Children of mixed ethnicity (88.8%) and Indian children (93.2%) all scored more highly than White British children.
In Scotland, the main measure used for early years education focuses on literacy and numeracy in early primary education (P1). Overall, 72.5% of all pupils in P1 in 2016/17 achieved all the expected Curriculum for Excellence (CfE) levels in reading, writing, listening and talking, and numeracy. However, some differences between different groups of children were evident:
– Children with additional support needs and those living in the most deprived areas were less likely to achieve all the expected CfE levels.
– Girls were more likely than boys to achieve all the expected CfE levels.
– There was some variation across ethnic groups. Compared with White Scottish children, Indian pupils and those with a Mixed or Multiple ethnicity were more likely to achieve all the expected CfE levels. Alongside White non-Scottish pupils, Pakistani pupils and those from Other ethnic groups were less likely to achieve the expected CfE levels.
On average, boys continue to do worse than girls at school at every stage and are more likely to be excluded in the UK
Attainment was lowest, by a large margin, for Gypsy, Roma and Irish Traveller children (33.2%) and highest for Indian children (77.3%)
EducationIs Britain Fairer?
25www.equalityhumanrights.com/britain-fairer

Difference in attainment at school-leaving age between pupils eligible for free school meals (FSM) in England
40.3%
Eligible
67.4%
Not eligible
Difference in attainment at School leaving age between pupils eligible for FSM in Wales
28.6%
Eligible
61.0%
Not eligible
Difference in attainment between school leavers living in most and least deprived areas in Scotland
35.4%
Most deprived areas
76.7%
Least deprived areas
Figures from England and Wales relate to pupils who achieved grades 9–4 in English and Mathematics in 2016/17.
Figures from Scotland relate to pupils who achieved 5 or more qualifications at SCQF Level 5 or above in 2015/16.
The rate of pupils receiving one or more fixed-period exclusion 2015/16 (per 1000 pupils)
21.1All pupils
60.0SEN
14.6No SEN
England
24.2WhiteBritish
77.3Travellerof Irishheritage
88.0Gypsy/Roma
6.7Indian
31.0Mixed
37.0Black
4.0Chinese
49.4FSM
16.4Non FSM
EducationIs Britain Fairer?
26 www.equalityhumanrights.com/britain-fairer
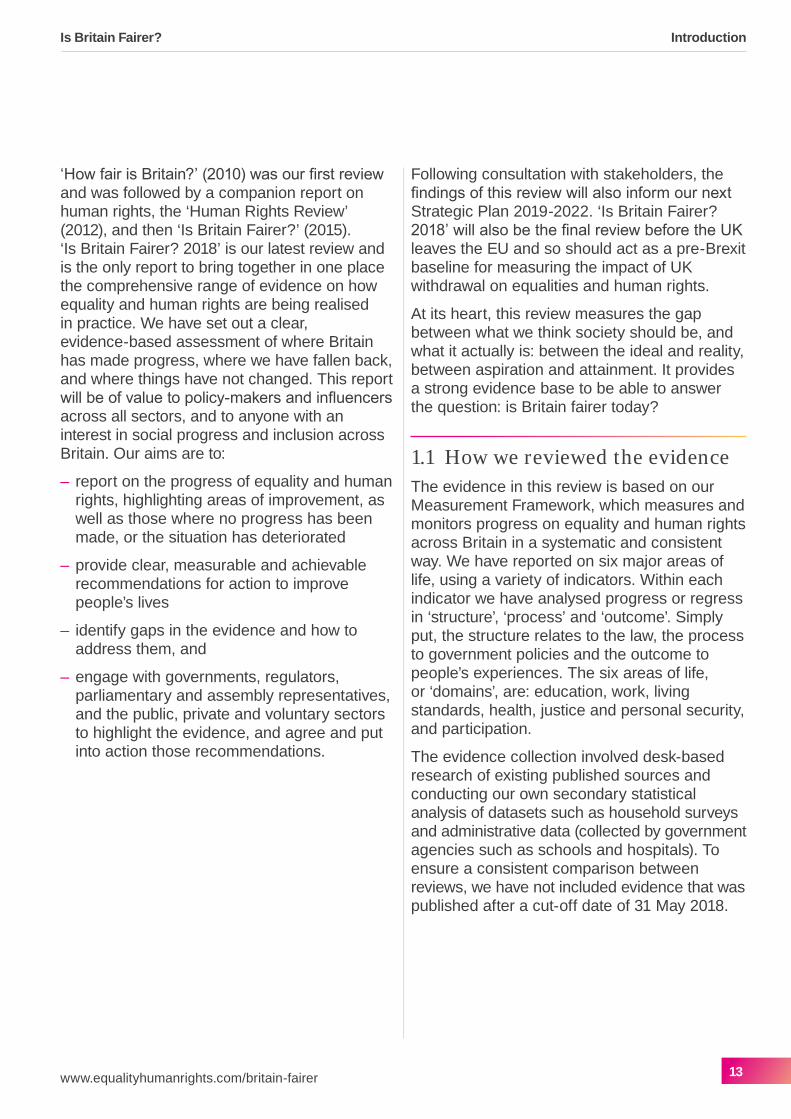
2.3.2 Attainment at school-leaving ageAlthough attainment measures vary across Britain,9 there are some common themes. In England, GCSE grading is changing, which presents challenges in tracking change over time. Overall, 63.9% of pupils in state-funded schools attained grades 9–4 in English and Mathematics at the end of Key Stage 4 in 2016/17. This was a small increase from 63.0% achieving A*–C grades10 in 2015/16 (Table EDU.EAT.2).
In 2016/17, 67.6% of girls and 60.3% of boys attained grades 9–4 in English and Mathematics. The difference was very large between pupils with Special Education Needs (SEN), 25.0% of whom attained these grades, compared with those without SEN (70.4%). Results also varied by ethnicity. Chinese pupils (84.3%) were the highest performing group, followed by Indian children (78.7%) and White Irish children (74.6%). White British pupils (63.9%) were ahead of Pakistani (60.1%) and Black pupils (59.8%) but behind Bangladeshi children (69.8%). By a huge margin, the worst performing group was Gypsy, Roma and Traveller pupils (11.8%).
Overall, educational attainment has improved in Scotland.11 Fifty-six per cent of all school leavers achieved five or more qualifications at SCQF level 5 or above in 2015/16, an increase of 1.4 percentage points since 2011/12. However, differences are evident. Girls do better than boys (62.0% compared with 50.1%), and the gap has increased since 2011/12. Only 30.3% of school leavers with additional support needs achieved five or more qualifications at SCQF level 5 or above compared with 63.5% of school leavers with no additional support needs. There is also a mixed picture by ethnic group. Compared with White Scottish school leavers, 55.6% of whom achieved five or more qualifications in 2015/16, school leavers with higher attainment were Chinese pupils (84.0%), Indian pupils (70.8%), Pakistani pupils (66.5%) and those of Mixed or Multiple ethnicities (64.9%). Other White school leavers had lower attainment (52.7%). Only 10.4% of Gypsy/Traveller school leavers achieved five or more qualifications at SCQF Level 5 over 2014/15 to 2015/16 (two-year average).
9 Unless otherwise stated, the attainment figures reported here are from analysis specifically for the ‘Is Britain Fairer? 2018’ review using data from the UK Government and devolved governments.
10 These grades are comparable with grades 9–4 in the reformed GCSEs, however not all pupils took the reformed English and Mathematics GCSEs in 2015/16 and those gaining unreformed or international GCSEs in these subjects are not counted in the measure.
11 In Scotland, the main measure used for educational attainment at secondary school is the percentage of school leavers who achieve five or more qualifications at SCQF level 5 or above.
Overall, 63.9% of pupils in state-funded schools attained grades 9–4 in English and Mathematics at the end of Key Stage 4 in 2016/17
EducationIs Britain Fairer?
27www.equalityhumanrights.com/britain-fairer
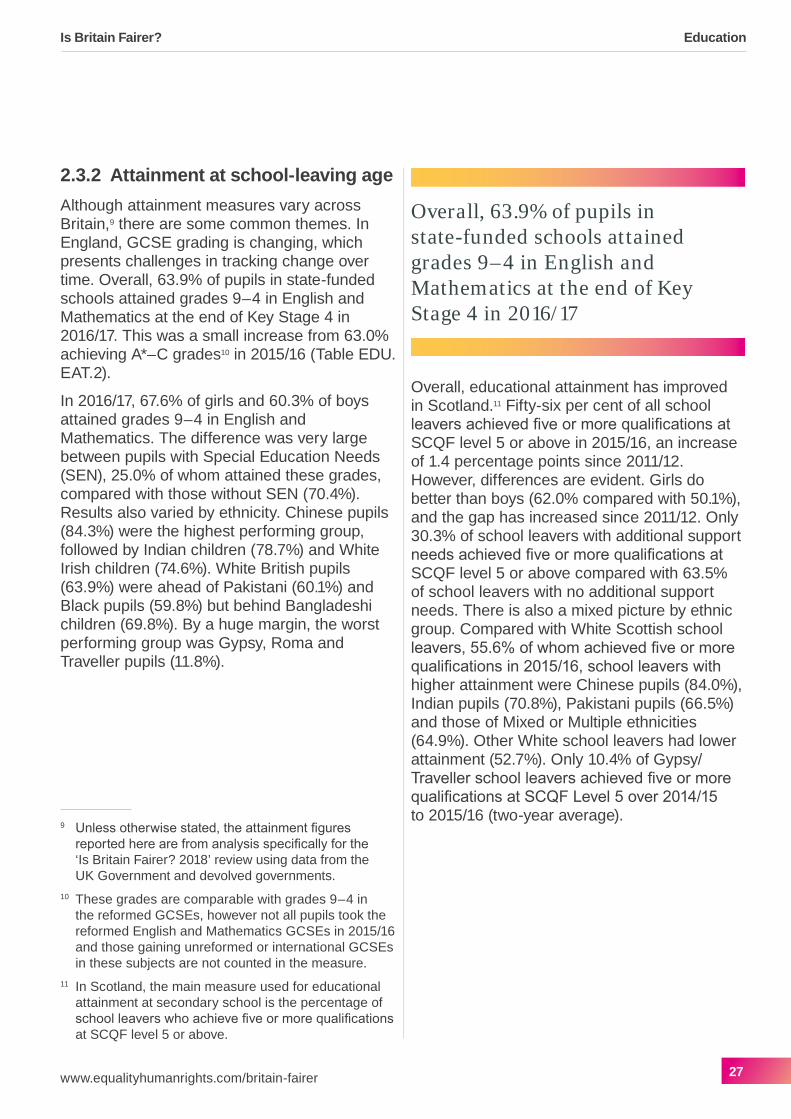
In Wales, 54.6% of pupils in year 11 achieved the Level Two Inclusive Threshold12 in 2016/17.13 A higher percentage of girls (58.8%) than boys (50.7%) achieved this level of attainment. Only one in five pupils (20.6%) with SEN reached the Level Two Inclusive Threshold, compared with two-thirds of pupils (66.6%) without SEN. Attainment was particularly low for pupils with: moderate learning difficulties (9.7%), social, emotional and behavioural impairments (16.6%), and speech, language and communications needs (15.6%).
Pooling three years’ data to overcome the small sample sizes in Wales, the analysis found that the percentages achieving the Level Two Inclusive Threshold were highest for Indian pupils (81.0%) and Chinese pupils (80.8%). A higher percentage of Bangladeshi pupils (65.2%) than White British pupils (58.9%) reached this level of attainment; only one in five Gypsy/Gypsy Roma pupils (21.5%) did so. Black (57.8%) and Pakistani children’s attainment (59.7%) was close to the average.
2.3.3 Impact of gender bias and stereotyping on educational outcomesWhile girls generally do better than boys in school, this advantage does not extend into the workplace in terms of pay and vocational achievement (see Chapter 3 (Work) for more detail). Boys’ and girls’ career expectations are formed at an early age and are heavily shaped by social norms. Survey research with 13,000 school children aged 7–11 across the UK found that the most common career choice was ‘sportsman’ for boys (34.1%) and ‘teacher/lecturer’ for girls (18.6%). Over five times the number of boys aimed to have a role in the armed forces or firefighting services, compared with girls, and over 20 times the number of boys aspired to be a ‘mechanic’ or ‘builder/architect/engineer’ (Education and Employers, 2018).
Some of these preferences are influenced by parents; only 7% of parents of girls feel that engineering would appeal to their daughters as a career (Institution of Engineering and Technology, 2015). However, the proportion of young women taking STEM A-levels increased slightly in 2017, compared with the year before (DfE, 2018). In Scotland, girls at all levels are less likely than boys to study STEM subjects. However, those that do have a higher pass rate than boys on average (Scottish Government, 2017b).
12 The Level Two Inclusive Threshold requires the equivalent volume of 5 GCSEs at grade A*–C including English or Welsh First Language and Mathematics.
13 Due to changes in the measurement of attainment at the end of compulsory education in Wales, which make it difficult to compare the data with previous years, only the results from 2016/17 are provided here.
In Wales, 54.6% of pupils in year 11 achieved the Level Two Inclusive Threshold in 2016/17
EducationIs Britain Fairer?
28 www.equalityhumanrights.com/britain-fairer

2.3.4 Impact of poverty and social exclusion on educational attainmentIn Britain, there is a strong link between social deprivation and poor educational attainment. In England, our analysis found a major difference in attainment between pupils eligible for FSM and those who were not: 40.3% of pupils who were eligible achieved 9–4 grades in English and Mathematics in 2016/17. This compares with 67.4% of non-eligible pupils. There was also a large difference in attainment between the most deprived pupils (48.0%) and the least deprived (81.6%).14 In Wales, only half as many pupils eligible for FSM (28.6%) achieved the Level Two Inclusive Threshold as pupils not eligible for FSM (61.0%).
In Scotland, the gap in attainment between school leavers living in the least and most deprived areas is large: only 35.4% of pupils in the most deprived areas attained five or more qualifications at SCQF Level 5 in 2015/16 compared with 76.7% of school leavers in the least deprived areas.15
Children from low-income households in England make less progress in secondary school than their more affluent peers, even when they have performed highly in primary school (SMC, 2017a). A child living in one of England’s most disadvantaged areas is around six times more likely to go to a school rated as ‘inadequate’ by Ofsted than a child in the least deprived (Ofsted, 2018). This disadvantage continues further into education – even when secondary school results are similar, lower household income impedes educational progress.
Young people who were eligible for FSM with similar GCSE results to their non-FSM classmates were one-third more likely to drop out of education at 16 and 30% less likely to study A-levels that could get them into a top university (SMC, 2016a). There has been ‘minimal progress’ in reducing the attainment gap between poor children and their less deprived peers over the past 20 years (SMC, 2017b). Even high-attaining children from disadvantaged family backgrounds are less likely to be high earners later in life than those from better-off families (Social Mobility and Child Poverty Commission, 2015).
Social deprivation does not affect all ethnic groups equally. Of all the children on FSM in England and Wales, White boys achieved the lowest grades at GCSE of any main ethnic group in 2016. They were either the lowest or second lowest performing ethnic group every year for a decade. White British girls were also the lowest performing main female ethnic group, of those on FSM (Sutton Trust, 2016). The situation is similar in Scotland: of school leavers who lived in the most deprived areas, White Scottish young people had the lowest attainment.
14 Living in the 10% most and least deprived areas according to the Income Deprivation Affecting Children Index (IDACI).
15 Based on Scottish Index of Multiple Deprivation (SIMD) quintiles.
EducationIs Britain Fairer?
29www.equalityhumanrights.com/britain-fairer

2.4 School exclusions, bullying and NEET
2.4.1 Exclusions from schoolSchool exclusion is linked with a range of other negative social outcomes. Survey research with British children found an association between school exclusion and poor general health, higher prevalence of learning disabilities and poor parental mental health. There were also consistently high levels of psychological distress among children who had experienced exclusion (Ford et al., 2017). Other research found that the high exclusion rate of pupils in England who were eligible for FSM had a negative impact on their attainment (SMC, 2017b).
Across Britain, some consistent themes emerge around school exclusions, although there are differences across the three nations (Table EDU.EBN.1):
– In England, the rate of pupils receiving one ormore fixed period exclusion declined overallfrom 24.2 per 1,000 in 2009/10 to 19.2 per1,000 in 2012/13, then increased to 21.1 per1,000 in 2015/16. From 2009/10 to 2015/16,the exclusion rate for pupils with SEN declinedby 5.6 pupils per 1,000 (from 65.6 to 60.0per 1,000). By ethnicity, the exclusion ratefor White British pupils was 24.2 per 1,000.Exclusion rates were highest for Gypsy/Romapupils (88.0 per 1,000) and Traveller of Irishheritage pupils (77.3 per 1,000) and alsorelatively high for Black pupils (37.0 per 1,000)and pupils of Mixed or Multiple ethnicityethnicity (31.0 per 1,000). Exclusion rates werelowest for Chinese (4.0 per 1,000) and Indianpupils (6.7 per 1,000). By gender and ethnicity,exclusion rates were highest for Gypsy/Romaboys (120.4 per 1,000) and Traveller of Irishheritage boys (115.0 per 1,000), followed byGypsy/Roma girls (54.8 per 1,000) and Blackboys (52.7 per 1,000). Exclusion rates werelowest for Chinese girls (1.3 per 1,000)followed by Indian girls (2.8 per 1,000).
– In Scotland, between 2010/11 and 2016/17,exclusion rates fell. Boys, disabled pupils,those from the most deprived areas andWhite Scottish pupils continued to have highexclusion rates. In 2016/17, the exclusion ratefor pupils with additional support needs wasmuch higher than for those without (66.6 per1,000 compared with 13.4 per 1,000respectively). Asian pupils had much lowerrates of exclusion (9.3 per 1,000) than WhiteScottish students (28.9 per 1,000). Pupils ofother ethnic backgrounds also had lowerexclusion rates than White Scottish pupils(around 20 per 1,000).
– In Wales, exclusion rates increased from30.2 per 1,000 in 2012/13 to 32.6 per 1,000in 2015/16. Pupils with SEN saw a largeincrease in exclusions of 15.7 per 1,000,while the rate for pupils with no SEN fellby 2.1 per 1,000. The exclusion rate alsoincreased for pupils eligible for FSM by8.6 per 1,000. This was more than theincrease of 1.7 per 1,000 for pupils who werenot eligible. Exclusion rates fell for Asian andBlack pupils but rose slightly for White pupils.Short, fixed-term exclusion16 rates were lowerfor Asian pupils (5.4 per 1,000), Black pupils(19.7 per 1,000) and pupils from other ethnicbackgrounds (9.4 per 1,000) than for Whitepupils (31.6 per 1,000), as well as pupils ofMixed ethnicity (31.3 per 1,000).
16 Exclusions of less than five days. Data on other types of exclusion are limited for ethnic minority pupils in Wales.
17 This contained a synthesis of the findings of nine high-profile research reports.
EducationIs Britain Fairer?
30 www.equalityhumanrights.com/britain-fairer

The drivers of high exclusion rates are complex. Across the UK, there is a link between support needs and poverty, with poorer children more likely to have support needs (Joseph Rowntree Foundation, 2016). The exclusion rates for children with support needs, and those in poverty, are higher than average (Ibid).
Research in England found that children with support needs are sometimes excluded unlawfully, as well as socially marginalised by peers and teachers in mainstream settings (O’Brien, 2016). Some families of children with support needs feel let down by the system and claim that mainstream schools fail to understand their children’s needs. One parent described the primary school experience of her son Ian, who has autism, as follows:
“ It’s Ian that doesn’t fit in and they [the teachers] failed completely to grasp the concept of that. They took him out of lessons, they took him out of class, they put him on the Wii… It was just foolish. It was lazy… it was easier to take Ian out, and had him sat along their side, colouring. The staff used it as planning and prep time.” (Cleere, 2016)
In England, the long-term trend towards inclusion of children with SEND in mainstream schools has been reversed. The proportion of such children attending special schools has increased, while the numbers attending state-funded secondary schools have declined over the past decade (DfE, 2017a). The UK Government has actively encouraged the creation of new free special schools (DfE, 2017b). As discussed above, this is at odds with the UK’s commitment to progressively achieve inclusive education for all under the UNCRPD. There has been a very small increase in the proportion of children attending special schools in Wales (Welsh Government, 2017b) whereas in Scotland the proportion has decreased (Scottish Government, 2017c). In all three nations, the proportion of all children in special schools is fairly similar, at about 1%.
2.4.2 Bullying in schools There are no official statistics on bullying in schools in Britain, although evidence exists from various sources. Ditch the Label’s ‘Annual Bullying Survey’ of 10,020 children and young people aged 12–20 across the UK found that 54% of respondents had experienced bullying at some point and one in five had been bullied in the past year. Girls were more likely to have been bullied than boys, disabled people more so than non-disabled people, and those who identified as lesbian, gay or bisexual more so than straight people. Young people who said they had been bullied at some point were asked why they thought they had been. The perceived reasons these young people gave ranged from attitudes towards one’s appearance (50% of respondents), attitudes towards one’s perceived masculinity or femininity (11% of respondents) and attitudes towards a disability (8% of respondents). Around 3% to 4% felt they had been bullied because of their religion, sexuality or gender identity (Ditch the Label, 2017).
In England, the long-term trend towards inclusion of children with SEND in mainstream schools has been reversed
EducationIs Britain Fairer?
31www.equalityhumanrights.com/britain-fairer

54%of UK respondents to Ditch the Label’s Annual Bullying Survey said they had experienced bullying at some point (2017).
A separate survey by the YMCA federation in England and Wales drew on a sample of 1,006 11–16 year olds. Around half (55%) of respondents said they had been bullied because of their appearance. Two-fifths (40%) experienced bullying at least once a week and 54% of young people experiencing bullying said it started by the age of 10 years old (YMCA, 2018). Anecdotal evidence from the National Society for the Prevention of Cruelty to Children (NSPCC) suggests that reporting of faith and race-based bullying has increased in the wake of terrorist attacks (NSPCC, 2017). Race and religion-based hate crimes are dealt with in more detail in Chapter 6.
A survey of 3,700 LGBT young people in Britain, aged 11–19, found that nearly half (45%) were bullied for being LGBT at school. In some cases the bullying was linked with mental health conditions and suicide. LGBT young people who said they had been bullied for being LGBT were more likely to have thought about taking their own life (84%) than young people who hadn’t been bullied for being LGBT (67%) (Stonewall, 2017).
Online bullying and harassment aimed at girls, in particular, is a problem. A Girlguiding UK survey of nearly 2,000 young women and girls, aged 13–21, found that 36% of respondents had experienced sexist comments on social media in the previous year – a major increase since 2014, when the proportion was 15%. (Girlguiding UK, 2017).
In the Scottish Parliament’s inquiry into bullying and harassment in schools,17 the key themes that emerged as reasons for children being bullied were physical appearance, gender, the presence of an additional support need or learning disability, sexual identity and race or faith (Scottish Parliament, 2017).
Survey research with primary and secondary school teachers in England found that 13% said that they had ‘sometimes’ seen homophobic or biphobic bullying in the previous 12 months. Seventeen per cent said the same about sexist or sexual language used to degrade girls. However, generally speaking, prejudice-based bullying tended not to have been witnessed very frequently by teachers, although this may simply have been because they were not present when it occurred (Smith et al., 2017). Survey research with pupils and their parents/carers (also in England) found that a third of pupils said they had been bullied, monthly or more often, but only 9% of parents/carers said the same of their child. The most common type of bullying witnessed by pupils related to the victim’s actual or perceived sexual orientation (Panayiotou et al., 2017).
17 This contained a synthesis of the findings of nine high-profile research reports.
A Girlguiding UK survey of nearly 2,000 young women and girls, aged 13–21, found that 36% of respondents had experienced sexist comments on social media
EducationIs Britain Fairer?
32 www.equalityhumanrights.com/britain-fairer

84%of LGBT young people in Britain who said they had been bullied had thought about taking their own life (2017).
University students achieving a first or 2:1 in UK (2017)
50.4% Black male students
79.8% White female students
1.4.3 NEET (not in education, employment or training)Across the UK, the overall proportion of young people who are NEET has been in decline for some time. This decline has been caused by increasing numbers of young people entering or staying in education after high school. The education participation rate for 16 year olds increased from 86.4% in 2000 to 96.4% in 2016 (Education Policy Institute, 2017).
Between 2010/11 and 2016/17, the percentage of people aged 16–18 who were NEET in Britain dropped by 2.6 percentage points, from 10.8% to 8.1% (Table EDU.EBN.2). Disabled people (16.2% of whom were NEET in 2016/17) were around twice as likely as non-disabled people to be NEET (7.1%). More White British people (8.3%) were NEET than Indian people (4.3%) and men (9.1%) were more likely to be NEET than women (7.1%).
In Britain, the NEET rate declined much more for Pakistani people (from 19.6% to 7.2%) than White British people (from 11.2% to 8.3%). The NEET rate declined both for men (3.0 percentage points) and women (2.3 percentage points). It dropped less for Christians (2.5 percentage points) than for those selecting the Other Religion category (13.7 percentage points).
In England, young people with the following attributes were more likely to be NEET: having a child of their own, being excluded or suspended from school, failing to achieve 5+ A*–C GCSE grades and being eligible for FSM. Other risk factors included health problems, caring responsibilities and difficult family circumstances (such as being in care or experiencing a breakdown in the relationship with their parents) (House of Commons Library, 2018). Young people who were NEET reported that their self-confidence and mental health had worsened as a result, with feelings of demoralisation a common theme (Voluntary Action Leeds, 2015).
EducationIs Britain Fairer?
33www.equalityhumanrights.com/britain-fairer

In Scotland, lack of educational qualifications was the most important risk factor in relation to young people who were NEET. Other risk factors were absence from school, having a high number of exclusions and, for young women, teenage pregnancy and being an unpaid carer for more than 20 hours a week (Scottish Government, 2015). There are long-term consequences for many young people who experience being NEET. They are more likely to be unemployed or economically inactive and if they find work they are more likely to be in low status occupations. They are also at higher risk of poor physical and mental health (Ibid).
2.5 Higher education and lifelong learning
2.5.1 Higher education, including subject choice, attainment and degree-level qualificationsOur analysis (Table EDU.HLL.1) found that:
– In 2016/17, nearly one in three people aged 25–64 (32.6%) had a degree level qualification in Britain. This is an increase from 2013/14, when the figure was 29.2%.
– More women (33.4%) than men (31.7%) had degree-level qualifications. Since 2013/14, the proportion of women with such qualifications has increased at a faster rate than that of men. Fewer disabled people (19.8%) than non-disabled people (35.7%) had degree-level qualifications. This has not changed significantly since 2013/14.
– A smaller proportion of White British people had degree-level qualifications compared with most other ethnic groups. The highest rates were among Chinese (60.6%), Indian (54.1%), and White Irish people (52.7%), compared with only 29.7% of White British people.
– Those in England (33.0%) were more likely to have degree-level qualifications than those in Scotland (30.9%) and Wales (28.2%).
While people from ethnic minorities are more likely to hold degrees, a freedom of information request found that only small numbers of Asian and Black students secure a place at Britain’s top institutions. At Cambridge University, 1% of offers were made to Black students in the period 2010–2015, whilst 3% of the population is black (David Lammy MP, 2017).
In British universities, students from ethnic minorities are slightly more likely to drop out than white students and much less likely to attain highly. In 2015/16, 78.4% of white students received a first or 2:1, compared with only 63.4% of ethnic minority students, representing an attainment gap of 15.0 percentage points. The gap was particularly large for Black African and Black Caribbean students (percentage points gaps of 26.0 and 22.5 respectively) but much smaller for Chinese and Indian graduates. While only half (50.4%) of black men at university achieve a first/2:1, nearly four-fifths (79.8%) of white women do so (Equality Challenge Unit, 2017).
In England, 43% of women aged 18 applied to higher education in 2018. In comparison, only 32% of men applied. Women of this age were 36% more likely to apply to higher education than men; women in disadvantaged areas were 66% more likely to apply to higher education than men in those areas. Similar gaps were found in Scotland and Wales (UCAS, 2018). Poor, white men are the most disadvantaged group in terms of entry to higher education. Men are also more likely to drop out and do not tend to perform as highly as women (Higher Education Policy Institute, 2016). A larger proportion of women achieve a first or 2:1 than men (75.1% compared with 70.7%) (Equality Challenge Unit, 2017).
EducationIs Britain Fairer?
34 www.equalityhumanrights.com/britain-fairer

A total of 71.8% of disabled graduates received a first or 2:1 in 2015/16 (a slight increase from 2014/15) compared with 73.4% of non-disabled graduates. The drop-out rate of disabled students is slightly higher than non-disabled students (8.4% compared with 7.3%) (Equality Challenge Unit, 2017).
Eighteen year olds from the most advantaged areas in England, Scotland18 and Wales are between 2.3 and three times more likely to enter higher education than those from the most disadvantaged areas, although this gap has narrowed in recent years (UCAS, 2017). From 2009/10 to 2016/17, the proportion of young people entering higher education from low participation neighbourhoods in the UK (as defined by the POLAR3 classification), excluding Scotland, increased from 9.6% to 11.4% (Higher Education Statistics Agency, 2018). In the period 2006 to 2016, entry rates for disadvantaged students increased by almost four percentage points at less selective universities in the UK but by just over one percentage point at the most selective (SMC, 2017b). British Pakistani and British Bangladeshi students are much more likely than White students to continue living at home with their families and study locally. The result is that universities in non-diverse areas remain ‘white-dominated’ spaces (Sutton Trust, 2018).
Other at-risk groups experience difficulties while at university. An online survey of around 4,000 students found that around half of all transgender university students had considered dropping out, a much higher proportion than average. One in five lesbian, gay or bisexual students, and one in three transgender students, had experienced at least one form of bullying or harassment on their campus (National Union of Students, 2015). More than half of young adult carers in college or university are struggling because of their caring role (Carers’ Trust, 2014).
2.5.2 Lifelong learningIn 2016/17, 28.4% of adults in Britain aged 16–64 had attended an education course or job-related training – described as ‘learning activities’ below – in the previous three months (Table EDU.HLL.2). Younger people were more likely than older people to have pursued learning activities. On average, more non-disabled people were engaged in learning activities than disabled people (30.3%, compared with 20.0%).
Mixed ethnicity (41.1%), Chinese (42%), and Black people (38.3%) were more likely to have engaged in learning activities than White British people (27.5%). Pakistani people were marginally less likely to have done so (24.6%). More women (29.4%) than men (27.3%) engaged in learning activities. Many more single people (37.6%) and those with current or former civil partnerships (31.9%) were engaged in learning activities than married people (21.3%).
18 In Scotland, there is a substantial section of higher education provision not included in UCAS’s figures. This is mostly full-time higher education provided in further education colleges, which represents around one third of young, full-time undergraduate study in Scotland.
In 2016/17, 28.2% of adults in Britain aged 16–64 had attended an education course or job-related training
EducationIs Britain Fairer?
35www.equalityhumanrights.com/britain-fairer

Between 2010/11 and 2016/17, engagement in learning activities overall dropped by -1.4 percentage points, from 29.8% to 28.4%. The change was variable across different groups. For example, it declined more for Black people (-4.7 percentage points) than White British people (-1.3 percentage points).
Lifelong learning is essential to enhance people’s employment prospects. Literacy and numeracy are poor compared with a number of countries in the Organisation for Economic Co-operation and Development (OECD), especially for younger people. The UK has one of the strongest associations between socio-economic background and literacy/numeracy among OECD countries (Government Office for Science, 2017). Furthermore, the proportion of disabled people with no qualifications is nearly three times that of non-disabled people (Papworth Trust, 2018). Lifelong learning is particularly important for at-risk groups, for example prisoners, whose literacy skills are very poor (Prisoners’ Education Trust, 2016).
2.6 Conclusion There have been a number of positive developments across education. Attainment at school-leaving age has generally improved. Resources have been targeted on school children from disadvantaged backgrounds, with some success. The proportion of young people who are NEET has declined and access to university has widened, particularly for ethnic minorities and those from disadvantaged areas. We welcome these developments.
However, educational inequality persists in Britain. Our 2015 review of equality and human rights identified a number of challenges, many of which are just as relevant in 2018:
– large school attainment gaps experienced byGypsy, Roma and Traveller children, thosewith special educational needs and childrenfrom disadvantaged backgrounds, particularlywhite boys
– bullying of school children because oftheir identity
– gender imbalances and stereotyping inthe education system
– poor educational outcomes for disabledpeople, and
– racial inequality in universities, including alarge attainment gap between black studentsand white students.
This chapter has not provided a comprehensive overview of educational inequality in Britain, due in part to evidence gaps. We would like to know more about the experiences of LGBT people at all levels of the education system. There are also obvious barriers facing Gypsies, Travellers and Roma, carers, looked-after children, homeless people and refugees and asylum seekers – but there is less evidence available about their educational experiences and outcomes.
We welcome the efforts being made by governments across Britain to address educational inequality, but more needs to be done. We are concerned about the marginalisation of disabled children, the lack of data collection on bullying in schools and persistent inequalities in higher education. Our recommendations for action at the end of this report address these issues.
EducationIs Britain Fairer?
36 www.equalityhumanrights.com/britain-fairer

3. Work
Under the right to work, all workers should be ensured fair wages and an adequate standard of living, safe and healthy working conditions, an equal opportunity to promotion and time for rest and leisure.
Is Britain Fairer?
37www.equalityhumanrights.com/britain-fairer
Work

Keyfindings – Overall employment has risen andunemployment fallen, while the rateof insecure employment has risen bothoverall and for many groups.
– Young people, disabled people, Pakistaniand Bangladeshi people, and Muslimshave consistently lower employment andhigher unemployment rates and are morelikely to be in insecure employment thanother groups.
• Differences in employment andunemployment rates for some groupshave narrowed.
• Disabled people’s employment rateis well below that of non-disabledpeople and they are more likely to beunemployed, in insecure employment,or economically inactive thannon-disabled people.
• Employment rates vary considerablyby type of impairment; the lowest ratesare for those with learning difficulties,a speech condition or mental healthconditions.
• Pakistani and Bangladeshi peoplehave both particularly low employmentrates and high unemployment rates,although their unemployment rateshave fallen. They are also more likelythan many other ethnic groups tobe in insecure employment. Theunemployment rates for the Mixed/Multiple and Black groups have fallen,but remain high.
• Among religion or belief groups,Muslims have the lowest rate ofemployment and the highest rateof unemployment and insecureemployment.
• People aged 16–24 have much higherunemployment rates than those inall age groups up to the age 65–74.
– Bullying and sexual harassment remainwidespread in the workplace, althougha lack of recent large-scale Britain-widesurveys means that it is difficult toquantify their precise extent. There issome evidence that women, particularlyyoung women, ethnic minorities, LGBand transgender people are at greaterrisk than other groups.
– Three-quarters of mothers have hada negative or possibly discriminatoryexperience during pregnancy, maternityleave or on their return to work frommaternity leave.
– There continues to be a pay gapbetween groups who share protectedcharacteristics.
• The gender pay gap in hourly earningsfor full-time employees in Britain hasnarrowed. It is consistently wider inEngland than in Scotland or Wales.
• Disabled people have lower averagehourly earnings than non-disabledpeople and the size of the pay gapvaries according to the type ofimpairment.
WorkIs Britain Fairer?
38

• The size of the gender pay gapfor full-time employees variesconsiderably between occupations andis particularly wide for those in skilledtrades and for process, plant andmachine operatives. It also variesconsiderably between industries and isparticularly wide in the finance sector.
– There has been a small increase inthe proportion of people in high-payoccupations.
• However, against this overall changethere was an increase in theproportions of disabled people inlow-pay occupations. Disabled peoplewere more likely than non-disabledpeople to be in low-pay occupations.
• Women are much more likely to bein low-pay occupations than men,however the proportion of womenin high-pay occupations has risen.
– Although women’s share of companyboard positions has increasedconsiderably in recent years, they remainunder-represented on them and are stillmuch more likely to be non-executivedirectors than executive directors.
– Apprenticeships remain stronglysegregated by sex and women are stillunder-represented in the constructionand engineering sectors.
3.1 Introduction This chapter examines the extent to which the workplace is becoming fairer and free from discrimination. Under the right to work, all workers should be ensured fair wages and an adequate standard of living, safe and healthy working conditions, an equal opportunity to promotion and time for rest and leisure. Everyone should also have the opportunity to enter, remain in and progress in employment.
The work domain has three indicators to assess progress: employment, earnings and occupational segregation. The first covers employment rates, unemployment, insecure employment and unfair treatment, bullying and harassment in the workplace. The second covers pay gaps in median hourly earnings, low pay and gender differences by occupation, sector and industry. The third covers vertical and horizontal segregation and segregation within apprenticeships.
Apprenticeships remain strongly segregated by sex and women are still under-represented in the construction and engineering sectors
WorkIs Britain Fairer?
39www.equalityhumanrights.com/britain-fairer

3.2 Key policy and legal developments Under international human rights law, the UK Government is obliged to implement the right to work and ensure just and favourable conditions of work. Various UN treaty bodies (for example, the UN Committee on Economic, Social and Cultural Rights, the UN Committee on the Rights of Persons with Disabilities, and the UN Committee on the Elimination of Racial Discrimination) have called upon the UK Government to eliminate the persistent gender pay gap; address the root causes of unemployment; intensify efforts to increase the level of representation of women in decision-making positions; and ensure that minimum wages are periodically reviewed and set at levels sufficient to provide all workers and their families with a decent standard of living (UNCESCR, 2016; UNCRPD, 2017; UNCERD, 2016).19 The UK Government is aiming to increase the National Living Wage, which was introduced in April 2016 replacing the National Minimum Wage for those aged 25 and over, to 60% of median earnings by 2020 (Pyper, 2018). Both enforcement powers and resources in relation to non-payment of the minimum wage have been increased (HM Government, 2018).
The UN and Council of Europe have also recommended that the UK Government takes measures to reduce the use of temporary employment, precarious self-employment and zero hours contracts and ensure that all migrant workers enjoy the same conditions as other workers with regard to remuneration, protection against unfair dismissal and other issues (UNCESCR, 2016; UNCRPD, 2017; UNCERD, 2016; European Committee of Social Rights, 2018). New regulations in 2015 provide greater protection for employees and workers by making exclusivity clauses in zero hours contracts unenforceable and making it unlawful to dismiss an employee or subject a worker to a detriment because they have breached such a clause. However, there are still gaps in legal protection. Various high-profile cases, notably Uber B.V. and Others v Mr Y Aslam and Others and Pimlico Plumbers Ltd and another v Smith, have looked at the employment status of individuals, dictating which, if any, employment rights they are entitled to. While the Supreme Court judgment in Pimlico Plumbers, which we funded and welcomed, shows that it is sometimes possible for those with ‘atypical’ employment arrangements to establish ‘worker’ status, it remains difficult to do so.
19 The NMW was set at £7.38 per hour for those aged 21–24 in April 2018 (with lower rates for those aged 16–17 and 18–21). The NLW was set at £7.83 per hour in April 2018.
The UK Government is aiming to increase the National Living Wage, which was introduced in April 2016 replacing the National Minimum Wage for those aged 25 and over, to 60% of median earnings by 2020 (Pyper, 2018)
WorkIs Britain Fairer?
40

Various UK-wide reviews have examined the composition of company boards. The Hampton-Alexander Review (Hampton, 2017) sought to increase the number of women on FTSE boards, with its focus being on increasing the number of women in leadership positions in FTSE 350 companies. Its first report published in 2016 contained five recommendations aimed at FTSE companies, the UK Government, investors and Executive Search Firms, while its second (2017) report assessed the extent of progress. The McGregor-Smith Review (2017) examined the position and progression of ethnic minorities in the workplace. The report contains recommendations about recruitment targets, the use of contracts and supply chains, work experience placements, and (for larger businesses) the publication of ethnicity data by salary band. Key recommendations were that organisations should gather and monitor data on ethnic minorities in the workplace; take accountability, for example by embedding diversity as a Key Performance Indicator; raise awareness of diversity issues; critically examine recruitment processes; and change processes to encourage greater diversity. The UK Government is reviewing progress against these recommendations. The Parker Review (2017) recommended that FTSE 100 Boards should have ‘at least one director of colour’ by 2021 (with FTSE 250 Boards having the same target by 2024). The Gender Representation on Public Boards (Scotland) Act 2018 states that in a tie-break situation for public board appointments, there is a requirement that a woman is appointed unless there is a substantial reason why the man should be appointed. This goes beyond positive action provisions under S159 of the Equality Act 2010.
After completing a Race Disparity Audit (Cabinet Office, 2017), the UK Government launched a website to shed light on ethnic disparities across society including in employment, unemployment, pay, business and the public sector workforce. However, this audit only covers non-devolved areas for which central government departments are responsible, so data on Scotland and Wales are limited. The Government has announced a programme of work to tackle inequalities in youth unemployment highlighted by the Race Disparity Audit (Prime Minister’s Office, 2018).
The Parker Review (2017) recommended that FTSE 100 Boards should have ‘at least one director of colour’ by 2021 (with FTSE 250 Boards having the same target by 2024)
WorkIs Britain Fairer?
41www.equalityhumanrights.com/britain-fairer

A major review of mental health in the workplace quantified how investment in supporting mental health at work is good for business and productivity. It recommended that all employers, regardless of size or industry, should adopt six ‘mental health core standards’ that lay basic foundations for an approach to workplace mental health (Stevenson and Farmer, 2017). The UK Government responded by announcing plans to transform employment prospects for disabled people and those with long-term health conditions over the next 10 years (Department for Work and Pensions and Department of Health, 2017). A House of Lords Select Committee report on the Equality Act 2010 and disability called for the UK Government to concentrate on the burden on disabled people, rather than the burden on business and for the Public Sector Equality Duty to be strengthened, among other measures (House of Lords, 2016).
The Taylor Review (2017) considered the implications of new forms of work on worker rights and responsibilities, as well as on employer freedoms and obligations. This includes workers in the gig economy, which recent UK Government research defined as involving ‘the exchange of labour for money between individuals or companies via digital platforms that actively facilitate matching between providers and customers, on a short-term and payment by task basis’ (Department for Business, Energy and Industrial Strategy, 2018). The review’s 53 recommendations cover a range of labour market issues and seek to build on the existing framework of regulation. The UK Government’s response to the Review, published in February 2018, included the setting up of four consultations on employment status, increasing transparency in the labour market, agency workers and enforcement of employment rights. Responses to the consultation are currently being evaluated (HM Government, 2018).
The Equality Act 2010 (Gender Pay Gap Information) Regulations 2017 which apply to private and voluntary sector employers in England, Scotland and Wales came into force in April 2017. The Equality Act 2010 (Specific Duties and Public Authorities) Regulations 2017 which apply to all public sector employers in Britain listed in Schedule 2 to the regulations came into force in March 2017. These regulations require employers with 250 or more employees annually to publish prescribed information about their gender pay gap. Employers are required to calculate their mean and median gender pay gaps; their mean and median bonus gender pay gaps; the proportions of male and female employees receiving a bonus; and the proportion of males and females in each quartile pay band. Private and voluntary sector employers are also required to publish a written statement, signed by an appropriate senior person, which confirms the accuracy of their calculations. This information must be published on the Government’s gender pay gap reporting website and on the employer’s own website. In Scotland and Wales, different specific duties apply in relation to public sector employers.
Following the first round of reporting (the deadlines for which were 30 March 2018 for public sector employers and 4 April 2018 for private/voluntary sector employers), just over 10,000 relevant employers had published the required information. Of these, 78% reported that they paid men more than women on average (Colebrook et al., 2018). By the beginning of July 2018, partly as a result of our enforcement action, all relevant employers had reported.
WorkIs Britain Fairer?
42

Our pay gaps strategy recommends addressing differencesinsubjectand career choices Our pay gaps strategy, Fair Opportunities For All, (EHRC, 2017a) recommends that the UK Government monitors the effectiveness of mandatory gender pay gap reporting on closing pay gaps and consults with employers on the most effective way of extending the reporting requirements to ethnicity and disability pay gaps. It also calls on the UK Government to publish statistical information on the scale and trends in disability and ethnicity pay gaps for full-time and part-time workers (in addition to gender). The strategy further argues that the UK, Scottish and Welsh Governments should develop national action plans to close gender, ethnicity and disability pay gaps and report regularly on progress.
Fair Opportunities For All also includes a range of other recommendations, including unlocking the earning potential of education by addressing differences in subject and career choices, educational attainment and access to apprenticeships; improving work opportunities for everyone, no matter who they are or where they live; making jobs at all levels available on a flexible basis; encouraging men and women to share childcare responsibilities; and reducing prejudice and bias in recruitment, promotion and pay decisions (EHRC, 2017a).
Builder discussing work with apprentices.
© Monkey Business Images / Shutterstock.com
WorkIs Britain Fairer?
43www.equalityhumanrights.com/britain-fairer

The Women and Equalities Committee published the results of its inquiry into sexual harassment in the workplace in July 2018; this draws on our call for evidence and recommendations on sexual harassment at work published in March 2018 (Women and Equalities Committee, 2018; EHRC, 2018a). Our recommendations highlighted the need to eliminate workplace sexual harassment through transforming workplace cultures, promoting transparency and strengthening legal protections which could be achieved by:
– a new mandatory duty on employers to takereasonable steps to protect workers fromharassment and victimisation
– a statutory code of practice on sexualharassment and harassment at work,specifying the steps that employers shouldtake to prevent and respond to sexualharassment
– legislation making void any contractual clausewhich prevents disclosure of future acts ofdiscrimination, harassment or victimisation
– collection and analysis of data on prevalenceand nature of sexual harassment with actionplans addressing findings
– restoring lost protections, including thepower of employment tribunals to makerecommendations aimed at reducing theadverse effects of discrimination on thewider workforce and reintroducing anamended statutory questionnaire procedurein employment-related discrimination andharassment claims
– extending time limits to bring harassmentclaims, and
– introducing interim relief for victims ofharassment.
In July 2017, the Supreme Court found, in R (on the application of UNISON) v Lord Chancellor that the introduction of substantial fees in the employment tribunal (ET) in 2013 was unlawful as it had a significant adverse impact on individuals’ abilities to access justice and enforce their employment rights, thereby preventing access to justice. Individuals were therefore able to submit a claim without paying a fee. As a result, the number of claims received by ETs has increased substantially; compared with January to March 2017, the number of single ET claims increased from 4,252 to 9,252 (118%) in January to March 2018 (Ministry of Justice, 2018).
Time limits for bringing claims in the ET remain at three months. Through its work on pregnancy and maternity and sexual harassment (EHRC, 2016; EHRC, 2018a), we have concluded that three months is not sufficient time for some people to consider what has happened to them, make a decision to pursue the claim, seek legal advice and start the legal process. Employees are also often faced with a choice of allowing the limitation period to expire while they pursue an internal grievance, or issuing a claim before they have exhausted internal procedures. We have therefore recommended that the time limit should be extended from three months to six months in cases involving pregnancy and maternity or harassment (EHRC, 2018a).
WorkIs Britain Fairer?
44

We have continued to promote and build on the findings of our major analysis of pregnancy and maternity discrimination in the workplace published in 2016 (Adams et al., 2016a; Adams et al., 2016b). Following this research, we identified six areas for action to tackle this discrimination and the Women and Equalities Committee launched an inquiry into the issue. The Committee called on the UK Government to publish an ambitious, detailed plan within the next two years or risk a further rise in pregnant women and new mothers being forced out of work (Women and Equalities Committee, 2016). In addition to policy work with employers through the Working Forward initiative, we have also called for the Equality Act 2010 to be amended to prohibit employers asking job applicants questions related to pregnancy and maternity.
In September 2017, the Women and Equalities Committee re-opened its inquiry into older people and employment, looking at current Government policies to help people extend their working lives, and considering further steps which could be taken to tackle issues including age discrimination. The inquiry is ongoing (Women and Equalities Committee, 2017).
Together with the Scottish and Welsh Governments, the UK Government plans to increase the number of apprenticeships and address barriers to participation experienced by ethnic minorities and disabled people (Davies, 2018).
3.3 Employment
3.3.1 EmploymentOur analysis of the Annual Population Survey (APS) shows that in 2016/17, 60.1% of people aged 16 and over in Britain were in employment (Table WRK.EMP.1). The employment rate, which had risen by 2.3 percentage points since 2010/11, was higher in England (60.5%) than in either Scotland (59.0%) or Wales (56.2%).
The increase in employment rates has been experienced across nearly all groups although gaps between groups with protected characteristics remain. The gender gap is narrower than in the past, but the disability gap has fluctuated. The employment rates for some ethnic groups have improved but remain low for Pakistani, Bangladeshi and Chinese people. Younger people and those approaching or over retirement age have lower employment rates, although the 55–64 rate has increased faster than average, partially due to the extension of women’s state pension age.
The employment rate is increasing for both sexes and in February to April 2018, 71.3% of women aged 16–64 were in employment (the highest since records began in 1971); the equivalent figure for men was 80.0%. The employment rate for women aged 16–64 has increased at a faster rate than for men aged 16–64 since 2015 and the gap between men’s and women’s employment rates, at 8.7% points in 2018, was also the smallest it has been since records began in 1971 (ONS, 2018a).20 The Office for National Statistics (ONS) notes that a considerable driver of the change has been the change in the state pension age resulting in fewer women leaving the workforce (ONS, 2018a).
20 These figures are seasonally adjusted.
The gender gap is narrower than in the past, but the disability gap hasfluctuated
WorkIs Britain Fairer?
45www.equalityhumanrights.com/britain-fairer

The structure of women’s employment is different to men’s. Women are more likely than men to work part-time; around 42% of women in employment work part-time, compared with around 13% of men in employment (McGuinness, 2018). The proportion of men in employment working part-time increased from 7% in 1992 to 13% in 2010 and has remained similar ever since, while the proportion of women working part-time was slightly higher in the 1990s than currently (McGuinness, 2018). Women with young children who are in employment are still more likely to work part-time than full-time, although there is evidence that the gap between full-time and part-time employment has narrowed following the UK Government’s expansion of childcare provision in England. In 2017, 25.4% of mothers with a youngest child aged 3-4 worked full-time in England (compared with 22.6% in 2010) and 38.1% worked part-time (ONS, 2017a).
However, in practice, parents in England are often not able to access the new entitlement of an additional 15 hours of free childcare for parents working over 16 hours per week because childcare providers say UK Government funding is not sufficient to cover the costs. Some providers have opted out of the scheme; others expect parents to make up for the shortfall (Lawler, 2018). In 2016, the Scottish Government published a public consultation on its commitment to almost double the hours of government-funded early learning and childcare to 1,140 hours per year by 2020. The long-term aim of the expansion is to support children’s cognitive, social and emotional development, and the secondary aim is to support more parents and carers in work, training or study (Eunson and Murray, 2017).
While rates of employment of disabled people have improved, the employment rate for non-disabled people aged 16–64 (81.1%) was still significantly higher than for disabled people aged 16–64 (50.7%) in January to March 2018 (ONS, 2018b), although the disability gap has narrowed from 32.7 percentage points in January to March 2015 to 30.3 percentage points in January to March 2018.21 Disabled people are more likely to be economically inactive than non-disabled people; in the same period 3.3 million disabled people aged 16–64 were economically inactive. This meant that 44.2% of disabled people of working age were neither in work, nor looking for work, compared with only 15.9% of non-disabled people.
Disabled people of working age were also more likely than non-disabled people to be unemployed (9.1%, compared with 3.6%), although the disability gap has narrowed from 6.2 percentage points in January to March 2015 to 5.6 percentage points in January to March 2018 (ONS, 2018b). The employment rate gap between disabled and non-disabled people is particularly wide for those aged 50–64 (Powell, 2018). Employment rates for disabled people also vary considerably according to the type of impairment; in March 2018, less than a quarter of people with learning difficulties, a speech impediment or mental health conditions were in employment (Powell, 2018).
Our analysis of the APS shows that the employment rates for both disabled and non-disabled people increased between 2013/14 and 2016/17. However, the gap between the two groups remains large and persistent.
21 The Government Statistical Service (GSS) definition of disability (rather than the Equality Act 2010 definition) is used here.
WorkIs Britain Fairer?
46

Our analysis also shows that Other White people (76.2%) had the highest employment rate in 2016/17, which was 17 percentage points higher than the White British rate (59.1%). Bangladeshi people (48.4%) had the lowest employment rate. Between 2010/11 and 2016/17 improvements occurred, with the largest employment rate increases for Pakistani (10.0 percentage points to 53.8%) and Black people (8.7 percentage points to 62.7%).
Those of no religion (69.1%) had a higher employment rate than those with any religion in 2016/17; the lowest employment rates were for Muslims (50.9%) and Christians (55.4%). Of those with a religion, between 2010/11 and 2016/17, employment rates rose for Jewish people and Muslims and declined for Christians.
Those aged 25–34, 35–44 and 45–54 had the highest employment rates in 2016/17 (all between 81% and 84%). The rates for those aged 16–24 (54.0%) and 55–64 (63.1%) were much lower. Between 2010/11 and 2016/17, employment rates increased for all age groups, with most age groups increasing by between 2.5 and 4 percentage points over the period and the largest increase being for the 55–64 age group (6.5 percentage points). This was potentially driven by the retention of older women in employment due to the state pension age changes mentioned above.
Only 1 in 10 FTSE 100 executive directors in the UK is a woman (2017)
% of disabled and non-disabled people employed aged 16-64 in Britain (2018)
51%
81%
Employed
Those of no religion (69.1%) had a higher employment rate than those with any religion in 2016/17; the lowest employment rates were for Muslims (50.9%) and Christians (55.4%)
Disabled people in employment aged 16-64
Non-disabled people in employement aged 16-64
WorkIs Britain Fairer?
47www.equalityhumanrights.com/britain-fairer

People who were single were more likely to be employed (66.7%) than those who were married (61.9%) in 2016/17 and the employment rate of single people increased by a greater amount (4.7, compared with 0.7 percentage points) since 2010/11. Those in a current or former civil partnership were more likely to be employed in 2016/17 than people with any other marital status (75.8%).
3.3.2 Unemployment Our analysis shows that in 2016/17, 4.7% of economically active people aged 16 and over in Britain were unemployed (Table WRK. EMP.2), the unemployment rate having fallen by 2.9 percentage points since 2010/11. Unemployment rates in England, Scotland and Wales were very similar.
Generally, some groups with high unemployment rates in 2010/11 experienced some of the greatest falls over the period 2010/11 to 2016/17. Young people experienced a greater fall in unemployment than older age groups but their rate in 2016/17 was still far higher than that of others. Similarly, some ethnic groups that had particularly high unemployment rates in 2010/11 experienced some of the largest decreases. The unemployment rate of disabled people fell faster than the rate for non-disabled people between 2013/14 and 2016/17 and the disability unemployment gap remained high.
Men (4.9%) were more likely than women (4.5%) to be unemployed in 2016/17, although the gap in 2010/11 was wider. Between 2010/11 and 2016/17, women’s unemployment rate decreased less (2.2 percentage points) than men’s (3.5 percentage points). Examining rates by ethnicity, Bangladeshi (13.4%) and Pakistani (10.2%) people had some of the highest unemployment rates in 2016/17. White Irish (2.4%) and White British people (4.2%) had lower unemployment rates. Muslims (11.4%) were more likely to be unemployed than any other religion or belief group in 2016/17.
Between 2010/11 and 2016/17, the unemployment rate fell for most religion or belief groups, with large decreases for Muslims, and for those of Other religions.
Similarly, those aged 16–24 who had the highest unemployment rate in 2016/17, at 12.8%, experienced the largest fall over the period 2010/11 to 2016/17, of 6.6 percentage points. Their unemployment rate in 2016/17 was more than four times the rate for those aged 45–54 (2.8%). Between 2010/11 and 2016/17, unemployment rates fell for all age groups up to 65–74.
However, the unemployment rate for disabled people (8.4%) was twice the rate for non-disabled people (4.2%) in 2016/17. It remains particularly high for those with learning difficulties or disabilities (EHRC, 2017b). The rates for both disabled and non-disabled people fell between 2013/14 and 2016/17, but for disabled people by a smaller amount.
3.3.3 Insecure employmentOur analysis shows that in 2016/17, 9.0% of employees and self-employed people aged 16 and over in Britain were in insecure employment (Table WRK.EMP.3). This meant that they were either employed in temporary employment or in agency work or were in low-paid self-employment, identified by self-employment in caring, leisure and other service occupations, process, plant and machine operative occupations, or elementary occupations, such as cleaners or kitchen and catering assistants.22 Fewer men (8.7%) than women (9.3%) were likely to be in insecure employment.
22 There is no standard definition of insecure employment and we recognise that other sources use different ones. We also recognise that some self-employed people in these occupational groups may not consider that they are in insecure employment.
WorkIs Britain Fairer?
48 www.equalityhumanrights.com/britain-fairer

23%of people on zero hour contracts are employed in the food and accommodation industries in Britain.
WorkIs Britain Fairer?
49www.equalityhumanrights.com/britain-fairer
Between 2010/11 and 2016/17, the proportion of employees and self-employed people in this type of employment increased by 0.8 percentage points, mostly before 2013/14. Any increase in insecure jobs is a concern if it has an adverse impact on job quality and living standards. A higher proportion of employees and self-employed were in insecure employment in England (9.0%) than in Scotland (8.3%) in 2016/17.
Some groups are more likely to be in insecure employment than others. These tend to be the same groups that are more likely to be unemployed or have low employment rates, such as young people, disabled people, people in certain ethnic groups and Muslims.
Among those aged under 65, those aged 16–24 had the highest insecure employment rate in 2016/17 (16.7%). This was around twice the proportion of the next four age groups. Between 2010/11 and 2016/17, insecure employment for those aged 16–24 increased by 1.6 percentage points.
Disabled people (10.3%) were more likely than non-disabled people (8.7%) to be in insecure employment in 2016/17.
Between 2010/11 and 2016/17, the proportion of Black and White British people in insecure employment increased, although Pakistani and Bangladeshi people remain around twice as likely as White British people to be in insecure employment. Similarly, Muslims (18.0%) were around twice as likely to be in insecure employment as Christians and those of no religion in 2016/17.
While insecure employment is made up of different types of employment, the patterns observed in our data are corroborated by other studies on specific employment types. A study by the Resolution Foundation estimated that the number of agency workers in the UK increased by 30% to 865,000 between 2011 and 2016. The same study (which was based on an analysis of the Labour Force Survey) found that agency workers are younger than average, and lower qualified. Black/African/Caribbean/Black British workers are three times as likely to be employed via an agency as White workers (Judge and Tomlinson, 2016).23
23 There are known robustness issues with Labour Force Survey data on agency workers; for example, it may be difficult for individuals responding to the LFS to identify accurately whether they are or are not agency workers (Judge and Tomlinson, 2016).

77%of mothers in Britain reported having had a negative or possibly discriminatory experience during pregnancy, maternity leave or on their return from maternity leave (2016).
Zero hours contracts are often cited as a precarious form of employment. These are defined as no guaranteed hours contracts. In October to December 2017, 901,000 people (2.8% of all people in employment) were employed on zero hours contracts in their main job in the UK. The industry with the largest number of people on zero hours contracts was accommodation and food (203,000), accounting for 22.6% of those on such contracts.
Women (3.3%) were more likely to be on zero hours contracts than men (2.4%) in October to December 2017, while those aged 16–24 (8.4%) were far more likely than those in older age groups to work on zero hours contracts (ONS, 2018c). Data are not analysed by ONS on the proportion of employees on zero hours contracts by disability or ethnicity. In October to December 2017, however, those who were born in the UK (2.6%) were less likely to be employed on zero hours contracts than those who were born outside the UK (3.6%) (ONS, 2018c). In addition, a UK-wide study for the TUC found that Black, Asian and minority ethnic employees were far more likely to be in insecure employment than White workers in 2016. Moreover, Black employees were twice as likely (12%) to be in insecure employment, compared with White employees (5%) (TUC, 2017a).24
3.3.4 Unfair treatment, bullying and harassment in the workplaceThere have been no large-scale Britain-wide surveys of unfair treatment, bullying and harassment in the workplace since the Fair Treatment at Work Survey 2008. This means that it is no longer possible to provide nationally representative figures on the extent to which these occur in British workplaces.
However, some indication of the extent of this can be gleaned from other large-scale, individual studies particularly by the TUC. They indicate that levels of bullying are unacceptably high and that women, particularly young women, ethnic minorities, LGB and trans people are at greater risk than other groups of experiencing bullying and harassment.
11%of mothers in Britain reported they were either dismissed; made compulsorily redundant, where others in their workplace were not; or treated so poorly they felt they had to leave their job (2016).
24 This study uses a definition of insecure employment that is different from our analysis.
WorkIs Britain Fairer?
50

One Britain-wide TUC survey found that nearly a third of adults (29%) reported that they had been bullied at work. Women (34%) were more likely to report that they were victims of bullying than men (23%) and those aged 40–59 were more likely to state that they had experienced bullying than those in other age groups (TUC, 2015). Another TUC survey found that 52% of adult women reported experiencing some form of sexual harassment; women aged 18–24 (63%) were more likely than average to state that they had experienced this (TUC, 2016). A third TUC survey found that 37% of Black or minority ethnic workers polled reported that they had been bullied, abused or experienced racial discrimination by their employer. Moreover, 43% of respondents did not feel able to report their experience of discrimination to their employers and 38% did not report incidents of bullying and harassment (TUC, 2017b). A TUC survey of lesbian, gay, bisexual, transgender plus (LGBT+) people found that 39% of all respondents stated that they had been harassed or discriminated against by a colleague, 29% by a manager and 14% by a client or patient. Almost half of transgender respondents (48%) stated that they had experienced bullying or harassment at work compared with 35% of non-transgender respondents (TUC, 2017c).
Our call for evidence in 2018, which received 750 responses, found that three-quarters of people who responded reported experiencing sexual harassment at work; the rest had witnessed harassment or supported others who had experienced it. Nearly all of the people who had been sexually harassed were women. Male respondents were more likely to state that they had supported a colleague or witnessed harassment, or that they had not experienced sexual harassment at work (EHRC, 2018a). The Women and Equalities Committee inquiry summarised the existing evidence from a range of studies of the extent of sexual harassment in the workplace (Women and Equalities Committee, 2018).
The survey we conducted with the Department for Business, Innovation and Skills in 2016 found that three in four mothers (77%) reported having had a negative or possibly discriminatory experience during pregnancy, maternity leave or on their return from maternity leave (EHRC, 2016). One in nine (11%) reported that they were either dismissed; made compulsorily redundant where others in their workplace were not; or treated so poorly they felt they had to leave their job.
The study of employers for the same project found that 84% felt it was in the interests of their organisation to support pregnant women and those on maternity leave. However, 70% said they felt women should declare upfront during recruitment if they are pregnant, while 27% felt that pregnancy put an unreasonable cost burden on the workplace (Adams et al., 2016a; Adams, 2016b). Our follow-up research revealed pervasive negative attitudes towards pregnant women, new mothers and women of child-bearing age in recruitment, which may indicate unlawful behaviour (EHRC, 2018b).
Our follow-up research revealed pervasive negative attitudes towards pregnant women, new mothers and women of child-bearing age in recruitment, which may indicate unlawful behaviour (EHRC, 2018b)
WorkIs Britain Fairer?
51www.equalityhumanrights.com/britain-fairer

The gender pay gap
18.8%19.8%
2012 2017
Gender pay gap for hourly pay excluding overtime for all employees in Britain.
Skilledtrades
Process,plant andmachineoperatives
Admin andsecretarial
Sales andcustomerservice
20.2%
24.8%
3.6%
6.2%
The size of the full-time gender pay gap in the UK varied considerably in 2017.
3.4 Earnings
3.4.1 Pay gaps in median hourly earningsMedian hourly earning allows us to compare the difference in earnings for different protected characteristics. Our analysis shows that in 2016/17, median hourly earnings of employees aged 16 and over (Table WRK.ERN.1) were £11.57 (at 2017 prices). They were higher in England (£11.63) than Wales (£10.52) and in Scotland than Wales (£11.39).25 They were higher for men (£12.81) than women (£10.30), representing a 19.4% gender pay gap. Using the Annual Survey of Hours and Earnings (ASHE) the median gender pay gap for all employees in 2017 was 18.8% (Britain) and 18.4% (UK) and the gender pay gap has decreased since 2012 (see section 2.4.3).26
Median hourly earnings increased by age to peak at £13.70 for those aged 35–44, before declining for older age groups. However, the lowest median earnings for those age groups under 75 were for those aged 16–24 (£7.58).
Median hourly earnings were higher in 2016/17 for non-disabled (£11.73) than for disabled (£10.19) employees, a disability pay gap of 13.1%, and the difference between the median earnings of the two groups was 6.5% in 2016/17. Longhi (2017) shows that the size of the pay gap varies according to the type of impairment.
25 Unless otherwise stated, the figures reported here for the earnings indicator are from analysis specifically conducted for the ‘Is Britain Fairer? 2018’ review using data from the Annual Population Survey (APS). Earnings were not significantly different in England and Scotland.
26 The gender pay gap is wider in GB than in the UK because the gender pay gap is particularly narrow in Northern Ireland.
WorkIs Britain Fairer?
52

In 2016/17, White Irish people had one of the highest median hourly earnings (£16.49). This was substantially higher than the median hourly earnings of White British people (£11.67). There were low median earnings for Bangladeshi (£9.24) and Pakistani employees (£9.93). Jewish people (£17.56) earned substantially more than those of no religion (£11.65) or any other religion and Muslims earned the least (£9.69). Between 2010/11 and 2016/17, median hourly earnings (at 2017 prices) increased for Bangladeshi employees.
3.4.2 Low pay In April 2017, provisional estimates were that 342,000 jobs in the UK (1.2% of all jobs) paid less than the National Minimum Wage (NMW) or National Living Wage (NLW) to employees aged 16 and over.27 Women held 64.6% of jobs paid below the NLW or NMW and a higher proportion of female (1.6%) than male (0.9%) employees worked in them. Moreover, a higher proportion of women working full-time (1.1%) than men working full-time (0.6%) were in such jobs, whereas similar proportions of women and men working part-time (both 2.3%) were in them. Women working part-time accounted for two-fifths of all jobs below the NLW or NMW (ONS, 2017b). D’Arcy (2017) also found that women made up three-fifths of those in low paid jobs (defined in this study as below two-thirds of national median earnings) (in April 2016); moreover, those aged 16–30 accounted for 47% of all those in low paid jobs, with those aged 16–20 alone accounting for a fifth of all those in such jobs.
Nearly a third (32.5%) of all jobs below the NLW or NMW in 2017 were in elementary occupations (e.g. cleaners or kitchen and catering assistants). Most other low paid jobs were in caring, leisure and other service occupations, sales and customer service occupations and administrative and secretarial occupations. Women comprised the majority of employees in all these occupational groups except elementary occupations (ONS, 2017c).
3.4.3 Gender differences by occupation, sector and industryGender pay gaps as they apply to differences in occupation are best identified using comparisons of full-time employees, which controls for the effect of different volumes of part-time employees in an occupation.
The gender pay gap for full-time employees only in Britain was 9.5% in 2017. The gap was narrower in Wales (6.3%) and Scotland (6.6%) than in England (10.0%).28 This is likely to reflect that there are more employees in the public sector in Wales, as 32% of employees are employed in the public sector in Wales, compared with only 24% in the UK as a whole (ONS, 2017d) and the public sector has a narrower pay gap than the private sector.
27 The data did not distinguish between the NMW and NLW.
28 The data shown are for place of work (ASHE Table 7.6), not place of residence (ASHE Table 8.6).
Nearly a third (32.5%) of all jobs below the NLW or NMW in 2017 were in elementary occupations
WorkIs Britain Fairer?
53www.equalityhumanrights.com/britain-fairer

The gender pay gap in hourly earnings for full-time employees in the UK in 2017 in the public sector (13.1%) was less than in the private sector (15.9%) and for non-profit bodies and mutual associations (16.4%). The gap was also wider in the private than the public sector in every year between 2012 and 2017.
In the UK in all nine major occupational groups,29 men working full-time had higher median hourly earnings than women who did so in 2017, but the size of the full-time gender pay gap varied considerably. The gap was widest for skilled trade occupations (24.8%) and for process, plant and machine operatives (20.2%). It was narrowest for sales and customer service occupations (3.6%) and administrative and secretarial occupations (6.2%). The gap among managers, directors and senior officials and in elementary occupations narrowed between 2012 and 2017, whereas the gap in professional occupations increased.
The gap between the median hourly earnings of women working part-time and men working full-time (gender pay gap as a result of part-time working) also varied between occupations and was much wider than the gap for full-time employees, reflecting the lower average hourly earnings of part-time employees compared with full-timers, and how that particularly affects women.
Comparing weekly and hourly pay gaps allows us to note the effect of different working hours on earnings. The overall gender pay gap in median weekly earnings for full-time employees in the UK in 2017 was 16.5%, wider than hourly earnings due to full-time male employees working longer total paid hours than female employees on average (38.8 compared with 37.4). The gender pay gap was again widest in skilled trades and for process, plant and machine operatives; women comprise only a small proportion of full-time employees in both these occupational groups. It was narrowest in sales and customer services where similar numbers of women and men are employed full-time (McGuinness, 2016). The gender pay gap for weekly earnings of full-time employees was narrower in the public and non-profit sectors than the private sector.
In 2017, the gender pay gap in hourly earnings of full-time employees in the UK also varied between industries. In those industries where comparisons could be made, the gap was widest in finance and insurance activities (30.9%). This was the same pattern as in 2012. Although the gap remains widest in this industry, it has narrowed since 2012 by 5.6 percentage points.
29 These are: managers, directors and senior officials; professional occupations; associate professional and technical occupations; administrative and secretarial occupations; skilled trades occupations; caring, leisure and other service occupations; sales and customer service occupations; process and plant machine operatives; elementary occupations.
The overall gender pay gap in median weekly earnings for full-time employees in the UK in 2017 was 16.5%
WorkIs Britain Fairer?
54

3.5 Occupational segregation
3.5.1 Vertical and horizontal segregationVertical segregation within an occupation occurs when members of one group (e.g. men) are typically employed at a higher level than members of another (e.g. women). Horizontal segregation occurs when members of one group (e.g. men) are typically employed in different types of job from members of another (e.g. women).
Our analysis of the APS shows that in 2016/17, 31.2% of people in employment aged 16 and over in Britain were employed in managerial or professional occupations (Table WRK.OCS.1).30 These tend to be high-pay occupations. A total of 27.5% were employed in caring, leisure and other service occupations, sales and customer service occupations, or elementary occupations, such as cleaners or kitchen and catering assistants (Table WRK.OCS.2). These tend to be low-pay occupations. Between 2010/11 and 2016/17, the number of people in high-pay occupations increased by 1.4 percentage points.
Evidence suggests the position for women in high-pay occupations has improved. Women (29.4%) were less likely than men (32.8%) to work in high-pay occupations in 2016/17 and much more likely to work in low-pay occupations (36.8%, compared with 19.3%). However, between 2010/11 and 2016/17, the gender gap narrowed for high-pay occupations from 8.8 to 3.4 percentage points.
The improvement seen in the occupational data is corroborated with information on director-level roles. In June 2018, women accounted for 29.0% of directors in UK FTSE 100 companies and for 23.7% of directors in UK FTSE 250 companies. The female proportion of FTSE 100 directors increased by 14 percentage points between 2012 and 2018, when women comprised only 15.0% of FTSE 100 and 9.4% of FTSE 250 directors (Sealy et al., 2016; Vinnicombe et al., 2018).
30 Unless otherwise stated, the figures reported here for the occupational segregation indicator are from analysis specifically conducted for the ‘Is Britain Fairer? 2018’ review using data from the Annual Population Survey (APS).
In June 2018, women accounted for 29.0% of directors in UK FTSE 100 companies
WorkIs Britain Fairer?
55www.equalityhumanrights.com/britain-fairer
Women also comprised a much higher proportion of FTSE 100 non-executive (35.4%) than executive directors (9.7%) in June 2018. The female share of both has increased since 2013, when women made up 21.6% of non-executive directors and 5.8% of executive directors. Since 2015, all FTSE 100 companies have had at least one female director; in 2018, 96.0% of FTSE 250 companies had at least one female director. This represented a substantial increase since 2013, when there was at least one female director in only 73.2% of FTSE 250 companies. In June 2018, there were seven female Chief Executive Officers and seven Chairs in FTSE 100 companies (Sealy et al., 2016; Vinnicombe et al., 2018). Research by Green Park reported in the McGregor-Smith Review (2017) found that the number of non-White chairs in FTSE 100 companies increased from two to three between 2012 and 2015.
The picture is different for disabled people regarding vertical segregation. Non-disabled people (32.0%) were more likely to work in high-pay occupations than disabled people (25.9%) in 2016/17, while disabled people were more likely than non-disabled people to work in low-pay occupations. This is a similar pattern to that for women and men. However, in contrast to the overall increase in high-pay jobs, between 2013/14 and 2016/17 the proportion of disabled people in low-pay occupations rose.
White Irish people (50.6%) were more likely than those in other ethnic groups to work in high-pay occupations in 2016/17, and were the least likely to work in low-pay occupations. S Those ethnic groups previously identified as more likely to be unemployed or in insecure employment had a lower percentage employed in high-pay occupations, specifically Bangladeshi (24.8%) and Black people (25.5%). Black people (41.5%) were the most likely to be employed in low-pay occupations. The proportion of White British people in low-pay occupations decreased by 0.6 percentage points between 2010/11 and 2016/17, while the proportion in high-pay occupations increased for White British (1.3 percentage points), Indian (6.2 percentage points), Black (3.2 percentage points) and people from Other ethnic groups (4.6 percentage points).
Between 2010/11 and 2016/17, the proportions of Christian, Hindu and Jewish people and those of other religions in high-pay occupations increased and the proportion of Hindu and Jewish people in low-pay occupations decreased. Jewish people (60.0%) were more likely to be employed in high-pay occupations in 2016/17 than those with any other religion, or no religion, while a high proportion of Muslims (33.7%) were in low-pay occupations.
Black people (41.5%) were the most likely to be employed in low-pay occupations
WorkIs Britain Fairer?
56

Among those in employment who were aged under 75, those aged 35–44 and 45–54 were most likely to work in high-pay occupations in 2016/17.
A higher proportion of people in employment in England (31.5%) than Scotland (29.6%) or Wales (28.5%) were in high-pay occupations in 2016/17. Between 2010/11 and 2016/17, the proportion of those employed in high-pay occupations increased by 3.1 percentage points in Scotland, 2.6 percentage points in Wales and 1.1 percentage points in England.
3.5.2 Segregation within apprenticeshipsData on apprenticeships are collected separately for England, Scotland and Wales (and are not compatible) and so it is not possible to provide overall Britain-wide data on the numbers of women and men on apprenticeships or the extent of gender segregation. In England, women accounted for 53.4% of new apprenticeships (referred to as ‘starts’) in 2016/17 (DfE, 2017), whereas men made up 50.0% of higher level apprenticeship starts in August 2017 to January 2018 (DfE, 2018).31 In Scotland, men made up 60% of starts in Modern Apprenticeships in 2016/17. In Wales, women made up 60% of apprenticeships (Davies, 2018). One common feature between the three countries is that women and men are concentrated in different apprenticeship occupational areas. Women are under-represented in sectors such as construction and engineering that tend to have better pay and prospects than predominantly female sectors such as hairdressing and early years care (Davies, 2018).
There are concerns about the under-representation of disabled people and ethnic minorities in England and Scotland. In England, in August 2017 to April 2018, learners who considered that they had a learning difficulty and/or were disabled and/or had a health condition in England made up 11.2% of apprenticeship starts, while those did not consider they had any of these made up 86.0% of starts. Those describing themselves as White made up 87.2% of starts. Asian/Asian British people made up 4.6% of starts; Black/African/Caribbean/Black British people made up 3.1%; people from the Mixed/Multiple ethnic group 2.5%; and those from Other ethnic groups 0.8% (DfE, 2018).32
31 Higher apprenticeships are those at level 4 and above.32 In the remaining cases, the learner did not provide
the information or the information was not known.
Women are under-represented in sectors such as construction and engineering that tend to have better pay and prospects (Davies, 2018)
WorkIs Britain Fairer?
57www.equalityhumanrights.com/britain-fairer

3.6 Conclusion Since the last ‘Is Britain Fairer?’ report in 2015, there has been progress in reducing inequalities between people sharing certain protected characteristics in some areas, but not in all. For example, female representation as non-executive directors on FTSE 100 Boards has risen considerably. This progress is due in part to the various reviews commissioned by the UK Government. The overall employment rate has also increased, although gaps between people sharing certain protected characteristics remain, particularly between disabled and non-disabled people. Similarly, while unemployment rates have fallen for some ethnic groups (although remaining high for Bangladeshi and Pakistani people, substantial gaps between ethnic groups remain. The gender pay gap in hourly earnings remains high, while wide gender pay gaps remain in some occupations and industries, notably the financial sector.
Finally, information is insufficient (or lacking altogether) for some people sharing certain protected characteristics. Generally speaking, there are far more large-scale Britain-wide data for sex than for any other protected characteristic, with a lack of information for sexual orientation, religion or belief and gender reassignment in particular. There are also gaps in evidence by topic, for example zero hours contracts and types of flexible working; particularly striking is the lack of any recent national survey data on unfair treatment, bullying and harassment in the workplace.
The gender pay gap in hourly earnings remains high, while wide gender pay gaps remain in some occupations and industries, notably thefinancialsector
WorkIs Britain Fairer?
58

4. Living standards Everyone should have the freedom to enjoy an adequate standard of living, with independence and security, and to be cared for and supported when necessary.
Is Britain Fairer?
59www.equalityhumanrights.com/britain-fairer
Living standards

Keyfindings – Homelessness continues to be a serious concern across all nations. Evidence links this to recent UK-wide reforms to social security, as well as a lack of affordable housing and reductions in local authority budgets to tackle homelessness. Recent legislative and policy measures to address homelessness are welcome but it is too early to evaluate their impact.
• Homelessness disproportionately affects ethnic minorities, lone parents, young care leavers, young offenders, LGBT young people, transgender people, people with mental health conditions, women at risk of domestic abuse, ex-services personnel, and those living in material deprivation.
– In England, people from ethnic minorities are still much more likely to live in overcrowded accommodation compared with White people. Across Britain, disabled people face a shortage of accessible and adaptable homes and long delays in making existing homes accessible.
– Refugees and asylum seekers continue to be affected by poor housing. A more hostile housing policy environment towards Gypsies and Travellers in England has been linked to an increase in unauthorised encampments.
– Child poverty has increased. Three in 10 children live in households in poverty, rising to over half of children in Bangladeshi, Black African, Pakistani and Other ethnicity households.
– There has been little change overall in the proportion of adults living in poverty and the overall proportion in severe material deprivation has reduced.
• Disabled people, women, and many ethnic minorities are more likely to live in poverty or to experience severe material deprivation.
– Food poverty continues to increase across Britain. Fuel poverty has remained stable in England but reduced in Scotland and is estimated to have reduced in Wales.
– UK-wide reforms to social security and taxes since 2010 are having a disproportionately negative impact on the poorest in society and are particularly affecting women, disabled people, ethnic minorities and lone parents.
– Benefit sanctions are applied inconsistently and may disproportionately impact disabled people, younger people, men and ethnic minorities.
– The proportion of social care service users reporting that they were treated with dignity and respect increased in England but declined slightly in Scotland. Older people and those with physical disabilities, frailty and sensory impairments were less likely to report this in England. In Scotland, older people, people with all impairment types, bisexual people and those of ‘Other’ sexual orientation were less likely to report this.
– Reductions to social care funding in England have led to concerns about their effect on the availability and quality of care provided, and the impact on people’s ability to live independently. Scottish and Welsh Governments have protected social care funding although the amount available has reduced in real terms due to rising need for services and no research has yet assessed the potential impact on the quality of care provided.
Living standardsIs Britain Fairer?
60 www.equalityhumanrights.com/britain-fairer

4.1 IntroductionEveryone should have the freedom to enjoy an adequate standard of living, with independence and security, and to be cared for and supported when necessary. This chapter examines three indicators of living standards in Britain (poverty, housing and social care) to assess how the right to an adequate standard of living is respected, protectedandfulfilled.
4.2 Key policy and legal developments
4.2.1 HousingHomelessness
The Homelessness Reduction Act 2017 introduced broader prevention and relief duties across local authorities in England, coming into effect in April 2018.33 The Act is a positive development. However, the Local Government Association has raised concerns that the amount of funding committed to support local authorities to deliver on their new duties may be inadequate to address rising need (LGA, 2017).
Ethnic minorities
between 2006/7 and 2016/17
28%% of all homeless households in England
14% % of population in England and Wales
Figures are for statutory homelessness: households eligible for local authority assistance, which means unintentionally homeless and falling within a specified priority need group.
33 The new duties are similar to those already in place in Wales under the Housing (Wales) Act 2014.
Living standardsIs Britain Fairer?
61www.equalityhumanrights.com/britain-fairer

In 2016, the UK Government launched a £60 million Homelessness Prevention Programme for England and established three ‘prevention trailblazers’, although no evaluations have yet been conducted to assess their effectiveness. Government reviews indicate that its targeted programmes (Positive Pathway Framework, Fair Chance and Platform for Life) are helping to tackle homelessness among young people in England (Ministry of Housing, Communities and Local Government, 2017a).
In 2017, the UK Government introduced the Flexible Homelessness Support Grant which allocates funding to local authorities for temporary accommodation, to better reflect local contexts. A Rough Sleeping Advisory Panel of homelessness experts, charities and local government was also established to support development of a national strategy to reduce rough sleeping.
Housing benefits
The cap on housing benefit introduced in 2013 by the Housing Benefit Regulations 2006 was considered by the Supreme Court in R (MA & Ors) v The Secretary of State for Work and Pensions.34 The Court held that imposing the cap on people who had an obvious medical need for an extra bedroom was unlawful discrimination. Other challenges related to disability were not successful, as the Court ruled that discrimination was lawful if the impact on the claimant depended on their ‘personal and social circumstances’ (for example, if they could in theory move to a smaller house). An application has been made to the European Court of Human Rights on behalf of those whose cases were unsuccessful in the Supreme Court challenge.
In response to the successful legal challenge the UK Government issued the Housing Benefit and Universal Credit (Size Criteria) (Miscellaneous Amendments) Regulations 2017. The regulations allow an extra bedroom for applicants meeting certain criteria. The Scottish and Welsh Governments mitigated the effect of the UK Government’s under-occupancy penalty policy by contributing further funding to Discretionary Housing Payment allocations to local authorities.
Housing tenure
The UK Government published a housing White Paper in 2017 to reform the housing market and increase the supply of new homes in England. The Housing and Planning Act 2016 included various measures to improve conditions for renters and first-time buyers in England.
The Private Housing (Tenancies) Scotland Act 2016 and the Renting Homes (Wales) Act 2016 are positive policy developments in Scotland and Wales, although their impact is not yet known.
A draft Bill to ban letting agent fees in the private rental sector was introduced to UK Parliament in November 2017 and the Welsh Government consulted on a similar move in the same year, although no new legislation has been proposed (such fees were banned in Scotland in 2012).
34 The cap is also known as the under-occupancy penalty, the spare room subsidy or ‘bedroom tax’ and reduces the amount of housing benefit paid to a council or housing association tenant who is classed as having a ‘spare’ bedroom.
Living standardsIs Britain Fairer?
62 www.equalityhumanrights.com/britain-fairer
Since 2016, landlords in England have been required to check tenants’ right to remain in the UK and can face civil penalties for renting to illegal immigrants, under the ‘Right to Rent’ scheme. One evaluation of the pilot scheme reported no overall major differences for White British and ethnic minority renters but identified a preference among landlords for tenants who were perceived as ‘lower risk’ (Brickell et al., 2015). Another reported that 42% of landlords were less likely to rent to somebody without a British passport and 27% were reluctant to engage with applicants with foreign accents or names (Joint Council for the Welfare of Immigrants, 2015). The Joint Council for the Welfare of Immigrants has been given permission to pursue a claim for judicial review against the Home Secretary to stop the scheme being rolled-out in Wales and Scotland.
Overcrowding and suitable accommodation
In 2017 the UK Government outlined a scheme to address overcrowding in the private rental sector in England, following a consultation. No legislation has yet been introduced.
The Grenfell Tower tragedy raised concerns about the state’s positive obligation to protect the right to life. We are undertaking a project, Following Grenfell, to determine if the state is fulfilling its duties under human rights and equality law. The Independent Review of Building Regulations and Fire Safety recommended a new regulatory system (Hackitt, 2018) but was widely criticized for not recommending a ban on the type of cladding used in the tower (Royal Institute of British Architects, 2018; Local Government Association, 2018a; London Assembly Planning Committee, 2018). Following the Review’s report, the UK Government announced a consultation on banning inflammable cladding on high-rise buildings. The Scottish and Welsh Governments have commissioned similar reviews that are yet to report.
In 2016 the United Nations Committee on Economic, Social and Cultural Rights called upon the UK and devolved governments to address poor housing, including substandard housing conditions, uninhabitable housing and the housing deficit, and to regulate the private rental sector effectively (UNCESCR, 2016).
Housing for Gypsies and Travellers
In 2015, the UK Government changed the definition of ‘Gypsy’ and ‘Traveller’ for English planning-related purposes (Ministry of Housing, Communities and Local Government, 2015). Those who have stopped travelling permanently are no longer classed as ‘Gypsies’ or ‘Travellers’. The consultation paper recognised that this could disproportionately affect elderly people, children and disabled children as they are more likely to have stopped travelling, so would fall outside of the new policy and applications would not be considered as a Traveller site (MHCLG, 2014).
Section 124 of the Housing and Planning Act 2016 revoked an obligation on local authorities in England to carry out a separate accommodation needs assessment for Gypsies and Travellers, although they still have a general duty to assess the housing needs of everyone in their area. A consultation from the Ministry of Housing, Communities and Local Government, the Home Office and the Ministry of Justice was announced in April 2018 to review the law and powers to deal with unauthorised caravan sites and developments in England.
The Scottish Government published a set of standards for all landlords running Gypsy/Traveller sites to comply with by June 2018. These are designed to bring the quality of accommodation on sites up to a minimum standard.
Living standardsIs Britain Fairer?
63www.equalityhumanrights.com/britain-fairer

4.2.2 PovertySocial security and the benefit system
The Welfare Reform and Work Act 2016 replaced binding targets for England and Scotland to reduce child poverty in the Child Poverty Act 2010 with a new duty on the UK Government to report annually on ‘life chances’ indicators relating to worklessness and educational attainment. It also removed the measure of poverty based on family income. The Child Poverty (Scotland) Act 2017 reintroduced these income-based targets and set statutory targets to reduce child poverty by 2030.
3 in 10 children are living in poverty (2015/16) in Britain
In the context of ongoing austerity measures, the UK Government made the following reforms to social security:
– Benefit cap reduced to £20,000 (£23,000 in London) for couples with or without children and single parents, and £13,400 (£15,410 in London) for single people without children (2016).
– Benefits frozen from 2016–2020: Universal Credit (UC), Income Support, Job Seeker’s Allowance, Employment and Support Allowance, Working Tax Credits, Child Tax Credits, Child Benefit, Housing Benefit and Local Housing Allowance.
– UC allowances for children restricted to a maximum of two children (2017).
– Waiting period from UC claim to first payment reduced to five weeks and calls to the UC helpline made free (2017).
– Employment and Support Allowance ‘work-related activity’ payment removed for new claimants (2017).
– Eligibility for the housing element of UC was removed for 18–21 year olds in 2017 but reinstated in 2018 following criticism by housing charities concerned that it would drive an increase in youth homelessness.
Part III of the Scotland Act 2016 devolved powers over some parts of the social security system to the Scottish Parliament, including the power to create new benefits, top up benefits in newly devolved areas, and administer benefits differently (e.g. splitting UC payments between individual members of a household).
Living standardsIs Britain Fairer?
64 www.equalityhumanrights.com/britain-fairer

1 in 2Pakistani, Bangladeshi and Black African children are living in poverty in Britain (2015/16).
In June 2017 the High Court ruled that the benefit cap unlawfully discriminated against lone parents with young children under the age of two (DA v SSWP [2017] EWHC 1446). The UK Government successfully appealed the ruling, and the Court of Appeal ruled in March 2018 that lone parents of children under the age of two were not substantially more disadvantaged than other lone parents generally (DA v SSWP [2018] EWCA Civ 504). An appeal against this decision was due to be heard by the Supreme Court in July 2018.
A challenge to the whole of the two-child benefit cap was dismissed by the High Court in April 2018, as the Court found that the policy did not breach equality or human rights legislation. However, the Court did find that the two-child benefit cap was unlawful in so far as it affected ‘kinship carers’, people who agree to look after a child relative to prevent them being taken into care (SC and others v SSWP [2018] EWHC 864). An appeal against this ruling has been ‘leapfrogged’ to the Supreme Court and it will be heard at the same time as DA v SSWP (see above).
In 2015, the High Court ruled that the benefit cap discriminated against those entitled to Carer’s Allowance who provide care to relatives such as a parent or grandparent, or a disabled child aged 18 or over (Hurley and others v Secretary of State for Work and Pensions).
Updated policy guidance for Personal Independence Payments (PIP) brought in during 2015 limited payments for planning activities or undertaking a journey to people with certain types of impairment. In MH v Secretary of State for Work and Pensions (PIP) the Upper Tribunal decided that ‘overwhelming psychological distress’ should be considered when making such payments. Statutory Instrument 2017/194 then reversed this decision with new PIP Regulations, with the effect that people who could not leave their home or undertake a journey alone for reasons of ‘overwhelming psychological distress’ (as opposed to other disabling conditions) often did not qualify for PIP at all. These new regulations were the subject of a judicial review challenge in R (RF) v SSWP. The High Court ruled that they were unlawfully discriminatory against people with mental health impairments and in breach of the Human Rights Act 1998 obligations.
The Socio-Economic Duty contained in Part 1 of the Equality Act 2010 was enacted by the Scottish Government in 2017 (also known as the Fairer Scotland Duty). The duty has not been enacted in England or Wales.
In June 2017, the High Court ruledthatthebenefitcapunlawfully discriminated against lone parents with young children under the age of two
Living standardsIs Britain Fairer?
65www.equalityhumanrights.com/britain-fairer

The Well-being of Future Generations (Wales) Act 2015 requires public bodies in Wales to consider the long-term impact of decisions and seek to prevent persistent problems such as poverty.
The Social Security (Scotland) Act 2018 includes a right to independent advocacy for individuals who require assistance due to an impairment, restrictions on private-sector involvement in medical assessments and a duty on the Scottish Government to consider the effects of inflation with disability and employment-injury assistance.
In 2016 the United Nations Committees on Economic, Social and Cultural Rights, on the Rights of Persons with Disabilities and on the Rights of the Child recommended that the UK and devolved governments ensure social security benefit levels are sufficient to meet the basic cost of living and set up clear accountability mechanisms to eradicate child poverty. They also urged the UK Government to ensure that its social security reforms meet international minimum standards of human rights for retrogressive measures, that is that they are temporary, necessary and proportionate, not discriminatory, and uphold the core minimum level of people’s rights. The UK Government should conduct comprehensive impact assessments of these changes to make sure that they do not discriminate against any individual or group. The use of sanctions for social security entitlements should also be reviewed, especially to make sure they are used proportionately, and independent dispute resolution mechanisms are available and accessible (UNCESCR, 2016; UNCRC, 2016; UNCRPD, 2017).
In response to increasing use of foodbanks across Britain, the Scottish and Welsh Governments have funded initiatives to address food poverty and the Scottish Government has also committed to explore how the right to food could be incorporated into domestic legislation.
4.2.3 Social care Impact of social care funding on the provision of services
Overall, budget settlements from the UK Government to all three nations have been reducing since 2010. The devolved and UK governments have managed these reductions differently and so the impact on funding for social care varies. In England, all local authorities have reduced their spending on social care to some degree. The UK Government has allocated additional funding to local authorities for adult social care in recent budgets through the adult social care precept, the Better Care Fund and a commitment to fund an Adult Social Care Support Grant. This additional funding is in the context of continuing substantial cuts to overall allocations from central government. The Association of Directors of Adult Social Services, the House of Commons Communities and Local Government Committee, the Local Government Association and the King’s Fund have all welcomed additional funding but criticised it for not being enough to address the funding crisis in adult social care (Association of Directors of Adult Social Services, 2017; Communities and Local Government Committee, 2017; Local Government Association, 2018b; The King’s Fund, 2017).
Living standardsIs Britain Fairer?
66 www.equalityhumanrights.com/britain-fairer

The Welsh Government has prioritised social care in budget allocations to local authorities since 2010, most recently through a local government settlement to maintain its assumed share of core spending at 2017/18 levels until 2020. The Supporting People Programme, which helps people to live independently, has been retained for a further two years as part of the budget for 2018/19. A £60 million Integrated Care fund has also been introduced, which aims to support people to maintain their independence and remain in their own home. However, there has been a real-terms reduction in budgets for social care services of over 12% due to increasing need for services (Luchinskaya et al., 2017).
The Scottish Government has also allocated additional funding to social care in recent budgets, including a transfer of funding from NHS Boards to Health and Social Care Partnerships. It has continued to invest in changing the social care system following the Social Care (Self-directed Support) Scotland Act which came into force in 2014. As in England and Wales, this additional funding is in the context of increasing demand for services and reduced allocations from central government.
In England, cost pressures on social care providers have led to an increasing number of care providers handing back contracts to local authorities and may deter new agencies entering the market (Communities and Local Government Committee, 2017). In 2017 the Welsh Government announced additional funding to help local authorities manage the impact of the National Living Wage. There are ongoing legal cases to decide on payment rates for ‘sleep-in’ shifts, which could affect social care providers in England and Wales.
In Scotland, local authorities face significant challenges to funding social care services as a result of the reduction in overall council spending, demographic changes and the cost of implementing new legislation and policies. Many councils have taken a piecemeal approach to implementing change, severely restricting the potential impact of any positive policy decisions (Accounts Commission, 2016).
Quality of social care
In 2017 the Department of Health and Social Care launched the Quality Matters initiative, a consortium of organisations in the adult social care and voluntary sectors working together to improve the quality of adult social care in England.
In 2016 the Department for Education published its reform programme for children’s social care services in England over the following five years. The Children and Social Work Act 2017 introduced ‘corporate parenting principles’ for local authorities which promote the rights of looked-after children.
The Scottish Government has allocated additional funding to social care in recent budgets
Living standardsIs Britain Fairer?
67www.equalityhumanrights.com/britain-fairer

In Wales a national outcomes framework for social services was launched in 2016, to report on progress against measures in the Social Services and Well-being (Wales) Act 2014. A new system of social care service regulation and inspection will come into force from April 2018, resulting from the Regulation and Inspection of Social Care (Wales) Act 2016.
The Scottish Government introduced a Health and Social Care Delivery Plan in 2016 to achieve an integrated health and social care system. It published a National Health and Social Care Workforce Plan in 2017 to address concerns about recruitment and retention of specialised social care staff which had been found to impact negatively on the quality of services.
Choice and control over support to enable independent living and independent advocacy
Deprivation of Liberty Safeguards (DoLS) are needed if restrictions and restraint used on a person will deprive that person of their liberty, and misuse of the safeguards could have a negative impact on a person’s ability to exercise control on their own care. They are applicable in England and Wales under the Mental Capacity Act 2005 and under the Adults with Incapacity (Scotland) Act 2000 in Scotland (where they are known as guardianship orders). There are ongoing calls across Britain to review and reform the legislation, following a 2014 Supreme Court ruling which widened the definition of a deprivation of liberty and led to a considerable increase in the number of applications made by hospitals and care homes. The legislation is currently being considered in an inquiry by the Joint Committee on Human Rights (JCHR, 2018) for England and Wales, and an ongoing consultation from the Scottish Government.
The United Nations Committee on the Rights of Persons with Disabilities expressed in 2017 concern about ‘policies and measures that affect the ability to live independently in the community, such as the reduction in social protection schemes related to housing, household income and budgets for independent living, as well as the closure of the Independent Living Fund’ in England (UNCRPD, 2017).
Impact of caring on carers
The Carers (Scotland) Act 2016 came into force in April 2018, including measures designed to support carers’ health and wellbeing.
Abuse and neglect
The statutory Independent Inquiry into Child Sexual Abuse in England and Wales opened in July 2015 in response to serious concerns that some organisations had failed and were continuing to fail to protect children from sexual abuse. The inquiry is due to report its interim findings at the end of 2018.
The Scottish Child Abuse Inquiry was set up in October 2015, focusing on the abuse of children in care. The inquiry will report to Scottish Ministers within four years. See also, ‘Sexual and domestic violence and abuse’ in Chapter 5.
The Department for Education is consulting on significant changes to its guidance on safeguarding children.
The United Nations Committee on the Rights of Persons with Disabilities expressed in 2017 concern about ‘policies and measuresthataffecttheability to live independently in the community…’
Living standardsIs Britain Fairer?
68 www.equalityhumanrights.com/britain-fairer

4.3 Housing
4.3.1 Overcrowding and suitable accommodation In England in 2015/16, 3.0% of households were living in overcrowded accommodation that failed to meet the bedroom standard (Table LST.HSG.1A). Based on the household reference person (HRP), this was highest for those aged 35–44 (5.8%). One in 10 (10.5%) ethnic minority households experienced overcrowding compared with one in 50 (2.0%) White households. Women HRPs were also more likely to experience overcrowding (3.7% compared with 2.5% of men) and for women from ethnic minorities, the percentage was higher than any other combination of sex and ethnicity at 13.2%. For disabled HRPs or those with long-term illnesses, 3.4% lived in overcrowded accommodation compared with 2.8% of non-disabled HRPs.
In Scotland, 3% of households were living in overcrowded accommodation in 2016, a proportion which has not changed since 2009 (Scottish Government, 2017b). Data on overcrowding are not available for Wales.
1 in 10 ethnic minority households in England experienced housing overcrowding (2015/16).
In England in 2015/16, 90.3% of adults lived in households that were satisfied with their house or flat, a slight increase of 1.1 percentage points from 2013/14 (Table LST.HSG.2). Satisfaction increased with age of HRP, ranging from 83.3% for those aged 16–24 to 96.3% for those aged 75 and over. Satisfaction was higher for White households (91.3%) than for Pakistani or Bangladeshi households (84.3%), Black households (77.8%), or those of Other ethnic minority households (82.5%), but the proportion of ethnic minority households reporting satisfaction increased by 3 percentage points between 2013/14 and 2015/16.
Satisfaction also increased with age in Scotland, with 98.4% of 65–74 year olds and 96.0% of over 75 year olds living in households reporting satisfaction. In Wales, 96% to 97% of those aged over 55 reported satisfaction. In Wales, 96% to 97% of those aged over 55 reported satisfaction. In Wales, reported satisfaction with accommodation was lower for disabled people (90.6%) than for non-disabled people (95.1%).
Whereas 1 in 50 White households in England experienced overcrowding (2015/16).
Living standardsIs Britain Fairer?
69www.equalityhumanrights.com/britain-fairer
4.3.2 HomelessnessBritain-wide literature reviews found that being at risk of homelessness is associated with being at risk and with other disadvantages. Although the causes vary, people at particular risk of homelessness include lone parents, young care leavers, young offenders, ethnic minorities (Watts et al., 2015), LGBT young people (Watts et al., 2015; Albert Kennedy Trust, 2015; Homeless Link, 2018), those with mental health conditions, women at risk of domestic abuse and ex-service personnel (Just Fair, 2015).
Living in material deprivation or in a deprived neighbourhood also increases risk of homelessness (Watts et al., 2015) and experiencing poverty in childhood increases an individual’s likelihood of being homeless as an adult (Fitzpatrick and Bramley, 2017).
Official counts of people sleeping rough in England on a single night ‘snapshot’ show that numbers have risen each year since 2010, from 1,768 to 4,751 in 2017 (MHCLG, 2011; 2018a).35, 36 Changes to the Housing (Wales) Act 2014 mean it is not possible to compare Welsh evidence over recent years. However, estimates from a single night ‘snapshot’ indicate that numbers may have increased, from 240 people in 2015 to 345 people in 2018 (Welsh Government, 2017a; 2018a). No official data on rough sleepers are collected in Scotland although in 2016/17, 8% of homeless people applying for assistance reported a household member sleeping rough at least once during the last three months prior to application, and 4% slept rough the night before (Scottish Government, 2017a).
The number of households recorded as homeless by local authorities in England has fluctuated: 56,500 in 2015, 59,260 in 2016 and 57,890 in 2017, an overall increase of 2.5% (MHCLG, 2018b).37 The number of households in temporary accommodation increased 14% between 2015 and 2017, to 78,930 (MHCLG, 2018c).38 Most households (66%) accepted as statutorily homeless in England in 2017 had dependent children (MHCLG, 2017b).
In Scotland, the number of homelessness applications to local authorities decreased from a peak of 57,672 in 2008/09 to 34,570 in 2016/17. This reduction is likely to be caused by Housing Options and homelessness prevention strategies adopted by local authorities, rather than by changes in the underlying drivers of homelessness (Scottish Government, 2017a).39
35 For the purposes of data collection, rough sleepers are defined by the Ministry of Housing, Communities and Local Government as: people sleeping, about to bed down (sitting on/in or standing next to their bedding) or actually bedded down in the open air (such as on the streets, in tents, doorways, parks, bus shelters or encampments); people in buildings or other places not designed for habitation (such as stairwells, barns, sheds, car parks, cars, derelict boats, stations, or ‘bashes’ which are makeshift shelters, often comprised of cardboard boxes).
36 The UK Statistics Authority has declared that the data do not meet the standard of National Statistics, a subset of official statistics which have been certified by the UK Statistics Authority as compliant with its Code of Practice for Official Statistics.
37 A household is considered homeless if the local authority deems that they do not have a legal right to occupy accommodation that is accessible, physically available and which it would be reasonable for the household to continue to live in.
38 On 31 December in the relevant year.39 Housing Options is a person-centred and preventative
approach to address homelessness.
Living standardsIs Britain Fairer?
70 www.equalityhumanrights.com/britain-fairer

Between March 2016 and March 2017, the number of people placed in temporary accommodation in Scotland increased from 10,543 households to 10,873 households, and the number of children in temporary accommodation increased by 16% (Scottish Government, 2017a).
Prior to the Homelessness Reduction Act 2017, certain homeless people in England and Wales were considered to be in ‘priority need’ and so had a statutory entitlement to be rehoused by their local authority. This included pregnant women and single parents (most of whom are women). A higher proportion of women were therefore recorded as homeless in Wales: two-thirds of 16–24 year olds accepted as homeless by local authorities in 2014/15 were women (Welsh Government, 2017b).
Similarly, in England, 47% of all households accepted as statutorily homeless in 2014/15 were lone parent households headed by women, and a further 10% were single women (Watts et al., 2015). These proportions (47% and 10%) remained the same in 2017 (MHCLG, 2018d).
In Scotland, women aged 34 and under, households with children, lone parents (most of whom are women) and people with at least one support need such as a mental health condition, physical disability or a learning disability were particularly at risk of homelessness (Scottish Government, 2017a).
People from ethnic minorities are at higher risk of homelessness in England. Between 2006/07 and 2016/17, people from ethnic minorities accounted for 28.4% of all homeless households in England (Cabinet Office, 2017) compared with 14% of the population of England and Wales from an ethnic minority background (ONS, 2012). Of homeless households in 2016/17, 16% were Black, 9% were Asian, 3% were from a Mixed ethnic background, and 5% were from an Other ethnic minority group (Cabinet Office, 2017).
An evaluation of the Housing (Wales) Act 2014 suggested that homelessness is being prevented for a larger number of people than under the previous policy. However, the impact on people with different protected characteristics or who are at risk (particularly those with mental health conditions) has been variable, largely due to differences in service provision. Single men, care leavers, ex-offenders and those experiencing multiple issues were most likely to have unmet housing needs (Welsh Government, 2017c).
Shelter estimates that around 128,000 children in Britain were homeless in 2017, the highest figure in a decade.40 Of these, one in 11 lived in ‘emergency accommodation’ provided by their local authority, for example a bed and breakfast or hostel where they shared a kitchen and bathroom with other families (Shelter, 2017b). In England, the number of families with children who were in emergency accommodation for more than the legal six-week limit increased from 910 in 2015 to 1,260 in 2016, and then decreased to 880 in 2017 (MHCLG, 2018e).41 The National Audit Office (2017a) attributes the 2015/16 increase to councils saving money by housing people in more affordable areas; it is not clear whether the recent reduction is due to a change in local authority practice.
40 Shelter’s estimate is based on data from the Ministry of Housing, Communities and Local Government and Scottish Government on the number of children in temporary accommodation, and Shelter’s own estimate of the number of children in temporary accommodation in Wales.
41 On 31 December in the relevant year.
Living standardsIs Britain Fairer?
71www.equalityhumanrights.com/britain-fairer

The evidence presented here does not capture ‘hidden’ homelessness or the number of people affected in a homeless household. Based on official data, Shelter estimates that more than 307,000 people in Britain were recorded as homeless in 2017, an increase of 4% on their estimate for the previous year. In addition to this, an unknown number were homeless but not recorded by authorities (Shelter, 2017a).
4.3.3 Housing benefits Multiple factors have been identified as contributing to the increase in homelessness, including welfare reforms (particularly reductions in entitlement to Housing Benefit and Local Housing Allowance); a shortfall between housing benefit and the cost of private renting; a lack of affordable housing available; and reduced investment by local authorities in homelessness services (Wilson, 2017; Shelter, 2017c; Barton et al., 2016; Communities and Local Government Committee, 2016).
Local Housing Allowance (LHA) has not kept pace with rent increases since 2012, meaning the allowance is not always sufficient to cover rent in the cheapest 30% of the market as intended. In some parts of the UK, people receiving LHA can only afford to rent in the cheapest 5%–10% of the market (Chartered Institute of Housing, 2016). This situation is likely to be worsening as LHA was frozen at 2015/16 rates from April 2016. The Communities and Local Government Committee (2016) recommended that LHA levels should more closely reflect market rents.
An evaluation of the under-occupancy charge found that disabled people experienced particular difficulty in downsizing due to a shortage of accessible or adaptable housing available (Cambridge Centre for Housing and Planning Research and Ipsos MORI, 2015). Estimates suggest that 47% of housing benefit claimants affected by the under-occupancy charge in 2015 had a disability (EHRC, 2017a).
4.3.4 Housing tenureIn England, the proportion of households privately renting continues to increase steadily, following a trend over the last twenty years (Barton, 2017). Private renters spend 34% of household income on rent compared with 28% for social renters. Housing quality is poorer in the private rental sector: 27% of residences did not meet basic standards of health, safety and habitability in 2017 compared with 13% of residences in the social rented sector (figures have changed little in the period covered) (MHCLG, 2018f).
White British households in England are less likely to rent in either the private or the social sector than any other ethnic group. This is consistent across all age groups, regions and socio-economic groups. Renting privately was particularly high among some ethnic minorities: in 2014/16, 55% of Other White, 53% of Chinese and 48% of Arab households compared with 16% of White British households (Cabinet Office, 2017).
Similarly, social renting was particularly high among some ethnic minorities: in 2014–16, 48% of African, 45% of Caribbean and Other Black and 42% of Bangladeshi households in England rented from a local authority or housing association compared with 16% of White British households. Pakistani, Chinese and Indian households were less likely to rent in the social sector, at 11%, 9% and 7% respectively (Cabinet Office, 2017).42
Housing quality is poorer in the private rental sector: 27% of residences did not meet basic standards of health, safety and habitability in 2017
Living standardsIs Britain Fairer?
72 www.equalityhumanrights.com/britain-fairer

The social housing sector provides accommodation for more at-risk groups than other sectors, due to the way housing is allocated.43 In 2015/16, half of households in the social rented sector in England had at least one member with a long-term illness or disability, higher than in private rented households (23%) and owner-occupied households (29%) (MHCLG, 2017c). Changes to the social renting sector, such as the under-occupancy charge, can therefore have a disproportionate impact on these groups.
Analysis of home ownership rates across Britain from 1961 to 2017 shows that people aged 30 or below in 2017 were half as likely to own their home compared with those born between 1946 and 1965 at the same age (Resolution Foundation, 2018).
In Scotland in 2016, households in private rented accommodation were more likely to have a highest income householder aged 16–34 (53%) than other tenures. Nearly three-quarters (72%) of owned outright households had a highest-income householder over the age of 60. Social rented properties had a higher proportion of adults permanently sick or disabled (13%) compared with private rented households or owner occupier households. Between 2013 and 2016, White Scottish (66%) and Other White British (70%) people were more likely to own their home compared with people from ethnic minorities, who were more likely to rent from a private or social landlord (Scottish Government, 2018a).
Official estimates in Wales show very little change in tenure type in recent years (Stats Wales, 2017a). Data from 2012/13 to 2014/15 show that younger adults and people aged 85 and over are more likely to live in social housing (Hackett and Cameron, 2017). In 2016, 21% of social housing was non-compliant with the Welsh Housing Quality Standard, a reduction from 28% in the previous year (Stats Wales, 2017b).
4.3.5 Housing for Gypsies and Travellers In July 2017 there were 22,792 Traveller caravans in England, an increase of 8.2% from July 2015.44 Of these, 1,524 were on unauthorised encampments on land not owned by Travellers, an increase of 26.9% (MHCLG, 2018g). Civil society organisations have linked this increase to the accommodation policy changes described earlier (Friends, Families and Travellers, 2017; Perraudin, 2018).
In Wales, there were 976 Traveller caravans in July 2017, a decrease of 5.2% from July 2015. The proportion of caravans on authorised sites increased from 80% in July 2015 to 87% in July 2017 (Welsh Government, 2015; 2016; 2017d).
A similar caravan count is not conducted in Scotland. In 2014/15, on average, 57.1% of Gypsy/Travellers were satisfied with their Registered Social Landlord’s management of their site, down from 70% in 2013/14. In contrast, 80.8% were satisfied with local authorities’ management of the site in 2014/15, up from 71.8% in in 2013/14 (Scottish Housing Regulator, 2016).
42 Analysis by the Cabinet Office is based on combined data from the English Housing Survey 2014/15 and 2015/16.
43 The term ‘vulnerable’ is used in the source material.44 Annual counts are taken in July and January and
have different patterns associated with seasonal variation. The January count tends reflect lower levels of movement during the winter months.
Living standardsIs Britain Fairer?
73www.equalityhumanrights.com/britain-fairer

4.3.6 Accessible housing for disabled people Our 2018 inquiry found that disabled people across Britain are demoralised and frustrated by the housing system, reporting a severe shortage of accessible houses across all tenures. Disabled people can experience serious deterioration in their mental wellbeing due to living in unsuitable accommodation. There is a chronic shortage of accessible homes, as local authorities are not building enough to meet increasing demand. Installing home adaptations involves unacceptable bureaucracy and delay and disabled people are often left waiting for long periods of time, even for minor adaptations. Disabled people are also not getting the support that they need to live independently as the provision of advice, support and advocacy is patchy and people report that they have nowhere to turn when their housing is unsuitable (EHRC, 2018).
4.3.7 Housing for refugees and asylum seekersThe Home Affairs Committee reported that accommodation for asylum seekers is often of a poor standard and does not meet the specific needs of disabled people; pregnant women; families; victims of trafficking, rape or torture; or people with mental health conditions. There are also reports of bullying and threatening behaviour by staff. People can be moved to new accommodation with little notice, ending established relationships with support services (Home Affairs Committee, 2017). The UK Government disagreed with the findings but expressed a commitment to develop performance standards to improve the welfare of asylum seekers in accommodation (UK Government, 2017).
Newly recognised refugees are at high risk of homelessness as accommodation is withdrawn after a 28 day ‘move on’ period following granting of their status. However, barriers to the private rental market (such as lack of income or savings for a deposit) and low likelihood of being considered for social housing can leave many people homeless for some time (All Party Parliamentary Group on Refugees, 2017).
4.4 Poverty
4.4.1 Relative poverty and severe material deprivation Our analysis shows that in 2015/16, a fifth (19.8%) of adults in Britain were living in relative poverty (Table LST.PVT.1A).45 There has been little change since 2010/11 in the overall figures although there are differences among people with different protected characteristics. However, the proportion of adults reporting that they are experiencing severe material deprivation decreased by 3.1 percentage points to 17.6% of adults (Table LST.PVT.2). This indicates that people’s ability to afford certain items up to the start of 2016 had not been detrimentally affected by increases in poverty, but there is a risk that this may have changed subsequently.
45 The proportion of adults living in households below 60% of the contemporary median income after housing costs (also known as relative poverty). In 2015/16, 60% of the contemporary median income after housing costs was £248 per week. See Table 2b, https://www.gov.uk/government/statistics/households-below-average-income-199495-to-201516.
Living standardsIs Britain Fairer?
74 www.equalityhumanrights.com/britain-fairer

In 2010/11 the percentage of adults living in poverty was higher in England (19.6%) than in Scotland (16.5%), although poverty rates in Scotland have since increased to 18.6% in 2015/16 while England remained at 19.6%. A similar decrease in severe material deprivation was seen in Scotland and England in the same period: a drop of 3.8 percentage points in Scotland and 3.0 percentage points in England.46 This brings the proportion experiencing material deprivation to 14.1%.
There was a significantly higher percentage of adults living in poverty in Wales (25.3%) in 2015/16 than in either England or Scotland and this had increased by 4.7 percentage points compared with 2010/11. Wales had significantly higher severe material deprivation (21.1%) in 2015/16 than England (a difference of 3.4 percentage points) or Scotland (a difference of 7.0 percentage points) but had also experienced a decrease of 4.9 percentage points over the period since 2010/11.
Across Britain, women (20.4%) were slightly more likely to live in poverty than men (19.1%). Women were also more likely than men to experience severe material deprivation, at 19.8% for women compared with 15.3% for men in 2015/16.
In 2015/16 Pakistani (44.3%), Bangladeshi (48.4%) and Black African (44.9%) adults were over twice as likely as White British people (17.2%) to live in poverty. Around a third of Mixed ethnicity (31.8%) and Chinese adults (31.5%) also lived in poverty. Over the period 2010/11 to 2015/16 the percentage of people living in poverty decreased among people from Indian and Bangladeshi backgrounds (a reduction of 7.4 percentage points and 15.3 percentage points respectively).
In 2015/16, high proportions of Bangladeshi (27.6%), Pakistani (28.5%), Black Caribbean (36.8%) and Black African (38.5%) adults experienced severe material deprivation compared with 1 in 6 White British (16.7%) people. Women from Black Caribbean (41.2%) and Black African (45.7%) backgrounds were substantially more likely to experience severe material deprivation. There was a decrease in the proportion of Bangladeshi (21.4 percentage point reduction) and Black African (11 percentage point reduction) people experiencing deprivation from 2013/14 to 2015/16.
In 2015/16, people aged 16–24 (27.2%) were most likely to live in poverty and those aged 56–74 (13.6%) least likely. Between 2010/11 and 2015/16 the percentage of people living in poverty decreased for those aged 16–24 (by 2.8 percentage points) but increased (by 3.0 percentage points) for people aged 55–64 years and those aged 75 and over (by 2.6 percentage points).
4.4.2 Social security and the benefit systemOur analysis of changes to taxes, benefits, tax credits and Universal Credit since 2010 found that by the 2021/22 tax year, the largest impacts will be felt by those with lower incomes and that the changes will have a disproportionately negative impact on several protected groups. Negative impacts are particularly large for households with more disabled members, and more severely disabled individuals, as well as for lone parents on low incomes. For households with at least one disabled adult and a disabled child, average annual cash losses are just over £6,500 – over 13% of average net income (Portes and Reed, 2018).
46 Severe material deprivation is measured in the Family Resources Survey by the percentage of respondents identifying that they cannot afford four out of nine listed items considered to be essential.
Living standardsIs Britain Fairer?
75www.equalityhumanrights.com/britain-fairer

Women lose about £400 per year on average, and men £30, although these figures conceal very substantial variation within sexes. Bangladeshi households lose around £4,400 per year on average. Around one and a half million more children are forecast to be living in households below the relative poverty line as a result of the reforms (Portes and Reed, 2018).
Analysis of UK data from 2009/10 to 2015/16 found that Bangladeshi, Black, Mixed, Pakistani and Other ethnic minority families were the most likely to receive income-related benefits and tax credits.47 Chinese families were the least likely to receive either of these types of support (Cabinet Office, 2017). These differences can be related to other characteristics, for example the low employment rate among Asian women (Cribb et al., 2017).
Analyses of Department for Work and Pensions data show that some groups of claimants are more likely to be sanctioned than others. In 2014, the sanctioning rate for self-declared disabled Job Seeker’s Allowance (JSA) claimants was 26%–28% higher than for non-disabled claimants (Baumberg Geiger, 2017).48 Younger people, men and ethnic minorities (particularly Black or Mixed ethnicity) are at substantially higher risk of being sanctioned (de Vries et al., 2017). Young people living independently (including care leavers) are a third more likely to be sanctioned compared with other young claimants (Social Security Advisory Committee, 2018).49
Several studies indicate that sanctions may not have been effective at encouraging people into work. Research showed as more disabled people were sanctioned, there was a corresponding increase in the number of disabled people not in work (Reeves, 2017). Employment and Support Allowance (ESA) claimants who were sanctioned were less likely to gain employment in later months, whereas for JSA claimants the likelihood of gaining employment increased (National Audit Office, 2016a).50 The UK Government’s policy to intensify the use of sanctions and introduce harsher penalties has been largely ineffective at moving people from JSA into sustainable employment (Taulbut et al., 2018). Benefit sanctions had no tangible positive effects in moving disabled people closer to paid work and worsened many disabled people’s illnesses and impairments, particularly mental health conditions (Dwyer et al., 2018).
47 A family unit is a single adult or a married or cohabiting couple (including same-sex partners), plus any dependent children.
48 People who apply for Employment and Support Allowance because their ability to work is limited by the effects of ill health or disability must undergo a functionality assessment in order to qualify for the benefit. If they do not qualify for ESA, they may apply for Job Seeker’s Allowance and self-declare a disability or ill health.
49 Young people (aged 16–24) who do not live with parents or other relatives or guardians.
50 Employment and Support Allowance is a benefit for people who cannot work because of an illness or disability.
Living standardsIs Britain Fairer?
76 www.equalityhumanrights.com/britain-fairer

4.4.3 Experiences of at-risk groups: child poverty and poverty of disabled people, refugees and asylum seekersChild poverty
Our analysis found that in 2015/16, 29.8% of children were living in households in poverty. This is a higher proportion than that of adults overall (19.8%). The child poverty rate increased by 2.4 percentage points from 2010/11, but most of the change occurred between 2013/14 and 2015/16 (an increase of 2.0 percentage points). The proportion of children living in poverty in 2015/16 was lower in Scotland (26.0%) than in both England (29.9%) and Wales (34.1%).
While a quarter (25.2%) of children in White British households were living in poverty, this was much more common for children in most ethnic minority households, including: Bangladeshi (57.0%), Black African (55.1%), Pakistani (52.8%) and Other ethnicity (51.1%).
Between 2013/14 and 2015/16, the percentage of children living in poverty increased by 7.2 percentage points for children living with people who were separated, divorced, widowed or previously in a civil partnership, groups that are likely to contain lone parents.
The Child Poverty Action Group calculated that the combined impact of rising costs, inflation and welfare reforms is widening the gap between the income of families with children and what they need to cover the basic costs of living (Hirsch, 2017).
Average annual loss due to change since 2010 to taxes, benefits, tax credits and Universal Credit in Britain. Projection to the 2021/22 tax year.
Households with at least one disabled adult and disabled child
-£6,500
Bangladeshi households -£4,400
Women -£400
Men -£30
Lone parents in the bottom fifthofthehouseholdincomedistribution lose around 25% of their net income on average in Britain
Living standardsIs Britain Fairer?
77www.equalityhumanrights.com/britain-fairer

Disabled people
In 2015/16 disabled adults (25.5%) were more likely than non-disabled adults (17.9%) to be living in poverty. Those with mental health conditions (35.6%) and social and behavioural (37.6%) impairments were around twice as likely to be living in poverty as non-disabled adults. For people with mental health conditions, this reduced by 5.7 percentage points between 2013/14 and 2015/16.
The proportion of disabled people living in poverty was greater in Wales (32.1%) than England (25.1%) or Scotland (24.3%).
Disabled people (36.8%) were nearly three times as likely to experience severe material deprivation as non-disabled people (13.5%), but around half of people with impairments related to memory (51.0%), mental health conditions (48.4%), learning, understanding or concentration (47.8%), or social and behavioural impairments (47.4%) experienced severe material deprivation.
There was a decrease in the number of disabled people experiencing severe material deprivation between 2013/14 and 2015/16 (a reduction of 8.8 percentage points). There were large decreases for people with mobility (10.3 percentage points), memory (12.3 percentage points) and mental health impairments (13.5 percentage points) between 2013/14 and 2015/16.
Disabled people are estimated to have extra living costs of £570 per month on average to cover expenses related to their impairment or condition, with one in five facing costs of more than £1,000 per month (Scope, 2018).
Refugees and asylum seekers
Asylum support is set at £37.75 per person per week, meaning that single asylum seekers live 74% below the relative poverty line (Asylum Matters et al., 2018).51 There is concern that that the level of support available is contributing to increased destitution among asylum seekers (British Red Cross, 2017).
Those recently granted refugee status have a short ‘move on period’ of 28 days before financial support is removed, which can leave them at risk of falling into destitution, poverty and homelessness. The UK Government is currently reviewing this time period (All Party Parliamentary Group on Refugees, 2017).
51 Calculation based on 2016/17 DWP data on Households Below Average Income, where the relative poverty threshold for a single adult after housing costs is £147.90 per week.
Disabled people (36.8%) were nearly three times as likely to experience severe material deprivation as non-disabled people (13.5%)
Living standardsIs Britain Fairer?
78 www.equalityhumanrights.com/britain-fairer

4.4.4 Food and fuel povertyFood poverty
In 2017/18, the Trussell Trust’s network of 428 food banks across Britain provided three-day emergency food supplies to 1,300,519 people in crisis, an increase of 46% from 2015/16. Of these, 470,737 went to households with children (Trussell Trust, 2018). There are estimated to be many more food banks in addition to this network (Church Urban Fund, 2016).
A survey of Trussell Trust food bank users found that certain groups may be more affected than others by food poverty.52 Single male households were the most common household type (38%) followed by female lone parents with children (13%). Households with a disabled person (49%) and asylum seekers (3.7%) were over-represented compared with these groups in the general population. One-third of food bank clients were awaiting a benefit payment (Loopstra and Lalor, 2017).
Fuel poverty
A research review found evidence from the UK, England and Wales published between 2012 and 2015 indicating that certain groups are at greater risk of experiencing fuel poverty and living in a cold home: older people, children living in single parent households, low income households, households in rural areas, households headed by an ethnic minority parent and households headed by a parent with a long-term health condition, disabled people, people with mental health conditions or people living with long-term health conditions (Bridgeman et al., 2016).
Approximately 2.5 million households in England were in fuel poverty in 2015 (11%, a figure which has changed little since 2003).53 The average ‘fuel poverty gap’ (the amount needed to meet the fuel poverty threshold) decreased in real terms by 5.6%, continuing a trend since 2013 (Department for Business, Energy and Industrial Strategy, 2017). In 2015, 16% of households from ethnic minorities (other than White ethnic minorities) were living in fuel poverty compared with 10% of White households. These figures have not changed between 2003 and 2015 (Cabinet Office, 2017).
In Scotland the proportion of households living in fuel poverty decreased from 30.7% (748,000) in 2015 to 26.5% (649,000) in 2016.54 This was partly due to a reduction in the price of domestic fuels (Scottish Government, 2017b).
In Wales in 2016 it was estimated that 23% of all Welsh households were fuel poor, a reduction from an estimated 30% in 2014. This was attributed to a combination of rising household incomes, lower household energy consumption due to energy efficiency improvements, and decreasing gas and oil prices (Beaumont et al., 2016).55
52 Random sample survey of 413 people across 18 food banks in The Trussell Trust Foodbank Network.
53 In England, a household is considered to be fuel poor if they have required fuel costs that are above average (the national median level) and, were they to spend that amount, they would be left with a residual income below the official poverty line.
54 In Scotland, a household is considered to be fuel poor if it is required to spend more than 10% of its income in order to maintain a satisfactory heating regime.
55 In Wales, a household is considered fuel poor if it needs to spend more than 10% of its income on fuel to maintain a satisfactory heating regime.
Living standardsIs Britain Fairer?
79www.equalityhumanrights.com/britain-fairer

Proportion of respondents to a survey on use of Trussell Trust foodbanks in Britain (2017/18)
Households with a disabled person 49%
Single men households 38%People seeking asylum 3.7%
46%increase in use of Trussell Trust foodbanks in last two years in Britain (2017/18)
4.4.5 Wealth and income distributionIn 2014–16 the wealth held by the top 10% wealthiest households in Britain was around five times greater than that of the bottom half of all households combined. This has not changed since 2012–14 and has changed little since data were first collected in 2006–8 (ONS, 2018).
Wealth distribution varies significantly: in 2012–14, almost a quarter (22%) of households in the South East of England were in the wealthiest 10% of British households, compared with only 7% of households in Scotland and 4% in Wales. Women are less likely to have savings by their late 30s than men; have a smaller pension pot at retirement age; and are less likely to have equal access to family savings within the household and when relationships end. Ethnic minorities are less likely to have housing wealth compared with White British people (Roberts and Lawrence, 2017).
4.5 Social care
4.5.1 Access to social care In England, 15.1 adults per 1,000 were receiving long-term home care, residential care or nursing care as of 31 March 2016 (Table LST.SCR.2). This increased to 41.7 per 1,000 among those aged over 65. More women (17.7 per 1,000) received care than men (12.5 per 1,000).
Living standardsIs Britain Fairer?
80 www.equalityhumanrights.com/britain-fairer

In Scotland, 28.7 adults per 1,000 were receiving social care either in the community or in a care home as of 31 March 2016. This was much higher for those aged 75–84 (111.0) and higher still for those over 85 (392.1). The rate for people aged over 85 also increased substantially (by 21.7 percentage points) between 2010 and 2016. More women received care than men, as did White people (22.6) compared with ethnic minorities (10.0).
In Wales, 29.2 adults per thousand were receiving care and support provided by Welsh local authorities56 as of 31 March 2016, higher for those aged over 65 (80.6 per 1,000). However, within this older age group the rate per 1,000 declined by 26.5 percentage points between 2009/10 and 2015/16.
4.5.2 Impact of social care funding on the provision of services An increasing older-age population across Britain is leading to rising need for social care services, in the context of reduced funding as described in the policy developments section earlier. Parliamentary inquiries have concluded that many councils in England have reduced the care available to the minimum required and so are potentially unable to comply with their duties to promote wellbeing and provide care in accordance with need (Health Committee, 2016; Communities and Local Government Committee, 2017).
In Scotland in 2017/18, nearly 7 in 8 (86.9%) people who received formal social care reported that they were treated with compassion and understanding. This was a slight decline since 2013/14.
Funding reductions to local authorities since 2010 have also had a negative impact on the provision of social care for children, especially in the poorest parts of the UK where children are 10 times more likely to be placed under a child protection plan or be subject to care proceedings (Association of Directors of Children’s Services, 2017).
Progress on the integration of health and social care in England is very limited, so far not delivering the expected benefits for patients, the NHS or local authorities (National Audit Office, 2017b). In Wales, there are good examples of joint working but overall progress towards integrated health and social care provision is insufficient (Hussey et al., 2017 and 2018). In Scotland, policies in this area are still being developed so it is difficult to fully assess progress towards integration.
56 Either through a Care and Support Plan or a Support Plan for Carers.
Living standardsIs Britain Fairer?
81www.equalityhumanrights.com/britain-fairer

3 in 5 carers in the UK had long-term health conditions (2016)
In England, there are concerns that high staff turnover and vacancy rates among providers is having a negative impact on the quality of services (National Audit Office, 2018). Some providers no longer take local authority clients, which risks creating a ‘two-tier system’ between those who can and cannot fund their own care (Health Committee, 2016).
4.5.3 Quality of social care The Care Quality Commission’s (CQC) annual inspections of adult social care services in England over 2015–17 report an increased proportion of services rated good or outstanding and a decreased proportion rated as inadequate or requiring improvement. However, they express concern about substantial variations in the quality of care across services and sectors (CQC, 2015; 2016; 2017). Ofsted’s annual inspection reports of children’s social care provision in England show that, over 2015–2017, both the percentage of local authorities rated as good and those rated as inadequate increased, while the percentage requiring improvement fluctuated. The number of local authorities rated as inadequate ‘should be of ongoing concern’ (Ofsted, 2016, p.14).
Respondents to a 2018 survey of social care service users in England reported not getting the quality of care they needed, with impacts including deteriorating health, not being fed, not being able to do basic things like washing or going to the toilet, and not being able to leave the house (Care and Support Alliance, 2018).57
57 An online survey was conducted by the Care and Support Alliance from 24 January 2018 to 9 March 2018 and was completed by 3,915 self-selecting people who identified as having experience of adult social care in England.
Living standardsIs Britain Fairer?
82 www.equalityhumanrights.com/britain-fairer
3/53 in 5 social care service users said they were treated with dignity and respect in England (2016/17), an increase since 2010/11. Older people (over 75) and some groups of disabled people were less likely to report this (2016/17)
The quality of help and protection for children across England has been found to be unsatisfactory and inconsistent, indicating problems with the overall system rather than at a local level (National Audit Office, 2016b). In Wales, the number of complaints about services has increased but reporting mechanisms make it difficult to assess change in the overall quality of care provided (Care Inspectorate Wales, 2017a).
In 2017/18, 80% of those who received formal help and support in Scotland rated the overall help, care or support services as excellent or good; this was a decrease from 83% in 2013/14. There was a continued decrease in the number of people who said that they had a say in how their help, care or support was provided from 83% in 2013/14 to 76% in 2017/18 (Scottish Government, 2018b).
4.5.4 Choice and control over support to enable independent living, and independent advocacyThere is a high level of inconsistency in decisions about eligibility for NHS funded care in England and Wales, resulting in some people who should be eligible having to pay for care services arranged by the local authority instead (Public Accounts Committee, 2018).58
In 2016/17 the number of applications for Deprivation of Liberty Safeguards (DoLS) rose by 11% in 2015/16 in England and by 9% in 2015/16 in Wales (see section 3.2). The statutory timescales for processing DoLS applications were routinely breached and a substantial number of applications were left unassessed (NHS Digital, 2017a; Care Inspectorate Wales, 2018) meaning there is a risk that people may be deprived of their liberty without proper authorisation. In Scotland, the number of guardianship orders increased by 12.5% from 2015/16 to 2016/17. The proportion of guardianship applications for people with a learning disability and dementia increased between 2014/15 and 2016/17. There are concerns about the seeking and granting of orders on an indefinite basis for young people with a learning disability (Mental Welfare Commission for Scotland, 2017).
58 In Scotland, personal care is provided free under the Community Care and Health (Scotland) Act 2002.
The quality of help and protection for children across England has been found to be unsatisfactory and inconsistent
Living standardsIs Britain Fairer?
83www.equalityhumanrights.com/britain-fairer

In 2016–17, 72% of people who received care and support in Wales and 79% of carers who received support agreed that they were in control of their daily life as much as they could be – fewer than the 82% of people who had not received any care or support. These are reductions from the same survey conducted in 2014–15, although the reason for the reduction is not clear (Welsh Government, 2018b).
In Scotland, the introduction of Self-directed Support (SDS) was welcomed by many disabled people and their organisations but concerns have been raised about its implementation (EHRC, 2017b). A 2017 review reported that while there had been progress, there was no evidence that local authorities had fully implemented the SDS strategy. Most people rated their social care services highly, but not everyone had greater choice and control, and data collection needed to improve in order to better assess the impact of SDS (Audit Scotland, 2017).
4.5.5 Dignity and respect in social care In England, in 2016/17, over 3 in 5 (62.3%) social care service users reported that they were treated with dignity and respect (Table LST.SCR.1). This was an increase of 5.3 percentage points from 2010/11. However, those aged 75–84 years and over 85 were least likely to report that they were treated with dignity and respect (at 58.3% and 57.9% respectively) and increases for these age groups (3.3 and 2.0 percentage points respectively) have lagged behind those of younger age groups (around 8 percentage points for ages 45–74).
Respondents with learning difficulties were more likely to say that they were treated with dignity and respect in 2016/17 (76.6%) than respondents with physical disability, frailty and sensory impairments (57.7%). The proportion of those with mental health conditions reporting that they were treated with dignity and respect increased by 6.5 percentage points over the period from 2010/11 to 2016/17, reaching 63.8%.
In 2016/17, 66.9% of Asian respondents reported being treated with dignity and respect, higher than White respondents (62.1%) and an increase of 8.0 percentage points from 2010/11. Buddhist (77.1%), Muslim (70.3%) and Hindu (68.7%) respondents were also more likely to report this than Christians (62.2%), and respondents with no religious affiliation were less likely (60.5%).
In Scotland in 2017/18, around 7 in 8 (86.9%) social care service users reported that they were treated with compassion and understanding. This is a slight decline of 1.6 percentage points from 2013/14. Of those aged over 65, 89.0% reported a positive response, as did a higher percentage of men compared with women (88.1% and 86.1% respectively). Heterosexual/straight people (87.2%) reported being treated with compassion and understanding more often than bisexual people (76.2%) or those of Other (75.9%) sexual orientation.
Living standardsIs Britain Fairer?
84 www.equalityhumanrights.com/britain-fairer

People with no impairments were more likely to report a positive response (88.2%), compared with those with chronic pain lasting at least three months (83.9% reported this) or mental health conditions (85.0%). Among people with impairments the proportion reporting that they were treated with compassion and understanding declined between 2013/14 and 2017/18: physical disabilities (2.5 percentage point drop), deafness or severe hearing impairments (2.7 percentage point drop), mental health conditions (2.8 percentage point drop), chronic pain lasting at least three months (3.2 percentage point drop), and blindness or severe vision impairments (4.3 percentage point drop).
In Wales in 2016/17, 7 in 10 (69.8%) adult social care service users reported that care and support services had helped them to have a better quality of life. Those aged over 75 were more likely to say this (82.5%).
Putting a wash on in a National Autistic Society support home.
In Wales in 2016/17, 7 in 10 (69.8%) adult social care service users reported that care and support services had helped them to have a better quality of life
Living standardsIs Britain Fairer?
85www.equalityhumanrights.com/britain-fairer

4.5.6 Impact of caring on carersAnalysis of the 2016 GP Patient Survey found that 3 in 5 carers in the UK had a long-term health condition themselves. Although most carers are older people, 40% of carers aged 18–24 reported a condition compared with 29% of non-carers of the same age (Carers UK, 2017).
Most respondents to a 2017 survey said that caring had affected their physical (60%) or mental (70%) health. Those caring for a disabled child were most likely to struggle to find suitable support services. Nearly 4 in 10 (39%) had been offered or asked for a ‘carer’s assessment’ in the last year, an increase from 31% in 2016.59 Older carers were most likely to have been offered an assessment (30%) and those caring for a disabled child least likely (10%). Eight in 10 respondents waited less than six months for their assessment, an improvement from 50% in 2016 (Carers UK, 2017).60
The Social Services and Well-being Act (2014) Wales is so far having little positive impact on carers, who can still find it hard to access information and advice and are not always offered an assessment of their needs or personalised support (Care Inspectorate Wales, 2017b; Carers Wales, 2016; 2017).
4.5.7 Abuse and neglectIn England in 2016/17, 109,145 individuals were the subject of a safeguarding enquiry, an increase of 6% from 2015/16.61 Enquiry rates were higher for women than for men, people aged over 75, and ethnic minorities than for White people. These differences did not change over the reporting years (NHS Digital, 2017b).
In Wales in 2016/17, 11,761 adults were suspected of being at risk of abuse or neglect in social care services. Comparable data is not available for previous years (Stats Wales, 2017c).
Disabled children are three to four times more likely to be abused and neglected than non-disabled children (National Working Group on Safeguarding Disabled Children, 2016). Following a 2012 Ofsted report which criticised the approach of most English Local Safeguarding Children’s Boards in protecting disabled children, a survey concluded that progress had been slow and many of the fundamental longstanding challenges remained (National Working Group on Safeguarding Disabled Children, 2016).62
59 Carers are entitled to the opportunity to discuss with their local council what support or services they need to help them in their caring role. This is known as a carer’s assessment.
60 A self-selecting annual survey with 6,607 respondents in 2017.
61 ‘Safeguarding enquiries’ refer to any action taken by a local authority under Section 42 of the Care Act 2014 in response to indications of abuse or neglect of an adult with care and support needs who is at risk and is unable to protect themselves because of those needs.
62 The National Working Group on Safeguarding Disabled Children sent out a survey to all 146 Local Safeguarding Children Boards and received 36 responses, a response rate of 25%.
Living standardsIs Britain Fairer?
86 www.equalityhumanrights.com/britain-fairer

4.6 Conclusion A continuing increase in homelessness, increased child poverty rates despite decreases in severe material deprivation, and UK-wide social security reforms hitting the poorest hardest, have contributed to an overall fall in living standards in Britain since our last report.
Recent legislation to address increasing homelessness across all nations is welcome, although it is too early to assess its impact. Some groups of people who share protected characteristics and some at risk groups are at higher risk of homelessness, so it is important that new measures meet their needs. Disabled people face a shortage of, and delay in obtaining, accessible and adaptable homes. For Gypsies and Travellers, a more hostile policy environment brought in at the start of the review period is leading to an increase in unauthorised encampments.
It is alarming that one in three children in Britain and half of children from some ethnic minorities are now living in poverty, figures which have increased since our last review. Disabled people, women, and many ethnic minorities are still more likely to live in poverty and experience severe material deprivation. The poverty rate for adults has not changed but the proportion of adults living in severe material deprivation has reduced. This indicates that people’s ability to afford certain items up to 2016 hadn’t been detrimentally affected by increases in poverty, but there is a risk that this may have changed subsequently.
UK-wide reforms to social security and taxes since 2010 are having a disproportionate impact on the poorest in society and particularly affecting women, disabled people, ethnic minorities and lone parents, widening gaps between groups and entrenching disadvantage.
Reductions to funding for social care services in England have led to concerns about negative impacts on the availability and quality of care provided. Scottish and Welsh Governments have protected social care funding although the amount available has reduced in real terms due to rising need for services. No research has yet assessed the potential impact on the quality of care provided in Scotland or Wales.
There have been some recent positive legislative and policy changes to address these issues, and we particularly welcome the enactment of the socio-economic duty in Scotland and the Wellbeing of Future Generations (Wales) Act. However, we are concerned that these measures will still fall short of ensuring that the right to an adequate standard of living is respected, protected and fulfilled for everyone.
One in three children in Britain and half of children from some ethnic minorities are now living in poverty
Living standardsIs Britain Fairer?
87www.equalityhumanrights.com/britain-fairer

5. Health Every person in Britain should have access to health services to support them to attain the highest possible standard of mental and physical health.
Is Britain Fairer? Health
88 www.equalityhumanrights.com/britain-fairer

Keyfindings
Access to healthcare – Across Britain, patients are unable to access the quality service and treatment they need in line with referral and waiting time targets set by respective governments:
– Waiting times have increased in all three countries since 2014. In March 2017, nearly one in 10 people (9.7%) in England who were waiting for treatment had waited for more than 18 weeks. In Scotland one in six people (16.8%) who received treatment had waited for more than 18 weeks since referral. In Wales, nearly one in eight people (12.0%) were waiting for health services for more than 26 weeks since referral.
– People with learning disabilities and disabled people more broadly, homeless people, refugees and asylum seekers and Gypsies, Roma and Travellers continue to experience the most significant barriers to accessing healthcare services.
– Transgender people experience considerable barriers to accessing specialist services in England and Wales, and face poor treatment and discrimination when accessing general health services.
– Workforce shortages across the health and social care sector in Britain have had an impact on the quality of and timely access to health services.
– Rules governing eligibility to NHS healthcare in England are inconsistently and incorrectly applied by healthcare providers resulting in refugees and asylum seekers being wrongly refused access to healthcare.
Health outcomes – In 2015, 75.8% of adults in England, 80.6% of adults in Wales and 73.0% of adults in Scotland (in 2016) reported good health:
– Men report slightly higher rates than women and, overall, disabled people report much lower rates of good health.
– Some groups experience worse physical and mental health outcomes than the rest of the population, particularly homeless people, transgender people, Gypsies, Roma and Travellers, refugees and asylum seekers and people with learning disabilities. These are linked with poorer socio-economic outcomes for these groups, which exacerbate poor health.
– As more people are living to older age, many of those extra years are being spent in poor health (particularly by women), posing a greater demand on existing health and social care services.
– On average, the life expectancy of women and men with a learning disability is 18 years and 14 years shorter than for non-disabled women and men, respectively.
Is Britain Fairer?
89www.equalityhumanrights.com/britain-fairer
Health

– In 2016, infant mortality increased following decades of decreases:
– In England and Wales, Pakistani and Black African groups had the highest infant mortality rates and the Other White ethnic group had the lowest rate. This pattern has continued since 2009.
– Infant mortality rates were higher in the most deprived areas compared with the least deprived areas in both England and Wales and increased risk of infant mortality is associated with higher levels of maternal deprivation.
– In 2016, men were more likely to die by suicide than women: in Britain and England, three times more likely; in Wales over four times more likely; and in Scotland over two-and-a-half times more likely.
– In 2016, the suicide rate for those aged 45–54 was almost double that for those aged 15–24 in Britain. This pattern was repeated across England and Scotland.
Mental health – The lack of ring-fenced funding for mental health in England, Wales and Scotland risks money being diverted away from mental health to fund other services.
– Overall, more adults in Wales report poor mental health than in England and Scotland:
– Lesbian, gay and bisexual people, and those reporting other sexual orientations were almost twice as likely (27.2%) as heterosexual people (14.3%) to report poor mental health in England.
– 45% of all looked after children in England have a diagnosable mental health condition (compared with 10% of all children).
– Access to specialist perinatal mental health services is extremely poor; 40% of people in the UK have no access at all. This is worse in Wales where 70% of people have no access.
– Despite numerous programmes to help children and young people with mental health needs, learning disabilities and/or autism in England, this has not yet resulted in improved access or outcomes for children and young people in need of mental health services.
– In Scotland, there is no inpatient provision for young people who have both significant mental health conditions and forensic63 needs, and there is no inpatient provision for young people with a learning disability.
– In 2016/17, known rates of Mental Health Act 1983 detention in the Black or Black British group were over four times that of the White group, and rates of Community Treatment Order use were almost nine times those of the White group.
– The use of restrictive interventions on mental health service users is also over three times higher for Black or Black British groups compared with White British.
63 Forensic mental health services provide assessment and treatment of people with a mental health condition and a history of criminal offending, or those who are at risk of offending.
Is Britain Fairer?
90 www.equalityhumanrights.com/britain-fairer
Health

5.1 IntroductionEvery person in Britain should have access to health services to support them to attain the highest possible standard of mental and physical health. This includes avoiding premature mortality through disease, neglect, injury or suicide. Everyone should have timely access to healthcare and information about health, without discrimination. This chapter summarises the evidence on current issues that impede fair access to healthcare and impact on equal health outcomes.
In line with our equality and human rights Measurement Framework, this chapter assesses the extent to which progress has been made since our last review across a number of indicators: access to healthcare; health outcomes; and mental health (including access to and quality of services). Health is devolved, so governments in England, Scotland and Wales are responsible for setting their own policies in relation to health. (See Chapter 4 for further evidence on social care Chapter 6 for further evidence on detention and the criminal justice system).
5.2 Key policy and legal developmentsUN treaty bodies (the UN Committee on Economic, Social and Cultural Rights, the UN Committee on the Elimination of All Forms of Discrimination Against Women, the UN Committee on the Elimination of Racial Discrimination and the UN Committee on the Rights of Persons with Disabilities) have made a number of recommendations to the UK and devolved governments in recent years on how to ensure the highest attainable standard of health, addressing barriers to accessing healthcare and inequalities in health outcomes across a range of groups, and providing adequate resources for mental health services (UNCESCR, 2016; UNCEDAW, 2013; UNCERD, 2016; UNCRPD, 2017). The UK Government has introduced policies to establish ‘parity of esteem’ to ensure the same provision of mental health services as physical health services, created frameworks for delivering improved public health outcomes and to address inequalities, as well as policies effecting migrants’ access to healthcare.
Much of the responsibility for public health and inequalities has been transferred from the NHS to local authorities and Public Health England to ensure health matters are considered in all relevant policies. However, some challenges have endured including variation in performance between local authorities and unclear accountability, as well as poor access to data and information. These have been further compounded by cuts to public health funding (House of Commons Health Committee, 2016).
The UK Government has introduced policies to establish ‘parity of esteem’ to ensure the same provision of mental health services as physical health services
Is Britain Fairer?
91www.equalityhumanrights.com/britain-fairer
Health

In parallel, the Department of Health and Social Care (DHSC) has established the Public Health Outcomes Framework (PHOF), a range of indicators to help local authorities to measure and benchmark their progress in improving public health and reducing health inequalities between communities. The PHOF, originally published in 2012, was reviewed in May 2016 with a view to align it with other relevant frameworks (DHSC, 2016).64 Despite having put these frameworks in place to encourage a collaborative approach, the DHSC and NHS England, and other health bodies have been criticised for continuing to have insufficient data to evaluate outcomes or understand costs (National Audit Office, 2017a).
In 2017, NHS England refined its equality objectives for 2016–2020 to address the specific equality duties of the Equality Act 2010, ensuring that these were more measurable and worked towards reducing health inequalities, including for people with protected characteristics. This includes, for example, a target to develop a lesbian, gay, bisexual and transgender (LGBT) action plan in 2016/17 (NHS England, no date). NHS Wales developed its seven equality objectives for 2016–2020 in line with evidence from our statutory review report in 2015, ‘Is Wales Fairer?’. Although some protected characteristic groups are represented in these objectives, there are no specific commitments for LGBT people or Gypsies, Roma and Travellers in Wales (NHS Wales, 2016). This is also true for NHS Health Scotland’s equality outcomes 2017 to 2021 (NHS Health Scotland, 2017).
‘Parity of esteem’ – valuing mental health equally with physical health– continues to be the central guiding principle of the policy reforms introduced since 2015 by governments in England, Scotland and Wales to improve access to mental health services, quality of care and allocation of resources. In particular, NHS England’s 2016 Five Year Forward View for Mental Health (NHS England, 2016b); the Scottish Government’s Equality Outcomes and Mainstreaming Report (Scottish Government, 2017b); and Wales’s delivery plan for mental health and wellbeing 2016–19 (Welsh Government, 2016).
Evidence submitted to the House of Commons Public Accounts Committee (NHS England, 2016a); recommended focus in England on achieving parity of esteem within mental health so that people with different protected characteristics have the same opportunities to access mental health services. Priorities include tackling the disparities in African and Caribbean men and women’s experience of mental health diagnosis, care and support, and between adult and children and young people’s mental health service provision (Public Accounts Committee, 2016; Mental Health Taskforce, 2015).
64 The NHS Outcomes Framework (that sets out outcomes and corresponding indicators used to hold NHS England to account) and the Adult Social Care Outcomes Framework (that sets out outcomes and corresponding indicators used to hold other organisations to account) (Department of Health, 2016).
Priorities include tackling the disparities in African and Caribbean men and women’s experience of mental health diagnosis, care and support
Is Britain Fairer?
92 www.equalityhumanrights.com/britain-fairer
Health

Investment in mental health services in England continues to grow
In its 2016 Concluding Observations, the UN Committee on Economic, Social and Cultural Rights (UNCESCR, 2016) noted its concern that parity of esteem is hindered by a lack of resources for mental health services, and recommended that sufficient resources be allocated to the mental health sector to ensure better accessibility, availability and quality of mental health care. The UN Committee on the Rights of the Child (UNCRC, 2016) has recommended investment in child and adolescent mental health services (CAMHS), and a strategy at national and devolved levels to ensure better accessibility and quality of such services.
Since 2015, UK Government and devolved governments have allocated more funding to achieve this ambition (Prime Minister’s Office, 2017; Welsh Government, 2015a; Scottish Government, 2017a). Investment in mental health services in England continues to grow with the total spend on mental health, including spend on specialised mental health services, set to reach £11.9 billion in 2017/18 (NHS England, 2018a). However, funding for mental health is not ring-fenced in England and concerns have been raised that the money is being diverted to fund other services, impacting on proper provision (see X (A Child) (No 3))65 (Public Accounts Committee, 2016; Kings Fund, 2015; NHS Providers, 2016).
65 X (A Child) (No 3) [2017] EWHC 2036 (Fam) (3 August 2017) in which Lord Munby highlights the lack of proper provision of the clinical, residential and other support services and highlights a risk of breach of Articles 2, 3 and 8 of the European Convention based on lack of available adolescent mental health beds.
Art therapy session at Fromeside secure services.
Is Britain Fairer?
93www.equalityhumanrights.com/britain-fairer
Health

In Wales, funding is ring-fenced; however, there are concerns that mental health is still underfunded (Mind Cymru, 2016a). In Scotland, mental health funding is not ring-fenced; NHS Boards and local authorities in partnership with Health and Social Care Partnerships (HSCPs) draw on the overall funding they receive from the Scottish Government for health and social care, and make local funding decisions based on locally assessed needs, and in line with priorities set by the Scottish Government. All HSCPs are listed authorities for the purpose of the PSED Scotland Specific Duties. Investment in mental health will help underpin the new 10-year Mental Health Strategy (Scottish Government, 2017a).
UN treaty bodies have expressed concerns over barriers to accessing healthcare and inequalities in health outcomes across a range of groups. This includes temporary migrants, undocumented migrants, asylum seekers, refused asylum seekers, refugees, Gypsies, Roma and Travellers, disabled people (particularly those with mental health conditions and learning disabilities), and women (particularly disabled women, older women, women seeking asylum and Traveller women) (UNCESCR, 2016; UNCEDAW, 2013; UNCERD, 2016; UNCRPD, 2017).
The new models of care that have been developed in England in 2015 (Sustainability Transformation Partnerships, or STPs), and Scotland in 2016 (HSCPs), are a culmination of policy developments directed towards facilitating better delivery of healthcare and improving access. However, since their launch, both models of care have faced a number of criticisms related to their quality, transparency and ability to achieve and assess progress (The Royal College of Emergency Medicine, 2017; Freeman, 2017).
There is limited evidence that STPs are taking account of the specific needs of people with certain protected characteristics or those considered ‘at risk’, with the exception of work conducted with children and young people with learning disabilities, autism and mental health conditions (NHS England, 2018b). There is some concern that funding limitations will restrict their potential impact, including their ability to improve access to services (The Health Foundation, 2016).
In 2017, the UK Government commissioned an independent review of the Mental Health Act 1983 (for England and Wales). An interim report in May 2018 summarised certain issues as priorities for further examination. These included specific concerns about ethnic minorities, children and young people, people with learning disabilities or autism, and prisoners, including those in immigration detention centres. It also acknowledges how the Mental Health Act 1983 should be more compatible with human rights obligations such as the European Convention on Human Rights (ECHR), the evolving case law of the European Court of Human Rights in relation to the rights of those with mental disorder and the UN Convention on the Rights of Persons with Disabilities. The final report is expected to be published in autumn 2018 and will make recommendations on how new policy could better protect the rights of those experiencing mental health conditions in England and Wales.
The independent review acknowledges how the Mental Health Act 1983 should be more compatible with human rights obligations
Is Britain Fairer?
94 www.equalityhumanrights.com/britain-fairer
Health

It is also hoped that many of these issues for children and young people will improve as a result of the vision set out in the 2015 Future in Mind and 2016 Five Year Forward View for Mental Health (DHSC, 2015; NHS England, 2016a).
A number of policy and legal changes over the last 10 years have affected migrants’ access to healthcare.66 By 2015, both the Welsh and Scottish Governments had introduced regulations to allow free access to healthcare to refused asylum seekers. There are no similar policies in England, and there continues to be confusion and misinformation among migrants, asylum seekers and refugees about their eligibility for free health care.
Since 2015, judgments under the Mental Health Act 1983 (and changes made to it under the Mental Health Act 2007) have signalled a potential restriction of rights for migrants.67 In August 2017 the extension of charging people from overseas for NHS treatment in virtually all community services68 represented a serious regression of rights69 to access NHS healthcare in England, particularly for refugees and asylum seekers. Primary care remains free but the UK Government has signalled plans to start charging for primary care in the future.
Linked to this, the Court of Appeal confirmed the legality of the requirement for the NHS in England to provide information to the Home Office about overseas patients who fail to pay for chargeable health treatment.70
In January 2017, the Home Office, Department of Health and NHS Digital signed a Memorandum of Understanding requiring NHS Digital to share patient information (in England) with the Home Office. No independent scrutiny was built into the arrangement. We and other organisations raised concerns about the human rights implications of this data-sharing agreement and its potential to deter people from accessing and receiving healthcare (Asylum Matters, 2017). In May 2018 the UK Government narrowed the sharing of patient data in England for immigration purposes, except where they are looking to trace people who have been investigated for or convicted of a serious criminal offence.71 Data sharing will continue to operate where there are concerns about the welfare and safety of a missing individual, for example vulnerable children and adults. There was no change to the relevant legislation (Health and Social Care Act 2012) that provides the legal basis for data sharing between those bodies in England.
66 Such as: National Health Service (Charges to Overseas Visitors) (Amendment) Regulations 2017 (SI 2017/756) (‘the 2017 Regulations’), which introduce amendments to the National Health Service (Charges to Overseas Visitors) Regulations 2015 (SI 2015/238) (‘the 2015 Regulations’).
67 See A&B v Secretary of State for Health [2017] UKSC 41.
68 In relation to secondary care services provided in a community (non-hospital) setting.
69 The ‘minimum core level of human rights protection’ includes ‘essential health care’ under the mandates of the Special Rapporteur on adequate housing; the Special Rapporteur on the rights of persons with disabilities; the Special Rapporteur on extreme poverty and human rights; and the Special Rapporteur on the right to food.
70 See WXYX v Secretary of State for Health [2015].71 Which results in a sentence of 12 months or more,
or where their presence is considered non-conducive to the public good, for example, where they present a risk to public security but have yet to be convicted of a criminal offence.
Is Britain Fairer?
95www.equalityhumanrights.com/britain-fairer
Health

The Mental Health (Scotland) Act 2015 introduced a number of important amendments to the Mental Health (Care and Treatment) (Scotland) Act 2003 in relation to issues such as: Compulsory Treatment Orders; the right to choose a named person (who can make important decisions about your care if you are not able to decide yourself); and the registration of advance statements in which a person can set out how they do and do not wish to be treated for a mental health condition. It also requires local authorities and hospitals to report to the Mental Welfare Commission on how they are meeting their duty to provide independent advocacy to those with a mental disorder and how they ensure access to that service.
5.3 Access to health
5.3.1 Waiting and referral timesAcross Britain, referral to treatment times are increasing in England, Wales and Scotland. More people in Scotland wait over 18 weeks for treatment than the other countries.
In March 2017, nearly one in 10 people (9.7%) who were waiting for health services in England had waited for more than 18 weeks (Table HLT.ACH.1). This was higher in 2011 at 10.6%, but lower in 2014 at 6.3%. In Scotland, one in six (16.8%) people who received treatment had waited for more than 18 weeks since referral in March 2017; this was higher than in 2011 (14.8%) and 2014 (10.8%). The data for Wales is for a longer waiting period and shows nearly one in eight people (12.0%) who were waiting for health services had waited for more than 26 weeks since referral; an increase from 6.0% in 2011 and 11.1% in 2014.
People waiting more than 18 weeks for health services (March)
England
6.3%
10.6%
2011 2014
9.7%
2017
Scotland
10.8%
14.8%
2011 2014
16.8%
2017
People waiting more than 26 weeks for health services (March)
Wales
11.1%
6.0%
2012 2014
12.0%
2017
25–30%The rate of increase in referrals to adult Gender Identity Clinic services in England each year.
Is Britain Fairer?
96 www.equalityhumanrights.com/britain-fairer
Health

There is a lack of evidence on waiting and referral times for different types of health services by protected characteristic or other at-risk groups in all three countries.
Workforce shortages across the health and social care sector in Britain for a number of years have had an impact on the quality of, and timely access to, health services. In England, there was a 5.9% shortfall of staff in the NHS in 2014, with particular gaps in nursing, midwifery and health visitors (National Audit Office, 2016). In Wales, during 2017, hundreds more skilled medics have been leaving Welsh NHS trusts than are being recruited. Workforce pressures have had a marked effect on morale and recruitment/retention in primary care in Wales (Royal College of General Practitioners, 2015). In Scotland, workforce planning faces criticism, where projections made by senior NHS managers and government officials do not fully recognise the number of staff soon to retire, or the effects of rising demand on an NHS workforce already under pressure (Audit Scotland, 2017).
In England, there was a 5.9% shortfallofstaffintheNHSin2014
5.3.2 Access issues for at-risk groupsAccess issues for people with learning disabilities
Most people with learning disabilities have poorer physical and mental health than the rest of the population, yet their access to appropriate health care is often limited. For example, in England, only an estimated 23% of people who have a learning disability are registered with their GP as having a learning disability (NAO, 2017b).
There is evidence that annual learning disability health checks72 lead to better health outcomes for people with a learning disability; for example they often uncover treatable health conditions. However, the quality or content of health checks are not analysed, so there is no way of measuring their success (NAO, 2017b).
In 2016/17, almost 50% of patients in England with a learning disability (who are registered with a GP) received an annual learning disability health check; an increase from 43% in 2014–15 (NHS Digital, 2017c). In Wales, most people with learning disabilities do not receive an annual health check and the uptake rates, quality and consistency of these checks vary. Evidence indicates that some GPs are reluctant to undertake annual health checks (Welsh Government, 2015d).
72 The Annual Health Check scheme is for adults and young people aged 14 or above with learning disabilities who need more health support and may otherwise have health conditions that go undetected.
Is Britain Fairer?
97www.equalityhumanrights.com/britain-fairer
Health

In Scotland, people with a learning disability or autism experienced delays in accessing appropriate mental health community services and were more likely to have longer stays in hospital than other mental health patients (Scottish Human Rights Commission and Equality and Human Rights Commission, 2017). The Mental Welfare Commission Scotland (2016c) visit to hospital learning disability units (excluding forensic units) in 2015 reported 35% (58 of 180) were ‘delayed discharges’ (individuals being kept in hospital when this is recognised as no longer the best place for them to be living). Reasons for delayed discharge included: no suitable accommodation and support for complex needs of many of the patients, coordination of the availability of funding from the local authority with the availability of appropriate accommodation, impact of constraints of local authority budgets, and delays in adaptations to properties.
Access issues for homeless people
Homeless people face multiple barriers to accessing healthcare across Britain. Mental health care is often the most difficult to access. In particular, the absence of specialist mental health teams leaves people who urgently need support without assessment or treatment, blocks their path to accommodation and keeps them on the streets for longer (St Mungo’s, 2016). Cymorth Cymru73 report that homeless people in Wales struggle to access healthcare and are bounced between mental health and addiction services. The inability to make an appointment, being discharged to the streets or ‘unsuitable accommodation’ and long waiting times were some of the factors that prevented people from accessing health services (Cymorth Cymru, 2017). There is also a lack of information on where homeless people in Scotland can go for treatment (Mental Welfare Commission, 2017).
There is evidence that some homeless people face particular difficulties registering with a GP. In England, while 98% of the population are registered with a GP, 83.3% of single homeless people in accommodation, 89.0% of hidden homeless people (those who are not evidenced in official figures, such as those staying with family members or friends, living in squats or other insecure accommodation) and just 65.5% of rough sleepers were registered. The study focused on people in contact with services so, in reality, these numbers could be much higher (Elwell-Sutton et al., 2017).
Access issues for transgender people
Transgender people face poor treatment when accessing healthcare services which is exacerbated by discrimination by medical staff (WEC, 2016). This is confirmed in a national survey by Stonewall,74 who report that two in five trans people (41%) said that healthcare staff lacked understanding of specific trans health needs when accessing general healthcare services (increasing to half of trans people (51%) living in Wales) and 7% of trans people said they had been refused care because they were LGBT (Bachmann and Gooch, 2018).
73 An umbrella body for providers of housing support and social care services. The sample was 332 homeless people from 21 out of 22 local authority areas.
74 Focuses on the experiences of 871 transgender and non-binary people who took part in the research.
Is Britain Fairer?
98 www.equalityhumanrights.com/britain-fairer
Health

Demand for adult Gender Identity Clinic (GIC) services in England is growing at a significant rate, with referrals increasing by an average of 25%–30% a year across all clinics. Transgender people face unacceptably long waiting times when trying to access specialist services (WEC, 2016). Waiting times in England can reach 2–3 years and this is in breach of patients’ legal entitlement, under the NHS Constitution, to have their first appointment in a specialist service within 18 weeks of referral (WEC, 2016).
The Tavistock Clinic (Gender Identity Development Service) is the only specialist service in Britain providing early-intervention treatment for children and young people. It has seen a surge in demand for its services with an increasing number of referrals; from 97 in 2009/10 to 2,519 in 2018/19 (GIDS, 2018). Although GPs can refer patients directly to GIDS, referral takes place predominately through local CAMHS (WEC, 2016).
Transgender patients in Wales have historically been referred to the GIC in London, adding to the time and cost it takes to access healthcare as well as affecting the mental wellbeing of patients waiting in a lengthy referral process (WEC, 2016). In order to improve health outcomes for transgender patients, a specialist ‘Welsh Gender Team’ was established in February 2018 that will allow patients to be assessed and begin treatment, if needed, in Wales (Welsh Government, 2018a). In March 2018, a new specialist gender identity service in Wales began to accept referrals.
Demand for specialist gender services has also been increasing in Scotland. From 2014 to 2017, the number of referrals to the three main Scottish GICs75 has increased every year for both adults and young people. However, the rate of increases appears to be slowing for both groups: for adults, an increase of 60.7% from 2014–15, to 23.2% from 2016–2017; and for children an increase of 103.2% from 2014–15, to 21.2% from 2016–2017. Although waiting times are still long, the mean waiting time for adult GICs fell by 69.2% across the time period, from 370.8 days in 2014 to 114.3 days in 2017 (Scottish Public Health Network, 2017).
An LGBT Youth Scotland survey reported that, in 2017, 84% of LGBT young people (who had used GIC services) felt supported and respected by GICs, although rates were lower (65%) for non-binary young people76. Some young people perceived GICs as only supporting those with binary identities of men and women and as a response some young people had misidentified themselves (as having a binary gender) in order to access support. Many young people also commented on the lack of local services and long waiting times for appointments, especially for GICs and mental health services (LGBT Youth Scotland, 2018).
75 Sandyford, Chalmers and Highland GICs.76 Defined in the report as a person who does not
identify exclusively as a boy or as a girl.
To improve health outcomes for transgender patients, a specialist ‘Welsh Gender Team’ was established in February 2018
Is Britain Fairer?
99www.equalityhumanrights.com/britain-fairer
Health

Access for Gypsies, Roma and Travellers
Gypsies, Roma and Travellers face numerous barriers in accessing health services, particularly across primary care. In England, these include: not being able to register (requiring proof of identity and address); poor literacy skills; fear of discrimination (resulting in non-engagement and hiding ethnicity); and over-reliance on A&E services (especially mobile and/or homeless Gypsies, Roma and Travellers) (The Traveller Movement, 2016).
Evidence to the Women and Equalities Committee inquiry highlighted stakeholder concerns about issues that may not be spoken about openly in more traditional communities, such as older people’s access to mental health and women’s access to antenatal services. The evidence also suggests that these communities may not seek healthcare until they are really ill. Stakeholders called for GP services to be more flexible so that children can be immunised and to make antenatal care more accessible. Children’s poor access to oral health services was also highlighted (Women and Equalities Committee, 2018).
Navigating the healthcare system is particularly difficult for Gypsies, Roma and Travellers. Although there is guidance available, a lack of leadership and a coordinated response of local health authorities was cited as a failing (Women and Equalities Committee, 2018 – question 40).
In Wales, access is obstructed by prejudice and discrimination, combined with the severe shortage of stopping places and lawful sites (Marsh, 2017). The Traveller Movement reports that some health professionals lack the skills, support and cultural understanding, and commissioners may not have the financial incentives to deliver high quality care to these communities (The Traveller Movement, 2015).
In 2017, it was reported that Gypsy/Travellers in Scotland have low rates of outpatient appointments, hospital admissions, A&E attendances, cancer registrations and maternity hospital admissions (NHS National Services Scotland, 2017).
There is a lack of disaggregated data on the access issues of Gypsy, Roma and Traveller people in Britain and no nationally representative data on the health needs of this group (Jones, 2016). Responsibility is entirely on service commissioners and providers at a local level but there are strong concerns about the under-recording of Gypsy/Travellers at a local level, compared with the proportions reported in the census (NHS National Services Scotland, 2017). This issue is exacerbated by the NHS failing to add the England and Wales 2011 census category ‘Gypsy or Irish Traveller’, to the NHS Data Dictionary. Thus, these categories are missing in the 40 or so ethnically coded datasets in the NHS. Scotland did adopt the 2011 census in the NHS Scotland Data Dictionary resulting in ethnically coded datasets being populated with this category.
The Traveller Movement reports that some health professionals lack the skills, support and cultural understanding...to deliver high quality care to these communities
Is Britain Fairer?
100 www.equalityhumanrights.com/britain-fairer
Health

Access for migrants, refugees and asylum seekers and people in Immigration Removal Centres
The evidence base on migrants’ access to health services across Britain is scarce and inconsistent and often captures a heterogeneous group of migrants. Evidence on the experience and health outcomes for differing migrant groups in Britain is limited to small qualitative studies in England and it is difficult to generalise or draw conclusions from these.
Language, reason for migration, such as fleeing violence or persecution, and experiences of health service delivery in the country of origin can all play an important role in the management of migrants’ health in Britain and can influence their experience and expectations of the NHS. Migrants’ perceptions of health services can be negatively influenced by poor experiences and perceptions of GPs, often their first experience with healthcare (University of Birmingham, 2016).77 General confusion exists among migrants and health providers about entitlements due to changes in NHS policy, controversy over ‘health tourism’, and challenges registering for health services or accessing secondary facilities (Rafighi et al., 2016).78 Confusion over entitlement to healthcare is felt by both asylum seekers, refused asylum seekers and service providers as a result of poor understanding and misapplication of guidelines in England (but which have a wider impact not confined to England) (EHRC, forthcoming).
There continues to be a lack of data available about the health needs of immigration detainees in England.79 The services available vary across the immigration detention estate. There are also gaps in the type of information collected on issues such as: health screenings on arrival failing to explore mental health or experiences of trauma; the poor continuation of treatment; and people not having access to regular medication (Shaw, 2016). Serious concerns about the detention of pregnant women and survivors of sexual abuse, rape and other forms of violence remain largely unaddressed (Shaw, 2016; APPG Refugees and APPG Migration, 2015). The screening process to determine whether women have experienced violence or have mental health conditions is inadequate, and vulnerable women continue to be detained (Women for Refugee Women, 2017). Fewer pregnant women have been detained since the Immigration Act 201680 came into force but some continue to be detained. It has become harder to obtain information about these women or to provide them with any level of support (Royal College of Midwives, 2017).
In Scotland, immigration detainees generally reported positively on health care provision, and that the overall quality of and access to health services was good (especially primary care, dental, mental health and pharmacy services). However, access to dispensary and medication administration areas were described as not fit for purpose (HMCIP, 2015). Evidence to the Scottish Parliament’s inquiry into asylum and destitution81 describes how the asylum process in itself exacerbates mental health difficulties and access to quality health care and treatment for patients who do not have regular accommodation was problematic (Scottish Parliament, 2017a). 77 Based on 23 interviews.
78 Based on 22 respondents.79 There are no Immigration Removal Centres in Wales.80 Pregnant women may not be detained for longer
than 72 hours, extendable up to a week in total with ministerial approval.
81 The inquiry received 107 responses, of which 37 were from individuals (this includes organisations who collated case studies from people who had experienced destitution).
Is Britain Fairer?
101www.equalityhumanrights.com/britain-fairer
Health

Access issues for prisoners
The UK Government (Ministry of Justice) does not collect enough data about the health of prisoners in England and Wales and there are no reliable data on the prevalence of illness in prisons, making it difficult to plan services and monitor outcomes. The NHS does not collate information from prisoner health screenings to understand if there is unmet need (NAO, 2017c). During 2016/17, access to health services was impeded by the reduction in the number of prison officers and restrictive regimes leading ultimately to increased waiting times (HMCIP, 2017a).
In contrast, the prison admissions process in Scotland was found to be robust in helping to identify healthcare needs (Scottish Parliament, 2017b). Prisoners over the age of 60 were generally favourable on their dealings with healthcare professionals in Scotland. However, there were large inconsistencies in their experiences of medical and personal care and a wide variation in the levels of basic human decency and humane treatment of older prisoners (HMIPS, 2017).
5.4 Health outcomes
5.4.1 People’s current health statusIn 2015, 75.8% of adults in England, 80.6% of adults in Wales and 73.0% of Scottish adults (in 2016) reported good health (Table HLT.OCM.1A). Across all three countries those numbers declined with increasing age. In England and Wales men report slightly higher rates of good health than women.82
Disabled people in Scotland and Wales reported good health more frequently than disabled people in England in 2015. Across Britain, disabled adults report much lower rates of good health overall compared with non-disabled adults.
In England, disabled adults with stamina, breathing or fatigue impairments83 (19.4%), vision impairments (20.8%) and mobility impairments (20.1%) report good health less often than non-disabled adults. In Wales in 2015, those with cancer (30.8%) and mental health conditions (42.4%) report good health less frequently than those with physical impairments (56.3%). In Scotland in 2016, those with mental health conditions (31.9%), or physical impairments (32.2%) report good health less often than non-disabled people.
82 Note, the impairment type data in the Welsh Health Survey is comparable with Scotland, but not England. Good health refers to ‘good or very good’ responses.
83 Impairment types are from the ONS harmonised codes for impairments See ONS (2015).
The life expectancy of those with learning disabilities is shorter than for the general population, by 18 years for women and 14 years for men in England
Is Britain Fairer?
102 www.equalityhumanrights.com/britain-fairer
Health

In England and Scotland, adults in higher managerial roles report good health more frequently than those in routine occupations (87.7% compared with 64.4% in England and 86.1% compared with 60.5% in Scotland). Similarly, in Wales, reporting of good or very good health declines from 90.6% for those in higher managerial professions to 62.0% for those who have never worked or who are long term unemployed.
In England, between 2010 and 2015, there has been an increase in the percentage of older people aged 70–74 (7.8 percentage points), younger people aged 20–24 (8.4 percentage points), and, since 2013, people with social or behavioural impairments of all ages (12.7 percentage points) reporting good health.
In Wales, between 2010 and 2015, the percentage of disabled people who report good or very good current health has increased (7.5 percentage points), particularly for those with physical impairments (9.0 percentage points). It has also increased for older people aged 65–74 (5.1 percentage points – particularly women, 5.5 percentage points) and those aged 75 or over (3.8 percentage points).
In Scotland, between 2010 and 2016, ethnic groups other than White or Asian have seen a decline (16.4 percentage points) in people reporting good health. This is also the case for men aged 25–34 (6.6 percentage points), and particularly men separated, divorced, widowed, or previously in a civil partnership (9.6 percentage points), or since 2013, those with physical disabilities (6.1 percentage points). Between 2010 and 2016 reporting of good health increased for those with mental health conditions (11.3 percentage points) and younger disabled people aged 16–24 (20 percentage points).
Infant mortality rates per 1,000 live births (2016)
England
5.9Mostdeprivedareas
2.6Leastdeprivedareas
Wales
4.7Mostdeprivedareas
1.4Leastdeprivedareas
England and Wales
2.2WhiteOther
5.9Pakistani
5.3BlackAfrican
Is Britain Fairer?
103www.equalityhumanrights.com/britain-fairer
Health

In 2015, 94.4% of children in England, 94.2% of children in Wales, and in 2016, 95.5% of children in Scotland reported their health as good (Table HLT.OCM.1C). There is no significant difference between boys and girls or between age groups. Across the three countries, disabled children report good health less frequently than non-disabled children (65.0% compared with 96.9% in England; 63.1% compared with 98.0% in Scotland; and 62.0% compared with 87.4% in Wales). In England this was most prominent for to those with mobility (51.9%) or stamina (50.7%) impairments. In England, children from Asian (91.8%) or Other (92.7%) ethnic backgrounds report good health less frequently than White children (95.3 %). There has been no significant change over time.
5.4.2 Health outcomes for other groupsHomeless people
In England, homeless people are considerably more likely to experience mental or physical health problems compared with the general population and many suffer from drug and/or alcohol abuse (Homeless Link, 2014). However, available research is limited to smaller studies and there are very few recent data. In Scotland, of the 28,247 households assessed as homeless in 2016/17, 12,462 (44%) cited having one or more support needs. Nearly half of applicants84 with support needs specified a mental health problem (45%), 25% cited drug or alcohol dependency, 10% for a physical disability and 19% for a medical condition (Scottish Government, 2017c). In Wales, between 30% and 40% of people become homeless because of alcohol misuse and an estimated 60% of the homeless population drink alcohol at hazardous and harmful levels. Drug and alcohol abuse are particularly common causes of death among the homeless population, accounting for just over a third of all deaths (Welsh Government, 2015c).
Transgender people
There is limited, robust evidence that focuses on the health outcomes of transgender people. However, the research that is available suggests that transgender people in Britain are likely to experience worse physical and mental health outcomes than the rest of the population (Sharp and Metcalf, 2016). Data on the health outcomes of transgender people in Wales and Scotland are scarce. See also section 5.5.2 in this chapter.
84 Households assessed as homeless who applied for accommodation.
Across the three countries, disabled children report good health less frequently than non-disabled children
Is Britain Fairer?
104 www.equalityhumanrights.com/britain-fairer
Health

Gypsies, Roma and Travellers
‘Is Britain Fairer? 2015’ reported that both the physical and mental health of Gypsies, Roma and Travellers was poorer than that of the rest of the population. Robust evidence related to health outcomes of Gypsies, Roma and Travellers is limited. There is evidence in England and Wales that existing health problems are exacerbated (or new problems created) by poor quality accommodation – including as a result of forced movement, and discrimination from the local community (The Traveller Movement, 2016).85 The Women and Equalities Committee highlighted similar concerns, that insecurity of tenure does not create a healthy living environment and contributes to the reasons why Gypsies, Roma and Travellers’ health deteriorates so drastically (WEC, 2017).
Migrants, refugees and asylum seekers
Migrants, refugees and asylum seekers are likely to experience many social determinants linked to poorer health, for instance poverty, lack of adequate housing or homelessness, unemployment, or isolation. This picture has not changed since our report ‘Is Britain Fairer? 2015’, and there remains only limited reliable evidence to draw from. In England, researchers have acknowledged that the poorer health outcomes of this group are a result of poor access to health services (Nair et al., 2015). The absence of accurate data on the number or status of migrants in Scotland means there is little accurate evidence on the health of migrants (Scottish Public Health Network, 2016). There is no robust evidence that reports the health outcomes of migrants, refugees and asylum seekers in Wales.
5.4.3 SuicideIn 2016, the overall suicide rate in Britain was 10.9 per 100,000 (Table HLT.OCM.2). The rate per 100,000 was higher in Scotland (16.0) than England (10.1) or Wales (9.6). Between 2011 and 2016 the suicide rate declined in Scotland (by 4.0/100,000) but declined by less in England (by 0.2/100,000). It declined in Wales between 2013 and 2016 (by 2.9/100,000).
Men in Britain (16.5 per 100,000) were three times more likely to die by suicide than women (5.1 per 100,000). Welsh men were over four times more likely to die by suicide than women (20.9 per 100,000 compared with 4.3 per 100,000). English men were three times more likely (15.6 per 100,000 compared with 4.8 per 100,000) and Scottish men were over two-and-a-half times more likely (23.6 per 100,000 compared with 8.9 per 100,000). Between 2011 and 2016 suicide rates in England showed little change by sex, with a small decline for men (1.4/100,000) between 2013 and 2016. Suicide rates declined for both men and women in Scotland (from 2011) and Wales (from 2013).
85 Based on 33 in-depth interviews.
Men in Britain were three times more likely to die by suicide than women
Is Britain Fairer?
105www.equalityhumanrights.com/britain-fairer
Health

In Britain, the suicide rate for those aged 45–54 was almost double (14.6 per 100,000) that for those aged 15–24 (7.5 per 100,000). This pattern was repeated across England and Scotland with rates for 45–54 year olds double the rate of 15–24 year olds. Between 2011 and 2016, the suicide rate in Britain declined for those aged 35–44 by 2.5 per 100,000. Between 2013 and 2016 declines were evident for those aged 45–64 (1.4/100,000) and those aged 75 and over (1.4/100,000). Over the same period the suicide rate in England had increased for younger people aged 15–24 (0.9/100,000) but decreased for 35–44 year olds in England (1.9/100,000) and Scotland (4.1/100,000) and 45–54 year olds in Wales (8.5/100,000).
There is further evidence that young people and LGBT people have an increased likelihood of dying by suicide than other groups. Between 2015 and 2016, rates of suicide among children and young people in Britain rose 2%, in contrast with the average trend across age groups (ONS, 2016b). NSPCC Childline were contacted every 30 minutes about suicidal thoughts in 2015/16; 19,481 contacts were made by young people who were struggling with thoughts of ending their own lives – more than double the number than in the previous five years (NSPCC, 2016). In 2016/17, a survey conducted with LGBT young people (11–19 years) in Scotland found that: 96% of transgender young people have deliberately harmed themselves at some point and 43% have attempted to take their own life; 58% of lesbian, gay and bisexual young people who are not trans have self-harmed and 24% have tried to take their own life (Stonewall Scotland, 2017).86
5.4.4 Life expectancyWomen continue to have higher life expectancy than men (ONS, 2017). In 2014 to 2016, life expectancy at birth87 in the UK was 79.2 years for men and 82.9 years for women (consistent with figures from 2013–15). Life expectancy at birth remained highest in England (79.5 years for men and 83.1 years for women) and lowest in Scotland (77.1 years for men and 81.1 years for women). The Welsh figure was 78.4 years for men and 82.3 years for women (ONS, 2017). A consequence of increasing life expectancy has been an increase in the proportion of the population expected to live to older ages. However, many of those extra years are being spent in poor health, posing a greater demand on existing health and social care services (Age UK, 2017).
ONS data based on the 2012–14 mortality and health status rates in England suggest more, not less, ill-health and disability in later life, particularly for older women. Men could expect to live on average for 79.5 years, with 63.3 of these years spent disability-free. In comparison, women could expect to live longer on average (83.2 years); however, less of their lifespan (63.2 years) would be spent free from disability (ONS, 2016a).
People with learning disabilities have significantly reduced life expectancy because of issues related to healthcare (LEDER, 2017). On average, the life expectancy of men and women with a learning disability is 14 and 18 years shorter, respectively, than for men and women in the general population (NHS Digital, 2017c). In 2017, the average age of death for people with a learning disability was 59 for men and 56 for women, and more than a quarter (28%) of these deaths were of people aged under 50 years (LEDER, 2017).
86 Sample of 3,713 LGBT young people aged 11–19, including 402 living in Scotland.
87 Life expectancy at birth is defined as how long, on average, a newborn can expect to live, if current death rates do not change.
Is Britain Fairer?
106 www.equalityhumanrights.com/britain-fairer
Health

5.4.5 MalnutritionMalnutrition88 is both a cause and a consequence of poor health. In 2016, of the 11.6 million older people in the UK, around one in 10 people over the age of 65 are malnourished or at risk (Malnutrition Task Force, 2017). Most cases of recorded malnutrition occur in the community (non-institutionalised population) (93%), with 5% in care homes and 2% in hospitals. In care homes, the prevalence of malnutrition did not differ significantly between England, Scotland and Wales but it was found to be higher in older residents, and among women compared with men (BAPEN, 2016).
In 2016, the All Party Parliamentary Group (APPG) on Hunger reported a rising number of children in England starting their first and final years of school underweight (Forsey, 2016). A further 2017 APPG report drew attention to hunger among school children during school holidays and the increase in the number of families with children relying on foodbanks during this time, compared with other parts of the year (Forsey, 2017). In April 2017, a National Union of Teachers survey in England found 80% of teachers noted a rise in ‘holiday hunger’ (in the last two years), with (over) a third saying pupils were returning to school with signs of malnourishment. See Chapter 4 for further evidence.
5.4.6 Infant mortalityIn England and Wales, the infant mortality rate in 2016 was 3.8 deaths per 1,000 live births, an increase from 3.7 deaths per 1,000 live births in 2015.89 The infant mortality rate had been following a downward trend since the 1990s, until 2015, where the rate began to increase (ONS, 2018). In Scotland, the infant mortality rate in 2016 was 3.3 (per 1,000 live births) (181 deaths), similar to rates for 2014 (3.6) and 2015 (3.2); lower than England but higher than Wales (National Records of Scotland, 2017).
Infant deaths and stillbirths are linked to a number of risk factors, including inequalities across different socio-economic and ethnic groups. The infant mortality rates were higher in the most deprived areas compared with the least deprived areas in both England (5.9 and 2.6 per 1,000 live births) and Wales90 (4.7 and 1.4 per 1,000 live births) in 2016 (ONS, 2018). In England and Wales, the lowest infant mortality rate was for babies in the Other White ethnic group at 2.2 deaths per 1,000 live births. In contrast, Pakistani and Black African babies had the highest infant mortality rates of 5.9 and 5.3 deaths per 1,000 live births, respectively. This pattern has continued since 2009 (ONS, 2018). There is no available evidence on infant mortality in Scotland by protected characteristic.
88 Malnutrition for many older people is characterised by low body weight or weight loss, meaning simply that some older people are not eating well enough to maintain their health and wellbeing. See Malnutrition Task Force (2016) ‘About Malnutrition’. Available at: http://www.malnutritiontaskforce.org.uk/about/ [accessed: 10 May 2017].
89 The increased infant mortality rate can be attributed to the 2.8% increase in the number of infant deaths in 2016 compared with 2015, along with the 0.2% decrease in the number of live births over this period.
90 The number of infant deaths in Wales is relatively small, making the infant mortality rates less robust.
Pakistani and Black African babies had the highest infant mortality rates in England and Wales
Is Britain Fairer?
107www.equalityhumanrights.com/britain-fairer
Health

Some of this increased risk is due partly to higher rates of obesity, diabetes and deprivation in ethnic minority groups (HoP POST, 2016). Other risk factors include poor access to maternity and postnatal care (HoP POST, 2016; MBRRACE-UK, 2015). The risk of stillbirth and infant mortality is higher where marriage occurs between couples from the same family (that is, with at least one shared great grandparent or closer), such as some British-born Pakistani people (HoP POST, 2016).
5.5 Mental health
5.5.1 Population reporting poor mental health and wellbeingMore adults in Wales reported poor mental health than in England and Scotland (Table HLT.MTL.1A). Numbers of men reporting poor mental health were higher in Wales than England and Scotland, where the number was higher for women. In Wales, there was an increase (2.5 percentage points) in the number of people reporting good mental health between 2011 and 2015.
In 2014, 14.7% of adults in England reported poor mental health and wellbeing. That number was higher for women (17.0%) than men (12.3%) and was lowest among those aged 65–74 (11.0%). Over three times as many disabled people (33.0%) reported poor mental health and wellbeing than non-disabled people (9.8%). Heterosexual people were almost half as likely (14.3%) to report poor mental health than lesbian, gay or bisexual people, or those reporting other sexual orientations (27.2%).
Mental health
Wales
2010 2015
16-24 year old
9.2%
2010 2015
25-34 year old
6.33%
Between 2010 and 2015 the percentage of young people with poor mental health and wellbeing increased by 9.2% for young people aged 16-24 and 6.33% for those age 25-34.
The standardised rate of people subject to restrictive intervention per 100,000 in England (2016/17)
52.1Black orBlack British
39.5Mixed
24.7Other ethnicGroups
15.8White
13Asian
Is Britain Fairer?
108 www.equalityhumanrights.com/britain-fairer
Health

In 2016, 15.4% of adults in Scotland reported poor mental health and wellbeing. This was higher for women (17.3%) than men (13.2%) and at its lowest among older people aged 65–74 (10.2%). Three times as many disabled people (28.4%) reported poor mental health and wellbeing as non-disabled people (9.4%). Older disabled people (age 65–74) reported lower rates of poor mental health (18.0%).
In 2015, 26.8% of adults in Wales reported poor mental health and wellbeing. This was lower for men (22.3%) than women (31.1%). Disabled people reported poor mental health nearly three times more frequently (48.0%) than non-disabled people (16.9%). People who had never worked or who were long term unemployed reported poor mental health more frequently (47.2%) than any other socio-economic group. Between 2010 and 2015 the percentage of young people in Wales with poor mental health and wellbeing increased for young people aged 16–24 (9.2 percentage points, and within this group more for young women than young men), and 25–34 (6.33 percentage points). It also increased more for women (3.5 percentage points) than men (1.4 percentage points).
In 2014, 9.3% of all children aged 13–15 in England had poor mental health and wellbeing (Table HLT.MTL.1C). In Scotland, 10.4% of all children aged 13–15 years living in private households had poor mental health and wellbeing in 2016. In Wales, this figure was 8.2% in 2015. Although 23.1% of disabled children in Wales had poor mental health and wellbeing, between 2013 and 2015, this percentage had declined substantially by 24.3 percentage points. There are no further breakdowns for Scotland.
The proportion of looked after children in England (2016) and Wales (2015) who have a diagnosable mental health condition, compared with 10% of all children
All children
10%
England
45%
Wales
49%
The number of children and young people who were starting or receiving treatment for mental health conditions
Scotland
13.82013/14
17.02016/17
Per 1,000 children
Is Britain Fairer?
109www.equalityhumanrights.com/britain-fairer
Health

Race and rates of detention in England (2017)
x4.1Rates of detention (under the Mental Health Act)
x8.8Rates of Community Treatment Order
White group Black/Black British group
In England in 2016/17, there was a disproportionate use of detention (in mental health settings) for ethnic minorities.
Across Britain, people from ethnic minorities are generally considered to be at increased risk of poor mental health (EHRC, 2016). Some evidence suggests that mental health conditions go unreported and untreated because people in some ethnic minorities are reluctant to engage with mainstream health services (Mental Health Foundation, 2017).
People who experience homelessness are more likely than the general population to have mental health conditions, and homelessness can cause or exacerbate mental health issues (MWC, 2017). People sleeping rough with a mental health need tend to live on the streets for longer and poor access to mental health support acts as a further barrier to accessing housing support (St Mungo’s, 2016).91 In England, the number of people recorded as sleeping rough with an identified mental health support need more than tripled from 711 in 2009/10 to 2,342 in 2014/15 (St. Mungo’s, 2016). In Scotland, 20% of homeless people cited mental health as a factor contributing to why they are homeless (Scottish Government, 2017c). See Chapter 4 for further detail on the scale and impact of homelessness.
91 Based on a survey of 3,335 respondents, 93% of whom were in emergency, hostel or supported accommodation, sofa surfing, rough sleeping or squatting.
In Scotland, 20% of homeless people cited mental health as a factor contributing to why they are homeless
Is Britain Fairer?
110 www.equalityhumanrights.com/britain-fairer
Health

Rates of Compulsory Treatment Orders (CTOs) from 2014/15 to 2015/16
Scotland
8%increase in CTOs in 2015/16 compared with 2014/15
52%Male (2015/16)
48%Female (2015/16)
Young people aged under 18 in 2015/16
78.3%Male
21.7%Female
The relevant UK Government and devolved departments and public bodies still do not know enough about the mental health of the prison population. They do not collate information from prisoner health screening to understand if there is unmet need. There are no official figures for the number of people in prison in England and Wales who have a mental health condition, or the amount of money being spent on mental health in prisons (National Audit Office, 2017c). There are no robust figures on the prevalence of mental health conditions of Scottish prisoners. In England and Wales, 70% of people who died from self-inflicted means while in prison had already been identified as having mental health needs. There were concerns that mental health conditions had only been flagged on entry to the prison for just over half of these people; nearly one in five of those diagnosed with a mental health condition received no care from a mental health professional in prison; and no mental health referral was made when it should have been in 29% of self-inflicted deaths where mental health needs had already been identified (PPO, 2016).
In England and Wales, 70% of peoplewhodiedfromself-inflictedmeans while in prison had already beenidentifiedashavingmentalhealth needs
Is Britain Fairer?
111www.equalityhumanrights.com/britain-fairer
Health

5.5.2 Access to and quality of mental health servicesA high proportion of people with mental health conditions in England and Wales do not have access to the care they need (House of Commons Committee of Public Accounts, 2016). Similarly in Scotland, the Mental Welfare Commission identified that mental health services need to respond better to those who do not fit current service approaches; for example their investigations repeatedly showed worse services and poorer outcomes for people with complex needs (MWC, 2016a).92
Access to specialist perinatal mental health services is poor; 40% of people in the UK have no access at all. This is worse in Wales, where 70% of people have no access (Mental Health Foundation, 2016b). In Wales, up to one in five women are affected by perinatal mental illness (National Assembly for Wales, 2017). Since 2013, there has been no access to a Mother and Baby Unit (MBU) in Wales for mothers with perinatal mental health conditions, resulting in many travelling to England for service provision.
In England, between January and December 2017, the use of mental health services was more common for younger people. Of the 1,733 people aged under 16, 397 (22.9%) were in contact with secondary mental health services (NHS Digital, 2018a).
In Scotland, community services for women with perinatal mental health conditions are limited. Only five of the 14 health boards offered a local specialist community mental health service in 2015. Stigma remained a significant barrier to women seeking help for postnatal mental illness, as was the fear that their baby would be taken into care (MWC, 2016d).
LGBT people – who have much higher rates of poor mental health – also have a much poorer experience of accessing mental health services in England and Wales (evidence from Stonewall and the Centre for Mental Health) (The House of Commons Committee of Public Accounts, 2016). Stonewall Scotland, The Equality Network and Scottish Transgender Alliance further highlighted (in consultation responses on the Scottish Government’s Mental Health Strategy in 2015/16), that LGBT people still felt discriminated against when accessing mental health services, and that their experience in accessing other health services can have a detrimental impact on their mental health (Scottish Government, 2016).
92 Including people with autistic spectrum disorders, acquired brain injury, a personality disorder label, a dual diagnosis (for example, a learning disability plus mental illness), or women and young people needing secure care.
Stigmaremainedasignificantbarrier to women seeking help for postnatal mental illness, as was the fear that their baby would be taken into care (MWC, 2016d)
Is Britain Fairer?
112 www.equalityhumanrights.com/britain-fairer
Health

As well as poorer access to services, there are large disparities in the way some ethnic minority groups experience mental health services and treatment (EHRC, 2016). For example, in England, Black Caribbean patients were more likely to be admitted to hospital than White patients once they had been seen by a Crisis Resolution and Home Treatment team (EHRC, 2016) and Black adults in the general population were the least likely to report being in receipt of any treatment (medication, counselling or therapy) (Cabinet Office, 2018). Having been referred to psychological therapies, both men and women in England were most likely to attain recovery if they were White (British, Irish or Other White) and least likely if they were Bangladeshi, Pakistani, or identified as Other Asian or the Other ethnic group (Cabinet Office, 2018).
There are considerable shortcomings in the provision of mental health services for children and young people (CAMHS) in Britain resulting in a number of access issues. In England, one-fifth of all children referred to local specialist NHS mental health services are not accepted for treatment (NSPCC, 2015a).93 There is often a period of no support when eligibility for CAMHS stops and children have to wait to access adult mental health services, with some children never making the transition (Young Minds, 2016). Young people are sometimes being discharged from services without a proper assessment. Around one in every 10 cases (9%) of children aged between 10 and 17 who fail to attend their appointment with a specialist mental health worker are discharged without a risk assessment (Children’s Society, 2015). There are long waiting lists for many of these services in the community and children and young people cannot always find an appropriate bed in an inpatient ward close to home (CQC, 2017).
In Wales, the total number of children and young people referred and waiting for treatment from CAMHS continues to increase – between 2010 and 2016 it experienced a 100% increase in demand for its services (Mental Health Foundation, 2016a). From October 2015/16, there was an increase of 16% in the number of referrals to CAMHS, compared with October 2014-15. There has been a 31% decrease in those waiting over four weeks and a 44% decrease in those waiting over 26 weeks (CYPE, 2017).
93 However, care needs to be taken in assuming that all referrals require NHS specialist help as it is not always necessary or appropriate for all children to be treated within a specialist service.
Having been referred to psychological therapies, both men and women in England were most likely to attain recovery if they were White
Is Britain Fairer?
113www.equalityhumanrights.com/britain-fairer
Health

In response to large numbers of rejected referrals to CAMHS, the Scottish Government commissioned an audit of CAMHS rejected referrals. Although the overall number of referrals to CAMHS increased, in 2017, the rejected referral rate was broadly stable at one in five since December 2016 (Scottish Government, 2017d). Findings from the audit94 show that decisions on rejecting referrals often happened quickly, with most decisions being made without a face-to-face assessment. Children, young people and their families expected that they would receive help after a referral. There was disparity between the number of rejected referrals being signposted, and signposting was reported as being too generic and unhelpful. Some young people whose referral had been rejected reported a belief that they would not be seen by CAMHS unless they were suicidal or at immediate risk of harm. There was a strong indication of a gap in services for children and young people who do not meet the criteria for the most specialist help.
Each year several young people from Scotland are transferred to specialist adolescent units in England, due to a national lack of provision. For example, in Scotland there is no inpatient provision at present for young people who have both significant mental health conditions and forensic needs95 and there is no inpatient provision for young people with a learning disability (Mental Welfare Commission, 2016b).
Quality and satisfaction
In England and Wales, the only detailed measure of people’s experience of mental health care is through the CQC survey of community mental health services (NHS England, 2016a). This was found to be inadequate following the CQC’s 2015 special inquiry into crisis care which showed that people’s experiences of mental health care across other settings were very mixed and should be tracked on a regular basis (CQC, 2015). There is also no measurement of people’s experience of inpatient mental health care, including secure care, despite the nature of compulsory treatment and the potential for those who are detained to be considered ‘at risk’.
94 The research was divided into two elements: qualitative and quantitative. The quantitative element examined data supplied by seven audit boards relating to 285 children and young people whose referrals to CAMHS were rejected during February 2018. The qualitative element used interviews, focus groups and an online survey, involving 363 people over the period December 2017 to April 2018.
95 Those who pose a risk of harm to others or who are in contact with the justice system.
There was a strong indication of a gap in services for children and young people who do not meet the criteria for the most specialist help
Is Britain Fairer?
114 www.equalityhumanrights.com/britain-fairer
Health

The Mental Health Foundation, VOX Scotland and the Scottish Government reviewed Mental Health Services in Scotland from the perspectives and experiences of service users, carers and professionals.96 There were numerous examples where respondents felt progress had been made. This included improvements to specific services (such as Advocacy, Crisis, and Specialist trauma services); improvements to diagnosis and early intervention; and better involvement and engagement with those who use services and who care for them. However, there were many areas that were regarded as requiring further development, particularly to support carers (Mental Health Foundation, 2016c).
5.5.3 Access to psychological therapiesEquality of access to psychological therapies remains an issue across Britain. There has been a significant expansion in access to psychological therapies in England, following the introduction of the national IAPT programme in 2008 (Improving Access to Psychological Therapies).97 However, 10 years on, NHS England acknowledges older people and ethnic minorities are under-represented among people who access IAPT therapies (NHS England, 2017).
In England, approximately 7% of those who complete a course of treatment are aged 65 or over (ONS suggests that approximately 12.5%–13% of people accessing IAPT services should be aged 65 or over (NHS England, 2017). In England 2016/17, IAPT referrals for White patients were more likely to have shown an improvement compared with other ethnic groups, and those for patients from the Asian or Other ethnic groups were the least likely to, particularly Bangladeshi, Pakistani, Other Asian or Other ethnic groups (for both men and women) (NHS Digital, 2018b).
In 2016, mental health charities continue to call for improved access to psychological therapies in Wales as people’s outcomes get worse the longer they have to wait to access treatment and support (RCGP, 2015). A 2016 Mind Cymru survey98 highlighted further barriers, such as patients not being offered any choice in the type of therapy received; no explanation of different types of therapies; and having to request psychological therapies, rather than being offered them (Mind Cymru, 2016b). Wales has not replicated the English IAPT programme and so there is no centralised reporting on the use of these services. While there has been an increase in local Cognitive Behavioural Therapy (CBT) based services, it has not been on the scale or level of systematic organisation that there has been in England, resulting in some areas being better equipped with mental health services than others and longer waiting times, particularly at a primary care level (Quality Compliance Systems, 2016). There is a lack of evidence on access to psychological therapies by protected characteristic.
96 The review took evidence from 384 participants with over half of the participants having a lived experience of using mental health services.
97 IAPT (Improving Access to Psychological Therapies) is run by the NHS in England and offers NICE-approved therapies for treating people with depression or anxiety. The programme began in 2008. Information is available on activity, waiting times and outcomes in the IAPT programme for England.
98 In a small study, based on survey responses from over 400 service users.
Is Britain Fairer?
115www.equalityhumanrights.com/britain-fairer
Health
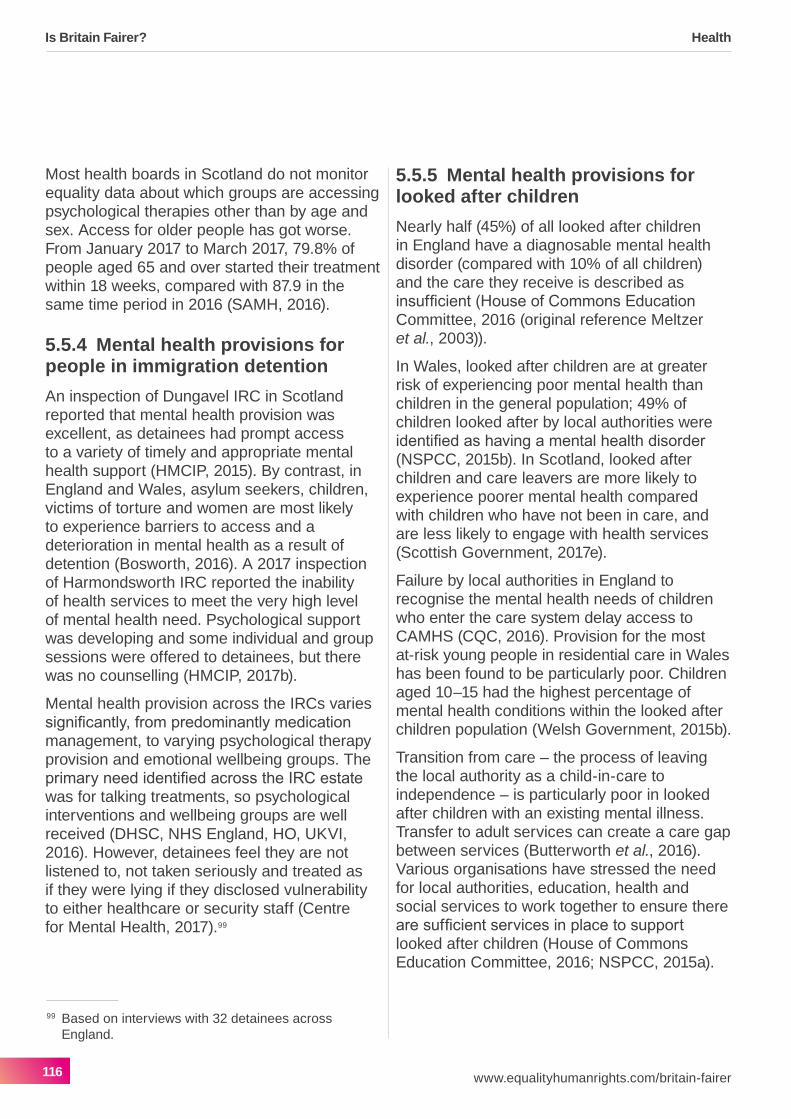
Most health boards in Scotland do not monitor equality data about which groups are accessing psychological therapies other than by age and sex. Access for older people has got worse. From January 2017 to March 2017, 79.8% of people aged 65 and over started their treatment within 18 weeks, compared with 87.9 in the same time period in 2016 (SAMH, 2016).
5.5.4 Mental health provisions for people in immigration detention An inspection of Dungavel IRC in Scotland reported that mental health provision was excellent, as detainees had prompt access to a variety of timely and appropriate mental health support (HMCIP, 2015). By contrast, in England and Wales, asylum seekers, children, victims of torture and women are most likely to experience barriers to access and a deterioration in mental health as a result of detention (Bosworth, 2016). A 2017 inspection of Harmondsworth IRC reported the inability of health services to meet the very high level of mental health need. Psychological support was developing and some individual and group sessions were offered to detainees, but there was no counselling (HMCIP, 2017b).
Mental health provision across the IRCs varies significantly, from predominantly medication management, to varying psychological therapy provision and emotional wellbeing groups. The primary need identified across the IRC estate was for talking treatments, so psychological interventions and wellbeing groups are well received (DHSC, NHS England, HO, UKVI, 2016). However, detainees feel they are not listened to, not taken seriously and treated as if they were lying if they disclosed vulnerability to either healthcare or security staff (Centre for Mental Health, 2017).99
5.5.5 Mental health provisions for looked after childrenNearly half (45%) of all looked after children in England have a diagnosable mental health disorder (compared with 10% of all children) and the care they receive is described as insufficient (House of Commons Education Committee, 2016 (original reference Meltzer et al., 2003)).
In Wales, looked after children are at greater risk of experiencing poor mental health than children in the general population; 49% of children looked after by local authorities were identified as having a mental health disorder (NSPCC, 2015b). In Scotland, looked after children and care leavers are more likely to experience poorer mental health compared with children who have not been in care, and are less likely to engage with health services (Scottish Government, 2017e).
Failure by local authorities in England to recognise the mental health needs of children who enter the care system delay access to CAMHS (CQC, 2016). Provision for the most at-risk young people in residential care in Wales has been found to be particularly poor. Children aged 10–15 had the highest percentage of mental health conditions within the looked after children population (Welsh Government, 2015b).
Transition from care – the process of leaving the local authority as a child-in-care to independence – is particularly poor in looked after children with an existing mental illness. Transfer to adult services can create a care gap between services (Butterworth et al., 2016). Various organisations have stressed the need for local authorities, education, health and social services to work together to ensure there are sufficient services in place to support looked after children (House of Commons Education Committee, 2016; NSPCC, 2015a).
99 Based on interviews with 32 detainees across England.
Is Britain Fairer?
116 www.equalityhumanrights.com/britain-fairer
Health

5.5.6 Deaths of mental health service users by suicideThere were 1,538 deaths by suicide by patients in contact with mental health services100 in the UK in 2015 – 28% of all deaths by suicide in the UK were of people who had been in contact with mental health services in the previous 12 months. This figure was similar for all countries of Britain but slightly higher in Scotland and lower in Wales. Deaths by suicide of mental health inpatients continue to fall (NCISH, 2017). Between 2009 and 2015 there were 5,119 ‘probable suicide’ deaths registered in Scotland by those aged five and over. In the 30 days before their death, 4.9% had been discharged from a mental health hospital, and 6.9% had a mental health outpatient appointment (NCISH, 2017).
5.5.7 Use of restraint of mental health service usersThe mental health charity Mind has reported on huge variations in the use of physical restraint in hospitals in England from 38 to 3,000 incidents (Mind, 2013). UK Government policy papers in England have set out the need for a reduction in the use of restraint and an end to face-down restraint. Some guidance related to face-down restraint has been changed to reflect this (Mind, 2015a).
In England in 2016/17, there was a disproportionate use of restrictive interventions for ethnic minorities. The rate of restrictive interventions is over three times higher for Black or Black British groups compared with White British in 2016/17 (NHS Digital, 2017a). Among people in contact with NHS funded secondary mental health, learning disabilities, and autism services, 9,771 were subject to a restrictive intervention.101 The standardised rate of people subject to restrictive intervention per 100,000 was highest in the Black or Black British group (52.1), followed by Mixed (39.5), Other ethnic groups (24.7), White (15.8), and Asian (13.0) (NHS Digital, 2017a).102
There is evidence that physical restraint is used most frequently in CAMHS, acute wards in learning disability services and psychiatric care. There were 382 recorded uses of face-down restraint in mental health services in Wales in 2014–15 (Mind, 2015b). There are no figures for use of restraint for Scotland. There are no figures for use of medication (as restraint) for Scotland or Wales. See Chapter 6 for further evidence on restraint.
100 People under mental health care, that is, they had been in contact with mental health services in the 12 months prior to death.
101 An intervention that is used to restrict the rights or freedom of movement of a person with a disability including chemical restraint, mechanical restraint, and seclusion.
102 Due to concerns regarding data quality these figures should be considered with caution.
Between 2009 and 2015 there were 5,119 ‘probable suicide’ deaths registered in Scotland by those agedfiveandover
Is Britain Fairer?
117www.equalityhumanrights.com/britain-fairer
Health

5.5.8 Use of mental health legislation and Community Treatment OrdersIn 2016/17, known rates of detention in the Black or Black British group were over four times those in the White group (272.1 per 100,000 compared with 67.0 per 100,000). Rates for other ethnic groups (179.6), Mixed (157.0), and Asian or Asian British (82.1) were also higher. Detention rates for ‘any other Black background’, which includes Black European or Black American, were over 10 times the rate of White group (NHS Digital, 2017b).
The independent review of the Mental Health Act interim report (2018) findings confirmed this trend and reported that Black Caribbean people were also more likely to come into contact with mental health services through the police, be given Community Treatment Orders (CTOs)103 (NHS Digital, 2017b), be admitted to secure hospital, and to have poorer health outcomes over time (Cabinet Office, 2018).
Among adults, detention rates tend to decline with age. In 2016/17 detention rates were higher for younger people aged 18–34 (111.3 per 100,000) than for those aged 50–64 (81.7 per 100,000 population). They were also higher for men (83.2 per 100,000) compared with women (76.1 per 100,000) (NHS Digital, 2017b). People with a learning disability and/or autism are sometimes detained because appropriate community support is unavailable and detentions in England under the Mental Health Act (MHA) can last for several years with no prospect of discharge (Independent Review of the Mental Health Act, 2018). See also Chapter 6.
Each year, around 1,000 mentally ill prisoners and immigration detainees are transferred to hospital in England and Wales under the MHA. The environment in prisons and immigration detention centres can negatively affect the experience of people with acute mental illness, and this affects the willingness of clinicians to recommend the remission of offenders back to prison (Independent Review of the Mental Health Act, 2018).
In spite of their initial uptake, CTO use appears to have declined in England over the past few years. During 2015/16, 4,361 CTOs were issued, a decrease of 4% compared with the previous year (4,564). In 2016/17 there was a further increase in use of 4,966 new CTOs, although these data are incomplete due to coverage issues (NHS Digital, 2017b).
In 2016/17, known rates of CTO use in England for men were almost twice the rate for women (11.4 compared with 6.6 per 100,000 population). Across age groups, those aged 35–49 had the highest rate of CTO use (15.6 known uses compared with 9.0 uses per 100,000 population for all age groups). Known rates of CTO use for the ‘Black or Black British’ group were almost nine times the rate for the White group (60.1 uses compared with 6.8 uses per 100,000 population) (NHS Digital, 2017b).
103 You may receive a Community Treatment Order (CTO) if you have been in hospital under the Mental Health Act. A CTO means you will have supervised treatment when you leave hospital.
Is Britain Fairer?
118 www.equalityhumanrights.com/britain-fairer
Health

In Wales, detention figures under the MHA have increased year-on-year since 2012/13. In 2016/17 there were 1,776 admissions under the Mental Health Act 1983 (excluding place of safety detentions), an increase of 44 (3%) from 2015/16. In 2016/17 there were 206 patients subject to Supervised Community Treatment (SCT) in Wales. Of this total, 117 were men and 89 were women. There is limited research and data relevant to the detention of people from different protected characteristics and their experiences of mental health care provision in Wales (Welsh Government 2018b).
In 2015/16, there were 1,366 CTOs issued in Scotland, an increase of 8% compared with 2014/15. The use of CTOs was higher for men (52%) compared with women (48%). The number of CTOs for young people aged 18 and under decreased (from 63 to 46) but remained higher for girls (78.3%) compared with boys (21.7%) (MWC, 2016b).
5.6 ConclusionWhile progress has been made in a number of areas, more needs to be done to make Britain a fairer society in terms of improving access to health services and improving outcomes for all.
Governments in England, Scotland and Wales have committed to making parity of esteem – valuing mental health equally with physical health – a priority. The need for major improvements to mental health service provision for children and young people has also been recognised, and governments have taken steps to achieve this.
Yet problems with timely and quality access to health services continue. Overall waiting and referral times are increasing. There are considerable barriers to accessing specialist services across Britain and some people still cannot register with a GP.
There continue to be greater barriers for the most disadvantaged in society; people with learning disabilities, disabled people, homeless people, migrants, asylum seekers and refugees and Gypsies, Roma and Travellers still experience the most significant barriers to accessing health services.
There continue to be stark disparities in the way some protected characteristic groups experience healthcare and this is reflected in their poorer health outcomes. A lack of data and published evidence continues to limit the ability of health services across the three countries to respond to their needs. People with protected characteristics (other than age or sex) and at-risk groups remain excluded from a range of national and local monitoring data. There is a particular a lack of reliable data collection and published evidence on:
– the LGBT community (particularly the transgender community)
– the health inequalities experienced by Gypsies, Roma and Travellers
– the health and healthcare needs of migrants, refugees and asylum seekers including immigration detainees
– access to healthcare services for disabled people and homeless people in Wales
– intersectional data for waiting and referral times and access to health services for ‘at-risk’ groups and disabled people with a range of impairment types, and
– the prevalence of illness in English and Welsh prisons, particularly mental health conditions.
Is Britain Fairer?
119www.equalityhumanrights.com/britain-fairer
Health

6. Justice and personal security
Justice enables people to live in security, knowing that they will be protected and treated fairly by the law.
Is Britain Fairer?
120 www.equalityhumanrights.com/britain-fairer
Justice and personal security

Keyfindings
Civil and criminal justice – Overall confidence in the justice systems of Britain remains high, but there is evidence of lower levels of confidence among some groups:
– Just 43% of disabled adults in England and Wales reported that the criminal justice system is effective, compared with an average of 53%.
– Only 54% of Black Caribbean adults in England and Wales reported that the criminal justice system is fair, compared with an average of 68%.
– Employment tribunal claims have increased substantially across Britain since the abolition of employment tribunal fees in July 2017, but are still below the levels seen before the fees were introduced.
– The volume of legal aid applications granted in England and Wales continues to fall, with evidence suggesting this has had a negative impact on people’s access to affordable advice and access to justice generally.
Violence and abuse – Increases in police recorded hate crime have been observed across all monitored hate crime strands in England and Wales, particularly for disability hate crimes. There has been a decrease in the number of racially aggravated charges recorded in Scotland.
– Homicide rates in England have reached their highest level since 2010/11, but remain low by historic standards.
– There has been a sharp increase in the number of sexual offences and domestic abuse related offences reported to, and recorded by, the police in England and Wales, including non-recent sexual offences against children.
– Those most at risk of sexual or domestic violence are women, LGB people and disabled people, particularly those with mental health conditions or learning disabilities.
Conditions of detention – Two-thirds of adult prisons are overcrowded in England and Wales, posing potential risks for prisoner safety.
– People from ethnic minorities continue to be over-represented in the adult prison population and within the youth secure estate in England and Wales, despite an overall decrease in the number of young people in custody.
– The use of police stations as a place of safety for people detained under the Mental Health Act has decreased considerably in England and Wales.
– There has been a considerable increase in self-harm and assault incidents in prisons across Britain and an increase in the rate of non-natural deaths among prisoners in England and Wales.
– The number of self-harm incidents requiring medical treatment in immigration detention settings almost trebled between 2011 and 2017.
Is Britain Fairer?
121www.equalityhumanrights.com/britain-fairer
Justice and personal security

6.1 IntroductionThis chapter explores the extent to which every individual has the right to access affordableandimpartiallegalinformationand advocacy, and to live without fear of violence or abuse. Justice enables people to live in security, knowing that they will be protected and treated fairly by the law.
Justice is administered in different ways across Britain, with one set of criminal and civil justice systems operating in England and Wales, and a separate system operating in Scotland.
This chapter examines developments across three areas related to justice and personal security:
– confidence in the criminal justice system, access to criminal and civil justice, including the provision of legal aid, and liaison and diversion services
– reporting, recording and convictions with regards to hate crimes, homicides, sexual offences and domestic abuse, and
– conditions of detention in a range of settings, including the safety of those detained and the use of force and restraint.
6.2 Key policy and legal developments
6.2.1 Civil and criminal justice Public confidence and trust
Public confidence and trust in the civil and criminal justice systems across Britain are crucial. Lack of trust in the justice system can affect how people engage with it, which in turn can lead to different outcomes.
The importance of trust across all areas of the criminal justice system was made particularly clear by the Lammy Review (2017). The review, covering England and Wales, highlighted that defendants from ethnic minorities are more likely to not trust the legal advice they receive and are more likely to plead not guilty than White defendants, owing to a lack of trust in the system. As a result, they are more likely to lose the potential benefits of early guilty pleas in criminal proceedings. In its response to the Lammy Review, the Government stated that it would explore approaches to improve the communication of legal rights and options to defendants (Ministry of Justice, 2017a).
Ethnic minorities are more likely to not trust the legal advice they receive and are more likely to plead not guilty than White defendants
Is Britain Fairer?
122 www.equalityhumanrights.com/britain-fairer
Justice and personal security

Access to courts and tribunals
The justice system in England and Wales has been affected by a substantial reduction in overall funding since 2010. Estimates suggest that the Ministry of Justice (MOJ) will have seen a cumulative 40% real-terms reduction in its budget by 2019/20.104 Substantial budget cuts have also taken place in Scotland, where the budgets of the Scottish Court Service and Crown Office and Procurator Fiscal Service (COPFS) were reduced by 28% and 14% respectively between 2010/11 and 2014/15 (Audit Scotland, 2015).
In 2016, the MOJ announced a programme to modernise the justice system in England and Wales, with the intention of producing a more proportionate and accessible justice system including greater use of ‘virtual’ court and tribunal hearings (Lord Chancellor et al., 2016). The UK Government also signalled its intention to close 86 court and tribunal buildings across England and Wales (MOJ and HMCTS, 2016).
The proposal to increase the use of video hearings is intended to improve efficiency and access to court services, but there is currently very limited evidence on how video hearings may affect people with protected characteristics. There is some evidence based on pilots to suggest that video hearings may disadvantage people with mental health conditions and/or learning disabilities (Gibbs, 2017). Where video hearings are not appropriate, we are concerned that court closures will make it harder for some people to access courts, including disabled people and those with caring responsibilities (EHRC, 2018).
The number of people making claims to employment tribunals reduced considerably after the introduction of employment tribunal fees. Employment Tribunals ‘Fees Order’ (2013) was introduced with the aim of transferring some of the costs of the system from taxpayers to system users to encourage early settlement and discourage unreasonable behaviour. In July 2017, the Supreme Court ruled that the Fees Order prevented access to justice and suggested that it was indirectly discriminatory (R v Lord Chancellor, 2017). This led to the abolition of fees for employment tribunals and a commitment to refund fees already paid, but the impact of the abolition is yet to be determined.
Legal aid
The Legal Aid, Sentencing and Punishment of Offenders Act (LASPO) 2012 continues to define the justice landscape in England and Wales. LASPO introduced changes to the scope of legal aid, eligibility for legal aid and the rates paid for legal aid work, resulting in a substantial fall in legal aid spend.
104 HC Deb 16 November 2017 c 112641W.
Is Britain Fairer?
123www.equalityhumanrights.com/britain-fairer
Justice and personal security

LASPO has been criticised from several quarters for its adverse impact on access to civil and criminal justice, especially among disadvantaged groups and people with protected characteristics (UNCERD, 2016; UNCESCR, 2016; UNCRC, 2016; UNCRPD, 2017). Concerns have been raised about the rise in self-representation (especially the lack of capacity within the system to support litigants in person, who may struggle to understand court procedures or their legal entitlements, leading to longer court cases as a result), growing pressure on legal advice providers and the appearance of ‘advice deserts’ (Law Society, 2017). The ineffectiveness of alternatives to legal aid, including the exceptional case funding (ECF) scheme, has also been highlighted as a key concern (Justice Committee, 2015).
Remuneration for criminal legal aid cases has also come under fire. In January 2018, the Law Society issued proceedings against the MOJ to challenge a decision to implement further cuts to legal aid, in a bid to reverse a cut to the Litigators’ Graduated Fee Scheme. In addition, the Criminal Bar Association called on its members to refuse instructions on all new legal aid cases, and to be prepared to go on strike, in reaction to proposed changes to the Advocates’ Graduated Fee Scheme (Criminal Bar Association, 2018).
In an initial assessment of LASPO, the MOJ concluded that it was difficult to establish whether or not the reforms had resulted in better value for money overall or to evaluate whether the objective to target legal aid at those who needed it most had been achieved (MOJ, 2017b). In March 2018, the MOJ announced a full review of the reforms introduced under LASPO (MOJ, 2018a).
In Scotland, a review of legal aid noted that legal aid spend per head was among the highest in the EU and has both the widest scope in terms of what it can be obtained for and who can receive assistance (Evans, 2018). It recommended that the legal aid system becomes simple, user-focused and flexible, as well as sustainable and cost effective. It did not look at solicitor and advocate fees, proposing a separate review is carried out.
6.2.2 Violence and abuseHate crimes
The need to strengthen measures to prevent hate crime and ensure appropriate prosecutions and convictions has been a key focus of UN human rights treaty bodies in recent years (UNCERD, 2016; UNCRPD, 2017). They have urged the UK and devolved governments to ensure the effective implementation of relevant legal and policy frameworks, introduce new awareness raising campaigns, improve reporting and provide victims with adequate support.
In January 2018, the Law Society issued proceedings against the MOJ to challenge a decision to implement further cuts to legal aid
Is Britain Fairer?
124 www.equalityhumanrights.com/britain-fairer
Justice and personal security

In 2016, the UK Government published an action plan on hate crime for England and Wales, which focused on prevention, response, reporting, support for victims and building an improved understanding of the causes and effects of hate crime (Home Office, 2016). While its aims are commendable, the action plan failed to outline the specific ways in which its aims would be achieved or how actions would be evaluated (Walters and Brown, 2016).
In Scotland, the Independent Advisory Group on Hate Crime, Prejudice and Community Cohesion (2016) published a series of recommendations, including calls for a review of whether existing criminal law provides sufficient protections for those who may be at risk from hate crime. It also called for improved monitoring of, and responses to, online hate crime and improved data collection in relation to hate crime more generally. The Scottish Government responded to the recommendations in June 2017 (Scottish Government, 2017a), and subsequently commissioned the Bracadale Review (2018), which has called for the introduction of new statutory aggravations based on gender and age hostility.
Sexual and domestic violence and abuse
In December 2015, controlling or coercive behaviour in intimate or familial relationships became a new offence in England and Wales under the Serious Crime Act 2015.105 Similar offences were introduced in Scotland specifically as part of the Domestic Abuse (Scotland) Act 2018. The Violence Against Women, Domestic Abuse and Sexual Violence (Wales) Act 2015 introduced provisions to improve arrangements for the prevention of gender-based violence, domestic abuse, sexual violence and for the protection and support of victims.
The UK and devolved governments are now working towards the ratification of the Council of Europe Convention on preventing and combating violence against women and domestic violence (the ‘Istanbul Convention’). One remaining barrier to ratification in England and Wales is in relation to Article 44 of the Convention, which would allow British offenders to be tried in a UK court for certain offences committed overseas. The UK Government has stated its aim to address this by introducing the necessary offences in the Domestic Abuse Bill, while Scotland has already introduced extra-territorial jurisdiction as part of the Domestic Abuse (Scotland) Act 2018. The latter made the abuse of a partner or ex-partner an aggravating factor for the sentencing of offences.
Criminal measures to address so-called ‘revenge porn’ have been introduced across Britain. In England and Wales, the Criminal Justice and Courts Act 2015 introduced an offence of the non-consensual disclosure of private sexual photographs or films with the intention of causing distress. Threats of disclosure are not covered, unlike a similar offence introduced by the Abusive Behaviour and Sexual Harm (Scotland) Act 2016.
105 The Serious Crime Act 2015 also amended the Female Genital Mutilation Act 2003 by introducing lifelong anonymity for FGM victims, creating an offence of failing to protect a girl from FGM, introducing FGM protection orders, extending the reach of various extra-territorial offences, and introducing a legal duty for health and social care professionals and teachers to report acts of FGM to the police for girls under the age of 18.
Is Britain Fairer?
125www.equalityhumanrights.com/britain-fairer
Justice and personal security

In 2016, the UK Government published a revised strategy to eliminate violence against women and girls (VAWG) in England (HM Government, 2016). The strategy aims to reduce all forms of VAWG and to increase reporting, police referrals, prosecutions and convictions. As of May 2018, there has been no announcement about how departments will report progress on this strategy.
Child abuse
Over the last 30 years there has been increasing concern about child abuse in the wake of high-profile cases and growing awareness of the scale of abuse previously hidden from public view.
The UK Government initiated the statutory Independent Inquiry into Child Sexual Abuse (IICSA) for England and Wales in March 2015. The purpose of the inquiry is to investigate whether public bodies and other non-state institutions have taken seriously their duty of care to protect children from sexual abuse in England and Wales. In October 2015, the Scottish Government started its own inquiry to investigate the abuse of children in residential care or foster care in Scotland (or where the care was arranged in Scotland). The Scottish Child Abuse Inquiry is not due to report before October 2019.
6.2.3 Conditions of detentionPrisons and the detained population
During the period under review, the MOJ set the ground for further expansion of the prison estate in England and Wales. In the 2015 Autumn Statement, the Chancellor announced a ‘prison building revolution’. The programme is to be part-funded through the closure and sale of older prison sites, including the largest women’s prison in Britain, HMP Holloway, which closed in 2016. In 2016, the Government also announced plans to recruit an additional 2,500 prison officers by the end of 2018 and had exceeded this target by March 2018 (MOJ, 2018b). But this still leaves the total headcount below 2010 levels.
In 2016, the MOJ made a commitment to publish a strategy in early 2017 aiming to reduce the number of female offenders who end up in custody and to improve the treatment of female offenders in custody and in the community (MOJ, 2016a). However, no further announcements have yet been made about the likely publication date for this strategy.
The Scottish Government has also sought ways to reduce the prison population, while addressing the recommendations made by the Commission on Women Offenders (2012) to improve outcomes for women in the criminal justice system. In 2017, the Scottish Government announced a new strategy focusing on recovery and reintegration and using prison only where necessary (Scottish Government, 2017b).
Is Britain Fairer?
126 www.equalityhumanrights.com/britain-fairer
Justice and personal security
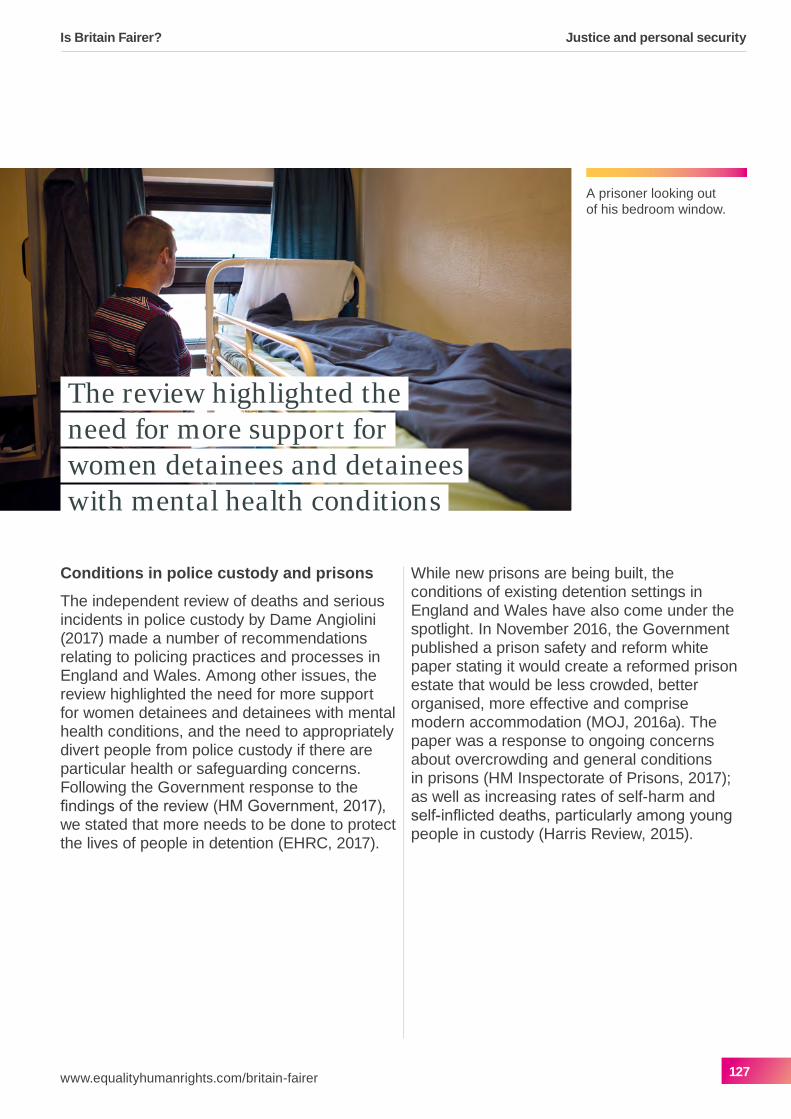
The review highlighted the need for more support for women detainees and detainees with mental health conditions
Conditions in police custody and prisons
The independent review of deaths and serious incidents in police custody by Dame Angiolini (2017) made a number of recommendations relating to policing practices and processes in England and Wales. Among other issues, the review highlighted the need for more support for women detainees and detainees with mental health conditions, and the need to appropriately divert people from police custody if there are particular health or safeguarding concerns. Following the Government response to the findings of the review (HM Government, 2017), we stated that more needs to be done to protect the lives of people in detention (EHRC, 2017).
While new prisons are being built, the conditions of existing detention settings in England and Wales have also come under the spotlight. In November 2016, the Government published a prison safety and reform white paper stating it would create a reformed prison estate that would be less crowded, better organised, more effective and comprise modern accommodation (MOJ, 2016a). The paper was a response to ongoing concerns about overcrowding and general conditions in prisons (HM Inspectorate of Prisons, 2017); as well as increasing rates of self-harm and self-inflicted deaths, particularly among young people in custody (Harris Review, 2015).
A prisoner looking out of his bedroom window.
Is Britain Fairer?
127www.equalityhumanrights.com/britain-fairer
Justice and personal security

Mental health
In 2017, the National Audit Office published a report criticising the UK Government’s efforts to improve the mental health and wellbeing of prisoners in England and Wales without having clear information on how many prisoners have mental health conditions and how much is being spent on mental health in prisons (NAO, 2017). This prompted an inquiry by the Committee of Public Accounts (2017) to investigate how reliable data would be secured and how the mental health needs of prisoners would be met. The Government agreed to most of the recommendations made by the Committee in its response (HM Treasury, 2018: 1-7).
The Policing and Crime Act 2017 for England and Wales introduced new limits on the use of the power to use police cells as a place of safety, under section 136 of the Mental Health Act 1983, for people experiencing a mental health crisis. This included stricter time limits and a ban on their use as a place of safety for children.
Confidenceinthecriminal justice system across Britain is up (2016/17).
Detention settings for children and young people
In 2016, the Youth Justice Board branded the young people’s secure estate in England and Wales as unfit for purpose and HM Chief Inspector of Prisons for England and Wales echoed these criticisms (HMCIP, 2017a).
The Taylor Review recommended that Young Offender Institutions (YOIs) and Secure Training Centres (STCs) be replaced by a network of secure schools with integrated services (Taylor, 2016). In response, the Government agreed to develop secure schools to test evidence-based approaches, although no official timeframe for the pilots has been set. The Government also committed to increase frontline staff in YOIs by 20%, and develop additional specialist teams to analyse and support the mental health and developmental needs of young people in custody.
Immigration detention
There is continued criticism of the UK for being the only EU country without a statutory time limit for the detention of immigrants (Shaw, 2016; Amnesty International, 2017).
The Shaw Review of the welfare of immigration detainees recommended that the Home Office extend the presumption against detention to include victims of rape and sexual violence, those with post-traumatic stress disorder, transgender people and those with learning difficulties, and recommended that pregnant women are never detained (Shaw, 2016). The review also raised concerns about the efficacy of Rule 35 in immigration detention settings and recommended that the Home Office immediately consider an alternative. The purpose of Rule 35 is to ensure that where there are particular health or safeguarding concerns, detainees are brought to the attention of those with direct responsibility for authorising, maintaining and reviewing detention.
Is Britain Fairer?
128 www.equalityhumanrights.com/britain-fairer
Justice and personal security
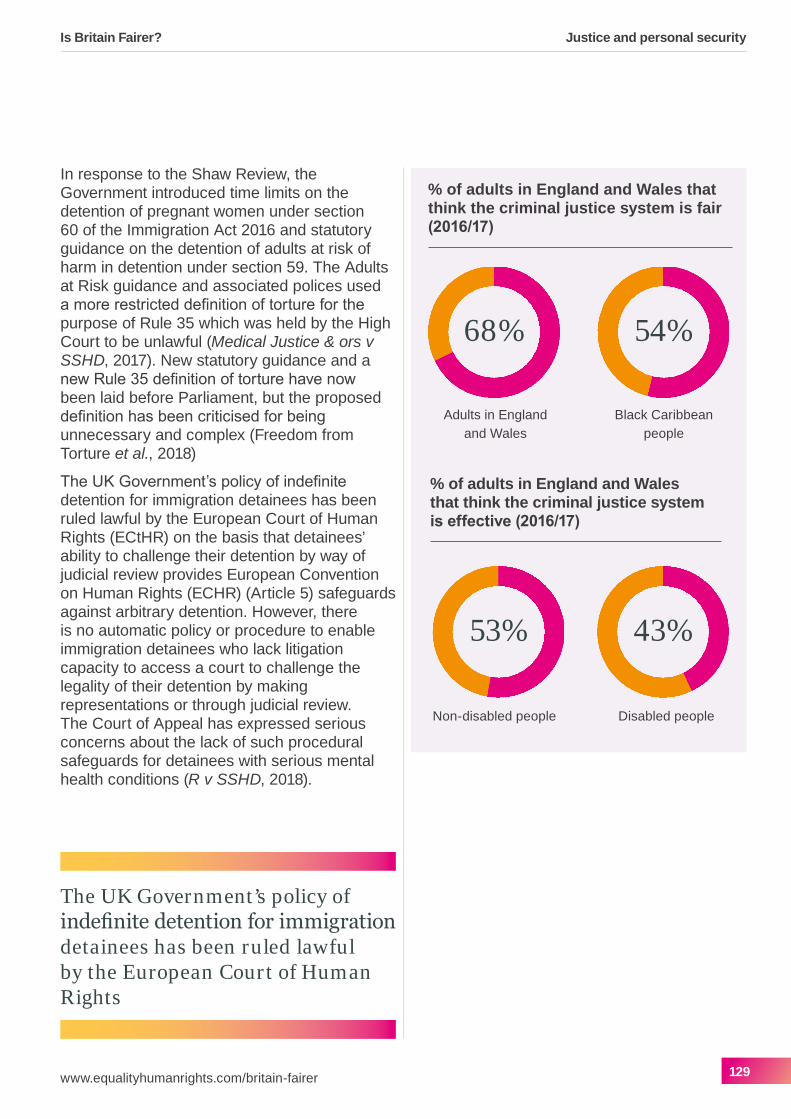
In response to the Shaw Review, the Government introduced time limits on the detention of pregnant women under section 60 of the Immigration Act 2016 and statutory guidance on the detention of adults at risk of harm in detention under section 59. The Adults at Risk guidance and associated polices used a more restricted definition of torture for the purpose of Rule 35 which was held by the High Court to be unlawful (Medical Justice & ors v SSHD, 2017). New statutory guidance and a new Rule 35 definition of torture have now been laid before Parliament, but the proposed definition has been criticised for being unnecessary and complex (Freedom from Torture et al., 2018)
The UK Government’s policy of indefinite detention for immigration detainees has been ruled lawful by the European Court of Human Rights (ECtHR) on the basis that detainees’ ability to challenge their detention by way of judicial review provides European Convention on Human Rights (ECHR) (Article 5) safeguards against arbitrary detention. However, there is no automatic policy or procedure to enable immigration detainees who lack litigation capacity to access a court to challenge the legality of their detention by making representations or through judicial review. The Court of Appeal has expressed serious concerns about the lack of such procedural safeguards for detainees with serious mental health conditions (R v SSHD, 2018).
The UK Government’s policy of indefinitedetentionforimmigrationdetainees has been ruled lawful by the European Court of Human Rights
% of adults in England and Wales that think the criminal justice system is fair (2016/17)
68%
Adults in England and Wales
54%
Black Caribbean people
% of adults in England and Wales that think the criminal justice system is effective (2016/17)
53%
Non-disabled people
43%
Disabled people
Is Britain Fairer?
129www.equalityhumanrights.com/britain-fairer
Justice and personal security

% of adults in Scotland who think those accused of crimes get a fair trial regardless of who they are (2016/17)
Scotland
78%
% of adults in Scotland who think that everyone has access to the justice system if they need it (2016/17)
75%
6.3 Criminal and civil justice: publicconfidenceandaccesstojustice
6.3.1 Public confidence in the criminal justice systemThe 2016/17 Crime Survey for England and Wales has reported that half (53%) of adults aged 16 and over are confident that the criminal justice system (CJS) as a whole is effective and about two-thirds (68%) are confident that the CJS as a whole is fair (ONS, 2017a). This represents an increase in public confidence since 2010/11, when these figures were 42% and 61% respectively. However, just 43% of disabled people (with a long-standing condition or illness that limits activities) in 2016/17 reported being confident that the CJS is effective and just 54% of Black Caribbean people reported being confident that the CJS is fair.
In our own analysis for 2015/16 (Table JPS.EFF.1), almost two-thirds of adults in England (66.3%) and Wales (64.9%) agreed that the CJS treats those who have been accused of a crime as ‘innocent until proven guilty’. Disabled people in England (62.3%) were less likely to agree than non-disabled people (67.1%), especially those with impairments relating to learning, understanding or concentrating (57.4%) or mental health (58.7%). Between 2010/11 and 2015/16, the percentage of disabled people agreeing with the statement decreased by 5.2 percentage points, compared with 1.3 percentage points for non-disabled people.
Is Britain Fairer?
130 www.equalityhumanrights.com/britain-fairer
Justice and personal security

Disclosure of evidence in criminal cases has come under increasing scrutiny in recent months, with the potential to undermine public confidence in the criminal justice system. Following the collapse of two rape cases in England due to evidence disclosure failures, criticisms were levelled at the police and CPS by senior members of the judiciary, prompting the CPS and police to issue a joint plan to deal with disclosure issues (National Police Chiefs Council et al., 2018).
In Scotland, approximately three in four people were confident that the system allows all those accused of crimes to get a fair trial regardless of who they are (78%) and treats those accused of crime as innocent until proven guilty (72%); and that everyone has access to the justice system if they need it (75%) (Scottish Government, 2018a). In 2014/15, these figures were 77%, 72% and 76%, respectively (Scottish Government, 2015).
6.3.2 Access to courts and tribunalsCourt and tribunal modernisation
Recent investment in the modernisation of the criminal and civil justice courts in England and Wales has been driven by the aim of using technology to enhance access to the justice system and to make the system more proportionate (Lord Chancellor et al., 2016). Some of the funding for this £1 billion programme of reform is being offset by the closure of court and tribunal buildings.
Over 100 court and tribunal buildings have closed since 2014.106 The impact on predicted travel times as a result of proposed closures was deemed to be minimal by the MOJ (2016b), but the analysis would have been stronger if it had included further evidence on court users with a range of protected characteristics, especially disabled people (EHRC, 2018).
Ten sheriff courts and seven Justice of the Peace courts were closed across Scotland between 2013 and 2016 (Scottish Courts and Tribunal Service, 2016), but no further closures have been announced since 2016. Data have shown that half of sheriff courts took longer to process summary criminal cases in 2016 than in 2015, potentially affecting the right of defendants to be tried without undue delay.
Tribunals and tribunal fees
Employment tribunal (ET) fees were introduced in July 2013 with discrimination claims attracting higher fees (Pyper et al., 2017). The fees led to a substantial fall in the subsequent number of claims accepted at ET, with a 68% decrease in single claim receipts from 55,225 in 2012 to 17,846 in 2014 (MOJ, 2018c).107 Figures such as these raised concerns that ET fees were deterring legitimate claims from accessing tribunals at the start of the review period.
106 HC Deb 29 January 2018 c 123668W.
107 ‘Employment tribunal claims are counted as received (receipts) once the relevant issue fee has been paid or remitted, and the tribunal has accepted the claim as valid. Claims in employment tribunals can be classified into either single or multiple claims. Single claims are made by a sole employee/worker, relating to alleged breaches of employment rights. Multiple claims are where two or more people bring proceedings arising out of the same facts, usually against a common employer […] The trend in multiple claims is more volatile than single claims due to large numbers of claims against a single employer which can skew the national figures’ (MOJ, 2018d, pp.7-8). Hence only single claim figures are quoted here.
Is Britain Fairer?
131www.equalityhumanrights.com/britain-fairer
Justice and personal security

The Supreme Court declared that the Employment Tribunal Fees Order was unlawful in July 2017 and this seems to have reversed the decline in claim receipts. In fact, the number of single claims received at ET increased to 23,708 in 2017 (MOJ, 2018c). Between 2014 and 2017, the number of single claims received at ET increased by 35% in England (reaching 20,816 in 2017), 41% in Wales (997) and 11% in Scotland (1,895), but the volumes are still far below the levels seen in 2012.
Translation and interpreting services
Court interpreters and translators play a vital role in helping people access justice. These services should always be available for those who are Deaf or have a hearing impairment, and available under certain circumstances for those who cannot understand English.
In England and Wales, the ‘success rate’108 for language interpreter and translation service requests gradually increased from 94.6% in 2014 to 97.4% in 2017.109 Improvements have been made across the various service types, with success rates of 99.2% for special services (including British Sign Language), 98.0% for standard language requests and 88.3% for languages without a Diploma in Public Service Interpreting (DPSI) in 2017 (MOJ, 2018e).110 The number of complaints for completed service requests decreased from 2,947 in 2014, to 2,061 in 2017, while the complaint rate decreased from 1.8% in 2014 to 1.4% in 2017 (MOJ, 2018e).
These figures indicate an improvement in the service provided at court in terms of volumes of service requests met. However, other than data on the number and type of complaints, there is currently no publicly available data on independent quality assurance of these services in England and Wales.111 In addition, there is no up-to-date information on interpretation services in Scotland other than those provided to ‘reserved tribunals’ in Scotland (which are included in MOJ statistics).
6.3.3 Liaison and diversion servicesLiaison and diversion (L&D) services are designed to support people through the early stages of the criminal justice pathway, refer them for appropriate health or social care, or enable them to be diverted away from the criminal justice system into more appropriate settings. This includes, but is not limited to, people with mental health conditions or learning disabilities and those with substance misuse problems.
108 The definition of the success rate has changed twice since 2013, but from 2017 onwards it has been calculated as the proportion of all service requests which are fulfilled (MOJ, 2018e).
109 The statistics cover face-to-face spoken and non-spoken language services provided to MOJ bodies including HM Courts and Tribunal Service and HM Prison and Probation Service. It covers all courts in England and Wales and tribunals in England, Wales and Scotland. Due to change in service providers in Q4 2016, robust comparison with earlier years of data is not possible. Although data pre-Q4 2016 are recognised as Official Statistics, data post-Q4 2016 are regarded as Provisional Statistics.
110 Special services comprise British Sign language, Deaf relay, Electronic notetaker, Lipspeaker, Sign Supported English, Speech-to-Text Reporter and Video remote interpreting. Standard languages are those listed in the language services framework as a standard language. Languages without DPSI are all those not listed as a standard language or under special services.
111 A new independent quality assurance service has been provided by The Language Shop since 31 October 2016 (MOJ, 2017c).
Is Britain Fairer?
132 www.equalityhumanrights.com/britain-fairer
Justice and personal security
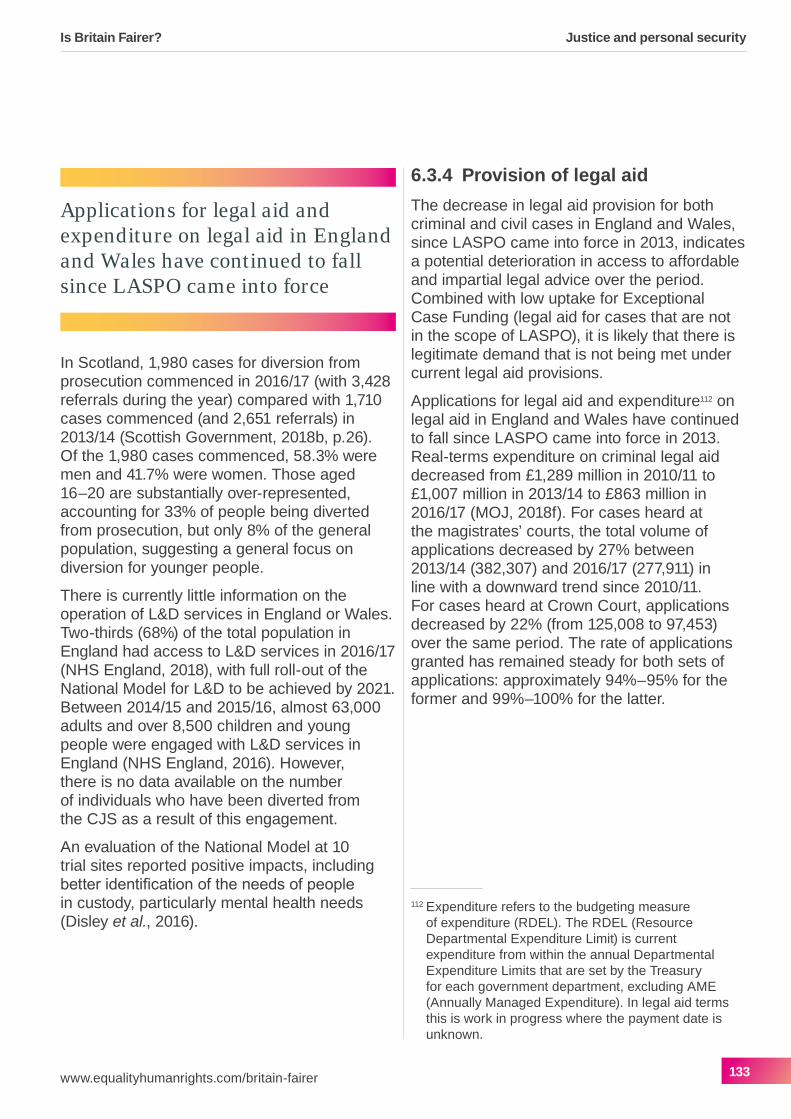
In Scotland, 1,980 cases for diversion from prosecution commenced in 2016/17 (with 3,428 referrals during the year) compared with 1,710 cases commenced (and 2,651 referrals) in 2013/14 (Scottish Government, 2018b, p.26). Of the 1,980 cases commenced, 58.3% were men and 41.7% were women. Those aged 16–20 are substantially over-represented, accounting for 33% of people being diverted from prosecution, but only 8% of the general population, suggesting a general focus on diversion for younger people.
There is currently little information on the operation of L&D services in England or Wales. Two-thirds (68%) of the total population in England had access to L&D services in 2016/17 (NHS England, 2018), with full roll-out of the National Model for L&D to be achieved by 2021. Between 2014/15 and 2015/16, almost 63,000 adults and over 8,500 children and young people were engaged with L&D services in England (NHS England, 2016). However, there is no data available on the number of individuals who have been diverted from the CJS as a result of this engagement.
An evaluation of the National Model at 10 trial sites reported positive impacts, including better identification of the needs of people in custody, particularly mental health needs (Disley et al., 2016).
6.3.4 Provision of legal aidThe decrease in legal aid provision for both criminal and civil cases in England and Wales, since LASPO came into force in 2013, indicates a potential deterioration in access to affordable and impartial legal advice over the period. Combined with low uptake for Exceptional Case Funding (legal aid for cases that are not in the scope of LASPO), it is likely that there is legitimate demand that is not being met under current legal aid provisions.
Applications for legal aid and expenditure112 on legal aid in England and Wales have continued to fall since LASPO came into force in 2013. Real-terms expenditure on criminal legal aid decreased from £1,289 million in 2010/11 to £1,007 million in 2013/14 to £863 million in 2016/17 (MOJ, 2018f). For cases heard at the magistrates’ courts, the total volume of applications decreased by 27% between 2013/14 (382,307) and 2016/17 (277,911) in line with a downward trend since 2010/11. For cases heard at Crown Court, applications decreased by 22% (from 125,008 to 97,453) over the same period. The rate of applications granted has remained steady for both sets of applications: approximately 94%–95% for the former and 99%–100% for the latter.
112 Expenditure refers to the budgeting measure of expenditure (RDEL). The RDEL (Resource Departmental Expenditure Limit) is current expenditure from within the annual Departmental Expenditure Limits that are set by the Treasury for each government department, excluding AME (Annually Managed Expenditure). In legal aid terms this is work in progress where the payment date is unknown.
Applications for legal aid and expenditure on legal aid in England and Wales have continued to fall since LASPO came into force
Is Britain Fairer?
133www.equalityhumanrights.com/britain-fairer
Justice and personal security

Real-terms expenditure on civil legal aid decreased from £1,125 million in 2010/11 to £859 million in 2013/14 to £646 million in 2016/17 (MOJ, 2018f). The total number of applications for civil representation decreased by 38% between 2010/11 (187,592) and 2016/17 (116,401) with little change since 2013/14 (117,573). Although the percentage of applications granted reached 93.3% in 2016/17 (an increase of 11.2 percentage points since 2010/11), the total number of applications granted in 2016/17 (108,790) was 29% lower than the total granted in 2010/11 (154,017) before LASPO was introduced (Table JPS.EFF.2).
The 2012 legal aid reforms introduced the mandatory Civil Legal Aid (CLA) Gateway as the only way to obtain publicly funded advice and assistance for debt, discrimination and special educational needs matters. The volume of cases handled by the CLA Operator Service decreased by 43% from 53,479 in 2013/14 to 30,370 in 2016/17.113 Over the same period, the volume of cases referred to CLA specialists decreased by 40% from 7,268 to 4,373. In 2016/17, very few of these cases were then referred to face-to-face advice for debt or special education needs matters and none were referred for discrimination matters.
The legal aid landscape in Scotland differs considerably from that of England and Wales, with very little change to the legal aid budget in recent years. The percentage of legal aid applications granted has also changed very little in recent years: 93.5% of legal aid applications received were granted in 2016/17 compared with 92.9% in 2010/11 (Table JPS.EFF.2).
6.4 Violence and abuse: hate crimes, homicides, and sexual and domestic abuse
6.4.1 Hate crime and identity-based harassmentHate crime is defined as any criminal offence which is perceived, by the victim or any other person, to be motivated by hostility or prejudice towards someone based on a personal characteristic (Crown Prosecution Service, 2016).114 There are five centrally monitored strands of hate crime across Britain: race, religion, sexual orientation, disability and transgender identity.115
113 HC Deb 7 November 2017 c 111874W.
114 The police, Crown Prosecution Service and other agencies that make up the criminal justice system agreed a common definition of monitored hate crime in 2007, which covered five ‘strands’ (HM Government, 2012).
115 Since 2008, all police forces in England and Wales have been required to record and measure hate crime offences across all five strands of hate crime. Individual forces can choose to monitor additional strands. For example, Nottinghamshire Police has recorded and treated misogyny as a hate crime. The Offences (Aggravation by Prejudice) (Scotland) Act 2009 introduced three newer categories of hate crime (disability, sexual orientation and transgender identity) in addition to the existing legislation on racially and religiously aggravated offences. The Crown Office and Procurator Fiscal Service (COPFS) has published data on all five categories of hate crime since 2010/11.
The volume of cases handled by the CLA Operator Service decreased by 43% from 53,479 in 2013/14 to 30,370 in 2016/17
Is Britain Fairer?
134 www.equalityhumanrights.com/britain-fairer
Justice and personal security

In 2016/17, the percentage of respondents to the Crime Survey for England and Wales (CSEW) who self-reported experiencing one or more hate incidents in the previous 12 months (Table JPS.VNT.1) was 0.3% in England, but higher for those aged 16–24 (1.1%).116 It was higher for disabled people (0.7%) than non-disabled people (0.2%), especially those with mental health conditions (1.8%).
Between 2010/11 and 2016/17, the percentage who self-reported experiencing one or more hate incidents in the previous 12 months decreased by 0.3 percentage points in England. The decrease was greater among those aged 16–24 (0.7 percentage points) and for those from ethnic minorities (1.2 percentage points) than for White people (0.2 percentage points).
The number of offences recorded by the police as hate crimes in England and Wales for 2016/17 (80,393) was almost twice that recorded in 2013/14 (44,577) (Home Office, 2017a).117 Increases were recorded for all five monitored strands over this period. Action taken by police forces in England and Wales to improve their recording practices, together with greater awareness of hate crime and improved willingness of victims to come forward, are likely to be factors in the increase in recorded hate crime offences since 2013/14 (Home Office, 2017a).
Despite the increase in police recorded hate crimes, estimates based on the 2014/15 CSEW suggest that only 48% of hate crime is reported to the police, while research from the University of Leicester found that only 24% of victims reported their most recent hate crime experience to the police (Chakraborti et al., 2014).118 A number of issues were identified as barriers to reporting: some victims feel that the police would not take the incident seriously or could not have done anything, while others feel that it is a private matter (Chakraborti et al., 2014). But there are also structural barriers, such as a lack of trust in the criminal justice system, as discussed above, which may prevent people from reporting such incidents.
Of the hate-crime flagged offences recorded in England and Wales in 2016/17, just 16% resulted in a charge/summons. There were evidential difficulties in 42% of offences and for 32% of offences, investigations were completed without a suspect identified (Home Office, 2017a). The Crown Prosecution Service (CPS) completed 14,480 hate crime prosecutions in England and Wales in 2016/17 – similar to the number recorded in 2013/14 (14,074 completed prosecutions). The ‘conviction rate’119 across all strands of hate crime remained unchanged at 83% (CPS, 2017a).120
116 This measure counts those who report that they think a criminal incident, which occurred in the last 12 months, was motivated by their identity.
117 Statistics based on police recorded data have been assessed against the code of practice for official statistics and found not to meet the required standard for designation as National Statistics. This applies to all police recorded data for England and Wales presented in this section.
118 The research involved 1,421 participants including 1,106 survey respondents.
119 The conviction rate is defined by the CPS as the percentage of criminal cases brought which result in a conviction.
120 The CPS collects data to assist in the effective management of its prosecution functions. The CPS does not collect data which constitute Official Statistics as defined in the Statistics and Registration Service Act 2007. This applies to all CPS data presented in this section.
Is Britain Fairer?
135www.equalityhumanrights.com/britain-fairer
Justice and personal security

The number of hate crime charges recorded by the Crown Office and Procurator Fiscal Service in Scotland decreased by 61 incidents from 5,386 charges in 2010/11 to 5,325 charges in 2016/17 (COPFS, 2017).121
Race and religion hate crimes
Most hate crimes recorded in England and Wales (85%) in 2016/17 were based on race or religion, including racially or religiously aggravated offences defined by statute (Table JPS.VNT.2). The number of race hate crimes recorded by the police in England and Wales increased by 67% from 2013/14 to 2016/17 (Home Office, 2017a). Over the same period, there was a 163% increase in recorded hate crimes motivated by religion.
The number of racially aggravated offences recorded by the police in Scotland decreased by 27% from 2,712 in 2013/14 to 1,993 in 2016/17 (Scottish Government, 2017c). However, these do not account for other crimes which might have had a racial motivation.122
The Community Security Trust (2018) recorded a 17% increase in anti-Semitic incidents between 2014 and 2017 in Britain, with a total of 1,382 anti-Semitic incidents in 2017. Tell MAMA (2017) documented 642 ‘offline’ anti-Muslim incidents in 2016, compared with 437 incidents in 2015. A recent survey of Gypsies, Roma and Travellers in the UK found that 77% (153 out of 199) had experienced hate speech or hate crime (Traveller Movement, 2017).
There is some evidence to suggest that there are ‘spikes’ in and following trigger events such as terrorist attacks and the EU referendum (Awan and Zempi, 2016; Miller et al., 2016). Increasing attention has also been paid to allegations of Islamophobic and anti-Semitic attitudes within the major political parties.
The increase in online abuse has been highlighted as a potential issue for the recording and monitoring of hate crime in Britain. Voluntary sector organisations such as the Community Security Trust (2018) and Tell MAMA (2017) have noted that their figures do not and cannot reflect the number of hate incidents and potential crimes perpetrated on social media, but rather just those incidents reported to them.123
Despite the increase in hate crimes recorded by the police in England and Wales, the volume of racially or religiously aggravated hate crime referrals from the police to the CPS decreased by 11%, from 12,071 in 2014/15 to 10,706 in 2016/17 (CPS, 2017a). In addition, the volume of completed prosecutions in 2016/17 (12,004) was similar to that in 2013/14 (12,368). The conviction rate for racially or religiously aggravated hate crimes in England and Wales remained steady at 83%–85%. The proportion of successfully completed prosecutions with a recorded sentence uplift (which the CPS can apply for to increase the length of a sentence) was 55.8% in 2016/17: an increase of 43.8 percentage points from 2014/15.
121 The repeal of the Offensive Behaviour at Football and Threatening Communications (Scotland) Act 2012 means that there is a discontinuity in the time series of figures between 2016/17 and 2017/18. Figures for all categories of hate crime may be higher in 2017/18 than they otherwise would have been.
122 The Scottish Government also publishes a bulletin on racist incidents recorded by the police in Scotland, but data were not available for 2014/15 onwards at the time of publication. No police recorded data are available for other hate crime strands in Scotland.
123 Many voluntary sector organisations – including the Community Security Trust and Tell MAMA – act as third party reporting centres, which help ensure that victims or witnesses are able to report hate crimes or incidents. Staff at these centres are trained to provide advice and support to victims of hate crime.
Is Britain Fairer?
136 www.equalityhumanrights.com/britain-fairer
Justice and personal security

In Scotland, three-quarters (76%) of hate crime charges in 2016/17 were racially or religiously aggravated charges (COPFS, 2017). Charges recorded for racially motivated hate crimes decreased by 20% from 4,178 charges in 2010/11 to 3,349 in 2016/17, in line with a long-term downward trend. Religiously aggravated charges increased by 14% from 591 charges in 2013/14 to 673 in 2016/17, but were lower than in 2010/11 (694 charges).
Sexual orientation, disability and transgender identity hate crimes
In 2016/17, the police in England and Wales recorded 9,157 sexual orientation hate crimes, 5,558 disability hate crimes and 1,248 transgender identity hate crimes (Home Office, 2017a). There was a sharp increase in all three monitored strands compared with 2013/14: 100% for sexual orientation, 175% for disability and 123% for transgender identity.
The Home Office (2017a) has suggested that increases in hate crimes reported in England and Wales were due to more people coming forward to report, and better identification and recording of hate crime offences by police forces. However, evidence from the voluntary sector suggests that these increases may also reflect an increase in incidents.
In Scotland, the number of charges reported with an aggravation of prejudice relating to disability increased from 48 in 2010/11 to 188 in 2016/17, and those relating to sexual orientation increased from 452 to 1,075 over the same period (COPFS, 2017). The number of charges relating to transgender identity increased from 14 to 40 over the same period.
Research by Stonewall found that two in five trans people (41%) in Britain have experienced a hate crime or incident because of their gender identity in the last 12 months (Bachmann and Gooch, 2017). It also found that 16% of LGB people in Britain have experienced a hate crime or incident in the last 12 months due to their sexual orientation, compared with 9% in 2013. This suggests that there has been considerable under-reporting of hate crimes and incidents (Hardy and Chakraborti, 2017).
In 2015, a joint review of disability hate crime by three inspectorates found that insufficient progress had been made in the way that the police, CPS and probation trusts in England and Wales had dealt with disability hate crime following a previous review in 2013 (HM Crown Prosecution Inspectorate Service et al., 2015).
In 2016/17, the police in England and Wales recorded 9,157 sexual orientation hate crimes (Home Office,2017a)
Is Britain Fairer?
137www.equalityhumanrights.com/britain-fairer
Justice and personal security

6.4.2 HomicidesThe term ‘homicide’ covers the offences of murder, manslaughter (including corporate manslaughter) and infanticide in England and Wales, and all crimes of murder and culpable homicide in Scotland.
In 2016/17, 709 homicides were recorded in England in Wales, including 96 cases of manslaughter that resulted from events at Hillsborough in 1989, compared with 521 homicides in 2013/14 and 633 homicides in 2010/11 (ONS, 2018a).124 Not including the Hillsborough deaths, the incidence rate for homicide in England and Wales was 10.5 per million population in 2016/17 compared with an incidence rate of 9.1 per million population in 2013/14, making it the highest rate since 2010/11 (when it was 11.4 per million population). The rate was more than twice as much among adult men (15.0 per million) than women (6.1 per million).
In Scotland, the number of victims of homicide decreased from 100 victims in 2010/11 to 64 victims in 2016/17 (Scottish Government, 2017d). There has been a corresponding decrease in the homicide rate from 21.4 per million in 2010/11 to 13.6 per million in 2016/17, largely driven by fewer homicides among those aged under 35 years (Table JPS.VNT.3A).
There were 58 homicide victims under the age of 16 years recorded by the police in 2016/17 in England and Wales, excluding the Hillsborough deaths, compared with 56 in 2010/11 (ONS, 2018a). There were three homicide victims aged under 16 in Scotland in 2016/17, compared with seven in 2010/11 (Scottish Government, 2017d).
As in previous years, the most common method of killing for both male and female victims was by a knife or other sharp instrument, with 215 such homicides (30% of the total) recorded in England and Wales in 2016/17 compared with 204 in 2013/14 (ONS, 2018a). This is the highest number of such offences since 2010/11.
6.4.3 Sexual violence and abuse The number of sexual offences recorded by the police across Britain has increased in recent years, but under-reporting is still recognised as a considerable issue. Findings from the 2016/17 CSEW suggest that 83% of victims of rape or assault by penetration (including attempts) do not report their experiences to the police.
Between 2013/14 and 2016/17, the number of sexual offences recorded by the police increased by 89% in England and Wales (to reach 121,450) and by 26% in Scotland (to reach 10,822) (ONS, 2018b; Scottish Government, 2017c). Increases were also recorded for the number of rapes recorded by the police in England and Wales (41,186 in 2016/17 compared with 20,751 in 2013/14) and Scotland (1,878 in 2016/17 compared with 1,808 in 2013/14, including attempted rapes).
124 The 2010/11 figure includes 12 victims of Derrick Bird.
Is Britain Fairer?
138 www.equalityhumanrights.com/britain-fairer
Justice and personal security

% of people who experienced domestic violence and abuse in England (2016/17)
England
7.4%Women
4.3%Men
13.8%Disabled
4.9%Non-disabled
21.8%Mental healthimpairments
21.5%Learning,understanding,or concentratingimpairments
10.6%Mixedethnicity
6.1%White
2%Asian
11.9%LGBT
5.5%Heterosexual
% of people who experienced domestic violence and abuse in Wales (2016/17)
Wales
7.6%Everyone
13.8%16-24 year olds
18.6%LGBT
7.3%Heterosexual
25.9%Visualimpairments
17.2%Mental healthimpairments
20.3%Learning,understanding,or concenratingimpairments
7.2%Non-disabled
Is Britain Fairer?
139www.equalityhumanrights.com/britain-fairer
Justice and personal security

% of people who experienced domestic violence and abuse in Scotland (2014/15)
Scotland
3.0%Everyone
3.5%Women
2.4%Men
4.1%Disabled
2.8%Non-disabled
It has been suggested that increases in recorded sexual violence and rape have been driven by both improved police recording processes and increased willingness of victims to report crimes in Scotland, England and Wales.
The CSEW provides a more reliable estimate of the number of individuals who have experienced sexual assault in the last year, in England and Wales, than police recorded crime data because it is less affected by changes in police activity, police recording practices or the propensity of victims to report such crimes. According to the 2016/17 survey, 3.1% of women and 0.8% of men aged 16 to 59 experienced a sexual assault (including attempts) in the last year, compared with 2.7% and 0.7%, respectively, in 2014/15 (ONS, 2018b). It has not been possible to determine any changes in the level of experience of sexual assault within the CSEW.
The percentage of women in England and Wales who had experienced rape or assault by penetration (including attempts) in the last year was estimated to be 0.9%, compared with 0.5% among men. The percentage among full-time female students was much higher: one in 20 (5.0%) according to the 2016/17 CSEW (ONS, 2018b).
In 2016/17, the percentage of adults (aged 16 or over) who experienced rape or assault by penetration in the previous 12 months (Table JPS.VNT.4) was 0.5% for England, but higher for those aged 16–24 (1.3%). It was substantially higher for disabled people (1.3%) than for non-disabled people (0.4%), and particularly so for those with impairments affecting mental health (2.5%) or learning, understanding or concentrating (2.8%). It was much higher for LGB people and those with other sexual orientations (3.3%) than for heterosexual people (0.4%).
The percentage of women in England and Wales who had experienced rape or assault by penetration (including attempts) in the last year was estimated to be 0.9%
Is Britain Fairer?
140 www.equalityhumanrights.com/britain-fairer
Justice and personal security

The number of completed prosecutions in England and Wales for rape and other sexual offences increased between 2013/14 and 2016/17. Conviction ratios for sexual offences excluding rape increased over this period from 58.3% to 66.8%.125 Conviction ratios for rape increased from 32.3% to 38.0%. In Scotland, the conviction rate for sexual crimes (69%) remained broadly stable in 2016/17 compared with 2014/15, but the conviction rate for rape and attempted rape was much lower (Scottish Government, 2018c).
6.4.4 Domestic violence and abuseAs with hate crimes and sexual offences, it is widely recognised that domestic abuse continues to be under-reported. More domestic violence and abuse offences are committed than are reported to and recorded by the police, including among same-sex couples.
In England and Wales, almost half a million (488,049) domestic abuse related offences were recorded by the police in 2016/17, up by 16% from the previous year (ONS, 2017b).126
In Scotland, 58,810 incidents of domestic abuse were recorded by the police in 2016/17 (Scottish Government, 2017e). The rate of domestic abuse incidents recorded by the police in 2016/17 (109 per 10,000 population) was similar to the rate recorded in 2014/15 (112 per 10,000 population).
In 2016/17, the percentage of adults (aged 16 or over) who experienced domestic violence and abuse127 in the previous 12 months (Table JPS.VNT.5) was 5.8% in England, but higher for those aged 16–24 (8.1%) and higher for women (7.4%) than men (4.3%). It was higher for disabled people (13.8%) than non-disabled people (4.9%), particularly for people with impairments affecting learning, understanding or concentrating (21.5%) or mental health (21.8%). It was also higher for those of mixed ethnic backgrounds (10.6%) than either White people (6.1%) or Asian people (2.0%). It was more than double for LGB people and those with other sexual orientations (11.9%) than for heterosexual people (5.5%).128
Between 2013/14 and 2016/17, the percentage of adults who experienced domestic violence and abuse in England in the previous 12 months decreased by 0.6 percentage points and decreased by 0.9 percentage points for women.
125 The MOJ defines conviction ratios as the number of offenders convicted as a proportion of the number prosecuted, in a given time period.
126 Due to changes in data collection, these figures cannot be compared with earlier years.
127 This includes domestic abuse (prevented them from having a fair share of the money, stopped them from seeing friends/relatives, belittled them to the extent they felt worthless), threats to hurt or kill them or someone close to them, use of force, indecent exposure and unwanted touching, serious sexual assault (rape/assault by penetration including attempts) or stalking (in a variety of senses) from a partner, ex-partner or family member.
128 Similar data were not available for Scotland for the period under review.
Is Britain Fairer?
141www.equalityhumanrights.com/britain-fairer
Justice and personal security

In 2016/17, the percentage of adults who experienced domestic violence and abuse in the previous 12 months was 7.6% in Wales, but higher for those aged 16–24 (13.8%). It was more than double for LGB and other people (18.6%) than for heterosexual people (7.3%). It was higher for those with impairments affecting vision (25.9%), mental health (17.2%) and learning, understanding or concentrating (20.3%) than for non-disabled people (7.2%). But it had declined by 5.6 percentage points between 2010/11 and 2016/17 for non-disabled people.
Despite a long-term increase in the number of prosecutions and convictions for crimes flagged as domestic abuse cases across Britain, the CPS recorded a decrease in the number of police referrals, prosecutions and convictions between 2015/16 and 2016/17 for domestic abuse in England and Wales (ONS, 2017b). The total number of completed prosecutions in 2016/17 (93,590) was similar to the total in 2014/15 (92,779) but lower than in 2015/16 (100,930). The conviction rate increased slightly from 73.9% in 2014/15 to 75.7% in 2016/17 (3.8 percentage points higher than in 2010/11). Although this was the highest volume of cases ever convicted, it still accounts for only a fraction of the recorded incidents (as highlighted above).
In Scotland, there were 10,830 domestic abuse convictions in 2016/17, which is 26% higher than in 2010/11 (8,566 convictions). Most people convicted were men (88%) (Scottish Government, 2018c).
Voluntary sector organisations have called for greater consideration of the links between domestic abuse victimisation and offending by women in Government strategies, sentencing guidelines and police responses (Prison Reform Trust, 2017a). Organisations have also highlighted the lack of specialist services available, particularly for women from ethnic minorities, disabled women and LGBT survivors (Sisters For Change, 2017; Women’s Aid, 2018). The current model for funding specialist domestic and sexual violence services has been described as not fit for purpose (APPG on Domestic and Sexual Violence, 2015).
6.4.5 Crimes against childrenAcross Britain, there was a substantial increase in the number of sexual offences against children (under the age of 16 years) reported to, and recorded by, the police in 2016/17 compared with 2013/14. The rate of sexual offences per 10,000 children (under the age of 16) increased from 21.8 to 41.3 in England, from 26.6 to 51.1 in Wales and from 34.0 to 45.0 in Scotland (NSPCC, 2018).129 These figures are likely to include a high number of historical sexual abuse offences.
129 Comparisons should not be made between countries due to differences in data collection practices and coverage.
The current model for funding specialist domestic and sexual violence services has been describedasnotfitforpurpose
Is Britain Fairer?
142 www.equalityhumanrights.com/britain-fairer
Justice and personal security

The NSPCC (2018) has suggested that improved recording of child sexual offences by the police and increased willingness of victims and survivors to come forward have contributed to increases in police-recorded crime and subsequent prosecutions. The NSPCC has identified a range of improvements, from social workers working with more children on child protection plans and registers, to more members of the public calling NSPCC’s helpline for advice or to report concern. High-profile inquiries, including the Independent Inquiry into Child Sexual Abuse (IICSA), and increased scrutiny of police are likely to be associated with the improvements in England and Wales.
Although there were increases in both England and Wales in the number of cruelty and neglect offences across this period, there was a decrease in Scotland. According to the CPS (2017b), record numbers of convictions in England and Wales were completed in 2016/17 for both child abuse (8,999) and child sexual abuse (5,374).
6.5 Conditions of detention
6.5.1 Detained populationPrison population by sex
There were 85,513 prisoners in different types of establishments in England and Wales at 31 March 2017. Most (81,353) were male, accounting for 95% of the prison population (MOJ, 2017d).
In 2016, there were 1.8 adults (aged 15 or over) per 1,000 population in prison in England and Wales and 1.7 adults per 1,000 population in Scotland (Table JPS.DTN.2). The rate was much higher among men (with a rate of 3.4 across Britain) than women (0.2 across Britain).
The impact of imprisonment on women has received much attention. Women are imprisoned further from home than men, on average, and are much more likely to be primary carers, with children far more directly affected by a prison sentence as a result (Prison Reform Trust, 2017b).
The Scottish Government announced a new justice strategy in 2017, acknowledging that female imprisonment grew at a faster rate in the decade to 2012 than for men and noting the benefits of women’s community justice services (Scottish Government, 2017b). In 2016/17, there were 7,185 men and 366 women across all types of custody in Scotland. According to the Scottish Prison Service (SPS), the population of men and women in custody have both fallen steadily from their peak levels in 2011/12, decreasing by 7% and 22%, respectively (SPS, 2017a).
A longstanding issue for Wales is the lack of prisons, or appropriate alternatives, for both women offenders and high-risk offenders130 (Welsh Affairs Committee, 2015). At the same time, there are growing concerns about the impact of maternal imprisonment on the rights and wellbeing of the children affected, especially in cases where mothers are imprisoned far from home (Minson, 2017).
130 Categorisation of prisoners in England and Wales centres around an assessment of risk and particularly the risk (and potential consequences) of escape (Garton Grimwood, 2015). Categorisation in Scotland works in a broadly similar way.
Is Britain Fairer?
143www.equalityhumanrights.com/britain-fairer
Justice and personal security

The reported number of incidents of self-harm in prisons increased between 2015/16 and 2016/17 in Scotland
Scotland
429305
2015/16 2016/17
Both serious and minor assaults between prisoners increased between 2014/15 and 2016/17
Scotland
Serious assaults
662014/15
742016/17
Minor and no injury assaults
1,7672014/15
2,1362016/17
Prison population by age
The proportion of older prisoners has gradually increased in England and Wales (HMCIP, 2017a) and in Scotland (HMIPS, 2017). Between 2013 and 2016, the rate per 1,000 population in prison decreased for young people (under the age of 25), but increased by 0.5 per 1,000 for those aged 30–39 and by 0.4 per 1,000 for those aged 50–59 in England and Wales (Table JPS.DTN.2). In Scotland, the rate per 1,000 decreased by 1.4 per 1,000 between 2010 and 2016 for those aged 16–30, especially among men (by 2.6 per 1,000). There was an increase in the rate for men aged 31–40 and for men aged over 70 (0.9 per 1,000 and 0.1 per 1,000 respectively).
These changes have been linked with an increase in men convicted of non-recent sexual offences and the imposition of longer sentences (HMIPS, 2017). Older people are more likely to experience physical or mental health conditions, so this demographic shift has presented additional challenges for those responsible for the health and wellbeing of prisoners (HMCIP, 2017a; HMIPS, 2017). (The health and wellbeing of prisoners is also discussed in Chapter 5.)
The number of children and young people detained in custody has steadily declined. In England and Wales, an average of 868 children and young people aged 10–17 were in custody 2016/17, compared with 2,040 during 2010/11 (a 57% decrease) (MOJ and YJB, 2018). The number of young people under the age of 21 years in the Scottish prison population decreased by 52% between 2010/11 (865) and 2016/17 (416) (SPS, 2017a).
Is Britain Fairer?
144 www.equalityhumanrights.com/britain-fairer
Justice and personal security

In 2016/17, the rate of children held in the youth secure estate was 20.0 per 10,000 population in England and Wales, compared with 14.0 in Scotland (Table JPS.DTN.3). The rate was much higher for boys (37.9 per 10,000) than girls (1.2 per 10,000) in England and Wales. Between 2010/11 and 2016/17, the rate of children held in the youth secure estate decreased by 25.6 per 10,000 population in England and Wales, with a considerably greater decrease for boys (46.5) than for girls (3.7).
Although fewer young people are being held in the youth secure estate overall, the proportion of young people from ethnic minorities in custody in England and Wales rose from 32% in 2010/11 to 45% in 2016/17 (MOJ and YJB, 2018).
Prison population by race/ethnicity
Most prisoners in England and Wales are White or White British but there are stark racial disparities, as highlighted by the Lammy Review (2017). Over 20,000 adults in prisons across England and Wales are from ethnic minorities, representing around a quarter of the overall prison population. But if the ethnicity of the prison population and the general population were similar, 9,000 fewer people from ethnic minorities would have been in prison in 2015 (Kneen, 2017).
Black or Black British men and women are particularly over-represented in the prison population. Black people make up 3% of the general population but 12% of prisoners in England and Wales (Lammy Review, 2017). Moreover, 43.5% of Mixed Ethnic and 42.6% of Black defendants at Crown Court were remanded in custody in 2017, compared with 36.2% of Asian defendants and 35.8% of White defendants (MOJ, 2017e).
In Scotland, the rate per 1,000 adults (aged 15 or over) in prison in 2016 was much higher for Black/African/Caribbean people (3.1 per 1,000) than White people (1.7 per 1,000), and much higher for White people than Indian (0.4 per 1,000), Pakistani (0.3 per 1,000) or Chinese (0.4 per 1,000) people (Table JPS.DTN.2).
Detentions under the Mental Health Act
Under section 136 of the Mental Health Act 1983, the police in England and Wales may remove people from where they are and take them to a ‘place of safety’ if they appear to be ‘suffering from mental disorder’ and it is considered that their behaviour poses an imminent risk of serious injury or death to themselves, or to another person. Similar powers exist in Scotland under the Mental Health (Care and Treatment) (Scotland) Act 2003.
In 2015/16, the rate of adults (aged over 16) per 100,000 detained under the Mental Health Act (Table JPS.DTN.4) was 79.5, and the rate was greater among men (85.9) than women (73.4), in England and Wales. Between 2012/13 and 2015/16, the rate of adults per 100,000 detained under the Mental Health Act decreased by 31.1 per 100,000, with a greater decrease recorded among men (41.7) than women (21.0).
The use of police custody as a place of safety is also declining and restrictions on its use were introduced in 2017. In 2016/17, a police cell was used as a place of safety 1,015 times in England and Wales (Home Office, 2017b), compared with 4,537 times in England and Wales in 2014/15 (NPCC, 2015). In Scotland, the use of police cells as a place of safety has changed little. Police stations were used as a place of safety 58 times in 2016/17 (5% of the total), compared with 60 times in 2013/14 (9% of the total) (Mental Welfare Commission for Scotland, 2018). Additionally, there were 17 occasions on which the second place of safety was a police station, usually due to the discovery of a weapon or breach of the peace.
Is Britain Fairer?
145www.equalityhumanrights.com/britain-fairer
Justice and personal security

Immigration detention
Fewer migrants are entering immigration detention overall. However, children are still entering the system despite a 2010 Government pledge to end the detention of children. According to the Home Office (2018), 27,289 adults and 42 children entered detention in 2017 (while 28,200 adults and 44 children left detention). This represents a decrease of 10% since 2014, when 30,364 people entered detention (including 128 children) and are the lowest levels since 2011.
In 2010, the Government announced changes which would mean that families with children are no longer detained in Immigration Removal Centres (IRCs), but may be detained in ‘pre-departure accommodation’ for a maximum of 72 hours (unless there are exceptional circumstances). Government policy also maintains that unaccompanied children should only be detained under exceptional circumstances, but should not be detained in IRCs under any circumstances (McGuinness and Gower, 2017).
The UK remains the only EU member with no limit on the length of time it can detain people subject to immigration controls. People are detained in the UK for months and even y ears, in contrast to the six-month time limit (extendable up to a further 12 months) set under the EU Returns Directive, which the UK has opted out of. In 2017, 225 of the 28,244 people leaving detention that year had been detained for over one year, 31 had been detained for over two years and one had been detained for over four years (Home Office, 2018). In 2014, by contrast, 161 of the 29,674 people leaving detention that year had been detained for over one year, 27 had been detained for over two years and one had been detained for over four years.
Military detention abroad
In October 2015, the Intelligence and Security Committee (ISC) within the UK Parliament stated that it would prioritise its substantial inquiry into the role of the UK Government and Security and Intelligence Agencies in relation to detainee treatment and rendition. The ISC published two special reports on this issue in June 2018 (ISC, 2018a; 2018b).
One of the recommendations made by the ISC was for the Government to proactively consult with non-governmental organisations and with us on a review of the Consolidated Guidance on the interviewing of detainees overseas and the exchange of intelligence on detainees. The aim of the Guidance has been to ensure that our Security and Intelligence Agencies are not, and will not be, involved in torture or mistreatment in the name of the UK.
The UK remains the only EU member with no limit on the length of time it can detain people subject to immigration controls
Is Britain Fairer?
146 www.equalityhumanrights.com/britain-fairer
Justice and personal security

6.5.2 Overcrowding and conditions of detentionConditions in prisons
A high proportion of prisons in England and Wales are overcrowded, particularly privately managed prisons in England, and this poses potential risks for prisoner safety. In June 2017, two-thirds of prisons in England and Wales (75 out of 116) were operating with crowded conditions, based on their populations exceeding their usable ‘certified normal accommodation’ (Coleman, 2017).131 The situation is different in Scotland, where just two of the fifteen prisons are overcrowded.
The crowding rate132 in English and Welsh prisons has remained relatively stable since 2003/04, with an average of one in four prisoners (24%–26%) held in overcrowded conditions up to 2016/17 (MOJ and HMPPS, 2017). The crowding rate in male local prisons was 48% in 2016/17: the highest for any type of establishment. Women’s prisons in England are less crowded than most male establishments, but the crowding rate in female local prisons increased from 8.3% in 2015/16 to 13.5% in 2016/17. This increase seems to have been driven largely by the closure of HMP Holloway. Most prisoners in HMP Holloway were moved to HMP Downview or HMP Bronzefield, where the crowding rate increased from 1.4% in 2015/16 to 14.3% in 2016/17. The closure had an emotional and mental health impact on many women who were in Holloway until its closure and for those who were from London, it is now costlier and more difficult for their families to visit them in prison (Cain, 2018).
Overcrowding can have a negative impact on the physical and mental health of prisoners (van Ginneken et al., 2017). Combined with staff shortages, this has consequences for the safety and dignity of prisoners (HMCIP, 2017a).
Rates of self-harm in prisons have risen significantly in the last five years, as discussed below, suggesting that mental health and overall wellbeing in prison has declined (Committee of Public Accounts, 2017). But the lack of effective screening measures means that there are no reliable estimates of the number of prisoners with mental health conditions. There is evidence to suggest that individuals from ethnic minorities are less likely to be identified with mental health conditions or learning disabilities on reception at prison (Lammy Review, 2017).
131 The CNA is the Prison Service’s own measure of accommodation and represents the decent standard of accommodation that the Prison Service aspires to provide all prisoners.
132 In England and Wales, prison crowding is measured by the MOJ as the number of prisoners held in a cell, cubicle or room in which the number of occupants exceeds the uncrowded capacity. For example, this means that two prisoners held in a single occupancy cell, or three prisoners held in a cell designed for two, are said to be crowded.
Is Britain Fairer?
147www.equalityhumanrights.com/britain-fairer
Justice and personal security

Conditions affecting transgender prisoners
The Women and Equalities Committee (2016) looked at the issues affecting transgender prisoners as part of their wider report on transgender equality. The Committee said there was a clear risk of harm where transgender prisoners are not located in appropriate prison settings with reasonable adjustments. It also noted the lack of reliable data on the numbers of transgender people in the criminal justice system.
Since 2016, the National Offender Management Service (NOMS) has been collecting more data on transgender prisoners in England and Wales. In March-April 2017, 47 of the 124 public and private prisons in England and Wales reported that they had one or more transgender prisoners (MOJ, 2017d), compared with 33 in March-April 2016 (MOJ, 2016c). These prisons reported that there were 125 prisoners currently living in, or presenting in, a gender different to their sex assigned at birth and who had had a local transgender case board. Of these prisoners, 99 reported their gender as male, 23 reported their gender as female and three did not state their gender. Twelve reported being from an ethnic minority background.
In November 2016 NOMS published a revised policy on transgender prisoners in England and Wales (NOMS, 2016). The Government acknowledged that the treatment of transgender people in the criminal justice system had not kept pace with wider social views. The new policy guidelines state that all transgender prisoners must be allowed to express the gender with which they identify, irrespective of whether or not their prison is consistent with their gender.
In Scotland, policy guidelines state that the social gender in which the prisoner is living should be fully respected, regardless of whether or not they have a gender reassignment certificate (SPS, 2014). The Scottish Prison Service reported that there were 18 transgender prisoners in November 2017 (SPS, 2017b).
Conditions in the youth estate
Despite the long-term decline in the number of under-18s detained in youth custody in England and Wales, there are concerns about conditions in the youth estate (Taylor, 2016). A recent report by HM Chief Inspector of Prisons (2017a) highlighted the endemic nature of violence and intimidation in Young Offender Institutions (YOIs) in England and Wales, with 39% of boys having reported feeling unsafe at their YOI at some point, compared with 29% in 2013/14.
HM Chief Inspector of Prisons reported that children in custody felt unsafe and that time out of cell was limited. The Inspectorate also found that there has been a general decline in conditions in Secure Training Centres (STCs). No STC was judged to be sufficiently safe, with high levels of violence, poor management of behaviour and overuse of force identified as key issues (HMCIP, 2017a). However, recent inspection reports suggest that improvements are appearing in some parts of the youth estate, particularly YOIs (HMCIP, 2017b; 2018a; 2018b).
Is Britain Fairer?
148 www.equalityhumanrights.com/britain-fairer
Justice and personal security

Conditions in immigration removal centres
A number of reports have highlighted inadequate conditions in immigration removal centres (IRCs), with concerns raised about the wellbeing of detainees. An investigation by BBC Panorama highlighted serious issues with the running of Brook House immigration removal centre, including bullying among staff and of detainees; allegations of assault, racial abuse and mocking of detainees by G4S staff; cases of self-harm and attempted suicide among detainees; and failure to report incidents of control and restraint or refusal to eat. This prompted a Home Affairs Committee inquiry into the running of Brook House.
Several observers have called for sweeping changes to the way IRCs are run owing to concerns on issues such as restraint, segregation, post-traumatic stress disorder and the management of complex health conditions (Shaw, 2016; Helen Bamber Foundation, 2017; British Medical Association, 2017). Issues have been identified with the accuracy and timeliness of health assessments, the availability of services, staff shortages and ensuring continuity of care.
6.5.3 Non-natural deathsDeaths in prisons
In 2017, the rate of non-natural deaths (including self-inflicted deaths, homicides and other non-natural deaths) per 1,000 prisoners was 1.30 for England and Wales, compared with 1.15 in 2014 and 0.81 in 2011 (MOJ, 2018g).
There were 70 recorded self-inflicted deaths in 2017 in England and Wales, of which most (68 out of 70) were male prisoners. The number of self-inflicted deaths in 2017 represents a decrease from the previous year, following a steady rise from 58 in 2011 to a peak of 122 in 2016 (MOJ, 2018g). Despite the decrease, the number of deaths in custody is still a serious concern and raises questions about the treatment of prisoners with mental health conditions, as highlighted by the National Audit Office (2017).
Most self-inflicted deaths in England and Wales (86%) were among White or White British prisoners, who accounted for 73% of prisoners in 2017 (MOJ, 2018h). The rate of self-inflicted deaths in the male estate (0.83 per 1,000 prisoners) was higher than the rate in the female estate (0.50 per 1,000 prisoners) (MOJ, 2018g).
The deaths of two transgender female prisoners in late 2015, both housed in the male estate, drew further attention to the treatment of transgender prisoners (Prisons and Probation Ombudsman, 2017). Following a review of the care and management of transgender offenders (MOJ, 2016d), NOMS issued refreshed guidance effective from the start of 2017 (NOMS, 2016).
There were 70 recorded self-inflicteddeathsin2017inEnglandand Wales, of which most (68 out of 70) were male prisoners
Is Britain Fairer?
149www.equalityhumanrights.com/britain-fairer
Justice and personal security

In Scotland, all deaths in prison trigger a Fatal Accident Inquiry (FAI). These can take several years to return a determination on the cause of death and make it difficult to look at trends over time. In 2017, there were three confirmed deaths by suicide: all male prisoners and all on remand. As of 31 May 2018, there were 32 deaths where the FAI had not yet concluded (SPS, 2018a; 2018b).
Deaths in police custody
In 2016/17, the Independent Office for Police Conduct (IOPC) investigated a number of deaths in, or following, police custody in England and Wales. This included 14 deaths in or following police custody (compared with 21 in 2010/11), 55 deaths by apparent suicide (compared with 46 in 2010/11) and 124 other deaths following police contact (compared with 57 in 2010/11) (IOPC, 2017). These mainly involved cases in which concerns were raised with the police either directly or indirectly about the safety or wellbeing of the deceased before their death.
According to the Police Investigations and Review Commissioner (PIRC), there were three deaths in police custody and 19 following police contact in Scotland in 2016/17 (PIRC, 2017). There were two deaths in police custody in 2014/15 and 2015/16. There were also eight deaths following police contact in 2014/15 and 12 in 2015/16 (PIRC, 2015; 2016).
Deaths of immigration detainees
According to figures based on INQUEST casework and monitoring, nine immigration detainees died in England and Wales in 2017 (INQUEST, 2018). This is the highest number of deaths it has reported in any given year.
There were six deaths of immigration detainees in immigration removal and detention centres in England and Wales in 2017, compared with three in 2016, two in 2015 and three in 2014.133 Four of the 2017 deaths have been reported by INQUEST as self-inflicted, with two awaiting classification. INQUEST also reports that there were three self-inflicted deaths of immigration detainees held in prisons in England and Wales in 2017. None were recorded in 2015 or 2016 and one self-inflicted death was recorded in 2014.
133 Of the three deaths recorded by INQUEST in 2016, one is reported as homicide, one is reported as non-self-inflicted and one is awaiting classification. Of the two recorded in 2015, one is reported as self-inflicted and one is reported as non-self-inflicted. Of the three deaths recorded in 2014, one is reported as self-inflicted and two are reported as non-self-inflicted. (These figures were last updated by INQUEST in April 2018.)
There were six deaths of immigration detainees in immigration removal and detention centres in England and Wales in 2017
Is Britain Fairer?
150 www.equalityhumanrights.com/britain-fairer
Justice and personal security

6.5.4 Safety of those detainedSelf-harm and assaults in prisons
Recorded self-harm in prisons in England and Wales reached a record high of 44,651 documented incidents in 2017 (MOJ, 2018i). There were 300 self-harm individuals per 1,000 prisoners in the female estate compared with 295 in 2011. The rate almost doubled in male establishments, from 69 in 2011 to 128 self-harm individuals per 1,000 prisoners in 2017.
In Scotland, the reported number of incidents of self-harm in prisons increased between 2015/16 and 2016/17 from 305 to 429. Female prisoners in Scotland are disproportionately likely to be involved in incidents of self-harm: 22% in 2015/16, increasing to 26% in 2016/17 (SPS, 2017c). It is not clear whether this is a consequence of improvements in reporting processes or increasing numbers of self-harm incidents.
The number of recorded assault incidents in England and Wales also reached a new high of 29,485 in 2017, including over 21,000 prisoner-on-prisoner assaults and over 8,000 assaults on staff (MOJ, 2018i). The number of prisoner-on-prisoner assaults per 1,000 male prisoners increased from 145 in 2011 to 251 in 2017. Over the same period, the rate doubled from 110 to 204 in female establishments.
In Scotland, both serious and minor assaults between prisoners increased between 2014/15 and 2016/17, from 66 to 74 serious assaults, and 1,767 to 2,136 minor and no injury assaults (SPS, 2016; 2017d). Most prisoners reported no fear for their safety (85%) and most had not experienced bullying in the last month (84%) (SPS, 2017e).
The rate of self-harm incidents, per 1,000 male prisoners, in England and Wales
692011
1282017
Self-harm in immigration detention
The number of self-harm incidents requiring medical treatment in immigration detention settings almost trebled between 2011 and 2017, increasing from 156 to 446 (No-Deportations, 2015; 2018). Despite fewer people entering immigration detention, 2,272 individuals were formally at risk of self-harm in 2017, compared with 1,695 individuals in 2011 (No-Deportations, 2015; 2018).
29,485The number of recorded assault incidents in detention in England and Wales in 2017 – a new high.
Is Britain Fairer?
151www.equalityhumanrights.com/britain-fairer
Justice and personal security

6.5.5 Use of force and restraintPolice and prison settings
In England and Wales, the IOPC expressed concerns about police use of force in nearly a third of investigations over a five-year period. And the European Committee for the Prevention of Torture (2017) noted that there were no reliable data on the use of force or means of restraint available from police forces in England and Wales during its last visit to the UK, or consistency in the approaches used.
In 2016, there were 11,294 uses of Taser by police – a 12% increase from 2014 (10,062 uses).134 The increase in use is due to a 16% rise in non-discharges, alongside a 4% fall in the number of discharges (Home Office, 2015; 2017d).135
Concerns have also been raised about the use of spit hoods136 by the police (European Committee for the Prevention of Torture, 2017), particularly on young people (Children’s Rights Alliance in England, 2016). Spit hoods were used on at least 12 children in England in 2015, while at least 24 children in England were hooded in the first nine months of 2016 (CRAE, 2016).137
HM Chief Inspector of Prisons (2017a) found high levels of force used on prisoners in England and Wales and significant gaps in the governance of use of force in two-thirds of prisons reported on in 2016/17. In half the prisons inspected, the inspectorate had concerns about the quality of documentation used to justify the use of force. Documentation and video footage did not always provide adequate evidence that the use of force was necessary or proportionate to the risk posed.
There is also concern about the use of force and restraint in health settings (see also Chapter 5). Research based on Freedom of Information requests found that girls were more likely to be restrained in a face-down (prone) position than boys in mental health settings in England, while adult women were more likely to be repeatedly restrained face down (Agenda, 2017).
134 Some police forces were unable to supply data for all types of Taser use prior to 2014 (Home Office, 2017c), hence no comparisons have been made with pre-2014 data.
135 Discharge is defined as firing or holding a Taser against a person’s body to deliver an incapacitating effect or cause pain. Non-discharge includes situations where a Taser is not fired but is drawn or aimed, produces a red dot (using the targeting mechanism without firing), or arced (sparking the Taser without having a target) (Home Office, 2017c).
136 A spit hood is a bag made of mesh-like material, with a drawstring to tighten it, which is put over the head to prevent an individual from spitting, biting or other acts of aggression.
137 Seventeen police forces in England were using spit hoods in 2015 and 10 of those responded to the Freedom of Information request from CRAE.
Is Britain Fairer?
152 www.equalityhumanrights.com/britain-fairer
Justice and personal security

6.6 ConclusionWhile confidence in the criminal justice system remains high in England and Wales, and Scotland, evidence suggests that some groups, such as disabled people or some people from ethnic minorities, are much less likely to have trust in the CJS.
Evidence also suggests that access to criminal and civil justice is at risk of being undermined by recent developments. This is particularly the case in relation to legal aid reforms, which have reduced access to affordable advice, and court and tribunal closures. By contrast, the abolition of employment tribunal fees in 2017 has begun to have a positive effect on employment tribunal application numbers.
Since 2015, there has been a considerable increase in the number of hate crimes, sexual offences and domestic abuse incidents reported to the police. But under-reporting and mis-recording remain key issues.
For sexual and domestic abuse incidents, there is a considerable lack of data on the experiences of disabled survivors, LGBT survivors and survivors from ethnic minorities. CSEW evidence suggests that those most at risk are women, disabled people and LGB people. And while conviction rates have remained steady or improved slightly for some offences, conviction rates for rape offences are still 5.6 percentage points lower than they were in 2012/13.
People from ethnic minorities are still over-represented throughout the criminal justice system, but more positive trends are appearing in other areas. For example, there are fewer young people in custody and there has been a decline in the use of police cells as a place of safety. But there is also clear evidence to suggest that conditions in detention have worsened since 2010. Most prisons in England and Wales are overcrowded, while incidents of self-harm in prisons and immigration detention settings have increased in recent years.
Since 2015, there has been a considerable increase in the number of hate crimes, sexual offencesanddomesticabuseincidents reported to the police
Is Britain Fairer?
153www.equalityhumanrights.com/britain-fairer
Justice and personal security

7. Participation Participation in decision making and in communities is important toenableapersontoinfluencethedecisionsthataffectthemindifferentareasoflife.
Is Britain Fairer?
154 www.equalityhumanrights.com/britain-fairer
Participation

Keyfindings
Political and civic participation and representation – There was an increased voter turnout between the 2015 and 2017 General Elections, but younger people and ethnic minorities are still less likely to take part in political activities, to be on the electoral register, or to vote. In Scotland 16 and 17 year olds now have the vote.
– Prisoners released on temporary licence will now be permitted to vote in UK elections.
– Women remain under-represented among local election candidates and in public appointments, and in England and Wales there remains a lack of disabled and ethnic minority magistrates.
Access to services – Transport services are at risk of becoming less accessible for disabled and older people, because of reductions in bus services and inconsistency of government public transport policy.
– Being older, a disabled person, or living in a rural area remain risk factors for digital exclusion, although personal internet use is improving among those groups. In Wales and Scotland, there continue to be areas of digital exclusion in rural areas.
– Fewer older people, disabled people, women and those from lower socio-economic groups access cultural and leisure services.
Privacy and surveillance – Internet use in Britain is increasing while the number of people who do not share information online is few and declining, therefore the potential impact from breaches of privacy online is increasing.
– There is uncertainty around the extent to which the UK Government’s bulk powers of surveillance, particularly regarding the retention of communications data and its use, are compliant with human rights law.
Social and community cohesion – Feelings of trust and belonging to one’s local area tend to be lower among ethnic minorities, younger people, those from lower socio-economic backgrounds or who are economically excluded, and for those living in urban areas.
– Recent public discourse and policy-making around social cohesion has focused predominantly on the exclusion of ethnic minorities while evidence suggests other groups are also at risk from isolation including young people, LGBT groups, disabled people and older people. However, there is little evidence on what works to foster social and community cohesion.
Is Britain Fairer?
155www.equalityhumanrights.com/britain-fairer
Participation

7.1 IntroductionParticipation in decision making and in communities is important to enable a persontoinfluencethedecisionsthataffectthemindifferentareasoflife.
Accessing services and forming relationships with freedom and autonomy also enables people to live their lives to the fullest. Where this comes under threat, for example because the right to privacy is not respected, or where a person faces disproportionate barriers to getting involved politically, this undermines the foundation of our democracy.
This domain includes voting and involvement in formal public life, as well as participation in civic organisations such as trade unions. Our evidence highlights barriers and inequalities when people access services such as transport, leisure, culture and sport, finance, banking and insurance. We have also monitored privacy and surveillance (including the collection, use, tracking, retention and disclosure of personal data), social cohesion and neighbourhood trust.
7.2 Political and civic participation and representation
Key policy and legal developmentsVoting
The UK Government has taken some steps to tackle democratic exclusion and has outlined how it will increase participation among under-registered groups through a Democratic Engagement Plan (UK Government, 2017a).
In March 2018 the Houses of Parliament passed Government proposals for changes to anonymous voter registration to make it easier for domestic abuse survivors across Britain to register to vote anonymously. The changes came into force in England, Wales and Northern Ireland on 7 March 2018, and in Scotland on 1 April 2018 (UK Government, 2017b; 2018a). The changes include broadening the sorts of professionals able to provide verification of the abuse, and expanding the type of evidence that can be put forward.
The UK Government ran voter ID pilots in five local authorities in England during the 2018 local government elections, which required voters to present personal identification before casting their ballot (UK Government, 2018b). These trials aimed to deal with ‘personification’, although personification numbers are low in Britain with 28 cases in 2017 (Electoral Reform Society, 2018; Equality and Human Rights Commission, 2018a; UK Parliament, 2018a). The Electoral Commission is evaluating the impact of the pilot schemes and intends to publish their report in July 2018 (Dempsey, 2018).
Is Britain Fairer?
156 www.equalityhumanrights.com/britain-fairer
Participation

The Scottish Elections (Reduction of Voting Age) Act 2015 allows 16 and 17 year olds to vote in local government and Scottish Parliament elections
Voter turnout across Britain (general elections)
77.3%2010
65.1%2015
68.2%2017
Voter turnout for the 2017 General Election (ethnic minorities in comparison with White British)
58.8%
Ethnic minorities
70.1%
White British
Voter turnout among 18-24 year olds and ethnic minorities
66.5%2010
43.1%2017
18-24 year olds
77.0%2010
58.8%2017
Ethnic minorities
Increase in people undertaking one or more political activities in England between 2013/14 to 2016/17
11.1 percentage points
22.0 percentage points
Overall
16-24 year olds
Is Britain Fairer?
157www.equalityhumanrights.com/britain-fairer
Participation

The Scottish Elections (Reduction of Voting Age) Act 2015 allows 16 and 17 year olds to vote in local government and Scottish Parliament elections. It also requires local authorities to help young people looked after by the local authority to register to vote in these elections.
The Scotland Act 1998 (as amended in 2016) devolved further powers in relation to local government and Scottish Parliament elections, including those relating to registration of voters, limits on campaign expenses of individual candidates and controlling campaign expenditure at those polls. The Wales Act 2017 devolved powers in relation to local government and Welsh Assembly elections, including the conduct of those polls. Scottish and Welsh Governments are now both consulting on electoral reform for local and parliamentary/Assembly elections. An expert panel advising on Welsh Assembly electoral reform reported in December 2017 that the system should ‘encourage and support the election of a body of representatives which broadly reflects the population’, and recommended the reduction in the minimum voting age to 16 (National Assembly for Wales, 2017a, pp. 9, 97).
In December 2017, the Council of Europe agreed the administrative changes proposed by the UK Government to address the 2005 Hirst judgment on prisoner voting rights. The UK Government agreed to amend guidance to address an anomaly in the current system, where offenders who are released back in the community on licence using an electronic tag under the Home Detention Curfew scheme can vote, but those who are in the community on Temporary Licence, cannot.
Political participation
The UK and devolved governments have enacted policies to address barriers to political participation, particularly for disabled people.
Current UK legislation does not explicitly exempt costs incurred by political parties and candidates to address inequality in representation, including disability-related needs, from being limited by statutory limits on campaign expenditure. The Scottish Government amended the candidate spending rules for the Scottish Parliament elections in 2016 and Local Government elections from May 2017 to ensure that additional costs faced by disabled candidates are not included in the statutory limits on candidates’ campaign spending.
Section 106 of the Equality Act 2010 requires political parties to publish candidate diversity data. However, this provision has not yet been brought into force. Implementation of s106 will support increased transparency and democratic accountability to support a more representative democracy.
Current UK legislation does not explicitly exempt costs incurred by political parties and candidates to address inequality in representation
Is Britain Fairer?
158 www.equalityhumanrights.com/britain-fairer
Participation

The UK-wide Access to Elected Office Fund was set up in 2012 to provide financial support for disabled people standing for election to the UK Parliament, English local and mayoral elections, Greater London Authority elections and Police and Crime Commissioner elections in England and Wales. The fund closed in May 2015 and has not been replaced in England, Wales and Northern Ireland. The Scottish Government set up an Access to Elected Office Fund for disabled people standing as candidates in the Scottish Local Government elections in May 2017. The Scottish Government has agreed to continue the Fund until the next Scottish Parliament election in 2021. In May 2018, the UK Government announced that it would provide interim funding of £250,000 for 12 months and that it would be initiating a programme of work with political parties to help improve the support given to disabled candidates (UK Parliament, 2018b).
Freedoms of expression, assembly and association, including trade union membership
New regulations on funding of political activities and restrictions on the activity of trade unions have had a potential impact on freedom of expression and assembly.
In 2016 an independent review of the Transparency of Lobbying, Non-Party Campaigning and Trade Union Administration Act 2014 reported that while there is a need for rules to regulate excessive spending by third party groups which could undermine the democratic process, the current regime unduly restricts third parties such as charities from participating in public debate at election time. It recommended the law should be reformed to address this, including a reduction in the regulated period before a general election from 12 months to four, and limiting regulation to electoral campaigning, rather than political campaigning138 (Hodgson, 2016).
The UN Special Rapporteur on the rights to freedom of peaceful assembly and of association warned against a series of domestic measures in the UK that have resulted in the ‘closing of space for civil society’. These include the UK Government’s focus on countering ‘non-violent’ extremism without an explicit definition of the term, concerns about the planned Counter-Extremism Bill, inquiry over police surveillance of activists, and the impact of the UK’s Prevent strategy (OHCHR, 2017).
The Trade Union Act 2016 introduced new restrictions on trade union activity in Britain, such as a requirement for 50% turnout and a 40% overall support requirement for strike votes for those delivering ‘important’ public services, and reducing the validity of strike mandates from being open ended to six months. These thresholds could make it difficult for trade unions to secure the mandate needed to take industrial action (Institute of Employment Rights, 2017). In Wales, many of the restrictions imposed by the Trade Union Act 2016 have been dis-applied by the Trade Union (Wales) Act 2017. In 2016, the Scottish Government set up the Trade Union Modernisation Fund to assist unions to mitigate the impacts of the Trade Union Act (Scottish Government, 2016a).138 For example, advocacy on child poverty issues by
an organisation as part of its usual work would not be regulated, but seeking to influence which party to vote for at an election based on the parties’ policies on child poverty would be.
Is Britain Fairer?
159www.equalityhumanrights.com/britain-fairer
Participation

Civic participation including public appointments and volunteering; ability to influence decisions in the local area
In 2017, the Cabinet Office launched a UK-wide public appointments diversity action plan to collate baseline data on current public appointees (UK Government, 2017c). The Gender Representation on Public Boards (Scotland) Act 2018 sets an objective for public boards in Scotland to have at least 50% of non-executive members who are women. This is in addition to the Public Sector Equality Duty specific duties in Scotland for board diversity that require the Scottish Government to collect information on the diversity of board members and for public authorities in Scotland to use that information to increase the diversity of board members (EHRC, 2016a).
A 2015/16 Justice Select Committee inquiry into the role of Magistrates in England and Wales found the UK Government needed to address the lack of younger, disabled and ethnic minority magistrates. The UK Government committed to considering introducing ‘equal merit provisions’139 for recruitment to the magistracy for the protected characteristics of race, disability and age (UK Parliament, 2016). The Judicial Diversity Committee of the Judges’ Council launched a programme to support those interested in applying to the High Court Judge Selection exercise (Courts and Tribunals Judiciary, 2017a).
The Community Empowerment (Scotland) Act 2015 enables community bodies to make requests to public service providers to participate in decision-making processes, when this will improve local outcomes. It is too early to assess the impact of this change in legislation.
OutcomesVoting
Two in three (68.2%) people in Britain over the age of 18 years voted in the 2017 General Election (Table PPN.PCP.1).140 Older people (65 years and over) were nearly twice as likely to vote as people aged 18–24 (43.1%). People from ethnic minority backgrounds (58.8%) were less likely to have voted in the last general election compared with White British people (70.1%). In 2015, those in lower supervisory and technical (58.8%) and routine occupations (52.5%) were less likely to vote than those from higher managerial and professional occupations (77.1%).
Despite the general election voting rate increasing from 65.1% in 2015 to 68.2% in 2017, there has been an overall decline in the voting rate in Britain as a whole since 2010 (77.3%).141 Between 2010 and 2017, the voting rate particularly declined among 18–24 year olds (a drop of 23.4 percentage points) and those from ethnic minority backgrounds (down 18.2 percentage points).
Younger people remain less likely to participate in political activities, to be on the electoral register or to vote, compared with other age groups (Ipsos MORI, 2017). Ethnic minorities and unskilled workers are also less likely to be registered and to vote. Disabled people are more likely to be registered but less likely to vote, while women are more likely to be registered but are just as likely to vote as men (Apostolova, Uberoi and Johnston, 2017).
139 Where two or more candidates are of equal merit, a candidate from an under-represented group may be selected.
140 Unless otherwise stated, the figures reported here on political and civic participation and representation are from analysis carried out specifically for the ‘Is Britain Fairer? 2018’ review using data from the British Election Study, the Community Life Survey, the Scottish Social Attitudes Survey and the British Social Attitudes Survey.
141 British Election Study.
Is Britain Fairer?
160 www.equalityhumanrights.com/britain-fairer
Participation

In 2017, the rate of voting for women in the most recent general election was significantly higher in Wales (90.2%) than in England (68.5%) and Scotland (59.5%). There was a 29.3 percentage point increase in voting among women in Wales between 2015 and 2017, while in England there was no significant change.
Some groups face barriers to registering to vote and voting. A review by the Cabinet Office identified particularly under-registered groups to be young people, frequent home movers, people from ethnic minorities, and disabled people. ‘Vulnerable groups’ were defined as people living in areas of high social deprivation, care home residents, people that are homeless, and survivors of domestic abuse (UK Government, 2017a).
Although the move towards online and individual electoral registration has increased accessibility to registration for many disabled voters, concerns have been raised about the lack of information on accessibility and reasonable adjustments to help disabled people vote, and to vote in private (WebRoots Democracy, 2017). A report from the Electoral Commission on the 2017 UK General Election highlighted the different barriers that disabled people face when they want to register to vote and cast their vote, including registration forms and poll cards that are difficult to read and understand, difficult-to-access polling stations or booths, lack of trained staff, and not being able to vote in private. It also recommended that the Government look at different ways that disabled people can vote so that they have greater flexibility and choice (Electoral Commission, 2017; Leonard Cheshire, 2017).
Historically, the proportion of Gypsies, Roma and Travellers who register to vote in Britain has been low. Barriers include feelings of distrust towards politicians. A Traveller Movement initiative ‘Operation Traveller Vote’ was launched in 2017 to encourage Gypsies, Roma and Travellers to vote. (Travellers Times, 2018; Traveller Movement, 2017).
Political participation
Women remain under-represented among political representatives. In the 2017 General Election, 208 women were elected as Members of Parliament, a record high but still only 32% of MPs (Keen and Cracknell, 2018).
Women elected representatives as of May 2018 for UK and devolved parliaments
Westminster
32.0%
Scottish Parliament
34.9%
Welsh Assembly
41.7%
Is Britain Fairer?
161www.equalityhumanrights.com/britain-fairer
Participation

In June 2017, it was reported that 8% of MPs in the House of Commons are from an ethnic minority background
Little evidence is available on the diversity of electoral candidates and representatives in Britain, making it difficult to give a clear picture of the scale of under-representation of women, disabled people, ethnic minorities and other people sharing protected characteristics in elected positions in England, Scotland and Wales. In June 2017 it was reported that 8% of MPs (52 of 650) in the House of Commons are from an ethnic minority background, lower than among the general population (14%), and ethnic minority MPs make up 12.5% of all women MPs (26 of 208), an increase from 3% in 2015 to 4% of all MPs142 (Audickas and Apostolova, 2017).
There were 45 women elected to the Scottish Parliament in 2016, making up 34.9% of MSPs. This number was the same as five years earlier despite a 10% increase in the number of women standing as candidates during that time. No ethnic minority women or disabled women were elected (Engender, 2017). Just one self-declared disabled MSP was elected in 2016 (Inclusion Scotland, 2016). Two men from ethnic minorities were elected to the Scottish Parliament in 2016, and the youngest MSP (age 21) to be elected ever (Scottish Parliament Information Centre, 2016).
Despite an increase in the proportion of women candidates for Welsh Assembly Elections between 2011 and 2016, the proportion of women elected as Assembly Members (AMs) in 2016 remained at 41.7%, the same level as in 2011 (LSE Public Policy Group, 2016; Holzinger, Jones and Millett, 2016). A survey of Welsh local government election candidates for the May 2017 elections found that 34% were women (Welsh Government, 2017a).
142 For the UK as a whole, not just Britain.
A room full of young people taking part in a discussion at the Houses of Parliament, London.
Is Britain Fairer?
162 www.equalityhumanrights.com/britain-fairer
Participation

Poor public perceptions of politics and the intimidation of MPs are considered a major barrier to standing for elected office, particularly for ethnic minority women. Research conducted by Amnesty International UK into online violence found that in the six weeks prior to the 2017 General Election, almost half of all abusive tweets to female MPs in the UK were directed towards Diane Abbott, a prominent black, female MP. Excluding Diane Abbott, black and Asian women MPs received 35% more abuse than white women MPs (Amnesty International UK, 2017). The 2016 murder of MP Jo Cox in her constituency during the EU referendum campaign highlighted the growing issue of female MPs being targeted (Krook, 2017).
In 2016/17, two in five (41.3%) people in England undertook at least one political activity in the past year (Table PPN.PCP.2). In 2015 in Scotland about three in five (61.7%) had undertaken political activities in the past few years, while in Wales it was one in four (26.4%).143 Between 2013/14 and 2016/17, the number of those undertaking one or more political activities in England increased by 11.1 percentage points overall. This increase was twice as large for 16–24 year olds (from 19.1% to 41.1%).
In Scotland, between 2013 and 2015 the number of people undertaking one or more political activities increased by 4.5 percentage points. Unlike in England, the largest significant increase was among older people aged 65–74, where the increase was almost three times that of overall levels (from 47.7% to 61.4%). The sample sizes for Wales were too small to provide precise findings by protected characteristics.
143 England: Community Life Survey; Scotland: Scottish Social Attitudes Survey; Wales: British Social Attitudes Survey. Measures for England, Scotland and Wales are not directly comparable.
For England, political activities are defined as: Contacted a local official such as local councillor, MP, government official, mayor, or public official working for the local council of Greater London Assembly; Attended a public meeting or rally, taken part in a public demonstration or protest; Signed a paper petition or an online/e-petition.
For Scotland, political activities are defined as: Contacted an MP or MSP; Contacted a government department directly; Contacted my local council; Responded to a consultation document; Attended a public meeting; Contacted radio, TV or a newspaper; Signed a petition (including online petitions); Raised the issue in an organisation I already belong to; Gone on a protest or demonstration; Attended an event organised as part of a consultation exercise; Spoken to an influential person; Formed a group of like-minded people; Joined an existing organisation; Actively took part in a campaign (e.g. leafleting, stuffing envelopes).
For Wales, political activities are defined as: Signed a petition; Boycotted, or deliberately bought, products for political, ethical or environmental reasons; Took part in a demonstration; Attended a political meeting or rally; Contacted or attempted to contact a politician or a civil servant to express views.
Is Britain Fairer?
163www.equalityhumanrights.com/britain-fairer
Participation

In England, people in managerial, administrative and professional occupations (55.0%) were twice as likely to undertake political activities in 2016/17 as those in routine occupations (28.2%) and those who had never worked or were long-term unemployed (25.9%). This was similar in Scotland in 2015, where about three in four (76.5%) people in higher managerial, administrative and professional occupations but around half of people in routine occupations (48.6%), semi-routine occupations (52.2%) and lower supervisory and technical occupations (54.6%) had undertaken one or more political activities in the past few years. In England political activities increased more between 2013/14 and 2016/17 for those in lower managerial (13 percentage points) and intermediate occupations (13.6 percentage points) than for those in routine occupations (8.2 percentage points) or who had never worked/were long term unemployed (8.6 percentage points).
Freedom of expression, assembly and association; trade unions, legislation and membership
Many debates on freedom of expression in England have related to higher education settings. A Joint Committee on Human Rights (JCHR) inquiry into freedom of speech in universities identified factors that act as disincentives for students at universities to organise events on controversial issues, and that such disincentives could be having a wider ‘chilling effect’ which is hard to measure. They recommended that a much broader survey of students’ opinion would be needed to assess levels of confidence among the student body as a whole (UK Parliament, 2018c, paragraph 37).
In 2016 the rate of trade union membership in the UK was at its lowest recorded at 6.2 million or 23.5% of UK employees, a 1.2 percentage point decrease from 24.7% in 2015) (BEIS, 2017). In Scotland, the proportion of employees who are union members (union density) is higher for women than men, disabled employees, UK nationals, public sector workers and for people with children (Fraser of Allander Institute, 2017).
Civic participation, including public appointments and volunteering; ability to influence decisions in the local area
The visibility of women in public appointments is increasing. A significant proportion of public appointments are regulated by the Commissioner for Public Appointments, which reported that of the bodies it regulates in England and Wales, 45.5% of all public appointments and reappointments in 2016/17 were women, an increase from 39.3% in 2013/14. However, the percentage of women being appointed as chairs of public bodies remained low, at 28% (Commissioner for Public Appointments, 2017; UK Government, 2017c).
Is Britain Fairer?
164 www.equalityhumanrights.com/britain-fairer
Participation
In 2016/17, 9.1% of public appointments were of ethnic minority candidates, compared with 7.9% in 2014/15. In 2016/17, this rose to 10.2% of new appointments, but just 5.2% of chair appointments were of ethnic minority candidates. This is compared with 14% of the population being ethnic minority according to the 2011 census. In 2016/17, 6% of total appointments and reappointments were of disabled people, an increase from 2014/15. In order to increase the appointment rates of people from ethnic minorities and disabled people, the Commissioner for Public Appointments identified the need not only to attract more applications but also for high quality applications that would be more likely to progress to the interview stage. Breakdown of public appointments by sexual orientation or gender reassignment was not available (The Commissioner for Public Appointments, 2017; UK Government, 2017c).
In Scotland in 2016, representation of women and people from ethnic minorities on public boards was at its highest level since 2004 when recording began (45.1% of all board members were women and 3.6% were from ethnic minorities). However, women remain under-represented. The proportion of appointees who declared a disability fell from 15.3% in 2014 to 11.8% in 2015, and fell again to 9.2% in 2016. Of all board members in 2016, 4% were lesbian, gay or bisexual (LGB), an increase from 3% in 2015, and 15.9% were aged under 50, a decrease from 17.6% in 2015 (CESPLS, 2017).
Women were less likely than men to apply for public board positions in Scotland but were more successful in the recruitment process. In 2016, 43% of applications were from women, while 59% of those appointed were women. This was also true for chair positions, with just 22% of applications coming from women, while 45% of those appointed were women. In 2016, 5.5% of applicants and 1.0% of those appointed were people from ethnic minorities (Scottish Government, 2017a).
Women were less likely than men to apply for public board positions in Scotland but were more successful in the recruitment process
Is Britain Fairer?
165www.equalityhumanrights.com/britain-fairer
Participation

Women, people from ethnic minorities and disabled people also remain under-represented in the judiciary. As of 1 April 2017, 28% of court judges and 45% of tribunal judges in England and Wales were women. Although representation has improved for those aged under 40, almost all magistrates (85%) were aged over 50. Only 7% of court judges and 10% of tribunal judges are from an ethnic minority, falling to 1% in Wales. Only 4% of magistrates declared themselves to be disabled, compared with 16% of working age adults (House of Commons Justice Committee, 2016, p.17; Courts and Tribunals Judiciary, 2017b). In 2017, only 25% of the Scottish judiciary were women. Most (88%) of the judiciary were aged over 50, and more than half (52%) were aged over 60 (Judiciary of Scotland, 2017).
Volunteering is part of civic participation. In 2016/17, 22% of adults in England reported that they take part in formal volunteering at least once a month. Formal volunteering has fluctuated around these levels since 2010/11. Annual levels of civic participation,144 however, have increased, with 41% engaging in some form of civic participation in 2016/17, compared with 30% in 2014/15. In Scotland in 2016, 27% of adults had provided unpaid help to organisations or groups in the last 12 months. Volunteers were more likely to be women, older people, from higher socio-economic groups, or from rural and less deprived areas. People from more disadvantaged areas were less likely to volunteer (NCVO, 2017; Scottish Government, 2017b; Southby and South, 2016).
Participation in civic activism (involvement in decision making about local services) in the past 12 months was much lower in comparison at 8% in 2016/17, the same level as in 2014/15. In England, only 8% of people said they got involved in local decision making in 2016/17 (Cabinet Office, 2015; 2017). In 2014/15, 20% of people in Wales agreed that they can influence decisions affecting their local area, compared with 24% in 2012/13 (Welsh Government, 2017b).
144 Civic participation describes the degree to which people involve themselves in their community in order to improve it.
Volunteers were more likely to be women, older people, from higher socio-economic groups, or from rural and less deprived areas
Is Britain Fairer?
166 www.equalityhumanrights.com/britain-fairer
Participation

7.3 Access to services
Key policy and legal developmentsAccess to transport
Responsibility for transport policy and delivery has been devolved to administrations in Scotland and Wales. The public transport network in Britain, particularly trains and buses, provides essential access for individuals wishing to participate in many aspects of everyday life such as going to work, visiting friends and family, and accessing services such as going to the doctor.
Since April 2017 designated taxi and private hire vehicle drivers have been obliged by law to transport wheelchair users in their wheelchair, provide passengers in wheelchairs with appropriate assistance, and charge wheelchair users the same as non-wheelchair users (Equality Act 2010, s165). In February 2017, the Department for Transport published statutory guidance on the new obligations (Department for Transport, 2017a). In 2017 the Supreme Court held that bus drivers should do whatever they reasonably can to ensure that wheelchair users can access wheelchair spaces on buses, even when they are occupied by other passengers (see First Group plc v Paulley [2017] UKSC 4). A Written Ministerial Statement was laid before the House of Commons on 8 March 2018 setting out plans to bring forward measures in 2017 to support access to wheelchair space on buses (HC Deb 8 March 2018). However, there is no national requirement to make a proportion of taxi or private hire vehicles accessible, and non-designated vehicles, which, in many areas, are most taxis, are unaffected by this requirement.
In England and Wales, rural transport needs in some communities have been addressed through Rural Transport Partnerships, Community Transport Services or developing other locally-led community transport solutions such as demand responsive buses, community mini-buses and community rail partnerships, which also support specific transport needs of disabled people and older people (Association of Community Rail Partnerships, 2017; Jones, 2016; Minnis, 2018). The UK Government ran a consultation on the future of the community rail strategy, and expect to publish a new strategy in summer 2018 (Department for Transport, 2018a).
Although we welcome these developments, there is a lack of consistency in the UK Government’s efforts to make vehicles, infrastructure and information accessible to disabled people. There is no comprehensive UK-wide accessibility plan for transport as required by the CRPD General Comment on accessibility (UNCRPD, 2014). In 2017 the Department for Transport launched a consultation on a draft accessibility action plan.145 As of May 2018 the consultation responses were still being analysed (Department for Transport, 2017b). The Department for Transport has also published the ‘Next steps towards an Aviation Strategy’ document, containing proposals for improving accessibility at UK airports (Department for Transport, 2018b).
145 The scope of this is restricted to those areas for which the Department for Transport has direct responsibility in England and for those transport matters on which powers have been reserved at UK level.
Is Britain Fairer?
167www.equalityhumanrights.com/britain-fairer
Participation

Museum and gallery attendance by socio-economic group in England (2018)
63%
Upper socio-economic group
36.5%
Lower socio-economic groupLower socio-
economic group
52.3%
Overall
In September 2016 the Scottish Government launched an Accessible Travel Framework; a ten-year plan to improve travel access for disabled people. The Framework included commitments to disability training for transport staff, mechanisms for enabling onward travel should journeys be disrupted, and advice on ticketing and pricing.
The Bus Services Act 2017 provides powers to make regulations for an accessible information requirement which would ultimately require bus operators to provide accessible information, using both audible and visible media, on board local bus services in England, Scotland and Wales.
Access to services should not be hindered by the threat of physical or sexual violence, which, as various UN bodies have previously raised, the UK and devolved governments have a duty to prevent. There has been action on national and local levels to tackle hate crime on public transport, with initiatives from UK and devolved governments, the British Transport Police and Passenger Transport Authorities (EHRC, 2017). The British Transport Police has run a ‘Report it to Stop it’ campaign since April 2015 to tackle the increasing problem of reported sexual offences on the railway network, which was found in London to increase reporting of unwanted sexual behaviour (British Transport Police, no date; Solymosi, Cella and Newton, 2018). However, it is not yet clear what the national impact of these initiatives or campaigns has been on reducing abuse on public transport.
Is Britain Fairer?
168 www.equalityhumanrights.com/britain-fairer
Participation

Digital and financial services
It is important that digital services are accessible to those who are most excluded, particularly older and disabled people. The UK Government introduced the Transformation Strategy in 2017 and a Digital Charter in 2018. The Transformation Strategy aims to use digital services to change how Government delivers particular services to people. The Digital Charter introduced in 2018 aims to make the UK ‘the safest place in the world to be online’, and to follow key principles to ensure the internet remains free, open and accessible (DCMS, 2018a).
In March 2016 the Scottish Government published a Digital Strategy for Scotland. The strategy acknowledged that ‘the very groups most likely to gain disproportionately from the benefits of being online through financial savings, reduced isolation and access to employment opportunities are those most likely to be excluded’ (Scottish Government, 2016b). However, there were no specific actions set out in the strategy to ensure that disabled people would be able to access the internet or to ensure that internet sites themselves are accessible to disabled people.
The law leaves a degree of interpretation for service providers about how far they are required to go to increase digital accessibility and there is as yet no UK case law precedent on web accessibility to clarify the position (Barton, Bradbrook and Broome, 2015). On 26 October 2016 EU Directive 2016/2102 on the accessibility of public sector bodies’ websites and mobile applications came into force. It must be implemented in the UK by 23 September 2018 and provides standards to make public sector websites and mobile applications more accessible to everyone including disabled people, not just through technical standards (such as being able to listen to a text, or reading subtitles to a video) but also through political will.
The House of Lords Select Committee 2017 report on financial exclusion recommended including financial education in schools in England, supporting those people particularly at risk of financial exclusion including older people and disabled people, and that the Government undertake a cumulative impact assessment of how changes in social security policy in recent years may have affected financial inclusion (House of Lords, 2017). Following this, the UK Government set up a Financial Inclusion Policy Forum (UK Government, 2017d; UK Government, 2018c). The Welsh Government’s Financial Inclusion Strategy for Wales 2016 made a number of commitments, including to ensure everyone in Wales has access to a basic bank account.On 26 October 2016 EU Directive
2016/2102 on the accessibility of public sector bodies’ websites and mobile applications came into force
Is Britain Fairer?
169www.equalityhumanrights.com/britain-fairer
Participation

Culture, leisure and sport
The UK Government’s Sporting Future strategy, published in December 2015, set out five outcomes it aimed to deliver through increased participation in sport. These included mental and physical wellbeing and community development, and the aim to support work designed to get more people from under-represented groups engaging in sport and physical activity, including those from lower socio-economic groups, older people, women and disabled people. It also extended the responsibility of Sport England to engage children as young as five years in grassroots sport (DCMS, 2015). Sport England published the ‘Towards an active nation strategy 2016–2021’ which committed to invest to engage more people from under-represented groups in sport and physical activity. There is currently evidence being gathered to assess the impact of sport and physical activity on the five Sporting Future outcomes through the Active Lives and Active Lives Children surveys (DCMS, 2018b).
Sports clubs are legally obliged under the Equality Act 2010 to ensure disabled fans are not unfairly disadvantaged. All English Premier League clubs pledged to improve their stadium facilities for disabled supporters and increase the numbers of wheelchair user spaces by August 2017. Most clubs have made significant improvements to their stadium facilities for disabled supporters. However, not all clubs have met this deadline and further improvements are required for the 2018/19 season (EHRC, 2018b).
Sport Scotland published ‘Raising the bar’ in 2015 (Sport Scotland, 2015) which set out its commitments to ensuring greater access to sports for people sharing protected characteristics and for those living in deprivation.
The Sport Wales strategic equality plan 2016–2020 set out equality objectives for Wales, with a focus on those living in socio-economic disadvantage in Wales and the role of sport in the promotion and protection of the Welsh Language (Sport Wales, 2016). Priorities set out in the 2018 Vision for Sport Wales include opportunities for every child and young person to undertake at least five hours of safe, high quality sport every week and sustaining their engagement throughout their adult life, encouraging local take-up of sport, and increasing participation (Sport Wales, 2018).
The UK Government published the Culture White Paper in 2016 which set out aims to increase participation in culture, particularly among children and young people from disadvantaged backgrounds, and set out plans for a cultural citizens programme in England (DCMS, 2016). An evaluation of a pilot of this programme, which aimed to introduce 11–14 year olds from disadvantaged backgrounds to arts and culture near to where they live, found that it had some positive impacts and was particularly effective for children who had less engagement with arts and culture (Arts Council England, 2018). In 2018, the UK Government set out a new policy commitment to broaden cultural engagement through the use of digital technology and tools (DCMS, 2018c).
Is Britain Fairer?
170 www.equalityhumanrights.com/britain-fairer
Participation

OutcomesAccess to transport
Transport presents one of the greatest challenges to disabled people; not only those with mobility impairments, but those with vision and hearing impairments, and mental health conditions, can experience barriers to accessing transport (House of Lords, 2016). There is limited evidence, however, on the impact that lack of access to different forms of public transport is having on different groups in Britain.
Young people, particularly 17 to 20 year olds, are more reliant on buses than any other age group, not only for access to education but also employment and training and social and leisure activities. Most bus trips made by young people are for the journey to and from school. In Scotland, Wales, and rural areas of England there have been some local authority cuts to school transport (Campaign for Better Transport, 2016). In Scotland 21% of children in full-time education went to school by bus (Transport Scotland, 2016). In England in 2016, 29% of pupils aged 11–16 years travelled to school by bus (Department for Transport, 2017c). In England Black children and those from the Other ethnic group were more likely to travel to school by local bus compared with other ethnic groups (Cabinet Office, 2018; Department for Transport, 2017c). In Wales, there is no available figure for the proportion of pupils that travel to school by bus.
There are concerns that the introduction of driver-only operations in Britain, where the driver is the only member of staff on board a train, will have significant accessibility implications (Butcher, 2018). As well as transport being accessible, it must also be safe for individuals to use. The number of sexual offences reported every year on the rail network in Britain increased by 9% compared with the previous year to 2,132 in 2016/17, and has nearly doubled in five years (British Transport Police 2012; 2017a). In Scotland the number of sexual offences reported on the rail network fell from 59 to 46 during this time. It is possible the overall increase of sexual offences in Britain could be partly due to high-profile campaigns to encourage reporting, and so should be interpreted with caution. The number of violence against the person offences reported on the rail network in Britain also increased by 13% during this time to 9,263 (British Transport Police, 2017a) and public transport remains a ‘hot spot’ for hate crime (EHRC, 2017). The British Transport Police recorded 2,756 hate crime offences taking place in England and Wales in 2016/17, an increase of 23% compared with the previous year. Of these, the largest proportion (2,300) were motivated by racism (British Transport Police, 2017b).
The number of violence against the personoffencesreportedontherailnetwork in Britain also increased by 13% during this time to 9,263
Is Britain Fairer?
171www.equalityhumanrights.com/britain-fairer
Participation

There are clear urban/rural differences in transport usage and satisfaction levels. The 2016 National Travel Survey revealed that in England people living in more urban areas are more likely to be satisfied with local transport provision than those living in more rural areas. Those living in rural areas are less likely to be satisfied with buses (36%) and trains (46%) than those living in urban areas (buses 53% and trains 55%) (Department for Transport, 2017c). There has been a continuing decline in bus use in England outside London, with passenger journeys falling by 0.8% to 2.20 billion people in the year ending March 2016/17 (Department for Transport, 2017d).
In Scotland in 2016, buses were used more frequently by people146 who lived in large urban areas; 55% used the bus in urban areas compared with 1% in remote rural areas. Women (61%) were more likely than men (39%) to use the bus, and the highest level of use was seen among the 20–29 (19%) and 60–69 (18%) age groups (Transport Scotland, 2018a).
Access to a car makes it easier to get around and opens up access to employment areas in Britain not easily accessible by public transport; but car ownership can be unaffordable for people on low incomes (Social Mobility Commission, 2017). In 2016, those in the lowest household income quintile in England were most likely to have no access to a car (44%) compared with other quintiles. People living in households without a car were found to do fewer trips in total, suggesting that other forms of transport including public transport are not filling the gap. Respondents from ethnic minorities also tend to live in households without cars, while around a quarter (27%) of adults aged 17 years and over did not hold a full car driving licence in 2016 (Department for Transport, 2017c).
146 Sample size: 1,480.
Access to a car makes it easier to get around and opens up access to employment areas in Britain not easily accessible by public transport
Is Britain Fairer?
172 www.equalityhumanrights.com/britain-fairer
Participation

In 2016, those with a mobility impairment in England made fewer trips and the way they travelled was different compared with those with no mobility impairment. Those with a mobility impairment were more likely to be passengers in cars and less likely to be drivers, were more likely to use taxis, and were less likely to use the rail network (Department for Transport, 2017c). Although the type of impairment has a key role in a disabled person’s travel behaviour, there is limited evidence on the travel behaviour of people with different impairments and how this interacts with age, what the factors are that affect the travel behaviour of disabled people, and how travel behaviours vary across location and across the life-course for disabled people (Clery, Kiss, Taylor and Gill, 2017).There were 0.9 million disabled concessionary passes for free local bus travel issued under the English National Concessionary Travel Scheme for older and disabled people in 2016/17, an increase of 2.3% since 2015/16 (Department for Transport, 2017e). In Scotland, 29% of all adults (16+) had a concessionary fares pass under the National Concessionary Travel Scheme in 2017, and 87% of those aged 60 or over had a pass. These proportions changed little since the introduction of the scheme in 2006, though there was a steady increase in pass holder numbers over the period (Transport Scotland, 2018b).
Access to digital services
In 2017, 92.2% of people in Britain had used the internet (Table PPN.ACS.1). Fewer disabled people (80.8%) used the internet than non-disabled people (95.8%). People in Wales (87.7%), the North East (88.5%), East Midlands (89.8%) and the East of England (90.2%) were less likely to have used internet than people in London (95.1%).147
Between 2010 and 2017, the proportion of people who had used the internet increased by 10.6 percentage points. This increase was greatest for those who were least likely to use the internet in 2010: those aged 65–74 (30.6 percentage points) or over 75 (31.0 percentage points), disabled people (19.9 percentage points), those in routine and manual occupations (26.6 percentage points to 96% in 2017) and those in the North East (17.6 percentage points). The gap between these groups and the largest groups of users of the internet (those aged 45–54, non-disabled people, higher managerial and professional occupations and London) narrowed but did not disappear. Just over half of those aged over 75 and 80.8% of disabled people had used the internet. For the 55+ age group, most of the increase in internet use took place before 2014.148
147 Using the internet is defined as having last accessed the internet within the last three months up to and over one year previously.
148 ONS internet users in the UK survey.
People who have used the internet in 2017
80.8%
Disabled
95.8%
Non-disabled
Is Britain Fairer?
173www.equalityhumanrights.com/britain-fairer
Participation

As the trend towards a digital society provides users with new ways of accessing information and services, it is important that digital services (those delivered online) are accessible to all users including older and disabled people. Digital exclusion can worsen access to services and isolation in many different ways, and the digital divide in Britain is considered to be based on social inequalities that lead to low levels of digital access for some groups (Martin, Hope and Zubairi, 2016).
Being older, a disabled person, or living in a rural area remain risk factors for digital exclusion, although personal internet use is improving among those groups. Forty-one per cent of those aged over 75 years in Britain were recent internet users in 2017, compared with 99% of those aged 16 to 34. Although this age gap is narrowing, showing a steady increase from 38.7% of over-75s in 2016 and 33% in 2015, older people still accessed the internet least of all age groups in 2017 (ONS 2017; 2016; 2015).
Twenty-two per cent of disabled adults in Britain had never used the internet in 2017, which was an improvement from 27.4% in 2015 (ONS 2017). Some disabled people who use the internet still face problems with digital accessibility.
Living in rural areas and experiencing poor access to digital services are often related. Despite government commitments to improving digital services across the UK, Wales and Scotland in particular continue to have areas of digital exclusion, particularly in rural areas. With services being increasingly available ‘digital-only’ by default, support for those in rural areas who might otherwise be left isolated is increasingly important (Alzheimer’s Society, 2016).
Barriers to financial access and vulnerability to fraud
Financial exclusion is the inability, difficulty or reluctance to access mainstream financial services (House of Lords, 2017). Meaningful access to financial services is essential for participation in society, and while digitisation of financial services presents new opportunities for financial access, those groups who are at greater risk of digital exclusion are now also most affected by the increasingly online nature of financial services. The risk of digital exclusion is exacerbated by the closure of high street bank branches. An estimated 650 branches of big banks closed in 2015/16, with a concern that many closures happened in poorer areas and in areas of low population density (Edmonds, 2018).
Is Britain Fairer?
174 www.equalityhumanrights.com/britain-fairer
Participation
Some groups may also be at greater risk of financial abuse – the misuse of a person’s funds and assets, including the theft or misuse of a person’s money or property. This can also lead to social isolation and the loss of confidence to live independently, and is linked to a decline in mental health. Women are at particular risk of financial abuse, as are those who are older, single or widowed, have dementia or reduced cognitive function, poor health, who have or are at risk of clinical depression and other illnesses, or need care or help with daily activities such as managing money and shopping (Davidson, Rossall and Hart, 2015). Seven per cent of LGBT people who visited a bank or insurance company in the last year reported they were discriminated against because of their sexual orientation and/or gender identity. This increases to 10% of disabled LGBT people, 16% of Black, Asian and ethnic minority LGBT people, and 26% of transgender people (Stonewall, 2017).
The Independent Chief Inspector of Borders and Immigration found that 10% of immigration checks on new bank accounts were incorrectly matched as a ‘disqualified person’, and that the Home Office has ‘no systematic knowledge of who has been affected by this measure and of assuring whether this was lawful in terms of the 2014 Act’ (ICIBI, 2016, p.6). This suggests that migrants in the UK are at risk of being denied access to basic financial services.
Access to culture, leisure and sport
In 2016 it was estimated that 110 static libraries closed in England between 2011 and 2016 (Woodhouse and Dempsey, 2016). There was a decrease in public library use in all regions of England from 48.2% in 2005/06 to 34.0% in 2016/17 (DCMS, 2018d), although the latest levels were similar to 2015/16 (33.4%). In 2016/17 public library use also continued to be lower among the White ethnic group compared with the Black and ethnic minority group, and remained lower for the lower socio-economic group than for the upper socio-economic group (DCMS, 2018d; DCMS, 2017).
In 2016, 28% of adults in Scotland visited a library (including mobile and online) compared with 30% in 2015 (Scottish Government, 2017b). The Carnegie Trust found that library usage in Scotland dropped by 11 percentage points between 2011 and 2017 (Peachey, 2017; Carnegie UK Trust, 2015).
In 2016/17 public library use also continued to be lower among the White ethnic group compared with the Black and ethnic minority group
Is Britain Fairer?
175www.equalityhumanrights.com/britain-fairer
Participation

Although three-quarters of people in Wales say libraries are important for their community, there was a decline in frequent library use across the UK between 2011 and 2017 with Wales seeing the sharpest drop in frequent use. Assessment of libraries in Wales against the Welsh Public Library Standards for 2014–17149 gave a mixed picture, but libraries performed well on goals designed to provide safe and accessible spaces and information resources for those with special educational needs despite ‘significant budget restrictions’, a drop in staffing and in usage during the course of the framework (Creaser and White, 2017, p.ii; Welsh Government, 2017c). Across Britain, it is not clear if this decline in library use indicates an overall decrease in access to culture and media, or a switch to digital and other alternatives.
Engagement with the arts and cultural activities in England in 2016/17 remained generally lower for black and minority ethnic adults, disabled adults and adults from the lower socio-economic group. There was a persistent gap in museum and gallery attendance by socio-economic group in England with 63% of adults from the upper socio-economic group having visited a museum or gallery in the last 12 months compared with only 36.5% of adults from the lower socio-economic group (DCMS, 2018d). Although there is a body of best practice within the live music industry in Britain, in 2016 many venues and festivals continued to provide poor information about accessibility, with only 26% providing information rated as ‘good’ (Attitude is Everything, 2016).
In Scotland most adults (92%) reported being culturally engaged in 2016, either by attending or visiting a cultural event or place, or by participating in a cultural activity (Scottish Government, 2017b). Attendance at cultural events (attending a cinema, library, museum, theatre, historical place) was much lower for people with a long-term physical or mental health condition, those with no qualifications and those living in the most deprived areas.
In relation to sport, one in 10 LGBT people in Britain who attended a live sporting event in the last year reported experiencing discrimination because of their sexual orientation and/or gender identity, while 43% of LGBT people thought public sporting events were not a welcoming space for LGBT people (Stonewall, 2017).
In 2015/16, just over half of adults (16 years and over) (55.3%) in England had exercised in the last four weeks (Table PPN.ACS.2). This was lower for older people; 40% of 65–74 year olds and a quarter (26.6%) of those aged 75 years and over).150 Non-disabled people (61.0%) were almost twice as likely to have exercised in the last four weeks as disabled people (36.0%), and the rate for people with impairments of mobility, or lifting, or carrying or moving objects, or manual dexterity, or coordination (approximately 27.3%) were less than half that of as non-disabled people. Men (61.3%) were more likely than women (49.6%) to have exercised in the last four weeks.
149 Sets out core library entitlements for Welsh citizens. Special requirements as set out by the Standards can encompass physical and health impairment, economic disadvantage (e.g. long-term unemployed), cultural difference (e.g. non-native speakers, new arrivals), educational background, or other circumstances that require special library services.
150 England: Taking Part: the National Survey of Culture, Leisure and Sport; Scotland: Scottish Household Survey; Wales: Sport and Active Lifestyles. Measures for England, Scotland and Wales are not directly comparable.
Is Britain Fairer?
176 www.equalityhumanrights.com/britain-fairer
Participation

Between 2013/14 and 2015/16, the percentage of people who had exercised in the last four weeks increased in England by 2.5 percentage points. Between 2010/11 and 2015/16 there were larger increases for people aged 75 years and over (8.9 percentage points), and disabled people (5.4 percentage points). For disabled people most of this increase (3.7 percentage points) happened between 2013/14 and 2015/16.
In Scotland, four in five adults (16 years and over) (80.0%) had participated in at least one activity in the last four weeks in 2015. As for England, this was lower for older people (65–74 years: 71.4%; 75 years and over: 51.0%). Disabled people (55.9%) were less likely to have exercised in the past four weeks compared with non-disabled people (87%). Between 2012 and 2015, the percentage of people in Scotland who had participated in at least one activity in the last four weeks increased by 5.7 percentage points overall. There were larger increases for people aged 65–74+ years (8.9 percentage points).
In Wales, just over half of adults (16 years and over) (58.7%) had exercised in the last four weeks in 2016. This was lower at one in three (31.7%) people for those aged over 65. Disabled people (46.6%) were much less likely to have taken exercise in the last four weeks as non-disabled people (69.4%). Between 2012 and 2016, the percentage of people in Wales who had taken exercise in the last four weeks declined by 11.2 percentage points overall, with the greatest decline between 2014 and 2016 (13.0 percentage points).
In a 2015 poll of over two thousand adults in Britain, over half (56%) of disabled people said they had done no moderate-intensity physical activity in the past week, compared with 28% of non-disabled people. The main barriers identified by disabled people were a lack of exercise provision suitable for them (41%), exercise facilities which are not accessible for disabled people (26%) and fear of injury (21%) (Leonard Cheshire, 2016). In 2016/17, 25.7% of adults in England were classified as inactive (doing fewer than 30 minutes of physical activity a week). Disabled people were more likely to be inactive; 51% of those with three or more impairments (making up over half the disabled people in the survey) were inactive compared with 21% of those without an impairment. Those in lower socio-economic groups were also more likely to be inactive compared with those in higher socio-economic groups, and inactivity levels saw a sharp increase among those aged over 75 years (Sport England, 2018).
Sports Wales identified some common factors that make people less likely to take part in sport, particularly those from ethnic minorities. These included social isolation, racism, a lack of appropriate facilities, and the impact of certain cultural expectations. Although racism was identified as a barrier to sport, Sport Wales also recognised that for some people sport provided a space to escape discrimination (Sport Wales, 2016).
Is Britain Fairer?
177www.equalityhumanrights.com/britain-fairer
Participation

7.4 Privacy and surveillance
Key policy and legal developmentsIt is essential that state powers of surveillance are compliant with human rights and are non-discriminatory. They must therefore strike the right balance between the right to respect for privacy and the state’s legitimate interests to protect national security and prevent crime. In the UK there is continuing uncertainty about how bulk surveillance and retention powers comply with human rights law. Data protection legislation has been strengthened with the adoption of the EU General Data Protection Regulation (GDPR) and policy development in the UK has focused on standards and codes of practice to protect users from online harm and to ensure children’s safety.
As part of its Transformation Strategy to use digital services to change how it delivers services to people, the UK Government launched the National Cyber Security Centre (NCSC) in October 2016, and published the National Cyber Security Strategy 2016–2021. This set priorities up to 2020 relating to the storage, management and use of data by the public sector (UK Government 2017e).
As part of its work towards a Digital Charter, the Government consulted on an Internet Safety Strategy green paper which set out proposals to ensure individuals’ online activity is kept safe and secure. The outcome of this consultation was published in May 2018. Consultation responses emphasised the importance of ensuring free speech is safeguarded and protecting users’ rights while protecting users from online harm. The Government response restated plans for a social media code of practice and transparency reporting for companies, focusing on engaging with industry, as well as improving digital literacy skills of both children and parents. The response also identified the need for a particular focus on children in care and mental health (UK Government, 2018d).
In March 2016 the Scottish Government published Realising Scotland’s full potential in a digital world: A Digital Strategy for Scotland, setting commitments to create digital public services around the needs of their users, and enable everybody to share in the social, economic and democratic opportunities of digital. In April 2017, the Scottish Government released the National Action Plan for Internet Safety for Children and Young People, with actions including strengthening children’s resilience, making younger people aware of their rights online, and who to turn to should they encounter abuse. The action plan sets out the Scottish Government’s support for the principles of the 5Rights framework which sets out children and young people’s digital rights (Scottish Government, 2017c).
Is Britain Fairer?
178 www.equalityhumanrights.com/britain-fairer
Participation

In March 2017 the House of Lords Select Committee on Communications launched its report on the children and the internet inquiry, ‘Growing up with the internet’, which called on the Government to establish a Children’s Digital Champion to ensure coordinated and sustained action from Ministers across all departments and to present robust advocacy on behalf of children. The report set out a series of recommendations to the Government including minimum standards established for all businesses operating on the internet, public bodies and the voluntary sector, and advised that online responsibilities, social norms and risks should be part of mandatory, Ofsted-inspected Personal, Social, Health and Economic (PSHE) education in all schools whatever their status (UK Parliament, 2017). Following their study ‘Growing up digital’ which called for mandatory digital citizenship education in schools, the Children’s Commissioner published digital citizenships resources in 2017 designed to help young people to understand their rights online (Children’s Commissioner, 2017).
There is uncertainty on the extent to which use of so-called ‘bulk powers’ comply with human rights standards. These powers permit large-scale interception and retention of private information, bulk interference with devices such as personal computers and mobile phones (hacking), and the retention and searching of extensive personal datasets containing private information, including about people in respect of whom there are no grounds of suspicion. A number of legal cases have challenged the use of bulk powers, and the sharing of personal information overseas following revelations by Edward Snowden about the extent of bulk data collection programmes used by the US and British intelligence agencies and data-sharing arrangements between the two countries (Amnesty International, 2015).
The Investigatory Powers Act 2016 (IPA) introduced major reforms to the legal and regulatory framework governing the collection, retention, and use of personal data by the state for law enforcement purposes including by the security services, police and other agencies. It followed criticism of the previous legislative framework over a number of years, including by us, as outdated, unclear, and lacking sufficient safeguards. Concerns remain, however, about the extent to which the IPA provides sufficient protections from abuse. A number of codes of practice provide essential further detail about the exercise of the powers in the Act. Many provisions in the IPA have not yet been brought into force whilst oversight arrangements are put into place.
A number of legal cases have challenged the use of bulk powers, and the sharing of personal information overseas
Is Britain Fairer?
179www.equalityhumanrights.com/britain-fairer
Participation

There have been legal challenges to powers in the Act that allow the retention of, and access to, communications data. On 27 April 2018 the High Court held that Part 4 of the IPA is incompatible with EU law and should be amended by 1 November 2018 (R (on the application of National Council for Civil Liberties) v SSHD Divisional Court [2018] EWHC 975). While other cases are still before the courts it remains uncertain whether a number of other aspects of the surveillance regime in UK law are fully compliant with fundamental rights in EU law. UN member states via the Universal Periodic Review, as well as the UN Committee on Civil and Political Rights, have urged the UK Government to strengthen individuals’ right to privacy, and ensure that any surveillance powers conform with their international human rights law obligations, in particular the principles of legality, proportionality and necessity.
The adequacy of legal safeguards governing retention of photographs and other intelligence by the police in England and Wales has been the subject of litigation and raises concerns about the surveillance of peaceful demonstrations affecting freedom to protest.151 Legal safeguards governing undercover policing in England and Wales have been scrutinised by the UK Parliament’s Home Affairs Committee (Home Affairs Committee, 2013) which raised concerns that the current legal framework fails to adequately safeguard the fundamental rights of those affected, including the right to respect for one’s private and family life and the right to peaceful protest. In 2015 an inquiry into undercover policing in England and Wales was established but has not yet concluded.
The Scottish Government has established an Independent Advisory Group on the Use of Biometric Data after a 2016 review of the use of photographic images by Police Scotland (HMICS, 2016). In March 2018, the Independent Advisory Group recommended that legislation should establish a code of practice covering the collection and use of biometric data, that distinct policies should be produced for the data of children aged between 12 and 17 years, and that there should be legislation to create an independent Scottish Biometrics Commissioner (Scottish Government, 2018a; 2017d).
151 In R (on the application of Catt) v Association of Chief Constable Officers of England, Wales and Northern Ireland the Supreme Court held that it was lawful for police to retain information on a national domestic extremism database about Mr Catt who is over 90 years old and of good character. He has no criminal record and is not suspected of any criminality. This case is currently before the European Court of Human Rights and judgment is awaited.
Is Britain Fairer?
180 www.equalityhumanrights.com/britain-fairer
Participation
The Data Protection Act 1998 has been repealed and replaced by a new Act (the Data Protection Act 2018) following the introduction of the GDPR and the Law Enforcement Directive.152 The purpose of the GDPR is to give citizens more control over their personal data. The GDPR recognises that children require specific protection when their data are collected and processed. It contains specific requirements in respect of children which the Information Commissioner’s Office (ICO) has explained further in guidance. Children have the same rights as adults over their personal data, including a right to erasure. When considering right to erasure requests, the fact that someone gave consent to processing when they were a child will be particularly relevant (Information Commissioner’s Office, 2018).
In 2017 the ICO published its strategy, Information Rights Strategic Plan 2017–2021. The strategy highlights a commitment to lead the implementation and effective oversight of the GDPR and associated data protection reforms; explore innovative and technologically agile ways of protecting privacy; strengthen transparency and accountability and promote good information governance; and protect the public in a digital world. The strategy highlights that the use of big data, artificial intelligence and machine learning has significant implications for privacy and data protection and steps must be taken to ensure that privacy and data protection are integral to big data analytics (Information Commissioner’s Office, 2017a).
US public policy relevant to the internet can have unforeseen and broad-spectrum consequences for British citizens in terms of privacy, and who has access to or an interest in their information. This has been demonstrated through the Digital, Culture, Media and Sport Committee’s inquiry into fake news (UK Parliament, no date).
OutcomesInternet use and awareness of privacy settings
Internet use has increased in Britain since 2015. While access to and use of the internet has increased, people are engaging with it through different modes. With the growth of social media people are more likely now to use a smartphone or tablet rather than a computer to go online. Adults that are online now spend more time using the internet in places other than their work or home, increasing from 66% in 2016 to 70% in 2017. More than half (58%) of newer users (those who started using the internet within the last five years) only use a device other than a computer to go online (Ofcom, 2018).
More than seven in 10 internet users (72%) say they are confident that they can manage who has access to their personal data online. Compared with the average (36%), 16–24 (48%) year olds are more likely to say they are ‘very confident’ while those aged 55 years and over are less likely (Ofcom, 2018).
152 As of June 2018, both the GDPR and Law Enforcement Directive were in force in the UK.
Is Britain Fairer?
181www.equalityhumanrights.com/britain-fairer
Participation

In 2015, fewer than one in five (17.8%) people in Britain said that security concerns led them to limit the personal information they provided to online communities for social networking (Table PPN.PRV.1). People aged 25–34 (13.2%) did this less than those aged 45–54 (21.1%). Between 2010 and 2015, the percentage of people who said they controlled the information they shared in this way declined by 3.5 percentage points overall.
In 2016, following changes to the wording of the survey question, nearly half (47.1%) of people in Britain said they limited access to their profile or content on social networking sites. Younger people (those aged 16-24 years old) did this more frequently (62.1%) than those aged 65 and over (18%).153
Research by Ofcom found that three in 10 internet users do not make adequate privacy or data security checks before entering their personal information online. One in eight internet users (12%) agreed they were happy to give personal information online if it was the only way to get the product or service they wanted (Ofcom, 2018). Millennials were less likely than older generations to safeguard their personal information (Information Commissioner’s Office, 2016), while younger people in Scotland were less likely to change their internet use as a result of security concerns (5Rights Youth Commission, 2017).
Together, this evidence suggests that while internet usage is increasing and we are engaging online via different modes, people in Britain have relatively low levels of awareness about online safety and are willing to engage in a trade-off to relinquish some control of their private data in order to access a service online.
Identity fraud in the UK rose to record levels in the first six months of 2017 to reach 89,000 victims of impersonation, with these frauds taking place almost exclusively online (Cifas, 2017).
Treatment of personal data
Owing to the small numbers of people in Britain who had used the internet in the last year and reported experience of abuse of personal information154 on community websites, there are few statistically significant results to report.155 In 2015, 2.6% of adults using the internet in the past year reported abuse of personal information while Black people (8.7%) were four times more likely than White British (2.2%) people to report abuse of personal information over the internet (Table.PPN.PRV.2).
Between 2010 and 2015, the percentage of people experiencing abuse of personal information over the internet declined by 1.8 percentage points overall and by 4.4 percentage points for people aged 25–34 years. It declined by 1.5 percentage points for White British people. Interpreting these figures is challenging as people may not necessarily be aware that they have experienced abuse of personal information over the internet, or may not recognise this behaviour as abuse in order to be able to answer this question, and so the true volume of experiences may be higher.
153 Opinions and Lifestyle Survey, Internet Access Module 2016 survey.
154 Characterised as abuse of personal information sent on the internet and/or other privacy violations (e.g. abuse of pictures, videos, personal data uploaded on community websites).
155 Opinions and Lifestyle Survey: Internet access – households and individuals 2015.
Is Britain Fairer?
182 www.equalityhumanrights.com/britain-fairer
Participation

Overall, the UK public are more likely to trust public bodies than private companies or organisations regarding holding or sharing their personal information. Younger UK adults report being more positive towards both of these than older people. Despite this, there is a limited understanding of how people’s personal information is made available and is used, with only 8% of the UK public saying they have a good understanding of how their information is made available to third parties and the public by companies and organisations in the UK (Information Commissioner’s Office, 2017b). Attitudes towards state surveillance of digital communications vary by age, with people aged under 60 years being more likely to see UK state actions as going too far and as an infringement upon the right to privacy; younger people and ethnic minorities are most concerned about lack of transparency and consent when it comes to state surveillance of digital communications (Bakir, Cable, Dencik, Hintz and McStay, 2015).
A 2017 poll suggested that nearly half (48%) of UK adults planned to use new rights over their personal data when the GDPR came into force in May 2018. This varies by region, with only 12% of adults in Wales planning to use the forthcoming rights (GDPR:Report, 2017).
According to studies, surveillance of people (through CCTV) and targeted surveillance of digital communications (smartphone location tracking) are more accepted by the UK public than blanket surveillance of digital communications. Although the UK public think that certain surveillance technologies are useful and/or effective for combatting national security threats, they think that they compromise human rights and are abused by security agencies (Bakir, Cable, Dencik, Hintz and McStay, 2015).
7.5 Social and community cohesion
Key policy and legal developmentsPublic discourse and policy making around social cohesion in Britain has focused predominantly on the impact of immigration and integration and the exclusion of ethnic minorities. Initiatives designed to tackle problems have been marred by a lack of consistency, coordination and leadership across national and local governments.
In 2015, the UK Government commissioned Dame Louise Casey to undertake a review into integration and opportunity in isolated and deprived communities in Britain. The review, published in 2016, found that the unprecedented pace and scale of population change has affected particularly deprived areas. The report also found that problems of social exclusion have persisted for some ethnic minority groups and that poorer White British groups in some areas are falling further behind in education and employment. The report raised concerns about a lack of consistency or continuity in UK Government policy, stating that work done has often been ‘piecemeal and lacked a clear evidence base or programme of evaluation’.
Is Britain Fairer?
183www.equalityhumanrights.com/britain-fairer
Participation

% of people that said most people in their area could be trusted (2016/17)
England
42.0%Adults
58.0%75 and over
24.8%16-24 years
28.6%Ethnicminorities
Breakdown
45.2%White British
33.9%White Other
27.0%Mixed
29.0%Indian
26.6%Pakistani
17.6%Bangladeshi
26.3%Chinese
20.6%Black
28.4%Other
Figures from 2015 in Scotland put trust at 61.4%.
Figures from Wales in 2016/17 put trust at 8.7% but a different survey was used in Wales looking at people trusting other people in general, rather than their local community.
Recommendations included a UK Government programme to help improve community cohesion, such as the promotion of English language, raising employment outcomes, increasing participation of women in the labour market, boosting out of school mixing between young people, and a list of indicators of a potential breakdown in integration, to be led by central and local government (UK Government, 2016, p.148).
The UK Government launched its Integrated Communities Strategy Green Paper for consultation in March 2018. This set out goals to tackle lack of integration in England through social mixing in neighbourhoods and schools, unemployment and English language skills. It called for central government but also local government, civil society, business and communities to promote integration and tackle social isolation. It set out a commitment of £50 million to support delivery of the priorities set out in the Green Paper, including an integration innovation fund to test different approaches to build understanding of what works in promoting integrated communities. The UK Government set out plans to work with five local authorities in England as the first Integration Areas to develop local integration plans: Blackburn and Darwen, Bradford, Peterborough, Walsall and Waltham Forest (MHCLG, 2018a).
Is Britain Fairer?
184 www.equalityhumanrights.com/britain-fairer
Participation

Following ‘Is Britain Fairer?’ in 2015, our ‘Healing a Divided Britain’ report (EHRC, 2016b) was a catalyst for the UK Government’s Race Disparity Audit. Following on from the Race Disparity Audit, in January 2018 the Ministry for Housing, Communities and Local Government launched a fund in collaboration with the Department for Education and the Department of Health and Social Care to support a series of pilot projects intended to improve outcomes for Gypsies, Roma and Travellers in England. The projects will be delivered in 2018/19 (MHCLG, 2018b; Cromarty, 2018).
The Welsh Government’s community cohesion national delivery plan for 2016/17 set out seven outcomes around: hate crime; modern slavery; increased engagement and awareness across Gypsies and Traveller communities; immigration and supporting the inclusion of asylum seekers, refugees and migrants; understanding the impact of poverty; and that policies and services are responsive to community tensions including supporting engagement with communities impacted through Prevent (Welsh Government, 2016).
61.6%In 2016/17, the amount of people in England that felt that they belonged in their immediate neighbourhood, a fall of 8.5pp since 2013/14.
Living in an urban area with higher levels of deprivation is negatively related to high levels of community cohesion (NatCen, 2018). Part 1 of the Equality Act 2010 could help to tackle this, as it imposes a duty on certain public bodies, when making decisions of a strategic nature, to consider how they can reduce inequalities resulting from socio-economic disadvantage. However, the duty, which was approved by Parliament, has still not been implemented in England or Wales. The Welsh Government gained the power to introduce the duty on 1 April 2018 under the Wales Act 2017. In Scotland the duty (now called the Fairer Scotland Duty) came into force on 1 April 2018. The Scottish Government has published interim guidance for public bodies on the duty (Scottish Government, 2018b).
In Wales, the Well-being of Future Generations (Wales) Act 2015 imposes new duties on public bodies to work towards improving wellbeing, including by improving equality and social cohesion.
Is Britain Fairer?
185www.equalityhumanrights.com/britain-fairer
Participation

% of people in England who felt that they belonged in their immediate neighbourhood (2016/17)
England
61.6%
Breakdown
75.6%75 and over
59.4%Ethnic minorities
47.5%16-24 years
Scotland, 2015 – 77.6% of people living in Scotland felt they belonged in their immediate neighbourhood
Wales, 2016/17 – 71.6% agreed they belong in their local area (a fall from 85% in 2013/14)
% of people who felt they could trust people in their neighbourhood (2015)
Scotland
61.4%
Breakdown
35.8%16-24 years
79.1%75 and over
41.5%Ethnic minorities
62.1%White people
In2016/17aroundtwoinfiveadultsin England (42.0%) said that many people in their neighbourhood could be trusted
Is Britain Fairer?
186 www.equalityhumanrights.com/britain-fairer
Participation

OutcomesTrust and sense of belonging in the local neighbourhood
In 2016/17 around two in five adults in England (42.0%) said that many people in their neighbourhood could be trusted (Table PPN.CSN.1).156
Those aged 75 years and over (58.0%), White British people (45.2%) and those in higher managerial, administrative and professional occupations (59.4%) were more likely to say that many people in their neighbourhood could be trusted compared with those aged 16–24 (24.8%), people from ethnic minorities (28.6%), and those in routine or semi-routine occupations (32.9%) or those who have never worked or who are long-term unemployed (27.6%).
Between 2013/14 and 2016/17, the proportion of people in England who said they could trust their neighbours increased by 3 percentage points, in particular among ethnic minorities (5.9 percentage points) and specifically those from Other White (13.5 percentage points from 20.4% to 33.9%) ethnic backgrounds, and those who had never worked or who had been long-term unemployed (11.4 percentage points).
In Scotland and Wales the pattern was largely similar, although between 2013 and 2015 there was no significant change in Scotland (61.4% in 2015) and trust dropped between 2013/14 and 2016/17 in Wales (5.4 percentage points to 8.7%). These differences cannot be compared because in Scotland they refer to trust in the local neighbourhood, but in Wales they refer to trust in people in general.
In Scotland, in 2015, disabled people (and specifically those with mental health conditions) were less likely to be trusting of people in their local area (56.3%) than non-disabled people (63.6%), while people aged 75 and over (79.1%) and those living rurally (73.6%) were more likely to be trusting than those aged 16–24 years (35.6%) and those living in urban areas (58.7%). Between 2011 and 2015 trust declined among people from religious minorities.
In Wales in 2016/17 people with mental health conditions and learning difficulties (4.3%) were less likely to be trusting of people in general than non-disabled people (8.5%). As in Scotland, older people aged 65–74 years (12.5%) were more likely to be trusting, as were those living in a village, hamlet or isolated dwelling (11.4%) compared with those in urban areas (7.7%).
156 England: Community Life Survey; Scotland: Scottish Health Survey; Wales: National Survey for Wales, Measures for England, Scotland and Wales are not comparable.
Is Britain Fairer?
187www.equalityhumanrights.com/britain-fairer
Participation
In 2016/17, 61.6% of people living in England felt that they belong to their immediate neighbourhood (Table PPN.CSN.2), with older people more likely to agree (75.6% of those aged 75 and older) compared with 16–24 year olds (47.5%).157 Between 2013/14 and 2016/17, the proportion of people who felt they belonged to their neighbourhood dropped by 8.5 percentage points, and by 17.1 percentage points for people aged 16–24 years.
In Scotland and Wales the pattern was largely similar. In 2015, 77.6% of people living in Scotland felt they belonged to their immediate neighbourhood, and this was particularly the case among people aged over 65 years. White people in Scotland (78.2%) were more likely to feel they belonged compared with those from an ethnic minority background (64.3%), as were those living rurally (84.9%) compared with those living in urban areas (76.2%). In 2016/17, 71.6% of adults living in Wales agreed they belong to their local area, with older people (86.1% of those aged 75 and over) more likely to agree and younger people aged 16–24 (61.8%) less likely, and those living rurally more likely to agree than those living in urban areas. In Wales, people with mental health conditions (57.7%) were less likely to agree than non-disabled people (72.5%), and people identifying as LGB or other sexual orientation (63.0%) were less likely to agree than those identifying as heterosexual or straight (71.6%).
Social and community cohesion; building relationships to counter radicalisation and extremismResearch has revealed a mixed picture of community cohesion in Britain, with complex drivers and marked by important inequalities (NatCen, 2018). The study found that half (50%) of British adults agreed they have a strong sense of community, with a similar level (55%) agreeing that different people get on well together in their local area. Neighbourliness (for example, feeling able to ask neighbours for favours) and having positive experiences of social mixing with neighbours are important factors in views on community cohesion (NatCen, 2018).
Prevent is a strand of the UK Government’s Counter-Terrorism Strategy which is designed to support people at risk of joining extremist groups and carrying out terrorist activities. Critiques of the Government’s Prevent policy to counter extremism have included that its focus on security has worked against other Government priorities such as community cohesion, it focuses too much on Islamic extremism to the neglect of far-right extremism, and that it does not tackle underlying inequalities (Tinkler, 2016). To date there has been no robust published evaluation of the impact of the Prevent strategy on community cohesion.
157 England: Community Life Survey; Scotland: Scottish Household Survey; Wales: National Survey for Wales, Measures for England, Scotland and Wales are not comparable.
Is Britain Fairer?
188 www.equalityhumanrights.com/britain-fairer
Participation

In 2016/17, 6,093 individuals in England and Wales were referred to Prevent due to concerns that they were at risk of being drawn into terrorism, with 12% still receiving Channel158 support in March 2018. Of those referred, 61% were referred for concerns relating to Islamist extremism, and 16% for concerns relating to right-wing extremism. Most of the individuals that went on to be discussed at a Channel panel (760; 66%) and those that received Channel support (184; 55%) were referred for concerns relating to Islamist extremism. Twenty-four per cent (271) of those discussed at a Channel panel and 37% (124) who received Channel support were referred for right-wing extremism-related concerns (Home Office, 2018).
In 2016/17, Police Scotland received 59 Prevent referrals, down from 81 in 2015/16. Of the referrals in 2016/17, 15 related to right-wing extremism, 13 related to international extremism, 11 related to ‘other’ and 20 were unspecified. Most referrals were for men (53). Two of the referrals were accepted into the Prevent Professional Concerns process which requires a case conference involving multi-agency partners, 31 were referred to other services and 26 were determined to require no further action (Police Scotland, 2017).
Community interaction and use of common spaces; access to, and exclusion from, engaging with the local communityA survey conducted in 2017 found that fewer than half of LGBT young people in Scotland (43%) said that there were enough places where they could socialise safely and be open about their sexual orientation or gender identity. The age of the respondents did not affect these findings (LGBT Youth, 2017).
Stonewall Cymru polled over 1,200 LGBT people in Wales and found that many still experience poor treatment while using public services and going about their lives; a third (30%) said that they avoid certain streets because they do not feel safe, while two in five (39%) would not feel comfortable walking down the street while holding their partner’s hand. This increases to three in five gay men (57%) (Stonewall Cymru, 2017). The Government Equalities Office ran a survey in 2017 to understand the experiences of LGBT people living in the UK, with the findings due in 2018 (UK Government, 2017f).
Loneliness can be related to low levels of community cohesion or social exclusion. In England, 5% of adults reported feeling lonely ‘often’ or ‘always’ in 2016/17. Younger people aged 16–24, women, single people, and people with poor health or who have conditions they describe as ‘limiting’ were particularly likely to report feeling lonely. People who felt they belonged less strongly to their neighbourhood or had little trust of others in their local area reported feeling lonely more often. The report suggested a set of ‘protective characteristics’ against loneliness which included living as a couple and having a strong sense of belonging to the neighbourhood (ONS, 2018).
158 The Channel programme in England and Wales is a voluntary initiative that provides a multi-agency approach to support people vulnerable to being drawn into terrorism.
Is Britain Fairer?
189www.equalityhumanrights.com/britain-fairer
Participation

In Scotland, a 2018 report examining older data on the prevalence of social isolation and loneliness found that one in 10 adults often felt lonely, and four in 10 sometimes felt lonely. Adults who were from deprived areas, were in debt, were economically inactive, had mental health conditions or who were women, were more likely to report experiencing loneliness (NHS Scotland, 2018). The Scottish Government has recently consulted on social isolation and loneliness and is expected to publish a strategy.
The National Survey for Wales for 2016/17 found that 17% of people in Wales were lonely, while more than half (54%) had experienced some feelings of loneliness. This was particularly likely among people living in material deprivation, as well as more likely among younger people, people from ethnic minorities, and people with limiting long-term illnesses, with the impact of this being greater for younger people. An inquiry by the National Assembly for Wales Health, Social Care and Sport Committee into loneliness and isolation found that these are some of the most significant issues facing older people, with around a quarter of older people in Wales reported being lonely or socially isolated (National Assembly for Wales, 2017b).
7.6 ConclusionPolitical and civic participation has opened up for new groups, including 16 and 17 year olds being able to vote in Scottish elections and prisoners released on temporary licence having the ban on voting lifted in England and Wales. Barriers to voting remain for some groups, however, and women remain under-represented among MPs, on public boards and the judiciary despite clear steps being taken by the UK and devolved governments. Unfortunately, the true scale of under-representation for people from ethnic and religious minorities, disabled people and for LGBT people remains unclear because of lack of data.
Access to transport services is in danger of becoming more restricted for some users. Reduced bus services, inconsistency in government efforts to ensure access to transport for disabled users and increasing violent and hate crime on the railways are significant concerns. Similarly access to leisure and cultural services is lower among disabled people, older people, women and lower socio-economic groups, with physical accessibility being key for disabled people.
Is Britain Fairer?
190 www.equalityhumanrights.com/britain-fairer
Participation

The move towards digitisation of services and communication presents new opportunities for living an independent and socially included life, improving access to services and social interaction, particularly for disabled and older people. These groups who may most benefit have seen the greatest improvement in using the services but they remain the most excluded, with at least a fifth of disabled and older people still not accessing the internet.
All the governments in Britain are introducing policies to encourage safer use of digital services and the internet, and to use new technology effectively. Concerns persist, however, regarding the abuse of such technology through investigative powers or bulk information gathering and retention. This is particularly relevant as the amount of people who do not share information online is few and declining and there is evidence that users have limited understanding of how their personal data are used by third parties.
The focus on community cohesion within government continues to address the economic exclusion of certain ethnic minority groups. While this is consistent with some of the evidence, other groups are at risk of exclusion too. Evidence suggests that LGBT people and young people find it harder than other groups to find socialising spaces, and older and disabled people, and those with limited English language skills, can suffer loneliness and isolation.
Older and disabled people, and those with limited English language skills, cansufferlonelinessandisolation
Is Britain Fairer?
191www.equalityhumanrights.com/britain-fairer
Participation

8. Conclusion This report seeks to answer the question ‘is Britain fairer?’ – has the realisation of equality and human rights for people in Britain improved since our last report in 2015?
Is Britain Fairer?
192 www.equalityhumanrights.com/britain-fairer
Conclusion

This report seeks to answer the question ‘is Britain fairer?’ – has the realisation of equality and human rights for people in Britain improved since our last report in 2015? The answer is ‘yes and no’. The evidencepointstofoursignificantfindings.
In the domains of work, education and participation we can see overall increases in employment, a narrowing of educational attainment gaps between some groups who share protected characteristics, and an increase in levels of political participation for most groups.
Government policies on social security and taxation have increased pressure on living standards for some groups, particularly disabled people, women and some ethnic minorities. Poverty levels have not improved and our review shows a clear and continuing relationship between poverty, lack of educational success and poorer health outcomes, with all three interacting to create multiple disadvantage.
People sharing certain protected characteristics continue to experience poorer outcomes across different areas of life. While women have some of the most equal employment and education outcomes they have ever had, the prevalence of societal gender norms and experiences of harassment and violence obstruct this progress. Disabled people are not experiencing the progress seen for other groups, with gaps in educational attainment and employment widening rather than narrowing, fewer accessing digital services, and poorer experiences of the criminal justice system. While there are narrower disparities in employment and education for some ethnic minorities, for others detention is still far too prevalent and trust in the criminal justice system is low.
Finally, our evidence shows a reversal of the improvements in justice and personal security that we observed in 2015. Government policies introduced since our last review have limited access to justice and fair representation, and there has been a deterioration in conditions of detention and an increase in identity-based violence.
Our evidence shows a reversal of the improvements in justice and personal security that we observed in 2015
Is Britain Fairer?
www.equalityhumanrights.com/britain-fairer 193
Conclusion

Steps in the right direction There have been overall improvements in outcomes, and reductions in inequalities, in education, political participation and work. Successive UK and devolved governments have pursued policies to improve attainment and widen participation at university. More children are achieving the required standards at primary and secondary school and this is raising attainment for traditionally lower-achieving groups, so that differences between girls and boys, white and ethnic groups, are narrowing. Access to university has improved and reached parity for many groups, but gaps in achievement at university remain for ethnic minority and disabled students. Across the population as a whole, more people were employed and fewer people unemployed, finally exceeding the levels seen pre-recession in 2008. For some groups, such as women, Pakistani and Black people, we can see that gaps are closing with men or with the overall population. A small increase in people moving from low-pay occupations into higher pay occupations is also positive news, although there has also been a rise in the number of people in insecure employment, particularly for some ethnic minorities..
There have also been encouraging improvements in political participation. More people participated in politics in recent years, with more people voting between 2015 and 2017, despite an overall decline since 2010. A particularly volatile political period with multiple elections and referendums across Britain may have contributed to this increase. Participation among ethnic minorities and young people also increased, although these groups were still less likely to vote. The franchise for Scottish elections was extended to 16 and 17 year olds in 2015 and further changes may be on the horizon following a consultation in Wales on reducing the voting age. The UK Government has committed to ending the blanket ban on prisoner voting.
The ability to access general services is also improving as a result of better internet access – a key requirement for the Government Transformation Strategy to increase access to services online – and this is particularly benefiting the most excluded groups: disabled people and older people. However, an over-reliance on online services risks limiting access to services for those who do not or cannot use the internet.
More children are achieving the required standards at primary and secondary school
Is Britain Fairer?
www.equalityhumanrights.com/britain-fairer194
Conclusion

Socio-economic disadvantage Living standards in Britain have deteriorated since our last review and this has a broader effect on people’s life chances. Socio-economic disadvantage and deprivation are strongly linked to poorer outcomes in education and health. People from the most deprived households have significantly lower educational attainment, putting them at a lifelong disadvantage in the employment market. The groups with the highest levels of poverty have seen no change, indicating a cycle of disadvantage that is perpetuated and entrenched across generations. There has been little change in levels of adult poverty, with a fifth of adults in Britain still living in poverty. Child poverty has increased: three in 10 children in Britain live in poverty, rising to half of Black Caribbean, Black African and Pakistani children. Over a third of disabled people experience material deprivation, nearly three times that of non-disabled people. While there has been some decrease in adults experiencing material deprivation, it is not clear whether this is due to increases in debt rather than a stronger financial position.
Pakistani, Bangladeshi, Black African and Black Caribbean people are more likely to live in poverty and more likely to experience material deprivation than people of other ethnicities. Fewer young people from these groups, along with Gypsies, Roma and Travellers,159 achieve the required standards of education, and people from these groups have the lowest levels of employment. Socio-economic disadvantage is also associated with poor health outcomes. There is an established increased risk of infant mortality related to maternal deprivation, with some groups who experience deprivation the most, such as Pakistani and Black African groups, also at greater risk of infant mortality. While increased prevalence of conditions such as obesity and diabetes contribute to this higher risk of infant mortality, deprivation is also a factor. The decades-long decrease in infant mortality has stalled and there is a danger that ongoing and intergenerational poverty is entrenching disadvantage for these groups.
Our evidence shows that certain government policies have disproportionately affected the incomes of certain groups, compounding the disadvantage they already experience. Our cumulative impact assessments evidenced that tax and social security changes since 2010 have reduced income for women, some ethnic minority groups such as Bangladeshi households, disabled people and lone parents more than for other groups and are projected to continue to do so.
159 Gypsies, Roma and Travellers are not included in the poverty statistics so we cannot correlate their attainment with levels of deprivation.
Is Britain Fairer?
www.equalityhumanrights.com/britain-fairer 195
Conclusion

We have seen other poor outcomes in the areas of health and living standards, with many organisations citing inadequate resources to meet demand. Waiting times for treatment have increased, and barriers to accessing healthcare persist for ‘at-risk’ groups such as homeless people, refugees and asylum seekers, disabled people and Gypsies, Roma and Travellers. Parity of esteem for mental health care is a positive aspiration of UK and devolved governments, but has been constrained by limitations on funding. Homelessness has increased, with groups such as asylum seekers, refugees and disabled people at greater risk. There are not enough accessible and adaptable homes to meet the needs of disabled people, with demand outstripping supply, and social care provision is limited by funding shortfalls. Pressures on public service resources at both national and local levels are limiting access to adequate healthcare and housing for some at-risk groups and groups sharing some protected characteristics.
Some groups being left behind
Disabled people falling further behindDisabled people are falling further behind in many areas, with many disparities with non-disabled people increasing rather than reducing. While overall employment rates have improved for disabled people, the gap with non-disabled people has widened. We recognise that full-time employment is not always an option for some disabled people, but those currently in employment should not experience deteriorating opportunities. The small overall shift toward higher pay occupations is not benefiting disabled people; in fact, the number of disabled people in low-pay occupations has increased. In education, it is a matter of great concern that disabled children with support needs are significantly more likely to be excluded from schools than non-disabled children. We hope that the recent legal case we funded, that extended disability discrimination protection at school to children whose impairment can make them more likely to be aggressive, will start to reverse this trend.
As we’ve seen, disabled people are more likely to live in poverty and live in material deprivation; they are finding it difficult to get accessible housing, and are at greater risk of homelessness. For those whose impairment means they are unable to work full-time, disability benefits are a lifeline. However, disabled people are among those worst affected by welfare reforms since 2010.
There are not enough accessible and adaptable homes to meet the needs of disabled people
Is Britain Fairer?
www.equalityhumanrights.com/britain-fairer196
Conclusion

Disabled people report much lower rates of good health, and the life expectancy for people with learning disabilities is between 14–18 years shorter than that of non-disabled people. Disabled people are more likely to experience domestic abuse, particularly those with mental health conditions, yet less than half of disabled adults in England and Wales felt that the criminal justice system is effective. The gaps between disabled people and non-disabled people are widening in many areas and disabled people are frequently falling behind other groups.
Challenges to women’s safety and career progressionFor women, many indicators show a considerable narrowing of disparities and positive trajectories. Girls outperform boys at school and more attend university. The representation of women on private and public boards and in elected office has improved, although they remain significantly under-represented. However, our evidence shows high levels of bullying, harassment and negative experiences reported in both workplaces and educational settings. We also found that subject choice for women at university appeared to be significantly gendered. So, while on the face of it women are experiencing more equal outcomes in many areas, their experiences of violence and harassment and the restrictions arising from perceived gender norms still have an impact across multiple domains of life. This indicates that strong gender stereotypes persist in British society and continue to hold women back.
Some ethnic minority groups falling behindOutcomes for people from ethnic minorities are mixed; some continue to succeed while others have poorer experiences. More Chinese and Indian children achieve the required qualifications than other ethnic groups, and Indian and Other White ethnic groups have the highest employment. However, some ethnic minority groups continue to lag behind. Pakistani and Bangladeshi people are still less likely to be employed, more likely to be unemployed and are disproportionately represented in insecure employment. It is encouraging that gaps have narrowed, with Pakistani and Black groups experiencing the fastest increase in employment, although they are among the most deprived.
Gypsies, Roma and Travellers are particularly disadvantaged: they have the poorest attainment levels at school and are more likely to be excluded from school. They also face barriers to accessing healthcare and have poorer health outcomes. Gypsies, Roma and Travellers are also at higher risk of homelessness and experiencing poor housing. These findings are all indicative of a group experiencing extreme poverty but lack of available poverty data for this group means that they are invisible in official poverty statistics.
Gypsies, Roma and Travellers are also at higher risk of homelessness and experiencing poor housing
Is Britain Fairer?
www.equalityhumanrights.com/britain-fairer 197
Conclusion

Poverty has decreased for some other ethnic minorities (Black Caribbean), while for others (Mixed ethnicity) it has increased. People from ethnic minorities are also over-represented among homeless people, are more likely to live in overcrowded conditions, and there is evidence of barriers to their accessing healthcare. As noted above, some groups have higher rates of infant mortality distinct from those associated with poverty. The criminal justice system continues to be trusted less among Black Caribbean people, while the continued over-representation of Black people in prisons or mental health detention remains a concern. While some of these disparities intersect with higher prevalence of socio-economic disadvantage, they are not explained by it entirely. The relationship between ethnicity, socio-economic status and poor social outcomes is complex and needs further exploration if these persistent disparities are to be reduced.
There is some evidence of poorer outcomes for other protected characteristic groups. LGBT people experience high levels of domestic abuse. ‘At-risk’ groups such as homeless people, carers, refugees and asylum seekers also experience barriers to healthcare and are at greater risk of homelessness and other adverse outcomes. There are some differences between people of certain religions; Christians have experienced a small decrease in employment in comparison with people of no religion, and Muslims experience the lowest employment and poorest health outcomes of any religious group. Our evidence also shows high levels of discrimination against pregnant women in employment. Older people are less likely to be treated with dignity in social care and are at greater risk of suffering isolation or being excluded from transport or other services. However, there are significant gaps in our knowledge on the experiences and outcomes of these groups because they have limited visibility in national data sources.
Moving backwards on justice and personal securityIn justice and personal security, we have seen a regression in the improvements we recorded in our 2015 review. Overall, we have observed decreasing access to justice, deterioration in conditions of detention, and risks to personal security for many groups that share protected characteristics.
The introduction of fees, which were subsequently repealed, for taking cases to employment tribunals, and restrictions on legal aid have reduced access to justice and this has had a disproportionate impact on certain groups, such as women and disabled people.
Conditions of detention have also deteriorated, evidenced by overcrowding in a high proportion of adult prisons in England and Wales and increases in self-harm and assaults in prisons across Britain. While we welcome the reduction in overall numbers of young people in custody, Black people continue to experience disproportionately high rates of detention in adult prisons across Britain and in the youth estate and under the Mental Health Act in England and Wales. Black people also continue to have lower levels of trust in the criminal justice system in England and Wales. It is encouraging that the UK Government has accepted most of the recommendations of the Lammy Review and we urge their speedy implementation.
Is Britain Fairer?
www.equalityhumanrights.com/britain-fairer198
Conclusion
While increases in police-recorded sexual offences and hate crime may be indicative of better recording or more confidence in reporting, levels of identity-based violence remain a concern. Women, disabled people, particularly those with mental impairments, and lesbian, gay and bisexual people are more likely to be victims of domestic abuse and sexual violence. Evidence also suggests that girls, LGBT young people and disabled young people are more likely to experience bullying in school, and, along with people from ethnic minorities, more likely to experience harassment and discrimination in the workplace. Identity-based victimisation is still a common experience for many.
Gaps in the dataAcross the indicators that we have analysed, our review provides a comprehensive picture of the issues relating to disability, ethnicity and sex. However, the scarcity of primary quantitative data means that the experiences and outcomes of other groups are less clear.
In relation to LGBT people, while individual research on specific subjects provides snapshots of evidence of poor outcomes, data is insufficient to determine whether these gaps have improved or deteriorated over the period of our review. Part of this is due to sensitivities around asking questions on sexual orientation and gender identity, which are necessary to classify respondents within administrative data or surveys. Although it fell outside our cut-off deadline for inclusion in this report, we welcome the UK Government’s National LGBT Survey which sheds more light on these issues, and the Government’s commitment in its LGBT action plan to develop monitoring standards for sexual orientation and gender identity.
Lack of data on religion and belief and pregnancy and maternity limits our ability to observe progress over time in many domains. This means that the true scale of adverse outcomes and levels of representation in many aspects of life is unclear for people of different religions, for women who are pregnant and for new mothers.
While some evidence is available on experiences of bullying and harassment, particularly of women, this is not the case across all protected characteristics, and not in a systematic way that is robust and longitudinal. Our work to develop a national barometer of prejudice and discrimination indicates that there are common experiences of prejudice across several protected characteristics. In order to clarify the extent of these experiences consistently across groups and across time, we recommend that the Government should put in place a systematic method for examining bullying, harassment, prejudice and discrimination across Britain.
Evidence also suggests that girls, LGBT young people and disabled young people are more likely to experience bullying in school
Is Britain Fairer?
www.equalityhumanrights.com/britain-fairer 199
Conclusion

9. Recommendations for action
The following recommendations are basedonthefindingsineachchapter,with additional recommendations to strengthen the legal framework protecting equality and human rights andtofillgapsinevidence.
Is Britain Fairer?
www.equalityhumanrights.com/britain-fairer200
Recommendations

The following recommendations are based onthefindingsineachchapter,withadditional recommendations to strengthen the legal framework protecting equality andhumanrightsandtofillgapsinevidence. Our recommendations identify the organisations we consider need to take action to address the key equality and humanrightsissuesidentifiedinourreport.
Having identified the issues and the changes that need to be made, our own role will be to work with others to help them effect change, and to use our range of powers to influence policy and legislative change, improve compliance with the law and enforce the law when it is breached.
Realising equality and human rights for everyone 1. In order to use the leverage of public
services and resources to address the findings of inequality in this report, governments across Britain and all public bodies should, in performing their Public Sector Equality Duty, set equality objectives or outcomes and publish evidence of action and progress in relation to our key findings that relate to their functions.
2. Governments across Britain should review how the Public Sector Equality Duty specific duties could be amended to focus public bodies on taking action to tackle the key challenges in this report.
3. To ensure that public bodies work together to reduce the inequalities linked to socio-economic disadvantage, the socio-economic duty should be brought into force in England and Wales by the UK and the Welsh Governments as a matter of urgency.
4. Governments across Britain should implement all provisions of the Equality Act 2010 outstanding in their nation, within their remit. This includes the duty to make reasonable adjustments to common parts of rented residential properties, the requirement for political parties to report on diversity of candidates, and the explicit prohibition of caste discrimination.
5. The UK Government should make a clear commitment to remaining permanently within the European Convention on Human Rights, and should publish action plans for implementing UN recommendations on human rights.
6. The UK Government should ensure that equality and human rights protections are safeguarded and enhanced during the Brexit process and beyond, and should legislate to replace gaps in rights in domestic law resulting from the loss of the EU Charter of Fundamental Rights.
Is Britain Fairer?
www.equalityhumanrights.com/britain-fairer 201
Recommendations

Education7. To address the key inequalities in education
identified in IBF 2018, relevant government departments, listed education bodies and inspectorates should take action under their Public Sector Equality Duty obligations to:
i. address the attainment gaps for children sharing certain protected characteristics (including boys, disabled children and Gypsy and Traveller children)
ii. reduce the high exclusion rates for children with certain protected characteristics (including boys, disabled children and Gypsy and Traveller children)
iii. increase the inclusion of disabled children in mainstream education in England and Wales
iv. tackle and reduce bullying, including prejudice-based bullying and sexual harassment, and
v. improve equality of access to and attainment in higher education.
8. Governments in England and Wales should extend to children under 16 the right to be heard before exclusion and to appeal against exclusions, and ensure that children are provided with legal advice and assistance throughout the exclusions appeal process.
9. The UK Government should amend Regulation 4(1) of the Equality Act 2010 (Disability) Regulations 2010 so that disabled children who may have ‘a tendency to physical abuse of other persons’ arising from their impairment are afforded the full protection of the Act.
10. To progressively increase the inclusion of disabled children in mainstream education:
i. The UK Government should remove its reservations to Article 24 (the right to inclusive education) of the United Nations Convention on the Rights of People with Disabilities, and set out the practical steps it will take to implement its stated commitment to ensuring disabled children have increasing access to mainstream schools and staff.
ii. Governments across Britain should ensure that all teachers are equipped with the understanding and skills to teach disabled pupils.
11. To tackle and reduce bullying, including prejudice-based bullying and sexual harassment, governments across Britain should:
i. ensure that systems are in place in schools to record and monitor prejudice-based bullying incidents and sexual harassment and use the data to inform their plans to tackle it, and
ii. ensure that teachers receive professional development on and support in recognising, recording and challenging bullying, including prejudice-based bullying and sexual harassment, throughout their careers.
Is Britain Fairer?
www.equalityhumanrights.com/britain-fairer202
Recommendations

12. To improve equality of access to and attainment within higher education, governments and higher education providers in England and Wales should mitigate the impact of tuition fees in England and Wales on students from lower socio-economic groups, including female Muslim students and White British and Black Caribbean students.
13. To improve the representation of women in science, technology, engineering and maths (STEM) courses in universities, governments and their agencies across Britain should ensure that careers guidance and work experience opportunities tackle stereotypes and encourage wider subject and career choices for women and girls, from primary school onwards.
Work14. To improve employment rates for disabled
people, the UK Government should set interim targets for its commitment to supporting one million more disabled people into work over the next 10 years; report regularly on progress, including by impairment group; and identify steps if progress is insufficient.
15. To address the gender pay gap, improve access to work for older workers and those with mental health impairments, and close the disability employment gap:
i. the UK Government should introduce the right for all employees to request flexible working from day one, and
ii. employers should offer all jobs, including the most senior, as open to flexible or part-time working, unless there is a justifiable business reason to prevent it.
16. To address the ethnic minority and disability pay gaps:
i. the UK, Scottish and Welsh Governments should work together to provide clear guidance on the classification system to be used for ethnicity and disability monitoring by all types of organisations, and practical guidance for different types/sizes of employers on how to collect, report on and use the data. This should enable cross-country comparison and we will do this in partnership with the Office for National Statistics..
ii. Once systems are in place, the UK Government should require private, voluntary and those public sector employers not in the scope of the Scottish and Welsh Public Sector Equality Duty specific duties, to monitor and report on ethnicity and disability in recruitment, retention and progression. This should apply to organisations with more than 250 employees.
iii. The UK Government should require those private, voluntary and public sector employers not in the scope of the Scottish and Welsh specific duties to publish a narrative and action plan with time bound targets, informed by analysis of their ethnicity and disability data.
Is Britain Fairer?
www.equalityhumanrights.com/britain-fairer 203
Recommendations
17. To reduce workplace harassment and victimisation:
i. the UK Government should introduce a mandatory duty on employers to take reasonable steps to protect workers from harassment, sexual harassment and victimisation under the Equality Act 2010 in the workplace, and introduce a statutory code of practice on preventing and responding to sexual harassment and other harassment at work, and
ii. the UK Government and employers should implement all the other recommendations in our 2018 report, ‘Turning the Tables’.
18. To reduce pregnancy and maternity discrimination and disadvantage, the UK Government should:
i. amend the Equality Act 2010 to prohibit employers asking job applicants questions related to pregnancy and maternity
ii. extend the time limit for bringing cases to employment tribunals for discrimination and harassment to six months, and
iii. reinstate the power of employment tribunals to make recommendations to reduce discrimination in the wider workforce.
19. To increase the numbers of women, people from ethnic minorities and other under-represented groups on company boards and in senior positions, companies and employers across Britain should: set and report against targets; seek advice from independent consultancies experienced in making diverse appointments; advertise widely; and use positive action and tie-break provisions to promote or recruit equally qualified diverse candidates.
20. To improve access to work for women, ethnic minorities and disabled people, and address gender segregation, governments across Britain should hold apprenticeship providers to account for improving participation rates, including through funding mechanisms. This should include requiring apprenticeship providers to set and meet targets for improved participation and to use positive action provisions to meet them.
Is Britain Fairer?
www.equalityhumanrights.com/britain-fairer204
Recommendations

Living standards 21. To ensure that there is an adequate supply
of accessible and adaptable homes for disabled people, governments across Britain should impose requirements that all new houses must be built to accessible and adaptable design standards. This should include:
i. imposing requirements that a minimum of 10% of all new-build homes across all tenure types are built to wheelchair-accessible standards, and
ii. amending the Building Regulations in England and Wales to increase the minimum accessibility standard for all new housing (to M4(2) for England and the Development Quality Standards in Wales). The Scottish Government should undertake a review of Housing for Varying Needs.
22. The UK Government should impose a statutory duty on local authorities in England to provide sufficient safe and adequate sites for Gypsies and Travellers. This should be based on the pre-2015 ‘Planning policy for traveller sites’ definition of ‘Gypsy’ and ‘Traveller’, to ensure the inclusion of all Gypsies and Travellers.
23. To achieve Sustainable Development Goal 1.2, to reduce at least by half the proportion of men, women and children of all ages living in poverty by 2030, the UK Government should restore the binding targets from the Child Poverty Act 2010 to eradicate child poverty for England, and develop a strategy for achieving them.
24. To target tax and spending decisions on minimising and reducing disadvantage experienced by different groups, governments across Britain should conduct and publish a cumulative impact assessment of the varied impacts on people sharing different protected characteristics alongside all national fiscal events (Budgets and Spending Reviews).
25. To ensure a social security system that is accessible to and provides an adequate standard of living for all, the UK Government should carry out a comprehensive review of the application of sanctions and conditionality on claimants sharing different protected characteristics and take action to address any disparities.
26. To ensure disabled people’s right to independent living in England, and meet its obligations under Article 19 of CRPD, the UK Government should:
i. provide guidance to local authorities to which it has delegated responsibility for independent living funding, to clarify what they must do to meet the requirements of Article 19, including examples of best practice, and
ii. put in place monitoring mechanisms so that each local authority reports on independent living funding and service-user experience, in order to monitor the sufficiency of the funding and compliance with Article 19.
27. The UK, Scottish and Welsh Governments should monitor the impact of any reductions in the availability of adult social care on disabled people’s ability to live independently and take steps to address any adverse impacts identified.
Is Britain Fairer?
www.equalityhumanrights.com/britain-fairer 205
Recommendations

Health28. To address the key inequalities in health
identified in ‘Is Britain Fairer? 2018’, relevant government departments, listed health bodies and inspectorates across Britain should take action under their Public Sector Equality Duty obligations to:
i. address differences in infant mortality rates by protected characteristics
ii. improve Gypsy and Traveller health and their ability to access services
iii. improve access to specialist services for transgender people in England and Wales
iv. improve suicide prevention in England and Wales
v. substantially reduce detentions under the Mental Health Act 1983 in England, and reduce the over-representation of people from ethnic minorities among those detained, and
vi. improve asylum seeker and refugee health outcomes and their ability to access services.
29. In order to improve access to healthcare and health outcomes for the groups identified in ‘Is Britain Fairer? 2018’ as disproportionately at risk, governments across Britain should ensure that healthcare professionals are required to receive training to facilitate access to appropriate and effective treatment for people sharing different protected characteristics and other ‘at-risk’ groups.
30. In order to ensure the full implementation of the right to health and the right to life for asylum seekers and refused asylum seekers, the UK Government should provide clear guidance and training on how to avoid unlawful discrimination in charging for NHS services in England, explicitly covering the exemptions from charging for groups such as asylum seekers. In addition, the UK Government should provide straightforward and accessible information for asylum seekers themselves, making clear their exemptions from the charging regime.
31. To ensure that the principle of parity of esteem between mental and physical health is realised in practice, governments across Britain should ensure there are sufficiently funded, appropriate and high quality mental health services to meet the mental health needs of adults, children and young people, based on a robust assessment of needs.
32. In order to address the over-representation of people from ethnic minorities among those detained under the Mental Health Act 1983 in England, the UK Government should implement in full the recommendations of the Independent Mental Health Taskforce, including the appointment of an Equality Champion to drive change in tackling mental health inequalities by co-ordinating cross-government action.
Is Britain Fairer?
www.equalityhumanrights.com/britain-fairer206
Recommendations

Justice and personal security33. To address the key inequalities in justice
and personal security identified in ‘Is Britain Fairer? 2018’, relevant government departments, listed public bodies and inspectorates across Britain should take action under their Public Sector Equality Duty obligations to:
i. improve the treatment of disabled people, ethnic minorities and other ‘at-risk’ groups in the criminal justice system
ii. strengthen the legal and policy frameworks that protect people from identity-based violence, and
iii. improve access to justice for victims of discrimination.
34. To increase the confidence of Black Caribbean people in the criminal justice system in England and Wales, the UK Government should prioritise implementation of the recommendations set out in the Lammy Review.
35. To improve the confidence of disabled people in the effectiveness of the justice system in England and Wales, the UK Government should promote the increased use of reasonable adjustments to facilitate effective participation and should ensure that efforts to modernise the justice system do not further undermine its effectiveness and accessibility.
36. To ensure accessible, effective and impartial legal advice in England and Wales, the UK Government should:
i. assess whether changes to the legal aid system have undermined access to justice, including an examination of any disproportionate impact on groups sharing protected characteristics, and
ii. develop and implement action plans to remedy any negative impact identified through their assessment.
37. To remove barriers to accessing courts and tribunals, the UK Government should identify and expedite refunds for all claimants who have paid employment tribunal and employment appeal tribunal fees during the period of increased fees, and ensure no new barriers to accessing employment tribunals are introduced.
38. To improve the response to hate crime:
i. the UK Government should undertake a review of hate crime legislation, sentencing provisions, reporting and recording (including third-party reporting) mechanisms and charging practices in England and Wales, and
ii. governments across Britain should develop effective mechanisms for tackling online and offline hostility and intimidation, and improve support for victims and witnesses to report it.
Is Britain Fairer?
www.equalityhumanrights.com/britain-fairer 207
Recommendations

39. To reduce levels of violence against women and girls, governments across Britain should:
i. fully implement their violence against women and girls strategies, undertake co-ordinated cross-government action and report on progress, and
ii. dedicate sufficient resources to be able to ratify and implement the Istanbul Convention.
40. To improve the response to sexual violence and domestic abuse, governments across Britain should:
i. take action to improve reporting and recording mechanisms
ii. increase prosecution and conviction rates, including by ensuring a victim-centred approach when dealing with sexual violence and domestic abuse and improving police investigations, and
iii. develop a sustainable and accountable funding model for sexual violence and domestic abuse services, including refuges and specialist services for women from ethnic minorities, disabled women and women with complex needs.
41. To address overcrowding in prisons in England and Wales, and the negative effects on the safety and wellbeing of prisoners, the UK Government should invest in appropriate alternatives to prison, including community sentencing, rehabilitation centres and diversion.
42. To improve conditions of detention in adult prisons and immigration detention:
i. governments across Britain should urgently assess the reasons for increased self-harm and assaults in prisons and set out a strategy to reverse this trend
ii. the UK Government should urgently assess the reasons for increased self-harm and assaults in immigration detention facilities and set out a strategy to reverse this trend, and
iii. the UK Government should set a statutory time limit of 28 days for holding an individual in immigration detention.
Is Britain Fairer?
www.equalityhumanrights.com/britain-fairer208
Recommendations

Participation43. To increase democratic engagement:
i. the UK Government should make education about equality and human rights mandatory in all schools in England
ii. the UK Government should clarify policy and guidance to prisons, before the next general and national elections, to ensure that prisoners released on temporary licence and on home detention curfew are able to vote in all elections
iii. governments across Britain should improve access to polling stations to ensure they are physically accessible to all, and address other barriers to disabled people’s right to vote.
44. To increase diversity in political representation:
i. the UK Government should legislate to exempt costs arising from disabled candidates’ impairments from statutory limits on campaign expenditure, and
ii. political parties should voluntarily publish diversity data on the selection and election of candidates in local, national and UK elections, in advance of UK Government legislation, and work with governments to ensure funding for the additional impairment-related costs of disabled candidates.
45. To improve transport accessibility for disabled and older people:
i. the UK Government should report annually on progress towards implementing the UK accessibility action plan, and
ii. public transport providers and regulators across Britain should work together to set industry standards to ensure that all staff have the knowledge and skills to help meet the needs of disabled passengers.
46. To ensure the increased digitalisation of modern society includes and benefits everyone, the UK Government should set specific accessibility requirements for the online delivery of all of its services and initiatives, and ensure that internet safety regulation protects against abuse and intimidation while respecting the rights to privacy and freedom of expression.
47. The UK Government should ensure that Prevent leads in public bodies are trained on their equality and human rights obligations, and should conduct a full evaluation of the impact of the Prevent strategy on equality, good relations and human rights.
Is Britain Fairer?
www.equalityhumanrights.com/britain-fairer 209
Recommendations

Evidence gaps 48. To build a more comprehensive evidence
base on the experiences of those who share different protected characteristics, governments in England, Scotland and Wales and other national agencies that routinely collect and use data, should:
i. ensure that where data are collected on protected characteristics, analysis is published as standard
ii. identify where data are not collected on protected characteristics, and take steps to address these gaps, and
iii. consider and adapt methodologies to increase the usability of data for protected characteristics, such as increasing sample sizes, boosting samples for particular groups or pooling data across years. Methodologies should ensure analysis of data can draw statistically significant comparisons with other categories and over time.
49. To promote the collection of sexual orientation and gender identity information in survey and administrative data in England, Wales and Scotland, the UK Government should work with the Scottish and Welsh Governments to fulfil the commitment of the LGBT Action Plan 2018 to develop and apply monitoring standards for the collection of data on sexual orientation and gender identity.
50. To address gaps in understanding of experiences of bullying, harassment, prejudice and discrimination, governments in England, Wales and Scotland should institute national surveys, or extend existing surveys, to collect data by protected characteristic. Coverage should include all aspects of life, such as employment, transport, and access to public and private services.
Is Britain Fairer?
www.equalityhumanrights.com/britain-fairer210
Recommendations

References
Is Britain Fairer?
211www.equalityhumanrights.com/britain-fairer
References

IntroductionDepartment of Work and Pensions (2018), ‘Family Resources Survey 2016/17’. [ONLINE]. Available at: https://assets.publishing.service.gov.uk/government/uploads/system/uploads/attachment_data/file/692771/family-resourc-es-survey-2016-17.pdf [accessed: 10 August 2018].
National Records for Scotland (2013), ‘2011 Census: Key Results on Population, Ethnicity, Identity, Language, Religion, Health, Housing and Accommodation in Scotland – Release 2A’. [ONLINE]. Available at: http://www.scotlandscensus.gov.uk/documents/censusresults/release2a/StatsBulletin2A.pdf [accessed: 6 August 2018].
Office for National Statistics [ONS] (2012a), ‘Ethnicity and National Identity in England and Wales: 2011’. [ONLINE]. Available at: https://www.ons.gov.uk/peoplepopulationandcommuni-ty/culturalidentity/ethnicity/articles/ethnicityand-nationalidentityinenglandandwales/2012-12-11 [accessed: 6 August 2018].
Office for National Statistics [ONS] (2012b), ‘Religion in England and Wales 2011’. [ONLINE]. Available at: https://www.ons.gov.uk/peoplepopulationandcommunity/culturalidentity/religion/articles/religioninenglandan-dwales2011/2012-12-11 [accessed: 10 August 2018].
Office for National Statistics [ONS] (2017), ‘Sexual identity, UK: 2016: Experimental Official Statistics on sexual identity in the UK in 2016 by region, sex, age, marital status, ethnicity and National Statistics Socio-economic Classification’. [ONLINE]. Available at: https://www.ons.gov.uk/peoplepopulationandcommuni-ty/culturalidentity/sexuality/bulletins/sexualidentityuk/2016 [accessed: 24 August 2018].
Portes, J. and Reed, H. (2018), ‘The cumulative impact of tax and welfare reforms’. Available at: https://www.equalityhumanrights.com/en/publication-download/cumulative-im-pact-tax-and-welfare-reforms [accessed: 25 May 2018].
Education
Standards, cases, legislation and rulesAdditional Learning Needs and Education Tribunal (Wales) Act 2018. Available at: http://www.legislation.gov.uk/anaw/2018/2/contents/enacted [accessed: 24 August 2018].
C & C v The Governing Body of a School [2018] UKUT 269
City of Edinburgh Council v R [2018] CSIH 20
Education (Scotland) Act 2016. Available at: http://www.legislation.gov.uk/asp/2016/8/contents/enacted [accessed: 24 August 2018].
Equality Act 2010 (Disability) Regulations 2010. Available at: http://www.legislation.gov.uk/uksi/2010/2128/contents/made [accessed: 24 August 2018].
Equality Act 2010. Available at: https://www.legislation.gov.uk/ukpga/2010/15/contents [accessed: 24 August 2018].
M v Glasgow City Council [2018] ASNTS/D/17/0017
R (on the application of Tigere) v Secretary of State for Business, Innovation and Skills (CA) [2014] EWCA Civ 1216
Is Britain Fairer?
www.equalityhumanrights.com/britain-fairer212
References

R (on the application of Tigere) v Secretary of State for Business, Innovation and Skills (SC) [2015] UKSC 57
South Lanarkshire Council v M [2018] ASNTS/D/17/0081
X v Governors of a School [2015] UKUT 7 (AAC); [2015] E.L.R. 133 (UT (AAC)) Wales (Education) Measure 2009. Available at: https://www.legislation.gov.uk/mwa/2009/5/contents [accessed: 24 August 2018].
All other sourcesCarers’ Trust (2014), ‘Young Adult Carers at College and University’. Available at: https://professionals.carers.org/sites/default/files/young_adult_carers_at_college_and_universi-ty.pdf [accessed: 13 April 2018].
Children’s Commissioner for Wales (2017), ‘Sam’s story: listening to children and young people’s experiences of bullying in Wales’. Available at: www.childcomwales.org.uk/wp-content/uploads/2017/07/Sams-Story.pdf [accessed: 30 August 2018].
Cleere, V. (2016), ‘Students’ and their parents’ experiences of inclusion in mainstream schools. What does inclusion mean for parents with children that have special educational needs and what does it mean for the children themselves in today’s mainstream schooling system?’ EdD, University of the West of England. Available at: http://eprints.uwe.ac.uk/26142/ [accessed: 26 April 2018].
Commission on Widening Access (2016), ‘A Blueprint for Fairness’. Available at: https://www.gov.scot/Resource/0049/00496535.pdf [accessed: 7 August 2018].
David Lammy MP (2017), Press release: Oxbridge access data FOIs – former higher education minister slams lack of progress and calls for reform. [ONLINE]. Available at: https://www.davidlammy.co.uk/single-post/2017/10/20/Oxbridge-access-data [accessed: 14 May 2018].
Department for Business, Innovation and Skills (2015), Speech: ‘Higher education: fulfilling our potential’. Available at: https://www.gov.uk/government/speeches/higher-education-fulfill-ing-our-potential [accessed: 11 May 2018].
Department for Education [DfE] (2017a), ‘Special educational needs in England: January 2017’. Available at: https://assets.publishing.service.gov.uk/government/uploads/system/uploads/attachment_data/file/633031/SFR37_2017_Main_Text.pdf [accessed: 29 June 2018].
Department for Education [DfE] (2017b), Press release: Applications open to create 1,600 new special free school places. [ONLINE]. Available at: https://www.gov.uk/government/news/applications-open-to-create-1600-new-special-free-school-places [accessed: 26 April 2018]
Department for Education [DfE] (2018), ‘Revised A-level and other 16-18 results in England, 2016/2017’. Available at: https://assets.publishing.service.gov.uk/government/uploads/system/uploads/attachment_data/file/676389/SFR03_2018_Main_text.pdf [accessed: 29 June 2018].
Ditch the Label (2017), ‘Annual Bullying Survey 2017’. Available at: https://www.ditchthelabel.org/wp-content/uploads/2017/07/The-Annu-al-Bullying-Survey-2017-1.pdf [accessed: 29 August 2017].
Is Britain Fairer?
www.equalityhumanrights.com/britain-fairer 213
References

Education and Employers (2018), ‘Drawing the future: exploring the career aspirations of primary school children from around the world’. Available at: https://www.educationandemploy-ers.org/wp-content/uploads/2018/01/DrawingTheFuture.pdf [accessed: 2 July 2018].
Education Policy Institute (2016), ‘Closing the gap? Trends in educational attainment and disadvantage’. Available at: https://epi.org.uk/report/closing-the-gap/ [accessed: 18 January 2018].
Education Policy Institute (2017), ‘Blog: should we still be concerned about NEETs?’ Available at: https://epi.org.uk/analysis/still-concerned-neets/ [accessed: 22 February 2018].
Equality Challenge Unit (2017), ‘Equality in higher education: statistical report 2017’. Available at: https://www.ecu.ac.uk/publications/equality-in-higher-education-statistical-re-port-2017/ [accessed: 15 December 2018].
Estyn (2015), ‘Education other than at school: a good practice survey’. Available at: https://www.estyn.gov.wales/sites/default/files/documents/Education_other_than_at_school_a_good_practice_survey_-_June_2015.pdf [accessed: 29 August 2018].
Ford, T., Parker, C., Salim, J. and Goodman, R. (2017), ‘The relationship between exclusion from school and mental health: a secondary analysis of the British Child and Adolescent Mental Health Surveys 2004 and 2007’ Psychological Medicine vol. 48, no. 4, pp.629-641. Available at: https://www.cambridge.org/core/journals/psychologi-cal-medicine/article/relationship-between-exclu-sion-from-school-and-mental-health-a-second-ary-analysis-of-the-british-child-and-adoles-cent-mental-health-surveys-2004-and-2007/C01898F768A7C47FB9A1F2F894B22A85 [accessed: 20 February 2018].
Girlguiding UK (2017), ‘Girls’ Attitudes Survey 2017’. Available at: https://www.girlguiding.org.uk/globalassets/docs-and-resources/research-and-campaigns/girls-attitudes-sur-vey-2017.pdf [accessed: 20 February 2018].
Government Office for Science (2017), ‘Future of skills and lifelong learning’. Available at: https://www.gov.uk/government/publications/future-of-skills-and-lifelong-learning [accessed: 27 April 2018].
Higher Education Policy Institute (2016), ‘Boys to men: the under-achievement of young men in higher education’. Available at: http://www.hepi.ac.uk/2016/05/12/new-hepi-report-reveals-edu-cational-underachievement-young-men-high-er-education-calls-sector-tackle-problem/ [accessed: 20 November 2017].
Higher Education Statistics Agency (2018), ‘Widening participation summary: UK Performance Indicators 2016/17’. Available at: https://www.hesa.ac.uk/news/01-02-2018/widening-participation-summary [accessed: 7 August 2018].
HM Government (2017a), ‘Building our Industrial Strategy’. Available at: https://beisgovuk.citizenspace.com/strategy/industrial-strategy/supporting_documents/buildingourindustrial-strategygreenpaper.pdf [accessed: 20 November 2017].
HM Government (2017b), ‘Industrial Strategy: Building a Britain for the future’. Available at: https://www.gov.uk/government/uploads/system/uploads/attachment_data/file/662508/industrial-strategy-white-paper.pdf [accessed: 28 November 2017].
House of Commons Library (2018), ‘NEET: Young People Not in Education, Employment or Training’. Available at: http://researchbriefings.parliament.uk/ResearchBriefing/Summary/SN06705#fullreport [accessed: 23 April 2018].
Is Britain Fairer?
www.equalityhumanrights.com/britain-fairer214
References

Institution of Engineering and Technology (2015), Press release: Parents restricting girls’ futures through outdated stereotypes of career choices. [ONLINE]. Available at: http://www.theiet.org/policy/media/press-releas-es/20150330.cfm [accessed: 16 May 2017].
Joseph Rowntree Foundation (2016), ‘Special educational needs and their links to poverty’. Available at: https://www.lkmco.org/poverty-and-special-needs-a-quarter-of-fsm-pupils-have-send/ [accessed: 20 February 2018].
Joint Committee on Human Rights (2013), ‘Third Report of Session 2013-14: Legislative Scrutiny Children and Families Bill; Energy Bill’. Available at: https://publications.parliament.uk/pa/jt201314/jtselect/jtrights/29/2902.htm [accessed: 16 August 2018].
National Union of Students (2015), ‘Education Beyond the Straight and Narrow – LGBT students’ experiences in Higher Education’. Available at: https://www.nusconnect.org.uk/resources/education-be-yond-the-straight-and-narrow-lgbt-students-ex-periences-in-higher-education [accessed: 26 April 2018].
NSPCC (2017), ‘Childline sees spike in counselling sessions about race and faith-based bullying’. Available at: https://www.nspcc.org.uk/what-we-do/news-opinion/childline-spike-counselling-sessions-race-faith-based-bullying/ [accessed: 27 February 2018].
O’Brien, J. (2016), ‘Don’t Send Him in Tomorrow: Shining a light on the marginalised, disenfranchised and forgotten children of today’s schools’. Carmarthen, Wales: Independent Thinking Press
Ofsted (2018), ‘Data View: View regional performance over time’. Available at: https://public.tableau.com/profile/ofsted#!/vizhome/Dataview/Viewregionalperformanceovertime [accessed: 20 August 2018].
Ofsted, Care Quality Commission (2017), ‘Local area SEND inspections: one year on’. Available at: https://www.gov.uk/government/uploads/system/uploads/attachment_data/file/652694/local_area_SEND_inspections_one__year__on.pdf [accessed: 1 February 2018].
Panayiotou, S., Boulden, K., Newton S., Andersson, D (2017), ‘Omnibus Survey of Pupils and their Parents/Carers’. Available at: https://www.gov.uk/government/publications/pupils-and-their-parents-or-carers-omnibus-wave-1-survey [accessed: 29 June 2018].
Papworth Trust (2018), ‘Disability Facts and Figures 2018: Disability in the United Kingdom’. Available at: https://www.papworthtrust.org.uk/about-us/publications/ [accessed: 27 April 2018].
Prisoners’ Education Trust (2016), ‘An assessment of the English and Maths skills levels of prisoners in England’. Available at: http://www.prisonerseducation.org.uk/resources/an-assessment-of-the-english-and-maths-skills-levels-of-prisoners-in-england- [accessed: 27 April 2018].
Russell Group (2017), Press release: Sutton Trust – contextualised admissions. [ONLINE]. Available at: http://russellgroup.ac.uk/news/contextualised-admissions/ [accessed: 3 March 2018].
Scottish Government (2015), ‘Consequences, risk factors and geography of young people not in education, employment or training (NEET)’. Available at: http://www.gov.scot/Publica-tions/2015/10/2258/downloads [accessed: 28 August 2017].
Is Britain Fairer?
www.equalityhumanrights.com/britain-fairer 215
References

Scottish Government (2017a), ‘Included, Engaged and Involved Part 2: A Positive Approach to Preventing and Managing School Exclusions’. Available at: http://www.gov.scot/Resource/0052/00521260.pdf [accessed: 12 September 2017].
Scottish Government (2017b), ‘Science, Technology, Engineering and Mathematics (STEM) Evidence Base’. Available at: http://www.gov.scot/Resource/0052/00526537.pdf [accessed: 19 January 2017].
Scottish Government (2017c), ‘Summary Statistics for Schools in Scotland’. Available at: https://www.gov.scot/Publications/2017/12/3099/downloads [accessed: 10 August 2018].
Scottish Government (2017d), ‘Implementing ‘A Blueprint for Fairness’: progress report’. Available at: https://beta.gov.scot/publications/implementing-blueprint-fairness-report-pro-gress-recommendations-commission-widen-ing-access/ [accessed: 20 August 2018].
Scottish Government (2018), ‘Evaluation of the Attainment Scotland Fund – Interim Report (Years 1 and 2)’. Available at: https://www.gov.scot/Resource/0053/00532725.pdf [accessed: 18 June 2018].
Scottish Parliament (2017), ‘Equalities and Human Rights Committee Inquiry into bullying and harassment in schools’. Available at: http://www.parliament.scot/S5_Equal_Opps/General%20Documents/Children_in_Scot-land_-_commissioned_by_EHRiC.pdf [accessed: 8 September 2017].
Smith, R., McCrone, T., Sharp, C., Menys, R., Rabiasz, A., Sims, D. (2017), ‘Teacher Voice Omnibus Survey’. Available at: https://www.gov.uk/government/publications/teacher-voice-om-nibus-november-2016-survey-dfe-questions [accessed: 29 July 2018].
Social Market Foundation (2016), ‘Widening participation in Higher Education’. Available at: http://www.smf.co.uk/publications/widening-par-ticipation/ [accessed: 23 April 2018].
Social Mobility Commission [SMC] (2016a), ‘State of the Nation 2016: Social Mobility in Great Britain’. Available at: https://www.gov.uk/government/uploads/system/uploads/attachment_data/file/569410/Social_Mobility_Commission_2016_REPORT_WEB__1__.pdf [accessed: 20 November 2017].
Social Mobility Commission [SMC] (2016b), ‘Ethnicity, Gender and Social Mobility’. Available at: https://www.gov.uk/government/uploads/system/uploads/attachment_data/file/579988/Ethnicity_gender_and_social_mobility.pdf [accessed: 20 November 2017].
Social Mobility Commission [SMC] (2017a), ‘Low income pupils’ progress at secondary school’. Available at: https://www.gov.uk/govern-ment/publications/low-income-pupils-progress-at-secondary-school [accessed: 6 April 2018].
Social Mobility Commission [SMC] (2017b), ‘Time for change: an assessment of government policies on social mobility 1997 to 2017’. Available at: https://www.gov.uk/government/publications/social-mobility-poli-cies-between-1997-and-2017-time-for-change [accessed: 12 February 2018].
Social Mobility and Child Poverty Commission (2015), ‘Downward mobility, opportunity hoarding and the ‘glass floor’’. Available at: https://www.gov.uk/government/uploads/system/uploads/attachment_data/file/447575/Downward_mobility_opportunity_hoarding_and_the_glass_floor.pdf [accessed: 14 July 2017].
Stonewall (2017), ‘School Report 2017’. Available at: https://www.stonewall.org.uk/school-report-2017 [accessed: 29 August 2017].
Is Britain Fairer?
www.equalityhumanrights.com/britain-fairer216
References

Sutton Trust (2016), ‘Research Brief: Class differences: Ethnicity and disadvantage’. Available at: https://www.suttontrust.com/research-paper/class-differences-ethnici-ty-and-disadvantage/ [accessed: 24 April 2018].
Sutton Trust (2017), ‘Admissions in Context’. Available at: https://www.suttontrust.com/wp-content/uploads/2017/10/Admis-sions-in-Context-Final_V2.pdf [accessed: 20 November 2017].
Sutton Trust (2018), ‘Home and away: social, ethnic and spatial inequalities in student mobility’. Available at: https://www.suttontrust.com/wp-content/uploads/2018/02/Home_and_away_FINAL.pdf [accessed: 3 March 2018].
Taylor, M. (2017), Good Work: The Taylor Review of Modern Working Practices. Available at: https://www.gov.uk/government/uploads/system/uploads/attachment_data/file/627671/good-work-taylor-review-modern-working-prac-tices-rg.pdf [accessed: 20 November 2017].
UCAS (2017), ‘2017 End of Cycle Report: patterns by applicant characteristics’. Available at: https://www.ucas.com/file/140396/download?token=TC7eMH9W [accessed: 29 June 2018].
UCAS (2018), ‘UK application rates by the January 2018 deadline – published 5 February 2018’. Available at: https://www.ucas.com/corporate/data-and-analysis/ucas-undergradu-ate-releases/ucas-undergraduate-analysis-re-ports [accessed: 22 March 2018].
United Nations Committee on Economic, Social and Cultural Rights [UNCESCR] (2016), ‘Concluding observations on the sixth periodic report of the United Kingdom of Great Britain and Northern Ireland’. Available at: http://docstore.ohchr.org/SelfServices/FilesHandler.ashx?enc=4slQ6QSmlBEDzFEovLCuW3XRi-nAE8KCBFoqOHNz%2FvuCC%2BTxEKAI18b-zE0UtfQhJkxxOSGuoMUxHGypYLjNFkwxn-MR6GmqogLJF8BzscMe9zpGfTXB-kZ4pEaigi44xqiL [accessed: 10 August 2018].
United Nations Committee on the Rights of the Child [UNCRC] (2016), ‘Concluding observations on the fifth periodic report of the United Kingdom of Great Britain and Northern Ireland’. Available at: http://www.crae.org.uk/publications-resources/un-crc-committees-con-cluding-observations-2016/ [accessed: 10 August 2018].
United Nations Committee on the Rights of Persons with Disabilities [UNCRPD] (2017), ‘Concluding observations on the initial report of the United Kingdom of Great Britain and Northern Ireland’. Available at: http://docstore.ohchr.org/SelfServices/FilesHandler.ashx?enc=6QkG1d%2FPPRiCAqhKb7yhsp-CUnZhK1jU66fLQJyHIkqMIT3RDaLiqzhH8t-VNxhro6S657eVNwuqlzu0x-vsQUehREyYEQD%2BldQaLP31QDpRcmG-35KYFtgGyAN%2BaB7cyky7 [accessed: 10 August 2018].
Voluntary Action Leeds (2015), ‘Young Lives Leeds NEET Research 2015’. Available at: https://doinggoodleeds.org.uk/blog/2015/11/13/young-lives-leeds-neet-re-search-2015-201511131147/ [accessed: 23 April 2018].
Is Britain Fairer?
www.equalityhumanrights.com/britain-fairer 217
References

Welsh Government (2017a), ‘Assessing the contribution of Schools Challenge Cymru to outcomes achieved by Pathways to Success Schools’. Available at: http://gov.wales/docs/caecd/research/2017/170724-assessing-contrib-tion-schools-challenge-cymru-outcomes-achieved-pathways-success-schools-en.pdf [accessed: 5 January 2018].
Welsh Government (2017b), ‘School Census Results, 2017’. Available at: https://gov.wales/docs/statistics/2017/170726-school-census-re-sults-2017-en.pdf [accessed: 10 August 2018].
Women and Equalities Select Committee (2016), ‘Sexual harassment and sexual violence in schools’. Available at: https://publications.parliament.uk/pa/cm201617/cmselect/cmwomeq/91/91.pdf [accessed: 1 September 2017].
YMCA (2018), ‘In Your Face: A report investigating young people’s experiences of appearance-based bullying’. Available at: https://www.ymca.org.uk/research/in-your-face-a-report-investigating-young-peo-ples-experiences-of-appearance-based-bully-ing [accessed: 2 March 2018].
Work
Standards, cases, legislation and rulesEquality Act 2010. Available at: https://www.legislation.gov.uk/ukpga/2010/15/contents [accessed: 24 August 2018].
Equality Act 2010 (Gender Pay Gap Information), Regulations 2017. Available at: https://www.legislation.gov.uk/uksi/2017/172/contents/made [accessed: 24 August 2018].
Equality Act 2010 (Specific Duties and Public Authorities), Regulations 2017. Available at: https://www.legislation.gov.uk/uksi/2017/353/contents/made [accessed: 24 August 2018].
Gender Representation on Public Boards (Scotland), Act 2018. Available at: http://www.legislation.gov.uk/asp/2018/4/contents/enacted [accessed: 24 August 2018].
Pimlico Plumbers Ltd and another v Smith [2018] UKSC 29
Uber B.V. and Others v Mr Y Aslam and Others [2017] UKEAT/0056/17/DA
R (on the application of UNISON) v Lord Chancellor [2017] UKSC 51
Is Britain Fairer?
www.equalityhumanrights.com/britain-fairer218
References

All other sources Adams, L., Winterbotham, M., Oldfield, K., McLeish, J., Large, A., Stuart, A., Murphy, L., Rossiter, H. and Selner, S. (2016a), ‘Pregnancy and maternity-related discrimination and disadvantage: experiences of mothers’. Department for Business, Innovation and Skills and the Equality and Human Rights Commission. Available at: https://www.equalityhumanrights.com/en/managing-preg-nancy-and-maternity-workplace/pregnan-cy-and-maternity-discrimination-research-find-ings [accessed: 12 April 2018].
Adams, L., Winterbotham, M., Oldfield, K., McLeish, J., Stuart, A., Large, A., Murphy, L., Rossiter, H. and Selner, S. (2016b), ‘Pregnancy and maternity-related discrimination and disadvantage: experiences of employers’. Department for Business, Innovation and Skills and the Equality and Human Rights Commission. Available at: https://www.equalityhumanrights.com/en/managing-pregnan-cy-and-maternity-workplace/pregnancy-and-ma-ternity-discrimination-research-findings [accessed: 12 April 2018].
Cabinet Office (2017), ‘Race disparity audit’. Available at: https://www.gov.uk/government/publications/race-disparity-audit [accessed: 12 April 2018].
Colebrook, C., Snelling, C. and Longlands, S. (2018), ‘The state of pay: demystifying the gender pay gap’. Available at: https://www.ippr.org/publications/the-state-of-pay [accessed: 11 July 2018].
D’Arcy, C. (2017), ‘Low Pay Britain 2017’. Resolution Foundation. Available at: https://www.resolutionfoundation.org/publications/low-pay-britain-2017/ [accessed: 1 May 2018].
Davies, C. (2018 forthcoming), ‘Positive action and apprenticeships: exploring positive action as a tool to address under-representation in apprenticeships in England, Scotland and Wales’. EHRC Research Report forthcoming.
Department for Business, Energy & Industrial Strategy (2018), ‘The characteristics of those in the gig economy’. Available at: https://assets.publishing.service.gov.uk/government/uploads/system/uploads/attachment_data/file/687553/The_characteristics_of_those_in_the_gig_economy.pdf [accessed: 10 July 2018].
Department for Education [DfE] (2017), ‘Apprenticeship demographic and sector subject area Pivot Table tool: starts and achievements 2016/17’. Available at: https://www.gov.uk/government/statistical-data-sets/fe-data-library-apprenticeships#apprentice-ship-starts-and-achievements [accessed: 11 July 2017].
Department for Education [DfE] (2018), ‘Apprenticeship demographic and sector subject area Pivot Table tool: starts and achievements Q2 2017 to 2018’. Available at: https://www.gov.uk/government/statistical-da-ta-sets/fe-data-library-apprenticeships#appren-ticeship-starts-and-achievements [accessed: 11 July 2017].
Department for Work and Pensions and Department of Health (2017), ‘Improving lives: the future of work, health and disability’. Available at: https://www.gov.uk/government/publications/improving-lives-the-future-of-work-health-and-disability [accessed: 12 April 2018].
Is Britain Fairer?
www.equalityhumanrights.com/britain-fairer 219
References

Equality and Human Rights Commission [EHRC] (2016), ‘Pregnancy and maternity discrimination in the workplace: recommenda-tions for change’. Available at: https://www.equalityhumanrights.com/en/managing-preg-nancy-and-maternity-workplace/our-recommen-dations-tackle-pregnancy-and-maternity [accessed: 15 August 2018].
Equality and Human Rights Commission [EHRC] (2017a), ‘Fair opportunities for all – a strategy to reduce pay gaps in Britain’. Available at: https://www.equalityhumanrights.com/en/publication-download/fair-opportunities-all-strat-egy-reduce-pay-gaps-britain [accessed: 12 April 2018].
Equality and Human Rights Commission [EHRC] (2017b), ‘Being disabled in Britain: a journey less equal’. Available at: https://www.equalityhumanrights.com/sites/default/files/being-disabled-in-britain.pdf [accessed: 1 May 2018].
Equality and Human Rights Commission [EHRC] (2018a), ‘Turning the tables: ending sexual harassment at work’. Available at: https://www.equalityhumanrights.com/en/publica-tion-download/turning-tables-ending-sexu-al-harassment-work [accessed: 12 April 2018].
Equality and Human Rights Commission [EHRC] (2018b), ‘Employers in the dark ages over recruitment of pregnant women and new mothers’. Available at: https://www.equalityhumanrights.com/en/our-work/news/employers-dark-ages-over-recruitment-preg-nant-women-and-new-mothers [accessed: 12 April 2018].
Eunson, J. and Murray, L. (2017), ‘Early learning and childcare: the experiences of parents’. Available at: http://www.audit-scotland.gov.uk/uploads/docs/report/2018/nr_180215_early_learning_supp.pdf [accessed: 6 August 2018].
European Committee of Social Rights (2018), ‘Conclusions XXI-2 (2017), United Kingdom’. Available at: http://hudoc.esc.coe.int/app/conversion/pdf/?library=ESC&id=CR_XXI-2_GBR_ENG&filename=CR_XXI-2_GBR_ENG.pdf [accessed: 11 July 2018].
Hampton, P. (2017), ‘Hampton-Alexander Review: improving gender balance in FTSE leadership’. Available at: https://assets.publishing.service.gov.uk/government/uploads/system/uploads/attachment_data/file/658126/Hampton_Alexander_Review_report_FI-NAL_8.11.17.pdf [accessed: 13 July 2017].
HM Government (2018), ‘Good work: a response to the Taylor Review of modern working practices’. Available at: https://www.gov.uk/government/publications/government-re-sponse-to-the-taylor-review-of-modern-work-ing-practices [accessed: 11 July 2018].
House of Lords (2016), ‘The Equality Act 2010: the impact on disabled People’. House of Lords Select Committee on the Equality Act and disability. Report of Session 2015-16. Available at: https://publications.parliament.uk/pa/ld201516/ldselect/ldeqact/117/117.pdf [accessed: 12 April 2018].
Judge, L. and Tomlinson, D. (2016), ‘Secret agents: agency workers in the new world of work’. Available at: https://www.resolutionfoun-dation.org/publications/secret-agents-agency-workers-in-the-new-world-of-work/ [accessed: 12 April 2018].
Lawler, R. (2018), ‘Parents are paying to access ‘free childcare’ offer, survey finds’. Survey by Pre-school Learning Alliance. Available at: https://www.pre-school.org.uk/news/2018/01/parents-are-paying-access-free-childcare-offer-survey-finds [accessed: 15 May 2018].
Is Britain Fairer?
www.equalityhumanrights.com/britain-fairer220
References

Longhi, S. (2017), ‘The disability pay gap’. EHRC Research Report no. 107. Available at: https://www.equalityhumanrights.com/en/publication-download/research-report-107-disa-bility-pay-gap [accessed: 12 April 2018].
McGregor-Smith, R. (2017), ‘Race in the workplace: the McGregor-Smith Review’. Report for Department for Business, Energy and Industrial Strategy. Available at: https://www.gov.uk/government/publications/race-in-the-workplace-the-mcgregor-smith-re-view [accessed: 12 April 2018].
McGuinness, F. (2016), ‘The gender pay gap’. House of Commons Briefing Paper no. SN07068. Available at: http://researchbriefings.parliament.uk/ResearchBriefing/Summary/SN07068 [accessed: 12 April 2018].
McGuinness, F. (2018), ‘Women and the economy’. House of Commons Briefing Paper no. CBP06838. Available at: http://research-briefings.files.parliament.uk/documents/SN06838/SN06838.pdf [accessed: 1 May 2018].
Ministry of Justice (2018), ‘Tribunals and Gender Recognition Statistics Quarterly, January to March 2018 (Provisional)’. Available at: https://www.gov.uk/government/statistics/tribunals-and-gender-recognitions-certifi-cates-statistics-quarterly-janu-ary-to-march-2018 [accessed: 11 July 2018].
Office for National Statistics [ONS] (2017a), ‘More mothers with young children working full-time’. Available at: https://www.ons.gov.uk/employmentandlabourmarket/peopleinwork/employmentandemployeetypes/articles/moremotherswithyoungchildrenworkingfull-time/2017-09-26 [accessed: 1 May 2018].
Office for National Statistics [ONS] (2017b), ‘Labour Force Survey: Zero-hours contract data tables’. Available at: https://www.ons.gov.uk/file?uri=/employmentandlabourmarket/peopleinwork/earningsandworkinghours/datasets/zerohourssummarydatatables/apriltojune2017/emp17aug20171.xls [accessed: 12 April 2018].
Office for National Statistics [ONS] (2017c), ‘Jobs paid below minimum wage by category’. Available at: https://www.ons.gov.uk/employmentandlabourmarket/peopleinwork/earningsandworkinghours/datasets/jobspaidbelowminimumwagebycategory [accessed: 15 May 2018].
Office for National Statistics [ONS] (2017d), ‘Annual Survey of Hours and Earnings: 2017 provisional and 2016 revised results’. Available at: https://www.ons.gov.uk/employmentandla-bourmarket/peopleinwork/earningsandworking-hours/bulletins/annualsurveyofhoursandearn-ings/2017provisionaland2016revisedresults [accessed: 12 April 2018].
Office for National Statistics [ONS] (2018a), ‘UK labour market: June 2018’. Available at: https://www.ons.gov.uk/employmentandlabourmarket/peopleinwork/employmentandemployeetypes/bulletins/uklabourmarket/latest#employment [accessed: 11 July 2018].
Office for National Statistics [ONS] (2018b), ‘Labour market status of disabled people’. Available at: https://www.ons.gov.uk/employmentandlabourmarket/peopleinwork/employmentandemployeetypes/datasets/labourmarketstatusofdisabledpeoplea08 [accessed: 11 July 2018].
Is Britain Fairer?
www.equalityhumanrights.com/britain-fairer 221
References

Office for National Statistics [ONS] (2018c), ‘People in employment on zero hours contracts’. (Version updated on 21 February 2018:9.30). Available at: https://www.ons.gov.uk/employmentandlabourmarket/peopleinwork/employmentandemployeetypes/datasets/emp17peopleinemploymentonzerohourscon-tracts/current [accessed: 12 April 2018].
Parker, J. (2017), ‘A report into the ethnic diversity of UK boards’. Report for Department for Business, Energy and Industrial Strategy. Available at: https://www.gov.uk/government/speeches/the-ethnic-di-versity-of-uk-boards-launch-of-the-parker-review [accessed: 12 April 2018].
Powell, A. (2018), People with disabilities in employment’. House of Commons Briefing Paper no. 7540. Available at: http://researchbriefings.files.parliament.uk/documents/CBP-7540/CBP-7540.pdf [accessed: 3 August 2018].
Prime Minister’s Office (2018), ‘Government announces major programme to tackle inequalities in youth unemployment’. Available at: https://www.gov.uk/government/news/government-announces-major-pro-gramme-to-tackle-inequalities-in-youth-unem-ployment [accessed: 12 April 2018].
Pyper, D. (2018), ‘The National Minimum Wage: rates and enforcement’. House of Commons Briefing Paper no. SN06898. Available at: http://researchbriefings.parliament.uk/ResearchBrief-ing/Summary/SN06898 [accessed: 12 April 2018].
Sealy, R., Dondor, E. and Vinnicombe, S. (2016), ‘Women on boards: taking stock of where we are. Cranfield School of Manage-ment’. Available at: https://www.cranfield.ac.uk/som/expertise/changing-world-of-work/gender-and-leadership/female-ftse-index [accessed: 12 April 2018].
Stevenson, D. and Farmer, P. (2017), ‘Thriving at work: the Stevenson/Farmer Review of mental health and employers’. Available at: https://www.gov.uk/government/publications/thriving-at-work-a-review-of-mental-health-and-employers [accessed: 12 April 2018].
Taylor, M. (2017), ‘Good work: the Taylor Review of modern working practices’. Available at: https://www.gov.uk/government/publications/good-work-the-taylor-review-of-modern-work-ing-practices [accessed: 12 April 2018].
TUC (2015), ‘Nearly a third of people are bullied at work, says TUC’. 16 November. Available at: https://www.tuc.org.uk/news/nearly-third-peo-ple-are-bullied-work-says-tuc [accessed: 12 April 2018].
TUC (2016), ‘Still just a bit of banter? Sexual harassment in the workplace in 2016’. Available at: https://www.tuc.org.uk/news/near-ly-two-three-young-women-have-experienced-sexual-harassment-work-tuc-survey-reveals [accessed: 12 April 2018].
TUC (2017a), ‘Insecure work and ethnicity’. Available at: https://www.tuc.org.uk/sites/default/files/Insecure%20work%20and%20ethnicity_0.pdf [accessed: 1 May 2018].
TUC (2017b), ‘Is racism real?’. Available at: https://www.tuc.org.uk/sites/default/files/Is%20Racism%20Real.pdf [accessed: 15 May 2018].
TUC (2017c), ‘The cost of being out at work’. Available at: https://www.tuc.org.uk/research-analysis/reports/cost-being-out-work [accessed: 12 April 2018].
Is Britain Fairer?
www.equalityhumanrights.com/britain-fairer222
References
https://www.gov.uk/government/speeches/the-ethnic-diversity-of-uk-boards-launch-of-the-parker-review
https://www.gov.uk/government/speeches/the-ethnic-diversity-of-uk-boards-launch-of-the-parker-review

United Nations Committee on Economic, Social and Cultural Rights [UNCESCR] (2016), ‘Concluding Observations on the sixth periodic report of the United Kingdom and Northern Ireland’. E/C.12/GBR/CO/6. Available at: http://tbinternet.ohchr.org/_layouts/treatybodyexter-nal/Download.aspx?symbolno=E/C.12/GBR/CO/6&Lang=En [accessed: 12 April 2018].
United Nations Committee on the Elimination of Racial Discrimination [UNCERD] (2016), ‘Concluding Observations on the combined twenty-first to twenty-third periodic reports of the United Kingdom of Great Britain and Northern Ireland’. CERD/C/GBR/CO/21-23. Available at: http://tbinternet.ohchr.org/_layouts/treatybodyexternal/Download.aspx?symbol-no=CERD/C/GBR/CO/21-23&Lang=En [accessed: 12 April 2018].
United Nations Committee on the Rights of Persons with Disabilities [UNCRPD] (2017), ‘Concluding Observations on the initial report of the United Kingdom of Great Britain and Northern Ireland’. CRPD/C/GBR/CO/1. Available at: http://tbinternet.ohchr.org/_layouts/treatybodyexternal/Download.aspx?symbol-no=CRPD/C/GBR/CO/1&Lang=En [accessed: 12 April 2018].
Vinnicombe, S., Doldor, E. and Sealy, R. (2018), ‘The FTSE Board Report 2018. Cranfield School of Management’. Available at: https://www.cranfield.ac.uk/som/expertise/changing-world-of-work/gender-and-leadership/female-ftse-index [accessed: 20 August 2018].
Women and Equalities Committee (2016), ‘Pregnancy and maternity discrimination: First Report of Session 2016–17’. Available at: http://www.publications.parliament.uk/pa/cm201617/cmselect/cmwomeq/90/90.pdf [accessed: 12 April 2018].
Women and Equalities Committee (2017), ‘Older people and employment: Is Government policy effective?’. Available at: https://www.parliament.uk/business/committees/committees-a-z/commons-select/wom-en-and-equalities-committee/news-parlia-ment-2017/older-people-and-employ-ment-launch-17-19/ [accessed: 15 May 2018].
Women and Equalities Committee (2018), ‘Sexual harassment in the workplace. Fifth Report of Session 2017-19’. Available at: https://publications.parliament.uk/pa/cm201719/cmselect/cmwomeq/725/725.pdf [accessed: 6 August 2018].
Living standards
Standards, cases, legislation and rulesAdults with Incapacity (Scotland), Act 2000. Available at: https://www.legislation.gov.uk/asp/2000/4/contents [accessed: 24 August 2018].
Carers (Scotland), Act 2016. Available at: http://www.legislation.gov.uk/asp/2016/9/contents/enacted [accessed: 24 August 2018].
Child Poverty (Scotland), Act 2017. Available at: http://www.legislation.gov.uk/asp/2017/6/contents/enacted [accessed: 24 August 2018].
Child Poverty Act 2010. Available at: https://www.legislation.gov.uk/ukpga/2010/9/contents [accessed: 24 August 2018].
DA v SSWP [2017] EWHC 1446
DA v SSWP [2018] EWCA Civ 504
Equality Act 2010. Available at: https://www.legislation.gov.uk/ukpga/2010/15/contents [accessed: 24 August 2018].
Is Britain Fairer?
www.equalityhumanrights.com/britain-fairer 223
References

Homelessness Reduction Act 2017. Available at: http://www.legislation.gov.uk/ukpga/2017/13/contents/enacted [accessed: 24 August 2018].
Housing and Planning Act 2016. Available at: http://www.legislation.gov.uk/ukpga/2016/22/contents/enacted [accessed: 24 August 2018].
Housing Benefit and Universal Credit (Size Criteria) (Miscellaneous Amendments) Regulations 2017. Available at: https://www.legislation.gov.uk/uksi/2017/213/contents/made [accessed: 24 August 2018].
Hurley and others v Secretary of State for Work and Pensions [2015] EWHC 3382
Mental Capacity Act 2005. Available at: https://www.legislation.gov.uk/ukpga/2005/9/contents [accessed: 24 August 2018].
MH v Secretary of State for Work and Pensions (PIP) [2016] UKUT 0531 (AAC)
Private Housing (Tenancies) Scotland Act 2016. Available at: http://www.legislation.gov.uk/asp/2016/19/contents/enacted [accessed: 24 August 2018].
R (MA & Ors) v The Secretary of State for Work and Pensions [2016] UKSC 58
R (RF) v SSWP [2017] EWHC 3375 (Admin)
Regulation and Inspection of Social Care (Wales) Act 2016. Available at: http://www.legislation.gov.uk/anaw/2016/2/contents/enacted [accessed: 24 August 2018].
Renting Homes (Wales) Act 2016. Available at: http://www.legislation.gov.uk/anaw/2016/1/contents/enacted [accessed: 24 August 2018].
SC and others v SSWP [2018] EWHC 864
Scotland Act 2016. Available at: http://www.legislation.gov.uk/ukpga/2016/11/contents/enacted [accessed: 24 August 2018].
Social Care (Self-directed Support) Scotland Act 2013. Available at: http://www.legislation.gov.uk/asp/2013/1/contents/enacted [accessed: 24 August 2018].
Social Security (Scotland) Act 2018. Available at: http://www.legislation.gov.uk/asp/2018/9/con-tents/enacted [accessed: 24 August 2018].
Social Services and Well-being (Wales) Act 2014. Available at: https://www.legislation.gov.uk/anaw/2014/4/contents [accessed: 24 August 2018].
Statutory Instrument 2017/194, The Social Security (Personal Independence Payment) (Amendment) Regulations 2017. Available at: http://www.legislation.gov.uk/uksi/2017/194/contents/made [accessed: 24 August 2018].
Welfare Reform and Work Act 2016. Available at: http://www.legislation.gov.uk/ukpga/2016/7/contents/enacted [accessed: 24 August 2018].
Well-being of Future Generations (Wales) Act 2015. Available at: http://www.legislation.gov.uk/anaw/2015/2/contents/enacted [accessed: 24 August 2018].
Is Britain Fairer?
www.equalityhumanrights.com/britain-fairer224
References

All other sources Accounts Commission (2016) ‘Social work in Scotland’. Available at: http://www.audit-scot-land.gov.uk/uploads/docs/report/2016/nr_160922_social_work.pdf [accessed: 06 September 2017].
Albert Kennedy Trust (2015), ‘LGBT Youth Homelessness: A UK National Scoping of Cause, Prevalence, Response & Outcome’. Available at: https://www.akt.org.uk/Handlers/Download.ashx?IDM-F=c0f29272-512a-45e8-9f9b-0b76e477baf1 [accessed: 24 May 2018].
All Party Parliamentary Group on Refugees (2017), ‘Refugees welcome? The experience of new refugees in the UK, April 2017’. Available at: https://www.refugeecouncil.org.uk/refugees_welcome_inquiry [accessed: 14 August 2017].
Association of Directors of Adult Social Services (2017), ‘ADASS Budget Survey’. Available at: https://www.adass.org.uk/media/5994/adass-budget-survey-report-2017.pdf [accessed: 20 August 2018].
Association of Directors of Children’s Services (2017), ‘A country that works for all children’. Available at: http://adcs.org.uk/assets/documentation/ADCS_A_country_that_works_for_all_children_FINAL.pdf [accessed: 25 May 2018].
Asylum Matters, Refugee Action, Freedom from Torture, Refugee Council, Greater Manchester Immigration Aid Unit, MRANG, Citizen’s Advice Staffordshire North & Stoke-on-Trent, Destitute Asylum Seekers Huddersfield, Helen Bamber Foundation, City of Sanctuary and Scottish Refugee Council (2018), ‘Asylum Support: Parliamentary Briefing’. Available at: https://cityofsanctuary.org/wp-content/up-loads/2018/06/Asylum-Support-Levels-Briefing.pdf [accessed 11 September 2018].
Audit Scotland (2017), ‘Self-directed support: 2017 progress report’. Available at: http://www.audit-scotland.gov.uk/report/self-directed-sup-port-2017-progress-report [accessed: 26 April 2018].
Barton, C. (2017), ‘Home ownership and renting: demographics’. Available at: http://researchbrief-ings.parliament.uk/ResearchBriefing/Summary/CBP-7706 [accessed: 14 August 2017].
Barton, C., Wilson, W. and Fears, C., (2016), ‘What is affordable housing?’ Available at: http://researchbriefings.parliament.uk/ResearchBriefing/Summary/CBP-7747 [accessed: 8 August 2017].
Baumberg Geiger, B. (2017), ‘Benefits conditionality for disabled people: stylised facts from a review of international evidence and practice’. Journal of Poverty and Social Justice, vol 25, no 2, pp. 107-28.
Beaumont, A., et al (2016), ‘The Production of Estimated Levels of Fuel Poverty in Wales: 2012-2016’. Welsh Government http://gov.wales/docs/caecd/research/2016/160711-produc-tion-estimated-levels-fuel-poverty-wales-2012-2016-en.pdf [accessed: 29 Sept 2007].
Brickell, C., Bucke, T., Burchell, J., Davidson, M., Kennedy, E., Linley, R., Zurawan A. (2015), ‘Evaluation of the Right to Rent scheme. Full evaluation report of phase one’. Available at: https://www.gov.uk/government/publications/evaluation-of-the-right-to-rent-scheme [accessed: 29 May 2018].
Bridgeman, T., Thumim, J., Asher, M., Hodges, N., Searby, G. and Morris, P. (2016), ‘Understanding the characteristics of low income households most at risk from living in cold homes’. Welsh Government. Available at: https://www.mwcscot.org.uk/media/375626/themed_visit_to_homeless_people_with_men-tal_ill_health.pdf [accessed: 29 Sept 2017].
Is Britain Fairer?
www.equalityhumanrights.com/britain-fairer 225
References

British Red Cross (2017), ‘Asylum destitution on the rise’. [ONLINE]. Available at: https://www.ein.org.uk/news/british-red-cross-reports-rise-destitute-asylum-seekers-and-refugees-2016 [accessed: 29 Sept 2017].
Cabinet Office (2017), ‘Ethnicity facts and figures: housing’. [ONLINE]. Available at: https://www.ethnicity-facts-figures.service.gov.uk/housing [accessed: 19 December 2017].
Cambridge Centre for Housing and Planning Research and Ipsos MORI (2015), ‘Removal of the Spare Room Subsidy evaluation: final report’. Available at: https://www.gov.uk/government/publications/remov-al-of-the-spare-room-subsidy-evaluation-final-report [accessed: 24 May 2018].
Care Inspectorate Wales (2017a), ‘Chief Inspector’s Annual Report Improving adult care, childcare and social services in Wales 2016–2017’. Available at: http://cssiw.org.uk/docs/cssiw/report/171102annualreporten.pdf [accessed: 19 July 2018].
Care Inspectorate Wales (2017b), ‘In support of carers: carers engagement overview report’. Available at: https://careinspectorate.wales/sites/default/files/2018-03/170615carersen.pdf [accessed: 19 July 2018].
Care Inspectorate Wales (2018), ‘Deprivation of Liberty Safeguards: annual monitoring report for health and social care 2016-17’. Available at: https://careinspectorate.wales/deprivation-liber-ty-safeguards-annual-monitoring-re-port-health-and-social-care-2016-17 [accessed: 15 August 2018].
Care and Support Alliance (2018), ‘Unwell, unsafe, and unfed – 4,000 people needing care reveal a shocking picture of neglect in our care system’. [ONLINE]. Available at: http://careandsupportalliance.com/unwell-unsafe-and-unfed-4000-people-needing-care-reveal-a-shocking-picture-of-neglect-in-our-care-system/ [accessed: 25 May 2018].
Care Quality Commission [CQC] (2015), ‘The state of health care and adult social care in England 2014/15’. Available at: http://www.cqc.org.uk/sites/default/files/20151221_cqc_state_of_care_report_web_accessible.pdf [accessed: 24 May 2018].
Care Quality Commission [CQC] (2016), ‘The state of health care and adult social care in England 2015/16’. Available at: http://www.cqc.org.uk/sites/default/files/20161019_stateof-care1516_web.pdf [accessed: 24 May 2018].
Care Quality Commission [CQC] (2017), ‘The state of health care and adult social care in England 2016/17’. Available at: https://www.cqc.org.uk/sites/default/files/20171123_stateof-care1617_report.pdf [accessed: 24 May 2018].
Carers UK (2017), ‘State of Caring 2017’. Available at: https://www.carersuk.org/for-professionals/policy/policy-library/state-of-caring-report-2017 [accessed: 17 Oct 2017].
Carers Wales (2016), ‘Track the Act, Briefing 1’. Available at: https://www.carersuk.org/wales/policy-resources-for-professionals/policy-library/track-the-act-briefing-1 [accessed: 19 July 2018].
Carers Wales (2017), ‘Track the Act, Briefing 2’. Available at: https://www.carersuk.org/files/section/5763/track-the-act-briefing-2-final-draft-year-1.pdf [accessed: 19 July 2018].
Is Britain Fairer?
www.equalityhumanrights.com/britain-fairer226
References
https://www.gov.uk/government/publications/removal-of-the-spare-room-subsidy-evaluation-final-report
https://www.gov.uk/government/publications/removal-of-the-spare-room-subsidy-evaluation-final-report
https://www.gov.uk/government/publications/removal-of-the-spare-room-subsidy-evaluation-final-report

Chartered Institute of Housing (2016), ‘Mind the gap: the growing shortfall between private rents and help with housing costs’. Available at: http://www.cih.org/resources/PDF/Policy%20free%20download%20pdfs/Mind%20the%20gap.pdf [accessed: 14 August 2017].
Church Urban Fund (2016), ‘Ingredients for Change: Understanding and Responding to Food Poverty’. Church Urban Fund https://www.cuf.org.uk/Handlers/Download.ashx?IDMF=-013b48a5-82fc-4976-a634-7b0ab2df7fb1 [accessed: 29 Sept 2017].
Communities and Local Government Committee (2016), ‘Homelessness: third report of session 2016–17’. Available at: http://www.parliament.uk/business/committees/committees-a-z/commons-select/communities-and-local-gov-ernment-committee/inquiries/parliament-2015/inquiry1 [accessed: 14 August 2017].
Communities and Local Government Committee (2017), ‘Adult social care. Ninth Report of Session 2016–17’. Available at: https://publications.parliament.uk/pa/cm201617/cmselect/cmcomloc/1103/1103.pdf [accessed: 1 August 2018].
Cribb, J., Hood, A., Joyce, R. and Norris Keiller, A. (2017), ‘In-work poverty among families with children’. Institute for Fiscal Studies. Available at: https://www.ifs.org.uk/uploads/publications/comms/r129_ch5.pdf [accessed: 29 Sept 2017].
De Vries, R., Reeves, A. and Geiger, B. (2017), ‘Inequalities in the application of welfare sanctions in Britain’. Available at: http://www.lse.ac.uk/International-Inequalities/Assets/Documents/Working-Papers/III-Working-Paper-15-Inequalities-in-the-application-of-welfare-sanctions-in-Britain-de-Vries-Reeves-and-Gei-ger.pdf [accessed: 25 May 2018].
Department for Business, Energy and Industrial Strategy (2017), ‘Annual fuel poverty statistics report, 2017 (2015 data)’. Available at: https://www.gov.uk/government/uploads/system/uploads/attachment_data/file/639118/Fuel_Pov-erty_Statistics_Report_2017_revised_August.pdf [accessed: 4 April 2018].
Dwyer, P., Jones, K., McNeill, J., Scullion, L. and Stewart, A. (2018), ‘Final findings: disabled people’. Available at: http://www.welfarecondi-tionality.ac.uk/wp-content/up-loads/2018/05/40414-Disabled-people-web.pdf [accessed: 25 May 2018].
Equality and Human Rights Commission [EHRC] (2017a), ‘Being disabled in Britain – a journey less equal’. Available at: https://www.equalityhumanrights.com/en/publication-down-load/being-disabled-britain-journey-less-equal [accessed: 25 May 2018].
Equality and Human Rights Commission [EHRC] (2017b), ‘Disability rights in the UK: UK Independent Mechanism Updated submission to the UN Committee on the Rights of Persons with Disabilities in advance of the public examination of the UK’s implementation of the UN CRPD July 2017 in the UK’. Available at: https://www.equalityhumanrights.com/sites/default/files/crpd-shadow-report-august-2017.pdf [accessed: 25 May 2018].
Equality and Human Rights Commission [EHRC] (2018), ‘Housing and disabled people: Britain’s hidden crisis’. Available at: https://www.equalityhumanrights.com/en/publication-down-load/housing-and-disabled-people-britains-hid-den-crisis [accessed: 24 May 2018].
Fitzpatrick, S. and Bramley, G (2017), ‘Homelessness in the UK: who is most at risk?’, Housing studies, vol 33 no, 1, pp. 96-116. Available at: https://www.tandfonline.com/doi/full/10.1080/02673037.2017.1344957 [accessed: 11 July 2018].
Is Britain Fairer?
www.equalityhumanrights.com/britain-fairer 227
References

Friends, Families and Travellers (2017), ‘Friends, Families and Travellers briefing: lack of increase in affordable pitches for Gypsies and Travellers in England, December 2017’. Available at: https://www.gypsy-traveller.org/wp-content/uploads/2017/12/Lack-of-increase-in-affordable-pitches-report-Dec-2017-FINAL.pdf [accessed: 2 August 2018].
Hackett, K. and Cameron, A. (2017), ‘Review of the evidence on inequality in Wales’. Available at: http://gov.wales/statistics-and-research/review-evidence-inequality-wales/?lang=en [accessed 11 September 2018].
Hackitt, J. (2018), ‘Building a safer future, independent review of building regulations and fire safety: final report’. Available at: https://www.local.gov.uk/sites/default/files/documents/9.33%20Get%20in%20on%20the%20Act%20-%20Homelessness%20Reduction%20Act_v04_Web.pdf [accessed: 11 April 2018].
Health Committee (2016), ‘Impact of the Comprehensive Spending Review on health and social care. First report of session 2016–17’. Available at: https://publications.parliament.uk/pa/cm201617/cmselect/cmhealth/139/139.pdf [accessed: 22 August 2018].
Hirsch, D. (2017), ‘The cost of a child in 2017’. Child Poverty Action Group. Available at: http://www.cpag.org.uk/sites/default/files/TheCostofaChildin2017.pdf [accessed: 29 Sept 2017].
Home Affairs Committee (2017), ‘Asylum accommodation: twelfth report of session 2016–17’. Available at: https://www.parliament.uk/business/committees/committees-a-z/commons-select/home-affairs-committee/inquiries/parliament-2015/asylum-accommoda-tion/ [accessed: 9 August 2017].
Homeless Link (2018), ‘Young and homeless 2018’. Available at: https://www.homeless.org.uk/sites/default/files/site-attachments/Young%20and%20Homeless%202018.pdf [accessed: 11 September 2018].
Hussey, R., Aylward, M., Berwick, D., Black, C., Dixon, J., Edwards, N., Moultrie, K., Gregory, E., and Rafferty, A. M. (2017), ‘Parliamentary Review of Health and Social Care in Wales: Interim Report’. Available at: https://beta.gov.wales/sites/default/files/publica-tions/2017-07/170714-review-interim-report-en.pdf [accessed: 22 August 2018].
Hussey, R., Aylward, M., Berwick, D., Black, C., Dixon, J., Edwards, N., Moultrie, K., Gregory, E., and Rafferty, A. M. (2018), ‘Parliamentary Review of Health and Social Care in Wales: Final Report’. Available at: https://beta.gov.wales/sites/default/files/publications/2018-01/Review-health-social-care-report-final.pdf [accessed: 22 August 2018].
Joint Committee on Human Rights (2018), ‘Reform of Deprivation of Liberty Safeguard: Submit your views’. [ONLINE]. Available at: http://www.parliament.uk/business/committees/committees-a-z/joint-select/human-rights-com-mittee/news-parliament-2017/right-freedom-safety-tor-17-19/ [accessed: 7 March 2018].
Joint Council for the Welfare of Immigrants (2015), ‘“No Passport Equals No Home”: An independent evaluation of the ‘Right to Rent’ scheme’. Available at: https://www.jcwi.org.uk/sites/jcwi/files/No%20Passport%20Equals%20No%20Home.pdf [accessed: 14 August 2017].
Is Britain Fairer?
www.equalityhumanrights.com/britain-fairer228
References

Just Fair (2015), ‘Implementation of the International Covenant on Economic, Social and Cultural Rights in the United Kingdom of Great Britain and Northern Ireland. Parallel report. Submission to the Committee on Economic, Social and Cultural Rights’. Available at: http://docs.wixstatic.com/ugd/8a2436_4b-339b81cc104497a9d9626522c7f796.pdf [accessed: 14 August 2017].
Local Government Association (2017), ‘Get in on the act: Homelessness Reduction’. Available at: https://www.local.gov.uk/sites/default/files/documents/9.33%20Get%20in%20on%20the%20Act%20-%20Homelessness%20Reduction%20Act_v04_Web.pdf [accessed: 1 August 2018].
Local Government Association (2018a), ‘Hackitt review: LGA responds to final report’. [ONLINE]. Available at: https://www.local.gov.uk/about/news/hackitt-review-lga-responds-final-report [accessed: 30 May 2018].
Local Government Association (2018b), ‘Local Government Association Briefing, long term sustainability of the NHS and social care, House of Lords’. Available at: https://www.local.gov.uk/sites/default/files/docu-ments/20180410%20LGABriefing_Sustaina-bleNHS_SocialCare_HoL_v2.pdf [accessed: 20 August 2018].
London Assembly Planning Committee (2018), ‘Statement on the Review of Building Regulations and Fire Safety’. [ONLINE] Available at: https://www.london.gov.uk/press-releases/assembly/response-to-fire-regu-lations-review [accessed: 30 May 2018].
Loopstra, R. and Lalor, D. (2017), ‘Financial insecurity, food insecurity, and disability: the profile of people receiving emergency food assistance from the Trussell Trust Foodbank Network in Britain’. The Trussell Trust and the University of Oxford. Available at: https://www.trusselltrust.org/wp-content/uploads/sites/2/2017/07/OU_Report_final_01_08_on-line2.pdf [accessed: 10 January 2018].
Luchinskaya, D., Ogle, J. and Trickey, M. (2017), ‘A delicate balance? Health and social care spending in Wales’. Available at: https://socialcare.wales/research-and-data/research-on-care-finder/a-delicate-balance-health-and-social-care-spending-in-wales [accessed: 7 March 2018].
Mental Welfare Commission for Scotland (2017), ‘Scotland’s Mental Health and Capacity Law: the Case for Reform’. Available at: https://www.mwcscot.org.uk/media/371023/scotland_s_mental_health_and_capacity_law.pdf [accessed: 27 July 2017].
Ministry of Housing, Communities and Local Government [MHCLG] (2011), ‘Rough Sleeping Statistics England – Autumn 2010 Experimental Statistics’. Available at: https://assets.publishing.service.gov.uk/government/uploads/system/uploads/attachment_data/file/7377/1845810.pdf [accessed: 24 May 2018].
Ministry of Housing, Communities and Local Government [MHCLG] (2014), ‘Consultation: planning and travellers equalities statement’. Available at: https://assets.publishing.service.gov.uk/government/uploads/system/uploads/attachment_data/file/354062/Equalities_State-ment__publication_format_140905.pdf [accessed: 24 May 2018].
Is Britain Fairer?
www.equalityhumanrights.com/britain-fairer 229
References

Ministry of Housing, Communities and Local Government [MHCLG] (2015), ‘Planning policy for travellers’ sites’. Available at: www.gov.uk/gov-ernment/uploads/system/uploads/attachment_data/file/457420/Final_planning_and_travellers_policy.pdf [accessed: 21 July 2017].
Ministry of Housing, Communities and Local Government [MHCLG] (2017a), ‘Government response to the Communities and Local Government Select Committee reports: homelessness and Homelessness Reduction Bill’. Available at: https://assets.publishing.service.gov.uk/government/uploads/system/uploads/attachment_data/file/604965/CM_9443_-_Select_Comittee_Response_-_Homelessness__Web_.pdf [accessed: 1 August 2018].
Ministry of Housing, Communities and Local Government [MHCLG] (2017b), ‘Table 793: families with children in B&B over 6 weeks’ ‘Statutory homelessness prevention and relief’. Available at: https://www.gov.uk/government/statistical-data-sets/live-tables-on-homeless-ness [accessed: 19 December 2017].
Ministry of Housing, Communities and Local Government [MHCLG] (2017c), ‘English Housing Survey social rented sector, 2015-16’. Available at: https://www.gov.uk/government/uploads/system/uploads/attachment_data/file/632464/Social_rented_sector_report_2015-16.pdf [accessed: 19 December 2017].
Ministry of Housing, Communities and Local Government [MHCLG] (2018a), ‘Rough sleeping in England: Autumn 2017 (Revised)’. Available at: https://www.gov.uk/government/statistics/rough-sleeping-in-england-autumn-2017 [accessed: 24 May 2018].
Ministry of Housing, Communities and Local Government [MHCLG] (2018b), Table 774: Reason for loss of last settled home: households accepted by local authorities as owed a main homelessness duty by reason for loss of last settled home, England, 2004 Q1 to 2018 Q1, ‘Statutory homelessness prevention and relief’. Available at: https://assets.publishing.service.gov.uk/government/uploads/system/uploads/attachment_data/file/692691/Acceptances_and_Decisions.xlsx [accessed: 24 May 2018].
Ministry of Housing, Communities and Local Government [MHCLG] (2018c), Table 782: household types in temporary accommodation, households in temporary accommodation at the end of the quarter by type of household, England, 2006 Q2 to 2018 Q1, ‘Statutory homelessness prevention and relief’. Available at: https://www.gov.uk/government/statistical-data-sets/live-tables-on-homeless-ness [accessed: 24 May 2018].
Ministry of Housing, Communities and Local Government [MHCLG] (2018d), Table 780: Household type: households accepted (1) by local authorities as owed a main homelessness duty by household type, England, 2006 Q2 to 2018 Q1. ‘Statutory homelessness prevention and relief: January to March 2018 (revised)’. Available at: https://www.gov.uk/government/statistical-data-sets/live-tables-on-homeless-ness [accessed: 11 July 2018].
Ministry of Housing, Communities and Local Government [MHCLG] (2018e), Table 793: Families with children in B&B over 6 weeks, families with children in bed and breakfast accommodation for more than 6 weeks, excluding those pending review, local authority level, 2012 Q4 to 2018 Q1, ‘Statutory homelessness prevention and relief’. Available at: https://www.gov.uk/government/statistical-data-sets/live-tables-on-homeless-ness [accessed: 24 May 2018].
Is Britain Fairer?
www.equalityhumanrights.com/britain-fairer230
References

Ministry of Housing, Communities and Local Government [MHCLG] (2018f), ‘Annex Table 2.2: non-decent homes, by tenure, 2006 to 2016. English Housing Survey Headline Report, 2016-17: section 2 housing stock tables’. Available at: https://assets.publishing.service.gov.uk/government/uploads/system/uploads/attachment_data/file/705821/2016-17_EHS_Headline_Report.pdf [accessed: 24 May 2018].
Ministry of Housing, Communities and Local Government [MHCLG] (2018g), ‘Count of Traveller Caravans, July 2017 England’. Available at: https://assets.publishing.service.gov.uk/government/uploads/system/uploads/attachment_data/file/674055/Traveller_cara-van_count_July_2017__revised.pdf [accessed: 2 August 2018].
National Audit Office (2016a), ‘Benefit sanctions: detailed methodology’. Available at: https://www.nao.org.uk/wp-content/uploads/2016/11/Benefit-sanctions-de-tailed-methodology.pdf [accessed: 31 May 2018].
National Audit Office (2016b), ‘Children in need of help or protection’. Available at: https://www.nao.org.uk/wp-content/uploads/2016/10/Children-in-need-of-help-protection.pdf [accessed: 25 May 2018].
National Audit Office (2017a), ‘Department for Communities and Local Government: homelessness HC 308 session 2017–2019 13 September 2017’. Available at: https://www.nao.org.uk/wp-content/uploads/2017/09/Homelessness.pdf accessed: 19 December 2017].
National Audit Office (2017b), ‘Health and social care integration’. Available at: https://www.nao.org.uk/wp-content/uploads/2017/02/Health-and-social-care-integration.pdf [accessed: 22 August 2018].
National Audit Office (2018), ‘The adult social care workforce in England’. Available at: https://www.nao.org.uk/report/the-adult-social-care-workforce-in-england/ [accessed: 25 May 2018].
National Working Group on Safeguarding Disabled Children (2016), ‘Safeguarding disabled children in England: how LSCBs are delivering against Ofsted requirements to protect disabled children ’. Available at: https://www.nspcc.org.uk/services-and-resourc-es/research-and-resources/2016/safeguard-ing-disabled-children-england/ [accessed: 25 May 2018].
NHS Digital (2017a), ‘Mental Health Capacity Act (2005) Deprivation of Liberty Safeguards (England): England 2016/17 National Statistics’. Available at: https://digital.nhs.uk/data-and-in-formation/publications/statistical/mental-capaci-ty-act-2005-deprivation-of-liberty-safe-guards-assessments/mental-capacity-act-2005-deprivation-of-liber-ty-safeguards-england-2016-17-official-statistics [accessed: 15 August 2018].
NHS Digital (2017b), ‘Safeguarding adults collection (SAC) England 2016-17 experimental statistics’. Available at: https://files.digital.nhs.uk/pdf/7/4/safeguarding_adults_collection_2016-17_report.pdf [accessed: 15 August 2018].
Office for National Statistics [ONS] (2012), ‘Ethnicity and national identity in England and Wales: 2011’. Available at: https://www.ons.gov.uk/peoplepopulationandcommunity/culturalidentity/ethnicity/articles/ethnicityandna-tionalidentityinenglandandwales/2012-12-11 [accessed: 8 August 2017].
Is Britain Fairer?
www.equalityhumanrights.com/britain-fairer 231
References

Office for National Statistics [ONS] (2016), ‘The effects of taxes and benefits on income inequality: 1977 to financial year ending 2015’. [ONLINE]. Available at: https://www.ons.gov.uk/peoplepopulationandcommunity/personaland-householdfinances/incomeandwealth/bulletins/theeffectsoftaxesandbenefitsonincomeinequali-ty/1977tofinancialyearending2015 [accessed: 5 January 2018].
Office for National Statistics [ONS] (2018), ‘Wealth in Great Britain Wave 5: 2014 to 2016 (statistical bulletin)’. [ONLINE]. Available at: https://www.ons.gov.uk/peoplepopulationand-community/personalandhouseholdfinances/incomeandwealth/bulletins/wealthingreatbritain-wave5/2014to2016 [accessed: 25 May 2018].
Ofsted (2016), ‘Ofsted social care annual report 2016’. Available at: https://www.gov.uk/government/uploads/system/uploads/attachment_data/file/574464/Ofsted_social_care_annual_report_2016.pdf [accessed: 22 August 2018].
Perraudin, F. (2018), ‘Gypsies and Travellers in UK face housing crisis, charities warn’, The Guardian, 18 January 2018. Available at: https://www.theguardian.com/world/2018/jan/18/gypsies-travellers-uk-housing-crisis-chari-ties-warn [accessed: 2 August 2018].
Portes, J. and Reed, H. (2018), ‘The cumulative impact of tax and welfare reforms’. Available at: https://www.equalityhumanrights.com/en/publication-download/cumulative-im-pact-tax-and-welfare-reforms [accessed: 25 May 2018].
Public Accounts Committee (2018), ‘NHS continuing healthcare funding’. Available at: https://publications.parliament.uk/pa/cm201719/cmselect/cmpubacc/455/45502.htm [accessed: 4 April 2018].
Reeves, A. (2017), ‘Does sanctioning disabled claimants of unemployment insurance increase labour market inactivity? An analysis of 346 British local authorities between 2009 and 2014’. Journal of Poverty and Social Justice, vol 25, no 2, pp. 129-46.
Resolution Foundation (2018), ‘A new generational contract: the final report of the Intergenerational Commission’. Available at: https://www.resolutionfoundation.org/advanced/a-new-generational-contract/#f3.1 [accessed: 24 May 2018].
Roberts, C. and Lawrence, M. (2017), ‘Wealth in the twenty-first century: inequalities and drivers’. Available at: https://www.ippr.org/files/2017-10/cej-wealth-in-the-21st-century-oc-tober-2017.pdf [accessed: 10 January 2018].
Royal Institute of British Architects (2018), ‘‘A major missed opportunity’ to make buildings safer today – RIBA responds to Hackitt Review’. [ONLINE]. Available at: https://www.architecture.com/knowledge-and-resources/knowl-edge-landing-page/riba-responds-to-hackitt-re-view-may-2018 [accessed: 30 May 2018].
Scope (2018), ‘The disability price tag’. Available at: https://www.scope.org.uk/campaigns/extra-costs/disability-price-tag [accessed: 25 May 2018].
Scottish Housing Regulator (2016), ‘The 2nd national report on the Scottish social housing charter. An analysis of landlords 2014/15 returns’. Available at: https://www.scottishhous-ingregulator.gov.uk/sites/default/files/publications/FINAL%20National%20Report%20on%20the%20Charter%20201415.pdf [accessed: 05 September 2018].
Scottish Government (2017a), ‘Homelessness in Scotland 2016-17’. Available at: http://www.gov.scot/Publications/2017/06/8907/downloads [accessed: 27 June 2017].
Is Britain Fairer?
www.equalityhumanrights.com/britain-fairer232
References

Scottish Government (2017b), ‘Key indicators from the Scottish House Condition Survey (SHCS) 2016’. Available at: http://www.gov.scot/Publications/2017/12/5401/0 [accessed: 1 June 2018].
Scottish Government (2018a), Bespoke analysis of the Scottish Household Survey for ‘Is Scotland Fairer?’
Scottish Government (2018b), ‘Health and Care Experience Survey 2017/18. National Results’. Available at: http://www.gov.scot/Re-source/0053/00534419.pdf [accessed: 1 May 2018].
Shelter (2017a), ‘Far from alone: Homelessness in Britain in 2017’. Available at: http://england.shelter.org.uk/__data/assets/pdf_file/0017/1440053/8112017_Far_From_Alone.pdf [accessed: 19 December 2017].
Shelter (2017b), ‘“We’ve got no home”: the experiences of homeless children in emergency accommodation’. Available at: http://england.shelter.org.uk/professional_resources/policy_and_research/policy_library/policy_library_fold-er/report_2017_emergency_accommodation_investigation [accessed: 19 December 2017].
Shelter (2017c), ‘Shut out: households at put at risk of homelessness by the housing benefit freeze’. Available at: http://england.shelter.org.uk/professional_resources/policy_and_re-search/policy_library/policy_library_folder/research_shut_out_households_at_put_at_risk_of_homelessness_by_the_housing_bene-fit_freeze [accessed: 19 December 2017].
Social Security Advisory Committee (2018), ‘Young people living independently a study by the social security advisory committee occasional paper no. 20’. Available at: https://assets.publishing.service.gov.uk/government/uploads/system/uploads/attachment_data/file/709732/ssac-occasional-pa-per-20-young-people-living-independently.pdf [accessed: 25 May 2018].
Stats Wales (2017a), ‘Dwelling stock estimates by local authority and tenure’. Available at: https://statswales.gov.wales/Catalogue/Housing/Dwelling-Stock-Estimates/dwellingstockestimates-by-localauthority-tenure [accessed: 14 August 2017].
Stats Wales (2017b), ‘Compliance with the overall Welsh Housing Quality Standard by provider and measure’. Available at: https://statswales.gov.wales/Catalogue/Housing/Social-Housing-Quality/compliancewiththeover-allwelshhousingqualitystandard-by-provid-er-measure [accessed: 14 August 2017].
Stats Wales (2017c), ‘Adults suspected of being at risk by local authority and measure’. Available at: https://statswales.gov.wales/Catalogue/Health-and-Social-Care/Social-Services/Adult-Services/Adult-Safe-guarding/adultssuspectedofbeingatrisk-by-loca-lauthority-measure [accessed: 25 May 2018].
Taulbut, M., Mackay, D. F. and McCartney, G. (2018), ‘Job Seeker’s Allowance (JSA) benefit sanctions and labour market outcomes in Britain, 2001-2014’. Available at: https://academic.oup.com/cje/advance-article/doi/10.1093/cje/bex088/4827894 [accessed: 25 May 2018].
The King’s Fund (2017), What are the priorities for health and social care? [ONLINE]. Available at: https://www.kingsfund.org.uk/publications/what-are-priorities-health-and-social-care [accessed: 20 August 2018].
Is Britain Fairer?
www.equalityhumanrights.com/britain-fairer 233
References

The Trussell Trust (2018), End of Year Stats. [ONLINE]. Available at: https://www.trusselltrust.org/news-and-blog/latest-stats/end-year-stats/ [accessed: 10 July 2017].
UK Government (2017), ‘Asylum accommodation: Government response to the Committee’s Twelfth Report of Session 2016–17’. Available at: https://publications.parliament.uk/pa/cm201719/cmselect/cmhaff/551/55102.htm [accessed: 24 May 2018].
United Nations Committee on Economic, Social and Cultural Rights [UNCESCR] (2016), ‘Concluding Observations on the sixth periodic report of the United Kingdom’. Available at: http://tbinternet.ohchr.org/_layouts/treaty-bodyexternal/Download.aspx?symbolno=E/C.12/GBR/CO/6&Lang=En] [accessed: 11 April 2018].
United Nations Committee on the Convention on the Rights of Disabled People [UNCRPD] (2017), ‘Concluding observations on the initial report of the United Kingdom of Great Britain and Northern Ireland’. Available at: http://tbinternet.ohchr.org/_layouts/treatybodyexter-nal/Download.aspx?symbolno=CRPD/C/GBR/CO/1&Lang=En] [accessed: 11 April 2018].
United Nations Committee on the Rights of the Child [UNCRC] (2016), ‘Concluding Observations on the fifth periodic report of the United Kingdom of Great Britain and Northern Ireland’. Available at: http://tbinternet.ohchr.org/_layouts/treatybodyexternal/Download.aspx?symbono=CRC/C/GBR/CO/5&Lang=En] [accessed: 11 April 2018].
Watts, B., Johnsen, S. and Sosenko, F. (2015), ‘Youth homelessness in the UK’. Available at: https://pureapps2.hw.ac.uk/ws/portalfiles/portal/9258335 [accessed: 14 August 2017].
Welsh Government (2015), ‘Gypsy and Traveller caravan count: July 2015’. Available at: https://gov.wales/docs/statistics/2015/150917-gyp-sy-traveller-caravan-count-july-2015-en.pdf [accessed: 1 August 2018].
Welsh Government (2016), ‘Gypsy and Traveller caravan count: July 2016’. Available at: http://gov.wales/docs/statistics/2016/160929-gyp-sy-traveller-caravan-count-july-2016-en.pdf [accessed: 1 August 2018].
Welsh Government (2017a), ‘National rough sleeper count, November 2016 experimental statistics’. Available at: http://gov.wales/statistics-and-research/national-rough-sleep-ing-count/?lang=en [accessed: 14 August 2017].
Welsh Government (2017b), ‘Homelessness in Wales, 2016-17’. Available at: http://gov.wales/docs/statistics/2017/170727-homeless-ness-2016-17-en.pdf [accessed: 14 August 2017].
Welsh Government (2017c), ‘Evaluation of Homelessness Legislation (Part 2 of the Housing Act (Wales) 2014)’. Available at: http://gov.wales/statistics-and-research/evaluation-homelessness-legislation/?lang=en [accessed: 14 August 2017].
Welsh Government (2017d), ‘Gypsy and Traveller caravan count: July 2017’. Available at: https://gov.wales/docs/statistics/2017/170926-gypsy-traveller-caravan-count-july-2017-en.pdf [accessed: 1 August 2018].
Welsh Government (2018a), ‘National rough sleeper count’. Available at: http://gov.wales/statistics-and-research/national-rough-sleep-ing-count/?lang=en [accessed: 24 May 2018].
Is Britain Fairer?
www.equalityhumanrights.com/britain-fairer234
References
http://tbinternet.ohchr.org/_layouts/treatybodyexternal/Download.aspx?symbono=CRC/C/GBR/CO/5&Lang=En
http://tbinternet.ohchr.org/_layouts/treatybodyexternal/Download.aspx?symbono=CRC/C/GBR/CO/5&Lang=En
Welsh Government (2018b), ‘Measuring national well-being: a report on the national outcomes framework for people who need care and support, and carers who need support, 2016–17’. Available at: http://gov.wales/topics/health/socialcare/well-being/?lang=en [accessed: 25 May 2018].
Wilson, W. (2017), ‘Rough sleeping (England)’. Available at: http://researchbriefings.parliament.uk/ResearchBriefing/Summary/SN02007 [accessed: 14 August 2017].
Health
Standards, cases, legislation and rulesEquality Act 2010. Available at: https://www.legislation.gov.uk/ukpga/2010/15/contents [accessed: 24 August 2018].
Mental Health Act 2007. Available at: https://www.legislation.gov.uk/ukpga/2007/12/contents [accessed: 24 August 2018].
Mental Health (Scotland) Act 2015. Available at: http://www.legislation.gov.uk/asp/2015/9/contents [accessed: 24 August 2018].
Mental Health (Care and Treatment) (Scotland) Act 2003. Available at: https://www.legislation.gov.uk/asp/2003/13/contents [accessed: 24 August 2018].
X (A Child) (No 3) [2017] EWHC 2036 (Fam)
WXYX v Secretary of State for Health [2015].
A&B v Secretary of State for Health [2017] UKSC 41
All other sources Age UK (2017), ‘Briefing: Health and Care of Older People in England 2017’. Available at: https://www.ageuk.org.uk/documents/en-gb/for-professionals/research/the_health_and_care_of_older_people_in_england_2016.pdf?dtrk=true [accessed: 10 August 2018].
APPG Refugees and APPG Migration (2015), ‘The report of the inquiry into the use of immigration detention in the United Kingdom’. https://detentioninquiry.com/report/ [accessed: 29 April 2018].
Asylum Matters (2017), ‘Barriers to healthcare for refugees and people seeking asylum in the UK: Briefing’, Available at: https://health.cityofsanctuary.org/resources [accessed: 11 September 2018].
Audit Scotland (2017), ‘NHS workforce planning’. Available at: http://www.audit-scot-land.gov.uk/report/nhs-workforce-planning [accessed: 10 August 2018].
Bachmann, C. L. and Gooch, B. (2017), ‘LGBT in Britain: hate crime and discrimination’. Stonewall. Available at: https://www.stonewall.org.uk/comeoutforLGBT/lgbt-in-britain/hate-crime [accessed: 24 August 2018].
BAPEN (2016), Press release: BAPEN Publishes Results of Biggest Malnutrition Survey Ever Undertaken in Care Homes. [ONLINE] Available at: http://www.bapen.org.uk/media-centre/press-releases/473-bap-en-publishes-results-of-biggest-malnutri-tion-survey [accessed: 10 August 2018].
Bosworth, M. (2016), ‘The impact of immigration detention on mental health: A literature review, January 2016’. (Published as Appendix 5 of the Shaw review). Available at: https://www.gov.uk/government/publications/review-into-the-wel-fare-in-detention-of-vulnerable-persons [accessed: 10 August 2018].
Is Britain Fairer?
www.equalityhumanrights.com/britain-fairer 235
References
Butterworth, S., Singh, S.P., Birchwood, M., Islam, Z., Munro, E.R., Vostanis, P., Paul, M., Khan, A., & Simkiss, D. (2016), ‘Transitioning care-leavers with mental health needs: ‘they set you up to fail!’’. Child and Adolescent Mental Health, 2016. Available at: https://onlinelibrary.wiley.com/doi/abs/10.1111/camh.12171 [accessed: 10 August 2018].
Cabinet Office (2018), ‘Race Disparity Audit’. Available at: https://www.ethnicity-facts-figures.service.gov.uk/health [accessed: 10 August 2018].
Care Quality Commission [CQC] (2015), ‘Right here, right now: Mental health crisis care review’. Available at: http://www.cqc.org.uk/sites/default/files/20150611_righthere_mhcrisiscare_summary_3.pdf [accessed: 10 August 2018].
Care Quality Commission [CQC] (2016), ‘Not Seen, Not Heard’. Available at: http://www.cqc.org.uk/publications/themed-work/not-seen-not-heard [accessed: 10 August 2018].
Care Quality Commission [CQC] (2017), ‘Care Quality Review. Review of children and young people’s mental health services. Phase One Report. October 2017. Available at: https://www.cqc.org.uk/sites/default/files/20171103_cypmh-phase1_report.pdf [accessed: 10 August 2018].
Centre for Mental Health (2017), ‘Immigration Removals Centres in England: a mental health needs analysis, January 2017’. Available at: https://www.centreformentalhealth.org.uk/sites/default/files/2018-09/immigration_removal.pdf [accessed: 10 August 2018].
Children, Young People and Education Committee [CYPE] (2017), ‘General Scrutiny Session, 18 January 2017’. Available at: http://www.senedd.assembly.wales/ieListDocuments.aspx?MId=3828 [accessed: 24 August 2018].
Children’s Society (2015), ‘Submission to the Joint Committee on Human Rights’. Available at: https://www.parliament.uk/documents/joint-committees/human-rights/Submission_from_The_Children’s_Society.pdf [accessed: 10 August 2018].
Cymorth Cymru (2017), ‘Cymorth Cymru. Health Matters. The health needs of homeless people in Wales’. Available at: http://www.cymorthcymru.org.uk/files/1515/0108/8821/Cymorth_Cymru_Health_Matters_report.pdf [accessed: 10 August 2018].
Department of Health and Social Care [DHSC] (2015), ‘Improving mental health services for young people: Report of the work of the Children and Young People’s Mental Health Taskforce’. Available at: https://www.gov.uk/government/publications/improving-men-tal-health-services-for-young-people [accessed: 10 August 2018].
Department of Health and Social Care [DHSC] (2016), ‘Improving outcomes and supporting transparency Part 2: Summary technical specifications of public health indicators’, [ONLINE] Available at https://assets.publishing.service.gov.uk/government/uploads/system/uploads/attachment_data/file/545605/PHOF_Part_2.pdf [accessed 11 September 2018].
Department of Health and Social Care [DHSC] (2018), ‘Independent review of the Mental Health Act: interim report’. [ONLINE]. Available at: https://www.gov.uk/government/publications/independent-review-of-the-mental-health-act-in-terim-report [accessed: 24 August 2018].
Is Britain Fairer?
www.equalityhumanrights.com/britain-fairer236
References

Department of Health and Social Care [DHSC], Home Office [HO], NHS England, and UK Visas and Immigration [UKVI] (2016), ‘Improving mental health services in immigration detention: action plan’. Available at: https://www.gov.uk/government/publications/improving-men-tal-health-services-in-immigration-detention-ac-tion-plan [accessed: 10 August 2018].
Elwell-Sutton, T. Fok, J. Albanese, F. Mathie, H. and Holland, R. (20-17), ‘Factors associated with access to care and healthcare utilization in the homeless population of England.’ Journal of Public Health, vol. 39, no. 1. pp. 26-35. Available at https://academic.oup.com/jpubhealth/article/39/1/26/3065715 [accessed 10 September 2018].
Equality and Human Rights Commission [EHRC] (2016), ‘Healing a divided Britain: the need for a comprehensive race equality strategy’. Available at: https://www.equalityhumanrights.com/en/publication-down-load/healing-divided-britain-need-comprehen-sive-race-equality-strategy [accessed: 10 August 2018].
Equality and Human Rights Commission [EHRC] (2017), ‘Being disabled in Britain – a journey less equal’. Available at: https://www.equalityhumanrights.com/en/publication-down-load/being-disabled-britain-journey-less-equal [accessed: 10 August 2018].
Equality and Human Rights Commission [EHRC] (forthcoming), ‘Asylum seeker and refused asylum seeker access to healthcare in Britain’. (working title).
Freeman, T. (2017), ‘Health and social care Integration Authorities ‘tokenistic’ when it comes to engagement, warn MSPs’.’ Holyrood Magazine. Available at: https://www.holyrood.com/articles/news/health-and-social-care-inte-gration-authorities-tokenistic-when-it-comes-en-gagement [accessed: 18 October 2017].
Forsey, A. (2016), ‘Britain’s not-so-hidden hunger: A progress report from the All-Party Parliamentary Group on Hunger’. All-Party Parliamentary Group on Hunger. Available at: https://www.feedingbritain.org/Handlers/Download.ashx?IDMF=f8f551ef-0c35-4ed2-9991-e0c97ecb485b [accessed: 10 August 2018].
Forsey, A. (2017), ‘Hungry Holidays: A report on hunger amongst children during school holidays’. All-Party Parliamentary Group on Hunger. Available at: https://www.feedingbritain.org/Handlers/Download.ashx?IDMF=f1305288-754c-4a73-80c9-094331cdd4e1 [accessed: 10 August 2018].
GIDS (2018), ‘Gender Identity Development Service statistics’. Available at: https://tavistockandportman.nhs.uk/documents/408/gids-service-statistics.pdf [accessed: 10 August 2018].
Houses of Parliament Parliamentary Office of Science and Technology [HoP POST] (2016), ‘Infant Mortality and Stillbirth in the UK’. POST Note Number 527 May 2016. Available at: http://researchbriefings.files.parliament.uk/documents/POST-PB-0021/postpn527_UK_In-fant_Mortality_and_Stillbirth_online.pdf [accessed: 10 August 2018].
Homeless Link (2014), ‘The unhealthy state of homelessness: Health audit results 2014’. Available at: https://www.homeless.org.uk/facts/our-research/homelessness-and-health-re-search [accessed: 10 August 2018].
House of Commons Committee of Public Accounts (2016), ‘Improving access to mental health services’. HC 2016-2017 (80). Available at: https://publications.parliament.uk/pa/cm201617/cmselect/cmpubacc/80/80.pdf [accessed: 24 August 2018].
Is Britain Fairer?
www.equalityhumanrights.com/britain-fairer 237
References

House of Commons Education Committee (2016), ‘Mental health and well-being of looked-after children’. HC 2015-2016 (481). Available at: https://www.publications.parliament.uk/pa/cm201516/cmselect/cmeduc/481/481.pdf [accessed: 24 August 2018].
House of Commons Health Committee (2016), ‘Public health post-2013’. HC 2016-2017 (140).. Available at: https://publications.parliament.uk/pa/cm201617/cmselect/cmhealth/140/140.pdf [accessed: 30 April 2018].
HM Chief Inspector of Prisons [HMCIP] (2015), ‘Report on an unannounced inspection of Dungavel House Immigration Removal Centre’. HM Inspectorate of Prisons. Available at: https://www.justiceinspectorates.gov.uk/hmiprisons/wp-content/uploads/sites/4/2015/07/Dungav-el-web-2015.pdf [accessed: 30 June 2017].
HM Chief Inspector of Prisons [HMCIP] (2017a), ‘HM Chief Inspector of Prisons for England and Wales Annual Report 2016–17’. HM Inspectorate of Prisons. Available at: http://www.justiceinspec-torates.gov.uk/hmiprisons/wp-content/uploads/sites/4/2017/07/HMIP-AR_2016-17_CON-TENT_11-07-17-WEB.pdf
HM Chief Inspector of Prisons [HMCIP] (2017b), ‘Report on an unannounced inspection of Heathrow Immigration Removal Centre Harmondsworth site’. HM Inspectorate of Prisons. Available at: https://www.justiceinspec-torates.gov.uk/hmiprisons/wp-content/uploads/sites/4/2018/03/Harmondsworth-Web-2017.pdf [accessed: 24 August 2018].
HM Inspectorate of Prisons for Scotland [HMIPS] (2017), ‘Who Cares? The Lived Experience of Older Prisoners in Scotland’s Prisons’. [ONLINE]. Available at: https://www.prisonsinspectoratescotland.gov.uk/sites/default/files/publication_files/SCT03172875161.pdf [accessed: 10 September 2018].
Jones, A. (2016), ‘Improving health outcomes for Gypsy, Roma and Traveller (GRT) communities’ Available at: http://www.nationalgypsytravellerfederation.org/uploads/3/7/5/2/37524461/improving_health_outcomes_for_grt_communities.pptx [accessed: 21 August 2017].
Kings Fund (2015), ‘Briefing: Mental health under pressure’. Available at: https://www.kingsfund.org.uk/sites/files/kf/field/field_publica-tion_file/mental-health-under-pressure-nov15_0.pdf [accessed: 24 August 2018].
LGBT Youth Scotland (2018), ‘Life in Scotland for LGBT young people’. Available at: https://www.lgbtyouth.org.uk/media/1354/life-in-scotland-for-lgbt-young-people.pdf [accessed: 24 August 2018].
Mind Cymru (2016a), ‘Mind responds to Welsh Government’s Together for Mental Health delivery plan’. [ONLINE]. Available at: https://www.mind.org.uk/news-campaigns/news/mind-responds-to-welsh-governments-together-for-mental-health-delivery-plan/#.WXuQLXn2Y-dV [accessed: 24 August 2018].
Mind Cymru (2016b), ‘Briefing on talking therapies’. Available at: https://www.mind.org.uk/news-campaigns/mind-cymru-campaigns/welsh-assembly-election-2016/ [accessed: 24 August 2018].
Malnutrition Task Force (2017), State of the Nation Older people and malnutrition in the UK today. Available at: http://www.malnutritiontask-force.org.uk/wp-content/uploads/2017/10/AW-5625-Age-UK-MTF_Report.pdf [accessed: 24 August 2018].
Is Britain Fairer?
www.equalityhumanrights.com/britain-fairer238
References

Marsh, A. (2017), ‘Stories of Health & Wellness amongst Romani and Traveller communities in Wales’. Available at: http://www.romaniarts.co.uk/wp-content/up-loads/2017/04/2017-05-02-HealthWellReportFi-nal.pdf [accessed: 4 September 2018].
MBRRACE-UK (2015), Mothers and Babies: Reducing Risk through Audits and Confidential Enquiries across the UK. Perinatal Confidential Enquiry 2015. Available at: https://www.npeu.ox.ac.uk/mbrrace-uk/reports [accessed: 24 August 2018].
Meltzer, H., Gatward, R., Corbin, T., Goodman, R., Ford, T. (2003) The mental health of young people looked after by local authorities in England. Norwich: HMSO. https://sp.ukdataservice.ac.uk/doc/5280/mrdoc/pdf/5280u-serguide.pdf [accessed: 11 November 2017].
Mental Health Foundation (2016a), ‘Mental Health in Wales: Fundamental Facts 2016’. Available at: https://www.mentalhealth.org.uk/sites/default/files/FF16%20Wales.pdf [accessed: 24 August 2018].
Mental Health Foundation (2016b), ‘Mental Health in Wales: Fundamental Facts.’ Available at: https://www.mentalhealth.org.uk/publications/mental-health-wales-fundamen-tal-facts [accessed: 24 August 2018].
Mental Health Foundation (2016c), ‘A Review of Mental Health Services in Scotland: Perspectives and Experiences of Service Users, Carers and Professionals Report for Commitment One of the Mental Health Strategy for Scotland: 2012 – 2015’. Available at: https://www.mentalhealth.org.uk/sites/default/files/Com-mitment%20One%20Report,%20January%202016.pdf [accessed: 24 August 2018].
Mental Health Foundation (2017), ‘Black, Asian and minority ethnic (BAME) communities’. [ONLINE]. Available at: https://www.mentalhealth.org.uk/a-to-z/b/black-asian-and-minority-ethnic-bame-commu-nities [accessed: 24 August 2018].
Mental Health Taskforce (2015), ‘The Five Year Forward View Mental Health Taskforce: public engagement findings’. [ONLINE]. https://www.england.nhs.uk/mentalhealth/wp-content/uploads/sites/29/2015/09/fyfv-mental-hlth-task-force.pdf [accessed: 24 August 2018].
Mental Welfare Commission for Scotland [MWC] (2016a), ‘Investigation: The death of Ms MN’. [ONLINE]. Available at: https://www.mwcscot.org.uk/media/244671/ms_mn_investi-gation_full_report.pdf [accessed: 25 April 2018].
Mental Welfare Commission for Scotland [MWC] (2016b), ‘Young Person Monitoring 2015-16’. Available at: http://www.mwcscot.org.uk/media/34372 9/young_person_monitoring_report_2015-16.pdf [accessed: 30 June 2017].
Mental Welfare Commission for Scotland [MWC] (2016c), ‘No through road: People with learning disabilities in hospital’. Available at: http://www.mwcscot.org.uk/media/296413/no_through_road.pdf [accessed: 17 July 2017].
Mental Welfare Commission for Scotland [MWC] (2016d), ‘Perinatal themes visit report: Keeping mothers and babies in mind’. Available at: https://www.mwcscot.org.uk/media/320718/perinatal_report_final.pdf [accessed: 30 June 2017].
Mental Welfare Commission for Scotland [MWC] (2017), ‘Themed visit to homeless people with mental ill health’. Available at: https://www.mwcscot.org.uk/media/375626/themed_visit_to_homeless_people_with_men-tal_ill_health.pdf [accessed: 26 July 2017].
Is Britain Fairer?
www.equalityhumanrights.com/britain-fairer 239
References

Mind (2013), ‘Mental health crisis care physical restraint in crisis: A report on physical restraint in hospital settings in England’. Available at: https://www.mind.org.uk/media/197120/physical_restraint_final_web_version.pdf [accessed: 8 March 2017].
Mind (2015a), ‘Restraint in mental health services – What the guidance says’. Available at: https://www.mind.org.uk/media/3352178/restraintguidanceweb.pdf [accessed: 24 August 2018].
Mind (2015b), ‘Restraint in mental health services’. Available at: https://www.mind.org.uk/media/3352178/restraintguidanceweb.pdf [accessed: 24 August 2018].
Nair, M., Kurinczuk, J.J., Brocklehurst, P., Sellers, S., Lewis, G., Knight, M. (2015), ‘Factors associated with maternal death from direct pregnancy complications: a UK national case–control study’ BJOG, Journal of Obstetrics and Gynaecology, vol. 122, no. 5. Available at: http://onlinelibrary.wiley.com/doi/10.1111/1471-0528.13279/full [accessed: 24 August 2018].
National Assembly for Wales (2017), ‘Perinatal Mental Health in Wales’. National Assembly for Wales Children, Young People and Education Committee. Available at: http://www.assembly.wales/laid%20documents/cr-ld11234/cr-ld11234-e.pdf [accessed 11 September 2018].
National Audit Office [NAO] (2016), ‘Managing the supply of NHS clinical staff in England’. London: National Audit Office. Available at: www.nao.org.uk/report/managing-the-supply-of-nhs-clinical-staff-in-england/ [accessed: 24 August 2018].
National Audit Office [NAO] (2017a), ‘A Short Guide to Department of Health and NHS England’. Available at: https://www.nao.org.uk/wp-content/uploads/2017/09/2017-Short-Guide-to-the-Department-of-Health-and-NHS-Eng-land.pdf [accessed: 30 April 2018].
National Audit Office [NAO] (2017b), ‘Local support for people with a learning disability’. Available at: https://www.nao.org.uk/wp-content/uploads/2017/03/Local-sup-port-for-people-with-a-learning-disability.pdf [accessed: 24 August 2018].
National Audit Office [NAO] (2017c), ‘Mental health in prisons’. Available at: https://www.nao.org.uk/wp-content/uploads/2017/06/Mental-health-in-prisons-Summary.pdf [accessed: 24 August 2018].
National Confidential Inquiry into Suicide and Homicide [NCISH] (2017), ‘Suicide by children and young people’. Manchester: University of Manchester. Available at: http://www.infocoponline.es/pdf/SUICIDE-CHIL-DREN-YOUNGPEOPLE.pdf [accessed: 11 September 2018].
National Records of Scotland (2017), ‘2016 Births, Deaths and Other Vital Events – Prelimi-nary Annual Figures: Table P1(b): Population and vital events, Scotland, 1971 to 2016’. Available at: https://www.nrscotland.gov.uk/statistics-and-data/statistics/statistics-by-theme/vital-events/general-publications/births-deaths-and-other-vital-events-prelimi-nary-annual-figures/2016 [accessed: 24 August 2018].
NHS Digital (2017a), ‘Mental Health Bulletin: 2016-17’. Reference Tables. Available at: https://digital.nhs.uk/catalogue/PUB30160 [accessed: 24 August 2018].
Is Britain Fairer?
www.equalityhumanrights.com/britain-fairer240
References

NHS Digital (2017b), ‘Mental Health Act Statistics, Annual Figures: 2016-17, Experimental statistics’. [ONLINE]. Available at: https://digital.nhs.uk/data-and-information/publications/statistical/mental-health-act-statis-tics-annual-figures/mental-health-act-statis-tics-annual-figures-2016-17-experimental-statis-tics [accessed: 24 August 2018].
NHS Digital (2017c), ‘Health and Care of People with Learning Disabilities: Experimental Statistics: 2016 to 2017’. [ONLINE]. Available at: https://digital.nhs.uk/data-and-information/publications/statistical/health-and-care-of-peo-ple-with-learning-disabilities/health-and-care-of-people-with-learning-disa-bilities-experimental-statistics-2016-to-2017 [accessed: 24 August 2018].
NHS Digital (2018a), ‘Mental Health Services Monthly Statistics. Exploratory Analysis: Women in contact with mental health services who were new or expectant mothers, January 2017 to December 2017, experimental statistics’. [ONLINE]. Available at: https://files.digital.nhs.uk/2B/5D61DF/MHSDS%20Perinatal%20Exploratory%20Report.pdf [accessed: 24 August 2018].
NHS Digital (2018b), ‘Psychological Therapies: Annual report on the use of IAPT services England, further analyses on 2016-17 [PAS]’ [ONLINE]. Available at: https://digital.nhs.uk/data-and-information/publications/statistical/psychological-therapies-annual-re-ports-on-the-use-of-iapt-services/annual-re-port-2016-17-further-analyses [accessed: 24 August 2018].
NHS England (2016a), Independent Mental Health Taskforce ‘The five year forward view for mental health’. Available at: https://www.england.nhs.uk/wp-content/uploads/2016/02/Mental-Health-Taskforce-FYFV-final.pdf [accessed: 24 August 2018].
NHS England (2016b), ‘Implementing the five year forward view for mental health’. NHSE. Available at: https://www.england.nhs.uk/wp-content/uploads/2016/07/fyfv-mh.pdf [accessed: 24 August 2018].
NHS England (2017), NHS England. Improving Access to Psychological Therapies. July 2017. Available at: https://www.england.nhs.uk/wp-content/uploads/2017/07/nhs-england-anal-ysis-increasing-access-psychological-therapies.pdf [accessed: 24 August 2018].
NHS England (2018a), ‘Mental Health Five Year Forward Dashboard’. Available at: https://www.england.nhs.uk/mental-health/taskforce/imp/mh-dashboard [accessed: 3 July 2018].
NHS England (2018b), ‘Changing the lives of Children’ (Blog). Available at: https://www.england.nhs.uk/blog/changing-the-lives-of-chil-dren [accessed: 24 August 2018].
NHS England (no date), ‘Equality Objectives, 2016-2020’. Available at: https://www.england.nhs.uk/about/equality/objectives-16-20/ [accessed: 24 August 2018].
NHS Health Scotland (2017), ‘NHS Health Scotland’s equality outcomes 2017 to 2021’. Available at: http://www.healthscotland.scot/media/1330/nhs-hs-equality-out-comes-2017-21_march17_english.pdf [accessed: 24 August 2018].
NHS National Services Scotland (2017), ‘Measuring use of health services by equality group’. Available at: https://www.isdscotland.org/Health-Topics/Equality-and-Diversity/Publications/2017-06-27/2017-06-27-Measur-ing-Use-of-Health-Services-by-Equality-Group-Report.pdf [accessed: 23 April 2017].
Is Britain Fairer?
www.equalityhumanrights.com/britain-fairer 241
References

NHS Providers (2016), ‘Investing in Mental health services: Survey briefing’. Available at: https://nhsproviders.org/media/2550/2016-12-15-mh-contracts-survey-results.pdf [accessed: 24 August 2018].
NHS Wales (2016), ‘Equality Objectives 2016-2020’. Available at: http://www.wales.nhs.uk/sitesplus/documents/863/Equality%20Objectives%20-%20evidence%20base.pdf [accessed: 24 August 2018].
NSPCC (2015a), ‘1 in 5 children are rejected mental health treatment’. [ONLINE]. Available at: https://www.nspcc.org.uk/what-we-do/news-opinion/1-in-five-5-children-referred-to-lo-cal-mental-health-services-are-rejected-for-treatment/ [accessed: 24 August 2018].
NSPCC (2015b), ‘NSPCC Wales Briefing: Achieving emotional well-being for looked after children’. [ONLINE] Available at: https://www.nspcc.org.uk/globalassets/documents/research-reports/achieving-emotional-wellbe-ing-for-looked-after-children-cymru-wales-brief-ing.pdf
NSPCC (2016), ‘It turned out someone did care: Childline annual review 2015-16’. [ONLINE]. Available at: https://www.nspcc.org.uk/services-and-resources/research-and-resourc-es/2016/childline-annual-review-2015-16-turned-out-someone-did-care/ [accessed: 24 August 2018].
Office for National Statistics [ONS] (2015), ‘Harmonised Concepts and Questions for Social Data Sources Primary Principles Long-lasting Health Conditions and Illnesses; Impairments and Disability’. Available at: http://www.ons.gov.uk/ons/guide-method/harmonisation/primary-set-of-harmonised-con-cepts-and-questions/long-lasting-health-condi-tions-and-illnesses--impairments-and-disability.pdf?format=contrast [accessed: 24 August 2018].
Office for National Statistics [ONS] (2016a), ‘Statistical bulletin: Disability-Free Life Expectancy by Upper Tier Local Authority: England 2012 to 2014’. Available at: https://www.ons.gov.uk/peoplepopulationandcommuni-ty/healthandsocialcare/healthandlifeexpectan-cies/bulletins/disabilityfreelifeexpectancybyup-pertierlocalauthority/england2012to2014#england [accessed: 24 August 2018].
Office for National Statistics [ONS] (2016b), ‘Statistical bulletin: Suicides in Great Britain: 2016 registrations’. Available at: https://www.ons.gov.uk/peoplepopulationandcommunity/birthsdeathsandmarriages/deaths/bulletins/suicidesintheunitedkingdom/2016registration [accessed: 24 August 2018].
Office for National Statistics [ONS] (2017), ‘Statistical bulletin: Health state life expectancies, UK: 2014 to 2016’. Available at: https://www.ons.gov.uk/peoplepopulationand-community/healthandsocialcare/healthandlife-expectancies/bulletins/healthstatelifeexpectan-ciesuk/2014to2 [accessed: 24 August 2018].
Office for National Statistics [ONS] (2018), ‘Child mortality in England and Wales: 2016 – Stillbirths, infant and childhood deaths occurring annually in England and Wales, and associated risk factors’. Available at: https://www.ons.gov.uk/peoplepopulationandcommuni-ty/birthsdeathsandmarriages/deaths/bulletins/childhoodinfantandperinatalmortalityinenglan-dandwales/2016 [accessed: 24 August 2018].
Prisons and Probation Ombudsman [PPO] (2016), ‘Learning from PPO investigations. Prisoner mental health’. Available at: https://s3-eu-west-2.amazonaws.com/ppo-prod-stor-age-1g9rkhjhkjmgw/uploads/2016/01/PPO-thematic-prisoners-mental-health-web-fi-nal.pdf [accessed: 24 August 2018].
Is Britain Fairer?
www.equalityhumanrights.com/britain-fairer242
References

Prime Minister’s Office [PMO] (2017), ‘Queen’s Speech 2017: background briefing notes’. Available at: https://www.gov.uk/government/uploads/system/uploads/attachment_data/file/620838/Queens_speech_2017_back-ground_notes.pdf [accessed: 24 August 2018].
Public Accounts Committee. (2016), ‘Improving access to mental health services’. Available at: https://www.publications.parliament.uk/pa/cm201617/cmselect/cmpubacc/80/8005.htm [accessed: 24 August 2018].
Public Health England (2015), ‘Early adolescence: Applying All Our Health’. [ONLINE]. Available at: www.gov.uk/government/publications/early-adolescence-ap-plying-all-our-health/early-adolescence-apply-ing-all-our-health [accessed: 24 August 2018].
Quality Compliance Systems (2016), ‘Time to increase access to psychological therapies in Wales?’. Available at: https://www.qcs.co.uk/psychological-therapies-wales-iapt/ [accessed: 24 August 2018].
Rafighi, E., Poduval, S., Legido-Quigley, H., and Howard, N. (2016), ‘National Health Service Principles as Experienced by Vulnerable London Migrants in “Austerity Britain”: A Qualitative Study of Rights, Entitlements, and Civil-Society Advocacy’. International Journal of Health Policy and Management, vol. 5, no. 10, 589-597. Available at: http://doi.org/10.15171/ijhpm.2016.50 [accessed: 24 August 2018].
RCGP (2015), ‘Experiences of delivering primary mental health care. A report by the Wales Mental Health in Primary Care network’. Available at: http://www.gofal.org.uk/uploads/Policy_documents/PMHSS/WaMH_in_PC_re-port_2015.pdf [accessed: 24 August 2018].
RCPCH (2017), ‘State of Child Health 2017’. Available at: https://www.rcpch.ac.uk/state-of-child-health [accessed: 24 August 2018].
Royal College of Midwives (2017), ‘Women in immigration detention: vulnerable but not visible’. Available at: https://www.rcm.org.uk/news-views-and-analysis/views/women-in-im-migration-detention-vulnerable-but-not-visible [accessed: 29 April 2018].
SAMH (2016), ‘Talking it out. Psychological Therapies in Scotland’. Available at: https://www.samh.org.uk/documents/Talking_it_out.pdf [accessed: 24 August 2018].
Scottish Human Rights Commission and Equality and Human Rights Commission (2017), ‘Disability rights in Scotland: Supplementary submission to inform the CRPD List of Issues on the UK’. Available at: http://www.scottishhumanrights.com/media/1558/crpdfeb2017scotlandsupplement.pdf [accessed: 17 October 2017].
Scottish Government (2016), ‘Mental Health in Scotland – a 10 year vision. Published Responses’. Available at: https://consult.scotland.gov.uk/mental-health-unit/mental-health-in-scotland-a-10-year-vision/consultation/published_select_respond-ent?uuId=49771375 [accessed: 24 July 2017].
Scottish Government (2017a), ‘Draft Budget 2017-18’. Available at: http://www.gov.scot/Topics/Government/Finance/18127 [accessed: 24 August 2018].
Scottish Government (2017b), ‘Equality Outcomes and Mainstreaming Report 2017’. Available at: http://www.gov.scot/Re-source/0051/00517333.pdf [accessed: 24 July 2017].
Scottish Government (2017c), ‘Homelessness in Scotland: 2016-17’. Available at: http://www.gov.scot/Resource/0052/00521186.pdf [accessed: 15 December 2017].
Is Britain Fairer?
www.equalityhumanrights.com/britain-fairer 243
References

Scottish Government (2017d), ‘Mental Health Strategy 2017-2027’. Available at: http://www.gov.scot/Publications/2017/03/1750/downloads [accessed: 6 July 2017].
Scottish Government (2017e), ‘The life chances of young people in Scotland: an evidence review for the First Minister’s Independent Advisor on Poverty and Inequality’. Available at: http://www.gov.scot/Publications/2017/07/3569/downloads [accessed: 4 July 2017].
Scottish Parliament (2017a), ‘Hidden Lives – New Beginnings: Destitution, asylum and insecure immigration status in Scotland’. Available at: http://www.parliament.scot/S5_Equal_Opps/Reports/EHRiC_3rd_Re-port_2017.pdf [accessed: 17 July 2017].
Scottish Parliament (2017b), ‘Health and Sport Committee: Healthcare in Prisons, 5th report (Session 5)’. Available at: https://sp-bpr-en-prod-cdnep.azureedge.net/published/HS/2017/5/10/Healthcare-in-Prisons/5th%20report.pdf [accessed: 30 June 2017].
Scottish Public Health Network (2016), ‘Improving the Health of Migrants to Scotland: An update for Scottish Directors of Public Health’. Available at: https://www.scotphn.net/wp-content/uploads/2016/04/2016_03_23-Mi-grant-Health-Report-FINAL-1.pdf [accessed: 03/11/17].
Scottish Public Health Network (2017), ‘Health Care Needs Assessment of Gender Identity Services’. Available at: http://www.ngicns.scot.nhs.uk/wp-content/up-loads/2018/05/2018_05_16-HCNA-of-Gen-der-Identity-Services.pdf [accessed: 24 August 2018].
Sharp and Metcalf (2016), ‘Inequality among lesbian, gay bisexual and transgender groups in the UK: a review of evidence’. National Institute of Economic and Social Research. Available at: https://www.gov.uk/government/uploads/system/uploads/attachment_data/file/539682/160719_REPORT_LGBT_evi-dence_review_NIESR_FINALPDF.pdf [accessed: 24 August 2018].
Shaw (2016), ‘Review into the Welfare in Detention of Vulnerable Persons’. Available at: https://www.gov.uk/government/publications/review-into-the-welfare-in-detention-of-vulnera-ble-persons [accessed: 29 April 2018].
St Mungo’s (2016), ‘Nowhere safe to stay’. Available at: https://www.mungos.org/publication/stop-scandal-case-action-mental-health-rough-sleeping/ [accessed: 24 August 2018].
Stonewall Scotland (2017), ‘School Report Scotland: The experiences of lesbian, gay, bi and trans young people in Scotland’s schools in 2017’. Available at: http://www.stonewallscot-land.org.uk/sites/default/files/school_report_scotland_2017_0.pdf [accessed: 17/10/17].
The Health Foundation (2016), ‘Is devolution good for health?’. Available at: http://www.health.org.uk/blog/devolution-good-health [accessed: 24 August 2018].
The Learning Disabilities Mortality Review Programme [LEDER] (2017), ‘Annual Report December 2017’. Available at: http://www.bristol.ac.uk/university/media/press/2018/leder-annual-report-final.pdf [accessed: 24 August 2018].
Is Britain Fairer?
www.equalityhumanrights.com/britain-fairer244
References

The Royal College of Emergency Medicine (2017), ‘Written evidence to the Health and Social Care Committee inquiry into Sustainability and Transformation Partnerships November 2017’. Available at: http://data.parliament.uk/writtenevidence/committeeevi-dence.svc/evidencedocument/health-commit-tee/sustainability-and-transformation-partner-ships/written/76851.html [accessed: 24 August 2018].
The Traveller Movement (2015), ‘Improving the health of Gypsies and Travellers’. Available at: http://www.travellermovement.org.uk/wp-content/uploads/2015/01/Gypsy-Travel-ler-Health-Briefing-2015.pdf [accessed: 24 August 2018].
The Traveller Movement (2016), ‘Impact of insecure accommodation and the living environment on Gypsies’ and Travellers’ health’. Inclusion Health Board. Available at: https://www.gov.uk/government/uploads/system/uploads/attachment_data/file/490846/NIHB_-_Gypsy_and_Traveller_health_accs.pdf [accessed: 24 August 2018].
United Nations Committee on Economic, Social and Cultural Rights [UNCESCR] (2016), ‘Concluding observations on the sixth periodic report of the United Kingdom of Great Britain and Northern Ireland’, E/C.12/GBR/CO/6 Available at: http://tbinternet.ohchr.org/_layouts/treatybodyexternal/Download.aspx?symbol-no=E%2fC.12%2fGBR%2fCO%2f6&Lang=en [accessed: 10 August 2018].
United Nations Committee on the Elimination of Discrimination Against Women [UNCEDAW] (2013), ‘Concluding observations on the seventh periodic report of the United Kingdom of Great Britain and Northern Ireland’, CEDAW/C/GBR/CO/7. Available at: http://tbinternet.ohchr.org/_layouts/treatybodyexter-nal/Download.aspx?symbolno=CEDAW%2f-C%2fGBR%2fCO%2f7&Lang=en [accessed: 24 August 2018].
United Nations Committee on the Elimination of Racial Discrimination [UNCERD] (2016), ‘Concluding Observations on the combined twenty-first to twenty-third periodic reports of the United Kingdom of Great Britain and Northern Ireland’, CERD/C/GBR/CO/21-23. Available at: http://tbinternet.ohchr.org/_layouts/treatybodyexternal/Download.aspx?symbol-no=CERD/C/GBR/CO/21-23&Lang=En [accessed: 24 August 2018].
United Nations Committee on the Rights of Persons with Disabilities [UNCRPD] (2017), ‘Concluding Observations on the initial report of the United Kingdom of Great Britain and Northern Ireland’, CRPD/C/GBR/CO/1. Available at: http://tbinternet.ohchr.org/_layouts/treatybodyexternal/Download.aspx?symbol-no=CRPD/C/GBR/CO/1&Lang=En [accessed: 24 August 2018].
United Nations Committee on the Rights of the Child [UNCRC] (2016), ‘Concluding observations on the fifth periodic report of the United Kingdom of Great Britain and Northern Ireland’, CRC/C/GBR/CO/5. Available at: http://tbinternet.ohchr.org/_layouts/treatybodyexter-nal/Download.aspx?symbolno=CRC%2f-C%2fGBR%2fCO%2f5&Lang=en [accessed: 24 August 2018].
Is Britain Fairer?
www.equalityhumanrights.com/britain-fairer 245
References

University of Birmingham (2016), ‘Health across borders: Recent migrants’ experience of managing their health and wellbeing in the UK and the implications for health policy and practice’. Available at: https://www.birmingham.ac.uk/Documents/college-social-sciences/social-policy/iris/2016/health-histories-report-fi-nal.pdf [accessed: 24 August 2018].
Welsh Government (2015a), ‘Written Statement – World Mental Health Day 2015: Celebrating improvements to mental healthcare in Wales’. [ONLINE] Available at: http://gov.wales/about/cabinet/cabinetstatements/previous-administra-tion/2015/worldmentalhealthday/?lang=en [accessed: 24 August 2018].
Welsh Government (2015b), ‘Wales Children in Need Census, 2014’. Available at: https://www.gov.uk/government/statistics/wales-children-in-need-census-2014 [accessed: 24 August 2018].
Welsh Government (2015c), ‘Misuse of alcohol one of the main causes of homelessness’. Available at: http://gov.wales/newsroom/health-and-social-services/2015/home-less/?lang=en [accessed: 24 August 2018].
Welsh Government (2015d),’ Review of Evidence of Inequalities in Access to Healthcare Services for Disabled People in Wales’. Available at: https://gov.wales/docs/caecd/research/2015/151015-review-evi-dence-inequalities-access-healthcare-sevic-es-disabled-people-en.pdf [accessed: 24 August 2018].
Welsh Government (2016), ‘Together for Mental Health: Delivery plan: 2016-19 and 2012-14’. Available at: http://gov.wales/topics/health/nhswales/plans/mental-health/?lang=en [accessed: 24 August 2018].
Welsh Government (2018a), ‘Written Statement - Update on improvements to adult gender identity services in Wales’. Available at: http://gov.wales/about/cabinet/cabinetstate-ments/2018/genderidentityservices/?lang=en [accessed: 24 August 2018].
Welsh Government (2018b), ‘Welsh Government. Admission of patients to mental health facilities in Wales, 2016-17’. Available at: http://gov.wales/statistics-and-research/admission-patients-mental-health-facili-ties/?lang=en [accessed: 24 August 2018].
Women and Equalities Committee [WEC] (2016), ‘Transgender Equality First Report of Session 2015-16’. Available at: https://publications.parliament.uk/pa/cm201516/cmselect/cmwomeq/390/390.pdf [accessed: 24 August 2018].
Women and Equalities Committee [WEC] (2017), ‘Inquiry: Tackling inequalities faced by Gypsy, Roma and Traveller communities’. Available at: http://www.parliament.uk/business/committees/committees-a-z/commons-select/women-and-equalities-committee/inquiries/parliament-2015/inequalities-faced-by-gypsy-ro-ma-and-traveller-communities-16-17/publications/ [accessed: 24 August 2018].
Women and Equalities Committee [WEC] (2018), ‘Oral evidence: Tackling inequalities faced by Gypsy, Roma and Traveller communities — HC 360 Wednesday 18 Apr 2018’. Available at: http://data.parliament.uk/writtenevidence/committeeevidence.svc/evidencedocument/women-and-equalities-com-mittee/tackling-inequalities-faced-by-the-gyp-sy-roma-and-traveller-communities/oral/81634.pdf [accessed: 24 August 2018].
Is Britain Fairer?
www.equalityhumanrights.com/britain-fairer246
References

Women for Refugee Women (2017), ‘We are Still Here: the continued detention of women seeking detention in Yarl’s Wood’. [ONLINE]. Available at: www.refugeewomen.co.uk/2016/wp-content/uploads/2017/10/We-are-still-here-report-WEB.pdf [accessed: 29 April 2018].
Young Minds, (2016), ‘Beyond Adversity: Addressing the mental health needs of young people who face complexity and adversity in their lives’. Available at: https://youngminds.org.uk/resources/policy/beyond-adversity/ [accessed: 24 August 2018].
Justice and personal security
Standards, cases, legislation and rulesAbusive Behaviour and Sexual Harm (Scotland), Act 2016. Available at: www.legislation.gov.uk/asp/2016/22/enacted [accessed: 24 August 2018].
Criminal Justice & Courts Act 2015. Available at: http://www.legislation.gov.uk/ukpga/2015/2/contents/enacted [accessed: 24 August 2018].
Domestic Abuse (Scotland), Act 2018. Available at: http://www.legislation.gov.uk/asp/2018/5/con-tents/enacted [accessed: 24 August 2018].
Employment Tribunals and the Employment Appeal Tribunal Fees Order 2013, SI 2013/1893 (‘the Fees Order’)
Female Genital Mutilation Act 2003. Available at: https://www.legislation.gov.uk/ukpga/2003/31/contents [accessed: 24 August 2018].
Legal Aid, Sentencing and Punishment of Offenders Act (LASPO), 2012. Available at: http://www.legislation.gov.uk/ukpga/2012/10/contents/enacted [accessed: 24 August 2018].
Medical Justice & ors v SSHD [2017] EWHC 2461 (Admin)
Mental Health (Care and Treatment) (Scotland) Act 2003. Available at: https://www.legislation.gov.uk/asp/2003/13/contents [accessed: 24 August 2018].
Mental Health Act 1983. Available at: www.legislation.gov.uk/ukpga/1983/20/contents [accessed: 24 August 2018].
Policing and Crime Act 2017. Available at: http://www.legislation.gov.uk/ukpga/2017/3/contents/enacted [accessed: 24 August 2018].
R (on the application of UNISON) v Lord Chancellor [2017] UKSC 51
R (VC) v SSHD [2018] EWCA Civ 57
Serious Crime Act 2015. Available at: http://www.legislation.gov.uk/ukpga/2015/9/contents/enacted [accessed: 24 August 2018].
Violence Against Women, Domestic Abuse and Sexual Violence (Wales) Act 2015. Available at: www.legislation.gov.uk/anaw/2015/3/contents/enacted [accessed: 24 August 2018].
All other sources Agenda (2017), ‘Agenda briefing on the use of restraint against women and girls’. Available at: https://weareagenda.org/wp-content/uploads/2017/03/Restraint-FOI-research-brief-ing-FINAL1.pdf [accessed: 23 August 2018].
All-Party Parliamentary Group [APPG] on Domestic and Sexual Violence (2015), ‘The changing landscape of domestic and sexual violence services’. Available at: https://www.womensaid.org.uk/appg-reports/ [accessed: 23 August 2018].
Is Britain Fairer?
www.equalityhumanrights.com/britain-fairer 247
References

Amnesty International (2017), ‘A matter of routine: the use of immigration detention in the UK’. Available at: https://www.amnesty.org.uk/node/53550 [accessed: 23 August 2018].
Angiolini Review (2017), ‘Report of the independent review of deaths and serious incidents in police custody’. Available at: https://www.gov.uk/government/publications/deaths-and-serious-incidents-in-police-custody [accessed: 23 August 2018].
Audit Scotland (2015), ‘Efficiency of prosecuting criminal cases through the sheriff courts’. Available at: http://www.audit-scotland.gov.uk/uploads/docs/report/2015/nr_150924_sheriff_courts.pdf [accessed: 23 August 2018].
Awan, A. and Zempi, I. (2016), ‘We fear for our lives: offline and online experiences of anti-Muslim hostility’. Tell MAMA. Available at: https://www.tellmamauk.org/wp-content/uploads/resources/We%20Fear%20For%20Our%20Lives.pdf [accessed: 23 August 2018].
Bachmann, C. L. and Gooch, B. (2017), ‘LGBT in Britain: hate crime and discrimination’. Stonewall. Available at: https://www.stonewall.org.uk/comeoutforLGBT/lgbt-in-britain/hate-crime [accessed: 23 August 2018].
Bracadale Review (2018), ‘Independent review of hate crime legislation in Scotland: final report’. Available at: http://www.gov.scot/Publications/2018/05/2988/downloads [accessed: 23 August 2018].
British Medical Association (2017), ‘Locked up, locked out: health and human rights in immigration detention’. Available at: https://www.bma.org.uk/-/media/files/pdfs/collective%20voice/policy%20research/ethics/locked-up-locked-out-immigration-detention-re-port-bma-2017.pdf?la=en [accessed: 23 August 2018].
Cain, C. (2018), ‘After Holloway: consultation with women affected by the criminal justice system’. Centre for Crime and Justice Studies. Available at: http://www.womeninprison.org.uk/perch/resources/after-holloway.pdf [accessed: 23 August 2018].
Chakraborti, N., Garland, J. and Hardy, S.-J. (2014), ‘The Leicester hate crime project: findings and conclusions’. Centre for Hate Studies, University of Leicester. Available at: https://www2.le.ac.uk/departments/criminology/hate/documents/fc-full-report [accessed: 23 August 2018].
Children’s Rights Alliance in England [CRAE] (2016), ‘State of children’s rights in England 2016’. Available at: http://www.crae.org.uk/media/118312/crae_scr2016_b8_cjs-web.pdf [accessed: 23 August 2018].
Coleman, C. (2017), ‘Prison overcrowding’. House of Lords library briefing. Available at: https://researchbriefings.parliament.uk/ResearchBriefing/Summary/LLN-2017-0049 [accessed: 23 August 2018].
Commission on Women Offenders (2012), ‘Commission on Women Offenders: final report’. Scottish Government. Available at: http://www.gov.scot/Topics/archive/reviews/commissiononwomenoffenders/finalreport-2012 [accessed: 23 August 2018].
Committee of Public Accounts (2017), ‘Mental health in prisons: eighth report of session 2017–19’. House of Commons. Available at: https://publications.parliament.uk/pa/cm201719/cmselect/cmpubacc/400/400.pdf [accessed: 23 August 2018].
Community Security Trust [CST] (2018), ‘Antisemitic incidents: report 2017’. Available at: https://cst.org.uk/data/file/a/b/IR17.1517308734.pdf [accessed: 23 August 2018].
Is Britain Fairer?
www.equalityhumanrights.com/britain-fairer248
References

Crown Office and Procurator Fiscal Service [COPFS] (2017), ‘Hate crime in Scotland 2016-17’. Available at: http://www.copfs.gov.uk/images/Documents/Equality_Diversity/Hate%20Crimes/Hate%20Crime%20in%20Scotland%202016-17.pdf [accessed: 23 August 2018].
Crown Prosecution Service [CPS] (2016), ‘Hate crime: what is it and how to support victims and witnesses’. Available at: https://www.cps.gov.uk/sites/default/files/documents/publications/Hate-Crime-what-it-is-and-how-to-support-vic-tims-and-witnesses.pdf [accessed: 23 August 2018].
Crown Prosecution Service [CPS] (2017a), ‘Hate crime annual report 2016–17’. Available at: https://www.cps.gov.uk/sites/default/files/documents/publications/cps-hate-crime-re-port-2017_0.pdf [accessed: 23 August 2018].
Crown Prosecution Service [CPS] (2017b), ‘Violence against women and girls report 2016–17’. Tenth edition. Available at: https://www.cps.gov.uk/sites/default/files/documents/publications/cps-vawg-report-2017_0.pdf [accessed: 23 August 2018].
Disley, E., Taylor, C., Kruithof, K., Winpenny, E., Liddle, M., Sutherland, A., Lilford, R., Wright, S., McAteer, L. and Francis, V. (2016), ‘Evaluation of the offender liaison and diversion trial schemes’. RAND Europe. Available at: https://www.rand.org/pubs/research_reports/RR1283.html [accessed: 23 August 2018].
Equality and Human Rights Commission [EHRC] (2017), Press release: Angiolini Review: long way to go on serious incidents and deaths in custody. [ONLINE]. Available at: https://www.equalityhumanrights.com/en/our-work/news/angiolini-review-long-way-go-serious-inci-dents-and-deaths-custody [accessed: 23 August 2018].
Equality and Human Rights Commission [EHRC] (2018), ‘Response of the Equality and Human Rights Commission to the consultation: “Fit for the future: transforming the court and tribunal estate”’. Available at: https://www.equalityhumanrights.com/sites/default/files/reponse_to_the_consultation_on_the_strate-gy_to_transform_the_courts_and_tribunal_es-tate.pdf [accessed: 23 August 2018].
European Committee for the Prevention of Torture and Inhuman or Degrading Treatment or Punishment (2017), ‘Report to the Government of the United Kingdom on the visit to the United Kingdom carried out by the European Committee for the Prevention of Torture and Inhuman or Degrading Treatment or Punishment (CPT) from 30 March to 12 April 2016’. Available at: https://rm.coe.in-t/168070a773 [accessed: 23 August 2018].
Evans, M (2018), ‘Rethinking legal aid: an independent strategic review’. Scottish Government. Available at: https://beta.gov.scot/publications/rethinking-legal-aid-an-independ-ent-strategic-review/ [accessed: 23 August 2018].
Freedom from Torture, Medical Justice, Bail for Immigration Detainees and Helen Bamber Foundation (2018), ‘Parliamentary briefing on immigration detention of victims of torture and other vulnerable people’. Available at: https://www.freedomfromtorture.org/sites/default/files/news/parliamentary_briefing_immigration_de-tention_vulnerable_individuals_june_2018.pdf [accessed: 23 August 2018].
Garton Grimwood, G. (2015), ‘Categorisation of prisoners in the UK’. Briefing Paper 7437. House of Commons Library. Available at: http://researchbriefings.files.parliament.uk/documents/CBP-7437/CBP-7437.pdf [accessed: 23 August 2018].
Is Britain Fairer?
www.equalityhumanrights.com/britain-fairer 249
References

Gibbs, P. (2017), ‘Defendants on video – con-veyor belt justice or a revolution in access?’ Transform Justice. Available at: http://www.transformjustice.org.uk/wp-content/uploads/2017/10/Disconnected-Thumbnail-2.pdf [accessed: 23 August 2018].
Hardy, S. and Chakraborti, N. (2017), ‘Hate crime: identifying and dismantling barriers to justice’. Equality and Human Rights Commission. Available at: https://www.equalityhumanrights.com/sites/default/files/research-lgbt-hate-crime-reporting-identify-ing-barriers-and-solutions.pdf [accessed: 23 August 2018].
Harris Review (2015), ‘Changing prisons, saving lives: report of the independent review into self-inflicted deaths in custody of 18-24 year olds’. Available at: https://assets.publishing.service.gov.uk/government/uploads/system/uploads/attachment_data/file/439859/moj-harris-review-web-accessible.pdf [accessed: 23 August 2018].
Helen Bamber Foundation (2017), ‘Helen Bamber Foundation briefing for the Westminster Hall debate on the detention of vulnerable people’. Available at: http://www.helenbamber.org/wp-content/uploads/2017/04/Debate-on-Detention-of-Vulnerable-People-14-March-2017-Helen-Bamber-Foundation-Brief-ing.pdf [accessed: 23 August 2018].
HM Chief Inspector of Prisons [HMCIP] (2017a), ‘HM Chief Inspector of Prisons for England and Wales: annual report 2016–17’. HM Inspectorate of Prisons. Available at: https://www.gov.uk/government/publications/hm-chief-inspector-of-prisons-annual-report-2016-to-2017 [accessed: 23 August 2018].
HM Chief Inspector of Prisons [HMCIP] (2017b), ‘Report on an unannounced inspection of Young Persons’ Unit At HMP & YOI Parc’. HM Inspectorate of Prisons. Available at: https://www.justiceinspectorates.gov.uk/hmiprisons/wp-content/uploads/sites/4/2018/02/Young-persons-unit-at-HMP-YOI-Parc-Web-2017.pdf [accessed: 23 August 2018].
HM Chief Inspector of Prisons [HMCIP] (2018a), ‘Report on an unannounced inspection of HMYOI Feltham (Feltham A – children and young people)’. HM Inspectorate of Prisons. HM Inspectorate of Prisons. Available at: https://www.justiceinspectorates.gov.uk/hmiprisons/wp-content/uploads/sites/4/2018/05/Feltham-A-Web-2018.pdf [accessed: 23 August 2018].
HM Chief Inspector of Prisons [HMCIP] (2018b), ‘Report on an unannounced inspection of HMYOI Werrington’. HM Inspectorate of Prisons. Available at: https://www.justiceinspec-torates.gov.uk/hmiprisons/wp-content/uploads/sites/4/2018/06/Werrington-Web-2018-1.pdf [accessed: 23 August 2018].
HM Crown Prosecution Inspectorate Service, HM Inspectorate of Constabulary and HM Inspectorate of Probation (2015), ‘Joint review of disability hate crime follow-up’. Available at: https://www.justiceinspectorates.gov.uk/hmicfrs/wp-content/uploads/joint-review-of-disabili-ty-hate-crime-review.pdf [accessed: 23 August 2018].
HM Government (2012), ‘Challenge it, report it, stop it: the Government’s plan to tackle hate crime’. Available at: https://assets.publishing.service.gov.uk/government/uploads/system/uploads/attachment_data/file/97848/action-plan.pdf [accessed: 23 August 2018].
Is Britain Fairer?
www.equalityhumanrights.com/britain-fairer250
References

HM Government (2016), ‘Ending violence against women and girls: strategy 2016 – 2020’. Available at: https://assets.publishing.service.gov.uk/government/uploads/system/uploads/attachment_data/file/522166/VAWG_Strategy_FINAL_PUBLICATION_MASTER_vRB.PDF [accessed: 23 August 2018].
HM Government (2017), ‘Government response to the Independent Review of Deaths and Serious Incidents in Police Custody’. Available at: https://www.gov.uk/government/publications/deaths-and-serious-incidents-in-police-custo-dy-government-response [accessed: 23 August 2018].
HM Inspectorate of Prisons (2017), ‘Life in prisons: living conditions’. Available at: https://www.justiceinspectorates.gov.uk/hmiprisons/inspections/life-in-prison-living-conditions/ [accessed: 23 August 2018].
HM Inspectorate of Prisons for Scotland [HMIPS] (2017), ‘HM Chief Inspector’s annual report 2016–17’. Available at: https://www.prisonsinspectoratescotland.gov.uk/publications/hm-chief-inspector-prisons-scot-land-annual-report-2016-2017 [accessed: 23 August 2018].
HM Treasury (2018), ‘Treasury minutes: Government response to the Committee of Public Accounts on the twelfth to the nineteenth reports from session 2017-19’. Available at: https://www.parliament.uk/documents/commons-committees/public-accounts/Cm-9596-Treasury-Minutes-march-2018.pdf [accessed: 23 August 2018].
Home Office (2015), ‘Police use of Taser statistics, England and Wales: 1 January to 31 December 2014: data tables’. Available at: https://www.gov.uk/government/statistics/police-use-of-taser-statistics-england-and-wales-1-jan-uary-to-31-december-2014-data-tables [accessed: 23 August 2018].
Home Office (2016), ‘Action against hate: the UK Government’s plan for tackling hate crime’. Available at: https://www.gov.uk/government/publications/hate-crime-action-plan-2016 [accessed: 23 August 2018].
Home Office (2017a), ‘Hate crime, England and Wales, 2016/17’. Statistical Bulletin 17/17. Available at: https://www.gov.uk/government/statistics/hate-crime-england-and-wales-2016-to-2017 [accessed: 23 August 2018].
Home Office (2017b), ‘Detentions under the Mental Health Act (1983): police powers and procedures year ending 31 March 2017’. Available at: https://www.gov.uk/government/statistics/police-powers-and-procedures-eng-land-and-wales-year-ending-31-march-2017 [accessed: 23 August 2018].
Home Office (2017c), ‘User guide to “Police use of TASER® X26 conducted energy devices statistics, England and Wales”’. Available at: https://assets.publishing.service.gov.uk/government/uploads/system/uploads/attachment_data/file/608032/police-use-of-con-ducted-energy-devices-2016-user-guide.pdf [accessed: 23 August 2018].
Home Office (2017d), ‘Police use of TASER® X26 conducted energy devices statistics, England and Wales: 1 January to 31 December 2016: data tables’. Available at: https://www.gov.uk/government/statistics/police-use-of-taser-x26-conducted-energy-devices-statistics-eng-land-and-wales-1-january-to-31-december-2016-data-tables [accessed: 23 August 2018].
Home Office (2018), ‘Immigration statistics, October to December 2017: data tables’. Available at: https://www.gov.uk/government/statistics/immigration-statistics-october-to-de-cember-2017-data-tables [accessed: 23 August 2018].
Is Britain Fairer?
www.equalityhumanrights.com/britain-fairer 251
References
https://www.gov.uk/government/statistics/immigration-statistics-october-to-december-2017-data-tables

Independent Advisory Group on Hate Crime, Prejudice and Community Cohesion (2016), ‘Report of Independent Advisory Group on Hate Crime, Prejudice and Community Cohesion’. Scottish Government. Available at: https://www.gov.scot/Resource/0050/00506074.pdf [accessed: 23 August 2018].
Independent Office for Police Conduct [IOPC] (2017), ‘Deaths during or following police contact: statistics for England and Wales. Time series tables 2004/05 to 2016/17’. Available at: https://policeconduct.gov.uk/re-search-and-learning/statistics/annu-al-deaths-during-or-following-police-con-tact-statistics [accessed: 23 August 2018].
INQUEST (2018), ‘Deaths of immigration detainees’. Available at: https://www.inquest.org.uk/deaths-of-immigration-detainees [accessed: 23 August 2018].
Intelligence and Security Committee of Parliament [ISC] (2018a), ‘Detainee mistreatment and rendition: 2001–2010’. House of Commons. Available at: http://isc.independent.gov.uk/committee-reports/special-reports [accessed: 23 August 2018].
Intelligence and Security Committee of Parliament [ISC] (2018b), ‘Detainee mistreatment and rendition: current issues’. House of Commons. Available at: http://isc.independent.gov.uk/committee-reports/special-reports [accessed: 23 August 2018].
Justice Committee (2015), ‘Impact of changes to civil legal aid under Part 1 of the Legal Aid, Sentencing and Punishment of Offenders Act 2012: eighth report of session 2014–15’. House of Commons. Available at: https://publications.parliament.uk/pa/cm201415/cmselect/cmjust/311/311.pdf [accessed: 23 August 2018].
Kneen, H. (2017), ‘An exploratory estimate of the economic cost of Black, Asian and minority ethnic net overrepresentation in the criminal justice system in 2015’. Ministry of Justice. Available at: https://assets.publishing.service.gov.uk/government/uploads/system/uploads/attachment_data/file/642551/david-lammy-eco-nomic-paper-short-summary.pdf [accessed: 23 August 2018].
Lammy Review (2017), ‘The Lammy review: an independent review into the treatment of, and outcomes for, Black, Asian and minority ethnic individuals in the criminal justice system’. Available at: https://www.gov.uk/government/publications/lammy-review-final-report [accessed: 23 August 2018].
Law Society (2017), ‘Access denied? LASPO four years on: a Law Society review’. Available at: https://www.lawsociety.org.uk/News/documents/laspo-4-years-on-review/ [accessed: 23 August 2018].
Lord Chancellor, Lord Chief Justice and Senior President of Tribunals (2016), ‘Transforming our justice system’. Ministry of Justice. Available at: https://www.gov.uk/government/publications/transforming-our-justice-system-joint-statement [accessed: 23 August 2018].
McGuinness and Gower (2017), ‘Immigration detention in the UK: an overview’. Briefing Paper 7294. House of Commons Library. Available at: https://researchbriefings.parliament.uk/ResearchBriefing/Summary/CBP-7294 [accessed: 23 August 2018].
Mental Welfare Commission for Scotland (2018), ‘Mental Health Act monitoring report 2016-17’. Available at: https://www.mwcscot.org.uk/media/395255/mha_monitoring_re-port2016-17_feb2018.pdf [accessed: 23 August 2018].
Is Britain Fairer?
www.equalityhumanrights.com/britain-fairer252
References

Miller, C., Arcostanzo, F., Smith, J., Krasdomski-Jones, A., Wiedlitzka, S., Jamali, R. and Dale, J. (2016), ‘Brexit: the digital aftermath’. Demos. Available at: https://www.demos.co.uk/wp-content/uploads/2016/07/Dispatches-Brexit-Demos.pdf [accessed: 23 August 2018].
Ministry of Justice [MOJ] (2016a), ‘Prison safety and reform’. Available at: https://assets.publishing.service.gov.uk/government/uploads/system/uploads/attachment_data/file/565014/cm-9350-prison-safety-and-reform-_web_.pdf [accessed: 23 August 2018].
Ministry of Justice [MOJ] (2016b), ‘Response to the proposal on the provision of court and tribunal estate in England and Wales’. Available at: https://consult.justice.gov.uk/digital-commu-nications/proposal-on-the-provision-of-court-and-tribunal-es/ [accessed: 23 August 2018].
Ministry of Justice [MOJ] (2016c), ‘Prisoner transgender statistics, March/April 2016: England and Wales’. Available at: https://assets.publishing.service.gov.uk/government/uploads/system/uploads/attachment_data/file/567053/prisoner-transgender-statis-tics-march-april-2016.pdf [accessed: 23 August 2018].
Ministry of Justice [MOJ] (2016d), ‘Review on the care and management of transgender offenders’. Available at: https://assets.publishing.service.gov.uk/government/uploads/system/uploads/attachment_data/file/566829/transgender-review-findings-print.PDF [accessed: 23 August 2018].
Ministry of Justice [MOJ] (2017a), ‘Government response to the Lammy Review on the treatment of, and outcomes for, Black, Asian and minority ethnic individuals in the criminal justice system’. Available at: https://assets.publishing.service.gov.uk/government/uploads/system/uploads/attachment_data/file/669206/Response_to_David_Lammy_Review.pdf [accessed: 23 August 2018].
Ministry of Justice [MOJ] (2017b), ‘Legal Aid, Sentencing and Punishment of Offenders Act 2012: post-legislative memorandum’. Available at: https://assets.publishing.service.gov.uk/government/uploads/system/uploads/attachment_data/file/655971/LASPO-Act-2012-post-legislative-memoran-dum.pdf [accessed: 23 August 2018].
Ministry of Justice [MOJ] (2017c), ‘Guide to language interpreter and translation services in courts and tribunals’. Available at: https://assets.publishing.service.gov.uk/government/uploads/system/uploads/attachment_data/file/622922/interpreter-and-translation-services-in_court-tri-bunals-jan-mar-2017.pdf [accessed: 23 August 2018].
Ministry of Justice [MOJ] (2017d), ‘National Offender Management Service annual offender equalities report 2016/17’. Available at:https://assets.publishing.service.gov.uk/government/uploads/system/uploads/attachment_data/file/663390/noms-offender-equalities-annual-re-port-2016-2017.pdf [accessed: 23 August 2018].
Ministry of Justice [MOJ] (2017e), ‘Remand status at Crown Court’. Criminal Justice Statistics. Available at: https://www.ethnicity-facts-figures.service.gov.uk/crime-justice-and-the-law/courts-sentenc-ing-and-tribunals/remand-status-at-crown-court/latest [accessed: 23 August 2018].
Is Britain Fairer?
www.equalityhumanrights.com/britain-fairer 253
References

Ministry of Justice [MOJ] (2018a), ‘Post-imple-mentation review evidence gathering exercise: terms of reference’. Available at: https://assets.publishing.service.gov.uk/government/uploads/system/uploads/attachment_data/file/686576/pir-laspo-terms-of-reference.pdf [accessed: 23 August 2018].
Ministry of Justice [MOJ] (2018b), ‘Her Majesty’s Prison and Probation Service (HMPPS) workforce statistics bulletin, as at 31 March 2018’. Available at: https://www.gov.uk/government/statistics/her-majestys-pris-on-and-probation-service-workforce-quarter-ly-march-2018 [accessed: 23 August 2018].
Ministry of Justice [MOJ] (2018c), ‘Annex C: employment tribunals receipts table’. Tribunals and gender recognitions certificates statistics quarterly: October to December 2017. Available at: https://www.gov.uk/government/collections/tribunals-statistics [accessed: 23 August 2018].
Ministry of Justice [MOJ] (2018d), ‘Guide to tribunals and gender recognition certificate statistics quarterly’. Available at: https://assets.publishing.service.gov.uk/government/uploads/system/uploads/attachment_data/file/716009/tribunal-grc-statistics-q4-2017-18-guide.pdf [accessed: 23 August 2018].
Ministry of Justice [MOJ] (2018e), ‘Language interpreter and translation services’. Criminal court statistics quarterly: October to December 2017. Available at: https://www.gov.uk/government/collections/criminal-court-statistics [accessed: 23 August 2018].
Ministry of Justice [MOJ] (2018f), ‘Legal aid statistics tables’. Legal aid statistics: October to December 2017. Available at: https://www.gov.uk/government/statistics/legal-aid-statistics-oc-tober-to-december-2017 [accessed: 23 August 2018].
Ministry of Justice [MOJ] (2018g), ‘Deaths in prison custody 1978 to 2017’. Safety in custody quarterly: update to December 2017. Available at: https://www.gov.uk/government/statistics/safety-in-custody-quarterly-update-to-decem-ber-2017 [accessed: 23 August 2018].
Ministry of Justice [MOJ] (2018h), ‘Prison population: 31 March 2018’. Offender management statistics quarterly: October to December 2017. Available at: https://www.gov.uk/government/statistics/offender-manage-ment-statistics-quarterly-october-to-decem-ber-2017 [accessed: 23 August 2018].
Ministry of Justice [MOJ] (2018i), ‘Self-harm in prison custody 1978 to 2017’. Safety in custody quarterly: update to December 2017. Available at: https://www.gov.uk/government/statistics/safety-in-custody-quarterly-update-to-decem-ber-2017 [accessed: 23 August 2018].
Ministry of Justice [MOJ] and HM Courts & Tribunals Service [HMCTS] (2016), ‘Response to the proposal on the provision of court and tribunal estate in England and Wales’. Available at: https://assets.publishing.service.gov.uk/government/uploads/system/uploads/attachment_data/file/499518/national-consulta-tion-document.pdf [accessed: 23 August 2018].
Ministry of Justice [MOJ] and Her Majesty’s Prison and Probation Service [HMPPS] (2017), ‘Supplementary tables and MDT data tool’. Annual National Offender Management Service digest: 2016 to 2017. Available at: https://www.gov.uk/government/statistics/annual-national-of-fender-management-service-di-gest-2016-to-2017 [accessed: 23 August 2018].
Ministry of Justice [MOJ] and Youth Justice Board for England and Wales [YJB] (2018), ‘Youth justice annual statistics: 2016 to 2017 supplementary tables’. Available at: https://www.gov.uk/government/collections/youth-justice-statistics [accessed: 23 August 2018].
Is Britain Fairer?
www.equalityhumanrights.com/britain-fairer254
References

Minson, S. (2017), ‘The impact of maternal imprisonment upon a child’s wellbeing and their relationship with their mother’. Briefing Paper. University of Oxford. Available at: http://dx.doi.org/10.2139/ssrn.3067653 [accessed: 23 August 2018].
National Audit Office [NAO] (2017), ‘Mental health in prisons’. Available at: https://www.nao.org.uk/wp-content/uploads/2017/06/Mental-health-in-prisons.pdf [accessed: 23 August 2018].
National Offender Management Service [NOMS] (2016), ‘The care and management of transgender offenders’. PSI 17/2016. Ministry of Justice. Available at: https://www.justice.gov.uk/downloads/offenders/psipso/psi-2016/PSI-17-2016-PI-16-2016-AI-13-2016-The-Care-and-Management-of-Transgender-Offenders.docx [accessed: 23 August 2018].
National Police Chiefs Council [NPCC] (2015), ‘Use of section 136 Mental Health Act 1983 in 2014-15 (England and Wales)’. Available at: http://www.npcc.police.uk/documents/edhr/2015/Section%20136%20MHA%20201415%20Data.pdf [accessed: 23 August 2018].
National Police Chiefs Council, College of Policing and Crown Prosecution Service (2018), ‘National disclosure improvement plan’. Available at: https://www.cps.gov.uk/publication/national-disclosure-improvement-plan [accessed: 23 August 2018].
NHS England (2016), ‘HM Treasury agrees full business case for liaison and diversion’. Programme Updates. Available at: https://www.england.nhs.uk/commissioning/health-just/liaison-and-diversion/news/programme-up-dates/ [accessed: 23 August 2018].
NHS England (2018), ‘Mental health five year forward view dashboard Q1 and Q2 2017/18’. Available at: https://www.england.nhs.uk/publication/mental-health-five-year-forward-view-dashboard/ [accessed: 23 August 2018].
NSPCC (2018), ‘How safe are our children? The most comprehensive overview of child protection in the UK’. Available at: https://www.nspcc.org.uk/globalassets/documents/research-reports/how-safe-children-2018-re-port.pdf [accessed: 23 August 2018].
No-Deportations (2015), ‘Self harm in immigration detention – January 2011 to December 2011’. Available at: http://www.no-de-portations.org.uk/Media-6-4-2011/Sel-HarmQ2.html [accessed: 23 August 2018].
No-Deportations (2018), ‘Self-harm in immigration detention, January through December 2017’. Available at: http://www.no-deportations.org.uk/Resources/Self-Harm%202017.html [accessed: 23 August 2018].
Office for National Statistics [ONS] (2017a), ‘Crime in England and Wales, year ending March 2017 – supplementary tables’. Available at: https://www.ons.gov.uk/peoplepopulation-andcommunity/crimeandjustice/datasets/crimeinenglandandwalesannualsupplementar-ytables [accessed: 23 August 2018].
Office for National Statistics [ONS] (2017b), ‘Domestic abuse in England & Wales, year ending March 2017 – appendix tables’. Available at: https://www.ons.gov.uk/peoplepopulationandcommunity/crimeandjus-tice/datasets/domesticabuseinenglandandwale-sappendixtables [accessed: 23 August 2018].
Is Britain Fairer?
www.equalityhumanrights.com/britain-fairer 255
References
Office for National Statistics [ONS] (2018a), ‘Homicide in England and Wales: year ending March 2017’. Available at: https://www.ons.gov.uk/peoplepopulationandcommunity/crimeandjustice/articles/homicideinenglandan-dwales/yearendingmarch2017 [accessed: 23 August 2018].
Office for National Statistics [ONS] (2018b), ‘Sexual offences in England and Wales: year ending March 2017 – appendix tables’. Available at: https://www.ons.gov.uk/peoplepopulationandcommunity/crimeandjus-tice/datasets/sexualoffencesappendixtables [accessed: 23 August 2018].
Police Investigations and Review Commissioner [PIRC] (2015), ‘Annual report and accounts 2014-15’. Available at: https://pirc.scot/media/1248/pirc_annual_accounts_and_statement_2014-15.pdf [accessed: 23 August 2018].
Police Investigations and Review Commissioner [PIRC] (2016), ‘Annual report 2015-16’. Available at: https://pirc.scot/media/3464/annual_report_2015-16.pdf [accessed: 23 August 2018].
Police Investigations and Review Commissioner [PIRC] (2017), ‘Commissioner’s annual report 2016-17’. Available at: https://pirc.scot/media/4441/pirc-commissioners-report-final.pdf [accessed: 23 August 2018].
Prison Reform Trust (2017a), ‘“There’s a reason we’re in trouble”: domestic abuse as a driver to women’s offending’. Available at: http://www.prisonreformtrust.org.uk/Portals/0/Documents/Domestic_abuse_report_final_lo.pdf [accessed: 23 August 2018].
Prison Reform Trust (2017b), ‘Why focus on reducing women’s imprisonment?’ Available at: http://www.prisonreformtrust.org.uk/Portals/0/Documents/Women/why%20women_final.pdf [accessed: 23 August 2018].
Prisons and Probation Ombudsman [PPO] (2017), ‘Learning lessons bulletin: transgender prisoners’. Available at: https://s3-eu-west-2.amazonaws.com/ppo-prod-storage-1g9rkhjhk-jmgw/uploads/2017/01/PPO-Learning-Les-sons-Bulletin_Transgender-prisoners_Final_WEB_Jan-17.pdf [accessed: 23 August 2018].
Pyper, D., McGuinness, F. and Brown, J. (2017), ‘Employment tribunal fees’. Briefing Paper 7081. House of Commons Library. Available at: https://researchbriefings.parliament.uk/ResearchBriefing/Summary/SN07081 [accessed: 23 August 2018].
Scottish Courts and Tribunals Service (2016), Shaping Scotland’s Court services: an evaluation after the first three years 2016’. Available at: http://www.scotcourts.gov.uk/docs/default-source/corporate-scs-library/shaping-scotland-39-s-court-services---an-evaluation---july-2016.pdf?sfvrsn=4 [accessed: 23 August 2018].
Scottish Government (2015), ‘SCJS 2014-15 data tables volume 1 – main survey – demographic breaks’. Scottish Crime and Justice Survey. Available at: https://www.gov.scot/Topics/Statistics/Browse/Crime-Justice/Datasets/SCJS [accessed: 23 August 2018].
Scottish Government (2017a), ‘Tackling prejudice and building connected communities: Scottish Government response to the report of the Independent Advisory Group on Hate Crime, Prejudice and Community Cohesion’. Available at: https://www.gov.scot/Re-source/0052/00520818.pdf [accessed: 23 August 2018].
Scottish Government (2017b), ‘Justice in Scotland: vision and priorities’. Available at: https://www.gov.scot/Resource/0052/00522274.pdf [accessed: 23 August 2018].
Is Britain Fairer?
www.equalityhumanrights.com/britain-fairer256
References
Scottish Government (2017c), ‘Recorded crime in Scotland, 2016-17’. Available at: https://www.gov.scot/Resource/0052/00525055.pdf [accessed: 23 August 2018].
Scottish Government (2017d), ‘Homicide in Scotland 2016-17’. Available at: https://www.gov.scot/Resource/0052/00525786.pdf [accessed: 23 August 2018].
Scottish Government (2017e), ‘Domestic abuse in Scotland: 2016-17 statistics’. Available at: https://beta.gov.scot/publications/domes-tic-abuse-recorded-police-scotland-2016-17/ [accessed: 23 August 2018].
Scottish Government (2018a), ‘SCJS 2016-17 data tables volume 1 – main survey – demographic & geography breaks’. Scottish Crime and Justice Survey. Available at: https://www.gov.scot/Topics/Statistics/Browse/Crime-Justice/Datasets/SCJS [accessed: 23 August 2018].
Scottish Government (2018b), ‘Criminal justice social work statistics in Scotland: 2016-17’. Available at: https://www.gov.scot/Re-source/0053/00530929.pdf [accessed: 23 August 2018].
Scottish Government (2018c), ‘Criminal proceedings in Scotland, 2016-17’. Available at: https://www.gov.scot/Resource/0053/00532010.pdf [accessed: 23 August 2018].
Scottish Prison Service [SPS] (2014), ‘Gender identity and gender reassignment policy for those in our custody’. Available at: http://www.sps.gov.uk/Corporate/Publications/Publication-2561.aspx [accessed: 23 August 2018].
Scottish Prison Service [SPS] (2016), ‘Scottish Prison Service annual report and accounts 2015-2016’. Available at: http://www.sps.gov.uk/Corporate/Publications/Publication-4206.aspx [accessed: 23 August 2018].
Scottish Prison Service [SPS] (2017a), ‘Annual report and accounts 2016-2017’. Available at: http://www.sps.gov.uk/Corporate/Publications/Publication-4207.aspx [accessed: 23 August 2018].
Scottish Prison Service [SPS] (2017b), ‘Transgender population’. FOI request HQ 17153. Available at: http://www.sps.gov.uk/FreedomofInformation/FOI-5435.aspx [accessed: 23 August 2018].
Scottish Prison Service [SPS] (2017c), ‘Self-harm and staff assaults’. FOI request HQ 17154. Available at: http://www.sps.gov.uk/FreedomofInformation/FOI-5716.aspx [accessed: 23 August 2018].
Scottish Prison Service [SPS] (2017d), ‘Scottish Prison Service annual report and accounts 2016-2017’. Available at: http://www.sps.gov.uk/Corporate/Publications/Publication-4207.aspx [accessed: 23 August 2018].
Scottish Prison Service [SPS] (2017e), ‘Prisoner survey 2017’. Available at: http://www.sps.gov.uk/Corporate/Publications/Publication-5751.aspx [accessed: 23 August 2018].
Scottish Prison Service [SPS] (2018a), ‘Deaths in prison custody 2017’. Prisoner deaths. Available at: http://www.sps.gov.uk/Corporate/Information/PrisonerDeaths.aspx [accessed: 23 August 2018].
Scottish Prison Service [SPS] (2018b), ‘Deaths in prison custody 2018’. Prisoner deaths. Available at: http://www.sps.gov.uk/Corporate/Information/PrisonerDeaths.aspx [accessed: 23 August 2018].
Shaw, S. (2016), ‘Review into the welfare in detention of vulnerable persons: a report to the Home Office by Stephen Shaw’. Home Office. https://www.gov.uk/government/publications/review-into-the-welfare-in-detention-of-vulnera-ble-persons [accessed: 23 August 2018].
Is Britain Fairer?
www.equalityhumanrights.com/britain-fairer 257
References

Sisters For Change (2017), ‘Unequal regard, unequal protection: public authority responses to violence against BME women in England’. Available at: http://sistersforchange.org.uk/unequal-regard-unequal-protection/ [accessed: 23 August 2018].
Taylor, C. (2016), ‘Review of the youth justice system in England and Wales’. Ministry of Justice. Available at: https://www.gov.uk/government/publications/review-of-the-youth-justice-system [accessed: 23 August 2018].
Tell MAMA (2017), ‘A constructed threat: identity, prejudice and the impact of anti-Muslim hatred. Tell MAMA annual report 2016’. Faith Matters. Available at: https://tellmamauk.org/wp-content/uploads/2017/11/A-Constructed-Threat-Identity-Intolerance-and-the-Impact-of-Anti-Muslim-Hatred-Web.pdf [accessed: 23 August 2018].
Traveller Movement (2017), ‘The last acceptable form of racism? The pervasive discrimination and prejudice experienced by Gypsy, Roma and Traveller communities’. Available at: http://travellermovement.org.uk/wp-content/uploads/TMreportFinalWeb1.pdf [accessed: 23 August 2018].
United Nations Committee on Economic, Social and Cultural Rights [UNCESCR] (2016), ‘Concluding observations on the sixth periodic report of the United Kingdom of Great Britain and Northern Ireland’. E/C.12/GB/CO/6. Available at: https://www.ohchr.org/en/countries/enacaregion/pages/gbindex.aspx [accessed: 23 August 2018].
United Nations Committee on the Elimination of Racial Discrimination [UNCERD] (2016), ‘Concluding observations on the combined twenty-first to twenty-third periodic reports of the United Kingdom of Great Britain and Northern Ireland’. CERD/C/GB/CO/21-23. Available at: https://www.ohchr.org/en/countries/enacaregion/pages/gbindex.aspx [accessed: 23 August 2018].
United Nations Committee on the Rights of Persons with Disabilities [UNCRPD] (2017), ‘Concluding observations on the initial report of the United Kingdom of Great Britain and Northern Ireland’. CRPD/C/GB/CO/1. Available at: https://www.ohchr.org/en/countries/enacaregion/pages/gbindex.aspx [accessed: 23 August 2018].
United Nations Committee on the Rights of the Child [UNCRC] (2016), ‘Concluding observations on the fifth periodic report of the United Kingdom of Great Britain and Northern Ireland’. CRC/C/GBR/CO/5. Available at: https://www.ohchr.org/en/countries/enacaregion/pages/gbindex.aspx [accessed: 23 August 2018].
Van Ginneken, E., Sutherland, A. and Molleman, T. (2017), ‘An ecological analysis of prison overcrowding and suicide rates in England and Wales, 2000–2014’, International Journal of Law and Psychiatry, vol. 50, pp. 76-82.
Walters, M. A. and Brown, R. (2016), ‘Preventing hate crime: emerging practices and recommendations for the improved management of criminal justice interventions’. University of Sussex. Available at: http://sro.sus-sex.ac.uk/64925/1/Interventions%20for%20Hate%20Crime%20-%20FINAL%20REPORT_2.pdf [accessed: 23 August 2018].
Is Britain Fairer?
www.equalityhumanrights.com/britain-fairer258
References

Welsh Affairs Committee (2015), ‘Prisons in Wales and treatment of Welsh offenders inquiry: fourth report of session 2014–15’. House of Commons. Available at: http://www.publications.parliament.uk/pa/cm201415/cmselect/cmwelaf/113/113.pdf [accessed: 23 August 2018].
Women and Equalities Committee (2016), ‘Transgender equality: first report of session 2015–16’. House of Commons. Available at: https://publications.parliament.uk/pa/cm201516/cmselect/cmwomeq/390/390.pdf#page=63 [accessed: 23 August 2018].
Women’s Aid (2018), ‘Survival and beyond: the domestic abuse report 2017’. Available at: https://www.womensaid.org.uk/survival-be-yond-report/ [accessed: 23 August 2018].
Participation
Standards, cases, legislation and rulesBus Services Act 2017. Available at: http://www.legislation.gov.uk/ukpga/2017/21/contents/enacted [accessed: 24 August 2018].
Community Empowerment (Scotland) Act 2015. Available at: http://www.legislation.gov.uk/asp/2015/6/contents/enacted [accessed: 24 August 2018].
Data Protection Act 1998. Available at: http://www.legislation.gov.uk/ukpga/1998/29/contents [accessed: 24 August 2018].
Data Protection Act 2018. Available at: http://www.legislation.gov.uk/ukpga/2018/12/contents/enacted [accessed: 24 August 2018].
Equality Act 2010. Available at: http://www.legislation.gov.uk/ukpga/2010/15/contents [accessed: 24 August 2018].
EU Data Protection Directive 2016/680 (Law Enforcement Directive). Available at: https://ec.europa.eu/info/law/law-topic/data-protection/data-protection-eu_en [accessed: 24 August 2018].
EU General Data Protection Regulation (GDPR). Available at: https://eur-lex.europa.eu/legal-content/EN/TXT/PDF/?uri=CELEX-:32016R0679 [accessed: 24 August 2018].
Fairer Scotland Duty. Available at: https://www.gov.scot/Publications/2018/03/6918 [accessed: 24 August 2018].
First Group plc v Paulley [2017] UKSC 4
Gender Representation on Public Boards (Scotland) Act 2018. Available at: http://www.legislation.gov.uk/asp/2018/4/enacted [accessed: 24 August 2018].
Investigatory Powers Act 2016. Available at: http://www.legislation.gov.uk/ukpga/2016/25/contents/enacted [accessed: 24 August 2018].
R (on the application of National Council for Civil Liberties) v SSHD Divisional Court [2018] EWHC 975
Scotland Act 1998. Available at: http://www.legislation.gov.uk/ukpga/1998/46/contents [accessed: 24 August 2018].
Scottish Elections (Reduction of Voting Age) Act 2015. Available at: www.legislation.gov.uk/asp/2015/7/contents/enacted [accessed: 24 August 2018].
Trade Union Act 2016. Available at: www.legislation.gov.uk/ukpga/2016/15/contents/enacted [accessed: 24 August 2018].
Trade Union (Wales) Act 2017. Available at: www.legislation.gov.uk/anaw/2017/4 [accessed: 24 August 2018].
Is Britain Fairer?
www.equalityhumanrights.com/britain-fairer 259
References

Transparency of Lobbying, Non-Party Campaigning and Trade Union Administration Act 2014. Available at: http://www.legislation.gov.uk/ukpga/2014/4/contents/enacted [accessed: 24 August 2018].
Wales Act 2017. Available at: www.legislation.gov.uk/ukpga/2017/4/contents/enacted/data.htm [accessed: 24 August 2018].
Well-being of Future Generations (Wales) Act 2015. Available at: http://www.legislation.gov.uk/anaw/2015/2/contents/enacted [accessed: 24 August 2018].
All other sources 5Rights Youth Commission (2017), ‘Our Digital Rights: How Scotland can realise the rights of children and young people in the digital world’. Available at: www.youngscot.net/wp-content/uploads/2017/05/Five_Rights_Report_2017_May.pdf [accessed: 16 October 2017].
Alzheimer’s Society (2016), ‘Dementia in rural Wales’. Available at: www.alzheimers.org.uk/get-involved/our-campaigns/dementia-in-ru-ral-wales [accessed: 10 August 2017].
Amnesty International (2015), ‘Two years after Snowden: Protecting human rights in an age of mass surveillance’. Available at: www.amnesty.nl/content/uploads/2015/06/two_years_after_snowden_final_report_en_a4.pdf?x32866 [accessed: 23 April 2018].
Amnesty International UK (2017), ‘Black and Asian women MPs abused more online’. [ONLINE]. Available at: www.amnesty.org.uk/online-violence-women-mps [accessed: 4 June 2018].
Apostolova, V., Uberoi, E. and Johnston, N. (2017), ‘Political disengagement in the UK: who is disengaged?’ House of Commons Library briefing paper CBP7501. Available at: researchbriefings.parliament.uk/ResearchBrief-ing/Summary/CBP-7501 [accessed: 1 June 2018].
Arts Council England (2018), ‘Evaluation of the cultural citizens programme pilot: overall report’. Available at: www.artscouncil.org.uk/publication/evaluation-cultural-citizens-pro-gramme-pilot [accessed: 16 July 2018].
Association of Community Rail Partnerships (2017), ‘What’s been achieved through community rail?’ Available at: acorp.uk.com/research-projects/whats-been-achieved-through-community-rail/ [accessed: 15 February 2018].
Attitude is Everything (2016), ‘State of Access Report 2016’. Available at: www.attitudei-severything.org.uk/soar [accessed: 22 September 2017].
Audickas, L. and Apostolova, V. (2017), ‘Ethnic minorities in politics and public life’. House of Commons Library briefing paper SN01156. Available at: http://researchbriefings.parliament.uk/ResearchBriefing/Summary/SN01156 [accessed: 3 August 2018].
Bakir, V., Cable, J., Dencik, L., Hintz, A. and McStay, A. (2015), ‘Public feeling on privacy, security and surveillance’. Available at: sites.cardiff.ac.uk/dcssproject/files/2015/11/Public-Feeling-on-Privacy-Security-Surveil-lance-DATAPSST-DCSS-Nov2015.pdf [accessed: 19 October 2017].
Barton, F., Bradbrook, G. and Broome, G. (2015), Digital accessibility: a brief landscaping. Citizen’s Online. Available at: https://www.citizensonline.org.uk/wp-content/uploads/digital-accessibility-report-a-pdf.pdf [accessed: 3 August 2018].
Is Britain Fairer?
www.equalityhumanrights.com/britain-fairer260
References

British Transport Police (no date), ‘Report it to Stop it’. [ONLINE]. Available at: http://www.btp.police.uk/about_us/our_campaigns/report_it_to_stop_it.aspx [accessed: 1 February 2018].
British Transport Police (2012), ‘Annual Report 2011-12’. Available at: www.btp.police.uk/about_us/your_right_to_information/publications/annual_report_archive.aspx [accessed: 1 February 2018].
British Transport Police (2017a), ‘Statistical bulletin 2016/17’. Available at: www.btp.police.uk/about_us/your_right_to_information/publications.aspx [accessed: 18 September 2017].
British Transport Police (2017b) ‘Crime statistics’. Available at: www.btp.police.uk/about_us/your_right_to_information/publication_scheme/disclosure_log/crime_sta-tistics.aspx [accessed: 9 July 2018].
Butcher, L. (2018), ‘Access to transport for disabled people’. House of Commons Library briefing paper CBP601. Available at: https://researchbriefings.parliament.uk/ResearchBrief-ing/Summary/SN00601 [accessed: 1 June 2018].
Cabinet Office (2015), ‘Community Life Survey, England 2014 to 2015: Statistical bulletin’. Available at: www.gov.uk/government/publications/community-life-survey-2014-to-2015-statistical-analysis [accessed: 11 April 2018].
Cabinet Office (2017), ‘Community Life Survey, England 2016 to 17: Statistical bulletin’. Available at: www.gov.uk/government/statistics/community-life-survey-2016-17 [accessed: 11 April 2018].
Cabinet Office (2018), ‘Ethnicity facts and figures: travel to school’. Available at: www.ethnicity-facts-figures.service.gov.uk/culture-and-community/transport/travel-to-school/latest [accessed: 1 June 2018].
Campaign for Better Transport (2016), School transport matters: a report on school transport provision across the UK 2010-2016. Available at: http://www.school-transport.com/assets/PDFs/SchoolTransportMattersApril2016.pdf [accessed: 22 September 2017].
Care International (2016), ‘Global leaders say financial inclusion is key to empowering women’. [ONLINE]. Available at: insights.careinternational.org.uk/development-blog/global-leaders-say-financial-inclusion-is-key-to-empowering-women [accessed: 16 April 2018].
Carnegie UK Trust (2015), ‘Ambition and opportunity: a strategy for public libraries in Scotland 2015-2020’. Available at: https://www.carnegieuktrust.org.uk/publications/national-strategy-for-public-libraries-in-scotland/ [accessed: 22 September 20157].
Commissioner for Ethical Standards in Public Life in Scotland [CESPLS] (2017), ‘Annual Report and Accounts 2016/17’. Available at: www.ethicalstandards.org.uk/site/uploads/publications/6596a6b583657d1e7ed-3b94a229ae796.pdf [accessed: 11 December 2017].
Children’s Commissioner (2017), ‘Children’s Commissioner launches social media giants’ terms and conditions ‘jargon-buster’ to give kids more power in digital world’. [ONLINE]. Available at: www.childrenscommissioner.gov.uk/2017/09/29/childrens-commissioner-launch-es-social-media-giants-terms-and-conditions-jargon-buster-to-give-kids-more-power-in-digi-tal-world/ [accessed: 1 June 2018].
Is Britain Fairer?
www.equalityhumanrights.com/britain-fairer 261
References

Cifas (2017), ‘Identity fraud soars to new levels’. [ONLINE]. Available at: https://www.cifas.org.uk/newsroom/identity-fraud-soars-to-new-levels [accessed: 18 November 2017].
Clery, E., Kiss, Z., Taylor, E. and Gill V. (2017), ‘Disabled people’s travel behaviour and attitudes to travel’. Available at: www.gov.uk/government/publications/disabled-people-atti-tudes-towards-travel [accessed: 16 July 2018].
Commissioner for Public Appointments (2015), ‘Annual report 2014/15’. Available at: publicappointmentscommissioner.independent.gov.uk/publications/annual-reports/ [accessed: 21 May 2018].
Commissioner for Public Appointments (2017), ‘Annual report 2016/17’. Available at: publicappointmentscommissioner.independent.gov.uk/publications/annual-reports/ [accessed: 13 April 2018].
Courts and Tribunals Judiciary (2017a), ‘Judicial Diversity Committee of the Judges’ Council – Report on Progress and Action Plan 2018-19’. Available at: www.judiciary.uk/about-the-judici-ary/who-are-the-judiciary/diversity/judicial-diversity-committee-of-the-judges-coun-cil-report-on-progress-and-action-plan-2018/ [accessed: 17 July 2018].
Courts and Tribunals Judiciary (2017b), ‘Judiciary diversity statistics 2017’. Available at: www.judiciary.gov.uk/about-the-judiciary/who-are-the-judiciary/diversity/judicial-diversi-ty-statistics-2017/ [accessed: 13 April 2018].
Creaser, C. and White, S. (2017), ‘Libraries making a difference: the fifth quality framework of Welsh Public Library Standards 2014-2017’. Available at: gov.wales/docs/drah/publica-tions/180302-library-standards-summary-re-port-en.pdf [accessed: 3 August 2018].
Cromarty, H. (2018), ‘Gypsies and Travellers’. House of Commons Library briefing paper 08083. Available at: researchbriefings.parliament.uk/ResearchBriefing/Summary/CBP-8083 [accessed: 16 July 2018].
Davidson, S., Rossall, P. and Hart, S. (2015), ‘Financial abuse evidence review’. Age UK. Available at: www.ageuk.org.uk/Documents/EN-GB/For-professionals/Research/Financial_Abuse_Evidence_Review-Nov_2015.pdf?dtrk=true [accessed: 20 September 2017].
Dempsey, N. (2018), ‘Local elections 2018’. House of Commons briefing paper CBP 8306’. Available at: researchbriefings.parliament.uk/ResearchBriefing/Summary/CBP-8306#fullre-port [accessed: 13 July 2018].
Department for Business, Energy and Industrial Strategy [BEIS] (2017), ‘Trade union membership 2016: Statistical bulletin’. Available at: www.gov.uk/government/statistics/trade-union-statistics-2016 [accessed: 17 July 2017].
Department for Digital, Culture, Media and Sport [DCMS] (2015), ‘Sporting Future – A New Strategy for an Active Nation’. Available at: www.gov.uk/government/publications/sporting-future-a-new-strategy-for-an-active-na-tion [accessed: 13 July 2018].
Department for Digital, Culture, Media and Sport [DCMS] (2016), ‘Culture white paper’. Available at: www.gov.uk/government/publications/culture-white-paper [accessed: 16 July 2018].
Department for Digital, Culture, Media and Sport [DCMS] (2017), ‘Taking Part April 2017: “Focus On…” diversity trends’. Available at: www.gov.uk/government/statistics/taking-part-april-2017-focus-on-reports [accessed: 5 February 2018].
Is Britain Fairer?
www.equalityhumanrights.com/britain-fairer262
References

Department for Digital, Culture, Media and Sport [DCMS] (2018a), ‘Digital Charter will set new online standards for years to come’. Available at: www.gov.uk/government/news/digital-charter-will-set-new-online-standards-for-years-to-come [accessed: 16 April 2018].
Department for Digital, Culture, Media and Sport [DCMS] (2018b), ‘Sporting Future: second annual report’. Available at: www.gov.uk/government/publications/sporting-future-sec-ond-annual-report [accessed: 9 July, 2018)
Department for Digital, Culture, Media and Sport [DCMS] (2018c), ‘Culture is digital’. Policy paper. Available at: www.gov.uk/government/publications/culture-is-digital/culture-is-digital [accessed: 16 July 2018].
Department for Digital, Culture, Media and Sport [DCMS] (2018d), ‘Taking Part Survey: England – Adult Report, 2016/17’. Available at: www.gov.uk/government/statistics/taking-part-201617-quarter-4-statistical-release [accessed: 12 July 2018].
Department for Transport (2017a), ‘Wheelchair access in taxis and private hire vehicles’. Available at: https://www.gov.uk/government/publications/access-for-wheelchair-users-to-taxis-and-private-hire-vehicles [accessed: 21 May 2018].
Department for Transport (2017b), ‘Draft transport accessibility action plan’. Available at: https://www.gov.uk/government/consultations/draft-transport-accessibility-action-plan [accessed: 23 April 2018].
Department for Transport (2017c), ‘National travel survey 2016’. Available at: https://www.gov.uk/government/collections/national-trav-el-survey-statistics [accessed: 1 June 2018].
Department for Transport (2017d), ‘Annual bus statistics: England 2016/17’. Available at: https://www.gov.uk/government/collections/bus-statistics#publications-2017 [accessed: 22 February 2018].
Department for Transport (2017e), ‘Concessionary travel statistics: year ending March 2017’. Available at: https://www.gov.uk/government/statistics/concessionary-travel-sta-tistics-year-ending-march-2017 [accessed: 1 June 2018].
Department for Transport (2018a), ‘Future of community rail strategy’. Available at: www.gov.uk/government/consultations/future-of-commu-nity-rail-strategy [accessed: 9 July 2018].
Department for Transport (2018b), ‘Beyond the horizon: the future of UK aviation – Next steps towards an aviation strategy’. Available at: www.gov.uk/government/consultations/a-new-aviation-strategy-for-the-uk-call-for-evidence [accessed: 9 July 2018].
Edmonds, T. (2018), ‘Bank branch closures’. House of Commons Library Briefing Paper SN00385. Available at: https://researchbrief-ings.parliament.uk/ResearchBriefing/Summary/SN00385 [accessed: 21 March 2018].
Electoral Commission (2017), ‘Elections for everyone: Experiences of people with disabilities at the 8 June 2017 UK Parliamenta-ry general election’. Available at: www.electoralcommission.org.uk/__data/assets/pdf_file/0008/237194/Accessibility-re-port-call-for-evidence.pdf [accessed: 18 May 2018].
Electoral Reform Society (2018), ‘Voters locked out: the flaws of voter ID in England’. Available at: https://www.electoral-reform.org.uk/latest-news-and-research/parliamentary-brief-ings/voters-locked-out-the-flaws-of-voter-id-in-england/ [accessed: 18 May 2018].
Is Britain Fairer?
www.equalityhumanrights.com/britain-fairer 263
References

Engender (2017), ‘Sex and power in Scotland 2017’. Available at: https://www.engender.org.uk/content/publications/SEX-AND-POWER-IN-SCOTLAND-2017.pdf [accessed: 5 July 2017].
Equality and Human Rights Commission [EHRC] (2016a), ‘Board diversity and the Public Sector Equality Duty: A guide for public authorities in Scotland’. Available at: https://www.equalityhumanrights.com/en/publica-tion-download/board-diversity-and-public-sec-tor-equality-duty-guide-public-authorities [accessed: 21 May 2018].
Equality and Human Rights Commission [EHRC] (2016b), ‘Healing a divided Britain: the need for a comprehensive race equality strategy’. Available at: https://www.equalityhumanrights.com/en/race-report-heal-ing-divided-britain [accessed: 9 August 2018].
Equality and Human Rights Commission [EHRC] (2017), ‘Tackling Disability-Related Harassment: final progress report 2017’. Available at: https://www.equalityhumanrights.com/en/publication-download/tackling-disabili-ty-related-harassment-final-progress-re-port-2017 [accessed: 14 September 2017].
Equality and Human Rights Commission [EHRC] (2018a), ‘Letter from the Equality and Human Rights Commission to the Cabinet Office, 11 April 2018’. Available at: https://www.gov.uk/government/publications/letter-from-the-equality-human-rights-commission-to-the-cabi-net-office [accessed: 2 August 2018].
Equality and Human Rights Commission [EHRC] (2018b) The state of play: progress on Premier League clubs’ accessibility [accessed: 26 June 2018].
Fraser of Allander Institute (2017), ‘Scottish Labour Market Trends vol. 1 No 3’. Available at: https://pure.strath.ac.uk/portal/files/66417175/FAI_2017_1_3_Scottish_Labour_Market_Trends.pdf [accessed: 4 July 2017].
GDPR:Report (2017), ‘Nearly half of UK adults polled intend to activate new personal data rights’. Available at: https://gdpr.report/news/2017/07/17/nearly-half-uk-adults-polled-in-tend-activate-new-personal-data-rights/ [accessed: 1 June 2018].
HC Deb (08 March 2018) vol. 637, col. 21WS [accessed: 9 July 2018].
HM Inspectorate of Constabulary in Scotland [HMICS] (2016), ‘Audit and assurance review of the facial search functionality within the UK Police National Database by Police Scotland’. Available at: https://www.documentcloud.org/documents/2702356-HMICS-Audit-and-Assur-ance-Review-of-the-Use-of.html?embed=true&-responsive=false&sidebar=false [accessed: 7 November].
Hodgson (Lord) report (2016), ‘Third Party Campaigning: Getting the Balance Right’. Available at: https://www.gov.uk/government/uploads/system/uploads/attachment_data/file/508568/2904969_Cm_9205_Complete_Text_V0.5.pdf [accessed: 19 July 2017].
Home Affairs Committee (2013), ‘Undercover policing: interim report’. House of Commons Home Affairs Committee. Available at: https://www.parliament.uk/business/committees/committees-a-z/commons-select/home-af-fairs-committee/inquiries/parliament-2010/undercover-policing-follow-up/ [accessed: 2 August 2018].
Home Office (2018), ‘Individuals referred to and supported through the Prevent Programme, April 2016 to March 2017’. Statistical Bulletin 06/18. Available at: www.gov.uk/government/statistics/individuals-referred-to-and-supported-through-the-prevent-programme-april-2016-to-march-2017 [accessed: 16 May 2018].
Is Britain Fairer?
www.equalityhumanrights.com/britain-fairer264
References

Holzinger, O., Jones, H., and Millett, D. (2016), ‘Assembly Election 2016: Women’s political representation’. National Assembly for Wales Research Service blog. Available at: https://seneddresearch.blog/2016/05/27/assem-bly-election-2016-womens-political-representa-tion [accessed: 29 November 2017].
House of Commons Justice Committee (2016), ‘The role of the magistracy’. Available at: https://publications.parliament.uk/pa/cm201617/cmselect/cmjust/165/165.pdf. [accessed: 22 August 2018].
House of Lords (2017), ‘Tackling financial exclusion: A country that works for everyone?’ Select Committee on Financial Exclusion, Report of Session 2016-17. Available at: publications.parliament.uk/pa/ld201617/ldselect/ldfinexcl/132/132.pdf [accessed: 22 February 2018].
House of Lords (2016), ‘The Equality Act 2010: the impact on disabled people’. Select Committee on the Equality Act 2010 and Disability, Report of Session 2015-16. Available at: publications.parliament.uk/pa/ld201516/ldselect/ldeqact/117/117.pdf [accessed: 1 August 2018].
Independent Chief Inspector of Borders and Immigration [ICIBI] (2016), ‘An inspection of the ‘hostile environment’ measures relating to driving licences and bank accounts’. Available at: www.gov.uk/government/publications/inspection-report-of-hostile-environment-meas-ures-october-2016 [accessed: 22 February 2018].
Inclusion Scotland (2016), ‘Access to Elected Office for Disabled People Report to the Scottish Government’. Available at: inclusionscotland.org/what-we-do/employabili-ty-and-civic-participation/access-to-politics/aeofs/ [accessed: 4 May 2018].
Information Commissioner’s Office (2016), ‘Annual Track 2016’. Available at: ico.org.uk/about-the-ico/our-information/research-and-re-ports/information-rights-research [accessed 15 November 2017].
Information Commissioner’s Office (2017a), Information rights strategic plan 2017-2021. Available at: ico.org.uk/about-the-ico/our-information/our-strategies-and-plans/ [accessed: 18 November 2017].
Information Commissioner’s Office (2017b), Trust and confidence in data. Available at: ico.org.uk/about-the-ico/news-and-events/news-and-blogs/2017/11/ico-survey-shows-most-uk-citizens-don-t-trust-organisations-with-their-data/ [accessed: 15 November 2017].
Information Commissioner’s Office (2018), ‘Children and the GDPR’. Available at: ico.org.uk/for-organisations/guide-to-the-general-da-ta-protection-regulation-gdpr/children-and-the-gdpr/ [accessed: 1 June 2018].
Institute of Employment Rights (2017), ‘Trade Union Act 2016: What it says; what it means’. Available at: www.ier.org.uk/resources/trade-union-act-2016-what-says-what-it-means [accessed: 18 May 2018].
Ipsos MORI (2017), ‘How Britain voted in the 2017 election’. Available at: https://www.ipsos.com/ipsos-mori/en-uk/how-britain-voted-2017-election [accessed: 18 May 2018].
Jones, M. (2016), ‘Community transport in Wales: A quick guide. National Assembly for Wales Research Service’. Available at: www.assembly.wales/research%20documents/16-021%20-%20community%20transport/16-021-web-final-english.pdf [accessed: 2 August 2018].
Is Britain Fairer?
www.equalityhumanrights.com/britain-fairer 265
References

Judiciary of Scotland (2017), ‘Judicial diversity statistics’. Available at: http://www.scotland-judi-ciary.org.uk/52/0/Publications [accessed: 6 August 2017].
Keen, R. and Cracknell, R. (2018), ‘Women in Parliament and Government’. House of Commons Library briefing paper SN01250. Available at: researchbriefings.parliament.uk/ResearchBriefing/Summary/SN01250#fullre-port. [accessed: 17 July 2018].
Krook, M. L. (2017), ‘Politics as usual? Rising violence against female politicians threatens democracy itself’. LSE British Politics and Policy blog. Available at: http://blogs.lse.ac.uk/politicsandpolicy/politics-as-usual-rising-vio-lence-against-female-politicians-threatens-de-mocracy-itself/ [accessed: 23 April 2018].
Leonard Cheshire (2016), ‘Barriers to sporting activity in the UK’. Available at: https://www.leonardcheshire.org/support-and-information/latest-news/news-and-blogs/barriers-sport-ing-activity-uk [accessed: 22 September 2017].
Leonard Cheshire (2017), ‘Councils urged to ensure disabled people can access polling stations’. Available at: www.leonardcheshire.org/support-and-information/latest-news/press-releases/councils-urged-ensure-disa-bled-people-can-access [accessed: 18 May 2018].
LGBT Youth (2017), ‘Life in Scotland for LGBT young people’. Available at: https://www.lgbtyouth.org.uk/media/1354/life-in-scotland-for-lgbt-young-people.pdf [accessed: 10 April 2018].
LSE Public Policy Group (2016), ‘Gender and the 2016 elections’. Democratic Dashboard briefing. Available at: blogs.lse.ac.uk/politicsandpolicy/gender-and-the-2016-elec-tions/ [accessed: 17 July 2018].
Martin, C., Hope, S. and Zubairi, S. (2016), ‘The role of digital exclusion in social exclusion’. Carnegie UK Trust. Available at: www.carnegieuktrust.org.uk/wp/wp-content/uploads/sites/64/2016/09/the-role-of-digital-exclusion.pdf [accessed: 23 April 2018].
Ministry of Housing, Communities and Local Government [MHCLG] (2018a), ‘Integrated communities strategy green paper’. Available at: https://www.gov.uk/government/consultations/integrated-communities-strate-gy-green-paper [accessed: 3 August 2018].
Ministry of Housing, Communities and Local Government [MHCLG] (2018b), ‘Written submis-sion from Ministry of Housing, Communities and Local Government (GRT0003)’. Women and Equalities Committee inquiry into tackling inequalities faced by Gypsy, Roma and Traveller communities. Available at: www.parliament.uk/business/committees/committees-a-z/commons-select/wom-en-and-equalities-committee/inquiries/parliament-2017/inequalities-faced-by-gypsy-ro-ma-and-traveller-communities-17-19/ [accessed: 6 August 2018].
Minnis, A. (2018), ‘Is there a difficult road ahead for Community Transport?’ National Assembly for Wales Research Service blog. Available at: https://seneddresearch.blog/2018/04/10/is-there-a-difficult-road-ahead-for-community-transport/ [accessed: 29 November 2017].
NatCen (2018), ‘Fragmented communities? The role of cohesion, community involvement and social mixing’. Available at: natcen.ac.uk/our-research/research/fragmented-communi-ties/ [accessed: 19 July 2018].
Is Britain Fairer?
www.equalityhumanrights.com/britain-fairer266
References

National Assembly for Wales (2017a), ‘A Parliament that works for Wales: The report of the Expert Panel on Assembly Electoral Reform’. Available at: www.assembly.wales/en/abthome/about_us-commission_assembly_ad-ministration/panel-elec-reform/Pages/Assembly-Electoral-Reform.aspx [accessed: 13 April 2018].
National Assembly for Wales (2017b), ‘Inquiry into loneliness and isolation’. Health, Social Care and Sport Committee. Available at: http://www.assembly.wales/laid%20documents/cr-ld11310/cr-ld11310-e.pdf [accessed: 3 August 2018].
National Council for Voluntary Organisations [NCVO] (2017), UK Civil Society Almanac 2017: Motivations and barriers to volunteering. Available at: data.ncvo.org.uk/a/almanac17/motivations-and-barriers-to-volunteer-ing-3/#Motivations_for_volunteering [accessed: 23 April 2018].
NHS Scotland (2018), ‘Social isolation and loneliness in Scotland: a review of prevalence and trends’. Available at: www.healthscotland.scot/media/1712/social-isolation-and-loneli-ness-in-scotland-a-review-of-prevalence-and-trends.pdf [accessed: 8 May 2017].
Ofcom (2018), ‘Adults’ media use and attitudes: report 2018’. Available at: https://www.ofcom.org.uk/__data/assets/pdf_file/0011/113222/Adults-Media-Use-and-Attitudes-Report-2018.pdf [accessed: 19 October 2017].
Office of the United Nations High Commission-er for Human Rights [OHCHR] (2017), ‘Report of the Special Rapporteur on the rights to freedom of peaceful assembly and of association on his follow-up mission to the United Kingdom of Great Britain and Northern Ireland’. Available at: www.ohchr.org/EN/HRBodies/HRC/RegularSessions/Session35/_layouts/15/WopiFrame.aspx?sourcedoc=/EN/HRBodies/HRC/RegularSessions/Session35/Documents/A_HRC_35_28_Add.1_AEV.docx&action=default&DefaultItemOpen=1 [accessed: 18 July 2017].
Office for National Statistics [ONS] (2015), ‘Internet users: 2015’. Available at: https://www.ons.gov.uk/businessindustryandtrade/itandinternetindustry/bulletins/internetus-ers/2015 [accessed: 10 August 2017].
Office for National Statistics [ONS] (2016), ‘Internet users in the UK: 2016’. Available at: https://www.ons.gov.uk/businessindustry-andtrade/itandinternetindustry/bulletins/internetusers/2016 [accessed: 10 August 2017].
Office for National Statistics [ONS] (2017), ‘Internet users in the UK: 2017’. Available at: https://www.ons.gov.uk/businessindustry-andtrade/itandinternetindustry/bulletins/internetusers/2017 [accessed: 10 August 2017].
Office for National Statistics [ONS] (2018), ‘Loneliness – What characteristics and circumstances are associated with feeling lonely?’ Available at: https://www.ons.gov.uk/peoplepopulationandcommunity/wellbeing/articles/lonelinesswhatcharacteristicsandcir-cumstancesareassociatedwithfeelinglone-ly/2018-04-10 [accessed: 3 August 2018].
Is Britain Fairer?
www.equalityhumanrights.com/britain-fairer 267
References

Public Administration and Constitutional Affairs Committee (PACAC) (2016), ‘Better Public Appointments? The Grimstone Review on Public Appointments. Third Report of Session 2016–17’. Available at: https://publications.parliament.uk/pa/cm201617/cmselect/cmpubadm/495/495.pdf [accessed: 31 July 2017].
Peachey, J. (2017), ‘Shining a light: the future of public libraries across the UK and Ireland. Policy Report, Carnegie UK Trust’. Available at: https://d1ssu070pg2v9i.cloudfront.net/pex/carnegie_uk_trust/2017/04/Policy-Report-Shin-ing-a-Light.pdf [accessed: 11 September 2017].
Police Scotland (2017), ‘Release of 2016/17 Prevent Referral Data’. [ONLINE]. Available at: http://www.scotland.police.uk/about-us/police-scotland/prevent-referral-data/ [accessed: 10 April 2018].
Power, A. (2016), ‘Sport and poverty’. Child Poverty Action Group Journal (154). pp. 10-13. Available at: http://www.cpag.org.uk/content/sport-and-poverty [accessed: 1 June 2018].
Scottish Government (2016a), Press release: £250,000 for trade unions. [ONLINE]. Available at: https://news.gov.scot/news/gbp-250-000-for-trade-unions [accessed: 8 August 2018].
Scottish Government (2016b), ‘Realising Scotland’s full potential in a digital world: A Digital Strategy for Scotland’. Available at: http://www.gov.scot/Publications/2017/03/7843 [accessed: 4 June 2018].
Scottish Government (2017a), ‘Public Appointments in Scotland 2016’. Available at: http://www.appointed-for-scotland.org/About-public-bodies/Diversity/ [accessed: 4 July 2017].
Scottish Government (2017b), ‘Scottish Household Survey Scotland’s People Annual Report 2016’. Available at: www.gov.scot/Publications/2017/09/9979/downloads [accessed: 16 October 2017].
Scottish Government (2017c), ‘National Action Plan on Internet Safety for Children and Young People’. Available at: https://www.gov.scot/Publications/2017/04/1061 [accessed: 6 August 2018].
Scottish Government (2017d), ‘Independent Advisory Group on the Use of Biometric Data in Scotland – Terms of Reference’. Available at: http://www.gov.scot/Resource/0052/00522483.pdf [accessed: 7 November].
Scottish Government (2018a), ‘Report of the Independent Advisory Group on the Use of Biometric Data in Scotland’. Available at: https://www.gov.scot/Publications/2018/03/9437 [accessed: 6 August 2018].
Scottish Government (2018b), ‘The Fairer Scotland Duty Interim Guidance for Public Bodies’. Available at: http://www.gov.scot/Publications/2018/03/6918/downloads [accessed: 3 August 2018].
Scottish Parliament Information Centre (2016), ‘Election 2016’. Available at: http://www.parliament.scot/parliamentarybusiness/99390.aspx [accessed: 5 July 2017].
Social Mobility Commission (2017), ‘Social mobility in Great Britain: fifth state of the nation report’. Available at: www.gov.uk/government/publications/state-of-the-nation-2017 [accessed: 01 June 2018].
Is Britain Fairer?
www.equalityhumanrights.com/britain-fairer268
References

Solymosi, R., Cella, K. and Newton, A. (2018), ‘Did they report it to stop it? A realist evaluation of the effect of an advertising campaign on victims’ willingness to report unwanted sexual behaviour’. Security Journal, 31(2), pp.570-590. Available at: doi.org/10.1057/s41284-017-0117-y [accessed: 1 June 2018].
Southby, K. and South, J. (2016), ‘Volunteering, inequalities and barriers to volunteering: A rapid evidence review’. Leeds Beckett University. Available at: eprints.leedsbeckett.ac.uk/3434/1/Barriers%20to%20volunteering%20-%20final%2021st%20November%202016.pdf [accessed: 23 April 2018].
Sport Scotland (2015), ‘Raising the bar’. Available at: https://sportscotland.org.uk/about-us/what-we-do/publications/raising-the-bar-corporate-plan-2015-2019/ [accessed: 7 August 2017].
Sport England (2018), ‘Active Lives Adult Survey: November 16/17 report’. Available at: www.sportengland.org/news-and-features/news/2018/march/22/figures-show-nations-ac-tivity-levels/ [accessed: 12 July 2018].
Sport Wales (2016), ‘Strategic equality plan 2016-2020’. Available at: http://sport.wales/media/1712914/sports_wales_equality_english.pdf [accessed: 16 May 2018].
Sport Wales (2018), ‘A vision for sport in Wales’. Available at: http://sport.wales/media/506916/sport_wales_english_vision_doc_reprint_all_v3.pdf [accessed: 23 May 2018].
Stonewall (2017), ‘LGBT in Britain: hate crime and discrimination’. Available at: https://www.stonewall.org.uk/comeoutforLGBT/lgbt-in-britain/hate-crime [accessed: 1 June 2018].
Stonewall Cymru (2017), ‘LGBT in Wales: Hate crime and discrimination’. Available at: https://www.stonewallcymru.org.uk/cymrucomeout-forLGBT/lgbt-in-britain/hate-crime [accessed: 24 May 2018].
Tinkler, J. (2016), ‘Addressing Islamic extremism’. Available at: researchbriefings.parliament.uk/ResearchBriefing/Summary/POST-PN-0526 [accessed: 3 August 2018].
Transport Scotland (2016), ‘Personal and cross-modal travel’. Scottish Transport Statistics No. 35. Available at: https://www.transport.gov.scot/publication/scottish-trans-port-statistics-no-35-2016-edition/sct01171871341-14/ [accessed: 4 July 2018].
Transport Scotland (2018a), ‘Scottish Transport Statistics – No 36 – Datasets’. Available at: https://www.transport.gov.scot/publication/scottish-transport-statistics-no-36-datasets/ [accessed: 8 August 2018].
Transport Scotland (2018b), ‘Scottish Transport Statistics’. Available at: https://www.transport.gov.scot/media/41863/scottish-transport-statis-tics-2017-with-correction-to-table-214.pdf [accessed: 8 August 2018].
Traveller Movement (2017), ‘Operation Traveller Vote: The general election’. Available at: https://travellermovement.org.uk/project/opera-tion-traveller-vote/ [accessed: 23 April 2018].
Travellers Times (2018), ‘Operation Traveller Vote 2018’. Available at: https://www.travellerstimes.org.uk/news/2018/04/operation-traveller-vote-2018 [accessed: 23 April 2018].
Is Britain Fairer?
www.equalityhumanrights.com/britain-fairer 269
References

UK Government (2016), ‘The Casey Review: a review into opportunity and integration’. Available at: www.gov.uk/government/publications/the-casey-review-a-review-into-op-portunity-and-integration. [accessed: 19 July 2018].
UK Government (2017a), ‘Every voice matters: building a democracy that works for everyone’. Available at: https://www.gov.uk/government/publications/every-voice-matters-building-a-de-mocracy-that-works-for-everyone [accessed: 18 May 2018].
UK Government (2017b), Press release: Domestic Abuse survivors given a voice to vote. [ONLINE]. Available at: https://www.gov.uk/government/news/domestic-abuse-survivors-given-a-voice-to-vote [accessed: 23 April 2018].
UK Government (2017c), ‘Public appointments diversity action plan’. Available at: https://www.gov.uk/government/publications/public-appoint-ments-diversity-action-plan [accessed: 23 April 2018].
UK Government (2017d), ‘Response to the final report of the Lords Select Committee on Financial Exclusion’. Available at: www.gov.uk/government/publications/response-to-the-final-report-of-the-lords-select-committee-on-finan-cial-exclusion [accessed: 16 July 2018].
UK Government (2017e), ‘Government transformation strategy: better use of data’. Available at: www.gov.uk/government/publications/government-transformation-strate-gy-2017-to-2020/government-transforma-tion-strategy-better-use-of-data [accessed: 15 September 2017].
UK Government (2017f), ‘National LGBT survey’. Available at: https://www.gov.uk/government/consultations/national-lgbt-survey [accessed: 23 August 2018].
UK Government (2018a), Press release: Anonymous voter registration made easier for domestic abuse survivors. [ONLINE]. Available at: www.gov.uk/government/news/survivors-of-domestic-abuse-now-able-to-vote-anonymously [accessed: 2 August 2018].
UK Government (2018b), ‘Voter ID pilots’. Available at: https://www.gov.uk/government/publications/voter-id-pilots [accessed: 18 May 2018].
UK Government (2018c), ‘First meeting of the financial inclusion policy forum’. Available at: www.gov.uk/government/news/first-meet-ing-of-the-financial-inclusion-policy-forum [accessed: 16 July 2018].
UK Government (2018d), ‘Government response to the Internet Safety Strategy green paper’. Available at: https://www.gov.uk/government/consultations/internet-safety-strate-gy-green-paper [accessed: 16 July 2018].
UK Parliament (no date), ‘Digital, Culture, Media and Sport Committee inquiry into the phenomenon of fake news’. Available at: www.parliament.uk/business/committees/committees-a-z/commons-select/digital-cul-ture-media-and-sport-committee/inquiries/parliament-2017/fake-news-17-19/ [accessed: 12 July 2018].
UK Parliament (2016), ‘Role of the magistracy inquiry’. Available at: https://www.parliament.uk/business/committees/committees-a-z/commons-select/justice-committee/inquiries/parliament-2015/role-of-the-magistracy-in-quiry-15-16/ [accessed: 18 May 2018].
UK Parliament (2017), ‘Growing up with the internet’. Available at: http://www.parliament.uk/children-and-the-internet [accessed: 15 November 2017].
Is Britain Fairer?
www.equalityhumanrights.com/britain-fairer270
References

UK Parliament (2018a), ‘Urgent question on voter ID pilots: 23 April 2018’. Available at: www.parliament.uk/business/news/2018/april/urgent-question-on-voter-id-pilots-23-april-2018/ [accessed: 18 May 2018].
UK Parliament (2018b), ‘Access to Elected Office for Disabled People: Written statement – HCWS695’. Available at: www.parliament.uk/business/publications/written-questions-an-swers-statements/written-statement/Commons/2018-05-17/HCWS695/ [accessed: 4 June 2018].
UK Parliament (2018c), ‘Freedom of speech in universities inquiry’. Available at: https://www.parliament.uk/business/committees/committees-a-z/joint-select/human-rights-com-mittee/inquiries/parliament-2017/inquiry/ [accessed: 3 April 2018].
United Nations Committee on the Rights of Persons with Disabilities [UNCRPD] (2014), ‘General Comment No 2 on Article 9 Accessibility’. Available at: www.ohchr.org/en/hrbodies/crpd/pages/gc.aspx [accessed: 16 August 2017].
WebRoots Democracy (2017), ‘Inclusive voting’. Available at: https://webrootsdemocracy.org/inclusive-voting/ [accessed: 18 May 2018].
Welsh Government (2016), ‘Community cohesion national delivery plan 2016-17’. Available at: gov.wales/docs/dsjlg/publications/equality/160310-community-cohesion-plan-en.pdf [accessed: 1 June 2018].
Welsh Government (2017a), ‘Local Government Candidates Survey’. Available at: https://gov.wales/statistics-and-research/local-govern-ment-candidates-survey/?lang=en [accessed: 17 July 2018].
Welsh Government (2017b), ‘Who is most likely to feel able to influence decisions affecting their local area? Future Generations Indicator 23’. Available at: http://gov.wales/docs/caecd/research/2017/170301-national-sur-vey-who-most-likely-influence-decisions-affect-ing-local-area-en.pdf [accessed: 17 July 2017].
Welsh Government (2017c), ‘Connected and ambitious libraries: The sixth quality framework of Welsh Public Library Standards 2017-2020’. Available at: gov.wales/topics/culture-tour-ism-sport/museums-archives-libraries/libraries/public-library-standards/?lang=en [accessed: 21 May 2018].
Woodhouse, J., and Dempsey, N. (2016), ‘Public libraries’. House of Commons Library briefing paper SN05875. Available at: researchbriefings.parliament.uk/ResearchBrief-ing/Summary/SN05875 [accessed: 15 February 2018].
Data tables Our analysis specifically for the ‘Is Britain Fairer? 2018’ review is available in the data tables published alongside this report online. The data tables contain the sources, notes and detailed breakdown of the dataset. Where this data is used in the report the specific data tables is referenced using its reference code, for example EDU.EAT.1.
The data tables can be found at the following link
www.equalityhumanrights.com/britain-fairer
Is Britain Fairer?
www.equalityhumanrights.com/britain-fairer 271
References

Appendix: Methodology This appendix explains the methods we used to compile this report. It begins with a brief overview of our Measurement Framework, whichformsthebasisofthefindings.
Is Britain Fairer?
272 www.equalityhumanrights.com/britain-fairer
Appendix

A.1 Introduction This appendix explains the methods we used to compile this report. It begins with a brief overview of our Measurement Framework, whichformsthebasisofthefindings.Itexploresthedifferenttypesofevidencewe have brought together and assesses their strengths and limitations. It also explains our approach to data gathering and analysis.
A.2 Our approach: the Measurement Framework We have a statutory duty to monitor equality and human rights in Britain by developing indicators and reporting regularly on progress to Parliament. To meet this duty, we have developed a suite of indicators over the last decade, through a series of Measurement Frameworks that enable us to monitor and evaluate progress towards protecting and promoting equality and human rights across England, Scotland and Wales. Using a framework like this allows us to collect and analyse evidence in a systematic way, against robust standards and to consistently evaluate change over time for specific groups.159
There are six major domains in our Framework, each of which contains three ‘core’ indicators and in some there are supplementary indicators. The indicators describe the issues that we are trying to measure. They are subject areas that have relevance for human rights and equality, as well as for ‘duty bearers’ such as the Government. More broadly, they relate to people’s ability to lead fulfilling lives. Indicators generally contain statistical measures as well as an assessment of the relevant laws and policies. Indicators are further broken down into topics. Topics reflect long-standing equality and human rights issues and many have featured in our monitoring activities in the past.
159 Please see our Measurement Framework in full for a more detailed overview: https://www.equalityhumanrights.com/en/how-do-we-measure-equality-and-human-rights
Is Britain Fairer?
www.equalityhumanrights.com/britain-fairer 273
Appendix

Within each indicator we identify what our Measurement Framework refers to as the ‘structure’, ‘process’ and ‘outcomes’. Simply put, the structure relates to the law, the process to government policies and the outcomes to people’s experiences.160 In more detail:
– Structure: we examine the laws affecting equality and human rights across Britain. In doing so we make observations about the overall efficacy of this legal framework and consider where changes may be needed to ensure greater equality and better protection of human rights.
– Process: we also explore the efforts that are being made by governments to effectively implement the obligations contained in human rights and equality standards, including the implementation and evaluation of public policies.
– Outcomes: we analyse the experiences and end results for individuals and groups in relation to the various indicators. This includes the outcomes for people with different protected characteristics, people with certain combinations of protected characteristics and those for ‘at-risk’ groups specified in our Measurement Framework.
A.3 Evidence gathering and analysis The evidence in this report is made up of reviews of the changes to laws and policies in the UK and devolved countries. We also present qualitative and quantitative research on the impact of such policies and laws on the outcomes for individuals.
A.3.1 How we analyse the evidenceThe analysis of structure and process evidence involved desk-based research of existing published sources. Analysis of the outcome evidence also involved reviewing the available literature; in addition, we conducted secondary statistical analysis of datasets such as household surveys and administrative data (collected by government agencies such as schools and hospitals). While most of these statistical data are publicly available, our analysis has been carried out specifically for this report and is published here for the first time. In our statistical analysis, we disaggregate these data by the following protected characteristics where possible: age, disability, marriage/civil partnership, religion or belief, race, sex and sexual orientation, or the closest available characteristics. We also include socio-economic status or proxies such as deprivation, geographical location (this is generally at the country level of England, Scotland and Wales, by English region or urban/rural) and some intersectional analysis examining how people experience a combination of multiple forms of discrimination or disadvantage. Since robust statistical data on gender reassignment and pregnancy and maternity are not routinely collected, we refer to other sources of evidence where appropriate.
160 Structure and process evidence can be found in the section entitled ‘Key policy and legal developments’ in each domain chapter. Outcome evidence can be found in the sections which follow it – these are broken down by the indicators and topics outlined in the Measurement Framework.
Is Britain Fairer?
www.equalityhumanrights.com/britain-fairer274
Appendix

To measure change over time, quantitative data are presented to compare up to three points in time. Where the data allow and clear differences are found, we report on data from 2010/11, 2013/14 and 2016/17 – though this was not possible for all the measures. For some measures, statistically significant changes have not been identified since we last reported in 2015, in which case we make comparisons with an earlier time period. In general, changes are more likely to have been statistically significant over a longer period of time. We also think it is sometimes useful to look at longer-term changes rather than simply the past three years, which is a relatively short timescale.
We only report on statistically significant changes over time, whatever the exact period. In the absence of any commentary on this in the analysis, the reader can assume that either no change was found or that comparable data over time were not available. Data is released at different times and for some measures the most recent data available are for 2015/16. For further information on our approach to statistical analysis, including data availability and timescales, please see the full technical paper and data tables.
We also drew on an extensive range of published sources to analyse equality and human rights progress from 2015 to 2018 (no primary research was undertaken). We have included only robust and credible research in our analysis. In practice, this meant checking that all sources were referenced and verifiable, assessing the robustness of the methodology employed and verifying that the findings were presented fairly and accurately. We do not include any research, policy developments or legislative changes that were published or brought into force after 31 May 2018.
Most of the cited secondary sources do not pre-date 2015. Our rationale for focusing on sources published since 2015 is simply that this is when we last reported to Parliament. However, a smaller number of sources do pre-date 2015. This is generally because the research is of continued and high relevance and/or a more recent source could not be found.
A.3.2 How we assess quantitative and qualitative data Quantitative data provide the main source for the outcome evidence in this report. Certain standards and criteria are applied to ensure the statistical datasets we draw on are robust. This includes ensuring the source is authoritative and credible, having access to the microdata or specified analysis, and checking that it can be broken down appropriately and consistently over time. As well as conducting our own statistical analysis, our report draws on a range of quantitative research conducted by others, including surveys conducted by NGOs, academics and think-tanks. As with all the quantitative sources, we check for methodological robustness and statistical validity. There is some variation in the certainty of the conclusions, depending on the strengths and limitations of the research evidence. These are reflected in our descriptions of the data.
We draw mainly on qualitative data sources to reflect outcomes not captured through surveys and administrative data, such as observations and conclusions from regulators, inspectorates, parliamentary committees, human rights monitoring bodies, NGOs and so on. Other robust and relevant sources, such as published research reports, books, ‘grey literature’ and research articles in academic journals are referenced in places.
Is Britain Fairer?
www.equalityhumanrights.com/britain-fairer 275
Appendix

A.4 The limitations of our approach When creating the Measurement Framework, we applied criteria to our domains and indicators to ensure they provided a wide-ranging overview of equality and human rights issues in Britain. However, our Measurement Framework does not cover every single issue that has a bearing on equality and human rights. In making the Framework more concise and easier for people to understand, decisions had to be made about what was in and out of scope. Inevitably, people will have different opinions about what a framework should cover and to some extent these competing priorities can never be fully satisfied. However, through consultation with our partners we have mitigated the risk of overlooking or missing out key issues.
In addition, there are inevitably limitations to any evidence-gathering process, owing to gaps in the data and difficulties involved in collecting information, particularly on certain protected characteristics (for example, sexual orientation). As mentioned above, for the quantitative data, the unavoidable time lag between gathering, analysing and checking data – as well as the fact that it takes a long time for some data to be released in the first place – means that much of the data in this report is already slightly dated. Sample size breakdowns for some protected characteristics are often small, particularly in Scotland and Wales – for example by ethnic group, religion and sexual orientation. This means that for some groups we are not able to provide robust data. This issue also proved problematic when attempting to conduct intersectional analysis. Specific caveats and limitations that relate to each of the domains are included in the Chapters 2 to 7 where relevant.
Is Britain Fairer?
www.equalityhumanrights.com/britain-fairer276
Appendix
—
Contacts —This publication and related equality and human rights resources are available from our website: www.equalityhumanrights.com.
Questions and comments regarding this publication may be addressed to: [email protected]. We welcome your feedback.
Alternative formats
For information on accessing one of our publications in an alternative format, please contact: [email protected].
EASS
For advice, information or guidance on equality, discrimination or human rights issues, please contact the Equality Advisory and Support Service, a free and independent service.
Website www.equalityadvisoryservice.com
Telephone 0808 800 0082
Textphone 0808 800 0084
Hours 09:00 to 19:00 (Monday to Friday)
10:00 to 14:00 (Saturday)
Post FREEPOST EASS HELPLINE FPN6521

CCS1018688848 978-1-5286-0824-4