
Large scale integration of renewable energy sources (RES) in ...
34
This is a repository copy of Large scale integration of renewable energy sources (RES) in the future Colombian energy system. White Rose Research Online URL for this paper: http://eprints.whiterose.ac.uk/155333/ Version: Accepted Version Article: Pupo-Roncallo, O., Campillo, J., Ingham, D. et al. (2 more authors) (2019) Large scale integration of renewable energy sources (RES) in the future Colombian energy system. Energy, 186. 115805. ISSN 0360-5442 https://doi.org/10.1016/j.energy.2019.07.135 [email protected] https://eprints.whiterose.ac.uk/ Reuse This article is distributed under the terms of the Creative Commons Attribution-NonCommercial-NoDerivs (CC BY-NC-ND) licence. This licence only allows you to download this work and share it with others as long as you credit the authors, but you can’t change the article in any way or use it commercially. More information and the full terms of the licence here: https://creativecommons.org/licenses/ Takedown If you consider content in White Rose Research Online to be in breach of UK law, please notify us by emailing [email protected] including the URL of the record and the reason for the withdrawal request.
-
Upload
khangminh22 -
Category
Documents
-
view
2 -
download
0
Transcript of Large scale integration of renewable energy sources (RES) in ...

This is a repository copy of Large scale integration of renewable energy sources (RES) in the future Colombian energy system.
White Rose Research Online URL for this paper:http://eprints.whiterose.ac.uk/155333/
Version: Accepted Version
Article:
Pupo-Roncallo, O., Campillo, J., Ingham, D. et al. (2 more authors) (2019) Large scale integration of renewable energy sources (RES) in the future Colombian energy system. Energy, 186. 115805. ISSN 0360-5442
https://doi.org/10.1016/j.energy.2019.07.135
[email protected]://eprints.whiterose.ac.uk/
Reuse
This article is distributed under the terms of the Creative Commons Attribution-NonCommercial-NoDerivs (CC BY-NC-ND) licence. This licence only allows you to download this work and share it with others as long as you credit the authors, but you can’t change the article in any way or use it commercially. More information and the full terms of the licence here: https://creativecommons.org/licenses/
Takedown
If you consider content in White Rose Research Online to be in breach of UK law, please notify us by emailing [email protected] including the URL of the record and the reason for the withdrawal request.
1
Large scale integration of Renewable Energy Sources (RES) in the future Colombian energy
system
O. Pupoa*, J. Campillob, D. Inghama, K. Hughesa, M. Pourkashaniana
a Energy 2050, University of Sheffield. 40 Leavygreave Road, Ella Armitage Building, Sheffield, UK. S3 7RD.
b Department of Electrical Engineering, Universidad Tecnológica de Bolívar. Parque Industrial
y Tecnológico, Carlos Vélez Pombo, Km 1 Vía Turbaco. Cartagena, Colombia, 130012
e-mail: [email protected], [email protected], [email protected], [email protected], [email protected]
Abstract
The diversification of the energy matrix, including larger shares of Renewable Energy
Sources (RES), is a significant part of the Colombian energy strategy towards a
sustainable and more secure energy system. Historically, the country has relied on the
intensive use of hydropower and fossil fuels as the main energy sources. Colombia has a
huge renewables potential, and therefore the exploration of different pathways for their
integration is required. The aim of this study was to build a model for a country with a
hydro dominated electric power system and analyse the impacts of integrated variable
RES in long-term future scenarios. EnergyPLAN was the modelling tool employed for
simulating the reference year and future alternatives. Initially, the reference model was
validated, and successively five different scenarios were built. The results show that an
increase in the shares of wind, solar and bioenergy could achieve an approximate
reduction of 20% in both the CO2 emissions and the total fuel consumption of the country
by 2030. Further, in the electricity sector the best-case scenario could allow an estimated
60% reduction in its emission intensity.
Keywords: Energy system analysis, RES, EnergyPLAN, Colombia.
*Corresponding author: Oscar Pupo e-mail: [email protected]
2
1. Introduction
In recent years, governments around the world have been increasing their attention on
energy supply policies. These policies are focused towards three main energy goals that
define the energy trilemma: security of supply, affordability and environmental
sustainability [1]. Nevertheless, these ideas are not necessarily compatible. For instance,
some countries could rely on cheap coal to guarantee their supply and this affects the
environmental sustainability. Others might prefer the use of clean energy sources at a
higher cost. A real balance between these factors is needed when evaluating energy goals
and policies in order to achieve a transition towards low-carbon and more efficient
energy systems. Further, a change is needed in the way that energy is produced and
consumed to observe a real positive impact in terms of environmental protection and
economic development [2]. The starting point for this change is an adequate sustainable
energy planning. In the last two decades, an increasing trend in the developing of
modelling tools for energy planning has been evidenced by the fact that more than 85
tools were available in 2017 [3,4]. The great majority of these models assist in the
formulation of strategies for renewable integration in national energy systems [4]. For
instance, in Latin America multiple models have been built for this purpose [3,5]. De
Moura et al. [6] simulated three long-term future scenarios for the South American power
system integration using the Open Source Energy Modelling System (OSeMOSYS).
Also, Octaviano et al. [7] used the MIT Economic Projection and Policy Analysis
(EPPA) model to evaluate different CO2 emission reduction alternatives for Brazil and
Mexico.
Historically, hydropower has been one of the main sources of energy in Latin America
and the Caribbean, assisting these countries to maintain low levels of greenhouse gas
(GHG) emissions [5]. These regions are rich in natural resources and hold great potential
for variable renewable sources integration. Therefore, the modelling of possible future
scenarios has become an essential planning tool, especially in the energy sector [3]. In
the case of Colombia, electricity generation has been dominated by hydropower during
the last few decades and, in 2017, approximately 53.7 TWh was produced by this source,
representing 86% of the total production [8]. This feature makes the Colombian energy
mix different from the great majority of countries around the globe. However, this also
involves a high risk due to the significant dependence of the resource to weather
variations. A clear example is the energy crisis in 1992-93, 2009-10 and 2015-16 due to
3
the El Niño and La Niña southern oscillation (ENSO), and the recent surge in the energy
cost. Some models for countries with a similar electricity mix to Colombia have been
developed for Brazil [9,10], Norway [11], and New Zealand [12]. The need for research
oriented towards the development of a diversified energy matrix has been raised by the
Mining and Energy Planning Unit (UPME) [13]. Despite this, little research has been
done on assessing the integration of renewable energy in developing countries. For the
case of Colombia, there have been limited studies on this issue and none of the current
models represents the entire energy system (this includes the heat, gas, electricity,
transport, residential and industrial sectors) using a high temporal resolution model. In
addition, no previous study has estimated the RES penetration limit into the Colombian
electric power system. Vergara et al. [14] investigated the correlation between wind and
hydro resources for future energy generation in the country. Gonzalez-Salazar et al. [15]
used LEAP (Long-range Energy Alternatives Planning) to evaluate the impact of
bioenergy in future scenarios. Paez et al. [16] developed an economic model in LEAP to
assess future energy demand scenarios for Colombia. Chavez et al. [17] also used LEAP
to model a group of fuel saving strategies for Colombia, Peru and Ecuador aiming to
energy security and diversification towards 2030. Calderon et al. [18] examined different
alternative CO2 emission scenarios using GCAM, TIAM-ECN, Phoenix and MEG4C.
However, the modelling tools used in these studies used long time-step simulations
(yearly simulations). Some previous works [4,19,20] have suggested that a better
approach is the use of high temporal resolution tools for studies that evaluate the
integration of RES in energy systems due to its intermittency.
The aim of this paper is to model the Colombian energy system and analyse the impacts
of integrated renewable sources in future scenarios. An important part of the analysis is
focused on the electricity sector by considering the low carbon strategy plans of the
country. Furthermore, this study estimates the maximum penetration levels of wind and
solar power into the national power system and, for this purpose, the EnergyPLAN
modelling tool was used to develop the model and build the scenarios. Technical details
about this tool are explained in section 3.
This paper is organised in five sections. The first section presents background
information and the scope of this work. Section 2 provides a description of the current
Colombian energy system and its renewable energy potential. Section 3 is concerned
with the methodology applied, including the modelling tool used, data sources,
4
assumptions and a description of the energy system scenarios. Section 4 presents the
findings of the research, focusing on the validation process for the Colombian model in
EnergyPLAN and the main results from the simulated scenarios and the sensitivity
analysis. The last section provides conclusions and recommendations for future works.
2. Characteristics of the Colombian energy system
This section presents an overview of the Colombian energy system. It includes a
description of the current system, the main renewable energy sources and GHG
emissions of the sector.
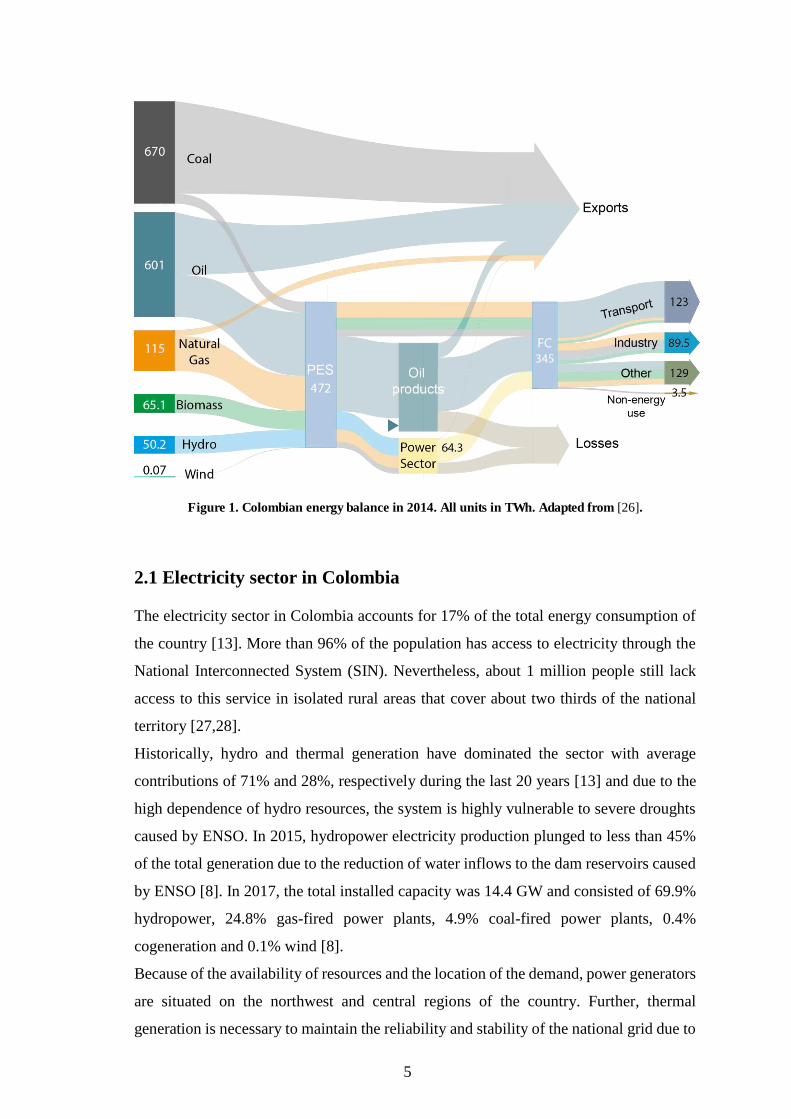
Multiple political and socioeconomic transformations have caused rapid changes in the
energy sector in Colombia during the last decades [15]. Between 1975 and 2014, the total
primary energy supply (TPES) increased from 197.5 to 472 TWh, representing an
average annual growth rate of 2.3% [21,22]. Further. The energy production grew faster
than GDP and it is nearly four times greater than the TPES as Colombia exports most of
its coal production and three quarters of its oil production [23]. Fossil fuels dominate the
total primary energy mix (see Figure 1), with coal, oil and natural gas collectively
representing about 93% of the primary demand in 2014 [23]. These are followed by
different forms of renewable sources, such as bioenergy that accounts for 4%, hydro
energy for 3% and wind energy with less than 1% of the TPES [24].
The energy demand for transport accounted for over 39% of the total final consumption
in 2014. This sector is the largest energy consumer, followed by industry (25%) and the
residential sector (19%). Oil products and natural gas dominate the transport sector
consumption [25].
5
Figure 1. Colombian energy balance in 2014. All units in TWh. Adapted from [26].
2.1 Electricity sector in Colombia
The electricity sector in Colombia accounts for 17% of the total energy consumption of
the country [13]. More than 96% of the population has access to electricity through the
National Interconnected System (SIN). Nevertheless, about 1 million people still lack
access to this service in isolated rural areas that cover about two thirds of the national
territory [27,28].
Historically, hydro and thermal generation have dominated the sector with average
contributions of 71% and 28%, respectively during the last 20 years [13] and due to the
high dependence of hydro resources, the system is highly vulnerable to severe droughts
caused by ENSO. In 2015, hydropower electricity production plunged to less than 45%
of the total generation due to the reduction of water inflows to the dam reservoirs caused
by ENSO [8]. In 2017, the total installed capacity was 14.4 GW and consisted of 69.9%
hydropower, 24.8% gas-fired power plants, 4.9% coal-fired power plants, 0.4%
cogeneration and 0.1% wind [8].
Because of the availability of resources and the location of the demand, power generators
are situated on the northwest and central regions of the country. Further, thermal
generation is necessary to maintain the reliability and stability of the national grid due to
6
transmission line constraints. Furthermore, they are used to match the demand during dry
seasons when large hydropower plants are not able to produce enough energy [29].
2.2 Renewable energy
Colombia has abundant renewable energy resources that, with the exception of
hydropower, remain largely unexploited. In addition to the available hydropower
potential, there are extensive wind, solar and biomass resources [13,25,30]. Therefore,
the increasing energy demand could be satisfied by these environmentally friendly
resources. This section offers a description of their potential for energy generation in the
country. Geothermal, tidal and wave power are not included despite their potential due
to the lack of interest of investors in these technologies [31].
Hydropower
Hydropower is the main renewable energy source for electricity generation in the world
[32]. It offers a clear alternative to fossil fuels for matching the global energy demand,
and Colombia has great potential for hydro energy generation due to its topography [28].
There are currently 11,773 MW of installed capacity in the SIN, from which 10,944 MW
corresponds to large hydropower plants and 829 MW to small-scale plants [8]. According
to ISA [33], the potential hydropower capacity in the country could be up to 93 GW.
Nevertheless, this potential cannot be fulfilled completely due to some environmental
constraints [28].
Wind power
Wind power currently contributes 0.1% of the electricity demand in Colombia. There is
only one wind farm (Jepirachi project) with an installed capacity of 19.5 MW. This
project started operation in 2004 as a first step to reduce GHG emissions in the electricity
sector. It consists of 15 Nordex wind turbines of 1.3 MW individual capacity [34].
The estimated annual wind energy potential in the country is approximately 81.2 TWh
and this could represent an installed capacity of up to 25 GW [31,33]. Most of the
resource is located in the northern part of the country, especially in La Guajira region
[14,35]. Here, the average wind speed at 80 meters above sea level is about 9 m/s [36].
Previous studies [13,14,35] have shown that the levelized cost of energy (LCOE) from
wind cannot currently compete with hydro generation. However, during periods of severe
droughts (mainly associated with ENSO in Latin America) wind energy shows a strong
complementarity with hydropower [14].

7
Solar PV
Solar photovoltaic technology in Colombia has been mainly developed in rural areas
without access to electricity (ZNI) to meet their basic demands and improve their quality
of life [37]. In 2017, the first large-scale PV power plant connected to the SIN started
operations. The Celsia Solar Yumbo project has an installed capacity of 9.8 MW, and it
is expected to have an average energy generation of 16.5 GWh per year [8]. The total
installed capacity of small-scale PV systems (usually of less than 10 kWp) is estimated
to be about 5.28 MW (between SIN and ZNI) [37].
The solar atlas of Colombia [38] shows that there is a high potential for the use of this
technology. As for the case of wind, the northern region has the highest solar resources
with average daily irradiation between 4.5 and 6 kWh/m2. As opposed to all the countries
further from the equator that experience four different seasons throughout the year,
tropical countries have minimal seasonality. This allows the irradiation levels to remain
relatively stable throughout the year, thus reducing the levels of variability with this type
of generation [39].
Bioenergy
After hydro generation, bioenergy is the second largest renewable resource for energy
production in Colombia [15]. In 2017, electricity generation using biomass accounted for
804 GWh, representing 1.3% of the total produced [8]. The main use of biomass is as
fuel for cooking and heating in rural areas (wood and charcoal), followed by electricity
generation in local industries (mainly using sugar cane bagasse) and biofuel production
(bioethanol and biodiesel) for the transport sector. Bioethanol is produced using sugar
cane as feedstock and biodiesel is produced from palm oil [15]. There are currently two
blending regulations designed to reduce GHG emissions in the sector: a 10% bioethanol
blending by volume for transport gasoline fuel, and 8-10% biodiesel blending for road
transport diesel [22,40].
Also there is a vast biomass energy potential untapped in Colombia [13]. Gonzalez-
Salazar et al. [15] estimated a maximum technical potential of approximately 116 TWh
per year. A sustainable use of this potential could boost the development of the rural
sector, thus driving modernization of agriculture methods, reducing oil dependence and
offering a clear option to diversify the energy mix. However, this is not a definite solution
and the water-food-energy nexus of biomass production must be further analysed.
Deforestation, impacts on food security, dependence on single-crop farming and
8
adequate management of water resources are some of the obstacles to overcome in order
to further exploit this potential sustainably.
2.3 GHG emissions
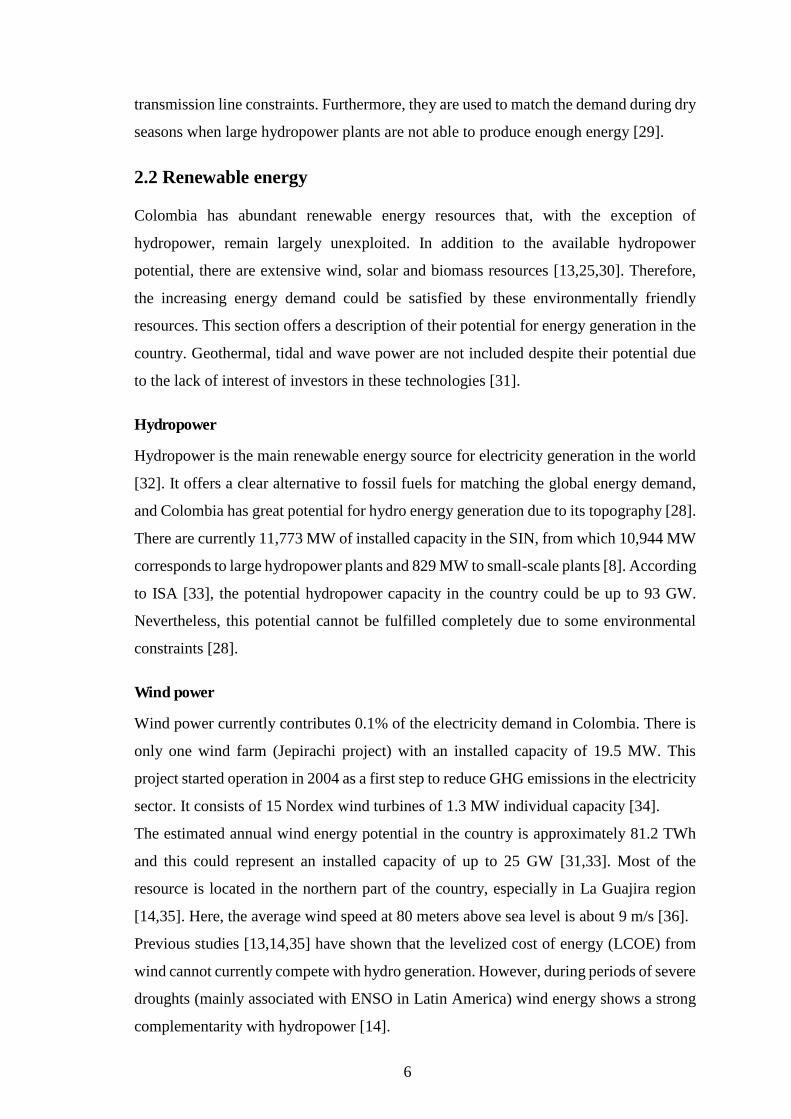
The electricity generation matrix in Colombia is considered very clean because of the
high share of hydro generation and low energy consumption levels, which are below the
international averages [41]. Electricity generation accounts for only 8.5% of the total
emissions, compared to the global average of 42% in the same sector [42]. Historically,
the AFOLU (Agriculture, Forestry and Other Land Use) and Energy sectors have
presented the highest contribution to the national emissions (see Figure 2). Deforestation
appears to be the principal driver in the AFOLU sector, while in the energy sector,
transport and energy industries are the main drivers [41,43]. From 1990 to 2014, the
energy sector emissions increased by 33 MtCO2e, being transportation (38%), fugitive
emissions (28%), and electricity and heat production (20%) the primary causes [44,45].
Currently, road transportation is the largest consumer of energy and the largest source of
CO2 emissions. This is a consequence of the increasing freight activity, rapid
urbanisation and rising incomes and motorisation rates [25,44].
Figure 2. Colombian GHG inventory in 2012. Adapted from [43,46].
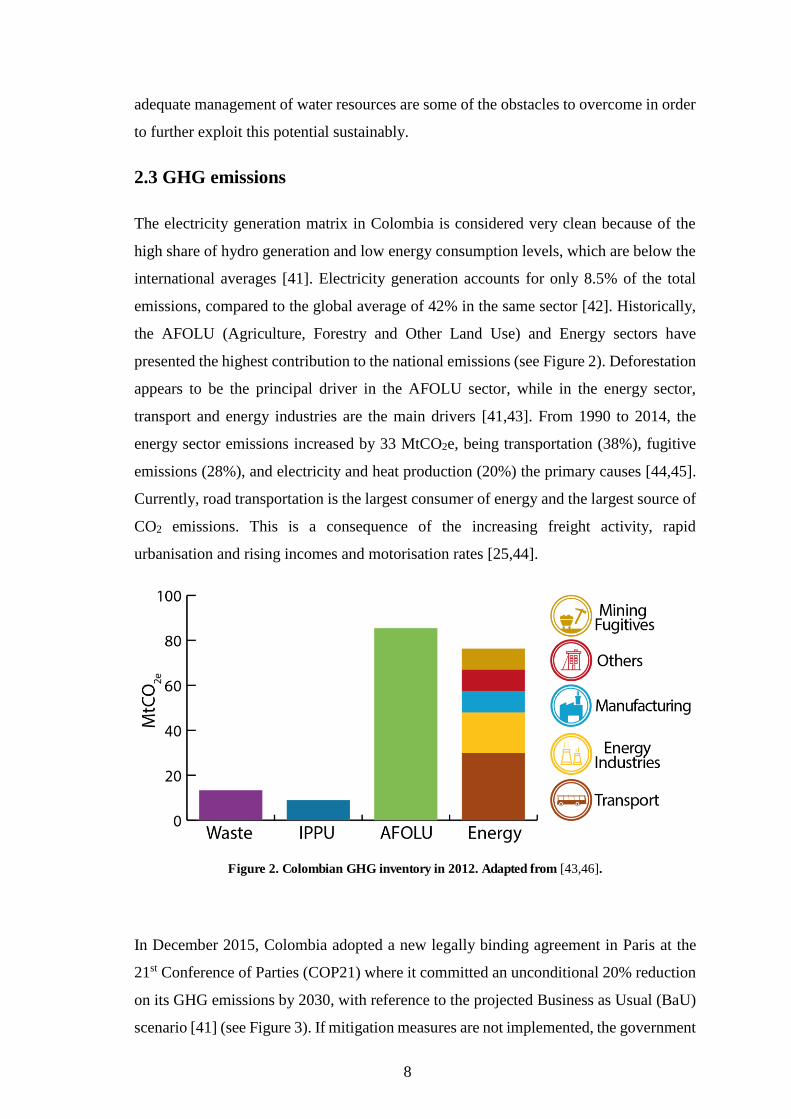
In December 2015, Colombia adopted a new legally binding agreement in Paris at the
21st Conference of Parties (COP21) where it committed an unconditional 20% reduction
on its GHG emissions by 2030, with reference to the projected Business as Usual (BaU)
scenario [41] (see Figure 3). If mitigation measures are not implemented, the government
9
estimates the total GHG emissions to reach 335 MtCO2e in 2030 (BaU scenario), from
which 110 MtCO2e are expected to be produced in the energy sector only [41].
Figure 3. Mitigation target for Colombia [41].
3. Methodology
This section presents a description of the methodology used in order to build the model
for the Colombian energy system. The selected modelling tool, data sources, assumptions
and defined scenarios are outlined.
3.1 EnergyPLAN modelling tool
Energy systems in emerging economies require adequate planning to face their
complexity and challenges. This is only possible through the appropriate selection of
modelling tools for each particular case. Each tool has its specific purpose and
characteristics that must be assessed by the energy analyst or policy maker. This study
adopted a bottom-up approach, integrating detailed engineering interactions between
technology activities and energy use [47]. As Deane et al. [48] indicate, no individual
tool is capable of addressing the totality of the energy system challenges. However,
planners can take advantage of the strengths of different models for developing deeper
insights. From the wide range of modelling tools currently available for these analyses
[3,4], EnergyPLAN was selected. The main purpose of this tool is to assist in the design
of national, regional or local long-term energy planning strategies by simulating the
complete energy system [20]. This open source tool was developed at Alborg University
in Denmark [49]. EnergyPLAN generates a deterministic model using analytical
programming instead of iterations, thus calculating the results in a shorter period of time
compared to iterative solvers. It uses a high temporal resolution (hourly) simulation over
a period of one year. Therefore, it can examine the effect of intermittent RES on the
10
system and analyse weekly and seasonal differences in power, heat demands and water
inputs to large hydropower systems.
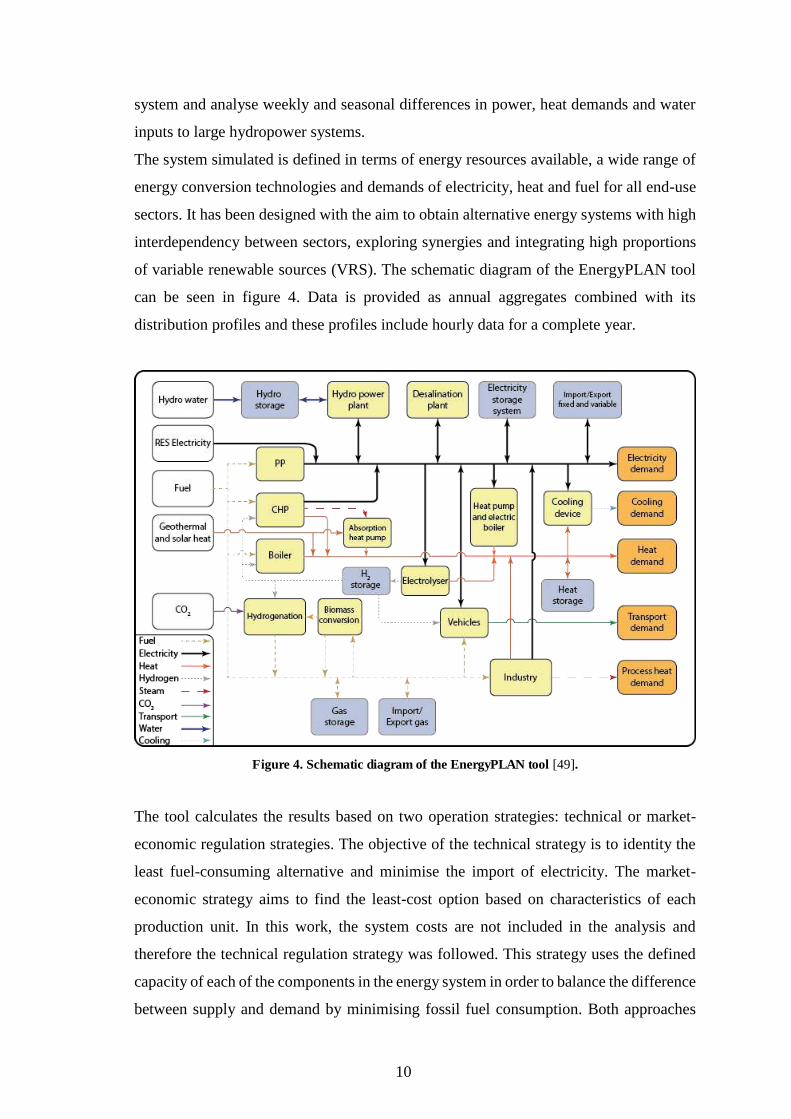
The system simulated is defined in terms of energy resources available, a wide range of
energy conversion technologies and demands of electricity, heat and fuel for all end-use
sectors. It has been designed with the aim to obtain alternative energy systems with high
interdependency between sectors, exploring synergies and integrating high proportions
of variable renewable sources (VRS). The schematic diagram of the EnergyPLAN tool
can be seen in figure 4. Data is provided as annual aggregates combined with its
distribution profiles and these profiles include hourly data for a complete year.
Figure 4. Schematic diagram of the EnergyPLAN tool [49].
The tool calculates the results based on two operation strategies: technical or market-
economic regulation strategies. The objective of the technical strategy is to identity the
least fuel-consuming alternative and minimise the import of electricity. The market-
economic strategy aims to find the least-cost option based on characteristics of each
production unit. In this work, the system costs are not included in the analysis and
therefore the technical regulation strategy was followed. This strategy uses the defined
capacity of each of the components in the energy system in order to balance the difference
between supply and demand by minimising fossil fuel consumption. Both approaches

11
allow the estimation of the socio-economic effects of the alternatives built by the system
designer. Based on the configuration and regulation selected, the tool estimates the total
annual demand and supply of the system and its individual components, CO2 emissions
and costs.
There are three key reasons for choosing EnergyPLAN in this study: Firstly, the
modelling tool considers the three primary sectors of any regular energy system, namely
power, heat and transport [50]. In Colombia, these sectors are completely segregated. In
the future, these three sectors must synergize in order to achieve an efficient penetration
of RES [19]. Therefore, a tool that includes these sectors is more useful for assessing
future integration scenarios. Secondly, EnergyPLAN has been used in the analysis of
energy systems in some emerging economies [19,49], and in some cases where the
electricity mix is hydro dominated [11,51]. Finally, the tool has been widely used in the
relevant literature considering large-scale integration of RES [52], 100% renewable
energy systems [20,53], and in specific studies assessing the effects of different elements
of the energy system such as energy storage [54], transport integration [55,56] and
demand response technologies [57]. The overall structure of the model for the Colombian
system can be seen in Figure 5.
12
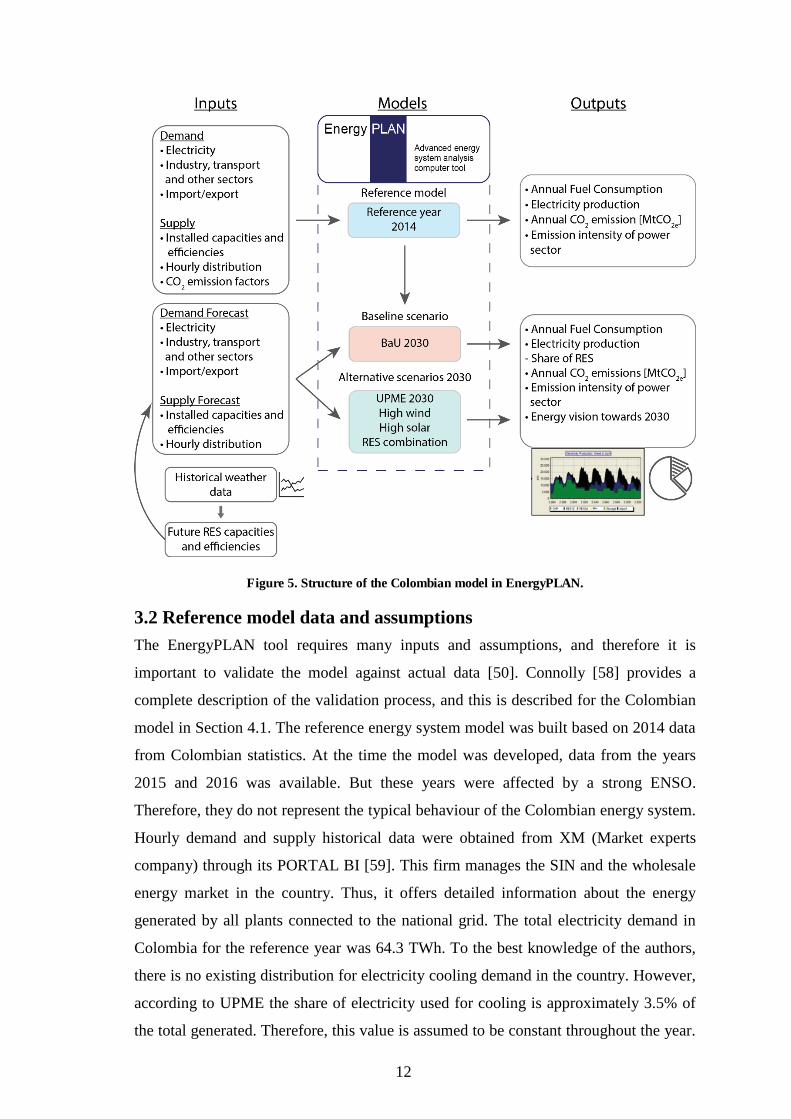
Figure 5. Structure of the Colombian model in EnergyPLAN.
3.2 Reference model data and assumptions The EnergyPLAN tool requires many inputs and assumptions, and therefore it is
important to validate the model against actual data [50]. Connolly [58] provides a
complete description of the validation process, and this is described for the Colombian
model in Section 4.1. The reference energy system model was built based on 2014 data
from Colombian statistics. At the time the model was developed, data from the years
2015 and 2016 was available. But these years were affected by a strong ENSO.
Therefore, they do not represent the typical behaviour of the Colombian energy system.
Hourly demand and supply historical data were obtained from XM (Market experts
company) through its PORTAL BI [59]. This firm manages the SIN and the wholesale
energy market in the country. Thus, it offers detailed information about the energy
generated by all plants connected to the national grid. The total electricity demand in
Colombia for the reference year was 64.3 TWh. To the best knowledge of the authors,
there is no existing distribution for electricity cooling demand in the country. However,
according to UPME the share of electricity used for cooling is approximately 3.5% of
the total generated. Therefore, this value is assumed to be constant throughout the year.
13
The capacity and efficiency of each power plant is available in the Colombian Electrical
Information System (SIEL) [8].
As described previously in Section 2.2, there are currently large and small-scale
hydropower plants in operation. Energy production from these plants rely on the water
inflow to its reservoirs, and not only on electricity demand patterns. Therefore, modelling
the Colombian hydropower system requires the use of natural inflow time series, which
are available in the PORTAL BI [59].
Wind power was the only VRS used to generate electricity to the national grid in 2014.
According to SIEL [8], the Jepirachi project with an installed capacity of 19.5 MW
generated 70.23 GWh that year, and the hourly distribution was obtained in [59]. The
RES dataset for wind and solar energy used in the future scenarios was built following
the approach suggested by George et al. [60]. The meteorological data for this study was
collected considering major current and future renewable energy generation sites. Long
period (over 5 years) average hourly wind speed and solar insolation data for each site
was supplied by the Colombian Institute of Hydrology, Meteorology and Environmental
Studies (IDEAM).
The energy consumption from the industry, transport, residential and commercial sectors
was acquired from the Colombian energy balance in 2014. This document is completed
every year by UPME and available in [21]. The CO2 emissions were calculated based on
fuel consumptions from the energy balance and the Tier 2 approach established in the
Intergovernmental Panel on Climate Change (IPPC) guidelines for stationary combustion
in [58,61]. Therefore, the GHG emission factors for Colombia reported in [62] were
incorporated into the EnergyPLAN model. Following the IPCC guidelines for national
GHG inventories in the energy sector [61], only the emissions associated with the direct
combustion of fuel nationwide were considered.
3.3 Energy system scenarios After validating the reference model against actual data, a thorough technical system
analysis can be completed. A baseline scenario and four different alternatives were
developed for the year 2030 (see Table 1) based on the characteristics of the Colombian
system, previous works [15,18] and the inputs from different specialised agencies
[22,24,41].
14
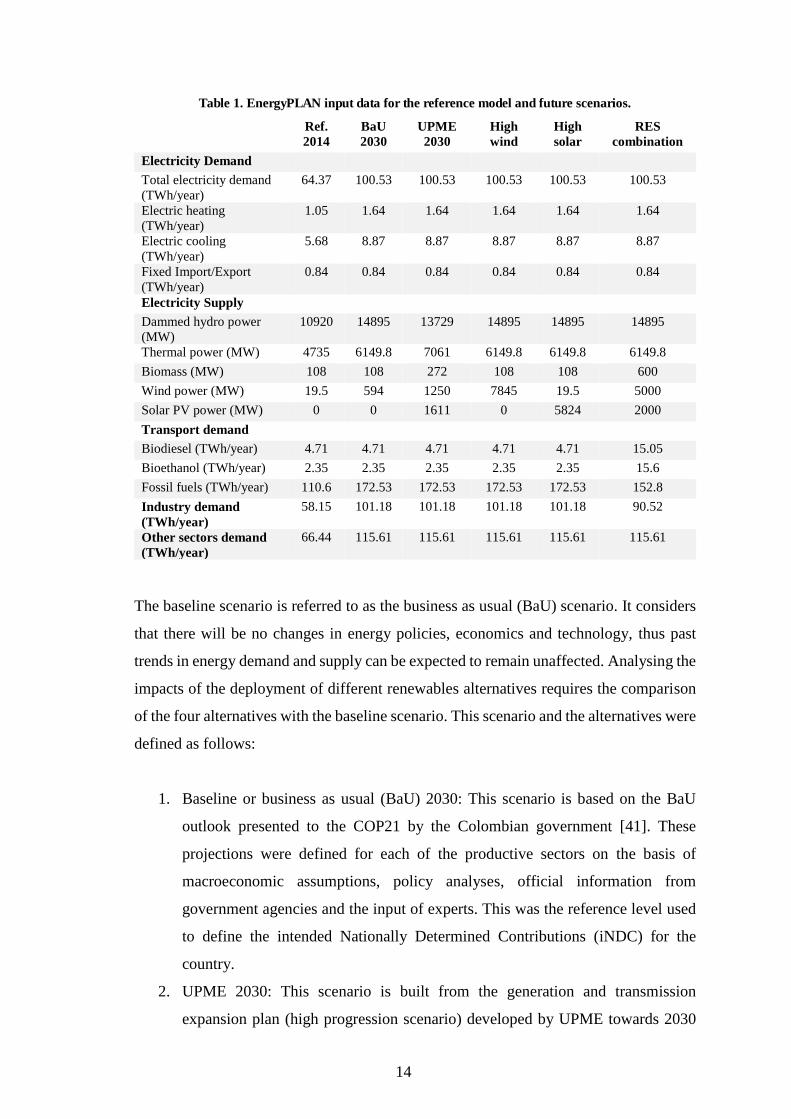
Table 1. EnergyPLAN input data for the reference model and future scenarios.
Ref. 2014
BaU 2030
UPME 2030
High wind
High solar
RES combination
Electricity Demand
Total electricity demand (TWh/year)
64.37 100.53 100.53 100.53 100.53 100.53
Electric heating (TWh/year)
1.05 1.64 1.64 1.64 1.64 1.64
Electric cooling (TWh/year)
5.68 8.87 8.87 8.87 8.87 8.87
Fixed Import/Export (TWh/year)
0.84 0.84 0.84 0.84 0.84 0.84
Electricity Supply
Dammed hydro power (MW)
10920 14895 13729 14895 14895 14895
Thermal power (MW) 4735 6149.8 7061 6149.8 6149.8 6149.8
Biomass (MW) 108 108 272 108 108 600
Wind power (MW) 19.5 594 1250 7845 19.5 5000
Solar PV power (MW) 0 0 1611 0 5824 2000
Transport demand
Biodiesel (TWh/year) 4.71 4.71 4.71 4.71 4.71 15.05
Bioethanol (TWh/year) 2.35 2.35 2.35 2.35 2.35 15.6
Fossil fuels (TWh/year) 110.6 172.53 172.53 172.53 172.53 152.8
Industry demand (TWh/year)
58.15 101.18 101.18 101.18 101.18 90.52
Other sectors demand (TWh/year)
66.44 115.61 115.61 115.61 115.61 115.61
The baseline scenario is referred to as the business as usual (BaU) scenario. It considers
that there will be no changes in energy policies, economics and technology, thus past
trends in energy demand and supply can be expected to remain unaffected. Analysing the
impacts of the deployment of different renewables alternatives requires the comparison
of the four alternatives with the baseline scenario. This scenario and the alternatives were
defined as follows:
1. Baseline or business as usual (BaU) 2030: This scenario is based on the BaU
outlook presented to the COP21 by the Colombian government [41]. These
projections were defined for each of the productive sectors on the basis of
macroeconomic assumptions, policy analyses, official information from
government agencies and the input of experts. This was the reference level used
to define the intended Nationally Determined Contributions (iNDC) for the
country.
2. UPME 2030: This scenario is built from the generation and transmission
expansion plan (high progression scenario) developed by UPME towards 2030

15
[24]. It is characterised by a moderate inclusion of additional wind and
photovoltaic power plants in the electricity mix.
3. High wind: Built from the BaU 2030, this scenario includes the maximum
technically feasible wind capacity estimated by the authors (see Section 4.2.1 for
more details).
4. High solar: Built from the BaU 2030, this scenario includes the maximum
technically feasible solar photovoltaics capacity estimated by the authors (see
Section 4.2.2 for more details).
5. RES combination: this scenario includes inputs developed by Gonzalez-Salazar
et al. [15] in the bioenergy technology 2030 roadmap for Colombia and a
combination of wind and solar PV for electricity generation based on the authors
considerations. It targets a combined deployment of biomethane production,
biomass-based powered generation and increasing participation of biofuels in the
transport sector. In addition, a combination of wind and solar power proposed by
the authors was included in the electricity mix. The list of actions set for this
scenario is presented in detail in Table 2.
Table 2. RES combination scenario inputs.
Sector Plan
Industry Use 5% of biomass residues and 1% of biogas from animal waste for biomethane production.
Electricity generation
Increase biomass participation in electricity generation to 10%. Wind power capacity: 5000 MW. Solar PV capacity: 2000 MW.
Transport Biodiesel (palm oil based): increase diesel-biodiesel blend to B20 by 2030. Bioethanol (sugar cane based): increase petrol-bioethanol blend to E20 by 2030.
4. Results and discussions
In this section, the results of the reference and alternative scenarios are presented. Section
4.1 presents the validation process of the reference model (2014). In Section 4.2, a
description of the method for estimating the maximum technical levels of RES
penetration is described. Finally, the last two sections provide a critical discussion of the
main findings from the scenario results and sensitivity analysis.

16
4.1 Reference model accuracy The outputs of the reference model must be assessed to confirm its consistency and
reliability given that this model is the basis for the future scenarios. The reference model
was built using data from the year 2014. The validation process has been described in
detail by Connolly [63]. This procedure involves a comparison between the reference
model outputs and the actual figures reported by different international and domestic
agencies [8,64]. Table 3 shows a comparison between the calculated monthly electricity
demand on EnergyPLAN and the actual demand reported by SIEL in 2014 [8]. In this
case, the difference is less than 0.5% for all months.
Table 3. Monthly electricity demand validation.
Month Modelled in
EnergyPLAN [MW]
Actual [8] [MW]
Percentage difference
Jan 7150 7138 -0.16%
Feb 7414 7413 -0.01%
Mar 7263 7236 -0.37%
Apr 7217 7235 0.25%
May 7296 7293 -0.04%
Jun 7306 7273 -0.45%
Jul 7437 7433 -0.06%
Aug 7289 7302 0.17%
Sep 7554 7537 -0.22%
Oct 7406 7421 0.20%
Nov 7513 7480 -0.44%
Dec 7214 7201 -0.18%
The modelled production from hydro, conventional power plants, biomass and wind are
within the expected margins (less than 4% difference), as shown in table 4. The actual
total energy-related emissions for Colombia in 2014 were reported to be 65.96 MtCO2e
by the International Energy Agency (IEA) [64]. EnergyPLAN calculated the emissions
for the same period as 65.06 MtCO2e.
17
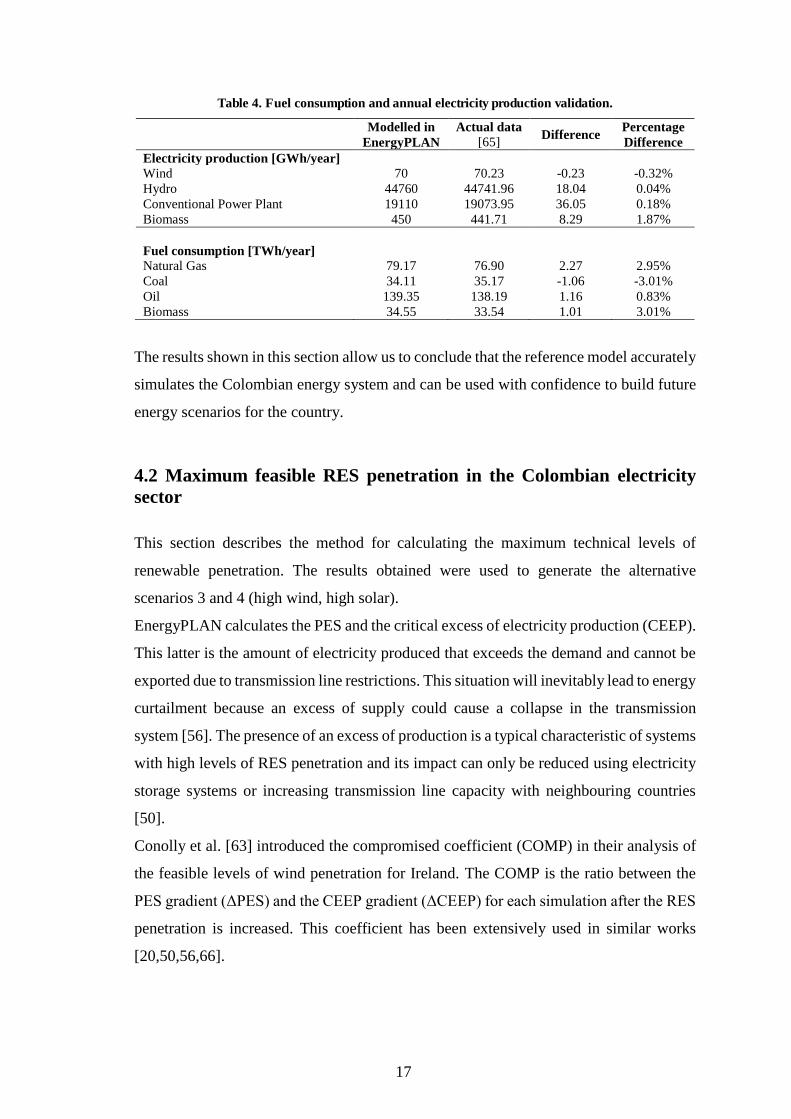
Table 4. Fuel consumption and annual electricity production validation.
Modelled in
EnergyPLAN Actual data
[65] Difference Percentage Difference
Electricity production [GWh/year] Wind 70 70.23 -0.23 -0.32% Hydro 44760 44741.96 18.04 0.04% Conventional Power Plant 19110 19073.95 36.05 0.18% Biomass 450 441.71 8.29 1.87%
Fuel consumption [TWh/year] Natural Gas 79.17 76.90 2.27 2.95% Coal 34.11 35.17 -1.06 -3.01% Oil 139.35 138.19 1.16 0.83% Biomass 34.55 33.54 1.01 3.01%
The results shown in this section allow us to conclude that the reference model accurately
simulates the Colombian energy system and can be used with confidence to build future
energy scenarios for the country.
4.2 Maximum feasible RES penetration in the Colombian electricity sector This section describes the method for calculating the maximum technical levels of
renewable penetration. The results obtained were used to generate the alternative
scenarios 3 and 4 (high wind, high solar).
EnergyPLAN calculates the PES and the critical excess of electricity production (CEEP).
This latter is the amount of electricity produced that exceeds the demand and cannot be
exported due to transmission line restrictions. This situation will inevitably lead to energy
curtailment because an excess of supply could cause a collapse in the transmission
system [56]. The presence of an excess of production is a typical characteristic of systems
with high levels of RES penetration and its impact can only be reduced using electricity
storage systems or increasing transmission line capacity with neighbouring countries
[50].
Conolly et al. [63] introduced the compromised coefficient (COMP) in their analysis of
the feasible levels of wind penetration for Ireland. The COMP is the ratio between the
PES gradient (〉PES) and the CEEP gradient (〉CEEP) for each simulation after the RES
penetration is increased. This coefficient has been extensively used in similar works
[20,50,56,66].

18
4.2.1 Maximum technical wind penetration
The behaviour of CEEP and PES when wind penetration increases is shown in Figure 6.
There is no excess of electricity production below a wind energy penetration of
approximately 12%. Then, the CEEP increases gradually until a penetration level of
about 40% before it starts rising rapidly.
Figure 6. Curtailment and PES change with increasing wind penetration in the electric power system.
The largest technical wind penetration is found when the COMP is close to one. For the
baseline scenario, that level is approximately 22%, which represents a wind installed
capacity of about 7845 MW.
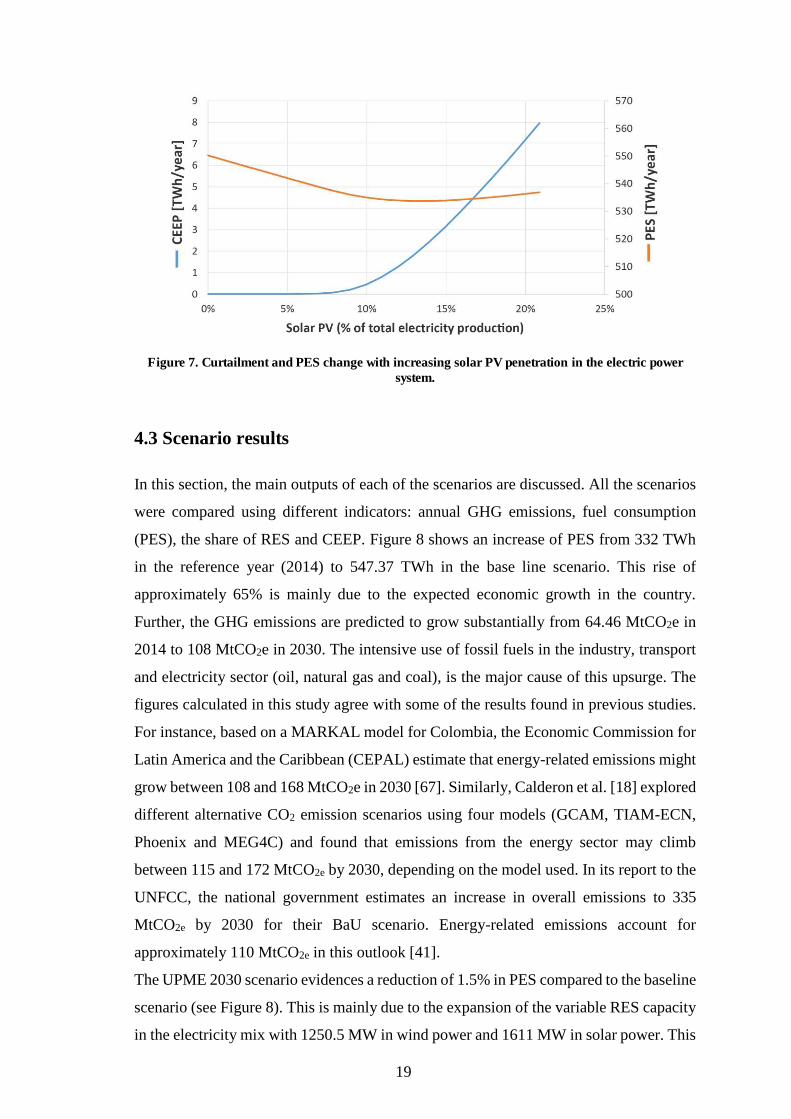
4.2.2 Maximum technical solar PV penetration
The analysis of the solar PV penetration follows the same procedure as for the case of
wind. Figure 7 illustrates the behaviour of CEEP and PES when solar energy penetration
increases. It was found that the maximum technical level is approximately 11% of the
solar power contribution to the electricity generation (5824 MW installed capacity). Due
to the nature of solar energy, which is available only during daylight hours, the
penetration level is lower than in the case of wind energy.
19
Figure 7. Curtailment and PES change with increasing solar PV penetration in the electric power system.
4.3 Scenario results In this section, the main outputs of each of the scenarios are discussed. All the scenarios
were compared using different indicators: annual GHG emissions, fuel consumption
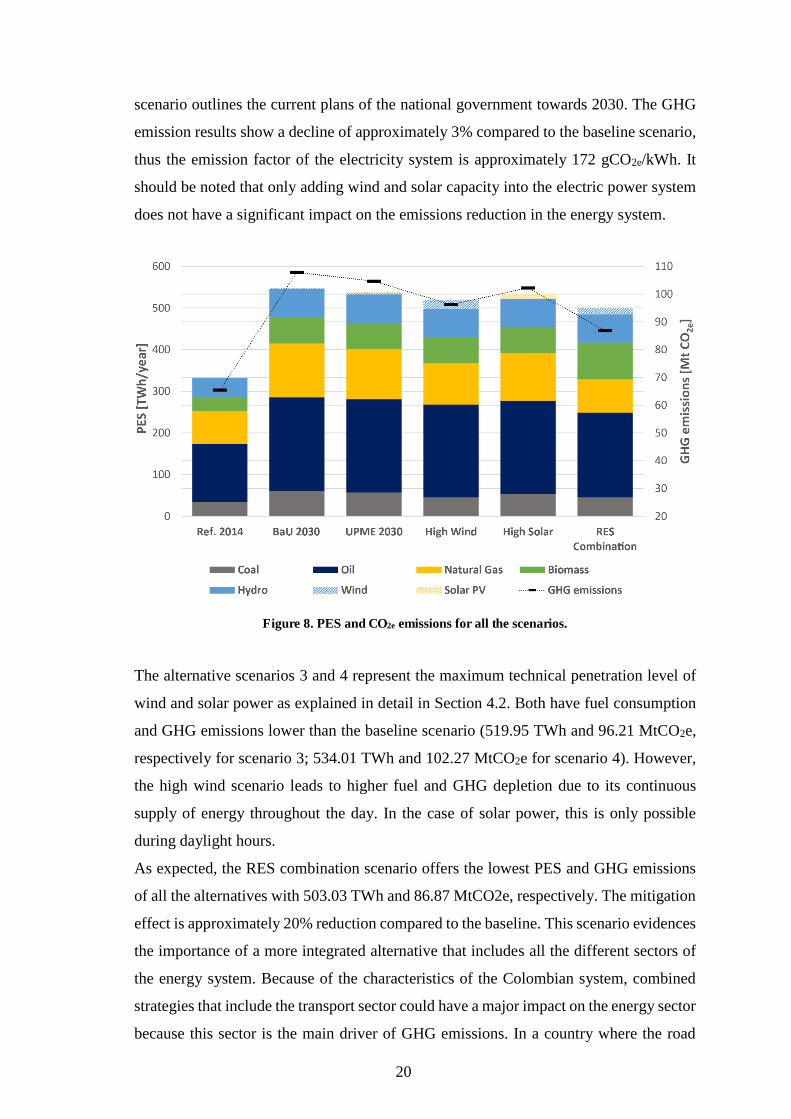
(PES), the share of RES and CEEP. Figure 8 shows an increase of PES from 332 TWh
in the reference year (2014) to 547.37 TWh in the base line scenario. This rise of
approximately 65% is mainly due to the expected economic growth in the country.
Further, the GHG emissions are predicted to grow substantially from 64.46 MtCO2e in
2014 to 108 MtCO2e in 2030. The intensive use of fossil fuels in the industry, transport
and electricity sector (oil, natural gas and coal), is the major cause of this upsurge. The
figures calculated in this study agree with some of the results found in previous studies.
For instance, based on a MARKAL model for Colombia, the Economic Commission for
Latin America and the Caribbean (CEPAL) estimate that energy-related emissions might
grow between 108 and 168 MtCO2e in 2030 [67]. Similarly, Calderon et al. [18] explored
different alternative CO2 emission scenarios using four models (GCAM, TIAM-ECN,
Phoenix and MEG4C) and found that emissions from the energy sector may climb
between 115 and 172 MtCO2e by 2030, depending on the model used. In its report to the
UNFCC, the national government estimates an increase in overall emissions to 335
MtCO2e by 2030 for their BaU scenario. Energy-related emissions account for
approximately 110 MtCO2e in this outlook [41].
The UPME 2030 scenario evidences a reduction of 1.5% in PES compared to the baseline
scenario (see Figure 8). This is mainly due to the expansion of the variable RES capacity
in the electricity mix with 1250.5 MW in wind power and 1611 MW in solar power. This
20
scenario outlines the current plans of the national government towards 2030. The GHG
emission results show a decline of approximately 3% compared to the baseline scenario,
thus the emission factor of the electricity system is approximately 172 gCO2e/kWh. It
should be noted that only adding wind and solar capacity into the electric power system
does not have a significant impact on the emissions reduction in the energy system.
Figure 8. PES and CO2e emissions for all the scenarios.
The alternative scenarios 3 and 4 represent the maximum technical penetration level of
wind and solar power as explained in detail in Section 4.2. Both have fuel consumption
and GHG emissions lower than the baseline scenario (519.95 TWh and 96.21 MtCO2e,
respectively for scenario 3; 534.01 TWh and 102.27 MtCO2e for scenario 4). However,
the high wind scenario leads to higher fuel and GHG depletion due to its continuous
supply of energy throughout the day. In the case of solar power, this is only possible
during daylight hours.
As expected, the RES combination scenario offers the lowest PES and GHG emissions
of all the alternatives with 503.03 TWh and 86.87 MtCO2e, respectively. The mitigation
effect is approximately 20% reduction compared to the baseline. This scenario evidences
the importance of a more integrated alternative that includes all the different sectors of
the energy system. Because of the characteristics of the Colombian system, combined
strategies that include the transport sector could have a major impact on the energy sector
because this sector is the main driver of GHG emissions. In a country where the road
21
sector is responsible for 88% of the transportation emissions and 95% of the goods are
transported by medium or heavy-duty vehicles, increasing biofuel blending regulations
could be an effective mitigation strategy. However, in order to reach further
decarbonisation of the energy system policy makers in the country should be more
ambitious and define comprehensive plans that include energy efficiency in all the
sectors, electrification of light-duty vehicles and other sustainable mobility alternatives.
4.3.1 Electricity production results
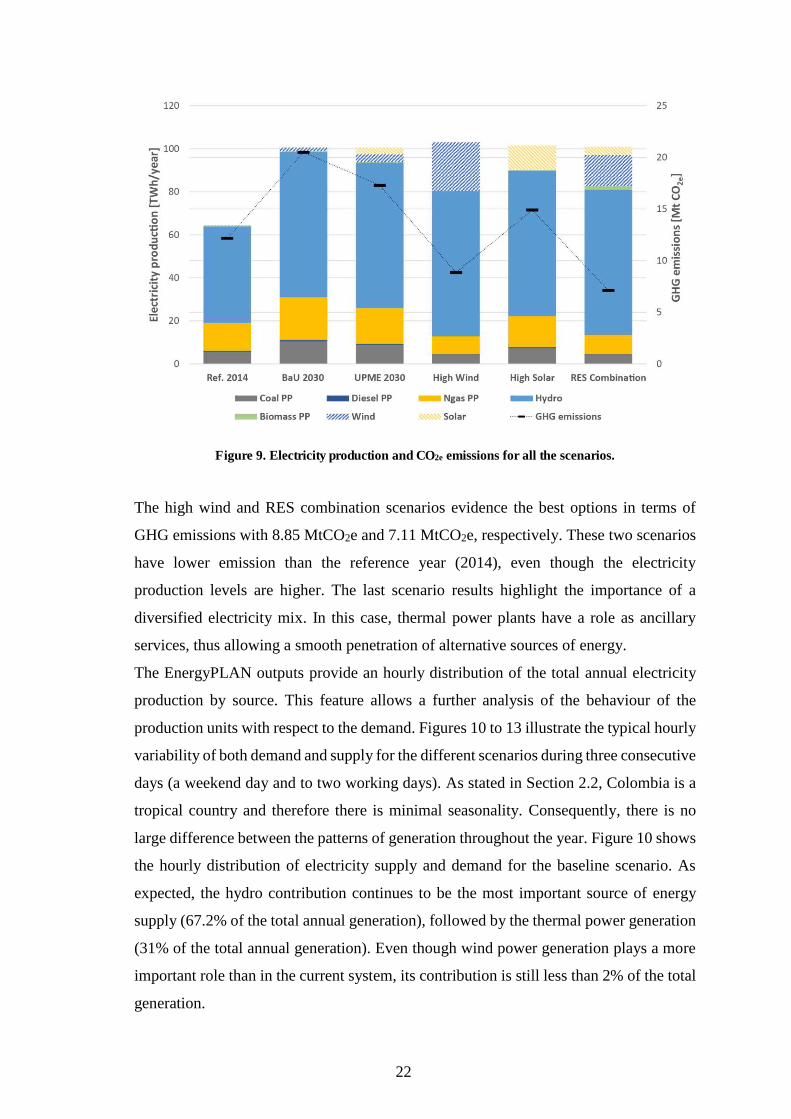
Figure 9 shows the amount of electricity produced in a year for all the scenarios
investigated. The electricity demand was obtained from the UPME transmission and
generation expansion plan and this value remains constant for all the scenarios [24]. The
excess of production in some of the scenarios is due to the RES over generation during
low consumption periods. Further, the hydropower installed capacity will continue to be
the main source of energy in the sector, and this might ensure a smooth and efficient
system integration. The flexibility of a power system to integrate RES is mainly
determined by the type of generation technology used. Hydropower dominated systems
are usually more flexible and capable to incorporate variable renewables than thermal
plants [11,51].
Figure 9 shows a growth in the electricity generation of about 56% between 2014 and
2030, from 64.39 TWh to 100.55 TWh, respectively. This accounts for an increase in
GHG emissions of approximately 69%, thus resulting in an emission factor for the
baseline scenario of approximately 204 gCO2e/kWh.
22
Figure 9. Electricity production and CO2e emissions for all the scenarios.
The high wind and RES combination scenarios evidence the best options in terms of
GHG emissions with 8.85 MtCO2e and 7.11 MtCO2e, respectively. These two scenarios
have lower emission than the reference year (2014), even though the electricity
production levels are higher. The last scenario results highlight the importance of a
diversified electricity mix. In this case, thermal power plants have a role as ancillary
services, thus allowing a smooth penetration of alternative sources of energy.
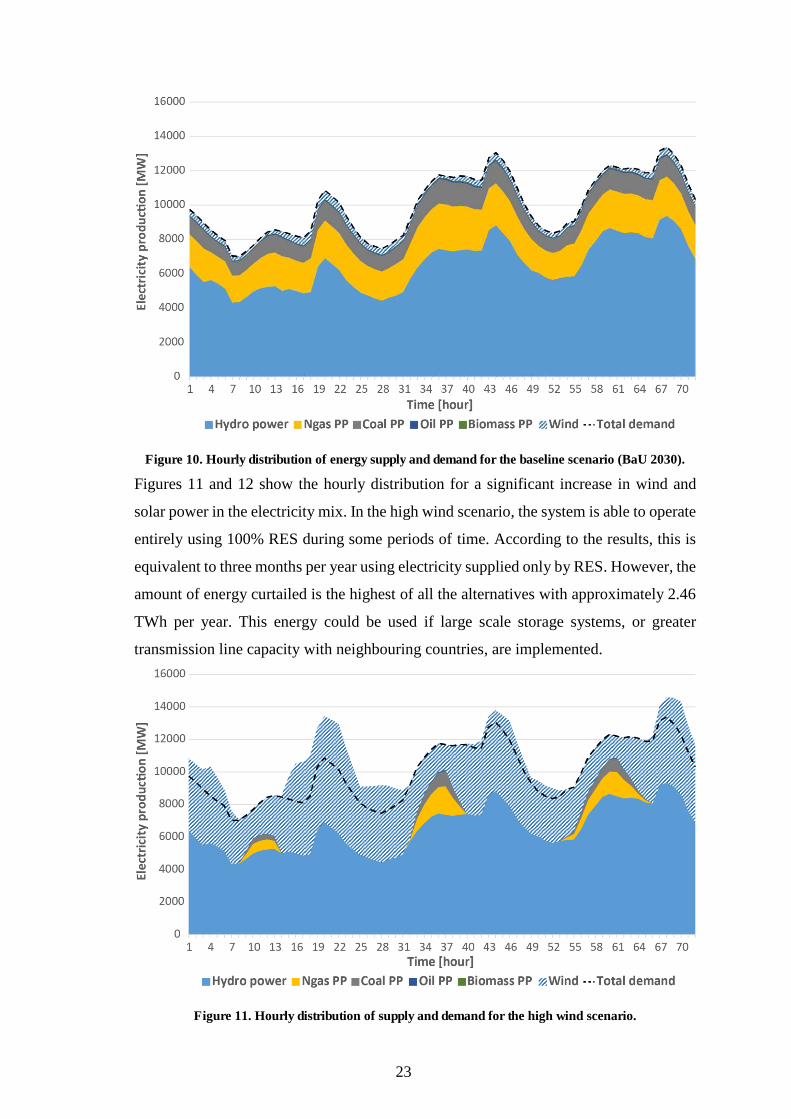
The EnergyPLAN outputs provide an hourly distribution of the total annual electricity
production by source. This feature allows a further analysis of the behaviour of the
production units with respect to the demand. Figures 10 to 13 illustrate the typical hourly
variability of both demand and supply for the different scenarios during three consecutive
days (a weekend day and to two working days). As stated in Section 2.2, Colombia is a
tropical country and therefore there is minimal seasonality. Consequently, there is no
large difference between the patterns of generation throughout the year. Figure 10 shows
the hourly distribution of electricity supply and demand for the baseline scenario. As
expected, the hydro contribution continues to be the most important source of energy
supply (67.2% of the total annual generation), followed by the thermal power generation
(31% of the total annual generation). Even though wind power generation plays a more
important role than in the current system, its contribution is still less than 2% of the total
generation.
23
Figure 10. Hourly distribution of energy supply and demand for the baseline scenario (BaU 2030).
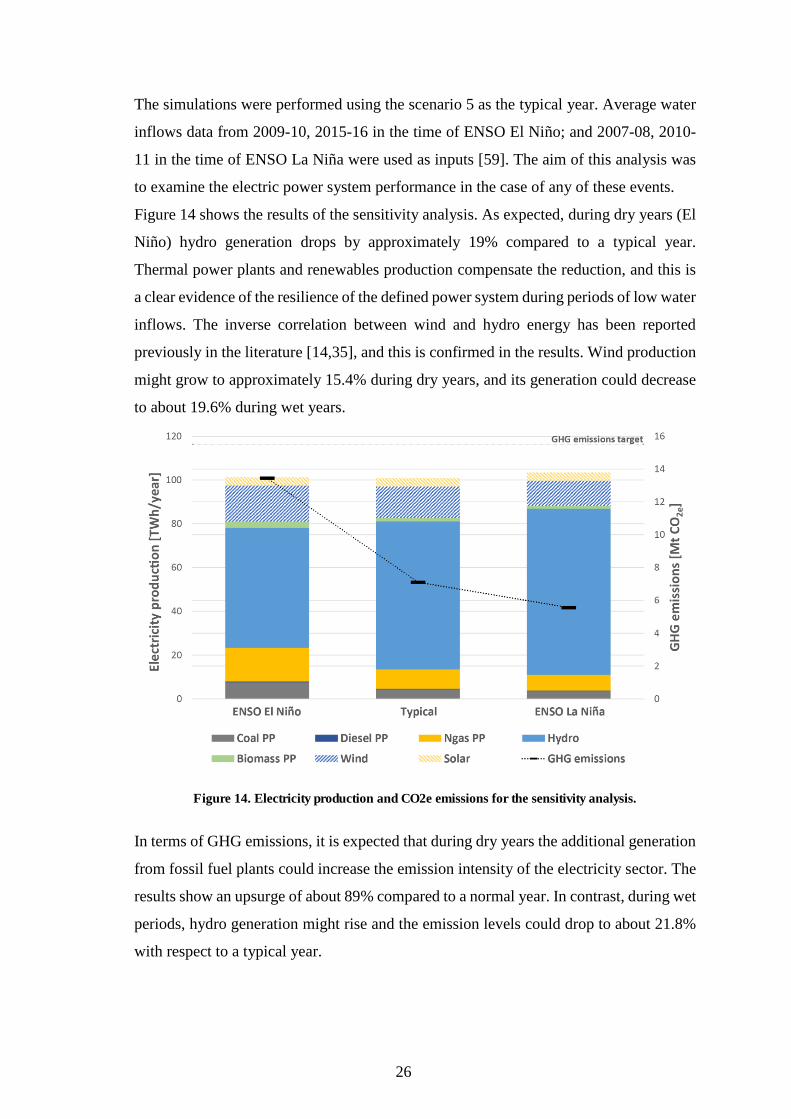
Figures 11 and 12 show the hourly distribution for a significant increase in wind and
solar power in the electricity mix. In the high wind scenario, the system is able to operate
entirely using 100% RES during some periods of time. According to the results, this is
equivalent to three months per year using electricity supplied only by RES. However, the
amount of energy curtailed is the highest of all the alternatives with approximately 2.46
TWh per year. This energy could be used if large scale storage systems, or greater
transmission line capacity with neighbouring countries, are implemented.
Figure 11. Hourly distribution of supply and demand for the high wind scenario.

24
Figure 12 illustrates the major challenge for solar power and the possibility of over
generation. Two distinct ramp periods develop for thermal power plants. The first one in
the downward direction occurs around 7:00 – 10:00 when people start their daily
activities and solar PV begins its generation. The second, in the upward direction, arises
as the sun sets at around 17:00 and solar generation plunges. This represents a ramp-up
for thermal generators of more than 4000 MW in a three hours period. To guarantee the
electricity supply under these load conditions, the power system requires the use of
highly flexible generation technologies.
Figure 12. Hourly distribution of supply and demand for the high solar PV scenario.
The RES combination hourly results are shown in Figure 13. This is the most equilibrated
of all the alternative scenarios. Although the participation of the thermal power plants is
higher than in the previous two scenarios (high wind and high solar), this fact allows
better interaction between all the resources. Here, thermal power plants act as ancillary
services in the case of scarcity of any of the RES. This is important in order to guarantee
the reliability of the electricity system.

25
Figure 13. Hourly distribution of supply and demand for the RES Combination scenario.
The effects of large scale RES integration on conventional thermal power plants require
special attention. The results shown in Figure 13 evidence that higher RES penetration
increase the ramping demands for thermal generators. This case is critical during peak
hours when the sun sets in tropical countries and solar production declines.
It is important to note that energy efficiency scenarios were not examined in this paper.
Additionally, it was assumed that the future energy demands would remain the same as
estimated by the Colombian government. Energy efficiency measures will need to be
included in future works when the best cost-efficient renewable energy system for
Colombia is estimated.
4.4 Sensitivity analysis
This section presents the sensitivity analysis for the future electricity sector of Colombia.
This analysis is important due to the high reliance of the power system on hydro
generation, which is affected periodically by extreme weather events. In Section 2.1, the
influence of the warm phase of ENSO was described. However, the cold phase of ENSO,
also known as La Niña, is characterised by heavy rainfalls that prompt an unusual
behaviour on the electricity sector.
26
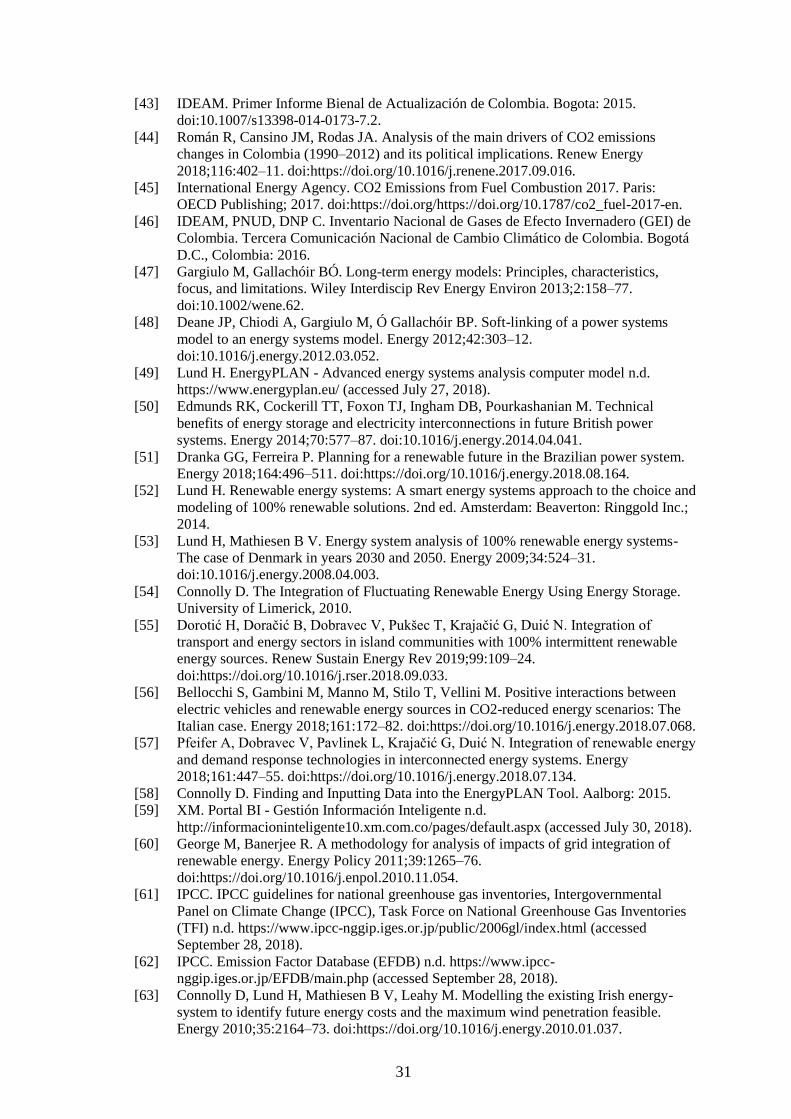
The simulations were performed using the scenario 5 as the typical year. Average water
inflows data from 2009-10, 2015-16 in the time of ENSO El Niño; and 2007-08, 2010-
11 in the time of ENSO La Niña were used as inputs [59]. The aim of this analysis was
to examine the electric power system performance in the case of any of these events.
Figure 14 shows the results of the sensitivity analysis. As expected, during dry years (El
Niño) hydro generation drops by approximately 19% compared to a typical year.
Thermal power plants and renewables production compensate the reduction, and this is
a clear evidence of the resilience of the defined power system during periods of low water
inflows. The inverse correlation between wind and hydro energy has been reported
previously in the literature [14,35], and this is confirmed in the results. Wind production
might grow to approximately 15.4% during dry years, and its generation could decrease
to about 19.6% during wet years.
Figure 14. Electricity production and CO2e emissions for the sensitivity analysis.
In terms of GHG emissions, it is expected that during dry years the additional generation
from fossil fuel plants could increase the emission intensity of the electricity sector. The
results show an upsurge of about 89% compared to a normal year. In contrast, during wet
periods, hydro generation might rise and the emission levels could drop to about 21.8%
with respect to a typical year.

27
5. Conclusions
In this paper, a new model for the Colombian energy system has been developed using
the EnergyPLAN tool. The purpose of the current study was to analyse the impacts of
different integrated renewable sources on possible future energy scenarios. The accuracy
of the model was verified considering 2014 as the reference year and then five different
scenarios have been built and simulated. Furthermore, the general results of this work
agree with those from earlier studies produced for Colombia [15,18,67] and other
countries with similar electricity mix [11,51].
The technical analysis of the scenarios evidenced the advantages of including renewable
alternatives in a system that has been historically dominated by hydro and fossil fuel
resources, such as natural gas and oil. In all the scenarios analysed, hydropower remains
as the main source of energy in the electricity sector. Its high flexibility, compared to
thermal plants, represents an advantage for the integration of variable renewables. The
maximum technical penetration levels of wind and solar power were estimated to be 22%
and 11%, respectively. Higher levels of penetration could result in over generation that
might limit the feasibility of the electric power system.
Even though the GHG emissions of the electricity sector in Colombia have been
generally low compared to international averages, further efforts are required to achieve
a significant decarbonisation of the complete energy system. The transport sector remains
challenging and the main driver of emissions even in the most optimistic scenario.
Therefore, policymakers should focus on long-term planning strategies oriented at
reducing its environmental impact through more sustainable mobility alternatives. In the
electricity sector, the results from the best-case scenario show an emission intensity of
70.44 gCO2e/kWh that could be achievable by increasing the participation of wind, solar
and bioenergy technologies as described in scenario 5.
The findings of this work should be interpreted with caution. The intention of the authors
is to suggest a pathway for the future energy system of the country based on the outcomes
of several scenario analyses rather than a forecast. The results of this work will be of
much assistance to policymakers that are developing a roadmap towards low carbon
energy systems in Colombia and other countries with similar potential and
characteristics.

28
Acknowledgements
This research was supported by the Fundación CEIBA - Gobernación de Bolívar through
the program “Bolivar gana con ciencia”. We thank our colleague Mauro Gonzalez, from
TEBSA, who provided his insights and expertise that greatly assisted this work. We also
thank IDEAM for providing their weather station data.

29
6. References [1] Ang BW, Choong WL, Ng TS. Energy security鳥: Definitions , dimensions and indexes.
Renew Sustain Energy Rev 2015;42:1077–93. doi:10.1016/j.rser.2014.10.064. [2] IEA. Harnessing Variable Renewables. 2012. doi:10.1787/9789264111394-en. [3] IRENA. Planning for the Renewable Future. 2017. [4] Connolly D, Lund H, Mathiesen B V., Leahy M. A review of computer tools for
analysing the integration of renewable energy into various energy systems. Appl Energy 2010;87:1059–82. doi:10.1016/j.apenergy.2009.09.026.
[5] Batlle C, Paredes JR. Análisis del impacto del incremento de la generación de energía renovable no convencional en los sistemas eléctricos latinoamericanos. Washington, D.C., USA: 2014.
[6] de Moura GNP, Legey LFL, Howells M. A Brazilian perspective of power systems integration using OSeMOSYS SAMBA – South America Model Base – and the bargaining power of neighbouring countries: A cooperative games approach. Energy Policy 2018;115:470–85. doi:https://doi.org/10.1016/j.enpol.2018.01.045.
[7] Octaviano C, Paltsev S, Gurgel AC. Climate change policy in Brazil and Mexico: Results from the MIT EPPA model. Energy Econ 2016;56:600–14. doi:https://doi.org/10.1016/j.eneco.2015.04.007.
[8] Colombian Electrical Information System (SIEL) 2017. http://www.siel.gov.co/ (accessed July 24, 2018).
[9] Schmidt J, Cancella R, Pereira AO. The role of wind power and solar PV in reducing risks in the Brazilian hydro-thermal power system. Energy 2016;115:1748–57. doi:https://doi.org/10.1016/j.energy.2016.03.059.
[10] Schmidt J, Cancella R, Pereira AO. An optimal mix of solar PV, wind and hydro power for a low-carbon electricity supply in Brazil. Renew Energy 2016;85:137–47. doi:https://doi.org/10.1016/j.renene.2015.06.010.
[11] Hagos DA, Gebremedhin A, Zethraeus B. Towards a flexible energy system – A case study for Inland Norway. Appl Energy 2014;130:41–50. doi:https://doi.org/10.1016/j.apenergy.2014.05.022.
[12] Mason IG, Page SC, Williamson AG. A 100% renewable electricity generation system for New Zealand utilising hydro, wind, geothermal and biomass resources. Energy Policy 2010;38:3973–84. doi:https://doi.org/10.1016/j.enpol.2010.03.022.
[13] Mining and Energy Planning Unit (UPME). Integración de las energías renovables no convencionales en Colombia. Bogota: 2015.
[14] Vergara W, Deeb A, Toba N, Cramton P, Leino I, Benoit P. Wind Energy in Colombia. The World Bank; 2010. doi:10.1596/978-0-8213-8504-3.
[15] Gonzalez-Salazar M, Venturini M, Poganietz W-R, Finkenrath M, Acevedo H, Kirsten T. Bioenergy Technology Roadmap for Colombia. 2014. doi:10.15160/unife/eprintsunife/774.
[16] Paez AF, Maldonado YM, Castro AO. Future Scenarios and Trends of Energy Demand in Colombia using Long-range Energy Alternative Planning. Int J Energy Econ Policy 2017;7:178–90.
[17] Chavez-Rodriguez MF, Carvajal PE, Martinez Jaramillo JE, Egüez A, Mahecha REG, Schaeffer R, et al. Fuel saving strategies in the Andes: Long-term impacts for Peru, Colombia and Ecuador. Energy Strateg Rev 2018;20:35–48. doi:https://doi.org/10.1016/j.esr.2017.12.011.
[18] Calderón S, Alvarez A, Loboguerrero A, Arango S, Calvin K, Kober T, et al. Achieving CO2 reductions in Colombia: Effects of carbon taxes and abatement targets. Energy Econ 2016;56:575–86. doi:https://doi.org/10.1016/j.eneco.2015.05.010.
[19] Østergaard PA. Reviewing EnergyPLAN simulations and performance indicator applications in EnergyPLAN simulations. Appl Energy 2015;154:921–33. doi:https://doi.org/10.1016/j.apenergy.2015.05.086.
[20] Connolly D, Lund H, Mathiesen B V., Leahy M. The first step towards a 100%

30
renewable energy-system for Ireland. Appl Energy 2011;88:502–7. doi:https://doi.org/10.1016/j.apenergy.2010.03.006.
[21] Mining and Energy Planning Unit (UPME). Colombian Energy Balance 2018. http://www1.upme.gov.co/InformacionCifras/Paginas/BECOCONSULTA.aspx (accessed July 9, 2018).
[22] Mining and Energy Planning Unit (UPME). Actualización y Revisión de los Balances Energéticos Nacionales de Colombia 1975–2009. Tomo I - Balances Energéticos Nacionales. Bogota: UPME; 2011.
[23] International Energy Agency. Energy Balances of non-OECD Countries 2015. Paris: International Energy Agency; 2015.
[24] Mining and Energy Planning Unit (UPME). Plan de Expansión de Referencia Generación Transmisión 2017-2031. Bogota: 2017.
[25] OECD/UN ECLAC. OECD environmental performance reviews: Colombia 2014. Paris: OECD Publishing; 2014. doi:10.1787/9789264208292-en.
[26] Espinasa R, Sucre C, Gutierrez M, Anaya F. Dossier energetico: Colombia. Washington, D.C., USA: 2017.
[27] International Energy Agency. Energy Access Outlook 2017: From Poverty to Prosperity. Paris: OECD; 2017. doi:10.1787/9789264285569-en.
[28] Morales S, Álvarez C, Acevedo C, Diaz C, Rodriguez M, Pacheco L. An overview of small hydropower plants in Colombia: Status, potential, barriers and perspectives. Renew Sustain Energy Rev 2015;50:1650–7. doi:10.1016/J.RSER.2015.06.026.
[29] Macias AM, Andrade J. Estudio de generación bajo escenarios de cambio climatico. Bogota: 2014.
[30] Vargas L, Jimenez-Estevez G, Dias M, Calfucoy P, Barrera M, Barrita F, et al. Comparative Analysis of Institutional and Technical Conditions Relevant for the Integration of Renewable Energy in South America. REGSA; 2014.
[31] Gómez-Navarro T, Ribó-Pérez D. Assessing the obstacles to the participation of renewable energy sources in the electricity market of Colombia. Renew Sustain Energy Rev 2018;90:131–41. doi:10.1016/J.RSER.2018.03.015.
[32] International Energy Agency. World Energy Outlook 2017. Paris: OECD Publishing; 2017.
[33] CORPOEMA – UPME. Formulación de un plan de desarrollo para las fuentes no convencionales de energía en Colombia (PDFNCE) - Vol 1. First. Bogotá: Mining and Energy Planning Unit (UPME); 2010.
[34] Edsand H-E. Identifying barriers to wind energy diffusion in Colombia: A function analysis of the technological innovation system and the wider context. Technol Soc 2017;49:1–15. doi:https://doi.org/10.1016/j.techsoc.2017.01.002.
[35] Asociación de energías renovables. Alternativas para la inclusión de FNCER en la matriz energética colombiana. 2017.
[36] UPME - IDEAM. Atlas de viento de Colombia. Bogotá: 2017. [37] Rodríguez-Urrego D, Rodríguez-Urrego L. Photovoltaic energy in Colombia: Current
status, inventory, policies and future prospects. Renew Sustain Energy Rev 2018;92:160–70. doi:https://doi.org/10.1016/j.rser.2018.04.065.
[38] UPME - IDEAM. Atlas de radiación solar, ultravioleta y ozono de Colombia. Bogotá: 2017.
[39] Radomes AA, Arango S. Renewable energy technology diffusion: an analysis of photovoltaic-system support schemes in Medellín, Colombia. J Clean Prod 2015;92:152–61. doi:https://doi.org/10.1016/j.jclepro.2014.12.090.
[40] Ministry of Mines and Energy (MME). Programa de Biocombustibles en Colombia. Bogotá: 2007.
[41] Environment and Sustainable Development Ministry (MADS). Upstream analytical work to support development of policy options for mid- and long-term mitigation objectives in Colombia. Bogota: 2016.
[42] Olaya Y, Arango-Aramburo S, Larsen ER. How capacity mechanisms drive technology choice in power generation: The case of Colombia. Renew Sustain Energy Rev 2016;56:563–71. doi:10.1016/J.RSER.2015.11.065.
31
[43] IDEAM. Primer Informe Bienal de Actualización de Colombia. Bogota: 2015. doi:10.1007/s13398-014-0173-7.2.
[44] Román R, Cansino JM, Rodas JA. Analysis of the main drivers of CO2 emissions changes in Colombia (1990–2012) and its political implications. Renew Energy 2018;116:402–11. doi:https://doi.org/10.1016/j.renene.2017.09.016.
[45] International Energy Agency. CO2 Emissions from Fuel Combustion 2017. Paris: OECD Publishing; 2017. doi:https://doi.org/https://doi.org/10.1787/co2_fuel-2017-en.
[46] IDEAM, PNUD, DNP C. Inventario Nacional de Gases de Efecto Invernadero (GEI) de Colombia. Tercera Comunicación Nacional de Cambio Climático de Colombia. Bogotá D.C., Colombia: 2016.
[47] Gargiulo M, Gallachóir BÓ. Long-term energy models: Principles, characteristics, focus, and limitations. Wiley Interdiscip Rev Energy Environ 2013;2:158–77. doi:10.1002/wene.62.
[48] Deane JP, Chiodi A, Gargiulo M, Ó Gallachóir BP. Soft-linking of a power systems model to an energy systems model. Energy 2012;42:303–12. doi:10.1016/j.energy.2012.03.052.
[49] Lund H. EnergyPLAN - Advanced energy systems analysis computer model n.d. https://www.energyplan.eu/ (accessed July 27, 2018).
[50] Edmunds RK, Cockerill TT, Foxon TJ, Ingham DB, Pourkashanian M. Technical benefits of energy storage and electricity interconnections in future British power systems. Energy 2014;70:577–87. doi:10.1016/j.energy.2014.04.041.
[51] Dranka GG, Ferreira P. Planning for a renewable future in the Brazilian power system. Energy 2018;164:496–511. doi:https://doi.org/10.1016/j.energy.2018.08.164.
[52] Lund H. Renewable energy systems: A smart energy systems approach to the choice and modeling of 100% renewable solutions. 2nd ed. Amsterdam: Beaverton: Ringgold Inc.; 2014.
[53] Lund H, Mathiesen B V. Energy system analysis of 100% renewable energy systems-The case of Denmark in years 2030 and 2050. Energy 2009;34:524–31. doi:10.1016/j.energy.2008.04.003.
[54] Connolly D. The Integration of Fluctuating Renewable Energy Using Energy Storage. University of Limerick, 2010.
[55] Dorotić H, Doračić B, Dobravec V, Pukšec T, Krajačić G, Duić N. Integration of transport and energy sectors in island communities with 100% intermittent renewable energy sources. Renew Sustain Energy Rev 2019;99:109–24. doi:https://doi.org/10.1016/j.rser.2018.09.033.
[56] Bellocchi S, Gambini M, Manno M, Stilo T, Vellini M. Positive interactions between electric vehicles and renewable energy sources in CO2-reduced energy scenarios: The Italian case. Energy 2018;161:172–82. doi:https://doi.org/10.1016/j.energy.2018.07.068.
[57] Pfeifer A, Dobravec V, Pavlinek L, Krajačić G, Duić N. Integration of renewable energy and demand response technologies in interconnected energy systems. Energy 2018;161:447–55. doi:https://doi.org/10.1016/j.energy.2018.07.134.
[58] Connolly D. Finding and Inputting Data into the EnergyPLAN Tool. Aalborg: 2015. [59] XM. Portal BI - Gestión Información Inteligente n.d.
http://informacioninteligente10.xm.com.co/pages/default.aspx (accessed July 30, 2018). [60] George M, Banerjee R. A methodology for analysis of impacts of grid integration of
renewable energy. Energy Policy 2011;39:1265–76. doi:https://doi.org/10.1016/j.enpol.2010.11.054.
[61] IPCC. IPCC guidelines for national greenhouse gas inventories, Intergovernmental Panel on Climate Change (IPCC), Task Force on National Greenhouse Gas Inventories (TFI) n.d. https://www.ipcc-nggip.iges.or.jp/public/2006gl/index.html (accessed September 28, 2018).
[62] IPCC. Emission Factor Database (EFDB) n.d. https://www.ipcc-nggip.iges.or.jp/EFDB/main.php (accessed September 28, 2018).
[63] Connolly D, Lund H, Mathiesen B V, Leahy M. Modelling the existing Irish energy-system to identify future energy costs and the maximum wind penetration feasible. Energy 2010;35:2164–73. doi:https://doi.org/10.1016/j.energy.2010.01.037.

32
[64] International Energy Agency (IEA). CO2 Emissions from Fuel Combustion 2016. 2016. doi:https://doi.org/https://doi.org/10.1787/co2_fuel-2016-en.
[65] International Energy Agency (IEA). Energy balances (Edition 2016) 2016. doi:https://doi.org/https://doi.org/10.1787/28c9796d-en.
[66] You W, Geng Y, Dong H, Wilson J, Pan H, Wu R, et al. Technical and economic assessment of RES penetration by modelling China’s existing energy system. Energy 2018;165:900–10. doi:https://doi.org/10.1016/j.energy.2018.10.043.
[67] CEPAL. Panorama del cambio climático en Colombia. vol. 146. Santiago: 2013. doi:10.1515/CCLM.2011.790\n/j/cclm.2012.50.issue-3/cclm.2011.790/cclm.2011.790.xml [pii].
33
List of Acronyms and Abbreviations AFOLU Agriculture, Forestry and Other Land Use BaU Business as Usual CEEP Critical Excess of Electricity Production CEPAL Economic Commission for Latin America and the Caribbean COMP Compromised Coefficient COP Conference of the parties ENSO El Niño and La Niña southern oscillation EPPA Economic Projection and Policy Analysis GDP Gross Domestic Product GHG Greenhouse gases IDEAM Hydrology, meteorology and environmental institute IEA International Energy Agency iNDC Intended Nationally Determined Contributions IPCC Intergovernmental Panel for Climate Change IPPU Industrial Products and Product Use ISA Interconexión eléctrica S.A. (Electric interconnection company) LEAP Long-range Energy Alternatives Planning OSeMOSYS Open Source Energy Modelling System PES Primary Energy Supply PV Photovoltaics RES Renewable Energy Sources SIEL Colombian Electrical Information System SIN National Interconnected System tCO2e ton of CO2 equivalent TPES Total primary energy supply
UPME Unidad de Planeación Minero Energética (Mining and Energy Planning Unit)
VRS Variable Renewable Source XM Compañía de Expertos en Mercados (Market experts company) ZNI Not-Interconnected Zones