Land use characterization of Ile-Ife
126
LAND USE CHARACTERIZATION OF ILE-IFE. BY ARODUDU OLUDUNSIN TUNRAYO GLY/2001/065 A DISSERTATION SUBMITTED IN PARTIAL FULFILMENT OF THE REQUIREMENT FOR THE AWARD OF BACHELOR OF SCIENCE DEGREE IN THE DEPARTMENT OF GEOGRAPHY, FACULTY OF SOCIAL SCIENCES, OBAFEMI AWOLOWO UNIVERSITY, ILE-IFE, OSUN STATE, NIGERIA. NOVEMBER 2008
-
Upload
independent -
Category
Documents
-
view
1 -
download
0
Transcript of Land use characterization of Ile-Ife

LAND USE CHARACTERIZATION OF ILE-IFE.
BY
ARODUDU OLUDUNSIN TUNRAYO
GLY/2001/065
A DISSERTATION SUBMITTED IN PARTIAL FULFILMENT OF
THE REQUIREMENT FOR THE AWARD OF BACHELOR OF
SCIENCE DEGREE IN THE DEPARTMENT OF GEOGRAPHY,
FACULTY OF SOCIAL SCIENCES, OBAFEMI AWOLOWO
UNIVERSITY, ILE-IFE, OSUN STATE, NIGERIA.
NOVEMBER 2008

ii
CERTIFICATION
This is to certify that ARODUDU OLUDUNSIN TUNRAYO with registration number
GLY/2001/065 of the Department of Geography, Faculty of Social Sciences, Obafemi
Awolowo University, Ile – Ife, Osun State, wrote this dissertation under the supervision of
Prof F.A Adesina.
Prof. F.A Adesina Date
Project Supervisor
.
Dr. Aderemi Adediji Date
Head of Department

iii
DEDICATION
To the Almighty; my source, my inheritance, my lot, my hope and my exceeding great
reward.

iv
ACKNOWLEDGEMENT
To Him who found me in the wilderness and had helped thus far, He instructed and
kept me as the apple of his eye, He made a nest for me, nurtured me and bore me on the
wings of the eagle, He alone led me and there was no strange god with me and made me to
ride on the high places of the earth. THANK YOU
To my Late Dad; thoughts of you are always sources of continuous inspiration for me, I
wished had lived longer to savour this moments. To the greatest Mum in the World; you
are first among equals, one in a million, thank you for your support and good training, Your
relentless love had made me stay in the race. I will always love and cherish you. To my
sisters; Sister Toyin, Sister Kemi, Sister Sade and Sister Tolu, you’ve been my defense and
security, come rain or shine, you have always been there for me, may you not lack any
Good thing in your life. To my only brother, far greater than Ali, you are the greatest.
Thank You
To the first people I met in this department, the clerical staffs, May God in his
infinite mercy take care of you and yours. To the first citizen of this department, when I
was about coming in, Prof A.S Aguda, what God has helped you to accomplish in my life
may you not lose the reward in Jesus name. Thank you for giving me another life, a new
lease of hope I am grateful to you for allowing God use you for me.
My profound gratitude goes to my Project supervisor, Prof. Adesina that I fondly
call Baba. I will want to say this that you are a rare specie on the earth, men like you are
very few and not easy to come by, I am glad to have passed through, you are indeed a rare
gem, I celebrate your forthrightness, achievements and life legacy of hard work and service
to humanity. Your glowing touch of idealism which to you is a lifestyle will remain with

v
me for the rest of my life and I as a person (Dunsin) promise not to betray your ideals as
father as we go into the larger society to contribute our share as stakeholders and policy
makers in a new emerging Nigeria of our dreams.
I thank all the lecturers in the department of Geography for their contribution to my
success on this campus. May heaven reward your labour of love over me, Keep doing the
good work that you are all doing. God bless you all.
I want to specially thank and appreciate Mr. Olawole and Dr Adeoye, through thick
and thin, you’ve been there for me; May the Almighty, whom I serve and whose I am make
sure that you and your offsprings never lack help in the name of Jesus. To Dr.
Orimoogunje, Mr Eludoyin and Dr.Olayiwola, Dr Babatimehin, Dr Odekunle, Dr Adediji,
you are all wonderful people; may God’s goodness and mercy rest on your habitations
forever and may God make our lives a testimony of your ceaseless labour over us. Amen.
To my church folks, you are all wonderful people, in your love and apathy,
togetherness and strife, through it all, you’ve helped me learn God, which is the essence of
our common salvation an eternal life; thank you all for the part you played in my stay on
campus, regardless of our differences, you have played the part that God will have you play
in my life, Thank you CLF, Living Seed Ministries and my Beloved pastor, Pastor Mrs.
Adetiloye, Thank you for your understanding.
To my own Gabu father, Oluh, Remson, Ilafa, Ogaaba, Lamidi, Segedu1, Christain
Love, Opasco, Jendor, Simon Ben Judah, Biola, Lola, Wale, Feyi, Lamide, Samson Nee,
Aworawo, Shobo, Yemi Aye, Alex Aye, Wale Aye, S O Jakes, Okay, TJ, Wardd; Blessed
be the day I met you all, The world has never known a better company than ours; Our

vi
season of revelation and manifestation had just began. Thank you for being worthwhile
investments.
Arodudu Oludunsin Tunrayo
NOVEMBER 2008.

vii
Table of content
Title page i
Certification ii
Dedication iii
Acknowledgement iv
Table of content vii
List of Tables xi
List of Figures xii
List of Charts xv
Abstract xvi
CHAPTER ONE: GENERAL BACKGROUND
1.11 Introduction 1
1.11 Land Use Issues 1
1.111 Issues in Land Use 3
1.112 Concept of Land Use an Environmental Concept 4
1.12 Land Use Characterization 5
1.2 Objectives 6
1.3 Statement of Problem 6
1.4 Justification of Study 6
1.5 The Study Area 6
1.51 Location 6
1.52 Climate and Vegetation 7
1.53 Population Characteristics 8

viii
CHAPTER TWO: LITERATURE REVIEW
2.1 Classes of Land Use 12
2.11 Rural Land Uses 12
2.12 Urban land uses 12
2.2 Factors Influencing Land Use 13
2.21 Population 13
2.22 Economic Growth 14
2.23 Efforts, Plans, Legislations and Policies 14
2.24 Available Resources 15
2.3 Land Use Study 16
2.31 Contemporary land use models 17
2.311 Models to predict total Land Use 18
2.3121 Build out Analysis 18
2.3122 Cellular Models 19
2.3123 Agent Based Models 19
2.32 Classification Schemes 20
2.33 Use of Remote Sensing Capabilities 24
2.331 What Is Remote Sensing 24
2.3311 Camera Remote Sensing 29
2.3312 Satellite Remote Sensing 29
2.332 Limitation of the Remote sensing Imageries 32
2.333 Problem of Remote Sensing In Developing Countries 37

ix
CHAPTER THREE: METHODOLOGY
3.1 Materials Required 40
3.2 Methodology 41
3.21 Data Collection 41
3.211 Primary Data 41
3.2111 Reconnaissance Survey (Recce) 41
3.2112 Land Use Field Survey 41
3.21121 Land Categorization 42
3.211211 Land Categorization Principles 43
3.212 Secondary Data 47
3.22 Image Processing 47
3.221 Pre-Processing 47
3.222 Classification 48
3.2221 Unsupervised (Automatic) Classification 48
3.2222 Supervised Classification Method 48
3.223 Pre- Classification 48
3.2231 Loading of the Coordinate System 50
3.2232 Colour Separation 56
3.2233 Map List Creation 60
3.2234 Georeferencing 62
3.2235 Domain or Class Creation 68
3.2236 Sample Set Creation 72
3.2237 Training of Sites 76

x
3.224 Classification Procedure 79
3.225 Digitization 83
3.23 Geo-Presentation or Result Presentation 84
3.231 Image Statistics Display 85
3.232 Overlay Operations 89
3.3 Limitation of the Study 93
CHAPTER FOUR: RESULT AND ANALYSIS
4.1 Observations 94
4.2 Land Use Characterization Map 94
4.3 Image Statistics Display 96
CHAPTER FIVE: SUMMARY AND CONCLUSION
5.1 Summary 101
5.2 Issues and Recommendation 101
REFERENCES 104
APPENDICES 106
xi
List of Tables
Table 1: Table showing the areal extent and percentage covered by the key land cover types and land
use types in Ile-Ife. 96
Table 2: Table showing the areal extent and percentage covered by the key land cover types in Ile-
Ife. 98
Table 3: Table showing the percentages of land uses in the Built Up areas of Ile-Ife. 99
Table 4: Table showing the selected coordinate points collected in the field for feature identification
and image processing 109

xii
List of Figure
Fig 1: Map showing the location of Ile-Ife 9
Fig 2: Procedure 1 50
Fig 3: Procedure 2 51
Fig 4: Procedure 3 52
Fig 5: Procedure 4 53
Fig 6: Procedure 5 54
Fig 7: Procedure 6 55
Fig 8: Procedure 7 56
Fig 9: Procedure 8 57
Fig 10: Procedure 9 58
Fig 11: Procedure 10 59
Fig 12: Procedure 11 60
Fig 13: Procedure 12 61
Fig 14: Procedure 13 62
Fig 15: Procedure 14 63
Fig 16: Procedure 15 64
Fig 17: Procedure 16 65
Fig 18: Procedure 17 66
Fig 19: Procedure 18 67
Fig 20: Procedure 19 68
Fig 21: Procedure 20 69
Fig 22: Procedure 21 70

xiii
Fig 23: Procedure 22 71
Fig 24: Procedure 23 72
Fig 25: Procedure 24 73
Fig 26: Procedure 25 74
Fig 27: Procedure 26 75
Fig 28: Procedure 27 76
Fig 29: Procedure 28 77
Fig 30: Procedure 29 78
Fig 31: Procedure 30 79
Fig 32: Procedure 31 80
Fig 33: Procedure 32 81
Fig 34: Procedure 33 82
Fig 35: Procedure 34 83
Fig 36: Procedure 35 84
Fig 37: Procedure 36 85
Fig 38: Procedure 37 86
Fig 39: Procedure 38 87
Fig 40: Procedure 39 88
Fig 41: Procedure 40 89
Fig 42: Procedure 41 90
Fig 43: Procedure 42 91
Fig 44: Flowchart of the Methodology 92
Fig 45: Land Use characterization map of Ile-Ife 95
xiv
Fig 46: Scanned Image of Ile-Ife Roadmap 106
Fig 47: The Coordinate System used for the study 107
Fig 48: The Georeference editor of LandSat ETM+
2002 Imagery of Ile-Ife. 108

xv
List of Charts
Chart 1: Pie chart showing the percentage of land cover types and land use types in Ile-Ife 97
Chart 2: Bar chart showing the percentage of land cover types and land use types in Ile-Ife 97
Chart 3: Pie chart showing the percentage of land cover types in Ile-Ife 98
Chart 4: Bar chart showing the percentage of land cover types in Ile-Ife 99
Chart 5: Pie chart showing the percentage of the different built-up land use classes in Ile-Ife 100
Chart 6: Bar chart showing the percentage of the different built-up land classes in Ile-Ife 100

xvi
ABSTRACT
This study attempts to characterize the key land uses in Ile-Ife. The study aims at
identifying the key land uses in Ile-Ife, producing a land characterization map of Ile-Ife and
obtaining information about the key land cover and land uses from remote sources.
In order to achieve the above aim, we undergo land use surveys so as to familiarize
ourselves with the study area and take coordinates of important features needed in the
characterization process.
Landsat Enhanced Thematic mapper (2002) imagery of Ile-Ife is obtained from
secondary sources and classified into key land uses and covers based on the information
gathered in the field using ILWIS 3.2, an image processing software; each layer or segment
of land cover types and land use types are created by digitization in the ILWIS 3.2
environment and the statistics of each layer or segment of the digitzied image is also
displayed in ILWIS 3.2 environment. The layers or segments of the digitized image
representing the various land use cover types and land use types are exported to Arcview
GIS 3.2a were they are overlain to produce a land characterization map of Ile-Ife.
In the course of our study, we identified five key land cover types in Ile-Ife; they
include Built-Up Areas or Built-Up settlements, Vegetation, Bare Soil, Water Body and
Wetland. We also identified three key land use types; they include Residential,
Commercial, and Institutional Land Use areas.
Based on the image analysis, the estimated total land area of the study area is
approximately 668.83 Km2 with 407.07Km
2 (61.16%) of it covered by Vegetation, mostly
secondary vegetation. About 172.59Km2
(25.81%) is covered by residential built-up
settlements, about 37.63 Km2
(5.63%) is covered by institutional built-up settlements, about
35.27 Km 2
(5.27%) is covered by Bare soil, about 8.00 Km2 (1.20%)
is covered by

xvii
wetlands, about 5.29 Km2
(0.79%) is covered by commercial built-up settlements while
remaining 0.15% ( about 0.98 Km2) is covered by pockets of water bodies. The total area of
built-up settlements in Ile-Ife put together is about 215.51 Km2 representing about 32.22%
of the total land in the area.
Although, vegetation covers most of the ground surface of the study area (about
61.16%), the ecosystem of the study area is still under threat because of the secondary
nature of the vegetation and the continuous rise in land use for urban purposes; therefore an
efficient land use planning structure that makes use of relevant technologies and
information such as that which this study is designed to produce need be put in place to
ensure sustainability of the environment and its capacity to continue to support life.

1
Chapter One
GENERAL BACKGROUND
1.1 Introduction
The term “Land Use” is usually used to describe the different kinds of
uses that portions of land are put to. It has often been used interchangeably with the term
“Land Cover” although they differ in meaning. Land Cover refers to the surface cover on
the ground or the physical state of the land surface; which may be in form of vegetation
or urban infrastructures such as buildings, churches, schools, asphalt laid roads, concrete
floors and pavements and features such as water, bare soil, wetland, swamp, Mangrove,
rocky surfaces etc while land use refers to the purpose the land serves or the purpose the
land is used for; examples include recreational land uses such as wildlife and game parks
and reserves, amusement parks, hotels, holiday Inns, hotels, brothels, motels etc.
Land use usually involves human modification of the natural environment
as wilderness into built up environments such as fields, Pastures and settlements. Land
use can be defined as the total arrangements, activities and inputs that people undertake
in a certain land cover type [FAO, 1997a; FAO/UNEP, 1999].
1.11 Land Use Issues
Land use is crucial because it directly touches on issues relating to man‟s survival
on earth. Man through his use of land to secure livelihood has destroyed the environment
which is the basis of his livelihood in the first instance.
Over the last three centuries, it has been observed that human population
had continue to grow at a rate that is astronomical when compared to the limited nature of

2
the resources available within reach to cater for the growing population. In 1798, English
clergymen and College Professor Robert Thomas Malthus in his Essay “the principle of
population” postulated that “man can only increase its means of subsistence at an
arithmetic progression while population increased at a geometric progression” and
suggested measures for checking such astronomical population increase so as to be able
to slow down the increase to march the level of subsistence. Numerous scholars had
argued that the persistence of such a scenario as these can cause the depletion of the
resources that once supported man‟s livelihood on earth to an extent that he can no longer
do so due to the wanton destruction of the environment. It has also been noted that such
wanton destruction could result in a widespread outbreak of hunger, famine, diseases and
pestilence which could also lead to conflict as it is the case today in many parts of Africa.
Land is “ a delineable area of the earth‟s terrestrial surface, encompassing
all attributes of the biosphere immediately above and below this surface including near-
surface climate, the soil and terrain forms, the surface hydrology (including shallow
lakes, rivers, marshes and swamps), the near surface sedimentary layers and associated
ground water reserves, the plant and animal populations, the human settlement pattern
and physical results of past and present human activity such as terracing, water storage or
drainage structures, infrastructures, buildings” [UN,1995] and not just the solid part of
the earth or the medium or bedrock on which man depends for the provision of his
physical, economic, religious and cultural wants or needs. This definition of land
encompasses all the attributes and aspect of resources needed for the survival, subsistence
and sustenance of its growing population on earth. Basic human needs and wants include
3
shelter, Clothing, housing, food, wealth, money, Comfort, warmth, cultural and religious
obligations.
A school of thought referred to as Marxists believe that population problems are
not due to population increase but unequal distribution of resources and all of such
resources are tied to land by the UN definition making land use an indispensable issue or
subject matter in many fields of sciences designed to proffer solutions to human
problems.
1.111 Issues in Land Use
Man uses land for varieties of purposes which satisfies his varieties of
wants and needs; such wants and needs are usually for physical, economic, cultural or
even religious purposes and are essential for man‟s survival and continued existence.
Consequently, Land had always been in high demand and such demands had always
increased with increase in population.
Land is fixed, immobile and irreplaceable in nature, limited in availability
and by boundaries as opposed to the belief that it is limitless and inexhaustible. At the
rate at which land is being used, there may be nothing left for the coming generation and
so the fear of exhaustion of land and land resources within delimited territories is the first
issue in land use and the need to control its use within such boundaries is the second and
this requires proper planning and implementation.
Planning for land use in a way that its execution will both be environmental and
human friendly is the third major issue in land use. It should be noted in planning of
whatever form that plans are meant for man and not man for plans i.e. that plans are made
for man by man to help man and so a plan that is not altogether environmentally, socially
4
and economically friendly in tackling man‟s problem is not fit for implementation.
Principles such as suitability of the environment for a certain use considering its local
physical, social and economic characteristics, optimization of whatever use land is been
put to and sustainability of whatever land use is proposed to ensure that the future of the
environment to run itself and support the continuity of human life is not compromised are
to be taken into consideration in planning and execution of projects for a better, more
productive and sustainable environment. However the principles mentioned above are
known to constitute the other issues in land use and they are thus issues of suitability,
issues of optimization of use and issues of sustainability.
1.112 Concept of Land Use an Environmental Concept
Many fields have evolved in the environmental sciences as man continues to
strive to understand himself and the environment enough to be able to effectively control
his resources for the common good of all in a way that its present needs and wants will be
satisfied without compromising the future capacity of the environment to run itself
continuously according to the natural order of life without being alienated and the future
capacity of the environment to support the continuity of human life on it (earth).
The term “Land use” had continue to find its way into very many environmental
fields of studies namely ecology, Biodiversity studies, Planning, Resource Management
and economic planning, Climatology, meteorology, hydrology, geomorphology etc
because it affects every element of the natural environment which are the subject matter
that those disciplines study.
Land use offsets the balance of the ecosystem which man is a component of. Land
use is one of the determinants of the distribution and prevalence of species on earth. Land

5
use practices produces and releases gases into the atmospheres that degrades the local,
regional and global air and precipitation quality and contributes to global warming. Land
use is a major determinant of hydrological processes and balance; it is capable of causing
a change in the course of hydrological processes or shifts in hydrological balance. Land
use is major determinant of the quality of water in basins; discharge rate, recharge rate
and volume of basins per time. Land use is one of the agents that influences the
distribution and formation of land forms and slopes in whatever environment whether
tropical, humid, temperate or Polar Regions and one of the factors that aid the agents of
land form formation such as wind, wave, ice and running water.
Increased Land use causes expansion of urban facilities and leapfrog development
into neighbouring boundaries (urban sprawl); this cause boundary violation which
precipitate into communal and inter-boundary conflicts.
Information on land use such as the stock of land used, the type of land uses and
the patterns and trends of land use within particular boundaries are essential tools for
making decision in planning and re-organization schemes and in distribution and
allocation of national resources for sustainable development.
1.12 Land Use Characterization
Land Use Characterization involves the classification of portions of land in an
area into different land use types based on its predominance, relative significance or its
association with other land use types that has wider definitions; for instance most
recreational land use forms exists for commercial purposes and so could be classified
under commercial land use in certain cases. Land use are usually characterized to take the
stock of land cover and land uses and provide relevant information (data and maps)

6
needed for subsequent planning or re-planning in lieu of development for meeting the
present needs of a man without compromising the ability of man to develop in the future.
1.2 Objectives
The specific objectives and scope of this study are to:
i. To identify key land use types in Ile-Ife.
ii. Attempt the production of a land use map for Ile-Ife.
iii. Provide an estimate of the key land use types in Ile-Ife
1.3 Statement of Problem
Effective Land resources management requires specific information on
what uses the land of a particular area is put to and this is lacking for many cities in
Nigeria. This present study is an attempt to provide such information to fill this gap for
Ile-Ife.
1.4 Justification of Study
Ile-Ife like other Nigerian cities is evidently growing at an unprecedented rate and
a good knowledge of the extent of the various land uses is not known. Such information
are required for rational planning of the city and for the provision of municipal services.
A study like this is needed to provide the information.
1.5 The Study Area
1.51 Location
The study area is Ile-Ife, covering the whole of Ife Central Local
Government Area and most parts of Ife East Local Government Area of Osun State,
Nigeria. Ile-Ife is located between latitude 7o 31‟N and 7
o34‟N of the equator and
between longitude 4o30‟E and 4
o34‟E of the prime meridian. The Area is bounded in the
7
North by Atakumosa West Local Government Area, in the North West by the Ede South
Local Government Area, in the East by Atakumosa West Local Government Area, in the
West by Ife North Local Government Area and in the South by Ife North and South Local
Government Areas.
1.52 Climate and Vegetation
Ile-Ife falls within the humid tropical environment (Adejuwon, 1979) and
therefore has high temperature and rainfall typical of the tropics. It is characterized by
marked wet and dry seasons. The wet season which is associated with the tropical air-
mass (mT) varies between seven and nine months. It lasts from around April to
November. The annual rainfall variability lies between 90% and 120% annually. The dry
season is associated with the tropical continental airmass (cT), temperature and relative
humidity are generally high. The mean monthly temperature ranges between 23°C and
27°C (Ojo, 1977). This climate supports the rainforest formation as described by
Richards (1952). In the dry season, the temperature can be as high as above 29.4°C and in
the rainy season it can be as low as 25.6°C. The relative humidity is very high between
67% and 88%. The dry season usually begins towards the end of October and ends
around March thus, lasting five months. The rainy season begins around April and ends
in October. Ile-Ife is located within the rain forest belt of Nigeria where the climate
encourages forest growth. Its forest cover supports the growth of cash crops such as
Cocoa, kolanut and Oil Palm. Ife Area generally is the home of valuable economic timber
resources such as Iroko, Oganwo, Obeche, Idingbo, Afa, and Ole making lumbering and
saw-milling a major industry in the area. The town is also a collecting centre for
agricultural products which has attracted traders from Northern Nigeria to settle and trade

8
especially in kolanut. Other occupations of the people include vocational practices,
trading, civil service, arts etc.
1.53 Population Characteristics
Figures from the last conducted national population and housing census in
2006 revealed that Ife central local government has an estimated total population
of about 167,254; comprising of about 84,653 male and about 82,601 female
while Ife East has an estimated population of about 188,087; comprising of about
92,054 male and about 96,033 Female.[NPC, 2007]
The total population of the Study area is estimated at about 355,341;
comprising of about 176,707 male and about 178,634 female.

9
Fig 1: Map showing the location of Ile-Ife

10
CHAPTER TWO
LITERATURE REVIEW
Land has been defined differently by different individual scholars, bodies of
scholars and organizations based on their different perceptions of what it actually is. It is
viewed by many as the solid part of the earth invaluable and necessary for human
existence and by many others as the plane on which human activities of whatever form or
magnitude take place. Such human activities could be industrial, agricultural or
commercial or economic or religious or cultural or even academic in native.
Economists view land as a factor of production comprising all naturally occurring
resources needed for production and on which production is done; Christian and Steward
(1968) said “land was synonymous to terrain”. Adeniyi (1986) defined land “as a major
resource that is a common base to all development effort”. Food and Agricultural
Organization (FAO), a United Nation Body in 1985 defined land initially as “an area of
the earth‟s surface, the characteristics of when embraces all reasonably stable or
predictably cyclic attributes of the biosphere vertically above and below this area
including those of the atmosphere, soil and underlining geology, the hydrology, the plant
and animal population, and the results of past and present human activities and the extent
that those attributes exert a significant influence on its present and future uses by
humans” but later redefined it in 1995 as “a delineable area of the earth terrestrial surface,
encompassing all attributes of the biosphere immediately above or below this surface
including those of near surface climate, the soil and terrain forms, the surface hydrology
(including shallow lakes, rivers, marshes and swamps), the near surface sedimentary
layers and associated ground water reserve, plant and animal populations, the human

11
settlement pattern and physical result of past and present human activity such as
terracing, water storage or drainage structures, infrastructures and buildings”, so as to
make it all encompassing to include non-cyclic attributes left out in the initial definition
which defined land only to encompass reasonably stable and predictably cyclic attributes
of the biosphere.
Most of the definitions of land touch on certain aspects if not all parts of resources
that man needs to survive; this had made the term “Land” and its usage central to all
discourse on resources in every walks of life globally as man continued to strive to meet
his needs in the face of growing population concerns and accompanying pressure on
limited available resources without destroying the environments capability to run itself
and to continue to support life in the future.
Generally land and its use are evaluated in terms of characteristics, qualities and
capabilities. Land characteristics are directly observable properties of land such as
productivity, fertility, ruggedness, erodibility etc. (Jeje, 1986); land quality is the degree
to which certain tract of land can be put to certain kinds of use, while land capability
refers to the fitness of the land to perform a definite use (Townshend, 1981).
Land use usually involves either a modification or conversion of the natural
environment or wilderness or cover type by human activities from the initial natural
condition to a newer less natural condition e.g. modification of a forest to a farm land for
agricultural use; or conversion of a grass land or a grazing fields or a farmland into a built
up residential house for residential use or conversion of a virgin land to a car park for
transportation use.

12
2.1 Classes of land use
Land use can be broadly classified into rural and urban land use.
2.11 Rural land uses
Rural land uses are usually primary or primitive in nature; they comprise of largely
extractive land uses such as agricultural land uses such as land use for farming, grazing
and fishing and mining land uses such as excavation for solid minerals, rocks and sands,
drilling for water, liquid minerals such as oil, gaseous minerals such as natural gas and
residential land uses such as huts, farmhouse, camps, tents and country houses and to a
lesser extent commercial land uses such as food markets; industrial land uses such as
crafts, artisanship etc traditional and cultural land uses such as traditional landmarks and
hotspots; recreational land uses such as open spaces, playing fields and playgrounds and
fewer educational land uses usually 1 or 2 primary and secondary schools.
2.12 Urban land uses
Urban land uses on the other hand are usually more modern and sophisticated.
Urban land use is usually composed of lesser extractive land uses i.e. lesser mining and
agricultural land uses. The few extractive land uses found in urban areas however
include drilled boreholes and wells (mining land use) gardens and orchards (agricultural
land use). Urban land uses usually compose of more of uses that are secondary, tertiary,
quaternary and quinary in nature because of its usual nearness to availability of all the
resources and infrastructures that favours such land use decisions and activities.
More predominant land uses in urban areas include industrial land uses example light
manufacturing such as food processing and heavy manufacturing such as steel rolling
mill, building and constructions such as block-making, industries etc and more service
13
oriented uses e.g. shops, shopping malls, filling stations, departmental stores, central
markets, banks and insurance companies etc. Residential uses such as estates,
Government reserve areas, streets, avenues, crescents etc, more modern religious land
uses such as churches, mosques and temples, educational land uses such as day cares,
kindergartens, primary schools and secondary schools, continuing education centre
(CECs) etc; transportation land uses such as car parks, road networks, bus stops, public
motor parks and garages etc, recreational land uses such as hotels, motels, brothels,
museums, cinemas, media and game houses, golf courses, stadia, amusement parks etc
and conservational land uses such as wildlife, games and forest reserves and parks.
“Land use is the result of continuous field of tension created between available
resources and human needs acted upon by human effort” (Vink, 1975). Land use, land
use decisions and patterns are therefore usually driven mainly by the size and dynamics
of human population and degree of human activities that such population size of
dynamics attracts, the state function and size of available land and its resources and the
action control, legislation and policies that man imposes on land use for optimization and
sustainability of his resources.
2.2 FACTORS INFLUENCING LAND USE
2.21 Population
Population growth occasioned either by natural increase or high rate of migration
increases the number of residents and the intensity of land use especially for residential
and commercial purposes in an area because more homes and places to work and shop
will be needed. Population growth could also cause a significant change in land use types
in an area because of the new functions or status that such an area could assume as a

14
result of natural increase or an increase in the number of immigrants and the new
demands that accompany such new function role or status. A decline in population in an
area due to disasters, incidences, epidemics, economic emmigration, economic crisis,
conflicts, economic depression, war, famine and hunger generally reduces the intensity of
land use for whatever purposes and could also modify the land use types in such an area.
The demographics of a particular area i.e. population structure and composition
also determines the land use types and patterns in an area. Different races, tribes, ethnic
groups, nations, age groups and sexes are known to have different needs and therefore
exhibit different land use characteristics and behaviours due to dissimilarities in physical
environment, ideologies and perceptions, historical, cultural and religious beliefs and
backgrounds, poverty and prosperity levels and also their biological differences.
2.22 Economic Growth
Population increase in different parts of the world together with the development
of the monetary economy in such areas had increased the volume and degree of economic
and commercial activities and jobs, the demand for land and the intensity of land uses in
such areas. The adverse effects of economic decline on the other hand can cause
reduction in the population, the economic and commercial activities due to emmigration
or natural decrease and could reduce the intensity of land use or stimulate indiscriminate,
unlawful, inordinate, over-ambitious, unplanned and improper land use behaviours in
such areas.
2.23 Efforts, Plans, Legislations and Policies
Individual and corporate efforts, regional and local plans, policies and legislations
made by constituted authorities based on recommendations from research studies made

15
by different organizations and interest groups prescribes, determines and effects land use
decisions, patterns and schemes. Zoning, preferential tax treatments, purchase of
development rights and Transfer of Development Rights are examples of policies which
influences land use. Zoning is a set of regulation that specify where different land use
types can occur and the magnitude and limits of development of such lands; preferential
tax treatment is given by government to tax payers to preserve land in its current use;
Purchase of development rights involve payment for development rights to land owner of
a valuable land by government or non-profit agency to prevent development of such land
for other uses other than the present use even if it is to be sold by the owner the land use
type must be preserved. Example includes wetlands or wildlife habitats; Transfer of
development rights is given to owners of land who wants more land for a particular use
other than he is allowed by the law, this allows him to secure the right for such an
acquisition from land owners in other areas where such land use is allowed.
2.24 Available Resources
The natural state of the physical environment in terms of soil, climate, topography
and vegetation characteristics determines the characteristics, quality and capability of
such land resource available, what it could be used for (land use type) and the extent to
which it could be used (intensity). A forest may be home to heavy logging activities or
modified into agricultural lands or plantation fields but heavy logging in woodlands and
savanna is not likely due to the fact that the nature of the physical environment does not
support that.
Plantation agriculture might not be feasible in an urban city due to the fact that
there might not be enough land for such a function in a city and because the function and

16
nature of city structures conflicts with agricultural land use of such a magnitude. The
size of lands available and the area covered by a certain land cover type in a particular
location determines the possible land use types and the intensity of such land uses in such
an area.
2.3 Land Use Study
Land use has been studied in a variety of ways depending on what such study is
designed to achieve or what information we intend to produce from such study. The
earliest study of land use attempted the description and explanation of land use patterns
and the prediction of future changes in land use pattern using various models. Such
attempts include Burgess (1925), Hoyt (1939) and Harris and Ulman (1945). Burgess
concentric zone and Hoyt‟s sector model has its use centred around the description and
prediction of changes in basic structure of land use pattern while the multiple nuclei
theory of Harris and Ulman was intended as a summary of the urban land use pattern at a
given point in time. However, the earlier land use model had so many limitations and
their use was criticized by a number of scholars for variety of reasons. Many of them
were only applicable to the study of urban land use; for instance Burgess theory focused
on urban residential patterns while Hoyt and Harris and Ulman only studied the structure
of all urban land use which are not usually applicable in studying the structure of rural
land use. Many of the models were criticized for not been in tune with the reality on
ground in many places but are were only applicable in their places of origin, an example
is the Mann‟s model (1956) patterned according to the history of British cities in the post
second world period and so many of such models were criticized for being myopic in

17
view, not essentially universal and not contemporary with current trends in the present
day world.
Today, more contemporary methods are being used in the study of land use;
unlike earlier methods and models that imposed models of land use pattern on areas and
try to see how land use structure of different areas conform to such models for whatever
advantage they think such models have over the others, more contemporary methods
collects information either directly or indirectly without contact with the land and use
such information collected in producing land use / cover maps, analyzing land use
structures and proffering solutions to problems arising from such land use structures.
2.31 Contemporary land use models
More recently, different models has been adopted by different scholars and
professionals in describing land use patterns and predicting or projecting future land use
and / or land cover depending on nature of their study. However, such models have been
classified into two broad categories: (a) models that predict total land use change for a
region, and (b) models that predict Land Use for specific parcels or grid cells (for vector
images). If the analyst wants to know the total amount of land use change that will occur
in a large region like a state, then the first type of model is appropriate. On the other
hand, if the analyst wants to know where in the region land use change will occur, or to
project what will happen at a specific place, then the second type of model is appropriate.

18
2.311 Models to predict total Land Use
These models predict the total amount of land use or land cover change that will occur
for a region (county, state, etc.), but do not predict where in the region that change will
occur. For example, these models use equations or formulas to predict how much new
development will occur, based on projections of population. A simple model could
assume that for each new resident of a region, a fixed amount of land will be developed.
A more complex model will use an equation to project land use change, based on initial
population, population growth, available land, and other factors.
2.312 Models that predict Land Use for Specific Parcels or Grid Cells
This category of models can be subdivided in three broad categories:
1) Build out analysis, 2) Cellular Automata Models and 3) Agent based models.
2.3121 Build out Analysis
A build out analysis projects future land use based on zoning regulations within the
region of analysis. A build out analysis is used to estimate levels of residential,
commercial and industrial uses that might happen in the future, given a zoning
specification, and to visualize where that development will occur. Build out refers to a
hypothetical future where all the available land has been developed at the maximum
density allowed according to its zoned use.

19
2.3122 Cellular Models
In these models, a region is subdivided into square cells that form a regular grid. For
each cell, an initial land use is measured. The analyst defines a set of rules that describe
the probability that a cell will transition from one land use to another. These rules depend
on the topography of the cell, its proximity via roads and highways to business centers,
and the pattern of land use in neighboring cells. The transition probabilities can be
estimated from historical data on land use. These models can be used to simulate the
spatial pattern of land use change over time.
2.3123 Agent Based Models
In contrast to cellular models, where the focus is on the interaction among neighboring
cells, Agent Based Models focus on the interactions among decision makers (individual
land owners, firms or institutions). Most Agent Based Models combine cellular models,
representing different land uses in the study area, with a model representing human
behavior. For example, an agent based model might simulate the decisions made by a
large number of farmers, each of whom is considering converting their farm to housing.
Because the price of vacant land depends on how much of it is available, each farmer‟s
decision affects the profits of all the other farmers.
In contemporary times, before producing maps of land use, a proper study of such
lands are done by field surveys; during such field surveys, a classification or
categorization schemes is chosen to suit the purpose of such study and such classification
schemes are used in generalizing, characterizing and classifying lands into land use types

20
and in determining the extents of such land use types. Information gotten from such
surveys are used in producing land use classification maps which are used in stock
taking, land use analysis and future land use planning.
2.32 Classification Schemes
A Classification scheme is a set of rules used during land use surveys for generalizing;
characterizing and classifying lands into land use / cover types. A primary component of
mapping land use and land cover is adopting or developing a land cover classification
system or schemes. There are many land use and land cover classification schemes and
many of them are designed specifically for use with remotely sensed data. Many of these
classification systems often resemble or incorporate other classification systems in order
to maintain cohesiveness and allow for data integration. A hierarchical framework is
often implemented within such classification system; this type of framework allows the
level of detail to vary for different project scopes and for the creation land use and land
cover categories that are compatible with other classification systems (Foti et al, 1994).
Many of these schemes are based on a classification level system developed by James
Anderson and coauthors in 1976 for different scales of study.
Different organizations set up their classifications differently, because they are
interested in different aspects of land use and land cover. An organization whose mission
involves local economic development will want to distinguish between a school and an
office building, but may not care about the difference between cropland and forests while
an organization whose mission involves storm water management may distinguish
between cropland and forests but not between a school and an office building.

21
Anderson et al (1967) developed a hierarchical land use and land cover classification
system for utilization with remote sensor data which has been adopted by the U.S.
Geological Survey for 1:250,000 and 1:100,000 scale land use and land cover mapping of
the United States. The Anderson classification system and or Anderson derived land use
and land cover classifications have been adopted in most contemporary land use and land
cover research utilizing remotely sensed satellite data.
A hierarchical classification framework is composed of different levels of land use
categories which are dependent upon the level of detail required by the project scope.
Level I categories are often broad classification categories with examples such as urban,
forest, agricultural land, and water classes. Level II categories offer more detail and are
usually subdivisions of the level I categories. Examples of level II categories are
coniferous forest, deciduous forest, and possibly mixed forest classes. Level III categories
are often employed in local studies which incorporate species level land classes such as
oak hickory forest or oak hickory pine forest (Anderson et al, 1976).
Anderson‟s classification combines information on land use and land cover, placing all
land into one of 9 level-I categories:
Anderson Level-I Categories
1. Urban or Built Up Land
2. Agricultural Land
3. Rangeland
4. Forest Land
5. Water

22
6. Wetland
7. Barren Land
8. Tundra
9. Perennial Snow or Ice
Subcategories make finer distinctions. For example, Level-I Category 1 (Urban Land)
could be divided into Level-II subcategories such as:
One Possible Set of Level-II Subcategories
11. Low density residential
12. Medium density residential
13. High density residential
14. Commercial
15. Industrial
16. Institutional
17. Extractive
18. Open urban land, including parks and golf courses
Each of these subcategories also can be divided. For example, Level-II subcategory 14
(Commercial) could be divided to distinguish between office buildings and shopping
malls, or to distinguish among commercial buildings associated with different industries
(retail, health care, etc.).
The user has to be careful when comparing two different land use maps, because Level-
II categories can differ from map to map. Some maps even use different Level-I

23
categories. Land use data obtained at any level of categorization certainly is not restricted
to any particular level of user groups or to any particular scale of presentation. Information
at Levels I and II would generally be of interest to users who desire data on a nationwide,
interstate, or statewide basis but more detailed land use and land cover data such as those
categorized at Levels III and IV usually will be used more frequently by those who need
and generate local information at the intrastate, regional, county/local government or
municipal level. It is intended that these latter levels of categorization will be developed by
the user groups themselves, so that their specific needs may be satisfied by the categories
they introduce into the structure.
On a small scale land use characterization can be done by a team of surveyors but these
is not practical on large scale; on a large scale, it is can done by land owner surveys which
involves determining the land use or land cover for each land parcel using appropriate land
use classification schemes. This has been done by organizations such as Census of
Agriculture surveys that is conducted every five years in every farm in the United States
where the quantity of land that a land owner has in different agricultural uses is mapped
other parcel specific mapping include the local Tax Assessment survey which is done to
determine the property taxes for each parcel and also state-wide mappings undertaken by
State Governments to maintain parcel maps showing national, state and local parks,
national and state forests, and agricultural lands. For example, Maryland State in the
United States maintains a state-wide parcel-specific database on land use.
However, the large scale land use characterization method used more contemporarily
is the use of Remote Sensing Capabilities. It usually involves the use of pictures taken by

24
satellites and by airplanes to determine the land use and land cover for each piece of
land. This can involve someone mere looking at an aerial photo with a magnifying glass
or the use of computers in processing of data from hundreds of satellite images.
2.33 Use of Remote Sensing Capabilities
Before we can effectively capture the use of remote sensing, we need to ask ourselves
what remote sensing is all about.
2.331 What Is Remote Sensing?
Remote Sensing is the science and art of obtaining information about an object, area,
or phenomenon through the analysis of data acquired by a device that is not in contact
with object, area, or phenomenon under investigation (Lillesand and Kiefer, 1987). Some
others define it as the art, science and technology of obtaining information about an
object, area, or phenomenon without coming in contact with them, through the analysis of
Electromagnetic Energy. The Groupement pour le Development de la Teledetection
Aerospatiale (GDTA) journal of Remote Sensing (1990) titled Remote Sensing defines it
as the name given to the family of techniques used to observe the earth from a distance
and to process the data obtained concerning terrestrial objects.
Acquiring information about the Earth's surface without actually being in contact with
it (Remote Sensing) is a reading process where sensors detects or senses and records
reflected or emitted energy or electromagnetic radiation from the earth‟s surface,
processes, analyzes, and applies those information.
Remote sensing systems which measure energy that is naturally available are called
passive sensors. Passive sensors can only be used to detect energy when the naturally

25
occurring energy is available. For all reflected energy, this can only take place during the
time when the sun is illuminating the Earth. There is no reflected energy available from
the sun at night. Energy that is naturally emitted (such as thermal infrared) can be
detected day or night, as long as the amount of energy is large enough to be recorded.
Active sensors, on the other hand, provide their own energy source for illumination. The
sensor emits radiation which is directed toward the target to be investigated. The
radiation reflected from that target is detected and measured by the sensor. Advantages
for active sensors include the ability to obtain measurements anytime, regardless of the
time of day or season. Active sensors can be used for examining wavelengths that are not
sufficiently provided by the sun, such as microwaves, or to better control the way a target
is illuminated. However, active systems require the generation of a fairly large amount of
energy to adequately illuminate targets. Some examples of active sensors are laser
fluorosensor and synthetic aperture radar (SAR).
Multispectral sensors acquire multiple images of the same target object at different
wavelengths (bands). Each band measures unique spectral characteristics about the target.
A spectral band is a data set collected by the sensor with information from discrete
portions of the electromagnetic spectrum.
In much of remote sensing, the process involves an interaction between incident
radiation and the targets of interest by the use of imaging systems although it also
involves the sensing of emitted energy and the use of non-imaging sensors which collects
data in diverse other forms other than electromagnetic radiation distributions; such forms
may include force distribution, acoustic wave distributions. The seven major elements
involved in remote sensing are described as follows

26
1. Energy Source or Illumination - the first requirement for remote sensing is to have
an energy source which illuminates or provides electromagnetic energy to the target of
interest.
2. Radiation and the Atmosphere – as the energy travels from its source to the target, it
will come in contact with and interact with the atmosphere it passes through. This
interaction may take place a second time as the energy travels from the target to the
sensor.
3. Interaction with the Target - once the energy makes its way to the target through the
atmosphere; it interacts with the target depending on the properties of both the target and
the radiation.
4. Recording of Energy by the Sensor- after the energy has been scattered by, or
emitted from the target, we require a sensor (remote - not in contact with the target) to
collect and record the electromagnetic radiation.
5. Transmission, Reception, and Processing- the energy recorded by the sensor has to
be transmitted, often in electronic form, to a receiving and processing station where the
data are processed into an image (hardcopy and/or digital).
6. Interpretation and Analysis - the processed image is interpreted, visually and/or
digitally or electronically, to extract information about the target which was illuminated.
7. Application- the final element of the remote sensing process is achieved when we
apply the information we have been able to extract from the imagery about the target in
order to better understand it, reveal some new information, or assist in solving a
particular problem. These seven elements comprise the remote sensing process from
beginning to end.

27
Electromagnetic energy may be detected either photographically or electronically. The
photographic process uses chemical reactions on the surface of light-sensitive film to
detect and record energy variations. It is important to distinguish between the terms
images and photographs in remote sensing. An image refers to any pictorial
representation, regardless of what wavelengths or remote sensing device has been used to
detect and record the electromagnetic energy. A photograph refers specifically to images
that have been detected as well as recorded on photographic film. Photos are normally
recorded over the wavelength range from 0.3 μm to 0.9 μm - the visible and reflected
infrared. Based on these definitions, we can say that all photographs are images, but not
all images are photographs. Therefore, unless we are talking specifically about an image
recorded photographically, we use the term image.
A photograph could also be represented and displayed in a digital format by
subdividing the image into small equal-sized and shaped areas, called picture elements or
pixels, and representing the brightness of each area with a numeric value or digital
number. The computer displays each digital value as different brightness levels. Sensors
that record electromagnetic energy, electronically record the energy as an array of
numbers in digital format right from the start. These two different ways of representing
and displaying remote sensing data, either pictorially or digitally, are interchangeable as
they convey the same information (although some detail may be lost when converting
back and forth).
As the human eyes see colour because it detects the entire visible range of
wavelengths and our brains process the information into separate colours so does sensors,
they only see very narrow ranges of wavelengths or colours. The information from a

28
narrow wavelength range is gathered and stored in a channel, also sometimes referred to
as a band. We can combine and display channels of information digitally using the three
primary colours (blue, green, and red). The data from each channel or band is represented
as one of the primary colours and, depending on the relative brightness (i.e. the digital
value) of each pixel in each channel, the primary colours combine in different proportions
to represent different colours. When we use this method to display a single band or range
of wavelengths, we are actually displaying that band through all three primary colours
because the brightness level of each pixel is the same for each primary colour, they
combine to form a black and white image, showing various shades of gray from black to
white. When we display more than one channel or band each as a different primary
colour, then the brightness levels may be different for each channel/primary colour
combination and they will combine to form a colour image.
The three remote Sensing modes widely used in environmental surveys today are, the
aerial photographs or images, (camera remote sensing) the satellite and radar imagery.
However it should be noted that the term “images” and “imageries” are essentially the
same as they are both pictorial representation of detected and recorded electromagnetic
energy but their basic difference is the platform (moving or stationary medium on which
images or imageries are taken) from which they are taken. Images are usually products of
the platforms such as the human eye and camera platform while imageries are usually
products of radar and satellite platforms. Products of radar and satellite platforms can be
loosely referred to as images but products of the human eye and camera platforms cannot
at any instance be referred to as imageries.

29
Less commonly used remote sensing modes in developing countries is the satellite and
radar remote sensing, but the least used is the radar remote sensing. We are going to be
examining the two mostly used remote sensing modes in developing nations like ours
which is the camera and satellite remote sensing.
2.3311 Camera Remote Sensing
This basically involves taking aerial photographs either at a near vertical or vertical or
low or high oblique angles from the kill of camera attached to specially adapted moving
aircrafts, helicopters, air balloons or parachutes which are analyzed and interpreted using
colour, tone, size, shape and textural properties. The products of camera remote sensing
are aerial photographs and topographical maps. Topographic maps are made by merging
sequences of aerial photographs or images using a stereoscope which enables us to see
perfect coincidence of overlaps of aerial photographs in Three-Dimensions. Types of
aerial photographs are known these include Panoramic, convergent, multi spectral and
continuous strip photographs. Both topographic base map and aerial photographs are used
in georeferencing (marking ground control point that had been accurately taken on the
field or accurately marked on an aerial photo or topographic base map on a satellite
imagery and inputing the geographical coordinates to register geographical coordinates of
sampled features on digital satellite imagery). Aerial photographs can be panchromatic
i.e. Black and white (B/W), Infrared (IR) black and white, Colour infrared (C.I.R.), and
colour photographs.
2.3312 Satellite Remote Sensing
Satellite remote sensing involves taking of imageries from heights above the ground
using via artificially erected space platforms called satellites at angles which may be

30
vertical or oblique. Remote sensors on space platforms are programmed to operate in
different atmospheric windows or electromagnetic bands and make measurements using
detectors tuned to these specific wavelength frequencies which pass through the
atmosphere. Spectral reflectance characteristics of common earth surface materials are
located within the visible and near to mid-infrared range (Richards, 1986).
In most contemporary land use studies which employ remote sensing imagery from
multispectral sensors, the foremost task is the observation of spectral characteristics of
measured electromagnetic radiation from a target or landscape. Analysts develop
signatures based upon the detected energy‟s measurement and position in the
electromagnetic spectrum. A signature is a set of statistics that defines the spectral
characteristic of a target phenomenon or training-sites. Image analysts determine the
measurement of signature separability by determining quantitatively the relation between
class signatures. Signatures are refined by improved ground-truth and accuracy
assessment analysis. By utilizing the developed signatures in multispectral classification
and thematic mapping, the analyst generates new data for analysis (ERDAS, 1999).
Today, remote sensing image data of the Earth‟s surface acquired by spacecraft
platforms is readily available in a digital format. Digital remote sensing systems convert
electromagnetic energy (color, light, heat, etc…) to a digital form. Spatially, the data is
composed of discrete picture elements, or pixels, and radiometrically it is quantized into
discrete brightness levels (ERDAS, 1999). The great advantage of having data available
digitally is that it can be processed by computer either for machine assisted information
extraction or for the enhancement by an image interpreter.

31
Resolution is an important term commonly used to describe remotely sensed imagery.
Resolution is the quality or property of a pixel unit of an image or imagery. However,
there are four distinct types of resolution that must be considered. These four types of
resolution are spatial, spectral, radiometric, and temporal. These resolution characteristics
help to describe the functionality of both remote sensing sensors and remotely sensed
data. The ERDAS, Earth Resources Data Analysis System, Field Guide (1999) further
describes each type of resolution as described below.
Spatial resolution is the minimum size of terrain features that can be distinguished
from the background in an image, or the ability to differentiate between two closely
spaced features in an image. It is also defined by the area on the ground that a pixel
represents in a digital image file. Large scale in remote sensing refers to imagery in
which each pixel represents a small area on the ground. Small scale refers to imagery in
which each pixel represents a large area on the ground.
Spectral resolution refers to the number and dimension of specific wavelength
intervals in the electromagnetic spectrum to which a sensor or sensor band is sensitive or
can record. Wide intervals in the electromagnetic spectrum are referred to as coarse
spectral resolution, and narrow intervals are referred to as fine spectral resolution.
Radiometric resolution refers to the dynamic range, or number of possible data files
values in each band. This is referred to by the number of bits into which the recorded
energy is divided. The total intensity of the energy, from 0 to the maximum amount, the
sensor measures is broken down, for example, into 256 brightness values for 8-bit data.

32
The data file values range from 0, for no energy return, to 255, for maximum return, for
each pixel. Landsat TM imagery is classified as 8-bit data.
Temporal resolution is a measure of how often a given sensor system obtains imagery
of a particular area, or how often an area can be revisited. The temporal resolution of
satellites is on a fixed schedule. The fixed schedule of satellites allows for more repetitive
views. This revisit capability makes it possible to use several passes, perhaps covering
two or three seasons or multiple years, for interpretation. In addition, new satellite
technology is incorporating pointable or directional sensors allowing for even quicker
revisit capabilities. Temporal resolution is an important factor to consider in change
detection studies. Landsat 5 can view the same area of the globe every 16 days (Wilkie &
Finn, 1996).
Remote sensing has become an important tool applicable to developing and
understanding the global, physical processes affecting the earth. As current trends
continue, additional and higher resolution satellites will become available providing the
means to produce more accurate land use and land cover maps characterized by finer
levels of detail.
2.332 Limitation of the Remote sensing Imageries
Remotely sensed imageries are one of the most important sources of spatial data for
environmental studies. They are images obtained by remotely placed sensors located at
variable heights in orbits level. Remotely sensed data allows land use and land cover to
be mapped quickly, relatively cheaply and when frequently needed. With improved

33
mapping of rapidly changing areas, planners and researchers will be able to better address
issues associated with land use analysis. However the type of data used has influence on
the accuracy of the classification. Each remote sensing application has specific demands
on the amount of area to be covered, the frequency with which measurements will be
made, and the type of energy that will be detected. Thus, a sensor must provide the
spatial, spectral, and temporal resolution necessary to meet the needs of the application.
While it is commonly thought that greater spatial resolution is the key to better land use
classification, finer spectral and radiometric resolution also have potential advantages
that remain only partially explored. (Cushnie, 1987).
Some of the most commonly used remote sensing data sets for mapping land use
and land cover in developing countries including Nigeria are those from Landsat, SPOT
and more recently, NigeriaSat-1 satellites The Landsat sensors are known to have greater
spectral resolution and a longer time series, while SPOT provides better spatial
resolution. Less traditional sensors may provide additional information that can improve
mapping accuracy. The NigeriaSat-1 has 3 spectral bands as compared 6 bands for
Landsat (not including the thermal band) and 4 bands for SPOT‟s multispectral scanner.
(Salami, A.T. et al, 1999).
Among the factors that may influence classification accuracy are a sensor‟s
spatial, radiometric and spectral resolutions. Spatial resolution describes the size each
pixel represents in the real world. For example, a satellite with 30 m resolution produces
pixels that measure a 30 x 30 m area on the ground. Radiometric resolution, in contrast,
is the smallest difference in brightness that a sensor can detect. A sensor with high
radiometric resolution has very low noise. Finally, spectral resolution is the number of

34
different wavelengths that a sensor can detect. A sensor that produces a panchromatic
image has very low spectral resolution, while one that can distinguish many shades of
each colour has high spectral resolution.
Generally, spatial resolution is accepted as the most important factor of the three
for land use and land cover definition. For example, a study in Indonesia showed that
SPOT Multispectral (XS) images are better than Landsat Multispectral Scanner (MSS)
images for mapping of heterogeneous near-urban land cover because of SPOT‟s superior
spatial resolution (Gastellu-Etchegorry 1990). In heterogeneous areas, such as
residential areas, it has been shown that classification accuracies may improve by up to
20% as spatial resolution increases (Cushnie, 1987). This occurs due to the potentials of
urban features to blend together to form composite distinctive “urban signals” that can be
distinguished from other land covers.
Spectral resolution also affects the ease and reliability of land use classification.
For example, in the mapping of farmland and urban land uses in New Zealand (Gao and
Skillcorn 1998), used the Multi-spectral SPOT XS, because of its ability to reveal
vegetative land covers with its high spatial resolution. In cases where different land uses
have similar but separable spectral resolution, High spectral resolution will likely
improve mapping accuracy when land uses are spectrally inseparable (Cushnie, J.L.
1987).
However, most developing countries are constrained by shortage of funds and are
therefore unable to acquire the most appropriate data types for various purposes. In
Nigeria, the three types Landsat, SPOT and NigeriaSat-1 are the most readily accessible.
Landsat products up to 2003 are available almost without any costs, SPOT-1 data are also

35
fairly commonly used as one of the first generation of high resolution imageries, made
available commercially by SPOT IMAGE Company and NigeriaSat-1 data are owned by
the Nigerian Government, also available without any cost. These images are of coarse
resolution but are the ones most readily accessible to researchers in Nigeria.
Available spectral bands either singly or as combined composites cannot reveal all
information needed for a particular study, therefore they have to be displayed correctly or
combined correctly to reveal information needed for particular studies .For instance
Landsat Thematic Mapper sensor record electromagnetic radiation in seven bands. Bands
1, 2, and 3 are in the visible portion of the spectrum. Bands 4, 5, and 7 are in the
reflective-infrared portion of the spectrum. Band 6 is in the thermal portion of the
spectrum. The following list describes each of the seven TM bands and the information
they reveal:
Band 1 – Visible Blue, 0.45 – 0.52 um; useful for mapping coastal water areas,
differentiating between soil and vegetation, forest type mapping, and detecting cultural
features.
Band 2 – Visible Green, 0.52 – 0.60 um, the green colour Corresponds to the green
reflectance of healthy vegetation. It is also useful for cultural feature identification.
Band 3 – Visible Red, 0.63 – 0.69 um; useful for discriminating between many plant
species. It is also useful for determining soil boundary and geological boundary
delineations as well as cultural features.

36
Band 4 – Reflective - infrared, 0.76 – 0.90 um; this band is especially responsive the
amount of vegetation biomass present in a scene. It is useful for crop identification and
emphasizes soil/crop and land/water contacts.
Band 5 – Mid - infrared, 1.55 – 1.74 um; this band is sensitive to the amount of water
in plants, which is useful in crop drought studies and in plant health analyses. This is also
one of the few bands that can be used to discriminate between clouds, snow, and ice.
Band 6 – Thermal - infrared, 10.40 – 12.50 um; this band is useful for vegetation and
crop stress detection, heat intensity, insecticide applications, and for locating thermal
pollution. It can also be used to locate geothermal activity.
Band 7 – Mid - infrared, 2.08 – 2.35 um; this band is important for the discrimination
of geologic rock type and soil boundaries, as well as soil and vegetation moisture content.
Different combinations of the TM bands can be displayed to create different
composite effects. The following combinations are commonly used to display images:
Bands 3, 2, and 1 create a true color composite. True color means that objects look as
though they would to the naked eye, similar to a photograph. Bands 4, 3, and 2 create a
false color composite. False color composites appear similar to an infrared photograph
where objects do have the same colors or contrasts as they would naturally. For instance,
in an infrared image, vegetation appears red, water appears navy or black. Bands 5, 4, and
2 create a pseudo color composite. (A thematic image is also a pseudo color image.) In
pseudo color, the colors do not reflect the features in natural colors. For instance, roads
may be red, water yellow, and vegetation blue. With the adequate knowledge of band

37
properties and the appropriate combination of Landsat TM bands, the extraction of
numerous themes, land use and land cover classes; can be achieved for various mapping
applications.
2.333 Problem of Remote Sensing In Developing Countries
The development of Remote Sensing techniques in the third world countries has
met with several problems. Some of these can be discussed under inadequate
infrastructure, inadequate financing, inadequate expertise and lack of technological
awareness. (Onyebuchi, 1993).
Infrastructure development involving the provision of material, finances and
manpower is the pivot on which the success of any technology resolve. Monitoring of the
environment including earth‟s natural resources need time-based data. Absence of recent
aerial photographic coverage of Nigeria at the Federal Surveys Department makes studies
and mapping of selected parts of the country difficult. Basic interpretation instrument like
pocket and mirror stereoscopes for teaching are by far too small in number in the tertiary
institutions. The acute shortage of equipment for digital image processing with
appropriate hardware and software system for research and teaching at higher degree
levels makes large scale adoption and meaningful contribution to the development and
utilization of the technology seemingly unattainable. Associated with equipment shortage
and maintenance is the persistent problem of unstable electric power supply which is
capable of causing serious damage to electronic hardwares.
The launching of Nigeria Sat 1 and the location of a Ground receiving Station in
Abuja for regular and sequential acquisition of images covering the country encourages

38
the present trends of acquisition of scenes on selective basis. However this is the only
satellite owned by a West African country and just one of the three owned by an African
country (others being Algeria and South Africa). Abuja Base Station is also the only
ground receiving station in Nigeria and the whole of West Africa; these are grossly
insufficient for data acquisition in the sub-region. This means that vast areas are neither
studied nor monitored for many years.
Dearth of Remote sensing specialists in various organizations employing the
techniques affects the growth of technology. Lacks of necessary equipment in tertiary
institutions also limit the scope of training where specialists are available. To cope with
the enormous environmental, earth and land resources management challenges of these
third world countries, more local Remote Sensing scientist with different background
need to be trained. Also the inability of some organizations and establishment to maintain
available equipments due to low technological competence handicaps the growth of the
technology.
Another problem is inadequate financing. Non-acquisition of remote sensing facilities
is linked to inadequate financing and prohibitive costs involving foreign exchange since
they are not locally made. Inability of research agencies to initiate researches into current
environmental degradation and natural resources conservation are to be blamed on
inadequate allocation of funds.
The insufficient utilization of Remote sensing technology in many developing
countries has been ascribed to lack of adequate awareness on the new technology among
those who allocate funds, manage resources, control advanced education and influence
professional careers. However, the development of remote sensing technologies in

39
developing countries can be achieved by a conscious effort by Government, private and
Non-Governmental organizations to increase their spending on sponsoring of training
programmes and organizing of short-term training courses on remote sensing
technologies, purchase and installation of necessary infrastructure, creation of awareness
at all levels and the channeling of such funds to the appropriate quarters.

40
METHODOLOGY
3.1 Materials Required
1. A Satellite imagery of Ile-Ife for classification
2. A Road map or Topographical map of Ile-Ife for Georeferencing
3. Computer System Unit with motherboard rating of not less than Pentium III
and operating System, Windows XP is advised because of the incompatibility (inability
of) of most of the available application softwares to work with lower version of
operating systems. It is the electronic platform for data classification, analysis and
presentation
4. Applications softwares (i) Image processing softwares used include ERDAS
IMAGINE 9.1 and ILWIS 3.2 for image processing operations, ILWIS 3.2 and ArcGIS
3.2a for image digitizing and vectorization, GEOCAL for conversion of coordinates
from one coordinate system to the other for Georeferencing and Microsoft Excel for
collating, recording and display of coordinate data. They are software programs written
for solving data classification and analysis problems (ii) Presentation and animation
softwares such as Microsoft PowerPoint, Macromedia Flash 8. They are software
programs written for the purposes of making general presentations and visualization of
changes using animated sequences.
5. Optical Scanners and digitizing tables of different sizes A4, A3, A2, A1 and
A0 for imputing images of aerial photographs and topographic base maps into the
computer.
6. Standard Garmin 12 GPS for marking coordinates of points in the field for
georeferencing of satellite imagery.

41
3.2 Methodology
The workflow of the methodology of this study like any other GIS-based study
is compartmentalized into three phases namely
(i) Data Collection
(ii) Image processing
(iii) Geo-Presentation
3.21 Data collection
This phase of the study requires the collection of both primary and secondary
data.
3.211 Primary Data
The primary data collected for this study were done by an initial reconnaissance
survey (Recce) followed by an intensive land use survey involving taking of GPS
readings of various locations in Ile-Ife and visual categorization of land uses in Ile-Ife.
3.2111 Reconnaissance Survey (Recce)
This involves an inventory of land resources, uses and management in the
study area with a view of capturing the spatial patterns of these features. The survey is
also used in updating the topographic base map of the area.
3.2112 Land Use Field survey
The old approach to land use/cover type in many parts of the developing world
involves the use of aerial photographs complemented with the traditional ground survey
techniques. The ground surveying provides the sample data which are used to interpret
the aerial coverage of the whole area of interest. This approach is however laborious,
time consuming and less reliable in terms of accuracy. They involve moving along and

42
across defined traverses all over the area to be surveyed at a walking speed but more
contemporarily used today is the taking of exact positions (elevations, latitude and
longitudes) of places using more accurate and less laborious ground remote sensing
device called Global Positioning Systems (GPS) which takes the coordinates of points
using the earth‟s electromagnetic field to pick up satellite signals for accurate
measurements of particular points on the earth at a very appreciable accuracy or error
level; usually below 10m. GPSs have different characteristics and different accuracy
levels.
The GPS readings of coordinates of highly conspicuous urban features such as
road junctions, turnings and T-junctions were taken for the georeferencing of the digital
imagery and creation of land use layers. Land use Survey also involves the
categorization of lands into their different uses.
3.21121 Land Categorization
The categorization of lands into their various uses is an essential part of the field
study and they are usually done by visual evaluation using a set of principles derived
from various categorization schemes. The most widely endorsed and used
categorization scheme is the Anderson‟s classification system; it has been certified by
the UN for most of their land characterization studies.
Most categorization schemes used in land characterization are hybrids of
different other categorization schemes, they are usually user tailored to meet the user‟s
demand and purposes of study.
3.211211 Land Categorization Principles

43
As generally prescribed by most categorization scheme used, Urban or Built-up
Land should comprise of areas of intensive use with much of the land covered by man-
made structures. Included in this category are cities, towns, villages, strip developments
along highways, transportation, power, and communication facilities, and areas such as
those occupied by mills, shopping centers, industrial and commercial complexes, and
institutions that may, in some instances, be isolated from urban areas like OAU is to
Urban Ile-Ife.
As development progresses, lands located in the midst of urban or Built-up areas
having less intensive or nonconforming uses are generally included in the urban or
built-up category. Agricultural land, forest, wetland, or water areas on the fringe of
urban or Built-up areas are not included except where they are surrounded and
dominated by urban development. The Urban or Built-up category takes precedence
over others when the criteria for more than one category are met. For example,
residential areas that have sufficient tree cover to meet Forest Land criteria will be
placed in the Residential category.
Residential land uses range from high density, represented by the multiple-unit
structures of urban cores, to low density, where houses are on plots of more than an
acre, on the periphery of urban expansion. Linear residential developments along
transportation routes extending outward from urban areas included in the residential
land category.
Areas of sparse residential land use, such as farmsteads are included in
categories to which they are related. In some places, the boundary will be clear where
new housing developments are adjacent to intensively used agricultural areas, but the

44
boundary may be vague and difficult to discern when residential development occurs in
small isolated units over an area of mixed or less intensive uses. Residential sections
which are integral parts of other uses may be difficult to identify but however, housing
situations such as those existing on military bases, at colleges and universities, living
quarters for laborers near a work base, or lodging for employees of agricultural field
operations or resorts are placed within the Industrial, Agricultural, or Commercial and
Services or institutional categories to which they belong.
Areas used predominantly for the sale of products and services are regarded as
Commercial areas. They are often adjoined by residential, agricultural, or other
contrasting uses which help to sustain them. Components of the Commercial and
Services category are urban central business districts, shopping centres in suburban and
outlying areas, junkyards, resorts, commercial strip developments along major
highways and access routes to cities like Gbagi in Ibadan; and so forth. The main
buildings, secondary structures and areas supporting the basic use are all included, they
include office buildings, warehouses, driveways, sheds, parking lots, landscaped areas
and waste disposal areas. Commercial areas may include some noncommercial uses too
small to be separated out. Central business districts commonly include some
institutions, such as churches and schools, and commercial strip developments may
include some residential units. When these noncommercial uses exceed one-third-of the
total commercial area, the Mixed Urban or Built-up category is used. There is no
separate category for recreational land uses since most recreational activity is pervasive
throughout many other land uses.

45
Recreational facilities that form an integral part of an institution should be
included as institutional land use category. The intensively developed sections of
recreational areas would be included in the Commercial and Services category. Various
educational, religious, health, correctional, and military facilities are also components of
Institutional land uses. All buildings, grounds, and parking lots that make up the facility
are included within the institutional unit, but areas not specifically related to the purpose
of the institution should be placed in the appropriate category. Auxiliary land uses,
particularly residential, commercial and services, and other supporting land uses on a
military base would be included as institutional land use category, but agricultural areas
that are not specifically associated with correctional, educational, or religious
institutions are placed in the appropriate agricultural category. Institutional units such as
churches, secondary and elementary schools would be mapable only at scales large
enough for such consideration and will usually be included within another category,
such as Residential or commercial as deemed fit.
Industrial areas are areas with a wide array of land uses ranging from light
manufacturing to heavy manufacturing plants. Light industries are differentiated from
heavy industries based on the type, number and density of building dedicated to the use,
the intensity of trucking service that the industry requires and uses, the volume of
threshold capital needed to start and run such industry effectively, the sophistication of
labour, equipments and technology employed, the volume of market and labour it
attracts and the value complexity and relative importance of the products being
manufactured.

46
Light industrial areas use relatively cheap and easily gotten raw materials such
as food substances, plant extract, earth materials and soil substances, their products are
usually less expensive processed food products, artworks, crafts etc. Heavy industries
use raw materials such as iron ore, timber, or coal. Included in this category are steel
mills, pulp and saw mills, electric power generating stations, oil refineries and tank
farms, chemical plants, and brick making plants. Stockpiles of raw materials and waste-
product disposal areas are usually visible, along with transportation facilities capable of
handling heavy materials.
Surface structures associated with mining operations are included in the
industrial category. Surface structures and equipment may range from a minimum of a
loading device and trucks to extended areas with access roads, processing facilities,
stockpiles, storage sheds, and numerous vehicles. Spoil material and slag heaps usually
are found within a short trucking distance of the major mine areas and may be the key
indicator of underground mining operations.
Transportation, Communications, and Utilities uses occur to some degree within
all of the other Urban or Built up categories; they usually are considered an integral part
of the land use within which they occur and can only be mapped separately at an
exceedingly large scale.
Farmsteads intermixed with strip or cluster settlements will be included within
the built-up land, but other agricultural land uses should be excluded. Mixed Urban or
Built-up areas consist of varieties of land uses, all of which occur so significantly as to
make classification under one particular use difficult.

47
3.212 Secondary Data
The data from other sources used for this study are images already taken at
heights near ground and far from the ground by camera sensors and imageries taken at
great heights via satellite sensors. Some of the data are obtainable in raw form while
some others have been pre-processed (radiometrically and geometrically corrected, and
georeferenced) for image analysis. However, the Secondary data used for this study
include Landsat Enhanced Thematic Mapper (ETM) 2002 imagery of Ile-Ife which was
obtained from the Centre for Space Science and Technology Education, OAU, Ile-Ife
and the electronic Road map of Ile-Ife which was obtained at The Department Of
Geography, OAU, Ile-Ife.
3.22 Image Processing
3.221 Pre-Processing
These are adjustment processes undergone at the base stations immediately after
data acquisition by satellite sensors. They are designed to adjust the resolution, clarity
(picture quality) and formats of imageries acquired to suit the studies they are to be used
for. Pre-processing adjusts the effect of natural and environmental phenomenon on
imageries; they include the reduction of noise effects from noise, vibration, cloud cover,
smog, smoke, sun burn, sun shade, strong wind and downpour. This could be done
using softwares such as ERDAS Imagine 9.1; ILWIS usually pre-processes file
automatically when creating bands during color separation processes.
They include: (i) Radiometric Enhancement (ii) Geometric Enhancement
Radiometric Enhancement: Linear stretching and filtering of low contrast
images for easier visualization

48
Geometric Enhancement: Conversion of images from satellite download formats
to readable formats.
3.222 Classification
There are two major methods of classifications built into image processing
softwares; they include
(i) Unsupervised (automatic) classification
(ii) Supervised classification
3.2221 Unsupervised (automatic) classification
The basic idea is that the computer separates the image using information
theory, into a classification that „best‟ (in an information-theoretic sense) differentiates
pixels. This method is however not used most of the time because it usually does not do
the classification according to that which had been accurately done on the field using
appropriate categorization or classification schemes; it may combine classes which may
not be necessarily compatible. The most reliable and widely accepted method of image
classification is the Supervised Classification.
3.2222 Supervised classification Method
The basic idea of this method is to train the computer to recognize landscape
elements by their spectral signatures in a particular band, assuming that we know what
is where in some training sites. For the purpose of this study, we will be using
Supervised Classification.
3.223 Pre- Classification
Before supervised classification can be done in ILWIS 3.2, there are pre-
classification processes that we have to embark on; they include

49
(i) Loading of the Coordinate system
(ii) Colour separation
(iii) Map List Creation
(iv) Georeferencing
(v) Domain or Class Creation
(vi) Sample Set Creation
(vii) Training of sites
To begin working with ILWIS 3.2, the following procedure is to be followed:
1. Click on the Start Button,
2. Go to All Programs
3. Navigate to ILWIS 3.2 Academic sub Menu and Click ILWIS 3.2 in the
Pop-up Menu.

50
Fig 2: Procedure 1
3.2231 Loading of the Coordinate System
This is done to load the appropriate coordinate system for the study been
undertaken. For Nigeria, the coordinate projection we use is UTM, the ellipsoid is
CLARKE 1880, the datum is Minna Nigeria and the Zone Number 31. It is done
following the procedures described below:
1. Click the file menu.
2. Navigate to coordinate system and click it.
3. A dialog box appears.

51
Fig 3: Procedure 2
4. Click on CoordSystem Projection and click OK.
5. It shows a new dialog box that helps you define the new coordinate projection
you intend to use.

52
Fig 4: Procedure 2
6. Click the projection button to chose the appropriate projection; in this case it
is the UTM.
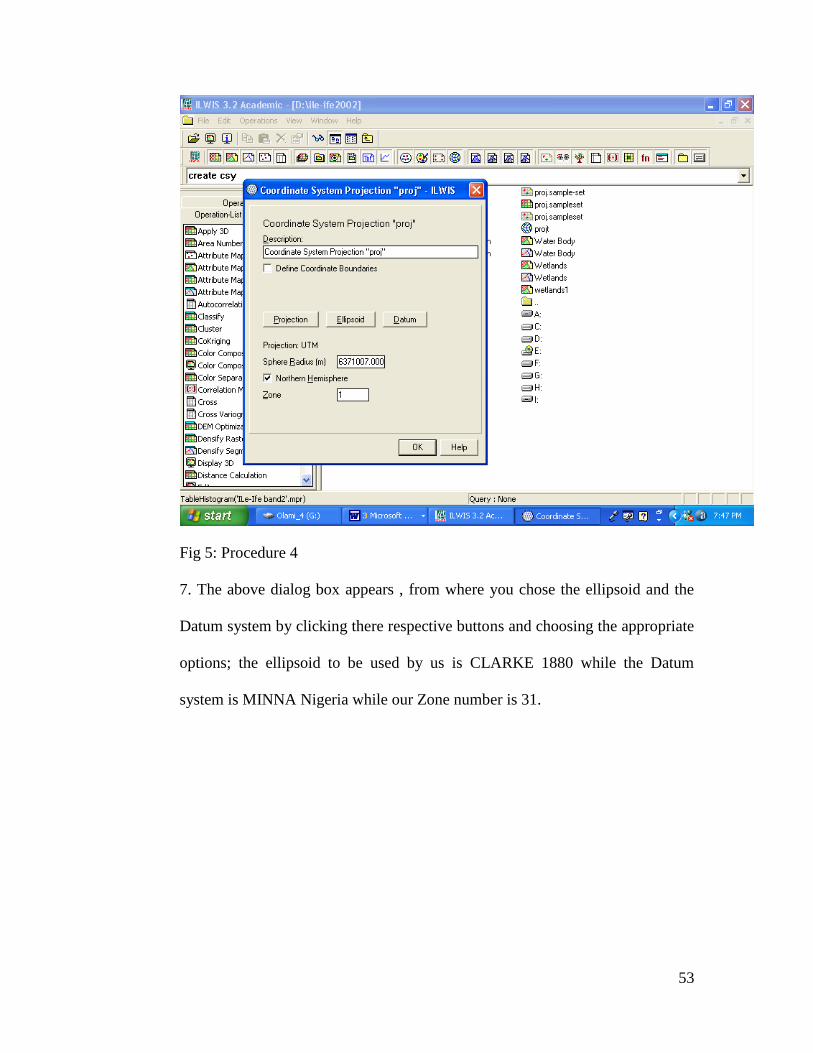
53
Fig 5: Procedure 4
7. The above dialog box appears , from where you chose the ellipsoid and the
Datum system by clicking there respective buttons and choosing the appropriate
options; the ellipsoid to be used by us is CLARKE 1880 while the Datum
system is MINNA Nigeria while our Zone number is 31.

54
Fig 6: Procedure 5
8. Choose the ellipsoid applicable Clarke 1880.

55
Fig 7: Procedure 6
9. Choose the Datum applicable: Minna Nigeria.
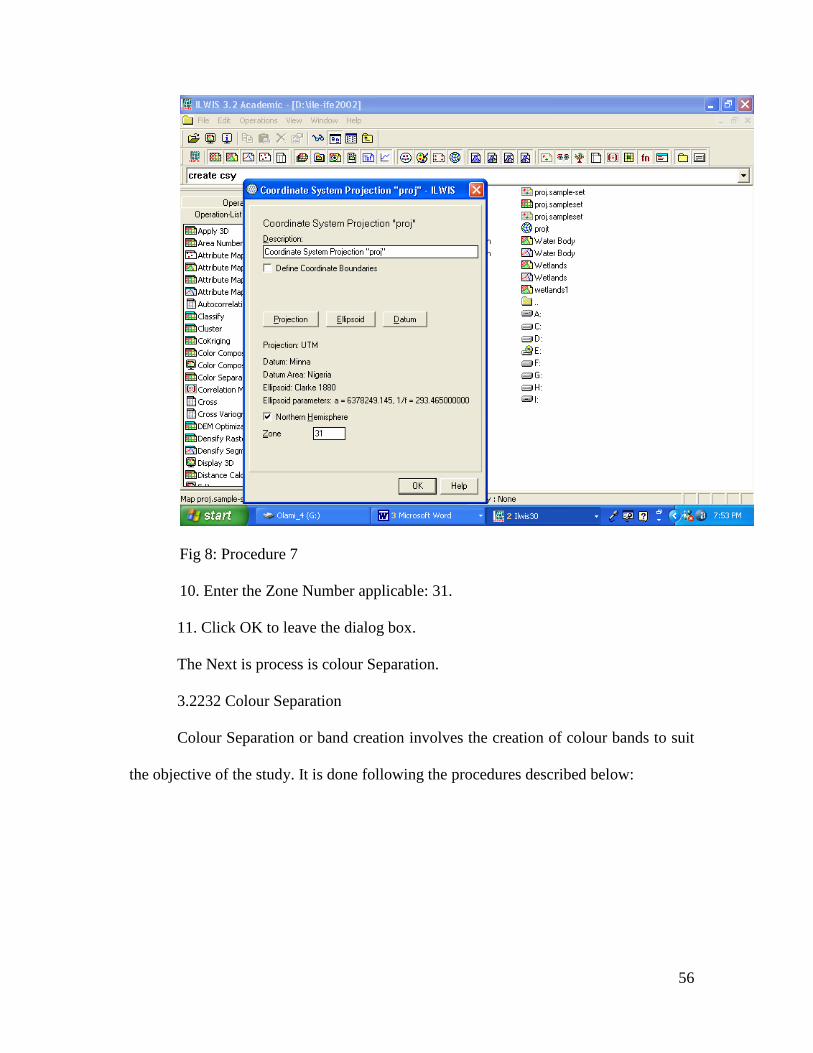
56
Fig 8: Procedure 7
10. Enter the Zone Number applicable: 31.
11. Click OK to leave the dialog box.
The Next is process is colour Separation.
3.2232 Colour Separation
Colour Separation or band creation involves the creation of colour bands to suit
the objective of the study. It is done following the procedures described below:

57
Fig 9: Procedure 8
1. Click on operations menu
2. Navigate to the image processing sub-menu and click color separation under
it.

58
Fig 10: Procedure 9
4. Click the colour band that you intend to create individually, say Red; click
the name of the file of the imagery from which the bands are created and
name the colour band; then click show on the dialogue box.
5. It first takes you to another dialogue box where you indicate your display
options.

59
Fig 11: Procedure 10
6. Click OK after you have indicated your display options to show the individual
band you have just created. An example of the individual band created is as seen
below.

60
Fig 12: Procedure 11
7. Repeat the process for the other bands needed for the study; in this case
green and blue.
Next is Map list Creation.
3.2233 Map List Creation
This is done to create a list of the color bands needed for this study. It is done
using the procedures described below:
1. Click on file menu
2. Navigate to map list sub-menu and click it.
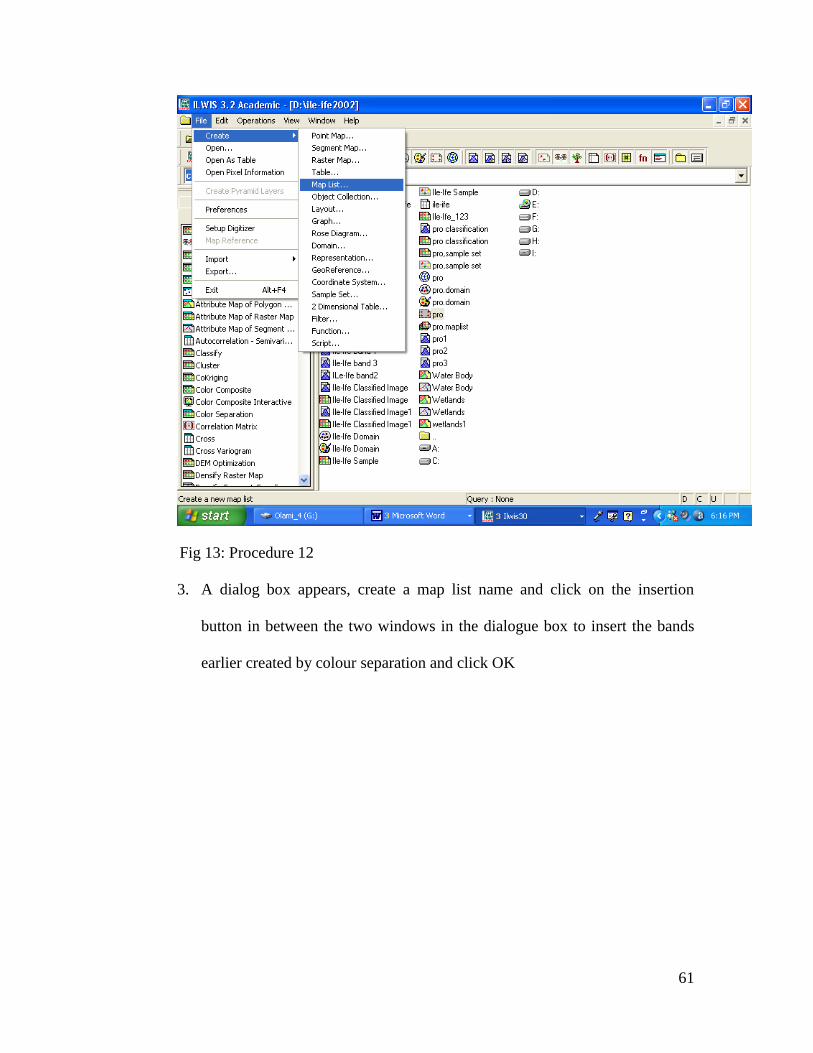
61
Fig 13: Procedure 12
3. A dialog box appears, create a map list name and click on the insertion
button in between the two windows in the dialogue box to insert the bands
earlier created by colour separation and click OK

62
Fig 14: Procedure 13
Next is georeferencing.
3.2234 Georeferencing
This involves defining or referencing features the way they are in relation to the
Globe Earth using the appropriate coordinate system suitable for the locality being
studied. It is usually done by marking the coordinates of conspicuous and easily
recognizable features on the imagery using previously georeferenced satellite imageries,
aerial photographs, topographical maps, street maps or even previously taken GPS
readings as Ground control points (GCPs) and registering them in the GIS environment
as tie lines at the appropriate coordinate system suitable for the area under study. To do
this, we follow the procedures described below:

63
1. Click on file Menu.
2. Go to create sub-menu and then click GeoReference under it.
Fig 15: Procedure 14
3. The dialog box below appears

64
Fig 16: Procedure 15
4. On the dialog box, give the georeference a name, Choose GeoRef Tiepoints
option, the name of coordinate system and the map list earlier created and
Click OK.
5. The dialog box below appears, fill in the display options in the correct order
(123, RGB) and click OK to go to the GeoReference editor window.
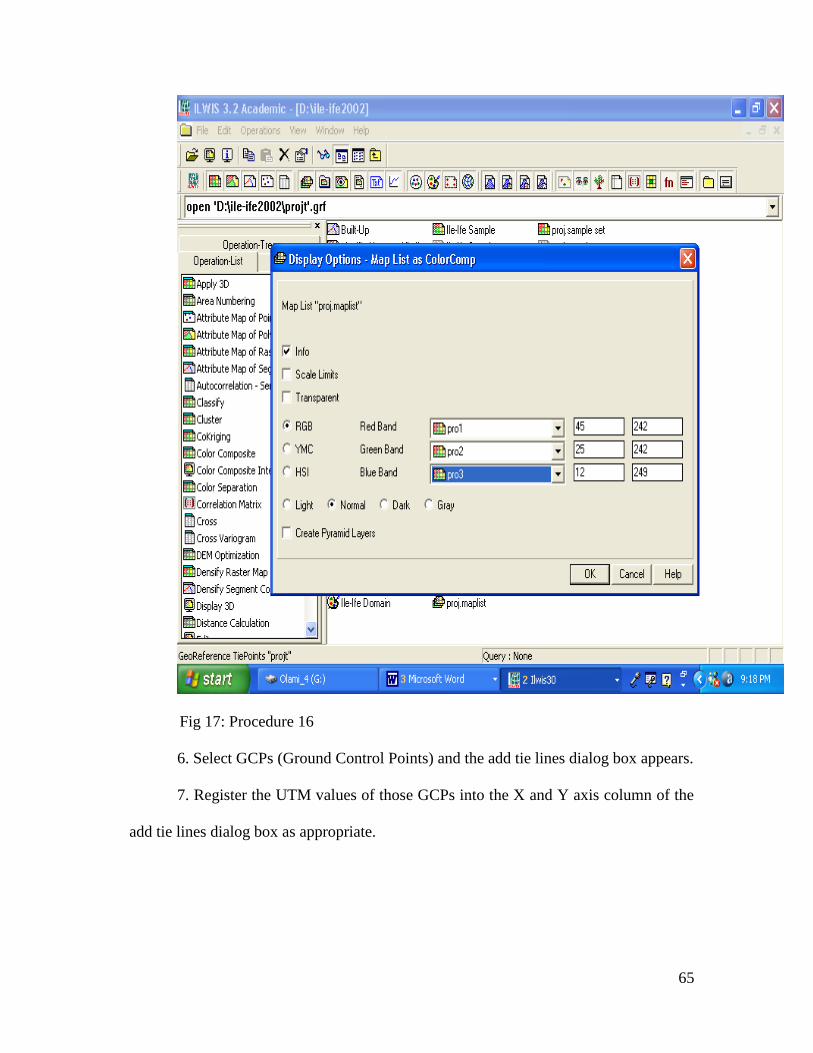
65
Fig 17: Procedure 16
6. Select GCPs (Ground Control Points) and the add tie lines dialog box appears.
7. Register the UTM values of those GCPs into the X and Y axis column of the
add tie lines dialog box as appropriate.

66
Fig 18: Procedure 17
8. Keep adding Tie lines until the Sigma Value drops to a little above or below
0.5 to ensure a high accuracy level. For the purpose of this study my sigma
was 0.516

67
Fig 19: Procedure 18

68
Fig 20: Procedure 19
The Next process is Domain or Class creation.
3.2235 Domain or Class Creation
This helps in entering classes of land uses and land covers observed in the study
area.
This is done by following the procedures described below:
1. Click the file Menu, Navigate to domain and click it.

69
Fig 21: Procedure 20
2. A dialog appears, type in domain name and click OK

70
Fig 22 Procedure 21
3. A new window appears, it enables you create land use and cover classes or
see those that have been created in the process of training sites.

71
Fig 23: Procedure 22
4. To add classes; click on edit menu in the domain window and navigate to add
item, then click it. It then brings out a dialog box where you can add class name and
code.

72
Fig 24: Procedure 23
5. Click OK after indicating the necessary parameters.
6. Repeat this for all other classes.
3.2236 Sample Set Creation
This is done to enable computer to be able to train sites in the study area.
This is done by following the procedures described below.
1. Click on file menu
2. Navigate to sample set sub-menu and click it

73
Fig 25: Procedure 24
3. It brings out a dialog box; fill in it the name you intend giving the sample set,
and the name of the domain and map list you created earlier and click OK.
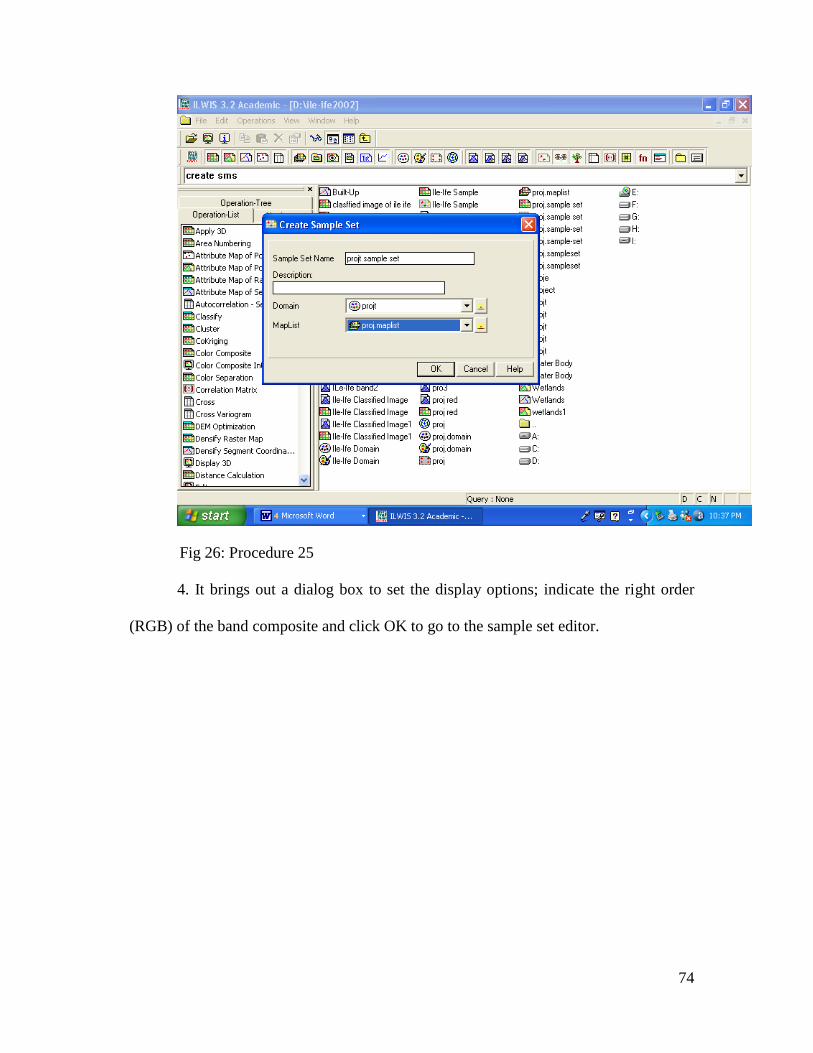
74
Fig 26: Procedure 25
4. It brings out a dialog box to set the display options; indicate the right order
(RGB) of the band composite and click OK to go to the sample set editor.

75
Fig 27: Procedure 26
5. The sample statistics window also opens with the sample set editor.

76
Fig 28: Procedure 27
Training of Sites
This involves selecting enough sample sites for each class created so as
to train the computer to recognize the classes that we are about to classify the
study area into.
To train the computer to recognize a class, you follow the following
procedures:
1. Use the Normal tool in the sample set editor to select the
rectangular samples of the class all over the imagery.
2. Right click as soon as you finish selecting a sample site and
click edit on the pop up menu

77
Fig 29: Procedure 28
3. A dialog box appears where you can fill in the right class for the site selected,
after filling in the class, click OK to register the sample site.

78
Fig 30: Procedure 29

79
Fig 31: Procedure 30
4. Repeat this for all other classes.
3.224 Classification Procedure
The analyst selects the land use/land cover legend (based on an existing
system). If on inspection of the image it is obvious that some classes are divided into
several spectral groups, the legend may be split accordingly. Example: forest in sun and
shade. These will be classified separately and then combined in the final map.

80
The computer is made to allocate to each cell in the complete image a land use /
cover class based on its cell value in the selected bands according to the classification
options such as maximum likelihood, minimum distance to centroid, bounding
parallelepiped, box classifier, prior probability, minimum mahalanobis distance.
Usually used is the maximum likelihood because it gives the most accurate results. The
classified map will then be digitized i.e. made into real maps by tracing out the
boundaries and outlines. The procedure for classification is as illustrated below.
1. Click on operations menu, navigate to classify and click on it.
Fig 32: Procedure 31

81
2. It brings out a dialog box asking you for the name of sample set made earlier
and the classification options; click the name of sample set you created from the drop
down menu by the sample set option, choose maximum likelihood for classification
method and name the image you are classifying and click on Show button.
Fig 33: Procedure 32

82
3. It brings out a dialog box showing display option, choose the appropriate
options and click OK
.
Fig 34: Procedure 33
4. It brings out the classified image of Ile-Ife. After this you can then digitize the
classified image.

83
Fig 35: Procedure 34
3.225 Digitization or Segment Map Creation
This involves the transformation of classified images in raster form into vector
primitives of points, lines and polygons by the process vectorization or polygonization.
The map vectorization will be done in such a way that different layers (themes)
are created. These themes includes the boundary of the study area, various land use /
cover types of the study area and creation of different layers. All this are done in ILWIS
3.2.

84
Fig 36: Procedure 35
Digitization is however followed by the presentation and display of the data
image statistics in numerical and graphical form.
3.23 Geo-Presentation or Result Presentation
This involves the presentation of land use / Cover information extractable from
the image analysis of the study area in numerical, graphical, written and geographic
forms, either electronically or on paper. Geo-Presentation comes in two forms; namely
Image Statistics Display and Overlay Operations.

85
3.231 Image Statistics Display
This is the display of the statistics of the classified image in numerical, graphical
and written form, either electronically and on paper. This is done by following the
following procedure:
1. Click on the image file of the layer that you intend to display its
statistics on the work frame.
Fig 37: Procedure 36
2. Right click on the layer and navigate to statistics, then click on
histogram sub menu.

86
Fig 38: Procedure 37
3. A dialog box is displayed, so that you could change the layer you intend to
display if you so choose, click on the show button after confirming your options to
display the image statistics for the map layer which in this case is either a land use or a
land cover.

87
Fig 39: Procedure 38
Below here is a sample for the image statistics displayed

88
Fig 40: Procedure 39
We can export the digitized image with many layers such as Bare soil,
Vegetation, Water Body, Built-up, Wetlands, Rivers, Roads, institutional land
uses, residential land uses and commercial land uses to Arcview GIS 3.2a image
were a legend can be added and the colours of classes can be Changed if they
are not representative of the features being used to represent them. For instance,
change water body to blue, secondary vegetation to green and so on, so as to
make them real maps which may be left in electronic form or printed in
hardcopy.

89
3.232 Overlay Operations
This involves the Geo-visualization of land use / cover as single layers and also
as overlays for visualization of the spatial structure and dimensions of land use classes
in Ile-Ife. This is usually also done in Arcview GIS 3.2a image following the procedure
described below.
1. Click OK on the first screen after opening Arcview 3.2a to open with a new
view.
Fig 41: Procedure 40
2. Click YES Option to add data to the view

90
Fig 42: Procedure 41
Click the files of the layers in their appropriate file locations to add them to the
view one after the other.
3. Arrange layers one after the other (overlay) in the sequence you
would want them to appear in the layout. Overlays are usually made
with linear features like roads and rivers arranged on top of polygon

91
features in the view window because putting polygon features over
linear features will block the visibility of the linear features.
Fig 43: Procedure 42
Place the map in Layout, then print it out in hardcopy or store in hard disk as
soft copy.

92
Below here is a diagrammatic representation of the workflow for this study.
Fig 44: Flowchart of the Methodology
IMAGE PROCESSING: USING ILWIS 3.2 COORDINATE REGISTRATION
RADIOMETRIC ENHANCEMENT
GEOMETRIC CORRECTION
PRE-CLASSIFICATION: Loading of the Coordinate system, Colour
separation, Map List Creation, Georeferencing, Domain or Class Creation, Sample
Set Creation and Training of sites
SUPERVISED CLASSIFICATION AT MAXIMUM
LIKELIHOOD
DIGITIZING OR SEGMENT MAP CREATION
DATA COLLECTION: PRIMARY DATA:
RECONNAINSANCE SURVEY
LAND USE FIELD SURVEY: Marking Ground Control Points Using GPS and
Land Categorization
SECONDARY DATA: FROM THE CENTRE FOR SPACE RESEARCH AND
TECHNOLOGY EDUCATION, OAU, ILE-IFE AND THE CARTOGRAPHIC/MAP
LABORATORY OF THE DEPARTMENT OF GEOGRAPHY, OAU, ILE-IFE
GEO-PRESENTATION OR RESULT
PRESENTATION: IMAGE STATISTICS DISPLAY
OVERLAY OPERATIONS
RESULTS

93
Limitation of the Study
It should be noted that embarking on this study is not without its own
limitations. The resolution of the imagery used seems not to go beyond Level -1
classification due to the poor resolution of the imagery used (LandSat ETM
2002). Many areas and features were not easily located as imageries appear to
pixellate easily when certain degree of detail is required. In identifying land
uses for more detailed analysis such as this study requires, higher spatial
resolution imageries such as Quick Bird and IKONOS are required although
they are not readily and cheaply available like the LandSat imagery we used for
this study which is mostly obtained free.
In classifying the land uses, into 3 generalized key land uses, we had to
use our knowledge of those areas and coordinates collected from the field to
draw land use boundaries for the study area. For instance, the settlements along
the road from May fair to Sabo which represents the central business district
(CBD) of Ile-Ife were all considered and marked on the imagery as commercial
land use areas by digitizing it as a separate layer using the GPS coordinates
taken during the field survey. Institutional land use areas such as OAU Campus,
environs of OAUTH Complex and 7-day Adventist areas were also marked and
digitized separately as institutional land use areas.

94
CHAPTER FOUR
RESULT AND ANALYSIS
This chapter is designed to present and analyze the observation gotten from the
field survey and GIS analysis of land uses and land cover in Ile-Ife. In the course of our
study, we identified five major land covers and three major land uses; we produced a land
use characterization map of Ile-Ife and compiled the statistics of all the land use/land
covers of Ile-Ife.
4.1 Observations
The five key land use cover identified include Built-Up Areas or Built-Up
settlements, Vegetation, Bare Soil, Water Body and Wetland while the three key land use
areas identified include Residential, Commercial, and Institutional Land Use areas; other
land uses occur pervasively all over Ile-Ife and are not regarded as separate land use
categories because they don‟t measure up in terms of concentration and density to change
the status of those areas and be regarded as separate categories.
4.2 Land Use Characterization Map
The final land use characterization map of Ile-Ife is produced in Arcview 3.2a by
overlaying layers or segment maps of land covers and land uses created in ILWIS 3.2 by
image digitization to form one whole land use characterization map. The final land use
characterization map produced is shown below.

95
Fig 45: Land Use characterization map of Ile-Ife.
Source: Author‟s Work (2008)

96
4.3 Image Statistics Display
From the classified image of Ile-Ife produced in ILWIS 3.2, the areal extent and
percentage of the land covers and land uses within Ile-Ife can be gotten and displayed in
tabular form. This is shown in the tables below.
Table 1: Table showing the areal extent and percentage covered by the key land
cover types and land use types in Ile-Ife.
Land use/cover
Area covered (km2)
Percentage (%)
Institutional Built-Up Areas
37.63
5.63
Commercial Built-Up Areas
5.29
0.79
Residential Built-Up Areas
172.59
25.81
Vegetation
407.07
61.16
Water Body
0.98
0.15
Wetland
8.00
1.20
Bare Soil
35.27
5.27
Total
668.83
100.0
Source: Author‟s Work (2008)
Based on the Result of the image analysis, the estimated total land area of Ile-Ife
is 668.83 Km2 with 407.07 Km
2 (61.16%) of it covered by Vegetation, about 172.59
Km2
(25.81%) is covered by residential built up, another 37.63 Km2
(5.63%) is covered
by institutional Built-Up, about 35.27 Km 2
(5.27%) is covered by Bare soil, about 8.00

97
Km2 (1.20%)
is covered by wetlands, about 5.29Km
2 (0.79%) is covered by commercial
built up while remaining 0.15% (0.98 Km2) is covered by pockets of water bodies.
Institutional Built-
Up AreasCommercial Built-
Up AreasResidential Built-
Up AreasVegetation
Water Body
Wetland
Bare Soil
Chart 1: Pie chart showing the percentage of land cover types and land use types
in Ile-Ife.
Source: Author‟s Work (2008)
0
50
100
150
200
250
300
350
400
450 Institutional Built-
Up Areas
Commercial Built-
Up Areas
Residential Built-
Up Areas
Vegetation
Water Body
Wetland
Bare Soil
Chart 2: Bar chart showing the percentage of land cover types and land use types
in Ile-Ife.
Source: Author‟s Work (2008)

98
Table 2: Table showing the areal extent and percentage covered by the key land
cover types in Ile-Ife.
Land Cover
Areal Extent (km2)
Percentage (%)
Built Up Areas
215.51
32.22
Vegetation
409.07
61.16
Water Body
0.98
0.15
Wetlands
8.00
1.20
Bare Soils
35.27
5.27
Total
668.85
100.0
Source: Author‟s Work (2008)
From this statistics, about 409.07 km2 (61.16 %) of land in Ile-Ife is covered by
Vegetation, about 215.51 Km2
(32.22 %) is covered by Built-Up settlements, about 35.27
Km2 (5.27 %) is covered by Bare Soils, about 8.00 Km
2 (1.20 %) of total land area is
covered by Wetlands, while the remaining 0.98 Km2
(0.15 %) is covered by Water
Bodies.
Built Up Areas
Vegetation
Water Body
Wetlands
Bare Soils
Chart 3: Pie chart showing the percentage of land cover types in Ile-Ife.
Source: Author‟s Work (2008)

99
0
100
200
300
400
500
Built Up A
reas
Veg
etat
ion
Wate
r Bod
y
Wetla
nds
Bar
e Soils
Chart 4: Bar chart showing the percentage of land cover types in Ile-Ife.
Source: Author‟s Work (2008)
Table 3: Table showing the percentages of land uses in the Built Up areas of Ile-Ife.
Land use/cover
Areal Extent (km2)
Percentage (%)
Built Up
215.51
100.0
Institutional Built Up Areas
37.63
17.46
Commercial Built Up Areas
5.29
2.46
Residential Built Up Areas
172.59
80.09
Total
668.83
100.0
Source: Author‟s Work (2008)
Built-Up Areas in Ile-Ife represents about 215.51Km2
(32.22 %) of the total land
coverage area; out of the built up areas, about 172.59 Km2 (80.09%) are regarded as
residential land use areas; about 37.63 Km 2
(17.46 %) a re regarded as institutional land
use areas, while the remaining areas which constitute about 2.46 % (5.29 Km2) are
commercial areas.

100
Institutional
Built Up Areas
Commercial
Built Up Areas
Residential
Built Up Areas
Chart 5: Pie chart showing the percentage of the different built-up land use classes in Ile-
Ife.
Source: Author‟s Work (2008)
0
50
100
150
200
Institu
tional
Built
Up
Are
as
Com
merc
ial
Built
Up
Are
as
Resid
ential
Built
Up
Are
as
Chart 6: Bar chart showing the percentage of the different built-up land use Classes in
Ile-Ife.
Source: Author‟s Work (2008)

101
CHAPTER FIVE
SUMMARY AND CONCLUSION
5.1 Summary
This study has enabled us to identify the key land use cover and uses in Ile-Ife and
helped us obtain information on how they are distributed on the ground. The final
information obtained from this study is valuable for planning of land use in Ile-Ife.
In the course of our study, we identified five key land cover types in Ile-Ife; they
include Built-Up Areas or Built-Up settlements, Vegetation, Bare Soil, Water Body and
Wetland. We also identified three key land use types; they include Residential,
Commercial, and Institutional Land Use areas.
Based on the image analysis, the estimated total land area of the study area is
approximately 668.83 Km2 with 407.07Km
2 (61.16%) of it covered by Vegetation,
mostly secondary vegetation since most of the natural vegetation had been degraded and
depleted in an attempt to develop. About 172.59Km2
(25.81%) is covered by residential
built-up settlements, another 37.63 Km2
(5.63%) is covered by institutional built-up
settlements, about 35.27 Km 2
(5.27%) is covered by Bare soil, about 8.00 Km2 (1.20%)
is covered by wetlands, about 5.29 Km2
(0.79%) is covered by commercial built-up
settlements while remaining 0.15% (0.98 Km2) is covered by pockets of water bodies.
The total area of built-up settlements in Ile-Ife put together is about 215.51 Km2
representing about 32.22 % of the total land area in Ile-Ife.
5.2 Issues and Recommendation
Although 61.16% of the total land area of Ile-Ife is covered by mostly secondary
Vegetation, if dynamic and purposeful planning aimed at sustainability is not embarked

102
on using the relevant technologies and information (like the one that this project is
designed to produce) the continued existence of the environment and its capacity to
continue to support life will be in doubt because of the significance of such forests since
the initial natural forests have been lost.
If the current secondary vegetation is not sustained there will be a great rise in
urban heat effect in Ile-Ife; the capacity of Ile-Ife to achieve sustainable water supply will
also be in doubt because there are only few water bodies to serve the growing urban
population. If the vegetation at heights within and outside Ile-Ife which acts as water shed
and drains to the area‟s most reliable drainage Basin, the Opa Drainage basin as observed
on the satellite imagery is touched, then there is great possibility of acute water Shortage
as most water are lost via run off. The touching of the vegetation also raises fear of
possible devastating flood in the land.
Lower rates of oxygen and higher rates of atmospheric pollution will also be
result of the loss of vegetation which acts as carbon sinks. The increase in runoff is also
likely to trigger the loss of farmlands to erosion which could cause crop failure and local
food scarcity. The local food scarcity is also capable of raising the general price level of
food and related items thereby causing hardship on the local economy.
Sustainable planning and development of Ile-Ife is a must and the implementation
of information technologies like we did in this study is a strong requirement for such.
Plans should be put in place to put a check on the rate at which secondary forests are been
depleted and degraded as a result of conversion for developmental purposes because of
the future hazardous implications of such a trend.

103
Sustainable developmental projects designed to stabilize the ecosystem such as
tree planting and agroforestry can be embarked on to prevent an eventual total loss of the
secondary forest to urban development.

104
REFERENCES
James R. Anderson, Ernest E. Hardy, John T. Roach, And Richard E. Witmer
(1976) “A Land Use And Land Cover Classification System For Use With Remote
Sensor Data” United States Government Printing Office, Washington. Pg 7-23.
Cushine J.L (1987) “ the Interactive Effect of Spatial Resolution and Degree of
internal Variability within land–cover types on classification Accuracies”
Photogrammmetic Engineering & Remote Sensing . Pg 15-29.
Gao. J and Skillcorn. D. (1998)“capability of SPOT XS Data in producing
Detailed Land cover Maps at the Urban Rural periphery” International Journal of
Remote Sensing. Pg 2877-2891
Gastellu-Etehegory, JP (1990) “ An Assessment of SPOT XS Landsat MSS Data
for Digital classification of Near-Urban Land cover”. International Journal of Remote
Sensing. Pg 225-235.
Jensen. JB (April 1982). “Detecting Residential land –Use Development at the
Urban Fringe” Photogrammetric Engineering & Remote Sensing . Pg 629-643.
Daniel Ayalew mengistu and Ayobami T. salami (2007) “Application of remote
sensing and GIS inland use/land cover mapping and change detection in a part of South
Western Nigeria” , Department of geography, Bahir Dar University, Bahir Dar, Ethiopia
and Space Applications and environmental science Laboratory, Institute of Ecology and
Environmental Studies, Obafemi Awolowo University, Ile-Ife, Nigeria.
David G. Rossiter (1994), Lecture Notes on Land Evaluation “ data sources for
Land Evaluation” Cornell University college of Agriculture & Life Sciences,
Department of soil, Crop, & Atmospheric sciences

105
Adeoye Nathaniel Olugbade (1989) “Geographical analysis of the urban land use
pattern in Ile-Ife”. Unpublished B.Sc Dissertation. University of Ile-Ife.
Brandon R. Bottomley, B.A. (1998) Mapping Rural Land Use & Land Cover
Change In Carroll County, Arkansas Utilizing Multi-Temporal Landsat Thematic Mapper
Satellite Imagery (1984 - 1999) University of Arkansas.

106
APPENDIX I
Fig 46: Scanned Image of Ile-Ife Roadmap
SOURCE: CARTOGRAPHIC/MAP LABORATORY OF THE DEPARTMENT
OF GEOGRAPHY, OAU, ILE-IFE

107
APPENDIX II
Fig 47: The Coordinate System used for the study

108
APPENDIX III
Fig 48: The Georeference editor of LandSat ETM+ 2002 Imagery of Ile-Ife.
Sigma value = 0.516

109
APPENDIX IV
POINTS LOCATION NORTHINGS (o) EASTINGS (
o)
P1 PARAKIN JUNCTION 07.4915 004.5305
P2 LAGERE ROUNDABOUT 07.4868 004.5477
P3 ADEREMI JUNCTION 07.4964 004.5068
P4 OAU CAMPUS GATE 07.4952 004.5217
P5 TOLL GATE 07.4942 004.4923
P5 SABO TRAFFIC POST 07.4913 004.5562
P6 MAYFAIR ROUNDABOUT 07.4899 004.5314
P7 SEVEN ADVENTIST 07.4890 004.5413
P8 ODUDUWA COLLEGE JUNCTION 07.4915 004.5565
P9 ILESHA GARAGE JUNCTION 07.4962 004.5683
P10 ONDO ROAD JUNCTION O7.4889 004.5340
Source: Author‟s Field Work.