Lam et al Forthcoming Relationship between road traffic noisescape and urban form in HK
13
Relationship between road traffic noisescape and urban form in Hong Kong Kin-Che Lam & Weichun Ma & Pak Kin Chan & Wing Chi Hui & King Lam Chung & Yi-tak Teresa Chung & Chun Yin Wong & Hui Lin Received: 19 July 2012 / Accepted: 29 May 2013 # Springer Science+Business Media Dordrecht 2013 Abstract This paper reports on a study which ex- plored the possible relationship between road traffic noisescape and urban form in Hong Kong. A total of 212 residential complexes from 11 contrasting urban forms were sampled, and their noise levels assessed both at dwelling and neighbourhood scales by noise mapping. Its findings indicate that residential com- plexes with different urban forms have significantly different noisescape attributes. There is a strong cor- relation between the noise characteristics and morpho- logical indicators at the dwelling scale. A less obstrep- erous noisescape is associated with urban forms with lower road and building densities, and with building arrangements which provide self-noise screening. These findings suggest that urban form is an influen- tial determinant of the noisescape in the urban envi- ronment, and they point to the need to rethink the conventional approach to managing the urban acoustic environment. Keywords Road traffic noise . Noise mapping . Noise exposure . Noisescape . Urban form . Urban acoustic management Abbreviations SB Single slab CF Cruciform TT Twin tower YY Trident MX Mixed SH Small house OS Old development with squares ON Old development and small housing estates without podium CM Compact massive housing estates LN Large housing estates without podium LP Large housing estates with podium LSBG Large Street Block Group WS With self-screening NS Without self-screening Introduction Transportation noise is a significant environmental problem confronting many cities. A recent WHO re- port (WHO 2011) indicates that exposure to high noise levels may have adverse health effects and estimates that about one in three urban inhabitants in EU coun- tries are highly annoyed by road traffic noise. Other Environ Monit Assess DOI 10.1007/s10661-013-3282-4 K.<C. Lam (*) : P. K. Chan : W. C. Hui : K. L. Chung : Y.<t. T. Chung : C. Y. Wong : H. Lin Department of Geography and Resource Management, The Chinese University of Hong Kong, Hong Kong, SAR, China e-mail: [email protected] W. Ma Department of Environmental Science and Engineering, Fudan University, Shanghai, China
Transcript of Lam et al Forthcoming Relationship between road traffic noisescape and urban form in HK

Relationship between road traffic noisescapeand urban form in Hong Kong
Kin-Che Lam & Weichun Ma & Pak Kin Chan &
Wing Chi Hui & King Lam Chung & Yi-tak Teresa Chung &
Chun Yin Wong & Hui Lin
Received: 19 July 2012 /Accepted: 29 May 2013# Springer Science+Business Media Dordrecht 2013
Abstract This paper reports on a study which ex-plored the possible relationship between road trafficnoisescape and urban form in Hong Kong. A total of212 residential complexes from 11 contrasting urbanforms were sampled, and their noise levels assessedboth at dwelling and neighbourhood scales by noisemapping. Its findings indicate that residential com-plexes with different urban forms have significantlydifferent noisescape attributes. There is a strong cor-relation between the noise characteristics and morpho-logical indicators at the dwelling scale. A less obstrep-erous noisescape is associated with urban forms withlower road and building densities, and with buildingarrangements which provide self-noise screening.These findings suggest that urban form is an influen-tial determinant of the noisescape in the urban envi-ronment, and they point to the need to rethink theconventional approach to managing the urban acousticenvironment.
Keywords Road traffic noise . Noise mapping . Noiseexposure . Noisescape . Urban form . Urban acousticmanagement
AbbreviationsSB Single slabCF CruciformTT Twin towerYY TridentMX MixedSH Small houseOS Old development with squaresON Old development and small housing estates
without podiumCM Compact massive housing estatesLN Large housing estates without podiumLP Large housing estates with podiumLSBG Large Street Block GroupWS With self-screeningNS Without self-screening
Introduction
Transportation noise is a significant environmentalproblem confronting many cities. A recent WHO re-port (WHO 2011) indicates that exposure to high noiselevels may have adverse health effects and estimatesthat about one in three urban inhabitants in EU coun-tries are highly annoyed by road traffic noise. Other
Environ Monit AssessDOI 10.1007/s10661-013-3282-4
K.<C. Lam (*) : P. K. Chan :W. C. Hui :K. L. Chung :Y.<t. T. Chung : C. Y. Wong :H. LinDepartment of Geography and Resource Management,The Chinese University of Hong Kong,Hong Kong, SAR, Chinae-mail: [email protected]
W. MaDepartment of Environmental Science and Engineering,Fudan University,Shanghai, China

studies (EC 1996; Klæboe 2011) also indicate thatmore than 30 % of the world’s population is exposedto excessive road traffic noise, and this situation maypersist and be aggravated. Reflecting the same trend, arecent study in Hong Kong (Lam et al. 2012) deter-mined that 36.2 % of its population suffers fromexcessive road traffic noise.
To address the problem of transportation noise,various noise policies and measures have beenimplemented in different countries over the lastthree decades (Adams et al. 2006). These includemore stringent vehicular emission standards,calming measures in urban road systems, and, inEU countries, the formulation of action plans basedon noise mapping. In spite of these efforts, surveyshave shown that there is no evidence of a signifi-cant reduction in the exposure of the urban population toroad traffic noise over time (EC 1996). This is echoed ina recent review by Klæboe (2011) on the situation in theNetherlands and Norway. The lack of significant im-provement can be ascribed to the fact that recent de-velopments in noise reduction technologies have beenoffset by the growth of road traffic in cities and thespread of urban boundaries (EC 1996; Klæboe 2011;Lam and Ma 2012).
Recognizing the limitations of the conventionalapproach to managing the urban acoustic environmentby noise reduction (Lam and Ma 2012), there has beenan increasing demand to address urban noise problemby alternative measures. With numerous empiricalstudies having suggested that human response is con-ditioned not only by the exposure level at the dwell-ings but also in their surrounding neighbourhood en-vironment (Botteldooren et al. 2011; Klæboe et al.2006; Klæboe 2011), some researchers have broad-ened their attention to the residents’ activity space inthe neighbourhood of the dwelling (Botteldooren et al.2011). Klæboe (2011) coined the term “noisescape” todescribe the acoustic characteristics of the sphere ofurban inhabitants. It is believed that the noisescapemay have physical and psychological impacts on thelocal inhabitants.
Given its extraordinarily high vehicular and resi-dential densities and diversified urban form, HongKong provides an ideal setting for exploring the rela-tionship between noisescape and urban form. Thispaper reports an attempt to determine: (a) whether ornot the noisescape of different urban forms is differ-ent; (b) in what ways they differ; and (c) why they
differ. The results will shed light on policies on man-aging urban noise pollution.
Study area
This study was undertaken in Hong Kong, a metropolistroubled by severe road traffic noise pollution (HK EPD2006). A recent city-wide noise mapping exercise re-vealed that 36.2 %, or about 1.6 million people, of itsseven million population is exposed to road traffic noiseabove the noise planning criterion (65 dBA, LDEN) (Lamet al. 2012). The city’s compact spatial arrangement,characterized by high-rise buildings and exceptionallyhigh vehicle density, has created an obstreperous urbanacoustic environment overwhelmed by noise fromroad traffic, making it probably one the noisiest cities inthe world.
Hong Kong also provides a large array of urbanforms for the study. During the most recent decades, apersistent housing shortage created by populationgrowth has prompted the Hong Kong Government tointervene in the city’s housing market through deliv-ering large-scale affordable housing. This has createda dualist housing provision mechanism under whichthe government and the private sector play an equallyimportant role in supplying residential units.Differences in the development goals and scale ofdevelopment have led to a variety of urban forms(Ng and Wong 2003). A number of exploratory studiesin Hong Kong have shown that there are significantdifferences between the noise exposure levels of peo-ple residing in different urban forms. These differ-ences have been attributed to, apart from the socialinequality of their inhabitants (Lam and Chung 2012),the influence of urban form (Lam et al. 2005, 2012;Lam and Ma 2012).
Given the diversity of urban forms in Hong Kong,it is hardly possible to examine all of them in a singlestudy. We nevertheless identified 11 of the more com-mon ones for the purposes of our study. Among them,five are typically found in public housing estates,including single slab (SL), cruciform (CF), twin tower(TT), trident (YY) and mixed (MX). The first four arecommon standard building arrangements adopted bythe public housing supplier, while MX refers to a formmade up of a mixture of two or more of the aforemen-tioned standardized forms. The other six, such as smallhouses (SH), old development with squares (OS), old
Environ Monit Assess

and small housing developments without podium(ON), compact massive housing estates (CM), largehousing estates without podium (LN) and large hous-ing estates with podium (LP), are commonly found inprivate housing developments. Figure 1 presents a 3-Dview of the morphology of each urban form, and, for amore holistic understanding of these urban forms,Table 1 provides additional information such as theirpredominant location in Hong Kong and local trafficvolume.
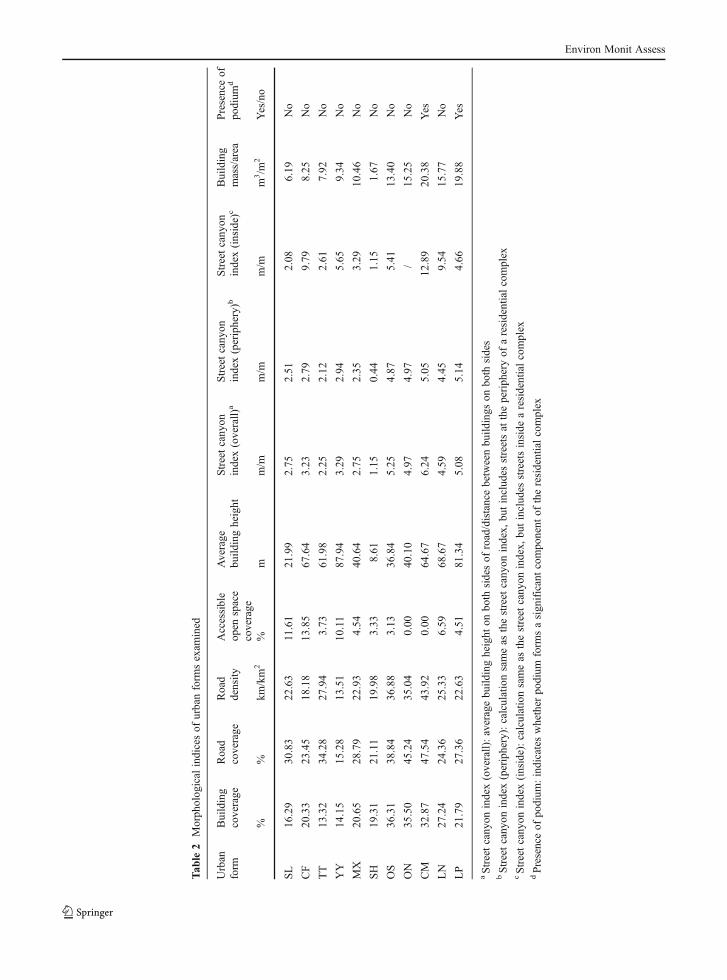
In addition, to quantify the morphological charac-teristics of these urban forms, urban morphology indi-ces were calculated for each of them (Table 2). It canbe seen that the urban forms which we studied differ invarious ways, particularly in terms of building foot-print, road coverage, accessible open space coverage,road density, building height, street canyon index andbuilding mass.
Methodology
Aiming to elucidate the relationship betweennoisescape characteristics and urban forms, thestudy sampled 212 residential complexes in HongKong. The noisescape characteristics and morpho-logical features of each of these were determined.The methods involved are outlined in the follow-ing sections.
The study units
This study adopts the “Large Street Block Group”(LSBG) as the study unit. Being a planning unit inHong Kong, LSBG is a cluster of residential blocksbuilt at about the same time and possessing similarmorphological characteristics (HK Census 2001). Thestudy selected 212 LSBGs among the total of 1,595LSBGs in Hong Kong in Census 2001. A hundred ofthe LSBGs in the sample were built by the govern-ment, whereas the other 112 were built by privatedevelopers. For ease of discussion, these LSBGs willbe referred to as “residential complexes” in subsequentsections.
Noise exposure assessment
Recognizing the need to give attention to the entirenoisescape rather than only to the noise exposure at
the dwellings, the study attempted to quantify noiseexposure levels at two spatial scales: dwelling andneighbourhood. At the dwelling scale, noise exposureis operationally defined as the incidence of road trafficnoise on the façade of the dwelling unit. As for theneighbourhood scale, it is defined as the area sur-rounding the dwelling which constitutes an importantpart of the urban living experience in Hong Kong.Details of the methodology can be found in Lamand Chung (2012) and Lam and Ma (2012). Thiscovers the communal open spaces of a residentialcomplex whose residents enjoy the exclusive rightsof using it or, in the absence of such facilities, thestreet block in which the residential complex islocated.
Given the large number of residential complexes, thisstudy employed the noise mapping technique for noiseexposure assessment. Noise mapping is widely acceptedas a cost-effective noise exposure assessment tool whichhas reasonable accuracy (EU 2002; Lam et al. 2009;Law et al. 2011). In this study, we employed the HongKong version of the proprietary noise mapping softwareLimA (Brüel and Kjær 2011) incorporating the CRTNalgorithm for noise prediction (Department of TransportWelsh Office 1988). The CRTN method has beenproven to be reliable for predicting traffic noise in HongKong (Leung and Mak 2008), giving accurate re-sults with varying height in a vertical urban setting(Mak et al. 2010).
The output of noise mapping was an array ofnoise exposure estimates for all assessment pointsof all buildings in each residential complex, atboth the dwelling and neighbourhood scales. Theresults were expressed in terms of LA10, 1h, thenoise metric used for environmental planning inHong Kong. The noise metrics so derived includemean noise level, median noise level (LA10, 50),the top 10 % noise level (LA10, 10), the bottom10 % noise level (LA10, 90), the percentage quiet (pro-portion of assessment points below 50 dBA, or %<50 dBA), the percentage of noise exceedance (propor-tion of assessment points above 70 dBA, or %>70 dBA), and noise climate (LA10, 10−LA10, 90).
Urban morphological indices
Urban morphological indices were calculated fromdigital maps by using the ArcGIS software. For eachof the urban forms, three typical residential complexes
Environ Monit Assess

were chosen, and their morphological indices calcu-lated in terms of building coverage, road coverage,accessible open space coverage, road density, averagebuilding height, street canyon index and buildingmass/area. All data were obtained from digital mapmeasurements, except the street canyon index, whichwas calculated as the ratio between the average build-ing height on both sides of the road and the distancebetween buildings on both sides. As well as measuringall buildings in a residential complex, the street can-yon index was also separately calculated for buildingson the periphery of, and for all buildings within, theboundary of a residential complex. For expediency,
they are referred to as street canyon index, “periphery”and “overall”, respectively. Finally, a set of ten mor-phological indices were derived for each form individ-ually by averaging the results obtained from relevantresidential complexes (Table 2).
Data analysis
Based on the noise metrics and urban morphologicalindices acquired, statistical analyses were conductedseparately at both the dwelling and the neighbourhoodscales. Correlation, cluster and discriminant analyseswere carried out to elucidate whether or not the
a SL (Single slab ) CF (Cruciform) TT (Twin tower)
YY (Trident) MX (Mixed) SH (Small houses)
OS (Old development with squares)
ON (Old development and small housing estates without podium)
CM (Compact massivehousing estates)
LN (Large housing estates without podium)
LP (Large housing estates with podium )
Noise
High
Low
b c
d e f
g h i
j k
Fig. 1 Morphological characteristics of urban forms examined in this study
Environ Monit Assess

relationship between noise exposure and urban formsis statistically significant.
Findings
To unravel the relationship between noisescape charac-teristics and urban form, this study determined firstly theacoustic attributes of 212 residential complexes of
different urban forms and ascertained the relationshipbetween such acoustic attributes with the urban morpho-logical indices by using correlation analysis. The studythen examined whether some of the urban forms earlieridentified could be merged based on their acoustic attri-butes by using cluster analysis. Further analysis wasundertaken to ascertain the acoustic attributes of thenew groupings. To evaluate whether any of the newgroupings were associated with urban morphological
Table 1 Morphological characteristics of urban forms examined
Urban form Characteristics
Public housing Single slab SL •Oldest form of public housing in Hong Kong
•Elongated and short, usually seven-storeys high
•Buildings running parallel with one another
Cruciform CF •Newest form of public housing in Hong Kong
•With ample, often well-shielded open spaces between buildings
Twin tower TT •Cuboid building design creates more façades runningparallel with roads
•Lack of open space, whose communal functions are substitutedby the light wells of each building
Trident YY •Built on large development sites
•Tall and elongated façades
•Ample, often well-shielded open spaces between the buildings
Mixed MX •Buildings consists of a combination of forms in theaforementioned public urban forms
•Mixed building height
Private housing Small houses SH •Located in less urbanized parts of Hong Kong
•Commonly three-storeys high
•Consist of homogeneous bungalows built by a singledeveloper as a gated community
Old development with squares OS •Located in old urban areas of Hong Kong
•Surrounded by main roads with high traffic flow
•With public open spaces (squares) surrounded by buildings
Old development and small housingestates without podium
ON •Located in old urban areas of Hong Kong
•Juxtaposition of buildings with an rectilinear roadnetwork with high traffic flow
•Sidewalk as the only neighbourhood space
Compact massive housing estates CM •Surrounded by main roads
•Buildings separated by narrow secondary roads
•Lack of open space
Large housing estates without podium LN •Buildings arrangement is less packed and less regularthan that in CM
•Served by secondary local roads
Large housing estates with podium LP •Buildings are built on a multi-storey podium
•Podium as an enclosed communal space for the exclusiveuse of inhabitants of the housing estate
Environ Monit Assess
Tab
le2
Morph
olog
ical
indicesof
urbanform
sexam
ined
Urban
form
Building
coverage
Road
coverage
Road
density
Accessible
open
space
coverage
Average
build
ingheight
Streetcany
onindex(overall)
aStreetcany
onindex(periphery)b
Streetcany
onindex(inside)
cBuilding
mass/area
Presenceof
podium
d
%%
km/km
2%
mm/m
m/m
m/m
m3/m
2Yes/no
SL
16.29
30.83
22.63
11.61
21.99
2.75
2.51
2.08
6.19
No
CF
20.33
23.45
18.18
13.85
67.64
3.23
2.79
9.79
8.25
No
TT
13.32
34.28
27.94
3.73
61.98
2.25
2.12
2.61
7.92
No
YY
14.15
15.28
13.51
10.11
87.94
3.29
2.94
5.65
9.34
No
MX
20.65
28.79
22.93
4.54
40.64
2.75
2.35
3.29
10.46
No
SH
19.31
21.11
19.98
3.33
8.61
1.15
0.44
1.15
1.67
No
OS
36.31
38.84
36.88
3.13
36.84
5.25
4.87
5.41
13.40
No
ON
35.50
45.24
35.04
0.00
40.10
4.97
4.97
/15
.25
No
CM
32.87
47.54
43.92
0.00
64.67
6.24
5.05
12.89
20.38
Yes
LN
27.24
24.36
25.33
6.59
68.67
4.59
4.45
9.54
15.77
No
LP
21.79
27.36
22.63
4.51
81.34
5.08
5.14
4.66
19.88
Yes
aStreetcany
onindex(overall):averagebu
ildingheight
onbo
thsidesof
road/distancebetweenbu
ildings
onbo
thsides
bStreetcany
onindex(periphery):calculationsameas
thestreet
cany
onindex,
butinclud
esstreetsat
theperiph
eryof
aresidentialcomplex
cStreetcany
onindex(inside):calculationsameas
thestreet
cany
onindex,
butinclud
esstreetsinside
aresidentialcomplex
dPresenceof
podium
:indicateswhether
podium
form
sasign
ificantcompo
nent
oftheresidentialcomplex
Environ Monit Assess

Tab
le4
Correlatio
nmatrixbetweenno
isemetrics
andmorph
olog
ical
indices
Morphological
indices
Dwellin
g(D
W)
Neighbourhood
(NB)
Mean
LA10(dB)
%of
dwellin
gexposedto
noise
level>
70dB
A
%of
dwellin
gexposedto
noise
level<
50dB
A
Noise
clim
ate
Mean
LA10(dB)
%of
dwellin
gexposedto
noise
level>
70dB
A
%of
dwellin
gexposedto
noise
level<
50dB
A
Noise
clim
ate
Percentageof
build
ingcoverage
0.341
0.331
−0.273
0.033
0.131
0.080
−0.134
0.014
Percentageof
roadscoverage
0.495
0.650a
−0.327
0.451
0.569
b0.541
b−0
.235
0.083
Roaddensity
0.448
0.625
a−0
.258
0.396
0.521
0.504
−0.232
0.000
Percentageof
accessible
open
spacecoverage
−0.097
−0.368
−0.112
−0.079
−0.197
−0.314
−0.167
−0.181
Average
build
ingheight
0.375
−0.002
−0.491
0.302
0.350
0.135
−0.335
−0.178
Streetcanyon
index(overall)
0.589
0.342
−0.603
a0.253
0.369
0.178
−0.365
−0.135
Streetcanyon
index(periphery)
0.689a
0.405
−0.706
a0.231
0.404
0.186
−0.467
−0.239
Streetcanyon
index(inside)
0.100
−0.052
−0.169
0.422
0.210
0.122
−0.143
0.047
Buildingmass/area
0.543
0.304
−0.558
0.350
0.383
0.226
−0.286
−0.046
Presenceof
podium
0.037
−0.063
−0.058
0.174
0.120
0.061
0.186
0.153
aCorrelatio
nissign
ificantat
the0.05
level(two-tailed)
bCorrelatio
nissign
ificantat
the0.10
level(two-tailed)
Tab
le3
Noisescapecharacteristicsof
urbanform
sexam
ined
Urban
form
Dwellin
g(D
W)
Neighbourhood
(NB)
Mean
LA10(dB)
LA10,10(dB)
LA10,50(dB)
LA10,90(dB)
%>70
dB%
<50
dBNoise
clim
atea
Mean
LA10(dB)
LA10,10(dB)
LA10,50(dB)
LA10,90(dB)
%>70
dB%
<50
dBNoise
clim
atea
SL
59.7
72.91
60.34
47.32
16.75
15.42
25.59
60.0
73.06
61.66
50.03
18.05
9.93
23.03
CF
57.1
67.72
58.21
41.55
4.83
24.34
26.17
58.3
70.05
59.53
44.28
10.11
20.98
25.77
TT
62.5
76.07
64.95
46.94
29.27
20.76
29.13
67.3
76.20
67.42
54.82
37.13
5.52
21.38
YY
57.4
67.88
60.43
45.02
4.30
16.18
22.86
57.4
69.16
59.55
45.83
7.36
16.41
23.33
MX
57.2
68.82
58.34
41.2
6.83
25.11
27.62
56.5
69.36
56.56
41.11
8.57
27.12
28.25
SH
47.7
57.61
45.79
38.59
1.03
74.41
19.02
51.7
65.72
50.74
38.26
5.73
46.24
27.46
OS
64.0
72.61
64.76
50.62
20.85
8.11
21.99
59.6
69.77
63.42
52.11
9.50
3.88
17.66
ON
62.1
74.26
62.50
49.57
20.98
11.27
24.69
61.2
74.36
61.91
47.16
22.24
17.51
27.20
CM
61.0
72.62
58.85
42.79
15.62
25.64
29.83
62.8
75.50
62.58
47.16
26.52
23.88
28.34
LN
61.0
73.07
61.65
45.60
20.33
16.95
27.47
61.1
75.37
63.89
52.61
24.11
5.98
22.76
LP
60.0
69.75
60.15
46.32
9.22
16.44
23.43
58.0
69.16
57.31
46.76
8.30
21.52
22.40
aNoise
clim
ate=LA10,10−LA10,90
Environ Monit Assess

indices, a discriminant analysis was undertaken to iden-tify those morphological characteristics which coulddifferentiate these new groups.
Noisescape characteristics of different urban forms
Noise exposure of the 11 urban forms was character-ized by seven noise metrics acquired at both thedwelling and neighbourhood scales. They includemean noise level, median noise level, top 10 % andbottom 10 % noise levels, percentage quiet, percent-age of noise exceedance and noise climate (Table 3).
Among the various urban forms, the noisescape ofSH was found to be remarkably different from theothers. At both the dwelling and neighbourhoodscales, SH has the lowest mean noise level and per-centage noise exceedance, but the largest percentagequiet. Such unique results can be ascribed to the loca-tion of most SH, which are less urbanized and wheretraffic flow is relatively low (Table 1). These location-al factors give generally lower noise levels and smallamplitude of the noise climate.
Other than SH, the CM and MX also exhibit a highpercentage quiet both at the dwelling andneighbourhood scales. For CM, the low vehicular flowon roads serving the residential complexes has sparedsome buildings from exposure to serious road trafficnoise (Fig. 1i, Table 1). Such differential exposure toroad traffic noise is also reflected by the high value ofCM’s noise climate, whereas for MX, its quieternoisescape is plausibly related to the self-protectingeffect amongst the buildings in a residential complex.For instance, long roadside buildings may serve asnoise screens to neighbourhood spaces and the low-rise buildings behind them (Fig. 1e).
Contrastingly, TT is distinctive for its relativelyhigher noise levels, as reflected by its higher percentage
noise exceedance at both spatial scales. The cuboiddesign of its buildings may have enhanced the exposureof its façades to road traffic (Fig. 1c).
Relationship between noise metricsand morphological indices
Correlation analysis was carried out to determine anystatistically significant relationships between variousnoise metrics and morphological indices (Table 4).The analysis found that at the dwelling scale, the streetcanyon index (peripheral) is strongly positively corre-lated to mean noise level, thus indicating that thepresence of buildings in a closely packed lay-out couldlead to higher noise levels. This is supportive of ourunderstanding of the role of a street canyon in wors-ening noise pollution (Lau 2006). For the same reason,street canyon index (peripheral) and street canyonindex (overall) were in strong negative correlationwith the percentage of quiet area. In addition, thepercentage of noise exceedance is positively relatedto the rate of road coverage and road density. At theneighbourhood scale, both mean noise level and thepercentage of noise exceedance are weakly correlated(p<0.1 but >0.05) with road density within the resi-dential complex.
Regrouping of urban forms by noisescape attributes
Cluster analysis was undertaken to explore whetherthe 11 urban forms can be merged according to theiracoustic attributes. A total of eight noise metrics wereused in the analysis to obtain new groupings, includ-ing (from both the dwelling and the neighbourhoodscales) mean noise level, %<50 dBA, %>70 dBA andnoise climate. The results indicate that the original 11urban forms could be reclassified into five acoustically
Fig. 2 Dendrogramof cluster analysis ofurban forms
Environ Monit Assess

Tab
le5
Noisescapecharacteristicsof
regrou
pedurbanform
s
New
grou
pUrban
form
Dwellin
g(D
W)
Neighbourhood
(NB)
Mean
LA10(dB)
LA10,10(dB)
LA10,50
(dB)
LA10,90
(dB)
%>
70dB
%<
50dB
Noise
clim
atea
Mean
LA10(dB)
LA10,10
(dB)
LA10,50
(dB)
LA10,90
(dB)
%>
70dB
%<
50dB
Noise
clim
atea
With
self-
screening
(WS)
CF
57.1
67.72
58.21
41.55
4.83
24.34
26.17
58.3
70.05
59.53
44.28
10.11
20.98
25.77
LP
60.0
69.75
60.15
46.32
9.22
16.44
23.43
58.0
69.16
57.31
46.76
8.30
21.52
22.40
YY
57.4
67.88
60.43
45.02
4.30
16.18
22.86
57.4
69.16
59.55
45.83
7.36
16.41
23.33
MX
57.2
68.82
58.34
41.20
6.83
25.11
27.62
56.5
69.36
56.56
41.11
8.57
27.12
28.25
With
outself-
screening
(NS)
Group
average
58.0
68.66
59.22
43.53
6.50
20.91
25.13
57.7
69.56
58.52
43.92
8.86
22.02
25.64
SL
59.7
72.91
60.34
47.32
16.75
15.42
25.59
60.0
73.06
61.66
50.03
18.05
9.93
23.03
LN
61.0
73.07
61.65
45.60
20.33
16.95
27.47
61.1
75.37
63.89
52.61
24.11
5.98
22.76
ON
62.1
74.26
62.50
49.57
20.98
11.27
24.69
61.2
74.36
61.91
47.16
22.24
17.51
27.20
CM
61.0
72.62
58.85
42.79
15.62
25.64
29.83
62.8
75.50
62.58
47.16
26.52
23.88
28.34
Group
average
61.4
73.55
61.49
47.63
19.07
14.65
25.92
61.0
73.91
62.13
48.33
20.24
11.40
25.58
TT
62.5
76.07
64.95
46.94
29.27
20.76
29.13
67.3
76.20
67.42
54.82
37.13
5.52
21.38
SH
47.7
57.61
45.79
38.59
1.03
74.41
19.02
51.7
65.72
50.74
38.26
5.73
46.24
27.46
OS
64.0
72.61
64.76
50.62
20.85
8.11
21.99
59.6
69.77
63.42
52.11
9.50
3.88
17.66
aNoise
clim
ate=LA10,10−LA10,90
Environ Monit Assess

defined groups according to their attributes (Fig. 2),two of these groups having been newly formed by themerging of the original forms.
These two new groups were distinctively differentfrom one another in terms of their noisescape charac-teristics (Table 5). In the first group, the noise metricsof the constituent urban forms, i.e. CF, LP, YY andMX, were all comparatively low. At both scales, all ofthem attained relatively low mean noise levels,LA10,10, and the percentage of dwellings exceedingthe standard. Contrastingly, for the second group,
which includes SL, LN, ON and CM, the correspond-ing noise metrics were all comparatively high. Inshort, the noisescape of the first group of urban formis less noisy than that of the second group, a factwhich is also reflected in the noise metrics newlycalculated for the two groups (Table 5). These twogroups, as we will discuss in the following sections onhow their noisescape characteristics are influenced bytheir building morphology, will be conveniently re-ferred to as “with self-screening” (WS) and “withoutself-screening” (NS), respectively.
0
10
20
30
40
50
60
70
80Mean
% >70dBA
% <50dBA
Noise Climate
WS
NS
TT
SH
OS
0
10
20
30
40
50
60
70Mean
% >70dBA
% <50dBA
Noise Climate
WS
NS
TT
SH
OS
Dwelling Scale
Neighborhood Scale
Fig. 3 Noise metrics of urban forms regrouped after cluster analysis
Environ Monit Assess

For the three remaining urban forms, SH, OS andTT, each of them constitutes a separate cluster becauseof their salient acoustic features, as is shown in Fig. 3.The noisescape in SH is the quietest of all forms, witha very low percentage of noise exceedance both at thedwelling and neighbourhood scales. Contrastingly, thenoisescapes of OS and TT are much noisier. Theformer is characterized by a low percentage of quiet-ness, especially at the dwelling scale, whereas thelatter features a high percentage of noise exceedanceat both scales. Figure 3 also shows the differencesbetween urban forms in terms of their mean noise leveland noise climate on both scales.
Morphological indices and noisescape attributesof new groups
Discriminant analysis was conducted to explorewhether the five new urban form groups can be dif-ferentiated by the morphological indices (Table 6).These indices were used as independent variables,whereas the grouping variable is the urban form afterclustering. The results show that 87.9 % of the originalcases were correctly classified. This suggests that theurban forms based on acoustic attributes are also re-lated to their morphological characteristics. In partic-ular, building coverage and the street canyon index(periphery) are heavily weighted in function 1 of thestructure matrix (Table 7), and by average buildingheight in function 2.
Discussion
This study compares the noisescape characteristics ofresidential complexes in 11 common urban forms inHong Kong both at the dwelling and theneighbourhood scales by the use of noise mappingfor noise exposure assessment. By statistical analysis,we established that: (a) there are significant differ-ences in the noisescape of residential complexes ofdifferent urban forms; (b) noisescape attributes of res-idential complexes at the dwelling scale are stronglycorrelated with their building design and arrangement;and (c) residential complexes categorized on theirnoisescape characteristics can also be distinguishedby their morphological attributes. These findings lendsupport to the proposition that urban form is a keydeterminant of noisescape.T
able
6Arithmetic
averageof
morph
olog
ical
indicesof
selected
urbanform
s
Urban
form
Building
coverage
Road
coverage
Road
density
Accessible
open
space
coverage
Average
build
ing
height
Streetcany
onindex(overall)
aStreetcany
onindex(periphery)b
Streetcany
onindex(inside)
cBuilding
mass/area
Presence
ofpo
dium
d
%%
km/km
2%
mm/m
m/m
m/m
m3/m
2Yes/no
WS
27.97
36.99
31.73
4.55
48.86
4.64
4.25
6.65
14.40
Yes
NS
19.23
23.72
19.31
8.25
69.39
3.59
3.30
5.28
11.98
No
TT
13.32
34.28
27.94
3.73
61.98
2.25
2.12
2.61
7.92
No
SH
19.31
21.11
19.98
3.33
8.61
1.15
0.44
1.15
1.67
No
OS
36.31
38.84
36.88
3.13
36.84
5.25
4.87
5.41
13.40
No
aStreetcany
onindex(overall):averagebu
ildingheight
onbo
thsidesof
road/distancebetweenbu
ildings
onbo
thsides
bStreetcany
onindex(periphery):calculationsameas
thestreet
cany
onindex,
butinclud
esstreetsat
theperiph
eryof
aresidentialcomplex
cStreetcany
onindex(inside):calculationsameas
thestreet
cany
onindex,
butinclud
esstreetsinside
aresidentialcomplex
dPresenceof
podium
:indicateswhether
podium
form
sasign
ificantcompo
nent
oftheresidentialcomplex
Environ Monit Assess

The study has found significant variations in thenoisescape of different urban forms. Among theseforms, WS is characterized by a very low percentagenoise exceedance and a high percentage quiet. Apartfrom the lower density of buildings and roads, thequieter noisescape of WS can be ascribed to the self-noise screening effects of the housing lay-out. This isachieved in a number of ways. Firstly, the number ofbuilding façades facing roadways is minimized.Secondly, variations in the height and shape of build-ings maximize noise shielding. Thirdly, the provisionof podia creates noise shadows for the buildings builton them, thereby reducing noise exposure of dwellingsat lower floor levels. Conversely, NS residential com-plexes lacking these self-shielding qualities are sub-stantially noisier. All these findings highlight two pol-icy implications.
Firstly, in a vertical city, noise barriers are of limit-ed effectiveness in reducing road traffic noise (Lamand Ma 2012). The strong correlation between urbanform and noisescape established in this study high-lights the possibility of noise reduction through urbandesign. The study has found that some forms, notablyCF and MX, have lower noise levels and a greaterpercentage of quiet areas, and their design can increaseour understanding of how the noisescape of futurehousing developments can be improved.
Secondly, the study points to the potential impor-tance of neighbourhood space in providing a restor-ative acoustical environment. There is increasing evi-dence which shows that the neighbourhood acoustic
environment can moderate people’s noise annoyanceresponses (Klæboe et al. 2006; Botteldooren et al.2011; Lam et al. 2012), and therefore, the creation ofan amicable neighbourhood acoustical environmentshould be encouraged. These open spaces serve as arestorative environment for urban inhabitants who suf-fer from serious road traffic noise exposure at thedwelling scale, by providing a respite from theirsource of nuisances. Their presence is important giventhe fact that no urban form can completely shield itsinhabitants from road traffic noise.
Conclusions
This study has ascertained that variations in thenoisescape attributes of different urban forms canlargely be explained by morphological heterogeneity.Based on the noise mapping results of 212 residentialcomplexes from 11 common urban forms in HongKong, the study confirms that the noisescape of resi-dential complexes differs with the arrangement of theirbuildings, roads and open spaces. The variation is notevident only at the façade of dwellings in a high-risesetting but also in the noise metrics gauged at theneighbourhood scale.
Numerous findings have suggested that differencesin urban form are responsible for the mosaic ofnoisescapes observed. Firstly, strong correlations wereobserved between noise metrics and morphologicalindices. Although the mean noise level of residential
Table 7 Structure matrix of discriminant analysis
Morphological indices Function
1 2 3 4
Percentage of building coverage 0.554 −0.332 0.075 −0.030Street canyon index (periphery) 0.506 0.224 −0.026 −0.187Street canyon index (overall) 0.432 0.109 0.031 −0.229Average building height 0.023 0.673 0.028 0.041
Percentage of roads coverage 0.361 −0.119 −0.631 −0.263Road density 0.368 −0.221 −0.543 −0.053Percentage of accessible open space coverage −0.042 0.212 0.258 −0.030Presence of podium 0.052 0.137 0.146 −0.541Building mass/area 0.358 0.254 0.005 −0.451Street canyon index (inside) −0.042 0.212 0.258 −0.030Variance explained 52.6 % 31.8 % 12.9 % 2.7 %
Environ Monit Assess

complex is positively correlated with the street canyonindex (peripheral), the percentage of quiet area is nega-tively related to the street canyon index both for thewhole development site and at the periphery. Secondly,morphological attributes are effective in differentiatingresidential complexes with noisescape peculiarities.Thirdly, residential complexes with noise-screeningstructures are found to be less noisy than the unshieldedones. These findings highlight the promising future ofurban noisescape management by means of thoughtfulurban design, which, apart from reducing noise expo-sure wi thin dwel l ings , should create quie tneighbourhoods which provide psychological relief topeople who are badly affected by noise.
Acknowledgments The authors would like to acknowledgethe Research Grants Council of Hong Kong for providingfunding for this study (CUHK 445805). We also thank Ms.Vivian Tse and Mr. Xiaopeng Fan for their kind assistance inanalysing the data, and Dr. David Wilmshurst for proofreadingthe manuscript.
References
Adams, M., Cox, T., Moore, G., Croxford, B., Refaee, M., &Sharples, S. (2006). Sustainable soundscapes: Noise policyand the urban experience. Urban Studies, 43(13), 2385–2398.
Botteldooren, D., Dekoninck, L., & Gillis, D. (2011). The influ-ence of traffic noise on appreciation of the living quality of aneighbourhood. International Journal of EnvironmentalResearch and Public Health, 8(3), 777–798.
Brüel & Kjær. (2011). Predictor-LimA Software Suite Type 7810.http://www.bksv.com/Products/EnvironmentManagementSolutions/Noise%20Mapping%20and%20Prediction/7810PredictorLimA.aspx. Accessed 8 Dec 2011.
Department of Transport Welsh Office. (1988). Calculation ofroad traffic noise. London: Her Majesty’s StationeryOffice.
European Commission. (1996). Future noise policy. Rep. GP961204. Brussels, Belgium: Author.
European Parliament and of the Council (EU). (2002). Relatingto the assessment and management of environmental noise.Directive 2002/49/EC.
Hong Kong Census and Statistics Department (HK Census).(2001). Hong Kong 2001 population census main report.Hong Kong, China: Publications Unit of the Census andStatistics Department, Hong Kong
Hong Kong Environmental Protection Department (HK EPD).(2006). Draft comprehensive plan to tackle road trafficnoise. Hong Kong, China: Author.
Klæboe, R. (2011). Environmental exposure—annoyance rela-tionships in black and gray urban areas. 10th InternationalCongress on Noise as a Public Health Problem (ICBEN)Proceedings, London, UK, 2011.
Klæboe, R., Engelien, E., & Steinnes, M. (2006). Contextsensitive noise impact mapping. Applied Acoustics, 67,620–642.
Lam, K. C., & Ma, W. (2012). Road traffic noise exposure inresidential complexes built at different times between 1950and 2000 in Hong Kong. Applied Acoustics, 73(11), 1112–1120.
Lam, K.C., Brown, A.L., Wong, T.W., van Kamp, I., & Chan,Y.K. (2012). Final report for the provision of service forthe study of health effects of transportation noise in HongKong . Retrieved on July 18, 2012, from http://www.epd.gov.hk/epd/textonly/english/environmentinhk/noise/studyrpts/files/study_health_effects.pdf
Lam, K.C., Chan, P.K., & Hui, W.C. (2005). How noisy is ourcity? Urban soundscapes at home, neighbourhood andcommunity levels. Paper presented at Internoise 2005, Riode Janeiro, Brazil.
Lam, K. C., Chan, P. K., Chan, T. C., Au, W. H., & Hui, W. C.(2009). Annoyance response to mixed transportation noisein Hong Kong. Applied Acoustics, 70, 1–10.
Lam, K. C., & Chung, Y. T. C. (2012). Exposure of urban popu-lations to road traffic noise in Hong Kong. TransportationResearch Part D: Transport and Environment, 17(6), 466–472.
Lau, S. S. Y. (2006). Traffic noise measurement for the school ofperforming arts. Hong Kong: Department of Architecture,The University of Hong Kong.
Law, C. W., Lee, C. K., Lui, A. S. W., Yeung, M. K. L., &Lam, K. C. (2011). Advancement of three-dimensionalnoise mapping in Hong Kong. Applied Acoustics, 72,534–543.
Leung, B. K. H., & Mak, C. M. (2008). Is the CRTN methodreliable and accurate for traffic noise predication in HongKong? The Hong Kong Institution of EngineersTransactions, 15(2), 1–7.
Mak, C. M., Leung, W. K., & Jiang, G. S. (2010). Measurementand prediction of road traffic noise at different buildingfloor levels in Hong Kong. Building Services EngineeringResearch and Technology, 31(2), 131–139.
Ng, E. & Wong, K. (2003). Efficiency & livability: Towardssustainable habitation in Hong Kong. Paper presented atHong Kong Housing Authority Conference 2003, HongKong, China.
World Health Organization Regional Office for Europe (WHO).(2011). Burden of disease from environmental noise:Quantification of healthy life years lost in Europe.Copenhagen, Denmark: Author.
Environ Monit Assess