Exploring the Earth's Subsurface with Virtual Seismic Sources ...
Upload
independentCategory
view
0download
0
This article appeared in a journal published by Elsevier. The attachedcopy is furnished to the author for internal non-commercial researchand education use, including for instruction at the authors institution
and sharing with colleagues.
Other uses, including reproduction and distribution, or selling orlicensing copies, or posting to personal, institutional or third party
websites are prohibited.
In most cases authors are permitted to post their version of thearticle (e.g. in Word or Tex form) to their personal website orinstitutional repository. Authors requiring further information
regarding Elsevier’s archiving and manuscript policies areencouraged to visit:
http://www.elsevier.com/copyright

Author's personal copy
Laboratory-scale saltwater behavior due to subsurface cutoff wall
Roger Luyun Jr. a,*,1, Kazuro Momii b, Kei Nakagawa b
a United Graduate School of Agricultural Sciences, Kagoshima University, 890-0065, Japanb Department of Environmental Sciences and Technology, Kagoshima University, 890-0065, Japan
a r t i c l e i n f o
Article history:Received 17 March 2009Received in revised form 30 July 2009Accepted 16 August 2009
This manuscript was handled by Prof. P.Baveye, Editor-in-Chief, with the assistanceof Prof. Renduo Zhang, Associate Editor
Keywords:Cutoff wallSEAWAT modelSaltwater intrusionSubsurface dam
s u m m a r y
Artificial subsurface barriers are among several countermeasures proposed to control seawater intrusioninto coastal aquifers. We performed experimental and numerical studies to investigate the dynamics ofresidual saltwater trapped in the storage area upon installation of cutoff walls. Experimental resultsshowed that after wall installation, the residual saltwater wedge initially flattened causing its toe toadvance, and then gradually retreated before being completely removed from the reservoir behind thecutoff wall. The SEAWAT model predicted the behavior of the advancing saltwater intrusion wedgeand the retreating residual saltwater after cutoff wall installation. Flow patterns showed that dispersedsaltwater flowed with the freshwater discharge along the mixing zone and over the cutoff wall. Eventu-ally all remaining saltwater in the storage area was flushed out. Experimental and numerical resultsshowed that a shorter cutoff wall achieved a faster removal rate of residual saltwater than a higher wall.Simulations of shorter cutoff wall heights show that a minimum height limit on the cutoff wall is neededto achieve complete removal of residual saltwater. Residual saltwater will be flushed if the wall heightexceeds the thickness of the saltwater wedge at that position.
� 2009 Elsevier B.V. All rights reserved.
Introduction
Seawater intrusion is often a major constraint to optimal utili-zation of fresh groundwater from coastal aquifers. Excessivegroundwater abstraction, in response to deteriorating quantityand quality of available surface water resources, has led to large-scale lowering of groundwater tables. Coupled with a continuingsea level rise due to global warming, coastal aquifers are even moreunder threat. With about 70% of the world’s population living incoastal zones, the challenges are for the optimal exploitation offresh groundwater and the control of seawater intrusion (Bearand Cheng, 1999).
Several strategies have been proposed to prevent or minimizesaltwater intrusion in coastal aquifers (e.g., Todd, 1959; Dam,1999; Oude Essink, 2001). These may be summarized into the fol-lowing methods: (1) reduction or rearrangement of the pattern ofgroundwater extraction; (2) artificial recharge from spreading ba-sins or recharge wells; (3) development of a pumping trough bysaltwater extraction adjacent to the coast; (4) maintenance of afreshwater ridge by freshwater injection along the coast; (5) con-struction of artificial subsurface barriers; and (6) land reclamation.
Abarca et al. (2006) grouped these countermeasures into demandactions, recharge actions, relocation of pumping wells, and addi-tional engineering solutions. Among these countermeasures, artifi-cial subsurface barriers have found use in Japan, particularly onsmall islands and in archipelagos. In these areas, geological condi-tions not only limit the construction of conventional water supplysystems but also favor the construction of subsurface dams foralternative water sources. Accordingly, subsurface dams areplanned and constructed to store and control groundwater foreffective use and to ensure a consistent extraction of freshwaterwithout causing intrusion of seawater into coastal aquifers. Thereare now about 15 subsurface dams in Japan, seven of which werespecifically constructed to prevent saltwater intrusion into coastalaquifers (Japan Green Resources Agency, 2004). Advanced con-struction procedures such as the soil mixing wall (SMW) ortrench-cutting remixing deep wall (TRD) methods were employedfor the cutoff walls.
Hanson and Nilsson (1986), Nishigaki et al. (2004), and the JapanGreen Resources Agency (2004) have reviewed subsurface damtechnology and developments worldwide. Other studies (e.g.,Nagata et al., 1994; Osuga, 1997) have been site-specific and morefocused on the design criteria, construction, and environmental im-pacts of individual dams. This prior research has identified specificbenefits of subsurface dams including sustained irrigation suppliesfor various crops and prevention of seawater intrusion due to in-creased freshwater groundwater levels in areas where dams havebeen constructed. However, there is a dearth of information on
0022-1694/$ - see front matter � 2009 Elsevier B.V. All rights reserved.doi:10.1016/j.jhydrol.2009.08.019
* Corresponding author.E-mail address: [email protected] (R. Luyun Jr.).
1 Land and Water Resources Division, University of the Philippines Los Baños, 4031,Philippines.
Journal of Hydrology 377 (2009) 227–236
Contents lists available at ScienceDirect
Journal of Hydrology
journal homepage: www.elsevier .com/ locate / jhydrol
Author's personal copy
the behavior of residual saltwater trapped in the storage area afterconstruction of a cutoff wall. After dam construction, the movementand removal of this residual saltwater is usually not investigated.Because cutoff walls are installed underground and their compo-nents and hydraulic properties are site-specific, groundwaterbehavior after dam construction is amenable to study by numericalsimulation and laboratory experiments.
Numerous investigators have performed experimental andnumerical studies to understand the dynamics of saltwater intru-sion into coastal aquifers (e.g., Ataie-Ashtiani et al., 1999; Zhanget al., 2001; Thorenz et al., 2002; Momii et al., 2005; Nakagawaet al., 2005; Illangasekare et al., 2006; Goswami and Clement,2007). However, these studies do not directly reference saltwaterdynamics in cutoff walls. Part of the saltwater intrusion wedge thatis trapped as residual saltwater in the storage area of the cutoff wallhas been assumed to remain stagnant (Fig. 10 of Oude Essink, 2001)but relevant experimental and numerical studies have been con-ducted to show that saltwater can migrate out of an enclosing bar-rier. Oswald et al. (2002) and Oswald and Kinzelbach (2004)described results from saltpool experiments that showed saltwaterof different densities migrating from a closed system due to fresh-water flow from the top. It has been presented as a three-dimen-sional benchmark problem and results have been reported byDiersch and Kolditz (2002), Johannsen et al. (2002) and Oswaldand Kinzelbach (2004). The saltdome problem (HYDROCOIN Level1 Case 5) was proposed for intercomparison of numerical solutions(OECD, 1988) and also involves salt migration as groundwater flowsover a constant-concentration salt source in a closed system. It hasbeen widely used and discussed (Herbert et al., 1988; Oldenburgand Pruess, 1995; Konikow et al., 1997; Kolditz et al., 1998; Holzbecher,1998; Youness et al., 1999, among others) for the different boundarycondition treatments applied. Both problems offer insights onmigration patterns of saltwater but they have different boundaryconditions from the classic saltwater intrusion problem representedin our case.
The objective of this study is to investigate the dynamics of theresidual saltwater trapped in the storage area upon installation ofcutoff walls. First, we performed flow tank experiments to modelsaltwater intrusion in a coastal unconfined aquifer. After the steadystate saltwater intrusion wedge was achieved, we installed cutoffwalls of different heights and examined the behavior of residualsaltwater. We then used the model SEAWAT to numerically simu-late the experiments and use the model results to analyze thedynamics involved. We then performed additional simulations toexamine the effect of cutoff wall height on the behavior andremoval of the residual saltwater.
Laboratory approach
Experimental setup
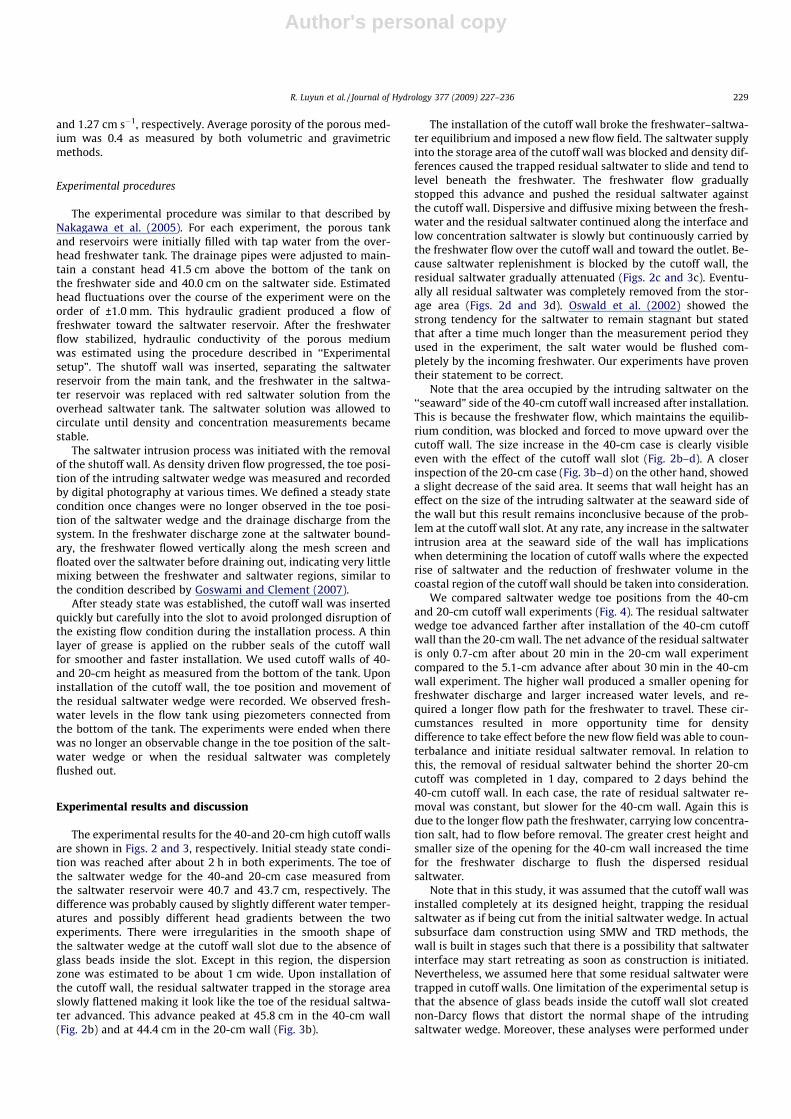
We conducted our experiments in a flow tank with internaldimensions 90 cm length, 60 cm height, and 8 cm width (Fig. 1). Tomodel an unconfined aquifer we packed the middle section of thetank with homogenous glass beads with a nominal diameter of1.2 mm. To each side of the bead section, separated by fine meshscreens, were freshwater and saltwater reservoirs. The heads inthe reservoirs were controlled by adjustable drainage pipes. Wemeasured drainage pipe outflow to estimate hydraulic conductivityand freshwater flux through the system. Freshwater and saltwaterwere supplied at constant flow rates to the respective reservoirsfrom large constant-head tanks positioned above the experimentalsetup.
We prepared saltwater in several 40 L barrels by dissolvingcommercial salt in tap water. To distinguish it from freshwater,
the salt water was dyed with a red food color [New Coccine AcidRed 18 (C.I. Number 16255), Kiriya Chemical Co., Ltd.] at a concen-tration of 20 g dye per 40 L saltwater solution. The suitability of thedye was demonstrated by consistently similar breakthrough curvesof NaCl and dye in our one-dimensional column test. We main-tained saltwater solution density at 1.025 g ml�1 as measured withan Akanuma hydrometer (JIS certified, Yokota Keiki Mfg., Co., Ltd.)and measured saltwater concentration with a WTW-LF330 con-ductivity meter. We used a small pump and several siphon tubesto circulate and homogenize the saltwater solution in the overheadconstant-head tank, the constant-head saltwater reservoir, and thebarrels, and monitored saltwater density and concentration atthese locations. We used tap water for our freshwater source.
The slot for installing the cutoff wall is located in the main tank20 cm from the saltwater reservoir (Fig. 1). Perforated acrylicsheets and fine mesh screens separate the cutoff wall slot fromthe main tank and prevent the entry of glass beads inside. A slotfor insertion of a shutoff wall between the main flow tank andthe saltwater reservoir was constructed to separate the saltwatersolution from the freshwater-filled porous tank at the start of eachexperiment. The cutoff and shutoff walls were made of 4 mm thickacrylic sheets. Rubber seals attached to the sides of these walls pre-vented leakage. A grid of perpendicular lines at 10 cm spacing wasetched on the flow tank and standard metallic rulers (cm and mmscales) were pasted along the bottom and sides of the flow tank tofacilitate direct measurement of the saltwater wedge profile, andthe freshwater and saltwater levels. Recorded data were cross-checked with photographs taken at various intervals with a highresolution digital camera.
Because the cutoff wall slot effectively divided the flow tankvolume, we packed each section with glass beads separately butsuccessively between each section. Beads were packed in 5 cm lay-ers under fully saturated conditions to prevent air entrapment.Each layer was homogenized with those below using a mixingrod to disrupt any possible layering. To ensure homogeneity ofthe porous medium, the glass beads were carefully compressedafter each layer was filled. We used clamps to prevent expansionof the tank sides during packing and ensure a fixed width for theflow tank. We estimated the hydraulic conductivity (k) of the por-ous medium using Darcy’s law, based on the preset hydraulic gra-dient and the measured volumetric drainage discharge. We usedthe in situ approach applied by Oostrtom et al. (1992) to estimatethe average k of the flow tank. There was a long time lag betweenexperiments and the porous medium was repacked for each exper-iment, causing different flow field conditions and, consequently,different hydraulic conductivity values. The k values measuredfor the 40- and 20-cm cutoff wall height experiments were 1.18
slot for cutoff wallslot for shutoff wall
cutoff wall
residualsaltwater
glass beads
drainage pipesinlet pipe forsaltwater fromoverhead tank
inlet pipe forfreshwater fromoverhead tank
40cm
20cm90 cm
41.5cm 60cm
saltwaterreservoir
freshwaterreservoir
Fig. 1. Schematic diagram of the experimental setup.
228 R. Luyun Jr. et al. / Journal of Hydrology 377 (2009) 227–236
Author's personal copy
and 1.27 cm s�1, respectively. Average porosity of the porous med-ium was 0.4 as measured by both volumetric and gravimetricmethods.
Experimental procedures
The experimental procedure was similar to that described byNakagawa et al. (2005). For each experiment, the porous tankand reservoirs were initially filled with tap water from the over-head freshwater tank. The drainage pipes were adjusted to main-tain a constant head 41.5 cm above the bottom of the tank onthe freshwater side and 40.0 cm on the saltwater side. Estimatedhead fluctuations over the course of the experiment were on theorder of ±1.0 mm. This hydraulic gradient produced a flow offreshwater toward the saltwater reservoir. After the freshwaterflow stabilized, hydraulic conductivity of the porous mediumwas estimated using the procedure described in ‘‘Experimentalsetup”. The shutoff wall was inserted, separating the saltwaterreservoir from the main tank, and the freshwater in the saltwa-ter reservoir was replaced with red saltwater solution from theoverhead saltwater tank. The saltwater solution was allowed tocirculate until density and concentration measurements becamestable.
The saltwater intrusion process was initiated with the removalof the shutoff wall. As density driven flow progressed, the toe posi-tion of the intruding saltwater wedge was measured and recordedby digital photography at various times. We defined a steady statecondition once changes were no longer observed in the toe posi-tion of the saltwater wedge and the drainage discharge from thesystem. In the freshwater discharge zone at the saltwater bound-ary, the freshwater flowed vertically along the mesh screen andfloated over the saltwater before draining out, indicating very littlemixing between the freshwater and saltwater regions, similar tothe condition described by Goswami and Clement (2007).
After steady state was established, the cutoff wall was insertedquickly but carefully into the slot to avoid prolonged disruption ofthe existing flow condition during the installation process. A thinlayer of grease is applied on the rubber seals of the cutoff wallfor smoother and faster installation. We used cutoff walls of 40-and 20-cm height as measured from the bottom of the tank. Uponinstallation of the cutoff wall, the toe position and movement ofthe residual saltwater wedge were recorded. We observed fresh-water levels in the flow tank using piezometers connected fromthe bottom of the tank. The experiments were ended when therewas no longer an observable change in the toe position of the salt-water wedge or when the residual saltwater was completelyflushed out.
Experimental results and discussion
The experimental results for the 40-and 20-cm high cutoff wallsare shown in Figs. 2 and 3, respectively. Initial steady state condi-tion was reached after about 2 h in both experiments. The toe ofthe saltwater wedge for the 40-and 20-cm case measured fromthe saltwater reservoir were 40.7 and 43.7 cm, respectively. Thedifference was probably caused by slightly different water temper-atures and possibly different head gradients between the twoexperiments. There were irregularities in the smooth shape ofthe saltwater wedge at the cutoff wall slot due to the absence ofglass beads inside the slot. Except in this region, the dispersionzone was estimated to be about 1 cm wide. Upon installation ofthe cutoff wall, the residual saltwater trapped in the storage areaslowly flattened making it look like the toe of the residual saltwa-ter advanced. This advance peaked at 45.8 cm in the 40-cm wall(Fig. 2b) and at 44.4 cm in the 20-cm wall (Fig. 3b).
The installation of the cutoff wall broke the freshwater–saltwa-ter equilibrium and imposed a new flow field. The saltwater supplyinto the storage area of the cutoff wall was blocked and density dif-ferences caused the trapped residual saltwater to slide and tend tolevel beneath the freshwater. The freshwater flow graduallystopped this advance and pushed the residual saltwater againstthe cutoff wall. Dispersive and diffusive mixing between the fresh-water and the residual saltwater continued along the interface andlow concentration saltwater is slowly but continuously carried bythe freshwater flow over the cutoff wall and toward the outlet. Be-cause saltwater replenishment is blocked by the cutoff wall, theresidual saltwater gradually attenuated (Figs. 2c and 3c). Eventu-ally all residual saltwater was completely removed from the stor-age area (Figs. 2d and 3d). Oswald et al. (2002) showed thestrong tendency for the saltwater to remain stagnant but statedthat after a time much longer than the measurement period theyused in the experiment, the salt water would be flushed com-pletely by the incoming freshwater. Our experiments have proventheir statement to be correct.
Note that the area occupied by the intruding saltwater on the‘‘seaward” side of the 40-cm cutoff wall increased after installation.This is because the freshwater flow, which maintains the equilib-rium condition, was blocked and forced to move upward over thecutoff wall. The size increase in the 40-cm case is clearly visibleeven with the effect of the cutoff wall slot (Fig. 2b–d). A closerinspection of the 20-cm case (Fig. 3b–d) on the other hand, showeda slight decrease of the said area. It seems that wall height has aneffect on the size of the intruding saltwater at the seaward side ofthe wall but this result remains inconclusive because of the prob-lem at the cutoff wall slot. At any rate, any increase in the saltwaterintrusion area at the seaward side of the wall has implicationswhen determining the location of cutoff walls where the expectedrise of saltwater and the reduction of freshwater volume in thecoastal region of the cutoff wall should be taken into consideration.
We compared saltwater wedge toe positions from the 40-cmand 20-cm cutoff wall experiments (Fig. 4). The residual saltwaterwedge toe advanced farther after installation of the 40-cm cutoffwall than the 20-cm wall. The net advance of the residual saltwateris only 0.7-cm after about 20 min in the 20-cm wall experimentcompared to the 5.1-cm advance after about 30 min in the 40-cmwall experiment. The higher wall produced a smaller opening forfreshwater discharge and larger increased water levels, and re-quired a longer flow path for the freshwater to travel. These cir-cumstances resulted in more opportunity time for densitydifference to take effect before the new flow field was able to coun-terbalance and initiate residual saltwater removal. In relation tothis, the removal of residual saltwater behind the shorter 20-cmcutoff was completed in 1 day, compared to 2 days behind the40-cm cutoff wall. In each case, the rate of residual saltwater re-moval was constant, but slower for the 40-cm wall. Again this isdue to the longer flow path the freshwater, carrying low concentra-tion salt, had to flow before removal. The greater crest height andsmaller size of the opening for the 40-cm wall increased the timefor the freshwater discharge to flush the dispersed residualsaltwater.
Note that in this study, it was assumed that the cutoff wall wasinstalled completely at its designed height, trapping the residualsaltwater as if being cut from the initial saltwater wedge. In actualsubsurface dam construction using SMW and TRD methods, thewall is built in stages such that there is a possibility that saltwaterinterface may start retreating as soon as construction is initiated.Nevertheless, we assumed here that some residual saltwater weretrapped in cutoff walls. One limitation of the experimental setup isthat the absence of glass beads inside the cutoff wall slot creatednon-Darcy flows that distort the normal shape of the intrudingsaltwater wedge. Moreover, these analyses were performed under
R. Luyun et al. / Journal of Hydrology 377 (2009) 227–236 229

Author's personal copy
two-dimensional, homogeneous, isotropic conditions. Subsurfaceheterogeneity would, of course, result in different saltwater intru-sion and attenuation behavior. Our results show that mechanicalremoval of residual saltwater may not be necessary. Dependingon the sedimentary architecture, residual saltwater may not followthe same behavior observed in this experiment; it may becomestagnant and require pumping out.
Numerical approach
We used the finite-difference model SEAWAT 2000 (Langevinet al., 2003), developed to simulate three-dimensional, variable-density, transient groundwater flow in porous media, to simulatethe experiments. It combines the modified MODFLOW (Harbaughet al., 2000) and MT3DMS (Zheng and Wang, 1999) into a singleprogram that solves the coupled groundwater flow and solute-transport equations. The SEAWAT code has been tested and provento simulate common benchmark problems involving variable-den-sity groundwater flow, such as the two box problems, the Henryproblem, the Elder problem, and the HYDROCOIN problem (Guoand Langevin, 2002; Langevin et al., 2003). Two additional tests,the modified Henry problem (Simpson and Clement, 2004) andthe saltpool problem (Johannsen et al., 2002; Oswald and Kinzelbach,2004), were presented by Langevin and Guo (2006). Bakker et al.(2004) and Goswami and Clement (2007) have tested SEAWATfor their proposed benchmark problems for density-dependentgroundwater flow software code. Examples of SEAWAT applica-
tions have been presented in Langevin (2003) and Bauer et al.(2006), among others.
The purpose of these simulations was to check whether theexperimental results were consistent with SEAWAT predictionsand to better explain the experimental results. The 20-cm cutoffwall experiment was simulated and used to verify the model code.The simulation area in the two-dimensional vertical cross sectionwas 90 cm by 41.6 cm (Fig. 5). Constant head boundary conditionscorresponding to hydrostatic pressure conditions were set at thefreshwater and saltwater sides. A zero mass flux boundary condi-tion was set at the top and bottom of the simulation area withno recharge at the top and an impermeable bottom. The saltwaterconcentration was specified as the point source concentration atthe saltwater boundary in the Source/Sink Mixing (SSM) package.Two cases of block-centered finite-difference grid intervals wereused for the discretization of the cross-sectional flow domain(Table 1). Case 1 has a uniform grid of dimensions Dx = Dz = 1 cmexcept for the topmost layer occupied by the water table whereDz = 2.6 cm. Case 2 has a finer grid spacing with dimensions ofDx = Dz = 0.5 cm and a top layer of Dz = 2.1 cm.
Parameter values for the numerical simulations, measured dur-ing the experiments, are listed in Table 1. The saltwater level (hs)was set at 40.0 cm while the freshwater level (hf) was adjustedto 41.3 cm for a closer fit between numerical and experimental re-sults. The adjusted freshwater head was outside the range of ob-served measurement error but produced model results that bestmatched the experimental results. A longitudinal dispersivity (aL)of 0.12 cm, the nominal diameter of the glass beads, was set for
Fig. 2. Behavior of the residual saltwater before and after installation of 40-cm cutoff wall.
230 R. Luyun Jr. et al. / Journal of Hydrology 377 (2009) 227–236

Author's personal copy
the porous medium. The transverse dispersivity (aT) was assumedto be 1/10 the longitudinal dispersivity (Johannsen et al., 2002;Langevin, 2003; Shoemaker, 2004; Goswami and Clement, 2007).In modeling the intrusion stage, we initially tried to duplicate theeffect of the slot by assuming a very high hydraulic conductivityat the slot section. We were able to duplicate the irregularity inthe wedge shape, and the rate of advance of the toe has very goodagreement with the experimental results. However, this exercisealso produced unrealistically high velocity vectors which meant
that to duplicate the limitations of the experiment will not servethe actual purpose of the study. As such we decided to use thehydraulic conductivity of the porous medium for the slot sectioninstead. Upon installation of the cutoff wall, the cells occupied bythe wall were rendered inactive such that no flow and no flux con-ditions exist at the wall (Fig. 5). The width of the cutoff wall sectionwas 1.0 cm, equivalent to one column for the 1.0 cm grid simula-tion and two columns for the 0.5 cm grid.
Two transient stress periods were set for the simulations. Thelength of the first stress period was 12 h and involved the advanc-ing front of the intruding saltwater wedge until it reach steadystate. The head and concentration values obtained at each cell ofthe calculation domain after this initial simulation were used asthe initial condition for the second stress period. This periodstarted with the installation of the cutoff walls and was set at
Fig. 3. Behavior of the residual saltwater before and after installation of 20-cm cutoff wall.
0
10
20
30
40
50
0 5 10 15 20 25 30 35 40 45 50 55
Time (h)
Toe
ofsa
ltwat
erw
edge
(cm
) 40cm
20cm
Fig.2b
Fig.2aFig.3a
Fig.3b
Fig.2c
Fig.3cFig.2d
Fig.3d
Fig. 4. Comparison of the transient position of the toe of the saltwater wedge forthe 40- and 20-cm cutoff wall experiments.
Fig. 5. Initial and boundary conditions for the numerical simulations.
R. Luyun et al. / Journal of Hydrology 377 (2009) 227–236 231

Author's personal copy
26 h, enough to cover the time when the residual saltwater wascompletely removed in the experiments. The installation of thecutoff wall was assumed to be instantaneous, that is, the wall is al-ready in place at the start of the second transient period. This alsomeans that the portion of the saltwater wedge on the landwardside (right side) of the wall is retained as residual saltwater.
Flow and transport were explicitly coupled for all the simula-tions. Upstream-weighted algorithm was used for internodal den-sity calculation and the variable-density water table correctionwas not applied. The Pre-conditioned Conjugate-Gradient (PCG)package (Hill, 1990; Harbaugh et al., 2000) was employed for theflow equation where the preconditioning method was set to Chole-sky. The Generalized Conjugate-Gradient (GCG) package (Zhengand Wang, 1999) was used for the dispersion and source termsof the transport equation. Both the forward-tracking MOC (Pinderand Cooper, 1970; Konikow and Bredehoeft, 1978) and the third-order total variation diminishing (TVD) scheme (Zheng and Wang,1999) were used to solve the advection term. The initial time-stepwas set at 1e-5 day and time-step lengths were calculated duringthe simulation using a Courant number of 0.1. In MOC, the 4th or-der Runge–Kutta algorithm was used for particle tracking nearsources and sinks and the 1st order Euler algorithm elsewhere.The concentration weighting factor is 0.5, maximum number ofparticles is 500,000 and the negligible gradient (DCEPS) is set at1e-5. The values for minimum (NPMIN) and maximum (NPMAX)number of particles allowed per cell, number of planes (NPLANE),number of particles set when concentration 6 DCEPS (NPL) orwhen concentration > DCEPS (NPH) are listed in Table 1. Specifica-tions for the different packages are also listed in Table 1.
In the additional simulations to investigate the effect of cutoffwall height on residual saltwater removal, only the TVD schemewas used for the advection term and all other parameters werethe same as the 20-cm wall simulation.
Numerical results and discussion
To test the performance of the model, transient positions ofthe advancing saltwater wedge prior to cutoff wall installation
and the retreating residual saltwater after wall installationwere compared with numerical predictions. Convergence testresults for Case 1 (Dx = Dz = 1.0 cm) and Case 2 (Dx = Dz =0.5 cm) grids showed that Case 2 compare more favorably withthe experiment and will thus be used for visual representation.Comparisons were based on the 0.1 and 0.5 isochlors. To betterexplain the underlying processes observed in the experiments,steady state numerical results were compared to physical re-sults at three times: (a) the initial steady state saltwaterwedge; (b) the peak of advance of the residual saltwater aftercutoff wall installation; and (c) 12 h after wall installation.We then examined numerical results for models of various cut-off wall heights.
Advancing saltwater intrusion wedge
Simulations under MOC and TVD schemes for Case 2 are shownin Fig. 6. Comparison was made up to 2 h only since steady statewas already reached in both experiments and simulation results.Comparison showed that the invading front predicted by SEAWATfor both cases generally matched the experimental results. In bothcases, model results temporally lagged the experimental data, par-ticularly during the period before reaching steady state. This can beattributed to the absence of porous medium in the cutoff wall slotcausing a faster rate of advance of the intruding saltwater in theexperimental results. The Case 1 MOC result underestimated thesteady state position of the intruding saltwater wedge but it wasaccurately predicted in Case1 TVD. The toe position was also accu-rately predicted in Case 2 MOC (Fig. 6a) while the TVD resultslightly overestimated its position (Fig. 6b). The effect of the twogrid sizes is not clearly apparent in the advancing saltwater intru-sion stage as SEAWAT was able to closely predict the experimentalresults in both cases.
(a) 0.5 cm grid (MOC)
0
5
10
15
20
25
30
35
40
45
50
0 0.2 0.4 0.6 0.8 1 1.2 1.4 1.6 1.8 2
Time (h)
0 0.2 0.4 0.6 0.8 1 1.2 1.4 1.6 1.8 2
Time (h)
Toe
of s
alt w
ater
wed
ge (c
m)
0
5
10
15
20
25
30
35
40
45
50
Toe
of s
alt w
ater
wed
ge (c
m)
Experiment
0.1 isochlor
0.5 isochlor
(b) 0.5 cm grid (TVD)
Experiment
0.1 isochlor
0.5 isochlor
Fig. 6. Comparison of model-predicted transient positions of the intruding saltwa-ter wedge with experimental data for Case 2 (0.5 cm grid).
Table 1Numerical simulation parameters.
Input parameters Values
Porosity 0.4Freshwater level, hf (cm) 41.3Saltwater level, hs (cm) 40.0Freshwater density, qf (g cm�3) 1.001Saltwater density, qs (g cm�3) 1.025Saltwater concentration, cs (mg L�1) 33,600Hydraulic conductivity, k (cm s�1) 1.27Longitudinal dispersivity, aL (cm) 0.12Transverse dispersivity, aT (cm) 0.012Molecular diffusion coefficient (cm2 s�1) 1 � 10�5
Cell sizeCase 1: Layer 1; Dx � Dz (cm) 1.0 � 2.6Layer 2 to 40; Dx � Dz (cm) 1.0 � 1.0Case 2: Layer 1; Dx � Dz (cm) 0.5 � 2.1Layer 2 to 80; Dx � Dz (cm) 0.5 � 0.5
Solution of flow equationMatrix solution technique PCGHead convergence value (m) 1 � 10�7
Flow convergence value (kg day�1) 1 � 10�7
Solution of transport equationAdvection term MOC; TVDCourant number 0.1MOC: NPMIN, NPMAX, NPLANE, NPL, NPH 4, 16, 2, 4, 8Dispersion and source terms GCGConcentration convergence value 1 � 10�7
232 R. Luyun Jr. et al. / Journal of Hydrology 377 (2009) 227–236

Author's personal copy
Retreating residual saltwater
We examined model results for retreating residual saltwaterusing MOC and TVD schemes for Cases 1 and 2. Case 1 with MOCpredicted the initial advance of the saltwater wedge but sincethe steady state toe position had been underestimated previously,the overall simulation was a poor match. This case also exhibited afaster attenuation, completing removal of residual saltwater inonly 15 h. The Case 1 TVD result accurately predicted the initialwedge advance but also exhibited a faster removal of the saltwaterthan experimentally achieved, completing the process in 18 h. ForCase 2, the MOC result closely predicted the initial advance of theresidual saltwater then exhibited a sudden increase in rate of salt-water removal before stabilizing at the same rate as the experi-ment, and finally completing saltwater removal in 21 h (Fig. 7a).The Case 2 TVD model result overshot the experimental initial ad-vance since it also overestimated the initial steady state toe posi-tion, but then showed a rate of saltwater removal that wasconsistent with the experiment completing the removal in 26 h(Fig. 7b). This Case 2 TVD result showed the best simulation matchto the experimental result.
In each case, the 0.5 isochlor lines eventually disappear, indicat-ing significant dispersion of the residual saltwater. The effects ofgrid resolution are clearly apparent by comparison. The coarser1.0 cm grid spacing resulted in faster attenuation and earlier com-plete removal of residual saltwater, while with the 0.5 cm grid, thesimulated transition zones and rate of removal are more consistentwith the experimental results.
The grid Peclet number (Pegrid) measures the sharpness of theconcentration front or the degree to which the transport problemis dominated by advection. A common criterion used to ensureaccurate results is Pegrid < 4 or the more severe condition Pegrid < 2(Huyakorn and Pinder, 1983; Voss and Souza, 1987). Although theabove inequality was proposed for finite-element and finite-differ-
ence based simulations of variable-density flow and transport, it isa commonly accepted constraint regardless of the method used tosolve the advection–dispersion equation (Brovelli et al., 2007). Inour case, both the 1.0 cm and 0.5 cm grid simulations are advectiondominated with Pegrid values of about 8 and 4, respectively. Moreaccurate solutions were not achieved because of the relatively highPegrid values. Although the Case 2 simulation is within the uppercriterion of Pegrid < 4, a grid spacing of 0.25 cm would yield a moreaccurate solution with Pegrid � 2. However, this would requireadditional computer memory and longer run times. We deemedthe grid resolution of our modeling exercise adequate for ourpurposes.
Discussion of model results
Consider the 20-cm cutoff wall experimental results and thenumerical results for Case 2 using the TVD method (Fig. 8). Thesimulation results display the saltwater intrusion wedge, velocityvector distribution, groundwater level, and relative concentrationprofile. The relative concentration (Cr) is defined as Cr = (q�qf)/
(a) 0.5 cm grid (MOC)
20
25
30
35
40
45
50
0 3 6 9 12 15 18 21 24Time (h)
0 3 6 9 12 15 18 21 24Time (h)
Toe
ofsa
ltwat
erw
edge
(cm
)
Experiment
0.1 isochlor
0.5 isochlor
(b) 0.5 cm grid (TVD)
20
25
30
35
40
45
50
Toe
ofsa
ltwat
erw
edge
(cm
)
Experiment
0.1 isochlor
0.5 isochlor
Fig. 7. Comparison of model-predicted transient positions of the residual saltwaterafter cutoff wall installation with experimental data for Case 2 (0.5 cm grid).
0 0.1 0.2 0.3 0.4 0.5 0.6 0.7 0.8 0.90
0.1
0.2
0.3
0.4Velocity (cm/s)
1E-005 0.1
0.1
0.3
0.5
0.7
0.9
a Steady state condition.
Distance m
Heightm
Cr
b Peak of advance of the residualsaltwater (20 min after wall installation).
c Attenuation of residual saltwater(12 h after wall installation).
0.1
0.3
0.5
0.7
0.9
0.1
0.3
0.5
0.7
0.9
0 0.1 0.2 0.3 0.4 0.5 0.6 0.7 0.8 0.90
0.1
0.2
0.3
0.4Velocity (cm/s)
1E-005 0.1
Distance m
Heightm
Cr
Distance m
Heightm
Cr
0 0.1 0.2 0.3 0.4 0.5 0.6 0.7 0.8 0.90
0.1
0.2
0.3
0.4Velocity (cm/s)
1E-005 0.1
Fig. 8. Comparison of experimental and numerical results for the 20-cm cutoff wall(dashed lines indicate the experimental results).
R. Luyun et al. / Journal of Hydrology 377 (2009) 227–236 233

Author's personal copy
(qs�qf) where q is the density of the fluid, qs is the saltwater den-sity and qf is the freshwater density. A Cr value of 0 corresponds tofreshwater and a Cr of 1 to the saltwater concentration. The relativeconcentration profile was in 0.1 isochlor intervals. The dashed linesmark the saltwater plume shape from the experiment for the sametime periods.
The initial steady state toe position predicted by the model forTVD was 46.2 cm at the 0.1 isochlor and 45.5 cm at the 0.5 isochlor,both numbers are high compared to the 43.7 cm measured in theexperiment (Figs. 6b and 8a). The MOC result (Fig. 6a) showed abetter fit with the experiment, at 44.5 cm and 44.0 cm for the 0.1and 0.5 isochlors, respectively. This equilibrium state was achievedafter about 2 h in both the experimental and numerical results. Theeffect of the cutoff wall slot is clearly apparent in the bulge of theexperimental result as compared to the smooth shape of the salt-water wedge in the model result. The mixing zone between the0.1 and 0.9 isochlors is about 1 cm, similar to that observed inthe experiment. Careful observation of the modeled flow patternsand relative concentration contours provided a clearer understand-ing of the residual saltwater behavior. The intruding saltwatervelocity vectors are quite small compared to the freshwater flowvelocities (Fig. 8a). Dispersion and diffusion take place at the salt-water and freshwater mixing zone and the freshwater flow trans-ported low concentration salt towards the outlet. Theequilibrium freshwater–saltwater wedge is maintained by the con-tinuous saltwater intrusion and density gradient is balanced by thefreshwater flow.
The experimental and numerical results at 20 min after cutoffwall installation showed a slight advance of the residual saltwater(Figs. 7b and 8b). The MOC result (Fig. 7a) predicted the peak at45.3 and 44.8 cm for the 0.1 and 0.5 isochlors, respectively. Thisis close to the 44.4 cm in the experiment. The TVD results are rel-atively high at 47.0 and 46.1 cm for the 0.1 and 0.5 isochlors,respectively. The general shape of the wedge however, matchedwell with that in the experiment. Upon installation of the cutoffwall, density gradient and the increase in freshwater level forcedthe residual saltwater plume to flatten out and appear to advance.The direction of the velocity vectors in the residual saltwater con-firms this behavior (Fig. 8b). In time, the freshwater flow balanced
the density effect and stopped the advance of the residual saltwa-ter. Dispersion developing at the upper part of the residual saltwa-ter wedge can also be observed indicating the start of lowconcentration salt removal by the freshwater. The flow patternsalso indicate increased velocity of the freshwater discharge overthe cutoff wall.
Attenuation and complete removal of residual saltwater wasaccurately predicted by the numerical model. We compared exper-imental and numerical results at 12 h after cutoff wall installation(Fig. 8c). Consider also the steady state numerical result for the 20-cm cutoff wall after complete removal of the residual saltwater(Fig. 9a). In the model, significant dispersion was observed in theupper portion of the residual saltwater although this was not muchapparent in the experimental observations. The 0.5 isochlor disap-peared after 9 h in the MOC result (Fig. 7a) and after 15 h in theTVD result (Fig. 7b). Similar to the saltpool experiments (Johannsenet al., 2002; Oswald and Kinzelbach, 2004) dispersive flux of salt iscarried with the freshwater as it flows along the mixing zone andover the cutoff wall. Salt is transported into the freshwater flowby diffusion and lateral dispersion and then carried to the outlet.The decreasing size of the residual saltwater plume and the weak-ening color concentration confirm this (Fig. 8c). Since the cutoffwall prevented additional supply of saltwater, there is a net fluxof salt flowing out over the wall and the residual saltwater plumein the storage area of the cutoff wall slowly but continuously de-creased. All the residual saltwater was eventually flushed out bythe freshwater discharge (Fig. 9a).
Effect of wall height
We performed additional numerical simulations of shorter cut-off walls to examine the effect of wall height on residual saltwaterremoval, using the same simulation parameters as in the 20 cmsimulation. There were marked differences in the final steady statecondition modeled for 20-, 10-, 9-, and 5-cm height cutoff walls(Figs. 9a–d). The 10-cm cutoff wall achieved a faster complete re-moval of residual saltwater than the 20-cm cutoff wall taking only21 h. This confirms the experimental results which showed that ashorter cutoff wall exhibited faster attenuation and earlier
0 0.1 0.2 0.3 0.4 0.5 0.6 0.7 0.8 0.90
0.1
0.2
0.3
0.4Velocity (cm/s)
1E-005 0.1
0 0.1 0.2 0.3 0.4 0.5 0.6 0.7 0.8 0.90
0.1
0.2
0.3
0.4Velocity (cm/s)
1E-005 0.1
0 0.1 0.2 0.3 0.4 0.5 0.6 0.7 0.8 0.90
0.1
0.2
0.3
0.4Velocity (cm/s)
1E-005 0.1
0 0.1 0.2 0.3 0.4 0.5 0.6 0.7 0.8 0.90
0.1
0.2
0.3
0.4Velocity (cm/s)
1E-005 0.1
b 10 cm cutoff wall (after 21 h)Distance m
Heightm
c 9 cm cutoff wall
Distance m
Heightm
d 5 cm cutoff wall
Distance m
Heightm
20 cm cutoff wall (after 26 h)Distance m
Heightm
Fig. 9. Steady state model results for 20, 11, 10, and 5 cm cutoff walls.
234 R. Luyun Jr. et al. / Journal of Hydrology 377 (2009) 227–236

Author's personal copy
complete removal of the residual saltwater than a higher wall.Residual saltwater was not completely removed in the case ofthe 9-and-5 cm walls. Both the 9-and 5-cm wall case exhibitedminimal retreat of residual saltwater (Fig. 9c and d).
These results revealed a minimum height requirement for cut-off walls below which residual saltwater will not be completelyflushed out. Flow patterns indicated a continuous flow of saltwaterover these shorter cutoff walls into the storage area such that lowconcentration saltwater flushed out by the freshwater dischargewas replaced with new saltwater. We further discovered that thecrests of the 10-, 9-and 5-cm cutoff walls are all below the mixingzone. The crest of the 10-cm wall however lies just below the mix-ing zone and the force of the freshwater discharge was able to pre-vent inflow of saltwater into the storage area behind the wall. Withthe 9-and 5-cm walls, there are enough clearance between the wallcrests and the mixing zone that freshwater discharge cannot pre-vent saltwater to flow into the storage area on the landward sideof the wall.
Consider again the area of intruding saltwater on the seawardside of the cutoff wall. In the experimental results in ‘‘Experimentalresults and discussion”, we discussed that this area increased uponinstallation of the cutoff wall in the 40-cm case. We cannot how-ever confirm this effect in the case of the 20-cm wall because ofthe irregularity in the saltwater wedge shape in the experiment.Using the model results, we can clearly see that the area of intrud-ing saltwater on the seaward side of the cutoff wall also increasedin the 20-cm wall (Fig. 9a) compared to the initial steady state salt-water wedge (Fig. 8a). The size increase is not that much comparedto the 40-cm experiment case because the increased freshwatervelocity at the crest (as shown in the flow pattern in Fig. 9a) ispushing the wedge downward. This flow condition established anew equilibrium and prevented further intrusion. The wall crestof the 40-cm wall is high such that any increased velocity at thecrest has negligible effect on the saltwater wedge. In the 10-cmhigh wall (Fig. 9b) on the other hand, the intruding saltwater areaactually decreased up to the tip of the crest. These results showthat reducing the cutoff wall height also reduces the expected riseof the intruding saltwater at the seaward side of the wall. Ofcourse, if the residual saltwater is not removed as in the 9-and5-cm wall cases (Fig. 9c and d), the intruding saltwater area willbe about the same as when the cutoff wall was not installed.
Tidal fluctuations were also not considered in this study but theeffect of tides may be easily accounted for by increasing the heightof the dam to cover for the highest expected sea level rise. Sincedesign height must also account for these saltwater increasesdue to tides and generally rising sea levels, we can say that residualsaltwater will be flushed out if the wall prevents inflow of saltwa-ter, that is, if wall height exceeds the thickness of the saltwaterwedge under steady state condition.
Conclusion
We conducted experiments and numerical studies to examinethe dynamics of residual saltwater after installation of cutoff walls.Experimental results showed that after installation of a cutoff wall,the residual saltwater wedge first flattens, causing the toe to ad-vance, then gradually attenuates and eventually is completely re-moved from the storage area on the landward side of the wall.The SEAWAT model adequately predicts the behavior of theadvancing saltwater intrusion wedge and the retreating residualsaltwater after cutoff wall installation using the transient toe posi-tion of the saltwater wedge as point of comparison. Careful analy-ses of the flow patterns and relative concentration contours fromthe model enabled us to explain the residual saltwater behaviordue to cutoff wall installation. Flow patterns indicated that as
freshwater flows along the mixing zone and over the cutoff wall,it transported dispersive flux of salt gradually removing the resid-ual saltwater. Since the inflow of saltwater is prevented, all theresidual saltwater was eventually removed from the storage areaof the cutoff wall. Our study have proven that saltwater trappedin an enclosing wall would be completely flushed out by the fresh-water flow from inland. This phenomenon proves that subsurfacedams may be effective not only in preventing saltwater intrusion,but also in reclaiming previously saline-intruded coastal aquifersfor freshwater storage and supply.
Our experimental and numerical results show that a shortercutoff wall achieves a faster residual saltwater removal rate thana higher cutoff wall. Shorter cutoff wall heights also reduce the ex-pected rise in the intruding saltwater area at the seaward side ofthe wall. We have shown that residual saltwater will be completelyflushed out when wall height exceeds the thickness of the saltwa-ter wedge at the cutoff wall location under steady state condition.These results imply that there is a potential for construction costsavings by installing shorter subsurface dams. The cutoff wall tobe installed only need to exceed the thickness of the saltwaterwedge at the desired location plus allowances to account for thetides and expected rise in seawater levels. We emphasize, there-fore, the importance of onsite investigation and monitoring todetermine the actual extent and thickness of saltwater intrusionwedges at locations of interest. By understanding the dynamicsof flow caused by the installation of cutoff walls, our results willhelp in future planning and design of subsurface dam structures.
Acknowledgements
We like to thank Mr. Sou Fujiyama for his help in the experi-ments and Dr. Ronny Berndtsson of Lund University, Sweden forhis encouragement and help in improving the article. We also liketo thank three anonymous reviewers for the comments and sug-gestions that significantly improved the manuscript.
References
Abarca, E., Vazquez-Suñe, E., Carrera, J., Capino, B., Gamez, D., Batlle, F., 2006.Optimal design of measures to correct seawater intrusion. Water ResourcesResearch 42, W09415. doi:10.1029/2005WR004524.
Ataie-Ashtiani, B., Volker, R.E., Lockington, D.A., 1999. Tidal effects on sea waterintrusion in unconfined aquifers. Journal of Hydrology 216, 17–31.
Bakker, M., Oude Essink, G.H.P., Langevin, C.D., 2004. The rotating movement ofthree immiscible fluids – a benchmark problem. Journal of Hydrology 287, 270–278.
Bauer, P., Held, R.J., Zimmermann, S., Linn, F., Kinzelbach, W., 2006. Coupled flowand salinity transport modelling in semi-arid environments: the Sahshe RiverValley, Botswana. Journal of Hydrology 316, 163–183.
Bear, J., Cheng, A.H.-D., 1999. Seawater intrusion in coastal aquifers – concepts,methods and practices. In: Bear, J., Cheng, A.H.-D., Sorek, S., Ouazar, D., Herrera,I. (Eds.), Theory and Applications of Transport in Porous Media, vol. 14. KluwerAcademic Publishers, Dordrecht, The Netherlands.
Brovelli, A., Mao, X., Barry, D.A., 2007. Numerical modeling of tidal influence ondensity-dependent contaminant transport. Water Resources Research 43,W10426. doi:10.1029/2006WR005173.
Dam, J.C. van, 1999. Seawater intrusion in coastal aquifers – concepts, methods andpractices. In: Bear, J., Cheng, A.H.-D., Sorek, S., Ouazar, D., Herrera, I. (Eds.),Theory and Applications of Transport in Porous Media, vol. 14. KluwerAcademic Publishers., Dordrecht, The Netherlands.
Diersch, H.-J.G., Kolditz, O., 2002. Variable-density flow and transport in porousmedia: approaches and challenges. Advances in Water Resources 25, 899–944.
Goswami, R.R., Clement, T.P., 2007. Laboratory-scale investigation of saltwaterintrusion dynamics. Water Resources Research 43, W04418. doi:10.1029/2006WR005151.
Guo, W., Langevin, C.D., 2002. User’s Guide to SEAWAT: A Computer Program forSimulation of Three-Dimensional Variable-Density Groundwater Flow. USGeological Survey Techniques of Water Resources Investigations 6-A7.Tallahassee, Florida.
Hanson, G., Nilsson, A., 1986. Ground-water dams for rural-water supplies indeveloping countries. Ground Water 24 (4), 497–506.
Harbaugh, A.W., Banta, E.R., Hill, M.C., McDonald, M.G., 2000. MODFLOW-2000, TheUS Geological Survey Modular Ground-Water Model – User Guide to
R. Luyun et al. / Journal of Hydrology 377 (2009) 227–236 235
Author's personal copy
Modularization Concepts and the Ground-Water Flow Process. USGS Open FileReport 00-92. Reston, Virginia.
Herbert, A.W., Jackson, C.P., Lever, D.A., 1988. Coupled groundwater flow and solutetransport with fluid density strongly dependent upon concentration. WaterResources Research 24 (10), 1781–1795.
Hill, M.C., 1990. Preconditioned Conjugate-Gradient 2 (PCG2), a Computer Programfor Solving Groundwater Flow Equations. US Geological Survey, Denver.
Holzbecher, E.O., 1998. Modeling Density-Driven Flow in Porous Media: Principles,Numerics, Software. Springer, Berlin.
Huyakorn, P.S., Pinder, G.F., 1983. Computational Methods in Subsurface Flow.Academic Press, New York.
Illangasekare, T. et al., 2006. Impacts of the 2004 tsunami on groundwater resourcesin Sri Lanka. Water Resources Research 42, W05201. doi:10.1029/2006WR004876.
Japan Green Resources Agency, 2004. Technical Reference for EffectiveGroundwater Development. Kanagawa, Japan.
Johannsen, K., Kinzelbach, W., Oswald, S., Wittum, G., 2002. The salt-poolbenchmark problem – numerical simulation of saltwater upconing in aporous medium. Advances in Water Resources 25 (3), 335–348.
Kolditz, O., Ratke, R., Diersch, H.-J.G., Zielke, W., 1998. Coupled groundwater flowand transport: 1. Verification of variable density flow and transport models.Advances in Water Resources 21 (1), 21–46.
Konikow, L.F., Bredehoeft, J.D., 1978. Computer Model of Two-Dimensional SoluteTransport and Dispersion in Ground Water. US Geological Survey. WaterResources Investigation, Book 7, 90 p (Chapter C2).
Konikow, L.F., Sanford, W.E., Campbell, P.J., 1997. Constant-concentration boundarycondition: lessons from the HYDROCOIN variable-density groundwaterbenchmark problem. Water Resources Research 33 (10), 2253–2261.
Langevin, C.D., 2003. Simulation of submarine ground water discharge to a marineestuary: Biscayne Bay, Florida. Ground Water 41 (6), 758–771.
Langevin, C.D., Guo, W., 2006. MODFLOW/MT3DMS-based simulation ofvariable-density ground water flow and transport. Ground Water 44 (3),339–351.
Langevin, C.D., Shoemaker, W.B., Guo, W., 2003. MODFLOW-2000, The US GeologicalSurvey Modular Ground-Water Model – Documentation of the SEAWAT-2000Version with the Variable-Density Flow Process (VDF) and the IntegratedMT3DMS Transport Process (IMT). USGS Open-File Report 03-426. Tallahassee,Florida.
Momii, K., Shoji, J., Nakagawa, K., 2005. Observations and modeling of seawaterintrusion for a small limestone island aquifer. Hydrological Processes 19, 3897–3909.
Nagata, S., Azuma, K., Asano, M., Nishijima, T., Shiiba, H., Yang, D.S., Nakata, R., 1994.Nakajima subsurface dam, water policy and management: solving theproblems. In: Proceedings of 21st Annual Conference on Water ResourcesPlanning and Management Div./ASCE. Denver, Colorado. <http://www.danielsandhouse.com/subsurface_dam.shtm>.
Nakagawa, K., Momii, K., Berndtsson, R., 2005. Saltwater intrusion in coastal aquifer– comparison between the CIP and MOC simulation technique. EnvironmentalModeling and Assessment 10, 323–329.
Nishigaki, M., Kankam-Yeboah, K., Komatsu, M., 2004. Underground damtechnology in some parts of the world. Journal of Groundwater Hydrology 46(2), 113–130.
Oldenburg, C.M., Pruess, K., 1995. Dispersive transport dynamics in a stronglycoupled groundwater-brine flow system. Water Resources Research 31 (2),289–302.
Organisation for Economic Co-operation and Development (OECD), 1988. TheInternational HYDROCOIN Project – level 1: Code Verification. Report 71617,Paris.
Oostrtom, M., Hayworth, J.S., Dane, J.H., Guven, O., 1992. Behavior of dense aqueousphase leachate plumes in homogeneous porous media. Water ResourcesResearch 28 (8), 2123–2134.
Osuga, K., 1997. In: Uitto, J.I., Schneider, J. (Eds.), The Development of GroundwaterResources on the Miyakojima Islands, Freshwater Resources in Arid lands.United Nations University Press, Tokyo. <http://www.unu.edu/unupress/unupbooks/uu02fe/uu02fe0c.htm>.
Oswald, S.E., Kinzelbach, W., 2004. Three-dimensional physical benchmarkexperiments to test variable-density flow models. Journal of Hydrology 290,22–42.
Oswald, S.E., Scheidegger, M.B., Kinzelbach, W., 2002. Time-dependentmeasurement of strongly density-dependent flow in a porous medium vianuclear magnetic resonance imaging. Transport in Porous Media 47, 169–193.
Oude Essink, G.H.P., 2001. Improving fresh groundwater supply – problems andsolutions. Ocean and Coastal Management 44, 429–449.
Pinder, G.F., Cooper, H.H., 1970. A numerical technique for calculating the transientposition of the saltwater front. Water Resources Research 6 (3), 885–892.
Shoemaker, W.B., 2004. Important observations and parameters for a salt waterintrusion model. Ground Water 42 (6), 829–840.
Simpson, M.J., Clement, T.P., 2004. Improving the worthiness of the Henry problemas a benchmark for density-dependent groundwater flow models. WaterResources Research 40, W01501.
Thorenz, C., Kosakowski, G., Kolditz, O., Berkowitz, B., 2002. An experimentaland numerical investigation of saltwater movement in coupled saturated–partially saturated systems. Water Resources Research 38 (6). doi:10.1029/2001WR000364.
Todd, D.K., 1959. Ground Water Hydrology. John Wiley & Sons, New York.Voss, C.I., Souza, W.R., 1987. Variable density flow and solute transport simulation
of regional aquifers containing a narrow freshwater–saltwater transition zone.Water Resources Research 23 (10), 1851–1866.
Youness, A., Ackerer, P.H., Mose, R., 1999. Modeling variable density flow and solutetransport in porous medium: 2. Re-evaluation of the salt dome flow problem.Transport in Porous Media 35, 375–394.
Zhang, Q., Volker, R.E., Lockington, D.A., 2001. Influence of seaward boundarycondition on contaminant transport in unconfined coastal aquifers. Journal ofContaminant Hydrology 49, 201–215.
Zheng, C., Wang, P.P., 1999. MT3DMS: A Modular Three-Dimensional MultispeciesTransport Model for Simulation of Advection, Dispersion and ChemicalReactions of Contaminants in Groundwater Systems. Vicksburg, Miss.Waterways Experiment Station, US Army Corps of Engineers.
236 R. Luyun Jr. et al. / Journal of Hydrology 377 (2009) 227–236
Copyright © 2022 FDOKUMEN