
New and modified anodic alumina membranes Part I. Thermotreatment of anodic alumina membranes
Lw
RSN
a
ARR2AA
KPHMSI
1
rbwehmch[
H
(owmCmL
0d
Journal of Membrane Science 389 (2012) 173– 181
Contents lists available at SciVerse ScienceDirect
Journal of Membrane Science
jo u rn al hom epa ge: www.elsev ier .com/ locate /memsci
a0.6Sr0.4Co0.2Fe0.8O3−ı microtubular membranes for hydrogen production fromater splitting
afael V. Franca, Alan Thursfield, Ian S. Metcalfe ∗
chool of Chemical Engineering and Advanced Materials, Laboratory of Applied Catalysis & Solid State Electrochemistry, University of Newcastle Upon Tyne, Merz Court NE1 7RU,ewcastle-upon-Tyne, United Kingdom
r t i c l e i n f o
rticle history:eceived 15 March 2011eceived in revised form9 September 2011ccepted 21 October 2011vailable online 25 October 2011
a b s t r a c t
Reactor modules consisting of four gas-tight microtubular membranes made of the mixed oxygen ionand electron conducting perovskite, La0.6Sr0.4Co0.2Fe0.8O3−ı have been tested for oxygen permeation andhydrogen production by membrane-based steam reforming, i.e., simultaneous syngas production cou-pled with water splitting. The membranes were subjected to two known axial temperature profiles inthe temperature of 900 ◦C. The microtubes showed good stability under reaction conditions, operatingover a total operation period of ca 400 h of oxygen permeation followed by ca 400 h of steam reforming.
eywords:erovskiteydrogen productionicrotubular membranes
team reformingnduction period
An induction period of approximately 30 h was observed before steam reforming commenced. Both themethane and water side outlet gas compositions were measured which allowed for accurate materialbalance; this indicated that the hydrogen production occurred due to oxygen flux across the membraneand not just surface reaction. Post operation analysis of the microtubes revealed the presence of a stron-tium enriched dense layer on the water exposed membrane surface and of crystallites enriched withcobalt and sulfur on the methane feed side surface.
. Introduction
Producing hydrogen from widely and freely available wateremains a major challenge because of its thermodynamic sta-ility; �G for water dissociation is zero at 4330 K [1]. Earlierork has focused on using solar heat to provide the thermal
nergy to achieve this; such temperature requirements imposeigh demands on reactors. Later work using oxide anion transportembranes (OTMs) at 1400–1800 ◦C indicated that the equilibrium
an be driven to the product side providing an enhancement inydrogen conversion as oxygen is removed across the membrane2,3].
2O(g) ↔ 12
O(g) + H2(g) (1)
Following this, mixed oxygen ion and electron conductingMIEC) OTMs capable of providing high oxygen fluxes were used inrder to lower the required operating temperature by coupling theater splitting with another reaction. To date, MIEC membraneaterials used for water splitting have included composites of
eO2–Gd–Ni and CeO2–Gd–NiO [4,5] and perovskite-type mixedetal oxides; BaCoxFeyZr1−x−yO3−ı [6–9], La0.3Sr0.7FeO3−ı [10],
a0.7Sr0.3FeO3−ı [11], La0.7Sr0.3Cu0.2Fe0.8O3−ı [12,13], and the
∗ Corresponding author. Tel.: +44 191 222 5279; fax: +44 191 222 5292.E-mail address: [email protected] (I.S. Metcalfe).
376-7388/$ – see front matter © 2011 Elsevier B.V. All rights reserved.oi:10.1016/j.memsci.2011.10.027
© 2011 Elsevier B.V. All rights reserved.
non-perovskite SrFeCo0.5Ox [14]. These membranes have beenused to investigate the feasibility of combining the partial oxi-dation of methane (POM) to syngas [7–9] with water splitting toproduce syngas and a separate hydrogen stream. Methane reactswith lattice oxygen, OO (using Kröger–Vink notation), to producesyngas, oxygen vacancies, V ••
O and electrons.
CH4(g) + OO → CO(g) + 2H2(g) + V••O + 2e− (2)
Water reacts with oxygen vacancies and electrons on the otherside of the membrane to produce lattice oxygen and hydrogen.
H2O(g) + V••O + 2e− ↔ OO + H2(g) (3)
The co-diffusion of oxygen vacancies and electrons in the MIECmembrane can be described by Wagner’s model of ambipolar dif-fusion [15]. Overall the reaction is endothermic steam reformingof methane:
CH4(g) + H2O(g) → CO(g) + 3H2(g), �H◦298 K = +206 kJ mol−1
(4)
In addition to this, the water–gas shift (WGS) reaction is also acandidate for clean hydrogen production and has attracted recent
attention in membrane reactors [10]. In this case carbon monoxideis used to remove oxygen from one side of the membrane.CO(g) + OO → CO2(g) + V••O + 2e− (5)

174 R.V. Franca et al. / Journal of Membran
R
C
atwmttiibrsafs[itbecha(
rmanobhbftmmWamism
2
2
mechrp
sealant tends to become porous, raising doubts as to its suitabilityfor this application.
In order to monitor the gas composition at the outlets fromthe shell side and lumen side of the membranes, two gas chro-
Fig. 1. Schematic diagram of membrane-based steam reforming at 900 ◦C.
esulting in the overall reaction
O(g) + H2O(g) → CO2(g) + H2(g), �H◦298 K = −41 kJ mol−1 (6)
Most studies have been performed using disk membranes in anttempt to simplify the interpretation of results. Future applica-ion of such membranes will require high surface area and reducedall thickness to minimise resistance to oxygen transport whileaintaining mechanical strength. Microtubular membrane geome-
ries meet this requirement and also provide a way to avoid highemperature sealing problems as long membrane lengths can facil-tate “cold” sealing [16,17]. However typically employed furnacesmpose a temperature profile along the axis of microtubular mem-ranes giving rise to a continuum of different oxygen permeationates along the membrane peaking at the centre, therefore, theum effect of this is measured at the outlet. One method used inn attempt to ensure that only the central linear hot zone of theurnace is affectively “active” is to pacify the shell-side membraneurface (the outer surface) with a blocking layer of gold, for example18]. However differences in thermal expansion can cause delam-nation of this layer and solid state reaction may occur betweenhe blocking layer and membrane material. The durability of mem-ranes operating under process conditions is a point rarely fullyxplored; often the duration of experiments is not stated or data isollected over a short period of time. Another issue is that of carbon,ydrogen and oxygen mass balances which are often not performedt all or only partially when the composition of the water-splittinghydrogen production) side of the membrane reactor is analysed.
In this contribution we report on the membrane-based steameforming of methane across La0.6Sr0.4Co0.2Fe0.8O3−ı (LSCF6428)icrotubular membranes for the production of separate hydrogen
nd syngas streams (Fig. 1). Previous work has lacked the detailecessary to conclusively prove that hydrogen production is due toxygen permeation across the membrane (e.g. a perovskite mem-rane can store and release oxygen; a reduced surface will produceydrogen over some period of time without net oxygen permeationeing required). We therefore analyse the exit gas compositionrom both sides of the membrane and obtain material balanceso demonstrate permeation (as opposed to dynamic changes in
embrane state) and we operate over long durations where per-eation is more important than dynamic surface redox processes.e investigate the difference in performance when the membranes
re subjected to two known axial temperature profiles and com-ent on membrane failure. In addition, post-operation analysis
s undertaken for both the shell-side and lumen-side (the coreide) membrane surfaces following exposure to water vapour andethane, respectively.
. Experimental
.1. Materials and characterisation
The dense gas-tight LSCF6428 microtube membranes wereanufactured by the phase-inversion/sintering method described
lsewhere [16] using commercial powders manufactured by
ombustion spray-pyrolysis (Praxair). The sintered microtubesad an outer diameter and inner diameter of 1.5 mm and 1 mm,espectively and a total length of 30 cm. Crystallinity and phaseurity were determined by powder X-ray diffraction (XRD) using ae Science 389 (2012) 173– 181
PANalytical X‘Pert Pro Multipurpose Diffractometer (PW3040/60)fitted with an X‘Celerator and a secondary monochromator. Fordata acquisition, the Cu anode was supplied with 40 kV and acurrent of 40 mA to generate Cu K-� radiation (� = 1.54180 A) orCu K-�1 (� = 1.54060 A). A nominal step size of 0.0334 two-thetaand time per step of 100 s in continuous mode was routinely used.A Rontec Quantax 1.2 FEI XL30 ESEM-FEG system was used tocarry out microstructure characterisation by scanning electronmicroscopy (SEM) and elemental analysis by energy dispersiveX-ray spectroscopy (EDS).
2.2. Membrane reactor apparatus and gas analysis
Two membrane modules of the same dimensions were con-structed and each comprised of four microtubes. The design of themodule is described elsewhere [19], the only difference being thatACC Silicoset 158 silicone sealant (composition; 1–5% diacetoxy-di-tertbutoxy silane and 1–5% methyl triacetoxy silane) was used inthis work. The membrane module was placed inside a furnace (Vec-star Furnaces, UK) which was used to heat the membranes usinga programmed temperature ramp of 0.5 ◦C min−1 to the requiredoperating temperature which was measured by an internal ther-mocouple. The gas flow through the lumen side is plug flow and inthe shell side can be described as well mixed (from residence timedistribution experiments – not reported). Two custom-made fur-naces were used to run the experiments. One furnace had a totallength of 10 cm and bore diameter 5 cm (short length and widebore, SW) and the other of length 15 cm with a bore diameter of4 cm (long length and narrow bore, LN). Temperature profiles atthe interior of the reactor module recorded at the set-point tem-perature of 900 ◦C for the SW and LN furnaces are presented in Fig. 2.Isothermal zone lengths of 3 cm and 5 cm were measured using theSW furnace and LN furnace, respectively. The temperature at thesealing points was ca 100 ◦C in both cases. The experimental setupensures the sealing points are situated in the “cold” zone outsideof the furnace but creates the problem of different oxygen fluxesalong the length of the membranes due to the temperature pro-file inside the reactor. In previous test experiments it was foundthat the “cold” zones were unsuccessfully blanked off using com-mercial water based glass-ceramic sealant. Although this materialcould withstand high temperatures, it did not allow the microtubesto bend (necessary when exposed to high temperatures due to themembranes’ thermal expansion) causing mechanical stress leadingto fracture. In addition, post operation inspection indicated that the
Fig. 2. SW and LN furnaces internal temperature profile of reactor at 900 ◦C. Hor-izontal lines indicate: (a) total heated length of membranes using SW furnace, (b)total heated length of membranes using LN furnace and (c) total length of mem-branes used during the experiments.
R.V. Franca et al. / Journal of Membrane Science 389 (2012) 173– 181 175
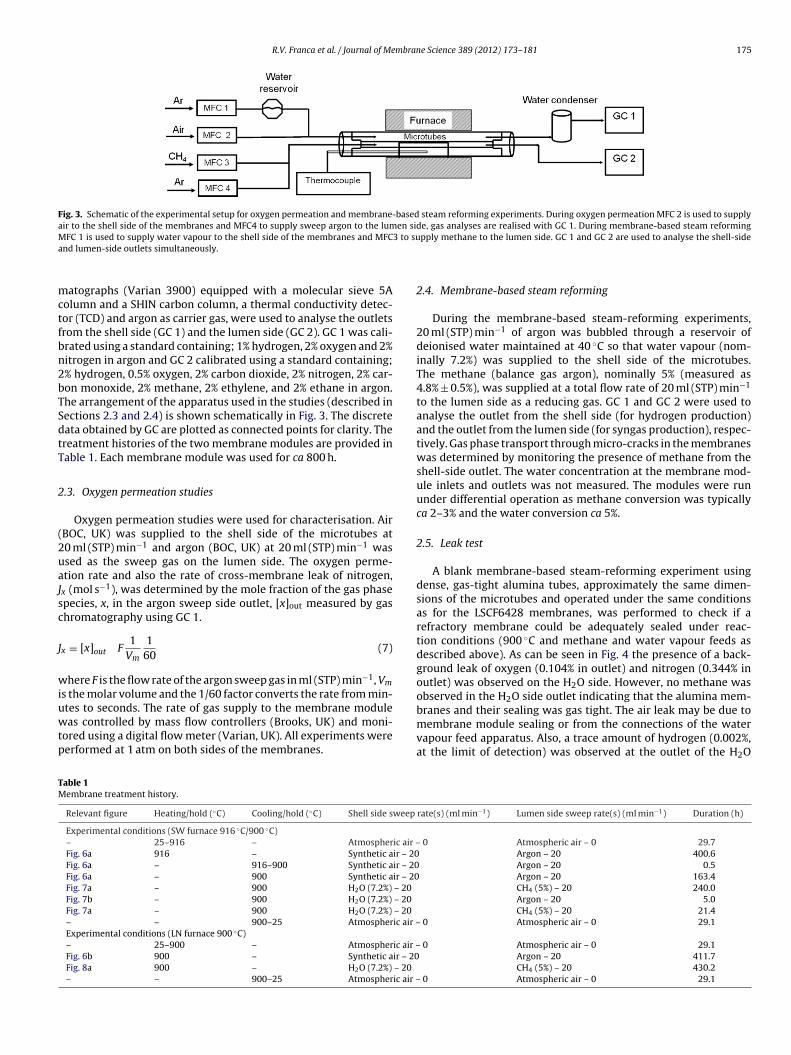
Fig. 3. Schematic of the experimental setup for oxygen permeation and membrane-based steam reforming experiments. During oxygen permeation MFC 2 is used to supplyair to the shell side of the membranes and MFC4 to supply sweep argon to the lumen side, gas analyses are realised with GC 1. During membrane-based steam reformingM 3 to sua
mctfbn2bTSdtT
2
(2uaJsc
J
wiuwtp
TM
FC 1 is used to supply water vapour to the shell side of the membranes and MFCnd lumen-side outlets simultaneously.
atographs (Varian 3900) equipped with a molecular sieve 5Aolumn and a SHIN carbon column, a thermal conductivity detec-or (TCD) and argon as carrier gas, were used to analyse the outletsrom the shell side (GC 1) and the lumen side (GC 2). GC 1 was cali-rated using a standard containing; 1% hydrogen, 2% oxygen and 2%itrogen in argon and GC 2 calibrated using a standard containing;% hydrogen, 0.5% oxygen, 2% carbon dioxide, 2% nitrogen, 2% car-on monoxide, 2% methane, 2% ethylene, and 2% ethane in argon.he arrangement of the apparatus used in the studies (described inections 2.3 and 2.4) is shown schematically in Fig. 3. The discreteata obtained by GC are plotted as connected points for clarity. Thereatment histories of the two membrane modules are provided inable 1. Each membrane module was used for ca 800 h.
.3. Oxygen permeation studies
Oxygen permeation studies were used for characterisation. AirBOC, UK) was supplied to the shell side of the microtubes at0 ml (STP) min−1 and argon (BOC, UK) at 20 ml (STP) min−1 wassed as the sweep gas on the lumen side. The oxygen perme-tion rate and also the rate of cross-membrane leak of nitrogen,
x (mol s−1), was determined by the mole fraction of the gas phasepecies, x, in the argon sweep side outlet, [x]out measured by gashromatography using GC 1.
x = [x]out F1
Vm
160
(7)
here F is the flow rate of the argon sweep gas in ml (STP) min−1, Vm
s the molar volume and the 1/60 factor converts the rate from min-
tes to seconds. The rate of gas supply to the membrane moduleas controlled by mass flow controllers (Brooks, UK) and moni-ored using a digital flow meter (Varian, UK). All experiments wereerformed at 1 atm on both sides of the membranes.
able 1embrane treatment history.
Relevant figure Heating/hold (◦C) Cooling/hold (◦C) Shell side sweep
Experimental conditions (SW furnace 916 ◦C/900 ◦C)– 25–916 – Atmospheric air –Fig. 6a 916 – Synthetic air – 20Fig. 6a – 916–900 Synthetic air – 20Fig. 6a – 900 Synthetic air – 20Fig. 7a – 900 H2O (7.2%) – 20
Fig. 7b – 900 H2O (7.2%) – 20
Fig. 7a – 900 H2O (7.2%) – 20
– – 900–25 Atmospheric air –Experimental conditions (LN furnace 900 ◦C)– 25–900 – Atmospheric air –Fig. 6b 900 – Synthetic air – 20Fig. 8a 900 – H2O (7.2%) – 20
– – 900–25 Atmospheric air –
pply methane to the lumen side. GC 1 and GC 2 are used to analyse the shell-side
2.4. Membrane-based steam reforming
During the membrane-based steam-reforming experiments,20 ml (STP) min−1 of argon was bubbled through a reservoir ofdeionised water maintained at 40 ◦C so that water vapour (nom-inally 7.2%) was supplied to the shell side of the microtubes.The methane (balance gas argon), nominally 5% (measured as4.8% ± 0.5%), was supplied at a total flow rate of 20 ml (STP) min−1
to the lumen side as a reducing gas. GC 1 and GC 2 were used toanalyse the outlet from the shell side (for hydrogen production)and the outlet from the lumen side (for syngas production), respec-tively. Gas phase transport through micro-cracks in the membraneswas determined by monitoring the presence of methane from theshell-side outlet. The water concentration at the membrane mod-ule inlets and outlets was not measured. The modules were rununder differential operation as methane conversion was typicallyca 2–3% and the water conversion ca 5%.
2.5. Leak test
A blank membrane-based steam-reforming experiment usingdense, gas-tight alumina tubes, approximately the same dimen-sions of the microtubes and operated under the same conditionsas for the LSCF6428 membranes, was performed to check if arefractory membrane could be adequately sealed under reac-tion conditions (900 ◦C and methane and water vapour feeds asdescribed above). As can be seen in Fig. 4 the presence of a back-ground leak of oxygen (0.104% in outlet) and nitrogen (0.344% inoutlet) was observed on the H2O side. However, no methane wasobserved in the H2O side outlet indicating that the alumina mem-
branes and their sealing was gas tight. The air leak may be due tomembrane module sealing or from the connections of the watervapour feed apparatus. Also, a trace amount of hydrogen (0.002%,at the limit of detection) was observed at the outlet of the H2Orate(s) (ml min−1) Lumen side sweep rate(s) (ml min−1) Duration (h)
0 Atmospheric air – 0 29.7 Argon – 20 400.6 Argon – 20 0.5 Argon – 20 163.4
CH4 (5%) – 20 240.0Argon – 20 5.0CH4 (5%) – 20 21.4
0 Atmospheric air – 0 29.1
0 Atmospheric air – 0 29.1 Argon – 20 411.7
CH4 (5%) – 20 430.2 0 Atmospheric air – 0 29.1

176 R.V. Franca et al. / Journal of Membrane Science 389 (2012) 173– 181
F ◦
ts
sht
3
3
mosFnt
(f5ssts
3
tcbttTsgfllTca
nampncm
ig. 4. Blank membrane-based reforming at 900 C using alumina tubes to simulatehe microtubes. Lumen side was supplied with methane (5%) at 20 ml min−1 and thehell side with water vapour (7.2%) at 20 ml min−1.
ide indicating a very low water-splitting activity. Any significantydrogen production can therefore be attributed to the presence ofhe perovskite microtubular membranes.
. Results and discussion
.1. Characterisation
XRD of the lumen-side and shell-side surfaces of unused freshembranes (not presented) indicated the presence of a single per-
vskite phase and the absence of foreign phases. Images of theurfaces and cross-section of the fresh microtubes are provided inig. 5. Spot EDS analysis (not presented) of the fresh microtubes didot show the presence of foreign elements or segregation of any ofhe constituents of the perovskite.
As can be seen on the lumen-side surface of the microtubesFig. 5a) the grains are connected with clear grain boundaries, sur-ace cavities are also present. The grain size ranges from ca 1 to
�m. The shell-side surface (Fig. 5b) shows an irregular roughurface. An irregular circular cross-section could be observed ashown in Fig. 5c indicating wall thickness of ca 250 �m. The micro-ubes possess enclosed finger-like pores that are visible in the crossection but do not communicate with either membrane surface.
.2. Oxygen permeation studies
For the purposes of this study, the oxygen permeation inves-igation was first undertaken using both furnaces to verify theapability of the membranes to permeate oxygen. Generally, as cane seen in Fig. 6a and b, the microtubes could permeate oxygen con-inuously for at least 400 h. The presence of nitrogen in the outlet ofhe sweep side was observed in both experiments at similar levels.he oxygen permeation rate is adjusted to take this into account byubtracting the rate of oxygen leakage based on the rate of nitro-en leakage (assuming a 1:4 oxygen:nitrogen ratio). Furthermore,uctuations of the calculated oxygen and nitrogen permeation and
eakage rates can be seen in both oxygen permeation experiments.his may be related to actual fluctuation in permeation rates orould be as a result of fluctuations in inlet flow rates or temperaturend/or pressure.
Using the SW furnace (Fig. 6a) the oxygen permeation anditrogen leakage rates at 916 ◦C were initially ca 0.25 �mol O2 s−1
nd 0.08 �mol N2 s−1 respectively indicating mainly oxygen per-eation through solid state transport. Over time the oxygen
−1
ermeation gradually increased to ca 0.33 �mol O2 s and theitrogen leakage rate decreased to ca 0.03 �mol N2 s−1 and wasonstant during the remainder of this experiment. The behaviouray be associated to slow disordering of oxygen vacancies causingFig. 5. SEM images of the fresh (a) lumen-side surface of the microtubes, (b) theshell-side surface and (c) cross-section.
the gradual increase of the oxygen permeation rate. After 400 h at916 ◦C the temperature was lowered to 900 ◦C to probe sensitiv-ity to small temperature changes. The rate of oxygen permeationdecreased over 2 h to 0.30 �mol O2 s−1 showing the expecteddependence on temperature. Over the next 150 h at this temper-ature the fluctuations in the rate continued but the underlyingpermeation rate remained constant.
Using the LN furnace (Fig. 6b) the initial oxygen perme-ation and nitrogen leakage rates were ca 0.15 �mol O2 s−1 and0.04 N2 �mol s−1 respectively. After 200 h the nitrogen leakage ratedecreased to ca 0.03 �mol N2 s−1 and then remained constant. Theoxygen permeation rate gradually increased during the first 300 hof the experiment, reaching the highest value of 0.24 �mol O2 s−1,followed by a decrease over 10 h back to the starting value of ca
0.15 �mol O2 s−1. The membranes used in the LN furnace gave alower oxygen permeation rate than those used in the SW furnace.This is unexpected as the LN furnace has a longer central hot zone;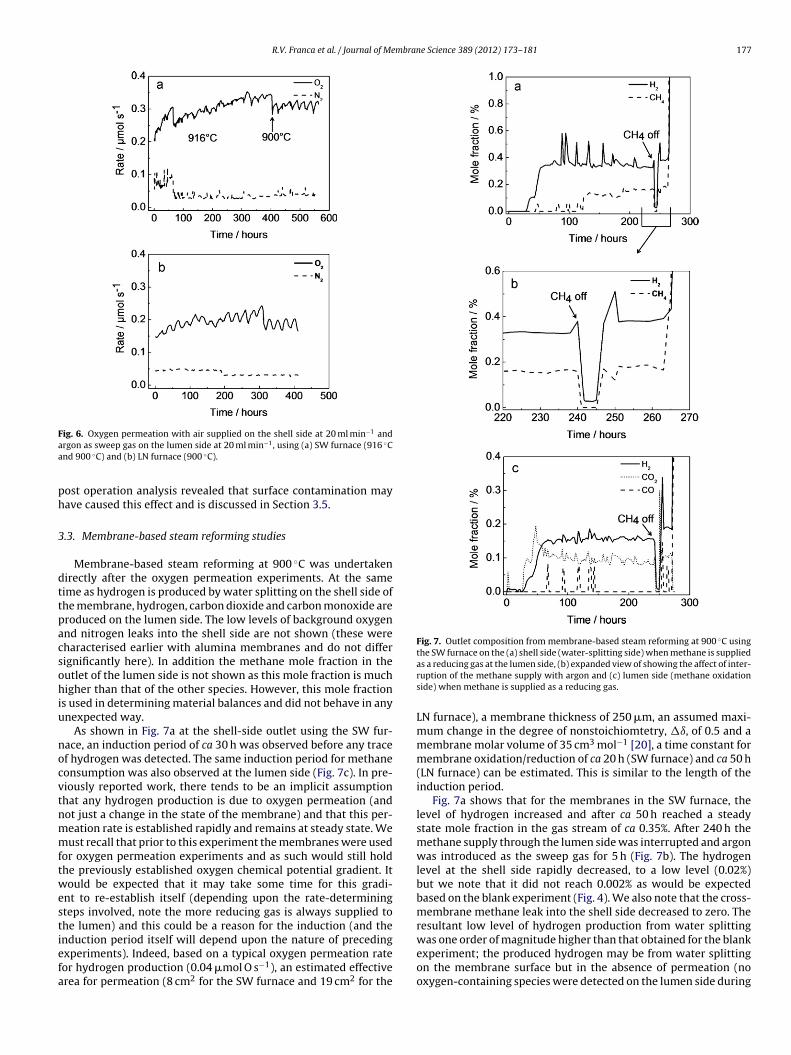
R.V. Franca et al. / Journal of Membrane Science 389 (2012) 173– 181 177
F −1
aa
ph
3
dttpacsohiu
nocvtnmmftwestiefa
Fig. 7. Outlet composition from membrane-based steam reforming at 900 ◦C usingthe SW furnace on the (a) shell side (water-splitting side) when methane is supplied
ig. 6. Oxygen permeation with air supplied on the shell side at 20 ml min andrgon as sweep gas on the lumen side at 20 ml min−1, using (a) SW furnace (916 ◦Cnd 900 ◦C) and (b) LN furnace (900 ◦C).
ost operation analysis revealed that surface contamination mayave caused this effect and is discussed in Section 3.5.
.3. Membrane-based steam reforming studies
Membrane-based steam reforming at 900 ◦C was undertakenirectly after the oxygen permeation experiments. At the sameime as hydrogen is produced by water splitting on the shell side ofhe membrane, hydrogen, carbon dioxide and carbon monoxide areroduced on the lumen side. The low levels of background oxygennd nitrogen leaks into the shell side are not shown (these wereharacterised earlier with alumina membranes and do not differignificantly here). In addition the methane mole fraction in theutlet of the lumen side is not shown as this mole fraction is muchigher than that of the other species. However, this mole fraction
s used in determining material balances and did not behave in anynexpected way.
As shown in Fig. 7a at the shell-side outlet using the SW fur-ace, an induction period of ca 30 h was observed before any tracef hydrogen was detected. The same induction period for methaneonsumption was also observed at the lumen side (Fig. 7c). In pre-iously reported work, there tends to be an implicit assumptionhat any hydrogen production is due to oxygen permeation (andot just a change in the state of the membrane) and that this per-eation rate is established rapidly and remains at steady state. Weust recall that prior to this experiment the membranes were used
or oxygen permeation experiments and as such would still holdhe previously established oxygen chemical potential gradient. Itould be expected that it may take some time for this gradi-
nt to re-establish itself (depending upon the rate-determiningteps involved, note the more reducing gas is always supplied tohe lumen) and this could be a reason for the induction (and the
nduction period itself will depend upon the nature of precedingxperiments). Indeed, based on a typical oxygen permeation rateor hydrogen production (0.04 �mol O s−1), an estimated effectiverea for permeation (8 cm2 for the SW furnace and 19 cm2 for theas a reducing gas at the lumen side, (b) expanded view of showing the affect of inter-ruption of the methane supply with argon and (c) lumen side (methane oxidationside) when methane is supplied as a reducing gas.
LN furnace), a membrane thickness of 250 �m, an assumed maxi-mum change in the degree of nonstoichiomtetry, �ı, of 0.5 and amembrane molar volume of 35 cm3 mol−1 [20], a time constant formembrane oxidation/reduction of ca 20 h (SW furnace) and ca 50 h(LN furnace) can be estimated. This is similar to the length of theinduction period.
Fig. 7a shows that for the membranes in the SW furnace, thelevel of hydrogen increased and after ca 50 h reached a steadystate mole fraction in the gas stream of ca 0.35%. After 240 h themethane supply through the lumen side was interrupted and argonwas introduced as the sweep gas for 5 h (Fig. 7b). The hydrogenlevel at the shell side rapidly decreased, to a low level (0.02%)but we note that it did not reach 0.002% as would be expectedbased on the blank experiment (Fig. 4). We also note that the cross-membrane methane leak into the shell side decreased to zero. Theresultant low level of hydrogen production from water splitting
was one order of magnitude higher than that obtained for the blankexperiment; the produced hydrogen may be from water splittingon the membrane surface but in the absence of permeation (nooxygen-containing species were detected on the lumen side during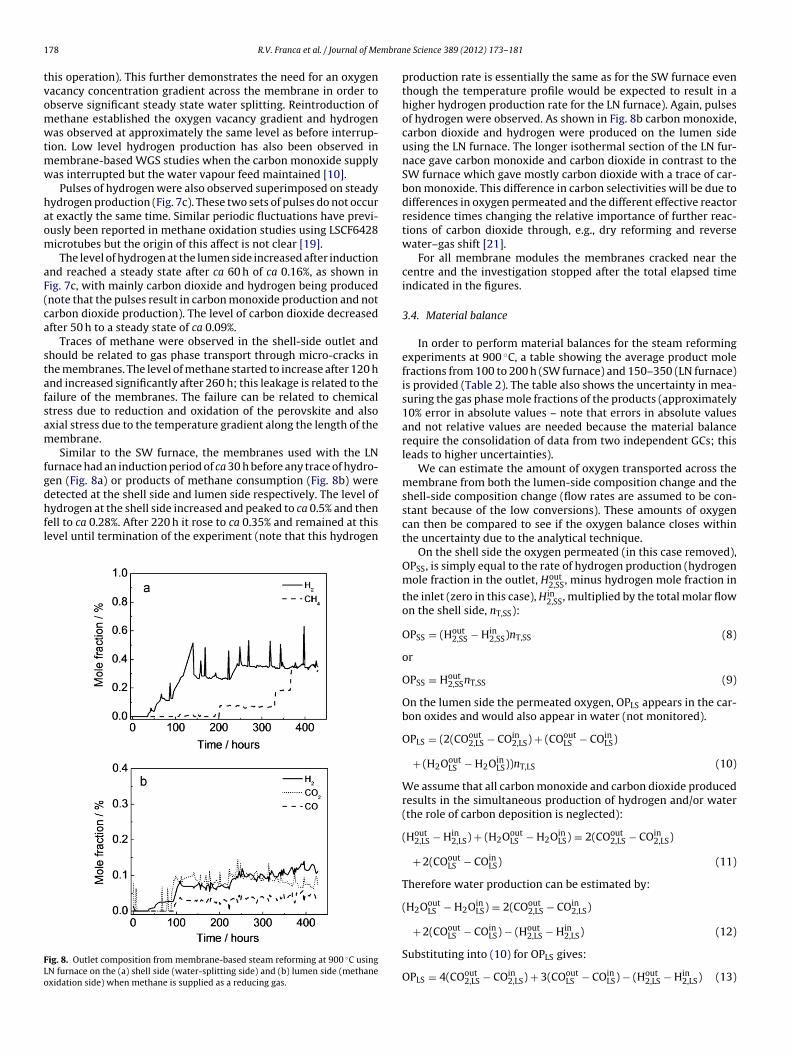
1 mbran
tvomwtmw
haom
aF(ca
stafsam
fgdhfl
FLo
78 R.V. Franca et al. / Journal of Me
his operation). This further demonstrates the need for an oxygenacancy concentration gradient across the membrane in order tobserve significant steady state water splitting. Reintroduction ofethane established the oxygen vacancy gradient and hydrogenas observed at approximately the same level as before interrup-
ion. Low level hydrogen production has also been observed inembrane-based WGS studies when the carbon monoxide supplyas interrupted but the water vapour feed maintained [10].
Pulses of hydrogen were also observed superimposed on steadyydrogen production (Fig. 7c). These two sets of pulses do not occurt exactly the same time. Similar periodic fluctuations have previ-usly been reported in methane oxidation studies using LSCF6428icrotubes but the origin of this affect is not clear [19].The level of hydrogen at the lumen side increased after induction
nd reached a steady state after ca 60 h of ca 0.16%, as shown inig. 7c, with mainly carbon dioxide and hydrogen being producednote that the pulses result in carbon monoxide production and notarbon dioxide production). The level of carbon dioxide decreasedfter 50 h to a steady state of ca 0.09%.
Traces of methane were observed in the shell-side outlet andhould be related to gas phase transport through micro-cracks inhe membranes. The level of methane started to increase after 120 hnd increased significantly after 260 h; this leakage is related to theailure of the membranes. The failure can be related to chemicaltress due to reduction and oxidation of the perovskite and alsoxial stress due to the temperature gradient along the length of theembrane.Similar to the SW furnace, the membranes used with the LN
urnace had an induction period of ca 30 h before any trace of hydro-en (Fig. 8a) or products of methane consumption (Fig. 8b) were
etected at the shell side and lumen side respectively. The level ofydrogen at the shell side increased and peaked to ca 0.5% and thenell to ca 0.28%. After 220 h it rose to ca 0.35% and remained at thisevel until termination of the experiment (note that this hydrogen
ig. 8. Outlet composition from membrane-based steam reforming at 900 ◦C usingN furnace on the (a) shell side (water-splitting side) and (b) lumen side (methanexidation side) when methane is supplied as a reducing gas.
e Science 389 (2012) 173– 181
production rate is essentially the same as for the SW furnace eventhough the temperature profile would be expected to result in ahigher hydrogen production rate for the LN furnace). Again, pulsesof hydrogen were observed. As shown in Fig. 8b carbon monoxide,carbon dioxide and hydrogen were produced on the lumen sideusing the LN furnace. The longer isothermal section of the LN fur-nace gave carbon monoxide and carbon dioxide in contrast to theSW furnace which gave mostly carbon dioxide with a trace of car-bon monoxide. This difference in carbon selectivities will be due todifferences in oxygen permeated and the different effective reactorresidence times changing the relative importance of further reac-tions of carbon dioxide through, e.g., dry reforming and reversewater–gas shift [21].
For all membrane modules the membranes cracked near thecentre and the investigation stopped after the total elapsed timeindicated in the figures.
3.4. Material balance
In order to perform material balances for the steam reformingexperiments at 900 ◦C, a table showing the average product molefractions from 100 to 200 h (SW furnace) and 150–350 (LN furnace)is provided (Table 2). The table also shows the uncertainty in mea-suring the gas phase mole fractions of the products (approximately10% error in absolute values – note that errors in absolute valuesand not relative values are needed because the material balancerequire the consolidation of data from two independent GCs; thisleads to higher uncertainties).
We can estimate the amount of oxygen transported across themembrane from both the lumen-side composition change and theshell-side composition change (flow rates are assumed to be con-stant because of the low conversions). These amounts of oxygencan then be compared to see if the oxygen balance closes withinthe uncertainty due to the analytical technique.
On the shell side the oxygen permeated (in this case removed),OPSS, is simply equal to the rate of hydrogen production (hydrogenmole fraction in the outlet, Hout
2,SS, minus hydrogen mole fraction in
the inlet (zero in this case), Hin2,SS, multiplied by the total molar flow
on the shell side, nT,SS):
OPSS = (Hout2,SS − Hin
2,SS)nT,SS (8)
or
OPSS = Hout2,SSnT,SS (9)
On the lumen side the permeated oxygen, OPLS appears in the car-bon oxides and would also appear in water (not monitored).
OPLS = (2(COout2,LS − COin
2,LS) + (COoutLS − COin
LS)
+ (H2OoutLS − H2Oin
LS))nT,LS (10)
We assume that all carbon monoxide and carbon dioxide producedresults in the simultaneous production of hydrogen and/or water(the role of carbon deposition is neglected):
(Hout2,LS − Hin
2,LS) + (H2OoutLS − H2Oin
LS) = 2(COout2,LS − COin
2,LS)
+ 2(COoutLS − COin
LS) (11)
Therefore water production can be estimated by:
(H2OoutLS − H2Oin
LS) = 2(COout2,LS − COin
2,LS)
out in out in
+ 2(COLS − COLS) − (H2,LS − H2,LS) (12)Substituting into (10) for OPLS gives:
OPLS = 4(COout2,LS − COin
2,LS) + 3(COoutLS − COin
LS) − (Hout2,LS − Hin
2,LS) (13)
R.V. Franca et al. / Journal of Membrane Science 389 (2012) 173– 181 179
Table 2Average mole fractions of products from membrane-based steam reforming at 900 ◦C using SW furnace (between 100 and 200 h) and LN furnace (between 150 and 350 h).
H2out (%) CH4
out (%) COout (%) CO2out (%)
SW furnaceShell side (SS) 0.366 ± 0.036 0.102 ± 0.010 – –Lumen side (LS) 0.159 ± 0.016 4.095 ± 0.409 0.011 ± 0.001 0.094 ± 0.009LN furnaceShell side (SS) 0.330 ± 0.033 0.064 ± 0.006 – –
01 ± 0
Of
O
Bt(rt0ssLbabwtswi
o2dmtLt(at
S
Tait
S
Ta
3
t(f(un
The shell-side membrane surface in the hot zone using the LN fur-nace also had needle like crystals (Fig. 11b), which were morepronounced than those formed using the SW furnace (Fig. 10b).
Lumen side (LS) 0.087 ± 0.008 4.1
r in the case of none of these components being present in theeed:
PLS = (4COout2,LS + 3COout
LS − Hout2,LS)nT,LS (14)
ased upon the above expressions for the experiments, usinghe SW furnace, the rate of oxygen removal from the shell sideOPSS) is 0.054 ± 0.005 �mol O s−1 and the oxygen permeationate to the lumen side (OPLS) is 0.037 ± 0.01 �mol O s−1. Usinghe LN furnace, OPSS and OPLS are 0.049 ± 0.005 �mol O s−1 and.056 ± 0.01 �mol O s−1, respectively. The values of OPSS and OPLShow that within measurement error the oxygen removed from thehell side matches the oxygen permeated to the lumen side for theN experiment. For the SW experiment there is some disagreementut the error is relatively small compared to the flux and does notppear to be a cause for concern. The closure of the oxygen materialalance is supporting evidence that the hydrogen production fromater splitting is directly related to the oxygen permeation flux
hrough the membrane. The carbon balance closed within the mea-urement uncertainty. Furthermore, after 400 h of operation thereere no visible signs of carbon build up anywhere in the system
ndicating that rate of carbon accumulation is low.For the SW furnace the methane conversion (exit carbon
xides mole fraction divided by methane feed mole fraction) was.2% ± 0.4 and the water conversion (exit hydrogen mole fractionivided by water feed mole fraction) was 5.0% (recall that waterole fraction supplied to the reactor is not directly measured so
he uncertainty in the water conversion is not quantified). For theN furnace the conversions were 2.6% ± 0.5 and 4.6%. This confirmshat both membranes were operated under differential conditionsconversions less that 10%). On the lumen side, in both cases (SWnd LN furnace) the selectivity to carbon dioxide, SCO2,LS, is greaterhan 0.7 consistent with a degree of total oxidation where,
CO2,LS = COout2,LS
COout2,LS + COout
LS
(15)
he selectivity to hydrogen, SH2,LS, is 0.77 ± 0.15 for the SW furnacend 0.36 ± 0.07 for the LN furnace where the selectivity to hydrogens defined in terms of exit carbon oxide mole fractions in light ofhe lack of information on the exit water mole fraction,
H2,LS = Hout2,LS
2(COout2,LS + COout
LS )(16)
he selectivity to water is therefore 0.23 ± 0.15 and 0.64 ± 0.07,gain indicating significant total oxidation.
.5. Post operation characterisation
After membrane failure the module was cooled down to roomemperature under air. Membrane samples from the “hot” zonecentral zone) and “cold” zone (outside the furnace) were taken
rom the modules used in the SW (900 and 916 ◦C) and LN900 ◦C) furnaces for SEM, EDS and XRD; the analysed samples werencrushed. Generally, the XRD patterns of the membranes wereot remarkable; reflections corresponding to the fresh LSCF6428.410 0.033 ± 0.003 0.091 ± 0.009
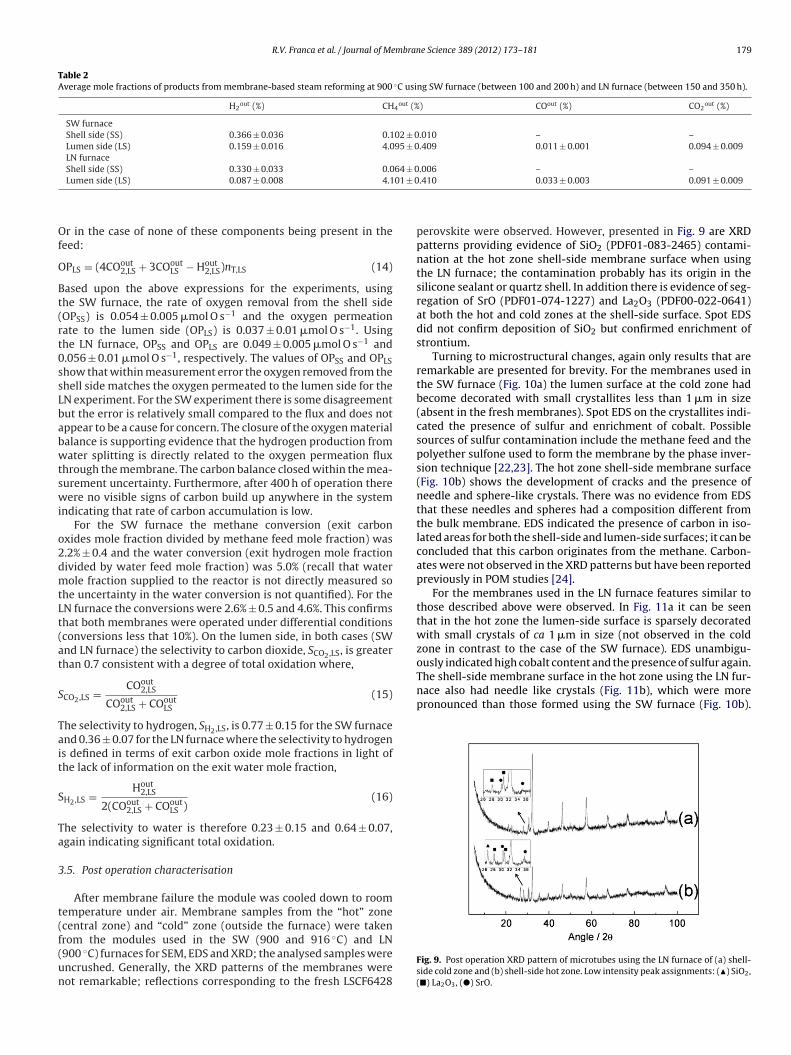
perovskite were observed. However, presented in Fig. 9 are XRDpatterns providing evidence of SiO2 (PDF01-083-2465) contami-nation at the hot zone shell-side membrane surface when usingthe LN furnace; the contamination probably has its origin in thesilicone sealant or quartz shell. In addition there is evidence of seg-regation of SrO (PDF01-074-1227) and La2O3 (PDF00-022-0641)at both the hot and cold zones at the shell-side surface. Spot EDSdid not confirm deposition of SiO2 but confirmed enrichment ofstrontium.
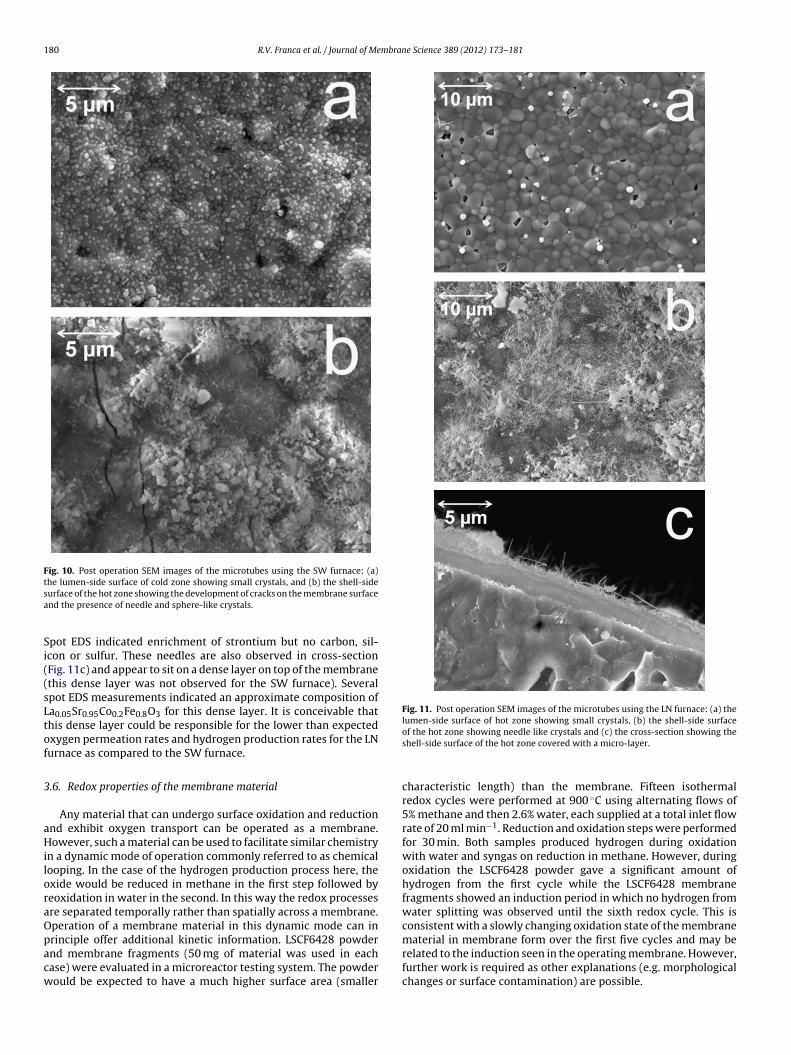
Turning to microstructural changes, again only results that areremarkable are presented for brevity. For the membranes used inthe SW furnace (Fig. 10a) the lumen surface at the cold zone hadbecome decorated with small crystallites less than 1 �m in size(absent in the fresh membranes). Spot EDS on the crystallites indi-cated the presence of sulfur and enrichment of cobalt. Possiblesources of sulfur contamination include the methane feed and thepolyether sulfone used to form the membrane by the phase inver-sion technique [22,23]. The hot zone shell-side membrane surface(Fig. 10b) shows the development of cracks and the presence ofneedle and sphere-like crystals. There was no evidence from EDSthat these needles and spheres had a composition different fromthe bulk membrane. EDS indicated the presence of carbon in iso-lated areas for both the shell-side and lumen-side surfaces; it can beconcluded that this carbon originates from the methane. Carbon-ates were not observed in the XRD patterns but have been reportedpreviously in POM studies [24].
For the membranes used in the LN furnace features similar tothose described above were observed. In Fig. 11a it can be seenthat in the hot zone the lumen-side surface is sparsely decoratedwith small crystals of ca 1 �m in size (not observed in the coldzone in contrast to the case of the SW furnace). EDS unambigu-ously indicated high cobalt content and the presence of sulfur again.
Fig. 9. Post operation XRD pattern of microtubes using the LN furnace of (a) shell-side cold zone and (b) shell-side hot zone. Low intensity peak assignments: (�) SiO2,(�) La2O3, (�) SrO.
180 R.V. Franca et al. / Journal of Membrane Science 389 (2012) 173– 181
Fig. 10. Post operation SEM images of the microtubes using the SW furnace: (a)the lumen-side surface of cold zone showing small crystals, and (b) the shell-sidesa
Si((sLtof
3
aHiloraOpacw
Fig. 11. Post operation SEM images of the microtubes using the LN furnace: (a) thelumen-side surface of hot zone showing small crystals, (b) the shell-side surface
urface of the hot zone showing the development of cracks on the membrane surfacend the presence of needle and sphere-like crystals.
pot EDS indicated enrichment of strontium but no carbon, sil-con or sulfur. These needles are also observed in cross-sectionFig. 11c) and appear to sit on a dense layer on top of the membranethis dense layer was not observed for the SW furnace). Severalpot EDS measurements indicated an approximate composition ofa0.05Sr0.95Co0.2Fe0.8O3 for this dense layer. It is conceivable thathis dense layer could be responsible for the lower than expectedxygen permeation rates and hydrogen production rates for the LNurnace as compared to the SW furnace.
.6. Redox properties of the membrane material
Any material that can undergo surface oxidation and reductionnd exhibit oxygen transport can be operated as a membrane.owever, such a material can be used to facilitate similar chemistry
n a dynamic mode of operation commonly referred to as chemicalooping. In the case of the hydrogen production process here, thexide would be reduced in methane in the first step followed byeoxidation in water in the second. In this way the redox processesre separated temporally rather than spatially across a membrane.peration of a membrane material in this dynamic mode can in
rinciple offer additional kinetic information. LSCF6428 powdernd membrane fragments (50 mg of material was used in eachase) were evaluated in a microreactor testing system. The powderould be expected to have a much higher surface area (smallerof the hot zone showing needle like crystals and (c) the cross-section showing theshell-side surface of the hot zone covered with a micro-layer.
characteristic length) than the membrane. Fifteen isothermalredox cycles were performed at 900 ◦C using alternating flows of5% methane and then 2.6% water, each supplied at a total inlet flowrate of 20 ml min−1. Reduction and oxidation steps were performedfor 30 min. Both samples produced hydrogen during oxidationwith water and syngas on reduction in methane. However, duringoxidation the LSCF6428 powder gave a significant amount ofhydrogen from the first cycle while the LSCF6428 membranefragments showed an induction period in which no hydrogen fromwater splitting was observed until the sixth redox cycle. This isconsistent with a slowly changing oxidation state of the membrane
material in membrane form over the first five cycles and may berelated to the induction seen in the operating membrane. However,further work is required as other explanations (e.g. morphologicalchanges or surface contamination) are possible.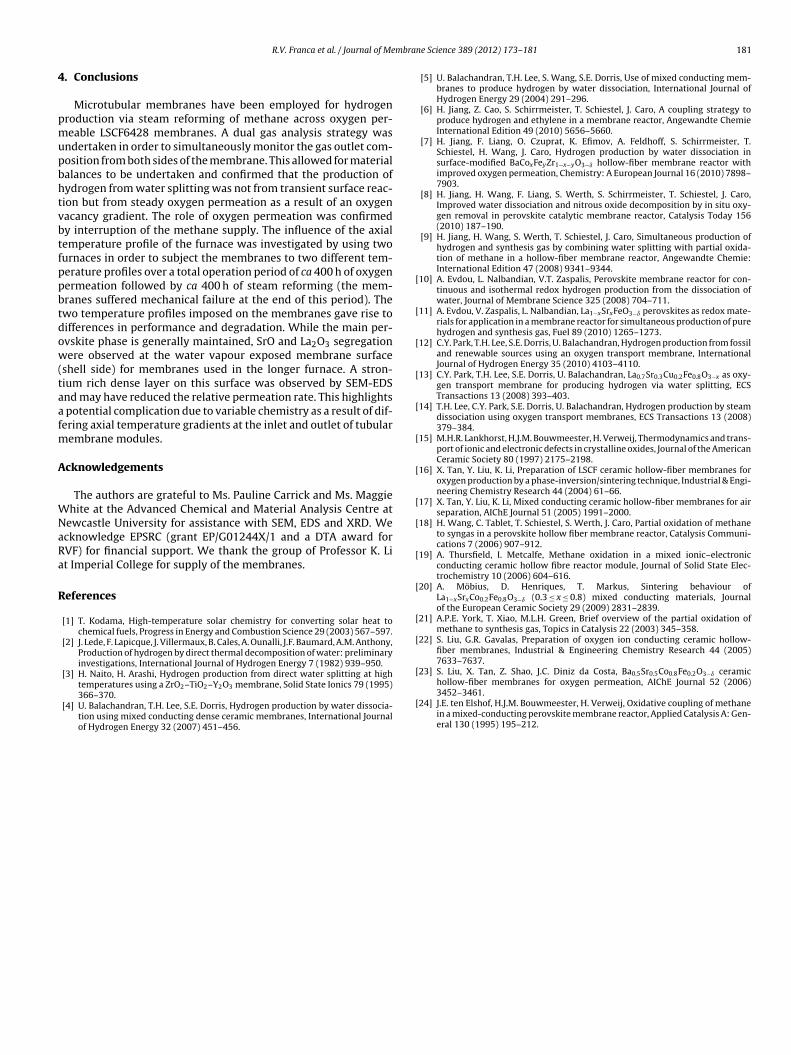
mbran
4
pmupbhtvbtfppbtdow(taafm
A
WNaRa
R
[
[
[
[
[
[
[
[
[
[
[
[
[
[
R.V. Franca et al. / Journal of Me
. Conclusions
Microtubular membranes have been employed for hydrogenroduction via steam reforming of methane across oxygen per-eable LSCF6428 membranes. A dual gas analysis strategy was
ndertaken in order to simultaneously monitor the gas outlet com-osition from both sides of the membrane. This allowed for materialalances to be undertaken and confirmed that the production ofydrogen from water splitting was not from transient surface reac-ion but from steady oxygen permeation as a result of an oxygenacancy gradient. The role of oxygen permeation was confirmedy interruption of the methane supply. The influence of the axialemperature profile of the furnace was investigated by using twournaces in order to subject the membranes to two different tem-erature profiles over a total operation period of ca 400 h of oxygenermeation followed by ca 400 h of steam reforming (the mem-ranes suffered mechanical failure at the end of this period). Thewo temperature profiles imposed on the membranes gave rise toifferences in performance and degradation. While the main per-vskite phase is generally maintained, SrO and La2O3 segregationere observed at the water vapour exposed membrane surface
shell side) for membranes used in the longer furnace. A stron-ium rich dense layer on this surface was observed by SEM-EDSnd may have reduced the relative permeation rate. This highlights
potential complication due to variable chemistry as a result of dif-ering axial temperature gradients at the inlet and outlet of tubular
embrane modules.
cknowledgements
The authors are grateful to Ms. Pauline Carrick and Ms. Maggiehite at the Advanced Chemical and Material Analysis Centre at
ewcastle University for assistance with SEM, EDS and XRD. Wecknowledge EPSRC (grant EP/G01244X/1 and a DTA award forVF) for financial support. We thank the group of Professor K. Lit Imperial College for supply of the membranes.
eferences
[1] T. Kodama, High-temperature solar chemistry for converting solar heat tochemical fuels, Progress in Energy and Combustion Science 29 (2003) 567–597.
[2] J. Lede, F. Lapicque, J. Villermaux, B. Cales, A. Ounalli, J.F. Baumard, A.M. Anthony,Production of hydrogen by direct thermal decomposition of water: preliminaryinvestigations, International Journal of Hydrogen Energy 7 (1982) 939–950.
[3] H. Naito, H. Arashi, Hydrogen production from direct water splitting at high
temperatures using a ZrO2–TiO2–Y2O3 membrane, Solid State Ionics 79 (1995)366–370.[4] U. Balachandran, T.H. Lee, S.E. Dorris, Hydrogen production by water dissocia-tion using mixed conducting dense ceramic membranes, International Journalof Hydrogen Energy 32 (2007) 451–456.
[
e Science 389 (2012) 173– 181 181
[5] U. Balachandran, T.H. Lee, S. Wang, S.E. Dorris, Use of mixed conducting mem-branes to produce hydrogen by water dissociation, International Journal ofHydrogen Energy 29 (2004) 291–296.
[6] H. Jiang, Z. Cao, S. Schirrmeister, T. Schiestel, J. Caro, A coupling strategy toproduce hydrogen and ethylene in a membrane reactor, Angewandte ChemieInternational Edition 49 (2010) 5656–5660.
[7] H. Jiang, F. Liang, O. Czuprat, K. Efimov, A. Feldhoff, S. Schirrmeister, T.Schiestel, H. Wang, J. Caro, Hydrogen production by water dissociation insurface-modified BaCoxFeyZr1−x−yO3−ı hollow-fiber membrane reactor withimproved oxygen permeation, Chemistry: A European Journal 16 (2010) 7898–7903.
[8] H. Jiang, H. Wang, F. Liang, S. Werth, S. Schirrmeister, T. Schiestel, J. Caro,Improved water dissociation and nitrous oxide decomposition by in situ oxy-gen removal in perovskite catalytic membrane reactor, Catalysis Today 156(2010) 187–190.
[9] H. Jiang, H. Wang, S. Werth, T. Schiestel, J. Caro, Simultaneous production ofhydrogen and synthesis gas by combining water splitting with partial oxida-tion of methane in a hollow-fiber membrane reactor, Angewandte Chemie:International Edition 47 (2008) 9341–9344.
10] A. Evdou, L. Nalbandian, V.T. Zaspalis, Perovskite membrane reactor for con-tinuous and isothermal redox hydrogen production from the dissociation ofwater, Journal of Membrane Science 325 (2008) 704–711.
11] A. Evdou, V. Zaspalis, L. Nalbandian, La1−xSrxFeO3−ı perovskites as redox mate-rials for application in a membrane reactor for simultaneous production of purehydrogen and synthesis gas, Fuel 89 (2010) 1265–1273.
12] C.Y. Park, T.H. Lee, S.E. Dorris, U. Balachandran, Hydrogen production from fossiland renewable sources using an oxygen transport membrane, InternationalJournal of Hydrogen Energy 35 (2010) 4103–4110.
13] C.Y. Park, T.H. Lee, S.E. Dorris, U. Balachandran, La0.7Sr0.3Cu0.2Fe0.8O3−x as oxy-gen transport membrane for producing hydrogen via water splitting, ECSTransactions 13 (2008) 393–403.
14] T.H. Lee, C.Y. Park, S.E. Dorris, U. Balachandran, Hydrogen production by steamdissociation using oxygen transport membranes, ECS Transactions 13 (2008)379–384.
15] M.H.R. Lankhorst, H.J.M. Bouwmeester, H. Verweij, Thermodynamics and trans-port of ionic and electronic defects in crystalline oxides, Journal of the AmericanCeramic Society 80 (1997) 2175–2198.
16] X. Tan, Y. Liu, K. Li, Preparation of LSCF ceramic hollow-fiber membranes foroxygen production by a phase-inversion/sintering technique, Industrial & Engi-neering Chemistry Research 44 (2004) 61–66.
17] X. Tan, Y. Liu, K. Li, Mixed conducting ceramic hollow-fiber membranes for airseparation, AIChE Journal 51 (2005) 1991–2000.
18] H. Wang, C. Tablet, T. Schiestel, S. Werth, J. Caro, Partial oxidation of methaneto syngas in a perovskite hollow fiber membrane reactor, Catalysis Communi-cations 7 (2006) 907–912.
19] A. Thursfield, I. Metcalfe, Methane oxidation in a mixed ionic–electronicconducting ceramic hollow fibre reactor module, Journal of Solid State Elec-trochemistry 10 (2006) 604–616.
20] A. Möbius, D. Henriques, T. Markus, Sintering behaviour ofLa1−xSrxCo0.2Fe0.8O3−ı (0.3 ≤ x ≤ 0.8) mixed conducting materials, Journalof the European Ceramic Society 29 (2009) 2831–2839.
21] A.P.E. York, T. Xiao, M.L.H. Green, Brief overview of the partial oxidation ofmethane to synthesis gas, Topics in Catalysis 22 (2003) 345–358.
22] S. Liu, G.R. Gavalas, Preparation of oxygen ion conducting ceramic hollow-fiber membranes, Industrial & Engineering Chemistry Research 44 (2005)7633–7637.
23] S. Liu, X. Tan, Z. Shao, J.C. Diniz da Costa, Ba0.5Sr0.5Co0.8Fe0.2O3−ı ceramic
hollow-fiber membranes for oxygen permeation, AIChE Journal 52 (2006)3452–3461.24] J.E. ten Elshof, H.J.M. Bouwmeester, H. Verweij, Oxidative coupling of methanein a mixed-conducting perovskite membrane reactor, Applied Catalysis A: Gen-eral 130 (1995) 195–212.
Copyright © 2022 FDOKUMEN