L, M and L–M hybrid cone photopigments in man: deriving λ max from flicker photometric spectral...
13
Vision Research 39 (1999) 3513 – 3525 Section 2 L, M and L–M hybrid cone photopigments in man: deriving l max from flicker photometric spectral sensitivities Lindsay T. Sharpe a, *, Andrew Stockman b , Herbert Ja ¨gle a , Holger Knau a , Jeremy Nathans c a Forschungsstelle fu ¨r Experimentelle Ophthalmologie, Ro ¨ntgenweg 11, D-72076 Tu ¨bingen, Germany b Department of Psychology, Uni6ersity of California San Diego, 9500 Gilman Dri6e, La Jolla, CA 92093 -0109, USA c Departments of Molecular Biology and Genetics, Neuroscience, and Ophthalmology, Howard Hughes Medical Institute, Johns Hopkins Uni6ersity School of Medicine, Baltimore, MA 21205, USA Received 4 November 1998; received in revised form 25 February 1999 Abstract Using heterochromatic flicker photometry, we have measured the corneal spectral sensitivities of the X -chromosome-linked photopigments in 40 dichromats, 37 of whom have a single opsin gene in their tandem array. The photopigments encoded by their genes include: the alanine variant of the normal middle-wavelength sensitive photopigment, M(A180); the alanine and serine variants of the normal long-wavelength sensitive photopigment, L(A180) and L(S180); four different L – M hybrid or anomalous photopigments, L2M3(A180), L3M4(S180), L4M5(A180) and L4M5(S180); and two variants of the L-cone photopigment, encoded by genes with embedded M-cone exon two sequences, L(M2; A180) and L(M2; S180). The peak absorbances (l max ) of the underlying photopigment spectra associated with each genotype were estimated by correcting the corneal spectral sensitivities back to the retinal level, after removing the effects of the macular and lens pigments and fitting a template of fixed shape to the dilute photopigment spectrum. Details of the genotype-phenotype correlations are summarized elsewhere (Sharpe, L. T., Stockman, A., Ja ¨gle, H., Knau, H., Klausen, G., Reitner, A. et al. (1998). J. Neuroscience, 18, 10053–10069). Here, we present the individual corneal spectral sensitivities for the first time as well as details and a comparison of three analyses used to estimate the l max values, including one in which the lens and macular pigment densities of each observer were individually measured. © 1999 Elsevier Science Ltd. All rights reserved. Keywords: M-cones; L-cones; Spectral sensitivity; Cone fundamental; Photopigments; Photopigment genes; Macular pigment; Lens pigment; Color matching; Single-gene dichromats; Dichromacy; Protanopes; Deuteranopes www.elsevier.com/locate/visres 1. Introduction The three types of cone photopigment, each with different spectral sensitivity, are universally acknowl- edged to be the foundations of human trichromatic color vision. Among vision scientists, they are now most frequently referred to as short- (S-), middle- (M-) and long- (L-) wavelength-sensitive, according to the relative spectral positions of their peak sensitivities (i.e. their l max values). Two of these, the M- and L-cone photopigments, are encoded by genes that reside in a head-to-tail tandem array on the X -chromosome (re- viewed in Nathans, Merbs, Sung, Weitz & Wang, 1992; Sharpe, Stockman, Ja ¨gle & Nathans, 1999). Each gene in the array consists of six coding regions, called exons, which are transcribed to produce the opsin or protein that binds with the chromophore, 11-cis retinal, to form the photopigment. The near identity (96%) and juxtaposition of the coding regions of the M- and L-cone opsin genes (Nathans, Thomas & Hogness, 1986) give rise to fre- quent unequal homologous exchanges between them, resulting in the formation of hybrid or fusion genes. Some of the hybrid genes code for photopigments with absorbance spectrum lying between those of the normal M- and L-cone photopigments. Hybrid opsin genes are denoted as 5%M–3%L or 5%L–3%M to indicate which * Corresponding author. Tel.: +49-7071-2983734; fax: +49-7071- 295777. E-mail address: [email protected] (L.T. Sharpe) 0042-6989/99/$ - see front matter © 1999 Elsevier Science Ltd. All rights reserved. PII:S0042-6989(99)00061-9
-
Upload
independent -
Category
Documents
-
view
2 -
download
0
Transcript of L, M and L–M hybrid cone photopigments in man: deriving λ max from flicker photometric spectral...
Vision Research 39 (1999) 3513–3525
Section 2
L, M and L–M hybrid cone photopigments in man: deriving lmax
from flicker photometric spectral sensitivities
Lindsay T. Sharpe a,*, Andrew Stockman b, Herbert Jagle a, Holger Knau a,Jeremy Nathans c
a Forschungsstelle fur Experimentelle Ophthalmologie, Rontgenweg 11, D-72076 Tubingen, Germanyb Department of Psychology, Uni6ersity of California San Diego, 9500 Gilman Dri6e, La Jolla, CA 92093-0109, USA
c Departments of Molecular Biology and Genetics, Neuroscience, and Ophthalmology, Howard Hughes Medical Institute,Johns Hopkins Uni6ersity School of Medicine, Baltimore, MA 21205, USA
Received 4 November 1998; received in revised form 25 February 1999
Abstract
Using heterochromatic flicker photometry, we have measured the corneal spectral sensitivities of the X-chromosome-linkedphotopigments in 40 dichromats, 37 of whom have a single opsin gene in their tandem array. The photopigments encoded by theirgenes include: the alanine variant of the normal middle-wavelength sensitive photopigment, M(A180); the alanine and serinevariants of the normal long-wavelength sensitive photopigment, L(A180) and L(S180); four different L–M hybrid or anomalousphotopigments, L2M3(A180), L3M4(S180), L4M5(A180) and L4M5(S180); and two variants of the L-cone photopigment,encoded by genes with embedded M-cone exon two sequences, L(M2; A180) and L(M2; S180). The peak absorbances (lmax) ofthe underlying photopigment spectra associated with each genotype were estimated by correcting the corneal spectral sensitivitiesback to the retinal level, after removing the effects of the macular and lens pigments and fitting a template of fixed shape to thedilute photopigment spectrum. Details of the genotype-phenotype correlations are summarized elsewhere (Sharpe, L. T.,Stockman, A., Jagle, H., Knau, H., Klausen, G., Reitner, A. et al. (1998). J. Neuroscience, 18, 10053–10069). Here, we presentthe individual corneal spectral sensitivities for the first time as well as details and a comparison of three analyses used to estimatethe lmax values, including one in which the lens and macular pigment densities of each observer were individually measured.© 1999 Elsevier Science Ltd. All rights reserved.
Keywords: M-cones; L-cones; Spectral sensitivity; Cone fundamental; Photopigments; Photopigment genes; Macular pigment; Lens pigment; Colormatching; Single-gene dichromats; Dichromacy; Protanopes; Deuteranopes
www.elsevier.com/locate/visres
1. Introduction
The three types of cone photopigment, each withdifferent spectral sensitivity, are universally acknowl-edged to be the foundations of human trichromaticcolor vision. Among vision scientists, they are nowmost frequently referred to as short- (S-), middle- (M-)and long- (L-) wavelength-sensitive, according to therelative spectral positions of their peak sensitivities (i.e.their lmax values). Two of these, the M- and L-conephotopigments, are encoded by genes that reside in a
head-to-tail tandem array on the X-chromosome (re-viewed in Nathans, Merbs, Sung, Weitz & Wang, 1992;Sharpe, Stockman, Jagle & Nathans, 1999). Each genein the array consists of six coding regions, called exons,which are transcribed to produce the opsin or proteinthat binds with the chromophore, 11-cis retinal, to formthe photopigment.
The near identity (96%) and juxtaposition of thecoding regions of the M- and L-cone opsin genes(Nathans, Thomas & Hogness, 1986) give rise to fre-quent unequal homologous exchanges between them,resulting in the formation of hybrid or fusion genes.Some of the hybrid genes code for photopigments withabsorbance spectrum lying between those of the normalM- and L-cone photopigments. Hybrid opsin genes aredenoted as 5%M–3%L or 5%L–3%M to indicate which
* Corresponding author. Tel.: +49-7071-2983734; fax: +49-7071-295777.
E-mail address: [email protected] (L.T. Sharpe)
0042-6989/99/$ - see front matter © 1999 Elsevier Science Ltd. All rights reserved.
PII: S 0 0 4 2 -6989 (99 )00061 -9
L.T. Sharpe et al. / Vision Research 39 (1999) 3513–35253514
parental gene contributed sequences for their 5% orupstream end and which contributed sequences for their3% or downstream end. Because unequal recombinationis more likely to occur between exons rather thanwithin them, both 5%M–3%L or 5%L–3%M hybrid opsingene can conveniently be identified by the site at whichthe transition from an L-cone to an M-cone opsin geneoccurs. Thus, L3M4, for example, indicates a 5%L–3%Mhybrid gene in which exons 1–3 derive from an L-conepigment gene and exons 4–6 from an M-cone pigmentgene.
Experiments aimed at defining in vivo the spectralsensitivities (phenotypes) of the photopigments associ-ated with such genotypes have often relied on psycho-physical techniques, involving one or more of thefollowing conditions: (i) the application of steady(Stiles, 1939; De Vries, 1948; Wald, 1964) or transient(e.g. King-Smith & Webb, 1974; Stockman, MacLeod& Vivien, 1993b) chromatic adaptation to favor thedesired cone type while disadvantaging the unwantedcone types; (ii) the presentation of brief or flickeringtargets, such as in heterochromatic flicker photometryexperiments, to avoid the intrusion of color-opponentprocesses in the detection process (for a review ofprocedures, see Stockman & Sharpe, 1999); and (iii) theuse of red–green dichromatic observers, who lack oneof the X-chromosome-linked photopigments (e.g. Pitt,1935; Hecht, 1949; Willmer, 1950; Hsia & Graham,1957; Mitchell & Rushton, 1971; Rushton, Powell &White, 1973; Smith & Pokorny, 1975; Alpern & Wake,1977), to reduce the complications introduced by over-lapping spectral sensitivities in normal observers.
In a study documented elsewhere (Sharpe, Stockman,Jagle, Knau, Klausen, Reitner et al., 1998a), we ex-ploited all three of these conditions to make genotype–phenotype correlations. Using both chromaticadaptation and heterochromatic flicker photometry, wemeasured, for centrally viewed 2° in diameter fields, thephotopigment spectral sensitivities of 40 male dichro-mats, 37 of whom have only a single opsin gene ontheir X-chromosome. We were able to identify ninenormal and 5%L–3%M hybrid opsin photopigments, eachof whose amino acid sequences were deduced from itsgene sequences: L(A180), L(S180), L1M2(A180) orM(A180), L2M3(A180), L3M4(S180), L4M5(A180),L4M5(S180), L(M2; A180) and L(M2; S180). As partof the gene and photopigment description, it is paren-thetically denoted whether the alanine (A180) or serine(S180) polymorphism at codon 180 is present, andwhether a M-cone pigment gene exon 2 (M2) is embed-ded within an otherwise L-cone opsin gene (Sharpe etal., 1999).
Here, we present in full the individual spectral sensi-tivities measured in the 40 dichromats, thus allowingthe reader to evaluate directly the reliability and inter-
observer variability of the data. In addition, we presenthere, for the first time, the individually measured crys-talline lens and macular pigment densities for eachobserver. Estimates of the lens and macular pigmentdensities are needed to correct the corneally measuredspectral sensitivities back to the retinal level, so that thepeak absorbances of the underlying photopigment spec-tra (i.e. the lmax values) can be derived. The lens andmacular pigments both alter spectral sensitivity by ab-sorbing light mainly of short-wavelengths, and bothvary substantially in density between individuals (see,for example, Wyszecki & Stiles, 1982; Stockman &Sharpe, 1999).
In the original study (Sharpe et al., 1998a), we usedbest-fitting lens and macular pigment densities to derivethe lmax values. Here we attempt to improve the lmax
estimates by replacing the best-fitting lens and macularpigment densities used in the fits with the individuallymeasured (fixed) density values. Unfortunately, themeasured densities proved to be too inaccurate.
2. Methods
2.1. Subjects
A total of 40 males with severe color vision deficien-cies were recruited in Freiburg, Tubingen, and Viennaby word of mouth and by advertising in local newspa-pers and cinemas. All were native Germans or Austri-ans, except for approximately 15% who were natives ofthe Balkan peninsula. The males were between 16 and45 years old with a mean age of 28 (see Table 1, column3). To qualify for the study, each had to be phenotypi-cally a dichromat in the red–green part of the visiblespectrum. That is, he had to produce a Rayleigh matchon a standard anomaloscope by merely adjusting theintensity of the yellow light, regardless of the red–greenratio (Rayleigh, 1881). Such matches are consistentwith light absorption being mediated by a single type ofphotopigment in the middle- and long-wavelength re-gion of the spectrum, where the Rayleigh equationapplies. Red–green dichromats can be either pro-tanopes, who lack the L-cone photopigment, or deuter-anopes, who lack the M-cone photopigment.Protanopes produce characteristically different matchesthan deuteranopes owing to differences in the spectralsensitivity of their remaining M- or L-cone photopig-ment (for details of the individual matches, see Sharpeet al., 1998a, b).
2.2. Genotyping
Full details of the genotyping, including the deduced
L.T. Sharpe et al. / Vision Research 39 (1999) 3513–3525 3515
amino acid sequences in exons 2–5 for all 40 dichro-mats, can be found in table 2 of Sharpe et al. (1998a).
2.3. Apparatus
Full details of the design and calibration of theMaxwellian-view optical system, used to measure theheterochromatic flicker photometric sensitivities as wellas to estimate the lens and macular pigment densities,are provided in Sharpe et al. (1998a).
2.4. Procedure
2.4.1. Corneal spectral sensiti6itiesThe heterochromatic flicker photometric procedures
used to measure the corneal spectral sensitivities arefully described in Sharpe et al. (1998a). They will onlybe briefly summarised here. A 2° reference light (560nm) was alternated at 25 Hz, or in preliminary mea-surements, at 16 Hz, in opposite phase with a superim-posed test light, the wavelength of which was varied in
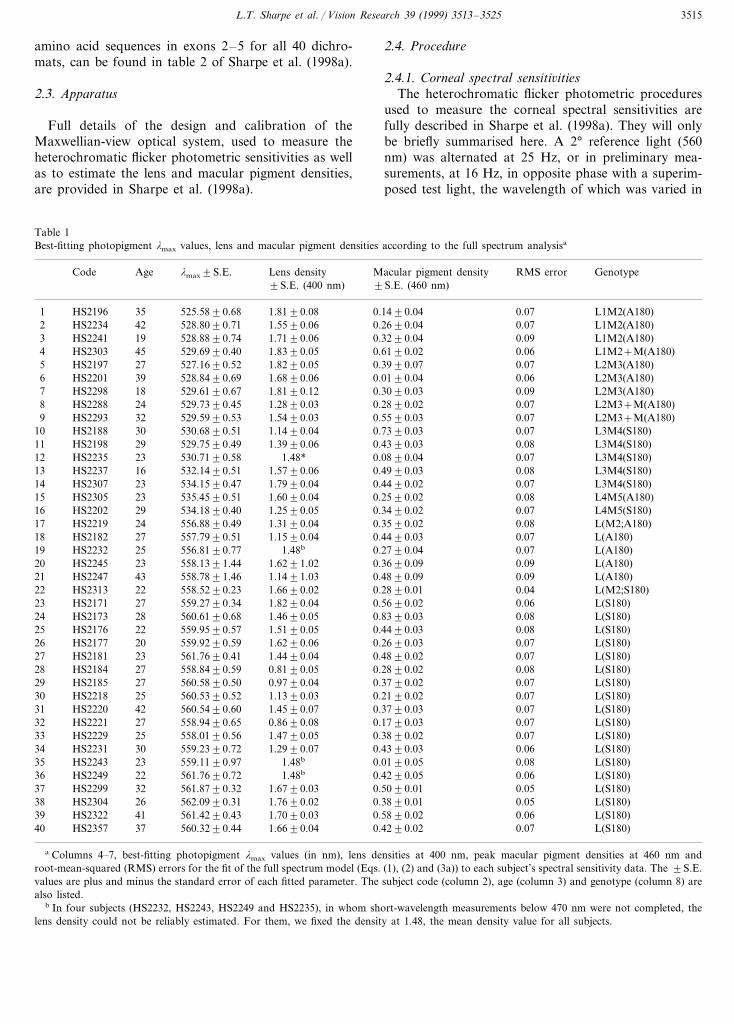
Table 1Best-fitting photopigment lmax values, lens and macular pigment densities according to the full spectrum analysisa
lmax9S.E. Lens densityAge Macular pigment densityCode RMS error Genotype9S.E. (460 nm)9S.E. (400 nm)
1 35HS2196 525.5890.68 1.8190.08 0.1490.04 0.07 L1M2(A180)42 528.8090.71 1.5590.06 0.2690.042 0.07HS2234 L1M2(A180)
3 L1M2(A180)0.090.3290.041.7190.06528.8890.7419HS22410.060.6190.021.8390.05 L1M2+M(A180)529.6990.4045HS23034
5 27HS2197 527.1690.52 1.8290.05 0.3990.07 0.07 L2M3(A180)HS2201 39 528.8490.696 1.6890.06 0.0190.04 0.06 L2M3(A180)
7 L2M3(A180)0.090.3090.031.8190.12529.6190.6718HS2298HS2288 L2M3+M(A180)8 0.0724 0.2890.021.2890.03529.7390.45
9 1.5490.03 0.5590.03 0.07 L2M3+M(A180)529.5990.53HS2293 3230 530.6890.51 1.1490.04 0.7390.0310 0.07HS2188 L3M4(S180)
L3M4(S180)0.080.4390.031.3990.0611 529.7590.4929HS219812 23HS2235 L3M4(S180)0.070.0890.041.48*530.7190.5813 L3M4(S180)0.080.4990.031.5790.06532.1490.5116HS223714 23 534.1590.47HS2307 1.7990.04 0.4490.02 0.07 L3M4(S180)
23 535.4590.51 1.6090.0415 0.2590.02HS2305 0.08 L4M5(A180)29 534.1890.40 1.2590.0516 0.3490.02HS2202 0.07 L4M5(S180)
L(M2;A180)0.080.3590.021.3190.0417 556.8890.4924HS2219HS218218 27 557.7990.51 1.1590.04 0.4490.03 0.07 L(A180)
19 L(A180)0.070.2790.041.48b556.8190.7725HS22320.090.3690.091.6291.02 L(A180)558.1391.4423HS224520
4321 558.7891.46HS2247 1.1491.03 0.4890.09 0.09 L(A180)HS2313 22 558.5290.2322 1.6690.02 L(M2;S180)0.2890.01 0.04HS2171 559.2790.34 1.8290.04 0.5690.02 0.06 L(S180)2723HS2173 L(S180)24 0.080.8390.031.4690.05560.6190.6828
1.5190.05 0.4490.03 0.08559.9590.57 L(S180)22HS21762520 559.9290.59 1.6290.0626 0.2690.03HS2177 0.07 L(S180)
HS218127 23 561.7690.41 1.4490.04 0.4890.02 0.07 L(S180)HS218428 27 558.8490.59 0.8190.05 0.2890.02 0.08 L(S180)
L(S180)0.070.3790.020.9790.0429 560.5890.5027HS2185HS221830 25 560.5390.52 1.1390.03 0.2190.02 0.07 L(S180)HS2220 42 560.5490.6031 1.4590.07 0.3790.03 0.07 L(S180)
L(S180)0.070.1790.030.8690.0832 558.9490.6527HS2221L(S180)0.0733 0.3890.02HS2229 1.4790.05558.0190.5625
34 30HS2231 559.2390.72 1.2990.07 0.4390.03 0.06 L(S180)35 L(S180)HS2243 23 559.1190.97 1.48b 0.0190.05 0.08
HS2249 L(S180)36 0.0622 0.4290.051.48b561.7690.7237 1.6790.03 0.5090.01 0.05 L(S180)561.8790.32HS2299 32
562.0990.31 1.7690.02 0.3890.0138 0.05HS2304 L(S180)2641 561.4290.43 1.7090.0339 0.5890.02HS2322 0.06 L(S180)37 560.3290.44 1.6690.04 0.4290.0240 0.07HS2357 L(S180)
a Columns 4–7, best-fitting photopigment lmax values (in nm), lens densities at 400 nm, peak macular pigment densities at 460 nm androot-mean-squared (RMS) errors for the fit of the full spectrum model (Eqs. (1), (2) and (3a)) to each subject’s spectral sensitivity data. The 9S.E.values are plus and minus the standard error of each fitted parameter. The subject code (column 2), age (column 3) and genotype (column 8) arealso listed.
b In four subjects (HS2232, HS2243, HS2249 and HS2235), in whom short-wavelength measurements below 470 nm were not completed, thelens density could not be reliably estimated. For them, we fixed the density at 1.48, the mean density value for all subjects.
L.T. Sharpe et al. / Vision Research 39 (1999) 3513–35253516
5-nm steps over the spectrum from 400 to 700 nm. Thetwo targets were presented on a 430-nm field of 11.00log quanta s−1 deg−2 (3.08 log photopic td or 4.71 logscotopic td), which saturated the rods and, togetherwith the high flicker rate, obviated the contribution ofthe S-cones.
2.4.2. Lens pigmentLens pigment densities were estimated from 1-Hz rod
thresholds measured at test wavelengths of 400, 420,460 and 500 nm at an eccentricity of 13° in the tempo-ral retina by comparing them with the correspondingvalues of the standard V %(l) scotopic luminosity func-tion (table I(4.3.2) of Wyszecki and Stiles (1982)). Weassumed that differences between the shape of V %(l)and the rod functions for each individual subject reflectdifferences in lens absorption in the violet (essentiallythe method of Ruddock (1965)). Each set of rod spec-tral sensitivity measurements was preceded by 40 minof dark adaptation. A dim 620 nm background of 6.25log quanta s−1 deg−2 (−1.63 log sc td or −0.31 logph td) was used, mainly to aid fixation. The scotopicspectral sensitivities were averaged from 20 settings:four separate runs of five threshold settings per targetwavelength.
To estimate the lens density, we assumed the lensoptical density spectrum of van Norren and Vos (1974),slightly modified by Stockman, MacLeod and Johnson(1993a). We also allowed a vertical shift of the logspectral sensitivity curves in order to account for wave-length-independent changes in overall sensitivity be-tween subjects. With the use of a standard curve-fittingalgorithm, we found: (1) the value by which the lensdensity spectrum should be multiplied before beingadded to or subtracted from each subject’s data; and (2)the vertical shift that together with (1) minimized thesquared deviations between the subject’s data andV %(l). This estimate of lens density yields the relativedifference in density between each of our subjects andthe mean density of the 50 observers upon which theV %(l) function was based. To provide an absolute esti-mate of lens density, which we needed for the analysisof spectral sensitivity, we assumed that the mean den-sity of the 50 observers upon which the V %(l) functionis based was the same as the mean density for our 40observers obtained from the best-fitting lens densityanalysis (i.e. 1.48 at 400 nm). Arbitrarily, we report lensdensities relative to the density at 400 nm (see Tables 1and 2).
2.4.3. Macular pigmentWe estimated macular pigment density by comparing
the 25-Hz flicker photometric sensitivities made at 13°in the periphery at 440, 460, 480, 500, 520, 540 and 560nm with the corresponding sensitivities made centrally.Again, the targets were presented on a 430-nm field of
11.00 log quanta sec−1 deg−2 (3.08 log photopic td or4.71 log scotopic td). We ignored the changes in pho-topigment optical density with eccentricity, and ac-counted for the differences in shape between the centraland peripheral spectral sensitivity curves solely in termsof a change in macular pigment (e.g. Stiles, 1953; seealso Sharpe, Stockman, Knau & Jagle, 1998b). Weassumed the macular pigment density spectrum of Vos(1972), and allowed a vertical shift in log sensitivitybetween the central and less sensitive peripheral data.With the use of a standard curve-fitting algorithm, wefound: (1) the factor by which the macular pigmentdensity spectrum should be multiplied before beingadded to each subject’s central data; and (2) the verticalshift that together with (1) minimized the squared devi-ations between the subject’s central and peripheraldata.
2.5. Analysis of spectral sensiti6ity data
The lmax of each subject’s L-, M- or L–M hybridspectral sensitivity was estimated by fitting a photopig-ment template of fixed shape, defined by a fifth-orderpolynomial, to their flicker photometer data correctedto photopigment optical density spectra. As describedin Sharpe et al. (1998a), the log photopigment opticaldensity, log[POD(x)], spectrum normalized to zero peak,is:
log[POD(x)]=a+bx+
cx2+
dx3+
ex4+
fx5, (1)
where x is log(l), a=3593840.5764, b=−48574668.0585, c=262378945.6275, d=−708007074.0766, e=954435497.8303, f=−514228901.1364, and l is the wavelength in nm.
Three different fits with the photopigment template(Eq. (1)) were obtained: (i) a full-spectrum fit withbest-fitting macular and lens densities; (ii) a full-spec-trum fit with individually measured (fixed) macular andlens densities; and (iii) a partial-spectrum fit (]520nm).
2.5.1. Full-spectrum fit (with best-fitting lens andmacular pigment densities)
The initial fit of the photopigment template (Eq. (1))to the data was carried out in the single fitting proce-dure defined by Eqs. (2) and (3a):
Sreceptor(x)=1−10−0.5POD(x+Dx), and (2)
log[Scornea(x)]
= log[Sreceptor(x)]+a lensOD(x)+bmacOD(x)+cn.(3a)
In Eq. (2), the template, POD(x), is shifted by Dx lognm along the log wavelength scale and adjusted to apeak photopigment optical density of 0.5 (see Stock-
L.T
.S
harpeet
al./V
isionR
esearch39
(1999)3513
–3525
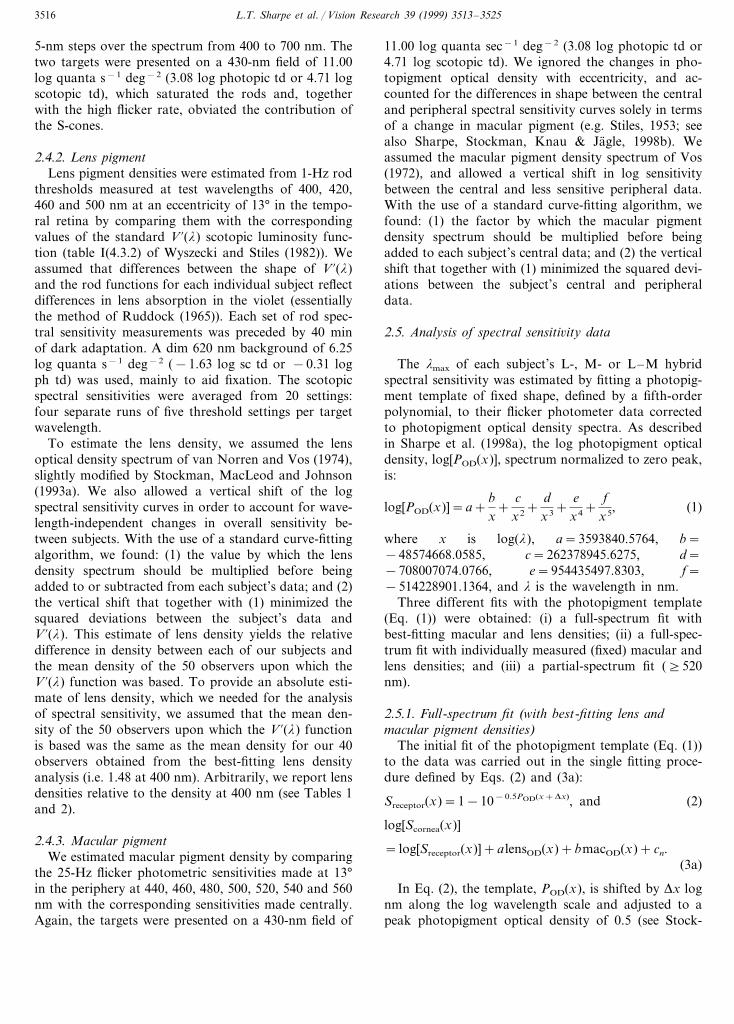
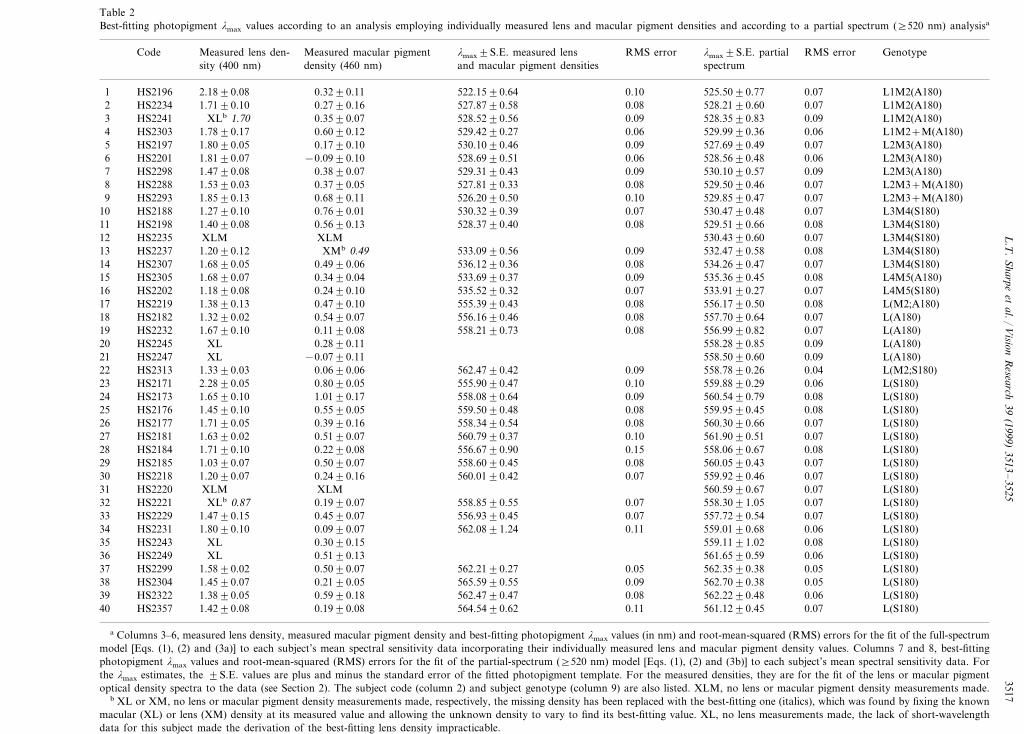
3517Table 2Best-fitting photopigment lmax values according to an analysis employing individually measured lens and macular pigment densities and according to a partial spectrum (]520 nm) analysisa
Measured macular pigment lmax9S.E. measured lens RMS error lmax9S.E. partial RMS error GenotypeMeasured lens den-Codespectrumand macular pigment densitiesdensity (460 nm)sity (400 nm)
525.5090.77 0.07 L1M2(A180)0.101 HS2196 522.1590.640.3290.112.1890.080.08HS2234 528.2190.60 0.07 L1M2(A180)1.7190.10 0.2790.16 527.8790.582
528.3590.83 0.09 L1M2(A180)3 HS2241 XLb 1.70 0.3590.07 528.5290.56 0.09529.9990.36 0.06 L1M2+M(A180)0.060.6090.121.7890.17 529.4290.274 HS2303
0.09HS2197 527.6990.49 0.07 L2M3(A180)1.8090.05 0.1790.10 530.1090.465528.6990.51 0.06 528.5690.48 0.06 L2M3(A180)6 HS2201 1.8190.07 −0.0990.10529.3190.43 0.09 530.1090.57 0.09 L2M3(A180)7 HS2298 1.4790.08 0.3890.07
529.5090.46 0.07 L2M3+M(A180)0.08527.8190.338 0.3790.051.5390.03HS2288HS2293 0.10 529.8590.47 0.07 L2M3+M(A180)1.8590.13 0.6890.119 526.2090.50
530.4790.48 0.07 L3M4(S180)0.07HS2188 1.2790.1010 530.3290.390.7690.010.08HS2198 529.5190.66 0.08 L3M4(S180)1.4090.08 0.5690.13 528.3790.4011
530.4390.60 0.07 L3M4(S180)12 HS2235 XLM XLM533.0990.56 0.09 532.4790.58 0.08 L3M4(S180)13 HS2237 1.2090.12 XMb 0.49
534.2690.47 0.07 L3M4(S180)0.08536.1290.3614 0.4990.061.6890.05HS23070.09HS2305 535.3690.45 0.08 L4M5(A180)1.6890.07 0.3490.04 533.6990.3715
533.9190.27 0.07 L4M5(S180)0.07535.5290.320.2490.1016 HS2202 1.1890.080.08HS2219 556.1790.50 0.08 L(M2;A180)1.3890.13 0.4790.10 555.3990.43170.08HS2182 557.7090.64 0.07 L(A180)1.3290.02 0.5490.07 556.1690.4618
556.9990.82 0.07 L(A180)0.08558.2190.7319 0.1190.081.6790.10HS2232HS2245 558.2890.85 0.09 L(A180)XL 0.2890.1120
558.5090.60 0.09 L(A180)−0.0790.11XL21 HS22470.09HS2313 558.7890.26 0.04 L(M2;S180)1.3390.03 0.0690.06 562.4790.4222
555.9090.47 0.10 559.8890.29 0.06 L(S180)23 HS2171 2.2890.05 0.8090.050.09HS2173 560.5490.79 0.08 L(S180)1.6590.10 1.0190.17 558.0890.6424
559.9590.45 0.08 L(S180)0.0825 HS2176 559.5090.480.5590.051.4590.100.08HS2177 560.3090.66 0.07 L(S180)1.7190.05 0.3990.16 558.3490.5426
560.7990.37 0.10 561.9090.51 0.07 L(S180)27 HS2181 1.6390.02 0.5190.07558.0690.67 0.08 L(S180)0.15556.6790.900.2290.0828 HS2184 1.7190.10
0.08HS2185 560.0590.43 0.07 L(S180)1.0390.07 0.5090.07 558.6090.45290.07HS2218 559.9290.46 0.07 L(S180)1.2090.07 0.2490.16 560.0190.4230
560.5990.67 0.07 L(S180)31 XLMXLMHS2220558.8590.55 0.07 558.3091.05 0.07 L(S180)32 HS2221 XLb 0.87 0.1990.07
557.7290.54 0.07 L(S180)0.07HS2229 1.4790.1533 556.9390.450.4590.070.11HS2231 559.0190.68 0.06 L(S180)1.8090.10 0.0990.07 562.0891.2434
559.1191.02 0.08 L(S180)35 HS2243 XL 0.3090.15561.6590.59 0.06 L(S180)36 HS2249 XL 0.5190.13562.3590.38 0.05 L(S180)0.05562.2190.2737 0.5090.071.5890.02HS2299
565.5990.55 0.09 562.7090.38 0.05 L(S180)38 HS2304 1.4590.07 0.2190.05562.2290.48 0.06 L(S180)0.08562.4790.470.5990.1839 HS2322 1.3890.05
0.11HS2357 561.1290.45 0.07 L(S180)1.4290.08 0.1990.08 564.5490.6240
a Columns 3–6, measured lens density, measured macular pigment density and best-fitting photopigment lmax values (in nm) and root-mean-squared (RMS) errors for the fit of the full-spectrummodel [Eqs. (1), (2) and (3a)] to each subject’s mean spectral sensitivity data incorporating their individually measured lens and macular pigment density values. Columns 7 and 8, best-fittingphotopigment lmax values and root-mean-squared (RMS) errors for the fit of the partial-spectrum (]520 nm) model [Eqs. (1), (2) and (3b)] to each subject’s mean spectral sensitivity data. Forthe lmax estimates, the 9S.E. values are plus and minus the standard error of the fitted photopigment template. For the measured densities, they are for the fit of the lens or macular pigmentoptical density spectra to the data (see Section 2). The subject code (column 2) and subject genotype (column 9) are also listed. XLM, no lens or macular pigment density measurements made.
b XL or XM, no lens or macular pigment density measurements made, respectively, the missing density has been replaced with the best-fitting one (italics), which was found by fixing the knownmacular (XL) or lens (XM) density at its measured value and allowing the unknown density to vary to find its best-fitting value. XL, no lens measurements made, the lack of short-wavelengthdata for this subject made the derivation of the best-fitting lens density impracticable.
L.T. Sharpe et al. / Vision Research 39 (1999) 3513–35253518
man & Sharpe, 1999) to give the spectral sensitivity atthe retinal level, Sreceptor(x). In preliminary trials, wealso attempted to optimize the peak photopigmentoptical density (rather than assuming the fixed valueof 0.5 in Eq. (2), but found that it was too poorlyconstrained. We therefore fixed it at 0.5 for each ob-server (see Stockman & Sharpe, 1999). In Eq. (3a),the spectral sensitivity at the retina, Sreceptor(x), is cor-rected to the cornea, Scornea(x), by restoring the filter-ing effects of the lens pigment, a lensOD(x), andmacular pigment, bmacOD(x). We assumed the lenspigment density spectrum [lensOD(x)] of van Norrenand Vos (1974), slightly modified by Stockman et al.(1993a), and a macular pigment density spectrum[macOD(x)] based on the Vos (1972) estimate. Verticalshifts (cn) were estimated for each of the n runs car-ried out by each subject. The lens density multiplier(a), the macular pigment density multiplier (b), thetemplate shift (Dx) and vertical shifts (cn) are all best-fitting values determined by the fit of the modeldefined by Eqs. (1), (2) and (3a) to each set of data.Each fit was carried out using the Marquardt–Leven-berg algorithm implemented in SigmaPlot (Jandel Sci-entific).
2.5.2. Full-spectrum fit (with measured lens and macul-ar pigment densities)
We also carried out the full-spectrum fit with indi-vidually measured estimates of the individual macularand lens pigment densities. That is, we used Eq. (3a)as in the full-spectrum fit (Section 2.5.1), but with aand b fixed at the measured values (see Table 2).
2.5.3. Partial-spectrum fit (]520 nm)In this analysis, the fit was carried out only for
measurements made at wavelengths ]520 nm. In thisregion, the macular pigment plays little role, and thelens is relatively transparent (having an average opti-cal density of only 0.10 log unit at 520 nm that de-clines with wavelength). Thus Eq. (3a) can bereplaced by Eq. (3b):
log[Scornea(x)]
= log[Sreceptor(x)]+ lensOD(x)+macOD(x)+c (3b)
The lens and macular pigment densities were fixedat the mean population densities obtained in the full-spectrum fit (Section 2.5.1). Thus, lensOD(x) is 1.48 at400 nm and macOD(x) is 0.37 at peak (see Table 1).The average data for each subject were used for thisfit, so that there is only a single vertical shift (c). Thetemplate shift (Dx) and vertical shift (c) are best-fitting values determined by the fit of the modeldefined by Eqs. (1), (2) and (3b)) to the mean data(]520 nm) for each subject.
3. Results
3.1. Genotype
The 40 dichromats studied here were originallyclassified as protanopes or deuteranopes according tothe characteristic slope of the regression line fittedthrough their Rayleigh matches (for details, seeSharpe et al., 1998a). They were then categorized (seethe rightmost column in Tables 1 and 2) according tothe amino acid sequences of their X-linked cone pho-topigment (or photopigments) as deduced from its(their) gene sequences. Of the 24 single gene deutera-nopes, four had L(A180) genes, one an L(M2;A180)gene, 18 L(S180) genes and one an L(M2;S180) gene.Of the 13 single-gene protanopes, three hadL1M2(A180) genes, three L2M3(A180) genes, fiveL3M4(A180) genes, one an L4M5(A180) gene andone an L4M5(S180) gene. In addition, three pro-tanopes had multiple genes, one with an L1M2(A180)and an M(A180) gene, and two with an L2M3(A180)and an M(A180) gene.
3.2. Spectral sensiti6ities
Foveal spectral sensitivities were determined in all40 subjects by heterochromatic flicker photometry.However, in four of the observers (HS2232, HS2243,HS2249 and HS2235) short-wavelength measurementsbelow 470 nm could not be completed (see Table 1).Figs. 1–5 show the individual spectral sensitivity datagrouped according to genotype. The continuous linesfitted to each data set are the predictions of the full-spectrum model with best-fitting lens and maculardensities. In general, this model provides a good de-scription of the spectral data, despite large individualdifferences in the data due to inter-observer variabilityin the lens and macular pigment densities (see, forexample, Fig. 4, in which all observers have the samephotopigment, but very different spectral sensitivitiesat short wavelengths).
The number of data points measured for each sub-ject depended on their availability. Six subjects didnot complete the short-wavelength measurements.Given that the subjects were naıve, the overall qualityof the data is good. Data treatment is discussed indetail elsewhere (see Sharpe et al., 1998a).
3.3. Macular pigment densities
We estimated the macular pigment densities fromthe differences between cone spectral sensitivities mea-sured centrally and peripherally (see Section 2). Thedensity estimates are given in Table 2, as the densityof the pigment at 460 nm, which is close to the wave-length of peak density.
L.T. Sharpe et al. / Vision Research 39 (1999) 3513–3525 3519
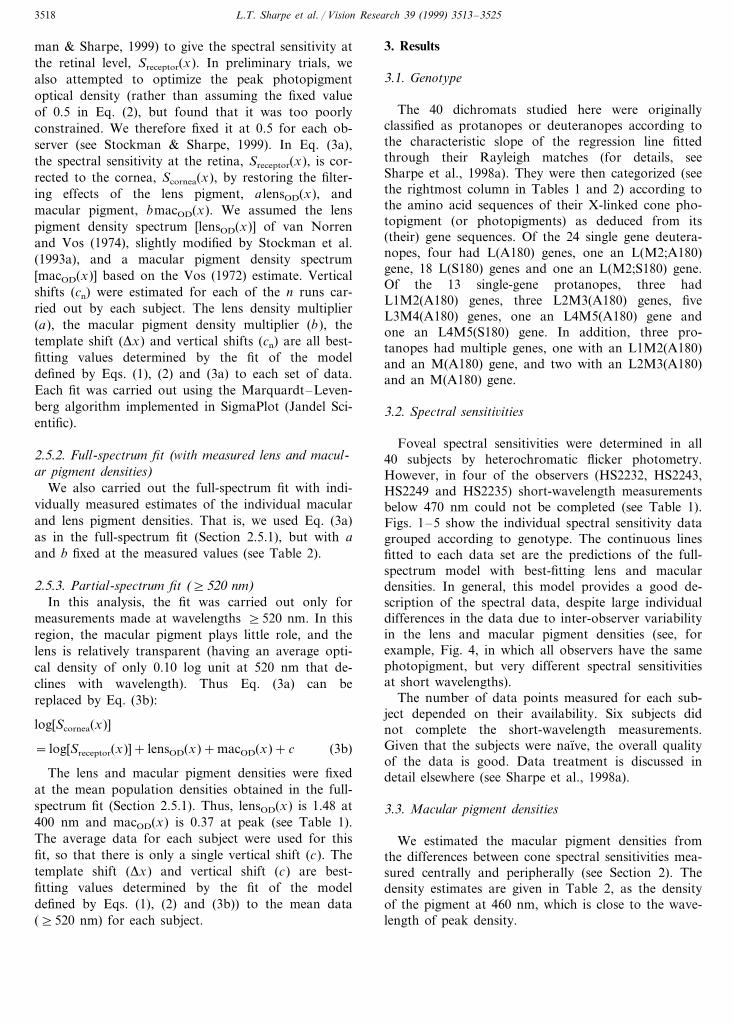
Fig. 1. Cone spectral sensitivity data for nine protanopes: three witha single L1M2(A180) (2); one with an L1M2(A180) plus anM(A180) gene ("); three with a single L2M3(A180) gene (�); andtwo with an L2M3(A180) plus an M(A180) gene (�). The fits of thefull-spectrum model (see text) are shown by the continuous lines; thelmax of the fitted photopigment template is given above each curve.
macular pigment densities (see Section 3.5.1 below).The fitted regression line (thick continuous line) has aslope of 0.981 and a correlation coefficient, r2, of 0.498.The thinner continuous lines show the 99% confidenceintervals for the regression (i.e. the range within whichthe regression line would be expected to fall, for re-peated measures, 99% of the time). Although the agree-ment between the measured and best-fitting densities ispoor, the regression line is not significantly differentfrom a line with a slope of 1 (i.e. perfect agreement, asshown by the diagonal dashed lines).
3.4. Lens pigment densities
To estimate lens densities, we measured rod spectralsensitivities at target wavelengths of 400, 420, 460 and500 nm. We then determined the relative adjustment inlens density and the vertical shift that together mini-
Fig. 2. Cone spectral sensitivity data for seven single-gene pro-tanopes: four with an L3M4(S180) gene (�); one with anL4M5(A180) gene (�); and one with an L4M5(S180) gene (filledhexagons). Other details as in Fig. 1.
Estimates of the macular pigment densities were ob-tained in all but three of the dichromats (HS2235,HS2237, HS2220). The macular pigment densities at460 nm are listed in Table 2 (column 4) for the avail-able observers. The densities at this wavelength rangefrom −0.09 to 1.01, with an average value of 0.3890.04. (We assume that the negative density values forHS2201 and HS2247 are due to noise, given that theyare less than the standard error of each estimate.) Thesemeasured macular pigment densities can be comparedwith the best-fitting macular densities obtained by thefit of the full-spectrum model (see values in column 6 ofTable 1 and below). Those values range from 0.01 to0.83; and have an average value of 0.3790.03.
Fig. 6A shows the measured macular pigment densi-ties plotted against the best-fitting densities obtainedfrom the full spectrum model with best-fitting lens and

L.T. Sharpe et al. / Vision Research 39 (1999) 3513–35253520
Fig. 3. Cone spectral sensitivity data for eight single-gene deutera-nopes: one with an L(M2;A180) gene (); four with an L(A180) gene( ); one with an L(M2;S180) gene (�); and two with an L(S180) (�).Other details as in Fig. 1.
with the best fitting lens densities obtained by the fitof the full spectrum model (see values in column 5 ofTable 1 and below). Those values range from 0.81 to1.83, and have an average value of 1.4890.04. Forthe measured (Table 2) lens pigment densities there isa slight increase in density with age of the observer.This accords with the relative youth of the populationsampled (28.191.2; range from 16 to 45). The den-sity of the crystalline lens at 400 nm increases lin-early, but only gradually between 16 and 45 years ofage (see Xu, Pokorny & Smith, 1997).
Fig. 6B shows the measured lens pigment densitiesplotted against the best-fitting densities obtained fromthe full spectrum model with best-fitting lens andmacular pigment densities (see fit Section 3.5.1 below).The fitted regression has a slope of 0.717 and a r2 of0.375. The thinner continuous lines show the 99%confidence intervals for the regression. Once again,the agreement between the measured and best-fittingdensities is poor, but the regression line is not signifi-cantly different from a line with a slope of 1.
Fig. 4. Cone spectral sensitivity data for eight single-gene deutera-nopes with an L(S180) (�). Other details as in Fig. 1.
mized the squared deviations between the subject’sdata and V %(l) (see Section 2). To reconstruct theabsolute densities from the relative ones, we assumedthat a zero relative adjustment was equivalent to adensity at 400 nm of 1.48 (i.e. we assumed the meandensity obtained from the best-fitting density analysis;see Table 1). The reconstructed values are tabulatedin Table 2. They are tabulated, arbitrarily, as thedensity of the pigment at 400 nm.
Estimates of the lens pigment densities were ob-tained in all but eight of the dichromats (HS2241,HS2235, HS2245, HS2247, HS2220, HS2221, HS2243,HS2249). The lens pigment densities at 400 nm arelisted in Table 2 (column 3) for the available observ-ers. The values at this wavelength vary from 1.03 to2.28; and have an average value of 1.5690.05. Thesemeasured lens pigment densities can be compared

L.T. Sharpe et al. / Vision Research 39 (1999) 3513–3525 3521
Fig. 5. Cone spectral sensitivity data for eight single gene protanopeswith an L(S180) gene (�). Other details as in Fig. 1.
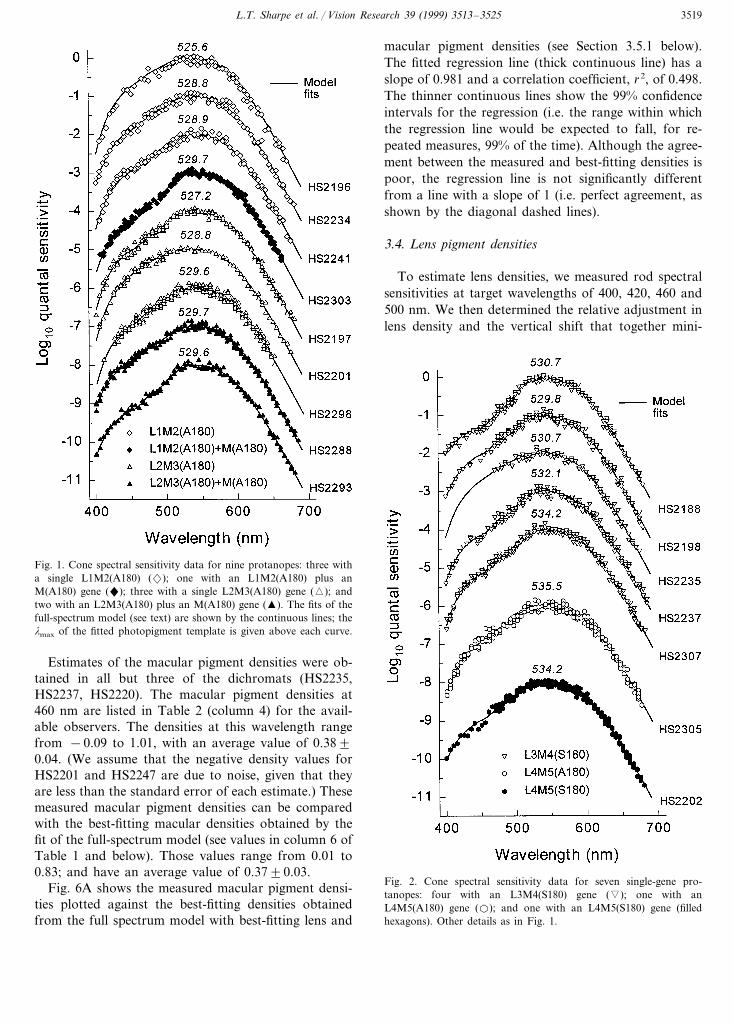
The lmax values and associated root mean squareerrors of the full-spectrum fit carried out with themeasured lens and macular pigment densities are tabu-lated in Table 2. Fig. 7 compares the lmax values soobtained with those obtained using best-fitting densityvalues. The fitted regression line for protanopes (panelA) has a slope of 1.188 and an r2 of 0.773; that fordeuteranopes (panel B), a slope of 1.196 and an r2 of0.420. Although the agreement between the two analy-ses is poor, the results are not significantly differentfrom perfect agreement (diagonal dashed lines).
The poor agreement seen in Fig. 7 could be causedeither by the measured lens and macular pigment den-sity values, which might be inaccurate, or by the best-fitting density values, which might be incorrect orskewed by the fitting procedure or model. We candetermine which of these is flawed by estimating thelmax values outside the spectral region in which individ-
Fig. 6. Best-fitting densities from the full-spectrum analysis plottedagainst the measured densities for macular (A) and lens (B) pigments(2). The regression line for the lens densities (A) has a slope of 0.981and an r2 of 0.498; whereas that for the macular pigment densities (B)has a slope of 0.717 and an r2 of 0.375 (thicker continuous line). Thethinner continuous lines show the 99% confidence intervals for theregressions lines. A perfect agreement between the two best-fittingand measured estimates is indicated by the dashed, diagonal lines. Asingle outlier (�) was excluded from the regression analysis for thelens density estimates.
3.5. Peak absorbances (lmax 6alues)
As described in Section 2, the spectral sensitivity datafor each observer were analyzed by three procedures toestimate the lmax of the underlying longer wavelengthcone photopigment.
3.5.1. Full-spectrum fit (with best-fitting lens and mac-ular pigment densities)
In the first fitting procedure, we determined the best-fitting lens and macular pigment densities, as well as thespectral position of the underlying photopigment tem-plate from 400 to 700 nm. The fits of the model areshown as the continuous lines in Figs. 1–5, and theresults are tabulated in Table 1. The lmax values forprotanopes range from 525.58 to 534.15 nm; whereasthose for deuteranopes range from 556.81 to 562.09 nm.
3.5.2. Full-spectrum-fit (with measured lens and macul-ar pigment densities)
In the second full-spectrum fit, measured lens andmacular pigment densities were used.
L.T. Sharpe et al. / Vision Research 39 (1999) 3513–35253522
Fig. 7. lmax values obtained from the full-spectrum analysis withestimated best-fitting lens and macular pigment densities plottedagainst those obtained from the full-spectrum analysis with individu-ally measured lens and macular pigment densities. The regression linefor protanopes (A) has a slope of 1.188 and an r2 of 0.773, while thatfor deuteranopes (B) has a slope of 1.196 and an r2 of 0.420 (thickercontinuous lines). The 99% confidence intervals for the regressionsare shown by the thinner continuous lines. Perfect agreement betweenthe two estimates is indicated by the dashed, diagonal lines. Symbolsas in Figs. 1–5.
optimal lens and macular densities are assumed in thepartial-spectrum fit (see Section 2).
Fig. 8 presents a comparison of the lmax estimatesobtained by the partial-spectrum fit and by the full-spectrum fit with best-fitting densities. The regressionline (thick continuous line) for protanopes has a slopeof 0.986 and an r2 of 0.982; whereas that for deutera-nopes has a slope of 0.844 and an r2 of 0.942. The thincontinuous lines indicate the 99% confidence intervals.For both protanopes and deuteranopes the correlationsare high. The estimates for deuteranopes, however, fallalong a regression line that is significantly shallowerthan a slope of one (dashed line). Thus, compared witha partial-spectrum fit, the full-spectrum fit tends tocompress slightly the range of lmax values of the deuter-anopic observers.
Fig. 8. lmax values obtained from the partial-spectrum (]520 nm)analysis plotted against those obtained from the full-spectrum analy-sis. The regression line for protanopes (A) has a slope of 0.986 and anr2 of 0.982, while that for deuteranopes (B) has a slope of 0.844 andan r2 of 0.942 (thicker continuous lines). The thinner continuous linesshow the 99% confidence intervals for the regressions. Perfect agree-ment is indicated by the dashed, diagonal lines. (Perfect agreementshould not be expected since mean, rather than individual, lens andmacular pigment density estimates are used in the partial-spectrum,but not full-spectrum, analysis.) Symbols as in Figs. 1–5.
ual differences in macular and lens pigment densitiesare important. This was done in the next fit.
3.5.3. Partial-spectrum-fit (]520 nm)In the partial-spectrum fit, we fixed the macular and
lens pigment densities at their mean best-fitting values,and determined only the spectral position of the under-lying pigment template. The results are tabulated inTable 2.
The partial-spectrum fit acts as a control for thefull-spectrum fits. Any distortions of the full-spectrumfits caused by inappropriate lens or macular pigmentdensities should result in clear discrepancies betweenthe full-spectrum and partial-spectrum estimates oflmax. These discrepancies will be in addition to thesmall differences that arise because mean rather than
L.T. Sharpe et al. / Vision Research 39 (1999) 3513–3525 3523
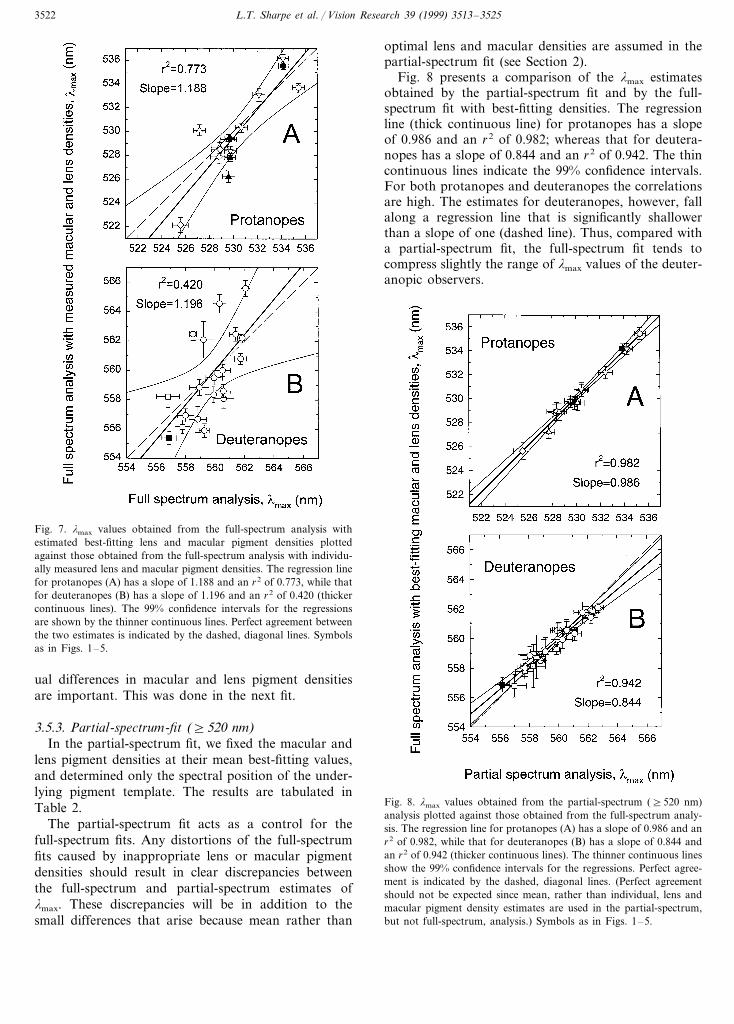
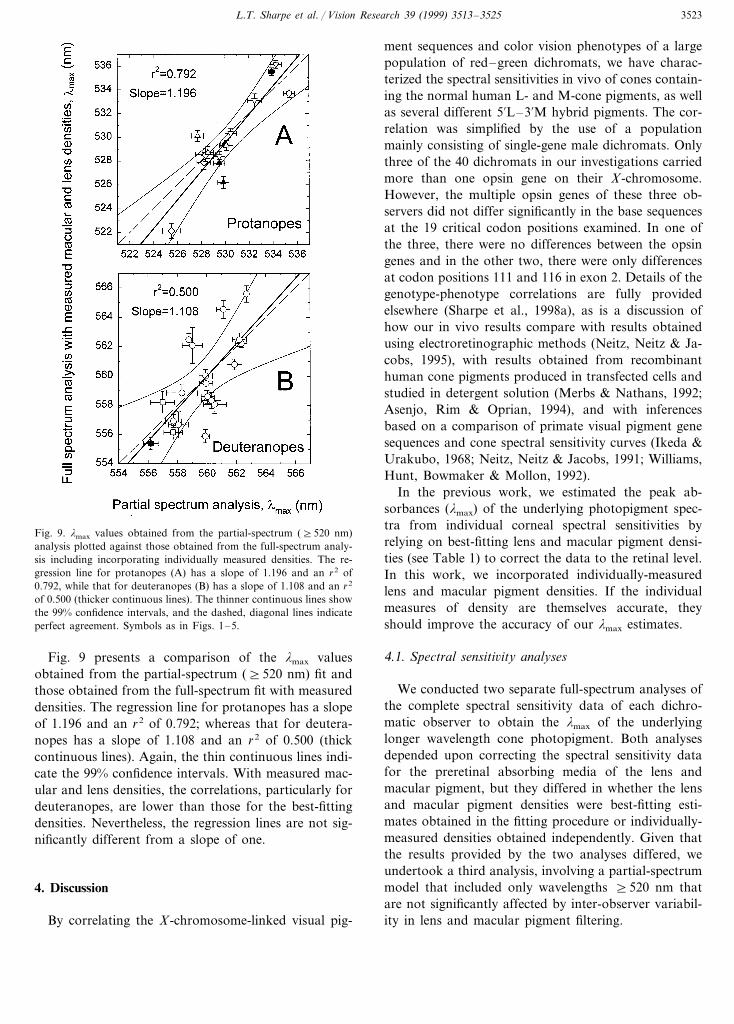
Fig. 9. lmax values obtained from the partial-spectrum (]520 nm)analysis plotted against those obtained from the full-spectrum analy-sis including incorporating individually measured densities. The re-gression line for protanopes (A) has a slope of 1.196 and an r2 of0.792, while that for deuteranopes (B) has a slope of 1.108 and an r2
of 0.500 (thicker continuous lines). The thinner continuous lines showthe 99% confidence intervals, and the dashed, diagonal lines indicateperfect agreement. Symbols as in Figs. 1–5.
ment sequences and color vision phenotypes of a largepopulation of red–green dichromats, we have charac-terized the spectral sensitivities in vivo of cones contain-ing the normal human L- and M-cone pigments, as wellas several different 5%L–3%M hybrid pigments. The cor-relation was simplified by the use of a populationmainly consisting of single-gene male dichromats. Onlythree of the 40 dichromats in our investigations carriedmore than one opsin gene on their X-chromosome.However, the multiple opsin genes of these three ob-servers did not differ significantly in the base sequencesat the 19 critical codon positions examined. In one ofthe three, there were no differences between the opsingenes and in the other two, there were only differencesat codon positions 111 and 116 in exon 2. Details of thegenotype-phenotype correlations are fully providedelsewhere (Sharpe et al., 1998a), as is a discussion ofhow our in vivo results compare with results obtainedusing electroretinographic methods (Neitz, Neitz & Ja-cobs, 1995), with results obtained from recombinanthuman cone pigments produced in transfected cells andstudied in detergent solution (Merbs & Nathans, 1992;Asenjo, Rim & Oprian, 1994), and with inferencesbased on a comparison of primate visual pigment genesequences and cone spectral sensitivity curves (Ikeda &Urakubo, 1968; Neitz, Neitz & Jacobs, 1991; Williams,Hunt, Bowmaker & Mollon, 1992).
In the previous work, we estimated the peak ab-sorbances (lmax) of the underlying photopigment spec-tra from individual corneal spectral sensitivities byrelying on best-fitting lens and macular pigment densi-ties (see Table 1) to correct the data to the retinal level.In this work, we incorporated individually-measuredlens and macular pigment densities. If the individualmeasures of density are themselves accurate, theyshould improve the accuracy of our lmax estimates.
4.1. Spectral sensiti6ity analyses
We conducted two separate full-spectrum analyses ofthe complete spectral sensitivity data of each dichro-matic observer to obtain the lmax of the underlyinglonger wavelength cone photopigment. Both analysesdepended upon correcting the spectral sensitivity datafor the preretinal absorbing media of the lens andmacular pigment, but they differed in whether the lensand macular pigment densities were best-fitting esti-mates obtained in the fitting procedure or individually-measured densities obtained independently. Given thatthe results provided by the two analyses differed, weundertook a third analysis, involving a partial-spectrummodel that included only wavelengths ]520 nm thatare not significantly affected by inter-observer variabil-ity in lens and macular pigment filtering.
Fig. 9 presents a comparison of the lmax valuesobtained from the partial-spectrum (]520 nm) fit andthose obtained from the full-spectrum fit with measureddensities. The regression line for protanopes has a slopeof 1.196 and an r2 of 0.792; whereas that for deutera-nopes has a slope of 1.108 and an r2 of 0.500 (thickcontinuous lines). Again, the thin continuous lines indi-cate the 99% confidence intervals. With measured mac-ular and lens densities, the correlations, particularly fordeuteranopes, are lower than those for the best-fittingdensities. Nevertheless, the regression lines are not sig-nificantly different from a slope of one.
4. Discussion
By correlating the X-chromosome-linked visual pig-
L.T. Sharpe et al. / Vision Research 39 (1999) 3513–35253524
The partial-spectrum fit clearly supports the full-spectrum fit with best-fitting lens and macular pigmentdensities over the full-spectrum fit with measured densi-ties. The individual lens and macular pigment densitymeasurements, although they involved standard tech-niques, produced relatively inaccurate density estimatescompared with those obtained from fitting density spec-tra to the flicker photometric spectral sensitivity data.
There are several reasons why the individually mea-sured macular and lens pigment densities, could, inprinciple, be inaccurate. First, the dichromatic observ-ers, who were relatively naıve and inexperienced, foundthe peripheral measurements much more challengingthan the central ones. Second, the macular and lensdensity estimates were based on far fewer wavelengthsthan the spectral sensitivity measurements: the full spec-tral sensitivity measurements involved as many as 60different wavelengths; whereas the macular pigmentmeasurements involved only seven wavelengths and thelens measurements, only four. Third, the method ofestimating macular pigment density ignores changes inphotopigment optical density with eccentricity, the ef-fect of which could slightly distort the macular densityestimates and the lmax fit (see Sharpe et al., 1998b).
It is not our intention to discourage the use of lensand macular pigment density determinations to correctcorneal spectral sensitivities. It is important, however,that the density determinations be as accurate as thespectral sensitivity measurements. Thus, repeated mea-sures at a comparable spectral density with well-trainedsubjects are required.
In order to obtain reliable and precise assays of thelmax of the pigment variants, large population samplesmust be obtained. Inspection of the population dataillustrates this point. For the pigment variant L(S180),comprising a large population of 18 observers, the sizeof the 95% confidence interval about the mean is 1.2nm. Thus the average lmax (560.3 nm) can be consid-ered to accurately represent the true lmax of the pho-topigment variant within about plus or minus 0.6 nm.In contrast, for the pigment variant L1M2(A180), com-prising only three individuals, the size of the 95%confidence interval is 9.4 nm; or plus and minus about4.7 nm, which is too large for making accurate predic-tions. The range of the estimate can be substantiallyimproved, however, by including in the sample all thosepigment variants whose absorbance maximum does notdiffer significantly from one another as determinedpsychophysically and by analysis of recombinant pig-ments: L1M2(A180), L1M29M(A180), L2M3(A180),L2M3(A180)9M(A180 (see Sharpe et al., 1998a). Thegroup, now comprising nine individuals, has a 95%confidence interval of 2.6 nm. Thus, given the amountof noise in the data, accurate assays of the lmax ofpigment variants in vivo by our method requires re-peated measures with highly-trained subjects.
In conclusion, in a previous study (Sharpe et al.,1998a), we estimated the lmax values of several X-chro-mosome-linked normal and hybrid photopigments. Weobtained them by correcting corneally measured spec-tral sensitivities back to the retinal level, after removingthe effects of the macular and lens pigments and fittinga template of fixed shape to the dilute photopigmentspectrum. In the previous study, we relied on best-fitting estimates of the lens and macular pigment densi-ties. In this study, we compared those estimates of thelmax with estimates based on individually measured lensand macular pigment densities. However, those com-parisons and comparisons with a partial-spectrum fit(]520 nm), which should not be significantly affectedby lens and macular pigment filtering, indicate that theindividually measured densities worsen rather than im-prove the fits. Presumably, the discrepancy arises be-cause our techniques for measuring the lens andmacular pigment densities rely on relatively few mea-surements made in peripheral retina; and, with naıveobservers, these are less accurate than centrally mea-sured flicker photometric sensitivities. We conclude thatwith this set of data the lmax values derived with thebest-fitting density estimates are overall the mostreliable.
Acknowledgements
Supported by the Deutsche Forschungsgemeinschaft(Bonn) grants SFB 325 Tp A13, SFB 430 Tp A6 andSh23/5-1 and a Hermann- und Lilly-Schilling-Stiftung-Professur (LTS), a National Institutes of Health grantEY 10206 (AS), and by the Howard Hughes MedicalInstitute (JN). We thank Clemens Fach, Gert Klausenand Andreas Reitner for assisting with the recruitmentof the dichromats and with the spectral sensitivitymeasurements.
References
Alpern, M., & Wake, T. (1977). Cone pigments in human deutancolor vision defects. Journal of Physiology, 266, 595–612.
Asenjo, A. B., Rim, J., & Oprian, D. D. (1994). Molecular determi-nants of human red/green color discrimination. Neuron, 12, 1131–1138.
De Vries, H. L. (1948). The fundamental response curves of normaland abnormal dichromatic and trichromatic eyes. Physica, 14,367–380.
Hecht, S. (1949). Brightness, visual acuity and color blindness. Docu-menta Ophthalmologica, 3, 289–306.
Hsia, Y., & Graham, C. H. (1957). Spectral luminosity curves forprotanopic, deuteranopic, and normal subjects. Proceedings of theNational Academy of Science USA, 43, 1011–1019.
Ikeda, M., & Urakubo, M. (1968). Flicker HRTF as test of colorvision. Journal of the Optical Society of America, 58, 27–31.
L.T. Sharpe et al. / Vision Research 39 (1999) 3513–3525 3525
King-Smith, P. E., & Webb, J. R. (1974). The use of photopicsaturation in determining the fundamental spectral sensitivitycurves. Vision Research, 14, 421–429.
Merbs, S. L., & Nathans, J. (1992). Absorption spectra of the hybridpigments responsible for anomalous color vision. Science, 258,464–466.
Mitchell, D. E., & Rushton, W. A. H. (1971). Visual pigments indichromats. Vision Research, 11, 1033–1043.
Nathans, J., Merbs, S. L., Sung, C.-H., Weitz, C. J., & Wang, Y.(1992). Molecular genetics of human visual pigments. AnnualRe6iew of Genetics, 26, 401–422.
Nathans, J., Thomas, D., & Hogness, S. G. (1986). Molecular genet-ics of human color vision: the genes encoding blue, green and redpigments. Science, 232, 193–202.
Neitz, M., Neitz, J., & Jacobs, G. H. (1991). Spectral tuning ofpigments underlying red–green color vision. Science, 252, 971–974.
Neitz, M., Neitz, J., & Jacobs, G. H. (1995). Genetic basis ofphotopigment variations in human dichromats. Vision Research,35, 2095–2103.
Pitt, F. H. G. (1935). Characteristics of dichromatic vision. MedicalResearch Council Special Report Series, No. 200. London: HisMajesty’s Stationery Office.
Rayleigh, L. (1881). Experiments on colour. Nature, 25, 64–66.Ruddock, K. H. (1965). The effect of age upon colour vision II.
Changes with age in light transmission of the ocular media. VisionResearch, 5, 47–58.
Rushton, W. A. H., Powell, D. S., & White, K. D. (1973). Exchangethresholds in dichromats. Vision Research, 13, 1993–2002.
Sharpe, L. T., Stockman, A., Jagle, H., Knau, H., Klausen, G.,Reitner, A., & Nathans, J. (1998a). Red, green, and red–greenhybrid photopigments in the human retina: correlations betweendeduced protein sequences and psychophysically measured spec-tral sensitivities. Journal of Neuroscience, 18, 10053–10069.
Sharpe, L. T., Stockman, A., Jagle, H., & Nathans, J. (1999). Opsingenes, cone photopigments, color vision and colorblindness. In K.Gegenfurtner, & L. T. Sharpe, Color 6ision: from genes to percep-tion. Cambridge: Cambridge University.
Sharpe, L. T., Stockman, A., Knau, H., & Jagle, H. (1998b). Macularpigment densities derived from central and peripheral spectral
sensitivity differences. Vision Research, 38, 3233–3239.Smith, V. C., & Pokorny, J. (1975). Spectral sensitivity of the foveal
cone photopigments between 400 and 500 nm. Vision Research,15, 161–171.
Stiles, W. S. (1939). The directional sensitivity of the retina and thespectral sensitivity of the rods and cones. Proceedings of the RoyalSociety of London, B127, 64–105.
Stiles, W. S. (1953). Further studies of visual mechanisms by thetwo-colour threshold technique. Coloquio sobre problemas opticosde la 6ision, 1, 65–103.
Stockman, A., MacLeod, D. I. A., & Johnson, N. E. (1993a).Spectral sensitivities of the human cones. Journal of the OpticalSociety of America A, 10, 2491–2521.
Stockman, A., MacLeod, D. I. A., & Vivien, J. A. (1993b). Isolationof the middle- and long-wavelength sensitive cones in normaltrichromats. Journal of the Optical Society of America A, 10,2471–2490.
Stockman, A., & Sharpe, L. T. (1999). Cone spectral sensitivities andcolor matching. In K. Gegenfurtner, & L. T. Sharpe, Color 6ision:from genes to perception. Cambridge: Cambridge University.
van Norren, D., & Vos, J. J. (1974). Spectral transmission of thehuman ocular media. Vision Research, 14, 1237–1244.
Vos, J. J. (1972). Literature review of human macular absorption inthe visible and its consequences for the cone receptor primaries.Netherlands Organization for applied scientific research, Institutefor Perception, Soesterberg, The Netherlands.
Wald, G. (1964). The receptors of human color vision. Science, 145,1007–1016.
Williams, A. J., Hunt, D. M., Bowmaker, J. K., & Mollon, J. D.(1992). The polymorphic photopigments of the marmoset: spectraltuning and genetic basis. EMBO Journal, 11, 2039–2045.
Willmer, E. N. (1950). Further observations on the properties of thecentral fovea in colour-blind and normal subjects. Journal ofPhysiology, 110, 422–446.
Wyszecki, G., & Stiles, W. S. (1982). Color science: concepts andmethods, quantitati6e data and formulae (2nd). New York: Wiley.
Xu, J., Pokorny, J., & Smith, V. C. (1997). Optical density of thehuman lens. Journal of the Optical Society of America A, 14,953–960.
..