KRI - Building Resilience - Khazanah Research Institute
212
BUILDING RESILIENCE TOWARDS INCLUSIVE SOCIAL PROTECTION IN MALAYSIA
-
Upload
khangminh22 -
Category
Documents
-
view
2 -
download
0
Transcript of KRI - Building Resilience - Khazanah Research Institute
BUILDING RESILIENCE TOWARDS INCLUSIVE SOCIAL PROTECTION IN MALAYSIA

BUILDING RESILIENCE TOWARDS INCLUSIVE SOCIAL
PROTECTION IN MALAYSIA
iv KHAZANAH RESEARCH INSTITUTE
©2021 Khazanah Research Institute September 2021 Building Resilience: Towards Inclusive Social Protection in Malaysia. – Kuala Lumpur, Malaysia: Khazanah Research Institute This work is available under the Creative Commons Attribution 3.0 Unported license (CC BY3.0) http://creativecommons.org/licenses/by/3.0/. Under the Creative Commons Attribution license, you are free to copy, distribute, transmit, and adapt this work, including for commercial purposes, under the following attributions: Attribution – Khazanah Research Institute. 2021. Building Resilience: Towards Inclusive Social Protection in Malaysia. Kuala Lumpur: Khazanah Research Institute. License: Creative Commons Attribution CC BY 3.0. Translations – If you create a translation of this work, please add the following disclaimer along with the attribution: This translation was not created by Khazanah Research Institute and should not be considered an official Khazanah Research Institute translation. Khazanah Research Institute shall not be liable for any content or error in this translation. Published September 2021. Published by Khazanah Research Institute at Level 25, Mercu UEM, Jalan Stesen Sentral 5, Kuala Lumpur Sentral 50470 Kuala Lumpur, Malaysia. Fax: +603 2034 0000; email: [email protected] All queries on rights and licenses should be addressed to the Chairman’s Office, Khazanah Research Institute at the address stated above. Information on Khazanah Research Institute publications and digital products can be found at www.KRInstitute.org Cover photo by Edwin Tan. The illustrations in the report have been designed using resources from freepik.com.
KHAZANAH RESEARCH INSTITUTE v
This report was prepared by the researchers of Khazanah Research Institute (KRI): Hawati Abdul Hamid, Adam
Manaf Mohamed Firouz, Jarud Romadan Khalidi, Nur Thuraya Sazali, Puteri Marjan Megat Muzafar and Siti
Aiysyah Tumin*.
It was authorised for publication by the Board of Trustees of KRI.
ACKNOWLEDGEMENTS
The team is grateful for the leadership and guidance provided by Tan Sri Nor Mohamed Yakcop, Chairman, KRI
and members of the KRI Board of Trustees (BOT) at the time of publication: Datuk Shahril Ridza Ridzuan and
Datuk Hisham Hamdan. The trust and advice given by the BOT have expanded the intellectual space for us to
pursue this research rigorously and impartially. We would also like to express our heartfelt appreciation to Dr
Jomo Kwame Sundaram, Senior Research Advisor of KRI, for his constant source of wisdom and insights
throughout the course of the research.
We also extend our sincere gratitude to Dr Stephen Kidd, Principal Social Policy Specialist, Development
Pathways for his constructive comments on the full draft of the report. Numerous subject matter experts have
provided feedback on various parts of the report: Dr Haniza Khalid; Muhammad Farqani Mohd Noor, Special
Officer (Policy and Strategy) at the CEO’s office, Social Security Organisation (SOCSO); Dr Saidatulakmal Mohd,
Associate Professor, Universiti Sains Malaysia (USM); Dr Mazlynda Md Yusuf, Senior Lecturer, Universiti Sains
Islam Malaysia (USIM); Eduardo Klien, Regional Director for Asia, Dr Flavia Galvani, Global Social Protection
Advisor and Florian Juergens, Income Security Advisor from HelpAge International; Stephen Barrett, Chief of
Social Policy and Ruben Villanueva Rodriguez, Regional Social Protection Specialist, United Nations Children’s
Fund (UNICEF); and Shea McClanahan, Senior Social Policy Specialist, Development Pathways.
The team is also grateful for the valuable insights from Datuk Hj Shamsuddin Bardan, Malaysian Employers
Federation (MEF); Dr Mohd Zaki Awang Chek, Senior Lecturer, Universiti Teknologi MARA (UiTM); Dr Amjad
Rabi, Social Security Economist and Chief Technical Advisor (Social Security) at the International Labour
Organization (ILO); Charles Knox-Vydmanov, Independent Consultant on Social Protection and former ILO
programme officer; and Siti Nur Shuhada Nor Baharin, Head of Actuary and Statistic unit, SOCSO.
We also thank the Ministry of Finance (MOF), SOCSO, Department of Statistics Malaysia (DOS), Lembaga Hasil
Dalam Negeri (LHDN), Employees Provident Fund (EPF) and Department of Labour Peninsular Malaysia for
providing essential data for our analyses.
We appreciate the constant support from our colleagues from the Chairman’s Office, namely Nicholas Khaw,
Siti Najyah Johar Salim, Hazilah Abdul Karim, Nurul Ain Fatizah Rahim and Nur Zulaikha Atiqah Mohd Zahril
for incessantly working behind the scenes to ensure everything goes smoothly. We would also like to thank
Christopher Choong Weng Wai for his instructive comments on the report; Nazihah Muhamad Noor for her
excellent editorial assistance; and Khoo Wei Yang, Mohd Amirul Rafiq bin Abu Rahim and Ahmad Ashraf Ahmad
Shaharudin for assistance at the publication stage of the report. We are also indebted to Siti Aisyah Razali Chan,
Noor Azwanee Sarah Roslee and Grace Loh Wan Chi for their diligent and dedicated assistance during their
internships at KRI.
In writing this report, we are indebted for the contributions of the people mentioned above. Interactions with
many others, not mentioned here, have also been instructive in shaping our thinking and providing reality
checks of the policy proposals. However, any fault lies with the authors.
*Except the lead author, remaining authors are listed alphabetically
vi KHAZANAH RESEARCH INSTITUTE
CONTENTS
ABBREVIATIONS viii
GLOSSARY xi
EXECUTIVE SUMMARY xvi
CHAPTER 1
INTRODUCTION 2
1.1 Social Protection: Meeting Present
and Future Challenges 2
1.2 Objective and Scope of the Report 7
CHAPTER 2
OVERVIEW OF SOCIAL PROTECTION IN
MALAYSIA 10
2.1 Social Protection Schemes in Malaysia 10
2.2 Overarching Issues and Challenges 12
2.2.1 Social insurance and legislated
provisions 12
2.2.2 Social assistance and subsidies 14
2.3 Towards an Inclusive and Cohesive
Life Cycle Social Protection System 24
CHAPTER 3
ESTABLISHING UNIVERSAL BASIC
INCOME FOR CHILDREN 28
3.1 Introduction 28
3.2 The Rights of Children to Social
Security 28
3.3 Overview of Child-specific Issues 30
3.3.1 Child poverty 30
3.3.2 Child malnutrition 33
3.4 Brief Review of Child-related
Assistance 34
3.4.1 Under-coverage 35
3.4.2 The “missing middle” 37
3.5 Policy Recommendation: Universal
Child Benefit as a Basic Income
Protection for Children 39
3.5.1 Implementing UCB in Malaysia 41
3.5.2 Level of investment required for a
UCB 42
3.5.3 Financing UCB 48
3.6 Concluding Remarks 50
CHAPTER 4
EXPANDING SOCIAL SECURITY TO ALL
WORKING-AGE INDIVIDUALS 52
4.1 Introduction 52
4.2 Overview of the Working-age
Population 53
4.3 Risks Faced by the Working-age
Population 56
4.4 Social Protection Policies and
Coverage Gaps in Malaysia 61
4.4.1 The state of social protection for
working-age population in
Malaysia 62
4.4.2 Coverage gaps in social insurance
for the working-age population 67
4.4.3 Other challenges in social
protection policies for the
working-age population 70
4.5 Policy Recommendation: Towards
Inclusive Social Security for the
Working-age Population 75
4.5.1 Extending the reach of social
security schemes 76
4.5.2 Government as the third pillar in
social security ecosystem 79
4.6 Concluding Remarks 87
KHAZANAH RESEARCH INSTITUTE vii
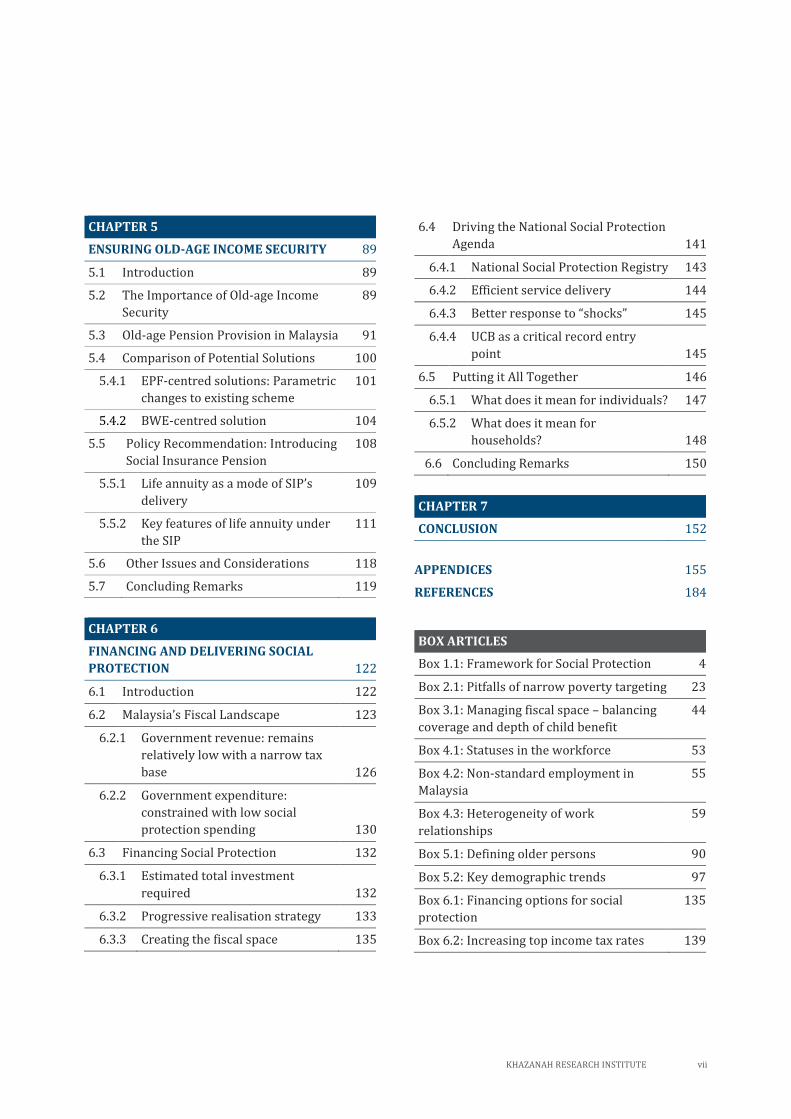
CHAPTER 5
ENSURING OLD-AGE INCOME SECURITY 89
5.1 Introduction 89
5.2 The Importance of Old-age Income
Security
89
5.3 Old-age Pension Provision in Malaysia 91
5.4 Comparison of Potential Solutions 100
5.4.1 EPF-centred solutions: Parametric
changes to existing scheme
101
5.4.2 BWE-centred solution 104
5.5 Policy Recommendation: Introducing
Social Insurance Pension
108
5.5.1 Life annuity as a mode of SIP’s
delivery
109
5.5.2 Key features of life annuity under
the SIP
111
5.6 Other Issues and Considerations 118
5.7 Concluding Remarks 119
CHAPTER 6
FINANCING AND DELIVERING SOCIAL
PROTECTION 122
6.1 Introduction 122
6.2 Malaysia’s Fiscal Landscape 123
6.2.1 Government revenue: remains
relatively low with a narrow tax
base 126
6.2.2 Government expenditure:
constrained with low social
protection spending 130
6.3 Financing Social Protection 132
6.3.1 Estimated total investment
required 132
6.3.2 Progressive realisation strategy 133
6.3.3 Creating the fiscal space 135
6.4 Driving the National Social Protection
Agenda 141
6.4.1 National Social Protection Registry 143
6.4.2 Efficient service delivery 144
6.4.3 Better response to “shocks” 145
6.4.4 UCB as a critical record entry
point 145
6.5 Putting it All Together 146
6.5.1 What does it mean for individuals? 147
6.5.2 What does it mean for
households? 148
6.6 Concluding Remarks 150
CHAPTER 7
CONCLUSION 152
APPENDICES 155
REFERENCES 184
BOX ARTICLES
Box 1.1: Framework for Social Protection 4
Box 2.1: Pitfalls of narrow poverty targeting 23
Box 3.1: Managing fiscal space – balancing
coverage and depth of child benefit
44
Box 4.1: Statuses in the workforce 53
Box 4.2: Non-standard employment in
Malaysia
55
Box 4.3: Heterogeneity of work
relationships
59
Box 5.1: Defining older persons 90
Box 5.2: Key demographic trends 97
Box 6.1: Financing options for social
protection
135
Box 6.2: Increasing top income tax rates 139
viii KHAZANAH RESEARCH INSTITUTE
ABBREVIATI ONS
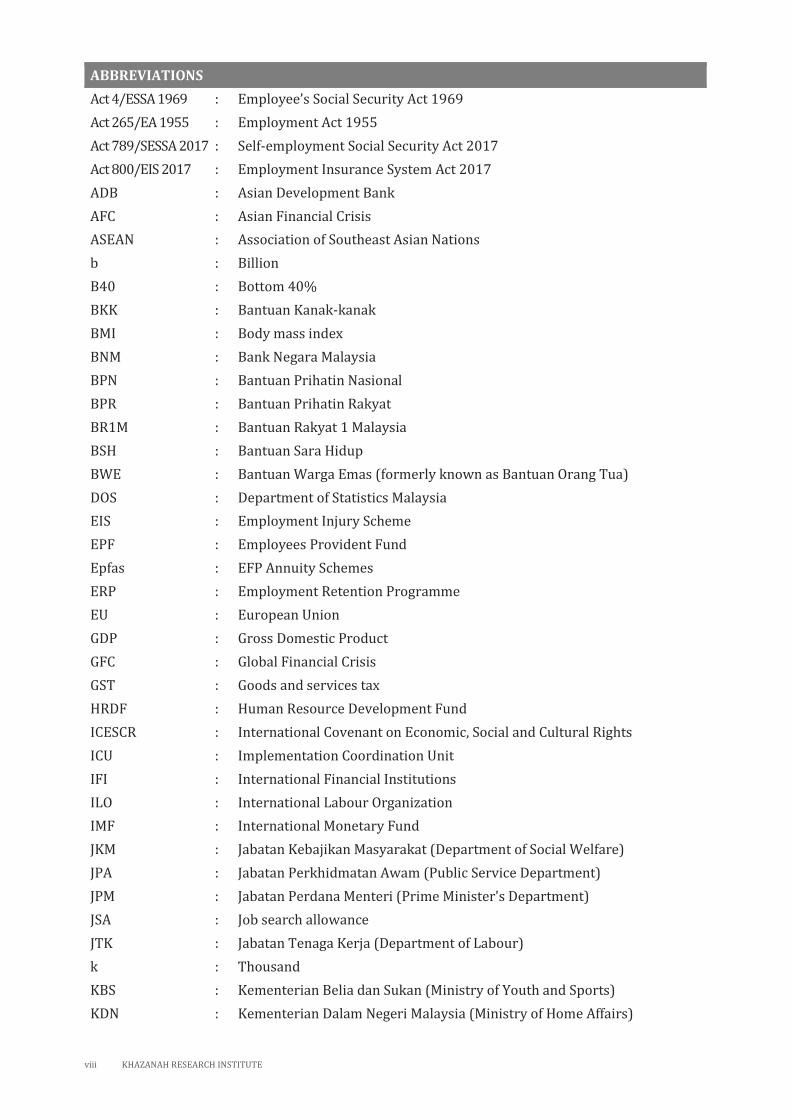
ABBREVIATIONS
Act 4/ESSA 1969 : Employee’s Social Security Act 1969
Act 265/EA 1955 : Employment Act 1955
Act 789/SESSA 2017 : Self-employment Social Security Act 2017
Act 800/EIS 2017 : Employment Insurance System Act 2017
ADB : Asian Development Bank
AFC : Asian Financial Crisis
ASEAN : Association of Southeast Asian Nations
b : Billion
B40 : Bottom 40%
BKK : Bantuan Kanak-kanak
BMI : Body mass index
BNM : Bank Negara Malaysia
BPN : Bantuan Prihatin Nasional
BPR : Bantuan Prihatin Rakyat
BR1M : Bantuan Rakyat 1 Malaysia
BSH : Bantuan Sara Hidup
BWE : Bantuan Warga Emas (formerly known as Bantuan Orang Tua)
DOS : Department of Statistics Malaysia
EIS : Employment Injury Scheme
EPF : Employees Provident Fund
Epfas : EFP Annuity Schemes
ERP : Employment Retention Programme
EU : European Union
GDP : Gross Domestic Product
GFC : Global Financial Crisis
GST : Goods and services tax
HRDF : Human Resource Development Fund
ICESCR : International Covenant on Economic, Social and Cultural Rights
ICU : Implementation Coordination Unit
IFI : International Financial Institutions
ILO : International Labour Organization
IMF : International Monetary Fund
JKM : Jabatan Kebajikan Masyarakat (Department of Social Welfare)
JPA : Jabatan Perkhidmatan Awam (Public Service Department)
JPM : Jabatan Perdana Menteri (Prime Minister's Department)
JSA : Job search allowance
JTK : Jabatan Tenaga Kerja (Department of Labour)
k : Thousand
KBS : Kementerian Belia dan Sukan (Ministry of Youth and Sports)
KDN : Kementerian Dalam Negeri Malaysia (Ministry of Home Affairs)
KHAZANAH RESEARCH INSTITUTE ix
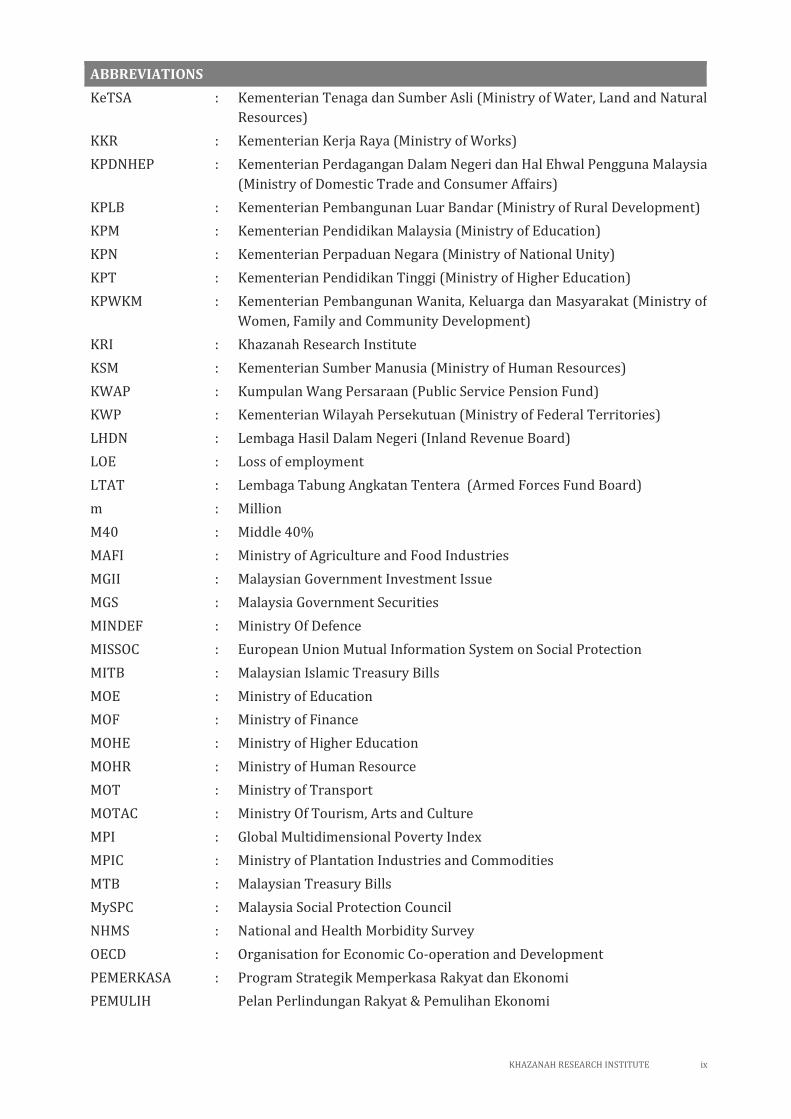
ABBREVIATIONS
KeTSA : Kementerian Tenaga dan Sumber Asli (Ministry of Water, Land and Natural
Resources)
KKR : Kementerian Kerja Raya (Ministry of Works)
KPDNHEP : Kementerian Perdagangan Dalam Negeri dan Hal Ehwal Pengguna Malaysia
(Ministry of Domestic Trade and Consumer Affairs)
KPLB : Kementerian Pembangunan Luar Bandar (Ministry of Rural Development)
KPM : Kementerian Pendidikan Malaysia (Ministry of Education)
KPN : Kementerian Perpaduan Negara (Ministry of National Unity)
KPT : Kementerian Pendidikan Tinggi (Ministry of Higher Education)
KPWKM : Kementerian Pembangunan Wanita, Keluarga dan Masyarakat (Ministry of
Women, Family and Community Development)
KRI : Khazanah Research Institute
KSM : Kementerian Sumber Manusia (Ministry of Human Resources)
KWAP : Kumpulan Wang Persaraan (Public Service Pension Fund)
KWP : Kementerian Wilayah Persekutuan (Ministry of Federal Territories)
LHDN : Lembaga Hasil Dalam Negeri (Inland Revenue Board)
LOE : Loss of employment
LTAT : Lembaga Tabung Angkatan Tentera (Armed Forces Fund Board)
m : Million
M40 : Middle 40%
MAFI : Ministry of Agriculture and Food Industries
MGII : Malaysian Government Investment Issue
MGS : Malaysia Government Securities
MINDEF : Ministry Of Defence
MISSOC : European Union Mutual Information System on Social Protection
MITB : Malaysian Islamic Treasury Bills
MOE : Ministry of Education
MOF : Ministry of Finance
MOHE : Ministry of Higher Education
MOHR : Ministry of Human Resource
MOT : Ministry of Transport
MOTAC : Ministry Of Tourism, Arts and Culture
MPI : Global Multidimensional Poverty Index
MPIC : Ministry of Plantation Industries and Commodities
MTB : Malaysian Treasury Bills
MySPC : Malaysia Social Protection Council
NHMS : National and Health Morbidity Survey
OECD : Organisation for Economic Co-operation and Development
PEMERKASA : Program Strategik Memperkasa Rakyat dan Ekonomi
PEMULIH Pelan Perlindungan Rakyat & Pemulihan Ekonomi
x KHAZANAH RESEARCH INSTITUTE
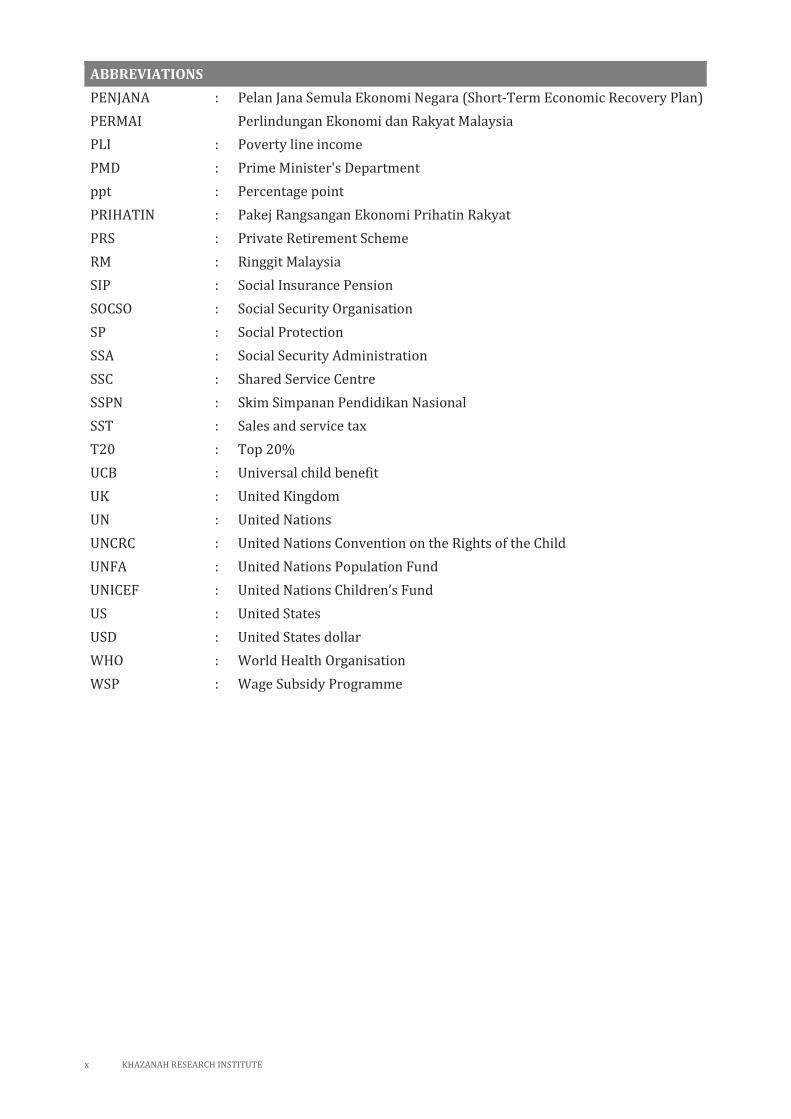
ABBREVIATIONS
PENJANA : Pelan Jana Semula Ekonomi Negara (Short-Term Economic Recovery Plan)
PERMAI Perlindungan Ekonomi dan Rakyat Malaysia
PLI : Poverty line income
PMD : Prime Minister's Department
ppt : Percentage point
PRIHATIN : Pakej Rangsangan Ekonomi Prihatin Rakyat
PRS : Private Retirement Scheme
RM : Ringgit Malaysia
SIP : Social Insurance Pension
SOCSO : Social Security Organisation
SP : Social Protection
SSA : Social Security Administration
SSC : Shared Service Centre
SSPN : Skim Simpanan Pendidikan Nasional
SST : Sales and service tax
T20 : Top 20%
UCB : Universal child benefit
UK : United Kingdom
UN : United Nations
UNCRC : United Nations Convention on the Rights of the Child
UNFA : United Nations Population Fund
UNICEF : United Nations Children’s Fund
US : United States
USD : United States dollar
WHO : World Health Organisation
WSP : Wage Subsidy Programme
KHAZANAH RESEARCH INSTITUTE xi
GLOSSAR Y
GLOSSARY
Active labour
market policies
: Policies concerning labour market integration for those looking for jobs,
usually the unemployed, but also the underemployed and the employed who
are looking for better jobs. Typical measures include training, job creation in
the form of public and community work programmes, programmes to
promote enterprise creation and hiring subsidies.
Source: ILO (2003c)
Aged population : When the population aged 65 years and over reached 14% of the total
population.
Source: DOS (2021a)
Ageing population : When the population aged 65 years and over reached 7% of the total
population.
Source: DOS (2021a)
Child poverty : Child poverty refers to the state of children living in poverty. One indicator of
child poverty is the child poverty rate which is the number of poor children
i.e. children from families/households earning below the poverty line
income, divided by the total number of children.
Source: Adapted from UNICEF (n.d.-a), Redmond et al. (2016)
Child-related tax
reliefs
: Tax reliefs allow a taxpayer to deduct a certain amount, usually money spent,
in that assessment year from the total annual income. Child-related tax reliefs
refer to tax reliefs for child-related expenses including reliefs for unmarried
children aged under 18, unmarried children aged 18 and above who are
studying and disabled children; purchase of breastfeeding equipment for
own use on children aged 2 years and below, childcare fees for children aged
under 7 and net savings in SSPN.
Source: Adapted from LHDN (n.d.-c)
Children : Internationally, children are persons aged under 18 as defined in the United
Nations Convention on the Rights of the Child. This definition is in line with
Malaysia’s Children and Young Persons (Employment) Act 1966 (Act 350)
although the Act distinguishes children from young adults. Children are
persons aged under 15 and young adults are persons aged 15 to 17.
Source: Adapted from UNICEF (n.d.-b), GOM (1966)
Contributory
scheme
: A scheme in which contributions made by protected persons directly
determine their entitlement to benefits. The most common form usually
covers workers in formal wage employment, where contributions are paid
by both employees and employers. In some countries, contributory schemes
also cover the self-employed and groups unable to contribute (e.g. unpaid
caregivers, the unemployed, or those with too low of an income), being partly
financed by government or other sources to cover the deficit. Other common
types of contributory schemes include national provident funds that usually
pay a lump sum to beneficiaries when particular contingencies occur
(typically old age, invalidity or death).
Source: ILO (2017b)
xii KHAZANAH RESEARCH INSTITUTE
GLOSSARY
Economies of scale : Economies of scale arises when the cost per unit decreases as scale or output
increases. In the context of households, economies of scale occurs when
people live together and make collective provisions for essentials, making the
cost per person lower as household size increases.
Source: Adapted from OECD (2003), Hawati Abdul Hamid, Ho, and Ismail
(2019)
Employer liability : Legislative provisions that specify the responsibilities of employers to
provide social protection for workers. For example, employers might be
required to provide benefits if workers are injured or suffer occupational
diseases, or provide paid maternity or paternity leave allowance, or provide
severance payments upon the termination of employment.
Source: ILO (2017c)
Exclusion error : Exclusion error refers to the extent to which persons in the targeted group
do not receive assistance/benefits even though they are entitled to them.
Source: World Bank (2020c)
Fiscal space : The resources available as a result of the active exploration and utilization of
all possible revenue sources by a government
Source: ILO (2019b)
Formal/informal
employment
: Formal employment refers to persons who are employed and are not in
informal employment. Informal employment is defined as employees or
other employed persons who are not protected by national labour
legislations, including non-affiliation to social security schemes or
employment benefits like paid leave; entrepreneurs of informal production
units; and contributing family workers.
Source: ILO (n.d.-d)
Formal/informal
sector
: Formal sector refers to incorporated enterprises. Informal sector refers to
unincorporated enterprises that produce at least partly for the market and
are not registered. Informal sector excludes households that produce
exclusively for own final use, subsistence agriculture, construction of own
dwellings, etc.
Source: ILO (n.d.-c)
Insurance premium : Contribution fee paid or made towards an insurance scheme.
Source: Adapted from OECD (2016)
Life annuity : An annuity or regular payments that continue until the annuitant’s or
individual's death, providing to the annuitant protection from outliving one’s
financial resources (longevity risk).
Source: OECD (2016)
Means-tested
scheme
: A scheme that provides benefits upon proof of need and targets certain
categories of persons or households whose means fall below a certain
threshold.
Source: ILO (2017b)
KHAZANAH RESEARCH INSTITUTE xiii
GLOSSARY
Non-monetary
deprivations
: Poverty is defined in both monetary and non-monetary deprivations. Non-
monetary deprivations reflect the lived reality of people’s experiences which
may not be captured through the poverty line income. Indicators of non-
monetary deprivations often focus on education, health and standard of
living.
Source: OPHI and UNDP (2020)
Non-standard
employment
: An umbrella term for different employment arrangements that deviate from
standard employment. They include temporary employment, part-time and
on-call work, temporary agency work and other multiparty employment
relationships, disguised employment and dependent self-employment. Non-
standard employment features prominently on digital labour platform.
Working from home could also be considered a diverse employment
arrangement.
Source: ILO (n.d.-d)
Passive labour
market policies
: Policies providing income replacement for those looking for jobs, usually the
unemployed, but also the underemployed and the employed who are looking
for better jobs. Typical measures include unemployment insurance and
assistance and early retirement.
Source: ILO (2003c)
Poverty line income
(PLI)
: The minimum income needed by a household to meet the basic food and non-
food needs for each of its members. The Food PLI is the amount of income
necessary to meet a household’s daily nutritional requirements as
determined by the Ministry of Health. The non-food PLI is the amount of
income necessary to meet the minimum requirements for items such as
clothing, housing, transport and other non-food needs by sex and age of a
person and is based on the expenditure patterns of low-income households.
Source: DOS (2020a)
Social assistance : The provision of benefits financed from general government revenue rather
than by individual contributions. Schemes are typically means-tested,
targeting low income and vulnerable individuals or households.
Source: ILO (2015a)
Social insurance : A scheme that guarantees protection through an insurance mechanism,
typically based on: (1) the prior payment of contributions i.e. before the
occurrence of the insured contingency; (2) risk sharing or “pooling”; and (3)
the notion of a guarantee. The contributions paid by (or for) insured persons
are pooled together and the resulting fund is used to cover the expenses
incurred exclusively by those persons affected by the occurrence of the
relevant (clearly defined) contingency.
Source: ILO (2017b)
xiv KHAZANAH RESEARCH INSTITUTE
GLOSSARY
Social protection : Social protection is defined as the set of policies and programs designed to
reduce poverty and vulnerability by promoting efficient labour markets,
diminishing people’s exposure to risks, and enhancing their capacity to
protect themselves against hazards and interruption/loss of income.
Source: ADB (2001)
Social protection
floor
: Nationally defined sets of basic social security guarantees which secure
protection aimed at preventing or alleviating poverty, vulnerability and
social exclusion.
Source: ILO (2012)
Social security : Social security is the protection that a society provides to individuals and
households to ensure access to health care and to guarantee income security,
particularly in cases of old age, unemployment, sickness, invalidity, work
injury, maternity or loss of a breadwinner.
Source: ILO (n.d.-b)
Standard
employment
: There is no official definition of standard employment, but historical
movements and economic changes roughly alluded to the conditions
expected from standard employment, typically understood as work that is
full time, indefinite, as well as part of a subordinate relationship between an
employee and employer.
Source: Adapted from ILO (2016), Nur Thuraya Sazali and Tan (2019)
Super-aged
population
: When the population aged 65 years and over reached 20% of the total
population.
Source: DOS (2021a)
Tax savings : Tax savings (or tax credits) provide support to eligible income-tax-paying
households by reducing the amount of tax owed or by providing a refund for
excess tax paid.
Source: ODI and UNICEF (2020)
The missing middle : The missing middle refers to households and persons not covered by neither
social assistance nor social insurance. Workers in the informal sector usually
comprise the missing middle due to the following: (1) not poor enough for
social assistance; and (2) not formal nor rich enough to contribute to social
insurance.
Source: ILO (2017b)
Tripartism or
tripartite
arrangement
: Tripartism is a division into three representative groups. In the context of
industrial relations in Malaysia, a tripartite set-up consists of the employer,
the employees and the government.
Source: Nankervis, Rowley, and Salleh (2016)
KHAZANAH RESEARCH INSTITUTE xv
GLOSSARY
Triple burden of
malnutrition
: Malnutrition refers to the lack of proper nutrition due to either one or a
combination of the following: not eating enough, not eating enough of the
right things or being unable to use the food that one does eat. The triple
burden of malnutrition refers to three stands of malnutrition:
undernutrition, hidden hunger due to deficiencies in essential vitamins and
minerals, and overweight and obesity.
Source: UNICEF (2019b)
Universal basic
income/Universal
child benefit
: Universal basic income is a periodic cash payment unconditionally delivered
to all citizens or legal residents on an individual basis, without a means-test
or behavioural requirement. It is paid to individuals at regular intervals over
time. Universal child benefit is similarly defined but is targeted to children.
Source: ODI and UNICEF (2020)
Working-age
population
: Internationally, the working-age population is commonly defined as persons
aged 15 years and older, although the age limits can vary from country to
country. In Malaysia, the working-age group is defined to be between 15 and
64 years old.
Source: Adapted from ILO (n.d.-e), DOS (n.d.)
xvi KHAZANAH RESEARCH INSTITUTE
EXECUTIVE SUMMARY
The Covid-19 pandemic has exposed pre-existing gaps in Malaysia’s social protection system with
many individuals falling through the cracks. Most social assistance programmes continue to be
associated with the idea of a short-term buffer and lack sustainable financial and legal foundations,
resulting in unpredictable benefits, under-coverage and programme fragmentation.
Social insurance schemes implemented by social security institutions have demonstrated great
agility and speed in providing relief, but their reach continues to be limited to formal sector workers
who are making contributions. It is an opportune time for the current model to be reconfigured in
preparing for a more volatile and challenging future which could contest the sustainability of the
social protection system in the coming decades.
This report advocates an inclusive social protection system in Malaysia with a forward-looking
approach in preventing poverty and addressing vulnerability. It recommends the adoption of the life
cycle approach and emphasises on a universal provision of social protection floor against major
risks at each stage of everyone’s life.
Our policy recommendations are as follows:
1. Investing in Universal Basic Income for Children
For children, we propose establishing a universal child benefit (UCB) scheme that provides
universal basic income for all children and their families to prevent the risk of any child being left
behind during this important stage of cognitive, physical and social development. Social
protection is vital for children as childhood is an inherently vulnerable stage of life, not least
because children are not able to provide for themselves and are dependent on others.
As children’s issues including education, health and nutrition are prevalent across all income
groups, a universal approach for children’s social protection is necessary. The proposed UCB
serves as an important scheme in building an inclusive and comprehensive social protection
system. Registering all children into the scheme would enable other need-specific interventions
to be better designed as well as ensuring inclusion in other social protection schemes when the
children enter the working age and old age.
2. Expanding Social Security to all Working-age Individuals
For the working-age adults, we propose expanding the mandatory coverage of existing formal
schemes of social insurance against the risks of work injury, invalidity and joblessness as well as
introducing a maternity income security scheme under the purview of the Social Security
Organisation (SOCSO). Currently, such provisions continue to mainly benefit employees in the
formal sector while neglecting a large share of the working-age population, including the self-
employed and informal workers, as well as those outside the labour force such as homemakers.
EXECUTIVE SUMMARY
KHAZANAH RESEARCH INSTITUTE xvii
The tripartite arrangement under the social insurance system is recommended to be
strengthened with greater government involvement as the third contributor in addition to
employers and employees. We call for the government to share the contributory costs for the
protection of residual working-age subgroups who face challenges to contribute such as workers
with informal and non-standard employment and those outside the labour force. Expanding the
coverage of such existing schemes ensures working-age individuals are not discriminated due to
their employment status or sector—a pertinent solution given the increasing informalisation of
jobs.
3. Establishing Social Insurance Pension for Old Age
For elders, we propose establishing a Social Insurance Pension (SIP) scheme as a basic income
security during old age. Currently, social protection for old-age income security from
contributory schemes remains limited in coverage as well as adequacy. These issues prevail as
the Employees Provident Fund (EPF) contributory scheme is only mandatory for workers with
clear employers, while the persistence of low wages and irregular work minimises the ability of
workers to contribute sufficiently to their retirement savings.
Meanwhile, tax-funded social assistance for the elder such as Bantuan Warga Emas (BWE) is
limited only to those considered poor. Thus, a universal social pension is critically needed to
provide basic old-age income security. We propose this to be delivered via a contributory social
insurance model where contributions are made by not only workers and employers, but also
shared by the government for working-age subgroups such as homemakers, unemployed
individuals and workers with informal and non-standard employment.
4. Financing and Progressive Realisation Strategy
Assuming all schemes are rolled out simultaneously and expanded in phases, the total initial
investment required would be RM17.5 billion or 1.1% of GDP. However, we propose progressive
implementation strategies with the UCB scheme to cover children aged 0 – 12 during the
inception year and expanded annually to achieve full coverage within the subsequent 5 years.
The expansion of social security schemes for the working-age adults can be realised by anchoring
the benefits at the minimum standards first and incorporating more aspirational targets over a
longer term.
The SIP is recommended to be rolled out later in 2025 or by the time the UCB scheme reaches full
coverage. The scheme could kick start by covering individuals aged 20 – 24 and gradually
expanding every year. Assuming the SIP will only be launched later, we estimate that the
investment for children and working-age population’s protections will be around RM16.4 billion.
However, savings rising from consolidation of several existing programmes would result in an
additional expenditure of only around RM2.4 billion in the first year of implementation. This
progressive realisation strategy recognises the essential arrangement to build institutional
capacity, including the amendment of relevant legislation as well as providing more time for the
government to shore up finances.
EXECUTIVE SUMMARY
xviii KHAZANAH RESEARCH INSTITUTE
While the government revenue base must be broadened, complementing social insurance model
with tax-based funding has greater potential of ensuring a social protection system that is
sustainable fiscally, economically and socially. Building on principles of risk sharing, collective
funding and solidary, greater government involvement under the social security tripartite
arrangement will be a more effective strategy in extending the protection floor to all. Inclusive
social protection will induce a virtuous cycle of strengthening the social contract, fostering trust
in government and enhancing government revenue.
5. Building a National Social Security Institution and a Unified Registry
In addition to sustainable funding, Malaysia’s social protection system also requires an
administrative system that is efficient and transparent to ensure good-quality service delivery
and responsiveness to shocks. We propose expanding the role of existing institution as the
National Social Security Institution to implement and administer both extended and new social
security schemes.
Additionally, we propose establishing a National Social Protection Registry to centralise the
information of every member of the population and enable a more efficient channelling of social
security and services. Since multiple databases are already available, digital technology can be
utilised to improve the efficiency of information flow by integrating these databases. The MyKad
number can be used as a single unique identification code to enable integration of data from
various institutions.
Our recommendations are built on, and not devoid of, existing social services, namely public
healthcare, social housing, the education system and other basic amenities. They are proposed to
complement, instead of replacing, the current tax-funded universal provision of social services. While
the report has made the case that these recommendations are necessary to protect individuals from
income insecurity throughout their lives, the schemes would not be sufficient on their own. True to
the social protection floor principle, our proposals seek to instil a solid foundation for income
security against well-documented risks. Cognisant of implementation and fiscal challenges, this
report strives to offer practical, equitable and sustainable policy proposals in the context of Malaysian
social protection.
KHAZANAH RESEARCH INSTITUTE 1
CHAPTER
01
INTRODUCTION 2
1.1 Social Protection: Meeting Present
and Future Challenges 2
1.2 Objective and Scope of the Report 7
2 KHAZANAH RESEARCH INSTITUTE
CHAPTER 1
INTRODUCTION
Social protections build sound economies and healthy societies. They can be crucial, life-sustaining tools
to enable access to health care and education, protect the right to housing and food, and shield people
from extreme poverty. There is also increasing evidence that failure to uphold people's economic, social
and cultural rights can be a contributing factor in violence and conflict. By protecting those
fundamental rights, social protections help to ensure public confidence in institutions, and social peace.
Michelle Bachelet (2020)1
1.1 Social Protection: Meeting Present and Future Challenges
Calls for social protection reform have gained prominence in public and policy discussions2 as the
Covid-19 pandemic exposed gaps in Malaysia’s existing system. Social protection can generally be
understood3 as a set of public policy measures that intend to achieve three key objectives: (1)
ensuring basic income security for all; (2) ensuring universal access to basic needs; and (3) enhancing
people’s capability to be productive and resilient to vulnerabilities (see Box 1.1).
From a long-term standpoint, Malaysia’s social protection policies appear to have moved in tandem
with the country’s needs as a developing nation. Various policy tools introduced over the years have
served the population relatively well, especially in supporting poverty alleviation objectives.
Although much has been achieved in terms of poverty eradication, gaps in terms of coverage and
adequacy of social protection remain serious problems to a large segment of Malaysia’s population.
One such challenge is that social assistance programmes funded by government revenue are often
short-term in nature and lack sustainable financial and legal foundations. This often results in
unpredictable benefits, under-coverage and programme fragmentation. Meanwhile, benefits under
the social insurance schemes mostly accrue to the relatively “well-off” workers with formal
employment arrangement4 who, together with their employers, are making contribution for the
social insurance premiums. Often neglected are the “missing middle”, who are neither “rich” nor
“poor”. Largely in informal employment, they are not in the position to benefit from social insurance
because they are not employed in the formal sector (public institutions or registered private sector
firms) yet may not be living in poverty by national standards, hence do not qualify for targeted social
assistance5. As social insurance is only available to contributing workers employed in the formal
sector and are making contributions for the insurance, those in the informal sector are not in the
position to benefit from these social insurance schemes.
1 OHCHR (2020) 2 For example, see World Bank (2020c), World Bank (2020a), BNM (2021a) 3 Based on concepts adopted by international agencies such as United Nations, ADB, World Bank and ILO. See Table 1.1 4 Workers are considered to have formal jobs if their employment arrangements, in law or in practice, are subjected to national labour
legislation and tax policies, covered by a formal social protection system or entitled to certain employment benefits such as paid leaves and
medical insurance. Source: Hawati Abdul Hamid and Nur Thuraya Sazali (2020) 5 UNDESA (2018)
CHAPTER 1
CHAPTER 1
INTRODUCTION
KHAZANAH RESEARCH INSTITUTE 3
Against this backdrop, there are several long-standing issues and emerging forces that could contest
the sustainability of the nation’s social protection system in the coming decades. First, although
Malaysia is classified as an upper middle-income country, it has been stuck in this middle-income
status for more than two decades since 19946. Lacklustre growth prospect will make this transition
more challenging. Despite, Malaysia’s economy has shifted away from being predominantly
agriculture-based, the incomes of the country’s agricultural workforce are still subject to volatility in
commodity prices and prone to seasonal unemployment owing to unfavourable weather conditions.
While the agriculture sector in recent years make up only around 10% of Malaysia’s total workforce,
it has consistently reported a higher incidence of fatal injuries. The agriculture sector also has a
higher proportion of informal and non-standard workers, likely unprotected by formal social
protection schemes such as employment injury insurance7.
Meanwhile, around 60% of Malaysia’s workforce is employed in the services sector, in which more
than half are involved in sales and services activities. These include wholesale & retail, food &
beverages and accommodation services that typically offer lower pay and more precarious
employment arrangements such as self-employment, temporary and part-time work. While the
manufacturing and other industrial activities are supposed to offer stable paid employment in the
formal sector, the number of medium and large enterprises in Malaysia is small: in 2015, medium
and large enterprises made up only 3.7% of all establishments in the country. The remaining 75.4%
of the establishments are micro enterprises and another 20.9% are classified as small8.
The trend in recent years has also shown a rise in vulnerable employment as technological
advancement and digitalisation have spurred the gig and platform economy. The phenomenon has
created new types of work relationships that pose a challenge in enforcing present labour market
regulations and protection schemes, which typically require a clear employer-employee
relationship9.
Second, Malaysia is a rapidly ageing society. While Malaysia has had a favourable demographic profile
that provided a large working-age population that has been beneficial for economic growth, the
country was estimated to have reached the tail end of the demographic dividend period in 2020.
Malaysia’s population has been ageing at a very high pace. In 2020, Malaysia has already become an
“ageing nation”, whereby more than 7% of the population is aged 65 and above. By 2044, the country
is set to become an “aged nation” when those aged 65 and above exceed 14% of the total population.
As the number of elderlies continues to rise, the old-age dependency ratio (the number of persons
aged 65 and above compared with the working population aged 15 – 64) will also rise from 10.4% in
2020 to 21.7% in 204010. Rapid ageing poses a challenge to Malaysia’s socio-economic policies
including those related to the labour market, income security post-working age, as well as health and
old-age care.
6 KRI (2018), Woo (2009) 7 Nur Thuraya Sazali and Siti Aiysyah Tumin (2020) 8 DOS (2016a) 9 Hawati Abdul Hamid and Nur Thuraya Sazali (2020) 10 World Bank (2020a)
CHAPTER 1
INTRODUCTION
4 KHAZANAH RESEARCH INSTITUTE
Third, Malaysians are now living longer, yet not necessarily healthier. On average, a baby born in
2019 can expect to live up to 75 years old given prevailing conditions i.e. over a decade longer
compared to newborns in 1970. However, 9.5 years of those years would be spent in poor health.
Since 1990, Malaysia has recorded marginal improvements in healthy life expectancy, increasing
from 62.8 years in 1990 to 65.5 years in 2019, but not large enough to reduce the number of years in
poor health. High prevalence of non-communicable diseases such as heart disease, cancer and mental
health problems are major contributors to this phenomenon11.
Health problems are not limited to adults and elderlies. In 2019, one in five children 5 years and
under are too short for their age (i.e. stunted). Meanwhile, one in three children under the age of 18
is overweight or obese, thus placing Malaysian children among the most obese in Southeast Asia12.
Beyond that, the Covid-19 pandemic is reversing decades of accomplishments in health. These
problems coupled with ageing population mean that the demand for health services will continue to
rise, putting pressure on the nation’s health sector.
Box 1.1: Framework for Social Protection
The definition of social protection varies across different schools of thought, organisations and
countries as interpretations have evolved over time. Based on definitions adopted by
international agencies (Table 1.1), it can be surmised that the objectives of social protection are
toward addressing and mitigating risks, emphasising protection from falling into poverty and
deprivations.
Towards achieving these ends, social protection policies generally strive to ensure basic income
security for all, universal access to basic needs and enhancing people’s capability to be productive
and resilient to vulnerabilities. More recently, an emerging new dimension in social protection
involves transformative solutions that intend to provide incentives for the society to develop
altogether, not only to alleviate poverty, but also to provide a decent and sustainable living for
all.
Social protection tools include a combination of social insurance (i.e. contributory forms of social
provisioning), social assistance (i.e. distribution of transfers by the state often funded by public
resources) as well provision of social services and basic amenities such as health, education and
water (Figure 1.1)
11 KRI (2020a) 12 Jarud Romadan Khalidi and Tan Zhai Gen (2020)
CHAPTER 1
INTRODUCTION
KHAZANAH RESEARCH INSTITUTE 5
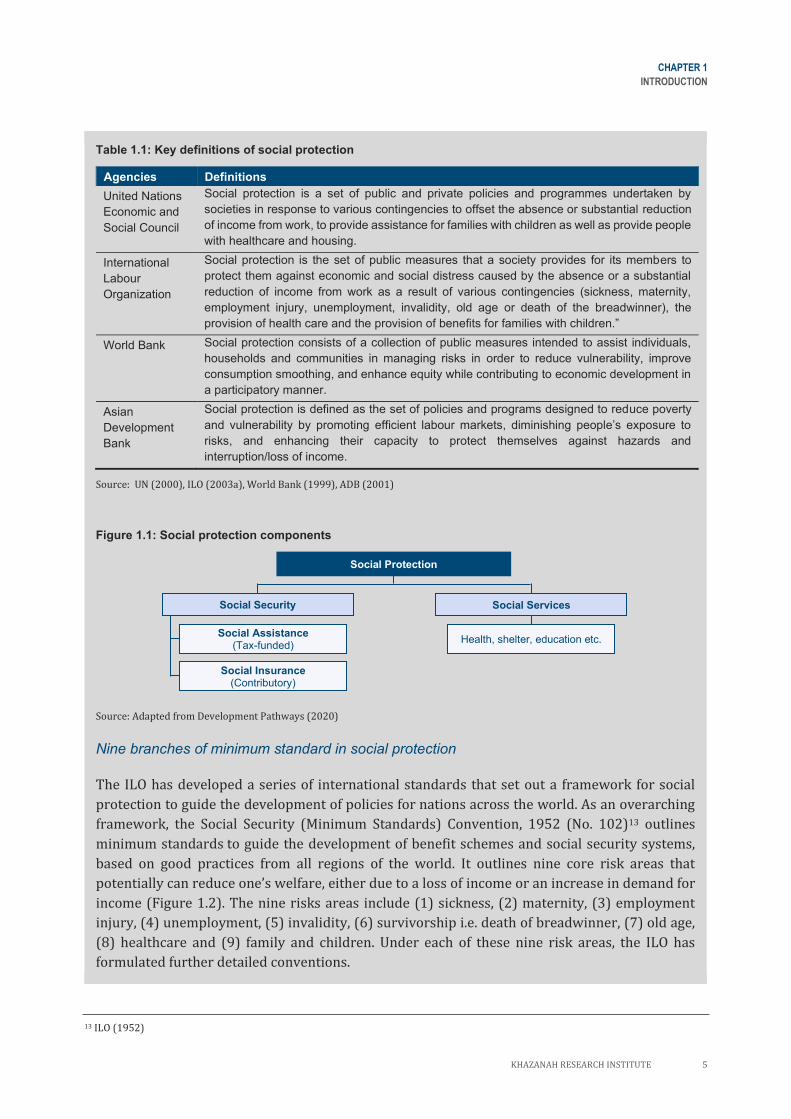
Table 1.1: Key definitions of social protection
Agencies Definitions
United Nations
Economic and
Social Council
Social protection is a set of public and private policies and programmes undertaken by
societies in response to various contingencies to offset the absence or substantial reduction
of income from work, to provide assistance for families with children as well as provide people
with healthcare and housing.
International
Labour
Organization
Social protection is the set of public measures that a society provides for its members to
protect them against economic and social distress caused by the absence or a substantial
reduction of income from work as a result of various contingencies (sickness, maternity,
employment injury, unemployment, invalidity, old age or death of the breadwinner), the
provision of health care and the provision of benefits for families with children.”
World Bank Social protection consists of a collection of public measures intended to assist individuals,
households and communities in managing risks in order to reduce vulnerability, improve
consumption smoothing, and enhance equity while contributing to economic development in
a participatory manner.
Asian
Development
Bank
Social protection is defined as the set of policies and programs designed to reduce poverty
and vulnerability by promoting efficient labour markets, diminishing people’s exposure to
risks, and enhancing their capacity to protect themselves against hazards and
interruption/loss of income.
Source: UN (2000), ILO (2003a), World Bank (1999), ADB (2001)
Figure 1.1: Social protection components
Source: Adapted from Development Pathways (2020)
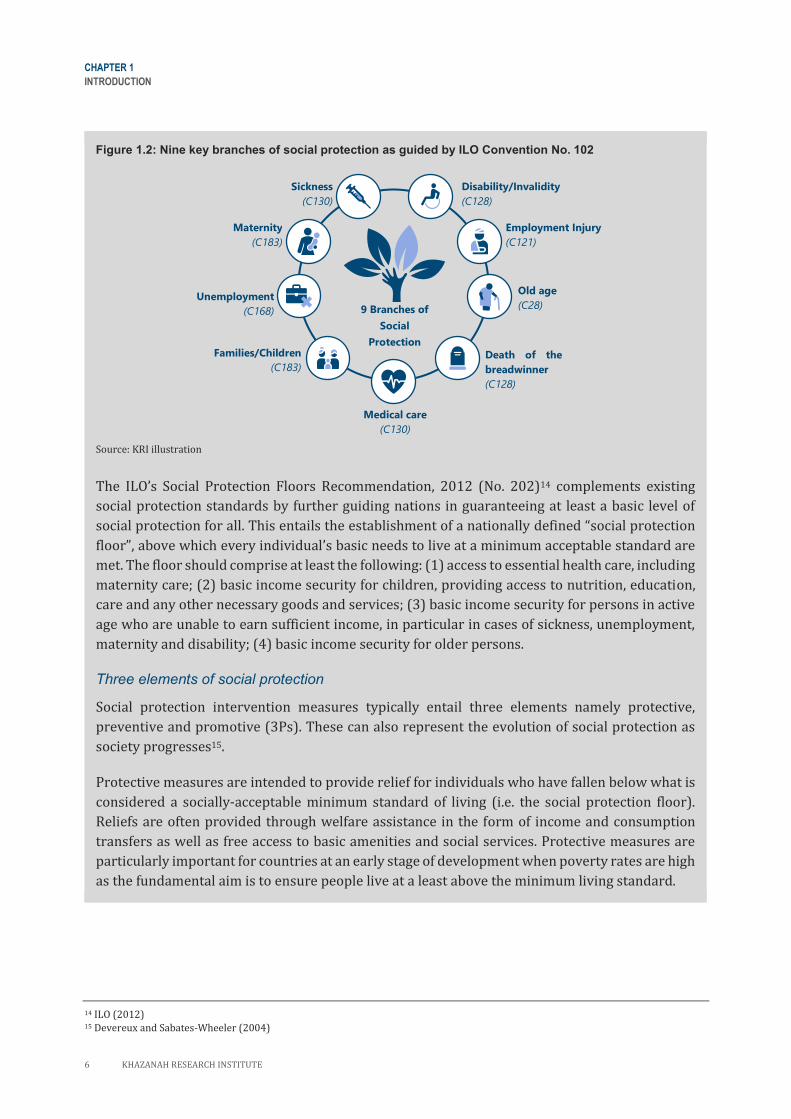
Nine branches of minimum standard in social protection
The ILO has developed a series of international standards that set out a framework for social
protection to guide the development of policies for nations across the world. As an overarching
framework, the Social Security (Minimum Standards) Convention, 1952 (No. 102)13 outlines
minimum standards to guide the development of benefit schemes and social security systems,
based on good practices from all regions of the world. It outlines nine core risk areas that
potentially can reduce one’s welfare, either due to a loss of income or an increase in demand for
income (Figure 1.2). The nine risks areas include (1) sickness, (2) maternity, (3) employment
injury, (4) unemployment, (5) invalidity, (6) survivorship i.e. death of breadwinner, (7) old age,
(8) healthcare and (9) family and children. Under each of these nine risk areas, the ILO has
formulated further detailed conventions.
13 ILO (1952)
Social Services
Health, shelter, education etc.
Social Protection
Social Assistance (Tax-funded)
Social Insurance (Contributory)
Social Security
CHAPTER 1
INTRODUCTION
6 KHAZANAH RESEARCH INSTITUTE
Figure 1.2: Nine key branches of social protection as guided by ILO Convention No. 102
Source: KRI illustration
The ILO’s Social Protection Floors Recommendation, 2012 (No. 202)14 complements existing
social protection standards by further guiding nations in guaranteeing at least a basic level of
social protection for all. This entails the establishment of a nationally defined “social protection
floor”, above which every individual’s basic needs to live at a minimum acceptable standard are
met. The floor should comprise at least the following: (1) access to essential health care, including
maternity care; (2) basic income security for children, providing access to nutrition, education,
care and any other necessary goods and services; (3) basic income security for persons in active
age who are unable to earn sufficient income, in particular in cases of sickness, unemployment,
maternity and disability; (4) basic income security for older persons.
Three elements of social protection
Social protection intervention measures typically entail three elements namely protective,
preventive and promotive (3Ps). These can also represent the evolution of social protection as
society progresses15.
Protective measures are intended to provide relief for individuals who have fallen below what is
considered a socially-acceptable minimum standard of living (i.e. the social protection floor).
Reliefs are often provided through welfare assistance in the form of income and consumption
transfers as well as free access to basic amenities and social services. Protective measures are
particularly important for countries at an early stage of development when poverty rates are high
as the fundamental aim is to ensure people live at a least above the minimum living standard.
14 ILO (2012) 15 Devereux and Sabates-Wheeler (2004)
Medical care
(C130)
Death of the
breadwinner
(C128)
9 Branches of
Social
Protection
Sickness
(C130)
Employment Injury
(C121)
Disability/Invalidity
(C128)
Old age
(C28)
Maternity
(C183)
Unemployment
(C168)
Families/Children
(C183)
CHAPTER 1
INTRODUCTION
KHAZANAH RESEARCH INSTITUTE 7
Preventive measures represent the forward-looking approach that serves to avert the risk of
falling below the floor due contingencies and livelihood shocks. Preventive measures, often
provided in the form of insurance, is grounded by the solidarity value in which society as a whole
standing together and pool resources in coping with contingencies. As countries develop, social
protection typically evolves from primarily serving a protective function aimed at ensuring a
minimum living standard to a more “proactive” function aimed at mitigating the risks of falling
into poverty and squalor.
Promotive measures focus on investment for individual’s human development. The measures are
designed to enhance productivity and build resilience of the population to safeguard against
potential vulnerabilities i.e. “enhancing their capacity to protect themselves against hazards and
interruption or loss of income”16 and “empower(s) them to adjust to changes in the economy and
in the labour market”17. Promotive measures include initiatives aimed at breaking the cycle of
poverty and promoting upward social mobility by enhancing capabilities through a range of
empowerment programmes such as skills development and early childhood education.
Fundamentally, the goals of the 3P measures are to promote poverty reduction and sustainable
development.
1.2 Objective and Scope of the Report
The aim of this report is to examine key trends in the context of social protection in Malaysia and to
recommend a set of strategic policies in addressing the challenges and mitigating the emerging risks.
For a cohesive social protection system, this report advocates for a life cycle approach that strives to
ensure that the entire population could overcome social and economic risks throughout their
lifetime. The recommendations hinge upon a socially acceptable standard of living to ensure a “social
protection floor” for everyone and subsequently to continuously deliver the protective, preventive
and promotive strategies sustainably.
This report encompasses seven chapters. This chapter has briefly outlined the theoretical framework
and approaches to social protection as the foundation to the discussions in ensuing chapters. Chapter
2 presents an overview of social protection in Malaysia, covering schemes designed as social
assistance, social insurance and labour market interventions, and the responsible institutions. This
is followed by a general discussion of the overarching issues and challenges faced, in terms of
coverage and adequacy of social protection. These discussions set the foundational basis of
establishing a social protection system that is more coherent and inclusive.
16 ILO (2003b) 17 ADB (2001)
CHAPTER 1
INTRODUCTION
8 KHAZANAH RESEARCH INSTITUTE
The succeeding three chapters are organised based on the proposed life cycle approach by classifying
the population into three broad phases of life: childhood, working age and old age. Chapter 3 focuses
on the population before entering the working age namely protection for children and the associated
family related risks. Childhood is considered as an inherently vulnerable stage in life as children are
not able to provide for themselves and highly dependent on others to meet their basic needs. Chapter
4 discusses the challenges and gaps in the labour market and highlights measures to build resilience
and mitigate contingency risks of the working-age population, including those entering, residing and
outside the labour market. Chapter 5 examines the social protection needs of the post-working age
population taking into account the gaps in terms of coverage and adequacy during old age amid
Malaysia rapid ageing scenario.
Chapter 6 ties all the recommendations presented in the preceding chapters and proposes some
institutional arrangements in delivering the services effectively. Chapter 7 concludes the report,
highlighting the potential of expanding social protection schemes beyond the minimum standards.
Overall, it is important to highlight that this report focuses on ensuring an inclusive provision of basic
social security for everyone (as illustrated in the left-hand side of Figure 1.1 in Box 1.1). We
acknowledge that social protection also encompasses the provision of social services and basic
amenities such as shelter, health, education, water and sanitation (right-hand side of Figure 1.1). The
provision of social services is undeniably a critical component of social protection. This is addressed
separately from this report as they are extensive and cross-cutting issues in the context of social
protection from cradle to grave. Discussions on housing are already extensively covered in KRI’s
work and remain a key area of research18. The provision of health services in the context of social
protection will be explored in a forthcoming publication. Likewise, education and other social
services in the context of social protection remains KRI’s future research agenda.
18 For example, see KRI (2015), Suraya Ismail et al. (2019)
KHAZANAH RESEARCH INSTITUTE 9
CHAPTER
02
OVERVIEW OF SOCIAL PROTECTION IN
MALAYSIA 10
2.1 Social Protection Schemes in Malaysia 10
2.2 Overarching Issues and Challenges 12
2.2.1 Social insurance and legislated
provisions 12
2.2.2 Social assistance and subsidies 14
2.3 Towards an Inclusive and Cohesive
Life Cycle Social Protection System 24
10 KHAZANAH RESEARCH INSTITUTE
CHAPTER 2
OVERVIEW OF SOCIAL PROTECTION IN MALAYSIA
Our Development Plan is national in character, national in intent and in scope. We carry out
development in accordance with priorities because it is our intention first and foremost to give all our
people of all races wherever they live the basic amenities of life and to raise their standard of living so
that they can live as decent, civilized human beings.
Tun Abdul Razak Hussein (1964)19
2.1 Social Protection Schemes in Malaysia
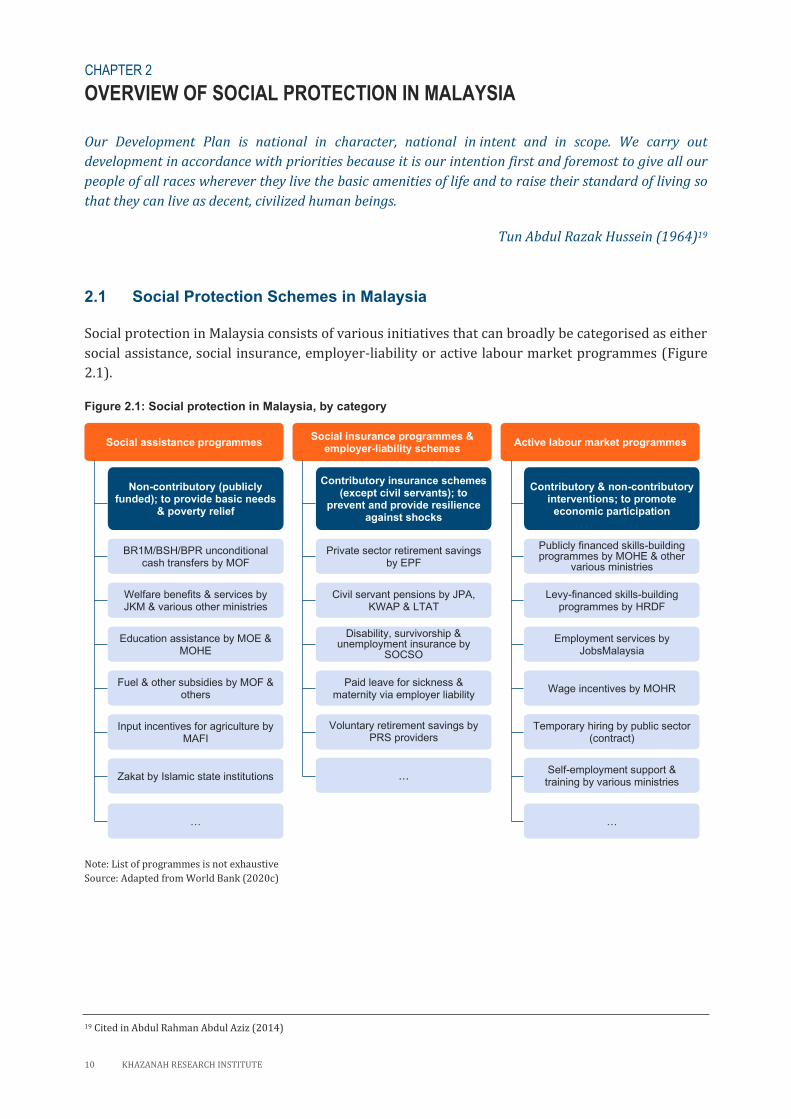
Social protection in Malaysia consists of various initiatives that can broadly be categorised as either
social assistance, social insurance, employer-liability or active labour market programmes (Figure
2.1).
Figure 2.1: Social protection in Malaysia, by category
Note: List of programmes is not exhaustive
Source: Adapted from World Bank (2020c)
19 Cited in Abdul Rahman Abdul Aziz (2014)
Non-contributory (publicly funded); to provide basic needs
& poverty relief
Contributory insurance schemes (except civil servants); to
prevent and provide resilience against shocks
Contributory & non-contributory interventions; to promote
economic participation
BR1M/BSH/BPR unconditional cash transfers by MOF
Welfare benefits & services by JKM & various other ministries
Education assistance by MOE & MOHE
Fuel & other subsidies by MOF & others
Input incentives for agriculture by MAFI
Zakat by Islamic state institutions
Private sector retirement savings by EPF
Civil servant pensions by JPA, KWAP & LTAT
Disability, survivorship & unemployment insurance by
SOCSO
Paid leave for sickness & maternity via employer liability
Voluntary retirement savings by PRS providers
Publicly financed skills-building programmes by MOHE & other
various ministries
Levy-financed skills-building programmes by HRDF
Employment services by JobsMalaysia
Wage incentives by MOHR
Temporary hiring by public sector (contract)
…
Social assistance programmes Social insurance programmes &
employer-liability schemes Active labour market programmes
Self-employment support & training by various ministries
…
…
CHAPTER 2

CHAPTER 2
OVERVIEW OF SOCIAL PROTECTION IN MALAYSIA
KHAZANAH RESEARCH INSTITUTE 11
Social assistance refers to non-contributory programmes that require no direct contribution from
beneficiaries (or their employers), as they are instead publicly funded through taxes or other
government revenues20. Meanwhile, social insurance mainly encompasses contributory schemes that
work through an insurance mechanism, entailing contributions by beneficiaries and the notion of a
guarantee, where benefits are paid exclusively to those persons affected by the occurrence of clearly-
defined contingencies. Alongside social insurance schemes are employer-liability schemes that are
likewise backed by legislation or contract law, where the costs of provisions are borne by employers.
Lastly, there are also active labour market programmes, which are designed to promote economic
participation and have been key given the emerging developmental aspects of social protection.
In Malaysia, social assistance schemes include a wide range of programmes administered and funded
by various federal government agencies, state governments and non-governmental organisations
(NGOs). For federal programmes, the largest social assistance scheme in more recent years is
Bantuan Rakyat 1 Malaysia (BR1M), an unconditional cash transfer programme for households in the
bottom 40% of the income distribution (B40) introduced in 2012. BR1M has since been revised and
rebranded as Bantuan Sara Hidup (BSH) in 2018 and later as Bantuan Prihatin Rakyat (BPR) for 2021.
In addition, there are also various welfare benefits and services provided by the Department of Social
Welfare (Jabatan Kebajikan Masyarakat, JKM), primarily for specific vulnerable groups such as poor
families, poor elders and the disabled. There are also numerous education-related programmes
offered by the Ministry of Education (MOE) and various others to provide support, either in cash or
in-kind, to students in school. Subsidies have also been a key component of Malaysia’s social
assistance, including consumption subsidies such as for fuel and food items. Fuel subsidies in
particular were the largest component of social assistance spending in Malaysia prior to its
rationalisation in the early 2010s and subsequent introduction of BR1M/BSH. Other types of
subsidies also exist as incentives for various actors across the production value chain, such as
agricultural input subsidies for fertiliser and seeds by the Ministry of Agriculture and Food Industries
(MAFI) and replanting incentives by Ministry of Rural Development (Kementerian Pembangunan
Luar Bandar, KPLB).
In terms of social insurance in Malaysia, these include various statutory schemes provided by several
government agencies21. For old-age income security, there is the Employees Provident Fund (EPF)
retirement savings scheme, which is a contributory scheme that is compulsory for private sector and
non-pensionable public sector employees22. EPF enrolment is also available for the self-employed,
workers in the informal sector, foreign workers and unpaid homemakers, but at a voluntary basis.
For the public sector, employees who opt for the government pension scheme are entitled to the non-
contributory pension upon retirement. Essentially, this scheme is a ‘pay as you go’ system that is
financed annually from government revenue. Given the issues of its sustainability, the Public Service
Pension Fund (Kumpulan Wang Persaraan, KWAP) was established to work towards financing the
pension liability. Lastly, there is also the Armed Forces Board Fund (Lembaga Tabung Angkatan
Tentera, LTAT) for the Malaysian Armed Forces, which is a compulsory contributory scheme.
20 In Malaysia, fiscal guidelines require that operating expenditure (which includes subsidies and social assistance) be financed by revenue,
whilst borrowings are only for development expenditure. Source: MOF (2018) 21 For greater detail on the existing social insurance and legislated provisions for the working age and older adults, including their
limitations, refer to Chapter 4 and Chapter 5, respectively. 22 EPF (2016b), EPF (2018)
CHAPTER 2
OVERVIEW OF SOCIAL PROTECTION IN MALAYSIA
12 KHAZANAH RESEARCH INSTITUTE
For working-age related risks, the Social Security Organisation (SOCSO) provides protection in the
form of cash benefits against unemployment, work injury, invalidity/disability, survivorship,
sickness and medical care23. Registration with SOCSO is compulsory for employees as classified under
the Employees Social Security Act 1969, and voluntary for the self-employed under the Self-
employment Social Security Act 2017 (except for the passenger transport sector where workers need
to be registered with SOCSO to apply for an e-hailing license). Employer-liability schemes, whilst not
considered as social insurance, are placed under the same pillar as they are similarly back by
legislation and operate under the notion of a guarantee given the occurrence of a risk. They are
provided for formal and public sector employees, and include paid leave for sickness and maternity,
entitling them to their full salaries paid by their employers.
In the third category of social protection initiatives in Malaysia, active labour market programmes
encompass various training and entrepreneurial programmes, provided by agencies such the Human
Resource Development Fund (HRDF) and other ministries such as the Ministry of Youth and Sports
(Kementerian Belia dan Sukan, KBS), the Ministry of Human Resource (MOHR) and the Ministry of
Higher Education (MOHE). Other measures also exist, some of which can be categorised as social
assistance (particularly in Malaysia’s fiscal item classification), with schemes such as MAFI’s input
subsidies and incentives for farmers.
2.2 Overarching Issues and Challenges
2.2.1. Social insurance and legislated provisions
Given the multiplicity of social protection initiatives in Malaysia, it is important to recognise that
legislative frameworks are essential in anchoring social protection systems in human rights24. In
Malaysia, these legislations are primarily limited to contributory social insurance schemes and other
employer-liability provisions afforded by labour and contract laws.
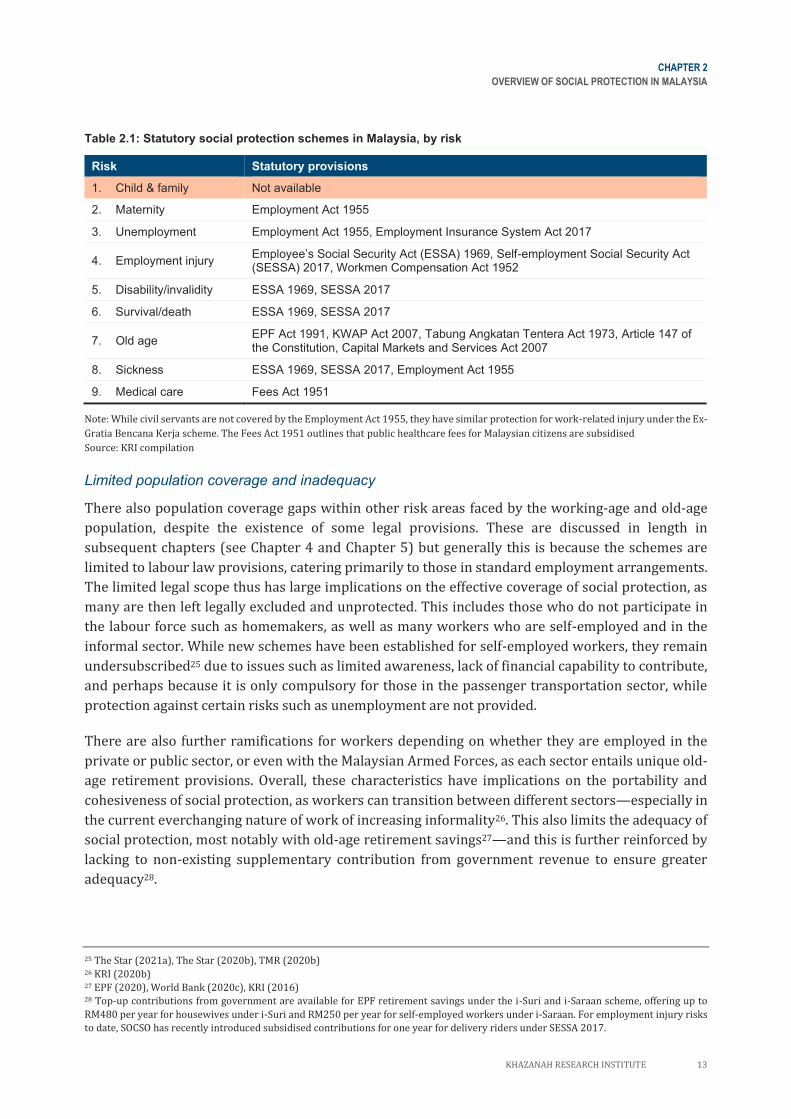
However, among these statutory provisions, coverage is limited in terms of the scope of risks covered,
the extent of the population protected and the adequacy of benefits provided. The existing legislated
provisions in Malaysia for each of the major branches of social protection risks areas, as prescribed
by ILO Convention No. 102, are outlined in Table 2.1.
Incomplete protection against core risks
The first notable limitation of statutory social protection in Malaysia is the lack of any provision of
benefits for child and family risks. This results in families and children having to seek social
assistance measures without any legal foundation, namely from government bodies or NGOs, but
these available schemes are only means-tested and intended for the low-income population. The lack
of any legal or universal social protection provision for children in Malaysia implies a limited
upholding of children’s entitlements, as the United Nations Convention on the Rights of the Child
(UNCRC) has recognised children’s rights to social security. Further issues related to social protection
for children are discussed in Chapter 3.
23 SOCSO (n.d.-g) 24 ILO (2017d)
CHAPTER 2
OVERVIEW OF SOCIAL PROTECTION IN MALAYSIA
KHAZANAH RESEARCH INSTITUTE 13
Table 2.1: Statutory social protection schemes in Malaysia, by risk
Risk Statutory provisions
1. Child & family Not available
2. Maternity Employment Act 1955
3. Unemployment Employment Act 1955, Employment Insurance System Act 2017
4. Employment injury Employee’s Social Security Act (ESSA) 1969, Self-employment Social Security Act (SESSA) 2017, Workmen Compensation Act 1952
5. Disability/invalidity ESSA 1969, SESSA 2017
6. Survival/death ESSA 1969, SESSA 2017
7. Old age EPF Act 1991, KWAP Act 2007, Tabung Angkatan Tentera Act 1973, Article 147 of the Constitution, Capital Markets and Services Act 2007
8. Sickness ESSA 1969, SESSA 2017, Employment Act 1955
9. Medical care Fees Act 1951
Note: While civil servants are not covered by the Employment Act 1955, they have similar protection for work-related injury under the Ex-
Gratia Bencana Kerja scheme. The Fees Act 1951 outlines that public healthcare fees for Malaysian citizens are subsidised
Source: KRI compilation
Limited population coverage and inadequacy
There also population coverage gaps within other risk areas faced by the working-age and old-age
population, despite the existence of some legal provisions. These are discussed in length in
subsequent chapters (see Chapter 4 and Chapter 5) but generally this is because the schemes are
limited to labour law provisions, catering primarily to those in standard employment arrangements.
The limited legal scope thus has large implications on the effective coverage of social protection, as
many are then left legally excluded and unprotected. This includes those who do not participate in
the labour force such as homemakers, as well as many workers who are self-employed and in the
informal sector. While new schemes have been established for self-employed workers, they remain
undersubscribed25 due to issues such as limited awareness, lack of financial capability to contribute,
and perhaps because it is only compulsory for those in the passenger transportation sector, while
protection against certain risks such as unemployment are not provided.
There are also further ramifications for workers depending on whether they are employed in the
private or public sector, or even with the Malaysian Armed Forces, as each sector entails unique old-
age retirement provisions. Overall, these characteristics have implications on the portability and
cohesiveness of social protection, as workers can transition between different sectors—especially in
the current everchanging nature of work of increasing informality26. This also limits the adequacy of
social protection, most notably with old-age retirement savings27—and this is further reinforced by
lacking to non-existing supplementary contribution from government revenue to ensure greater
adequacy28.
25 The Star (2021a), The Star (2020b), TMR (2020b) 26 KRI (2020b) 27 EPF (2020), World Bank (2020c), KRI (2016) 28 Top-up contributions from government are available for EPF retirement savings under the i-Suri and i-Saraan scheme, offering up to
RM480 per year for housewives under i-Suri and RM250 per year for self-employed workers under i-Saraan. For employment injury risks
to date, SOCSO has recently introduced subsidised contributions for one year for delivery riders under SESSA 2017.
CHAPTER 2
OVERVIEW OF SOCIAL PROTECTION IN MALAYSIA
14 KHAZANAH RESEARCH INSTITUTE
2.2.2. Social assistance and subsidies
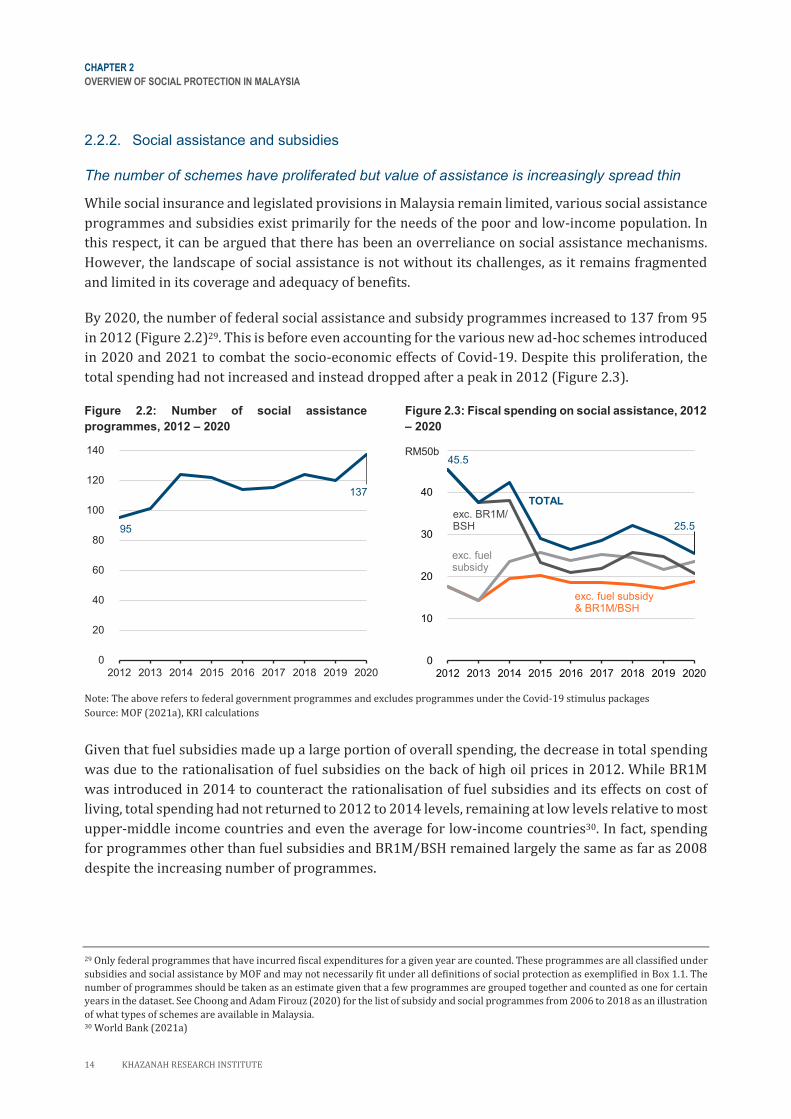
The number of schemes have proliferated but value of assistance is increasingly spread thin
While social insurance and legislated provisions in Malaysia remain limited, various social assistance
programmes and subsidies exist primarily for the needs of the poor and low-income population. In
this respect, it can be argued that there has been an overreliance on social assistance mechanisms.
However, the landscape of social assistance is not without its challenges, as it remains fragmented
and limited in its coverage and adequacy of benefits.
By 2020, the number of federal social assistance and subsidy programmes increased to 137 from 95
in 2012 (Figure 2.2)29. This is before even accounting for the various new ad-hoc schemes introduced
in 2020 and 2021 to combat the socio-economic effects of Covid-19. Despite this proliferation, the
total spending had not increased and instead dropped after a peak in 2012 (Figure 2.3).
Figure 2.2: Number of social assistance
programmes, 2012 – 2020
Figure 2.3: Fiscal spending on social assistance, 2012
– 2020
Note: The above refers to federal government programmes and excludes programmes under the Covid-19 stimulus packages
Source: MOF (2021a), KRI calculations
Given that fuel subsidies made up a large portion of overall spending, the decrease in total spending
was due to the rationalisation of fuel subsidies on the back of high oil prices in 2012. While BR1M
was introduced in 2014 to counteract the rationalisation of fuel subsidies and its effects on cost of
living, total spending had not returned to 2012 to 2014 levels, remaining at low levels relative to most
upper-middle income countries and even the average for low-income countries30. In fact, spending
for programmes other than fuel subsidies and BR1M/BSH remained largely the same as far as 2008
despite the increasing number of programmes.
29 Only federal programmes that have incurred fiscal expenditures for a given year are counted. These programmes are all classified under
subsidies and social assistance by MOF and may not necessarily fit under all definitions of social protection as exemplified in Box 1.1. The
number of programmes should be taken as an estimate given that a few programmes are grouped together and counted as one for certain
years in the dataset. See Choong and Adam Firouz (2020) for the list of subsidy and social programmes from 2006 to 2018 as an illustration
of what types of schemes are available in Malaysia. 30 World Bank (2021a)
0
20
40
60
80
100
120
140
2012 2013 2014 2015 2016 2017 2018 2019 2020
95
137
0
10
20
30
40
50
2012 2013 2014 2015 2016 2017 2018 2019 2020
RM50b
exc. fuel subsidy & BR1M/BSH
exc. BR1M/BSH
exc. fuelsubsidy
TOTAL
45.5
25.5
CHAPTER 2
OVERVIEW OF SOCIAL PROTECTION IN MALAYSIA
KHAZANAH RESEARCH INSTITUTE 15
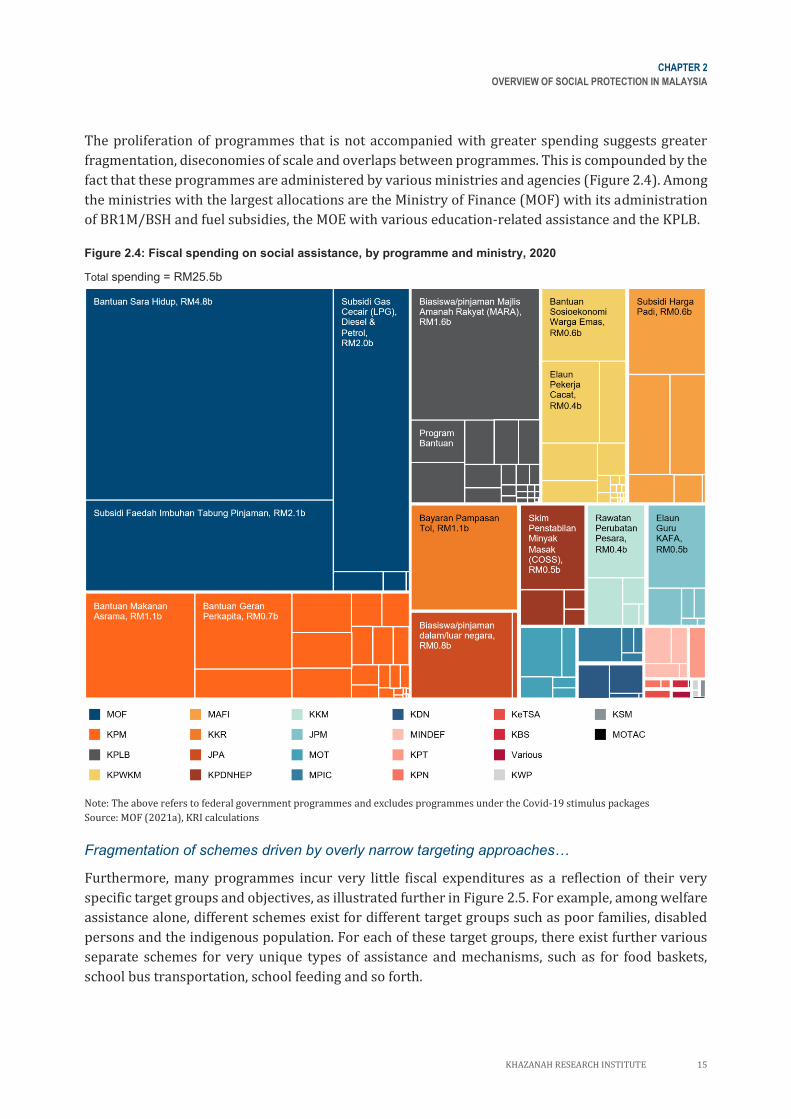
The proliferation of programmes that is not accompanied with greater spending suggests greater
fragmentation, diseconomies of scale and overlaps between programmes. This is compounded by the
fact that these programmes are administered by various ministries and agencies (Figure 2.4). Among
the ministries with the largest allocations are the Ministry of Finance (MOF) with its administration
of BR1M/BSH and fuel subsidies, the MOE with various education-related assistance and the KPLB.
Figure 2.4: Fiscal spending on social assistance, by programme and ministry, 2020
Total spending = RM25.5b
Note: The above refers to federal government programmes and excludes programmes under the Covid-19 stimulus packages
Source: MOF (2021a), KRI calculations
Fragmentation of schemes driven by overly narrow targeting approaches…
Furthermore, many programmes incur very little fiscal expenditures as a reflection of their very
specific target groups and objectives, as illustrated further in Figure 2.5. For example, among welfare
assistance alone, different schemes exist for different target groups such as poor families, disabled
persons and the indigenous population. For each of these target groups, there exist further various
separate schemes for very unique types of assistance and mechanisms, such as for food baskets,
school bus transportation, school feeding and so forth.
CHAPTER 2
OVERVIEW OF SOCIAL PROTECTION IN MALAYSIA
16 KHAZANAH RESEARCH INSTITUTE
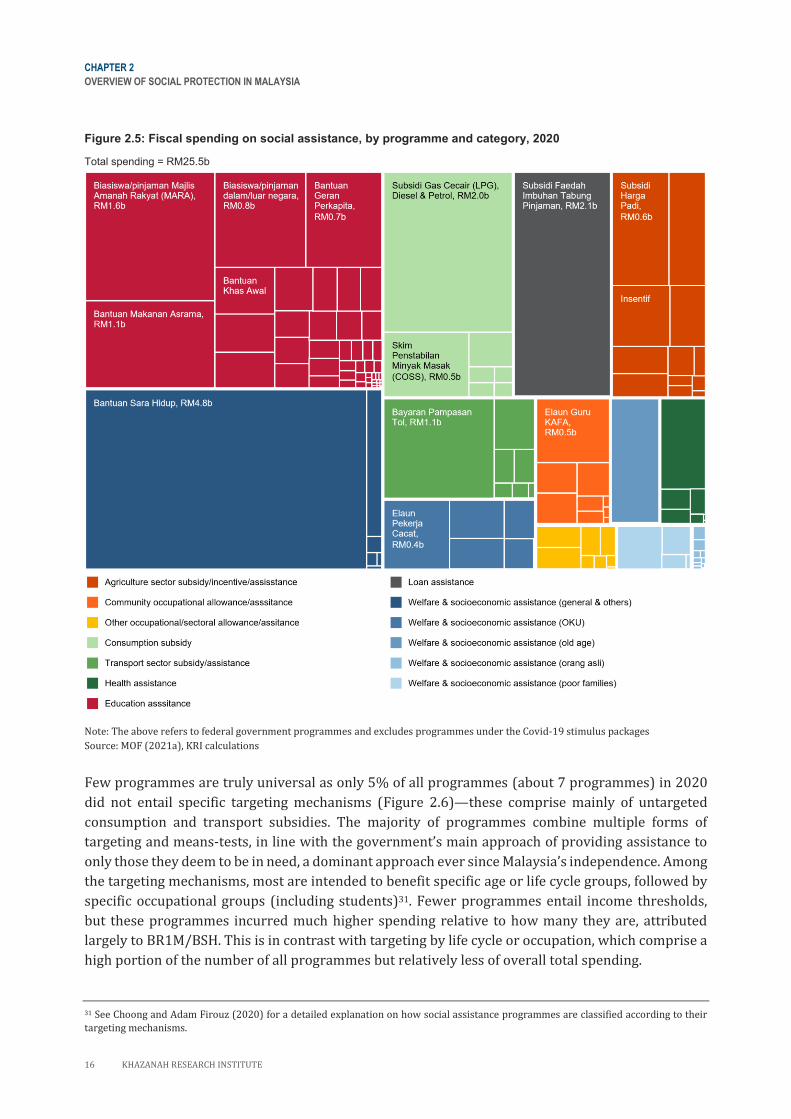
Figure 2.5: Fiscal spending on social assistance, by programme and category, 2020
Total spending = RM25.5b
Note: The above refers to federal government programmes and excludes programmes under the Covid-19 stimulus packages
Source: MOF (2021a), KRI calculations
Few programmes are truly universal as only 5% of all programmes (about 7 programmes) in 2020
did not entail specific targeting mechanisms (Figure 2.6)—these comprise mainly of untargeted
consumption and transport subsidies. The majority of programmes combine multiple forms of
targeting and means-tests, in line with the government’s main approach of providing assistance to
only those they deem to be in need, a dominant approach ever since Malaysia’s independence. Among
the targeting mechanisms, most are intended to benefit specific age or life cycle groups, followed by
specific occupational groups (including students)31. Fewer programmes entail income thresholds,
but these programmes incurred much higher spending relative to how many they are, attributed
largely to BR1M/BSH. This is in contrast with targeting by life cycle or occupation, which comprise a
high portion of the number of all programmes but relatively less of overall total spending.
31 See Choong and Adam Firouz (2020) for a detailed explanation on how social assistance programmes are classified according to their
targeting mechanisms.
CHAPTER 2
OVERVIEW OF SOCIAL PROTECTION IN MALAYSIA
KHAZANAH RESEARCH INSTITUTE 17
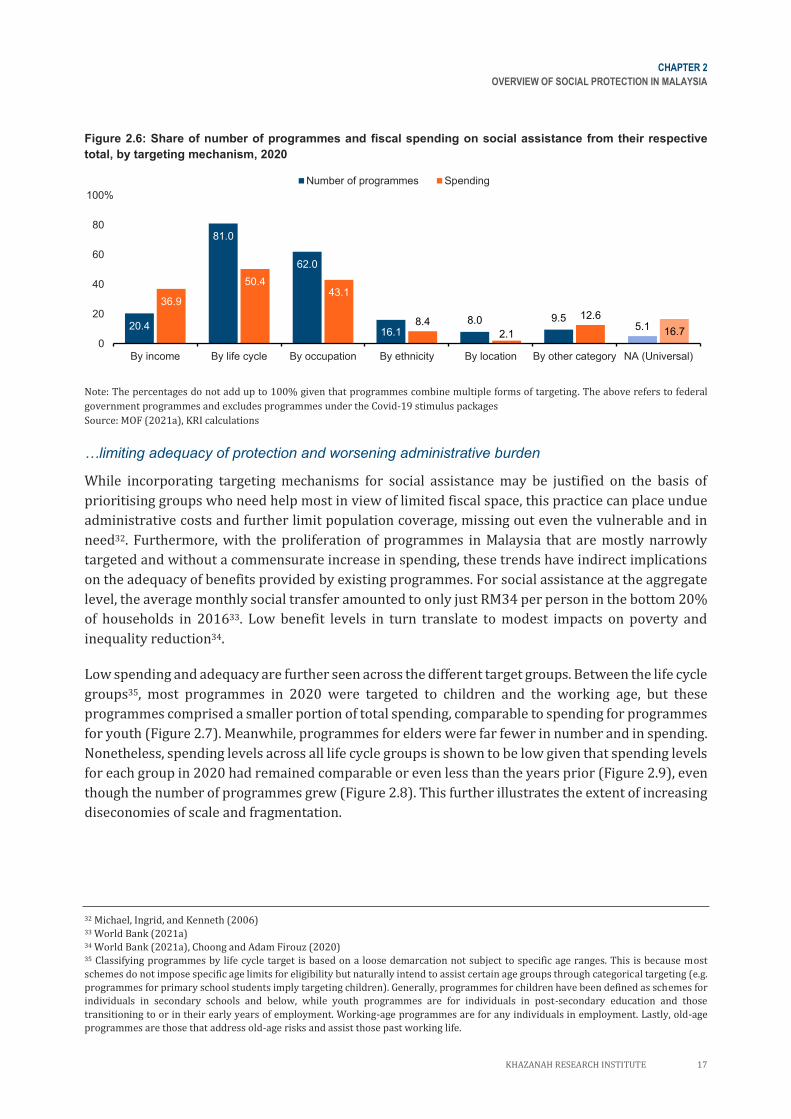
Figure 2.6: Share of number of programmes and fiscal spending on social assistance from their respective
total, by targeting mechanism, 2020
Note: The percentages do not add up to 100% given that programmes combine multiple forms of targeting. The above refers to federal
government programmes and excludes programmes under the Covid-19 stimulus packages
Source: MOF (2021a), KRI calculations
…limiting adequacy of protection and worsening administrative burden
While incorporating targeting mechanisms for social assistance may be justified on the basis of
prioritising groups who need help most in view of limited fiscal space, this practice can place undue
administrative costs and further limit population coverage, missing out even the vulnerable and in
need32. Furthermore, with the proliferation of programmes in Malaysia that are mostly narrowly
targeted and without a commensurate increase in spending, these trends have indirect implications
on the adequacy of benefits provided by existing programmes. For social assistance at the aggregate
level, the average monthly social transfer amounted to only just RM34 per person in the bottom 20%
of households in 201633. Low benefit levels in turn translate to modest impacts on poverty and
inequality reduction34.
Low spending and adequacy are further seen across the different target groups. Between the life cycle
groups35, most programmes in 2020 were targeted to children and the working age, but these
programmes comprised a smaller portion of total spending, comparable to spending for programmes
for youth (Figure 2.7). Meanwhile, programmes for elders were far fewer in number and in spending.
Nonetheless, spending levels across all life cycle groups is shown to be low given that spending levels
for each group in 2020 had remained comparable or even less than the years prior (Figure 2.9), even
though the number of programmes grew (Figure 2.8). This further illustrates the extent of increasing
diseconomies of scale and fragmentation.
32 Michael, Ingrid, and Kenneth (2006) 33 World Bank (2021a) 34 World Bank (2021a), Choong and Adam Firouz (2020) 35 Classifying programmes by life cycle target is based on a loose demarcation not subject to specific age ranges. This is because most
schemes do not impose specific age limits for eligibility but naturally intend to assist certain age groups through categorical targeting (e.g.
programmes for primary school students imply targeting children). Generally, programmes for children have been defined as schemes for
individuals in secondary schools and below, while youth programmes are for individuals in post-secondary education and those
transitioning to or in their early years of employment. Working-age programmes are for any individuals in employment. Lastly, old-age
programmes are those that address old-age risks and assist those past working life.
20.4
81.0
62.0
16.18.0 9.5
5.1
36.9
50.443.1
8.42.1
12.6
16.70
20
40
60
80
100
By income By life cycle By occupation By ethnicity By location By other category NA (Universal)
Number of programmes Spending
100%
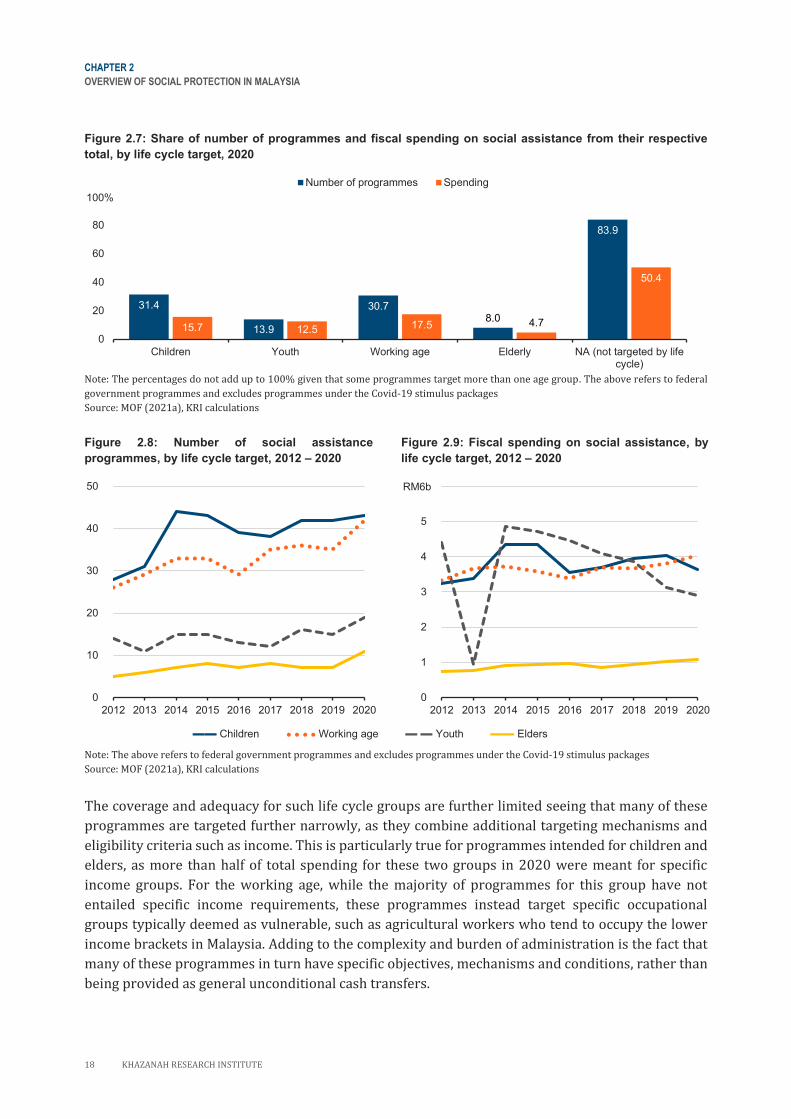
CHAPTER 2
OVERVIEW OF SOCIAL PROTECTION IN MALAYSIA
18 KHAZANAH RESEARCH INSTITUTE
Figure 2.7: Share of number of programmes and fiscal spending on social assistance from their respective
total, by life cycle target, 2020
Note: The percentages do not add up to 100% given that some programmes target more than one age group. The above refers to federal
government programmes and excludes programmes under the Covid-19 stimulus packages
Source: MOF (2021a), KRI calculations
Figure 2.8: Number of social assistance
programmes, by life cycle target, 2012 – 2020
Figure 2.9: Fiscal spending on social assistance, by
life cycle target, 2012 – 2020
▬▬ Children ● ● ● ● Working age ▬ ▬ Youth ▬▬ Elders
Note: The above refers to federal government programmes and excludes programmes under the Covid-19 stimulus packages
Source: MOF (2021a), KRI calculations
The coverage and adequacy for such life cycle groups are further limited seeing that many of these
programmes are targeted further narrowly, as they combine additional targeting mechanisms and
eligibility criteria such as income. This is particularly true for programmes intended for children and
elders, as more than half of total spending for these two groups in 2020 were meant for specific
income groups. For the working age, while the majority of programmes for this group have not
entailed specific income requirements, these programmes instead target specific occupational
groups typically deemed as vulnerable, such as agricultural workers who tend to occupy the lower
income brackets in Malaysia. Adding to the complexity and burden of administration is the fact that
many of these programmes in turn have specific objectives, mechanisms and conditions, rather than
being provided as general unconditional cash transfers.
31.4
13.9
30.78.0
83.9
15.7 12.5 17.5 4.7
50.4
0
20
40
60
80
100
Children Youth Working age Elderly NA (not targeted by lifecycle)
Number of programmes Spending
100%
0
10
20
30
40
50
2012 2013 2014 2015 2016 2017 2018 2019 2020
0
1
2
3
4
5
6
2012 2013 2014 2015 2016 2017 2018 2019 2020
RM6b
CHAPTER 2
OVERVIEW OF SOCIAL PROTECTION IN MALAYSIA
KHAZANAH RESEARCH INSTITUTE 19
For children, the bulk of assistance has largely been for education-related purposes (Figure 2.10)—
with some programmes even meant for children in specific educational institutions. The largest
allocation has been attributed to MOE by a considerable margin. However, provisions for children’s
education are also made by KPLB and by others, such as Ministry of Defence (MINDEF) with schemes
that benefit the children of veterans—illustrating some potential overlaps in schemes for children
between the various ministries.
Furthermore, it can be seen that the multitude of schemes have varying transfer mechanisms (be it
via grants, subsidies, direct cash or in-kind transfers) and target specific children groups (e.g.
children in boarding schools, disabled children, poor children, etc.). Despite this proliferation that
likely places undue administrative burden, general child benefits as recommended by the ILO under
Convention No. 102 is lacking while care service provisions are also limited. The existing provisions,
namely those provided by JKM36, cater only to poor households, such Bantuan Kanak-kanak (BKK).
The scheme (with an allocation of just RM192.7 million) benefited only 62,000 families in 2020,
which is less than 1% of total Malaysian households, with an average monthly benefit of RM255 per
household37. Thus, current provisions are limited and have arguably also not been facilitative in
expanding the care sector—a raising concern given the increasing burden of care needs in dual-
earner households38, along with other pressing issues related to children in Malaysia such as
malnutrition39.
For the working age, a high number of schemes also exist, many of which intend to benefit specific
workers in certain jobs (Figure 2.11). For example, while MAFI had the largest allocation in 2020 with
their agricultural subsidies and incentives, similar schemes are also provided by Ministry of
Plantation Industries and Commodities (MPIC) and the KPLB, thus exemplifying the fragmentation
and overlaps of Malaysia social assistance for the working age.
For elders, Bantuan Warga Emas (BWE) by JKM is the programme with the highest allocation, at
RM600 million in 2020 (Figure 2.12), but it is intended only for elders under the poverty line. In 2020,
just less than 4% of old-aged individuals (aged 60 years and above) were recipients of the scheme,
receiving a monthly amount of RM35040. It is further concerning that other social assistance schemes
entail additional targeting/eligibility requirements other than income, such as retirees from specific
occupations from the public sector, with many having little to do with ensuring sufficient old-age
income for the general population. This is concerning given that old-age savings remain inadequate
for many in Malaysia41.
36 JKM is under the Ministry of Women, Family and Community Development (Kementerian Pembangunan Wanita, Keluarga dan
Masyarakat, KPWKM) 37 MOF (2021a). This is based on an assistance value RM100 per child or a maximum of RM450 per family. However, Budget 2021 increased
the value of assistance to RM150 per child aged seven to 18 years and RM200 per child aged six years and below, or a maximum of RM1,000
per family. The number of expected beneficiaries is also expected to increase considerably, although still limited to families below the
poverty line. These changes follow the revision in the PLI measure. Source: PMO (2020) 38 KRI (2019) 39 Jarud Romadan Khalidi and Tan Zhai Gen (2020) 40 MOF (2021a) 41 See Chapter 5 for further discussion on issues related to old-age social protection.
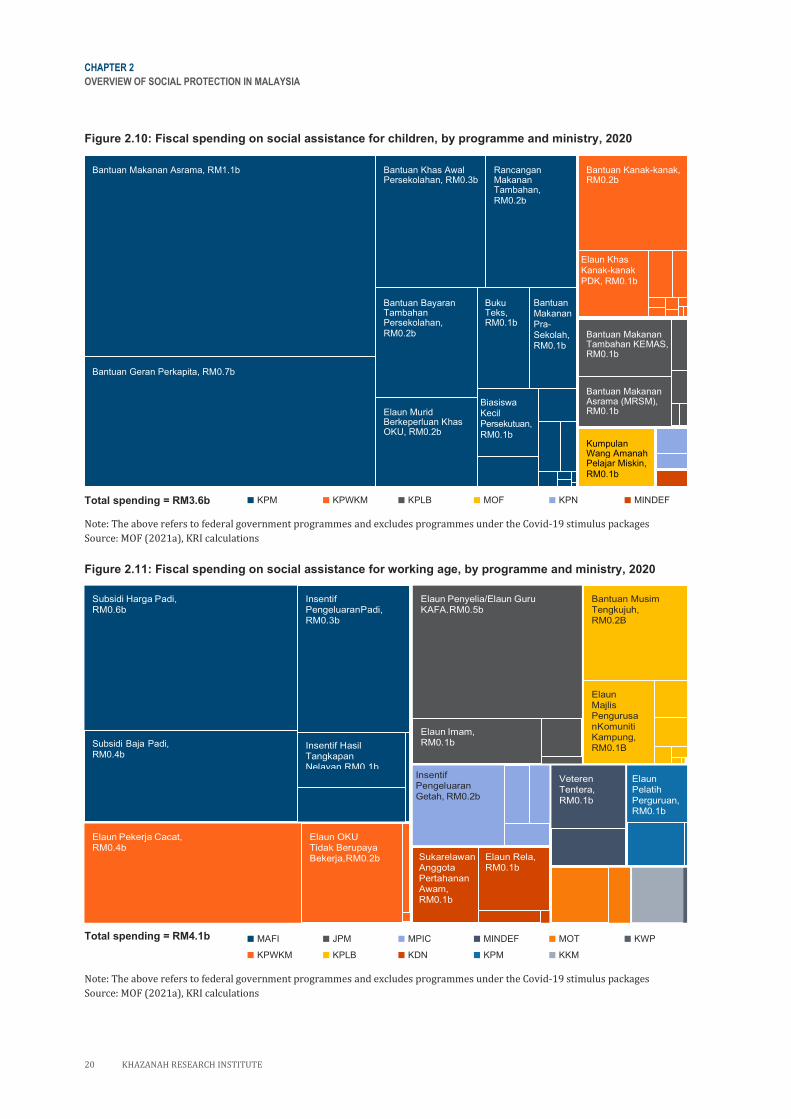
CHAPTER 2
OVERVIEW OF SOCIAL PROTECTION IN MALAYSIA
20 KHAZANAH RESEARCH INSTITUTE
Figure 2.10: Fiscal spending on social assistance for children, by programme and ministry, 2020
Total spending = RM3.6b ■ KPM ■ KPWKM ■ KPLB ■ MOF ■ KPN ■ MINDEF
Note: The above refers to federal government programmes and excludes programmes under the Covid-19 stimulus packages
Source: MOF (2021a), KRI calculations
Figure 2.11: Fiscal spending on social assistance for working age, by programme and ministry, 2020
Total spending = RM4.1b ■ MAFI ■ JPM ■ MPIC ■ MINDEF ■ MOT ■ KWP
■ KPWKM ■ KPLB ■ KDN ■ KPM ■ KKM
Note: The above refers to federal government programmes and excludes programmes under the Covid-19 stimulus packages
Source: MOF (2021a), KRI calculations
Kumpulan Wang Amanah Pelajar Miskin, RM0.1b
Bantuan Makanan Tambahan KEMAS, RM0.1b
Bantuan Makanan Asrama (MRSM), RM0.1b
Elaun Khas Kanak-kanak PDK, RM0.1b
Bantuan Kanak-kanak, RM0.2b
Rancangan Makanan Tambahan, RM0.2b
Elaun Murid Berkeperluan Khas OKU, RM0.2b
Buku Teks, RM0.1b
Biasiswa Kecil Persekutuan, RM0.1b
Bantuan Makanan Pra- Sekolah, RM0.1b
Bantuan Makanan Asrama, RM1.1b Bantuan Khas Awal Persekolahan, RM0.3b
Bantuan Geran Perkapita, RM0.7b
Bantuan Bayaran Tambahan Persekolahan, RM0.2b
Subsidi Baja Padi, RM0.4b
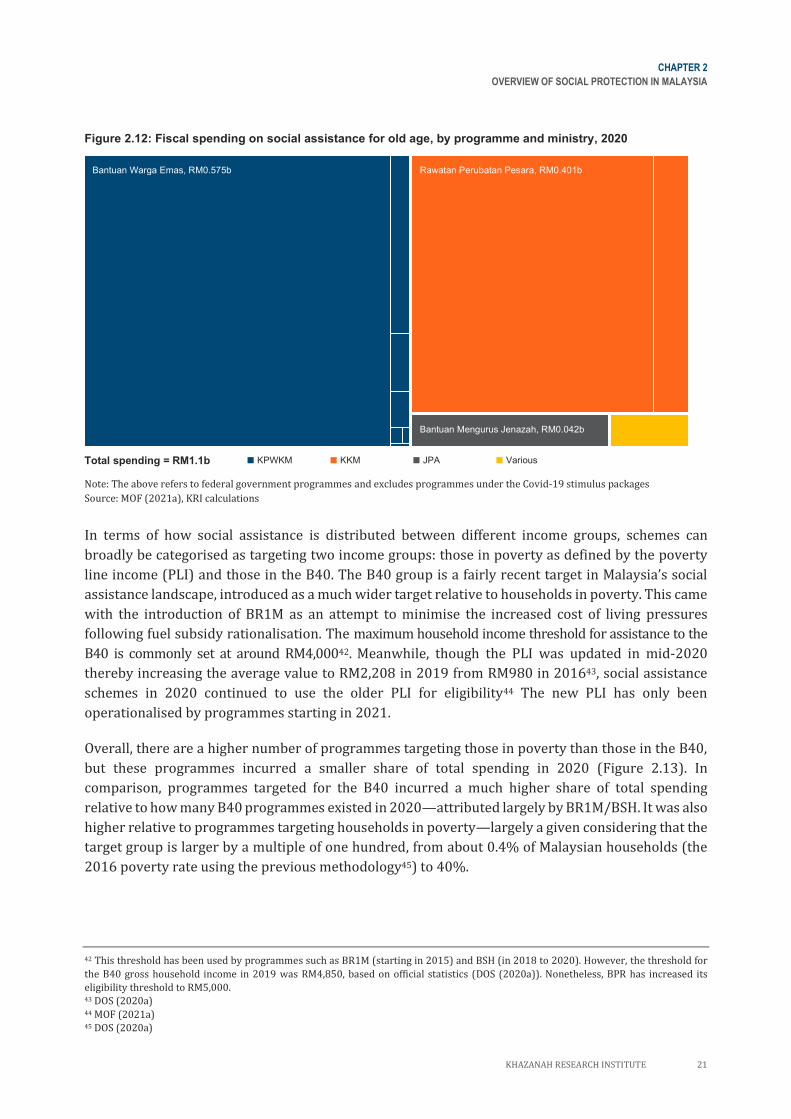
CHAPTER 2
OVERVIEW OF SOCIAL PROTECTION IN MALAYSIA
KHAZANAH RESEARCH INSTITUTE 21
Figure 2.12: Fiscal spending on social assistance for old age, by programme and ministry, 2020
Total spending = RM1.1b ■ KPWKM ■ KKM ■ JPA ■ Various
Note: The above refers to federal government programmes and excludes programmes under the Covid-19 stimulus packages
Source: MOF (2021a), KRI calculations
In terms of how social assistance is distributed between different income groups, schemes can
broadly be categorised as targeting two income groups: those in poverty as defined by the poverty
line income (PLI) and those in the B40. The B40 group is a fairly recent target in Malaysia’s social
assistance landscape, introduced as a much wider target relative to households in poverty. This came
with the introduction of BR1M as an attempt to minimise the increased cost of living pressures
following fuel subsidy rationalisation. The maximum household income threshold for assistance to the
B40 is commonly set at around RM4,00042. Meanwhile, though the PLI was updated in mid-2020
thereby increasing the average value to RM2,208 in 2019 from RM980 in 201643, social assistance
schemes in 2020 continued to use the older PLI for eligibility44 The new PLI has only been
operationalised by programmes starting in 2021.
Overall, there are a higher number of programmes targeting those in poverty than those in the B40,
but these programmes incurred a smaller share of total spending in 2020 (Figure 2.13). In
comparison, programmes targeted for the B40 incurred a much higher share of total spending
relative to how many B40 programmes existed in 2020—attributed largely by BR1M/BSH. It was also
higher relative to programmes targeting households in poverty—largely a given considering that the
target group is larger by a multiple of one hundred, from about 0.4% of Malaysian households (the
2016 poverty rate using the previous methodology45) to 40%.
42 This threshold has been used by programmes such as BR1M (starting in 2015) and BSH (in 2018 to 2020). However, the threshold for
the B40 gross household income in 2019 was RM4,850, based on official statistics (DOS (2020a)). Nonetheless, BPR has increased its
eligibility threshold to RM5,000. 43 DOS (2020a) 44 MOF (2021a) 45 DOS (2020a)
Bantuan Mengurus Jenazah, RM0.042b
Rawatan Perubatan Pesara, RM0.401b Bantuan Warga Emas, RM0.575b
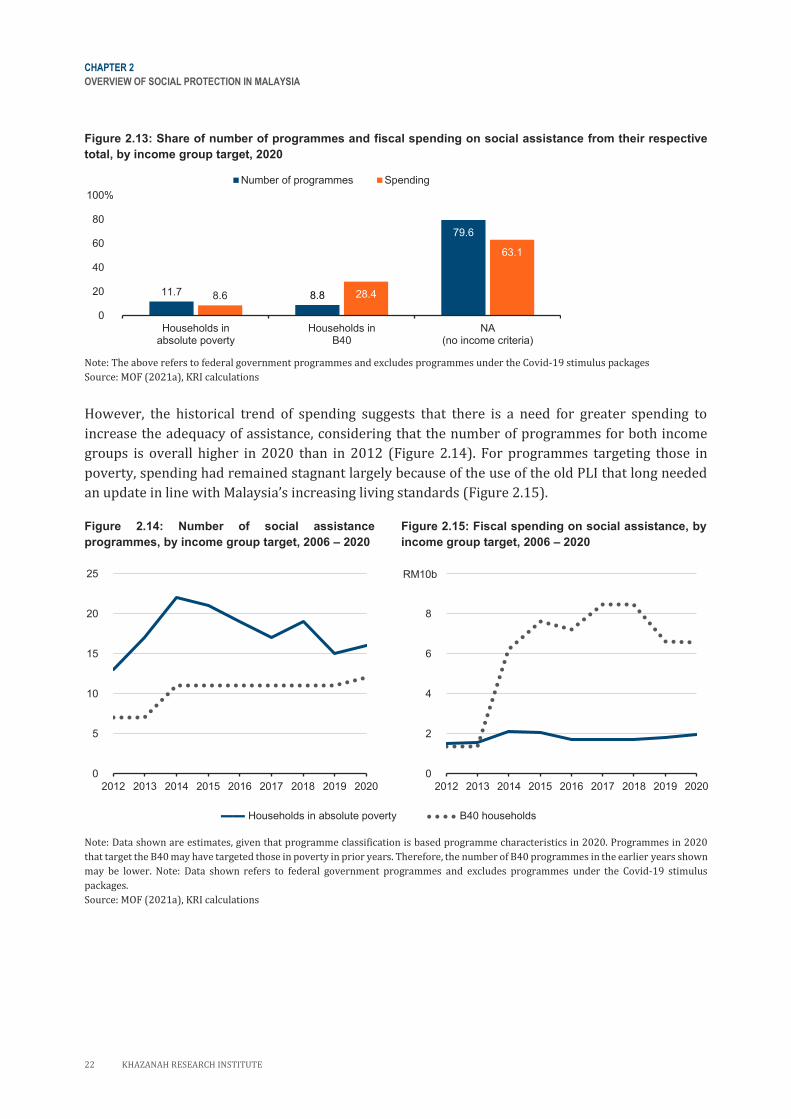
CHAPTER 2
OVERVIEW OF SOCIAL PROTECTION IN MALAYSIA
22 KHAZANAH RESEARCH INSTITUTE
Figure 2.13: Share of number of programmes and fiscal spending on social assistance from their respective
total, by income group target, 2020
Note: The above refers to federal government programmes and excludes programmes under the Covid-19 stimulus packages
Source: MOF (2021a), KRI calculations
However, the historical trend of spending suggests that there is a need for greater spending to
increase the adequacy of assistance, considering that the number of programmes for both income
groups is overall higher in 2020 than in 2012 (Figure 2.14). For programmes targeting those in
poverty, spending had remained stagnant largely because of the use of the old PLI that long needed
an update in line with Malaysia’s increasing living standards (Figure 2.15).
Figure 2.14: Number of social assistance
programmes, by income group target, 2006 – 2020
Figure 2.15: Fiscal spending on social assistance, by
income group target, 2006 – 2020
▬▬ Households in absolute poverty ● ● ● ● B40 households
Note: Data shown are estimates, given that programme classification is based programme characteristics in 2020. Programmes in 2020
that target the B40 may have targeted those in poverty in prior years. Therefore, the number of B40 programmes in the earlier years shown
may be lower. Note: Data shown refers to federal government programmes and excludes programmes under the Covid-19 stimulus
packages.
Source: MOF (2021a), KRI calculations
11.7 8.8
79.6
8.6 28.4
63.1
0%
20%
40%
60%
80%
100%
Households inabsolute poverty
Households inB40
NA(no income criteria)
Number of programmes Spending
0
5
10
15
20
25
2012 2013 2014 2015 2016 2017 2018 2019 2020
0
2
4
6
8
10
2012 2013 2014 2015 2016 2017 2018 2019 2020
RM10b
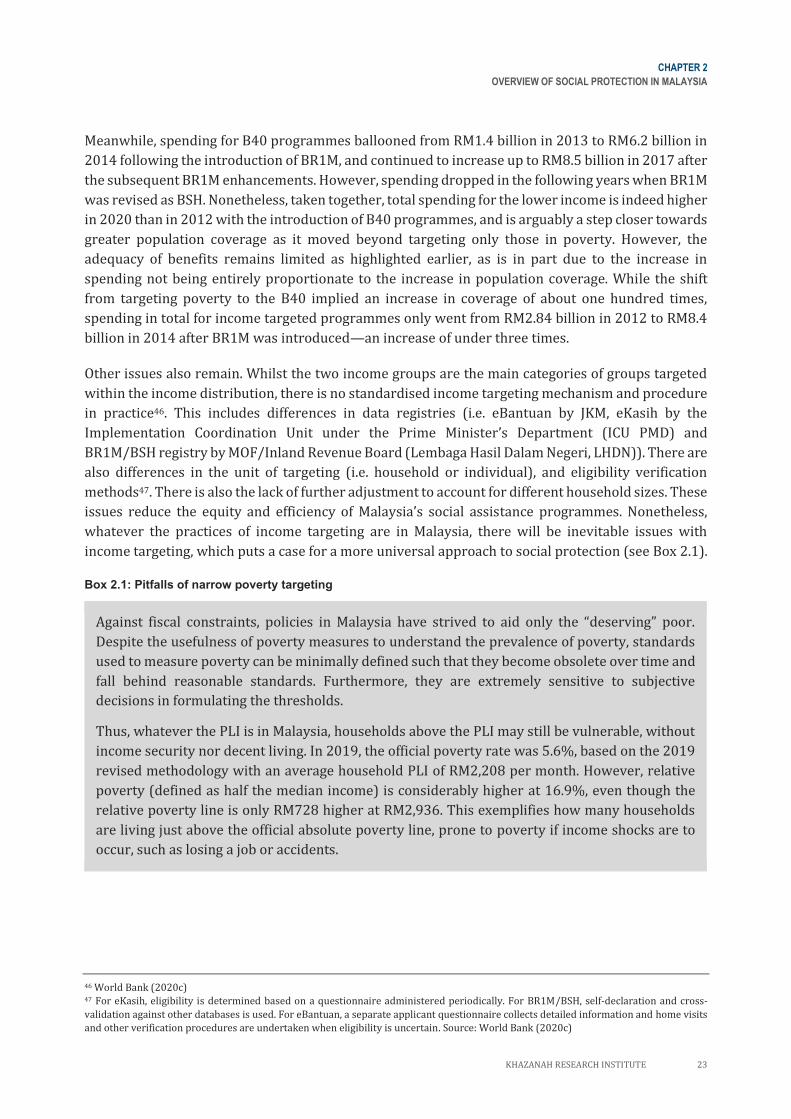
CHAPTER 2
OVERVIEW OF SOCIAL PROTECTION IN MALAYSIA
KHAZANAH RESEARCH INSTITUTE 23
Meanwhile, spending for B40 programmes ballooned from RM1.4 billion in 2013 to RM6.2 billion in
2014 following the introduction of BR1M, and continued to increase up to RM8.5 billion in 2017 after
the subsequent BR1M enhancements. However, spending dropped in the following years when BR1M
was revised as BSH. Nonetheless, taken together, total spending for the lower income is indeed higher
in 2020 than in 2012 with the introduction of B40 programmes, and is arguably a step closer towards
greater population coverage as it moved beyond targeting only those in poverty. However, the
adequacy of benefits remains limited as highlighted earlier, as is in part due to the increase in
spending not being entirely proportionate to the increase in population coverage. While the shift
from targeting poverty to the B40 implied an increase in coverage of about one hundred times,
spending in total for income targeted programmes only went from RM2.84 billion in 2012 to RM8.4
billion in 2014 after BR1M was introduced—an increase of under three times.
Other issues also remain. Whilst the two income groups are the main categories of groups targeted
within the income distribution, there is no standardised income targeting mechanism and procedure
in practice46. This includes differences in data registries (i.e. eBantuan by JKM, eKasih by the
Implementation Coordination Unit under the Prime Minister’s Department (ICU PMD) and
BR1M/BSH registry by MOF/Inland Revenue Board (Lembaga Hasil Dalam Negeri, LHDN)). There are
also differences in the unit of targeting (i.e. household or individual), and eligibility verification
methods47. There is also the lack of further adjustment to account for different household sizes. These
issues reduce the equity and efficiency of Malaysia’s social assistance programmes. Nonetheless,
whatever the practices of income targeting are in Malaysia, there will be inevitable issues with
income targeting, which puts a case for a more universal approach to social protection (see Box 2.1).
Box 2.1: Pitfalls of narrow poverty targeting
Against fiscal constraints, policies in Malaysia have strived to aid only the “deserving” poor.
Despite the usefulness of poverty measures to understand the prevalence of poverty, standards
used to measure poverty can be minimally defined such that they become obsolete over time and
fall behind reasonable standards. Furthermore, they are extremely sensitive to subjective
decisions in formulating the thresholds.
Thus, whatever the PLI is in Malaysia, households above the PLI may still be vulnerable, without
income security nor decent living. In 2019, the official poverty rate was 5.6%, based on the 2019
revised methodology with an average household PLI of RM2,208 per month. However, relative
poverty (defined as half the median income) is considerably higher at 16.9%, even though the
relative poverty line is only RM728 higher at RM2,936. This exemplifies how many households
are living just above the official absolute poverty line, prone to poverty if income shocks are to
occur, such as losing a job or accidents.
46 World Bank (2020c) 47 For eKasih, eligibility is determined based on a questionnaire administered periodically. For BR1M/BSH, self-declaration and cross-
validation against other databases is used. For eBantuan, a separate applicant questionnaire collects detailed information and home visits
and other verification procedures are undertaken when eligibility is uncertain. Source: World Bank (2020c)
CHAPTER 2
OVERVIEW OF SOCIAL PROTECTION IN MALAYSIA
24 KHAZANAH RESEARCH INSTITUTE
In recent years, the focus of welfare policies has shifted to the B40. However, the choice of the
40% cut-off point that delineates one as eligible to aid is even more arbitrary. A study by KRI on
Malaysian household consumption48 found that the bottom 20% of households are barely able to
meet their basic needs, while only the top 30% exhibit some aspirational traits of more diverse
‘middle-class’ consumption. Households in the 50% middle income group often face spending
constraints leading to various consumption trade-offs, especially if hit by unexpected
circumstances. The hardship of the bottom 20% of households and the modest consumption of
the middle 50% suggest that government welfare policies matter to at least the bottom 70%
(B70), well beyond just the B40 and those living under the PLI.
2.3 Towards an Inclusive and Cohesive Life Cycle Social Protection System
While social protection is still seen by many as relief for the poor49, poverty targeting alone is not
sufficient to guide social protection policies. Poverty may be temporary, recurrent or persistent over
longer periods. The relative and dynamic nature of poverty means that anyone can move in and out
of poverty over time. This implies high costs of administering effective and equitable welfare
programmes, a complication for a social protection paradigm that is fixated with a narrow targeting
approach. Narrow poverty-targeting is also prone to inclusion and exclusion errors and its limitations
often lead to failure in developing sustainable pre-emptive measures to prevent more from falling
through the cracks now and in the future. At the same time, the current social protection ecosystem
still fails to provide a basic floor for all including those in need.
It is imperative for Malaysia to gradually move from the charity-model (poverty targeting) into a
more inclusive model that is forward looking in preventing poverty and addressing vulnerability.
Instead of targeting poverty explicitly, we should shift our policy to a life cycle approach that is
embedded with poverty mitigating mechanisms. The life cycle approach acknowledges that
individuals are constantly exposed to various types of risks throughout their life span and the risks
may vary from one phase of life to another. The risks can be idiosyncratic—occurring at an individual
or community level (e.g. work injury, death of breadwinner); and/or systematic—affecting many
communities or countries (e.g. pandemic, earthquake, flood). External factors stemming from
economic and social development such as demographic and climate changes, economic crisis and
social conflicts also can result in greater insecurity and vulnerability, potentially pushing people into
poverty at any phase of their lives.
48 Hawati Abdul Hamid, Ho, and Suraya Ismail (2019) 49 Barrientos and Hulme (2008), World Bank (2015)
CHAPTER 2
OVERVIEW OF SOCIAL PROTECTION IN MALAYSIA
KHAZANAH RESEARCH INSTITUTE 25
Furthermore, individuals’ lives do not always follow a linear path of events: birth → education →
work → marriage → family → retirement → death. Instead, life events can be cyclical in nature with
education, work and family potentially re-occurring a few times throughout one’s life. Some
individuals could return to education after being retrenched; marry, divorce or re-start another
family later in life. Some do not marry and never have children, or marry but never join the workforce.
Longer life expectancies have made elders continue to work beyond mandatory retirement age either
for subsistence or out of own willingness. Vulnerability can be perpetuated throughout the life phases
with the condition in the earlier phases serving as a strong predictor of a person’s standing in
following phases. In the context of family life, there can also be a link between the economic standing
of parents (breadwinners) and children’s life outcomes, with implications on intergenerational social
mobility.
The above instances demonstrate the role of social protection that targets core risk areas such as
disability, sickness, unemployment, childhood and old age, hence ensuring everyone is able to
overcome any catastrophic threats they may face throughout their lifetime. During childhood, social
protection plays a key role as investment to advance every child’s potential by providing the
conditions and capabilities to live a decent life. This investment prepares children to undertake
productive work when they reach working age, rather than trying to address their problems
reactively in later stage. Examples include maternity, nutritional and health protections, child benefit
and care allowance, and education.
During the working age, social protection has multiple functions in promoting decent work for all
workers regardless in the formal or informal economy. According to the ILO’s Decent Work Agenda50,
this entails opportunities for work that is productive and delivers a fair income, security in the
workplace and social protection for families, better prospects for personal development and social
integration, freedom for people to express their concerns, organise and participate in the decisions
that affect their lives and equality of opportunity and treatment for all women and men. Examples
include benefits for training, unemployment, injury and invalidity.
During old age, the critical function of social protection is to allow elders to live in dignity with at
least a guaranteed basic income and/or access to essential goods and services, including food, shelter,
health and care. At the same time, social protection such as survivor benefits serves to lessen the
consequences of breadwinner death on survivors and dependents.
While Figure 2.16 depicts many life cycle risks and social protection needs at each stage of life,
existing international frameworks discussed in Box 1.1 provide guidance and a valid policy roadmap
to narrow things down. Given the proliferation of programmes of which many are small and narrowly
targeted, there is room for consolidation and greater coordination for social protection system in
Malaysia to be transformative.
50 ILO (2002)
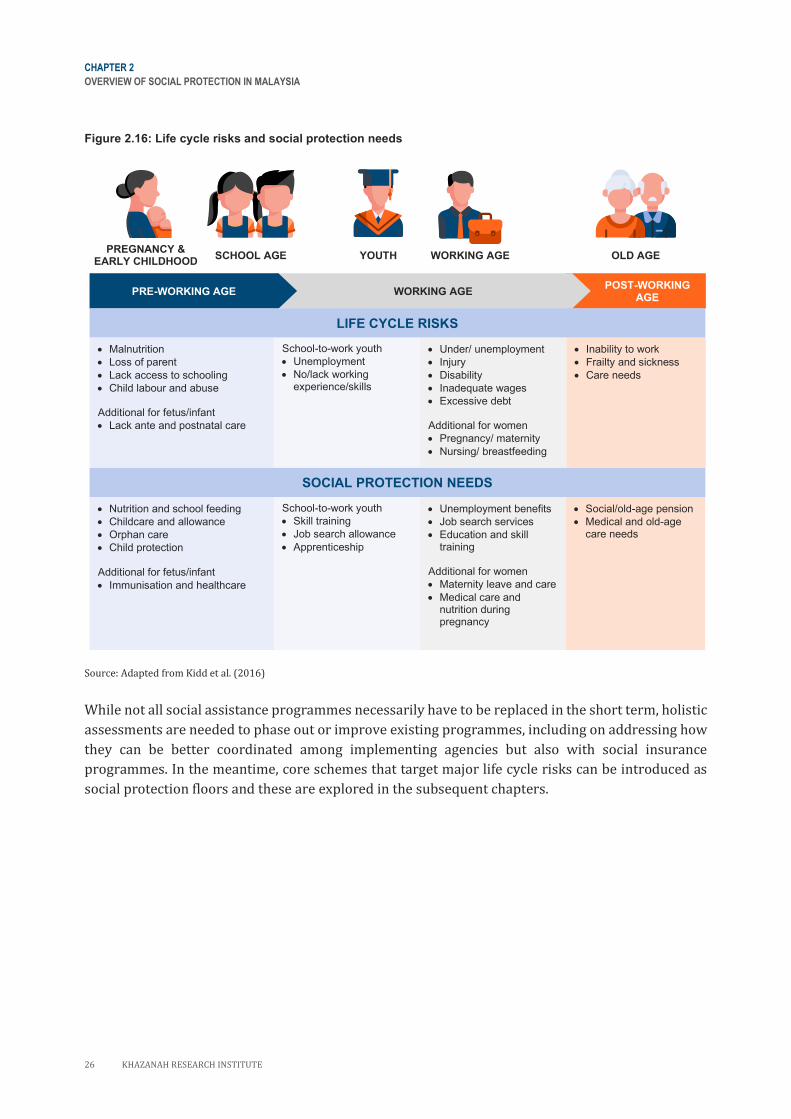
CHAPTER 2
OVERVIEW OF SOCIAL PROTECTION IN MALAYSIA
26 KHAZANAH RESEARCH INSTITUTE
Figure 2.16: Life cycle risks and social protection needs
Source: Adapted from Kidd et al. (2016)
While not all social assistance programmes necessarily have to be replaced in the short term, holistic
assessments are needed to phase out or improve existing programmes, including on addressing how
they can be better coordinated among implementing agencies but also with social insurance
programmes. In the meantime, core schemes that target major life cycle risks can be introduced as
social protection floors and these are explored in the subsequent chapters.
SOCIAL PROTECTION NEEDS
POST-WORKING AGE
WORKING AGE
PREGNANCY & EARLY CHILDHOOD
SCHOOL AGE YOUTH WORKING AGE OLD AGE
PRE-WORKING AGE
LIFE CYCLE RISKS
• Malnutrition
• Loss of parent
• Lack access to schooling
• Child labour and abuse Additional for fetus/infant
• Lack ante and postnatal care
School-to-work youth
• Unemployment
• No/lack working experience/skills
• Under/ unemployment
• Injury
• Disability
• Inadequate wages
• Excessive debt Additional for women
• Pregnancy/ maternity
• Nursing/ breastfeeding
• Inability to work
• Frailty and sickness
• Care needs
• Nutrition and school feeding
• Childcare and allowance
• Orphan care
• Child protection Additional for fetus/infant
• Immunisation and healthcare
School-to-work youth
• Skill training
• Job search allowance
• Apprenticeship
• Unemployment benefits
• Job search services
• Education and skill training
Additional for women
• Maternity leave and care
• Medical care and nutrition during pregnancy
• Social/old-age pension
• Medical and old-age care needs
KHAZANAH RESEARCH INSTITUTE 27
CHAPTER
03
ESTABLISHING UNIVERSAL BASIC
INCOME FOR CHILDREN 28
3.1 Introduction 28
3.2 The Rights of Children to Social
Security 28
3.3 Overview of Child-specific Issues 30
3.3.1 Child poverty 30
3.3.2 Child malnutrition 33
3.4 Brief Review of Child-related
Assistance 34
3.4.1 Under-coverage 35
3.4.2 The “missing middle” 37
3.5 Policy Recommendation: Universal
Child Benefit as a Basic Income
Protection for Children 39
3.5.1 Implementing UCB in Malaysia 41
3.5.2 Level of investment required for a
UCB 42
3.5.3 Financing UCB 48
3.6 Concluding Remarks 50
28 KHAZANAH RESEARCH INSTITUTE
CHAPTER 3
ESTABLISHING UNIVERSAL BASIC INCOME FOR CHILDREN
The best investment we can make is in childhood. It’s an investment that yields remarkable results—not
only in the lives of the world’s children, especially those who are most vulnerable, but for the future we
all share.
Save the Children (n.d.)
3.1 Introduction
Childhood is an important stage of one’s life51. It is the period when foundational capabilities—from
cognitive and linguistic gains to progress in emotional, moral and social capacities52—are developed.
Unquestionably, the foundation laid has profound effects on children’s development and their
outcomes in adulthood.
Given the importance of this stage in life, this chapter presents arguments on why social security is
essential in protecting children and promoting children’s development. The chapter begins by
discussing the rights of children to social security, followed by a situational analysis of the state of
Malaysia’s children and a review of child-related assistance in Malaysia. Based on the findings, this
chapter proposes establishing universal basic income for children to create a social protection floor
from the start of life.
3.2 The Rights of Children to Social Security
Children make up a significant portion of the Malaysian population. In 2021, children—defined as
individuals aged under 1853—made up an estimated 28% of the population, or 9.2 million people54.
The number of children has increased around 1.4 times in the last five decades but is expected to
decline in the next few years55. In fact, the share of children has been declining since 1970—when it
was 51% of total population—and forecasted to shrink to 20% in 205056. Regardless of this expected
decline in size, children will remain a key demographic group within the social protection system
owing to children’s rights.
51 For the purposes of this report, we do not distinguish between the different periods in childhood and their relative importance in child
development. For example, the most crucial period for development is the first 1,000 days i.e. from conception to the second birthday. This
is not to dismiss the importance of later childhood periods as research suggests that these periods present a second window of opportunity
to make up for growth deficits suffered in early childhood. Source: UNICEF (2019b), Samson, Fajth, and François (2016) 52 UNICEF (2019b) 53 This is as defined in the United Nations Convention on the Rights of the Child. This definition is in line with Malaysia’s Children and Young
Persons (Employment) Act 1966 (Act 350) although the Act distinguishes children from young adults, with the former being persons aged
under 15 and the latter being persons aged 15 to 17. Source: UNICEF (n.d.-b), GOM (1966) 54 UN (2019b), KRI calculations 55 UN (2019b), KRI calculations 56 UN (2019b), KRI calculations
CHAPTER 3
CHAPTER 3
ESTABLISHING UNIVERSAL BASIC INCOME FOR CHILDREN
KHAZANAH RESEARCH INSTITUTE 29
Children have basic universal human rights and child-specific rights that recognise children’s needs
and vulnerabilities. The United Nations Convention on the Rights of the Child (UNCRC), an
international human rights treaty, recognises children’s rights regardless of ability, ethnicity and
religion. It sets out the civil, cultural, economic, political and social rights of children and establishes
children’s right to:
• special assistance and protection;
• essential services such as education and healthcare;
• develop their abilities and talents to their utmost potential;
• grow up in a happy, loving and understanding environment; and
• know children’s rights and empowered to achieve them57.
Of the 54 articles listed in the UNCRC58, two articles especially relevant in the context of this report
are:
1. Article 26 (1) which recognises children’s right to benefit from social security; and
2. Article 27 (1) which recognises children’s right to an adequate standard of living for physical,
mental, moral, social and spiritual development.
The ILO’s Social Security (Minimum Standards) Convention, 1952 (No. 102) complements the
protection of these rights by setting minimum standards of social security through child benefits i.e.
regular resource transfers either in cash, in-kind or a combination of both. The fundamental objective
of child benefits is to ensure the welfare of children and the economic stability of their families59.
Recognising children’s rights and implementing measures to protect their welfare are imperative
because children are disproportionately affected by poverty which creates a major barrier to child
development. Despite making up only one-third of the global population, almost half of poor persons
worldwide are children60. While already alarming, monetary measures of poverty alone do not fully
reflect deprivations children face. Based on the 2020 Global Multidimensional Poverty Index (MPI)—
an index that identifies deprivations in education, health and standard of living—children were more
likely to be deprived in these dimensions compared to adults61.
Not only do poverty and deprivations result in immediate negative consequences such as poor
education and nutrition but also long-term implications in cognitive and social development,
educational attainment, earnings, health and productivity62 If a person’s potential is curtailed during
childhood, productivity in adulthood will likely be weakened and a nation’s talent pool is
compromised, resulting in reduced economic prosperity63. Thus, protecting children’s well-being is
also in the interest of the community at large.
57 UNICEF (n.d.-b) 58 Refer to UN General Assembly (1989) to read the articles. 59 ILO (2017d) 60 UNICEF (n.d.-b) 61 OPHI and UNDP (2020) 62 Bastagli et al. (2016). 63 OPHI and UNDP (2020)
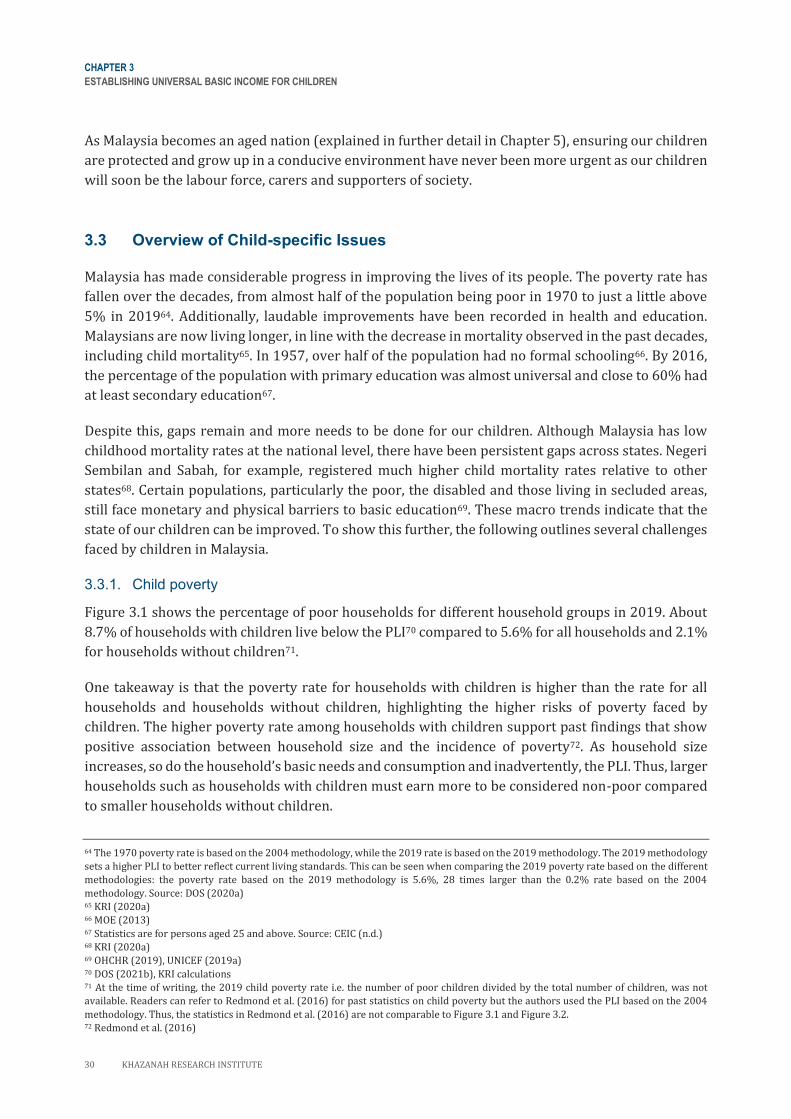
CHAPTER 3
ESTABLISHING UNIVERSAL BASIC INCOME FOR CHILDREN
30 KHAZANAH RESEARCH INSTITUTE
As Malaysia becomes an aged nation (explained in further detail in Chapter 5), ensuring our children
are protected and grow up in a conducive environment have never been more urgent as our children
will soon be the labour force, carers and supporters of society.
3.3 Overview of Child-specific Issues
Malaysia has made considerable progress in improving the lives of its people. The poverty rate has
fallen over the decades, from almost half of the population being poor in 1970 to just a little above
5% in 201964. Additionally, laudable improvements have been recorded in health and education.
Malaysians are now living longer, in line with the decrease in mortality observed in the past decades,
including child mortality65. In 1957, over half of the population had no formal schooling66. By 2016,
the percentage of the population with primary education was almost universal and close to 60% had
at least secondary education67.
Despite this, gaps remain and more needs to be done for our children. Although Malaysia has low
childhood mortality rates at the national level, there have been persistent gaps across states. Negeri
Sembilan and Sabah, for example, registered much higher child mortality rates relative to other
states68. Certain populations, particularly the poor, the disabled and those living in secluded areas,
still face monetary and physical barriers to basic education69. These macro trends indicate that the
state of our children can be improved. To show this further, the following outlines several challenges
faced by children in Malaysia.
3.3.1. Child poverty
Figure 3.1 shows the percentage of poor households for different household groups in 2019. About
8.7% of households with children live below the PLI70 compared to 5.6% for all households and 2.1%
for households without children71.
One takeaway is that the poverty rate for households with children is higher than the rate for all
households and households without children, highlighting the higher risks of poverty faced by
children. The higher poverty rate among households with children support past findings that show
positive association between household size and the incidence of poverty72. As household size
increases, so do the household’s basic needs and consumption and inadvertently, the PLI. Thus, larger
households such as households with children must earn more to be considered non-poor compared
to smaller households without children.
64 The 1970 poverty rate is based on the 2004 methodology, while the 2019 rate is based on the 2019 methodology. The 2019 methodology
sets a higher PLI to better reflect current living standards. This can be seen when comparing the 2019 poverty rate based on the different
methodologies: the poverty rate based on the 2019 methodology is 5.6%, 28 times larger than the 0.2% rate based on the 2004
methodology. Source: DOS (2020a) 65 KRI (2020a) 66 MOE (2013) 67 Statistics are for persons aged 25 and above. Source: CEIC (n.d.) 68 KRI (2020a) 69 OHCHR (2019), UNICEF (2019a) 70 DOS (2021b), KRI calculations 71 At the time of writing, the 2019 child poverty rate i.e. the number of poor children divided by the total number of children, was not
available. Readers can refer to Redmond et al. (2016) for past statistics on child poverty but the authors used the PLI based on the 2004
methodology. Thus, the statistics in Redmond et al. (2016) are not comparable to Figure 3.1 and Figure 3.2. 72 Redmond et al. (2016)
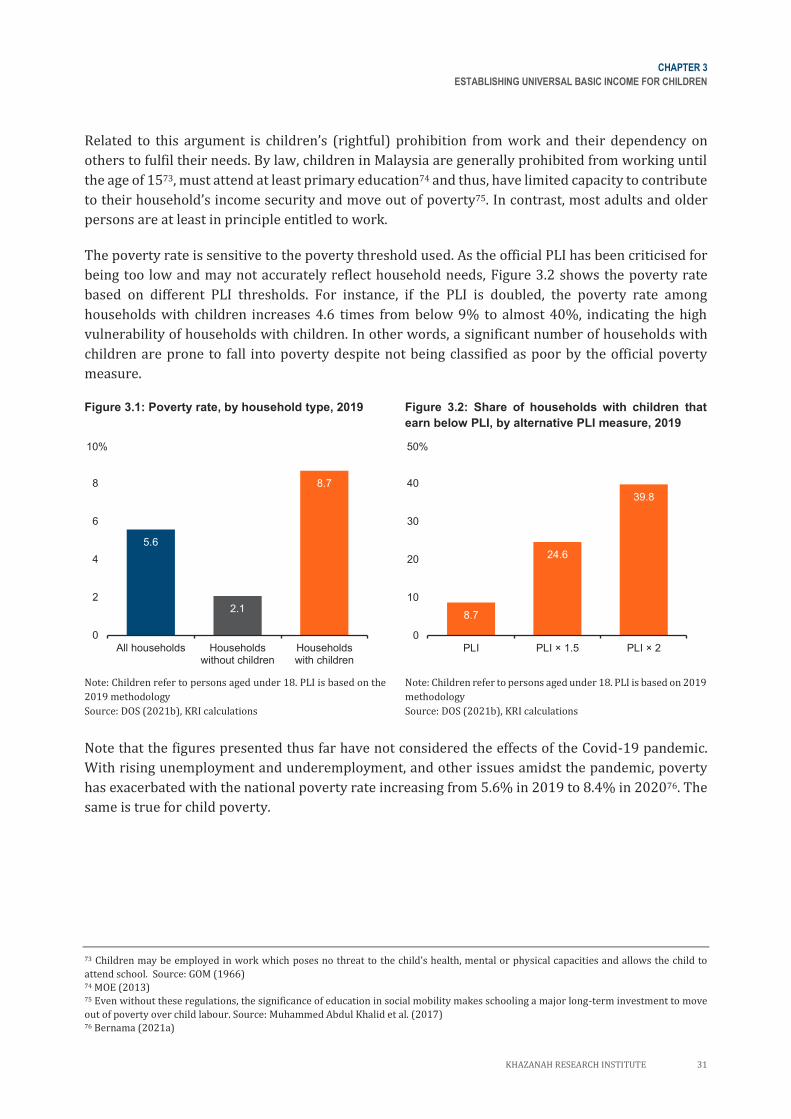
CHAPTER 3
ESTABLISHING UNIVERSAL BASIC INCOME FOR CHILDREN
KHAZANAH RESEARCH INSTITUTE 31
Related to this argument is children’s (rightful) prohibition from work and their dependency on
others to fulfil their needs. By law, children in Malaysia are generally prohibited from working until
the age of 1573, must attend at least primary education74 and thus, have limited capacity to contribute
to their household’s income security and move out of poverty75. In contrast, most adults and older
persons are at least in principle entitled to work.
The poverty rate is sensitive to the poverty threshold used. As the official PLI has been criticised for
being too low and may not accurately reflect household needs, Figure 3.2 shows the poverty rate
based on different PLI thresholds. For instance, if the PLI is doubled, the poverty rate among
households with children increases 4.6 times from below 9% to almost 40%, indicating the high
vulnerability of households with children. In other words, a significant number of households with
children are prone to fall into poverty despite not being classified as poor by the official poverty
measure.
Figure 3.1: Poverty rate, by household type, 2019 Figure 3.2: Share of households with children that
earn below PLI, by alternative PLI measure, 2019
Note: Children refer to persons aged under 18. PLI is based on the
2019 methodology
Source: DOS (2021b), KRI calculations
Note: Children refer to persons aged under 18. PLI is based on 2019
methodology
Source: DOS (2021b), KRI calculations
Note that the figures presented thus far have not considered the effects of the Covid-19 pandemic.
With rising unemployment and underemployment, and other issues amidst the pandemic, poverty
has exacerbated with the national poverty rate increasing from 5.6% in 2019 to 8.4% in 202076. The
same is true for child poverty.
73 Children may be employed in work which poses no threat to the child’s health, mental or physical capacities and allows the child to
attend school. Source: GOM (1966) 74 MOE (2013) 75 Even without these regulations, the significance of education in social mobility makes schooling a major long-term investment to move
out of poverty over child labour. Source: Muhammed Abdul Khalid et al. (2017) 76 Bernama (2021a)
5.6
2.1
8.7
0
2
4
6
8
10
All households Householdswithout children
Householdswith children
10%
8.7
24.6
39.8
0
10
20
30
40
50
PLI PLI × 1.5 PLI × 2
50%
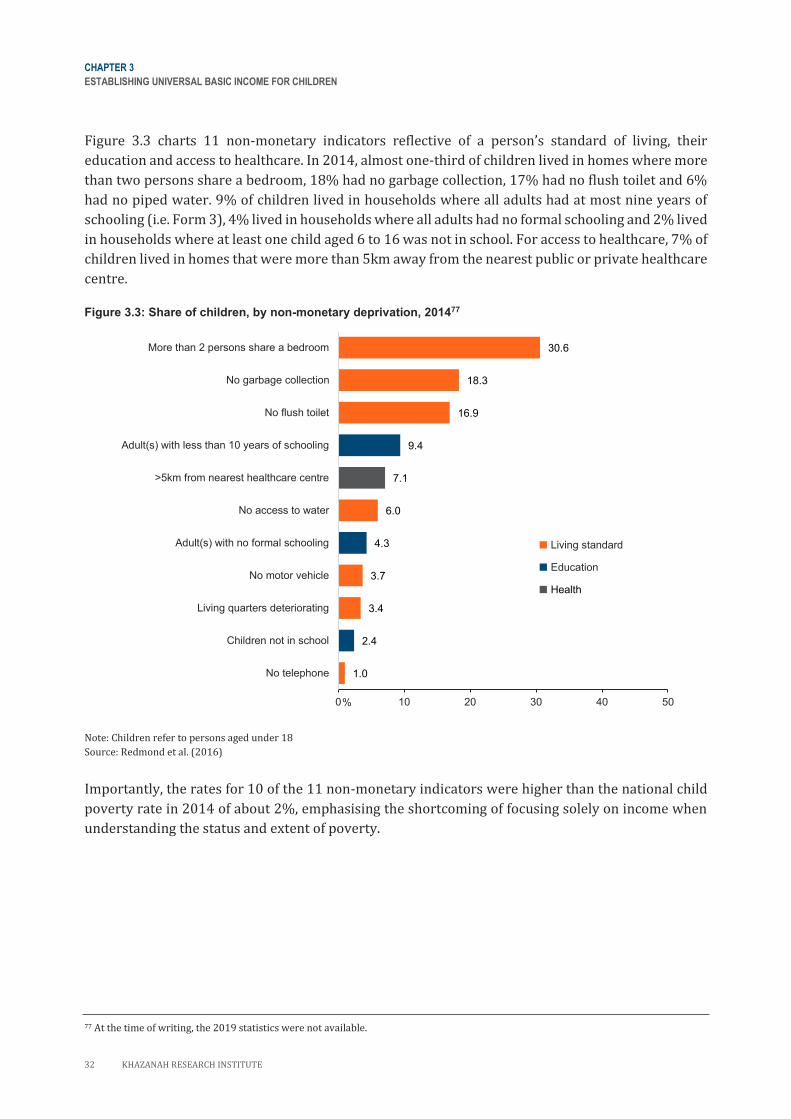
CHAPTER 3
ESTABLISHING UNIVERSAL BASIC INCOME FOR CHILDREN
32 KHAZANAH RESEARCH INSTITUTE
Figure 3.3 charts 11 non-monetary indicators reflective of a person’s standard of living, their
education and access to healthcare. In 2014, almost one-third of children lived in homes where more
than two persons share a bedroom, 18% had no garbage collection, 17% had no flush toilet and 6%
had no piped water. 9% of children lived in households where all adults had at most nine years of
schooling (i.e. Form 3), 4% lived in households where all adults had no formal schooling and 2% lived
in households where at least one child aged 6 to 16 was not in school. For access to healthcare, 7% of
children lived in homes that were more than 5km away from the nearest public or private healthcare
centre.
Figure 3.3: Share of children, by non-monetary deprivation, 201477
Note: Children refer to persons aged under 18
Source: Redmond et al. (2016)
Importantly, the rates for 10 of the 11 non-monetary indicators were higher than the national child
poverty rate in 2014 of about 2%, emphasising the shortcoming of focusing solely on income when
understanding the status and extent of poverty.
77 At the time of writing, the 2019 statistics were not available.
1.0
2.4
3.4
3.7
4.3
6.0
7.1
9.4
16.9
18.3
30.6
0 10 20 30 40 50
No telephone
Children not in school
Living quarters deteriorating
No motor vehicle
Adult(s) with no formal schooling
No access to water
>5km from nearest healthcare centre
Adult(s) with less than 10 years of schooling
No flush toilet
No garbage collection
More than 2 persons share a bedroom
%
■ Living standard
■ Education
■ Health
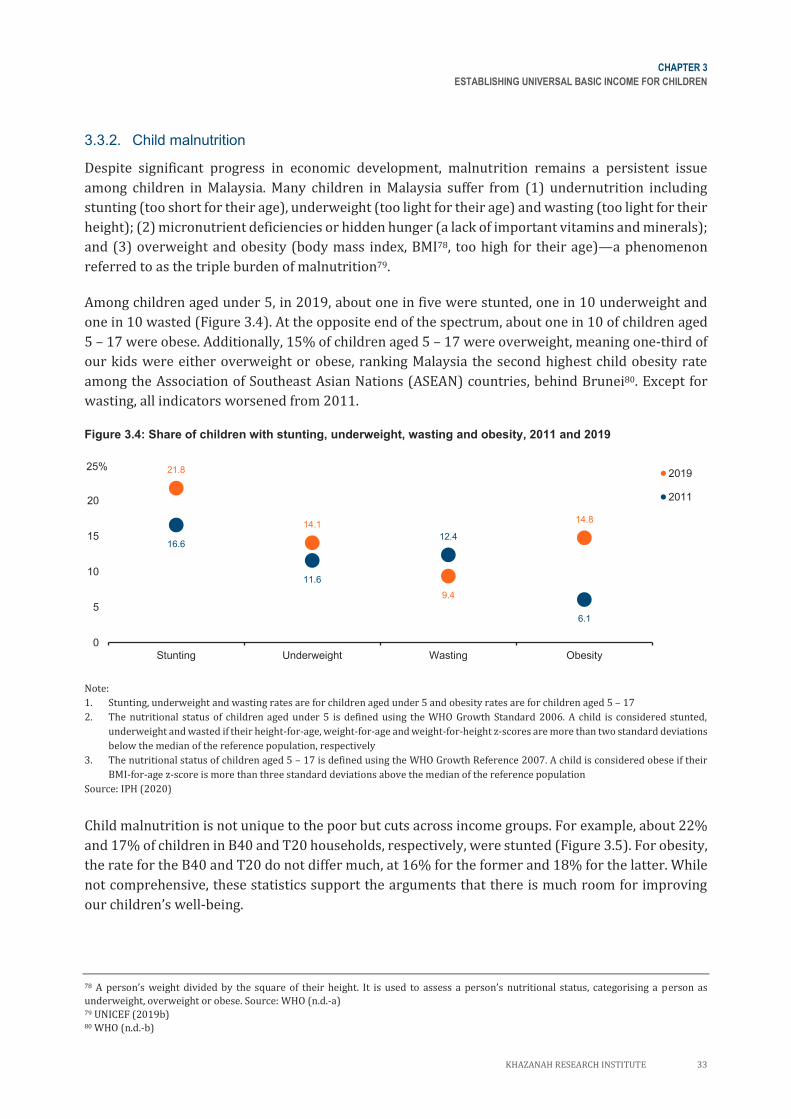
CHAPTER 3
ESTABLISHING UNIVERSAL BASIC INCOME FOR CHILDREN
KHAZANAH RESEARCH INSTITUTE 33
3.3.2. Child malnutrition
Despite significant progress in economic development, malnutrition remains a persistent issue
among children in Malaysia. Many children in Malaysia suffer from (1) undernutrition including
stunting (too short for their age), underweight (too light for their age) and wasting (too light for their
height); (2) micronutrient deficiencies or hidden hunger (a lack of important vitamins and minerals);
and (3) overweight and obesity (body mass index, BMI78, too high for their age)—a phenomenon
referred to as the triple burden of malnutrition79.
Among children aged under 5, in 2019, about one in five were stunted, one in 10 underweight and
one in 10 wasted (Figure 3.4). At the opposite end of the spectrum, about one in 10 of children aged
5 – 17 were obese. Additionally, 15% of children aged 5 – 17 were overweight, meaning one-third of
our kids were either overweight or obese, ranking Malaysia the second highest child obesity rate
among the Association of Southeast Asian Nations (ASEAN) countries, behind Brunei80. Except for
wasting, all indicators worsened from 2011.
Figure 3.4: Share of children with stunting, underweight, wasting and obesity, 2011 and 2019
Note:
1. Stunting, underweight and wasting rates are for children aged under 5 and obesity rates are for children aged 5 – 17
2. The nutritional status of children aged under 5 is defined using the WHO Growth Standard 2006. A child is considered stunted,
underweight and wasted if their height-for-age, weight-for-age and weight-for-height z-scores are more than two standard deviations
below the median of the reference population, respectively
3. The nutritional status of children aged 5 – 17 is defined using the WHO Growth Reference 2007. A child is considered obese if their
BMI-for-age z-score is more than three standard deviations above the median of the reference population
Source: IPH (2020)
Child malnutrition is not unique to the poor but cuts across income groups. For example, about 22%
and 17% of children in B40 and T20 households, respectively, were stunted (Figure 3.5). For obesity,
the rate for the B40 and T20 do not differ much, at 16% for the former and 18% for the latter. While
not comprehensive, these statistics support the arguments that there is much room for improving
our children’s well-being.
78 A person’s weight divided by the square of their height. It is used to assess a person’s nutritional status, categorising a person as
underweight, overweight or obese. Source: WHO (n.d.-a) 79 UNICEF (2019b) 80 WHO (n.d.-b)
21.8
14.1
9.4
14.8
16.6
11.6
12.4
6.1
0
5
10
15
20
25
Stunting Underweight Wasting Obesity
2019
2011
25%
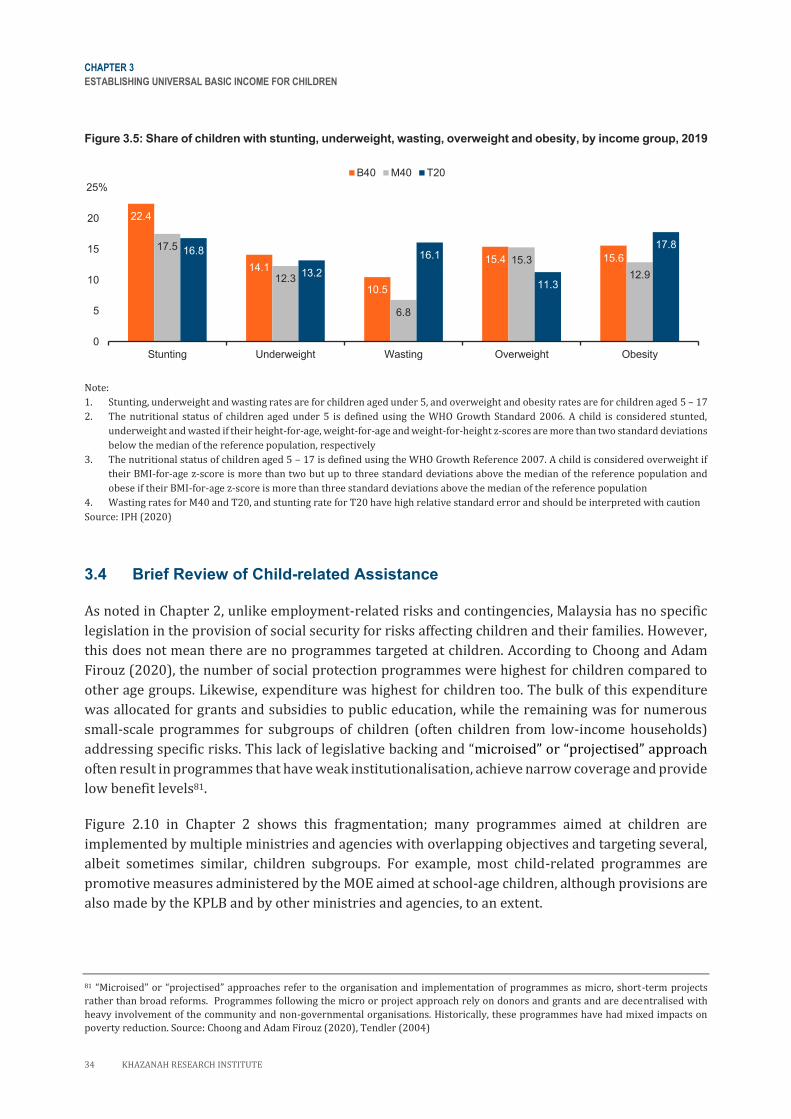
CHAPTER 3
ESTABLISHING UNIVERSAL BASIC INCOME FOR CHILDREN
34 KHAZANAH RESEARCH INSTITUTE
Figure 3.5: Share of children with stunting, underweight, wasting, overweight and obesity, by income group, 2019
Note:
1. Stunting, underweight and wasting rates are for children aged under 5, and overweight and obesity rates are for children aged 5 – 17
2. The nutritional status of children aged under 5 is defined using the WHO Growth Standard 2006. A child is considered stunted,
underweight and wasted if their height-for-age, weight-for-age and weight-for-height z-scores are more than two standard deviations
below the median of the reference population, respectively
3. The nutritional status of children aged 5 – 17 is defined using the WHO Growth Reference 2007. A child is considered overweight if
their BMI-for-age z-score is more than two but up to three standard deviations above the median of the reference population and
obese if their BMI-for-age z-score is more than three standard deviations above the median of the reference population
4. Wasting rates for M40 and T20, and stunting rate for T20 have high relative standard error and should be interpreted with caution
Source: IPH (2020)
3.4 Brief Review of Child-related Assistance
As noted in Chapter 2, unlike employment-related risks and contingencies, Malaysia has no specific
legislation in the provision of social security for risks affecting children and their families. However,
this does not mean there are no programmes targeted at children. According to Choong and Adam
Firouz (2020), the number of social protection programmes were highest for children compared to
other age groups. Likewise, expenditure was highest for children too. The bulk of this expenditure
was allocated for grants and subsidies to public education, while the remaining was for numerous
small-scale programmes for subgroups of children (often children from low-income households)
addressing specific risks. This lack of legislative backing and “microised” or “projectised” approach
often result in programmes that have weak institutionalisation, achieve narrow coverage and provide
low benefit levels81.
Figure 2.10 in Chapter 2 shows this fragmentation; many programmes aimed at children are
implemented by multiple ministries and agencies with overlapping objectives and targeting several,
albeit sometimes similar, children subgroups. For example, most child-related programmes are
promotive measures administered by the MOE aimed at school-age children, although provisions are
also made by the KPLB and by other ministries and agencies, to an extent.
81 “Microised” or “projectised” approaches refer to the organisation and implementation of programmes as micro, short-term projects
rather than broad reforms. Programmes following the micro or project approach rely on donors and grants and are decentralised with
heavy involvement of the community and non-governmental organisations. Historically, these programmes have had mixed impacts on
poverty reduction. Source: Choong and Adam Firouz (2020), Tendler (2004)
22.4
14.1
10.5
15.4 15.617.5
12.3
6.8
15.3
12.9
16.8
13.2
16.1
11.3
17.8
0
5
10
15
20
25
Stunting Underweight Wasting Overweight Obesity
B40 M40 T20
25%
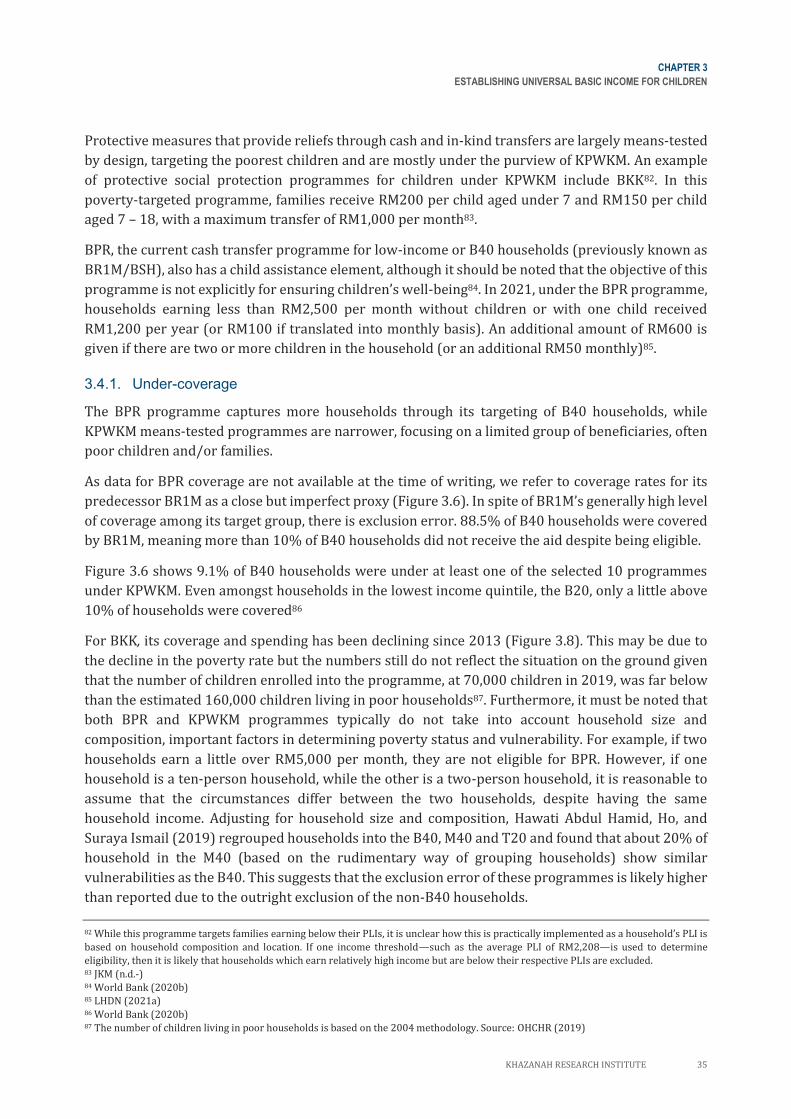
CHAPTER 3
ESTABLISHING UNIVERSAL BASIC INCOME FOR CHILDREN
KHAZANAH RESEARCH INSTITUTE 35
Protective measures that provide reliefs through cash and in-kind transfers are largely means-tested
by design, targeting the poorest children and are mostly under the purview of KPWKM. An example
of protective social protection programmes for children under KPWKM include BKK82. In this
poverty-targeted programme, families receive RM200 per child aged under 7 and RM150 per child
aged 7 – 18, with a maximum transfer of RM1,000 per month83.
BPR, the current cash transfer programme for low-income or B40 households (previously known as
BR1M/BSH), also has a child assistance element, although it should be noted that the objective of this
programme is not explicitly for ensuring children’s well-being84. In 2021, under the BPR programme,
households earning less than RM2,500 per month without children or with one child received
RM1,200 per year (or RM100 if translated into monthly basis). An additional amount of RM600 is
given if there are two or more children in the household (or an additional RM50 monthly)85.
3.4.1. Under-coverage
The BPR programme captures more households through its targeting of B40 households, while
KPWKM means-tested programmes are narrower, focusing on a limited group of beneficiaries, often
poor children and/or families.
As data for BPR coverage are not available at the time of writing, we refer to coverage rates for its
predecessor BR1M as a close but imperfect proxy (Figure 3.6). In spite of BR1M’s generally high level
of coverage among its target group, there is exclusion error. 88.5% of B40 households were covered
by BR1M, meaning more than 10% of B40 households did not receive the aid despite being eligible.
Figure 3.6 shows 9.1% of B40 households were under at least one of the selected 10 programmes
under KPWKM. Even amongst households in the lowest income quintile, the B20, only a little above
10% of households were covered86
For BKK, its coverage and spending has been declining since 2013 (Figure 3.8). This may be due to
the decline in the poverty rate but the numbers still do not reflect the situation on the ground given
that the number of children enrolled into the programme, at 70,000 children in 2019, was far below
than the estimated 160,000 children living in poor households87. Furthermore, it must be noted that
both BPR and KPWKM programmes typically do not take into account household size and
composition, important factors in determining poverty status and vulnerability. For example, if two
households earn a little over RM5,000 per month, they are not eligible for BPR. However, if one
household is a ten-person household, while the other is a two-person household, it is reasonable to
assume that the circumstances differ between the two households, despite having the same
household income. Adjusting for household size and composition, Hawati Abdul Hamid, Ho, and
Suraya Ismail (2019) regrouped households into the B40, M40 and T20 and found that about 20% of
household in the M40 (based on the rudimentary way of grouping households) show similar
vulnerabilities as the B40. This suggests that the exclusion error of these programmes is likely higher
than reported due to the outright exclusion of the non-B40 households.
82 While this programme targets families earning below their PLIs, it is unclear how this is practically implemented as a household’s PLI is
based on household composition and location. If one income threshold—such as the average PLI of RM2,208—is used to determine
eligibility, then it is likely that households which earn relatively high income but are below their respective PLIs are excluded. 83 JKM (n.d.-) 84 World Bank (2020b) 85 LHDN (2021a) 86 World Bank (2020b) 87 The number of children living in poor households is based on the 2004 methodology. Source: OHCHR (2019)
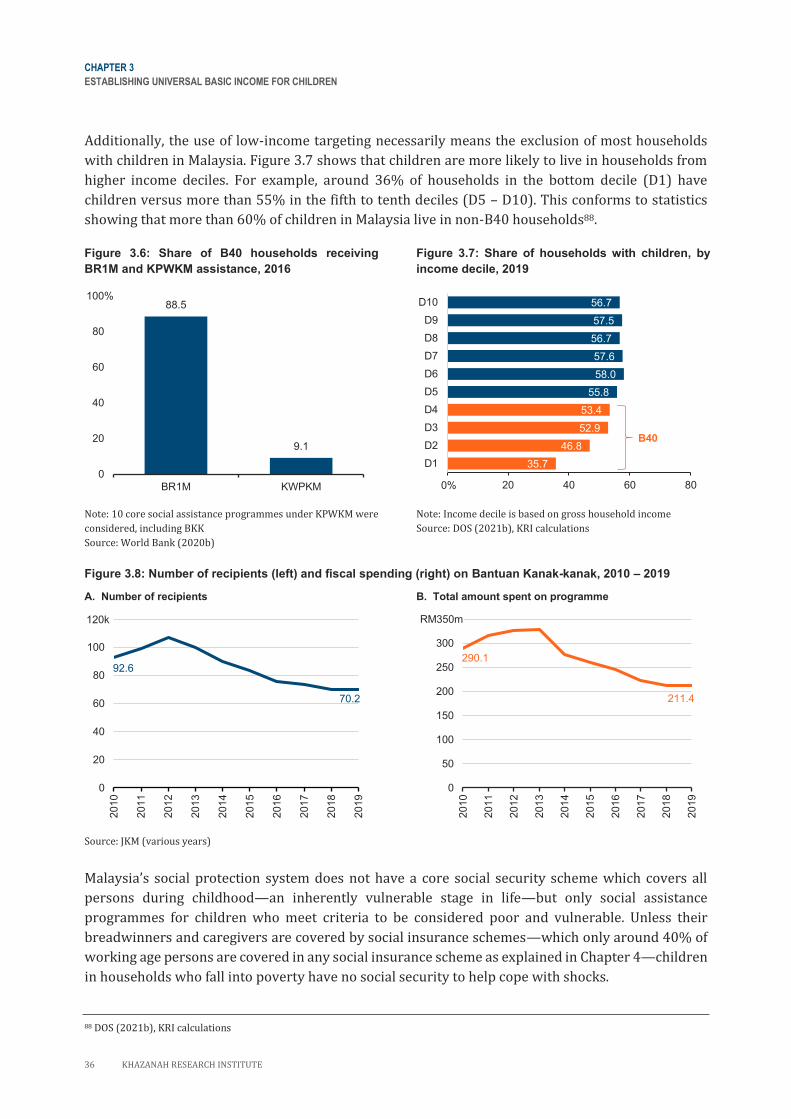
CHAPTER 3
ESTABLISHING UNIVERSAL BASIC INCOME FOR CHILDREN
36 KHAZANAH RESEARCH INSTITUTE
Additionally, the use of low-income targeting necessarily means the exclusion of most households
with children in Malaysia. Figure 3.7 shows that children are more likely to live in households from
higher income deciles. For example, around 36% of households in the bottom decile (D1) have
children versus more than 55% in the fifth to tenth deciles (D5 – D10). This conforms to statistics
showing that more than 60% of children in Malaysia live in non-B40 households88.
Figure 3.6: Share of B40 households receiving
BR1M and KPWKM assistance, 2016
Figure 3.7: Share of households with children, by
income decile, 2019
Note: 10 core social assistance programmes under KPWKM were
considered, including BKK
Source: World Bank (2020b)
Note: Income decile is based on gross household income
Source: DOS (2021b), KRI calculations
Figure 3.8: Number of recipients (left) and fiscal spending (right) on Bantuan Kanak-kanak, 2010 – 2019
A. Number of recipients B. Total amount spent on programme
Source: JKM (various years)
Malaysia’s social protection system does not have a core social security scheme which covers all
persons during childhood—an inherently vulnerable stage in life—but only social assistance
programmes for children who meet criteria to be considered poor and vulnerable. Unless their
breadwinners and caregivers are covered by social insurance schemes—which only around 40% of
working age persons are covered in any social insurance scheme as explained in Chapter 4—children
in households who fall into poverty have no social security to help cope with shocks.
88 DOS (2021b), KRI calculations
88.5
9.1
0
20
40
60
80
100
BR1M KWPKM
100%
35.7
46.8
52.9
53.4
55.8
58.0
57.6
56.7
57.5
56.7
0 20 40 60 80
D1
D2
D3
D4
D5
D6
D7
D8
D9
D10
B40
0%
92.6
70.2
0
20
40
60
80
100
120
2010
2011
2012
2013
2014
2015
2016
2017
2018
2019
120k
290.1
211.4
0
50
100
150
200
250
300
350
2010
2011
2012
2013
2014
2015
2016
2017
2018
2019
RM350m
CHAPTER 3
ESTABLISHING UNIVERSAL BASIC INCOME FOR CHILDREN
KHAZANAH RESEARCH INSTITUTE 37
Aside from coverage, the transfer amounts from these programmes have been argued for being
irregular and too little to make a difference89. These programmes fail to establish a social protection
floor as they do not provide regular income streams. Establishing a scheme that provides benefits at
regular and predictable intervals while at the same time at a reasonably adequate level would
provide the security to ride out the life cycle risk during childhood.
3.4.2. The “missing middle”
Hitherto, the discussion has focused on social assistance for underprivileged children. However,
benefits also accrue to children in higher income households through tax reliefs for child-related
expenses. For 2019 and 2020 assessments for instance, parents and caregivers can claim tax refunds
for child dependents, expenses on breastfeeding equipment, childcare fees to registered childcare
centres or kindergartens and net deposit in Skim Simpanan Pendidikan Nasional (SSPN)90.
Summarising these programmes and benefits in Figure 3.9, child-related assistance in the form of
resources transfers tends to concentrate in the lower income groups, while children in higher income
groups benefit from child-related tax relief. Within this system, it is likely that children in middle-
income groups benefit the least or are left out entirely91.
The PLI and B40 eligibility thresholds for social assistance programmes result in children in the
middle (right above the thresholds) being left out from receiving these benefits despite possibly
being vulnerable. This is a reflection of the downside in using household income-based thresholds
for targeting assistance programmes, especially for children. For example, the use of PLI to determine
the deserving poor can be sensitive to subjective judgements of what constitutes the basket of goods
representing the minimum standard of living. Additionally, the B40 demarcation is arbitrary and
does not consider household composition, economies of scale and economic disparities in different
geographical locations. According to Hawati Abdul Hamid, Ho, and Suraya Ismail (2019), when these
factors are considered, it was found that the living standard of households in non-B40 groups
(particularly the M50) was not significantly different from those in the upper segment of the B4092 .
Furthermore, parents or carers in middle-income groups may not earn high enough to claim child-
related tax reliefs embedded in the income tax system, as demonstrated in the scenarios described in
Figure 3.9.
89 In 2016, the average monthly social transfers in Malaysia amounts to RM34 per person or 7.5% of per capita income for the B20. Source:
World Bank (2020b), OHCHR (2019) 90 LHDN (n.d.-c) 91 The minimum taxable annual income is above RM34,000 (after EPF deduction) or close to RM3,000 per month and intersects with BPR
income eligibility which is earning less than RM5,000 per month. However, a measly 16.5% of Malaysia’s workforce file income taxes
suggesting that a large majority of the workforce do not benefit from child-related tax reliefs. Source: LHDN (n.d.-b), MOF (2019) 92 Hawati Abdul Hamid, Ho, and Suraya Ismail (2019)
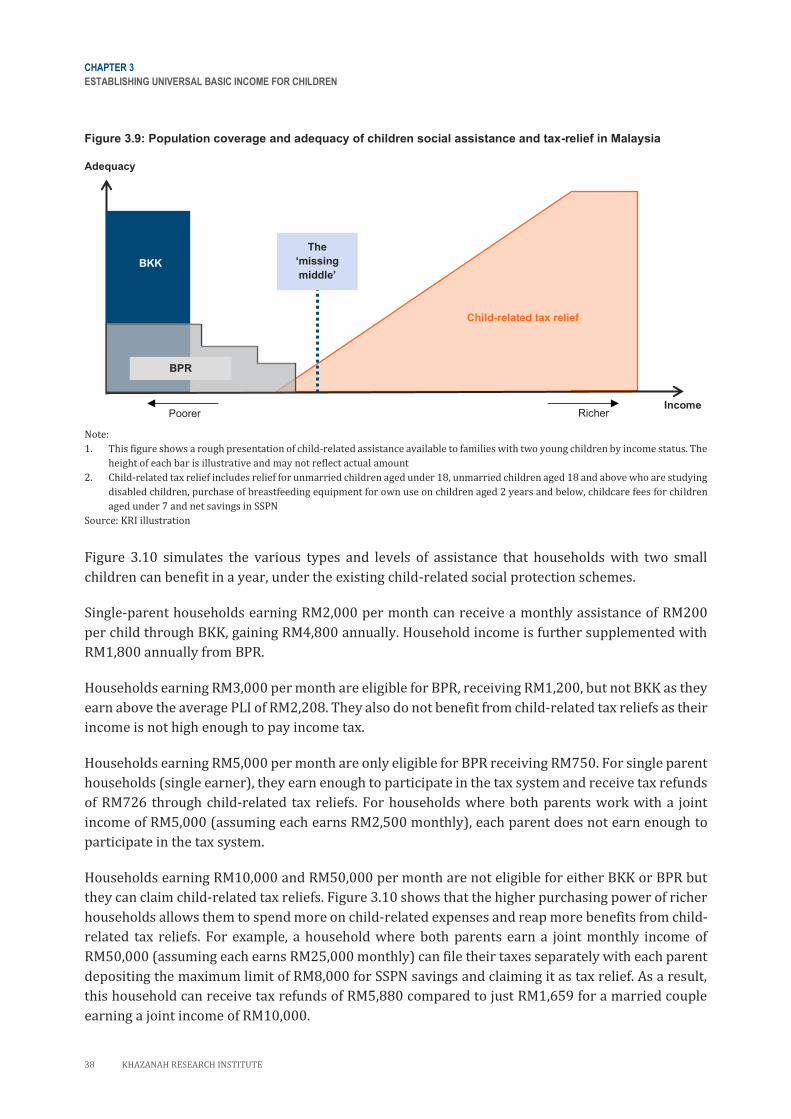
CHAPTER 3
ESTABLISHING UNIVERSAL BASIC INCOME FOR CHILDREN
38 KHAZANAH RESEARCH INSTITUTE
Figure 3.9: Population coverage and adequacy of children social assistance and tax-relief in Malaysia
Note:
1. This figure shows a rough presentation of child-related assistance available to families with two young children by income status. The
height of each bar is illustrative and may not reflect actual amount
2. Child-related tax relief includes relief for unmarried children aged under 18, unmarried children aged 18 and above who are studying
disabled children, purchase of breastfeeding equipment for own use on children aged 2 years and below, childcare fees for children
aged under 7 and net savings in SSPN
Source: KRI illustration
Figure 3.10 simulates the various types and levels of assistance that households with two small
children can benefit in a year, under the existing child-related social protection schemes.
Single-parent households earning RM2,000 per month can receive a monthly assistance of RM200
per child through BKK, gaining RM4,800 annually. Household income is further supplemented with
RM1,800 annually from BPR.
Households earning RM3,000 per month are eligible for BPR, receiving RM1,200, but not BKK as they
earn above the average PLI of RM2,208. They also do not benefit from child-related tax reliefs as their
income is not high enough to pay income tax.
Households earning RM5,000 per month are only eligible for BPR receiving RM750. For single parent
households (single earner), they earn enough to participate in the tax system and receive tax refunds
of RM726 through child-related tax reliefs. For households where both parents work with a joint
income of RM5,000 (assuming each earns RM2,500 monthly), each parent does not earn enough to
participate in the tax system.
Households earning RM10,000 and RM50,000 per month are not eligible for either BKK or BPR but
they can claim child-related tax reliefs. Figure 3.10 shows that the higher purchasing power of richer
households allows them to spend more on child-related expenses and reap more benefits from child-
related tax reliefs. For example, a household where both parents earn a joint monthly income of
RM50,000 (assuming each earns RM25,000 monthly) can file their taxes separately with each parent
depositing the maximum limit of RM8,000 for SSPN savings and claiming it as tax relief. As a result,
this household can receive tax refunds of RM5,880 compared to just RM1,659 for a married couple
earning a joint income of RM10,000.
BKK
The
‘missing
middle’
Child-related tax relief
Adequacy
Poorer
BPR
Richer Income
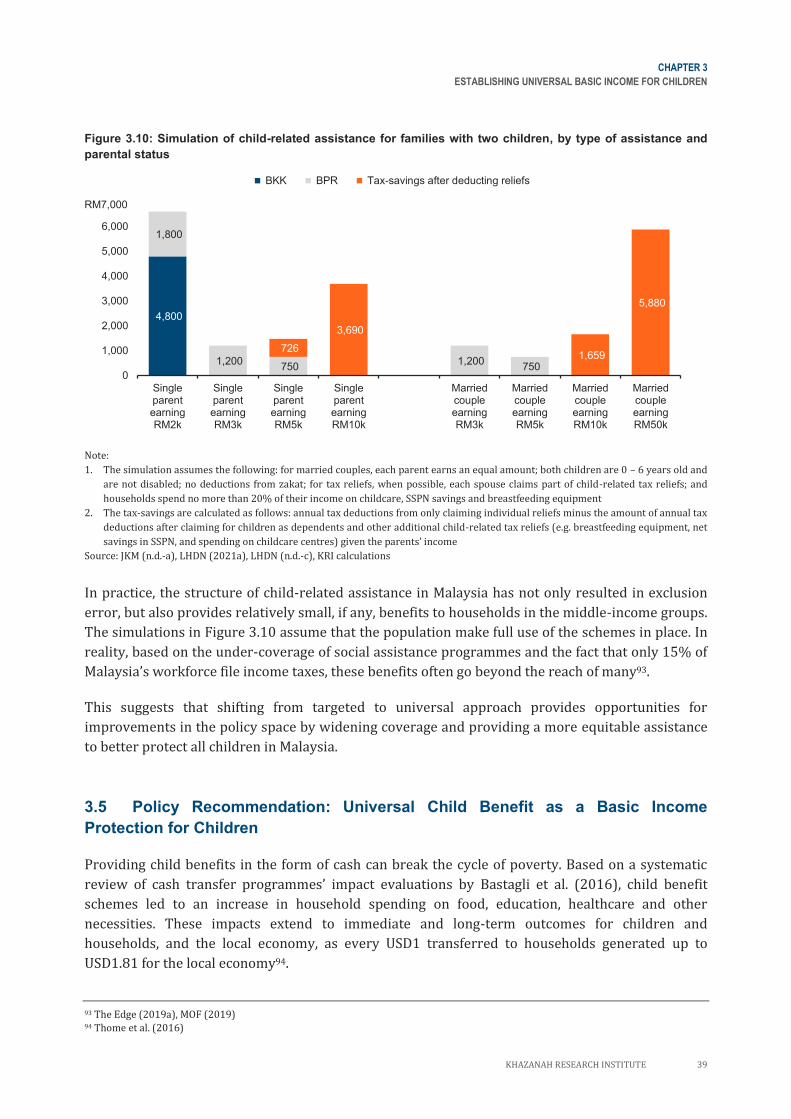
CHAPTER 3
ESTABLISHING UNIVERSAL BASIC INCOME FOR CHILDREN
KHAZANAH RESEARCH INSTITUTE 39
Figure 3.10: Simulation of child-related assistance for families with two children, by type of assistance and
parental status
Note:
1. The simulation assumes the following: for married couples, each parent earns an equal amount; both children are 0 – 6 years old and
are not disabled; no deductions from zakat; for tax reliefs, when possible, each spouse claims part of child-related tax reliefs; and
households spend no more than 20% of their income on childcare, SSPN savings and breastfeeding equipment
2. The tax-savings are calculated as follows: annual tax deductions from only claiming individual reliefs minus the amount of annual tax
deductions after claiming for children as dependents and other additional child-related tax reliefs (e.g. breastfeeding equipment, net
savings in SSPN, and spending on childcare centres) given the parents’ income
Source: JKM (n.d.-a), LHDN (2021a), LHDN (n.d.-c), KRI calculations
In practice, the structure of child-related assistance in Malaysia has not only resulted in exclusion
error, but also provides relatively small, if any, benefits to households in the middle-income groups.
The simulations in Figure 3.10 assume that the population make full use of the schemes in place. In
reality, based on the under-coverage of social assistance programmes and the fact that only 15% of
Malaysia’s workforce file income taxes, these benefits often go beyond the reach of many93.
This suggests that shifting from targeted to universal approach provides opportunities for
improvements in the policy space by widening coverage and providing a more equitable assistance
to better protect all children in Malaysia.
3.5 Policy Recommendation: Universal Child Benefit as a Basic Income
Protection for Children
Providing child benefits in the form of cash can break the cycle of poverty. Based on a systematic
review of cash transfer programmes’ impact evaluations by Bastagli et al. (2016), child benefit
schemes led to an increase in household spending on food, education, healthcare and other
necessities. These impacts extend to immediate and long-term outcomes for children and
households, and the local economy, as every USD1 transferred to households generated up to
USD1.81 for the local economy94.
93 The Edge (2019a), MOF (2019) 94 Thome et al. (2016)
4,800
1,800
1,200 750
1,200 750
726
3,690
1,659
5,880
0
1,000
2,000
3,000
4,000
5,000
6,000
7,000
SingleparentearningRM2k
SingleparentearningRM3k
SingleparentearningRM5k
SingleparentearningRM10k
MarriedcoupleearningRM3k
MarriedcoupleearningRM5k
MarriedcoupleearningRM10k
MarriedcoupleearningRM50k
BKK BPR Tax-savings after deducting reliefs
RM7,000
CHAPTER 3
ESTABLISHING UNIVERSAL BASIC INCOME FOR CHILDREN
40 KHAZANAH RESEARCH INSTITUTE
Acknowledging the shortcomings of current child-related assistance in Malaysia, we propose a
universal child benefit (UCB) scheme because of their comparatively higher coverage rates and lower
exclusion errors95. Universalism has become an important consideration in the design of child
benefits, in line with the central promise of the 2030 Agenda for Sustainable Development to “leave
no one behind.”96 Under the universal paradigm, a UCB would include all children, independent of
their socioeconomic status.
UCB’s administrative simplicity, whereby beneficiaries do not need to prove their eligibility, is also
an advantage as it eliminates multiple barriers to assistance, including reducing the potential for
bribery and abuse of power by authorities. The simpler application processes and less invasive
compliance mechanisms associated with UCB may mean it is better able to respect the dignity of
those entitled to transfers and minimise stigmatisation.
Ideally a UCB scheme offers families regular, unconditional cash payments until the child’s 18th
birthday with the aim to ensure children’s basic needs are taken care of throughout childhood and
adolescence97.
As of 2020, only 23 countries offer UCB98. This small number may be unsurprising as Mkandawire
(2005) stated that in both developed and developing countries, there has been a general shift from
universalism to targeting in the design of social policies, citing several drivers of this shift including
(1) prescribing to the neoliberal ideology, premised on self-interest and belief that the free market
will fix issues including social security and (2) fiscal constraint that led to the perception that there
is a need for budgetary restraint in the quest for efficiency. In an ideal scenario, with perfect targeting,
poverty can indeed be eradicated more cost-efficiently99. However, in reality, higher administrative
costs from identifying and verifying beneficiaries, and exclusion errors often reduce targeting’s
effectiveness100. The decision on targeting in child benefits is critical as it affects children’s access to
material assistance and chances of social mobility, especially for the poor.
Recognising the right to social protection and costs of leaving the poor and vulnerable behind,
Mkandawire (2005) argues that social protection itself has to be universalistic, and targeting only
utilised as an instrument for making the system more effective e.g. enhancing benefits for those
identified as more needy in a universalistic system. In line with this principle, this report proposes a
universal approach in establishing a social protection floor for all children in the form of a regular
basic income.
95 Exclusion error refers to the extent to which persons in the targeted group do not receive assistance/benefits even though they are
entitled to them. Source: World Bank (2020b) 96 UNSDG (n.d.) 97 ODI and UNICEF (2020). 98 Kidd et al. (2020), Ortiz et al. (2015) 99 ODI and UNICEF (2020) 100 ODI and UNICEF (2020)
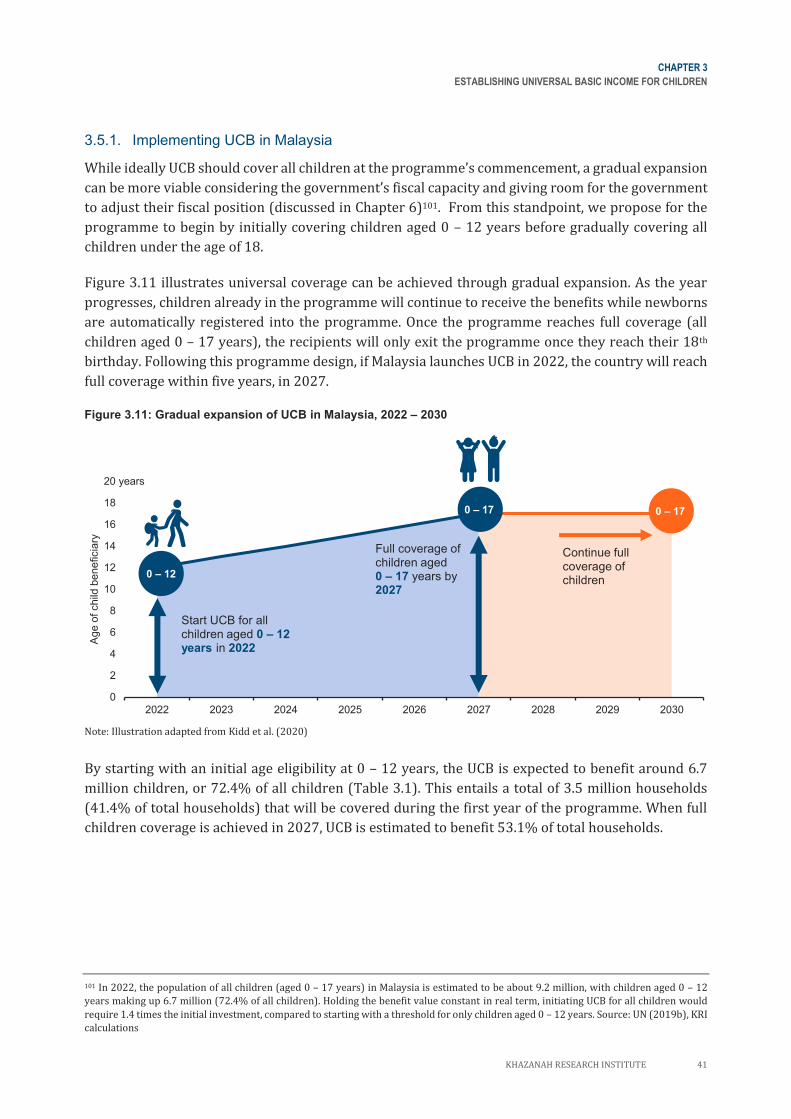
CHAPTER 3
ESTABLISHING UNIVERSAL BASIC INCOME FOR CHILDREN
KHAZANAH RESEARCH INSTITUTE 41
3.5.1. Implementing UCB in Malaysia
While ideally UCB should cover all children at the programme’s commencement, a gradual expansion
can be more viable considering the government’s fiscal capacity and giving room for the government
to adjust their fiscal position (discussed in Chapter 6)101. From this standpoint, we propose for the
programme to begin by initially covering children aged 0 – 12 years before gradually covering all
children under the age of 18.
Figure 3.11 illustrates universal coverage can be achieved through gradual expansion. As the year
progresses, children already in the programme will continue to receive the benefits while newborns
are automatically registered into the programme. Once the programme reaches full coverage (all
children aged 0 – 17 years), the recipients will only exit the programme once they reach their 18th
birthday. Following this programme design, if Malaysia launches UCB in 2022, the country will reach
full coverage within five years, in 2027.
Figure 3.11: Gradual expansion of UCB in Malaysia, 2022 – 2030
Note: Illustration adapted from Kidd et al. (2020)
By starting with an initial age eligibility at 0 – 12 years, the UCB is expected to benefit around 6.7
million children, or 72.4% of all children (Table 3.1). This entails a total of 3.5 million households
(41.4% of total households) that will be covered during the first year of the programme. When full
children coverage is achieved in 2027, UCB is estimated to benefit 53.1% of total households.
101 In 2022, the population of all children (aged 0 – 17 years) in Malaysia is estimated to be about 9.2 million, with children aged 0 – 12
years making up 6.7 million (72.4% of all children). Holding the benefit value constant in real term, initiating UCB for all children would
require 1.4 times the initial investment, compared to starting with a threshold for only children aged 0 – 12 years. Source: UN (2019b), KRI
calculations
0
2
4
6
8
10
12
14
16
18
20
2022 2023 2024 2025 2026 2027 2028 2029 2030
Age o
f child
beneficia
ry
Full coverage of children aged0 – 17 years by 2027
0 – 12
0 – 17
Start UCB for all children aged 0 – 12 years in 2022
0 – 17
Continue fullcoverage of children
20 years
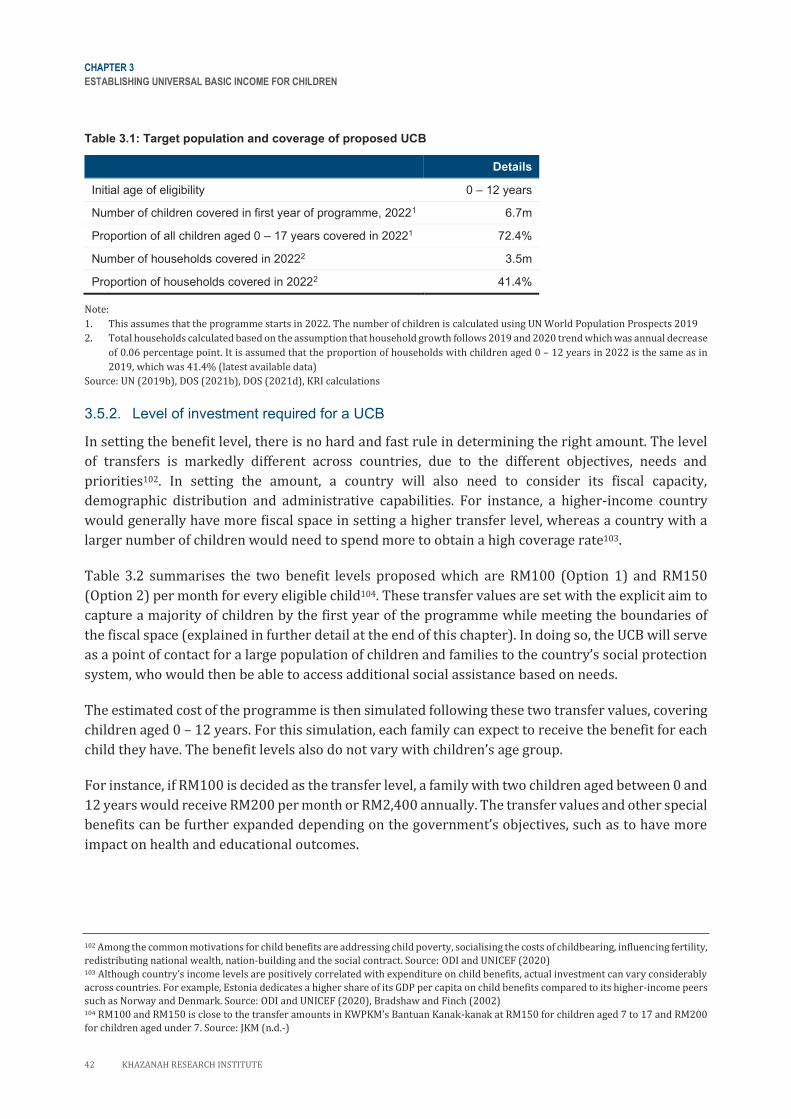
CHAPTER 3
ESTABLISHING UNIVERSAL BASIC INCOME FOR CHILDREN
42 KHAZANAH RESEARCH INSTITUTE
Table 3.1: Target population and coverage of proposed UCB
Details
Initial age of eligibility 0 – 12 years
Number of children covered in first year of programme, 20221 6.7m
Proportion of all children aged 0 – 17 years covered in 20221 72.4%
Number of households covered in 20222 3.5m
Proportion of households covered in 20222 41.4%
Note:
1. This assumes that the programme starts in 2022. The number of children is calculated using UN World Population Prospects 2019
2. Total households calculated based on the assumption that household growth follows 2019 and 2020 trend which was annual decrease
of 0.06 percentage point. It is assumed that the proportion of households with children aged 0 – 12 years in 2022 is the same as in
2019, which was 41.4% (latest available data)
Source: UN (2019b), DOS (2021b), DOS (2021d), KRI calculations
3.5.2. Level of investment required for a UCB
In setting the benefit level, there is no hard and fast rule in determining the right amount. The level
of transfers is markedly different across countries, due to the different objectives, needs and
priorities102. In setting the amount, a country will also need to consider its fiscal capacity,
demographic distribution and administrative capabilities. For instance, a higher-income country
would generally have more fiscal space in setting a higher transfer level, whereas a country with a
larger number of children would need to spend more to obtain a high coverage rate103.
Table 3.2 summarises the two benefit levels proposed which are RM100 (Option 1) and RM150
(Option 2) per month for every eligible child104. These transfer values are set with the explicit aim to
capture a majority of children by the first year of the programme while meeting the boundaries of
the fiscal space (explained in further detail at the end of this chapter). In doing so, the UCB will serve
as a point of contact for a large population of children and families to the country’s social protection
system, who would then be able to access additional social assistance based on needs.
The estimated cost of the programme is then simulated following these two transfer values, covering
children aged 0 – 12 years. For this simulation, each family can expect to receive the benefit for each
child they have. The benefit levels also do not vary with children’s age group.
For instance, if RM100 is decided as the transfer level, a family with two children aged between 0 and
12 years would receive RM200 per month or RM2,400 annually. The transfer values and other special
benefits can be further expanded depending on the government’s objectives, such as to have more
impact on health and educational outcomes.
102 Among the common motivations for child benefits are addressing child poverty, socialising the costs of childbearing, influencing fertility,
redistributing national wealth, nation-building and the social contract. Source: ODI and UNICEF (2020) 103 Although country’s income levels are positively correlated with expenditure on child benefits, actual investment can vary considerably
across countries. For example, Estonia dedicates a higher share of its GDP per capita on child benefits compared to its higher-income peers
such as Norway and Denmark. Source: ODI and UNICEF (2020), Bradshaw and Finch (2002) 104 RM100 and RM150 is close to the transfer amounts in KWPKM’s Bantuan Kanak-kanak at RM150 for children aged 7 to 17 and RM200
for children aged under 7. Source: JKM (n.d.-)
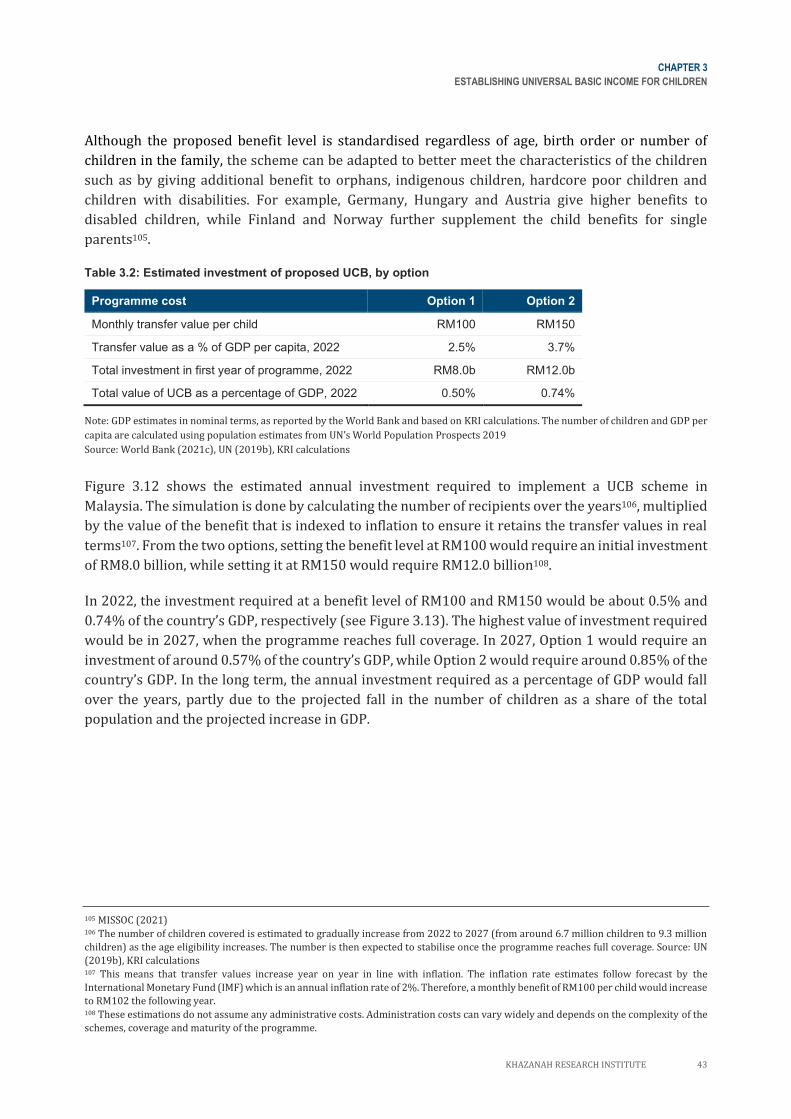
CHAPTER 3
ESTABLISHING UNIVERSAL BASIC INCOME FOR CHILDREN
KHAZANAH RESEARCH INSTITUTE 43
Although the proposed benefit level is standardised regardless of age, birth order or number of
children in the family, the scheme can be adapted to better meet the characteristics of the children
such as by giving additional benefit to orphans, indigenous children, hardcore poor children and
children with disabilities. For example, Germany, Hungary and Austria give higher benefits to
disabled children, while Finland and Norway further supplement the child benefits for single
parents105.
Table 3.2: Estimated investment of proposed UCB, by option
Programme cost Option 1 Option 2
Monthly transfer value per child RM100 RM150
Transfer value as a % of GDP per capita, 2022 2.5% 3.7%
Total investment in first year of programme, 2022 RM8.0b RM12.0b
Total value of UCB as a percentage of GDP, 2022 0.50% 0.74%
Note: GDP estimates in nominal terms, as reported by the World Bank and based on KRI calculations. The number of children and GDP per
capita are calculated using population estimates from UN’s World Population Prospects 2019
Source: World Bank (2021c), UN (2019b), KRI calculations
Figure 3.12 shows the estimated annual investment required to implement a UCB scheme in
Malaysia. The simulation is done by calculating the number of recipients over the years106, multiplied
by the value of the benefit that is indexed to inflation to ensure it retains the transfer values in real
terms107. From the two options, setting the benefit level at RM100 would require an initial investment
of RM8.0 billion, while setting it at RM150 would require RM12.0 billion108.
In 2022, the investment required at a benefit level of RM100 and RM150 would be about 0.5% and
0.74% of the country’s GDP, respectively (see Figure 3.13). The highest value of investment required
would be in 2027, when the programme reaches full coverage. In 2027, Option 1 would require an
investment of around 0.57% of the country’s GDP, while Option 2 would require around 0.85% of the
country’s GDP. In the long term, the annual investment required as a percentage of GDP would fall
over the years, partly due to the projected fall in the number of children as a share of the total
population and the projected increase in GDP.
105 MISSOC (2021) 106 The number of children covered is estimated to gradually increase from 2022 to 2027 (from around 6.7 million children to 9.3 million
children) as the age eligibility increases. The number is then expected to stabilise once the programme reaches full coverage. Source: UN
(2019b), KRI calculations 107 This means that transfer values increase year on year in line with inflation. The inflation rate estimates follow forecast by the
International Monetary Fund (IMF) which is an annual inflation rate of 2%. Therefore, a monthly benefit of RM100 per child would increase
to RM102 the following year. 108 These estimations do not assume any administrative costs. Administration costs can vary widely and depends on the complexity of the
schemes, coverage and maturity of the programme.
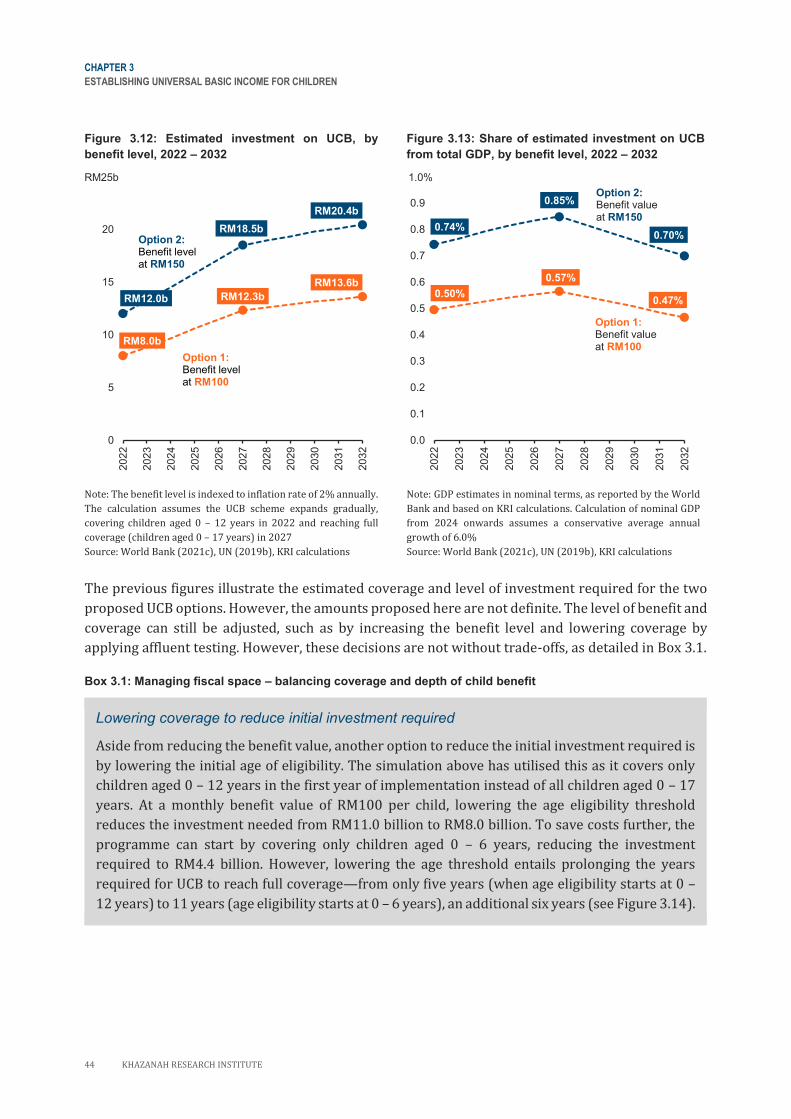
CHAPTER 3
ESTABLISHING UNIVERSAL BASIC INCOME FOR CHILDREN
44 KHAZANAH RESEARCH INSTITUTE
Figure 3.12: Estimated investment on UCB, by
benefit level, 2022 – 2032
Figure 3.13: Share of estimated investment on UCB
from total GDP, by benefit level, 2022 – 2032
Note: The benefit level is indexed to inflation rate of 2% annually.
The calculation assumes the UCB scheme expands gradually,
covering children aged 0 – 12 years in 2022 and reaching full
coverage (children aged 0 – 17 years) in 2027
Source: World Bank (2021c), UN (2019b), KRI calculations
Note: GDP estimates in nominal terms, as reported by the World
Bank and based on KRI calculations. Calculation of nominal GDP
from 2024 onwards assumes a conservative average annual
growth of 6.0%
Source: World Bank (2021c), UN (2019b), KRI calculations
The previous figures illustrate the estimated coverage and level of investment required for the two
proposed UCB options. However, the amounts proposed here are not definite. The level of benefit and
coverage can still be adjusted, such as by increasing the benefit level and lowering coverage by
applying affluent testing. However, these decisions are not without trade-offs, as detailed in Box 3.1.
Box 3.1: Managing fiscal space – balancing coverage and depth of child benefit
Lowering coverage to reduce initial investment required
Aside from reducing the benefit value, another option to reduce the initial investment required is
by lowering the initial age of eligibility. The simulation above has utilised this as it covers only
children aged 0 – 12 years in the first year of implementation instead of all children aged 0 – 17
years. At a monthly benefit value of RM100 per child, lowering the age eligibility threshold
reduces the investment needed from RM11.0 billion to RM8.0 billion. To save costs further, the
programme can start by covering only children aged 0 – 6 years, reducing the investment
required to RM4.4 billion. However, lowering the age threshold entails prolonging the years
required for UCB to reach full coverage—from only five years (when age eligibility starts at 0 –
12 years) to 11 years (age eligibility starts at 0 – 6 years), an additional six years (see Figure 3.14).
RM8.0b
RM12.3b
RM13.6b
RM12.0b
RM18.5b
RM20.4b
0
5
10
15
20
25
2022
2023
2024
2025
2026
2027
2028
2029
2030
2031
2032
RM25b
Option 2:Benefit levelat RM150
Option 1:Benefit levelat RM100
0.50%
0.57%
0.47%
0.74%
0.85%
0.70%
0.0
0.1
0.2
0.3
0.4
0.5
0.6
0.7
0.8
0.9
1.0
2022
2023
2024
2025
2026
2027
2028
2029
2030
2031
2032
1.0%
Option 2:Benefit valueat RM150
Option 1:Benefit valueat RM100
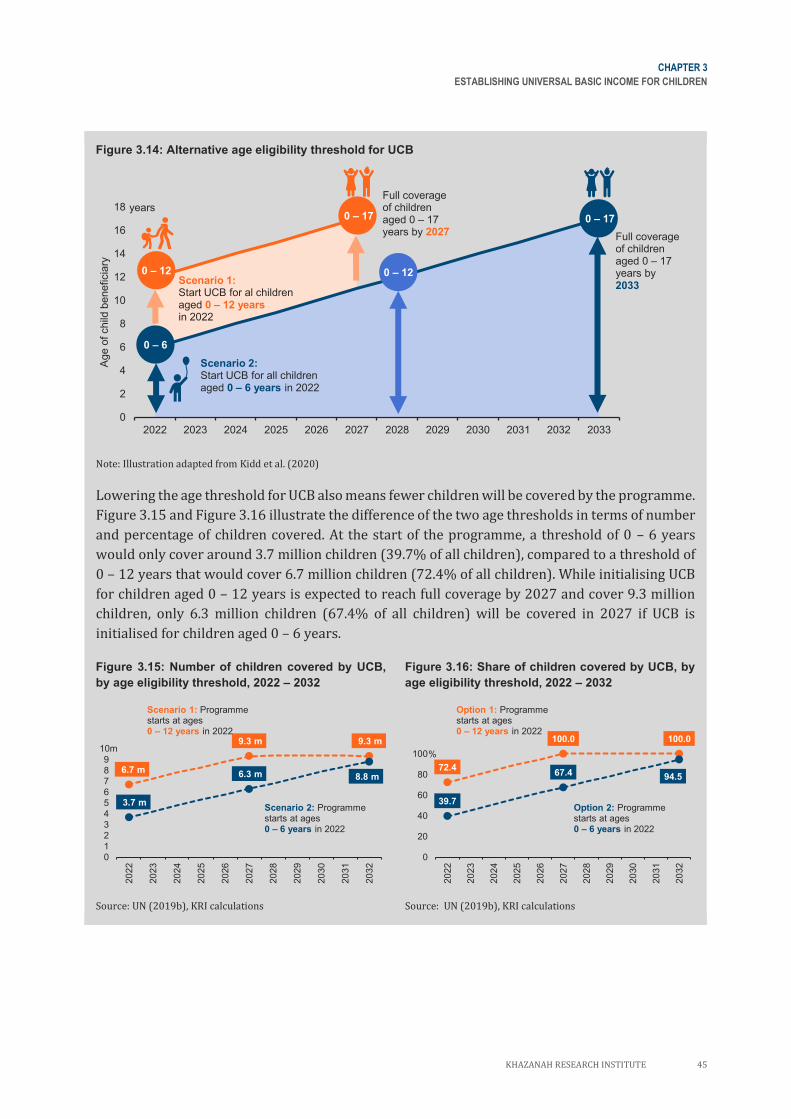
CHAPTER 3
ESTABLISHING UNIVERSAL BASIC INCOME FOR CHILDREN
KHAZANAH RESEARCH INSTITUTE 45
Figure 3.14: Alternative age eligibility threshold for UCB
Note: Illustration adapted from Kidd et al. (2020)
Lowering the age threshold for UCB also means fewer children will be covered by the programme.
Figure 3.15 and Figure 3.16 illustrate the difference of the two age thresholds in terms of number
and percentage of children covered. At the start of the programme, a threshold of 0 – 6 years
would only cover around 3.7 million children (39.7% of all children), compared to a threshold of
0 – 12 years that would cover 6.7 million children (72.4% of all children). While initialising UCB
for children aged 0 – 12 years is expected to reach full coverage by 2027 and cover 9.3 million
children, only 6.3 million children (67.4% of all children) will be covered in 2027 if UCB is
initialised for children aged 0 – 6 years.
Figure 3.15: Number of children covered by UCB,
by age eligibility threshold, 2022 – 2032
Figure 3.16: Share of children covered by UCB, by
age eligibility threshold, 2022 – 2032
Source: UN (2019b), KRI calculations Source: UN (2019b), KRI calculations
0
2
4
6
8
10
12
14
16
18
2022 2023 2024 2025 2026 2027 2028 2029 2030 2031 2032 2033
Age o
f child
beneficia
ry
Full coverage of children aged 0 – 17 years by 2027 Full coverage
of children aged 0 – 17 years by 2033
0 – 6
0 – 12
0 – 17 0 – 17
Scenario 1:Start UCB for al childrenaged 0 – 12 yearsin 2022
Scenario 2:Start UCB for all children aged 0 – 6 years in 2022
0 – 12
years
6.7 m
9.3 m 9.3 m
3.7 m
6.3 m 8.8 m
0123456789
10
20
22
20
23
20
24
20
25
20
26
20
27
20
28
20
29
20
30
20
31
20
32
10m
Scenario 1: Programmestarts at ages0 – 12 years in 2022
Scenario 2: Programmestarts at ages0 – 6 years in 2022
72.4
100.0 100.0
39.7
67.4 94.5
0
20
40
60
80
100
20
22
20
23
20
24
20
25
20
26
20
27
20
28
20
29
20
30
20
31
20
32
%
Option 1: Programmestarts at ages0 – 12 years in 2022
Option 2: Programmestarts at ages0 – 6 years in 2022
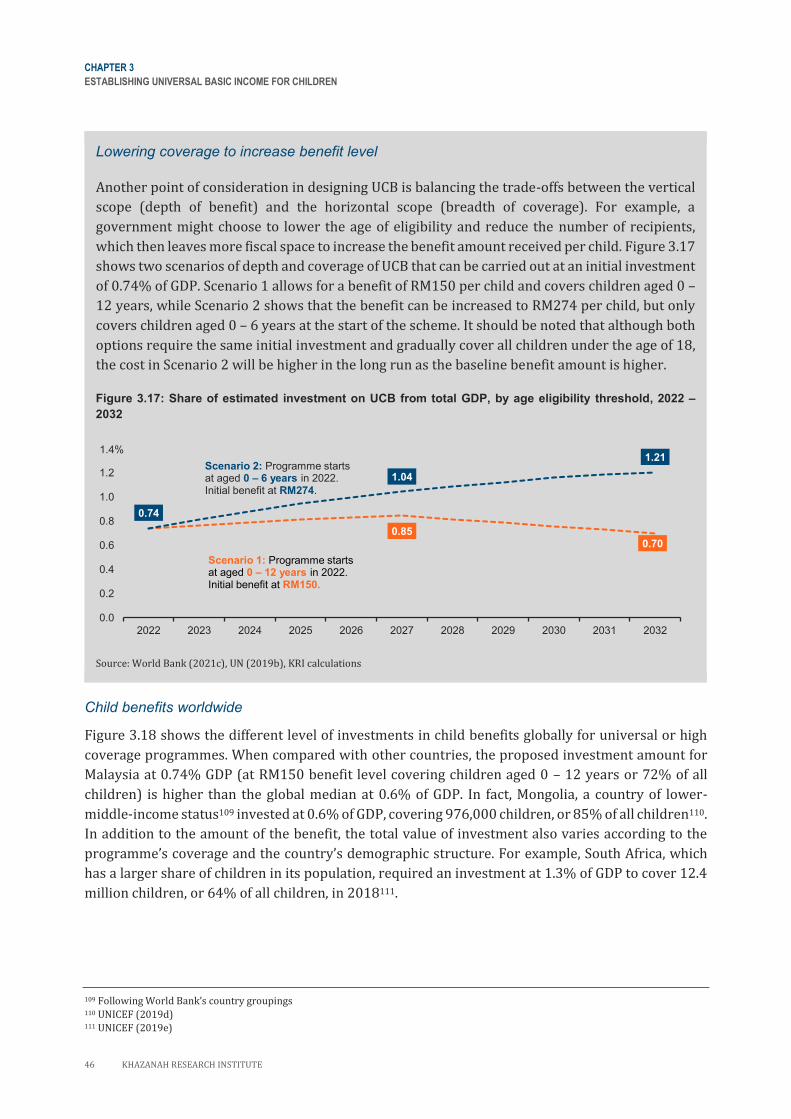
CHAPTER 3
ESTABLISHING UNIVERSAL BASIC INCOME FOR CHILDREN
46 KHAZANAH RESEARCH INSTITUTE
Lowering coverage to increase benefit level
Another point of consideration in designing UCB is balancing the trade-offs between the vertical
scope (depth of benefit) and the horizontal scope (breadth of coverage). For example, a
government might choose to lower the age of eligibility and reduce the number of recipients,
which then leaves more fiscal space to increase the benefit amount received per child. Figure 3.17
shows two scenarios of depth and coverage of UCB that can be carried out at an initial investment
of 0.74% of GDP. Scenario 1 allows for a benefit of RM150 per child and covers children aged 0 –
12 years, while Scenario 2 shows that the benefit can be increased to RM274 per child, but only
covers children aged 0 – 6 years at the start of the scheme. It should be noted that although both
options require the same initial investment and gradually cover all children under the age of 18,
the cost in Scenario 2 will be higher in the long run as the baseline benefit amount is higher.
Figure 3.17: Share of estimated investment on UCB from total GDP, by age eligibility threshold, 2022 –
2032
Source: World Bank (2021c), UN (2019b), KRI calculations
Child benefits worldwide
Figure 3.18 shows the different level of investments in child benefits globally for universal or high
coverage programmes. When compared with other countries, the proposed investment amount for
Malaysia at 0.74% GDP (at RM150 benefit level covering children aged 0 – 12 years or 72% of all
children) is higher than the global median at 0.6% of GDP. In fact, Mongolia, a country of lower-
middle-income status109 invested at 0.6% of GDP, covering 976,000 children, or 85% of all children110.
In addition to the amount of the benefit, the total value of investment also varies according to the
programme’s coverage and the country’s demographic structure. For example, South Africa, which
has a larger share of children in its population, required an investment at 1.3% of GDP to cover 12.4
million children, or 64% of all children, in 2018111.
109 Following World Bank’s country groupings 110 UNICEF (2019d) 111 UNICEF (2019e)
0.850.70
0.74
1.04
1.21
0.0
0.2
0.4
0.6
0.8
1.0
1.2
1.4
2022 2023 2024 2025 2026 2027 2028 2029 2030 2031 2032
1.4%
Scenario 2: Programme startsat aged 0 – 6 years in 2022.Initial benefit at RM274.
Scenario 1: Programme startsat aged 0 – 12 years in 2022.Initial benefit at RM150.
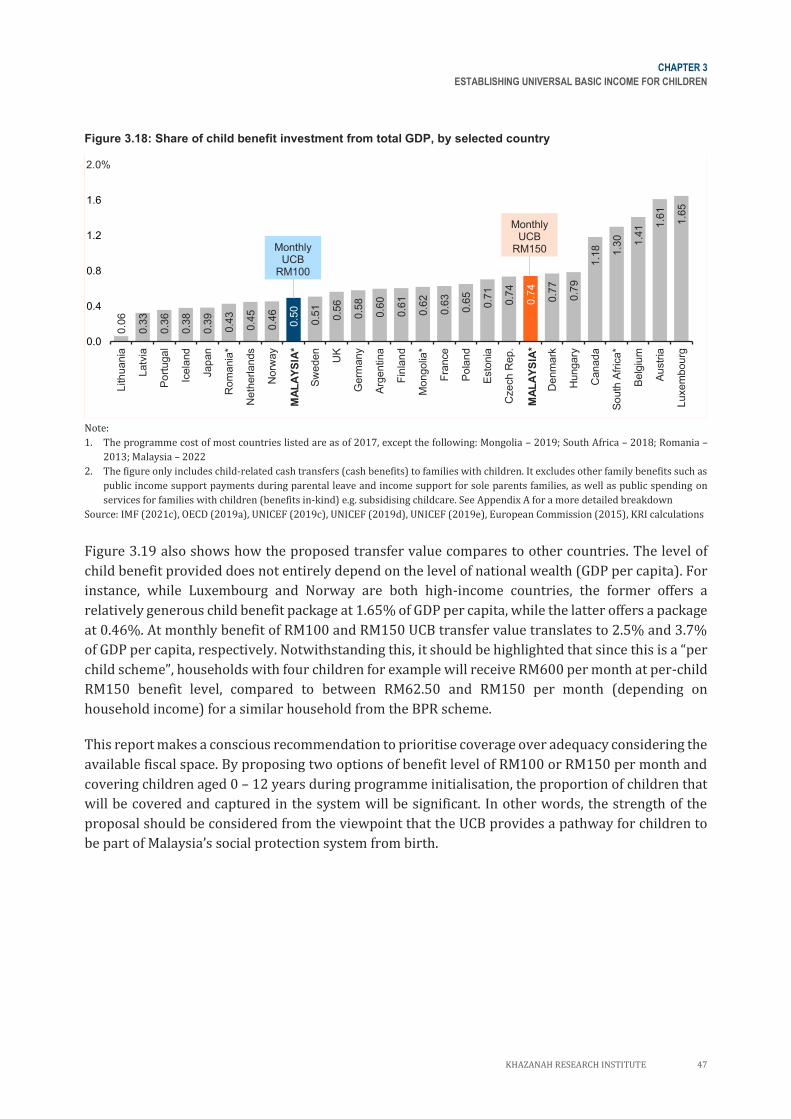
CHAPTER 3
ESTABLISHING UNIVERSAL BASIC INCOME FOR CHILDREN
KHAZANAH RESEARCH INSTITUTE 47
Figure 3.18: Share of child benefit investment from total GDP, by selected country
Note:
1. The programme cost of most countries listed are as of 2017, except the following: Mongolia – 2019; South Africa – 2018; Romania –
2013; Malaysia – 2022
2. The figure only includes child-related cash transfers (cash benefits) to families with children. It excludes other family benefits such as
public income support payments during parental leave and income support for sole parents families, as well as public spending on
services for families with children (benefits in-kind) e.g. subsidising childcare. See Appendix A for a more detailed breakdown
Source: IMF (2021c), OECD (2019a), UNICEF (2019c), UNICEF (2019d), UNICEF (2019e), European Commission (2015), KRI calculations
Figure 3.19 also shows how the proposed transfer value compares to other countries. The level of
child benefit provided does not entirely depend on the level of national wealth (GDP per capita). For
instance, while Luxembourg and Norway are both high-income countries, the former offers a
relatively generous child benefit package at 1.65% of GDP per capita, while the latter offers a package
at 0.46%. At monthly benefit of RM100 and RM150 UCB transfer value translates to 2.5% and 3.7%
of GDP per capita, respectively. Notwithstanding this, it should be highlighted that since this is a “per
child scheme”, households with four children for example will receive RM600 per month at per-child
RM150 benefit level, compared to between RM62.50 and RM150 per month (depending on
household income) for a similar household from the BPR scheme.
This report makes a conscious recommendation to prioritise coverage over adequacy considering the
available fiscal space. By proposing two options of benefit level of RM100 or RM150 per month and
covering children aged 0 – 12 years during programme initialisation, the proportion of children that
will be covered and captured in the system will be significant. In other words, the strength of the
proposal should be considered from the viewpoint that the UCB provides a pathway for children to
be part of Malaysia’s social protection system from birth.
0.0
6
0.3
3
0.3
6
0.3
8
0.3
9
0.4
3
0.4
5
0.4
6
0.5
0
0.5
1
0.5
6
0.5
8
0.6
0
0.6
1
0.6
2
0.6
3
0.6
5
0.7
1
0.7
4
0.7
4
0.7
7
0.7
9
1.1
8 1.3
0 1.4
1 1.6
1
1.6
5
0.0
0.4
0.8
1.2
1.6
2.0
Lith
uania
Latv
ia
Po
rtuga
l
Icela
nd
Jap
an
Rom
ania
*
Neth
erla
nds
Norw
ay
MA
LA
YS
IA*
Sw
eden
UK
Germ
any
Arg
entin
a
Fin
lan
d
Mo
ngolia
*
Fra
nce
Po
lan
d
Esto
nia
Cze
ch R
ep.
MA
LA
YS
IA*
Denm
ark
Hungary
Canada
So
uth
Afr
ica*
Be
lgiu
m
Au
str
ia
Luxem
bourg
MA
LA
YS
IA*
MA
LA
YS
IA*
MonthlyUCB
RM100
MonthlyUCB
RM150
2.0%
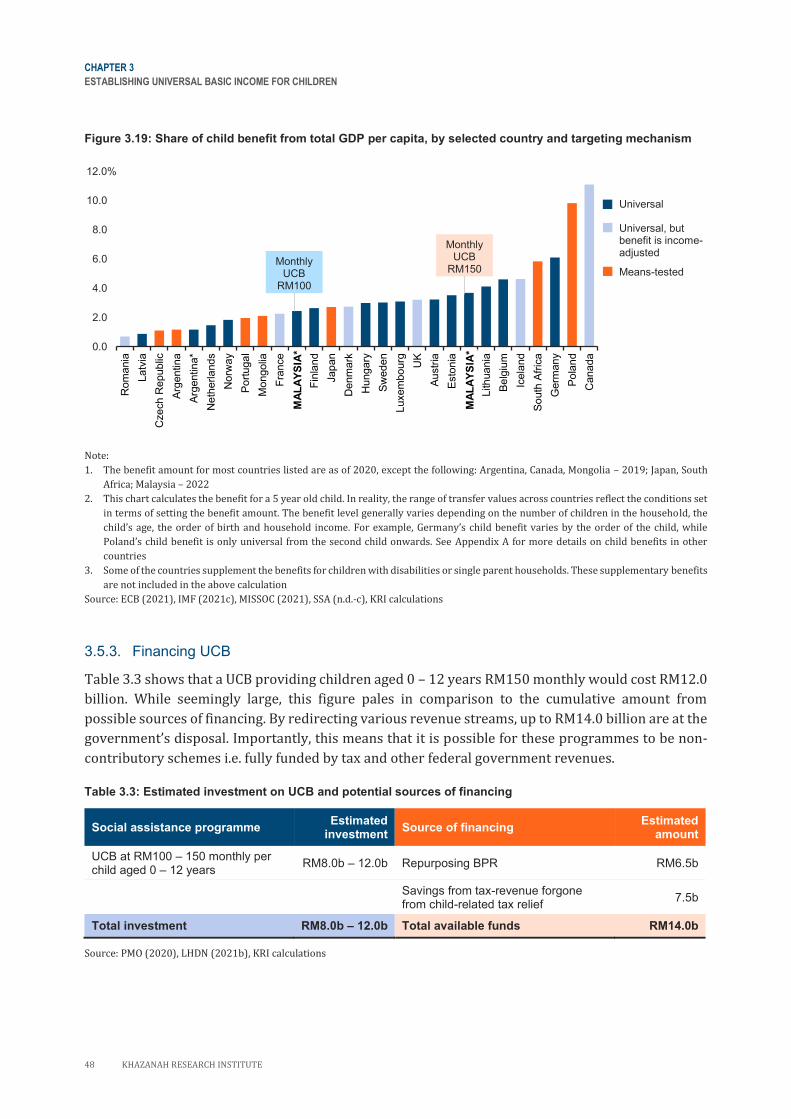
CHAPTER 3
ESTABLISHING UNIVERSAL BASIC INCOME FOR CHILDREN
48 KHAZANAH RESEARCH INSTITUTE
Figure 3.19: Share of child benefit from total GDP per capita, by selected country and targeting mechanism
Note:
1. The benefit amount for most countries listed are as of 2020, except the following: Argentina, Canada, Mongolia – 2019; Japan, South
Africa; Malaysia – 2022
2. This chart calculates the benefit for a 5 year old child. In reality, the range of transfer values across countries reflect the conditions set
in terms of setting the benefit amount. The benefit level generally varies depending on the number of children in the household, the
child’s age, the order of birth and household income. For example, Germany’s child benefit varies by the order of the child, while
Poland’s child benefit is only universal from the second child onwards. See Appendix A for more details on child benefits in other
countries
3. Some of the countries supplement the benefits for children with disabilities or single parent households. These supplementary benefits
are not included in the above calculation
Source: ECB (2021), IMF (2021c), MISSOC (2021), SSA (n.d.-c), KRI calculations
3.5.3. Financing UCB
Table 3.3 shows that a UCB providing children aged 0 – 12 years RM150 monthly would cost RM12.0
billion. While seemingly large, this figure pales in comparison to the cumulative amount from
possible sources of financing. By redirecting various revenue streams, up to RM14.0 billion are at the
government’s disposal. Importantly, this means that it is possible for these programmes to be non-
contributory schemes i.e. fully funded by tax and other federal government revenues.
Table 3.3: Estimated investment on UCB and potential sources of financing
Social assistance programme Estimated
investment Source of financing
Estimated amount
UCB at RM100 – 150 monthly per child aged 0 – 12 years
RM8.0b – 12.0b Repurposing BPR RM6.5b
Savings from tax-revenue forgone from child-related tax relief
7.5b
Total investment RM8.0b – 12.0b Total available funds RM14.0b
Source: PMO (2020), LHDN (2021b), KRI calculations
0.0
2.0
4.0
6.0
8.0
10.0
12.0
Rom
ania
Latv
ia
Cze
ch R
epublic
Arg
entin
a
Arg
entin
a*
Neth
erla
nds
Norw
ay
Po
rtuga
l
Mo
ngolia
Fra
nce
MA
LA
YS
IA*
Fin
lan
d
Jap
an
Denm
ark
Hungary
Sw
eden
Luxem
bourg
UK
Au
str
ia
Esto
nia
MA
LA
YS
IA*
Lith
uania
Be
lgiu
m
Icela
nd
So
uth
Afr
ica
Germ
any
Po
lan
d
Canada
12.0%
MonthlyUCB
RM100
MonthlyUCB
RM150
Universal
Universal, butbenefit is income-adjusted
Means-tested
MA
LA
YS
IA*
MA
LA
YS
IA*

CHAPTER 3
ESTABLISHING UNIVERSAL BASIC INCOME FOR CHILDREN
KHAZANAH RESEARCH INSTITUTE 49
There are two feasible measures that can be put in place to implement the proposed UCB in a fiscally-
neutral manner during the first year, namely repurposing the BPR and redirecting savings from the
tax revenue forgone from child-related tax relief, as discussed further below.
1. Repurposing BPR
The UCB can be partly funded by redesigning the BPR programme to target children instead of the
B40 households and single individuals. Currently, the general objective of BPR is to alleviate cost of
living issues for B40 households but this target is not as tangible and harder to measure due to the
changing challenges faced by households112. By repurposing BPR into a UCB, the programme
explicitly contributes to income security of families for the well-being of children. In Budget 2021,
RM6.5 billion was allocated to BPR113.
There are bound to be “losers” from shifting the target group of BPR from B40 households to children.
To a large extent, the exclusion of single individuals and working-age households without children in
the B40 group and their social protection needs will be addressed in Chapter 4. The protection of
elder households in the B40 is of particular concern. 2019 statistics indicate that among households
without children and headed by those aged 65 years and above, 72.7% were in B40114. This group of
older adults would stand to lose out with the repurposing of BPR to target children. Since the old-age
income security benefit proposed in Chapter 5 will only come to fruition long in the future, we
recommend expanding the coverage of Bantuan Warga Emas—a KPWKM programme which
provides RM500 monthly to persons aged 60 and above living below the PLI—as an interim solution.
2. Savings from tax-revenue forgone under child-related tax relief
In 2019, RM7.5 billion tax revenue was forgone from child-related tax reliefs, namely reliefs for child
dependents, expenses on breastfeeding equipment, childcare fees to registered childcare centres or
kindergartens and net deposit in SSPN. Instead of providing tax savings, this amount could contribute
to the proposed UCB115.
Based on data on tax revenue forgone from child-related tax relief in 2019, a few key takeaways can
be made on child-related tax reliefs. Firstly, Malaysia already has child benefits embedded in the
taxation system in some form, whereby individual taxpayers with children could claim child-related
tax reliefs yearly as a refund. From the government’s perspective, this amount becomes a “cost” in
the form of tax revenue forgone.
Secondly, the amount of tax relief increases as we move up income groups. For 2019 assessments of
those with chargeable income between RM5,000 and RM20,000, about RM4,640 or a little below
RM400 in monthly term was refunded. For assessments of those earning at least RM2.0 million, about
RM7,534 or more than RM600 in monthly term on average was refunded116 . The higher reliefs among
higher income groups may reflect the positive correlation between number of children and family
income and/or the groups’ higher purchasing power to gain from the reliefs.
112 BR1M was introduced in 2012 to soften the effects of fuel subsidy rationalisation and later, the introduction of the goods and services
tax (GST) in 2015. Since then, cost of living challenges have changed e.g. fuel prices have plummeted, GST has been replaced by the sales
and services tax (SST) and the Covid-19 pandemic introduced new problems. Source: World Bank (2020b) 113 PMO (2020) 114 DOS (2021b) 115 LHDN (2021b) 116 LHDN (2021b)
CHAPTER 3
ESTABLISHING UNIVERSAL BASIC INCOME FOR CHILDREN
50 KHAZANAH RESEARCH INSTITUTE
This again underscores the exclusion of families in the middle-income groups who may not earn
enough to be in the tax system or have enough purchasing power to fully utilise the reliefs.
3.6 Concluding Remarks
This proposal comes at a dire, yet opportune time when the Covid-19 pandemic is creating significant
and unprecedented challenges for Malaysia. Hitherto, Malaysia has taken reactionary measures to
mitigate the impact of the Covid-19 crisis on families. While commendable and most likely beneficial
to those who are included, these measures fail to resolve long-standing issues, including exclusion of
those in need. As the pandemic rages on and more people have been falling into poverty, this problem
has worsened. Thus, there is a need for longer term and wide-reaching support to avoid deterioration
of children’s well-being.
These issues need to be proactively addressed and a UCB presents a tried and tested policy which
has been adopted in a number of countries. Through the UCB, Malaysia can begin to fill the stark gaps
highlighted during the Covid-19 outbreak, mitigate the impacts of the crisis on children and establish
child-focused social protection mechanisms, in line with Malaysia’s commitment to creating a
comprehensive, life cycle-based social protection system.
The UCB scheme is vital to the proposals in this report as it serves as an entry point into the social
protection system since birth, registering all children in a National Social Protection Registry
proposed in Chapter 6. In doing so, providing protection at each stage of everyone’s life can be made
possible. Not only that, it also facilitates assistance to adults as it can be tied to other proposed
schemes such as the maternity grant proposed in Chapter 4 as an income protection for women
following childbirth.
Implementing a UCB will be a step in the right direction to establish a social protection floor for
children but it is by no means a panacea for all risks present during childhood. While there are
benefits of providing cash to families, some childhood risks can only be addressed through different
forms of intervention namely in-kind benefits, social services and public campaigns. For example,
household food insecurity because of financial constraints may be solved through cash benefit but
without complementary interventions to educate households on eating healthily, it may result in
households purchasing low-quality food that costs less. The implementation of a UCB should be
followed by complementary policies on important areas such as school feeding programme and early
childhood care and education to holistically ensure children’s well-being.
Moreover, better indicators including routine reporting on child poverty and multidimensional
poverty measures must be tracked to better understand children’s well-being and its developments.
We believe that only after creating a social protection floor and having more information can refined,
targeted measures be taken to supplement the UCB.
This chapter has shown that implementing UCB in Malaysia is within the current policy and fiscal
space. What remains is the political will and courage of the powers that be to ensure no children is
left behind.
KHAZANAH RESEARCH INSTITUTE 51
CHAPTER
04
EXPANDING SOCIAL SECURITY TO ALL
WORKING-AGE INDIVIDUALS 52
4.1 Introduction 52
4.2 Overview of the Working-age
Population 53
4.3 Risks Faced by the Working-age
Population 56
4.4 Social Protection Policies and
Coverage Gaps in Malaysia 61
4.4.1 The state of social protection for
working-age population in
Malaysia 62
4.4.2 Coverage gaps in social insurance
for the working-age population 67
4.4.3 Other challenges in social
protection policies for the
working-age population 70
4.5 Policy Recommendation: Towards
Inclusive Social Security for the
Working-age Population 75
4.5.1 Extending the reach of social
security schemes 76
4.5.2 Government as the third pillar in
social security ecosystem 79
4.6 Concluding Remarks 87
52 KHAZANAH RESEARCH INSTITUTE
CHAPTER 4
EXPANDING SOCIAL SECURITY TO ALL WORKING-AGE INDIVIDUALS
We need a new model of social protection. Let us accept that jobs are not the magic solution—and that
in a globalised market, job guarantees are a false promise. Let us accept flexible labour, too. But in
return, let us have a society in which everybody has a right to basic security and a more equal access to
other insurance-based schemes.
Guy Standing (2013)117
4.1 Introduction
The working age constitutes more than half of one’s life. Work is a significant part of it, not only as a
way to earn a living, but also to give one a sense of purpose and identity. Good and fulfilling work is
essential for individual and societal well-being. In their working life, people aspire to have the
opportunity for productive work that is compensated fairly, security at their workplace, social
protection for them and their families, prospects for personal development as well as social
integration, freedom to express their concerns, organise and participate in decisions that affect their
lives, and enjoy equal opportunity and treatment regardless of their gender118 This encapsulates the
concept of decent work advanced by the ILO, with social protection being an important element in
ensuring acceptable living standard and driving inclusive and sustainable growth. While earnings
through labour market activities are an important source of income security during the working age,
social protection plays a complementary role to smooth income and hence consumption, and provide
income protection that prevents people from falling below poverty and promotes individual’s
capabilities.
In the context of the provision of social protection, this chapter illustrates differences in access to
social security among the working-age population by employment status. Some people also face
higher risks and limited social protection because of the changing nature of work relationships, in
response to changes in labour demand and technology.
This chapter starts with an overview of the working-age population and major risks they face during
their working life which subsequently contribute to income insecurity. It then looks at existing social
security schemes in Malaysia, as well as the gaps in these schemes. Given the issues identified, this
chapter will propose several policy recommendations to expand social security schemes to all
working-age individuals in the country.
117 Cited in The Guardian (2013) 118 ILO (n.d.-a)
CHAPTER 4
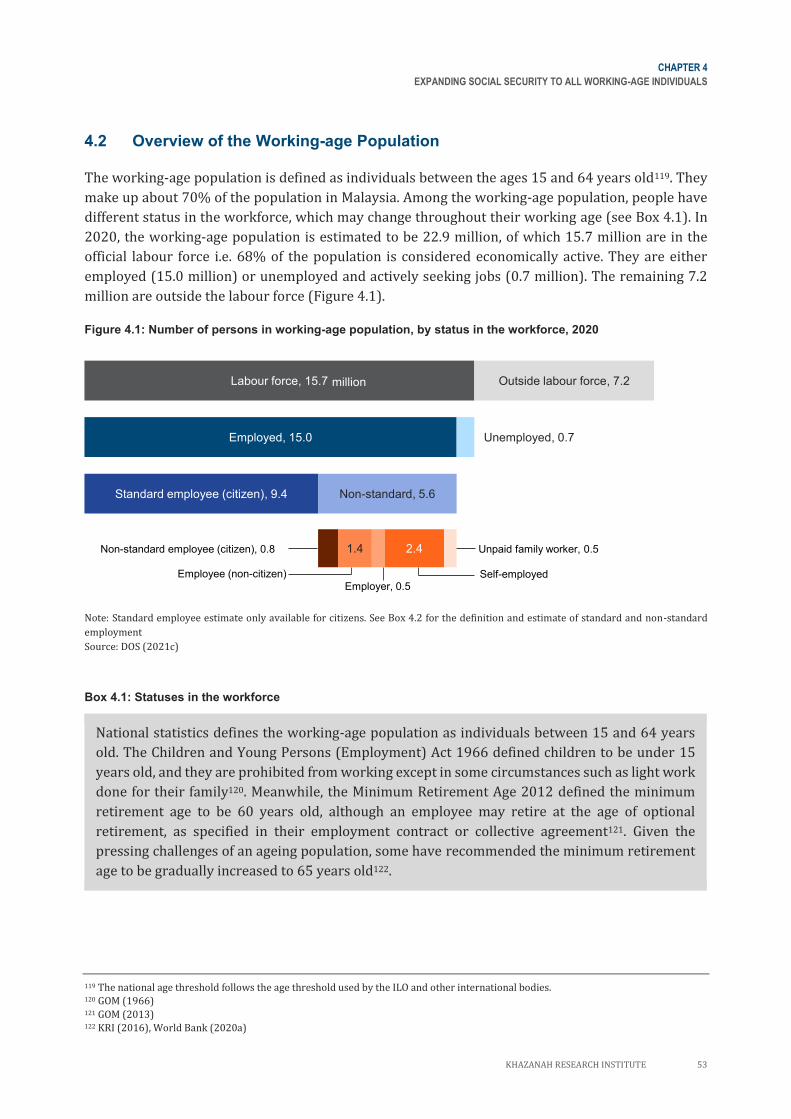
CHAPTER 4
EXPANDING SOCIAL SECURITY TO ALL WORKING-AGE INDIVIDUALS
KHAZANAH RESEARCH INSTITUTE 53
4.2 Overview of the Working-age Population
The working-age population is defined as individuals between the ages 15 and 64 years old119. They
make up about 70% of the population in Malaysia. Among the working-age population, people have
different status in the workforce, which may change throughout their working age (see Box 4.1). In
2020, the working-age population is estimated to be 22.9 million, of which 15.7 million are in the
official labour force i.e. 68% of the population is considered economically active. They are either
employed (15.0 million) or unemployed and actively seeking jobs (0.7 million). The remaining 7.2
million are outside the labour force (Figure 4.1).
Figure 4.1: Number of persons in working-age population, by status in the workforce, 2020
Note: Standard employee estimate only available for citizens. See Box 4.2 for the definition and estimate of standard and non-standard
employment
Source: DOS (2021c)
Box 4.1: Statuses in the workforce
National statistics defines the working-age population as individuals between 15 and 64 years
old. The Children and Young Persons (Employment) Act 1966 defined children to be under 15
years old, and they are prohibited from working except in some circumstances such as light work
done for their family120. Meanwhile, the Minimum Retirement Age 2012 defined the minimum
retirement age to be 60 years old, although an employee may retire at the age of optional
retirement, as specified in their employment contract or collective agreement121. Given the
pressing challenges of an ageing population, some have recommended the minimum retirement
age to be gradually increased to 65 years old122.
119 The national age threshold follows the age threshold used by the ILO and other international bodies. 120 GOM (1966) 121 GOM (2013) 122 KRI (2016), World Bank (2020a)
Labour force, 15.7 Outside labour force, 7.2million
Employed, 15.0 Unemployed, 0.7
Standard employee (citizen), 9.4 Non-standard, 5.6
1.4 2.4Non-standard employee (citizen), 0.8
Employee (non-citizen)
Employer, 0.5Self-employed
Unpaid family worker, 0.5
CHAPTER 4
EXPANDING SOCIAL SECURITY TO ALL WORKING-AGE INDIVIDUALS
54 KHAZANAH RESEARCH INSTITUTE
In this chapter, we rely heavily on the employment statistics published by the Department of
Statistics Malaysia (DOS), especially their Labour Force Survey reports. This annual household-
based publication identifies the employment status of the working-age population. In the survey,
respondents were inquired about their economic activity in the seven days preceding their
interview. They are considered to be in the labour force if they are either employed or
unemployed. Employed persons worked for at least an hour for pay, profit or family gain, at any
time in the reference week. A person working more than 30 hours per week are considered to be
in full employment, while less than 30 hours are considered to be in underemployment.
Unemployed persons did not work during the reference week and are considered actively
unemployed if they are available for work and actively looking for jobs.
People who are not classified as either employed or unemployed are considered to be outside the
labour force (2020: 7.2 million). However, they are not necessarily “idle” despite being
economically inactive. In 2020:
• 2.9 million persons were outside the labour force because they are still in school, as the
formal secondary education in Malaysia finishes at 18 years old.
• 3.3 million are not in the workforce due to housework or family responsibilities.
• About 529,200 persons are retired, 264,000 are disabled, 128,400 further their studies,
and around 71,500 persons are not interested to be in the workforce.
Source: Adapted from DOS (2020b), DOS (2021c)
Among employed individuals, they have different employment status, defined based on the nature of
their working relationships. A standard employee refers to a worker whose employment
relationship with an employer is clearly defined. The employment relationship usually does not have
a term limit (open-ended employment duration) and their working hours are regular. They receive a
salary on a predictable interval (e.g. monthly) and have a stable inflow of income. Additionally, they
are required to contribute to, and receive employers’ contribution in the statutory social insurance
schemes managed by SOCSO and in the retirement savings schemes managed by EPF. The schemes
under SOCSO will be discussed in this chapter, while the schemes under the EPF will be discussed in
Chapter 5.
However, employment relationships could also be non-standard, defined as anything that deviates
from the standard employment relationship. Non-standard workers might have an employer, but
unlike standard employees, they are hired on temporary or part-time basis, have non-regular
working hours (on-call), have multiple layers of employer (employment via agency or multi-party).
In some cases, they are dependent self-employed. Non-standard employment features prominently
in digital labour platforms123 . For the purposes of this report, we also include employers, self-
employed and unpaid family workers as non-standard, because they deviate from the definition of
standard employees. The self-employed do not have an employer or hire anyone, while unpaid family
workers typically help with household-based market production. In 2020, there were about 2.4
million individuals who were self-employed and more than half a million unpaid family workers in
the country. Due to data limitation, we could not differentiate standard and non-standard employees
among non-citizens, so all non-citizen employees (estimated to be 1.4 million in 2020) are
conveniently assumed to be non-standard.
123 ILO (n.d.-d)
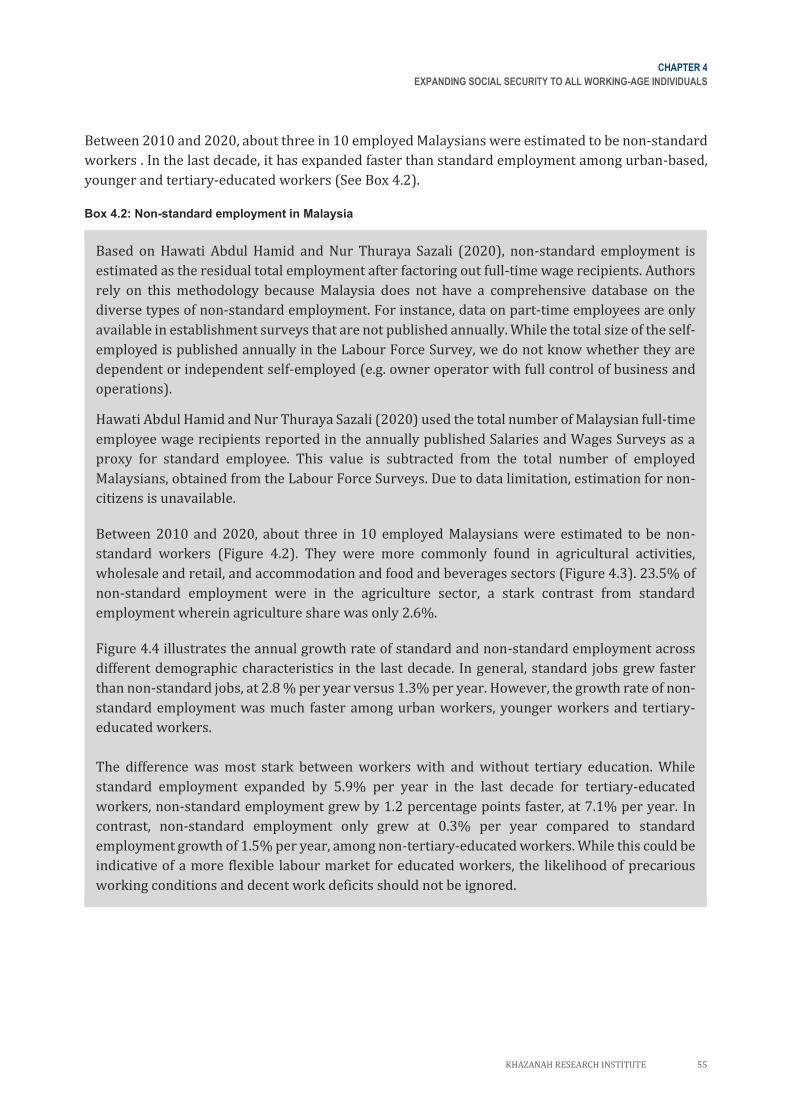
CHAPTER 4
EXPANDING SOCIAL SECURITY TO ALL WORKING-AGE INDIVIDUALS
KHAZANAH RESEARCH INSTITUTE 55
Between 2010 and 2020, about three in 10 employed Malaysians were estimated to be non-standard
workers . In the last decade, it has expanded faster than standard employment among urban-based,
younger and tertiary-educated workers (See Box 4.2).
Box 4.2: Non-standard employment in Malaysia
Based on Hawati Abdul Hamid and Nur Thuraya Sazali (2020), non-standard employment is
estimated as the residual total employment after factoring out full-time wage recipients. Authors
rely on this methodology because Malaysia does not have a comprehensive database on the
diverse types of non-standard employment. For instance, data on part-time employees are only
available in establishment surveys that are not published annually. While the total size of the self-
employed is published annually in the Labour Force Survey, we do not know whether they are
dependent or independent self-employed (e.g. owner operator with full control of business and
operations).
Hawati Abdul Hamid and Nur Thuraya Sazali (2020) used the total number of Malaysian full-time
employee wage recipients reported in the annually published Salaries and Wages Surveys as a
proxy for standard employee. This value is subtracted from the total number of employed
Malaysians, obtained from the Labour Force Surveys. Due to data limitation, estimation for non-
citizens is unavailable.
Between 2010 and 2020, about three in 10 employed Malaysians were estimated to be non-
standard workers (Figure 4.2). They were more commonly found in agricultural activities,
wholesale and retail, and accommodation and food and beverages sectors (Figure 4.3). 23.5% of
non-standard employment were in the agriculture sector, a stark contrast from standard
employment wherein agriculture share was only 2.6%.
Figure 4.4 illustrates the annual growth rate of standard and non-standard employment across
different demographic characteristics in the last decade. In general, standard jobs grew faster
than non-standard jobs, at 2.8 % per year versus 1.3% per year. However, the growth rate of non-
standard employment was much faster among urban workers, younger workers and tertiary-
educated workers.
The difference was most stark between workers with and without tertiary education. While
standard employment expanded by 5.9% per year in the last decade for tertiary-educated
workers, non-standard employment grew by 1.2 percentage points faster, at 7.1% per year. In
contrast, non-standard employment only grew at 0.3% per year compared to standard
employment growth of 1.5% per year, among non-tertiary-educated workers. While this could be
indicative of a more flexible labour market for educated workers, the likelihood of precarious
working conditions and decent work deficits should not be ignored.
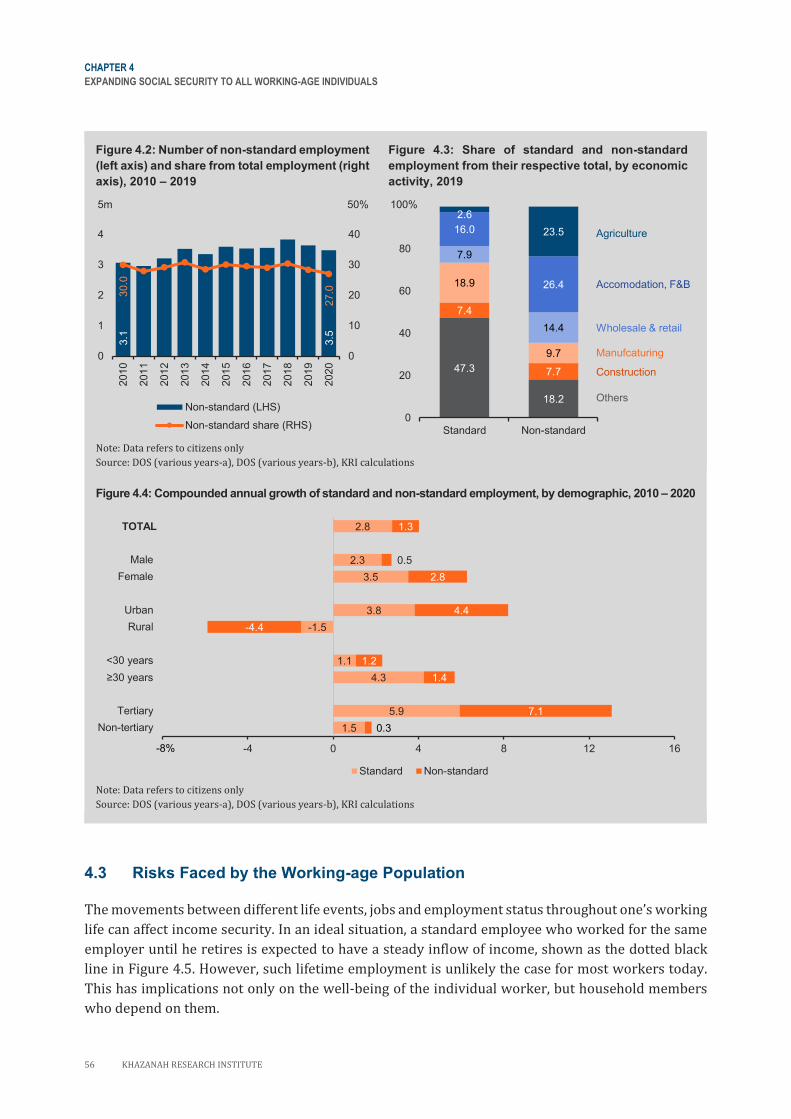
CHAPTER 4
EXPANDING SOCIAL SECURITY TO ALL WORKING-AGE INDIVIDUALS
56 KHAZANAH RESEARCH INSTITUTE
Figure 4.2: Number of non-standard employment
(left axis) and share from total employment (right
axis), 2010 – 2019
Figure 4.3: Share of standard and non-standard
employment from their respective total, by economic
activity, 2019
Note: Data refers to citizens only
Source: DOS (various years-a), DOS (various years-b), KRI calculations
Figure 4.4: Compounded annual growth of standard and non-standard employment, by demographic, 2010 – 2020
Note: Data refers to citizens only
Source: DOS (various years-a), DOS (various years-b), KRI calculations
4.3 Risks Faced by the Working-age Population
The movements between different life events, jobs and employment status throughout one’s working
life can affect income security. In an ideal situation, a standard employee who worked for the same
employer until he retires is expected to have a steady inflow of income, shown as the dotted black
line in Figure 4.5. However, such lifetime employment is unlikely the case for most workers today.
This has implications not only on the well-being of the individual worker, but household members
who depend on them.
3.1
3.5
30.0
27.0
0
10
20
30
40
50
0
1
2
3
4
5
2010
2011
2012
2013
2014
2015
2016
2017
2018
2019
2020
Non-standard (LHS)
Non-standard share (RHS)
5m 50%
47.3
18.2
7.4
7.7
18.9
9.7
7.9
14.4
16.0
26.4
2.6
23.5
0
20
40
60
80
100
Standard Non-standard
100%
Agriculture
Wholesale & retail
Accomodation, F&B
Manufcaturing
Construction
Others
2.8
2.3
3.5
3.8
-1.5
1.1
4.3
5.9
1.5
1.3
0.5
2.8
4.4
-4.4
1.2
1.4
7.1
0.3
-8 -4 0 4 8 12 16
Total
Male
Female
Urban
Rural
<30 years
≥30 years
Tertiary
Non-tertiary
Standard Non-standard
-8%
TOTAL
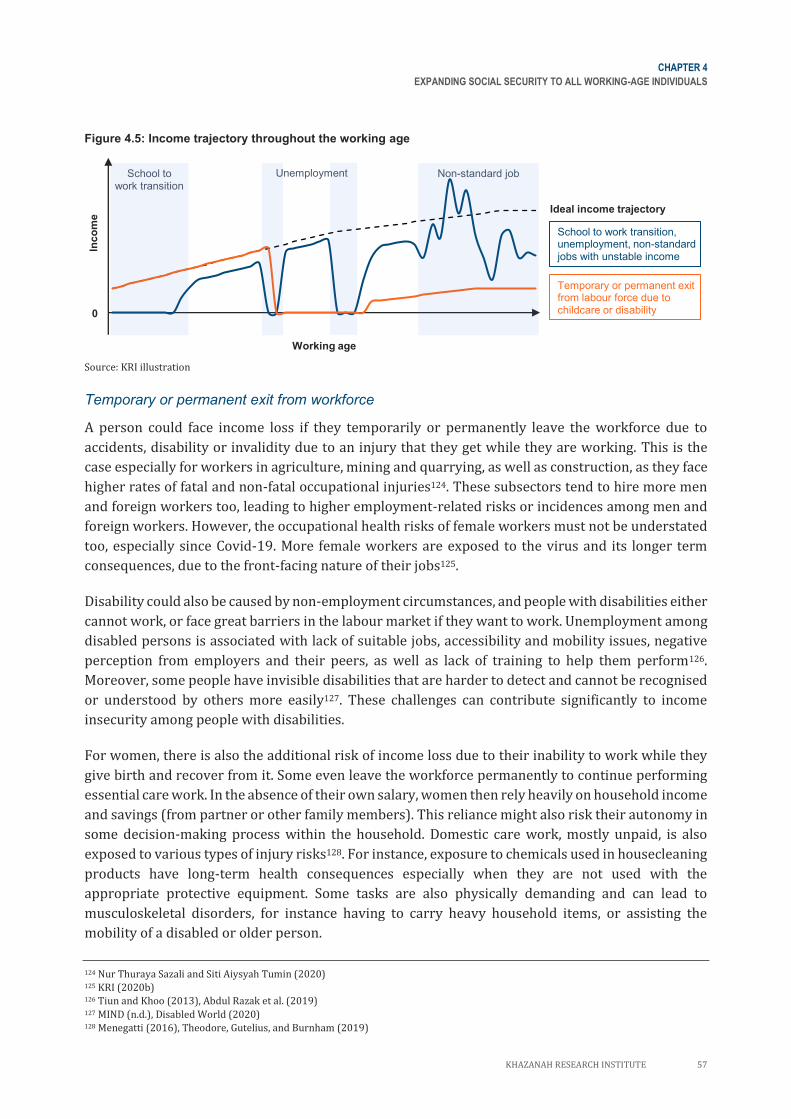
CHAPTER 4
EXPANDING SOCIAL SECURITY TO ALL WORKING-AGE INDIVIDUALS
KHAZANAH RESEARCH INSTITUTE 57
Figure 4.5: Income trajectory throughout the working age
Source: KRI illustration
Temporary or permanent exit from workforce
A person could face income loss if they temporarily or permanently leave the workforce due to
accidents, disability or invalidity due to an injury that they get while they are working. This is the
case especially for workers in agriculture, mining and quarrying, as well as construction, as they face
higher rates of fatal and non-fatal occupational injuries124. These subsectors tend to hire more men
and foreign workers too, leading to higher employment-related risks or incidences among men and
foreign workers. However, the occupational health risks of female workers must not be understated
too, especially since Covid-19. More female workers are exposed to the virus and its longer term
consequences, due to the front-facing nature of their jobs125.
Disability could also be caused by non-employment circumstances, and people with disabilities either
cannot work, or face great barriers in the labour market if they want to work. Unemployment among
disabled persons is associated with lack of suitable jobs, accessibility and mobility issues, negative
perception from employers and their peers, as well as lack of training to help them perform126.
Moreover, some people have invisible disabilities that are harder to detect and cannot be recognised
or understood by others more easily127. These challenges can contribute significantly to income
insecurity among people with disabilities.
For women, there is also the additional risk of income loss due to their inability to work while they
give birth and recover from it. Some even leave the workforce permanently to continue performing
essential care work. In the absence of their own salary, women then rely heavily on household income
and savings (from partner or other family members). This reliance might also risk their autonomy in
some decision-making process within the household. Domestic care work, mostly unpaid, is also
exposed to various types of injury risks128. For instance, exposure to chemicals used in housecleaning
products have long-term health consequences especially when they are not used with the
appropriate protective equipment. Some tasks are also physically demanding and can lead to
musculoskeletal disorders, for instance having to carry heavy household items, or assisting the
mobility of a disabled or older person.
124 Nur Thuraya Sazali and Siti Aiysyah Tumin (2020) 125 KRI (2020b) 126 Tiun and Khoo (2013), Abdul Razak et al. (2019) 127 MIND (n.d.), Disabled World (2020) 128 Menegatti (2016), Theodore, Gutelius, and Burnham (2019)
Inc
om
e
Working age
0
Ideal income trajectory
School to work transition, unemployment, non-standard jobs with unstable income
UnemploymentSchool to work transition
Non-standard job
Temporary or permanent exit from labour force due to childcare or disability
CHAPTER 4
EXPANDING SOCIAL SECURITY TO ALL WORKING-AGE INDIVIDUALS
58 KHAZANAH RESEARCH INSTITUTE
School to work transition and unemployment
Among working individuals, their work situation is not static, and their income trajectory could be
cyclical. At the start of one’s working life, young jobseekers face challenges to transition from school
to work, as evident by higher unemployment rates among youth in the country. In 2020, the
unemployment rate of 15—19-year-olds was 15.2% and the rate for 20—24-year-olds was 11.1%,
both much higher than the national average of 4.5%129. To sustain their lives while looking for work,
young jobseekers rely solely on their family to support their livelihood and job search efforts.
However, most unemployed young workers are likely from low-income households who do not have
high amounts of savings or might not have savings at all. In 2019, close to 60% of unemployed
graduates were found to be from households with income less than RM4,000 per month130.
Unemployment is also not just a youth-centric issue. Some adults face voluntary or involuntary
unemployment, due to factors both within and beyond their control. In the case of voluntary
unemployment, they might be seeking jobs with better income prospects or working conditions. For
involuntary unemployment, people could lose their jobs due to retrenchment, closure of businesses
or structural changes in the economy. Regardless of the circumstance, unemployment leads to loss of
income and people have to rely on their individual or household savings. Unfortunately, savings
among working adults is also not encouraging. In a survey by Bank Negara of Malaysia, almost two
out of 10 Malaysian working adults were unable to save, and most cited cost of living and no surplus
income as their main reasons for not saving enough131.
Non-standard jobs
Some people are also more likely to experience non-standard working relationships, potentially due
to factors such as sudden but temporary increase in demand for certain type of work. Increased hiring
of non-standard workers allow flexibility among employers to manage the short-term nature of the
rise in demand. For example, the Covid-19 pandemic increased the demand for app-based delivery
riders by about 100,000132, and more than 14,500 contract healthcare staff was hired to help manage
this crisis133.
Furthermore, technological advances have led to the development of various digital platforms that
allow workers to work more flexibly in the platform or gig economy, a development that will likely
be a permanent feature of the labour market. Digital workforce could either be online web-based
(tasks performed online by workers, such as freelancers or workers performing microtasks) or
location-based (tasks carried out in-person, enabled by digital platforms, such as taxi drivers or
delivery workers)134. Both lead to income that is more irregular or unstable, and workers can earn
higher or lower than the standard employee, depending on the type of work. A survey of more than
300 e-hailing drivers in Malaysia estimates that the average net income of a full-time driver is
RM2,300 per month135, lower than the Malaysian average employee salary of RM3,224 in the same
year136. However, their earnings can be more volatile compared to standard employees and they are
less likely to earn the same amount of income every month.
129 The unemployment rate in 2020 is higher due to the Covid-19 pandemic. In 2019, national unemployment rate was 3.3%, and remained
to be around 3% on the last decade. However, youth unemployment rate is consistently higher. Source: DOS (2020b), DOS (2021c) 130 MOHE (2020) 131 AKPK (2018) 132 Grab (2020) 133 Based on figure shared PMO (2021) 134 ILO (2021) 135 Goh and Nelleita Omar (2020) 136 DOS (2021f)
CHAPTER 4
EXPANDING SOCIAL SECURITY TO ALL WORKING-AGE INDIVIDUALS
KHAZANAH RESEARCH INSTITUTE 59
The trend of non-standard employment is highlighted as it presents several challenges to achieve the
decent work agenda, most pressingly in the provision of social protection. Employment laws and
regulations, as well as enforcement of social security schemes, are only applicable for standard
employees with clear employer-employee relationships. Introduction or amendments of laws or
regulations and new social security schemes have been introduced to consider new forms of work
relationships in many countries including Malaysia. However, they might ignore the heterogenous
nature of non-standard employment relationships (see Box 4.3).
Different life events, jobs and employment status could result in different state of well-being among
people in the working-age population. This chapter will focus on the core life cycle risks of the
working-age population which lead to income loss and risk the individual to fall below the poverty
line: (1) employment-related injuries or invalidity; (2) unemployment; and (3) childbirth. To guide
our discussions, we rely on the minimum and higher standards specified by the relevant conventions
and recommendations of the ILO, summarised in Appendix B.
In this report, we focus on increasing the coverage of social security in the working-age population,
such that they are provided basic income security when they experience a drastic economic shock i.e.
total income loss. However, we recognise other challenges in the working-age population that might
limit the effectiveness of social security. For example, low wage levels, which determines
contribution and benefit levels, might not provide adequate protection for the affected insured
persons. Lack of adequate care policies also exacerbate the vulnerability of unpaid carers in the
country. While important, these issues are beyond the scope of this report. Formulation and reforms
of other complementary policies, such as active labour market policies, health policies and care
policies are essential to provide an effective social protection floor137.
Box 4.3: Heterogeneity of work relationships
Many social protection initiatives for non-standard employment, especially the self-employed
workers, assume that they are fully responsible for contributing to their own social insurance
schemes, in the absence of an employer. However, this ignores the heterogenous nature of work
relationship and whether the self-employed are truly independent and therefore should solely
be responsible for their own social security.
Identifying the nature of work relationships has been the core of identifying whether self-
employed individuals on digital platforms are truly independent. France, Spain and the
Netherlands138 argue self-employed individuals on gig platforms are in fact employees, and
platform companies were required to fund the social security contributions for these workers.
The United Kingdom (UK) argued that e-hailing drivers are not independent contractors, but
workers who are entitled to several employment rights139.
137 For discussion on active labour market policies, see Siti Aiysyah Tumin (forthcoming); health policies see KRI (2020a) and Nazihah
Muhamad Noor (forthcoming); care policies, see KRI (2019) 138 As cited by Goh and Nelleita Omar (2021) 139 CNBC (2021)

CHAPTER 4
EXPANDING SOCIAL SECURITY TO ALL WORKING-AGE INDIVIDUALS
60 KHAZANAH RESEARCH INSTITUTE
On the other hand, in the United States, the California assembly Bill 5 initially granted gig workers
the rights of employees, but this has since been reversed by the Proposition 22, meaning that
platforms do not have to provide entitlements such as minimum wages, paid sick days and
unemployment insurance for gig workers on their platform140. Similarly, in Australia, the Fair
Work Ombudsman also found that Uber drivers are independent contractors and not
employees141.
Goh and Nelleita (2021) based on Roll (2020), used a “dependence” and “control” framework to
determine the extent of dependence (or lack thereof) among gig workers—e-hailing drivers and
delivery riders, could be classified as “dependent contractor” or “employee”, while freelance
writers, graphic artists and programmers could be classified as “independent contractor” or
“dependent contractor”142.
In the 20th International Conference of Labour Statistician 2018, the ILO used both the type of
“authority” and type of “economic risk” to define work relationships. Authority identifies whether
workers are independent workers or dependent workers. In the case of the former, they have
control on how they work, while the latter is generally supervised by an authoritative figure.
Economic risk identifies whether workers are exposed to financial gain or loss, and whether their
remuneration is for profit or for pay. The former implies that they would be more exposed to
economic shocks and irregular income, while the latter implies that they would be more insulated
from economic shock and receive stable income (Figure 4.6). This framework includes the
classification of all employed individuals and not just the “gig workers”.
Figure 4.6: Classification of workers based on authority and economic risk
Source: KRI illustration adapted from ILO (2018b)
140 The Guardian (2021), The Guardian (2020) 141 ABC News (2021) 142 Goh and Nelleita Omar (2021), Roll (2020)
For profit
Independent
Dependent
For pay
Economic risk
Authority
Higher exposure to financial loss & irregular remuneration
Higher degree of independence
Employers in household market
enterprise
Own-account in household market
enterprises
Dependent contractors
Contributing family members
Apprentices, trainees,
interns
Short-term/casual employees
Fixed-term employees
Full-time employees
Owner-operator of
corporations (without
employee)
Employer in corporation
CHAPTER 4
EXPANDING SOCIAL SECURITY TO ALL WORKING-AGE INDIVIDUALS
KHAZANAH RESEARCH INSTITUTE 61
Currently, international and national employment statistics only defines four types of
employment status to capture different work relationships: employer, employee, own account
worker (self-employed) and unpaid family worker. Given more complex employment
relationships, international classification is currently developing new employment status, as
defined by their authority and economic risks. For example, the self-employed could be further
categorised into three types: owner-operator of corporation (e.g. sole proprietors or partners in
a private limited companies), own-account in household market enterprisers (e.g. smallholder
farmers) and dependent contractor (e.g. drivers of e-hailing platform).
However, clear categorisation of workers for statistical purposes is necessary but not a sufficient
condition to guarantee effective protection for the self-employed, both legally and in practice.
Much of employment relationship is still defined based on the employer-employee framework in
Malaysia. The proposed amendment of the Employment Act 1955 (which started in 2018)
included some provisions to allow for a more nuanced take on how work relationships are
defined. However, in August 2020, the government noted that it will not amend the act to adapt
to jobs in the gig economy, but instead establish specific legislations for the gig economy143.
4.4 Social Protection Policies and Coverage Gaps in Malaysia
Unlike children or older adults, the working-age population has the advantage of being economically
active and has the ability to contribute to their own social security. This is the case for close to two-
thirds of the population who are working.
Malaysia relies on employees and their employers to manage the life cycle risks faced by working
individuals, through various social insurance schemes that provides income protection in the event
of employment-related injury, invalidity and employment loss. The issues of effective and legal
coverage gaps of these social insurance schemes are discussed in this section.
There is also social assistance for selected groups in the population. For example, there is universal
disability benefits provided by JKM for disabled persons, regardless of their economic activity status.
This is an essential social protection floor for disabled persons in the country, although it is not
without limitations. Certain occupations, such as farmers and fishermen also receive income
assistance, although the amount is small. Some assistance is also available for some women, but
specific to their status as a parent (e.g. single mother). In view of the limited reach of some social
assistance programmes, the expansion of social insurance schemes is key towards providing an
inclusive social protection floor for the population.
143 Malay Mail (2020)
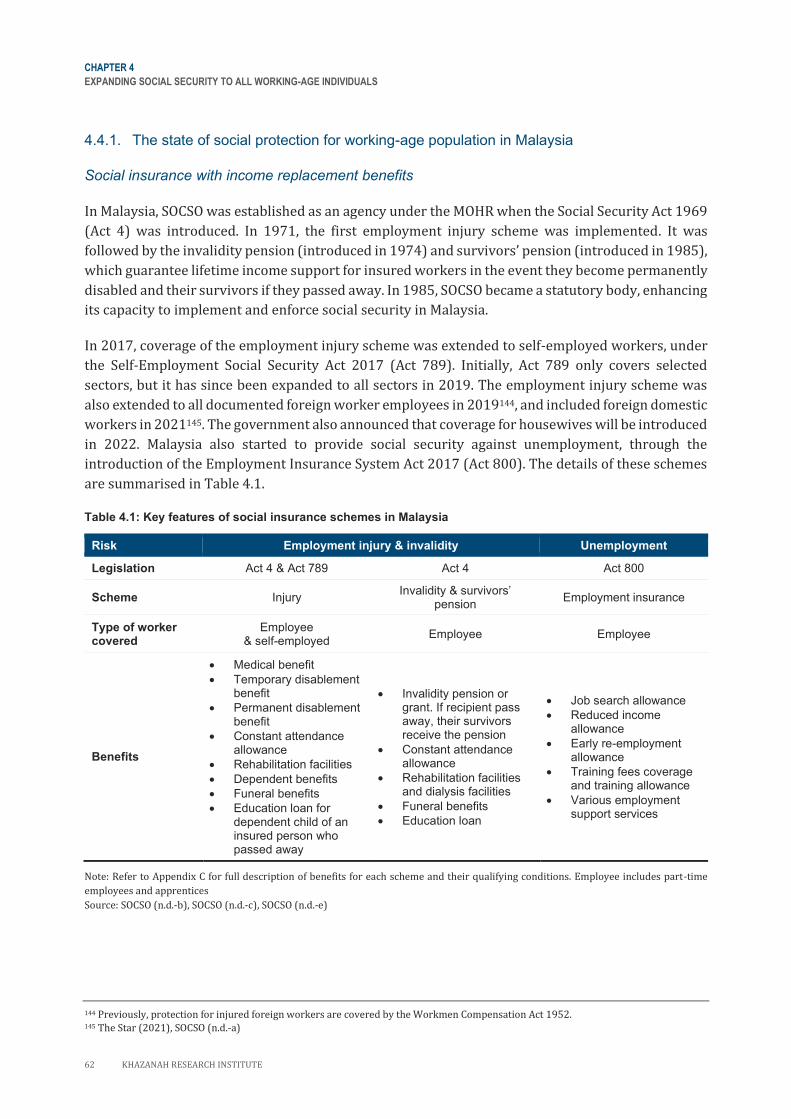
CHAPTER 4
EXPANDING SOCIAL SECURITY TO ALL WORKING-AGE INDIVIDUALS
62 KHAZANAH RESEARCH INSTITUTE
4.4.1. The state of social protection for working-age population in Malaysia
Social insurance with income replacement benefits
In Malaysia, SOCSO was established as an agency under the MOHR when the Social Security Act 1969
(Act 4) was introduced. In 1971, the first employment injury scheme was implemented. It was
followed by the invalidity pension (introduced in 1974) and survivors’ pension (introduced in 1985),
which guarantee lifetime income support for insured workers in the event they become permanently
disabled and their survivors if they passed away. In 1985, SOCSO became a statutory body, enhancing
its capacity to implement and enforce social security in Malaysia.
In 2017, coverage of the employment injury scheme was extended to self-employed workers, under
the Self-Employment Social Security Act 2017 (Act 789). Initially, Act 789 only covers selected
sectors, but it has since been expanded to all sectors in 2019. The employment injury scheme was
also extended to all documented foreign worker employees in 2019144, and included foreign domestic
workers in 2021145. The government also announced that coverage for housewives will be introduced
in 2022. Malaysia also started to provide social security against unemployment, through the
introduction of the Employment Insurance System Act 2017 (Act 800). The details of these schemes
are summarised in Table 4.1.
Table 4.1: Key features of social insurance schemes in Malaysia
Risk Employment injury & invalidity Unemployment
Legislation Act 4 & Act 789 Act 4 Act 800
Scheme Injury Invalidity & survivors’
pension Employment insurance
Type of worker covered
Employee & self-employed
Employee Employee
Benefits
• Medical benefit
• Temporary disablement benefit
• Permanent disablement benefit
• Constant attendance allowance
• Rehabilitation facilities
• Dependent benefits
• Funeral benefits
• Education loan for dependent child of an insured person who passed away
• Invalidity pension or grant. If recipient pass away, their survivors receive the pension
• Constant attendance allowance
• Rehabilitation facilities and dialysis facilities
• Funeral benefits
• Education loan
• Job search allowance
• Reduced income allowance
• Early re-employment allowance
• Training fees coverage and training allowance
• Various employment support services
Note: Refer to Appendix C for full description of benefits for each scheme and their qualifying conditions. Employee includes part-time
employees and apprentices
Source: SOCSO (n.d.-b), SOCSO (n.d.-c), SOCSO (n.d.-e)
144 Previously, protection for injured foreign workers are covered by the Workmen Compensation Act 1952. 145 The Star (2021), SOCSO (n.d.-a)
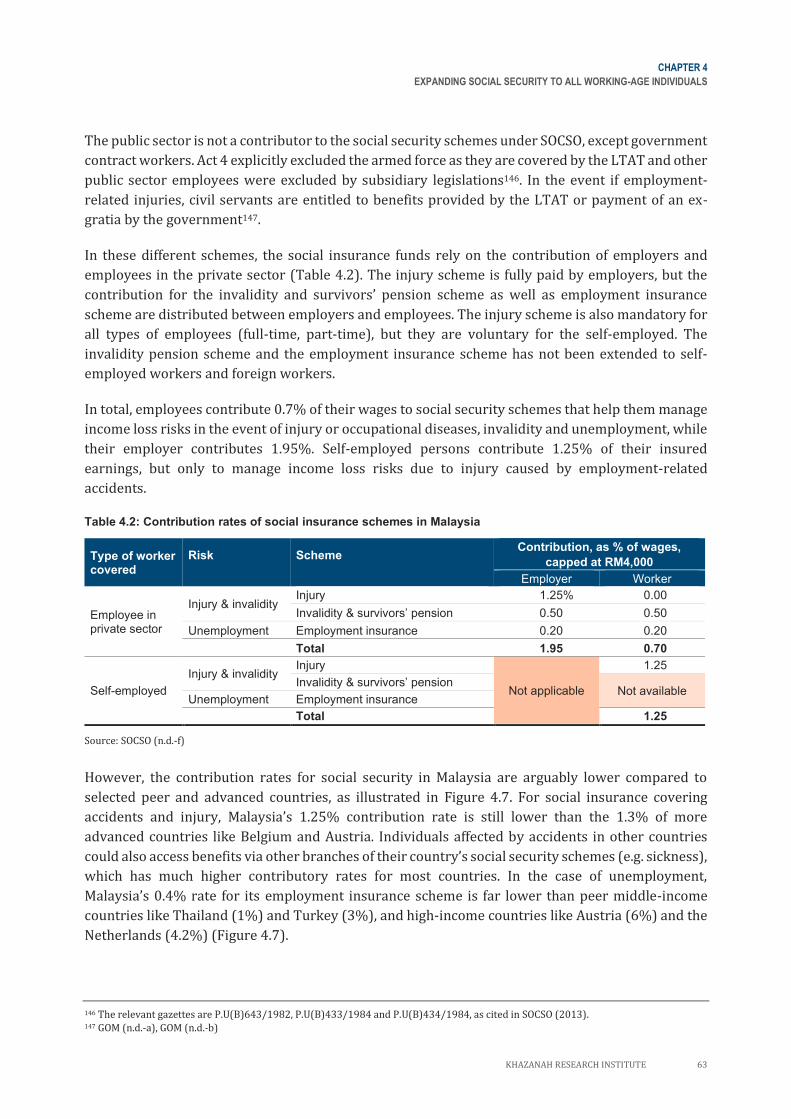
CHAPTER 4
EXPANDING SOCIAL SECURITY TO ALL WORKING-AGE INDIVIDUALS
KHAZANAH RESEARCH INSTITUTE 63
The public sector is not a contributor to the social security schemes under SOCSO, except government
contract workers. Act 4 explicitly excluded the armed force as they are covered by the LTAT and other
public sector employees were excluded by subsidiary legislations146. In the event if employment-
related injuries, civil servants are entitled to benefits provided by the LTAT or payment of an ex-
gratia by the government147.
In these different schemes, the social insurance funds rely on the contribution of employers and
employees in the private sector (Table 4.2). The injury scheme is fully paid by employers, but the
contribution for the invalidity and survivors’ pension scheme as well as employment insurance
scheme are distributed between employers and employees. The injury scheme is also mandatory for
all types of employees (full-time, part-time), but they are voluntary for the self-employed. The
invalidity pension scheme and the employment insurance scheme has not been extended to self-
employed workers and foreign workers.
In total, employees contribute 0.7% of their wages to social security schemes that help them manage
income loss risks in the event of injury or occupational diseases, invalidity and unemployment, while
their employer contributes 1.95%. Self-employed persons contribute 1.25% of their insured
earnings, but only to manage income loss risks due to injury caused by employment-related
accidents.
Table 4.2: Contribution rates of social insurance schemes in Malaysia
Type of worker covered
Risk
Scheme
Contribution, as % of wages,
capped at RM4,000
Employer Worker
Employee in private sector
Injury & invalidity Injury 1.25% 0.00
Invalidity & survivors’ pension 0.50 0.50
Unemployment Employment insurance 0.20 0.20
Total 1.95 0.70
Self-employed
Injury & invalidity Injury
Not applicable
1.25
Invalidity & survivors’ pension Not available
Unemployment Employment insurance
Total 1.25
Source: SOCSO (n.d.-f)
However, the contribution rates for social security in Malaysia are arguably lower compared to
selected peer and advanced countries, as illustrated in Figure 4.7. For social insurance covering
accidents and injury, Malaysia’s 1.25% contribution rate is still lower than the 1.3% of more
advanced countries like Belgium and Austria. Individuals affected by accidents in other countries
could also access benefits via other branches of their country’s social security schemes (e.g. sickness),
which has much higher contributory rates for most countries. In the case of unemployment,
Malaysia’s 0.4% rate for its employment insurance scheme is far lower than peer middle-income
countries like Thailand (1%) and Turkey (3%), and high-income countries like Austria (6%) and the
Netherlands (4.2%) (Figure 4.7).
146 The relevant gazettes are P.U(B)643/1982, P.U(B)433/1984 and P.U(B)434/1984, as cited in SOCSO (2013). 147 GOM (n.d.-a), GOM (n.d.-b)
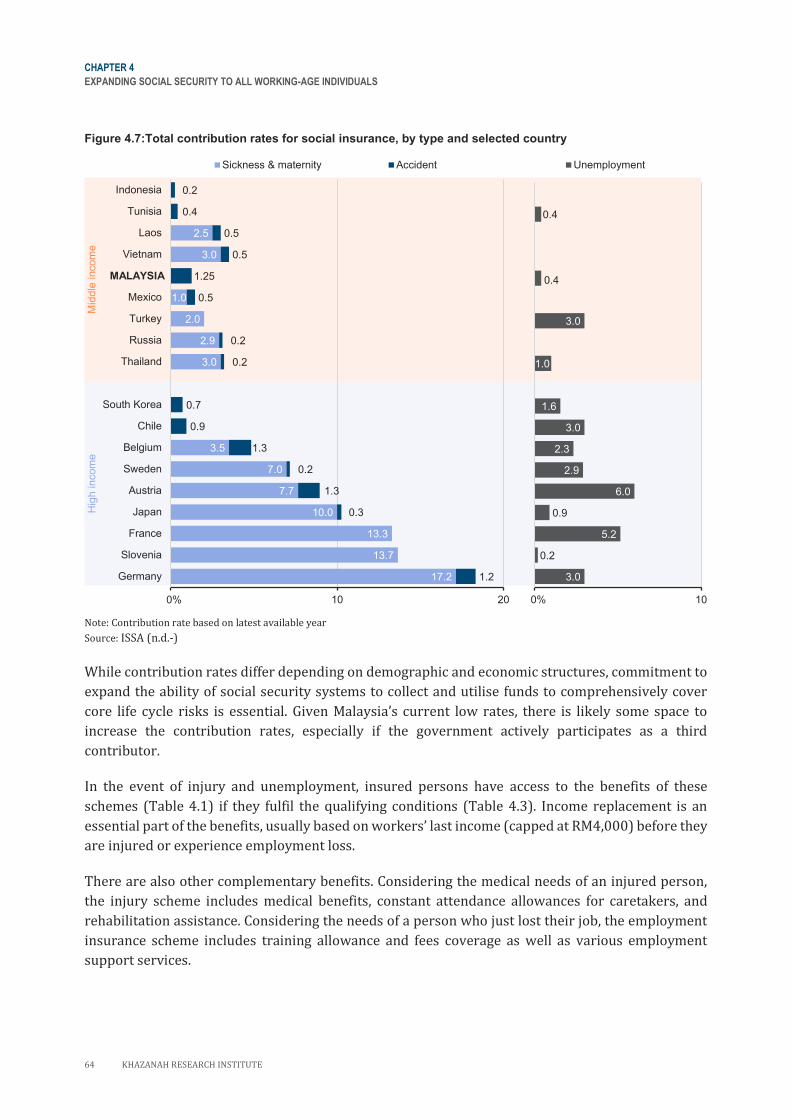
CHAPTER 4
EXPANDING SOCIAL SECURITY TO ALL WORKING-AGE INDIVIDUALS
64 KHAZANAH RESEARCH INSTITUTE
Figure 4.7:Total contribution rates for social insurance, by type and selected country
Note: Contribution rate based on latest available year
Source: ISSA (n.d.-)
While contribution rates differ depending on demographic and economic structures, commitment to
expand the ability of social security systems to collect and utilise funds to comprehensively cover
core life cycle risks is essential. Given Malaysia’s current low rates, there is likely some space to
increase the contribution rates, especially if the government actively participates as a third
contributor.
In the event of injury and unemployment, insured persons have access to the benefits of these
schemes (Table 4.1) if they fulfil the qualifying conditions (Table 4.3). Income replacement is an
essential part of the benefits, usually based on workers’ last income (capped at RM4,000) before they
are injured or experience employment loss.
There are also other complementary benefits. Considering the medical needs of an injured person,
the injury scheme includes medical benefits, constant attendance allowances for caretakers, and
rehabilitation assistance. Considering the needs of a person who just lost their job, the employment
insurance scheme includes training allowance and fees coverage as well as various employment
support services.
17.2
13.7
13.3
10.0
7.7
7.0
3.5
3.0
2.9
2.0
1.0
3.0
2.5
1.2
0.3
1.3
0.2
1.3
0.9
0.7
0.2
0.2
0.5
1.25
0.5
0.5
0.4
0.2
0 10 20
Germany
Slovenia
France
Japan
Austria
Sweden
Belgium
Chile
South Korea
Thailand
Russia
Turkey
Mexico
Malaysia
Vietnam
Laos
Tunisia
Indonesia
MALAYSIA
0%
3.0
0.2
5.2
0.9
6.0
2.9
2.3
3.0
1.6
1.0
3.0
0.4
0.4
0 100%
0 10 20Sickness & maternity Accident 0 10Unemployment
Mid
dle
incom
e
Hig
h in
com
e
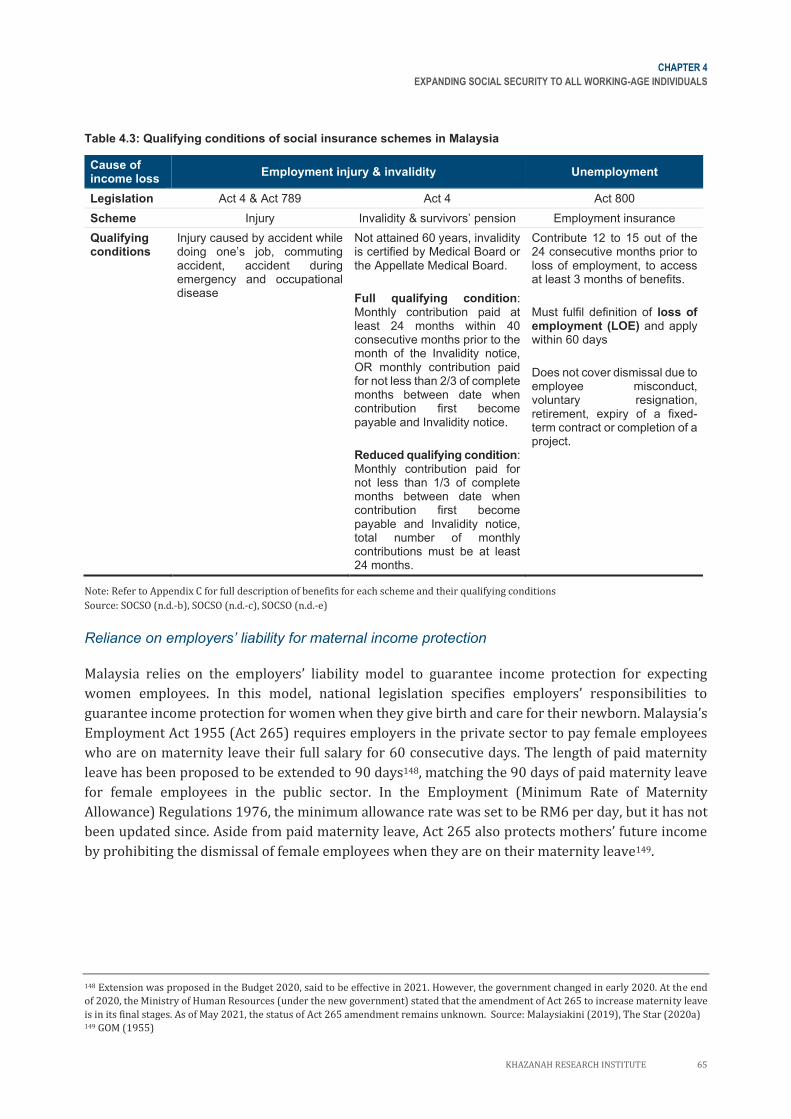
CHAPTER 4
EXPANDING SOCIAL SECURITY TO ALL WORKING-AGE INDIVIDUALS
KHAZANAH RESEARCH INSTITUTE 65
Table 4.3: Qualifying conditions of social insurance schemes in Malaysia
Cause of income loss
Employment injury & invalidity Unemployment
Legislation Act 4 & Act 789 Act 4 Act 800
Scheme Injury Invalidity & survivors’ pension Employment insurance
Qualifying conditions
Injury caused by accident while doing one’s job, commuting accident, accident during emergency and occupational disease
Not attained 60 years, invalidity is certified by Medical Board or the Appellate Medical Board.
Full qualifying condition: Monthly contribution paid at least 24 months within 40 consecutive months prior to the month of the Invalidity notice, OR monthly contribution paid for not less than 2/3 of complete months between date when contribution first become payable and Invalidity notice.
Reduced qualifying condition: Monthly contribution paid for not less than 1/3 of complete months between date when contribution first become payable and Invalidity notice, total number of monthly contributions must be at least 24 months.
Contribute 12 to 15 out of the 24 consecutive months prior to loss of employment, to access at least 3 months of benefits.
Must fulfil definition of loss of employment (LOE) and apply within 60 days
Does not cover dismissal due to employee misconduct, voluntary resignation, retirement, expiry of a fixed-term contract or completion of a project.
Note: Refer to Appendix C for full description of benefits for each scheme and their qualifying conditions
Source: SOCSO (n.d.-b), SOCSO (n.d.-c), SOCSO (n.d.-e)
Reliance on employers’ liability for maternal income protection
Malaysia relies on the employers’ liability model to guarantee income protection for expecting
women employees. In this model, national legislation specifies employers’ responsibilities to
guarantee income protection for women when they give birth and care for their newborn. Malaysia’s
Employment Act 1955 (Act 265) requires employers in the private sector to pay female employees
who are on maternity leave their full salary for 60 consecutive days. The length of paid maternity
leave has been proposed to be extended to 90 days148, matching the 90 days of paid maternity leave
for female employees in the public sector. In the Employment (Minimum Rate of Maternity
Allowance) Regulations 1976, the minimum allowance rate was set to be RM6 per day, but it has not
been updated since. Aside from paid maternity leave, Act 265 also protects mothers’ future income
by prohibiting the dismissal of female employees when they are on their maternity leave149.
148 Extension was proposed in the Budget 2020, said to be effective in 2021. However, the government changed in early 2020. At the end
of 2020, the Ministry of Human Resources (under the new government) stated that the amendment of Act 265 to increase maternity leave
is in its final stages. As of May 2021, the status of Act 265 amendment remains unknown. Source: Malaysiakini (2019), The Star (2020a) 149 GOM (1955)
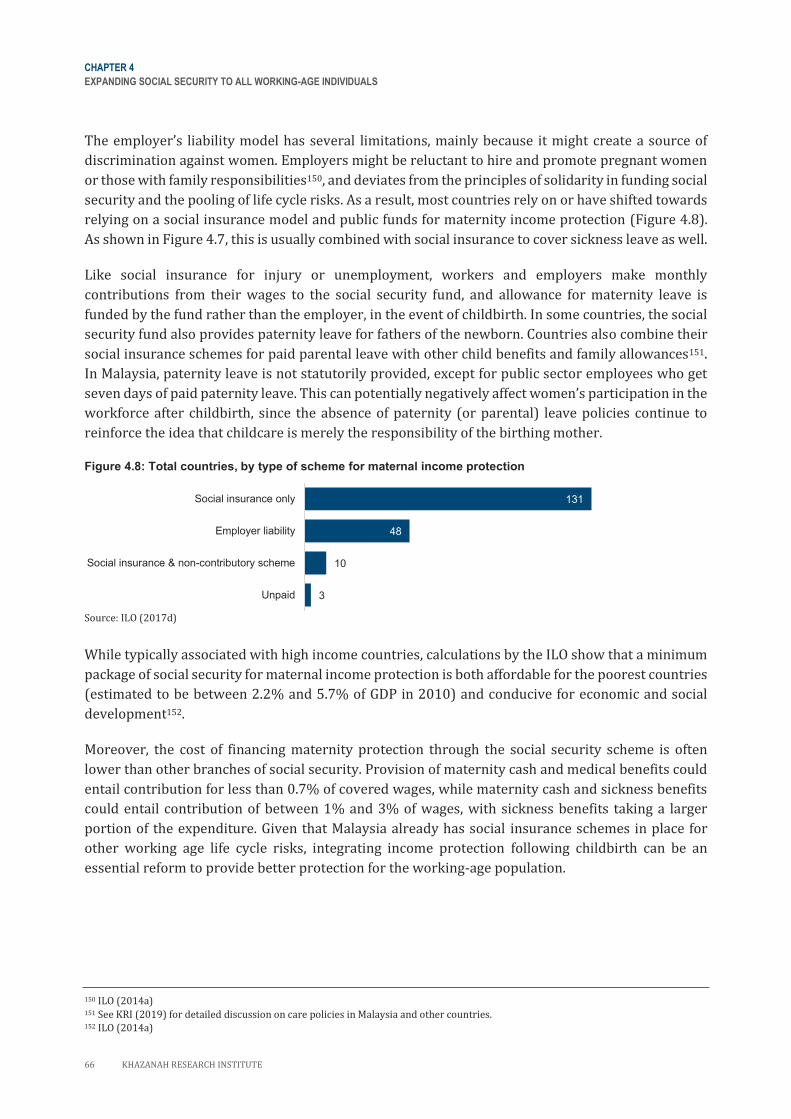
CHAPTER 4
EXPANDING SOCIAL SECURITY TO ALL WORKING-AGE INDIVIDUALS
66 KHAZANAH RESEARCH INSTITUTE
The employer’s liability model has several limitations, mainly because it might create a source of
discrimination against women. Employers might be reluctant to hire and promote pregnant women
or those with family responsibilities150, and deviates from the principles of solidarity in funding social
security and the pooling of life cycle risks. As a result, most countries rely on or have shifted towards
relying on a social insurance model and public funds for maternity income protection (Figure 4.8).
As shown in Figure 4.7, this is usually combined with social insurance to cover sickness leave as well.
Like social insurance for injury or unemployment, workers and employers make monthly
contributions from their wages to the social security fund, and allowance for maternity leave is
funded by the fund rather than the employer, in the event of childbirth. In some countries, the social
security fund also provides paternity leave for fathers of the newborn. Countries also combine their
social insurance schemes for paid parental leave with other child benefits and family allowances151.
In Malaysia, paternity leave is not statutorily provided, except for public sector employees who get
seven days of paid paternity leave. This can potentially negatively affect women’s participation in the
workforce after childbirth, since the absence of paternity (or parental) leave policies continue to
reinforce the idea that childcare is merely the responsibility of the birthing mother.
Figure 4.8: Total countries, by type of scheme for maternal income protection
Source: ILO (2017d)
While typically associated with high income countries, calculations by the ILO show that a minimum
package of social security for maternal income protection is both affordable for the poorest countries
(estimated to be between 2.2% and 5.7% of GDP in 2010) and conducive for economic and social
development152.
Moreover, the cost of financing maternity protection through the social security scheme is often
lower than other branches of social security. Provision of maternity cash and medical benefits could
entail contribution for less than 0.7% of covered wages, while maternity cash and sickness benefits
could entail contribution of between 1% and 3% of wages, with sickness benefits taking a larger
portion of the expenditure. Given that Malaysia already has social insurance schemes in place for
other working age life cycle risks, integrating income protection following childbirth can be an
essential reform to provide better protection for the working-age population.
150 ILO (2014a) 151 See KRI (2019) for detailed discussion on care policies in Malaysia and other countries. 152 ILO (2014a)
3
10
48
131
Unpaid
Social insurance & non-contributory scheme
Employer liability
Social insurance only
CHAPTER 4
EXPANDING SOCIAL SECURITY TO ALL WORKING-AGE INDIVIDUALS
KHAZANAH RESEARCH INSTITUTE 67
4.4.2. Coverage gaps in social insurance for the working-age population
Over the years, SOCSO has managed to steadily increase its total contributors, leading to an increasing
size of the fund. Back in 1982, only 25.2% of total employed persons in Malaysia were registered with
SOCSO, but this rate almost doubled to 47.8% in 2018153.
Coverage gap in the existing social insurance schemes is the biggest challenge in providing an
inclusive social protection for the working-age population. While they are mandatory for all private
sector employees in all economic activities, some are still non-contributors. They could be workers
in the informal sector or those working for employers who do not comply with mandatory
contribution requirements. While social security for injury is available for the self-employed,
contribution is voluntary and take-up rate remains low.
Injury and invalidity risks protection are applicable to about 13.3 million workers, but only 8.5
million (63.6% of target population) are covered by some income protection in the event of injury
through disablement benefits, invalidity pension or ex-gratia payment (Figure 4.9).
Unemployment risk protection is available for 8.9 million Malaysian workers154, but only 6.8 million
(76.3% of target population) private sector employees are contributors to SOCSO’s employment
insurance scheme and are entitled to job search allowance (JSA) to cushion the impact of
retrenchment and assist new job search activities (Figure 4.9).
There are also some legal exclusions to the existing social security scheme. 2.4 million persons are
legally excluded from injury and invalidity scheme. About 6.7 million persons are legally excluded
from employment insurance scheme. These include individuals who identify as employers (sole
proprietors or partners, who could make voluntary contribution by classifying themselves as
employee in their incorporated business), unpaid family workers and unemployed individuals who
do not earn any income to make contribution into the schemes. The employment insurance scheme
also legally excluded non-citizen employees and the self-employed.
Moreover, these schemes are also unavailable for close to 7.2 million people outside of the workforce
because they are not earning income through participation in the labour market. However, the
government announced that housewives will be covered by a voluntary injury scheme, starting
2022155.
In short, only 37% of the working-age population have protection against injury and invalidity risks,
while 30% have protection against unemployment risk.
153 Hawati Abdul Hamid and Nur Thuraya Sazali (2020) 154 Total Malaysian employees reported in DOS (2021c), minus total public sector employees (2019 figure) in KPWKM (2019). 155 Astro Awani (2021b)
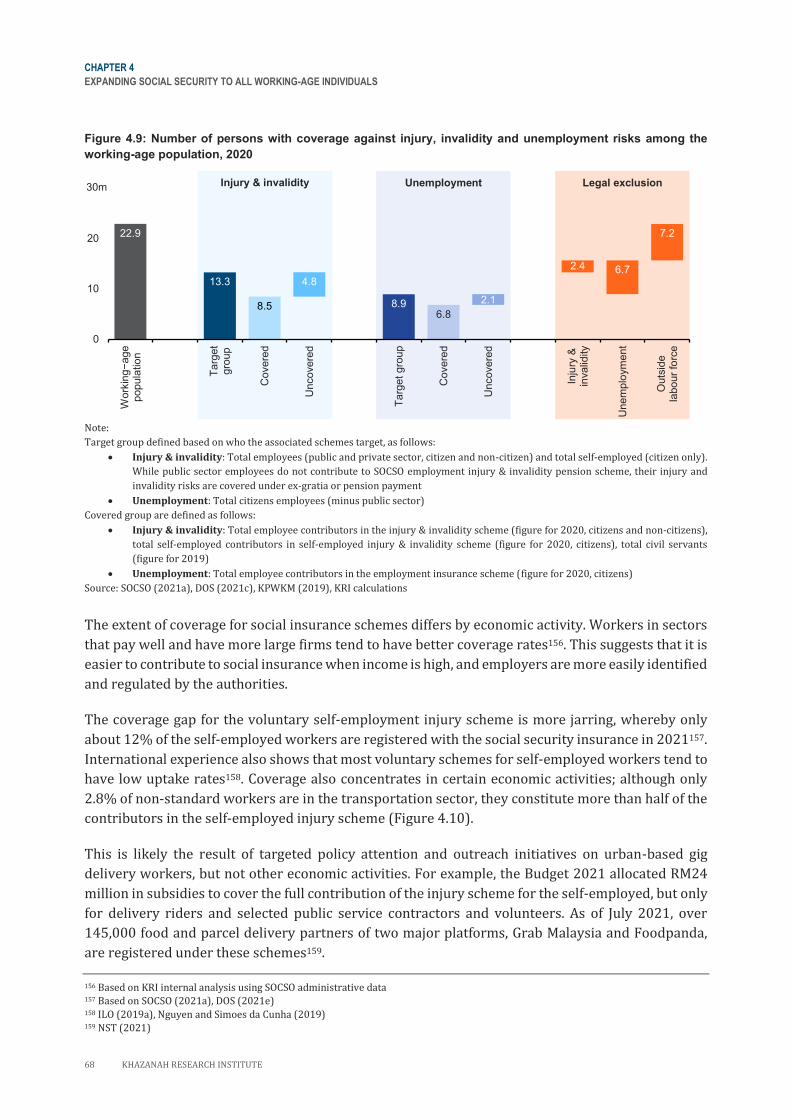
CHAPTER 4
EXPANDING SOCIAL SECURITY TO ALL WORKING-AGE INDIVIDUALS
68 KHAZANAH RESEARCH INSTITUTE
Figure 4.9: Number of persons with coverage against injury, invalidity and unemployment risks among the
working-age population, 2020
Note:
Target group defined based on who the associated schemes target, as follows:
• Injury & invalidity: Total employees (public and private sector, citizen and non-citizen) and total self-employed (citizen only).
While public sector employees do not contribute to SOCSO employment injury & invalidity pension scheme, their injury and
invalidity risks are covered under ex-gratia or pension payment
• Unemployment: Total citizens employees (minus public sector)
Covered group are defined as follows:
• Injury & invalidity: Total employee contributors in the injury & invalidity scheme (figure for 2020, citizens and non-citizens),
total self-employed contributors in self-employed injury & invalidity scheme (figure for 2020, citizens), total civil servants
(figure for 2019)
• Unemployment: Total employee contributors in the employment insurance scheme (figure for 2020, citizens)
Source: SOCSO (2021a), DOS (2021c), KPWKM (2019), KRI calculations
The extent of coverage for social insurance schemes differs by economic activity. Workers in sectors
that pay well and have more large firms tend to have better coverage rates156. This suggests that it is
easier to contribute to social insurance when income is high, and employers are more easily identified
and regulated by the authorities.
The coverage gap for the voluntary self-employment injury scheme is more jarring, whereby only
about 12% of the self-employed workers are registered with the social security insurance in 2021157.
International experience also shows that most voluntary schemes for self-employed workers tend to
have low uptake rates158. Coverage also concentrates in certain economic activities; although only
2.8% of non-standard workers are in the transportation sector, they constitute more than half of the
contributors in the self-employed injury scheme (Figure 4.10).
This is likely the result of targeted policy attention and outreach initiatives on urban-based gig
delivery workers, but not other economic activities. For example, the Budget 2021 allocated RM24
million in subsidies to cover the full contribution of the injury scheme for the self-employed, but only
for delivery riders and selected public service contractors and volunteers. As of July 2021, over
145,000 food and parcel delivery partners of two major platforms, Grab Malaysia and Foodpanda,
are registered under these schemes159.
156 Based on KRI internal analysis using SOCSO administrative data 157 Based on SOCSO (2021a), DOS (2021e) 158 ILO (2019a), Nguyen and Simoes da Cunha (2019) 159 NST (2021)
22.9
13.3
8.5
4.8
8.96.8
2.1
2.4 6.7
7.2
0
10
20
30
Working−age
popula
tio
n
Ta
rget
gro
up
Covere
d
Uncovere
d
Ta
rget gro
up
Covere
d
Uncovere
d
Inju
ry &
invalid
ity
Unem
plo
ym
ent
Outs
ide
labour
forc
e
30m Legal exclusion Unemployment Injury & invalidity
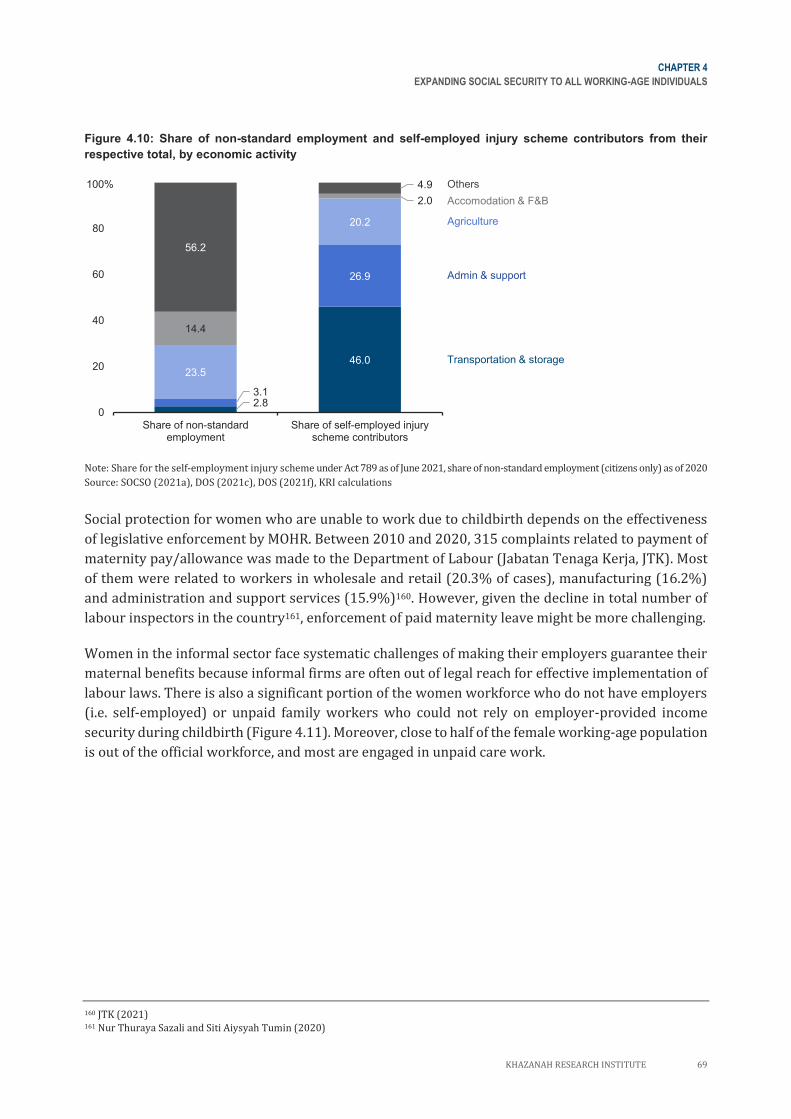
CHAPTER 4
EXPANDING SOCIAL SECURITY TO ALL WORKING-AGE INDIVIDUALS
KHAZANAH RESEARCH INSTITUTE 69
Figure 4.10: Share of non-standard employment and self-employed injury scheme contributors from their
respective total, by economic activity
Note: Share for the self-employment injury scheme under Act 789 as of June 2021, share of non-standard employment (citizens only) as of 2020
Source: SOCSO (2021a), DOS (2021c), DOS (2021f), KRI calculations
Social protection for women who are unable to work due to childbirth depends on the effectiveness
of legislative enforcement by MOHR. Between 2010 and 2020, 315 complaints related to payment of
maternity pay/allowance was made to the Department of Labour (Jabatan Tenaga Kerja, JTK). Most
of them were related to workers in wholesale and retail (20.3% of cases), manufacturing (16.2%)
and administration and support services (15.9%)160. However, given the decline in total number of
labour inspectors in the country161, enforcement of paid maternity leave might be more challenging.
Women in the informal sector face systematic challenges of making their employers guarantee their
maternal benefits because informal firms are often out of legal reach for effective implementation of
labour laws. There is also a significant portion of the women workforce who do not have employers
(i.e. self-employed) or unpaid family workers who could not rely on employer-provided income
security during childbirth (Figure 4.11). Moreover, close to half of the female working-age population
is out of the official workforce, and most are engaged in unpaid care work.
160 JTK (2021) 161 Nur Thuraya Sazali and Siti Aiysyah Tumin (2020)
2.8
46.0
3.1
26.9
23.5
20.2
14.4
2.0
56.2
4.9
0
20
40
60
80
100
Share of non-standardemployment
Share of self-employed injuryscheme contributors
100% Others
Accomodation & F&B
Agriculture
Admin & support
Transportation & storage
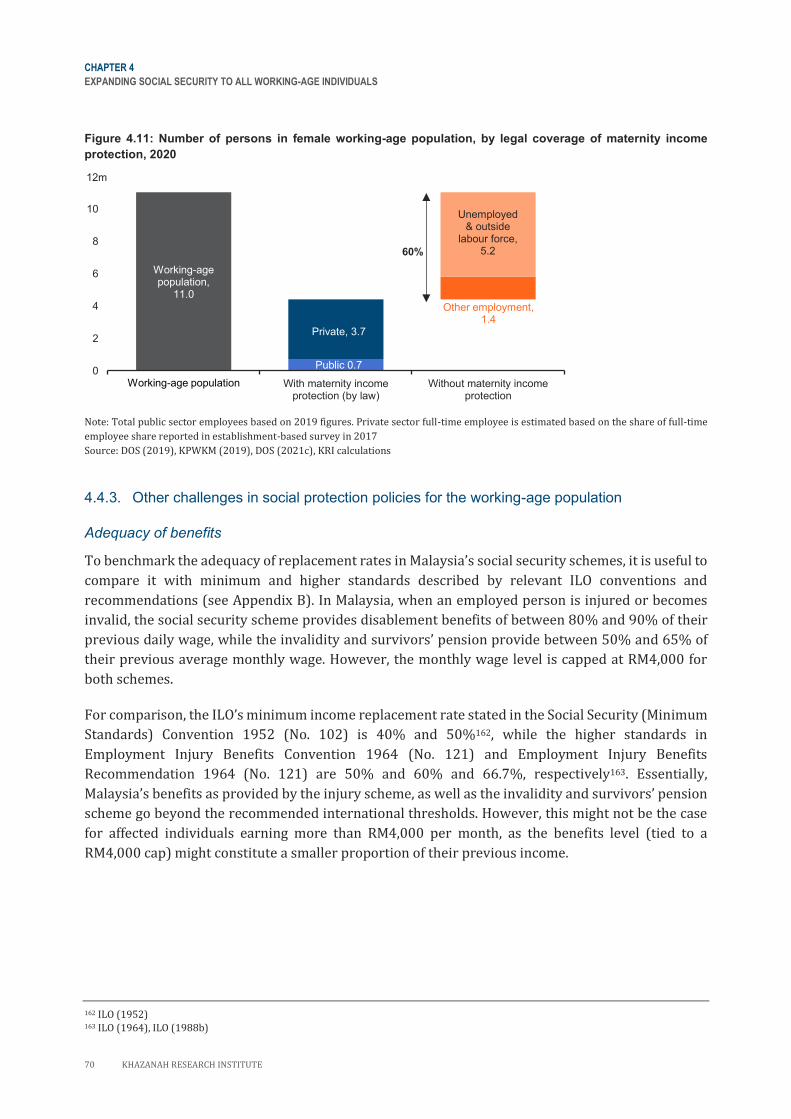
CHAPTER 4
EXPANDING SOCIAL SECURITY TO ALL WORKING-AGE INDIVIDUALS
70 KHAZANAH RESEARCH INSTITUTE
Figure 4.11: Number of persons in female working-age population, by legal coverage of maternity income
protection, 2020
Note: Total public sector employees based on 2019 figures. Private sector full-time employee is estimated based on the share of full-time
employee share reported in establishment-based survey in 2017
Source: DOS (2019), KPWKM (2019), DOS (2021c), KRI calculations
4.4.3. Other challenges in social protection policies for the working-age population
Adequacy of benefits
To benchmark the adequacy of replacement rates in Malaysia’s social security schemes, it is useful to
compare it with minimum and higher standards described by relevant ILO conventions and
recommendations (see Appendix B). In Malaysia, when an employed person is injured or becomes
invalid, the social security scheme provides disablement benefits of between 80% and 90% of their
previous daily wage, while the invalidity and survivors’ pension provide between 50% and 65% of
their previous average monthly wage. However, the monthly wage level is capped at RM4,000 for
both schemes.
For comparison, the ILO’s minimum income replacement rate stated in the Social Security (Minimum
Standards) Convention 1952 (No. 102) is 40% and 50%162, while the higher standards in
Employment Injury Benefits Convention 1964 (No. 121) and Employment Injury Benefits
Recommendation 1964 (No. 121) are 50% and 60% and 66.7%, respectively163. Essentially,
Malaysia’s benefits as provided by the injury scheme, as well as the invalidity and survivors’ pension
scheme go beyond the recommended international thresholds. However, this might not be the case
for affected individuals earning more than RM4,000 per month, as the benefits level (tied to a
RM4,000 cap) might constitute a smaller proportion of their previous income.
162 ILO (1952) 163 ILO (1964), ILO (1988b)
Working-age population,
11.0
0
2
4
6
8
10
12
Working age population With maternity incomeprotection (by law)
Without maternity incomeprotection
12m
Public 0.7
Private, 3.7
Other employment, 1.4
60%
Unemployed& outside
labour force,5.2
Working-age population
CHAPTER 4
EXPANDING SOCIAL SECURITY TO ALL WORKING-AGE INDIVIDUALS
KHAZANAH RESEARCH INSTITUTE 71
Meanwhile, when a person loses their employment, the social security scheme provides a JSA of
between 30% and 80% of previous average wage (also capped at RM4,000), for up to six months
(~24 weeks). The scheme is designed such that JSA benefits decline over time to incentivise job-
search efforts among recipients. The minimum income replacement rate stated in ILO’s Convention
No. 102 is 45%164, while the higher standard in the Employment Promotion and Protection against
Unemployment Convention, 1988 (No. 168) and Employment Promotion and Protection against
Unemployment Recommendation, 1988 (No. 176) is 50%165.
Given staggered payment structure of JSA in the employment insurance scheme, the higher standard
is fulfilled in the first two months of unemployment period of insured person (benefits rate of 80%
in first month and 50% in second month) and the minimum standard is fulfilled in the third and
fourth month of unemployment (benefits rate of 40%) but fails to meet minimum standards in the
remaining two months (benefits rate of 30%). In terms of the duration of benefits, Malaysia meets
the minimum standard of 13 weeks in Convention No. 102, but not the 26 weeks stated by higher
standards in Convention No. 168 and Recommendation No. 168. The scheme also caps wages at
RM4,000, and therefore affected individuals earning higher income might earn less than their
previous income.
In the case of income protection during childbirth, ILO’s Convention No. 102 and the Maternity
Protection Convention 2000 (No. 183) state that mothers should be provided cash benefits at least
45% of reference wages and 66.7% of their previous earnings respectively166. As Act 265 requires
employers to provide maternity cash allowance equivalent to their full wages (i.e. 100%), the
legislations fulfil this minimum international standard. However, these conventions extend the
coverage of cash benefits to all employed women and not just employees. Considering that paid
maternity leave is an employers’ liability in Malaysia, female self-employed or unpaid family workers
do not have basic income security. In this respect, Malaysia has yet to meet the Convention No. 183.
In practice, are these benefits enough for individuals experiencing injury, invalidity, unemployment
or childbirth? Another useful benchmark is the poverty income per capita. As the average household
PLI is RM2,208 per month and the average household size is 4, we approximate and assume a PLI per
capita of RM600 per month. Assuming that an individual is paid at least the minimum wage
(RM1,200), the income replacement rates of the social security schemes should provide basic income
security.
However, there are two key considerations that must be noted. Firstly, not all workers are paid the
minimum wage, even when it is legislated. Between 2013 and 2020, JTK received close to 3,000
complaints associated with issues in minimum wages payment167. Secondly, Social Protection Floors
Recommendation, 2012 (No. 202) also stated that benefits (cash and in-kind) provided must not only
provide basic income security to secure access to necessary goods and services and prevent poverty,
vulnerability and social exclusion, but also allows life in dignity168. Even if benefits level is above the
poverty threshold, some might be unable to enjoy a decent living standard, especially when
considering changing composition and cost of necessities.
164 ILO (1952) 165 ILO (1988b), ILO (1988a) 166 ILO (1952), ILO (2012) 167 JTK (2021) 168 ILO (2012)
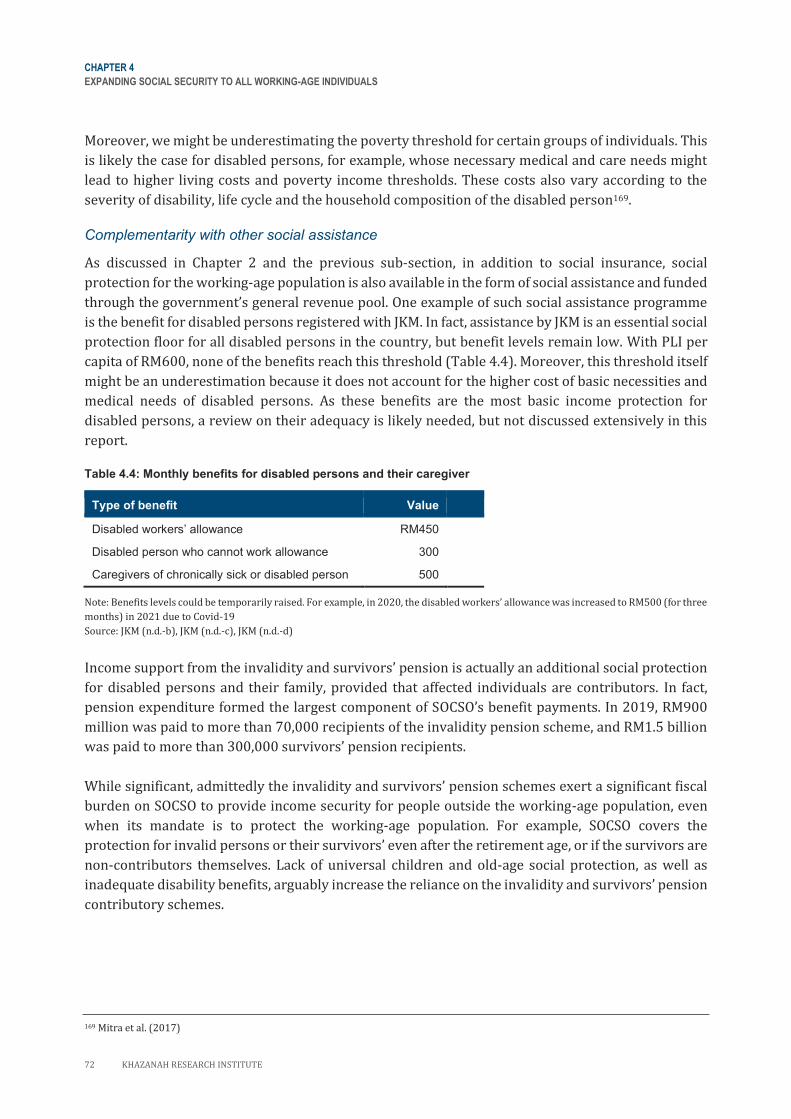
CHAPTER 4
EXPANDING SOCIAL SECURITY TO ALL WORKING-AGE INDIVIDUALS
72 KHAZANAH RESEARCH INSTITUTE
Moreover, we might be underestimating the poverty threshold for certain groups of individuals. This
is likely the case for disabled persons, for example, whose necessary medical and care needs might
lead to higher living costs and poverty income thresholds. These costs also vary according to the
severity of disability, life cycle and the household composition of the disabled person169.
Complementarity with other social assistance
As discussed in Chapter 2 and the previous sub-section, in addition to social insurance, social
protection for the working-age population is also available in the form of social assistance and funded
through the government’s general revenue pool. One example of such social assistance programme
is the benefit for disabled persons registered with JKM. In fact, assistance by JKM is an essential social
protection floor for all disabled persons in the country, but benefit levels remain low. With PLI per
capita of RM600, none of the benefits reach this threshold (Table 4.4). Moreover, this threshold itself
might be an underestimation because it does not account for the higher cost of basic necessities and
medical needs of disabled persons. As these benefits are the most basic income protection for
disabled persons, a review on their adequacy is likely needed, but not discussed extensively in this
report.
Table 4.4: Monthly benefits for disabled persons and their caregiver
Type of benefit Value
Disabled workers’ allowance RM450
Disabled person who cannot work allowance 300
Caregivers of chronically sick or disabled person 500
Note: Benefits levels could be temporarily raised. For example, in 2020, the disabled workers’ allowance was increased to RM500 (for three
months) in 2021 due to Covid-19
Source: JKM (n.d.-b), JKM (n.d.-c), JKM (n.d.-d)
Income support from the invalidity and survivors’ pension is actually an additional social protection
for disabled persons and their family, provided that affected individuals are contributors. In fact,
pension expenditure formed the largest component of SOCSO’s benefit payments. In 2019, RM900
million was paid to more than 70,000 recipients of the invalidity pension scheme, and RM1.5 billion
was paid to more than 300,000 survivors’ pension recipients.
While significant, admittedly the invalidity and survivors’ pension schemes exert a significant fiscal
burden on SOCSO to provide income security for people outside the working-age population, even
when its mandate is to protect the working-age population. For example, SOCSO covers the
protection for invalid persons or their survivors’ even after the retirement age, or if the survivors are
non-contributors themselves. Lack of universal children and old-age social protection, as well as
inadequate disability benefits, arguably increase the reliance on the invalidity and survivors’ pension
contributory schemes.
169 Mitra et al. (2017)
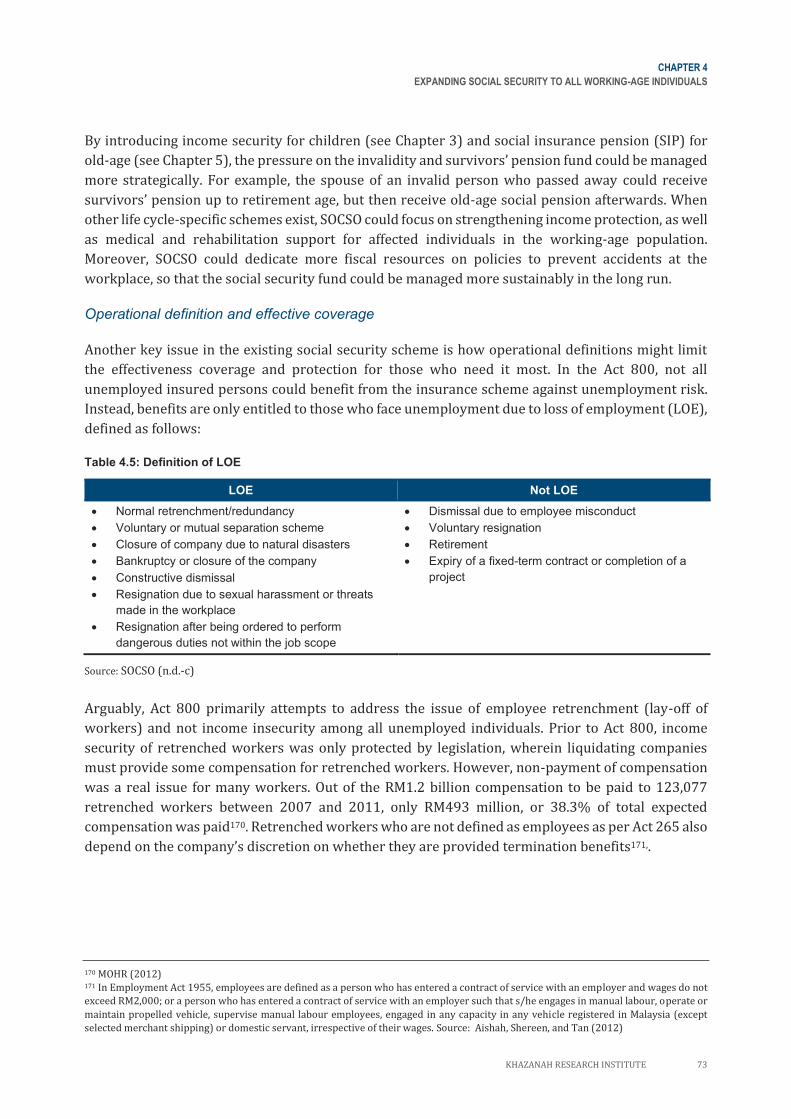
CHAPTER 4
EXPANDING SOCIAL SECURITY TO ALL WORKING-AGE INDIVIDUALS
KHAZANAH RESEARCH INSTITUTE 73
By introducing income security for children (see Chapter 3) and social insurance pension (SIP) for
old-age (see Chapter 5), the pressure on the invalidity and survivors’ pension fund could be managed
more strategically. For example, the spouse of an invalid person who passed away could receive
survivors’ pension up to retirement age, but then receive old-age social pension afterwards. When
other life cycle-specific schemes exist, SOCSO could focus on strengthening income protection, as well
as medical and rehabilitation support for affected individuals in the working-age population.
Moreover, SOCSO could dedicate more fiscal resources on policies to prevent accidents at the
workplace, so that the social security fund could be managed more sustainably in the long run.
Operational definition and effective coverage
Another key issue in the existing social security scheme is how operational definitions might limit
the effectiveness coverage and protection for those who need it most. In the Act 800, not all
unemployed insured persons could benefit from the insurance scheme against unemployment risk.
Instead, benefits are only entitled to those who face unemployment due to loss of employment (LOE),
defined as follows:
Table 4.5: Definition of LOE
LOE Not LOE
• Normal retrenchment/redundancy
• Voluntary or mutual separation scheme
• Closure of company due to natural disasters
• Bankruptcy or closure of the company
• Constructive dismissal
• Resignation due to sexual harassment or threats
made in the workplace
• Resignation after being ordered to perform
dangerous duties not within the job scope
• Dismissal due to employee misconduct
• Voluntary resignation
• Retirement
• Expiry of a fixed-term contract or completion of a
project
Source: SOCSO (n.d.-c)
Arguably, Act 800 primarily attempts to address the issue of employee retrenchment (lay-off of
workers) and not income insecurity among all unemployed individuals. Prior to Act 800, income
security of retrenched workers was only protected by legislation, wherein liquidating companies
must provide some compensation for retrenched workers. However, non-payment of compensation
was a real issue for many workers. Out of the RM1.2 billion compensation to be paid to 123,077
retrenched workers between 2007 and 2011, only RM493 million, or 38.3% of total expected
compensation was paid170. Retrenched workers who are not defined as employees as per Act 265 also
depend on the company’s discretion on whether they are provided termination benefits171,.
170 MOHR (2012) 171 In Employment Act 1955, employees are defined as a person who has entered a contract of service with an employer and wages do not
exceed RM2,000; or a person who has entered a contract of service with an employer such that s/he engages in manual labour, operate or
maintain propelled vehicle, supervise manual labour employees, engaged in any capacity in any vehicle registered in Malaysia (except
selected merchant shipping) or domestic servant, irrespective of their wages. Source: Aishah, Shereen, and Tan (2012)
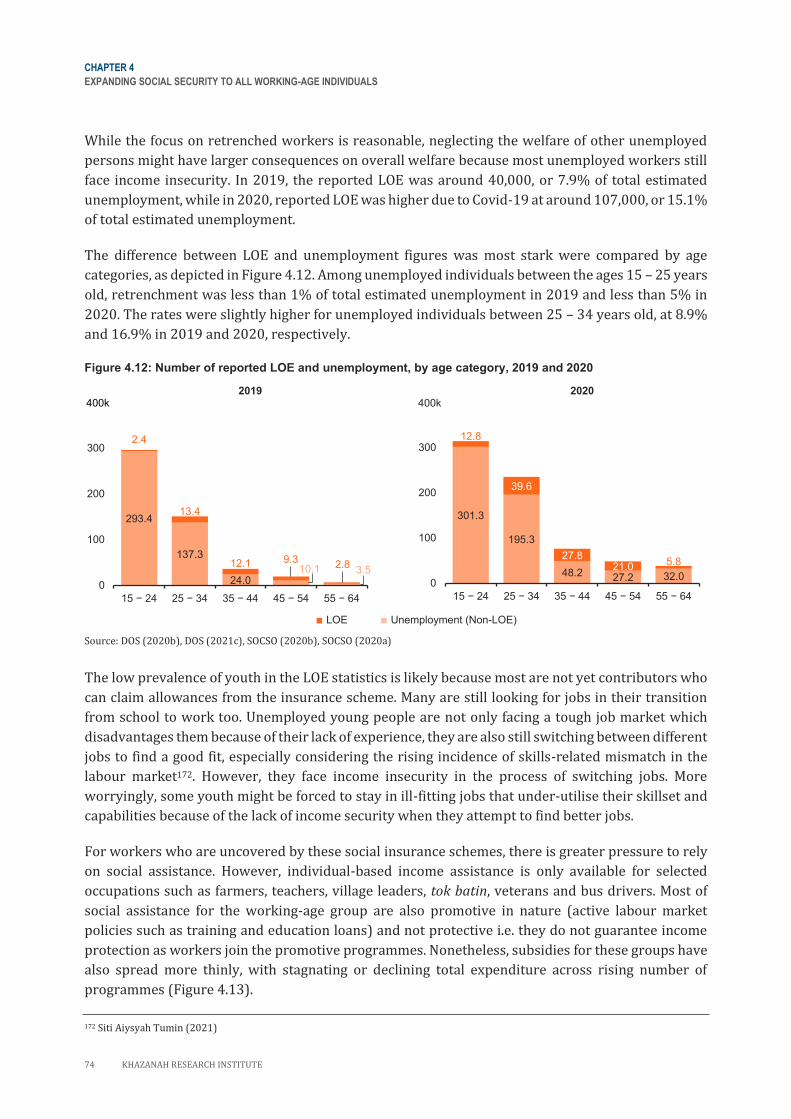
CHAPTER 4
EXPANDING SOCIAL SECURITY TO ALL WORKING-AGE INDIVIDUALS
74 KHAZANAH RESEARCH INSTITUTE
While the focus on retrenched workers is reasonable, neglecting the welfare of other unemployed
persons might have larger consequences on overall welfare because most unemployed workers still
face income insecurity. In 2019, the reported LOE was around 40,000, or 7.9% of total estimated
unemployment, while in 2020, reported LOE was higher due to Covid-19 at around 107,000, or 15.1%
of total estimated unemployment.
The difference between LOE and unemployment figures was most stark were compared by age
categories, as depicted in Figure 4.12. Among unemployed individuals between the ages 15 – 25 years
old, retrenchment was less than 1% of total estimated unemployment in 2019 and less than 5% in
2020. The rates were slightly higher for unemployed individuals between 25 – 34 years old, at 8.9%
and 16.9% in 2019 and 2020, respectively.
Figure 4.12: Number of reported LOE and unemployment, by age category, 2019 and 2020
2019 2020
■ LOE ■ Unemployment (Non-LOE)
Source: DOS (2020b), DOS (2021c), SOCSO (2020b), SOCSO (2020a)
The low prevalence of youth in the LOE statistics is likely because most are not yet contributors who
can claim allowances from the insurance scheme. Many are still looking for jobs in their transition
from school to work too. Unemployed young people are not only facing a tough job market which
disadvantages them because of their lack of experience, they are also still switching between different
jobs to find a good fit, especially considering the rising incidence of skills-related mismatch in the
labour market172. However, they face income insecurity in the process of switching jobs. More
worryingly, some youth might be forced to stay in ill-fitting jobs that under-utilise their skillset and
capabilities because of the lack of income security when they attempt to find better jobs.
For workers who are uncovered by these social insurance schemes, there is greater pressure to rely
on social assistance. However, individual-based income assistance is only available for selected
occupations such as farmers, teachers, village leaders, tok batin, veterans and bus drivers. Most of
social assistance for the working-age group are also promotive in nature (active labour market
policies such as training and education loans) and not protective i.e. they do not guarantee income
protection as workers join the promotive programmes. Nonetheless, subsidies for these groups have
also spread more thinly, with stagnating or declining total expenditure across rising number of
programmes (Figure 4.13).
172 Siti Aiysyah Tumin (2021)
293.4
137.3
24.0
2.4
13.4
12.1
0
100
200
300
400
15 − 24 25 − 34 35 − 44 45 − 54 55 − 64
400k
10.1 3.59.3
2.8
301.3
195.3
48.2 27.2 32.0
12.8
39.6
27.821.0 5.8
0
100
200
300
400
15 − 24 25 − 34 35 − 44 45 − 54 55 − 64
400k
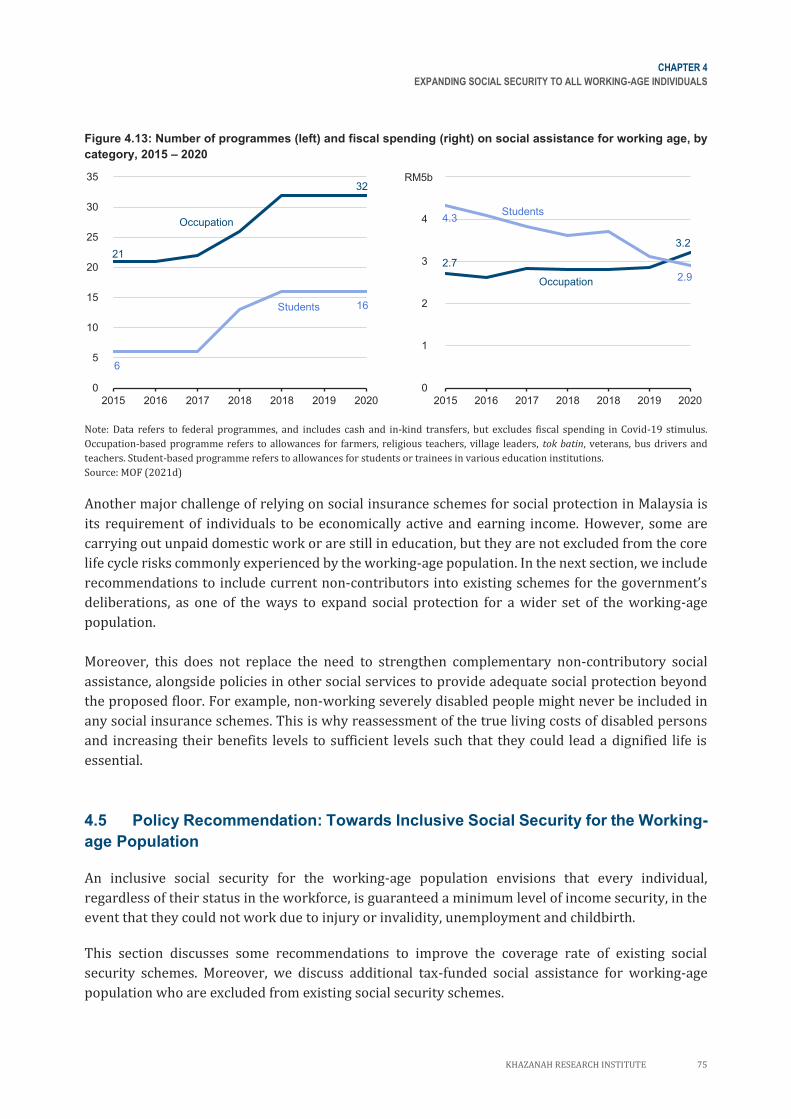
CHAPTER 4
EXPANDING SOCIAL SECURITY TO ALL WORKING-AGE INDIVIDUALS
KHAZANAH RESEARCH INSTITUTE 75
Figure 4.13: Number of programmes (left) and fiscal spending (right) on social assistance for working age, by
category, 2015 – 2020
Note: Data refers to federal programmes, and includes cash and in-kind transfers, but excludes fiscal spending in Covid-19 stimulus.
Occupation-based programme refers to allowances for farmers, religious teachers, village leaders, tok batin, veterans, bus drivers and
teachers. Student-based programme refers to allowances for students or trainees in various education institutions.
Source: MOF (2021d)
Another major challenge of relying on social insurance schemes for social protection in Malaysia is
its requirement of individuals to be economically active and earning income. However, some are
carrying out unpaid domestic work or are still in education, but they are not excluded from the core
life cycle risks commonly experienced by the working-age population. In the next section, we include
recommendations to include current non-contributors into existing schemes for the government’s
deliberations, as one of the ways to expand social protection for a wider set of the working-age
population.
Moreover, this does not replace the need to strengthen complementary non-contributory social
assistance, alongside policies in other social services to provide adequate social protection beyond
the proposed floor. For example, non-working severely disabled people might never be included in
any social insurance schemes. This is why reassessment of the true living costs of disabled persons
and increasing their benefits levels to sufficient levels such that they could lead a dignified life is
essential.
4.5 Policy Recommendation: Towards Inclusive Social Security for the Working-
age Population
An inclusive social security for the working-age population envisions that every individual,
regardless of their status in the workforce, is guaranteed a minimum level of income security, in the
event that they could not work due to injury or invalidity, unemployment and childbirth.
This section discusses some recommendations to improve the coverage rate of existing social
security schemes. Moreover, we discuss additional tax-funded social assistance for working-age
population who are excluded from existing social security schemes.
21
32
6
16
0
5
10
15
20
25
30
35
2015 2016 2017 2018 2018 2019 2020
Students
Occupation
2.7
3.2
4.3
2.9
0
1
2
3
4
5
2015 2016 2017 2018 2018 2019 2020
RM5b
Students
Occupation
CHAPTER 4
EXPANDING SOCIAL SECURITY TO ALL WORKING-AGE INDIVIDUALS
76 KHAZANAH RESEARCH INSTITUTE
4.5.1. Extending the reach of social security schemes
Reforms to existing social security schemes
Malaysia’s current social insurance schemes is designed to be mandatory for private sector
employees, but not public sector employees. The separation of compensation scheme for public
sector employees from private sector employees is not uncommon in Asian countries, but more
developed countries tend to integrate all workers under a unified social security scheme regardless
of their employment sector173. Inclusion of civil servants in the existing social security schemes could
lead to two potential benefits. First, it could strengthen and expand the size of the fund, as there will
be 1.3 million new contributors, increasing the size of the fund to be between RM482 million and
RM1.6 billion174. Second, it smoothens the transition of social protection coverage among workers
who change their employment from the public sector to the private sector, or vice versa.
Moreover, foreign workers should be covered more systematically under existing schemes.
Currently, only the injury scheme covers foreign employees, including foreign domestic workers.
However, they are not included in the invalidity scheme as foreign workers are assumed to return to
their home country after their employment ends, and unlikely to benefit from the lifetime invalidity
or survivors’ pension if they are eligible for it. They are also excluded from the employment insurance
scheme, which provides income support if a worker is retrenched. However, they are not excluded
from the risks of economic downturn. During the Covid-19 pandemic, when both retrenchment and
unemployment numbers peaked, foreign workers were more adversely affected. Between 2019 and
2020, total unemployed citizens increased by 32.0%, while non-citizens increased by 134.0%175.
Excluded from social insurance that could provide some income replacement when they were
retrenched due to Covid-19, foreign workers were made more vulnerable because most household-
based cash assistance were provided for citizens only.
While selected social insurance schemes have been extended to self-employed (and housewives
starting 2022), contribution should be mandatory instead of voluntary. There are at least three
weaknesses to the current voluntary schemes for self-employed workers176. Firstly, it creates adverse
selection i.e. only workers in dangerous economic activities contribute to social insurance because
they are more likely to access its benefits, and this will eventually put greater sustainability pressure
on the schemes as the insurance premium will have to be increased. Secondly, risks are not effectively
pooled due to its small size. Thirdly, it could create perverse incentives among enterprises that seek
to cut labour cost, by hiring self-employed workers when in fact they are dependent self-employed.
However, since non-standard workers might earn irregular income (or unpaid in the case of some
family workers), policymakers must ensure the schemes are flexible and/or supported by
government’s fiscal assistance. If mandatory schemes are effectively enforced, total SOCSO
contributors would increase by more than 5.0 million, and the fund could expand between RM2.0 and
RM7.4 billion177.
173 Su and Hoe (2008) 174 See Appendix D. 175 DOS (various years-a) 176 ILO (2019a), Nguyen and Simoes da Cunha (2019) 177 See Appendix D
CHAPTER 4
EXPANDING SOCIAL SECURITY TO ALL WORKING-AGE INDIVIDUALS
KHAZANAH RESEARCH INSTITUTE 77
It is also important to precisely determine who should contribute to the self-employed social security
schemes. Currently, employers are fully responsible to pay the 1.25% of employment injury scheme
for their employees but this is fully borne by the self-employed because they do not have an employer.
If the invalidity pension and employment insurance scheme will be extended to the self-employed,
there is an additional 1.4% contribution (1% invalidity pension and 0.4% employment insurance).
However, as discussed in Box 4.3, this ignores the heterogenous nature of work relationships and
might place an unfair burden to some self-employed workers. Consequently, policies could focus on
determining the contribution responsibilities and more ambitiously, fiscal allocation could cover the
contribution costs for some self-employed workers.
One way to determine contribution responsibility is by assessing how “independent” the self-
employed is, considering their level of authority and economic risks. The matrix illustrated in Figure
4.6 in Box 4.3 could be used for the assessment. For instance, self-employed individuals who have an
incorporated business are relatively independent and face less economic shocks, and they could be
assumed as capable of independently contributing to their social security schemes. Self-employed
individuals without incorporated business (household market enterprise) or contributing family
members (usually unpaid and in household market enterprise) might require full government assistance.
Dependent self-employed refer to those who might actually show features similar to an employee of
the company but are disguised as independent self-employed. Legal provision and enforcement to
ensure that businesses do not misuse the grey area of workers classification to evade labour laws are
necessary. In the UK for example, this has been done by defining six types of employment statuses
(worker, employee, employee shareholder, self-employed and contractor, director, and office holder)
and their employment rights. Once workers are accurately classified based on the nature of their
work relationships, innovative ways to sustainably finance social insurance could be considered.
Malaysia could consider some solutions based on international examples. In Germany for instance,
self-employed artist and publicists have the same contribution rate as a standard employee, but the
remaining contribution (usually covered by an employer) is funded by government taxation and
global contribution among enterprises that regularly contract self-employed artists and publicists178.
Moreover, the expansion of social insurance schemes to non-standard workers also necessitates
some amendments to qualifying conditions to access benefits. For example, the employment
insurance scheme could broaden its definition of “loss of employment”, which relies heavily on the
existence of a standard employment relationship between an employee and an employer. For the
self-employed, “retrenchment by employer” is simply not possible for them because they work for no
one. However, business cycles affect all workers and not just employers and employees in the formal
sector. Self-employed workers could face this in the form of non-payment by their clients, destruction
of crop due to extreme weather conditions, or sudden closure of economic activities as experienced
during a pandemic like the Covid-19 pandemic. Tailoring the qualifying conditions of the existing
employment insurance scheme to consider the various experiences of income loss is an essential
reform to provide protection for all workers in the economy.
178 ILO (2019a)
CHAPTER 4
EXPANDING SOCIAL SECURITY TO ALL WORKING-AGE INDIVIDUALS
78 KHAZANAH RESEARCH INSTITUTE
However, if the existing approach of voluntary contribution for the self-employed remains,
policymakers must improve their outreach initiatives, especially through cooperation with relevant
workers associations and government agencies. For example, SOCSO could work with the National
Farmers’ Association which has access to more than 920,000 farmers179, as well as the National
Organization of Smallholders with access to more than 100,000 smallholders180, to formalise
agriculture self-employed workers by including them in the social insurance schemes. Recipient of
subsidies or assistance administered by agencies such as the Department of Agriculture and
Department of Fisheries should also be incentivised to contribute, and they need to be convinced that
social insurance is capable of providing adequate and predictable income replacement and other
benefits in the event they become injured or experience income loss. Such predictable benefits are
likely more beneficial than one-off cash handouts announced annually via the federal government
budgets.
Coverage to workers in micro- and smaller enterprises is also very challenging due to their large
numbers in the country. They could be reached through local councils and/or municipalities who
administers business licenses and collect local taxes. Monitoring and enforcement must also be
enhanced by stronger federal-state collaboration to ensure we maximise the inclusion of all workers
in the social insurance schemes. Additionally, simplification of payment processes for small
businesses could also be considered. Monotax, which is a simplified collection of tax and social
security contribution, has been implemented in Uruguay, Argentina, Brazil and Ecuador. In Uruguay,
for instance, the social security institution collects a monotax, transfers tax payment to fiscal
authorities on behalf of the business and then uses the remaining collection to finance social security
contribution181.
Greater utilisation of social insurance model and strengthening of the social security institution
In Malaysia, currently, social insurance is only used to manage risks associated with injury, invalidity
and unemployment. However, it has also been utilised to cover sickness, maternity, family benefits
and old-age risks in other countries.
Malaysia’s reliance on employers’ liability to cover maternity might not be sustainable. Considering
the rising share of female employment and deliberate policy focus to further increase female labour
force participation rate, shifting to a social insurance model could be a more sustainable way to
guarantee basic income protection when women are temporarily unable to work due to childbirth.
Following the implementation of other social insurance schemes, employers, workers, and the
government contribute to this social security fund. Contributing workers must include all
employment status and genders. The social insurance fund could also be used to finance paternity
leave and attempt to equalise the burden of care between mothers and fathers, as well as provide
more comprehensive maternity and childcare benefits, as discussed comprehensively in KRI’s
previous report, Time to Care: Gender Inequality, Unpaid Care Work and Time Use Survey182.
179 NAFAS (n.d.) 180 NASH (n.d.) 181 ILO (2017d) 182 KRI (2019)

CHAPTER 4
EXPANDING SOCIAL SECURITY TO ALL WORKING-AGE INDIVIDUALS
KHAZANAH RESEARCH INSTITUTE 79
The expanded utilisation and dependence on social insurance schemes to cover more life cycle risks
necessitate the strengthening of the agency in charge of the social protection for the working-age
population, namely SOCSO. Several operational reforms could be introduced to improve the
efficiency of the institution. Similar to the automatic registration of children into the UCB upon their
birth certificate registration discussed in Chapter 3, we also propose the automatic registration of
every Malaysian into all employment-related social security schemes. This could be done at the age
of 15 years old, which is the minimum working age.
The automatic registration of individuals into social protection schemes addresses the issue of non-
compliance among employers and self-limiting cognitive biases among workers who under-estimate
future life cycle risks, and under-value social insurance schemes that will protect them. It also
potentially reduces SOCSO’s administrative burden of processing new applications every year. Prior
to earning an income that allows contribution (during schooling or tertiary education years), every
citizen will be categorised as a non-contributor to the system. However, their inclusion into the social
security system enables them to access other proposed income security, such as the tax-funded JSA
(discussed in the next sub-section of this chapter).
The proximity of SOCSO to various active labour market policies also facilitates the synergy between
passive measures that provide income security and active measures to promote the productivity and
employability of workers. As productive workers continue making contribution and paying taxes,
fiscal resources go back into the social security system and general tax collection fund, to help cover
those with atypical circumstances.
Moreover, continuous improvement and modernisation of the administration of social security
system is essential. Consolidation of the different schemes covering different risks into one common
scheme might also be a way forward, so that collection is easier, risks are better pooled and resources
could also be shared strategically. It might also minimise complexity when determining qualifying
conditions to access benefits. However, reforms to the structure of the fund must uphold the
principles of accountability, transparency and independence from political influence. These reforms
might require considerable, yet necessary investment by the government.
4.5.2. Government as the third pillar in social security ecosystem
Aside from policy-setting role, the government is largely absent in the existing social insurance
schemes, which focuses on workers in the private sector. However, the experience of the Covid-19
illustrates how the government could play a larger role in providing social protection for individuals
in the working-age population, responding to their specific life cycle risks.
For example, retrenchment by struggling companies has been a key concern for the country during
the Covid-19 pandemic. The government then leveraged on SOCSO to distribute more than RM25
billion in wage subsidies to keep people on the payroll. Relaxation of some qualifying conditions to
access benefits as well as additional assistance have also been provided for some affected workers,
as long as they are registered with SOCSO. However, non-contributors cannot be reached through
these initiatives.
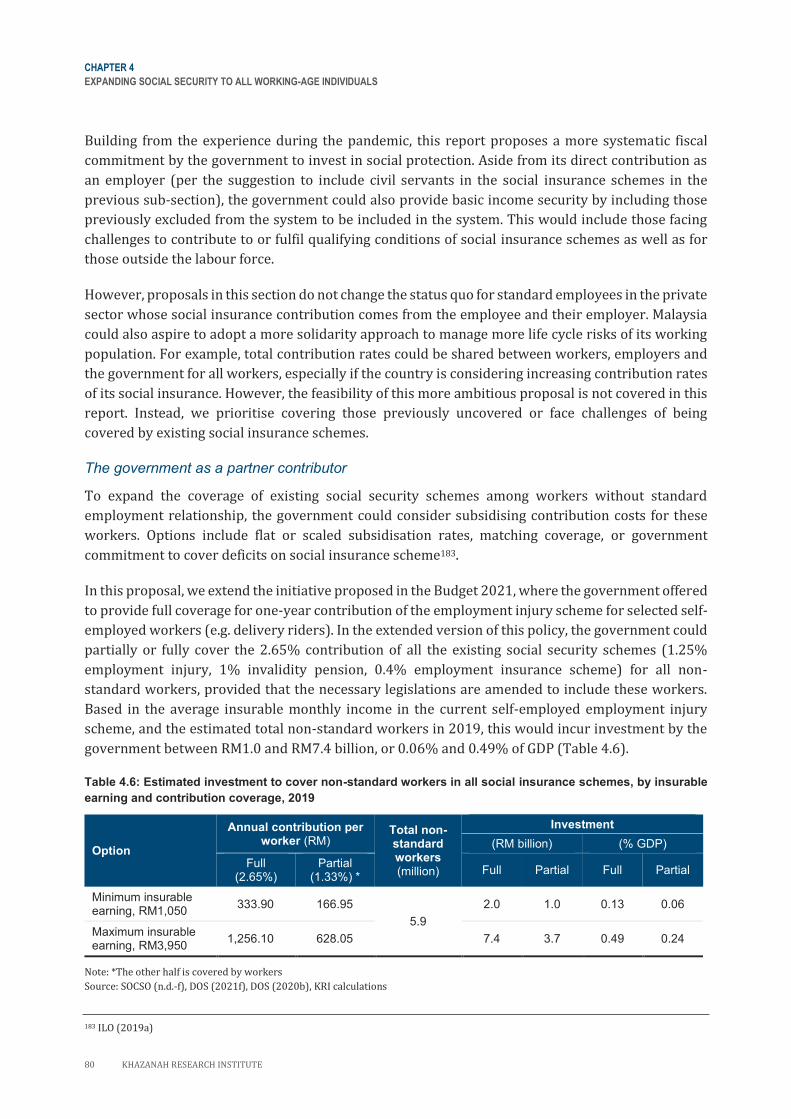
CHAPTER 4
EXPANDING SOCIAL SECURITY TO ALL WORKING-AGE INDIVIDUALS
80 KHAZANAH RESEARCH INSTITUTE
Building from the experience during the pandemic, this report proposes a more systematic fiscal
commitment by the government to invest in social protection. Aside from its direct contribution as
an employer (per the suggestion to include civil servants in the social insurance schemes in the
previous sub-section), the government could also provide basic income security by including those
previously excluded from the system to be included in the system. This would include those facing
challenges to contribute to or fulfil qualifying conditions of social insurance schemes as well as for
those outside the labour force.
However, proposals in this section do not change the status quo for standard employees in the private
sector whose social insurance contribution comes from the employee and their employer. Malaysia
could also aspire to adopt a more solidarity approach to manage more life cycle risks of its working
population. For example, total contribution rates could be shared between workers, employers and
the government for all workers, especially if the country is considering increasing contribution rates
of its social insurance. However, the feasibility of this more ambitious proposal is not covered in this
report. Instead, we prioritise covering those previously uncovered or face challenges of being
covered by existing social insurance schemes.
The government as a partner contributor
To expand the coverage of existing social security schemes among workers without standard
employment relationship, the government could consider subsidising contribution costs for these
workers. Options include flat or scaled subsidisation rates, matching coverage, or government
commitment to cover deficits on social insurance scheme183.
In this proposal, we extend the initiative proposed in the Budget 2021, where the government offered
to provide full coverage for one-year contribution of the employment injury scheme for selected self-
employed workers (e.g. delivery riders). In the extended version of this policy, the government could
partially or fully cover the 2.65% contribution of all the existing social security schemes (1.25%
employment injury, 1% invalidity pension, 0.4% employment insurance scheme) for all non-
standard workers, provided that the necessary legislations are amended to include these workers.
Based in the average insurable monthly income in the current self-employed employment injury
scheme, and the estimated total non-standard workers in 2019, this would incur investment by the
government between RM1.0 and RM7.4 billion, or 0.06% and 0.49% of GDP (Table 4.6).
Table 4.6: Estimated investment to cover non-standard workers in all social insurance schemes, by insurable
earning and contribution coverage, 2019
Option
Annual contribution per worker (RM)
Total non-standard workers (million)
Investment
(RM billion) (% GDP)
Full (2.65%)
Partial (1.33%) *
Full Partial Full Partial
Minimum insurable earning, RM1,050
333.90 166.95
5.9
2.0 1.0 0.13 0.06
Maximum insurable earning, RM3,950
1,256.10 628.05 7.4 3.7 0.49 0.24
Note: *The other half is covered by workers
Source: SOCSO (n.d.-f), DOS (2021f), DOS (2020b), KRI calculations
183 ILO (2019a)
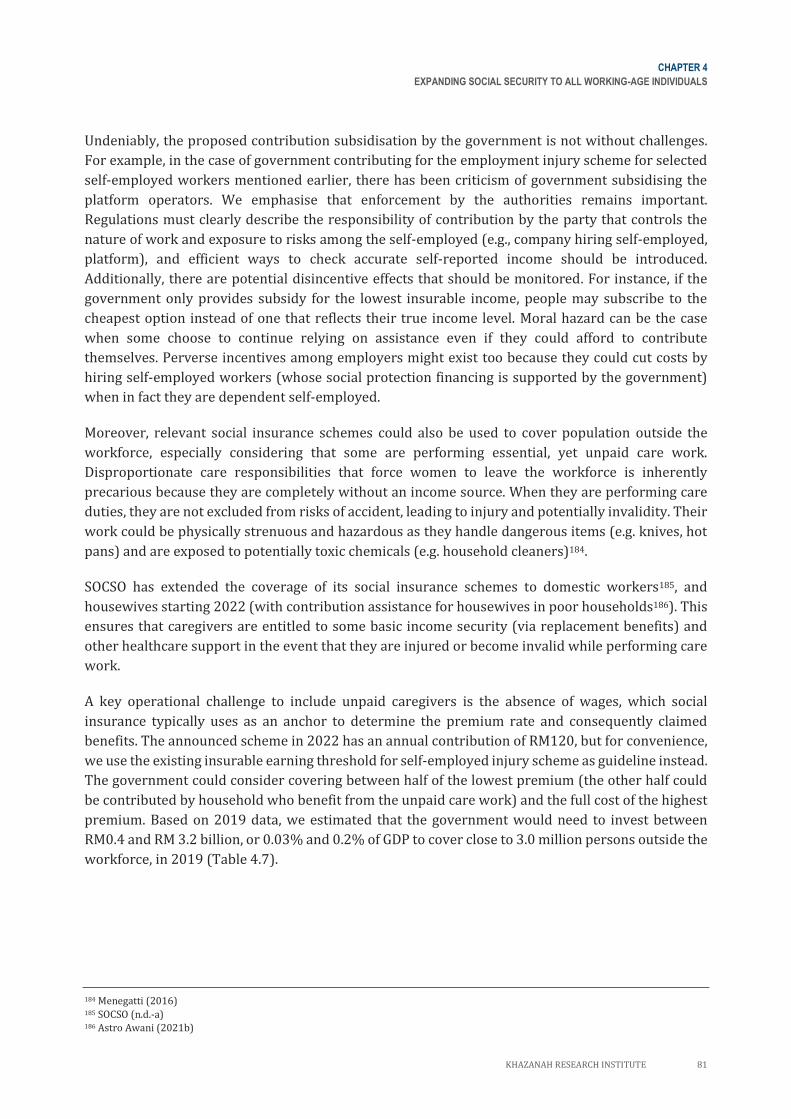
CHAPTER 4
EXPANDING SOCIAL SECURITY TO ALL WORKING-AGE INDIVIDUALS
KHAZANAH RESEARCH INSTITUTE 81
Undeniably, the proposed contribution subsidisation by the government is not without challenges.
For example, in the case of government contributing for the employment injury scheme for selected
self-employed workers mentioned earlier, there has been criticism of government subsidising the
platform operators. We emphasise that enforcement by the authorities remains important.
Regulations must clearly describe the responsibility of contribution by the party that controls the
nature of work and exposure to risks among the self-employed (e.g., company hiring self-employed,
platform), and efficient ways to check accurate self-reported income should be introduced.
Additionally, there are potential disincentive effects that should be monitored. For instance, if the
government only provides subsidy for the lowest insurable income, people may subscribe to the
cheapest option instead of one that reflects their true income level. Moral hazard can be the case
when some choose to continue relying on assistance even if they could afford to contribute
themselves. Perverse incentives among employers might exist too because they could cut costs by
hiring self-employed workers (whose social protection financing is supported by the government)
when in fact they are dependent self-employed.
Moreover, relevant social insurance schemes could also be used to cover population outside the
workforce, especially considering that some are performing essential, yet unpaid care work.
Disproportionate care responsibilities that force women to leave the workforce is inherently
precarious because they are completely without an income source. When they are performing care
duties, they are not excluded from risks of accident, leading to injury and potentially invalidity. Their
work could be physically strenuous and hazardous as they handle dangerous items (e.g. knives, hot
pans) and are exposed to potentially toxic chemicals (e.g. household cleaners)184.
SOCSO has extended the coverage of its social insurance schemes to domestic workers185, and
housewives starting 2022 (with contribution assistance for housewives in poor households186). This
ensures that caregivers are entitled to some basic income security (via replacement benefits) and
other healthcare support in the event that they are injured or become invalid while performing care
work.
A key operational challenge to include unpaid caregivers is the absence of wages, which social
insurance typically uses as an anchor to determine the premium rate and consequently claimed
benefits. The announced scheme in 2022 has an annual contribution of RM120, but for convenience,
we use the existing insurable earning threshold for self-employed injury scheme as guideline instead.
The government could consider covering between half of the lowest premium (the other half could
be contributed by household who benefit from the unpaid care work) and the full cost of the highest
premium. Based on 2019 data, we estimated that the government would need to invest between
RM0.4 and RM 3.2 billion, or 0.03% and 0.2% of GDP to cover close to 3.0 million persons outside the
workforce, in 2019 (Table 4.7).
184 Menegatti (2016) 185 SOCSO (n.d.-a) 186 Astro Awani (2021b)
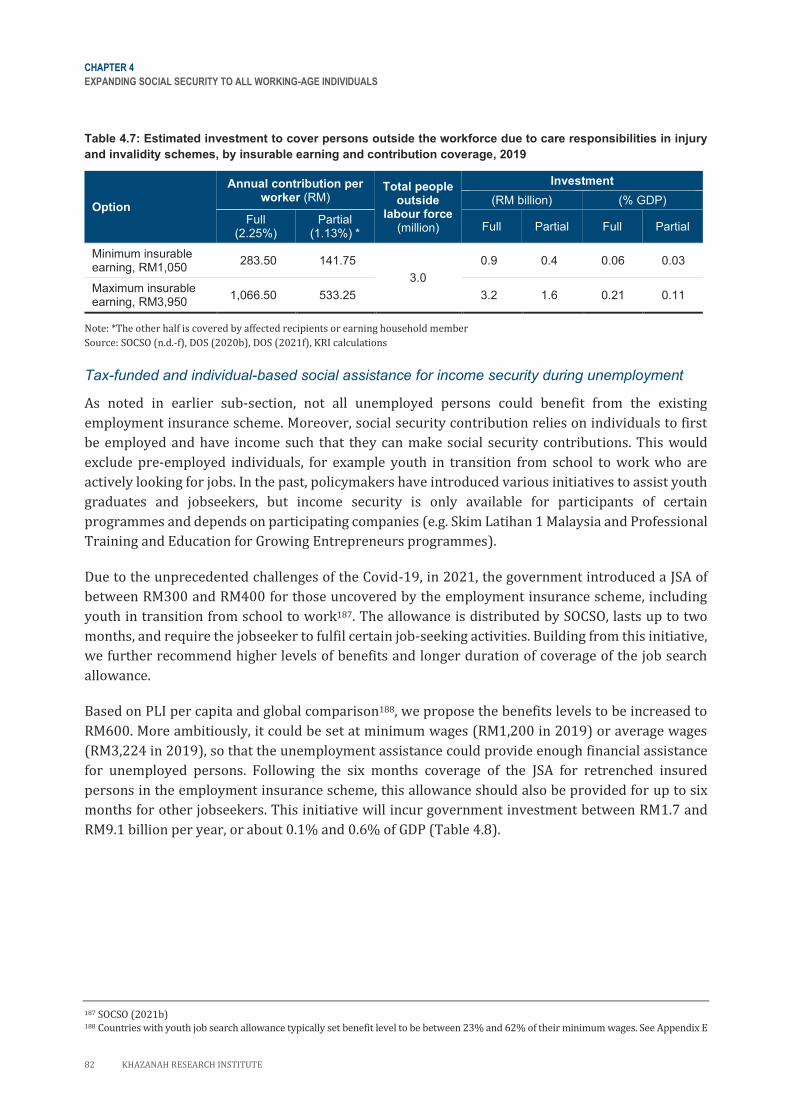
CHAPTER 4
EXPANDING SOCIAL SECURITY TO ALL WORKING-AGE INDIVIDUALS
82 KHAZANAH RESEARCH INSTITUTE
Table 4.7: Estimated investment to cover persons outside the workforce due to care responsibilities in injury
and invalidity schemes, by insurable earning and contribution coverage, 2019
Option
Annual contribution per worker (RM)
Total people outside
labour force (million)
Investment
(RM billion) (% GDP)
Full (2.25%)
Partial (1.13%) *
Full Partial Full Partial
Minimum insurable earning, RM1,050
283.50 141.75
3.0
0.9 0.4 0.06 0.03
Maximum insurable earning, RM3,950
1,066.50 533.25 3.2 1.6 0.21 0.11
Note: *The other half is covered by affected recipients or earning household member
Source: SOCSO (n.d.-f), DOS (2020b), DOS (2021f), KRI calculations
Tax-funded and individual-based social assistance for income security during unemployment
As noted in earlier sub-section, not all unemployed persons could benefit from the existing
employment insurance scheme. Moreover, social security contribution relies on individuals to first
be employed and have income such that they can make social security contributions. This would
exclude pre-employed individuals, for example youth in transition from school to work who are
actively looking for jobs. In the past, policymakers have introduced various initiatives to assist youth
graduates and jobseekers, but income security is only available for participants of certain
programmes and depends on participating companies (e.g. Skim Latihan 1 Malaysia and Professional
Training and Education for Growing Entrepreneurs programmes).
Due to the unprecedented challenges of the Covid-19, in 2021, the government introduced a JSA of
between RM300 and RM400 for those uncovered by the employment insurance scheme, including
youth in transition from school to work187. The allowance is distributed by SOCSO, lasts up to two
months, and require the jobseeker to fulfil certain job-seeking activities. Building from this initiative,
we further recommend higher levels of benefits and longer duration of coverage of the job search
allowance.
Based on PLI per capita and global comparison188, we propose the benefits levels to be increased to
RM600. More ambitiously, it could be set at minimum wages (RM1,200 in 2019) or average wages
(RM3,224 in 2019), so that the unemployment assistance could provide enough financial assistance
for unemployed persons. Following the six months coverage of the JSA for retrenched insured
persons in the employment insurance scheme, this allowance should also be provided for up to six
months for other jobseekers. This initiative will incur government investment between RM1.7 and
RM9.1 billion per year, or about 0.1% and 0.6% of GDP (Table 4.8).
187 SOCSO (2021b) 188 Countries with youth job search allowance typically set benefit level to be between 23% and 62% of their minimum wages. See Appendix E
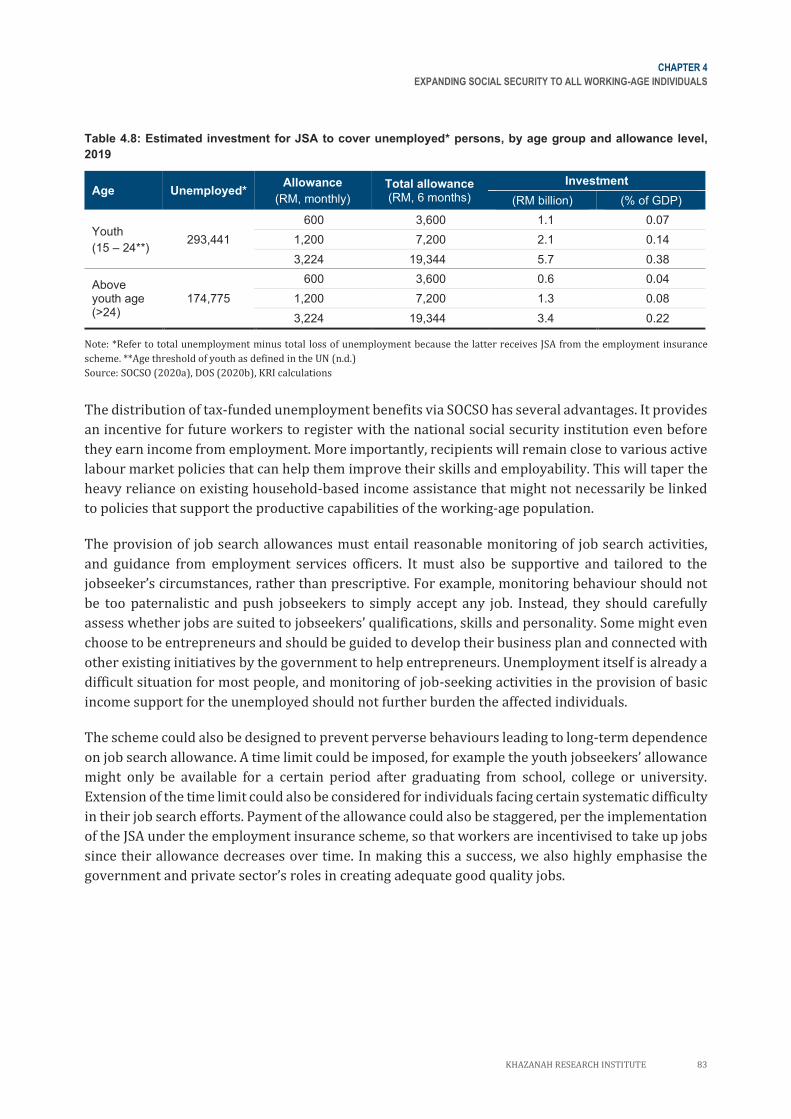
CHAPTER 4
EXPANDING SOCIAL SECURITY TO ALL WORKING-AGE INDIVIDUALS
KHAZANAH RESEARCH INSTITUTE 83
Table 4.8: Estimated investment for JSA to cover unemployed* persons, by age group and allowance level,
2019
Age Unemployed* Allowance
(RM, monthly)
Total allowance (RM, 6 months)
Investment
(RM billion) (% of GDP)
Youth
(15 – 24**) 293,441
600 3,600 1.1 0.07
1,200 7,200 2.1 0.14
3,224 19,344 5.7 0.38
Above youth age (>24)
174,775
600 3,600 0.6 0.04
1,200 7,200 1.3 0.08
3,224 19,344 3.4 0.22
Note: *Refer to total unemployment minus total loss of unemployment because the latter receives JSA from the employment insurance
scheme. **Age threshold of youth as defined in the UN (n.d.)
Source: SOCSO (2020a), DOS (2020b), KRI calculations
The distribution of tax-funded unemployment benefits via SOCSO has several advantages. It provides
an incentive for future workers to register with the national social security institution even before
they earn income from employment. More importantly, recipients will remain close to various active
labour market policies that can help them improve their skills and employability. This will taper the
heavy reliance on existing household-based income assistance that might not necessarily be linked
to policies that support the productive capabilities of the working-age population.
The provision of job search allowances must entail reasonable monitoring of job search activities,
and guidance from employment services officers. It must also be supportive and tailored to the
jobseeker’s circumstances, rather than prescriptive. For example, monitoring behaviour should not
be too paternalistic and push jobseekers to simply accept any job. Instead, they should carefully
assess whether jobs are suited to jobseekers’ qualifications, skills and personality. Some might even
choose to be entrepreneurs and should be guided to develop their business plan and connected with
other existing initiatives by the government to help entrepreneurs. Unemployment itself is already a
difficult situation for most people, and monitoring of job-seeking activities in the provision of basic
income support for the unemployed should not further burden the affected individuals.
The scheme could also be designed to prevent perverse behaviours leading to long-term dependence
on job search allowance. A time limit could be imposed, for example the youth jobseekers’ allowance
might only be available for a certain period after graduating from school, college or university.
Extension of the time limit could also be considered for individuals facing certain systematic difficulty
in their job search efforts. Payment of the allowance could also be staggered, per the implementation
of the JSA under the employment insurance scheme, so that workers are incentivised to take up jobs
since their allowance decreases over time. In making this a success, we also highly emphasise the
government and private sector’s roles in creating adequate good quality jobs.
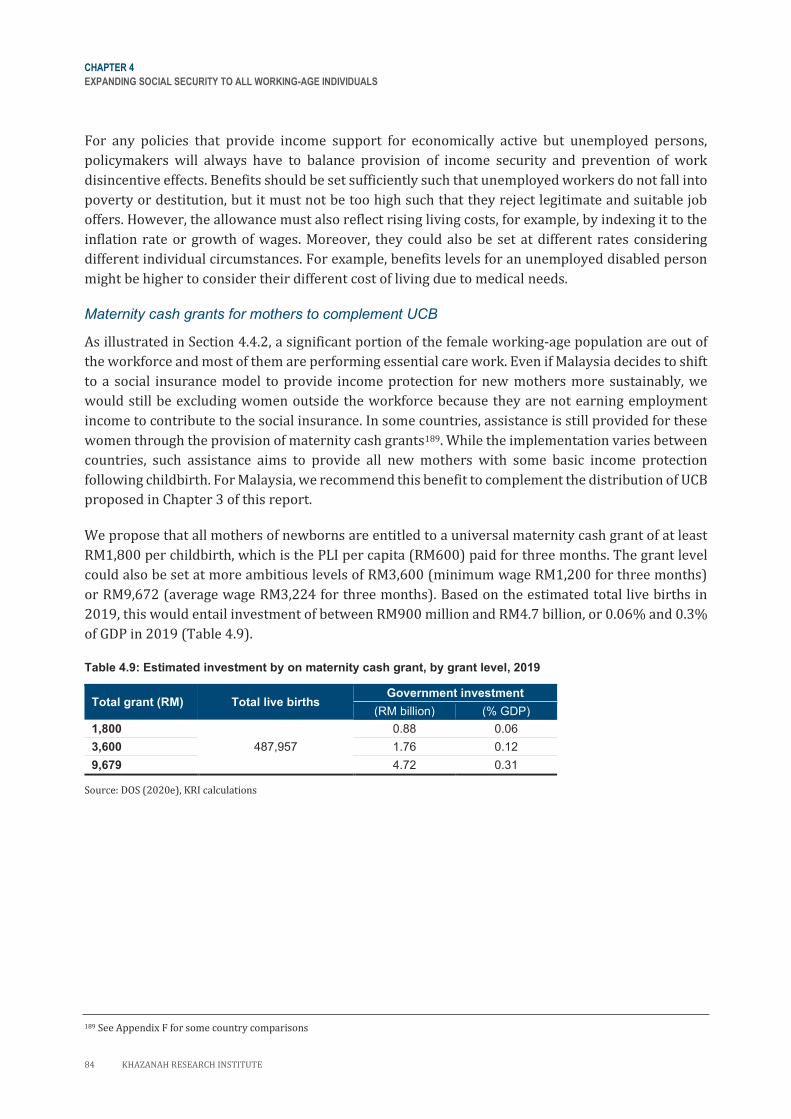
CHAPTER 4
EXPANDING SOCIAL SECURITY TO ALL WORKING-AGE INDIVIDUALS
84 KHAZANAH RESEARCH INSTITUTE
For any policies that provide income support for economically active but unemployed persons,
policymakers will always have to balance provision of income security and prevention of work
disincentive effects. Benefits should be set sufficiently such that unemployed workers do not fall into
poverty or destitution, but it must not be too high such that they reject legitimate and suitable job
offers. However, the allowance must also reflect rising living costs, for example, by indexing it to the
inflation rate or growth of wages. Moreover, they could also be set at different rates considering
different individual circumstances. For example, benefits levels for an unemployed disabled person
might be higher to consider their different cost of living due to medical needs.
Maternity cash grants for mothers to complement UCB
As illustrated in Section 4.4.2, a significant portion of the female working-age population are out of
the workforce and most of them are performing essential care work. Even if Malaysia decides to shift
to a social insurance model to provide income protection for new mothers more sustainably, we
would still be excluding women outside the workforce because they are not earning employment
income to contribute to the social insurance. In some countries, assistance is still provided for these
women through the provision of maternity cash grants189. While the implementation varies between
countries, such assistance aims to provide all new mothers with some basic income protection
following childbirth. For Malaysia, we recommend this benefit to complement the distribution of UCB
proposed in Chapter 3 of this report.
We propose that all mothers of newborns are entitled to a universal maternity cash grant of at least
RM1,800 per childbirth, which is the PLI per capita (RM600) paid for three months. The grant level
could also be set at more ambitious levels of RM3,600 (minimum wage RM1,200 for three months)
or RM9,672 (average wage RM3,224 for three months). Based on the estimated total live births in
2019, this would entail investment of between RM900 million and RM4.7 billion, or 0.06% and 0.3%
of GDP in 2019 (Table 4.9).
Table 4.9: Estimated investment by on maternity cash grant, by grant level, 2019
Total grant (RM) Total live births Government investment
(RM billion) (% GDP)
1,800
487,957
0.88 0.06
3,600 1.76 0.12
9,679 4.72 0.31
Source: DOS (2020e), KRI calculations
189 See Appendix F for some country comparisons
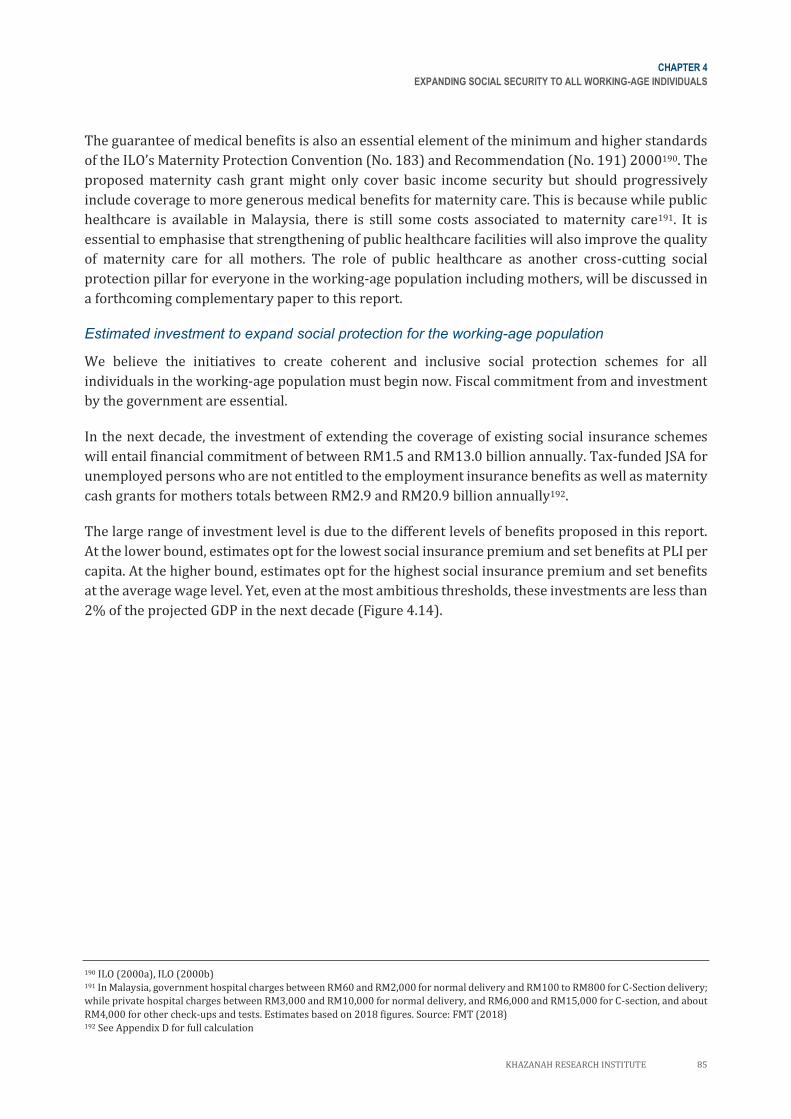
CHAPTER 4
EXPANDING SOCIAL SECURITY TO ALL WORKING-AGE INDIVIDUALS
KHAZANAH RESEARCH INSTITUTE 85
The guarantee of medical benefits is also an essential element of the minimum and higher standards
of the ILO’s Maternity Protection Convention (No. 183) and Recommendation (No. 191) 2000190. The
proposed maternity cash grant might only cover basic income security but should progressively
include coverage to more generous medical benefits for maternity care. This is because while public
healthcare is available in Malaysia, there is still some costs associated to maternity care191. It is
essential to emphasise that strengthening of public healthcare facilities will also improve the quality
of maternity care for all mothers. The role of public healthcare as another cross-cutting social
protection pillar for everyone in the working-age population including mothers, will be discussed in
a forthcoming complementary paper to this report.
Estimated investment to expand social protection for the working-age population
We believe the initiatives to create coherent and inclusive social protection schemes for all
individuals in the working-age population must begin now. Fiscal commitment from and investment
by the government are essential.
In the next decade, the investment of extending the coverage of existing social insurance schemes
will entail financial commitment of between RM1.5 and RM13.0 billion annually. Tax-funded JSA for
unemployed persons who are not entitled to the employment insurance benefits as well as maternity
cash grants for mothers totals between RM2.9 and RM20.9 billion annually192.
The large range of investment level is due to the different levels of benefits proposed in this report.
At the lower bound, estimates opt for the lowest social insurance premium and set benefits at PLI per
capita. At the higher bound, estimates opt for the highest social insurance premium and set benefits
at the average wage level. Yet, even at the most ambitious thresholds, these investments are less than
2% of the projected GDP in the next decade (Figure 4.14).
190 ILO (2000a), ILO (2000b) 191 In Malaysia, government hospital charges between RM60 and RM2,000 for normal delivery and RM100 to RM800 for C-Section delivery;
while private hospital charges between RM3,000 and RM10,000 for normal delivery, and RM6,000 and RM15,000 for C-section, and about
RM4,000 for other check-ups and tests. Estimates based on 2018 figures. Source: FMT (2018) 192 See Appendix D for full calculation
CHAPTER 4
EXPANDING SOCIAL SECURITY TO ALL WORKING-AGE INDIVIDUALS
86 KHAZANAH RESEARCH INSTITUTE
Figure 4.14: Estimated investment to expand social protection for the working-age population, by scenario,
2022 – 2030
Scenario 1: Lower bound, set at minimum premium and benefit at PLI per capita in 2019
• Partial coverage of lowest insurable earning for all existing social security schemes for all non-standard
workers, RM167 per year.
• Partial coverage of lowest insurable earning for injury and invalidity schemes for people outside the
workforce due to care responsibilities, RM142 per year.
• RM600 for jobseekers’ allowance for unemployed who do not get any benefits from employment
insurance scheme, for up to six months and indexed to inflation 2%.
• RM1,800 maternity cash grants to all mothers, indexed to inflation 2%.
Scenario 2: Higher bound, set at maximum premium and benefit at average wages in 2019
• Full coverage of highest insurable earning for all existing social security schemes for all non-standard
workers, RM1,256 per year.
• Full coverage of highest insurable earning for injury and invalidity schemes for people outside the
workforce due to care responsibilities, RM1,067 per year.
• RM3,224 for jobseekers’ allowance for unemployed who do not get any benefits from employment
insurance scheme, for up to six months and indexed to inflation.
• RM9,672 maternity cash grants to all mothers, indexed to inflation 2%.
Note: See Appendix G for the full list of assumptions and calculations
Source: KRI calculations
4.3
5.6
0
2
4
6
2022
2023
2024
2025
2026
2027
2028
2029
2030
Total investment level...
RM6b
0.27
0.22
0.0
0.1
0.2
0.3
2022
2023
2024
2025
2026
2027
2028
2029
2030
... and its share from total GDP
0.3%
Inclusion in SS JSA Maternity grant Total
26.5
33.8
0
10
20
30
40
2022
2023
2024
2025
2026
2027
2028
2029
2030
Total investment level...
RM40b
1.64
1.30
0.0
0.5
1.0
1.5
2.0
2022
2023
2024
2025
2026
2027
2028
2029
2030
... and its share from total GDP
2.0%
Inclusion in SS JSA Maternity grant Total
CHAPTER 4
EXPANDING SOCIAL SECURITY TO ALL WORKING-AGE INDIVIDUALS
KHAZANAH RESEARCH INSTITUTE 87
4.6 Concluding Remarks
This chapter looks at the provision of basic income protection among the working-age population in
facing core life cycle and employment-related risks. To date, Malaysia has relied on social insurance
to manage the risks of income loss due to injury, invalidity and unemployment. However, the social
security schemes are only mandatory for employees in the formal sector, with explicit contributory
responsibility by the employers. Voluntary schemes for the self-employed remain under-subscribed.
Income protection for women following childbirth also depends solely on employers’ ability to
provide paid maternity leave. As such, women with unscrupulous employers, those who are self-
employed, unemployed or outside the labour force remain vulnerable and this serious gap must be
addressed by social protection policies urgently.
To minimise the social protection gaps among the working-age population, this chapter then propose
the expansion of mandatory coverage of social insurance schemes, requiring the amendment of
multiple social security acts and regulations, and the revision of qualifying conditions to consider the
heterogenous nature of different groups in the working-age population. The utilisation of the social
insurance model to cover more life cycle risks for the working age population, such as maternity,
could also be considered, while at the same time, develop the coverage and financing of paid paternity
leave.
The government is an essential third pillar that provides essential contribution assistance, tax-
funded benefits for some unemployed persons and maternity cash grants for new mothers to
complement the UCB. We contend that this tax-funded assistance should be implemented within the
ambit of our existing social security institution (i.e. SOCSO) to avoid fragmentation and ensure
cohesive delivery of workforce-related public service throughout one’s life during the working age.
In addition to its inclusivity, this report attempts to uphold the principle of solidarity and risk sharing
between the government, employers, as well as workers of all categories. The proximity between
passive labour market policies (embedded in the income protection aspect of social security
schemes), and active labour market policies as advanced by SOCSO is also preserved. This ensures
that that all workers are prevented from falling into poverty when they face some catastrophic
events, promoted to recover from it and to continue being a productive member of the workforce.
The provision of such social protection floor smoothens one’s risks and vulnerabilities during the
working age and contributes significantly to their well-being.
88 KHAZANAH RESEARCH INSTITUTE
CHAPTER
05
ENSURING OLD-AGE INCOME SECURITY 89
5.1 Introduction 89
5.2 The Importance of Old-age Income
Security 89
5.3 Old-age Pension Provision in Malaysia 91
5.4 Comparison of Potential Solutions 100
5.4.1 EPF-centred solutions: Parametric
changes to existing scheme 101
5.4.2 BWE-centred solution 104
5.5 Policy Recommendation: Introducing
Social Insurance Pension 108
5.5.1 Life annuity as a mode of SIP’s
delivery 109
5.5.2 Key features of life annuity under
the SIP 111
5.6 Other Issues and Considerations 118
5.7 Concluding Remarks 119
KHAZANAH RESEARCH INSTITUTE 89
CHAPTER 5
ENSURING OLD-AGE INCOME SECURITY
…there is no method of avoiding the costs of ageing. In fact, all debate and policy decisions are about
how to allocate, in the fairest manner, the costs of ageing among all stakeholders. In this debate,
however, the term “fair” is open to interpretation, which is driven by the interests of those involved.
ASEAN Secretariat (2020)
5.1 Introduction
The future of a more aged society is nearer than we think. In 2020, Malaysia has transitioned to an
“ageing” population, whereby those aged 65 and older reached 7% of the population. The country is
projected to become “aged” in 2045 when the share of those aged 65 and older will reach 14% of the
population and “super-aged” by 2060, when those aged 65 and older will reach 20%193. In 2020, one
in 14 persons in Malaysia aged over 65, making up 2.3 million of the 32.4 million total population.
Based on the population forecast, older individuals194 will become more prevalent, expected to reach
one in seven in 2045 and one in five in 2060. Similarly, the median age of the population is rising; in
2020, it was 31 years old and in 2060 it is projected to be 43 years old.
Longevity is to be celebrated but ageing often increases the risk of deteriorating income, health and
social support. While ageing is inevitable, the experience varies depending on how well the risks are
managed. Multipronged policies must accompany the multifaceted nature of old-age vulnerabilities,
but a detailed discussion on these challenges goes beyond the scope of this report. Instead, this
chapter focuses on the risk of income insecurity in old age which is one of the key factors
underpinning other challenges including homelessness, disability, as well as physical and mental
health issues. In this context, an effective system that is forward-looking in managing income
insecurity during old age matters and must be extended to all.
This chapter first outlines the importance of old-age income security. It then discusses key gaps in
the pension ecosystem in Malaysia and later compares and contrasts existing solution options.
Finally, it offers Social Insurance Pension (SIP) as a policy option to expand pension coverage and
help improve pension affordability.
5.2 The Importance of Old-age Income Security
Old-age income security or the ability to meet basic needs in old age is grounded in human rights
instruments and international labour standards. It is a pertinent issue as Malaysia is rapidly ageing,
with changing family structure and weakening monetary family support. Weaker labour market
participation and deteriorating capacity to work also make older adults more vulnerable to poverty. At
the same time, the current pension system has yet to deliver the much-needed protection coverage with
many groups falling through the cracks. Against this backdrop, improving old-age pension has shown
promising results in improving the lives of the recipients, their households and the larger economy.
Figure 5.1 summarises key points supporting the expansion of old-age income security in Malaysia.
193 Unless otherwise stated all demographic statistics are KRI calculations based on the medium fertility variant of the 2019 revision of the
United Nations Population Forecast via CEIC (n.d.). 194 See Box 5.1 for a brief note on definitions of older persons
CHAPTER 5
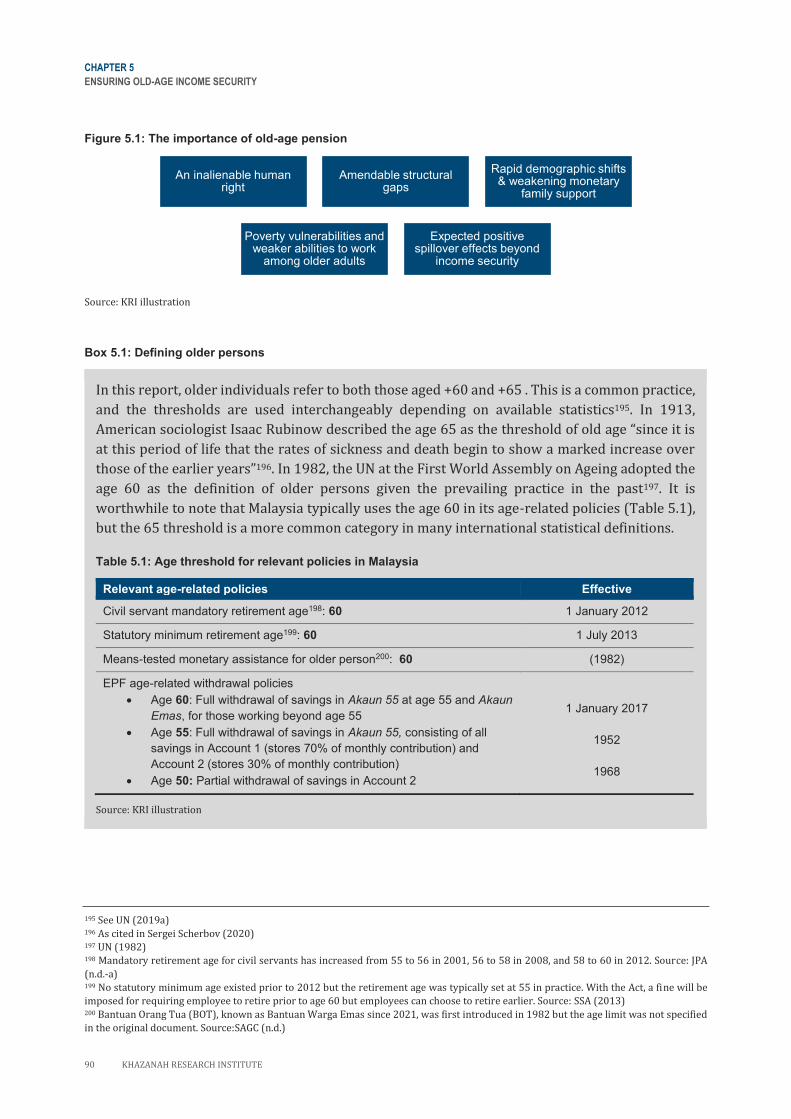
CHAPTER 5
ENSURING OLD-AGE INCOME SECURITY
90 KHAZANAH RESEARCH INSTITUTE
Figure 5.1: The importance of old-age pension
Source: KRI illustration
Box 5.1: Defining older persons
In this report, older individuals refer to both those aged +60 and +65 . This is a common practice,
and the thresholds are used interchangeably depending on available statistics195. In 1913,
American sociologist Isaac Rubinow described the age 65 as the threshold of old age “since it is
at this period of life that the rates of sickness and death begin to show a marked increase over
those of the earlier years”196. In 1982, the UN at the First World Assembly on Ageing adopted the
age 60 as the definition of older persons given the prevailing practice in the past197. It is
worthwhile to note that Malaysia typically uses the age 60 in its age-related policies (Table 5.1),
but the 65 threshold is a more common category in many international statistical definitions.
Table 5.1: Age threshold for relevant policies in Malaysia
Relevant age-related policies Effective
Civil servant mandatory retirement age198: 60 1 January 2012
Statutory minimum retirement age199: 60 1 July 2013
Means-tested monetary assistance for older person200: 60 (1982)
EPF age-related withdrawal policies
• Age 60: Full withdrawal of savings in Akaun 55 at age 55 and Akaun
Emas, for those working beyond age 55
• Age 55: Full withdrawal of savings in Akaun 55, consisting of all
savings in Account 1 (stores 70% of monthly contribution) and
Account 2 (stores 30% of monthly contribution)
• Age 50: Partial withdrawal of savings in Account 2
1 January 2017
1952
1968
Source: KRI illustration
195 See UN (2019a) 196 As cited in Sergei Scherbov (2020) 197 UN (1982) 198 Mandatory retirement age for civil servants has increased from 55 to 56 in 2001, 56 to 58 in 2008, and 58 to 60 in 2012. Source: JPA
(n.d.-a) 199 No statutory minimum age existed prior to 2012 but the retirement age was typically set at 55 in practice. With the Act, a fine will be
imposed for requiring employee to retire prior to age 60 but employees can choose to retire earlier. Source: SSA (2013) 200 Bantuan Orang Tua (BOT), known as Bantuan Warga Emas since 2021, was first introduced in 1982 but the age limit was not specified
in the original document. Source:SAGC (n.d.)
An inalienable human right
Amendable structural gaps
Rapid demographic shifts & weakening monetary
family support
Poverty vulnerabilities and weaker abilities to work
among older adults
Expected positive spillover effects beyond
income security

CHAPTER 5
ENSURING OLD-AGE INCOME SECURITY
KHAZANAH RESEARCH INSTITUTE 91
5.3 Old-age Pension Provision in Malaysia
The right to income security is part of the Universal Declaration of Human Rights. This right is later
operationalised in other international standards (see Appendix H for more details). These
international documents anchor the ideal by providing broad tools to design a social security system
where three main income-security contingencies are covered. These are old age, disability and loss
of a breadwinner.
While Malaysia is not a signatory of the relevant international conventions, the country has in place
schemes that strive to protect all three income-related contingencies (see Appendix I for key features
of each scheme). This chapter zooms in on old age contingency, excluding discussions on disability
pension and survivors’ pension201. As illustrated in Table 5.2, the pension provision for old age has
three components: a tax-funded first tier, a second tier of mandatory individual accounts and a
voluntary third tier. The first tier aims to ensure a minimum standard of living, the second targets
income replacement (the value depends on past earnings or contributions), and the third tier consists
of voluntary retirement savings. However, even with the three tiers, not all individuals are covered
and benefits vary from one scheme to another. This inconsistency reflects structural shortcomings.
Table 5.2 : Old-age retirement schemes in Malaysia
Old-age income
security
Stipulated ILO
conventions:
i) No. 102 (Social
security minimum
standards) and
ii) No. 128 (Invalidity,
Old-Age and
Survivors' Benefits)
Scheme Agency & governing document/legislation Tier
Means-tested allowances for older individuals
JKM National Policy for Older Persons, 2011
First tier
Mandatory retirement savings
EPF Employees Provident Fund Act 1991
LTAT Tabung Angkatan Tentera Act 1973 Second
tier
Civil service pension KWAP Retirement Fund Act 2007 (Act 662)
JPA Article 147 of the Constitution
Voluntary private retirement
PRS Capital Markets and Services Act 2007
Third tier
Note: The LTAT is a government statutory body providing retirement savings scheme for officers and members of other ranks of the
Malaysian Armed Forces and the volunteer forces; KWAP is Malaysia’s civil service pension fund; JPA (Jabatan Perkhidmatan Awam) is the
Public Service Department; PRS refers to Private Retirement Scheme
Source: KRI illustration
Table 5.3 shows there were 22.7 million working-age individuals aged between 15 and 64 in 2019.
33% of this population or 7.6 million individuals actively contributed to their retirement savings in
the EPF. Active contributors here refer to those who contributed at least once during the reported
year. In the same year, almost 1.4 million civil servants including armed forces personnel were either
eligible for tax-funded pensions through KWAP or contributing to other retirement funds, like the
LTAT. This left almost 13.9 million outside the formal retirement arrangements or 60% of the total
working-age individuals202.
201 SOCSO provides invalidity pension and survivors’ pension for its contributors. In 2017, SOCSO received over 14,000 applications for
invalidity pension, only 40% of which were eventually approved. The high proportion of applications has been cited to indicate applicants
trying to receive SOCSO pension to meet their old-age income needs. Source: Rabi et al. (2019) 202 With this deductive method, the total and proportion of uncovered individuals vary based on the denominator. Out of 15.6 million
labour force, the total would be 6.77 million or 43.4% in 2019. Out of 15.1 million employed persons, the total would be 6.3 million or
41.5% in 2019. Note that computing coverage for old age as a percentage of the working-age population is a common practice
internationally.

CHAPTER 5
ENSURING OLD-AGE INCOME SECURITY
92 KHAZANAH RESEARCH INSTITUTE
While some within the excluded population can eventually seek assistance from the BWE
programme—tax-funded financial assistance for poor older persons—as will be shown below, the
scale of the programme is small. This means the majority would have to rely on individual efforts like
personal savings, house, land ownership, or intra-generational family transfer. Yet, for most, these
other sources of income may not always be available to them. Declining fertility rate, shrinking
household size203, the weaker prevalence of a multi-generational household204, and rising household
debt205 also point to a future where old-age income security would depend less and less on monetary
family transfer.
Table 5.3: Number and share of persons in the working-age population, by old-age retirement scheme, 2009
and 2019
2009 2019
Total Share Total Share
Estimated working-age individuals without formal old-age retirement schemes
11,200,327 62.3% 13,869,370 61.2%
EPF active contributors aged below 65 5,773,302 32.1% 7,545,935 33.3%
Civil service (excludes the Malaysian Armed Forces and the Royal Malaysia Police)
1,015,719 5.6% 1,265,335 5.6%
Armed forces personnel 133,600 0.7% 136,000 0.6%
Working-age individuals (15 to 64 years old) 17,989,348 100.0% 22,680,640 100.0%
Note: Estimated uncovered individuals are a lower bound as it discounts a potential overlap between EPF active members and civil
servants; both include non-pensionable public sector employees. The size of the overlap is expected to be small. Armed forces personnel
are used as a proxy for LTAT contributors; 2018 data was used for the year 2019. Account-holders for the PRS are also excluded from the
estimation as PRS members are expected to have a higher overlap with EPF active members, with 71% of PRS members being employed
Source: SC (2019).
Source: DOS (various years-a), EPF (various years), KPWKM (2020), World Bank via CEIC (n.d.), KRI calculations
The meagre improvement of estimated working-age individuals without old age retirement schemes
from 62.3% in 2009 to only 61.2% in 2019 indicates a persistent coverage gap (Table 5.3). This is
despite the EPF’s efforts to expand coverage by introducing voluntary savings schemes for i-Saraan
(previously known as the 1Malaysia Retirement Savings Scheme) for self-employed in 2010 and i-
Suri for housewives registered under the National Poverty Data Bank (e-Kasih) in 2018206. As a
simple comparison, out of the 2.5 million Malaysian citizens working on their own, only 121,000 or
5% registered with i-Saraan in 2019 (Figure 5.2). Meanwhile, only 81,000 housewives registered
with i-Suri. This is 3% of the 2.9 million women citing housework for not seeking work or 20% of the
total number of poor households among citizens only, assuming one member from each poor
household is eligible for i-Suri.
203 Household size shrunk from 4.3 in 2005 to 3.9 in 2019. The declining pattern is observed in both rural and urban areas. Source: DOS via
CEIC (n.d.) 204 The proportion of three-generation households declined from 41.1% in 2004 to 30.7% in 2016. Source: World Bank (2020a) 205 Household debt as percentage of nominal GDP has increased from its all-time low of 60.4% in 2008 to 93.3% in 2020. Source: BNM via
World Bank (n.d.-b) 206 The amendment to allow self-employed to contribute to the EPF was made in 1977 under the EPF Ordinance 1951.
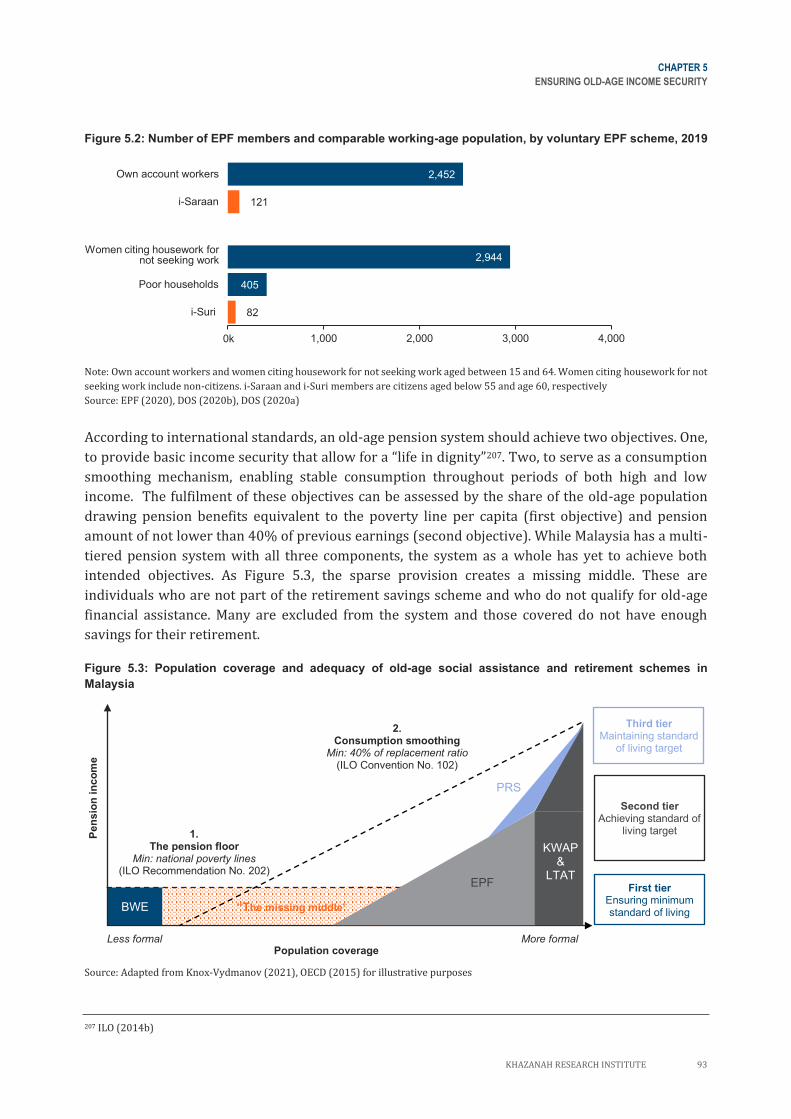
CHAPTER 5
ENSURING OLD-AGE INCOME SECURITY
KHAZANAH RESEARCH INSTITUTE 93
Pen
sio
n in
co
me
2. Consumption smoothing
Min: 40% of replacement ratio
(ILO Convention No. 102)
1.
The pension floor
Min: national poverty lines
(ILO Recommendation No. 202)
Population coverage
BWE
Third tier Maintaining standard
of living target
Second tier Achieving standard of
living target
First tier Ensuring minimum standard of living
More formal Less formal
“The missing middle”
Figure 5.2: Number of EPF members and comparable working-age population, by voluntary EPF scheme, 2019
Note: Own account workers and women citing housework for not seeking work aged between 15 and 64. Women citing housework for not
seeking work include non-citizens. i-Saraan and i-Suri members are citizens aged below 55 and age 60, respectively
Source: EPF (2020), DOS (2020b), DOS (2020a)
According to international standards, an old-age pension system should achieve two objectives. One,
to provide basic income security that allow for a “life in dignity”207. Two, to serve as a consumption
smoothing mechanism, enabling stable consumption throughout periods of both high and low
income. The fulfilment of these objectives can be assessed by the share of the old-age population
drawing pension benefits equivalent to the poverty line per capita (first objective) and pension
amount of not lower than 40% of previous earnings (second objective). While Malaysia has a multi-
tiered pension system with all three components, the system as a whole has yet to achieve both
intended objectives. As Figure 5.3, the sparse provision creates a missing middle. These are
individuals who are not part of the retirement savings scheme and who do not qualify for old-age
financial assistance. Many are excluded from the system and those covered do not have enough
savings for their retirement.
Figure 5.3: Population coverage and adequacy of old-age social assistance and retirement schemes in
Malaysia
Source: Adapted from Knox-Vydmanov (2021), OECD (2015) for illustrative purposes
207 ILO (2014b)
82
405
2,944
121
2,452
0 1,000 2,000 3,000 4,000
i-Suri
Poor households
Women citing houseworkfor not seeking work
i-Saraan
Own account workers
Thousands
0k
Women citing housework for not seeking work
PRS
KWAP &
LTAT EPF
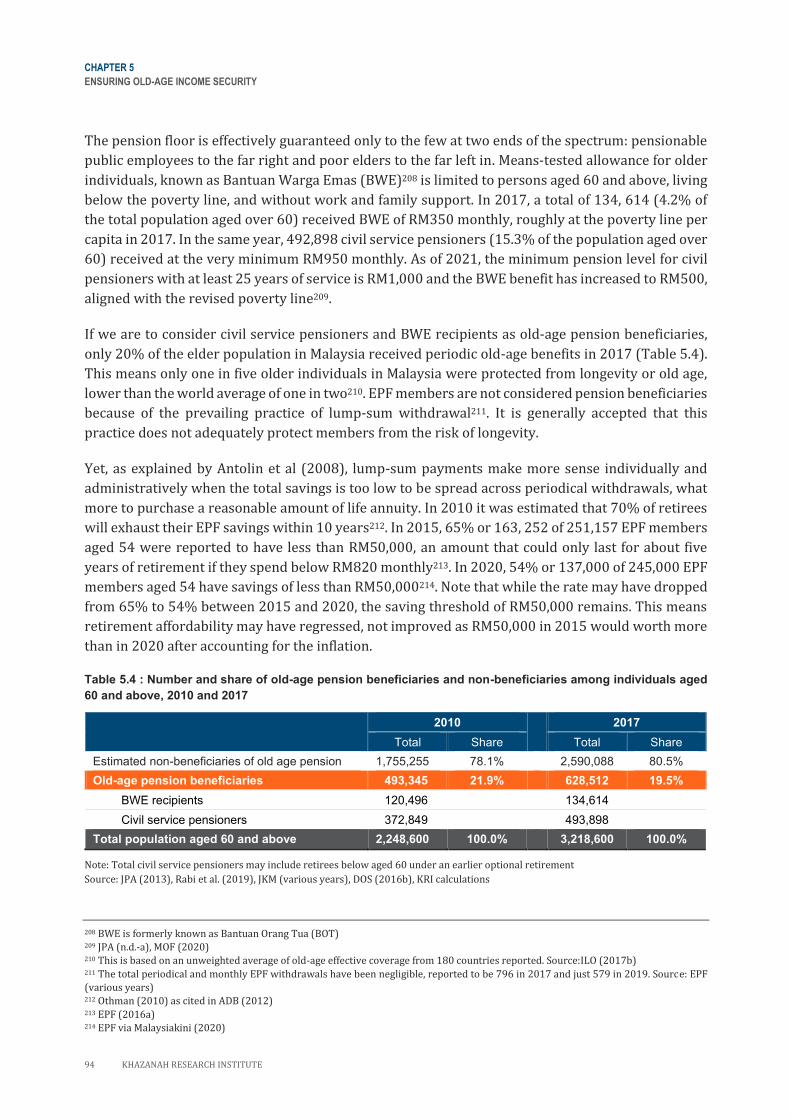
CHAPTER 5
ENSURING OLD-AGE INCOME SECURITY
94 KHAZANAH RESEARCH INSTITUTE
The pension floor is effectively guaranteed only to the few at two ends of the spectrum: pensionable
public employees to the far right and poor elders to the far left in. Means-tested allowance for older
individuals, known as Bantuan Warga Emas (BWE)208 is limited to persons aged 60 and above, living
below the poverty line, and without work and family support. In 2017, a total of 134, 614 (4.2% of
the total population aged over 60) received BWE of RM350 monthly, roughly at the poverty line per
capita in 2017. In the same year, 492,898 civil service pensioners (15.3% of the population aged over
60) received at the very minimum RM950 monthly. As of 2021, the minimum pension level for civil
pensioners with at least 25 years of service is RM1,000 and the BWE benefit has increased to RM500,
aligned with the revised poverty line209.
If we are to consider civil service pensioners and BWE recipients as old-age pension beneficiaries,
only 20% of the elder population in Malaysia received periodic old-age benefits in 2017 (Table 5.4).
This means only one in five older individuals in Malaysia were protected from longevity or old age,
lower than the world average of one in two210. EPF members are not considered pension beneficiaries
because of the prevailing practice of lump-sum withdrawal211. It is generally accepted that this
practice does not adequately protect members from the risk of longevity.
Yet, as explained by Antolin et al (2008), lump-sum payments make more sense individually and
administratively when the total savings is too low to be spread across periodical withdrawals, what
more to purchase a reasonable amount of life annuity. In 2010 it was estimated that 70% of retirees
will exhaust their EPF savings within 10 years212. In 2015, 65% or 163, 252 of 251,157 EPF members
aged 54 were reported to have less than RM50,000, an amount that could only last for about five
years of retirement if they spend below RM820 monthly213. In 2020, 54% or 137,000 of 245,000 EPF
members aged 54 have savings of less than RM50,000214. Note that while the rate may have dropped
from 65% to 54% between 2015 and 2020, the saving threshold of RM50,000 remains. This means
retirement affordability may have regressed, not improved as RM50,000 in 2015 would worth more
than in 2020 after accounting for the inflation.
Table 5.4 : Number and share of old-age pension beneficiaries and non-beneficiaries among individuals aged
60 and above, 2010 and 2017
2010
2017
Total Share Total Share
Estimated non-beneficiaries of old age pension 1,755,255 78.1% 2,590,088 80.5%
Old-age pension beneficiaries 493,345 21.9% 628,512 19.5%
BWE recipients 120,496 134,614
Civil service pensioners 372,849 493,898
Total population aged 60 and above 2,248,600 100.0% 3,218,600 100.0%
Note: Total civil service pensioners may include retirees below aged 60 under an earlier optional retirement
Source: JPA (2013), Rabi et al. (2019), JKM (various years), DOS (2016b), KRI calculations
208 BWE is formerly known as Bantuan Orang Tua (BOT) 209 JPA (n.d.-a), MOF (2020) 210 This is based on an unweighted average of old-age effective coverage from 180 countries reported. Source:ILO (2017b) 211 The total periodical and monthly EPF withdrawals have been negligible, reported to be 796 in 2017 and just 579 in 2019. Source: EPF
(various years) 212 Othman (2010) as cited in ADB (2012) 213 EPF (2016a) 214 EPF via Malaysiakini (2020)
CHAPTER 5
ENSURING OLD-AGE INCOME SECURITY
KHAZANAH RESEARCH INSTITUTE 95
With only the very poor older persons and the pensioners of the civil service sector covered by the
tax-funded old-age pension; others are left with the EPF to accumulate savings for their retirement.
However, as shown in Table 5.3, the EPF has yet to successfully expand its coverage beyond the
formal salaried employees. In 2019, only half of the total 14.6 million EPF members actively
contributed to their accounts and among the total active members (7.6 million), the total registered
members in voluntary schemes (0.2 million in 2019) only made up a dismal 2.7%215. For those with
EPF accounts, as highlighted above, most of them do not have adequate retirement savings to last for
long.
Considering that more than half of EPF members aged 54 in 2020 had less than RM50,000 in 2020216,
most EPF members are far from meeting the target set in 2019 of meeting RM240,000 total savings
by age 55. This basic saving targets can afford members RM1,000 a month for 20 years of retirement,
from age 55 to 75 as aligned with Malaysia’s life expectancy217. This RM1,000 monthly pension is
equivalent to 40% of the median monthly salaries of RM2,442 for paid employees in 2019, arguably
fulfilling the minimum replacement rate of 40% for regular wage earners218. The level was also said
to be consistent with the minimum pension for civil service, which was raised from RM950 to
RM1,000 in 2018219. However, this rate of about RM1,000 is lower than the estimated monthly
expenses of RM2,450 for a senior citizen to lead a reasonable standard of living220.
This issue of inadequacy is further exacerbated by the decision to provide short-term relief for Covid-
19 by facilitating early access to retirement savings. While other countries also provide early access
to retirement, many of the schemes are conditional to specific Covid-19 financial hardships221. Based
on the OECD 2020 report, only a few countries like Chile and Peru provide unconditional access
similar to Malaysia222. In late February 2021, the EPF estimated that before the Covid-19 withdrawal
schemes i.e. i-Lestari and i-Sinar were introduced, only 3.3 million or 22% of all their members were
meeting the basic savings target223. With the Covid-19 schemes, the figures dropped further to 2.7
million or 18% of all EPF members224. Between April 2020 and June 2021 withdrawals for Account 2
via the i-Lestari facility, Account 1 through the i-Sinar facility, and a combination of Account 1 and 2
via the i-Citra facility were made available to all EPF members (see Table 5.5). As of August 2021, the
EPF reported that about 39% or 4.8 million of 12.5 million members aged below 55 have near zero
retirement savings of less than RM1,000225.
215 EPF (2020), KRI calculations 216 EPF via Malaysiakini (2020) 217 EPF Basic Savings target by age 55 was revised from RM 120,000 in 2008, RM 196,800 in 2014, RM 228,000 in 2017 and RM 240,000
in 2019. Source:EPF (n.d.-a) 218 DOS (2021f), KRI calculations 219 The minimum monthly pension for civil service increased from RM720 in 2009, RM820 in 2012, RM950 in 2016, RM1,000 in 2018.
Source: JPA (n.d.-a) 220 The Centre for Social Welfare Research (SWRC) as cited in Malaysiakini (2020) 221 OECD (2020) 222 OECD (2020) 223 EPF (2021) via Astro Awani (2021a) 224 EPP via Astro Awani (2021a), EPF (2021) KRI calculations 225 EPF (2021), KRI calculations

CHAPTER 5
ENSURING OLD-AGE INCOME SECURITY
96 KHAZANAH RESEARCH INSTITUTE
Table 5.5 Withdrawal range, by EPF Covid-19 pre-withdrawal schemes, 2020 to 2022
Year Month Announcement i-Lestari (Account 2) i-Sinar (Account 1) i-Citra (Max Account 2
then Account 1)
Category A
< RM100K
Category B > RM100K
Max
(RM6,000) Min
(RM600) Max
(RM10,000) Max
(RM60,000) Max
(RM5,000) Min
(RM250)
2020
March
April i-Lestari launched
May i-Lestari first credited 500 50
June 500 50
July 500 50
August 500 50
September 500 50
October 500 50
November i-Sinar announced 500 50
December
i-Sinar automatic approval announced i-Sinar Category 1 application opened
500 50
2021
January i-Sinar Category 2 application opened i-Sinar first credited
500 50 5,000 10,000
February 500 50 1,000 10,000
March i-Lestari ended i-Lestari could apply for i-Sinar
500 50 1,000 10,000
April 500 50 1,000 10,000
May 1,000 10,000
June i-Sinar application ended 1,000 10,000
July i-Citra application opened 1,000 50
August i-Citra first credited 1,000 50
September i-Citra application ended 1,000 50
October 1,000 50
November 1,000 50
December
2022 January
February i-Citra ends
Note: Payment period for i-Lestari and i-Citra depends on application month
Source: KRI illustration
While the Covid-19 early withdrawals have aggravated the problem of savings inadequacy, the issues
of inadequate coverage and savings have pre-dated the Covid-19 crisis. For the large majority of the
population, Malaysia’s pension provision is neither providing the pension floor, nor adequate
consumption smoothing. The next section will discuss key existing solutions to tackle the missing
middle and strengthen old-age income adequacy along with their inherent limitations.
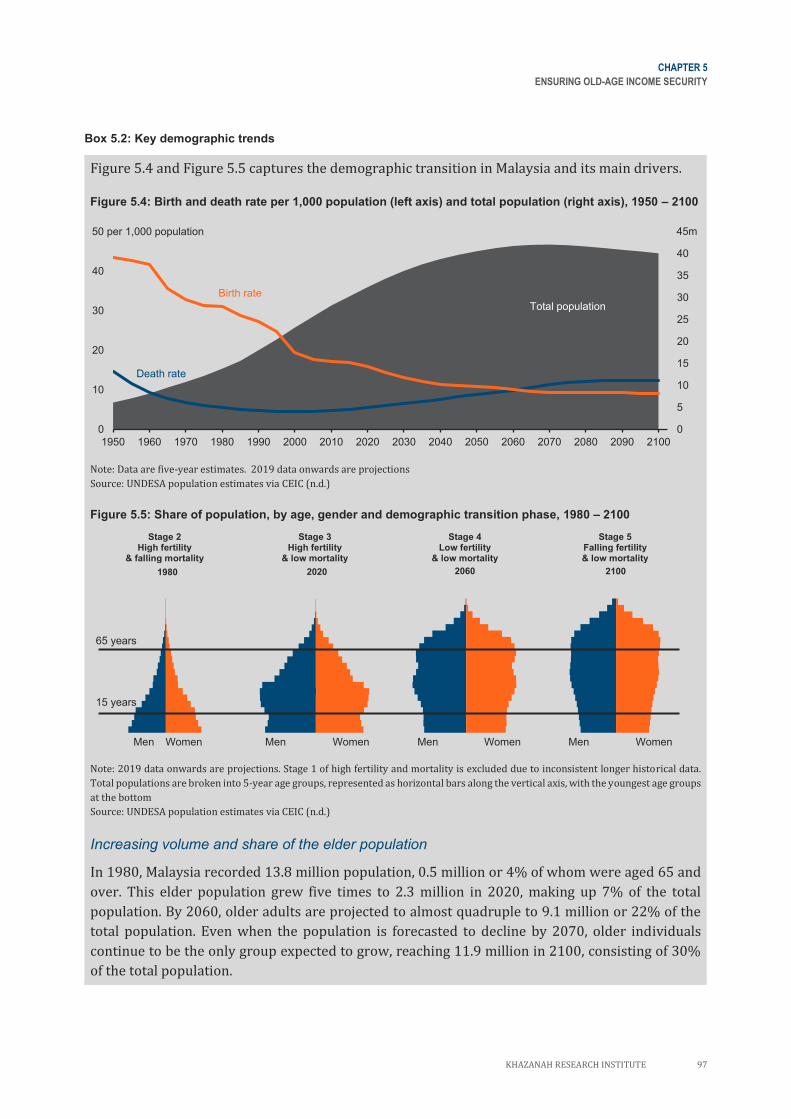
CHAPTER 5
ENSURING OLD-AGE INCOME SECURITY
KHAZANAH RESEARCH INSTITUTE 97
Box 5.2: Key demographic trends
Figure 5.4 and Figure 5.5 captures the demographic transition in Malaysia and its main drivers.
Figure 5.4: Birth and death rate per 1,000 population (left axis) and total population (right axis), 1950 – 2100
Note: Data are five-year estimates. 2019 data onwards are projections
Source: UNDESA population estimates via CEIC (n.d.)
Figure 5.5: Share of population, by age, gender and demographic transition phase, 1980 – 2100
Stage 2 High fertility
& falling mortality
Stage 3 High fertility
& low mortality
Stage 4 Low fertility
& low mortality
Stage 5 Falling fertility & low mortality
Men Women Men Women Men Women Men Women
Note: 2019 data onwards are projections. Stage 1 of high fertility and mortality is excluded due to inconsistent longer historical data.
Total populations are broken into 5-year age groups, represented as horizontal bars along the vertical axis, with the youngest age groups
at the bottom
Source: UNDESA population estimates via CEIC (n.d.)
Increasing volume and share of the elder population
In 1980, Malaysia recorded 13.8 million population, 0.5 million or 4% of whom were aged 65 and
over. This elder population grew five times to 2.3 million in 2020, making up 7% of the total
population. By 2060, older adults are projected to almost quadruple to 9.1 million or 22% of the
total population. Even when the population is forecasted to decline by 2070, older individuals
continue to be the only group expected to grow, reaching 11.9 million in 2100, consisting of 30%
of the total population.
0
5
10
15
20
25
30
35
40
45
0
10
20
30
40
50
1950 1960 1970 1980 1990 2000 2010 2020 2030 2040 2050 2060 2070 2080 2090 2100
Birth rate
Death rate
Total population
50 per 1,000 population 45m
1980
65 years
15 years
2020 2060 2100
CHAPTER 5
ENSURING OLD-AGE INCOME SECURITY
98 KHAZANAH RESEARCH INSTITUTE
Reached the tail end of demographic dividend in 2020
In 2020, Malaysia experienced the tail end of a demographic dividend where a greater proportion
of the population was of young working age, as reflected in a mid-bulge age pyramid. This was after
55 years of favourable demographic period starting in 1965226, during which improvements in
labour supply, labour productivity, and savings are theorised to create a tailwind for strong
economic growth227. According to UNFA (n.d.), demographic dividend is “the economic growth
potential that can result from the shifts in a population’s age structure, mainly when the share of
the working-age population (15 to 64) is larger than the non-working-age share of the population
(14 and younger, and 65 and older)”. Rabi et al. (2019) estimated this by adding the number of
years where the working-age population’s growth exceeds the total population’s growth.
Less working-age individuals to support older individuals
From 2020 onwards, there will be fewer and fewer working-age individuals to support younger
and older generations, as seen in the inverted top-heavy pyramid in 2100 in Figure 5.4. The number
of persons of working age for every elder tumble from 16 in 1980, 10 in 2020 to just three in
2060228. Unless productivity increases faster and/or workers retire later, the shrinking working-
age population can affect the current sources of government revenue. In 2021, individual income
tax is estimated to account for 17.9% of the total government revenue of RM236.9 billion, almost
identical to the size of indirect tax229.
Falling mortality and fertility as the main drivers of the demographic transition
Like other countries, falling fertility typically coincides with better healthcare access along with
improved educational and labour outcomes for women230. On average, a woman in Malaysia was
expected to have about six children (6.3) in 1958, four (3.5) in 1990 and just two (1.8) in 2018. The
fertility rate has also fallen below the replacement level of 2.1 children since 2013.
Migration is estimated to have a far smaller effect on Malaysia’s demographic shift231. A projected
net migration rate (immigrants less emigrants per 1,000 population) for 1980 is only -1.05 and
1.21 in 2100232. This is a much smaller rate compared to the birth rate of 31.1 in 1980 and 9.1 in
2100. Similarly, the estimated death rate in 1980 is 5.5 and 12.4 in 2100.
Living longer and longer
For individuals, a longer life expectancy affects retirement arrangements. On average, a person
born in 2020 can expect to live almost 77 years, almost eight more years than those born in 1980.
This coincides with the increasing average years a person at 65 can expect to live. A person aged
65 years in 2020 can expect to live an average of 17 additional years, up from 15 in 2000. By 2080,
the figure will have increased to 23 years. Survival to age 65 has also increased from 67.9% for
females and 60.1% for males in 1969 to 87.0% for females and 76.9% for males in 2019. This means
almost nine out of 10 female babies born in 2019 would survive to age 65, an improvement from
seven out of 10 for those born in 1969.
226 Rabi et al. (2019) 227 See Bloom and Williamson (1997) 228 Overall dependency ratio will increase (dependent for every working age individual) even after accounting for shrinking young
population (under 15) as the reduction in young population is offset by the rapid increase of older population (over 65). 229 MOF (2020) 230 SeeKirk (1996) 231 An IMF (2017) estimate also supports a relatively weaker impact of migration on Malaysian demographic trends and economic growth. 232 Death rates, birth rates and net migration rates are all from UNDESA via CEIC (n.d.).
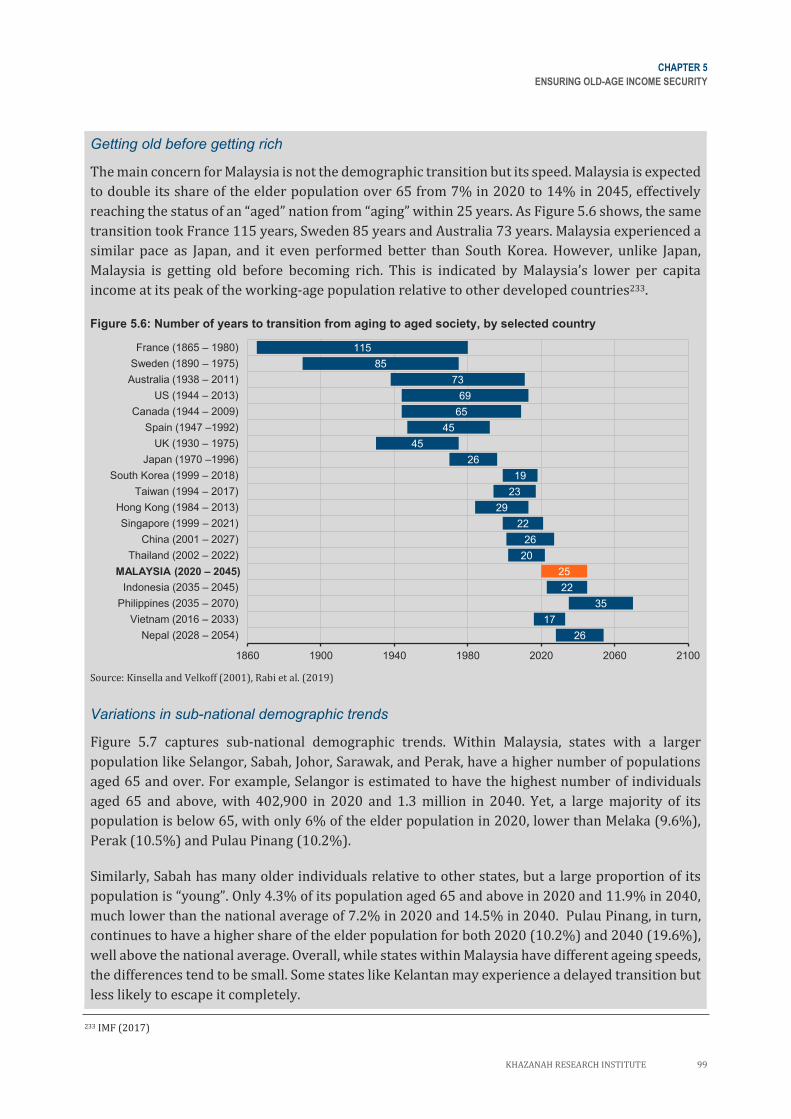
CHAPTER 5
ENSURING OLD-AGE INCOME SECURITY
KHAZANAH RESEARCH INSTITUTE 99
Getting old before getting rich
The main concern for Malaysia is not the demographic transition but its speed. Malaysia is expected
to double its share of the elder population over 65 from 7% in 2020 to 14% in 2045, effectively
reaching the status of an “aged” nation from “aging” within 25 years. As Figure 5.6 shows, the same
transition took France 115 years, Sweden 85 years and Australia 73 years. Malaysia experienced a
similar pace as Japan, and it even performed better than South Korea. However, unlike Japan,
Malaysia is getting old before becoming rich. This is indicated by Malaysia’s lower per capita
income at its peak of the working-age population relative to other developed countries233.
Figure 5.6: Number of years to transition from aging to aged society, by selected country
Source: Kinsella and Velkoff (2001), Rabi et al. (2019)
Variations in sub-national demographic trends
Figure 5.7 captures sub-national demographic trends. Within Malaysia, states with a larger
population like Selangor, Sabah, Johor, Sarawak, and Perak, have a higher number of populations
aged 65 and over. For example, Selangor is estimated to have the highest number of individuals
aged 65 and above, with 402,900 in 2020 and 1.3 million in 2040. Yet, a large majority of its
population is below 65, with only 6% of the elder population in 2020, lower than Melaka (9.6%),
Perak (10.5%) and Pulau Pinang (10.2%).
Similarly, Sabah has many older individuals relative to other states, but a large proportion of its
population is “young”. Only 4.3% of its population aged 65 and above in 2020 and 11.9% in 2040,
much lower than the national average of 7.2% in 2020 and 14.5% in 2040. Pulau Pinang, in turn,
continues to have a higher share of the elder population for both 2020 (10.2%) and 2040 (19.6%),
well above the national average. Overall, while states within Malaysia have different ageing speeds,
the differences tend to be small. Some states like Kelantan may experience a delayed transition but
less likely to escape it completely.
233 IMF (2017)
115
85
73
69
65
45
45
26
19
23
29
22
26
20
25
22
35
17
26
1860 1900 1940 1980 2020 2060 2100
France (1865 – 1980)
Sweden (1890 – 1975)
Australia (1938 – 2011)
US (1944 – 2013)
Canada (1944 – 2009)
Spain (1947 –1992)
UK (1930 – 1975)
Japan (1970 –1996)
South Korea (1999 – 2018)
Taiwan (1994 – 2017)
Hong Kong (1984 – 2013)
Singapore (1999 – 2021)
China (2001 – 2027)
Thailand (2002 – 2022)
MALAYSIA (2020 – 2045)
Indonesia (2035 – 2045)
Philippines (2035 – 2070)
Vietnam (2016 – 2033)
Nepal (2028 – 2054)
MALAYSIA (2020 – 2045)
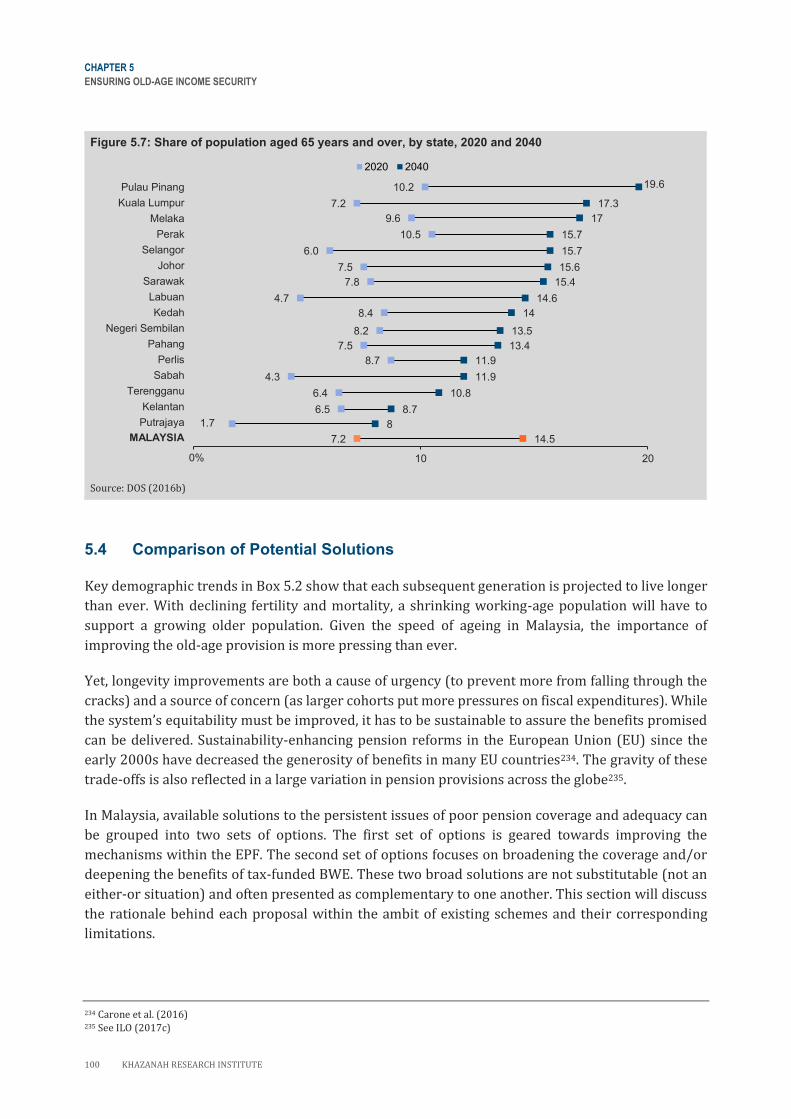
CHAPTER 5
ENSURING OLD-AGE INCOME SECURITY
100 KHAZANAH RESEARCH INSTITUTE
Figure 5.7: Share of population aged 65 years and over, by state, 2020 and 2040
Source: DOS (2016b)
5.4 Comparison of Potential Solutions
Key demographic trends in Box 5.2 show that each subsequent generation is projected to live longer
than ever. With declining fertility and mortality, a shrinking working-age population will have to
support a growing older population. Given the speed of ageing in Malaysia, the importance of
improving the old-age provision is more pressing than ever.
Yet, longevity improvements are both a cause of urgency (to prevent more from falling through the
cracks) and a source of concern (as larger cohorts put more pressures on fiscal expenditures). While
the system’s equitability must be improved, it has to be sustainable to assure the benefits promised
can be delivered. Sustainability-enhancing pension reforms in the European Union (EU) since the
early 2000s have decreased the generosity of benefits in many EU countries234. The gravity of these
trade-offs is also reflected in a large variation in pension provisions across the globe235.
In Malaysia, available solutions to the persistent issues of poor pension coverage and adequacy can
be grouped into two sets of options. The first set of options is geared towards improving the
mechanisms within the EPF. The second set of options focuses on broadening the coverage and/or
deepening the benefits of tax-funded BWE. These two broad solutions are not substitutable (not an
either-or situation) and often presented as complementary to one another. This section will discuss
the rationale behind each proposal within the ambit of existing schemes and their corresponding
limitations.
234 Carone et al. (2016) 235 See ILO (2017c)
7.2
1.7
6.5
6.4
4.3
8.7
7.5
8.2
8.4
4.7
7.8
7.5
6.0
10.5
9.6
7.2
10.2
14.5
8
8.7
10.8
11.9
11.9
13.4
13.5
14
14.6
15.4
15.6
15.7
15.7
17
17.3
19.6
0 10 20
Malaysia
Putrajaya
Kelantan
Terengganu
Sabah
Perlis
Pahang
Negeri Sembilan
Kedah
Labuan
Sarawak
Johor
Selangor
Perak
Melaka
Kuala Lumpur
Pulau Pinang
2020 2040
0%
MALAYSIA
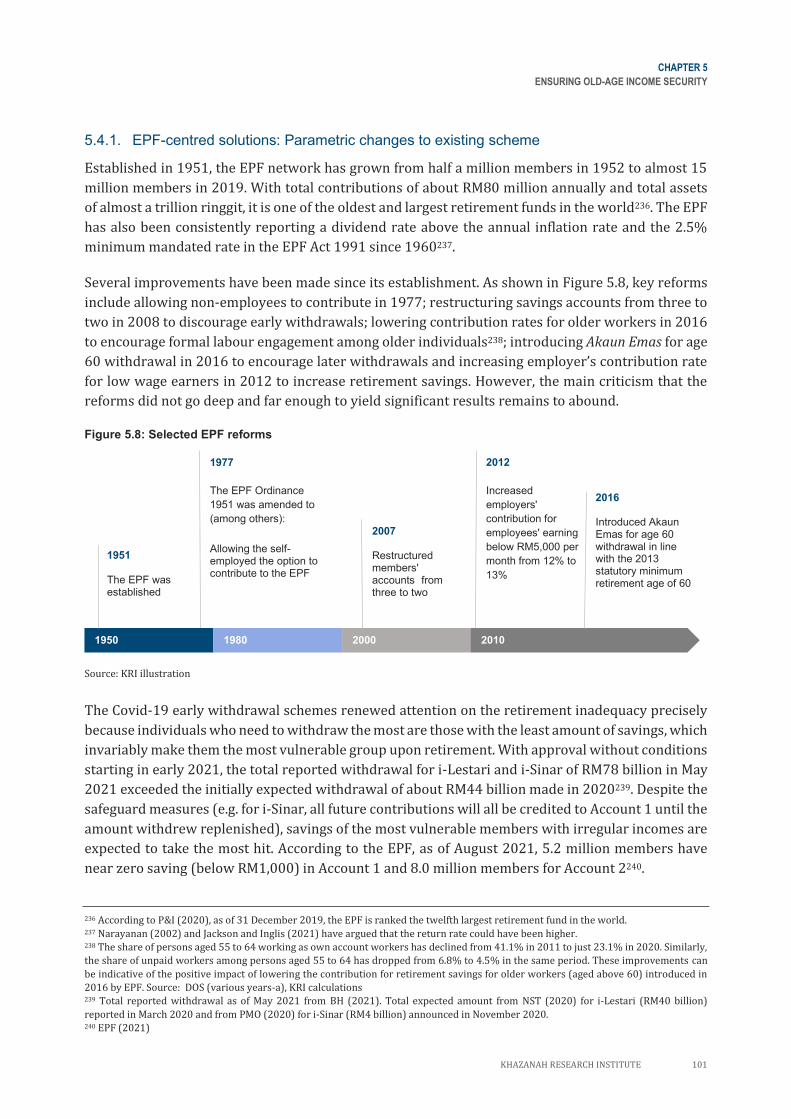
CHAPTER 5
ENSURING OLD-AGE INCOME SECURITY
KHAZANAH RESEARCH INSTITUTE 101
5.4.1. EPF-centred solutions: Parametric changes to existing scheme
Established in 1951, the EPF network has grown from half a million members in 1952 to almost 15
million members in 2019. With total contributions of about RM80 million annually and total assets
of almost a trillion ringgit, it is one of the oldest and largest retirement funds in the world236. The EPF
has also been consistently reporting a dividend rate above the annual inflation rate and the 2.5%
minimum mandated rate in the EPF Act 1991 since 1960237.
Several improvements have been made since its establishment. As shown in Figure 5.8, key reforms
include allowing non-employees to contribute in 1977; restructuring savings accounts from three to
two in 2008 to discourage early withdrawals; lowering contribution rates for older workers in 2016
to encourage formal labour engagement among older individuals238; introducing Akaun Emas for age
60 withdrawal in 2016 to encourage later withdrawals and increasing employer’s contribution rate
for low wage earners in 2012 to increase retirement savings. However, the main criticism that the
reforms did not go deep and far enough to yield significant results remains to abound.
Figure 5.8: Selected EPF reforms
Source: KRI illustration
The Covid-19 early withdrawal schemes renewed attention on the retirement inadequacy precisely
because individuals who need to withdraw the most are those with the least amount of savings, which
invariably make them the most vulnerable group upon retirement. With approval without conditions
starting in early 2021, the total reported withdrawal for i-Lestari and i-Sinar of RM78 billion in May
2021 exceeded the initially expected withdrawal of about RM44 billion made in 2020239. Despite the
safeguard measures (e.g. for i-Sinar, all future contributions will all be credited to Account 1 until the
amount withdrew replenished), savings of the most vulnerable members with irregular incomes are
expected to take the most hit. According to the EPF, as of August 2021, 5.2 million members have
near zero saving (below RM1,000) in Account 1 and 8.0 million members for Account 2240.
236 According to P&I (2020), as of 31 December 2019, the EPF is ranked the twelfth largest retirement fund in the world. 237 Narayanan (2002) and Jackson and Inglis (2021) have argued that the return rate could have been higher. 238 The share of persons aged 55 to 64 working as own account workers has declined from 41.1% in 2011 to just 23.1% in 2020. Similarly,
the share of unpaid workers among persons aged 55 to 64 has dropped from 6.8% to 4.5% in the same period. These improvements can
be indicative of the positive impact of lowering the contribution for retirement savings for older workers (aged above 60) introduced in
2016 by EPF. Source: DOS (various years-a), KRI calculations 239 Total reported withdrawal as of May 2021 from BH (2021). Total expected amount from NST (2020) for i-Lestari (RM40 billion)
reported in March 2020 and from PMO (2020) for i-Sinar (RM4 billion) announced in November 2020. 240 EPF (2021)
1951 The EPF was established
1950 1980 2000 2010
1977
The EPF Ordinance
1951 was amended to
(among others):
Allowing the self-employed the option to contribute to the EPF
2007 Restructured members' accounts from three to two
2012
Increased
employers'
contribution for
employees' earning
below RM5,000 per
month from 12% to
13%
2016 Introduced Akaun Emas for age 60 withdrawal in line with the 2013 statutory minimum retirement age of 60
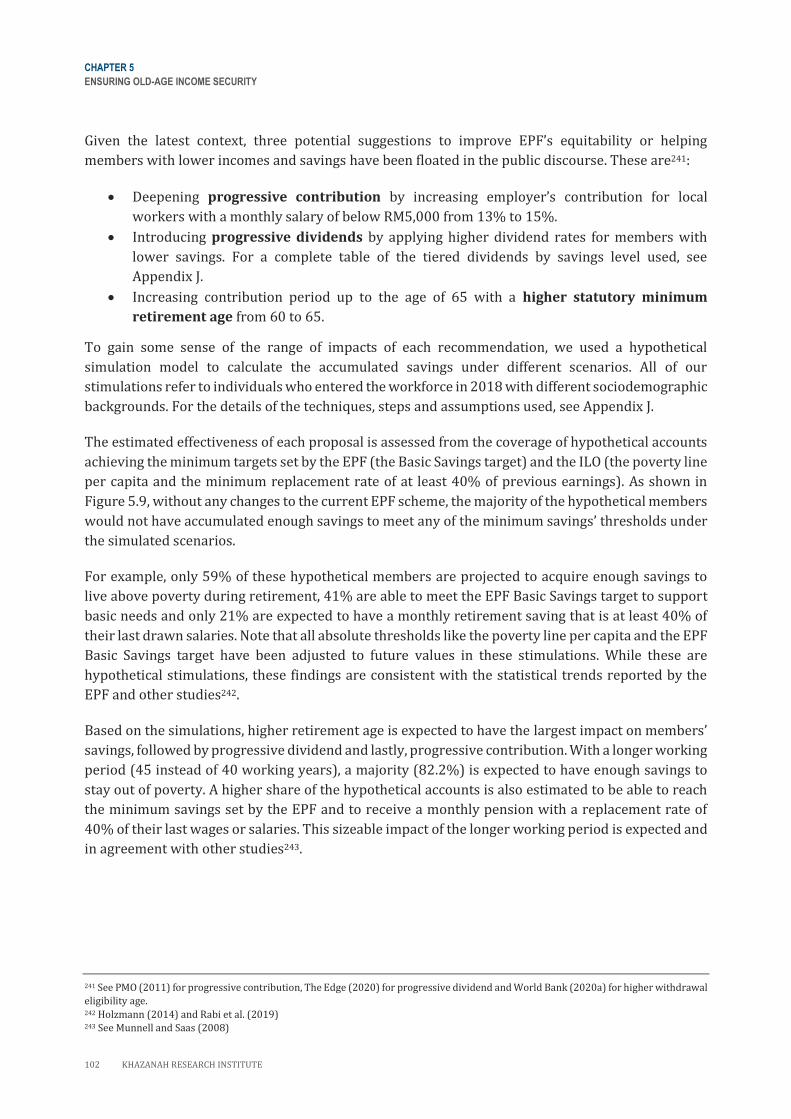
CHAPTER 5
ENSURING OLD-AGE INCOME SECURITY
102 KHAZANAH RESEARCH INSTITUTE
Given the latest context, three potential suggestions to improve EPF’s equitability or helping
members with lower incomes and savings have been floated in the public discourse. These are241:
• Deepening progressive contribution by increasing employer’s contribution for local
workers with a monthly salary of below RM5,000 from 13% to 15%.
• Introducing progressive dividends by applying higher dividend rates for members with
lower savings. For a complete table of the tiered dividends by savings level used, see
Appendix J.
• Increasing contribution period up to the age of 65 with a higher statutory minimum
retirement age from 60 to 65.
To gain some sense of the range of impacts of each recommendation, we used a hypothetical
simulation model to calculate the accumulated savings under different scenarios. All of our
stimulations refer to individuals who entered the workforce in 2018 with different sociodemographic
backgrounds. For the details of the techniques, steps and assumptions used, see Appendix J.
The estimated effectiveness of each proposal is assessed from the coverage of hypothetical accounts
achieving the minimum targets set by the EPF (the Basic Savings target) and the ILO (the poverty line
per capita and the minimum replacement rate of at least 40% of previous earnings). As shown in
Figure 5.9, without any changes to the current EPF scheme, the majority of the hypothetical members
would not have accumulated enough savings to meet any of the minimum savings’ thresholds under
the simulated scenarios.
For example, only 59% of these hypothetical members are projected to acquire enough savings to
live above poverty during retirement, 41% are able to meet the EPF Basic Savings target to support
basic needs and only 21% are expected to have a monthly retirement saving that is at least 40% of
their last drawn salaries. Note that all absolute thresholds like the poverty line per capita and the EPF
Basic Savings target have been adjusted to future values in these stimulations. While these are
hypothetical stimulations, these findings are consistent with the statistical trends reported by the
EPF and other studies242.
Based on the simulations, higher retirement age is expected to have the largest impact on members’
savings, followed by progressive dividend and lastly, progressive contribution. With a longer working
period (45 instead of 40 working years), a majority (82.2%) is expected to have enough savings to
stay out of poverty. A higher share of the hypothetical accounts is also estimated to be able to reach
the minimum savings set by the EPF and to receive a monthly pension with a replacement rate of
40% of their last wages or salaries. This sizeable impact of the longer working period is expected and
in agreement with other studies243.
241 See PMO (2011) for progressive contribution, The Edge (2020) for progressive dividend and World Bank (2020a) for higher withdrawal
eligibility age. 242 Holzmann (2014) and Rabi et al. (2019) 243 See Munnell and Saas (2008)
CHAPTER 5
ENSURING OLD-AGE INCOME SECURITY
KHAZANAH RESEARCH INSTITUTE 103
Figure 5.9: Share of hypothetical EPF members achieving minimum income threshold, by threshold and
simulation scenario
Note: The EPF Basic Savings thresholds and the poverty line per capita have been inflated into future values, assuming a future constant
inflation annual rate of 2%. For more details, see Appendix J
Source: KRI calculations
Two points need to be highlighted from the findings in Figure 5.9. First, even if all members work for
longer, EPF cannot guarantee the minimum savings adequacy to all its members (18% of hypothetical
accounts are still projected to live below the poverty line per capita upon retirement even with a
higher retirement age). While low wages and pre-retirement withdrawals via Account 2 have often
been cited as reasons behind the EPF savings inadequacy despite its relatively high contribution rates
(cited to rank fifth globally in 2015)244, less attention has been paid to the frequency of contributions.
From the official statistics, it can be observed that only half of all EPF members contribute at least
once a year (7.6 million out of 14.6 million in 2019). The number of actual members contributing
monthly would have been even lower. By design, the EPF arrangements reward regular continuous
contributions, but many may not have the privilege of lifetime employment, let alone without any
income disruption. It is yet to be seen whether matching contributions like i-Suri and i-Saraan can be
effective in substantially increasing participation and savings in the future245. The actual total
registered EPF members under these voluntary schemes at the moment is discouraging (Figure 5.2).
Second, the expectation that more older individuals will continue to be active in the labour market
for longer by increasing the statutory minimum retirement age should be tampered with. The labour
participation of older individuals is an outcome of various external/structural and
internal/individual factors. It can be affected by labour market conditions, policies, and institutions;
the pension ecosystem; as well as individual characteristics including educational attainment, health
status, net wealth and personal preferences246. These complex and convoluted factors make it
difficult to predict whether more older individuals will stay longer in the labour market. For example,
while oft-cited drivers like improvement in policies, health outcomes and educational attainment247
may explain the recent rise in the participation rate for older persons in the labour market, they
cannot explain the high rate of 50.9% in 1975 and the subsequent decline (Figure 5.10).
244 See EPF (2016a) and World Bank (2018) 245 Hinz et al. (2013) documented international experience where matching contributions have been successful in increasing participation
and savings. By contrast, ILO (2015a) found that internationally coverage expansion efforts through voluntary schemes without
government-enforce compliances to be rarely effectively implemented. 246 See Bodnár and Nerlich (2020) 247 The statutory minimum retirement age was passed in 2012. Estimated years spent in poor health have improved slightly from 9.1 years
in 1990 to 9.5 years in 2019. Source: KRI (2020). Rate of tertiary enrolment has increased from 3.8% in 1979 to 43.1% in 2019. Source:
UNESCO Institute for Statistics via World Bank (n.d.-b)
82
59 6166
49
33
61
45
24
59
41
21
0
20
40
60
80
100
The poverty line per capita(ILO R202)
The EPF Basic Savings The minimum replacement ratio (ILO C102)
100%
Higher retirement age
Progressive dividend
Progressive contribution
Status quo/baseline
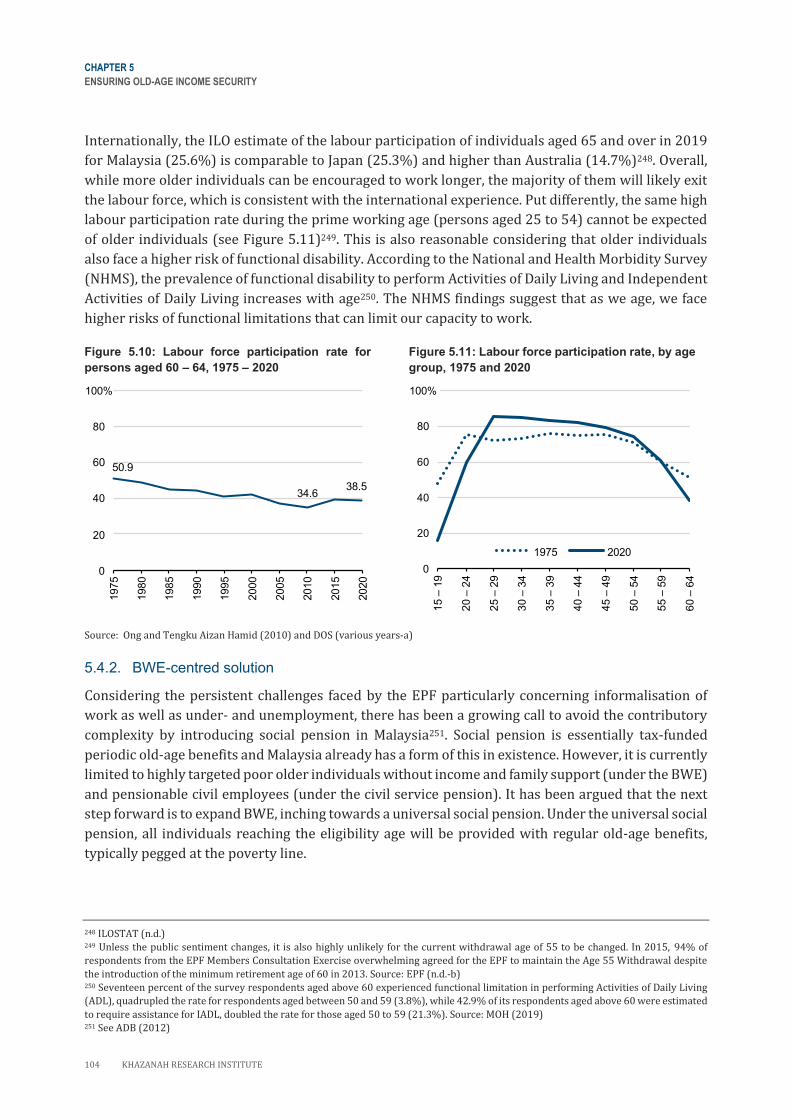
CHAPTER 5
ENSURING OLD-AGE INCOME SECURITY
104 KHAZANAH RESEARCH INSTITUTE
Internationally, the ILO estimate of the labour participation of individuals aged 65 and over in 2019
for Malaysia (25.6%) is comparable to Japan (25.3%) and higher than Australia (14.7%)248. Overall,
while more older individuals can be encouraged to work longer, the majority of them will likely exit
the labour force, which is consistent with the international experience. Put differently, the same high
labour participation rate during the prime working age (persons aged 25 to 54) cannot be expected
of older individuals (see Figure 5.11)249. This is also reasonable considering that older individuals
also face a higher risk of functional disability. According to the National and Health Morbidity Survey
(NHMS), the prevalence of functional disability to perform Activities of Daily Living and Independent
Activities of Daily Living increases with age250. The NHMS findings suggest that as we age, we face
higher risks of functional limitations that can limit our capacity to work.
Figure 5.10: Labour force participation rate for
persons aged 60 – 64, 1975 – 2020
Figure 5.11: Labour force participation rate, by age
group, 1975 and 2020
Source: Ong and Tengku Aizan Hamid (2010) and DOS (various years-a)
5.4.2. BWE-centred solution
Considering the persistent challenges faced by the EPF particularly concerning informalisation of
work as well as under- and unemployment, there has been a growing call to avoid the contributory
complexity by introducing social pension in Malaysia251. Social pension is essentially tax-funded
periodic old-age benefits and Malaysia already has a form of this in existence. However, it is currently
limited to highly targeted poor older individuals without income and family support (under the BWE)
and pensionable civil employees (under the civil service pension). It has been argued that the next
step forward is to expand BWE, inching towards a universal social pension. Under the universal social
pension, all individuals reaching the eligibility age will be provided with regular old-age benefits,
typically pegged at the poverty line.
248 ILOSTAT (n.d.) 249 Unless the public sentiment changes, it is also highly unlikely for the current withdrawal age of 55 to be changed. In 2015, 94% of
respondents from the EPF Members Consultation Exercise overwhelming agreed for the EPF to maintain the Age 55 Withdrawal despite
the introduction of the minimum retirement age of 60 in 2013. Source: EPF (n.d.-b) 250 Seventeen percent of the survey respondents aged above 60 experienced functional limitation in performing Activities of Daily Living
(ADL), quadrupled the rate for respondents aged between 50 and 59 (3.8%), while 42.9% of its respondents aged above 60 were estimated
to require assistance for IADL, doubled the rate for those aged 50 to 59 (21.3%). Source: MOH (2019) 251 See ADB (2012)
50.9
34.63 .5
0
20
40
60
0
100
19 5
19 0
19 5
1990
1995
2000
2005
2010
2015
2020
100
0
20
40
60
0
100
15 19
20 24
25 29
30 34
35 39
40 44
45 49
50 54
55 59
60 64
19 5 2020
100
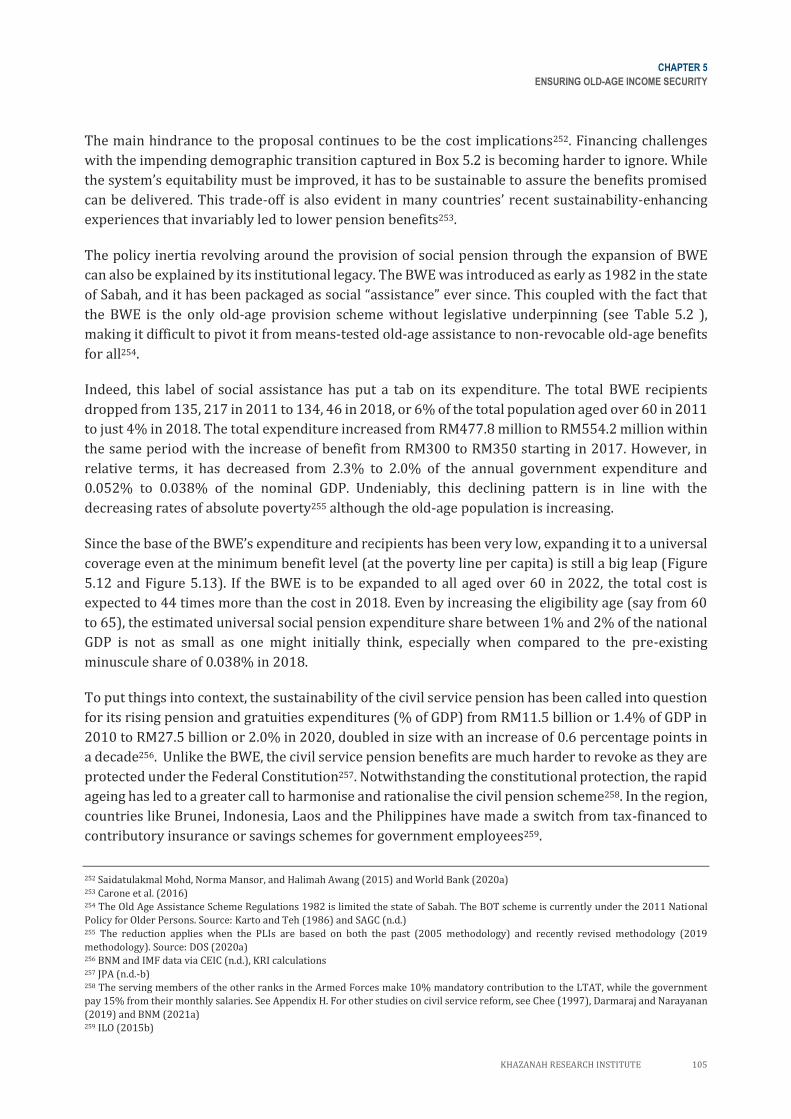
CHAPTER 5
ENSURING OLD-AGE INCOME SECURITY
KHAZANAH RESEARCH INSTITUTE 105
The main hindrance to the proposal continues to be the cost implications252. Financing challenges
with the impending demographic transition captured in Box 5.2 is becoming harder to ignore. While
the system’s equitability must be improved, it has to be sustainable to assure the benefits promised
can be delivered. This trade-off is also evident in many countries’ recent sustainability-enhancing
experiences that invariably led to lower pension benefits253.
The policy inertia revolving around the provision of social pension through the expansion of BWE
can also be explained by its institutional legacy. The BWE was introduced as early as 1982 in the state
of Sabah, and it has been packaged as social “assistance” ever since. This coupled with the fact that
the BWE is the only old-age provision scheme without legislative underpinning (see Table 5.2 ),
making it difficult to pivot it from means-tested old-age assistance to non-revocable old-age benefits
for all254.
Indeed, this label of social assistance has put a tab on its expenditure. The total BWE recipients
dropped from 135, 217 in 2011 to 134, 46 in 2018, or 6% of the total population aged over 60 in 2011
to just 4% in 2018. The total expenditure increased from RM477.8 million to RM554.2 million within
the same period with the increase of benefit from RM300 to RM350 starting in 2017. However, in
relative terms, it has decreased from 2.3% to 2.0% of the annual government expenditure and
0.052% to 0.038% of the nominal GDP. Undeniably, this declining pattern is in line with the
decreasing rates of absolute poverty255 although the old-age population is increasing.
Since the base of the BWE’s expenditure and recipients has been very low, expanding it to a universal
coverage even at the minimum benefit level (at the poverty line per capita) is still a big leap (Figure
5.12 and Figure 5.13). If the BWE is to be expanded to all aged over 60 in 2022, the total cost is
expected to 44 times more than the cost in 2018. Even by increasing the eligibility age (say from 60
to 65), the estimated universal social pension expenditure share between 1% and 2% of the national
GDP is not as small as one might initially think, especially when compared to the pre-existing
minuscule share of 0.038% in 2018.
To put things into context, the sustainability of the civil service pension has been called into question
for its rising pension and gratuities expenditures (% of GDP) from RM11.5 billion or 1.4% of GDP in
2010 to RM27.5 billion or 2.0% in 2020, doubled in size with an increase of 0.6 percentage points in
a decade256. Unlike the BWE, the civil service pension benefits are much harder to revoke as they are
protected under the Federal Constitution257. Notwithstanding the constitutional protection, the rapid
ageing has led to a greater call to harmonise and rationalise the civil pension scheme258. In the region,
countries like Brunei, Indonesia, Laos and the Philippines have made a switch from tax-financed to
contributory insurance or savings schemes for government employees259.
252 Saidatulakmal Mohd, Norma Mansor, and Halimah Awang (2015) and World Bank (2020a) 253 Carone et al. (2016) 254 The Old Age Assistance Scheme Regulations 1982 is limited the state of Sabah. The BOT scheme is currently under the 2011 National
Policy for Older Persons. Source: Karto and Teh (1986) and SAGC (n.d.) 255 The reduction applies when the PLIs are based on both the past (2005 methodology) and recently revised methodology (2019
methodology). Source: DOS (2020a) 256 BNM and IMF data via CEIC (n.d.), KRI calculations 257 JPA (n.d.-b) 258 The serving members of the other ranks in the Armed Forces make 10% mandatory contribution to the LTAT, while the government
pay 15% from their monthly salaries. See Appendix H. For other studies on civil service reform, see Chee (1997), Darmaraj and Narayanan
(2019) and BNM (2021a) 259 ILO (2015b)
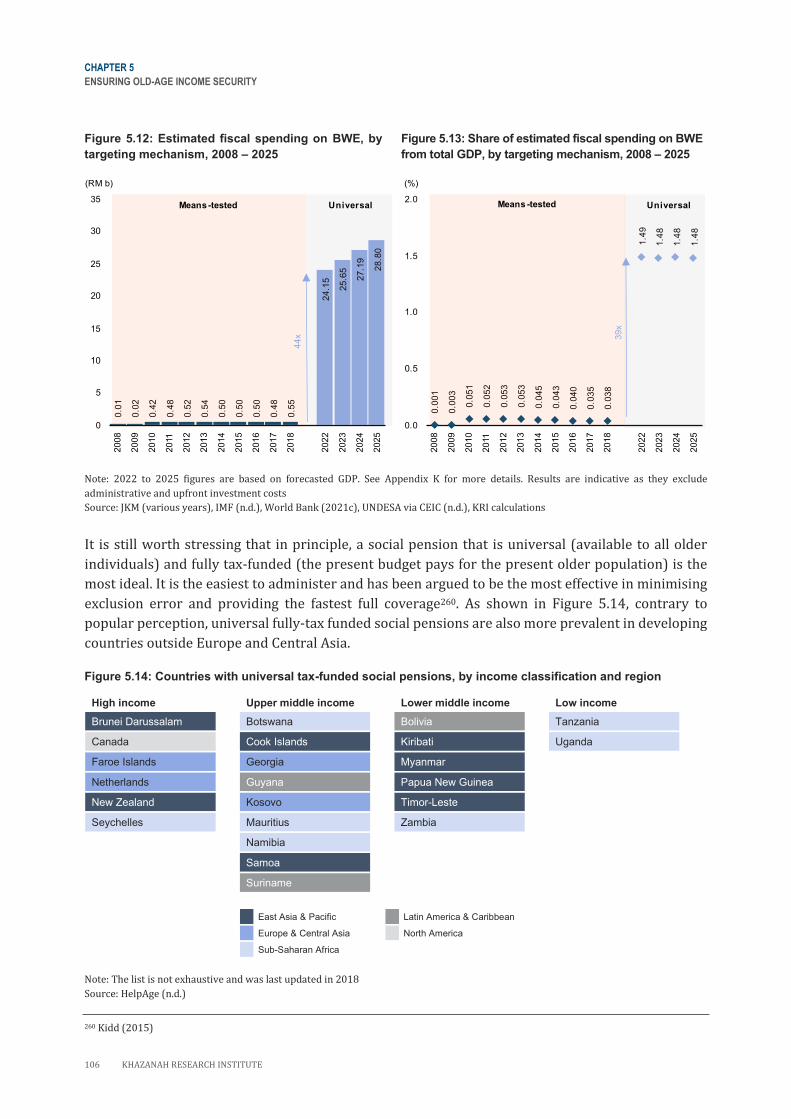
CHAPTER 5
ENSURING OLD-AGE INCOME SECURITY
106 KHAZANAH RESEARCH INSTITUTE
Figure 5.12: Estimated fiscal spending on BWE, by
targeting mechanism, 2008 – 2025
Figure 5.13: Share of estimated fiscal spending on BWE
from total GDP, by targeting mechanism, 2008 – 2025
Note: 2022 to 2025 figures are based on forecasted GDP. See Appendix K for more details. Results are indicative as they exclude
administrative and upfront investment costs
Source: JKM (various years), IMF (n.d.), World Bank (2021c), UNDESA via CEIC (n.d.), KRI calculations
It is still worth stressing that in principle, a social pension that is universal (available to all older
individuals) and fully tax-funded (the present budget pays for the present older population) is the
most ideal. It is the easiest to administer and has been argued to be the most effective in minimising
exclusion error and providing the fastest full coverage260. As shown in Figure 5.14, contrary to
popular perception, universal fully-tax funded social pensions are also more prevalent in developing
countries outside Europe and Central Asia.
Figure 5.14: Countries with universal tax-funded social pensions, by income classification and region
High income Upper middle income Lower middle income Low income
Brunei Darussalam Botswana Bolivia Tanzania
Canada Cook Islands Kiribati Uganda
Faroe Islands Georgia Myanmar
Netherlands Guyana Papua New Guinea
New Zealand Kosovo Timor-Leste
Seychelles Mauritius Zambia
Namibia
Samoa
Suriname
East Asia & Pacific Latin America & Caribbean
Europe & Central Asia North America
Sub-Saharan Africa
Note: The list is not exhaustive and was last updated in 2018
Source: HelpAge (n.d.)
260 Kidd (2015)
0.01
0.02
0.42
0.4
0.52
0.54
0.50
0.50
0.50
0.4
0.55
24.15
25.65
2 .19
2 . 0
0
5
10
15
20
25
30
35
200
2009
2010
2011
2012
2013
2014
2015
2016
201
201
2022
2023
2024
2025
e ns es ed ni e s l
(RM b)
44x
0.001
0.003
0.051
0.052
0.053
0.053
0.045
0.043
0.040
0.035
0.03
1.49
1.4
1.4
1.4
0.0
0.5
1.0
1.5
2.0
200
2009
2010
2011
2012
2013
2014
2015
2016
201
201
2022
2023
2024
2025
e ns es ed ni e s l
( )
39x
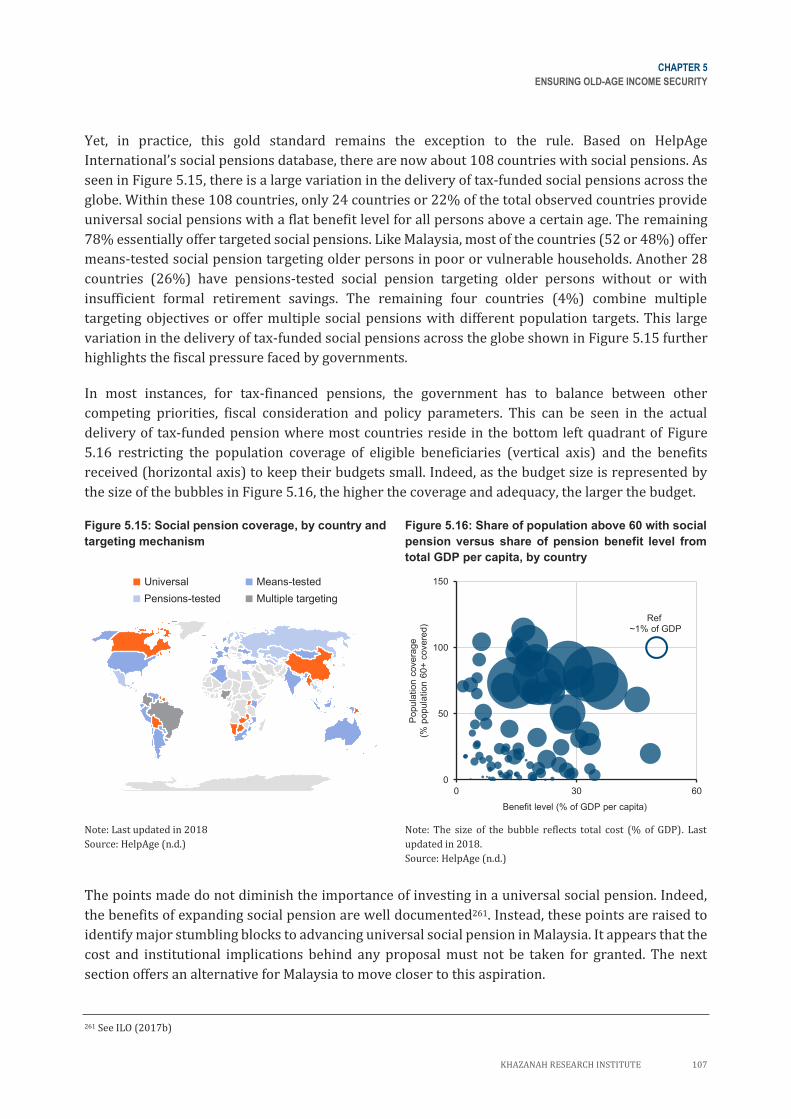
CHAPTER 5
ENSURING OLD-AGE INCOME SECURITY
KHAZANAH RESEARCH INSTITUTE 107
Yet, in practice, this gold standard remains the exception to the rule. Based on HelpAge
International’s social pensions database, there are now about 108 countries with social pensions. As
seen in Figure 5.15, there is a large variation in the delivery of tax-funded social pensions across the
globe. Within these 108 countries, only 24 countries or 22% of the total observed countries provide
universal social pensions with a flat benefit level for all persons above a certain age. The remaining
78% essentially offer targeted social pensions. Like Malaysia, most of the countries (52 or 48%) offer
means-tested social pension targeting older persons in poor or vulnerable households. Another 28
countries (26%) have pensions-tested social pension targeting older persons without or with
insufficient formal retirement savings. The remaining four countries (4%) combine multiple
targeting objectives or offer multiple social pensions with different population targets. This large
variation in the delivery of tax-funded social pensions across the globe shown in Figure 5.15 further
highlights the fiscal pressure faced by governments.
In most instances, for tax-financed pensions, the government has to balance between other
competing priorities, fiscal consideration and policy parameters. This can be seen in the actual
delivery of tax-funded pension where most countries reside in the bottom left quadrant of Figure
5.16 restricting the population coverage of eligible beneficiaries (vertical axis) and the benefits
received (horizontal axis) to keep their budgets small. Indeed, as the budget size is represented by
the size of the bubbles in Figure 5.16, the higher the coverage and adequacy, the larger the budget.
Figure 5.15: Social pension coverage, by country and
targeting mechanism
Figure 5.16: Share of population above 60 with social
pension versus share of pension benefit level from
total GDP per capita, by country
■ Universal ■ Means-tested
■ Pensions-tested ■ Multiple targeting
Note: Last updated in 2018
Source: HelpAge (n.d.)
Note: The size of the bubble reflects total cost (% of GDP). Last
updated in 2018.
Source: HelpAge (n.d.)
The points made do not diminish the importance of investing in a universal social pension. Indeed,
the benefits of expanding social pension are well documented261. Instead, these points are raised to
identify major stumbling blocks to advancing universal social pension in Malaysia. It appears that the
cost and institutional implications behind any proposal must not be taken for granted. The next
section offers an alternative for Malaysia to move closer to this aspiration.
261 See ILO (2017b)
0
50
100
150
0 30 60
Popula
tion c
overa
ge
(% p
opula
tion 6
0+
covere
d)
Benefit level (% of GDP per capita)
Ref~1% of GDP
Australian ureau of Statistics, eo ames, Microsoft, avinfo, TomTom, Wikipedia owered by ing
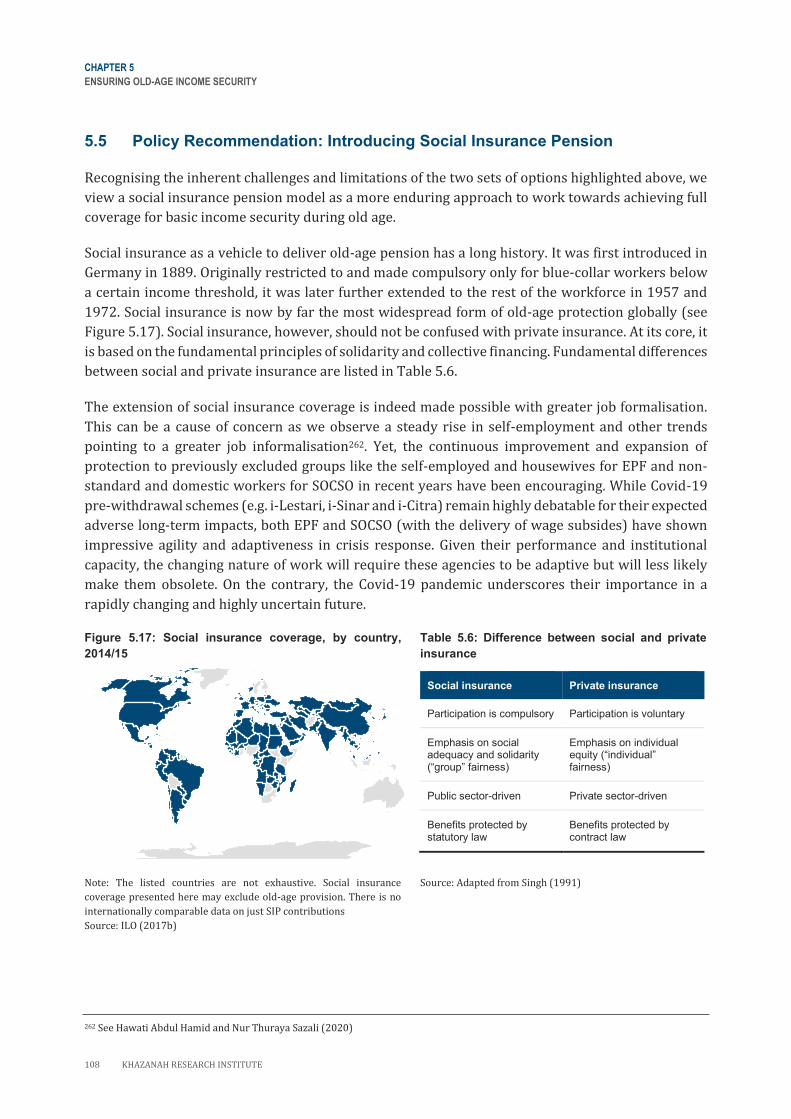
CHAPTER 5
ENSURING OLD-AGE INCOME SECURITY
108 KHAZANAH RESEARCH INSTITUTE
5.5 Policy Recommendation: Introducing Social Insurance Pension
Recognising the inherent challenges and limitations of the two sets of options highlighted above, we
view a social insurance pension model as a more enduring approach to work towards achieving full
coverage for basic income security during old age.
Social insurance as a vehicle to deliver old-age pension has a long history. It was first introduced in
Germany in 1889. Originally restricted to and made compulsory only for blue-collar workers below
a certain income threshold, it was later further extended to the rest of the workforce in 1957 and
1972. Social insurance is now by far the most widespread form of old-age protection globally (see
Figure 5.17). Social insurance, however, should not be confused with private insurance. At its core, it
is based on the fundamental principles of solidarity and collective financing. Fundamental differences
between social and private insurance are listed in Table 5.6.
The extension of social insurance coverage is indeed made possible with greater job formalisation.
This can be a cause of concern as we observe a steady rise in self-employment and other trends
pointing to a greater job informalisation262. Yet, the continuous improvement and expansion of
protection to previously excluded groups like the self-employed and housewives for EPF and non-
standard and domestic workers for SOCSO in recent years have been encouraging. While Covid-19
pre-withdrawal schemes (e.g. i-Lestari, i-Sinar and i-Citra) remain highly debatable for their expected
adverse long-term impacts, both EPF and SOCSO (with the delivery of wage subsides) have shown
impressive agility and adaptiveness in crisis response. Given their performance and institutional
capacity, the changing nature of work will require these agencies to be adaptive but will less likely
make them obsolete. On the contrary, the Covid-19 pandemic underscores their importance in a
rapidly changing and highly uncertain future.
Figure 5.17: Social insurance coverage, by country,
2014/15
Table 5.6: Difference between social and private
insurance
Social insurance Private insurance
Participation is compulsory Participation is voluntary
Emphasis on social adequacy and solidarity (“group” fairness)
Emphasis on individual equity (“individual” fairness)
Public sector-driven Private sector-driven
Benefits protected by statutory law
Benefits protected by contract law
Note: The listed countries are not exhaustive. Social insurance
coverage presented here may exclude old-age provision. There is no
internationally comparable data on just SIP contributions
Source: ILO (2017b)
Source: Adapted from Singh (1991)
262 See Hawati Abdul Hamid and Nur Thuraya Sazali (2020)
Australian ureau of Statistics, eo ames, Microsoft, avinfo, TomTom, Wikipedia
owered by ing
CHAPTER 5
ENSURING OLD-AGE INCOME SECURITY
KHAZANAH RESEARCH INSTITUTE 109
In general, a social insurance pension provides old-age benefits to individuals who have met the
qualifying age and the minimum contribution period, which can vary between 10 and 35 years.
Compulsory contributions are made during the working years and typically are a percentage of an
earned income. Like other schemes, the operational details vary significantly from country to
country. It is also worthwhile to note that most social insurance schemes are a hybrid of both defined
benefits scheme and defined contribution scheme as one’s entitlement depends on one’s
contribution263. Yet, the benefits are defined in advance and are not determined primarily or strictly
tied to individual contributions. In many instances, because of the contribution parameters, there are
transfers between members, preserving the element of social solidarity.
It is acknowledged that social insurance or social security agencies are also facing increasing fiscal
pressure. In the OECD experience, reforms to address increasing longevity by increasing the
retirement age, lowering pension benefits or penalising early retirement remain understandably
highly unpopular264. In Malaysia, under SOCSO, survivors’ pension and invalidity pension continue
to occupy a larger share in SOCSO’s annual expenditure and the schemes’ sustainability has been
called into question265. One potential way to balance between equity and sustainability is by
introducing a life annuity scheme as the social insurance pension.
5.5.1. Life annuity as a mode of SIP’s delivery
By definition, an annuity is a series of periodic payments. For life annuity, a person is guaranteed a
predetermined lifetime stream of income in exchange for paying the policy premium. The premium
can be a lump sum payment that one makes upon retirement or through a series of premium
payments before retirement. By design, the life annuity covers the risk of outliving one’s accumulated
savings. In the private sphere, the cost of this scheme depends on individual profile (life expectancy)
and preference (the length and the depth of annuity or benefit).
In 2000, the EPF introduced the EPF Annuity Schemes (Epfas266) which allowed EPF members to
withdraw from their retirement savings to purchase a single premium deferred annuity from private
insurance companies. Within less than a year, over 200,000 EPF members registered totalling over
RM4 billion, signalling high demand for the product267. However, by the end of 2001, the scheme was
suspended after massive backlash from several entities, most prominently from the Malaysian
Trades Union Congress and the Consumers Association Penang because i) it was managed by private
insurers it was suspected to excessively benefit the private insurers; (ii), there is no guarantee against
investment loss; and (iii), there were allegations of product misselling268. While the scheme was
halted after just one year, the final number of policies sold was surprisingly high, at 273,392 policies
sold with a total of RM5.1 billion premium payment signalling a strong appetite for securing income
for life269.
263 As the names suggest, defined-benefit schemes are those where benefits of the schemes are predetermined, while in defined-
contribution schemes, the contribution rates are predetermined. 264 OECD (2019b) 265SOCSO (2019). ILO (2017a) projected that the specific funds would deplete in 2026 and the combined assets would deplete in 2040 if
the current contribution rate of 1% for the invalidity scheme is not increased. 266 The official acronyms are the SAKK (Skim Annuiti Konvensional) for the conventional scheme and the SATK (Skim Annuiti Tidak
Konvensional) for the non-conventional Islamic scheme. 267 Zainal Abidin Mohd Kassim (2003) 268 Product misselling refers to allegations that private insurance agents were misrepresenting the scheme. Source: Zainal Abidin Mohd
Kassim (2003) 269 Nurin Haniah Asmuni (2018)
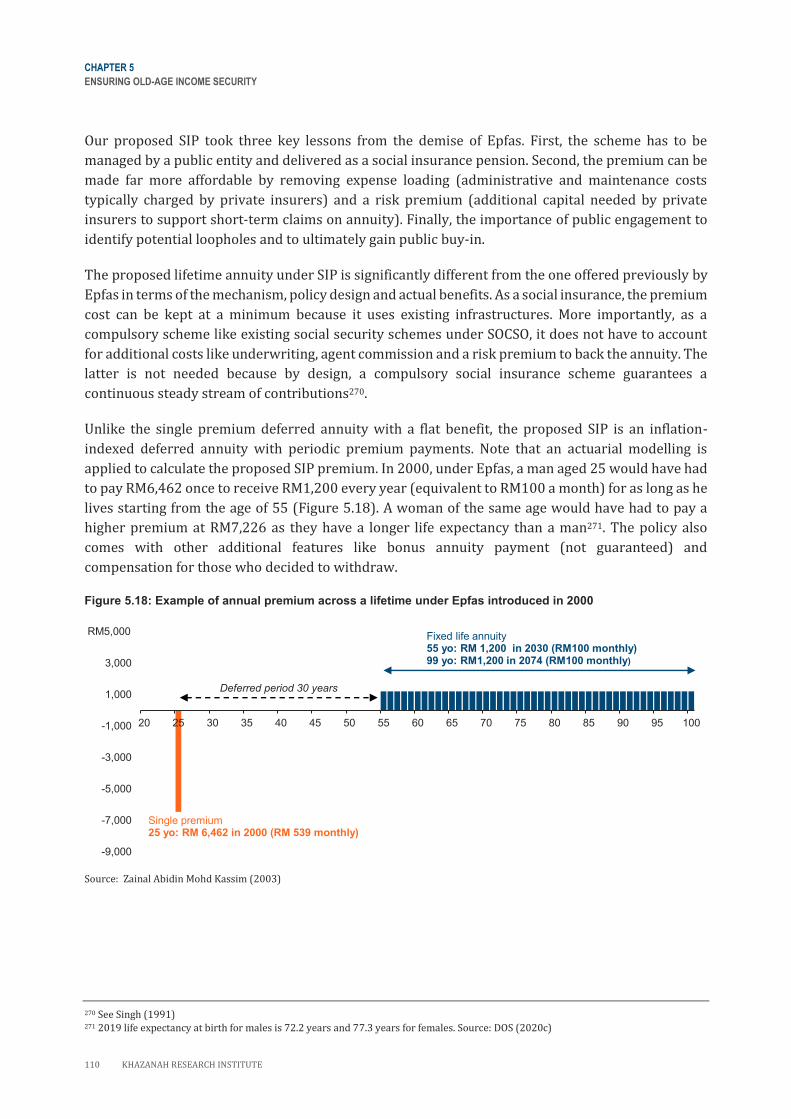
CHAPTER 5
ENSURING OLD-AGE INCOME SECURITY
110 KHAZANAH RESEARCH INSTITUTE
Our proposed SIP took three key lessons from the demise of Epfas. First, the scheme has to be
managed by a public entity and delivered as a social insurance pension. Second, the premium can be
made far more affordable by removing expense loading (administrative and maintenance costs
typically charged by private insurers) and a risk premium (additional capital needed by private
insurers to support short-term claims on annuity). Finally, the importance of public engagement to
identify potential loopholes and to ultimately gain public buy-in.
The proposed lifetime annuity under SIP is significantly different from the one offered previously by
Epfas in terms of the mechanism, policy design and actual benefits. As a social insurance, the premium
cost can be kept at a minimum because it uses existing infrastructures. More importantly, as a
compulsory scheme like existing social security schemes under SOCSO, it does not have to account
for additional costs like underwriting, agent commission and a risk premium to back the annuity. The
latter is not needed because by design, a compulsory social insurance scheme guarantees a
continuous steady stream of contributions270.
Unlike the single premium deferred annuity with a flat benefit, the proposed SIP is an inflation-
indexed deferred annuity with periodic premium payments. Note that an actuarial modelling is
applied to calculate the proposed SIP premium. In 2000, under Epfas, a man aged 25 would have had
to pay RM6,462 once to receive RM1,200 every year (equivalent to RM100 a month) for as long as he
lives starting from the age of 55 (Figure 5.18). A woman of the same age would have had to pay a
higher premium at RM7,226 as they have a longer life expectancy than a man271. The policy also
comes with other additional features like bonus annuity payment (not guaranteed) and
compensation for those who decided to withdraw.
Figure 5.18: Example of annual premium across a lifetime under Epfas introduced in 2000
Source: Zainal Abidin Mohd Kassim (2003)
270 See Singh (1991) 271 2019 life expectancy at birth for males is 72.2 years and 77.3 years for females. Source: DOS (2020c)
-9,000
-7,000
-5,000
-3,000
-1,000
1,000
3,000
5,000
20 25 30 35 40 45 50 55 60 65 70 75 80 85 90 95 100
Single premium 25 yo: RM 6,462 in 2000 (RM 539 monthly)
Fixed life annuity 55 yo: RM 1,200 in 2030 (RM100 monthly) 99 yo: RM1,200 in 2074 (RM100 monthly)
Deferred period 30 years
RM5,000
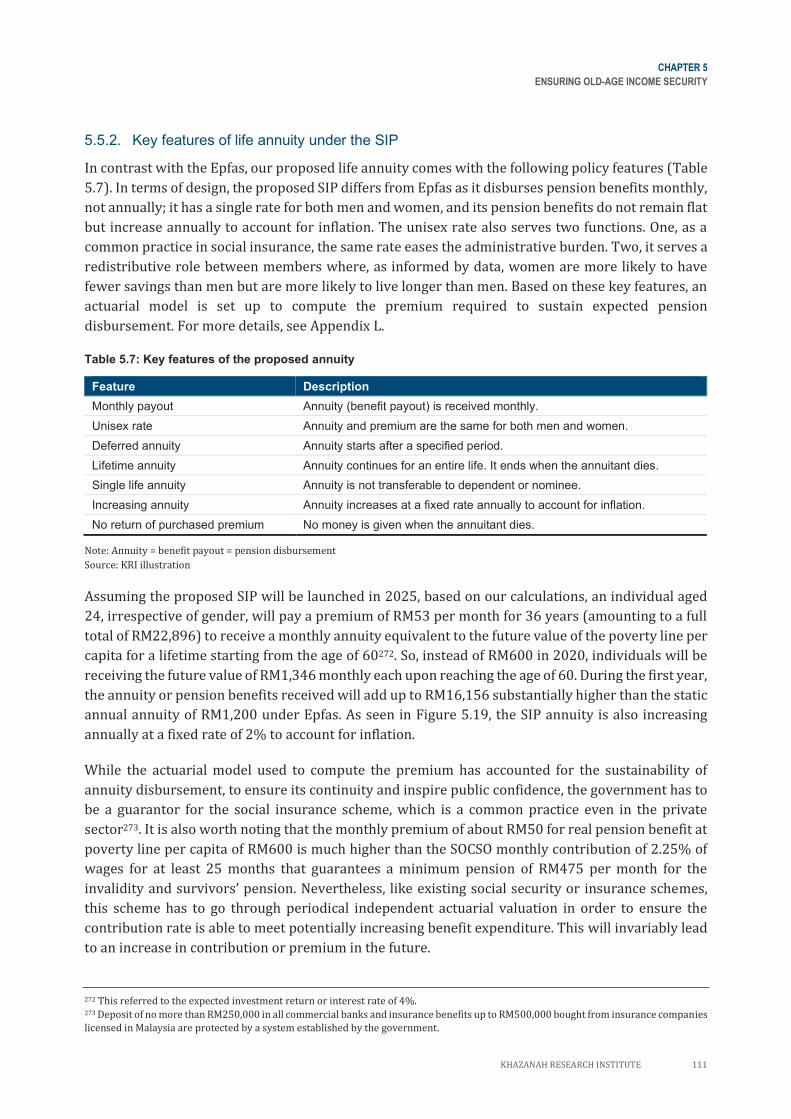
CHAPTER 5
ENSURING OLD-AGE INCOME SECURITY
KHAZANAH RESEARCH INSTITUTE 111
5.5.2. Key features of life annuity under the SIP
In contrast with the Epfas, our proposed life annuity comes with the following policy features (Table
5.7). In terms of design, the proposed SIP differs from Epfas as it disburses pension benefits monthly,
not annually; it has a single rate for both men and women, and its pension benefits do not remain flat
but increase annually to account for inflation. The unisex rate also serves two functions. One, as a
common practice in social insurance, the same rate eases the administrative burden. Two, it serves a
redistributive role between members where, as informed by data, women are more likely to have
fewer savings than men but are more likely to live longer than men. Based on these key features, an
actuarial model is set up to compute the premium required to sustain expected pension
disbursement. For more details, see Appendix L.
Table 5.7: Key features of the proposed annuity
Feature Description
Monthly payout Annuity (benefit payout) is received monthly.
Unisex rate Annuity and premium are the same for both men and women.
Deferred annuity Annuity starts after a specified period.
Lifetime annuity Annuity continues for an entire life. It ends when the annuitant dies.
Single life annuity Annuity is not transferable to dependent or nominee.
Increasing annuity Annuity increases at a fixed rate annually to account for inflation.
No return of purchased premium No money is given when the annuitant dies.
Note: Annuity = benefit payout = pension disbursement
Source: KRI illustration
Assuming the proposed SIP will be launched in 2025, based on our calculations, an individual aged
24, irrespective of gender, will pay a premium of RM53 per month for 36 years (amounting to a full
total of RM22,896) to receive a monthly annuity equivalent to the future value of the poverty line per
capita for a lifetime starting from the age of 60272. So, instead of RM600 in 2020, individuals will be
receiving the future value of RM1,346 monthly each upon reaching the age of 60. During the first year,
the annuity or pension benefits received will add up to RM16,156 substantially higher than the static
annual annuity of RM1,200 under Epfas. As seen in Figure 5.19, the SIP annuity is also increasing
annually at a fixed rate of 2% to account for inflation.
While the actuarial model used to compute the premium has accounted for the sustainability of
annuity disbursement, to ensure its continuity and inspire public confidence, the government has to
be a guarantor for the social insurance scheme, which is a common practice even in the private
sector273. It is also worth noting that the monthly premium of about RM50 for real pension benefit at
poverty line per capita of RM600 is much higher than the SOCSO monthly contribution of 2.25% of
wages for at least 25 months that guarantees a minimum pension of RM475 per month for the
invalidity and survivors’ pension. Nevertheless, like existing social security or insurance schemes,
this scheme has to go through periodical independent actuarial valuation in order to ensure the
contribution rate is able to meet potentially increasing benefit expenditure. This will invariably lead
to an increase in contribution or premium in the future.
272 This referred to the expected investment return or interest rate of 4%. 273 Deposit of no more than RM250,000 in all commercial banks and insurance benefits up to RM500,000 bought from insurance companies
licensed in Malaysia are protected by a system established by the government.
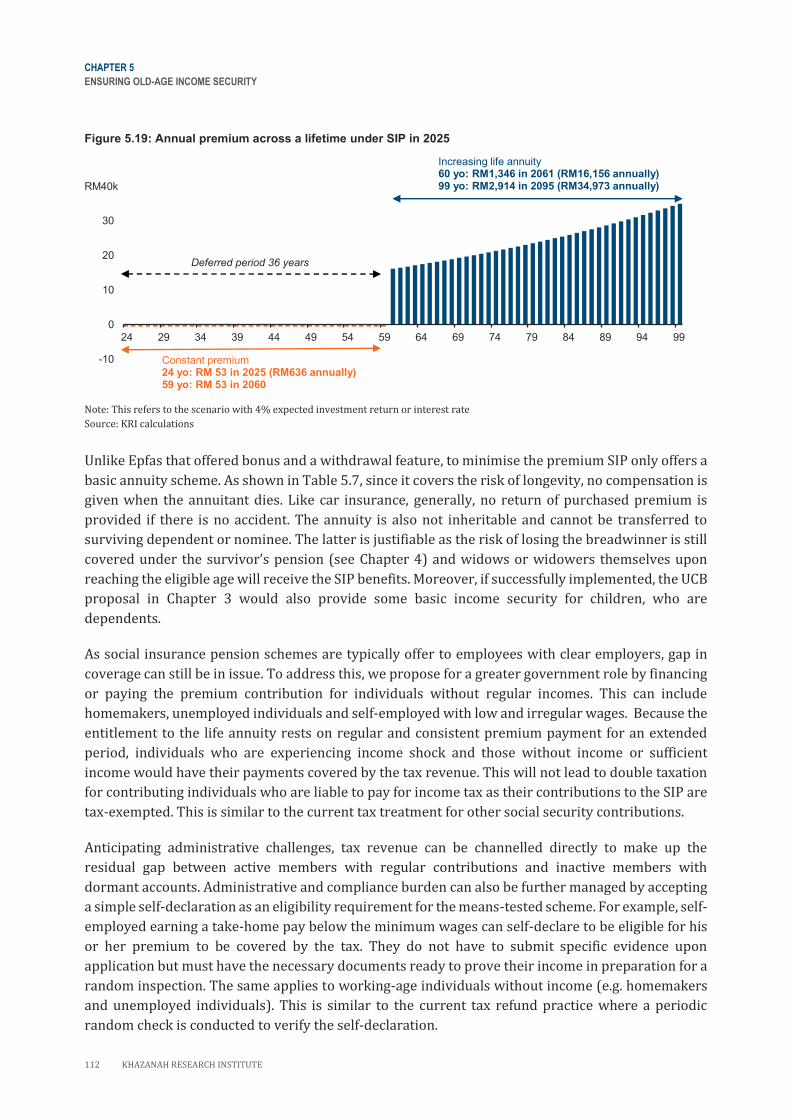
CHAPTER 5
ENSURING OLD-AGE INCOME SECURITY
112 KHAZANAH RESEARCH INSTITUTE
Figure 5.19: Annual premium across a lifetime under SIP in 2025
Note: This refers to the scenario with 4% expected investment return or interest rate
Source: KRI calculations
Unlike Epfas that offered bonus and a withdrawal feature, to minimise the premium SIP only offers a
basic annuity scheme. As shown in Table 5.7, since it covers the risk of longevity, no compensation is
given when the annuitant dies. Like car insurance, generally, no return of purchased premium is
provided if there is no accident. The annuity is also not inheritable and cannot be transferred to
surviving dependent or nominee. The latter is justifiable as the risk of losing the breadwinner is still
covered under the survivor’s pension (see Chapter 4) and widows or widowers themselves upon
reaching the eligible age will receive the SIP benefits. Moreover, if successfully implemented, the UCB
proposal in Chapter 3 would also provide some basic income security for children, who are
dependents.
As social insurance pension schemes are typically offer to employees with clear employers, gap in
coverage can still be in issue. To address this, we propose for a greater government role by financing
or paying the premium contribution for individuals without regular incomes. This can include
homemakers, unemployed individuals and self-employed with low and irregular wages. Because the
entitlement to the life annuity rests on regular and consistent premium payment for an extended
period, individuals who are experiencing income shock and those without income or sufficient
income would have their payments covered by the tax revenue. This will not lead to double taxation
for contributing individuals who are liable to pay for income tax as their contributions to the SIP are
tax-exempted. This is similar to the current tax treatment for other social security contributions.
Anticipating administrative challenges, tax revenue can be channelled directly to make up the
residual gap between active members with regular contributions and inactive members with
dormant accounts. Administrative and compliance burden can also be further managed by accepting
a simple self-declaration as an eligibility requirement for the means-tested scheme. For example, self-
employed earning a take-home pay below the minimum wages can self-declare to be eligible for his
or her premium to be covered by the tax. They do not have to submit specific evidence upon
application but must have the necessary documents ready to prove their income in preparation for a
random inspection. The same applies to working-age individuals without income (e.g. homemakers
and unemployed individuals). This is similar to the current tax refund practice where a periodic
random check is conducted to verify the self-declaration.
-10
0
10
20
30
40
24 29 34 39 44 49 54 59 64 69 74 79 84 89 94 99
Constant premium 24 yo: RM 53 in 2025 (RM636 annually) 59 yo: RM 53 in 2060
Increasing life annuity 60 yo: RM1,346 in 2061 (RM16,156 annually) 99 yo: RM2,914 in 2095 (RM34,973 annually)
Deferred period 36 years
RM40k
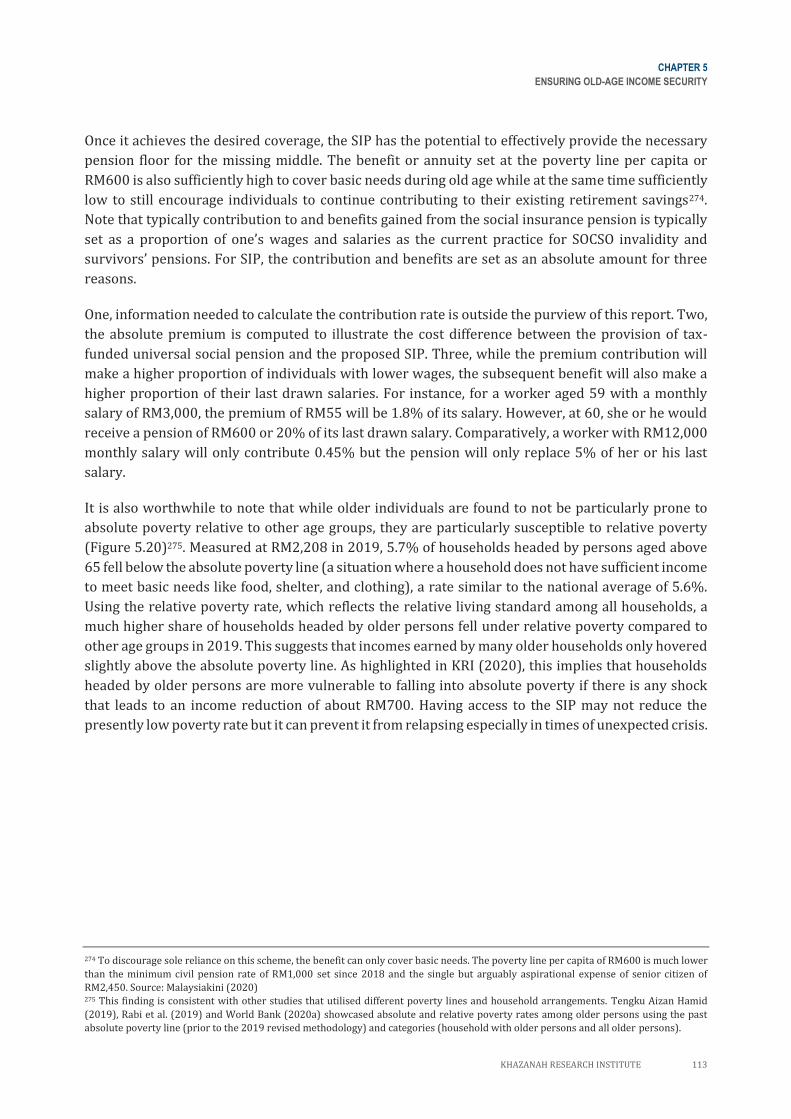
CHAPTER 5
ENSURING OLD-AGE INCOME SECURITY
KHAZANAH RESEARCH INSTITUTE 113
Once it achieves the desired coverage, the SIP has the potential to effectively provide the necessary
pension floor for the missing middle. The benefit or annuity set at the poverty line per capita or
RM600 is also sufficiently high to cover basic needs during old age while at the same time sufficiently
low to still encourage individuals to continue contributing to their existing retirement savings274.
Note that typically contribution to and benefits gained from the social insurance pension is typically
set as a proportion of one’s wages and salaries as the current practice for SOCSO invalidity and
survivors’ pensions. For SIP, the contribution and benefits are set as an absolute amount for three
reasons.
One, information needed to calculate the contribution rate is outside the purview of this report. Two,
the absolute premium is computed to illustrate the cost difference between the provision of tax-
funded universal social pension and the proposed SIP. Three, while the premium contribution will
make a higher proportion of individuals with lower wages, the subsequent benefit will also make a
higher proportion of their last drawn salaries. For instance, for a worker aged 59 with a monthly
salary of RM3,000, the premium of RM55 will be 1.8% of its salary. However, at 60, she or he would
receive a pension of RM600 or 20% of its last drawn salary. Comparatively, a worker with RM12,000
monthly salary will only contribute 0.45% but the pension will only replace 5% of her or his last
salary.
It is also worthwhile to note that while older individuals are found to not be particularly prone to
absolute poverty relative to other age groups, they are particularly susceptible to relative poverty
(Figure 5.20)275. Measured at RM2,208 in 2019, 5.7% of households headed by persons aged above
65 fell below the absolute poverty line (a situation where a household does not have sufficient income
to meet basic needs like food, shelter, and clothing), a rate similar to the national average of 5.6%.
Using the relative poverty rate, which reflects the relative living standard among all households, a
much higher share of households headed by older persons fell under relative poverty compared to
other age groups in 2019. This suggests that incomes earned by many older households only hovered
slightly above the absolute poverty line. As highlighted in KRI (2020), this implies that households
headed by older persons are more vulnerable to falling into absolute poverty if there is any shock
that leads to an income reduction of about RM700. Having access to the SIP may not reduce the
presently low poverty rate but it can prevent it from relapsing especially in times of unexpected crisis.
274 To discourage sole reliance on this scheme, the benefit can only cover basic needs. The poverty line per capita of RM600 is much lower
than the minimum civil pension rate of RM1,000 set since 2018 and the single but arguably aspirational expense of senior citizen of
RM2,450. Source: Malaysiakini (2020) 275 This finding is consistent with other studies that utilised different poverty lines and household arrangements. Tengku Aizan Hamid
(2019), Rabi et al. (2019) and World Bank (2020a) showcased absolute and relative poverty rates among older persons using the past
absolute poverty line (prior to the 2019 revised methodology) and categories (household with older persons and all older persons).
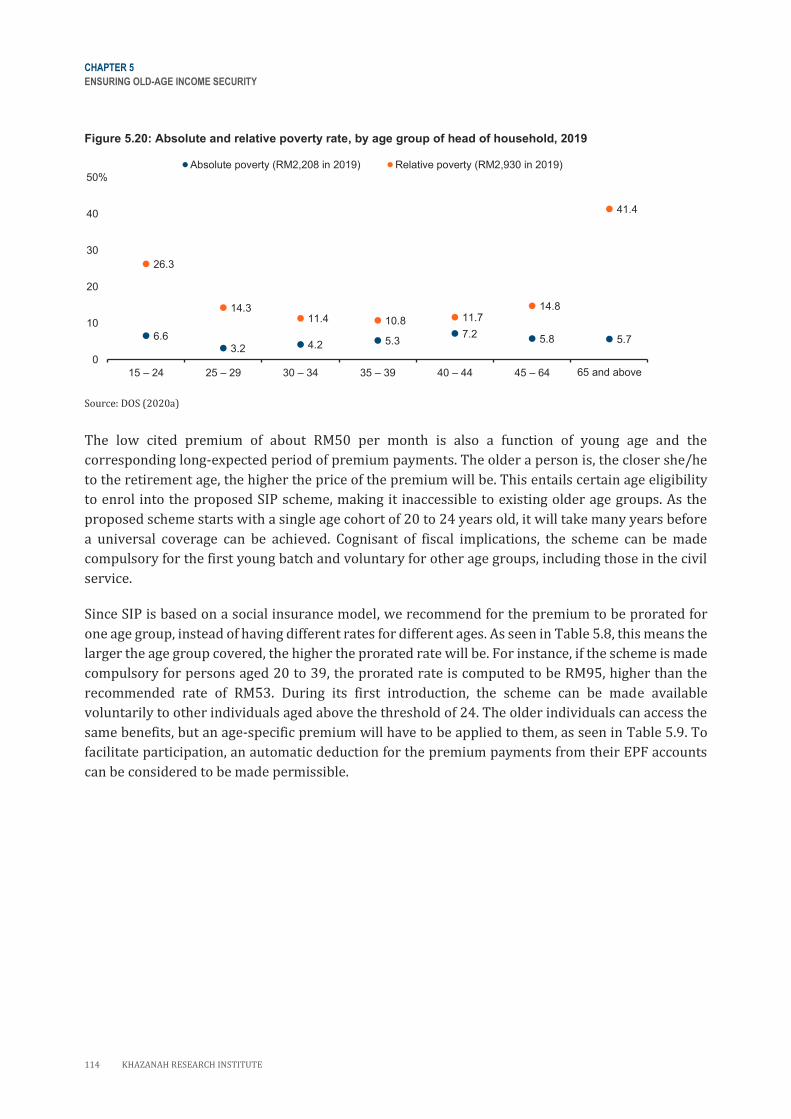
CHAPTER 5
ENSURING OLD-AGE INCOME SECURITY
114 KHAZANAH RESEARCH INSTITUTE
Figure 5.20: Absolute and relative poverty rate, by age group of head of household, 2019
Source: DOS (2020a)
The low cited premium of about RM50 per month is also a function of young age and the
corresponding long-expected period of premium payments. The older a person is, the closer she/he
to the retirement age, the higher the price of the premium will be. This entails certain age eligibility
to enrol into the proposed SIP scheme, making it inaccessible to existing older age groups. As the
proposed scheme starts with a single age cohort of 20 to 24 years old, it will take many years before
a universal coverage can be achieved. Cognisant of fiscal implications, the scheme can be made
compulsory for the first young batch and voluntary for other age groups, including those in the civil
service.
Since SIP is based on a social insurance model, we recommend for the premium to be prorated for
one age group, instead of having different rates for different ages. As seen in Table 5.8, this means the
larger the age group covered, the higher the prorated rate will be. For instance, if the scheme is made
compulsory for persons aged 20 to 39, the prorated rate is computed to be RM95, higher than the
recommended rate of RM53. During its first introduction, the scheme can be made available
voluntarily to other individuals aged above the threshold of 24. The older individuals can access the
same benefits, but an age-specific premium will have to be applied to them, as seen in Table 5.9. To
facilitate participation, an automatic deduction for the premium payments from their EPF accounts
can be considered to be made permissible.
6.63.2 4.2 5.3
7.25.8 5.7
26.3
14.311.4 10.8 11.7
14.8
41.4
0
10
20
30
40
50
15 – 24 25 – 29 30 – 34 35 – 39 40 – 44 45 – 64 65 and above
Absolute poverty (RM2,208 in 2019) Relative poverty (RM2,930 in 2019)
50%
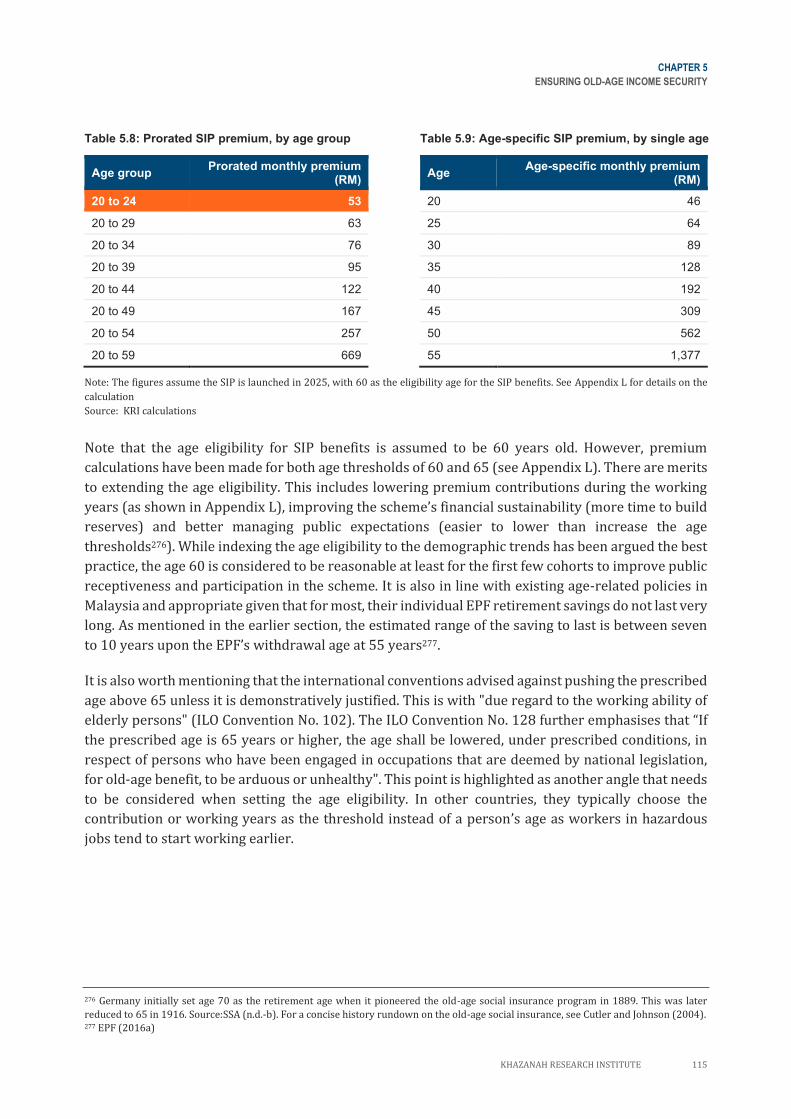
CHAPTER 5
ENSURING OLD-AGE INCOME SECURITY
KHAZANAH RESEARCH INSTITUTE 115
Table 5.8: Prorated SIP premium, by age group Table 5.9: Age-specific SIP premium, by single age
Age group Prorated monthly premium
(RM)
20 to 24 53
20 to 29 63
20 to 34 76
20 to 39 95
20 to 44 122
20 to 49 167
20 to 54 257
20 to 59 669
Age Age-specific monthly premium
(RM)
20 46
25 64
30 89
35 128
40 192
45 309
50 562
55 1,377
Note: The figures assume the SIP is launched in 2025, with 60 as the eligibility age for the SIP benefits. See Appendix L for details on the
calculation
Source: KRI calculations
Note that the age eligibility for SIP benefits is assumed to be 60 years old. However, premium
calculations have been made for both age thresholds of 60 and 65 (see Appendix L). There are merits
to extending the age eligibility. This includes lowering premium contributions during the working
years (as shown in Appendix L), improving the scheme’s financial sustainability (more time to build
reserves) and better managing public expectations (easier to lower than increase the age
thresholds276). While indexing the age eligibility to the demographic trends has been argued the best
practice, the age 60 is considered to be reasonable at least for the first few cohorts to improve public
receptiveness and participation in the scheme. It is also in line with existing age-related policies in
Malaysia and appropriate given that for most, their individual EPF retirement savings do not last very
long. As mentioned in the earlier section, the estimated range of the saving to last is between seven
to 10 years upon the EPF’s withdrawal age at 55 years277.
It is also worth mentioning that the international conventions advised against pushing the prescribed
age above 65 unless it is demonstratively justified. This is with "due regard to the working ability of
elderly persons" (ILO Convention No. 102). The ILO Convention No. 128 further emphasises that “If
the prescribed age is 65 years or higher, the age shall be lowered, under prescribed conditions, in
respect of persons who have been engaged in occupations that are deemed by national legislation,
for old-age benefit, to be arduous or unhealthy". This point is highlighted as another angle that needs
to be considered when setting the age eligibility. In other countries, they typically choose the
contribution or working years as the threshold instead of a person’s age as workers in hazardous
jobs tend to start working earlier.
276 Germany initially set age 70 as the retirement age when it pioneered the old-age social insurance program in 1889. This was later
reduced to 65 in 1916. Source:SSA (n.d.-b). For a concise history rundown on the old-age social insurance, see Cutler and Johnson (2004). 277 EPF (2016a)
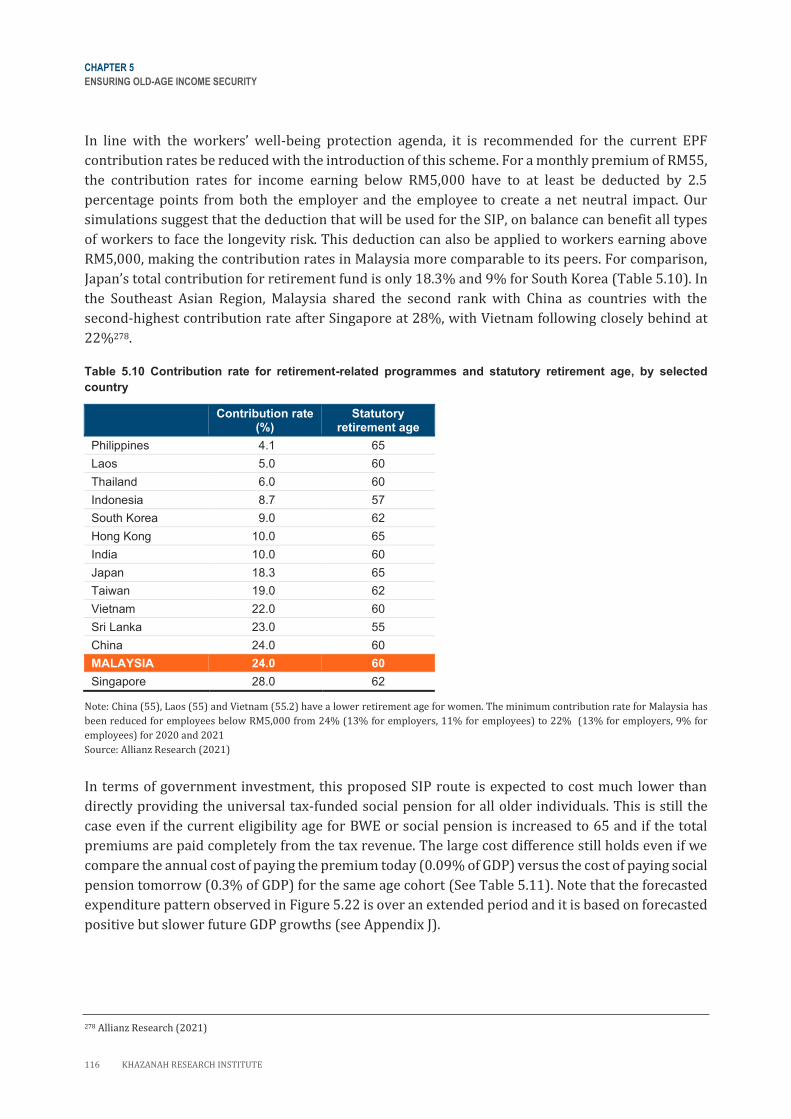
CHAPTER 5
ENSURING OLD-AGE INCOME SECURITY
116 KHAZANAH RESEARCH INSTITUTE
In line with the workers’ well-being protection agenda, it is recommended for the current EPF
contribution rates be reduced with the introduction of this scheme. For a monthly premium of RM55,
the contribution rates for income earning below RM5,000 have to at least be deducted by 2.5
percentage points from both the employer and the employee to create a net neutral impact. Our
simulations suggest that the deduction that will be used for the SIP, on balance can benefit all types
of workers to face the longevity risk. This deduction can also be applied to workers earning above
RM5,000, making the contribution rates in Malaysia more comparable to its peers. For comparison,
Japan’s total contribution for retirement fund is only 18.3% and 9% for South Korea (Table 5.10). In
the Southeast Asian Region, Malaysia shared the second rank with China as countries with the
second-highest contribution rate after Singapore at 28%, with Vietnam following closely behind at
22%278.
Table 5.10 Contribution rate for retirement-related programmes and statutory retirement age, by selected
country
Contribution rate (%)
Statutory retirement age
Philippines 4.1 65
Laos 5.0 60
Thailand 6.0 60
Indonesia 8.7 57
South Korea 9.0 62
Hong Kong 10.0 65
India 10.0 60
Japan 18.3 65
Taiwan 19.0 62
Vietnam 22.0 60
Sri Lanka 23.0 55
China 24.0 60
MALAYSIA 24.0 60
Singapore 28.0 62
Note: China (55), Laos (55) and Vietnam (55.2) have a lower retirement age for women. The minimum contribution rate for Malaysia has
been reduced for employees below RM5,000 from 24% (13% for employers, 11% for employees) to 22% (13% for employers, 9% for
employees) for 2020 and 2021
Source: Allianz Research (2021)
In terms of government investment, this proposed SIP route is expected to cost much lower than
directly providing the universal tax-funded social pension for all older individuals. This is still the
case even if the current eligibility age for BWE or social pension is increased to 65 and if the total
premiums are paid completely from the tax revenue. The large cost difference still holds even if we
compare the annual cost of paying the premium today (0.09% of GDP) versus the cost of paying social
pension tomorrow (0.3% of GDP) for the same age cohort (See Table 5.11). Note that the forecasted
expenditure pattern observed in Figure 5.22 is over an extended period and it is based on forecasted
positive but slower future GDP growths (see Appendix J).
278 Allianz Research (2021)
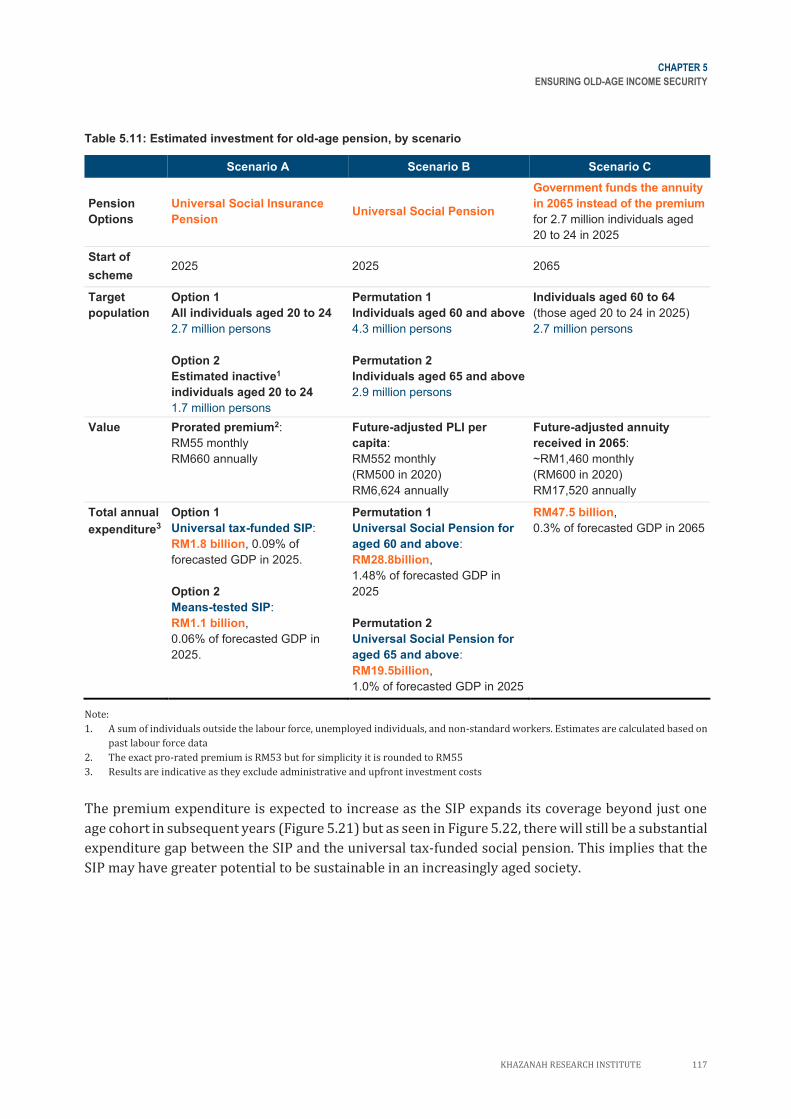
CHAPTER 5
ENSURING OLD-AGE INCOME SECURITY
KHAZANAH RESEARCH INSTITUTE 117
Table 5.11: Estimated investment for old-age pension, by scenario
Scenario A Scenario B Scenario C
Pension
Options
Universal Social Insurance
Pension Universal Social Pension
Government funds the annuity
in 2065 instead of the premium
for 2.7 million individuals aged
20 to 24 in 2025
Start of
scheme 2025 2025 2065
Target
population
Option 1
All individuals aged 20 to 24
2.7 million persons
Option 2
Estimated inactive1
individuals aged 20 to 24
1.7 million persons
Permutation 1
Individuals aged 60 and above
4.3 million persons
Permutation 2
Individuals aged 65 and above
2.9 million persons
Individuals aged 60 to 64
(those aged 20 to 24 in 2025)
2.7 million persons
Value Prorated premium2:
RM55 monthly
RM660 annually
Future-adjusted PLI per
capita:
RM552 monthly
(RM500 in 2020)
RM6,624 annually
Future-adjusted annuity
received in 2065:
~RM1,460 monthly
(RM600 in 2020)
RM17,520 annually
Total annual
expenditure3
Option 1
Universal tax-funded SIP:
RM1.8 billion, 0.09% of
forecasted GDP in 2025.
Option 2
Means-tested SIP:
RM1.1 billion,
0.06% of forecasted GDP in
2025.
Permutation 1
Universal Social Pension for
aged 60 and above:
RM28.8billion,
1.48% of forecasted GDP in
2025
Permutation 2
Universal Social Pension for
aged 65 and above:
RM19.5billion,
1.0% of forecasted GDP in 2025
RM47.5 billion,
0.3% of forecasted GDP in 2065
Note:
1. A sum of individuals outside the labour force, unemployed individuals, and non-standard workers. Estimates are calculated based on
past labour force data
2. The exact pro-rated premium is RM53 but for simplicity it is rounded to RM55
3. Results are indicative as they exclude administrative and upfront investment costs
The premium expenditure is expected to increase as the SIP expands its coverage beyond just one
age cohort in subsequent years (Figure 5.21) but as seen in Figure 5.22, there will still be a substantial
expenditure gap between the SIP and the universal tax-funded social pension. This implies that the
SIP may have greater potential to be sustainable in an increasingly aged society.
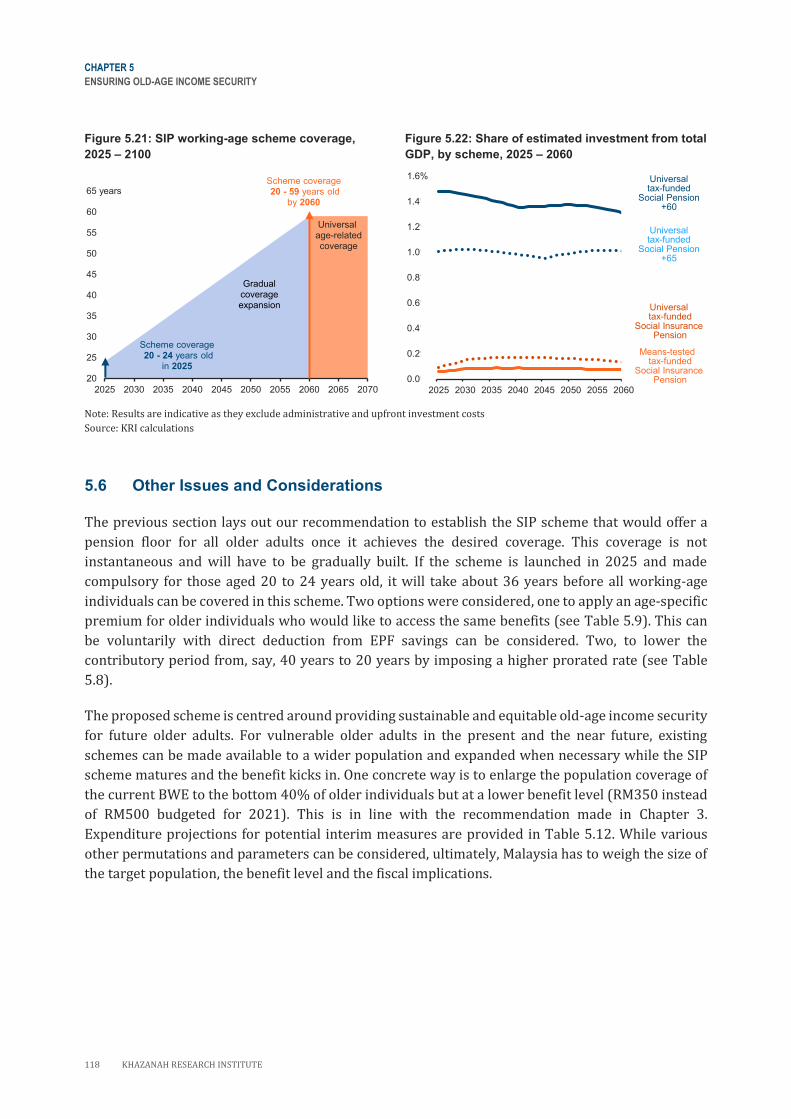
CHAPTER 5
ENSURING OLD-AGE INCOME SECURITY
118 KHAZANAH RESEARCH INSTITUTE
Figure 5.21: SIP working-age scheme coverage,
2025 – 2100
Figure 5.22: Share of estimated investment from total
GDP, by scheme, 2025 – 2060
Note: Results are indicative as they exclude administrative and upfront investment costs
Source: KRI calculations
5.6 Other Issues and Considerations
The previous section lays out our recommendation to establish the SIP scheme that would offer a
pension floor for all older adults once it achieves the desired coverage. This coverage is not
instantaneous and will have to be gradually built. If the scheme is launched in 2025 and made
compulsory for those aged 20 to 24 years old, it will take about 36 years before all working-age
individuals can be covered in this scheme. Two options were considered, one to apply an age-specific
premium for older individuals who would like to access the same benefits (see Table 5.9). This can
be voluntarily with direct deduction from EPF savings can be considered. Two, to lower the
contributory period from, say, 40 years to 20 years by imposing a higher prorated rate (see Table
5.8).
The proposed scheme is centred around providing sustainable and equitable old-age income security
for future older adults. For vulnerable older adults in the present and the near future, existing
schemes can be made available to a wider population and expanded when necessary while the SIP
scheme matures and the benefit kicks in. One concrete way is to enlarge the population coverage of
the current BWE to the bottom 40% of older individuals but at a lower benefit level (RM350 instead
of RM500 budgeted for 2021). This is in line with the recommendation made in Chapter 3.
Expenditure projections for potential interim measures are provided in Table 5.12. While various
other permutations and parameters can be considered, ultimately, Malaysia has to weigh the size of
the target population, the benefit level and the fiscal implications.
20
25
30
35
40
45
50
55
60
65
2025 2030 2035 2040 2045 2050 2055 2060 2065 2070
65 years
Scheme coverage 20 - 24 years old
in 2025
Scheme coverage20 - 59 years old
by 2060
Gradualcoverageexpansion
Universalage-relatedcoverage
0.0%
0.2%
0.4%
0.6%
0.8%
1.0%
1.2%
1.4%
1.6%
2025 2030 2035 2040 2045 2050 2055 2060
Universaltax-funded
Social Pension+60
Universaltax-funded
Social Pension+65
Universaltax-funded
Social InsurancePension
Means-tested tax-funded
Social InsurancePension
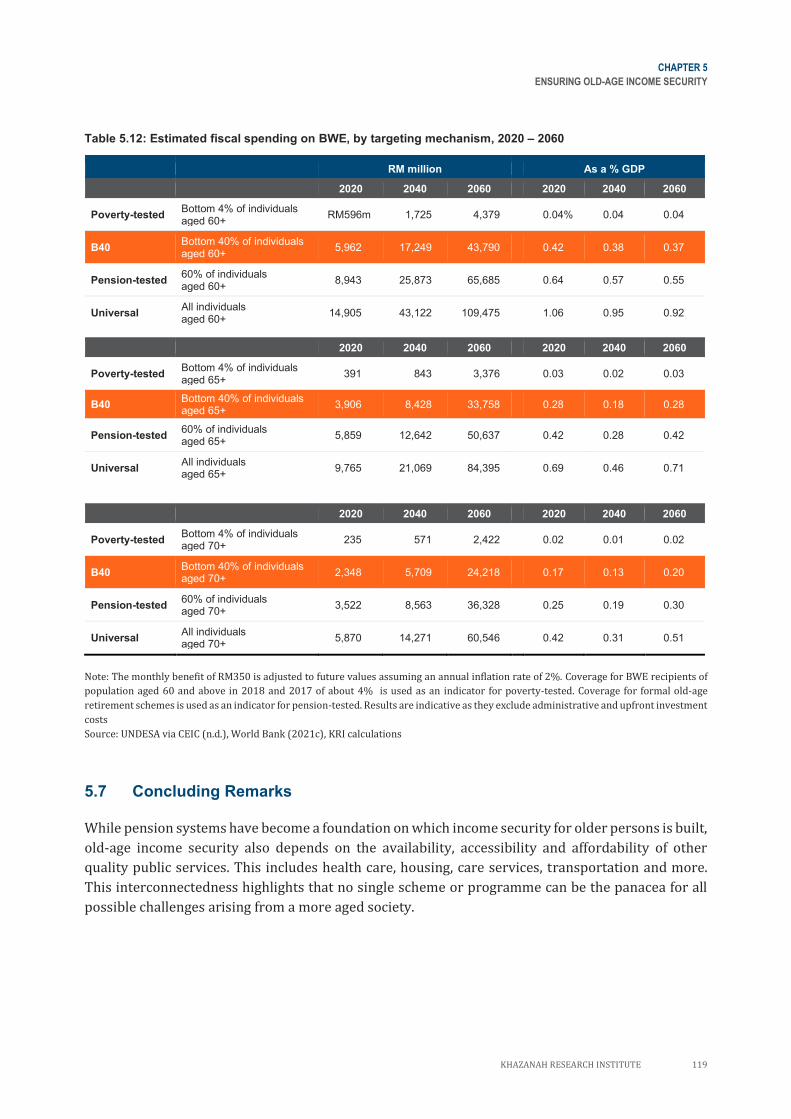
CHAPTER 5
ENSURING OLD-AGE INCOME SECURITY
KHAZANAH RESEARCH INSTITUTE 119
Table 5.12: Estimated fiscal spending on BWE, by targeting mechanism, 2020 – 2060
RM million As a % GDP
2020 2040 2060 2020 2040 2060
Poverty-tested Bottom 4% of individuals aged 60+
RM596m 1,725 4,379 0.04% 0.04 0.04
B40 Bottom 40% of individuals aged 60+
5,962 17,249 43,790 0.42 0.38 0.37
Pension-tested 60% of individuals aged 60+
8,943 25,873 65,685 0.64 0.57 0.55
Universal All individuals aged 60+
14,905 43,122 109,475 1.06 0.95 0.92
2020 2040 2060 2020 2040 2060
Poverty-tested Bottom 4% of individuals aged 65+
391 843 3,376 0.03 0.02 0.03
B40 Bottom 40% of individuals aged 65+
3,906 8,428 33,758 0.28 0.18 0.28
Pension-tested 60% of individuals aged 65+
5,859 12,642 50,637 0.42 0.28 0.42
Universal All individuals aged 65+
9,765 21,069 84,395 0.69 0.46 0.71
2020 2040 2060 2020 2040 2060
Poverty-tested Bottom 4% of individuals aged 70+
235 571 2,422 0.02 0.01 0.02
B40 Bottom 40% of individuals aged 70+
2,348 5,709 24,218 0.17 0.13 0.20
Pension-tested 60% of individuals aged 70+
3,522 8,563 36,328 0.25 0.19 0.30
Universal All individuals aged 70+
5,870 14,271 60,546 0.42 0.31 0.51
Note: The monthly benefit of RM350 is adjusted to future values assuming an annual inflation rate of 2%. Coverage for BWE recipients of
population aged 60 and above in 2018 and 2017 of about 4% is used as an indicator for poverty-tested. Coverage for formal old-age
retirement schemes is used as an indicator for pension-tested. Results are indicative as they exclude administrative and upfront investment
costs
Source: UNDESA via CEIC (n.d.), World Bank (2021c), KRI calculations
5.7 Concluding Remarks
While pension systems have become a foundation on which income security for older persons is built,
old-age income security also depends on the availability, accessibility and affordability of other
quality public services. This includes health care, housing, care services, transportation and more.
This interconnectedness highlights that no single scheme or programme can be the panacea for all
possible challenges arising from a more aged society.

CHAPTER 5
ENSURING OLD-AGE INCOME SECURITY
120 KHAZANAH RESEARCH INSTITUTE
This chapter offers a universal pension based on a social insurance model as an alternative to the
often discussed but not yet realised Universal Social Pension. SIP posits itself as a preventative
measure for an increasingly pressing issue. SIP also seeks to balance equity and sustainability.
Learning from the experience of other countries, the sustainability, adequacy, and coverage
challenges for old-age pensions are expected to persist. Therefore, the best way forward would be to
continue honing the balancing act.
This chapter sets out a proposal to introduce the SIP scheme in Malaysia to gradually install a pension
floor for all its older adults. We propose for the scheme to be launched in 2025 and be made
compulsory for individuals aged 20 to 24 years, with the government subsiding or financing
contribution for certain groups. Participants in the scheme would make monthly payments of RM53
for at least 36 years to receive a monthly annuity or pension equivalent to the inflation-adjusted
poverty line per capita for a lifetime starting from the age of 60. This scheme is argued to be an
important step towards developing a sustainable and equitable pension system in Malaysia that can
ensure (or in this case insure) old-age income security. While the fruit of SIP may only be seen long
into the future, the seeds of change have to be sow now.
KHAZANAH RESEARCH INSTITUTE 121
CHAPTER
06
FINANCING AND DELIVERING SOCIAL
PROTECTION 122
6.1 Introduction 122
6.2 Malaysia’s Fiscal Landscape 123
6.2.1 Government revenue: remains
relatively low with a narrow tax
base 126
6.2.2 Government expenditure:
constrained with low social
protection spending 130
6.3 Financing Social Protection 132
6.3.1 Estimated total investment
required 132
6.3.2 Progressive realisation strategy 133
6.3.3 Creating the fiscal space 135
6.4 Driving the National Social Protection
Agenda 141
6.4.1 National Social Protection Registry 143
6.4.2 Efficient service delivery 144
6.4.3 Better response to “shocks” 145
6.4.4 UCB as a critical record entry
point 145
6.5 Putting it All Together 146
6.5.1 What does it mean for individuals? 147
6.5.2 What does it mean for
households? 148
6.6 Concluding Remarks 150
122 KHAZANAH RESEARCH INSTITUTE
CHAPTER 6
FINANCING AND DELIVERING SOCIAL PROTECTION
Social protection is no longer considered to be a luxury. Neither is it seen as something that countries
can only afford after reaching certain income levels. Instead, social protection is now largely regarded
as a pre-condition for sustainable growth, social inclusion, and as a mechanism to promote equity.
Xiaoqing (2016)
6.1 Introduction
There has been a global consensus that social protection is a key element in the sustainable
development agenda279. A large body of literature suggest that strong social protection system with
breadth and depth can have a positive impact on poverty, inequality, human capital, consumption
and aggregate demand leading to economic growth280. While many compelling arguments on the
positive impact of social protection can be found in literature, the discussion inevitably must entail
the source of financing to ensure successful and sustainable implementation.
Undeniably, social protection is not insulated from intense debate of its impact on overall economic
performance. A large welfare state is argued to be creating excessive administrative cost, affect the
allocation of productive resources and give rise to moral hazard281. Others claimed that welfare aids
create reliance on public support and perverse incentives in the labour market, undermining the
notion of work. For example, the provision of unemployment benefits has been argued to provide
perverse incentives in the labour market as it may negatively influence the job search effort of the
unemployed282. Nevertheless, the experiences of economically successful and socially stable
countries—which demonstrated that economic development and strong social protection are
mutually reinforcing—have largely countered these arguments283.
An effective social protection system needs to be grounded by solid financial resources. Identifying
sustainable funding either within the existing fiscal space or generating additional revenue will be
necessary in light of population ageing, erosion of the participation and contribution base for social
insurance due to the changing nature of work, and economic uncertainty leading to higher risk of
unemployment, underemployment and other types of precarity.
This chapter consolidates the social protection floor proposals for children, working age and old age
populations in the earlier chapters and ties the recommendations in the context of fiscal space and
sustainable financing. As Malaysia currently have several providers of social protection schemes, the
discussion is extended on the institutional arrangements and administrative coordination in
delivering the services effectively.
279 UN (2015), ILO (2012) 280 ILO (2018a) 281 Cichon et al. (2004) 282 Arranz Muñoz and Muro (2004) 283 Headey et al. (1999)
CHAPTER 6
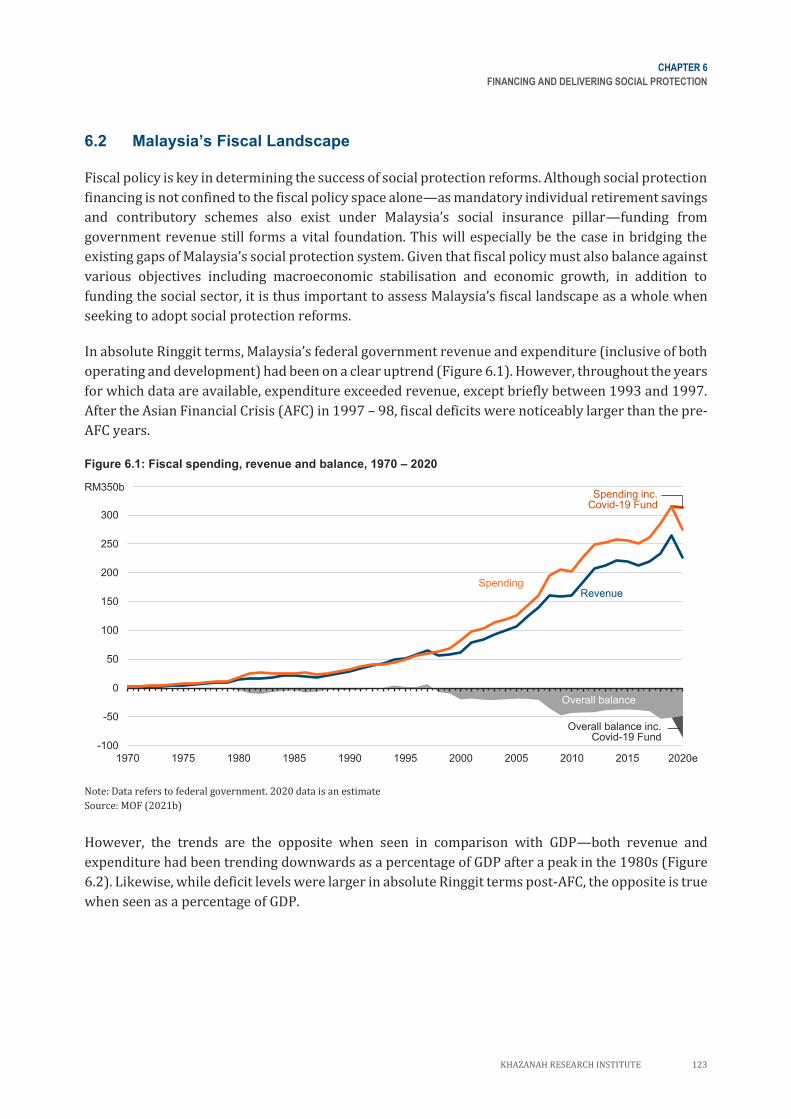
CHAPTER 6
FINANCING AND DELIVERING SOCIAL PROTECTION
KHAZANAH RESEARCH INSTITUTE 123
6.2 l ysi ’s Fiscal Landscape
Fiscal policy is key in determining the success of social protection reforms. Although social protection
financing is not confined to the fiscal policy space alone—as mandatory individual retirement savings
and contributory schemes also exist under Malaysia’s social insurance pillar—funding from
government revenue still forms a vital foundation. This will especially be the case in bridging the
existing gaps of Malaysia’s social protection system. Given that fiscal policy must also balance against
various objectives including macroeconomic stabilisation and economic growth, in addition to
funding the social sector, it is thus important to assess Malaysia’s fiscal landscape as a whole when
seeking to adopt social protection reforms.
In absolute Ringgit terms, Malaysia’s federal government revenue and expenditure (inclusive of both
operating and development) had been on a clear uptrend (Figure 6.1). However, throughout the years
for which data are available, expenditure exceeded revenue, except briefly between 1993 and 1997.
After the Asian Financial Crisis (AFC) in 1997 – 98, fiscal deficits were noticeably larger than the pre-
AFC years.
Figure 6.1: Fiscal spending, revenue and balance, 1970 – 2020
Note: Data refers to federal government. 2020 data is an estimate
Source: MOF (2021b)
However, the trends are the opposite when seen in comparison with GDP—both revenue and
expenditure had been trending downwards as a percentage of GDP after a peak in the 1980s (Figure
6.2). Likewise, while deficit levels were larger in absolute Ringgit terms post-AFC, the opposite is true
when seen as a percentage of GDP.
-100
-50
0
50
100
150
200
250
300
350
1970 1975 1980 1985 1990 1995 2000 2005 2010 2015 2020e
RM350b
SpendingRevenue
Overall balance
Spending inc. Covid-19 Fund
Overall balance inc. Covid-19 Fund
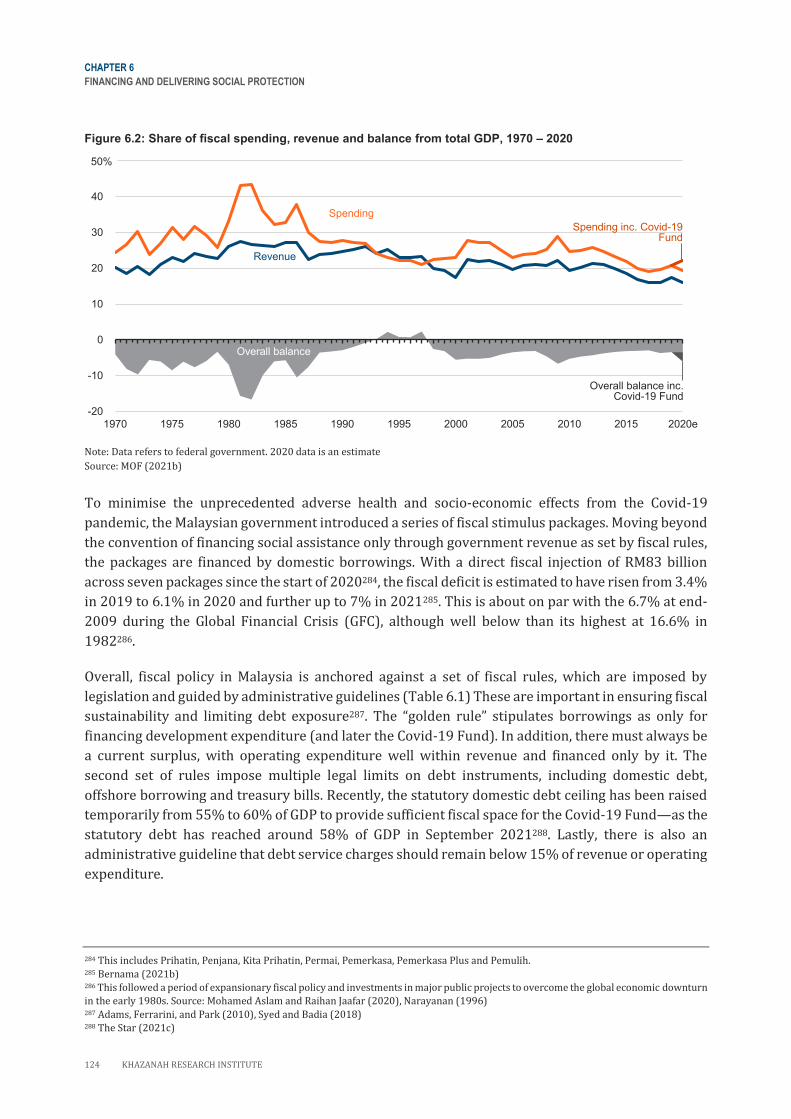
CHAPTER 6
FINANCING AND DELIVERING SOCIAL PROTECTION
124 KHAZANAH RESEARCH INSTITUTE
Figure 6.2: Share of fiscal spending, revenue and balance from total GDP, 1970 – 2020
Note: Data refers to federal government. 2020 data is an estimate
Source: MOF (2021b)
To minimise the unprecedented adverse health and socio-economic effects from the Covid-19
pandemic, the Malaysian government introduced a series of fiscal stimulus packages. Moving beyond
the convention of financing social assistance only through government revenue as set by fiscal rules,
the packages are financed by domestic borrowings. With a direct fiscal injection of RM83 billion
across seven packages since the start of 2020284, the fiscal deficit is estimated to have risen from 3.4%
in 2019 to 6.1% in 2020 and further up to 7% in 2021285. This is about on par with the 6.7% at end-
2009 during the Global Financial Crisis (GFC), although well below than its highest at 16.6% in
1982286.
Overall, fiscal policy in Malaysia is anchored against a set of fiscal rules, which are imposed by
legislation and guided by administrative guidelines (Table 6.1) These are important in ensuring fiscal
sustainability and limiting debt exposure287. The “golden rule” stipulates borrowings as only for
financing development expenditure (and later the Covid-19 Fund). In addition, there must always be
a current surplus, with operating expenditure well within revenue and financed only by it. The
second set of rules impose multiple legal limits on debt instruments, including domestic debt,
offshore borrowing and treasury bills. Recently, the statutory domestic debt ceiling has been raised
temporarily from 55% to 60% of GDP to provide sufficient fiscal space for the Covid-19 Fund—as the
statutory debt has reached around 58% of GDP in September 2021288. Lastly, there is also an
administrative guideline that debt service charges should remain below 15% of revenue or operating
expenditure.
284 This includes Prihatin, Penjana, Kita Prihatin, Permai, Pemerkasa, Pemerkasa Plus and Pemulih. 285 Bernama (2021b) 286 This followed a period of expansionary fiscal policy and investments in major public projects to overcome the global economic downturn
in the early 1980s. Source: Mohamed Aslam and Raihan Jaafar (2020), Narayanan (1996) 287 Adams, Ferrarini, and Park (2010), Syed and Badia (2018) 288 The Star (2021c)
-20
-10
0
10
20
30
40
50
1970 1975 1980 1985 1990 1995 2000 2005 2010 2015 2020e
50%
Spending
Revenue
Overall balance
Spending inc. Covid-19 Fund
Overall balance inc. Covid-19 Fund
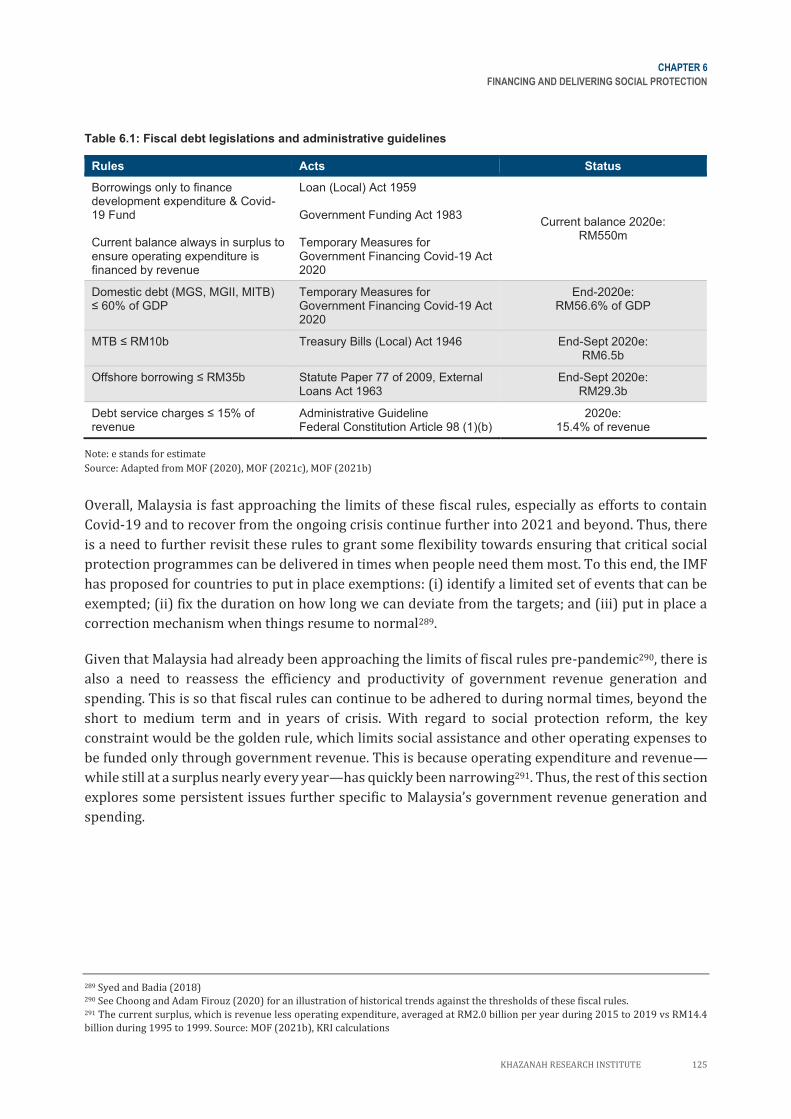
CHAPTER 6
FINANCING AND DELIVERING SOCIAL PROTECTION
KHAZANAH RESEARCH INSTITUTE 125
Table 6.1: Fiscal debt legislations and administrative guidelines
Rules Acts Status
Borrowings only to finance development expenditure & Covid-19 Fund Current balance always in surplus to ensure operating expenditure is financed by revenue
Loan (Local) Act 1959 Government Funding Act 1983 Temporary Measures for Government Financing Covid-19 Act 2020
Current balance 2020e: RM550m
Domestic debt (MGS, MGII, MITB) ≤ 60 of D
Temporary Measures for Government Financing Covid-19 Act 2020
End-2020e: RM56.6% of GDP
MT ≤ RM10b Treasury Bills (Local) Act 1946 End-Sept 2020e: RM6.5b
Offshore borrowing ≤ RM35b Statute Paper 77 of 2009, External Loans Act 1963
End-Sept 2020e: RM29.3b
Debt service charges ≤ 15 of revenue
Administrative Guideline Federal Constitution Article 98 (1)(b)
2020e: 15.4% of revenue
Note: e stands for estimate
Source: Adapted from MOF (2020), MOF (2021c), MOF (2021b)
Overall, Malaysia is fast approaching the limits of these fiscal rules, especially as efforts to contain
Covid-19 and to recover from the ongoing crisis continue further into 2021 and beyond. Thus, there
is a need to further revisit these rules to grant some flexibility towards ensuring that critical social
protection programmes can be delivered in times when people need them most. To this end, the IMF
has proposed for countries to put in place exemptions: (i) identify a limited set of events that can be
exempted; (ii) fix the duration on how long we can deviate from the targets; and (iii) put in place a
correction mechanism when things resume to normal289.
Given that Malaysia had already been approaching the limits of fiscal rules pre-pandemic290, there is
also a need to reassess the efficiency and productivity of government revenue generation and
spending. This is so that fiscal rules can continue to be adhered to during normal times, beyond the
short to medium term and in years of crisis. With regard to social protection reform, the key
constraint would be the golden rule, which limits social assistance and other operating expenses to
be funded only through government revenue. This is because operating expenditure and revenue—
while still at a surplus nearly every year—has quickly been narrowing291. Thus, the rest of this section
explores some persistent issues further specific to Malaysia’s government revenue generation and
spending.
289 Syed and Badia (2018) 290 See Choong and Adam Firouz (2020) for an illustration of historical trends against the thresholds of these fiscal rules. 291 The current surplus, which is revenue less operating expenditure, averaged at RM2.0 billion per year during 2015 to 2019 vs RM14.4
billion during 1995 to 1999. Source: MOF (2021b), KRI calculations
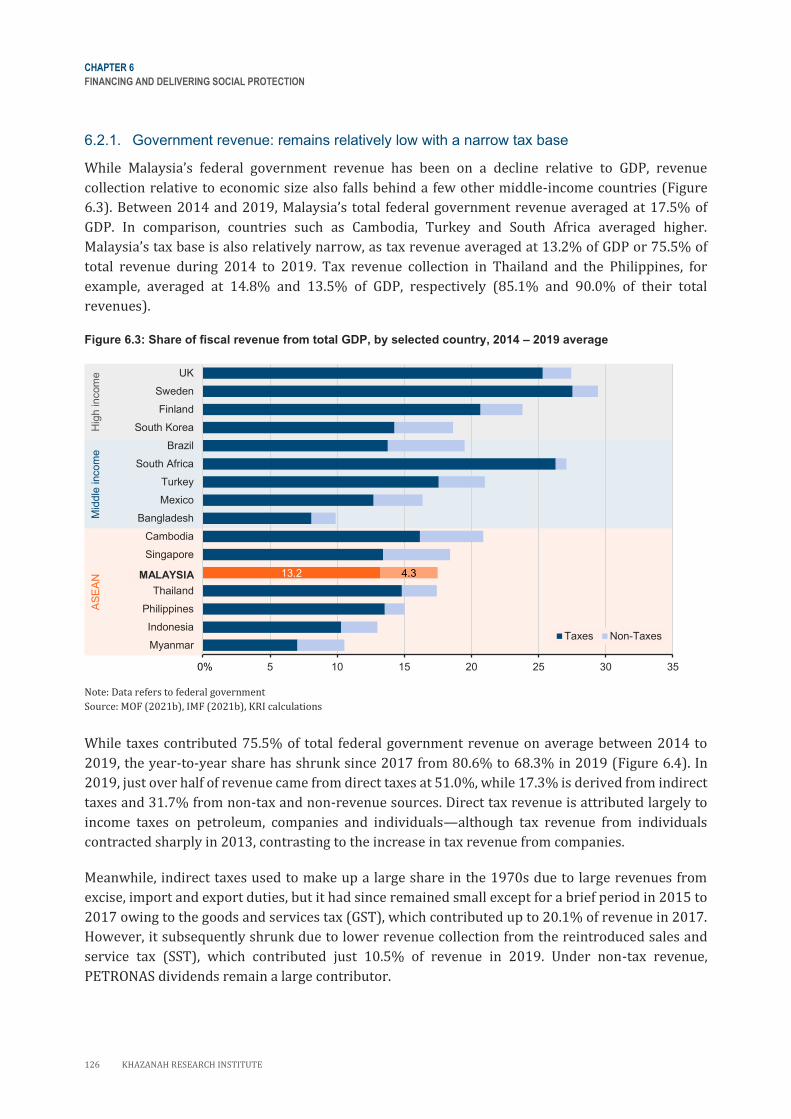
CHAPTER 6
FINANCING AND DELIVERING SOCIAL PROTECTION
126 KHAZANAH RESEARCH INSTITUTE
AS
EA
N
Mid
dle
incom
e
Hig
h in
com
e
6.2.1. Government revenue: remains relatively low with a narrow tax base
While Malaysia’s federal government revenue has been on a decline relative to GDP, revenue
collection relative to economic size also falls behind a few other middle-income countries (Figure
6.3). Between 2014 and 2019, Malaysia’s total federal government revenue averaged at 17.5% of
GDP. In comparison, countries such as Cambodia, Turkey and South Africa averaged higher.
Malaysia’s tax base is also relatively narrow, as tax revenue averaged at 13.2% of GDP or 75.5% of
total revenue during 2014 to 2019. Tax revenue collection in Thailand and the Philippines, for
example, averaged at 14.8% and 13.5% of GDP, respectively (85.1% and 90.0% of their total
revenues).
Figure 6.3: Share of fiscal revenue from total GDP, by selected country, 2014 – 2019 average
Note: Data refers to federal government
Source: MOF (2021b), IMF (2021b), KRI calculations
While taxes contributed 75.5% of total federal government revenue on average between 2014 to
2019, the year-to-year share has shrunk since 2017 from 80.6% to 68.3% in 2019 (Figure 6.4). In
2019, just over half of revenue came from direct taxes at 51.0%, while 17.3% is derived from indirect
taxes and 31.7% from non-tax and non-revenue sources. Direct tax revenue is attributed largely to
income taxes on petroleum, companies and individuals—although tax revenue from individuals
contracted sharply in 2013, contrasting to the increase in tax revenue from companies.
Meanwhile, indirect taxes used to make up a large share in the 1970s due to large revenues from
excise, import and export duties, but it had since remained small except for a brief period in 2015 to
2017 owing to the goods and services tax (GST), which contributed up to 20.1% of revenue in 2017.
However, it subsequently shrunk due to lower revenue collection from the reintroduced sales and
service tax (SST), which contributed just 10.5% of revenue in 2019. Under non-tax revenue,
PETRONAS dividends remain a large contributor.
13.2 4.3
0 5 10 15 20 25 30 35
Myanmar
Indonesia
Philippines
Thailand
Malaysia
Singapore
Cambodia
Bangladesh
Mexico
Turkey
South Africa
Brazil
South Korea
Finland
Sweden
UK
Taxes Non-Taxes
0%
MALAYSIA
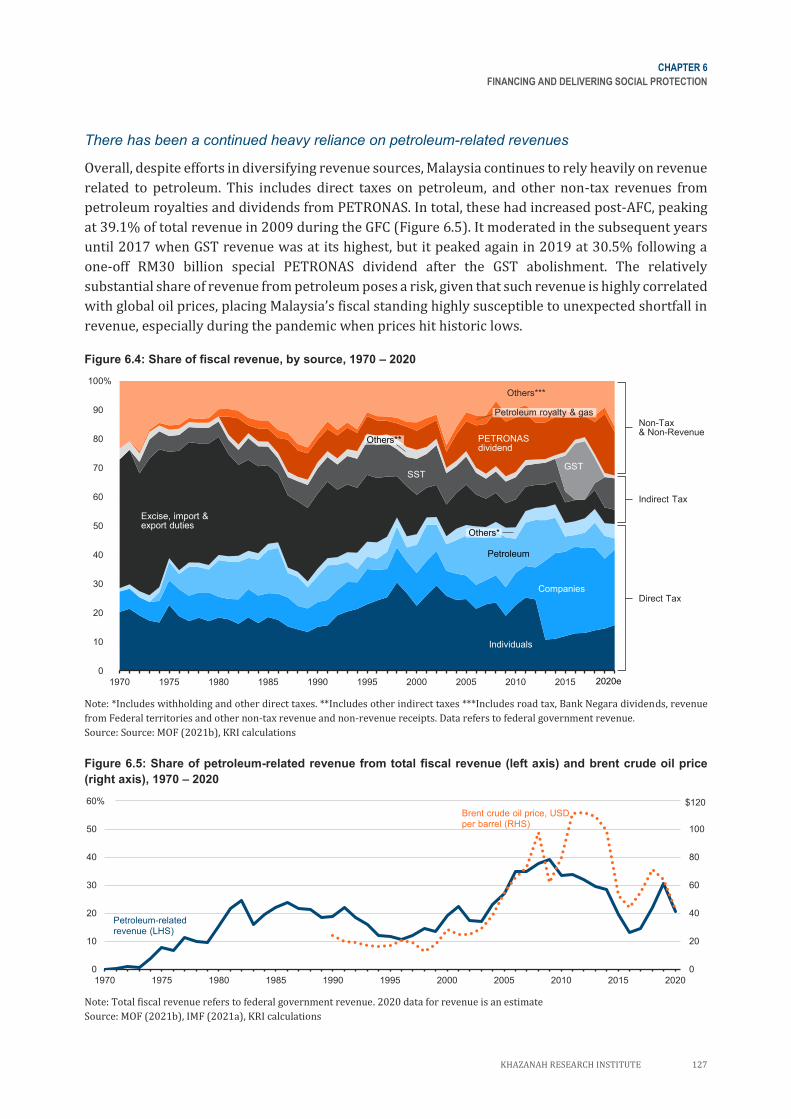
CHAPTER 6
FINANCING AND DELIVERING SOCIAL PROTECTION
KHAZANAH RESEARCH INSTITUTE 127
There has been a continued heavy reliance on petroleum-related revenues
Overall, despite efforts in diversifying revenue sources, Malaysia continues to rely heavily on revenue
related to petroleum. This includes direct taxes on petroleum, and other non-tax revenues from
petroleum royalties and dividends from PETRONAS. In total, these had increased post-AFC, peaking
at 39.1% of total revenue in 2009 during the GFC (Figure 6.5). It moderated in the subsequent years
until 2017 when GST revenue was at its highest, but it peaked again in 2019 at 30.5% following a
one-off RM30 billion special PETRONAS dividend after the GST abolishment. The relatively
substantial share of revenue from petroleum poses a risk, given that such revenue is highly correlated
with global oil prices, placing Malaysia’s fiscal standing highly susceptible to unexpected shortfall in
revenue, especially during the pandemic when prices hit historic lows.
Figure 6.4: Share of fiscal revenue, by source, 1970 – 2020
Note: *Includes withholding and other direct taxes. **Includes other indirect taxes ***Includes road tax, Bank Negara dividends, revenue
from Federal territories and other non-tax revenue and non-revenue receipts. Data refers to federal government revenue.
Source: Source: MOF (2021b), KRI calculations
Figure 6.5: Share of petroleum-related revenue from total fiscal revenue (left axis) and brent crude oil price
(right axis), 1970 – 2020
Note: Total fiscal revenue refers to federal government revenue. 2020 data for revenue is an estimate
Source: MOF (2021b), IMF (2021a), KRI calculations
0%
10%
20%
30%
40%
50%
60%
70%
80%
90%
100%
1970 1975 1980 1985 1990 1995 2000 2005 2010 2015 2020
Others***
Petroleum royalty & gas
PETRONAS dividend
Others**
GSTSST
Others*
Petroleum
Companies
Individuals
Direct Tax
Indirect Tax
Non-Tax& Non-Revenue
Excise, import & export duties
2020e
0
20
40
60
80
100
120
0
10
20
30
40
50
60
1970 1975 1980 1985 1990 1995 2000 2005 2010 2015 2020
60% $120
Petroleum-related revenue (LHS)
Brent crude oil price, USD per barrel (RHS)
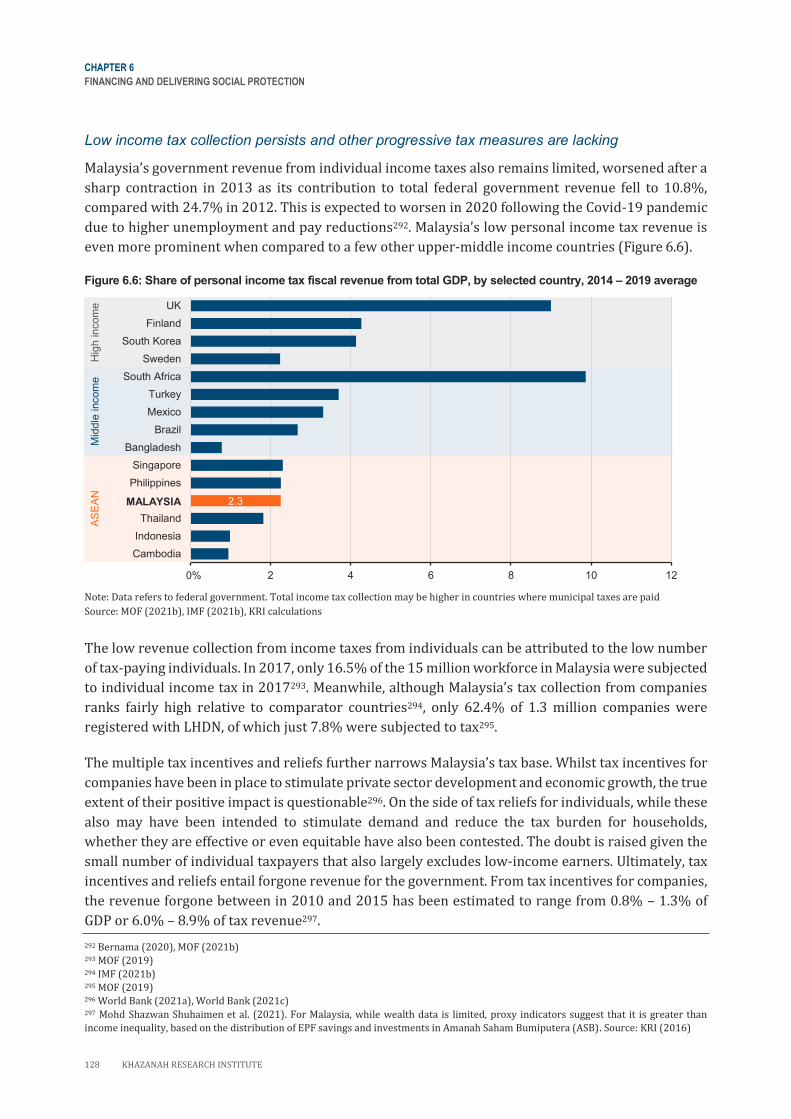
CHAPTER 6
FINANCING AND DELIVERING SOCIAL PROTECTION
128 KHAZANAH RESEARCH INSTITUTE
AS
EA
N
Mid
dle
incom
e
Hig
h in
com
e
Low income tax collection persists and other progressive tax measures are lacking
Malaysia’s government revenue from individual income taxes also remains limited, worsened after a
sharp contraction in 2013 as its contribution to total federal government revenue fell to 10.8%,
compared with 24.7% in 2012. This is expected to worsen in 2020 following the Covid-19 pandemic
due to higher unemployment and pay reductions292. Malaysia’s low personal income tax revenue is
even more prominent when compared to a few other upper-middle income countries (Figure 6.6).
Figure 6.6: Share of personal income tax fiscal revenue from total GDP, by selected country, 2014 – 2019 average
Note: Data refers to federal government. Total income tax collection may be higher in countries where municipal taxes are paid
Source: MOF (2021b), IMF (2021b), KRI calculations
The low revenue collection from income taxes from individuals can be attributed to the low number
of tax-paying individuals. In 2017, only 16.5% of the 15 million workforce in Malaysia were subjected
to individual income tax in 2017293. Meanwhile, although Malaysia’s tax collection from companies
ranks fairly high relative to comparator countries294, only 62.4% of 1.3 million companies were
registered with LHDN, of which just 7.8% were subjected to tax295.
The multiple tax incentives and reliefs further narrows Malaysia’s tax base. Whilst tax incentives for
companies have been in place to stimulate private sector development and economic growth, the true
extent of their positive impact is questionable296. On the side of tax reliefs for individuals, while these
also may have been intended to stimulate demand and reduce the tax burden for households,
whether they are effective or even equitable have also been contested. The doubt is raised given the
small number of individual taxpayers that also largely excludes low-income earners. Ultimately, tax
incentives and reliefs entail forgone revenue for the government. From tax incentives for companies,
the revenue forgone between in 2010 and 2015 has been estimated to range from 0.8% – 1.3% of
GDP or 6.0% – 8.9% of tax revenue297.
292 Bernama (2020), MOF (2021b) 293 MOF (2019) 294 IMF (2021b) 295 MOF (2019) 296 World Bank (2021a), World Bank (2021c) 297 Mohd Shazwan Shuhaimen et al. (2021). For Malaysia, while wealth data is limited, proxy indicators suggest that it is greater than
income inequality, based on the distribution of EPF savings and investments in Amanah Saham Bumiputera (ASB). Source: KRI (2016)
2.3
0 2 4 6 8 10 12
Cambodia
Indonesia
Thailand
Malaysia
Philippines
Singapore
Bangladesh
Brazil
Mexico
Turkey
South Africa
Sweden
South Korea
Finland
UK
0%
MALAYSIA
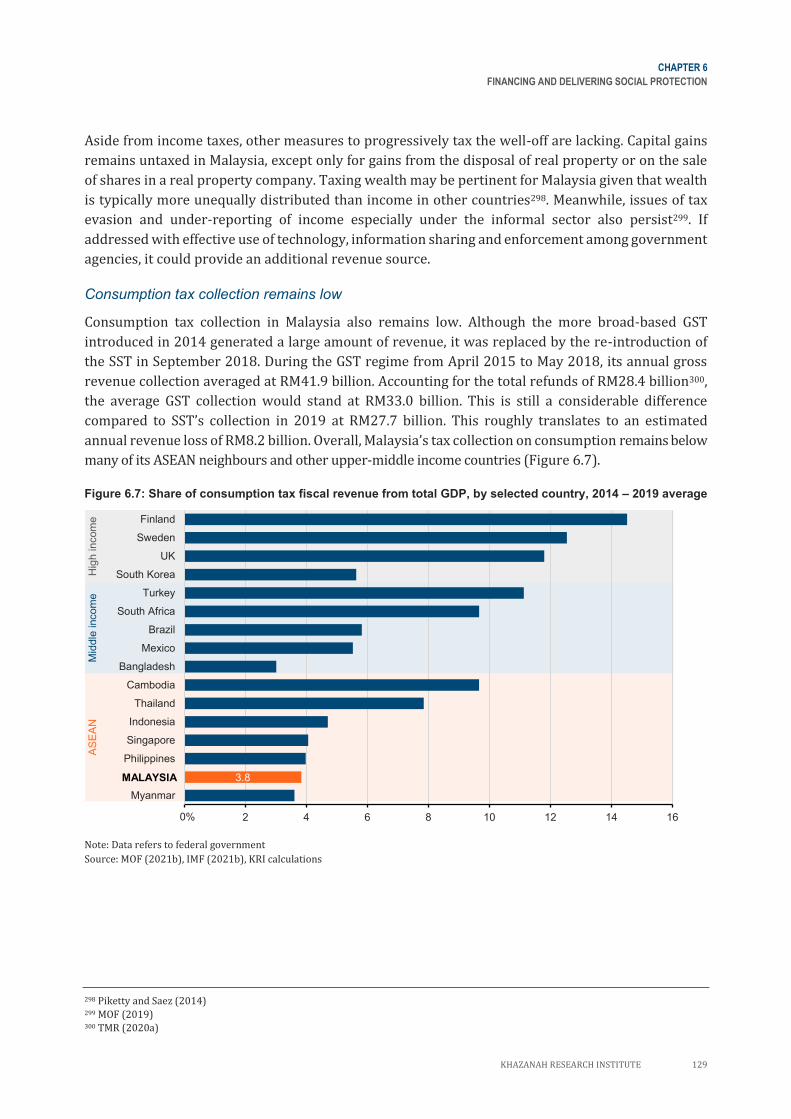
CHAPTER 6
FINANCING AND DELIVERING SOCIAL PROTECTION
KHAZANAH RESEARCH INSTITUTE 129
AS
EA
N
Mid
dle
incom
e
Hig
h in
com
e
Aside from income taxes, other measures to progressively tax the well-off are lacking. Capital gains
remains untaxed in Malaysia, except only for gains from the disposal of real property or on the sale
of shares in a real property company. Taxing wealth may be pertinent for Malaysia given that wealth
is typically more unequally distributed than income in other countries298. Meanwhile, issues of tax
evasion and under-reporting of income especially under the informal sector also persist299. If
addressed with effective use of technology, information sharing and enforcement among government
agencies, it could provide an additional revenue source.
Consumption tax collection remains low
Consumption tax collection in Malaysia also remains low. Although the more broad-based GST
introduced in 2014 generated a large amount of revenue, it was replaced by the re-introduction of
the SST in September 2018. During the GST regime from April 2015 to May 2018, its annual gross
revenue collection averaged at RM41.9 billion. Accounting for the total refunds of RM28.4 billion300,
the average GST collection would stand at RM33.0 billion. This is still a considerable difference
compared to SST’s collection in 2019 at RM27.7 billion. This roughly translates to an estimated
annual revenue loss of RM8.2 billion. Overall, Malaysia’s tax collection on consumption remains below
many of its ASEAN neighbours and other upper-middle income countries (Figure 6.7).
Figure 6.7: Share of consumption tax fiscal revenue from total GDP, by selected country, 2014 – 2019 average
Note: Data refers to federal government
Source: MOF (2021b), IMF (2021b), KRI calculations
298 Piketty and Saez (2014) 299 MOF (2019) 300 TMR (2020a)
3.8
0 2 4 6 8 10 12 14 16
Myanmar
Malaysia
Philippines
Singapore
Indonesia
Thailand
Cambodia
Bangladesh
Mexico
Brazil
South Africa
Turkey
South Korea
UK
Sweden
Finland
0%
MALAYSIA
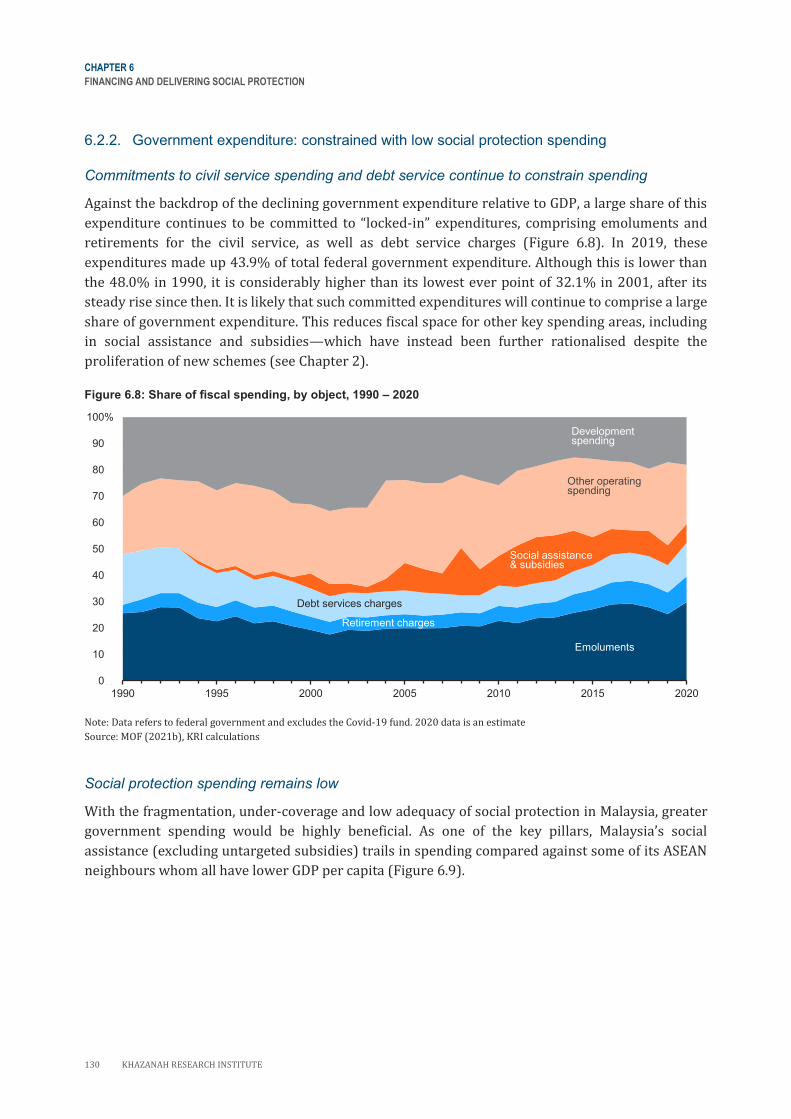
CHAPTER 6
FINANCING AND DELIVERING SOCIAL PROTECTION
130 KHAZANAH RESEARCH INSTITUTE
6.2.2. Government expenditure: constrained with low social protection spending
Commitments to civil service spending and debt service continue to constrain spending
Against the backdrop of the declining government expenditure relative to GDP, a large share of this
expenditure continues to be committed to “locked-in” expenditures, comprising emoluments and
retirements for the civil service, as well as debt service charges (Figure 6.8). In 2019, these
expenditures made up 43.9% of total federal government expenditure. Although this is lower than
the 48.0% in 1990, it is considerably higher than its lowest ever point of 32.1% in 2001, after its
steady rise since then. It is likely that such committed expenditures will continue to comprise a large
share of government expenditure. This reduces fiscal space for other key spending areas, including
in social assistance and subsidies—which have instead been further rationalised despite the
proliferation of new schemes (see Chapter 2).
Figure 6.8: Share of fiscal spending, by object, 1990 – 2020
Note: Data refers to federal government and excludes the Covid-19 fund. 2020 data is an estimate
Source: MOF (2021b), KRI calculations
Social protection spending remains low
With the fragmentation, under-coverage and low adequacy of social protection in Malaysia, greater
government spending would be highly beneficial. As one of the key pillars, Malaysia’s social
assistance (excluding untargeted subsidies) trails in spending compared against some of its ASEAN
neighbours whom all have lower GDP per capita (Figure 6.9).
0%
10%
20%
30%
40%
50%
60%
70%
80%
90%
100%
1990 1995 2000 2005 2010 2015 2020
Developmentspending
Other operating spending
Retirement charges
Emoluments
Debt services charges
Social assistance& subsidies
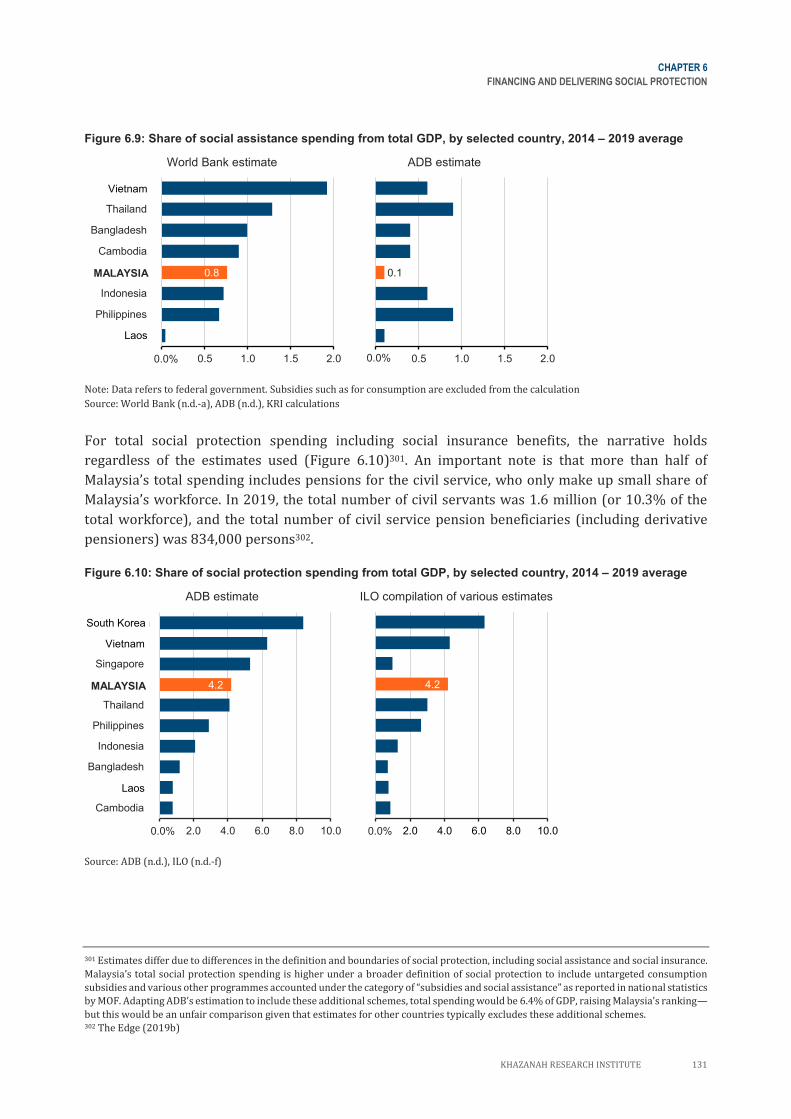
CHAPTER 6
FINANCING AND DELIVERING SOCIAL PROTECTION
KHAZANAH RESEARCH INSTITUTE 131
Figure 6.9: Share of social assistance spending from total GDP, by selected country, 2014 – 2019 average
World Bank estimate ADB estimate
Note: Data refers to federal government. Subsidies such as for consumption are excluded from the calculation
Source: World Bank (n.d.-a), ADB (n.d.), KRI calculations
For total social protection spending including social insurance benefits, the narrative holds
regardless of the estimates used (Figure 6.10)301. An important note is that more than half of
Malaysia’s total spending includes pensions for the civil service, who only make up small share of
Malaysia’s workforce. In 2019, the total number of civil servants was 1.6 million (or 10.3% of the
total workforce), and the total number of civil service pension beneficiaries (including derivative
pensioners) was 834,000 persons302.
Figure 6.10: Share of social protection spending from total GDP, by selected country, 2014 – 2019 average
ADB estimate ILO compilation of various estimates
Source: ADB (n.d.), ILO (n.d.-f)
301 Estimates differ due to differences in the definition and boundaries of social protection, including social assistance and social insurance.
Malaysia’s total social protection spending is higher under a broader definition of social protection to include untargeted consumption
subsidies and various other programmes accounted under the category of “subsidies and social assistance” as reported in national statistics
by MOF. Adapting ADB’s estimation to include these additional schemes, total spending would be 6.4% of GDP, raising Malaysia’s ranking—
but this would be an unfair comparison given that estimates for other countries typically excludes these additional schemes. 302 The Edge (2019b)
0.8
0.0 0.5 1.0 1.5 2.0
Lao PDR
Philippines
Indonesia
Malaysia
Cambodia
Bangladesh
Thailand
Viet Nam
0.0%
MALAYSIA
Vietnam
Laos
0.1
0.0 0.5 1.0 1.5 2.00.0%
4.2
0.0 2.0 4.0 6.0 8.0 10.0
Cambodia
Lao PDR
Bangladesh
Indonesia
Philippines
Thailand
Malaysia
Singapore
Viet Nam
South Korea
0.0%
MALAYSIA
Vietnam
South Korea
Laos
4.2
0.0 2.0 4.0 6.0 8.0 10.00.0%
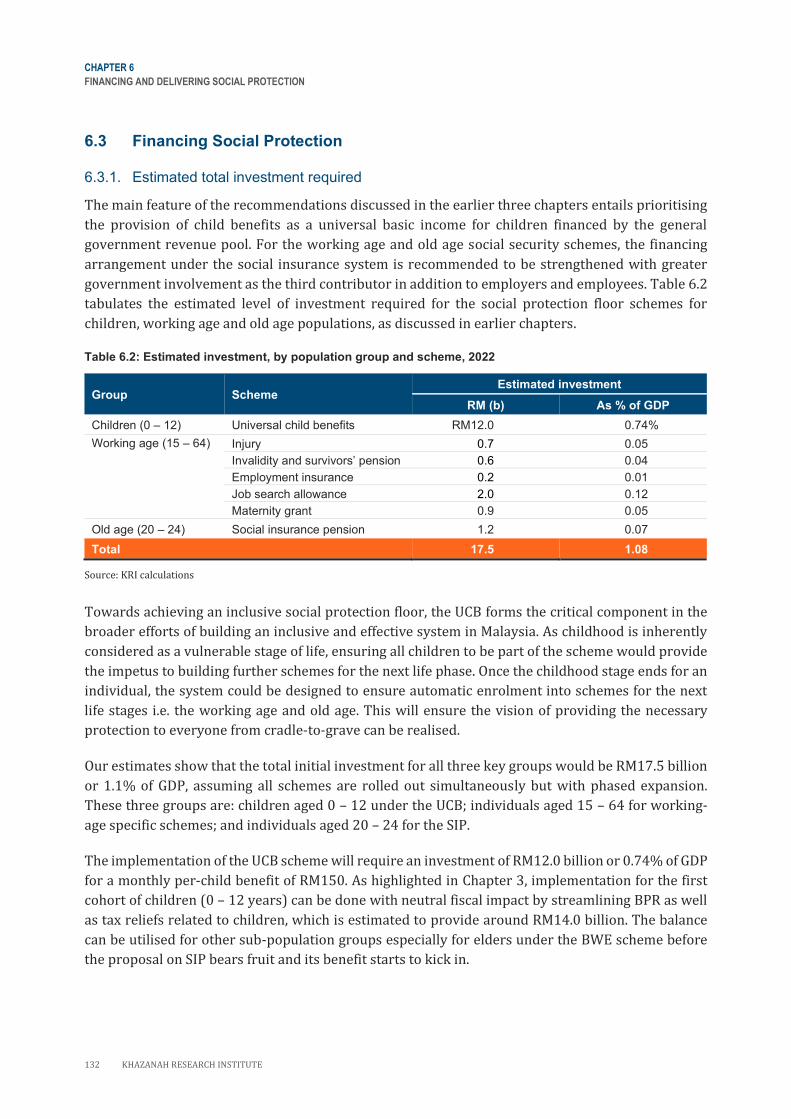
CHAPTER 6
FINANCING AND DELIVERING SOCIAL PROTECTION
132 KHAZANAH RESEARCH INSTITUTE
6.3 Financing Social Protection
6.3.1. Estimated total investment required
The main feature of the recommendations discussed in the earlier three chapters entails prioritising
the provision of child benefits as a universal basic income for children financed by the general
government revenue pool. For the working age and old age social security schemes, the financing
arrangement under the social insurance system is recommended to be strengthened with greater
government involvement as the third contributor in addition to employers and employees. Table 6.2
tabulates the estimated level of investment required for the social protection floor schemes for
children, working age and old age populations, as discussed in earlier chapters.
Table 6.2: Estimated investment, by population group and scheme, 2022
Group Scheme Estimated investment
RM (b) As % of GDP
Children (0 – 12) Universal child benefits RM12.0 0.74%
Working age (15 – 64) Injury 0.7 0.05
Invalidity and survivors’ pension 0.6 0.04
Employment insurance 0.2 0.01
Job search allowance 2.0 0.12
Maternity grant 0.9 0.05
Old age (20 – 24) Social insurance pension 1.2 0.07
Total 17.5 1.08
Source: KRI calculations
Towards achieving an inclusive social protection floor, the UCB forms the critical component in the
broader efforts of building an inclusive and effective system in Malaysia. As childhood is inherently
considered as a vulnerable stage of life, ensuring all children to be part of the scheme would provide
the impetus to building further schemes for the next life phase. Once the childhood stage ends for an
individual, the system could be designed to ensure automatic enrolment into schemes for the next
life stages i.e. the working age and old age. This will ensure the vision of providing the necessary
protection to everyone from cradle-to-grave can be realised.
Our estimates show that the total initial investment for all three key groups would be RM17.5 billion
or 1.1% of GDP, assuming all schemes are rolled out simultaneously but with phased expansion.
These three groups are: children aged 0 – 12 under the UCB; individuals aged 15 – 64 for working-
age specific schemes; and individuals aged 20 – 24 for the SIP.
The implementation of the UCB scheme will require an investment of RM12.0 billion or 0.74% of GDP
for a monthly per-child benefit of RM150. As highlighted in Chapter 3, implementation for the first
cohort of children (0 – 12 years) can be done with neutral fiscal impact by streamlining BPR as well
as tax reliefs related to children, which is estimated to provide around RM14.0 billion. The balance
can be utilised for other sub-population groups especially for elders under the BWE scheme before
the proposal on SIP bears fruit and its benefit starts to kick in.
CHAPTER 6
FINANCING AND DELIVERING SOCIAL PROTECTION
KHAZANAH RESEARCH INSTITUTE 133
To completely provide the social security for all population in the working-age group, the investment
required from the government is estimated to be RM4.3 billion or 0.27% of GDP in 2022. When
projected until 2030, the share as a percentage of GDP remains to be about 0.20%. The estimated
amount includes government contributions for various social insurance premium as well as tax-
funded JSA and maternity grant.
Assuming the SIP scheme also commences in 2022, the projected gaps in the premium contributions
that require funding from the government is estimated to be RM1.2 billion or 0.07% of GDP. In this
estimation, the amount refers to the contribution gaps for the working-age population aged 20 – 24
years as of 2022. The aim is to provide a monthly income security of RM600 in real terms for
individuals in this age cohort when they reach 60 years old in 2062 – 2064.
Overall, the initial investment to start the basic income for children, expand the social security
coverage to all working-age population and install a foundation that would ensure income security
for all future old-age population is estimated to be RM16.9 billion or about 1.1% of GDP. As shown in
Chapter 3, if BPR and existing child-related tax reliefs are rationalised, only RM2.4 billion is needed
for the proposed children and working-age schemes during the first implementation year of 2022.
Streamlining another wide number of existing programmes, particularly many that are small-scale
and overlapping in nature, could yield even greater fiscal space.
6.3.2. Progressive realisation strategy
Considering the limited fiscal space that the government may face, the schemes can be implemented
in stages with gradual expansion strategies. As highlighted earlier in Chapter 3, it is proposed for the
UCB to cover initially children aged 0 – 12 during the inception year. A smaller population coverage
is to account for the fiscal capacity of the government in the early stages of roll-out. Gradual
expansion can be undertaken to achieve full coverage of all children aged 0 – 17 years by
automatically registering newborns into the programme while the children already in the
programme continue to receive the benefits. The recipients will exit the programme once they reach
their 18th birthday. The required investment to cover all children is estimated to be RM18.5 billion
or 0.85% of GDP in 2027, with the same transfer value in real term. Nevertheless, the figure as a
percentage of GDP would fall in the long term, corresponding to the declining size of the population
under the age of 18 and the projected growth in GDP.
The expansion of social security schemes for the working-age population can be rolled out gradually
to achieve full coverage and higher than the minimum standards. In Chapter 4, we recommended a
six-month coverage of JSA under tax-funded income security scheme for unemployment. The
allowance period can be extended to at least 6.5 months in the long run to meet the higher standard
described in ILO Convention No. 168 for means-tested non-contributory scheme. The recommended
rate of RM600 for tax-funded JSA could also be increased gradually later considering government’s
fiscal position as well as the importance to support employment. The proposed maternity grant could
also move beyond covering basic income security to include other medical benefits.
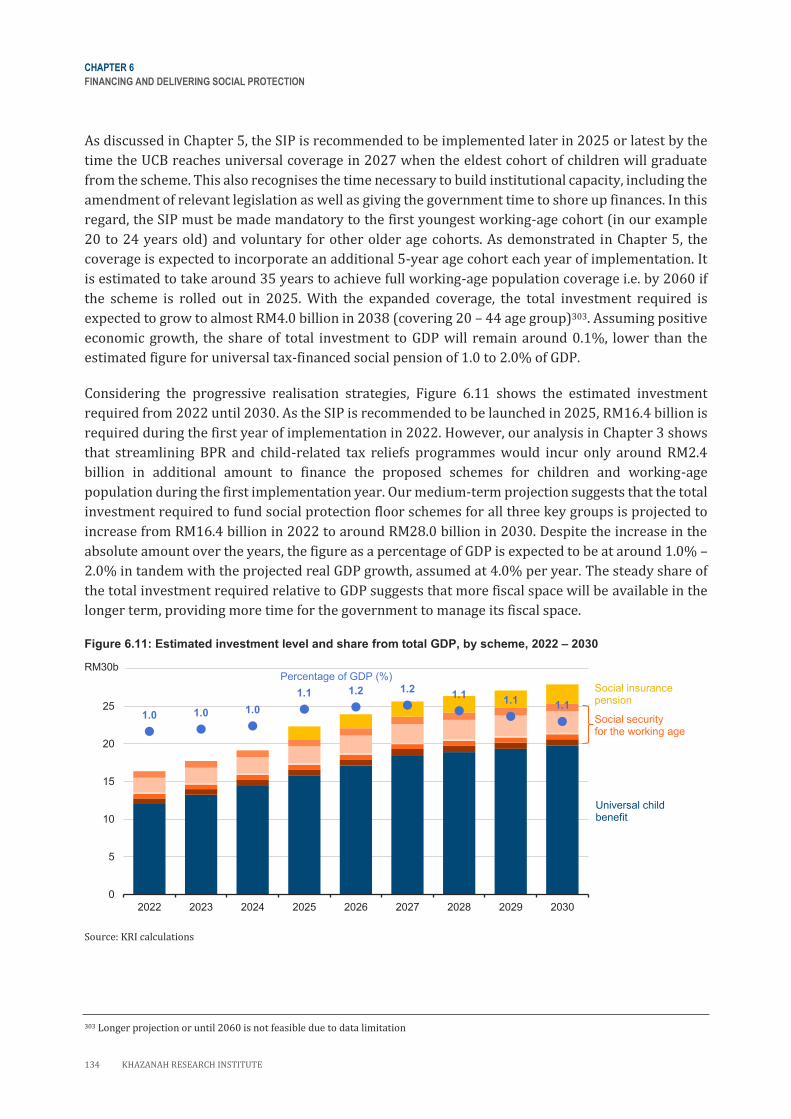
CHAPTER 6
FINANCING AND DELIVERING SOCIAL PROTECTION
134 KHAZANAH RESEARCH INSTITUTE
As discussed in Chapter 5, the SIP is recommended to be implemented later in 2025 or latest by the
time the UCB reaches universal coverage in 2027 when the eldest cohort of children will graduate
from the scheme. This also recognises the time necessary to build institutional capacity, including the
amendment of relevant legislation as well as giving the government time to shore up finances. In this
regard, the SIP must be made mandatory to the first youngest working-age cohort (in our example
20 to 24 years old) and voluntary for other older age cohorts. As demonstrated in Chapter 5, the
coverage is expected to incorporate an additional 5-year age cohort each year of implementation. It
is estimated to take around 35 years to achieve full working-age population coverage i.e. by 2060 if
the scheme is rolled out in 2025. With the expanded coverage, the total investment required is
expected to grow to almost RM4.0 billion in 2038 (covering 20 – 44 age group)303. Assuming positive
economic growth, the share of total investment to GDP will remain around 0.1%, lower than the
estimated figure for universal tax-financed social pension of 1.0 to 2.0% of GDP.
Considering the progressive realisation strategies, Figure 6.11 shows the estimated investment
required from 2022 until 2030. As the SIP is recommended to be launched in 2025, RM16.4 billion is
required during the first year of implementation in 2022. However, our analysis in Chapter 3 shows
that streamlining BPR and child-related tax reliefs programmes would incur only around RM2.4
billion in additional amount to finance the proposed schemes for children and working-age
population during the first implementation year. Our medium-term projection suggests that the total
investment required to fund social protection floor schemes for all three key groups is projected to
increase from RM16.4 billion in 2022 to around RM28.0 billion in 2030. Despite the increase in the
absolute amount over the years, the figure as a percentage of GDP is expected to be at around 1.0% –
2.0% in tandem with the projected real GDP growth, assumed at 4.0% per year. The steady share of
the total investment required relative to GDP suggests that more fiscal space will be available in the
longer term, providing more time for the government to manage its fiscal space.
Figure 6.11: Estimated investment level and share from total GDP, by scheme, 2022 – 2030
Source: KRI calculations
303 Longer projection or until 2060 is not feasible due to data limitation
1.0 1.0 1.0
1.1 1.2 1.21.1
1.11.1
0
5
10
15
20
25
30
2022 2023 2024 2025 2026 2027 2028 2029 2030
Universal childbenefit
Social insurance pension
Social security for the working age
RM30bPercentage of GDP (%)
CHAPTER 6
FINANCING AND DELIVERING SOCIAL PROTECTION
KHAZANAH RESEARCH INSTITUTE 135
As the benefit levels are anchored at minimum standards and may seem modest, over a longer term,
progressive realisation strategies can be deployed to increase the depth of the schemes by
incorporating more aspirational targets.
6.3.3. Creating the fiscal space
The projected investment required in absolute amount presented earlier means that viable financial
resources need to be identified to fund the social protection floor schemes. The international
community, especially within the UN system and the International Financial Institutions (IFIs), has
outlined eight financing options that could extend a country’s fiscal space for social protection
coverage and adequacy. These measures are described in Box 6.1 .
Box 6.1: Financing options for social protection
The eight options below are recognised either directly or indirectly in the Addis Ababa Action
Agenda for Sustainable Development Goals which contain targets for universal social protection.
The first option entails improving the effectiveness of existing fiscal resources and Options (2) –
(8) deal with potential revenues to enlarge fiscal space.
(1) Re-allocating public expenditures: Some of the measures include assessing on-going
budget allocations through a review of public expenditure and other types of thematic budget
analyses, replacing high-cost, low-impact investments with those with larger socio-economic
impacts, eliminating spending inefficiencies and/or tackling corruption.
(2) Expanding social security coverage and contributory revenues: The idea is to increase
coverage and therefore increase the collection of contributions of social security systems. As the
social protection benefits are linked to employment-based contributions, the measure is expected
to increase formalisation of the informal economy.
(3) Increasing tax revenue: This is a channel for generating domestic resources and is achieved
by expanding the tax base and altering different types of tax rates e.g. on consumption, corporate
profits, financial activities, personal income, property, imports or exports, natural resource
extraction, etc. It can also include measures to strengthen the efficiency of tax collection methods
and overall compliance.
(4) Eliminating illicit financial flows: It is estimated that a substantial number of resources—
more than 10 times the total aid received—escape developing countries each year illegally.
Therefore, this option involves cracking down on money laundering, bribery, tax evasion, trade
mis-invoicing and other financial crimes that are illegal and deprive governments of revenues
needed for social and economic development.
(5) Tapping into fiscal and central bank foreign exchange reserves: This includes drawing
down fiscal savings and other state revenues stored in special funds, such as sovereign wealth
funds, and/or using excess foreign exchange reserves in the central bank for national devel-
opment.
CHAPTER 6
FINANCING AND DELIVERING SOCIAL PROTECTION
136 KHAZANAH RESEARCH INSTITUTE
(6) Managing debt (borrowing or restructuring sovereign debt): This involves an active
exploration of domestic and foreign borrowing options at low cost, including concessional loans,
following a careful assessment of debt sustainability. For countries under high debt distress,
restructuring existing debt may be possible and justifiable if the legitimacy of the debt is ques-
tionable or the opportunity cost in terms of worsening deprivations of vulnerable groups is high.
(7) Adopting a more accommodating macroeconomic framework: This involves creating an
enabling macroeconomic condition that can promote economic growth and government revenue.
It may entail allowing for higher budget deficit paths and higher levels of inflation without
jeopardising macroeconomic stability.
(8) Increasing aid and transfers: This requires either engaging with different donor
governments or international organisations in order to ramp up transfers and aid.
Source: ILO (2019b)
The financing options presented in Box 6.1 can be applied as a mix of policies depending on the
country’s context. Three relevant measures of creating the fiscal space needed to finance the
proposed programmes in Malaysia are discussed below.
1. Reallocating and consolidating existing subsidies and social assistance expenditure
Reallocating public expenditures requires replacing high-cost and low-impact investments with
investments that can generate larger socioeconomic impact. It also involves eliminating spending
inefficiencies as well as tackling corruption. There are a wide range of options in accomplishing fiscal
rationalisation. One pertinent way could involve streamlining spending within the social sector itself.
From the sectoral perspective, Malaysia channelled RM91.9 billion or 40.5% of operating
expenditure for the social sector in 2019, comprising spending on various initiatives related to
education, health, housing and other types of social services. Meanwhile, from the perspective of
expenditure by object, RM23.9 billion or 9.1% of operating expenditure was allocated for subsidies
and social assistance—an expenditure component that is closer to the definition of social protection.
If retirements charges—a form of old-age protection exclusive for civil servants—is included, the
amount increases by RM25.9 billion to RM49.8 billion or 18.9% of operating expenditure. Together,
spending on subsidies and social assistance, and retirement charges constitute 3.3% of GDP.
As highlighted in Chapter 2, Malaysia has been implementing a substantial number of small social
protection and poverty reduction programmes, often fragmented and overlapping in nature. Some
programmes can be streamlined and consolidated to form social protection schemes that are more
inclusive and larger in scale, providing increased efficiency. Chapter 3 has identified an amount of
around RM14.0 billion related to existing social assistance programmes such as BPR and tax reliefs
related to children that can be streamlined in order to introduce a more broad-based scheme for
children. Furthermore, several occupation-based tax-funded social assistance programme such as
allowances for farmers, religious teachers, village leaders, tok batin, veterans and bus/taxi drivers
can be redesigned as social insurance schemes.
CHAPTER 6
FINANCING AND DELIVERING SOCIAL PROTECTION
KHAZANAH RESEARCH INSTITUTE 137
In another related dimension, several studies have suggested moving towards a defined-contribution
scheme for the public sector pension to unlock financial resources more broadly to equally protect
both public and private sector workers304.
2. Supplementing social insurance schemes with government contribution
A more durable and sustainable approach to financing social protection programmes would be to
generate an independent source of funding out of the general tax pool. Typically, this can be achieved
by establishing a social wealth fund in which the return from investments would cover the costs for
generations to come. To date, this idea has largely been the case of social insurance schemes that
involves creation of “earmarked fund” with the whole community standing together to contribute for
the protection.
Malaysia has long adopted this earmarking approach as exemplified by the existing retirement
savings and the occupational social insurance schemes that are funded by employers and workers’
contributions. To protect and balance the interest of both employers and workers, the government
currently plays a supervisory role at the policy level, yet with limited role as a co-contributor.
On the other hand, the government implements its social assistance initiatives quite separately
outside the social insurance system using funds from taxation and other public revenues. Tax-funded
schemes (compared to contributory social insurance schemes) are often considered to be more
effective in averting exclusion of marginalised populations, especially those who are poor and in the
informal sector.
However, the pool of revenue in the national budget typically faces many competing needs from
various other sectors. Due to various financial constraints, the principles of rationing, targeting and
conditionality have been considered to be more effective in guiding and distributing social assistance.
This usually happens at the expense of higher administrative costs and fragmentation between social
assistance programmes which subsequently could not fully promote social inclusion and cohesion.
Moreover, social assistance schemes that target the poor are stigmatising and are often perceived as
unfair, discriminatory and politically motivated.
At the same time, the lack of coordination between social assistance and social insurance
programmes exacerbates the fragmentation problems further, undermining social justice. Benefits
deployed via social insurance channels, such as the wage subsidy and employment retention
programmes, are mostly seen as accruing to the relatively “well-off” formal sector workers who are
already registered and participating in the formal social insurance system.
A coherent system that ensures long-term sustainability can be achieved by a well-coordinated mix
of contributions by employers, employees and the government (from general public revenue pool) in
an integrated social protection system. We contend that instead of dispensing poor reliefs separately,
greater government commitment in the social insurance platform is a more effective strategy in
extending protection to all.
304 BNM (2021a), Darmaraj and Narayanan (2019)
CHAPTER 6
FINANCING AND DELIVERING SOCIAL PROTECTION
138 KHAZANAH RESEARCH INSTITUTE
As shown in Chapter 5, providing a universal tax-funded social pension would cost 1.0% to 2.0% of
GDP annually. This is 10 times higher than the projected cost of the proposed social insurance
pension of less than 0.5% of annual GDP. With the social insurance approach, the pension fund that
disperses benefits in the future is slowly built today. However, as the proposed scheme will take a
few years to expand its coverage and directly benefit future older adults, interim relief for existing
elders should continue to be made available. Similarly, the government can ensure that all working-
age population are protected from occupational injury and invalidity, maternity and employment
risks at an investment of only around RM4.0 billion to RM6.0 billion annually or less than 0.3% of
GDP when this is done via social insurance channels.
Hence, we recommend the tripartite arrangement under the social insurance system to be
strengthened with government involvement as a third contributor for the working age and old age
schemes. In this arrangement, the government would contribute social insurance premium on behalf
of adult individuals who are unable to work or are involved in non-standard employment that does
not entail a relationship with an employer.
In short, the fundamental principle in making social protection system more inclusive and
sustainable is to generate an independent source of funding via employers and workers’
contributions while at the same time integrating government contribution for the residual population
groups who are unable to pay.
3. Increasing tax revenue
Although the above two measures provide some fiscal space to finance the proposed social protection
floor schemes, these sources would not be sufficient to finance the projected investment required.
This means that increasing tax and other revenue is still critical in ensuring an adequate and
sustainable funding base for years to come.
It important to highlight the Tax Reform Committee formed in 2018 has reviewed the overall tax
system and outlined four key areas with the strategic objectives of enhancing government revenue.
The overarching strategies are (1) reduce the tax gap, mainly informal and hard-to-tax sectors as well
as widening the tax base through digitalisation and effective enforcement activities; (2) reduce tax
leakages by reviewing existing tax incentives and legislations; (3) explore new sources of sustainable
tax revenue such as digital and environmental tax; and (4) enhance tax administration by reviewing
the legislation and simplifying administrative processes and procedures towards improving
compliance305.
Looking at the outlined strategic objectives, it can be assumed that the recommendations prepared
by the Tax Reform Committee are all-encompassing, having reviewed the tax system holistically.
Given that a review has already been done by the Tax Reform Committee, this report does not attempt
to provide comprehensive recommendations on measures to generate tax. Nonetheless, Box 6.2
illustrates the potential of generating additional revenue from raising income tax rates.
305 MOF (2019)
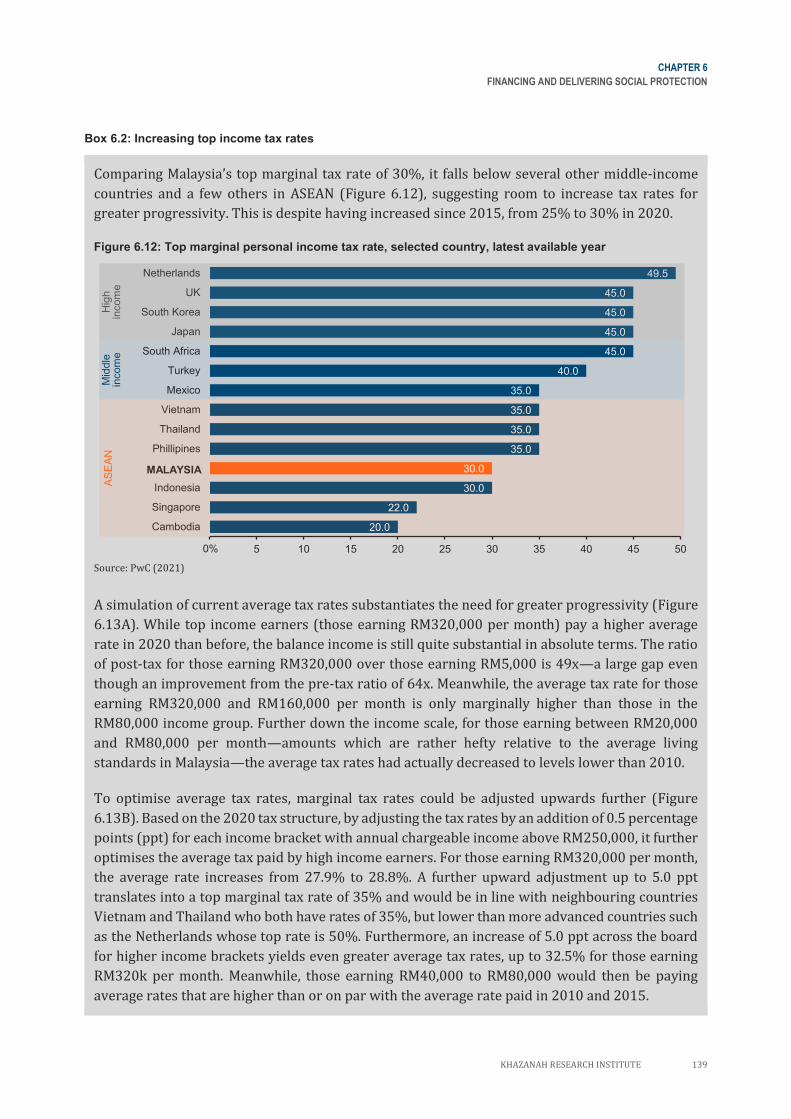
CHAPTER 6
FINANCING AND DELIVERING SOCIAL PROTECTION
KHAZANAH RESEARCH INSTITUTE 139
Box 6.2: Increasing top income tax rates
Comparing Malaysia’s top marginal tax rate of 30%, it falls below several other middle-income
countries and a few others in ASEAN (Figure 6.12), suggesting room to increase tax rates for
greater progressivity. This is despite having increased since 2015, from 25% to 30% in 2020.
Figure 6.12: Top marginal personal income tax rate, selected country, latest available year
Source: PwC (2021)
A simulation of current average tax rates substantiates the need for greater progressivity (Figure
6.13A). While top income earners (those earning RM320,000 per month) pay a higher average
rate in 2020 than before, the balance income is still quite substantial in absolute terms. The ratio
of post-tax for those earning RM320,000 over those earning RM5,000 is 49x—a large gap even
though an improvement from the pre-tax ratio of 64x. Meanwhile, the average tax rate for those
earning RM320,000 and RM160,000 per month is only marginally higher than those in the
RM80,000 income group. Further down the income scale, for those earning between RM20,000
and RM80,000 per month—amounts which are rather hefty relative to the average living
standards in Malaysia—the average tax rates had actually decreased to levels lower than 2010.
To optimise average tax rates, marginal tax rates could be adjusted upwards further (Figure
6.13B). Based on the 2020 tax structure, by adjusting the tax rates by an addition of 0.5 percentage
points (ppt) for each income bracket with annual chargeable income above RM250,000, it further
optimises the average tax paid by high income earners. For those earning RM320,000 per month,
the average rate increases from 27.9% to 28.8%. A further upward adjustment up to 5.0 ppt
translates into a top marginal tax rate of 35% and would be in line with neighbouring countries
Vietnam and Thailand who both have rates of 35%, but lower than more advanced countries such
as the Netherlands whose top rate is 50%. Furthermore, an increase of 5.0 ppt across the board
for higher income brackets yields even greater average tax rates, up to 32.5% for those earning
RM320k per month. Meanwhile, those earning RM40,000 to RM80,000 would then be paying
average rates that are higher than or on par with the average rate paid in 2010 and 2015.
20.0
22.0
30.0
30.0
35.0
35.0
35.0
35.0
40.0
45.0
45.0
45.0
45.0
49.5
0 5 10 15 20 25 30 35 40 45 50
Cambodia
Singapore
Indonesia
Malaysia
Phillipines
Thailand
Vietnam
Mexico
Turkey
South Africa
Japan
South Korea
UK
Netherlands
0%
MALAYSIA
AS
EA
NM
iddle
in
com
eH
igh
incom
e
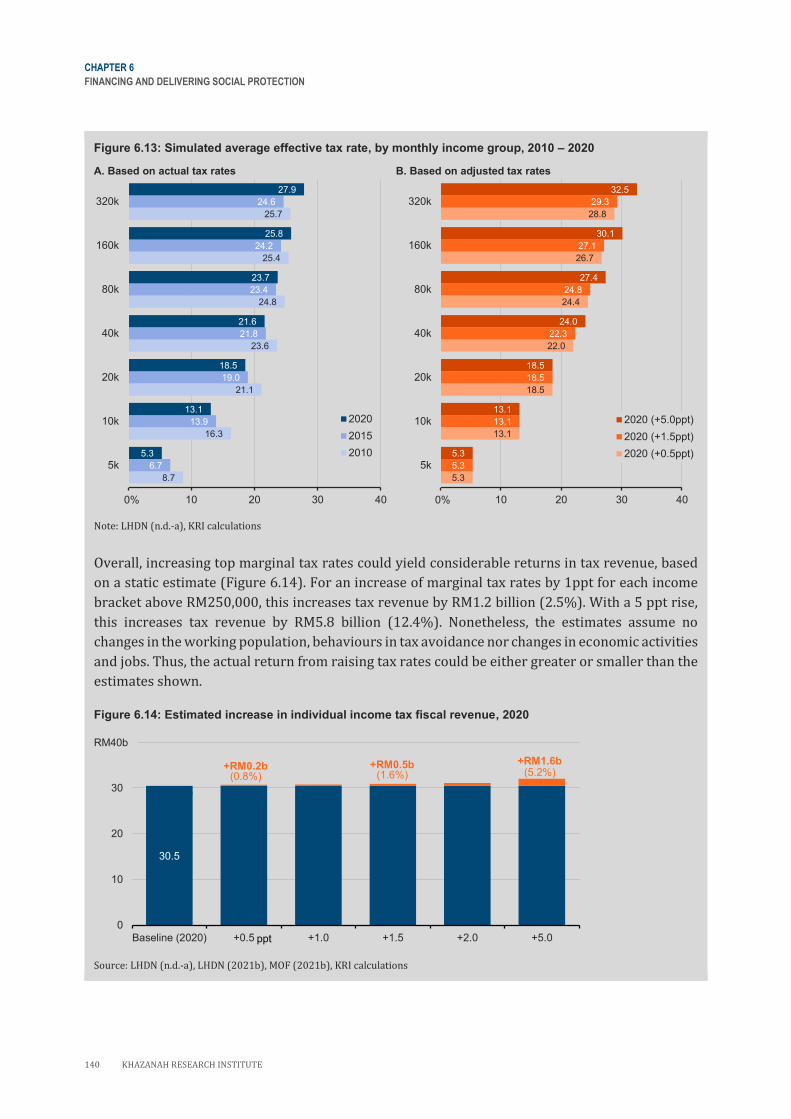
CHAPTER 6
FINANCING AND DELIVERING SOCIAL PROTECTION
140 KHAZANAH RESEARCH INSTITUTE
Figure 6.13: Simulated average effective tax rate, by monthly income group, 2010 – 2020
A. Based on actual tax rates B. Based on adjusted tax rates
Note: LHDN (n.d.-a), KRI calculations
Overall, increasing top marginal tax rates could yield considerable returns in tax revenue, based
on a static estimate (Figure 6.14). For an increase of marginal tax rates by 1ppt for each income
bracket above RM250,000, this increases tax revenue by RM1.2 billion (2.5%). With a 5 ppt rise,
this increases tax revenue by RM5.8 billion (12.4%). Nonetheless, the estimates assume no
changes in the working population, behaviours in tax avoidance nor changes in economic activities
and jobs. Thus, the actual return from raising tax rates could be either greater or smaller than the
estimates shown.
Figure 6.14: Estimated increase in individual income tax fiscal revenue, 2020
Source: LHDN (n.d.-a), LHDN (2021b), MOF (2021b), KRI calculations
8.7
16.3
21.1
23.6
24.8
25.4
25.7
6.7
13.9
19.0
21.8
23.4
24.2
24.6
5.3
13.1
18.5
21.6
23.7
25.8
27.9
0 10 20 30 40
5k
10k
20k
40k
80k
160k
320k
2020
2015
2010
0%
5.3
13.1
18.5
22.0
24.4
26.7
28.8
5.3
13.1
18.5
22.3
24.8
27.1
29.3
5.3
13.1
18.5
24.0
27.4
30.1
32.5
0 10 20 30 40
5k
10k
20k
40k
80k
160k
320k
2020 (+5.0ppt)
2020 (+1.5ppt)
2020 (+0.5ppt)
0%
30.5
0
10
20
30
40
Baseline (2020) +0.5 +1.0 +1.5 +2.0 +5.0
RM40b
+RM1.6b (5.2%)
+RM0.5b(1.6%)
+RM0.2b (0.8%)
RM30.5b
ppt
CHAPTER 6
FINANCING AND DELIVERING SOCIAL PROTECTION
KHAZANAH RESEARCH INSTITUTE 141
Inclusive social protection and the virtuous cycle of expanding government’s fiscal space
With the tax reform initiatives already outlined by the Tax Reform Committee, enhancing fiscal space
appears to be a policy choice that is also fundamentally underpinned by political will—rather than
purely constrained by a lack of options to generate additional revenue. The current fiscal scenario
and tax system characterised by an extremely narrow revenue base underscore the urgent needs to
initiate the impending tax reform actions.
As illustrated earlier in Section 6.2.1, Malaysia’s government revenue collection in relation to
comparator countries suggests that there is significant space to increase tax revenues in Malaysia
and prioritise social protection. Likewise, the international comparison of public spending shows that
social protection spending does not necessarily depend just on a country’s income levels. Low-
income countries can spend reasonably well as a proportion of their GDP. Rather than just a matter
of finance, public spending on social protection eventually boils down to society’s preference and
political will in determining public spending priorities. Broadly, social protection is observed to be
an essential component of successful and sustainable society.
While it is essential that effective tax systems can ensure an adequate and sustainable funding base,
we also believe that a combination of taxes and social security contributions has a greater potential
in ensuring a social protection system that is sustainable fiscally, economically and socially. Building
on the principles of risk sharing, equity and solidarity, Inclusive social protection will induce a
virtuous cycle of strengthening the social contract, fostering trust in government and enhancing
government revenue306.
6.4 Driving the National Social Protection Agenda
In addition to sustainable funding, Malaysia’s social protection system also requires an
administrative system that is efficient and transparent to ensure good-quality service delivery in
addition to responsiveness to extraordinary shocks. The administrative processes of social
protection schemes need to be underpinned by strong operational policies and procedures,
supported by well-coordinated institutional arrangements, human resources, information
management systems, communications strategies and fiscal management, as well as monitoring and
evaluation307.
From a long-term viewpoint, schemes for social protection in Malaysia have evolved in tandem with
the country’s needs as a developing nation. The foundation for social protection was embedded right
at the beginning of the development process with wide ranging publicly funded programmes aimed
to eradicated poverty and improve access to health, education and basic infrastructure. Contributory
schemes were institutionalised with the establishment of the EPF in 1951308 and SOCSO in 1971309 as
responses to increasing wage labour in the private sector. Meanwhile, schemes for civil servants are
largely administered by JPA, the LTAT and KWAP. In addition to these main institutions, there have
been a proliferation of social programmes undertaken by many other ministries and agencies, largely
targeting specific vulnerable and poor population groups.
306 ILO (2018a), Kidd et al. (2020) 307 ESCAP (2018) 308 EPF (n.d.-a) 309 SOCSO (n.d.-g)
CHAPTER 6
FINANCING AND DELIVERING SOCIAL PROTECTION
142 KHAZANAH RESEARCH INSTITUTE
Today, the fragmentation and coverage gaps highlighted in earlier chapters indicate that more work
needs to be done. As part of the transformation agenda to put in place an inclusive and coherent social
protection system, these institutional arrangements need to be reviewed to ensure that all initiatives
are well coordinated, and their effective implementation is well supported.
One good governance practice is to delineate the policy design and service delivery functions. With
regards to the former, Malaysia is already a step ahead with the formation of the Malaysia Social
Protection Council (MySPC) in 2016 and reactivated in 2020 as the authority to coordinate a holistic
and integrated social protection agenda. The council is well positioned to push for reform initiatives
as four strategic core areas are rightly under its purview: (1) social assistance, (2) social insurance,
(3) labour market policy and (4) data integration and governance. However, MySPC’s effectiveness is
largely untested. Malaysia is yet to have a national social protection masterplan that describes both
a comprehensive package of social protection measures and a roadmap for realising this package310.
In terms of service delivery, institutional coordination can be improved to reduce gaps and increase
efficiency. In the specific context of social security (one that has a similar objective of providing basic
income security), the arrangement for the institutions involved in providing social assistance and
social insurance can be streamlined.
On this matter, we assert that there is a need to have an anchor institution in driving initiatives on
social security comprehensively. One model that could be considered is Kela (Kansaneläkelaitos)311,
a Finnish government agency in charge of administering benefits under national social security
programs. Initially founded in 1937 to handle retirement pay, its role was expanded in the 1980s and
1990s to other fields like child benefits, unemployment benefits, sickness benefits, health insurance
and student financial aid.
On the whole, proposals in this report entails establishing a social protection floor especially in the
form of income security for children, working-age and old-age populations when they are unable to
provide for themselves. One institution with the capability to strengthen Malaysia’s social security is
SOCSO—an agency currently responsible for the provision of protection schemes for workers who
predominantly work in the private sector. While it is well recognised that SOCSO’s mandate is
somewhat confined to social security for the working population, we propose for SOCSO’s functions
to be expanded as the National Social Security Institution to implement and administer the extended
and newly proposed social security schemes.
As aforementioned, we believe that social security initiatives can be implemented more efficiently
and sustainably when it is organised as a mix of tax-funded and contributory social insurance
schemes. As it stands now, the provision of social security via defined-contribution mechanism has
largely been funded by employer and employee contributions, with SOCSO as the administrator. In
this regard, there is a room to expand the role of SOCSO to also include the residual working-age
population who are not engaged with paid work, as well as the population outside the working age,
namely children and the elder.
310 World Bank (2020c) 311 Kela (n.d.)
CHAPTER 6
FINANCING AND DELIVERING SOCIAL PROTECTION
KHAZANAH RESEARCH INSTITUTE 143
Two new important universal schemes that we are proposing are: (1) UCB for all children and (2)
social insurance pension for all elders. Meanwhile, the proposals for the working-age population are
largely an extension to the existing schemes to address significant coverage gaps particularly among
workers in informal employment as well as the residual working-age population who are not working
either by choice or by force (e.g. homemakers, youth). As highlighted earlier, the source of financing
for these newly expanded schemes can be sourced from tax revenue with government becoming the
third contributor.
In embarking on an inclusive social protection system, it is imperative that everyone is included. As
it stands now, workers in informal and non-standard employment are among those who are severely
left behind. These are the vulnerable group who have a higher likelihood of being adversely impacted
in times of crisis312. A report by the ILO detailed that this group of workers have fallen between the
cracks of the government’s PRIHATIN stimulus package during the pandemic, only receiving one-off
cash payments from the BPN and BSH313. In contrast, formal sector employees can benefit from
multiple relief measures such as the i-Lestari provision, BPN, Employment Retention Programme
(ERP), Employment Insurance System (EIS) and Wage Subsidy Programme (WSP).
In addition to the expansion of SOCSO’s functions, we propose for a one-stop service centre to be
established as the front-line service delivery to the public. The Shared Service Centre (SSC) can be
done by leveraging existing social protection providers network and branches including SOCSO, the
EPF, KWAP and the LTAT. For example, currently EPF and SOCSO with their 62 and 49 branches,
respectively314, serves very similar population segment namely the formal workforce with each
institution having physical branches and manpower across Malaysia. Coordinating these networks of
branches to provide shared social security services is not only cost-effective, but also convenient for
the public.
In the future, the services by the income tax agency (i.e. LHDN) can also be integrated to enable people
to declare their incomes alongside their application for social security benefits. Technology holds
tremendous capabilities to integrate data for various schemes; the MyKad, for example, can be
maximised given that it already accords Malaysians with a unique identification number that allows
for seamless data integration. Improved integration of service delivery is practical and cost-saving.
6.4.1. National Social Protection Registry
The importance of having a complete and comprehensive database of the population is underscored
during the Covid-19 crisis, with the government heavily utilising existing databases to deploy
stimulus measures and to guide efforts in alleviating the rakyat’s burden315. However, the design and
delivery of assistance is a challenge due to database inflexibility and cross-database verification
issues316.
312 A special survey by DOS on effects of Covid-19 showed 46.6% of self-employed workers lost their jobs, significantly higher than those
in other categories. In addition, 94.8% suffered reduction in income, and 71.4% responded having savings sufficient for less than one
month. Source: DOS (2020d) 313 ILO (2020) 314 EPF (n.d.-a), SOCSO (n.d.-g) 315 For example, LHDN’s database was used to channel cash handouts for the BSH/BPR programme, and SOCSO’s existing infrastructure
enables the implementation of wage subsidy programmes. Source: BNM (2021b) 316 UNDP (2021)
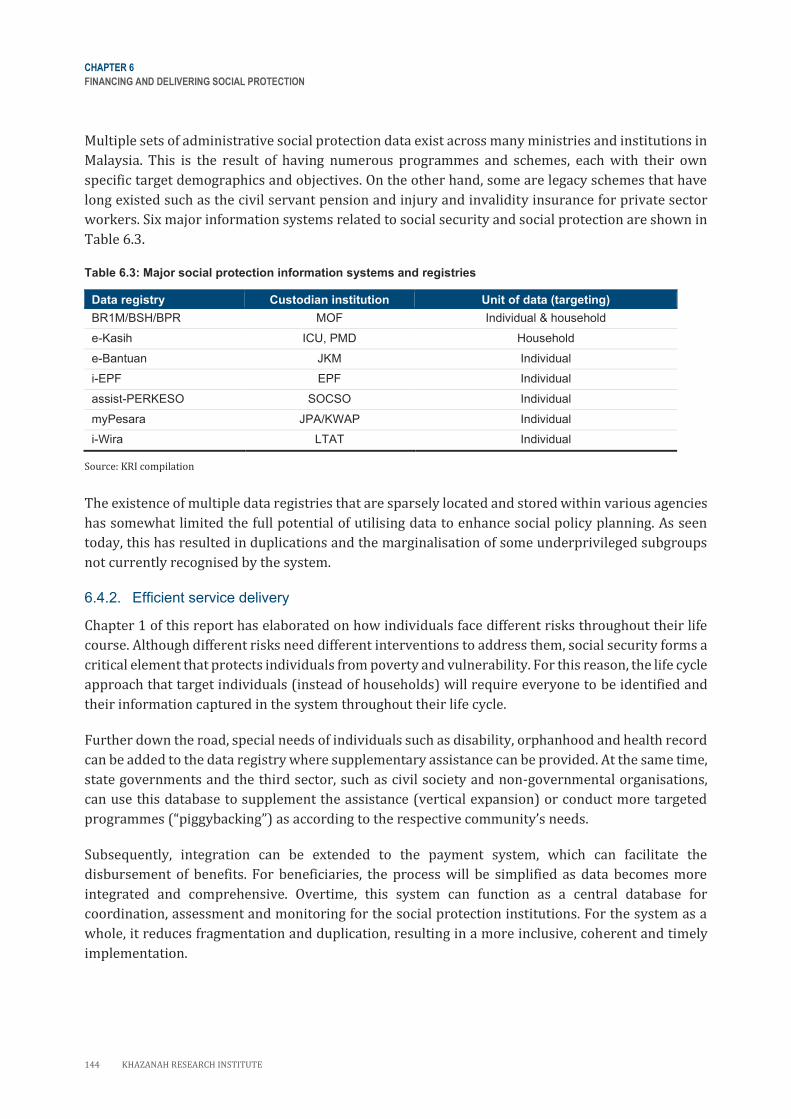
CHAPTER 6
FINANCING AND DELIVERING SOCIAL PROTECTION
144 KHAZANAH RESEARCH INSTITUTE
Multiple sets of administrative social protection data exist across many ministries and institutions in
Malaysia. This is the result of having numerous programmes and schemes, each with their own
specific target demographics and objectives. On the other hand, some are legacy schemes that have
long existed such as the civil servant pension and injury and invalidity insurance for private sector
workers. Six major information systems related to social security and social protection are shown in
Table 6.3.
Table 6.3: Major social protection information systems and registries
Data registry Custodian institution Unit of data (targeting)
BR1M/BSH/BPR MOF Individual & household
e-Kasih ICU, PMD Household
e-Bantuan JKM Individual
i-EPF EPF Individual
assist-PERKESO SOCSO Individual
myPesara JPA/KWAP Individual
i-Wira LTAT Individual
Source: KRI compilation
The existence of multiple data registries that are sparsely located and stored within various agencies
has somewhat limited the full potential of utilising data to enhance social policy planning. As seen
today, this has resulted in duplications and the marginalisation of some underprivileged subgroups
not currently recognised by the system.
6.4.2. Efficient service delivery
Chapter 1 of this report has elaborated on how individuals face different risks throughout their life
course. Although different risks need different interventions to address them, social security forms a
critical element that protects individuals from poverty and vulnerability. For this reason, the life cycle
approach that target individuals (instead of households) will require everyone to be identified and
their information captured in the system throughout their life cycle.
Further down the road, special needs of individuals such as disability, orphanhood and health record
can be added to the data registry where supplementary assistance can be provided. At the same time,
state governments and the third sector, such as civil society and non-governmental organisations,
can use this database to supplement the assistance (vertical expansion) or conduct more targeted
programmes (“piggybacking”) as according to the respective community’s needs.
Subsequently, integration can be extended to the payment system, which can facilitate the
disbursement of benefits. For beneficiaries, the process will be simplified as data becomes more
integrated and comprehensive. Overtime, this system can function as a central database for
coordination, assessment and monitoring for the social protection institutions. For the system as a
whole, it reduces fragmentation and duplication, resulting in a more inclusive, coherent and timely
implementation.
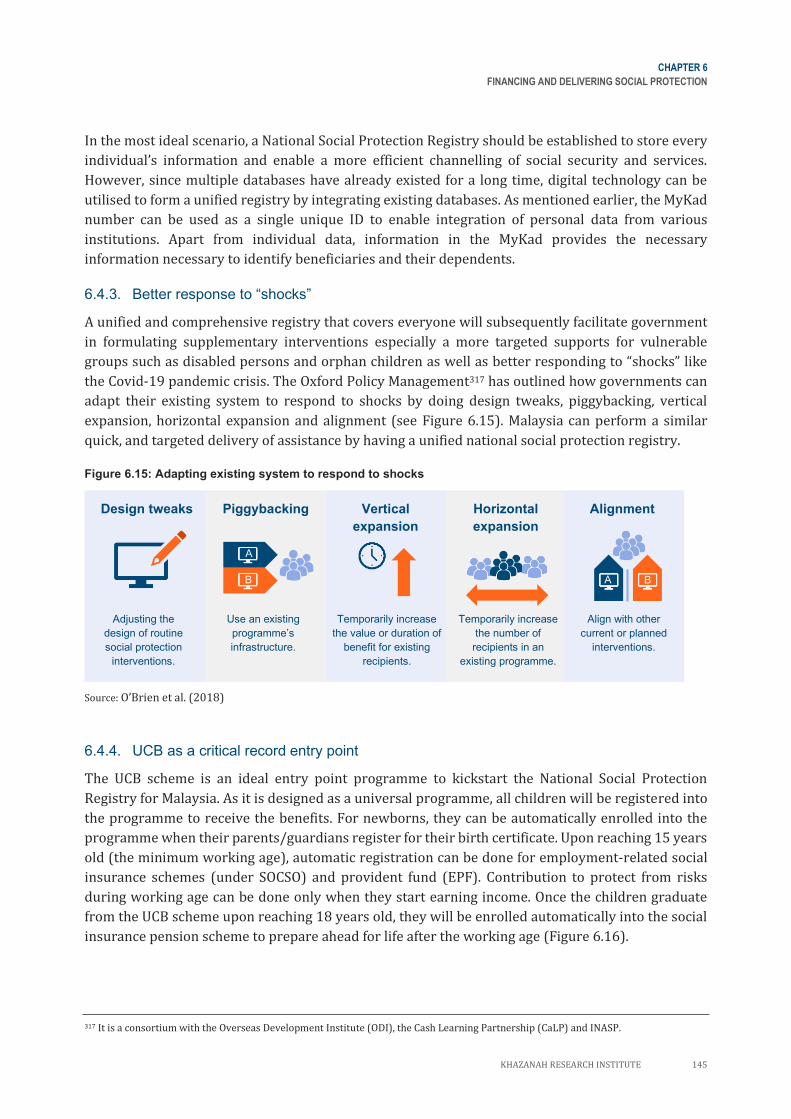
CHAPTER 6
FINANCING AND DELIVERING SOCIAL PROTECTION
KHAZANAH RESEARCH INSTITUTE 145
In the most ideal scenario, a National Social Protection Registry should be established to store every
individual’s information and enable a more efficient channelling of social security and services.
However, since multiple databases have already existed for a long time, digital technology can be
utilised to form a unified registry by integrating existing databases. As mentioned earlier, the MyKad
number can be used as a single unique ID to enable integration of personal data from various
institutions. Apart from individual data, information in the MyKad provides the necessary
information necessary to identify beneficiaries and their dependents.
6.4.3. etter response to “shocks”
A unified and comprehensive registry that covers everyone will subsequently facilitate government
in formulating supplementary interventions especially a more targeted supports for vulnerable
groups such as disabled persons and orphan children as well as better responding to “shocks” like
the Covid-19 pandemic crisis. The Oxford Policy Management317 has outlined how governments can
adapt their existing system to respond to shocks by doing design tweaks, piggybacking, vertical
expansion, horizontal expansion and alignment (see Figure 6.15). Malaysia can perform a similar
quick, and targeted delivery of assistance by having a unified national social protection registry.
Figure 6.15: Adapting existing system to respond to shocks
Source: O’Brien et al. (2018)
6.4.4. UCB as a critical record entry point
The UCB scheme is an ideal entry point programme to kickstart the National Social Protection
Registry for Malaysia. As it is designed as a universal programme, all children will be registered into
the programme to receive the benefits. For newborns, they can be automatically enrolled into the
programme when their parents/guardians register for their birth certificate. Upon reaching 15 years
old (the minimum working age), automatic registration can be done for employment-related social
insurance schemes (under SOCSO) and provident fund (EPF). Contribution to protect from risks
during working age can be done only when they start earning income. Once the children graduate
from the UCB scheme upon reaching 18 years old, they will be enrolled automatically into the social
insurance pension scheme to prepare ahead for life after the working age (Figure 6.16).
317 It is a consortium with the Overseas Development Institute (ODI), the Cash Learning Partnership (CaLP) and INASP.
Design tweaks Piggybacking Vertical
expansion
Horizontal
expansion
Alignment
Adjusting the
design of routine
social protection
interventions.
Use an existing
programme’s
infrastructure.
Temporarily increase
the value or duration of
benefit for existing
recipients.
Temporarily increase
the number of
recipients in an
existing programme.
Align with other
current or planned
interventions.
A
B A B
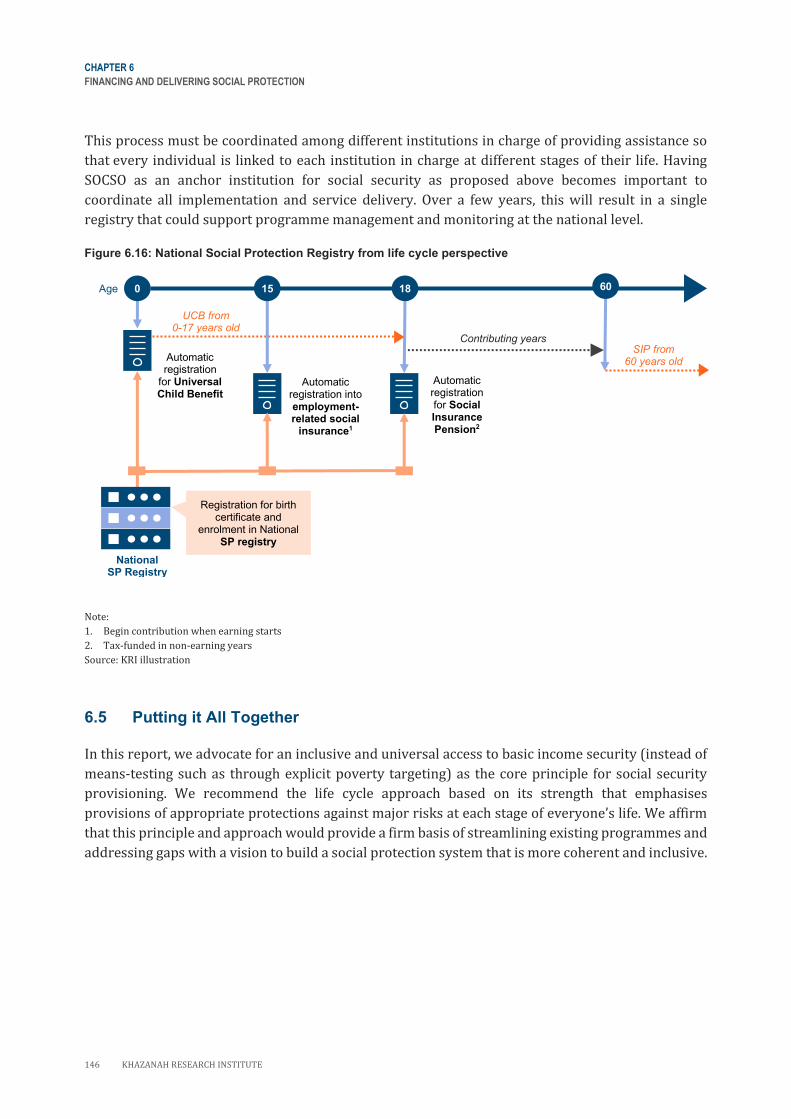
CHAPTER 6
FINANCING AND DELIVERING SOCIAL PROTECTION
146 KHAZANAH RESEARCH INSTITUTE
This process must be coordinated among different institutions in charge of providing assistance so
that every individual is linked to each institution in charge at different stages of their life. Having
SOCSO as an anchor institution for social security as proposed above becomes important to
coordinate all implementation and service delivery. Over a few years, this will result in a single
registry that could support programme management and monitoring at the national level.
Figure 6.16: National Social Protection Registry from life cycle perspective
Note:
1. Begin contribution when earning starts
2. Tax-funded in non-earning years
Source: KRI illustration
6.5 Putting it All Together
In this report, we advocate for an inclusive and universal access to basic income security (instead of
means-testing such as through explicit poverty targeting) as the core principle for social security
provisioning. We recommend the life cycle approach based on its strength that emphasises
provisions of appropriate protections against major risks at each stage of everyone’s life. We affirm
that this principle and approach would provide a firm basis of streamlining existing programmes and
addressing gaps with a vision to build a social protection system that is more coherent and inclusive.
Registration for birth certificate and
enrolment in National SP registry
Automatic registration
for Universal Child Benefit
Automatic registration into employment-related social
insurance1
Automatic registration for Social Insurance Pension2
UCB from 0-17 years old
0 18 15
National SP Registry
60
Contributing years SIP from
60 years old
Age
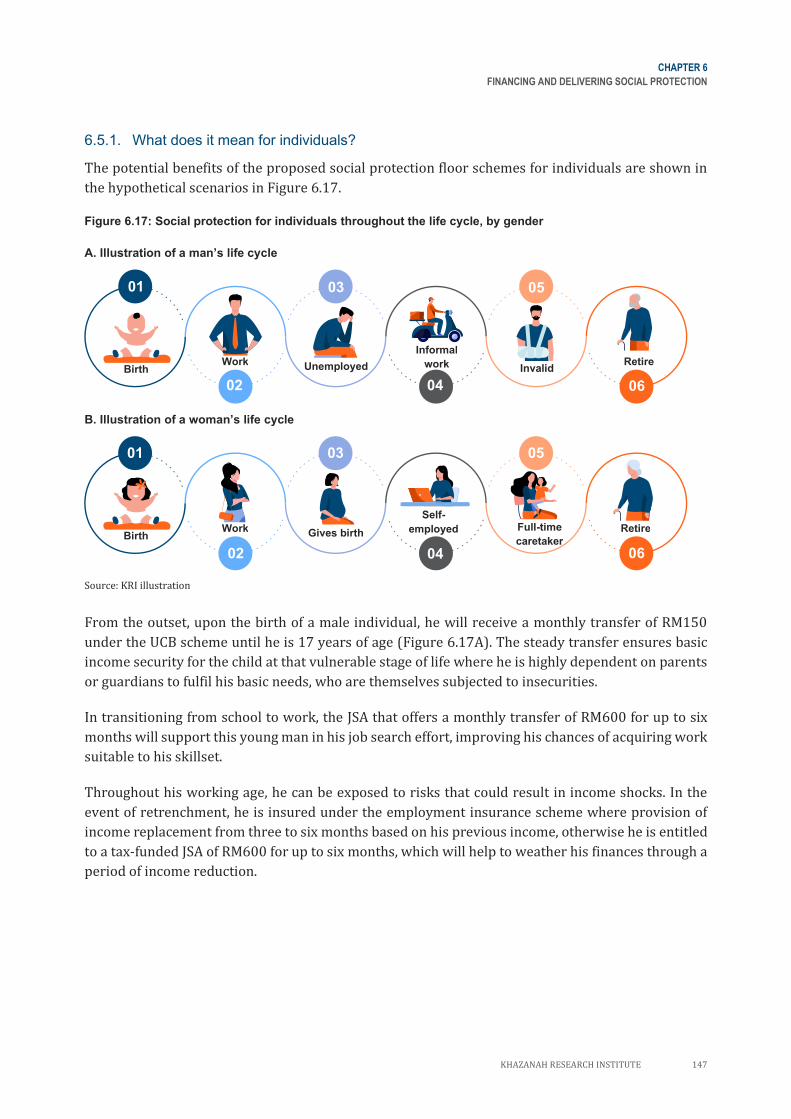
CHAPTER 6
FINANCING AND DELIVERING SOCIAL PROTECTION
KHAZANAH RESEARCH INSTITUTE 147
01 03
02
05
04 06
Birth Work Unemployed
Informal
work Invalid Retire
01 03
02
05
04 06 Birth
Work Gives birth
Self-
employed Full-time
caretaker
Retire
6.5.1. What does it mean for individuals?
The potential benefits of the proposed social protection floor schemes for individuals are shown in
the hypothetical scenarios in Figure 6.17.
Figure 6.17: Social protection for individuals throughout the life cycle, by gender
A. Illustration of m n’s life cycle
B. Illustration of wom n’s life cycle
Source: KRI illustration
From the outset, upon the birth of a male individual, he will receive a monthly transfer of RM150
under the UCB scheme until he is 17 years of age (Figure 6.17A). The steady transfer ensures basic
income security for the child at that vulnerable stage of life where he is highly dependent on parents
or guardians to fulfil his basic needs, who are themselves subjected to insecurities.
In transitioning from school to work, the JSA that offers a monthly transfer of RM600 for up to six
months will support this young man in his job search effort, improving his chances of acquiring work
suitable to his skillset.
Throughout his working age, he can be exposed to risks that could result in income shocks. In the
event of retrenchment, he is insured under the employment insurance scheme where provision of
income replacement from three to six months based on his previous income, otherwise he is entitled
to a tax-funded JSA of RM600 for up to six months, which will help to weather his finances through a
period of income reduction.
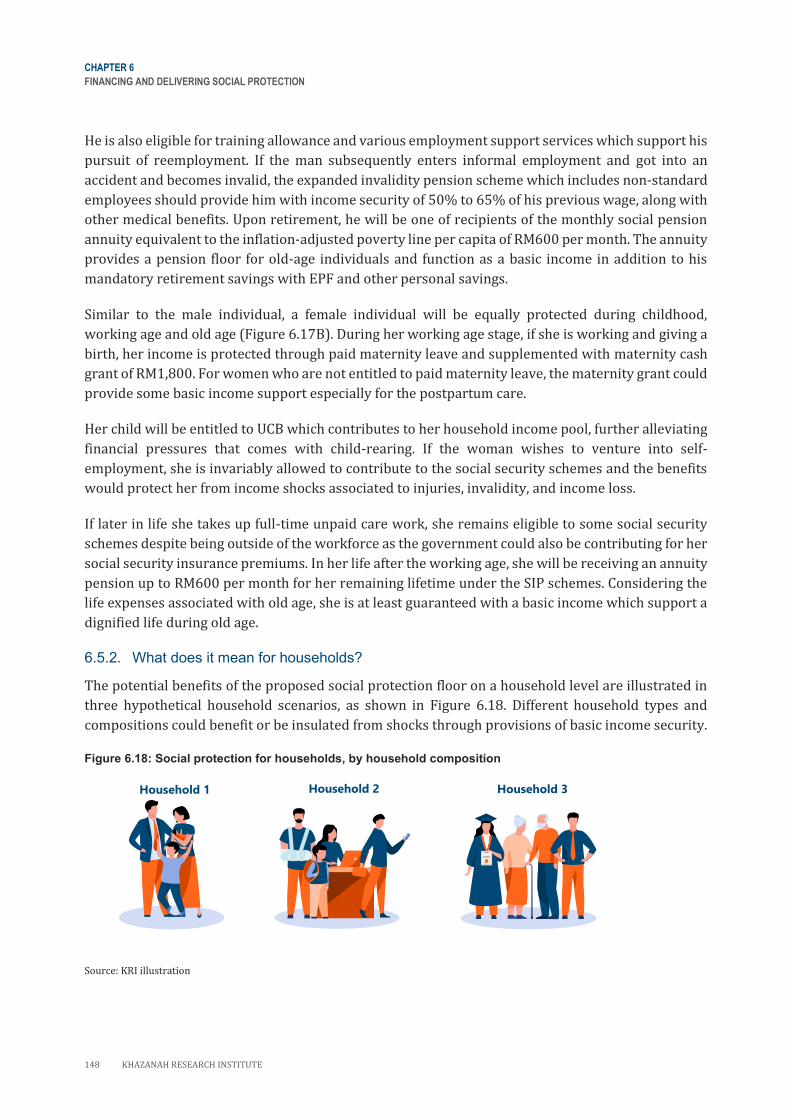
CHAPTER 6
FINANCING AND DELIVERING SOCIAL PROTECTION
148 KHAZANAH RESEARCH INSTITUTE
Household 2 Household 1 Household 3
He is also eligible for training allowance and various employment support services which support his
pursuit of reemployment. If the man subsequently enters informal employment and got into an
accident and becomes invalid, the expanded invalidity pension scheme which includes non-standard
employees should provide him with income security of 50% to 65% of his previous wage, along with
other medical benefits. Upon retirement, he will be one of recipients of the monthly social pension
annuity equivalent to the inflation-adjusted poverty line per capita of RM600 per month. The annuity
provides a pension floor for old-age individuals and function as a basic income in addition to his
mandatory retirement savings with EPF and other personal savings.
Similar to the male individual, a female individual will be equally protected during childhood,
working age and old age (Figure 6.17B). During her working age stage, if she is working and giving a
birth, her income is protected through paid maternity leave and supplemented with maternity cash
grant of RM1,800. For women who are not entitled to paid maternity leave, the maternity grant could
provide some basic income support especially for the postpartum care.
Her child will be entitled to UCB which contributes to her household income pool, further alleviating
financial pressures that comes with child-rearing. If the woman wishes to venture into self-
employment, she is invariably allowed to contribute to the social security schemes and the benefits
would protect her from income shocks associated to injuries, invalidity, and income loss.
If later in life she takes up full-time unpaid care work, she remains eligible to some social security
schemes despite being outside of the workforce as the government could also be contributing for her
social security insurance premiums. In her life after the working age, she will be receiving an annuity
pension up to RM600 per month for her remaining lifetime under the SIP schemes. Considering the
life expenses associated with old age, she is at least guaranteed with a basic income which support a
dignified life during old age.
6.5.2. What does it mean for households?
The potential benefits of the proposed social protection floor on a household level are illustrated in
three hypothetical household scenarios, as shown in Figure 6.18. Different household types and
compositions could benefit or be insulated from shocks through provisions of basic income security.
Figure 6.18: Social protection for households, by household composition
Source: KRI illustration
CHAPTER 6
FINANCING AND DELIVERING SOCIAL PROTECTION
KHAZANAH RESEARCH INSTITUTE 149
The first scenario involves budding young families such as Household 1, which includes the father
who is the sole breadwinner, the mother who has just given birth, the newborn and another young
child. As there are four family members, significant pressures remain with the sole income earner.
Under the UCB scheme, each child will receive a monthly RM150 transfer and in total the family will
be guaranteed with an amount of RM3,600 per year for the two children. This grant would assist the
parents with the cost of raising children such as food, education and healthcare expenses. The
benefits could markedly improve the family’s capacity to smooth the expenses associated with raising
children or could simply be dedicated as savings for future education. Postpartum care could also
account for a significant share of household expenses as it implies an extra amount to be set aside for
both the mother and the new addition to the family. The mother who is a homemaker is entitled to a
maternity grant of RM1,800, hopefully to cover some of these costs.
Household 2 illustrates the case of a family which comprise the father who is currently injured and
unable to work due to an accident at the workplace, the mother who is self-employed, a son who is
looking for a job and a school-aged daughter. The illustrated household experiences income
insecurity due to an injury experienced by one of the income earners which suspends their main
source of income. The disablement benefits from the injury scheme provides some income
replacement (80% to 90% of wage), as well as other medical benefits. The income replacement
scheme mitigates the magnitude of income loss during the period of disability, thus alleviating the
stress placed upon the second earner to replace the loss.
The expanded social security schemes and associated fiscal support from the government also
provides the opportunity for the self-employed mother to contribute to and benefit from the social
insurance schemes in case of future unexpected contingencies. The household also receives
additional income support, especially for the job-seeking son through the tax-funded JSA of RM600
per month. This would finance his job searching effort for a period of six months, which could further
build the household income pool and relieves him from accepting an ill-fitting job due to financial
constraints. The schooling daughter will be receiving RM150 child benefits monthly, further adding
to the household income pool.
In an extended family where aged members are often present, life risks could be higher with more
demanding living expenses. Household 3 illustrates a family comprising two retired parents, a
working son and a daughter who has just graduated. Old-age parents without adequate income
security could put financial pressures to the other earners in the household. Under the old-age social
security proposal, the parents will be provided with a monthly social pension annuity equivalent to
the inflation-adjusted poverty line per capita for the rest of their lives. In 2020 prices, the amount
will be roughly RM600 per month depending on the contribution for the social insurance premium
during the working-age years. The consistent annuity provides a pension floor for retired individuals,
effectively shielding them from falling into poverty, guaranteeing a life of dignity in old age.
Additional income is available if they are also contributing for their own EPF savings. The household
income is also supplemented with an additional RM600 per month for up to six months, in the form
of a JSA for the recently graduated daughter. The young working son is thus relieved from the high
living costs to support other family members as the forward-looking social security system is built
around a preventive principle that mitigate the risk of falling into severe financial hardship.
CHAPTER 6
FINANCING AND DELIVERING SOCIAL PROTECTION
150 KHAZANAH RESEARCH INSTITUTE
The above illustrations demonstrate the scope of the proposed social protection floor in providing
income security, protecting all individuals at all stages of life cycle. While the social protection shifts
from providing household-level benefits to individual-level benefits, the consistent and predictable
transfer of income based on individual life cycle stage (e.g. children, youth job seeker, temporarily
unemployed, unable to work due to disability, retired elders) could still provide household-level
income security by combining individual benefits.
6.6 Concluding Remarks
This report advocates for an inclusive and universal access to basic income security (instead of
means-testing such as through explicit poverty targeting) as the core principle for social security
provisioning. We recommend the life cycle approach based on its strength that emphasises
provisions of appropriate protections against major risks at each stage of everyone’s life. We affirm
that this principle and approach would provide a firm basis of streamlining existing programmes and
addressing gaps with a vision to build a social protection system that is more coherent and inclusive.
It is hoped that the proposed core life cycle social security schemes would contribute to the reform
agenda and enable Malaysia to transform from a welfare-based to development-oriented social
protection system—one that could create a sustainable and inclusive system with profound impact
for generations to come.
KHAZANAH RESEARCH INSTITUTE 151
CHAPTER
07
CONCLUSION 152

152 KHAZANAH RESEARCH INSTITUTE
CHAPTER 7
CONCLUSION
The legitimate object of government is to do for a community of people whatever they need to have done,
but cannot do at all, or cannot so well do, for themselves – in their separate, and individual capacities.
Abraham Lincoln (1854)
Social protection has been globally recognised as instrumental for preventing poverty and addressing
socio-economic vulnerability, as well as advancing social justice and sustainable development.
Recently, its importance has soared to new heights with the ongoing Covid-19 pandemic that has
posed unprecedented health and economic challenges for nations across the globe. Notwithstanding
the Covid-19 pandemic, several long-standing issues and new trends highlight the challenges in social
protection provisions in Malaysia.
The first is the issue of child deprivations and malnutrition across income groups and the
socioeconomic deprivations that hamper children’s full potential. If not urgently addressed, it will
have cascading effects as the children transition to adulthood. While Malaysia has implemented
several social assistance programmes for poor and vulnerable children, these interventions suffer
from fragmentation that compromises both the breadth and depth of the programmes, leading to the
exclusion of many children and low adequacy or quality of the benefits delivered.
The second trend concerns Malaysia’s workforce, with continued concentration in low paying jobs in
traditional services and rising vulnerable employment. The interactions between technological
development, globalisation and socioeconomic policies have accelerated structural change in the
economy, transforming work environments and employment relations. These fast-emerging trends
are rendering existing social protection systems increasingly insufficient, especially those that are
“employer-tied”. If left unchecked, the rapid informalisation of jobs and encroachment of non-
standard employment on traditional full-time jobs could pose challenges to Malaysia’s social
protection as many schemes are typically built around standard employment relationships.
The third trend concerns rapid population ageing as reflected by rising old-age dependency against
a shrinking working-age population share, resulting in increasing health and old-age care needs. This
trend is compounded by Malaysians living longer, but not necessarily healthier, with the increasing
prevalence of non-communicable diseases affecting especially the elder population. While rising
longevity is to be celebrated, if these trends persist, an increasing proportion of elders will spend
these additional years of life gained in poor health and without sufficient retirement savings. If the
status quo is not reversed, larger older cohorts will put more pressure on fiscal expenditure.
Against these trends, social protection in Malaysia continues to grapple with issues of coverage and
adequacy. Among contributory social insurance schemes and other provisions backed by legislation,
benefits continue to be limited to workers in formal employment. Provisions for informal workers
remain largely inadequate and with limited reach, while the rest of the working-age population
outside the labour force, such as unpaid care-givers and homemakers, are left almost wholly
unprotected.
CHAPTER 7
CONCLUSION
KHAZANAH RESEARCH INSTITUTE 153
Yet many of these population groups unprotected by social insurance schemes may also receive little
to no aid from tax-funded social assistance schemes, as they may be deemed ineligible. At the
moment, social assistance schemes in Malaysia continue to heavily target those considered most in
need of aid, particularly those defined as poor, low income or vulnerable. Such practices are bound
to exclude a large share of the population deprived of decent living. It has also led to the
fragmentation of social protection from a proliferation of various small-scale schemes, placing undue
administrative burden and undermining the efficacy of government social spending, all while yet
providing inadequate assistance.
These issues of social protection call for greater inclusiveness and coherence in providing a minimum
level of income security in Malaysia. This requires a paradigm shift towards universality beyond
seeing social protection strictly as relief for the poor. Moving forward, social protection policy in
Malaysia should adopt a life cycle approach by targeting and pre-empting against key risks faced
throughout life in a forward-looking manner, rather than only targeting those who have already fallen
into dire straits. These key risks include disability, sickness, unemployment as well as vulnerabilities
during childhood and old age—risks which can adversely impact anyone’s wellbeing regardless of
income status.
Our five key policy recommendations are summarised as follows:
1) Investing in a universal basic income for children so that no child is left behind during this
important stage of cognitive, physical and social development.
2) Expanding the mandatory coverage of existing social insurance schemes for the working-age
population especially for the self-employed, informal workers and those outside the official
labour force.
3) Establishing a social insurance pension for old age to provide basic income security for elders,
amidst coverage and adequacy challenges of old age savings.
4) Progressive realisation of proposed policies to build institutional capacity, introduce or amend
the relevant legislations, and broadening revenue base.
5) Building a national social security institution and a unified registry by expanding the role of
existing institution to administer and implement both extended and new social security schemes.
Our recommendations are built on, and not devoid of, existing social services, namely public
healthcare, social housing and the education system. Our proposals are designed to complement,
instead of replacing, the current tax-funded universal provision of social services. While the report
has made the case that these recommendations are necessary to protect individuals from income
insecurity throughout their lives, the schemes would not be sufficient on their own. True to the social
protection floor principle, our proposals seek to instil a solid foundation for income security against
well-documented risks. Cognisant of implementation and fiscal challenges, this report strives to offer
practical, equitable and sustainable policy proposals in the context of Malaysian social protection.
CONCLUSION
154 KHAZANAH RESEARCH INSTITUTE
This report aims to ultimately put forward a renewed social protection paradigm, moving from a
charity-based model to a more universal rights-based approach. Building on principles of risk
sharing, collective funding and solidary, the report advocates for an inclusive lifecycle social
protection system with a forward-looking approach in preventing poverty and addressing
vulnerability, thus ensuring the entire population could overcome socioeconomic shocks and risks
throughout their lifetime. It calls for a greater government involvement under the social security
tripartite arrangement as a strategy in extending protection floor to all. Inclusive social protection
will induce a virtuous cycle of strengthening the social contract, fostering trust in government and
enhancing government revenue. Institutionalising this aspiration is of paramount importance to
ensure that the materialisation of these visions is not contingent on goodwill and shifting priorities.
With existing social security institutions, Malaysia has achieved so much but can also do so much
more.
KHAZANAH RESEARCH INSTITUTE 155
APPENDICES & REFERENCES
APPENDICES 155
Appendix A: International
Comparison of Child Benefits 156
Appendix B: ILO Conventions for
Unemployment, Injury Protection
and Maternity Protection 160
Appendix C: Social Insurance
Schemes for Working-Age Population
in Malaysia 163
Appendix D: Estimated Investment to
Expand Social Insurance Schemes 164
Appendix E: International
Comparison of Youth Job Search
Allowance 165
Appendix F: International
Comparison of Maternity Grants 166
Appendix G: Estimated Investment to
Expand Social Protection for the
Working-Age Population 168
Appendix H: International
Conventions for Old-Age Income
Security 171
Appendix I: Income Security
Programmes in Malaysia 172
Appendix J: Stimulated Hypothetical
EPF Retirement Savings 176
Appendix K: Forecasted Nominal
Gross Domestic Product 178
Appendix L: Premium Calculations
for Life Annuity 179
REFERENCES 184
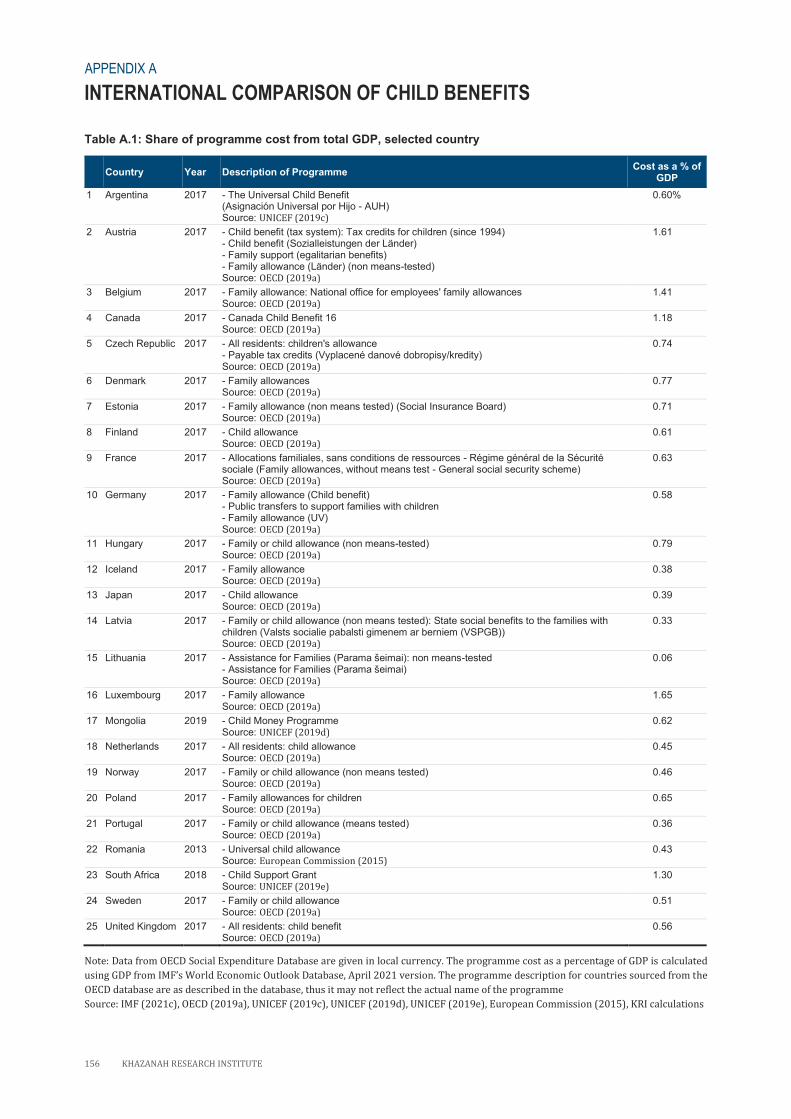
156 KHAZANAH RESEARCH INSTITUTE
APPENDICES
APPENDIX A
INTERNATIONAL COMPARISON OF CHILD BENEFITS
Table A.1: Share of programme cost from total GDP, selected country
Country Year Description of Programme Cost as a % of
GDP
1 Argentina 2017 - The Universal Child Benefit (Asignación Universal por Hijo - AUH) Source: UNICEF (2019c)
0.60%
2 Austria 2017 - Child benefit (tax system): Tax credits for children (since 1994) - Child benefit (Sozialleistungen der Länder) - Family support (egalitarian benefits) - Family allowance (Länder) (non means-tested) Source: OECD (2019a)
1.61
3 Belgium 2017 - Family allowance: National office for employees' family allowances Source: OECD (2019a)
1.41
4 Canada 2017 - Canada Child Benefit 16 Source: OECD (2019a)
1.18
5 Czech Republic 2017 - All residents: children's allowance - Payable tax credits (Vyplacené danové dobropisy/kredity) Source: OECD (2019a)
0.74
6 Denmark 2017 - Family allowances Source: OECD (2019a)
0.77
7 Estonia 2017 - Family allowance (non means tested) (Social Insurance Board) Source: OECD (2019a)
0.71
8 Finland 2017 - Child allowance Source: OECD (2019a)
0.61
9 France 2017 - Allocations familiales, sans conditions de ressources - Régime général de la Sécurité sociale (Family allowances, without means test - General social security scheme) Source: OECD (2019a)
0.63
10 Germany 2017 - Family allowance (Child benefit) - Public transfers to support families with children - Family allowance (UV) Source: OECD (2019a)
0.58
11 Hungary 2017 - Family or child allowance (non means-tested) Source: OECD (2019a)
0.79
12 Iceland 2017 - Family allowance Source: OECD (2019a)
0.38
13 Japan 2017 - Child allowance Source: OECD (2019a)
0.39
14 Latvia 2017 - Family or child allowance (non means tested): State social benefits to the families with children (Valsts socialie pabalsti gimenem ar berniem (VSPGB)) Source: OECD (2019a)
0.33
15 Lithuania 2017 - Assistance for Families ( arama šeimai): non means-tested - Assistance for Families ( arama šeimai) Source: OECD (2019a)
0.06
16 Luxembourg 2017 - Family allowance Source: OECD (2019a)
1.65
17 Mongolia 2019 - Child Money Programme Source: UNICEF (2019d)
0.62
18 Netherlands 2017 - All residents: child allowance Source: OECD (2019a)
0.45
19 Norway 2017 - Family or child allowance (non means tested) Source: OECD (2019a)
0.46
20 Poland 2017 - Family allowances for children Source: OECD (2019a)
0.65
21 Portugal 2017 - Family or child allowance (means tested) Source: OECD (2019a)
0.36
22 Romania 2013 - Universal child allowance Source: European Commission (2015)
0.43
23 South Africa 2018 - Child Support Grant Source: UNICEF (2019e)
1.30
24 Sweden 2017 - Family or child allowance Source: OECD (2019a)
0.51
25 United Kingdom 2017 - All residents: child benefit Source: OECD (2019a)
0.56
Note: Data from OECD Social Expenditure Database are given in local currency. The programme cost as a percentage of GDP is calculated
using GDP from IMF’s World Economic Outlook Database, April 2021 version. The programme description for countries sourced from the
OECD database are as described in the database, thus it may not reflect the actual name of the programme
Source: IMF (2021c), OECD (2019a), UNICEF (2019c), UNICEF (2019d), UNICEF (2019e), European Commission (2015), KRI calculations
APPENDIX A
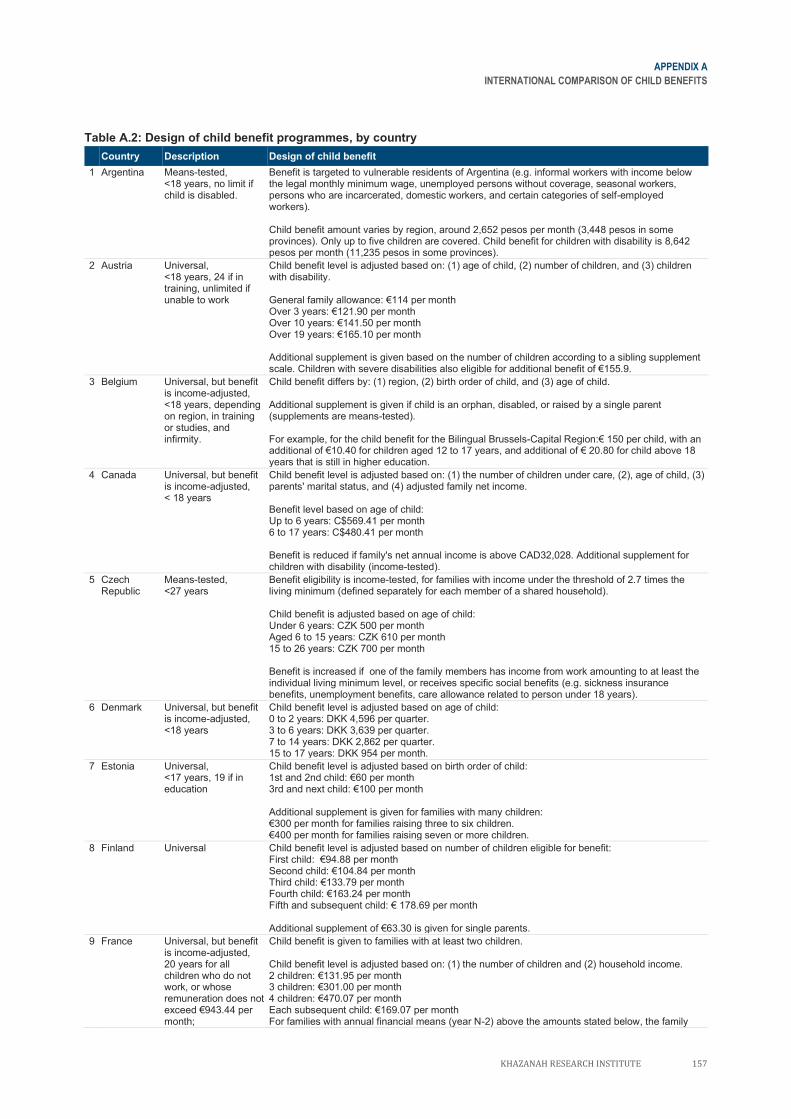
APPENDIX A
INTERNATIONAL COMPARISON OF CHILD BENEFITS
KHAZANAH RESEARCH INSTITUTE 157
Table A.2: Design of child benefit programmes, by country
Country Description Design of child benefit
1 Argentina Means-tested, <18 years, no limit if child is disabled.
Benefit is targeted to vulnerable residents of Argentina (e.g. informal workers with income below the legal monthly minimum wage, unemployed persons without coverage, seasonal workers, persons who are incarcerated, domestic workers, and certain categories of self-employed workers). Child benefit amount varies by region, around 2,652 pesos per month (3,448 pesos in some provinces). Only up to five children are covered. Child benefit for children with disability is 8,642 pesos per month (11,235 pesos in some provinces).
2 Austria Universal, <18 years, 24 if in training, unlimited if unable to work
Child benefit level is adjusted based on: (1) age of child, (2) number of children, and (3) children with disability. eneral family allowance: €114 per month Over 3 years: €121.90 per month Over 10 years: €141.50 per month Over 19 years: €165.10 per month Additional supplement is given based on the number of children according to a sibling supplement scale. Children with severe disabilities also eligible for additional benefit of €155.9.
3 Belgium Universal, but benefit is income-adjusted, <18 years, depending on region, in training or studies, and infirmity.
Child benefit differs by: (1) region, (2) birth order of child, and (3) age of child. Additional supplement is given if child is an orphan, disabled, or raised by a single parent (supplements are means-tested). For example, for the child benefit for the Bilingual Brussels-Capital Region:€ 150 per child, with an additional of €10.40 for children aged 12 to 1 years, and additional of € 20. 0 for child above 1 years that is still in higher education.
4 Canada Universal, but benefit is income-adjusted, < 18 years
Child benefit level is adjusted based on: (1) the number of children under care, (2), age of child, (3) parents' marital status, and (4) adjusted family net income. Benefit level based on age of child: Up to 6 years: C$569.41 per month 6 to 17 years: C$480.41 per month Benefit is reduced if family's net annual income is above CAD32,028. Additional supplement for children with disability (income-tested).
5 Czech Republic
Means-tested, <27 years
Benefit eligibility is income-tested, for families with income under the threshold of 2.7 times the living minimum (defined separately for each member of a shared household). Child benefit is adjusted based on age of child: Under 6 years: CZK 500 per month Aged 6 to 15 years: CZK 610 per month 15 to 26 years: CZK 700 per month Benefit is increased if one of the family members has income from work amounting to at least the individual living minimum level, or receives specific social benefits (e.g. sickness insurance benefits, unemployment benefits, care allowance related to person under 18 years).
6 Denmark Universal, but benefit is income-adjusted, <18 years
Child benefit level is adjusted based on age of child: 0 to 2 years: DKK 4,596 per quarter. 3 to 6 years: DKK 3,639 per quarter. 7 to 14 years: DKK 2,862 per quarter. 15 to 17 years: DKK 954 per month.
7 Estonia Universal, <17 years, 19 if in education
Child benefit level is adjusted based on birth order of child: 1st and 2nd child: €60 per month 3rd and next child: €100 per month Additional supplement is given for families with many children: €300 per month for families raising three to six children. €400 per month for families raising seven or more children.
8 Finland Universal Child benefit level is adjusted based on number of children eligible for benefit: First child: €94. per month Second child: €104. 4 per month Third child: €133. 9 per month Fourth child: €163.24 per month Fifth and subsequent child: € 1 .69 per month Additional supplement of €63.30 is given for single parents.
9 France Universal, but benefit is income-adjusted, 20 years for all children who do not work, or whose remuneration does not exceed €943.44 per month;
Child benefit is given to families with at least two children. Child benefit level is adjusted based on: (1) the number of children and (2) household income. 2 children: €131.95 per month 3 children: €301.00 per month 4 children: €4 0.0 per month Each subsequent child: €169.0 per month For families with annual financial means (year N-2) above the amounts stated below, the family
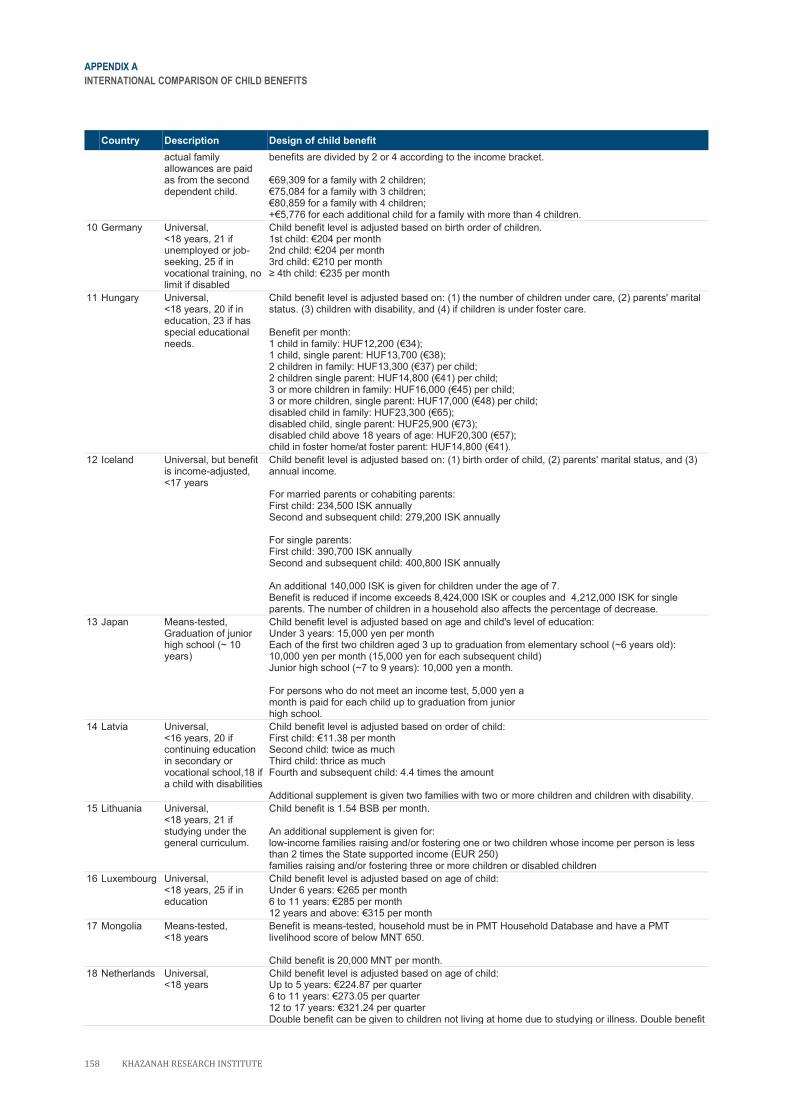
APPENDIX A
INTERNATIONAL COMPARISON OF CHILD BENEFITS
158 KHAZANAH RESEARCH INSTITUTE
Country Description Design of child benefit
actual family allowances are paid as from the second dependent child.
benefits are divided by 2 or 4 according to the income bracket. €69,309 for a family with 2 children; € 5,0 4 for a family with 3 children; € 0, 59 for a family with 4 children; +€5, 6 for each additional child for a family with more than 4 children.
10 Germany Universal, <18 years, 21 if unemployed or job-seeking, 25 if in vocational training, no limit if disabled
Child benefit level is adjusted based on birth order of children. 1st child: €204 per month 2nd child: €204 per month 3rd child: €210 per month ≥ 4th child: €235 per month
11 Hungary Universal, <18 years, 20 if in education, 23 if has special educational needs.
Child benefit level is adjusted based on: (1) the number of children under care, (2) parents' marital status. (3) children with disability, and (4) if children is under foster care. Benefit per month: 1 child in family: HUF12,200 (€34); 1 child, single parent: HUF13, 00 (€3 ); 2 children in family: HUF13,300 (€3 ) per child; 2 children single parent: HUF14, 00 (€41) per child; 3 or more children in family: HUF16,000 (€45) per child; 3 or more children, single parent: HUF1 ,000 (€4 ) per child; disabled child in family: HUF23,300 (€65); disabled child, single parent: HUF25,900 (€ 3); disabled child above 1 years of age: HUF20,300 (€5 ); child in foster home/at foster parent: HUF14, 00 (€41).
12 Iceland Universal, but benefit is income-adjusted, <17 years
Child benefit level is adjusted based on: (1) birth order of child, (2) parents' marital status, and (3) annual income. For married parents or cohabiting parents: First child: 234,500 ISK annually Second and subsequent child: 279,200 ISK annually For single parents: First child: 390,700 ISK annually Second and subsequent child: 400,800 ISK annually An additional 140,000 ISK is given for children under the age of 7. Benefit is reduced if income exceeds 8,424,000 ISK or couples and 4,212,000 ISK for single parents. The number of children in a household also affects the percentage of decrease.
13 Japan Means-tested, Graduation of junior high school (~ 10 years)
Child benefit level is adjusted based on age and child's level of education: Under 3 years: 15,000 yen per month Each of the first two children aged 3 up to graduation from elementary school (~6 years old): 10,000 yen per month (15,000 yen for each subsequent child) Junior high school (~7 to 9 years): 10,000 yen a month. For persons who do not meet an income test, 5,000 yen a month is paid for each child up to graduation from junior high school.
14 Latvia Universal, <16 years, 20 if continuing education in secondary or vocational school,18 if a child with disabilities
Child benefit level is adjusted based on order of child: First child: €11.3 per month Second child: twice as much Third child: thrice as much Fourth and subsequent child: 4.4 times the amount Additional supplement is given two families with two or more children and children with disability.
15 Lithuania Universal, <18 years, 21 if studying under the general curriculum.
Child benefit is 1.54 BSB per month. An additional supplement is given for: low-income families raising and/or fostering one or two children whose income per person is less than 2 times the State supported income (EUR 250) families raising and/or fostering three or more children or disabled children
16 Luxembourg Universal, <18 years, 25 if in education
Child benefit level is adjusted based on age of child: Under 6 years: €265 per month 6 to 11 years: €2 5 per month 12 years and above: €315 per month
17 Mongolia Means-tested, <18 years
Benefit is means-tested, household must be in PMT Household Database and have a PMT livelihood score of below MNT 650. Child benefit is 20,000 MNT per month.
18 Netherlands Universal, <18 years
Child benefit level is adjusted based on age of child: Up to 5 years: €224. per quarter 6 to 11 years: €2 3.05 per quarter 12 to 1 years: €321.24 per quarter Double benefit can be given to children not living at home due to studying or illness. Double benefit
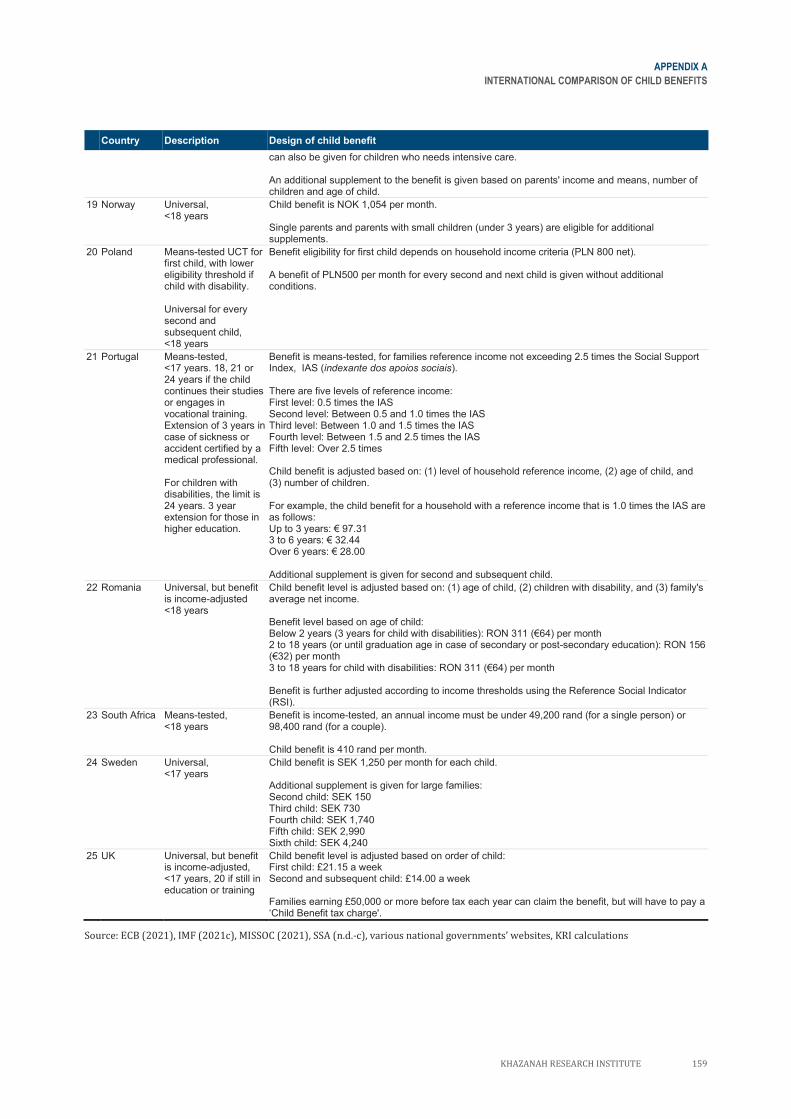
APPENDIX A
INTERNATIONAL COMPARISON OF CHILD BENEFITS
KHAZANAH RESEARCH INSTITUTE 159
Country Description Design of child benefit
can also be given for children who needs intensive care. An additional supplement to the benefit is given based on parents' income and means, number of children and age of child.
19 Norway Universal, <18 years
Child benefit is NOK 1,054 per month. Single parents and parents with small children (under 3 years) are eligible for additional supplements.
20 Poland Means-tested UCT for first child, with lower eligibility threshold if child with disability. Universal for every second and subsequent child, <18 years
Benefit eligibility for first child depends on household income criteria (PLN 800 net). A benefit of PLN500 per month for every second and next child is given without additional conditions.
21 Portugal Means-tested, <17 years. 18, 21 or 24 years if the child continues their studies or engages in vocational training. Extension of 3 years in case of sickness or accident certified by a medical professional. For children with disabilities, the limit is 24 years. 3 year extension for those in higher education.
Benefit is means-tested, for families reference income not exceeding 2.5 times the Social Support Index, IAS (indexante dos apoios sociais). There are five levels of reference income: First level: 0.5 times the IAS Second level: Between 0.5 and 1.0 times the IAS Third level: Between 1.0 and 1.5 times the IAS Fourth level: Between 1.5 and 2.5 times the IAS Fifth level: Over 2.5 times Child benefit is adjusted based on: (1) level of household reference income, (2) age of child, and (3) number of children. For example, the child benefit for a household with a reference income that is 1.0 times the IAS are as follows: Up to 3 years: € 9 .31 3 to 6 years: € 32.44 Over 6 years: € 2 .00 Additional supplement is given for second and subsequent child.
22 Romania Universal, but benefit is income-adjusted <18 years
Child benefit level is adjusted based on: (1) age of child, (2) children with disability, and (3) family's average net income. Benefit level based on age of child: elow 2 years (3 years for child with disabilities): RO 311 (€64) per month 2 to 18 years (or until graduation age in case of secondary or post-secondary education): RON 156 (€32) per month 3 to 1 years for child with disabilities: RO 311 (€64) per month Benefit is further adjusted according to income thresholds using the Reference Social Indicator (RSI).
23 South Africa Means-tested, <18 years
Benefit is income-tested, an annual income must be under 49,200 rand (for a single person) or 98,400 rand (for a couple). Child benefit is 410 rand per month.
24 Sweden Universal, <17 years
Child benefit is SEK 1,250 per month for each child. Additional supplement is given for large families: Second child: SEK 150 Third child: SEK 730 Fourth child: SEK 1,740 Fifth child: SEK 2,990 Sixth child: SEK 4,240
25 UK Universal, but benefit is income-adjusted, <17 years, 20 if still in education or training
Child benefit level is adjusted based on order of child: First child: £21.15 a week Second and subsequent child: £14.00 a week Families earning £50,000 or more before tax each year can claim the benefit, but will have to pay a ‘Child Benefit tax charge'.
Source: ECB (2021), IMF (2021c), MISSOC (2021), SSA (n.d.-c), various national governments’ websites, KRI calculations
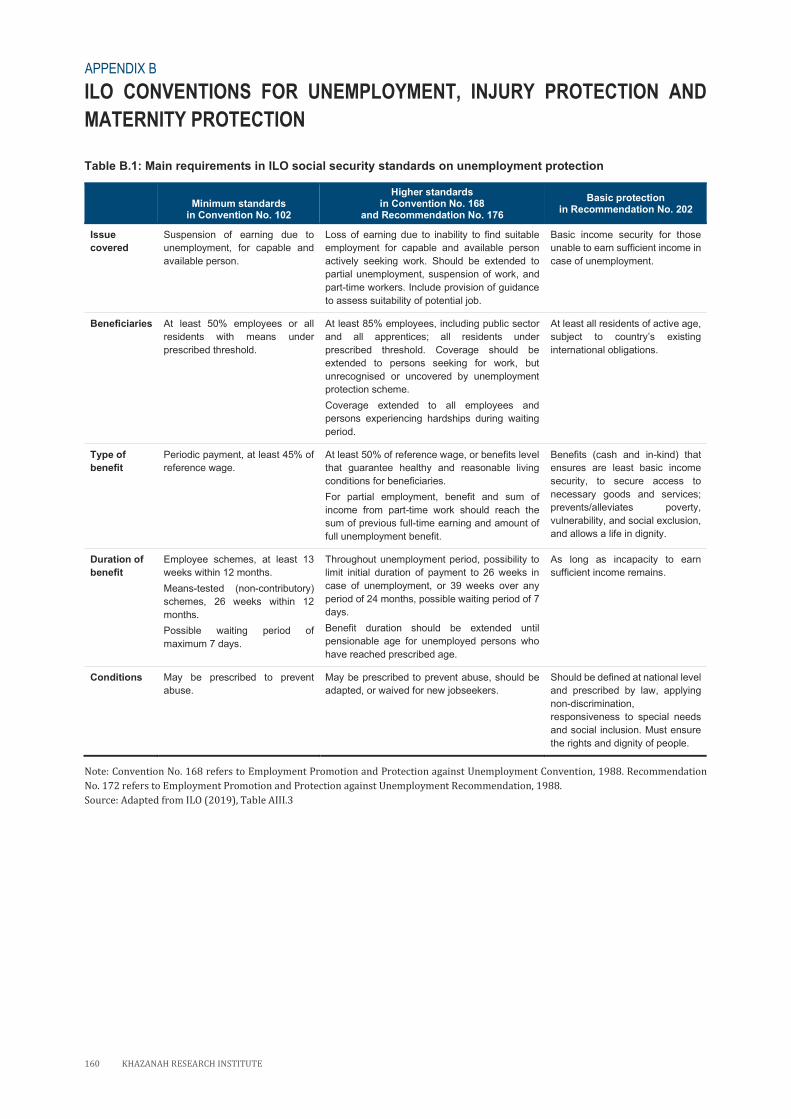
160 KHAZANAH RESEARCH INSTITUTE
APPENDIX B
ILO CONVENTIONS FOR UNEMPLOYMENT, INJURY PROTECTION AND
MATERNITY PROTECTION
Table B.1: Main requirements in ILO social security standards on unemployment protection
Minimum standards
in Convention No. 102
Higher standards in Convention No. 168
and Recommendation No. 176
Basic protection in Recommendation No. 202
Issue
covered
Suspension of earning due to
unemployment, for capable and
available person.
Loss of earning due to inability to find suitable
employment for capable and available person
actively seeking work. Should be extended to
partial unemployment, suspension of work, and
part-time workers. Include provision of guidance
to assess suitability of potential job.
Basic income security for those
unable to earn sufficient income in
case of unemployment.
Beneficiaries At least 50% employees or all
residents with means under
prescribed threshold.
At least 85% employees, including public sector
and all apprentices; all residents under
prescribed threshold. Coverage should be
extended to persons seeking for work, but
unrecognised or uncovered by unemployment
protection scheme.
Coverage extended to all employees and
persons experiencing hardships during waiting
period.
At least all residents of active age,
subject to country’s existing
international obligations.
Type of
benefit
Periodic payment, at least 45% of
reference wage.
At least 50% of reference wage, or benefits level
that guarantee healthy and reasonable living
conditions for beneficiaries.
For partial employment, benefit and sum of
income from part-time work should reach the
sum of previous full-time earning and amount of
full unemployment benefit.
Benefits (cash and in-kind) that
ensures are least basic income
security, to secure access to
necessary goods and services;
prevents/alleviates poverty,
vulnerability, and social exclusion,
and allows a life in dignity.
Duration of
benefit
Employee schemes, at least 13
weeks within 12 months.
Means-tested (non-contributory)
schemes, 26 weeks within 12
months.
Possible waiting period of
maximum 7 days.
Throughout unemployment period, possibility to
limit initial duration of payment to 26 weeks in
case of unemployment, or 39 weeks over any
period of 24 months, possible waiting period of 7
days.
Benefit duration should be extended until
pensionable age for unemployed persons who
have reached prescribed age.
As long as incapacity to earn
sufficient income remains.
Conditions May be prescribed to prevent
abuse.
May be prescribed to prevent abuse, should be
adapted, or waived for new jobseekers.
Should be defined at national level
and prescribed by law, applying
non-discrimination,
responsiveness to special needs
and social inclusion. Must ensure
the rights and dignity of people.
Note: Convention No. 168 refers to Employment Promotion and Protection against Unemployment Convention, 1988. Recommendation
No. 172 refers to Employment Promotion and Protection against Unemployment Recommendation, 1988.
Source: Adapted from ILO (2019), Table AIII.3
APPENDIX B
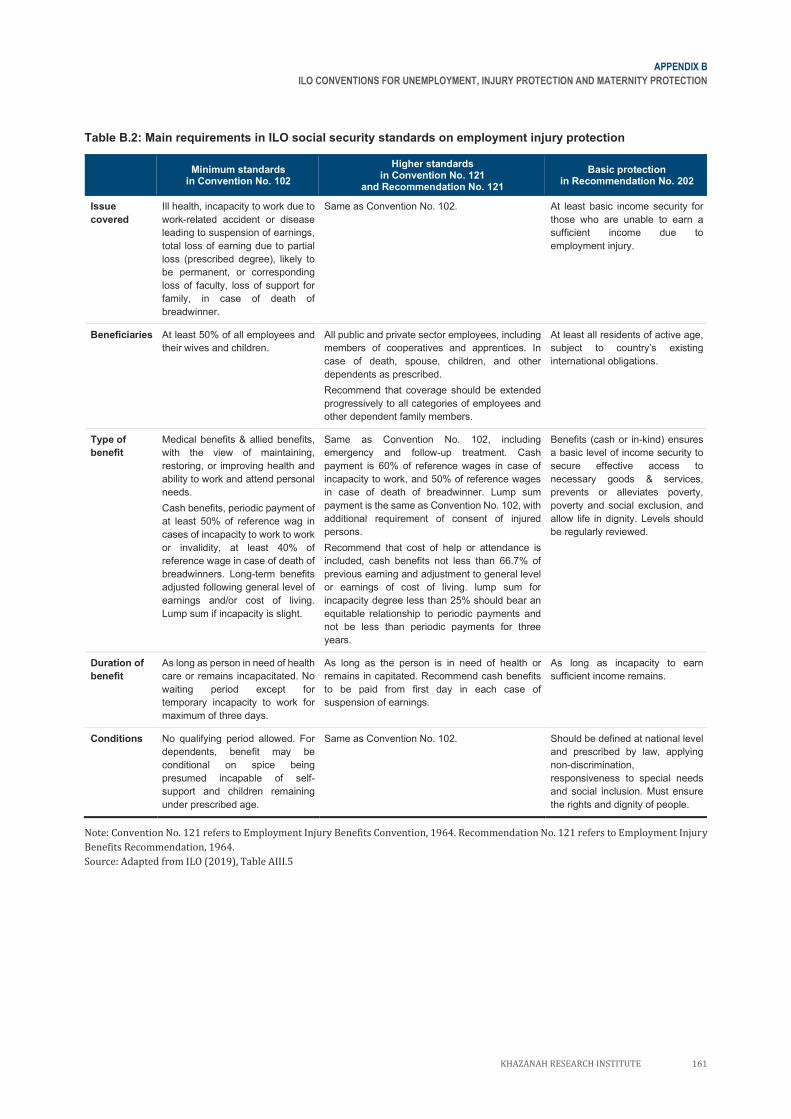
APPENDIX B
ILO CONVENTIONS FOR UNEMPLOYMENT, INJURY PROTECTION AND MATERNITY PROTECTION
KHAZANAH RESEARCH INSTITUTE 161
Table B.2: Main requirements in ILO social security standards on employment injury protection
Minimum standards
in Convention No. 102
Higher standards in Convention No. 121
and Recommendation No. 121
Basic protection in Recommendation No. 202
Issue
covered
Ill health, incapacity to work due to
work-related accident or disease
leading to suspension of earnings,
total loss of earning due to partial
loss (prescribed degree), likely to
be permanent, or corresponding
loss of faculty, loss of support for
family, in case of death of
breadwinner.
Same as Convention No. 102. At least basic income security for
those who are unable to earn a
sufficient income due to
employment injury.
Beneficiaries At least 50% of all employees and
their wives and children.
All public and private sector employees, including
members of cooperatives and apprentices. In
case of death, spouse, children, and other
dependents as prescribed.
Recommend that coverage should be extended
progressively to all categories of employees and
other dependent family members.
At least all residents of active age,
subject to country’s existing
international obligations.
Type of
benefit
Medical benefits & allied benefits,
with the view of maintaining,
restoring, or improving health and
ability to work and attend personal
needs.
Cash benefits, periodic payment of
at least 50% of reference wag in
cases of incapacity to work to work
or invalidity, at least 40% of
reference wage in case of death of
breadwinners. Long-term benefits
adjusted following general level of
earnings and/or cost of living.
Lump sum if incapacity is slight.
Same as Convention No. 102, including
emergency and follow-up treatment. Cash
payment is 60% of reference wages in case of
incapacity to work, and 50% of reference wages
in case of death of breadwinner. Lump sum
payment is the same as Convention No. 102, with
additional requirement of consent of injured
persons.
Recommend that cost of help or attendance is
included, cash benefits not less than 66.7% of
previous earning and adjustment to general level
or earnings of cost of living. lump sum for
incapacity degree less than 25% should bear an
equitable relationship to periodic payments and
not be less than periodic payments for three
years.
Benefits (cash or in-kind) ensures
a basic level of income security to
secure effective access to
necessary goods & services,
prevents or alleviates poverty,
poverty and social exclusion, and
allow life in dignity. Levels should
be regularly reviewed.
Duration of
benefit
As long as person in need of health
care or remains incapacitated. No
waiting period except for
temporary incapacity to work for
maximum of three days.
As long as the person is in need of health or
remains in capitated. Recommend cash benefits
to be paid from first day in each case of
suspension of earnings.
As long as incapacity to earn
sufficient income remains.
Conditions No qualifying period allowed. For
dependents, benefit may be
conditional on spice being
presumed incapable of self-
support and children remaining
under prescribed age.
Same as Convention No. 102. Should be defined at national level
and prescribed by law, applying
non-discrimination,
responsiveness to special needs
and social inclusion. Must ensure
the rights and dignity of people.
Note: Convention No. 121 refers to Employment Injury Benefits Convention, 1964. Recommendation No. 121 refers to Employment Injury
Benefits Recommendation, 1964.
Source: Adapted from ILO (2019), Table AIII.5
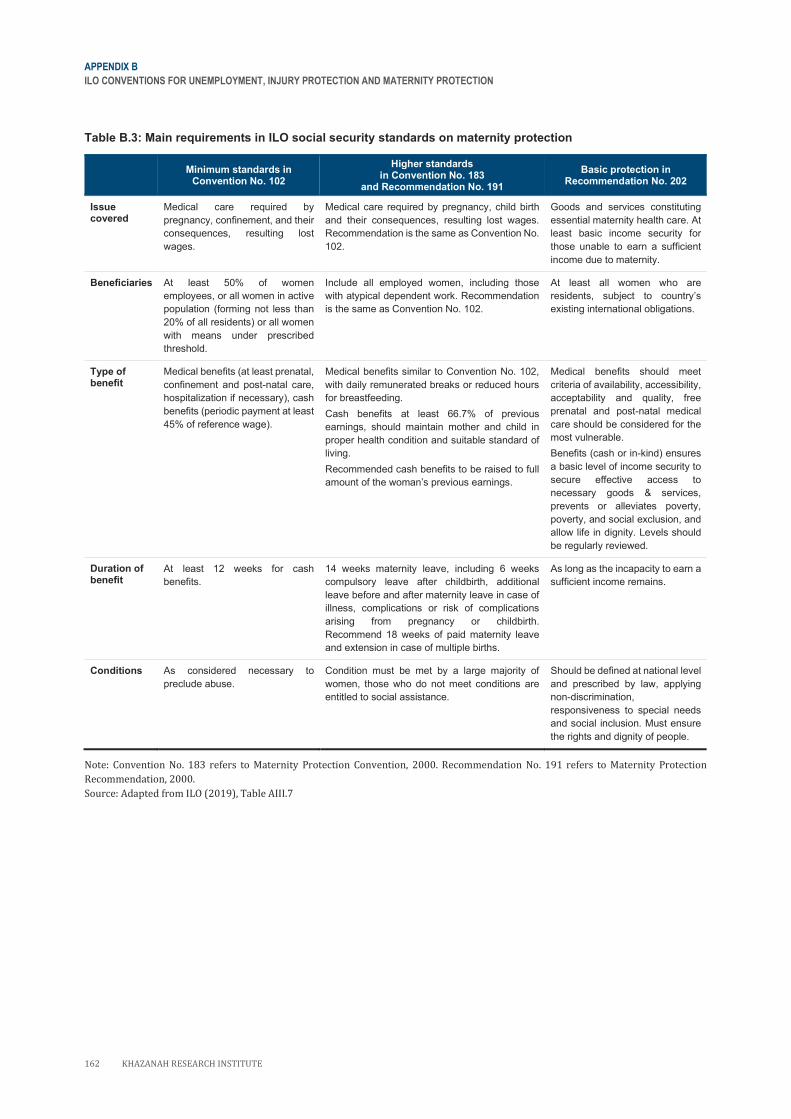
APPENDIX B
ILO CONVENTIONS FOR UNEMPLOYMENT, INJURY PROTECTION AND MATERNITY PROTECTION
162 KHAZANAH RESEARCH INSTITUTE
Table B.3: Main requirements in ILO social security standards on maternity protection
Minimum standards in
Convention No. 102
Higher standards in Convention No. 183
and Recommendation No. 191
Basic protection in Recommendation No. 202
Issue covered
Medical care required by
pregnancy, confinement, and their
consequences, resulting lost
wages.
Medical care required by pregnancy, child birth
and their consequences, resulting lost wages.
Recommendation is the same as Convention No.
102.
Goods and services constituting
essential maternity health care. At
least basic income security for
those unable to earn a sufficient
income due to maternity.
Beneficiaries At least 50% of women
employees, or all women in active
population (forming not less than
20% of all residents) or all women
with means under prescribed
threshold.
Include all employed women, including those
with atypical dependent work. Recommendation
is the same as Convention No. 102.
At least all women who are
residents, subject to country’s
existing international obligations.
Type of benefit
Medical benefits (at least prenatal,
confinement and post-natal care,
hospitalization if necessary), cash
benefits (periodic payment at least
45% of reference wage).
Medical benefits similar to Convention No. 102,
with daily remunerated breaks or reduced hours
for breastfeeding.
Cash benefits at least 66.7% of previous
earnings, should maintain mother and child in
proper health condition and suitable standard of
living.
Recommended cash benefits to be raised to full
amount of the woman’s previous earnings.
Medical benefits should meet
criteria of availability, accessibility,
acceptability and quality, free
prenatal and post-natal medical
care should be considered for the
most vulnerable.
Benefits (cash or in-kind) ensures
a basic level of income security to
secure effective access to
necessary goods & services,
prevents or alleviates poverty,
poverty, and social exclusion, and
allow life in dignity. Levels should
be regularly reviewed.
Duration of benefit
At least 12 weeks for cash
benefits.
14 weeks maternity leave, including 6 weeks
compulsory leave after childbirth, additional
leave before and after maternity leave in case of
illness, complications or risk of complications
arising from pregnancy or childbirth.
Recommend 18 weeks of paid maternity leave
and extension in case of multiple births.
As long as the incapacity to earn a
sufficient income remains.
Conditions As considered necessary to
preclude abuse.
Condition must be met by a large majority of
women, those who do not meet conditions are
entitled to social assistance.
Should be defined at national level
and prescribed by law, applying
non-discrimination,
responsiveness to special needs
and social inclusion. Must ensure
the rights and dignity of people.
Note: Convention No. 183 refers to Maternity Protection Convention, 2000. Recommendation No. 191 refers to Maternity Protection
Recommendation, 2000.
Source: Adapted from ILO (2019), Table AIII.7
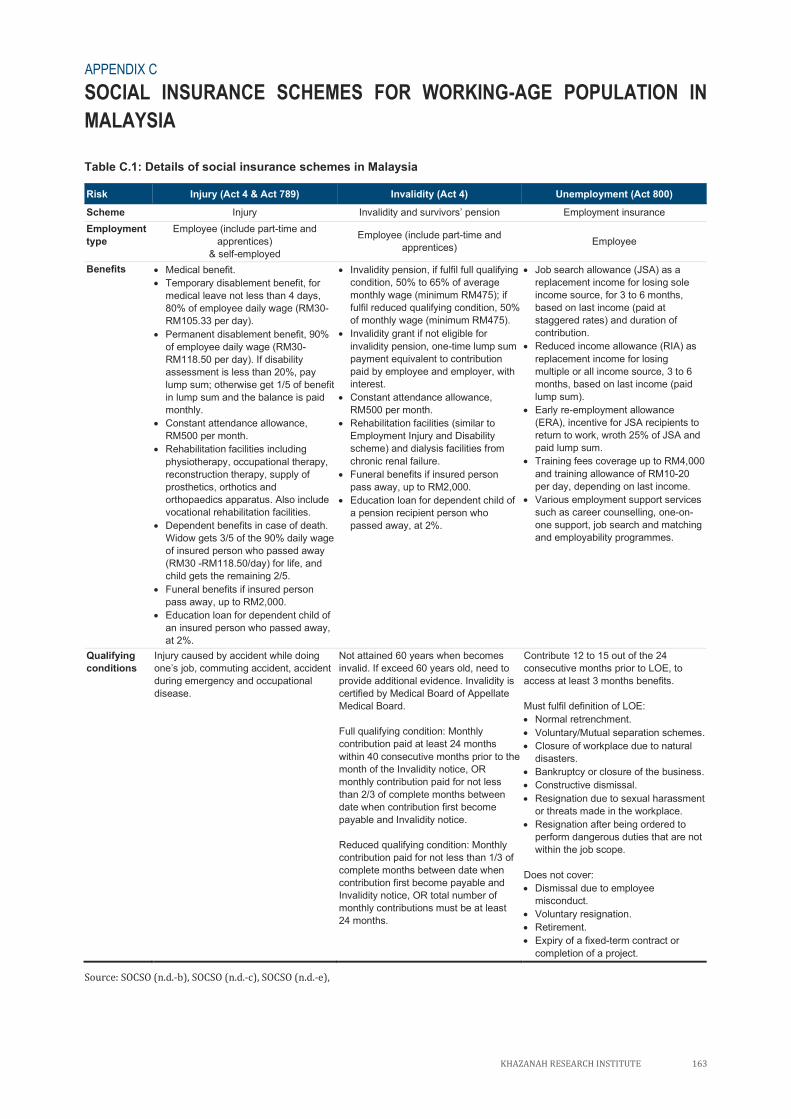
KHAZANAH RESEARCH INSTITUTE 163
APPENDIX C
SOCIAL INSURANCE SCHEMES FOR WORKING-AGE POPULATION IN
MALAYSIA
Table C.1: Details of social insurance schemes in Malaysia
Risk Injury (Act 4 & Act 789) Invalidity (Act 4) Unemployment (Act 800)
Scheme Injury Invalidity and survivors’ pension Employment insurance
Employment
type
Employee (include part-time and
apprentices)
& self-employed
Employee (include part-time and
apprentices) Employee
Benefits • Medical benefit.
• Temporary disablement benefit, for
medical leave not less than 4 days,
80% of employee daily wage (RM30-
RM105.33 per day).
• Permanent disablement benefit, 90%
of employee daily wage (RM30-
RM118.50 per day). If disability
assessment is less than 20%, pay
lump sum; otherwise get 1/5 of benefit
in lump sum and the balance is paid
monthly.
• Constant attendance allowance,
RM500 per month.
• Rehabilitation facilities including
physiotherapy, occupational therapy,
reconstruction therapy, supply of
prosthetics, orthotics and
orthopaedics apparatus. Also include
vocational rehabilitation facilities.
• Dependent benefits in case of death.
Widow gets 3/5 of the 90% daily wage
of insured person who passed away
(RM30 -RM118.50/day) for life, and
child gets the remaining 2/5.
• Funeral benefits if insured person
pass away, up to RM2,000.
• Education loan for dependent child of
an insured person who passed away,
at 2%.
• Invalidity pension, if fulfil full qualifying
condition, 50% to 65% of average
monthly wage (minimum RM475); if
fulfil reduced qualifying condition, 50%
of monthly wage (minimum RM475).
• Invalidity grant if not eligible for
invalidity pension, one-time lump sum
payment equivalent to contribution
paid by employee and employer, with
interest.
• Constant attendance allowance,
RM500 per month.
• Rehabilitation facilities (similar to
Employment Injury and Disability
scheme) and dialysis facilities from
chronic renal failure.
• Funeral benefits if insured person
pass away, up to RM2,000.
• Education loan for dependent child of
a pension recipient person who
passed away, at 2%.
• Job search allowance (JSA) as a
replacement income for losing sole
income source, for 3 to 6 months,
based on last income (paid at
staggered rates) and duration of
contribution.
• Reduced income allowance (RIA) as
replacement income for losing
multiple or all income source, 3 to 6
months, based on last income (paid
lump sum).
• Early re-employment allowance
(ERA), incentive for JSA recipients to
return to work, wroth 25% of JSA and
paid lump sum.
• Training fees coverage up to RM4,000
and training allowance of RM10-20
per day, depending on last income.
• Various employment support services
such as career counselling, one-on-
one support, job search and matching
and employability programmes.
Qualifying
conditions
Injury caused by accident while doing
one’s job, commuting accident, accident
during emergency and occupational
disease.
Not attained 60 years when becomes
invalid. If exceed 60 years old, need to
provide additional evidence. Invalidity is
certified by Medical Board of Appellate
Medical Board.
Full qualifying condition: Monthly
contribution paid at least 24 months
within 40 consecutive months prior to the
month of the Invalidity notice, OR
monthly contribution paid for not less
than 2/3 of complete months between
date when contribution first become
payable and Invalidity notice.
Reduced qualifying condition: Monthly
contribution paid for not less than 1/3 of
complete months between date when
contribution first become payable and
Invalidity notice, OR total number of
monthly contributions must be at least
24 months.
Contribute 12 to 15 out of the 24
consecutive months prior to LOE, to
access at least 3 months benefits.
Must fulfil definition of LOE:
• Normal retrenchment.
• Voluntary/Mutual separation schemes.
• Closure of workplace due to natural
disasters.
• Bankruptcy or closure of the business.
• Constructive dismissal.
• Resignation due to sexual harassment
or threats made in the workplace.
• Resignation after being ordered to
perform dangerous duties that are not
within the job scope.
Does not cover:
• Dismissal due to employee
misconduct.
• Voluntary resignation.
• Retirement.
• Expiry of a fixed-term contract or
completion of a project.
Source: SOCSO (n.d.-b), SOCSO (n.d.-c), SOCSO (n.d.-e),
APPENDIX C
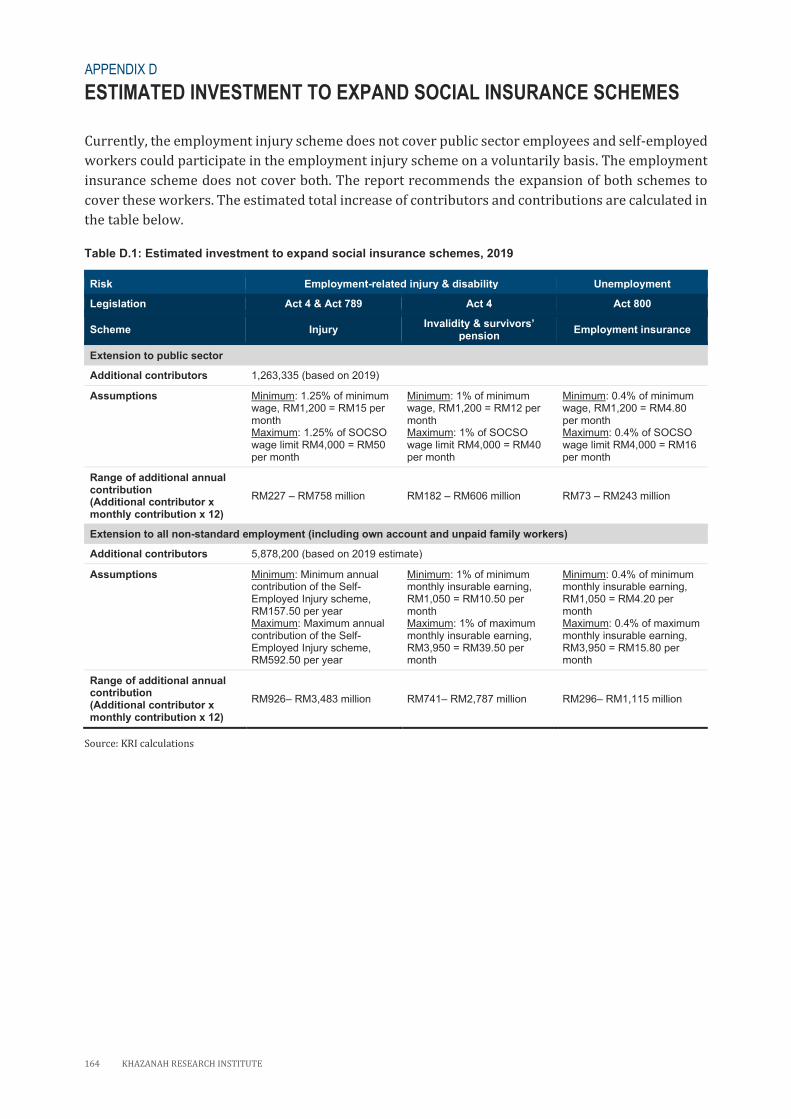
164 KHAZANAH RESEARCH INSTITUTE
APPENDIX D
ESTIMATED INVESTMENT TO EXPAND SOCIAL INSURANCE SCHEMES
Currently, the employment injury scheme does not cover public sector employees and self-employed
workers could participate in the employment injury scheme on a voluntarily basis. The employment
insurance scheme does not cover both. The report recommends the expansion of both schemes to
cover these workers. The estimated total increase of contributors and contributions are calculated in
the table below.
Table D.1: Estimated investment to expand social insurance schemes, 2019
Risk Employment-related injury & disability Unemployment
Legislation Act 4 & Act 789 Act 4 Act 800
Scheme Injury In lidi y & su i o s’
pension Employment insurance
Extension to public sector
Additional contributors 1,263,335 (based on 2019)
Assumptions Minimum: 1.25% of minimum wage, RM1,200 = RM15 per month Maximum: 1.25% of SOCSO wage limit RM4,000 = RM50 per month
Minimum: 1% of minimum wage, RM1,200 = RM12 per month Maximum: 1% of SOCSO wage limit RM4,000 = RM40 per month
Minimum: 0.4% of minimum wage, RM1,200 = RM4.80 per month Maximum: 0.4% of SOCSO wage limit RM4,000 = RM16 per month
Range of additional annual contribution (Additional contributor x monthly contribution x 12)
RM227 – RM758 million RM182 – RM606 million RM73 – RM243 million
Extension to all non-standard employment (including own account and unpaid family workers)
Additional contributors 5,878,200 (based on 2019 estimate)
Assumptions Minimum: Minimum annual contribution of the Self-Employed Injury scheme, RM157.50 per year Maximum: Maximum annual contribution of the Self-Employed Injury scheme, RM592.50 per year
Minimum: 1% of minimum monthly insurable earning, RM1,050 = RM10.50 per month Maximum: 1% of maximum monthly insurable earning, RM3,950 = RM39.50 per month
Minimum: 0.4% of minimum monthly insurable earning, RM1,050 = RM4.20 per month Maximum: 0.4% of maximum monthly insurable earning, RM3,950 = RM15.80 per month
Range of additional annual contribution (Additional contributor x monthly contribution x 12)
RM926– RM3,483 million RM741– RM2,787 million RM296– RM1,115 million
Source: KRI calculations
APPENDIX D
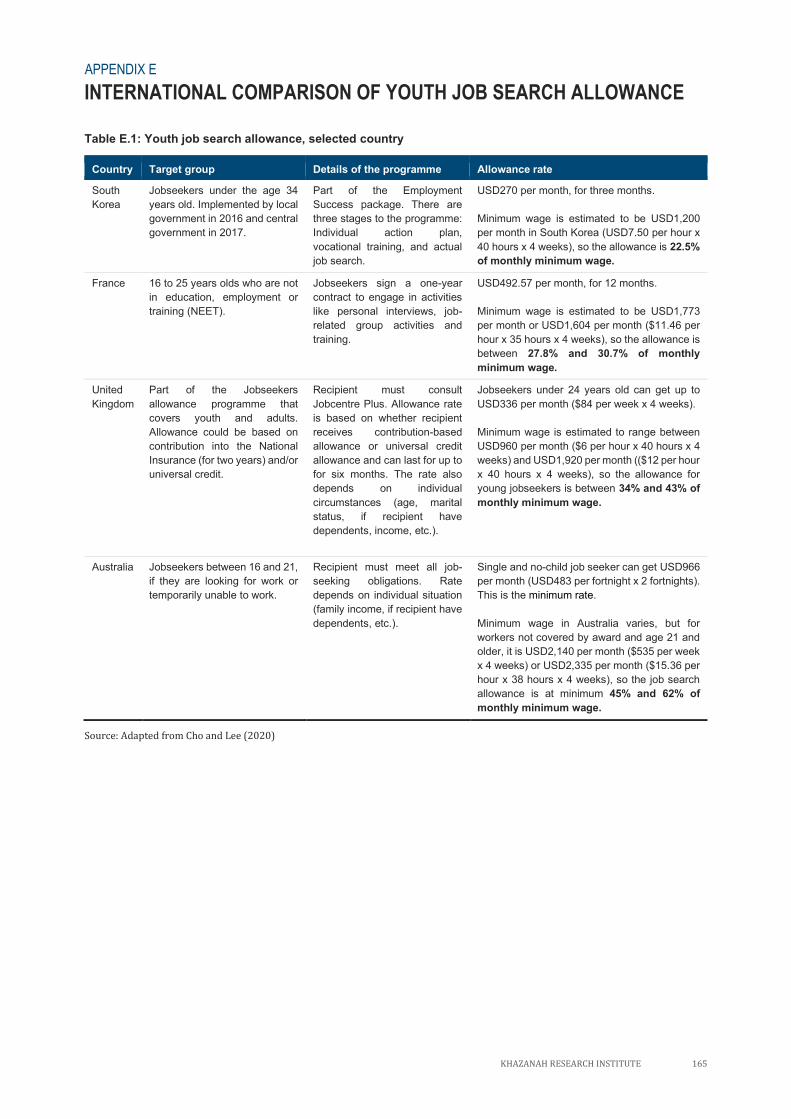
KHAZANAH RESEARCH INSTITUTE 165
APPENDIX E
INTERNATIONAL COMPARISON OF YOUTH JOB SEARCH ALLOWANCE
Table E.1: Youth job search allowance, selected country
Country Target group Details of the programme Allowance rate
South
Korea
Jobseekers under the age 34
years old. Implemented by local
government in 2016 and central
government in 2017.
Part of the Employment
Success package. There are
three stages to the programme:
Individual action plan,
vocational training, and actual
job search.
USD270 per month, for three months.
Minimum wage is estimated to be USD1,200
per month in South Korea (USD7.50 per hour x
40 hours x 4 weeks), so the allowance is 22.5%
of monthly minimum wage.
France 16 to 25 years olds who are not
in education, employment or
training (NEET).
Jobseekers sign a one-year
contract to engage in activities
like personal interviews, job-
related group activities and
training.
USD492.57 per month, for 12 months.
Minimum wage is estimated to be USD1,773
per month or USD1,604 per month ($11.46 per
hour x 35 hours x 4 weeks), so the allowance is
between 27.8% and 30.7% of monthly
minimum wage.
United
Kingdom
Part of the Jobseekers
allowance programme that
covers youth and adults.
Allowance could be based on
contribution into the National
Insurance (for two years) and/or
universal credit.
Recipient must consult
Jobcentre Plus. Allowance rate
is based on whether recipient
receives contribution-based
allowance or universal credit
allowance and can last for up to
for six months. The rate also
depends on individual
circumstances (age, marital
status, if recipient have
dependents, income, etc.).
Jobseekers under 24 years old can get up to
USD336 per month ($84 per week x 4 weeks).
Minimum wage is estimated to range between
USD960 per month ($6 per hour x 40 hours x 4
weeks) and USD1,920 per month (($12 per hour
x 40 hours x 4 weeks), so the allowance for
young jobseekers is between 34% and 43% of
monthly minimum wage.
Australia Jobseekers between 16 and 21,
if they are looking for work or
temporarily unable to work.
Recipient must meet all job-
seeking obligations. Rate
depends on individual situation
(family income, if recipient have
dependents, etc.).
Single and no-child job seeker can get USD966
per month (USD483 per fortnight x 2 fortnights).
This is the minimum rate.
Minimum wage in Australia varies, but for
workers not covered by award and age 21 and
older, it is USD2,140 per month ($535 per week
x 4 weeks) or USD2,335 per month ($15.36 per
hour x 38 hours x 4 weeks), so the job search
allowance is at minimum 45% and 62% of
monthly minimum wage.
Source: Adapted from Cho and Lee (2020)
APPENDIX E
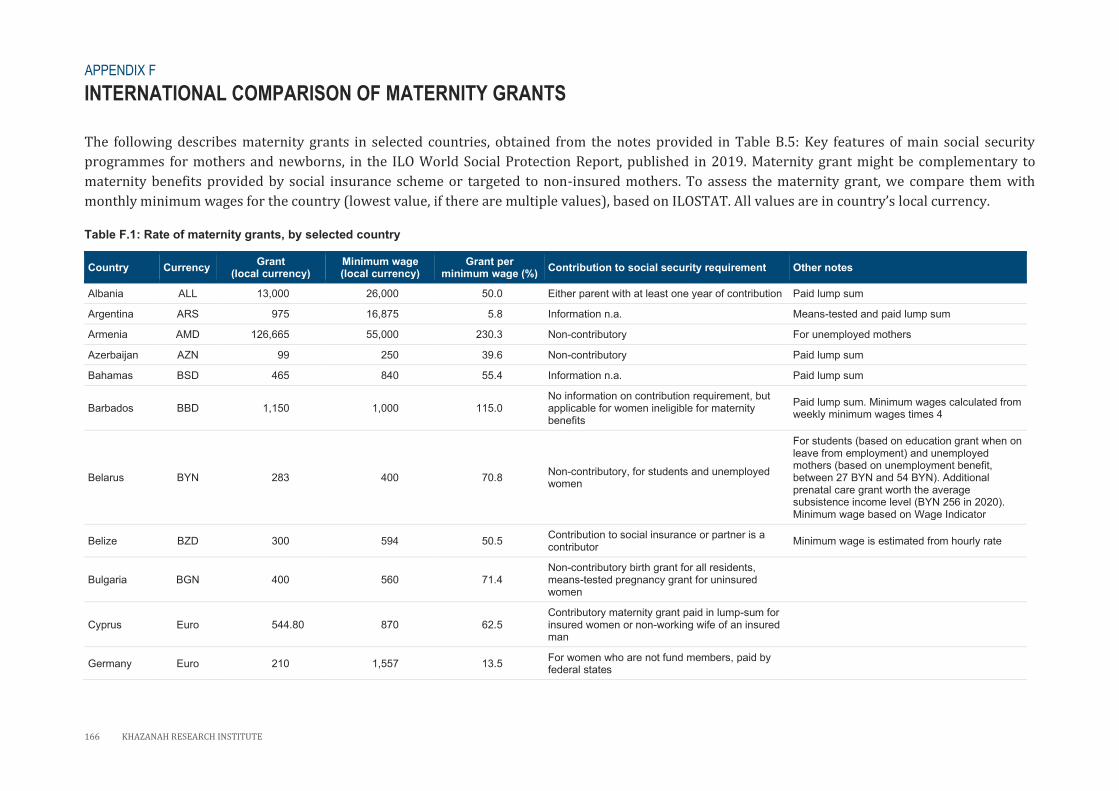
166 KHAZANAH RESEARCH INSTITUTE
APPENDIX F
INTERNATIONAL COMPARISON OF MATERNITY GRANTS
The following describes maternity grants in selected countries, obtained from the notes provided in Table B.5: Key features of main social security
programmes for mothers and newborns, in the ILO World Social Protection Report, published in 2019. Maternity grant might be complementary to
maternity benefits provided by social insurance scheme or targeted to non-insured mothers. To assess the maternity grant, we compare them with
monthly minimum wages for the country (lowest value, if there are multiple values), based on ILOSTAT. All values are in country’s local currency.
Table F.1: Rate of maternity grants, by selected country
Country Currency Grant
(local currency) Minimum wage (local currency)
Grant per minimum wage (%)
Contribution to social security requirement Other notes
Albania ALL 13,000 26,000 50.0 Either parent with at least one year of contribution Paid lump sum
Argentina ARS 975 16,875 5.8 Information n.a. Means-tested and paid lump sum
Armenia AMD 126,665 55,000 230.3 Non-contributory For unemployed mothers
Azerbaijan AZN 99 250 39.6 Non-contributory Paid lump sum
Bahamas BSD 465 840 55.4 Information n.a. Paid lump sum
Barbados BBD 1,150 1,000 115.0 No information on contribution requirement, but applicable for women ineligible for maternity benefits
Paid lump sum. Minimum wages calculated from weekly minimum wages times 4
Belarus BYN 283 400 70.8 Non-contributory, for students and unemployed women
For students (based on education grant when on leave from employment) and unemployed mothers (based on unemployment benefit, between 27 BYN and 54 BYN). Additional prenatal care grant worth the average subsistence income level (BYN 256 in 2020). Minimum wage based on Wage Indicator
Belize BZD 300 594 50.5 Contribution to social insurance or partner is a contributor
Minimum wage is estimated from hourly rate
Bulgaria BGN 400 560 71.4 Non-contributory birth grant for all residents, means-tested pregnancy grant for uninsured women
Cyprus Euro 544.80 870 62.5 Contributory maternity grant paid in lump-sum for insured women or non-working wife of an insured man
Germany Euro 210 1,557 13.5 For women who are not fund members, paid by federal states
APPENDIX F
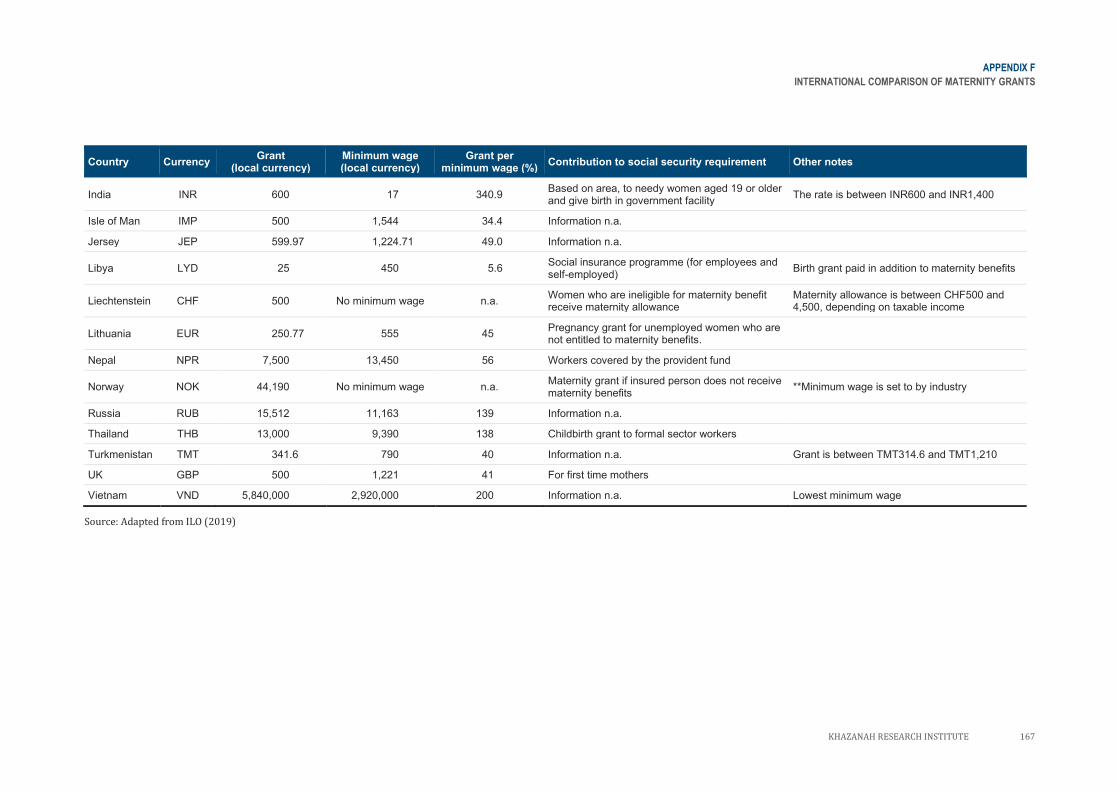
APPENDIX F
INTERNATIONAL COMPARISON OF MATERNITY GRANTS
KHAZANAH RESEARCH INSTITUTE 167
Country Currency Grant
(local currency) Minimum wage (local currency)
Grant per minimum wage (%)
Contribution to social security requirement Other notes
India INR 600 17 340.9 Based on area, to needy women aged 19 or older and give birth in government facility
The rate is between INR600 and INR1,400
Isle of Man IMP 500 1,544 34.4 Information n.a.
Jersey JEP 599.97 1,224.71 49.0 Information n.a.
Libya LYD 25 450 5.6 Social insurance programme (for employees and self-employed)
Birth grant paid in addition to maternity benefits
Liechtenstein CHF 500 No minimum wage n.a. Women who are ineligible for maternity benefit receive maternity allowance
Maternity allowance is between CHF500 and 4,500, depending on taxable income
Lithuania EUR 250.77 555 45 Pregnancy grant for unemployed women who are not entitled to maternity benefits.
Nepal NPR 7,500 13,450 56 Workers covered by the provident fund
Norway NOK 44,190 No minimum wage n.a. Maternity grant if insured person does not receive maternity benefits
**Minimum wage is set to by industry
Russia RUB 15,512 11,163 139 Information n.a.
Thailand THB 13,000 9,390 138 Childbirth grant to formal sector workers
Turkmenistan TMT 341.6 790 40 Information n.a. Grant is between TMT314.6 and TMT1,210
UK GBP 500 1,221 41 For first time mothers
Vietnam VND 5,840,000 2,920,000 200 Information n.a. Lowest minimum wage
Source: Adapted from ILO (2019)
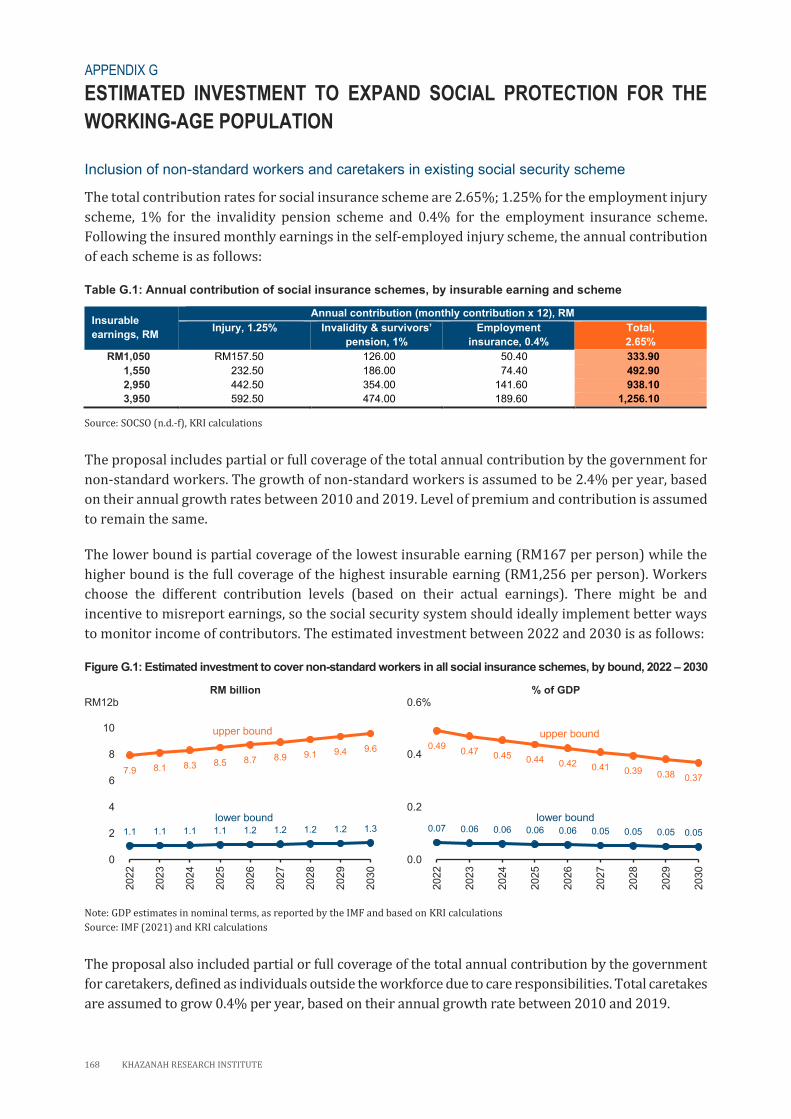
168 KHAZANAH RESEARCH INSTITUTE
APPENDIX G
ESTIMATED INVESTMENT TO EXPAND SOCIAL PROTECTION FOR THE
WORKING-AGE POPULATION
Inclusion of non-standard workers and caretakers in existing social security scheme
The total contribution rates for social insurance scheme are 2.65%; 1.25% for the employment injury
scheme, 1% for the invalidity pension scheme and 0.4% for the employment insurance scheme.
Following the insured monthly earnings in the self-employed injury scheme, the annual contribution
of each scheme is as follows:
Table G.1: Annual contribution of social insurance schemes, by insurable earning and scheme
Insurable
earnings, RM
Annual contribution (monthly contribution x 12), RM
Injury, 1.25% In lidi y & su i o s’
pension, 1%
Employment
insurance, 0.4%
Total,
2.65%
RM1,050 RM157.50 126.00 50.40 333.90
1,550 232.50 186.00 74.40 492.90
2,950 442.50 354.00 141.60 938.10
3,950 592.50 474.00 189.60 1,256.10
Source: SOCSO (n.d.-f), KRI calculations
The proposal includes partial or full coverage of the total annual contribution by the government for
non-standard workers. The growth of non-standard workers is assumed to be 2.4% per year, based
on their annual growth rates between 2010 and 2019. Level of premium and contribution is assumed
to remain the same.
The lower bound is partial coverage of the lowest insurable earning (RM167 per person) while the
higher bound is the full coverage of the highest insurable earning (RM1,256 per person). Workers
choose the different contribution levels (based on their actual earnings). There might be and
incentive to misreport earnings, so the social security system should ideally implement better ways
to monitor income of contributors. The estimated investment between 2022 and 2030 is as follows:
Figure G.1: Estimated investment to cover non-standard workers in all social insurance schemes, by bound, 2022 – 2030
RM billion % of GDP
Note: GDP estimates in nominal terms, as reported by the IMF and based on KRI calculations
Source: IMF (2021) and KRI calculations
The proposal also included partial or full coverage of the total annual contribution by the government
for caretakers, defined as individuals outside the workforce due to care responsibilities. Total caretakes
are assumed to grow 0.4% per year, based on their annual growth rate between 2010 and 2019.
1.1 1.1 1.1 1.1 1.2 1.2 1.2 1.2 1.3
7.9 8.1 8.3 8.5 8.7 8.9 9.1 9.4 9.6
0
2
4
6
8
10
12
2022
2023
2024
2025
2026
2027
2028
2029
2030
RM12b
upper bound
lower bound0.07 0.06 0.06 0.06 0.06 0.05 0.05 0.05 0.05
0.490.47 0.45 0.44 0.42 0.41 0.39 0.38 0.37
0.0
0.2
0.4
0.6
2022
2023
2024
2025
2026
2027
2028
2029
2030
upper bound
lower bound
0.6%
APPENDIX G
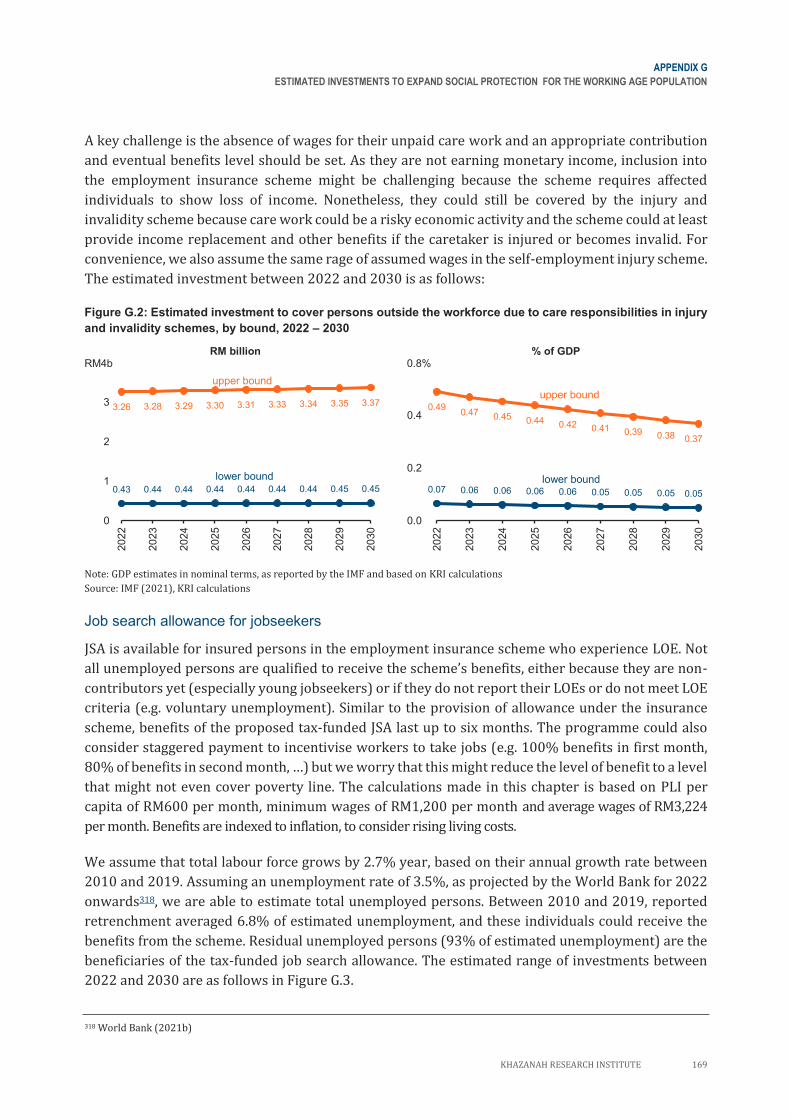
APPENDIX G
ESTIMATED INVESTMENTS TO EXPAND SOCIAL PROTECTION FOR THE WORKING AGE POPULATION
KHAZANAH RESEARCH INSTITUTE 169
A key challenge is the absence of wages for their unpaid care work and an appropriate contribution
and eventual benefits level should be set. As they are not earning monetary income, inclusion into
the employment insurance scheme might be challenging because the scheme requires affected
individuals to show loss of income. Nonetheless, they could still be covered by the injury and
invalidity scheme because care work could be a risky economic activity and the scheme could at least
provide income replacement and other benefits if the caretaker is injured or becomes invalid. For
convenience, we also assume the same rage of assumed wages in the self-employment injury scheme.
The estimated investment between 2022 and 2030 is as follows:
Figure G.2: Estimated investment to cover persons outside the workforce due to care responsibilities in injury
and invalidity schemes, by bound, 2022 – 2030
RM billion % of GDP
Note: GDP estimates in nominal terms, as reported by the IMF and based on KRI calculations
Source: IMF (2021), KRI calculations
Job search allowance for jobseekers
JSA is available for insured persons in the employment insurance scheme who experience LOE. Not
all unemployed persons are qualified to receive the scheme’s benefits, either because they are non-
contributors yet (especially young jobseekers) or if they do not report their LOEs or do not meet LOE
criteria (e.g. voluntary unemployment). Similar to the provision of allowance under the insurance
scheme, benefits of the proposed tax-funded JSA last up to six months. The programme could also
consider staggered payment to incentivise workers to take jobs (e.g. 100% benefits in first month,
80% of benefits in second month, …) but we worry that this might reduce the level of benefit to a level
that might not even cover poverty line. The calculations made in this chapter is based on PLI per
capita of RM600 per month, minimum wages of RM1,200 per month and average wages of RM3,224
per month. Benefits are indexed to inflation, to consider rising living costs.
We assume that total labour force grows by 2.7% year, based on their annual growth rate between
2010 and 2019. Assuming an unemployment rate of 3.5%, as projected by the World Bank for 2022
onwards318, we are able to estimate total unemployed persons. Between 2010 and 2019, reported
retrenchment averaged 6.8% of estimated unemployment, and these individuals could receive the
benefits from the scheme. Residual unemployed persons (93% of estimated unemployment) are the
beneficiaries of the tax-funded job search allowance. The estimated range of investments between
2022 and 2030 are as follows in Figure G.3.
318 World Bank (2021b)
0.43 0.44 0.44 0.44 0.44 0.44 0.44 0.45 0.45
3.26 3.28 3.29 3.30 3.31 3.33 3.34 3.35 3.37
0
1
2
3
4
2022
2023
2024
2025
2026
2027
2028
2029
2030
RM4b
upper bound
lower bound
0.07 0.06 0.06 0.06 0.06 0.05 0.05 0.05 0.05
0.490.47 0.45 0.44 0.42 0.41 0.39 0.38 0.37
0.0
0.2
0.4
0.6
2022
2023
2024
2025
2026
2027
2028
2029
2030
upper bound
lower bound
0.8%
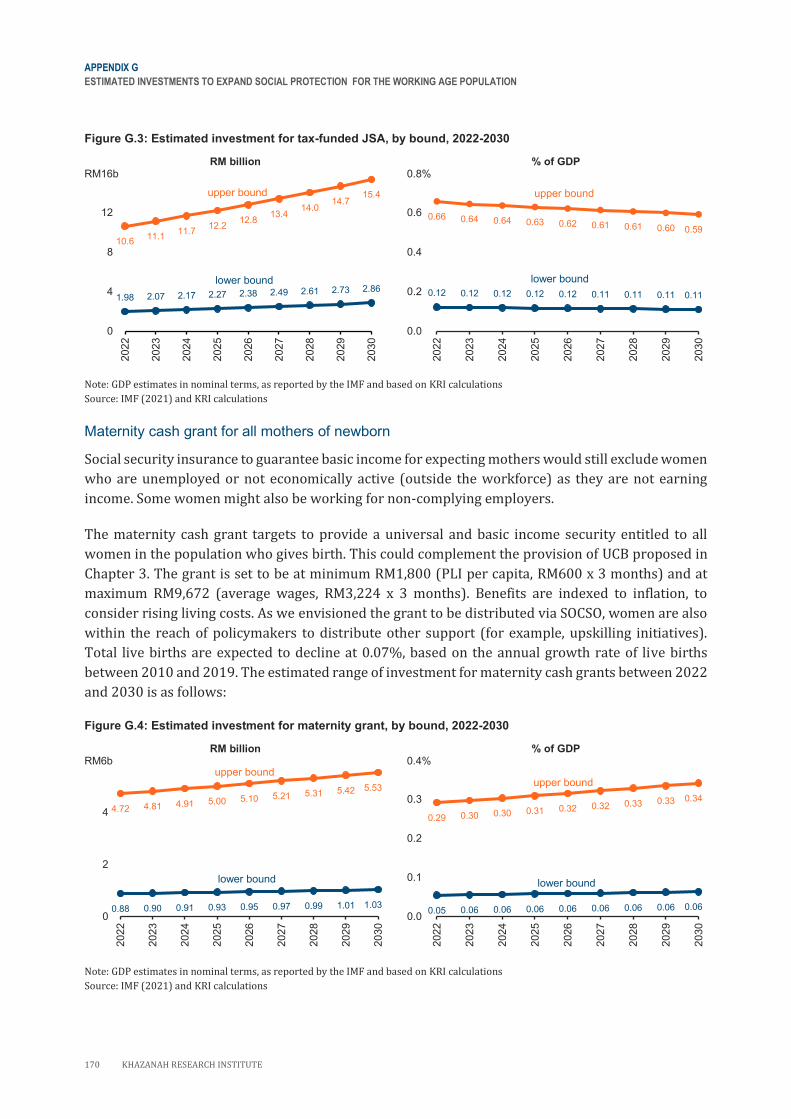
APPENDIX G
ESTIMATED INVESTMENTS TO EXPAND SOCIAL PROTECTION FOR THE WORKING AGE POPULATION
170 KHAZANAH RESEARCH INSTITUTE
Figure G.3: Estimated investment for tax-funded JSA, by bound, 2022-2030
RM billion % of GDP
Note: GDP estimates in nominal terms, as reported by the IMF and based on KRI calculations
Source: IMF (2021) and KRI calculations
Maternity cash grant for all mothers of newborn
Social security insurance to guarantee basic income for expecting mothers would still exclude women
who are unemployed or not economically active (outside the workforce) as they are not earning
income. Some women might also be working for non-complying employers.
The maternity cash grant targets to provide a universal and basic income security entitled to all
women in the population who gives birth. This could complement the provision of UCB proposed in
Chapter 3. The grant is set to be at minimum RM1,800 (PLI per capita, RM600 x 3 months) and at
maximum RM9,672 (average wages, RM3,224 x 3 months). Benefits are indexed to inflation, to
consider rising living costs. As we envisioned the grant to be distributed via SOCSO, women are also
within the reach of policymakers to distribute other support (for example, upskilling initiatives).
Total live births are expected to decline at 0.07%, based on the annual growth rate of live births
between 2010 and 2019. The estimated range of investment for maternity cash grants between 2022
and 2030 is as follows:
Figure G.4: Estimated investment for maternity grant, by bound, 2022-2030
RM billion % of GDP
Note: GDP estimates in nominal terms, as reported by the IMF and based on KRI calculations
Source: IMF (2021) and KRI calculations
1.98 2.07 2.17 2.27 2.38 2.49 2.61 2.73 2.86
10.611.1
11.712.2
12.813.4
14.014.7
15.4
0
4
8
12
16
2022
2023
2024
2025
2026
2027
2028
2029
2030
RM16b
upper bound
lower bound0.12 0.12 0.12 0.12 0.12 0.11 0.11 0.11 0.11
0.66 0.64 0.64 0.63 0.62 0.61 0.61 0.60 0.59
0.0
0.2
0.4
0.6
0.8
2022
2023
2024
2025
2026
2027
2028
2029
2030
0.8%
upper bound
lower bound
0.88 0.90 0.91 0.93 0.95 0.97 0.99 1.01 1.03
4.72 4.81 4.91 5.00 5.10 5.21 5.31 5.42 5.53
0
2
4
6
2022
2023
2024
2025
2026
2027
2028
2029
2030
RM6bupper bound
lower bound
0.05 0.06 0.06 0.06 0.06 0.06 0.06 0.06 0.06
0.29 0.30 0.30 0.31 0.32 0.32 0.33 0.33 0.34
0.0
0.1
0.2
0.3
0.4
2022
2023
2024
2025
2026
2027
2028
2029
2030
upper bound
lower bound
0.4%
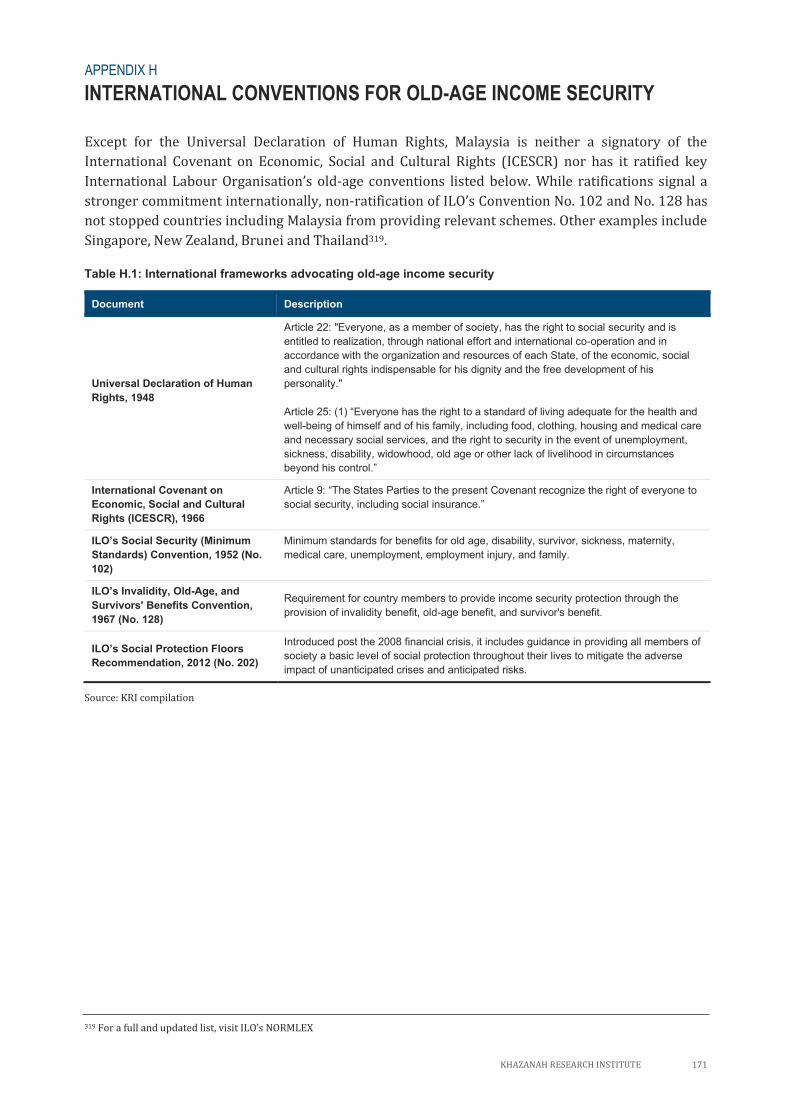
KHAZANAH RESEARCH INSTITUTE 171
APPENDIX H
INTERNATIONAL CONVENTIONS FOR OLD-AGE INCOME SECURITY
Except for the Universal Declaration of Human Rights, Malaysia is neither a signatory of the
International Covenant on Economic, Social and Cultural Rights (ICESCR) nor has it ratified key
International Labour Organisation’s old-age conventions listed below. While ratifications signal a
stronger commitment internationally, non-ratification of ILO’s Convention No. 102 and No. 128 has
not stopped countries including Malaysia from providing relevant schemes. Other examples include
Singapore, New Zealand, Brunei and Thailand319.
Table H.1: International frameworks advocating old-age income security
Document Description
Universal Declaration of Human
Rights, 1948
Article 22: "Everyone, as a member of society, has the right to social security and is
entitled to realization, through national effort and international co-operation and in
accordance with the organization and resources of each State, of the economic, social
and cultural rights indispensable for his dignity and the free development of his
personality."
Article 25: (1) “Everyone has the right to a standard of living adequate for the health and
well-being of himself and of his family, including food, clothing, housing and medical care
and necessary social services, and the right to security in the event of unemployment,
sickness, disability, widowhood, old age or other lack of livelihood in circumstances
beyond his control.”
International Covenant on
Economic, Social and Cultural
Rights (ICESCR), 1966
Article 9: “The States arties to the present Covenant recognize the right of everyone to
social security, including social insurance.”
ILO’s Soci l Secu i y ( inimum
Standards) Convention, 1952 (No.
102)
Minimum standards for benefits for old age, disability, survivor, sickness, maternity,
medical care, unemployment, employment injury, and family.
ILO’s In lidi y, Old-Age, and
Survivors' Benefits Convention,
1967 (No. 128)
Requirement for country members to provide income security protection through the
provision of invalidity benefit, old-age benefit, and survivor's benefit.
ILO’s Soci l P o ec ion Floo s
Recommendation, 2012 (No. 202)
Introduced post the 2008 financial crisis, it includes guidance in providing all members of
society a basic level of social protection throughout their lives to mitigate the adverse
impact of unanticipated crises and anticipated risks.
Source: KRI compilation
319 For a full and updated list, visit ILO’s NORMLEX
APPENDIX H
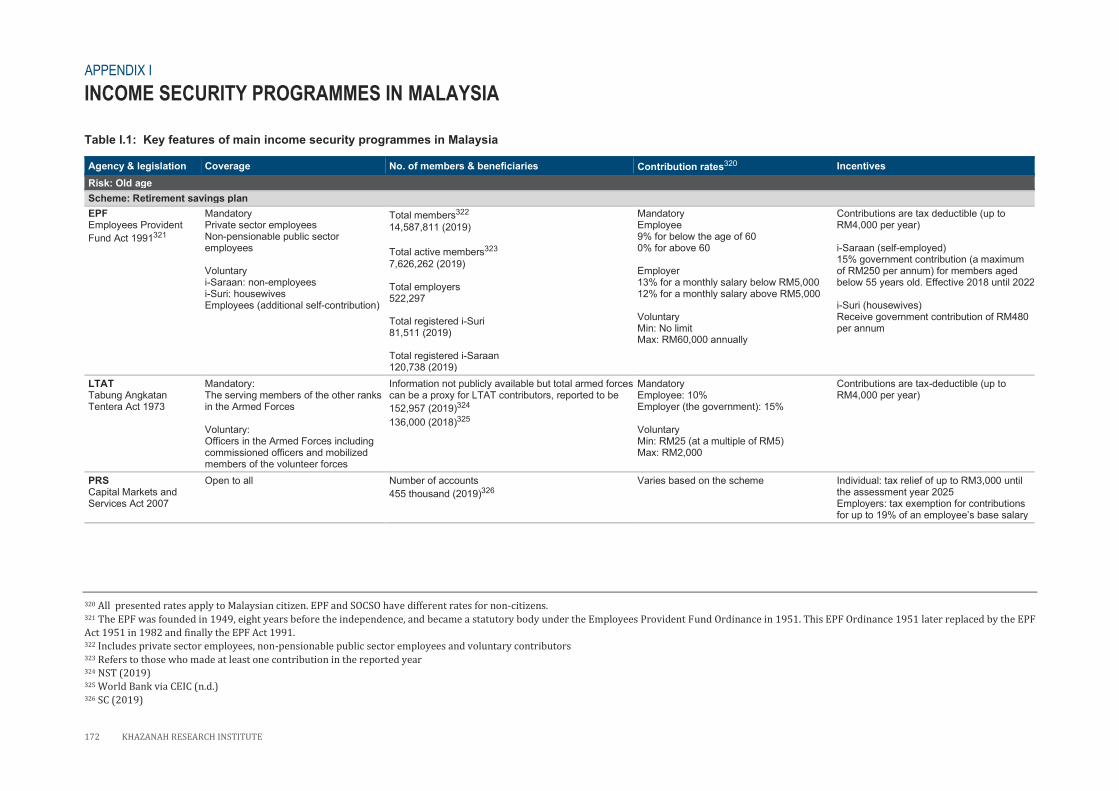
172 KHAZANAH RESEARCH INSTITUTE
APPENDIX I
INCOME SECURITY PROGRAMMES IN MALAYSIA
Table I.1: Key features of main income security programmes in Malaysia
Agency & legislation Coverage No. of members & beneficiaries Contribution rates320 Incentives
Risk: Old age
Scheme: Retirement savings plan
EPF Employees Provident
Fund Act 1991321
Mandatory Private sector employees Non-pensionable public sector employees Voluntary i-Saraan: non-employees i-Suri: housewives Employees (additional self-contribution)
Total members322
14,587,811 (2019)
Total active members323
7,626,262 (2019) Total employers 522,297 Total registered i-Suri 81,511 (2019) Total registered i-Saraan 120,738 (2019)
Mandatory Employee 9% for below the age of 60 0% for above 60 Employer 13% for a monthly salary below RM5,000 12% for a monthly salary above RM5,000 Voluntary Min: No limit Max: RM60,000 annually
Contributions are tax deductible (up to RM4,000 per year) i-Saraan (self-employed) 15% government contribution (a maximum of RM250 per annum) for members aged below 55 years old. Effective 2018 until 2022 i-Suri (housewives) Receive government contribution of RM480 per annum
LTAT Tabung Angkatan Tentera Act 1973
Mandatory: The serving members of the other ranks in the Armed Forces Voluntary: Officers in the Armed Forces including commissioned officers and mobilized members of the volunteer forces
Information not publicly available but total armed forces can be a proxy for LTAT contributors, reported to be
152,957 (2019)324
136,000 (2018)325
Mandatory Employee: 10% Employer (the government): 15% Voluntary Min: RM25 (at a multiple of RM5) Max: RM2,000
Contributions are tax-deductible (up to RM4,000 per year)
PRS Capital Markets and Services Act 2007
Open to all
Number of accounts
455 thousand (2019)326
Varies based on the scheme Individual: tax relief of up to RM3,000 until the assessment year 2025 Employers: tax exemption for contributions for up to 19 of an employee’s base salary
320 All presented rates apply to Malaysian citizen. EPF and SOCSO have different rates for non-citizens. 321 The EPF was founded in 1949, eight years before the independence, and became a statutory body under the Employees Provident Fund Ordinance in 1951. This EPF Ordinance 1951 later replaced by the EPF
Act 1951 in 1982 and finally the EPF Act 1991. 322 Includes private sector employees, non-pensionable public sector employees and voluntary contributors 323 Refers to those who made at least one contribution in the reported year 324 NST (2019) 325 World Bank via CEIC (n.d.) 326 SC (2019)
APPENDIX I
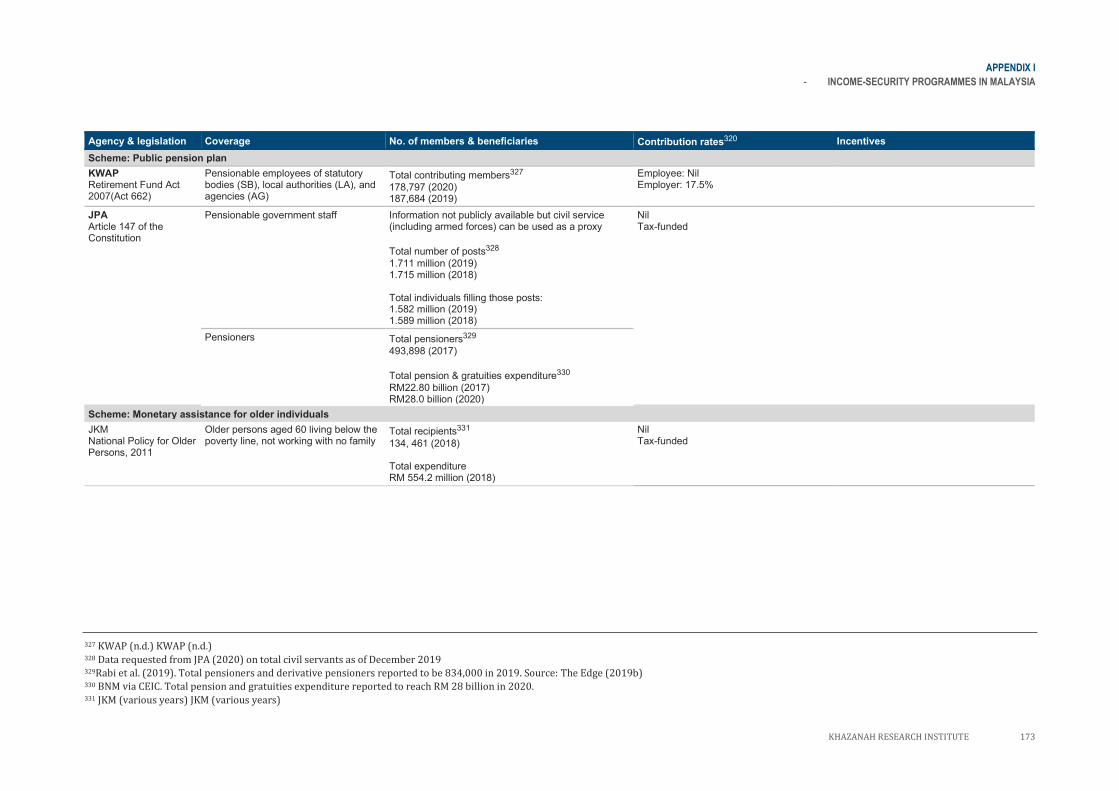
APPENDIX I
- INCOME-SECURITY PROGRAMMES IN MALAYSIA
KHAZANAH RESEARCH INSTITUTE 173
Agency & legislation Coverage No. of members & beneficiaries Contribution rates320 Incentives
Scheme: Public pension plan
KWAP Retirement Fund Act 2007(Act 662)
Pensionable employees of statutory bodies (SB), local authorities (LA), and agencies (AG)
Total contributing members327
178,797 (2020) 187,684 (2019)
Employee: Nil Employer: 17.5%
JPA Article 147 of the Constitution
Pensionable government staff Information not publicly available but civil service (including armed forces) can be used as a proxy
Total number of posts328
1.711 million (2019) 1.715 million (2018) Total individuals filling those posts: 1.582 million (2019) 1.589 million (2018)
Nil Tax-funded
Pensioners Total pensioners329
493,898 (2017)
Total pension & gratuities expenditure330
RM22.80 billion (2017) RM28.0 billion (2020)
Scheme: Monetary assistance for older individuals
JKM National Policy for Older Persons, 2011
Older persons aged 60 living below the poverty line, not working with no family
Total recipients331
134, 461 (2018) Total expenditure RM 554.2 million (2018)
Nil Tax-funded
327 KWAP (n.d.) KWAP (n.d.) 328 Data requested from JPA (2020) on total civil servants as of December 2019 329Rabi et al. (2019). Total pensioners and derivative pensioners reported to be 834,000 in 2019. Source: The Edge (2019b) 330 BNM via CEIC. Total pension and gratuities expenditure reported to reach RM 28 billion in 2020. 331 JKM (various years) JKM (various years)
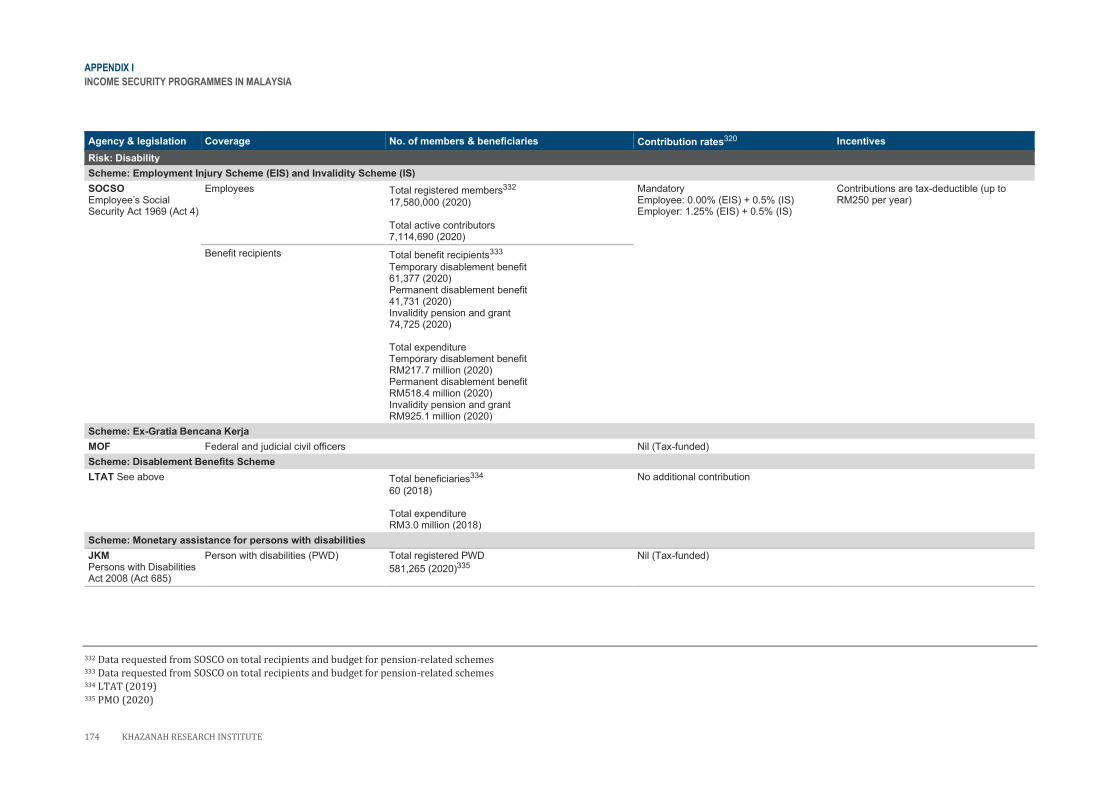
APPENDIX I
INCOME SECURITY PROGRAMMES IN MALAYSIA
174 KHAZANAH RESEARCH INSTITUTE
Agency & legislation Coverage No. of members & beneficiaries Contribution rates320 Incentives
Risk: Disability
Scheme: Employment Injury Scheme (EIS) and Invalidity Scheme (IS)
SOCSO Employee’s Social Security Act 1969 (Act 4)
Employees Total registered members332
17,580,000 (2020) Total active contributors 7,114,690 (2020)
Mandatory Employee: 0.00% (EIS) + 0.5% (IS) Employer: 1.25% (EIS) + 0.5% (IS)
Contributions are tax-deductible (up to RM250 per year)
Benefit recipients Total benefit recipients333
Temporary disablement benefit 61,377 (2020) Permanent disablement benefit 41,731 (2020) Invalidity pension and grant 74,725 (2020) Total expenditure Temporary disablement benefit RM217.7 million (2020) Permanent disablement benefit RM518.4 million (2020) Invalidity pension and grant RM925.1 million (2020)
Scheme: Ex-Gratia Bencana Kerja
MOF Federal and judicial civil officers Nil (Tax-funded)
Scheme: Disablement Benefits Scheme
LTAT See above Total beneficiaries334
60 (2018) Total expenditure RM3.0 million (2018)
No additional contribution
Scheme: Monetary assistance for persons with disabilities
JKM Persons with Disabilities Act 2008 (Act 685)
Person with disabilities (PWD)
Total registered PWD
581,265 (2020)335
Nil (Tax-funded)
332 Data requested from SOSCO on total recipients and budget for pension-related schemes 333 Data requested from SOSCO on total recipients and budget for pension-related schemes 334 LTAT (2019) 335 PMO (2020)
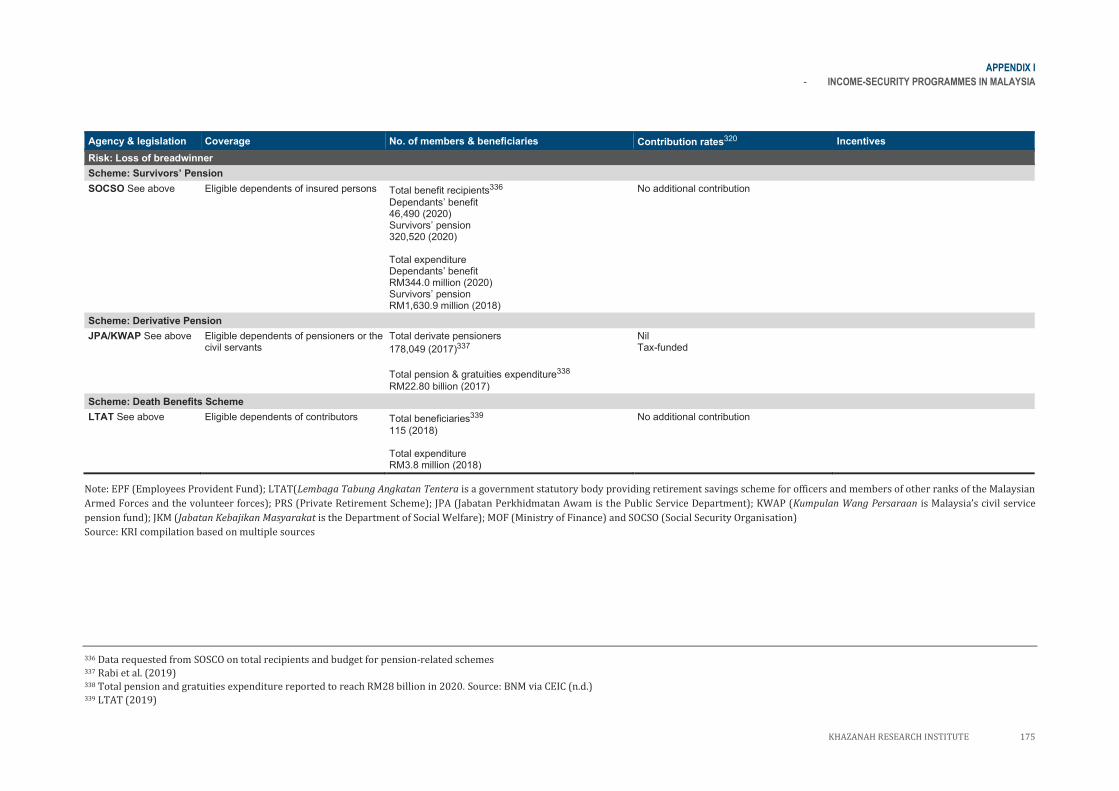
APPENDIX I
- INCOME-SECURITY PROGRAMMES IN MALAYSIA
KHAZANAH RESEARCH INSTITUTE 175
Agency & legislation Coverage No. of members & beneficiaries Contribution rates320 Incentives
Risk: Loss of breadwinner
Scheme: Su i o s’ Pension
SOCSO See above Eligible dependents of insured persons Total benefit recipients336
Dependants’ benefit 46,490 (2020) Survivors’ pension 320,520 (2020) Total expenditure Dependants’ benefit RM344.0 million (2020) Survivors’ pension RM1,630.9 million (2018)
No additional contribution
Scheme: Derivative Pension
JPA/KWAP See above Eligible dependents of pensioners or the civil servants
Total derivate pensioners
178,049 (2017)337
Total pension & gratuities expenditure338
RM22.80 billion (2017)
Nil Tax-funded
Scheme: Death Benefits Scheme
LTAT See above Eligible dependents of contributors Total beneficiaries339
115 (2018) Total expenditure RM3.8 million (2018)
No additional contribution
Note: EPF (Employees Provident Fund); LTAT(Lembaga Tabung Angkatan Tentera is a government statutory body providing retirement savings scheme for officers and members of other ranks of the Malaysian
Armed Forces and the volunteer forces); PRS (Private Retirement Scheme); JPA (Jabatan Perkhidmatan Awam is the Public Service Department); KWAP (Kumpulan Wang Persaraan is Malaysia’s civil service
pension fund); JKM (Jabatan Kebajikan Masyarakat is the Department of Social Welfare); MOF (Ministry of Finance) and SOCSO (Social Security Organisation)
Source: KRI compilation based on multiple sources
336 Data requested from SOSCO on total recipients and budget for pension-related schemes 337 Rabi et al. (2019) 338 Total pension and gratuities expenditure reported to reach RM28 billion in 2020. Source: BNM via CEIC (n.d.) 339 LTAT (2019)
176 KHAZANAH RESEARCH INSTITUTE
APPENDIX J
STIMULATED HYPOTHETICAL EPF RETIREMENT SAVINGS
In the absence of longitudinal data, we stimulate hypothetical members to calculate the expected
accumulated EPF savings of individuals with different characteristics and circumstances340. 576
hypothetical members were created from 192 profiles341 with three life trajectories (steady
employment income; steady employment income with pre-retirement withdrawals; and disrupted
employment income with pre-retirement withdrawals). Key features of the profiles are outlined in
Table J.1.
For simplicity, we only use the Third Contribution Schedule, released for January 2019 to March
2020, to calculate monthly contributions. Following the Schedule, different contribution rates are
applied for different wages (above and below RM5,000) and age (below and above the age of 60). All
account holders are citizens, entering the labour force for the first time in 2018. They are assumed to
experience a linear wage growth of 5% per the compounded annual growth rate of salaries and wages
for 2010 to 2019. Pay rise and bonus considerations are excluded. A constant 5% dividend rate was
applied, informed by the most commonly reported EPF dividend rate (mode).
These 576 hypothetical accounts are then placed in four different scenarios: the first to simulate the
status quo; the second to deepen employers’ contribution for low wage earners (progressive
contribution); the third to apply a higher dividend rate to members with lower savings (progressive
dividend); and the fourth to forecast the savings impact for a longer working period (higher minimum
retirement age). For progressive dividends, simple tiered dividends were used (Table J.2). The
savings thresholds and the tiered dividend rates were modified based on the reported savings
distribution, the total dividend payout, and the flat dividend rate.
Individual accumulated savings from each account is then benchmarked against the (inflation
adjusted) EPF Savings Target, the ILO’s pension floor and the ILO’s minimum replacement ratio of
the last drawn salary. The individuals’ results are finally aggregated for each policy scenario for ease
of comparison. The final aggregated results are as captured in Figure 5.9.
340 See Mazlynda Md Yusuf (2012) 341 This is a sum of 12 variations of lifetime employment; 72 variations of career transition from an employee to a self-employed; 72
variations of career transition from a self-employed to an employee; and 36 variations of self-employment. Variations are based on
frequency of EPF contributions (monthly, annually, or dormant) and gender differences in EPF contributions (e.g., women leaving the
labour force because of care work).
APPENDIX J
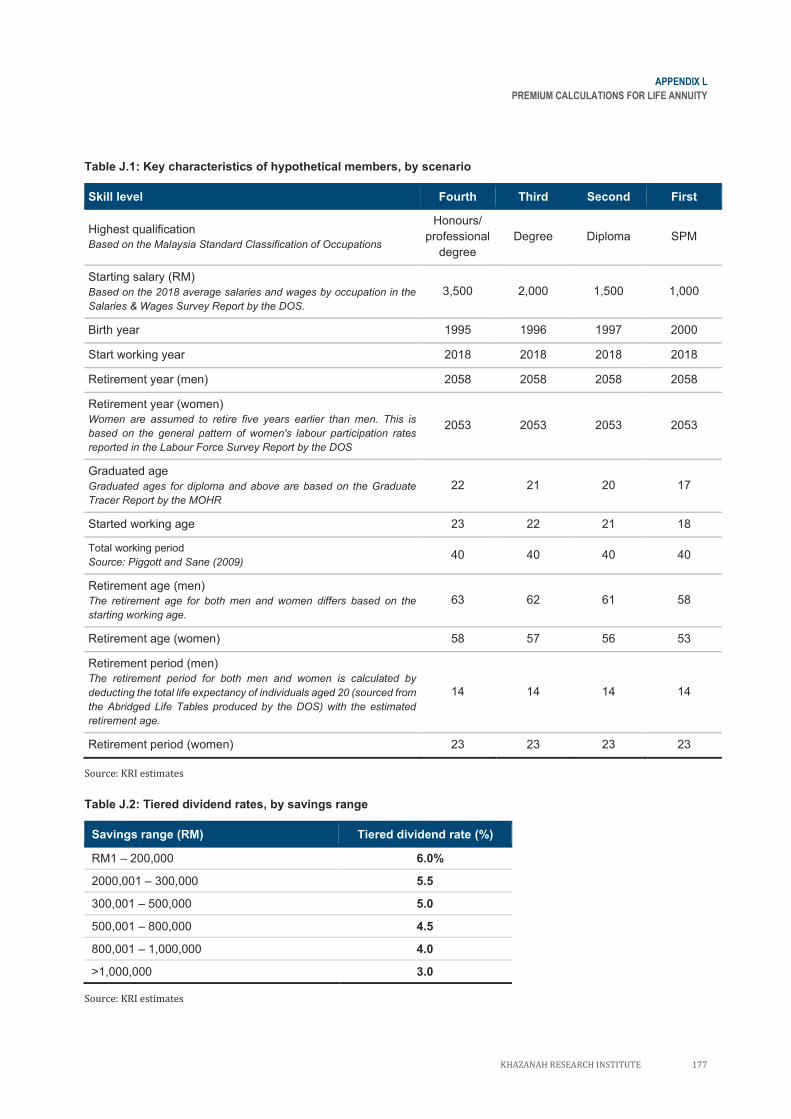
APPENDIX L
PREMIUM CALCULATIONS FOR LIFE ANNUITY
KHAZANAH RESEARCH INSTITUTE 177
Table J.1: Key characteristics of hypothetical members, by scenario
Skill level Fourth Third Second First
Highest qualification
Based on the Malaysia Standard Classification of Occupations
Honours/
professional
degree
Degree Diploma SPM
Starting salary (RM)
Based on the 2018 average salaries and wages by occupation in the
Salaries & Wages Survey Report by the DOS.
3,500 2,000 1,500 1,000
Birth year 1995 1996 1997 2000
Start working year 2018 2018 2018 2018
Retirement year (men) 2058 2058 2058 2058
Retirement year (women)
Women are assumed to retire five years earlier than men. This is
based on the general pattern of women's labour participation rates
reported in the Labour Force Survey Report by the DOS
2053 2053 2053 2053
Graduated age
Graduated ages for diploma and above are based on the Graduate
Tracer Report by the MOHR
22 21 20 17
Started working age 23 22 21 18
Total working period
Source: Piggott and Sane (2009) 40 40 40 40
Retirement age (men)
The retirement age for both men and women differs based on the
starting working age.
63 62 61 58
Retirement age (women) 58 57 56 53
Retirement period (men)
The retirement period for both men and women is calculated by
deducting the total life expectancy of individuals aged 20 (sourced from
the Abridged Life Tables produced by the DOS) with the estimated
retirement age.
14 14 14 14
Retirement period (women) 23 23 23 23
Source: KRI estimates
Table J.2: Tiered dividend rates, by savings range
Savings range (RM) Tiered dividend rate (%)
RM1 – 200,000 6.0%
2000,001 – 300,000 5.5
300,001 – 500,000 5.0
500,001 – 800,000 4.5
800,001 – 1,000,000 4.0
>1,000,000 3.0
Source: KRI estimates
178 KHAZANAH RESEARCH INSTITUTE
APPENDIX K
FORECASTED NOMINAL GROSS DOMESTIC PRODUCT
Forecasted nominal GDPs used in this section are as follow:
• The GDP forecasted figures for 2020 to 2023 are computed based on forecasted GDP growth
from World Bank (2021).
• From 2024 to 2039 GDP figures are based on a 6% nominal GDP growth, following the 6.8%
forecasted nominal growth (assuming 2% inflation rate) by the World Bank for 2023.
• From 2030 onwards, GDP figures are estimated using forecasted population data and
averages of historical annual growth of labour productivity and inflation rate (1960 – 2020).
The framework used is based on a simple growth model where the GDP is proportional to the size of
its working-age population (𝑊𝐴𝑃) and its workers' productivity (𝐿𝑃). Note that this simple
framework does not capture all considerations and risks related to future growth.
The GDP projections here only serve to illustrate the projected required investment as a share of GDP
given the expected shrinking working-age population. It assumes that the labour productivity growth
rate (𝑝) and inflation rate to remain constant over the projection period. For a summary of the
limitations to this simple growth model, see Hubbard and Sharma (2016).
The GDP growth rate forecasts (𝑔) are simplified based on the following logic:
If:
𝐺𝐷𝑃 = 𝐿𝑎𝑏𝑜𝑢𝑟 𝑝𝑟𝑜𝑑𝑢𝑐𝑖𝑡𝑦 × 𝑤𝑜𝑟𝑘𝑖𝑛𝑔 𝑎𝑔𝑒 𝑝𝑜𝑝𝑢𝑙𝑎𝑡𝑖𝑜𝑛 or
𝐺𝐷𝑃 =𝐺𝐷𝑃
𝑊𝐴𝑃× 𝑊𝐴𝑃
at 𝑛 + 1
𝐺𝐷𝑃𝑛 ∗ 𝐺𝐷𝑃 𝑔𝑟𝑜𝑤𝑡ℎ𝑛+1
≈ (𝐿𝑎𝑏𝑜𝑢𝑟 𝑝𝑟𝑜𝑑𝑢𝑐𝑡𝑖𝑣𝑖𝑡𝑦𝑛 ∗ 𝐿𝑃 𝑔𝑟𝑜𝑤𝑡ℎ𝑛+1)
× (𝑊𝑜𝑟𝑘𝑖𝑛𝑔 𝑎𝑔𝑒 𝑝𝑜𝑝𝑢𝑙𝑎𝑡𝑖𝑜𝑛𝑛 ∗ 𝑊𝐴𝑃 𝑔𝑟𝑜𝑤𝑡ℎ𝑛+1)
GDP∗ (1 + 𝑔) ≈ 𝐿𝑃 (1 + 𝑝) × 𝑊𝐴𝑃 (1 + 𝑙)
Therefore
(1 + 𝑔) ≈ 𝐿𝑃 (1 + 𝑝) ∗ 𝑊𝐴𝑃 (1 + 𝑙)
where:
g GDP growth
p Labour productivity growth
l Working age population growth
APPENDIX K
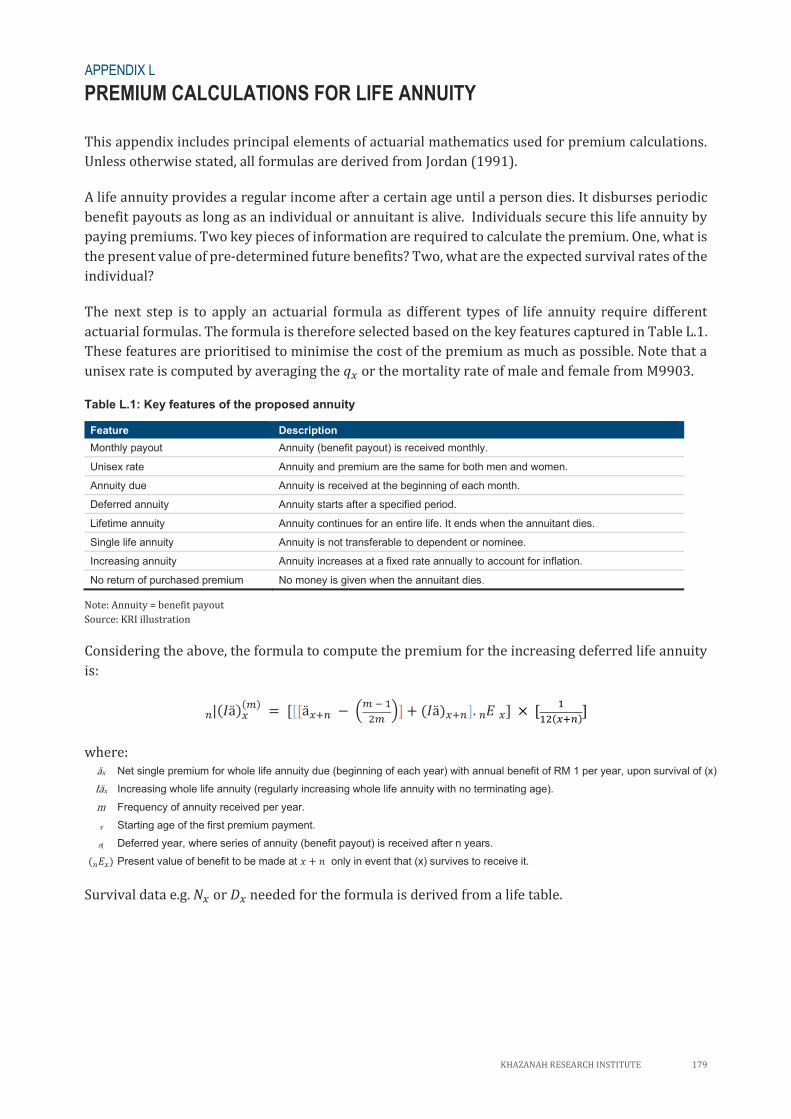
KHAZANAH RESEARCH INSTITUTE 179
APPENDIX L
PREMIUM CALCULATIONS FOR LIFE ANNUITY
This appendix includes principal elements of actuarial mathematics used for premium calculations.
Unless otherwise stated, all formulas are derived from Jordan (1991).
A life annuity provides a regular income after a certain age until a person dies. It disburses periodic
benefit payouts as long as an individual or annuitant is alive. Individuals secure this life annuity by
paying premiums. Two key pieces of information are required to calculate the premium. One, what is
the present value of pre-determined future benefits? Two, what are the expected survival rates of the
individual?
The next step is to apply an actuarial formula as different types of life annuity require different
actuarial formulas. The formula is therefore selected based on the key features captured in Table L.1.
These features are prioritised to minimise the cost of the premium as much as possible. Note that a
unisex rate is computed by averaging the 𝑞𝑥 or the mortality rate of male and female from M9903.
Table L.1: Key features of the proposed annuity
Feature Description
Monthly payout Annuity (benefit payout) is received monthly.
Unisex rate Annuity and premium are the same for both men and women.
Annuity due Annuity is received at the beginning of each month.
Deferred annuity Annuity starts after a specified period.
Lifetime annuity Annuity continues for an entire life. It ends when the annuitant dies.
Single life annuity Annuity is not transferable to dependent or nominee.
Increasing annuity Annuity increases at a fixed rate annually to account for inflation.
No return of purchased premium No money is given when the annuitant dies.
Note: Annuity = benefit payout
Source: KRI illustration
Considering the above, the formula to compute the premium for the increasing deferred life annuity
is:
|𝑛 (𝐼ä)𝑥
(𝑚) = [[[ä𝑥+𝑛 − (
𝑚 − 1
2𝑚)] + (𝐼ä)𝑥+𝑛]. 𝐸𝑛
𝑥] × [1
12(𝑥+𝑛)]
where: äx Net single premium for whole life annuity due (beginning of each year) with annual benefit of RM 1 per year, upon survival of (x)
Iäx Increasing whole life annuity (regularly increasing whole life annuity with no terminating age).
m Frequency of annuity received per year.
x Starting age of the first premium payment.
n| Deferred year, where series of annuity (benefit payout) is received after n years.
(𝑛𝐸𝑥) Present value of benefit to be made at 𝑥 + 𝑛 only in event that (x) survives to receive it.
Survival data e.g. 𝑁𝑥 or 𝐷𝑥 needed for the formula is derived from a life table.
APPENDIX L
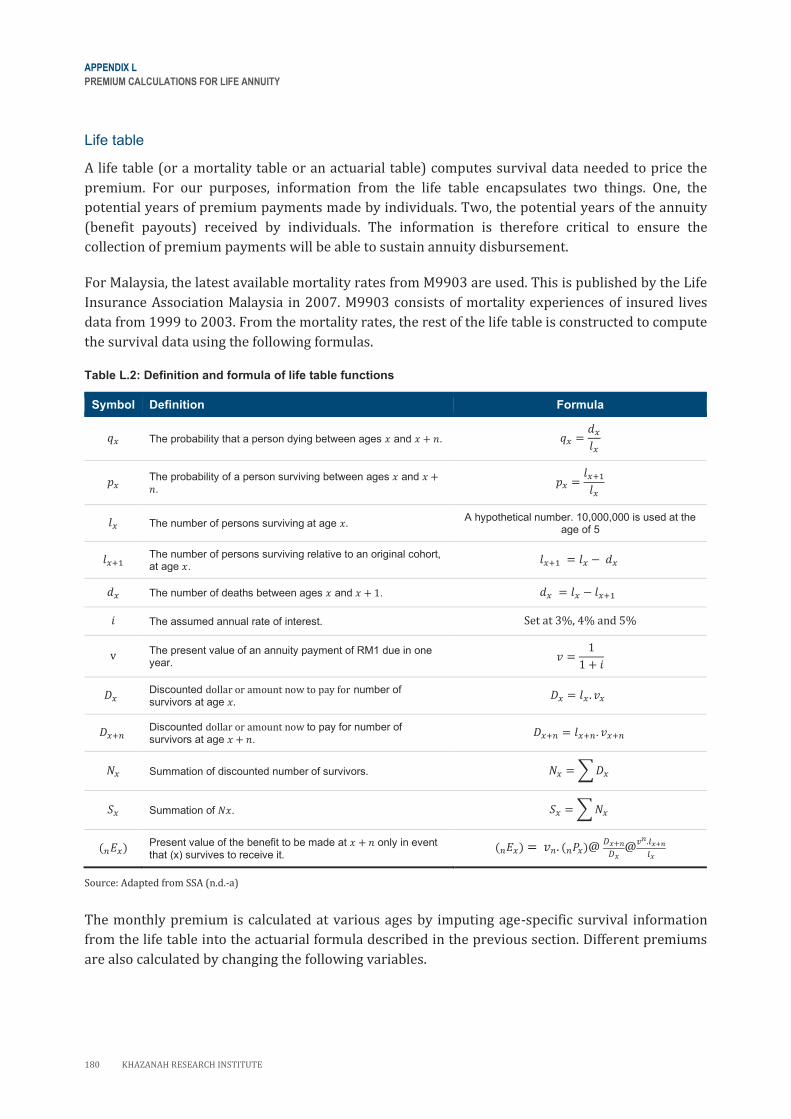
APPENDIX L
PREMIUM CALCULATIONS FOR LIFE ANNUITY
180 KHAZANAH RESEARCH INSTITUTE
Life table
A life table (or a mortality table or an actuarial table) computes survival data needed to price the
premium. For our purposes, information from the life table encapsulates two things. One, the
potential years of premium payments made by individuals. Two, the potential years of the annuity
(benefit payouts) received by individuals. The information is therefore critical to ensure the
collection of premium payments will be able to sustain annuity disbursement.
For Malaysia, the latest available mortality rates from M9903 are used. This is published by the Life
Insurance Association Malaysia in 2007. M9903 consists of mortality experiences of insured lives
data from 1999 to 2003. From the mortality rates, the rest of the life table is constructed to compute
the survival data using the following formulas.
Table L.2: Definition and formula of life table functions
Symbol Definition Formula
𝑞𝑥 The probability that a person dying between ages 𝑥 and 𝑥 + 𝑛. 𝑞𝑥 =𝑑𝑥
𝑙𝑥
𝑝𝑥 The probability of a person surviving between ages 𝑥 and 𝑥 +𝑛.
𝑝𝑥 =𝑙𝑥+1
𝑙𝑥
𝑙𝑥 The number of persons surviving at age 𝑥. A hypothetical number. 10,000,000 is used at the
age of 5
𝑙𝑥+1 The number of persons surviving relative to an original cohort, at age 𝑥.
𝑙𝑥+1 = 𝑙𝑥 − 𝑑𝑥
𝑑𝑥 The number of deaths between ages 𝑥 and 𝑥 + 1. 𝑑𝑥 = 𝑙𝑥 − 𝑙𝑥+1
𝑖 The assumed annual rate of interest. Set at 3%, 4% and 5%
v The present value of an annuity payment of RM1 due in one year.
𝑣 =1
1 + 𝑖
𝐷𝑥 Discounted dollar or amount now to pay for number of survivors at age 𝑥.
𝐷𝑥 = 𝑙𝑥 . 𝑣𝑥
𝐷𝑥+𝑛 Discounted dollar or amount now to pay for number of survivors at age 𝑥 + 𝑛.
𝐷𝑥+𝑛 = 𝑙𝑥+𝑛. 𝑣𝑥+𝑛
𝑁𝑥 Summation of discounted number of survivors. 𝑁𝑥 = ∑ 𝐷𝑥
𝑆𝑥 Summation of 𝑁𝑥. 𝑆𝑥 = ∑ 𝑁𝑥
(𝑛𝐸𝑥) Present value of the benefit to be made at 𝑥 + 𝑛 only in event that (x) survives to receive it.
(𝑛𝐸𝑥) = 𝑣𝑛. (𝑛𝑃𝑥)@ 𝐷𝑥+𝑛
𝐷𝑥@
𝑣𝑛.𝑙𝑥+𝑛
𝑙𝑥
Source: Adapted from SSA (n.d.-a)
The monthly premium is calculated at various ages by imputing age-specific survival information
from the life table into the actuarial formula described in the previous section. Different premiums
are also calculated by changing the following variables.
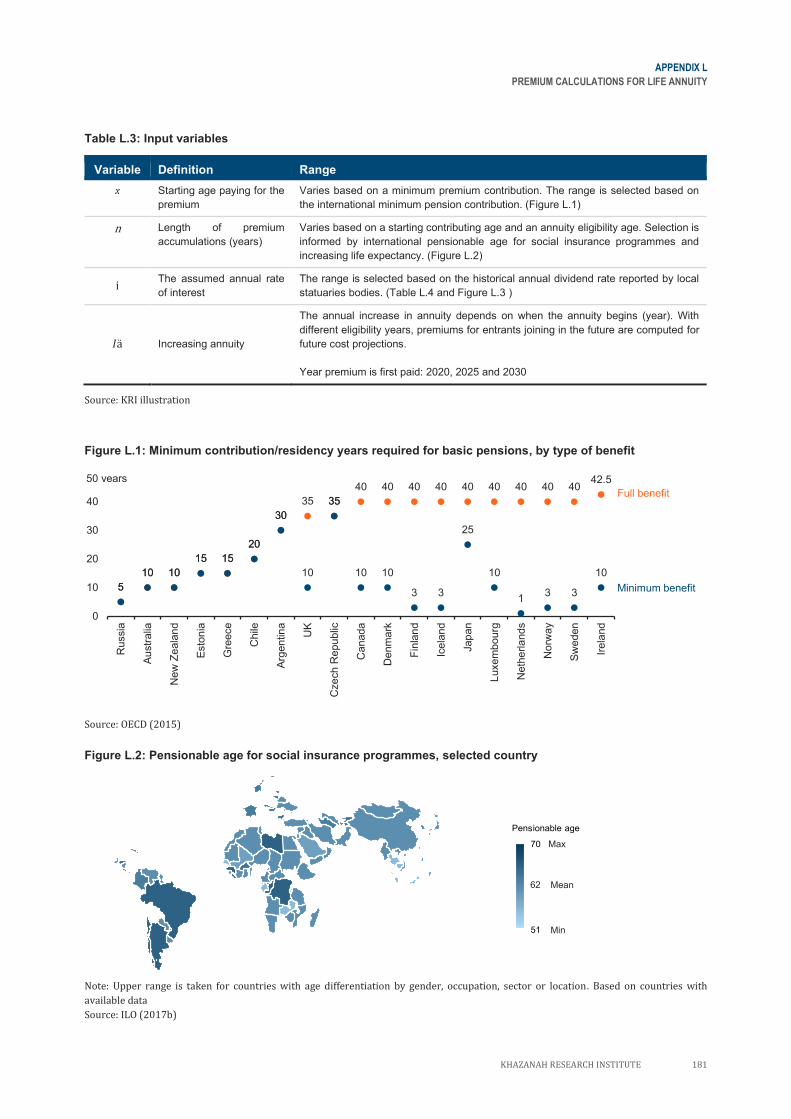
APPENDIX L
PREMIUM CALCULATIONS FOR LIFE ANNUITY
KHAZANAH RESEARCH INSTITUTE 181
Table L.3: Input variables
Variable Definition Range
x Starting age paying for the
premium
Varies based on a minimum premium contribution. The range is selected based on
the international minimum pension contribution. (Figure L.1)
n Length of premium
accumulations (years)
Varies based on a starting contributing age and an annuity eligibility age. Selection is
informed by international pensionable age for social insurance programmes and
increasing life expectancy. (Figure L.2)
i The assumed annual rate
of interest
The range is selected based on the historical annual dividend rate reported by local
statuaries bodies. (Table L.4 and Figure L.3 )
𝐼ä Increasing annuity
The annual increase in annuity depends on when the annuity begins (year). With
different eligibility years, premiums for entrants joining in the future are computed for
future cost projections.
Year premium is first paid: 2020, 2025 and 2030
Source: KRI illustration
Figure L.1: Minimum contribution/residency years required for basic pensions, by type of benefit
Source: OECD (2015)
Figure L.2: Pensionable age for social insurance programmes, selected country
Note: Upper range is taken for countries with age differentiation by gender, occupation, sector or location. Based on countries with
available data
Source: ILO (2017b)
5
10 10
15 15
20
30
35 35
40 40 40 40 40 40 40 40 4042.5
5
10 10
15 15
20
30
10
35
10 10
3 3
25
10
13 3
10
0
10
20
30
40
50
Russia
Au
str
alia
New
Ze
ala
nd
Esto
nia
Gre
ece
Chile
Arg
entin
a
UK
Cze
ch R
epublic
Canada
Denm
ark
Fin
lan
d
Icela
nd
Jap
an
Luxem
bourg
Neth
erla
nds
Norw
ay
Sw
eden
Irela
nd
50 years
Full benefit
Minimum benefit
51
0
ensionable age
62
Max
Min
Mean
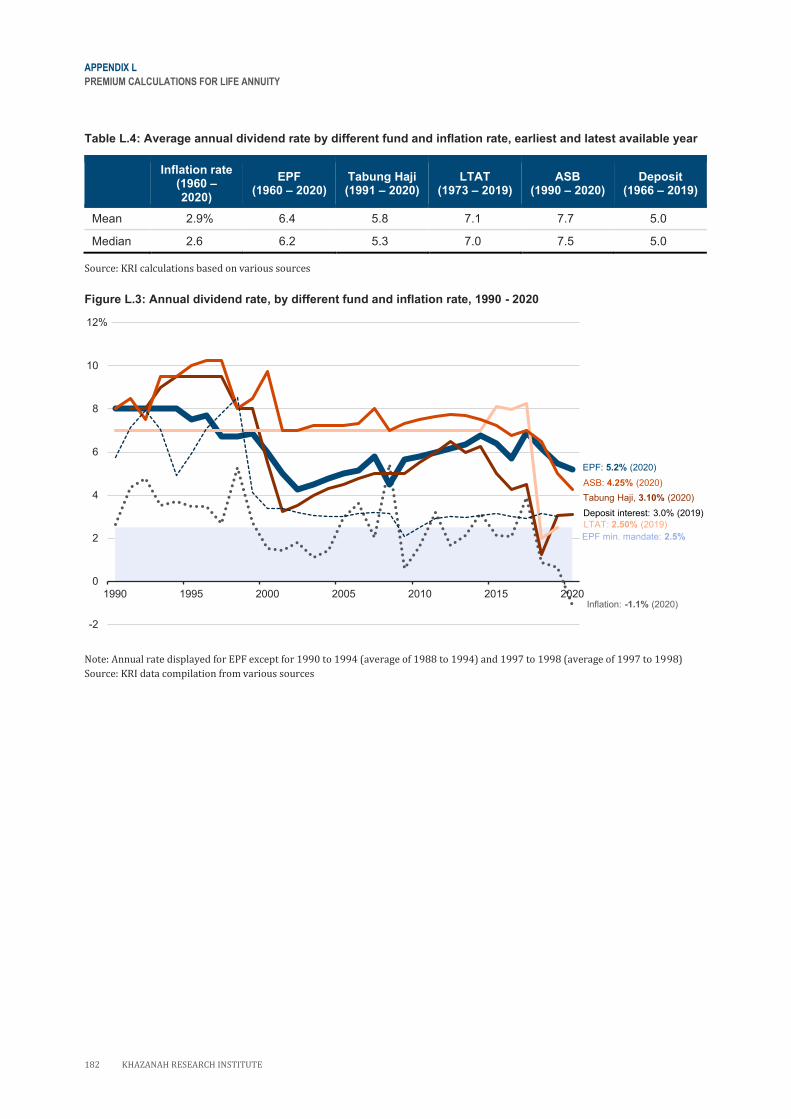
APPENDIX L
PREMIUM CALCULATIONS FOR LIFE ANNUITY
182 KHAZANAH RESEARCH INSTITUTE
Table L.4: Average annual dividend rate by different fund and inflation rate, earliest and latest available year
Inflation rate
(1960 – 2020)
EPF (1960 – 2020)
Tabung Haji (1991 – 2020)
LTAT (1973 – 2019)
ASB (1990 – 2020)
Deposit (1966 – 2019)
Mean 2.9% 6.4 5.8 7.1 7.7 5.0
Median 2.6 6.2 5.3 7.0 7.5 5.0
Source: KRI calculations based on various sources
Figure L.3: Annual dividend rate, by different fund and inflation rate, 1990 - 2020
Note: Annual rate displayed for EPF except for 1990 to 1994 (average of 1988 to 1994) and 1997 to 1998 (average of 1997 to 1998)
Source: KRI data compilation from various sources
Inflation: -1.1% (2020)
EPF: 5.2% (2020)
Tabung Haji, 3.10% (2020)
LTAT: 2.50% (2019)
ASB: 4.25% (2020)
-2
0
2
4
6
8
10
12
1990 1995 2000 2005 2010 2015 2020
EPF min. mandate: 2.5%
Deposit interest: 3.0% (2019)
12%
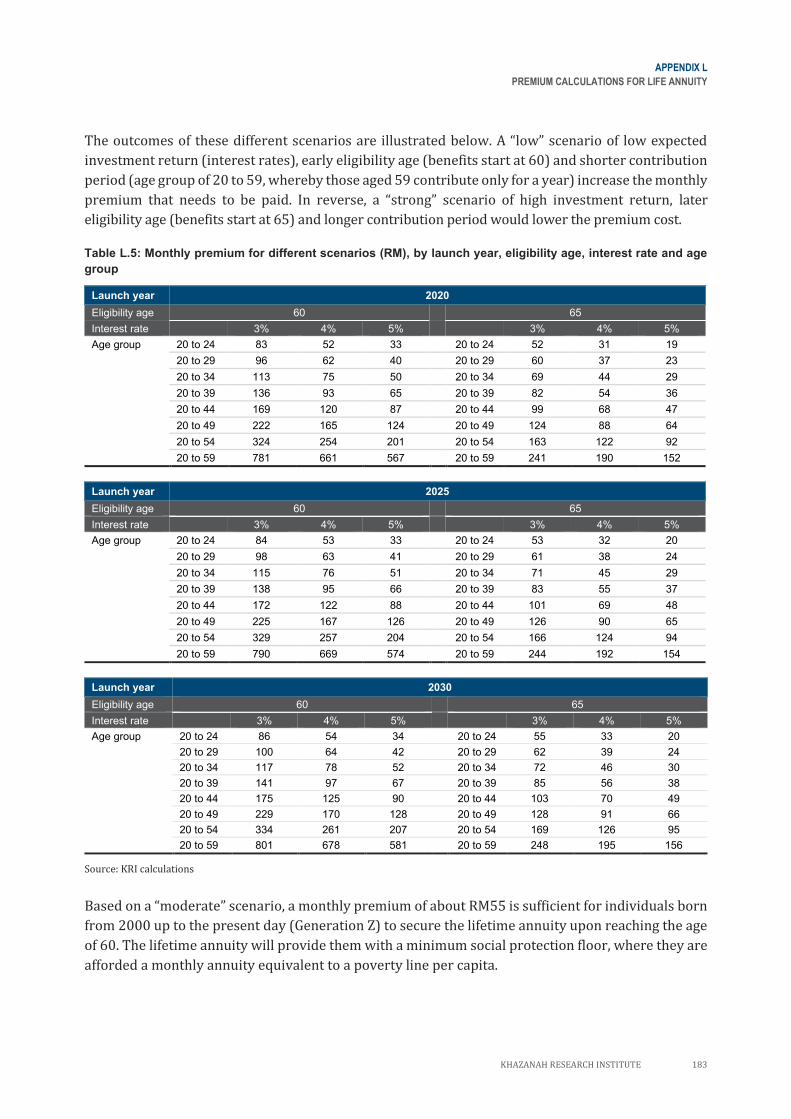
APPENDIX L
PREMIUM CALCULATIONS FOR LIFE ANNUITY
KHAZANAH RESEARCH INSTITUTE 183
The outcomes of these different scenarios are illustrated below. A “low” scenario of low expected
investment return (interest rates), early eligibility age (benefits start at 60) and shorter contribution
period (age group of 20 to 59, whereby those aged 59 contribute only for a year) increase the monthly
premium that needs to be paid. In reverse, a “strong” scenario of high investment return, later
eligibility age (benefits start at 65) and longer contribution period would lower the premium cost.
Table L.5: Monthly premium for different scenarios (RM), by launch year, eligibility age, interest rate and age
group
Launch year 2020
Eligibility age 60 65
Interest rate 3% 4% 5% 3% 4% 5%
Age group 20 to 24 83 52 33 20 to 24 52 31 19
20 to 29 96 62 40 20 to 29 60 37 23
20 to 34 113 75 50 20 to 34 69 44 29
20 to 39 136 93 65 20 to 39 82 54 36
20 to 44 169 120 87 20 to 44 99 68 47
20 to 49 222 165 124 20 to 49 124 88 64
20 to 54 324 254 201 20 to 54 163 122 92
20 to 59 781 661 567 20 to 59 241 190 152
Launch year 2025
Eligibility age 60 65
Interest rate 3% 4% 5% 3% 4% 5%
Age group 20 to 24 84 53 33 20 to 24 53 32 20
20 to 29 98 63 41 20 to 29 61 38 24
20 to 34 115 76 51 20 to 34 71 45 29
20 to 39 138 95 66 20 to 39 83 55 37
20 to 44 172 122 88 20 to 44 101 69 48
20 to 49 225 167 126 20 to 49 126 90 65
20 to 54 329 257 204 20 to 54 166 124 94
20 to 59 790 669 574 20 to 59 244 192 154
Launch year 2030
Eligibility age 60 65
Interest rate 3% 4% 5% 3% 4% 5%
Age group 20 to 24 86 54 34 20 to 24 55 33 20
20 to 29 100 64 42 20 to 29 62 39 24
20 to 34 117 78 52 20 to 34 72 46 30
20 to 39 141 97 67 20 to 39 85 56 38
20 to 44 175 125 90 20 to 44 103 70 49
20 to 49 229 170 128 20 to 49 128 91 66
20 to 54 334 261 207 20 to 54 169 126 95
20 to 59 801 678 581 20 to 59 248 195 156
Source: KRI calculations
Based on a “moderate” scenario, a monthly premium of about RM55 is sufficient for individuals born
from 2000 up to the present day (Generation Z) to secure the lifetime annuity upon reaching the age
of 60. The lifetime annuity will provide them with a minimum social protection floor, where they are
afforded a monthly annuity equivalent to a poverty line per capita.
184 KHAZANAH RESEARCH INSTITUTE
REFERENCES
ABC News. 2021. “Uber Drivers Are Not Employees, Fair Work Ombudsman Finds.” ABC News, 2021.
https://www.abc.net.au/news/2019-06-07/uber-fair-work-ombudsman-investigation-contractor-employee/11189828.
Abdul Rahman Abdul Aziz. 2014. Pembangunan 1960-an: Daripada Kata-Kata Tun Abdul Razak Hussein. Kuala Lumpur: Institut Terjemahan & Buku Malaysia Berhad.
Abdul Razak, Abd Manaf, Othman Siti Zubaidah, Mohd Isa Mohd Faizal, Mohd Noor Wan Shakizah, and Azizan Norizan. 2019. “Employment Challenges among Persons with Disabilities in Malaysia.” International Journal of Academic Research in Business and Social Sciences 9 (10).
Abraham Lincoln. 1854. “Abraham Lincoln, Fragment on Government, circa July 1, 1854.” House Divided: The Civil War Research Engine at Dickinson College. 1854. https://hd.housedivided.dickinson.edu/node/40487.
Adams, Charles, Benno Ferrarini, and Donghyun Park. 2010. “Fiscal Sustainability in Developing Asia.” Asian Developement Bank.
ADB. 2001. Social Protection Strategy. Asian Development Bank.
———. 2012. “Pension Systems in East and Southeast Asia.” Manila: Asian Development Bank.
———. n.d. “SPI Database.” ADB Social Protection Indicator. n.d. https://spi.adb.org/spidmz/.
Aishah, Bidin, Khan Shereen, and Olivia Tan. 2012. “Protection of Employees’ Entitlements in Cases of Employer Insolvency in Malaysia.” International Journal of Business and Society 13 (2): 209.
AKPK. 2018. “Financial Behavior and State of Financial Well-Being of Malaysian Working Adults 2018.” Kuala Lumpur: Bank Negara Malaysia.
Allianz Research. 2021. “Allianz Pension Report Asia Special 2021.” Munich: Allianz and Euler Hermes.
Arranz Muñoz, José María, and Juan Muro. 2004. “An Extra Time Duration Model with Application to Unemployment Duration under Benefits in Spain.”
Astro Awani. 2021a. “‘Hanya Tinggalkan RM100’ - 30 Peratus Ahli KWSP Keluarkan Hampir Semua Simpanan Akaun 1.” Astro Awani, 2021. https://www.astroawani.com/berita-malaysia/hanya-tinggalkan-rm100-30-peratus-ahli-kwsp-keluarkan-hampir-semua-simpanan-akaun-1-285071.
———. 2021b. “Perkeso Bakal Lindungi Suri Rumah Mulai 2022.” Astro Awani, 2021. https://krinstituteorg.sharepoint.com/:x:/s/SocialProtectionPolicyProposal/EV6BMakmECROopPYU1rj3UYBbIDVHAKtO78PVnHSJJevdA?e=Stxsc3.
Barrientos, A., and D. Hulme, eds. 2008. Social Protection for the Poor and Poorest: Concepts, Policies and Politics. Palgrave Studies in Development. Palgrave Macmillan UK. https://doi.org/10.1057/978-0-230-58309-2.
Bastagli, Francesca, Jessica Hagen-Zanker, Luke Harman, Valentina Barca, Georgina Sturge, Tanja Schmidt, and Luca Pellerano. 2016. “Cash Transfers: What Does the Evidence Say? A Rigorous Review of Impacts and the Role of Design and Implementation Features.” London: Overseas Development Institute. https://cdn.odi.org/media/documents/11316.pdf.
Bernama. 2020. “Govt Revenue to Fall 14 Pct in 2020 as Tax Collection Slips.” BERNAMA. November 6, 2020. https://www.bernama.com/en/business/news_penjana.php?id=1897849.
———. 2021a. “Govt to Establish Poverty Circle to Address Issue, Says Mustapa.” The Edge Markets, 2021. https://www.theedgemarkets.com/article/govt-establish-poverty-circle-address-issue-says-mustapa.
———. 2021b. “Malaysia’s 2021 Fiscal Deficit to Hover between 6.5 and 7pct of GDP.” Malaysiakini. 2021. https://www.malaysiakini.com/news/583668.
BH. 2021. “RM78 Bilion Dikeluarkan Dari I-Lestari, i-Sinar.” Berita Harian, 2021. https://www.bharian.com.my/berita/nasional/2021/05/816308/rm78-bilion-dikeluarkan-dari-i-lestari-i-sinar.
Bloom, David E., and Jeffrey G. Williamson. 1997. “Demographic Transitions and Economic Miracles in Emerging Asia.” NBER Working Paper Series. National Bureau of Economic Research.
BNM. 2021a. “A Vision for Social Protection in Malaysia.” Kuala Lumpur: Bank Negara Malaysia.
———. 2021b. “Bank Negara Malaysia Annual Report 2020.” Kuala Lumpur: Bank Negara Malaysia.
Bodnár, Katalin, and Carolin Nerlich. 2020. “Drivers of Rising Labour Force Participation – the Role of Pension Reforms.”
Bradshaw, Jonathan, and Naomi Finch. 2002. “A Comparison of Child Benefit Packages in 22 Countries.”
Carone, Giuseppe, Per Eckefeldt, Luigi Giamboni, Veli Laine, and Stéphanie Pamies Sumner. 2016. “Pension Reforms in the EU since the Early 2000’s: Achievements and Challenges Ahead.” Luxembourg: European Comission.
CEIC. n.d. “CEIC Database.” n.d.
Chee, Lee Kum. 1997. “The Malaysian Government Pension Scheme: Whither Its Future Direction?” Jurnal Ekonomi Malaysia.
Choong, Christopher and Adam Firouz. 2020. “Social Protection and Fiscal Policy in Malaysia.” Kuala Lumpur: Khazanah Research Institute.
Cichon, Michael, Wolfgang Scholz, Arthur Van de Meerendonk, Krzysztof Hagemejer, Fabio Bertranou, and Pierre Plamondon. 2004. Financing Social Protection. Vol. 5. Geneva: International Labour Organization.
CNBC. 2021. “Uber Employment Rights Setback Is a ‘Gut Punch’ to Its Prospects in the UK.” CNBC, 2021. https://www.cnbc.com/2021/03/18/uber-is-reclassifying-uk-drivers-as-workers-heres-what-happens-next.html.
REFERENCES
KHAZANAH RESEARCH INSTITUTE 185
Cutler, David M., and Richard Johnson. 2004. “The Birth and Growth of the Social Insurance State: Explaining Old Age and Medical Insurance across Countries.” Public Choice 120. https://scholar.harvard.edu/files/cutler/files/the_birth_and_growth_of_the_social_insurance_state.pdf.
Darmaraj, Sheila Rose, and Suresh Narayanan. 2019. “The Long-Term Financial Sustainability of the Civil Service Pension Scheme in Malaysia.” Asian Economic Papers 18 (1): 155–78.
Development Pathways. 2020. “Understanding Social Protection: Definitions, Approaches and Underpinning Ideologies.”
Devereux, Stephen, and Rachel Sabates-Wheeler. 2004. “Transformative Social Protection.” Institute of Development Studies, 1–27.
Disabled World. 2020. “Invisible Disabilities: List and General Information.” Malaysian Information Network on Disabilities. 2020. https://www.disabled-world.com/disability/types/invisible/.
DOS. 2016a. “Economic Census 2016 - Profile of Small and Medium Enterprises.” Putrajaya: Department of Statistics.
———. 2016b. “Population Projections (Revised) Malaysia 2010 - 2040.” Putrajaya: Department of Statistics.
———. 2019. “Annual Employment Statistics 2018.” Putrajaya: Department of Statistics.
———. 2020a. “Household Income and Basic Amenities Survey Report 2019.” Putrajaya: Department of Statistics Malaysia.
———. 2020b. “Labour Force Survey Report 2019.” Putrajaya: Department of Statistics.
———. 2020c. “Malaysia Economics Statistics - Time Series 2019 (Population).” Putrajaya: Department of Statistics.
———. 2020d. “Report of Special Survey on Effects of COVID-19 on Economy & Individual - Round 1.” Putrajaya: Department of Statistics.
———. 2020e. “Vital Statistics 2019.” Putrajaya: Department of Statistics.
———. 2021a. “Current Population Estimates.” Putrajaya: Department of Statistics.
———. 2021b. “Data Requested from the Department of Statistics on Household Income and Basic Amenities Survey 2016.” Putrajaya: Department of Statistics.
———. 2021c. “Labour Force Survey Report 2020.” Putrajaya: Department of Statistics.
———. 2021d. “Malaysia Informative Data Centre.” Putrajaya: Department of Statistics. mysidc.statistics.gov.my/.
———. 2021e. “Quarterly Labour Force Survey Report 2021 (Second Quarter).” Putrajaya: Department of Statistics.
———. 2021f. “Salaries and Wages Report 2020.” Putrajaya: Department of Statistics.
———. various years-a. “Labour Force Survey Report.” Department of Statistics.
———. n.d. “Malaysia Population Projection 2010-2040.” n.d. https://www.dosm.gov.my/v1/index.php?r=column/cdatavisualization&menu_id=WjJMQ1F0N3RXclNGNWpIODBDRmh2UT09&bul_id=aDNJSnBKRTNYSGhvcU5wamlLUFB5UT09.
———. various years-b. “Salaries and Wages Report.” Department of Statistics.
ECB. 2021. “Euro Foreign Exchange Reference Rates.” European Central Bank. 2021. https://www.ecb.europa.eu/stats/policy_and_exchange_rates/euro_reference_exchange_rates/html/index.en.html.
EPF. 2016a. “Annual Report, 2015.” Kuala Lumpur: Employees Provident Fund.
———. 2016b. “Social Protection Insight Vol. 1.” Kuala Lumpur: Employees Provident Fund.
———. 2018. “Social Protection Insight Vol. 3.” Kuala Lumpur: Employees Provident Fund.
———. 2020. “Annual Report 2019.” Kuala Lumpur: Employees Provident Fund.
———. 2021. “Data Requested from EPF on the Impact of Covid-19 Pre-Withdrawal Schemes.” Kuala Lumpur: Employees Provident Fund.
———. various years. “Annual Report.” Kuala Lumpur: Employees Provident Fund.
———. n.d.-a. “EPF.” Employees Provident Fund. n.d.-. https://www.kwsp.gov.my/.
———. n.d.-b. “No Change To Age 55 Withdrawal And Introducing Akaun Emas For Age 60 Withdrawal.” Employees Provident Fund. n.d.-. https://www.kwsp.gov.my/-/epf-no-change-to-age-55-withdrawal-and-introducing-akaun-emas-for-age-60-withdrawal.
ESCAP. 2018. “Policy Guide: How to Implement Inclusive Social Protection Schemes.” United Nations Economic and Social Commission for Asia and the Pacific.
European Commission. 2015. “ESPN Thematic Report on Social Investment - Romania.” Brussels, European Union: European Commission.
FMT. 2018. “Can You Afford to Have a Baby?” Free Malaysia Today, 2018. https://www.freemalaysiatoday.com/category/leisure/2018/11/05/can-you-afford-to-have-a-baby/.
Goh, Edwin and Nelleita Omar. 2020. “Gig Work: Side Hustle or Main Job? Part 1. The Reality of Hours Worked in the Gig World.” The Center. 2020.
———. 2021. “The Case for A Fair Work Act, Part 1: Responding to Malaysia’s Changing Employment Landscape.” The Center. 2021.
GOM. 1955. Employment Act 1955 (Act 265).
———. 1966. Children and Young Persons (Employment) Act 1966 (Act 350). Malaysia.
———. 2013. Minimum Retirement Age Act 2012 (Act 753).
REFERENCES
186 KHAZANAH RESEARCH INSTITUTE
———. n.d.-a. Skim Bayaran Pampasan (Ex-Gratia) Bagi Pegawai Kerajaan Di Bawah Skim Kumpulan Wang Simpanan Pekerja Dan Pegawai Berpencen Yang Ditimpa Kemalangan Atau Kecederaan Termasuk Yang Teraniaya Anasir-Anasir Jahat Semasa Menjalankan Tugas Rasmi (WP 6.2).
———. n.d.-b. Skim Ex-Gratia Bencana Kerja Bagi Pegawai Perkhidmatan Awam Persekutuan (WP 6.3).
Grab. 2020. “Grab Social Impact Report 2019/2020.” GrabTaxi Holdings Pte. Ltd.
Hawati Abdul Hamid, Gregory Wai Son Ho, and Suraya Ismail. 2019. “Demarcating Households: An Integrated Income and Consumption Analysis.” Kuala Lumpur: Khazanah Research Institute.
Hawati Abdul Hamid and Nur Thuraya Sazali. 2020. “Shrinking ‘Salariat’ and Growing ‘Precariat’? Estimating Informal and Non-Standard Employment in Malaysia.” Kuala Lumpur: Khazanah Research Institute.
Headey, Bruce, Robert E. Goodin, Ruud Muffels, and Henk-Jan Dirven. 1999. “Is There a Trade-Off between Economic Efficiency and a Generous Welfare State? A Comparison of Best Cases of 'The Three Worlds of Welfare Capitalism’.” SSRN Scholarly Paper ID 1988250. Rochester, NY: Social Science Research Network.
HelpAge. n.d. “Social Pensions Database.” http://www.pension-watch.net/social-pensions-database/social-pensions-database--/.
Hinz, Richard, Robert Holzmann, David Tuesta, and Noriyuki Takayama. 2013. “Matching Contributions for Pensions : A Review of International Experience.” Washington, DC: The World Bank.
Holzmann, Robert. 2014. “Old-Age Financial Protection in Malaysia: Challenges and Options.” Washington, DC: The World Bank.
Hubbard, Paul, and Dhruv Sharma. 2016. “Understanding and Applying Long-Term GDP Projections.” EABER Working Paper Series.
ILO. 1952. “Social Security (Minimum Standards) Convention, 1952 (No. 102).” 1952. https://www.ilo.org/dyn/normlex/en/f?p=NORMLEXPUB:12100:0::NO::P12100_ILO_CODE:C102.
———.1964. “Employment Injury Benefits Convention, 1964 (No. 121).” 1964. https://www.ilo.org/dyn/normlex/en/f?p=NORMLEXPUB:12100:0::NO::P12100_ILO_CODE:C121.
———.1988a. “Employment Promotion and Protection against Unemployment Convention, 1988 (No. 168).” 1988. https://www.ilo.org/dyn/normlex/en/f?p=NORMLEXPUB:12100:::NO:12100:P12100_ILO_CODE:C168:NO.
———. 1988b. “Employment Promotion and Protection against Unemployment Recommendation, 1988 (No. 176).” 1988. ilo.org/dyn/normlex/en/f?p=NORMLEXPUB:12100:0::NO::P12100_ILO_CODE:R176.
———. 2000a. “Maternity Protection Convention, 2000 (No. 183).” 2000. https://www.ilo.org/dyn/normlex/en/f?p=1000:12100:0::NO::P12100_ILO_CODE:C183.
———. 2000b. “Maternity Protection Recommendation, 2000 (No. 191).” 2000. https://www.ilo.org/dyn/normlex/en/f?p=NORMLEXPUB:12100:0::NO::P12100_INSTRUMENT_ID:312529.
———. 2002. Resolution Concerning Decent Work and the Informal Economy. Geneva: International Labor Organization.
———. 2003a. “A Life Cycle Continuum Investment for Social Justice, Poverty Reduction and Sustainable Development.” Social Protection, 64.
———. 2003b. Social Protection Matters: Prevention and Protection. Geneva: International Labor Organization.
———. 2003c. “Committee on Employment and Social Policy: Governing Body.” ILO. https://www.ilo.org/public/english/standards/relm/gb/docs/gb288/pdf/esp-2.pdf.
———. 2012. “Social Protection Floors Recommendation, 2012 (No. 202).” 2012. https://www.ilo.org/dyn/normlex/en/f?p=NORMLEXPUB:12100:0::NO::P12100_INSTRUMENT_ID:3065524.
———. 2014a. “Maternity and Paternity at Work: Law and Practice across the World.” International Labour Organization.
———. 2014b. “R202 - Social Protection Floors Recommendation, 2012 (No. 202).” Geneva, 101st ILC session (14 Jun 2012): International Labour Organization. https://www.ilo.org/dyn/normlex/en/f?p=NORMLEXPUB:12100:0::NO::P12100_INSTRUMENT_ID:3065524.
———. 2015a. “Social Protection Assessment-Based National Dialogue: A Global Guide. Joint United Nations Response to Implement Social Protection Floors and Achieve the Sustainable Development Goals.” Geneva: International Labour Office.
———. 2015b. “The State of Social Protection in ASEAN at the Dawn of Integration.” Geneva: International Labour Organization.
———. 2016. “Non-Standard Employment Around the World: Understanding Challenges, Shaping Prospects.” Geneva: International Labor Organization.
———. 2017a. “Malaysia – Report to the Social Security Organization Tenth Actuarial Valuation as of 31 December 2014.” Geneva: International Labour Organization.
———. 2017b. World Social Protection Report 2017-19: Universal Social Protection to Achieve the Sustainable Development Goals. World Social Protection Report 2017/19. Geneva: International Labour Office.
———. 2017c. World Social Protection Report 2017-19: Universal Social Protection to Achieve the Sustainable Development Goals. World Social Protection Report 2017/19. Geneva: International Labour Office.
———. 2017d. “World Social Protection Report 2017–19: Universal Social Protection to Achieve the Sustainable Development Goals.” Report. Geneva: International Labour Organization.
———. 2018a. “Developmental Impacts of Expanding Social Protection.” Publication. Geneva: International Labor Organization.
REFERENCES
KHAZANAH RESEARCH INSTITUTE 187
———. 2018b. “Report II Statistics on Work Relationships.” Geneva: International Labor Organization.
———. 2019a. “Extending Social Security to Workers in the Informal Economy: Lessons from International Experience.” Geneva: International Labor Organization.
———. 2019b. Fiscal Space for Social Protection. A Handbook for Assessing Financing Options. Geneva: International Labor Organization.
———. 2020. “The Socioeconomic Impacts of COVID-19 in Malaysia: Policy Review and Guidance for Protecting the Most Vulnerable and Supporting Enterprises.” Geneva: International Laboure Organization.
———. 2021. “World Employment Social Outlook 2021: The Role of Digital Labour Platforms in Transforming the World of Work (InfoStories).” 2021. https://ilo.org/infostories/en-GB/Campaigns/WESO/World-Employment-Social-Outlook-2021.
———. n.d.-a. “Decent Work.” https://www.ilo.org/global/topics/decent-work/lang--en/index.htm.
———.n.d.-b. “Facts on Social Security.” ILO. https://www.ilo.org/wcmsp5/groups/public/---dgreports/---dcomm/documents/publication/wcms_067588.pdf.
———.n.d.-c “Indicator Description: Informality.” ILOSTAT. https://ilostat.ilo.org/resources/concepts-and-definitions/description-informality/.
———.n.d.-d “Non-Standard Forms of Employment.” ILO. https://www.ilo.org/global/topics/non-standard-employment/lang--en/index.htm.
———. n.d.-e. “Statistics on the Working-Age Population and Labour Force.” https://ilostat.ilo.org/topics/population-and-labour-force/.
———.n.d.-f. “World Social Protection Data Dashboards.” Social-Protection.Org. https://www.social-protection.org/gimi/WSPDB.action?id=19.
ILOSTAT. n.d. “ILO Database.” https://ilostat.ilo.org/.
IMF. 2017. “Asia: At Risk of Growing Old before Becoming Rich?” Washington, DC: International Monetary Fund.
———. 2021a. “Global Price of Brent Crude.” FRED, Federal Reserve Bank of St. Louis. FRED, Federal Reserve Bank of St. Louis. 2021. https://fred.stlouisfed.org/series/POILBREUSDM.
———. 2021b. “Government Finance Statistics.” IMF Data. 2021. https://data.imf.org/?sk=a0867067-d23c-4ebc-ad23-d3b015045405&sId=1435697914186.
———. 2021c. “World Economic Outlook Database: April 2021 Edition.” Washington: International Monetary Fund.
———.n.d. “IMF Data.” https://www.imf.org/en/Data.
IPH. 2020. “National Health and Morbidity Survey 2019: Non-Communicable Diseases: Risk Factors and Other Health Problems.” Shah Alam: Institute for Public Health, Ministry of Health.
ISSA. n.d.-. “Country Profiles: Contribution Rates.” n.d.-. https://ww1.issa.int/country-profiles/contribution-rates.
Jackson, Richard, and Evan Inglis. 2021. “Asian Provident Funds : Meeting Tomorrow’s Challenges.” Washington, DC: The World Bank.
Jarud Romadan Khalidi and Tan Zhai Gen. 2020. “Understanding School Feeding in Malaysia.” KRI Discussion Papers. Khazanah Research Institute.
JKM. n.d.-a. “Bantuan Kanak-Kanak.” Jabatan Kebajikan Masyarakat. https://www.jkm.gov.my/jkm/index.php?r=portal/left&id=QW15ZEo2UnZIMnJXSHdEQTdXZGE3dz09.
———. n.d.-b. “Disability (Unable to Work) Allowance.” https://www.jkm.gov.my/jkm/index.php?r=portal/left&id=akVMUTlrSU5mT0dCZys3bzFCendNdz09.
———. n.d.-c. “Disabled Person Care Allowance.” https://www.jkm.gov.my/jkm/index.php?r=portal/left&id=UzhQSWdqWnJSZ2xIUUNFT2Z0WG9tQT09.
———. n.d.-d. “Disabled Worker Allowance.” https://www.jkm.gov.my/jkm/index.php?r=portal/left&id=akVMUTlrSU5mT0dCZys3bzFCendNdz09.
———. various years. “Statistical Report.” Putrajaya: Department of Social Welfare.
Jordan, Chester Wallace. 1991. Society of Actuaries’ Textbook on Life Contingencies. Chicago: The Society of Actuaries.
JPA. 2013. “Annual Report 2012.” Putrajaya: Public Service Department.
———. 2020. “Data Requested from the Public Service Department.” Putrajaya: Jabatan Perkhidmatan Awam.
———. n.d.-a. “Improvement of Pension Benefits (1968 - 2004).” Public Service Department. http://www.jpapencen.gov.my/english/improvement_pension.html.
———.n.d.-b. “The Protection of Pension Right.” Public Service Department. http://www.jpapencen.gov.my/English/pension_right.html.
JTK. 2021. “Data Requested from JTK on Total Complaints, 2010 - 2020.” Putrajaya: Jabatan Tenaga Kerja Semenanjung Malaysia.
Karto, Dom, and Kok Peng Teh. 1986. “Social Security in Malaysia.” ASEAN Economic Buletin.
Kela. n.d. “Kela.” Kela.En. https://www.kela.fi/web/en.
Kidd, Stephen., T. Abu-el-Haj, B. Khondker, C. Watson, and S. Ramkissoon. 2016. “Social Assistance in Viet Nam: A Review and Proposals for Reform.”
Kidd, Stephen. 2015. “The Political Economy of ‘Targeting’ of Social Security Schemes.” London: Development Pathways.
REFERENCES
188 KHAZANAH RESEARCH INSTITUTE
Kidd, Stephen, Gunnel Axelsson Nycander, Anh Tran, and Madeleine Cretney. 2020. “The Social Contract and the Role of Universal Social Security in Building Trust in Government.” Development Pathways and Act Church of Sweden.
Kidd, Stephen, Louise Moreira Daniels, Bjorn Gelders, Diloá Athias, and Madeleine Cretney. 2020. “Investing in the Future: A Universal Benefit for Sri Lanka’s Children.” Sri Lanka: United Nations Children’s Fund.
Kinsella, Kevin, and Victoria A. Velkoff. 2001. “An Ageing World: 2001, International Population Reports.” Washington, DC: U.S. Department of Commerce. https://www.census.gov/prod/2001pubs/p95-01-1.pdf.
Kirk, Dudley. 1996. “Demographic Transition Theory.” Population Studies 50 (3).
Knox-Vydmanov, Charles. 2021. “Social Protection for Older Persons.”
KPWKM. 2019. “Statistics on Women, Family and Community 2018.” Ministry of Women, Family and Community Development.
———. 2020. “Statistics on Women, Family and Community 2019.” Putrajaya: Kementerian Pembangunan Wanita, Keluarga dan Masyarakat.
KRI. 2015. “Making Housing Affordable.” Kuala Lumpur: Khazanah Research Institute.
———. 2016. “The State of Households II.” Kuala Lumpur: Khazanah Research Institute.
———. 2018. “The State of Households 2018: Different Realities.” Kuala Lumpur: Khazanah Research Institute.
———. 2019. “Time to Care: Gender Inequality, Unpaid Care Work and Time Use Survey.” Kuala Lumpur: Khazanah Research Institute.
———. 2020a. “Social Inequalities and Health in Malaysia: The State of Households 2020 Part III.” Khazanah Research Institute.
———. 2020b. “Work in an Evolving Malaysia: The State of Households 2020 Part II.” Kuala Lumpur: Khazanah Research Institute.
KWAP. n.d. “Contributing Members.” Kumpulan Wang Persaraan. https://www.kwap.gov.my/EN/Contributions/Pages/Contributing-Members.aspx.
LHDN. 2021a. “Brochure BPR 2021 Selected.” Putrajaya: Lembaga Hasil Dalam Negeri. 2021. https://bpr.hasil.gov.my/Download/book/Brochure%20BPR.pdf.
———. 2021b. “Statistik Taburan Cukai Pendapatan Kumpulan Individu (Penggajian Dan Perniagaan) Bagi Tahun Taksiran 2019 Dan 2020 Bagi Kegunaan Kajian Sistem Perlindungan Sosial Negara Oleh Khazanah Research Institute (KRI).” Putrajaya: Lembaga Hasil Dalam Negeri.
———.n.d.-a. “Income Tax Rates.” Inland Revenue Board of Malaysia (LDHN). Inland Revenue Board of Malaysia. http://www.hasil.gov.my/bt_goindex.php?bt_kump=5&bt_skum=1&bt_posi=2&bt_unit=5000&bt_sequ=11&bt_lgv=2.
———.n.d.-b. “Tax Chargeablity.” Putrajaya: Lembaga Hasil Dalam Negeri. http://www.hasil.gov.my/bt_goindex.php?bt_kump=5&bt_skum=1&bt_posi=2&bt_unit=5000&bt_sequ=2.
———.n.d.-c. “Tax Relief for Resident Individual.” Putrajaya: Lembaga Hasil Dalam Negeri. http://www.hasil.gov.my/bt_goindex.php?bt_kump=5&bt_skum=1&bt_posi=3&bt_unit=1&bt_sequ=1&bt_lgv=2.
LTAT. 2019. “Annual Report, 2018.” Kuala Lumpur: Lembaga Tabung Angkatan Tentera.
Malay Mail. 2020. “Govt to Introduce New Legislation to Regulate Gig Workers, Dewan Rakyat Told.” Malay Mail, 2020. https://www.malaymail.com/news/malaysia/2020/07/29/govt-to-introduce-new-legislation-to-regulate-gig-workers-dewan-rakyat-told/1889319.
Malaysiakini. 2019. “Budget 2020 Sees 90-Day Maternity Leave, Higher Overtime Cap.” Malaysiakini, 2019. https://www.malaysiakini.com/news/495401.
———. 2020. “EPF Chief Vows Not to Make Reckless Decision over Account 1 Withdrawal.” Malaysia Kini, 2020. https://www.malaysiakini.com/news/550637.
Mazlynda Md Yusuf. 2012. “Women and Pensions in Malaysia: Assessing the Impacts of Disruptions in Working Life.” Faculty of Social and Human Sciences. University of Southampton.
Menegatti, Elisa. 2016. “Migrant Domestic Workers: Promoting Occupational Safety and Health.” International Labor Organization.
Michael, Samson, Van Niekerk Ingrid, and Mac Quene Kenneth. 2006. “Designing and Implementing Social Transfer Programmes.” Economic Policy Research Institute (EPRI). Cape Town.
MIND. n.d. “Invisible Disabilities 101.” Malaysian Information Network on Disabilities. n.d. https://mind.org.my/article/invisible-disabilities-101/.
MISSOC. 2021. “European Union Mutual Information System on Social Protection - Comparative Tables.” Brussels, European Union: Mutual Information System on Social Protection. https://www.missoc.org/missoc-database/comparative-tables/.
Mitra, Sophie, Michael Palmer, Hoolda Kim, Daniel Mont, and Nora Groce. 2017. “Extra Costs of Living with a Disability: A Review and Agenda for Research.” Disability and Health Journal 10 (4): 475–84.
Mkandawire, Thandika. 2005. “Targeting and Universalism in Poverty Reduction.” Social Policy and Development Programme Paper Number 23.
MOE. 2013. “Malaysia Education Blueprint 2013-2025 (Preschool to Post-Secondary Education).” Putrajaya: Ministry of Education.
MOF. 2018. “Fiscal Outlook and Federal Government Revenue Estimates 2019.” Putrajaya: Ministry of Finance.
REFERENCES
KHAZANAH RESEARCH INSTITUTE 189
———. 2019. “Fiscal Outlook and Federal Government Revenue Estimates 2020.” Putrajaya: Ministry of Finance.
———. 2020. “Fiscal Outlook and Federal Government Revenue Estimates 2021.” Putrajaya: Ministry of Finance.
———. 2021a. “Data Requested from the Ministry of Finance on Expenditure of Subsidy and Social Assistance Programmes, 2006 – 2020.” Putrajaya: Ministry of Finance.
———. 2021b. “Fiscal & Economic Data.” 2021. https://www.mof.gov.my/en/economy/fiscal-economic-data.
———. 2021c. “Government’s Temporary Debt Increase Due To Helping Rakyat & Businesses: Fiscal Discipline And Consolidation To Follow Once Economy Recovers.” Ministry of Finance. 2021. https://www.mof.gov.my/en/news/press-release/government-s-temporary-debt-increase-due-to-helping-rakyat-businesses-fiscal-discipline-and-consolidation-to-follow-once-economy-recovers.
———. 2021d. “Programme Expenditure, 2015-2020 (Unpublished).”
MOH. 2019. “National Health and Morbidity Survey (NHMS) 2018: Elderly Health. Vol. II: Elderly Health Findings, 2018.” Kuala Lumpur: Institute for Public Health, Ministry of Health. http://www.iku.gov.my/images/IKU/Document/REPORT/NHMS2018/NHMS2018ElderlyHealthVolume2.pdf.
Mohamed Aslam and Raihan Jaafar. 2020. “Budget Deficit and the Federal Government Debt in Malaysia.” In Perspectives on Economic Development - Public Policy, Culture, and Economic Development. IntechOpen. https://doi.org/10.5772/intechopen.91457.
Mohd Shazwan Shuhaimen, Nurul Hana Ahmad Ghazali, Kevin Wong Tho Foo, Loke Po Ling, and Sarah Syamimi Mohd Suhaimi. 2021. “Box Article 1: Rethinking Investment Incentives.” In BNM Quarterly Bulletin 3Q 2017. BNM Quarterly Bulletin. Bank Negara Malaysia.
MOHE. 2020. “Graduate Tracer Study 2019.” Putrajaya: Ministry of Higher Education.
MOHR. 2012. “Introduction to the Project of Unemployment Insurance Scheme in Malaysia.” https://www.social-protection.org/gimi/RessourcePDF.action;jsessionid=iAZfueWdXvO3R6FMeUdfDzhW50loBsPPeSBvzDniA4xhoE3-DGpM!539423187?id=40144.
Muhammed Abdul Khalid, Hawati Abdul Hamid, Jarud Romadan Khalidi, Gregory Wai Son Ho, and Adam Manaf Mohamed Firouz. 2017. “Climbing the Ladder: Socio-Economic Mobility in Malaysia.” Kuala Lumpur: Khazanah Research Institute.
Munnell, Alicia H., and Steven A. Saas. 2008. Working Longer: The Solution to the Retirement Income Challenge. Washington D.C.: Brookings Institution Press.
NAFAS. n.d. “National Farmers Organization.” n.d. http://nafas.com.my/v2/index.php?option=com_content&view=article&id=442&Itemid=408&lang=my.
Nankervis, Alan, Chris Rowley, and Noorziah Mohd Salleh, eds. 2016. “Asia Pacific Human Resource Management and Organisational Effectiveness.” In Asia Pacific Human Resource Management and Organisational Effectiveness, xiii–xviii. Chandos Publishing. https://doi.org/10.1016/B978-0-08-100643-6.11001-2.
Narayanan, Suresh. 1996. “Fiscal Reform in Malaysia: Behind a Successful Experience.” Asian Survey 36 (9): 869–81. https://doi.org/10.2307/2645536.
———. 2002. “Old Age Support for Private Sector Employees in Malaysia: Can the Employees Provident Fund Do Better?” Hitotsubashi Journal of Economics 43.
NASH. n.d. “National Organization of Smallholders.” n.d. http://www.pkpkm.org.my/v2/main.php?lang=en.
Nguyen, Q. A., and N. M. Simoes da Cunha. 2019. “Extension of Social Security to Workers in Informal Employment in the ASEAN Region.” Geneva: International Labor Organization.
NST. 2019. “1.71 Million Civil Servants on Govt Payroll as of March 2019.” New Straits Times, 2019. https://www.nst.com.my/news/government-public-policy/2019/04/484308/171-million-civil-servants-govt-payroll-march-2019.
———. 2020. “Finance Ministry: Can Apply for i-Lestari Withdrawal Facility from April 1.” New Straits Times, 2020. https://www.nst.com.my/news/nation/2020/03/577441/finance-ministry-can-apply-i-lestari-withdrawal-facility-april-1.
———. 2021. “Grab, Foodpanda Delivery Partners Now Covered by SOCSO.” New Straits Times, 2021. https://www.nst.com.my/news/nation/2021/07/709033/grab-foodpanda-delivery-partners-now-covered-socso.
Nur Thuraya Sazali and Siti Aiysyah Tumin. 2020. “Leaving No Worker Behind: Deficit in Decent Work.” Kuala Lumpur: Khazanah Research Institute.
Nur Thuraya Sazali, and Zhai Gen Tan. 2019. “The Demise of Formal Employment? — A Literature Update on Informality.” Kuala Lumpur: Khazanah Research Institute.
Nurin Haniah Asmuni, Sachi Purcal. 2018. “On the Study of Malaysia’s Private Annuity.” Journal of Quality Measurement and Analysis 14 (1).
O’Brien, Clare, Rebecca Holmes, Zoë Scott, and V. Barca. 2018. “Shock-Responsive Social Protection Systems Toolkit.” Oxford, UK: OPM.
ODI and UNICEF. 2020. “Universal Child Benefits: Policy Issues and Options.” London: Overseas Development Institute United Nations Children’s Fund.
OECD. 2003. “OECD Glossary of Statistical Terms - Economies of Scale Definition.” OECD. 2003. https://stats.oecd.org/glossary/detail.asp?ID=3203.
REFERENCES
190 KHAZANAH RESEARCH INSTITUTE
———. 2015. “Pensions at a Glance 2015, OECD and G20 Indicators.” Paris: OECD Publishing.
———. 2016. Life Annuity Products and Their Guarantees. OECD. https://doi.org/10.1787/9789264265318-en.
———. 2019a. “OECD Social Expenditure Database - Social Expenditure: Detailed Data.” 2019. https://stats.oecd.org/Index.aspx?DataSetCode=SOCX_DET&_ga=2.47677927.1560509674.1621495878-48760098.1614914656.
———. 2019b. “Pensions at a Glance 2019, OECD and G20 Indicators.” Paris: OECD Publishing.
———. 2020. “OECD Pensions Outlook 2020.” Paris: OECD Publishing.
OHCHR. 2019. “Statement by Professor Philip Alston, United Nations Special Rapporteur on Extreme Poverty and Human Rights, on His Visit to Malaysia, 13-23 August 2019.” Kuala Lumpur: Office of the High Commissioner for Human Rights.
———. 2020. “OHCHR High-Level Expert Meeting on Global Fund for Social Protection (Statement by Michelle Bachelet).” 2020. https://www.ohchr.org/EN/NewsEvents/Pages/DisplayNews.aspx?NewsID=26274&LangID=E.
Ong, Fong Sim and Tengku Aizan Hamid. 2010. “Social Protection in Malaysia - Current State and Challenges Towards Practical and Sustainable Social Protection in East Asia: A Compassionate Community.” In Social Protection in East Asia - Current State and Challenges, edited by Mukul Asher. Jakarta: ERIA Research Project Report.
OPHI and UNDP. 2020. “Global Multidimensional Poverty Index 2020 - Charting Pathways out of Multidimensional Poverty: Achieving the SDGs.” Official Poverty & Human Development Initiative United Nations Development Programme.
Ortiz, Isabel, Matthew Cummins, Jeronim Capaldo, and Kalaivani Karunanethy. 2015. “The Decade of Adjustment: A Review of Austerity Trends 2010-2020 in 187 Countries.” Extension of Social Security Series No. 53.
P&I. 2020. “List: The World’s Largest Retirement Funds.” New York: Pensions & Investments. 2020. https://www.pionline.com/interactive/list-worlds-largest-retirement-funds.
Piggott, John, and Renuka Sane. 2009. “Indexing Pensions.” Washington, DC: The World Bank.
Piketty, Thomas, and Emmanuel Saez. 2014. “Inequality in the Long Run.” Science 344 (6186): 838–43. https://doi.org/10.1126/science.1251936.
PMO. 2011. “2012 Budget Speech.” Putrajaya. https://www.pmo.gov.my/dokumenattached/speech/files/Belanjawan2012.pdf.
———. 2020. “2021 Budget Speech.” Prime Minister’s Office of Malaysia. http://www1.treasury.gov.my/pdf/speech/2021/bs21.pdf.
———. 2021. “PEMERKASA+ (Speech Text).” Prime Minister’s Office (blog). 2021. https://www.pmo.gov.my/2021/05/teks-ucapan-program-strategik-memperkasa-rakyat-dan-ekonomi-tambahan-pemerkasa/.
PwC. 2021. “Personal Income Tax (PIT) Rates.” Worldwide Tax Summaries. 2021. https://taxsummaries.pwc.com/quick-charts/personal-income-tax-pit-rates.
Rabi, Amjad, Norma Mansor, Halimah Awang, and Nurul Diyana Kamarulzaman. 2019. “Longevity Risk and Social Old-Age Protection in Malaysia: Situation Analysia and Options for Refor.” Kuala Lumpur: Social Wellbeing Research Centre (SWRC).
Redmond, Gerry, Rodrigo Praine, Noore Siddiquee, and Mohd Zin Mohamed. 2016. “Child Deprivation in Malaysia: Final Report for UNICEF.” Adelaide: School of Social and Policy Studies, Flinders University.
Roll, Kate. 2020. “Gig Work at the Base of the Pyramid: Considering Dependence and Control.” UCL Institute for Innovation and Public Purpose.
SAGC. n.d. Old Age Assistance Scheme Regulations 1982. The State Attorney-General’s Chambers of Sabah.
Saidatulakmal Mohd, Norma Mansor, Halimah Awang, Shamsulbahriah Ku Ahmad, Norma Mansor, and Halimah Awang. 2015. “Population Ageing, Poverty and Social Pension in Malaysia.” In Revisiting Malaysia’s Population–Development Nexus, edited by Cheong Kee Cheok Tey Nai Peng Rajah Rasiah. Kuala Lumpur: Faculty of Economics and Administration (FEA), University of Malaya.
Samson, Michael, Gaspar Fajth, and Daphne François. 2016. “Cognitive Capital, Equity and Child-Sensitive Social Protection in Asia and the Pacific.” BMJ Global Health 1 (Suppl 2): i19–26. https://doi.org/10.1136/bmjgh-2016-000191.
Save the Children. n.d. “Investing in Childhood.” Connecticut: Save the Children.
SC. 2019. “Annual Report 2020.” Kuala Lumpur: Securities Commission.
Sergei Scherbov, Warren C. Sanderson. 2020. “New Approaches to the Conceptualization and Measurement of Age and Ageing.” In Developments in Demographic Forecasting. The Springer Series on Demographic Methods and Population Analysis, edited by Nico Keilman Stefano Mazzuco. Springer, Cham.
Singh, Paguman. 1991. “Social Security in Malaysia.” In Safety at Work in Malaysia: An Anthology of Current Research, edited by Arne Wangel Colin Nicholas. Kuala Lumpur: University of Malaya.
Siti Aiysyah Tumin. 2021. “Labour Market Gaps: More than Just Unemployment.” http://www.krinstitute.org/Views-@-Labour_market_gaps-;_More_than_just_unemployment.aspx.
SOCSO. 2013. “PEKELILING MAJIKAN NO. 2 TAHUN 2013: SKIM PERLINDUNGAN KESELAMATAN SOSIAL KEPADA KAKITANGAN AWAM BERTARAF SEMENTARA DAN KONTRAK.” Social Security Organisation. https://www.perkeso.gov.my/images/arahan/Pekeliling_Majikan_Bil._2_Tahun_2013.pdf.
———. 2019. “Annual Report, 2018.” Kuala Lumpur: Social Security Organisation.
———. 2020a. “Employment Insurance System Interim Report 2020.” Kuala Lumpur: Social Security Organisation.
REFERENCES
KHAZANAH RESEARCH INSTITUTE 191
———. 2020b. “Employment Outlook 2019.” Social Security Organisation.
———. 2021a. “Data Requested from SOCSO on Total Contributors for Social Security Schemes, 2020.” Kuala Lumpur: Social Security Organisation.
———. 2021b. “SOCSO: PEMULIH.” 2021. https://www.perkeso.gov.my/pemulih.html.
———. n.d.-a. “Domestic Workers.” https://www.perkeso.gov.my/en/our-services/protection/employees-social-security-act-1969-act-4/domestic-workers.html.
———. n.d.-b. “Employment Injury Scheme.” https://www.perkeso.gov.my/index.php/en/30-social-security-protection/social-security-protection-scheme/55-employment-injury-scheme.
———. n.d.-c. “Employment Insurance Scheme (Benefits).” https://eiscentre.perkeso.gov.my/eis-benefits/.
———. n.d.-d. “Frequently Asked Questions.” https://www.perkeso.gov.my/en/frequently-asked-question.html#9-q-what-type-of-accidents-are-claimable-under-act-789.
———. n.d.-e. “Invalidity Scheme.” https://www.perkeso.gov.my/en/our-services/protection/employees-social-security-act-1969-act-4/invalidity-scheme.html.
———. n.d.-f. “Social Security Contributions Rate.” n.d.-. https://www.perkeso.gov.my/en/rate-of-contribution.html.
———. n.d.-g. “SOCSO.” n.d.-. https://www.perkeso.gov.my/en/about-us/corporate-information/profile.html.
SSA. n.d.-a. “Definitions of Life Table Functions.” Social Security Administration. n.d.-. https://www.ssa.gov/OACT/HistEst/CohLifeTables/LifeTableDefinitions.pdf.
———. n.d.-b. “Social Security History.” Social Security Administration. https://www.ssa.gov/history/ottob.html.
———.n.d.-c. “Social Security Programs Throughout the World.” SSA. https://www.ssa.gov/policy/docs/progdesc/ssptw/index.html.
Su, T., and V. C. W. Hoe. 2008. “Awareness on Ex-Gratia Compensation Scheme Among Medical Department Staff in a Tertiary Government Hospital in Kuala Lumpur.” Med J Malaysia 63 (4).
Suraya Ismail, Christopher Choong, Hawati Abdul Hamid, Fareza Mustapha, Gregory Ho, Tan Theng Theng, Muhammad Nazhan Kamaruzuki, and Adam Manaf Mohamed Firouz. 2019. “Rethinking Housing: Between State, Market and Society: A Special Report for the Formulation of the National Housing Policy (2018–2025), Malaysia.” Kuala Lumpur: Khazanah Research Institute.
Syed, M., and M. Badia. 2018. “Assessing Fiscal Space: An Update and Stocktaking.” IMF Policy Paper. http://www.imf.org/external/pp/ppindex.aspx.
Tendler, Judith. 2004. “Why Social Policy Is Condemned to a Residual Category of Safety Nets and What to Do about It.” In Social Policy in a Development Context, 119–42. London: Palgrave Macmillan.
Tengku Aizan Hamid. 2019. “Ageing in Malaysia.” In . Bangkok.
The Edge. 2019a. “The State of the Nation: Finding Room to Lighten the Middle-Income Tax Burden.” The Edge Markets, July 22, 2019. https://www.theedgemarkets.com/article/state-nation-finding-room-lighten-middleincome-tax-burden.
———. 2019b. “Cover Story: Can the Civil Service Be Downsized?” The Edge Markets, October 3, 2019. http://www.theedgemarkets.com/article/cover-story-can-civil-service-be-downsized.
———. 2020. “The State Of The Nation: Tiered Dividend Necessary to Help Low-Income EPF Members.” The Edge, 2020. https://www.theedgemarkets.com/article/state-nation-tiered-dividend-necessary-help-lowincome-epf-members.
The Guardian. 2013. “Job Security Is a Thing of the Past - so Millions Need a Better Welfare System.” The Guardian, 2013. https://www.theguardian.com/commentisfree/2013/may/21/job-security-welfare-flexible-labour-precariat.
———. 2020. “Prop 22 Explained: How California Voters Could Upend the Gig Economy.” The Guardian, 2020. https://www.theguardian.com/us-news/2020/oct/15/proposition-22-california-ballot-measure-explained.
———. 2021. “‘I Can’t Keep Doing This’: Gig Workers Say Pay Has Fallen after California’s Prop 22.” The Guardian, 2021. https://www.theguardian.com/us-news/2021/feb/18/uber-lyft-doordash-prop-22-drivers-california.
The Star. 2020a. “Amendment to Increase Maternity Leave and Alow Paternity Leave in Final Stages.” The Star Online, 2020. https://www.thestar.com.my/news/nation/2020/11/12/govt039s-bid-to-amend-law-to-increase-maternity-leave-and-provide-for-paternity-leave-in-final-stages-says-deputy-minister.
———. 2020b. “SOCSO Wants Self-Employed M’sians to Sign up.” The Star. January 4, 2020. https://www.thestar.com.my/news/nation/2020/01/04/socso-wants-self-employed-msians-to-sign-up.
———. 2021a. “Many Self-Employed Workers Not Contributing to SOCSO.” The Star. 2021. https://www.thestar.com.my/metro/metro-news/2021/02/23/many-self-employed-workers-not-contributing-to-socso.
———. 2021b. “SOCSO Coverage Extended to Domestic Workers from June 1, Says CEO.” The Star Online, 2021. https://www.thestar.com.my/news/nation/2021/06/04/socso-coverage-extended-to-domestic-workers-from-june-1-says-ceo.
———. 2021c. “Tengku Zafrul to Propose Raising Statutory Debt Limit to 65%.” The Star. 2021. https://www.thestar.com.my/business/business-news/2021/09/03/tengku-zafrul-to-propose-raising-statutory-debt-limit-to-65.
Theodore, Nik, Beth Gutelius, and Linda Burnham. 2019. “Workplace Health and Safety Hazards Faced by Informally Employed Domestic Workers in the United States.” Workplace Health & Safety 67 (1): 9–17.
REFERENCES
192 KHAZANAH RESEARCH INSTITUTE
Thome, Karen, J. Edward Taylor, Mateusz Filipski, Benjamin Davis, and Sudhanshu Handa. 2016. “The Local Economy Impacts of Social Cash Transfers A Comparative Analysis of Seven Sub-Saharan Countries.” Rome: Food and Agriculture Organization of the United Nations.
Tiun, Ling Ta, and Suet Leng Khoo. 2013. “Challenges Faced by Malaysians with Disabilities in the World of Employment.” Disability, CBR & Inclusive Development 24 (1): 6–21.
TMR. 2020a. “Outstanding GST Refund to Be Paid by Year-End.” The Malaysian Reserve. August 4, 2020. https://themalaysianreserve.com/2020/08/04/outstanding-gst-refund-to-be-paid-by-year-end/.
———. 2020b. “Only 10% Grab Drivers Protected by SOCSO.” The Malaysian Reserve. December 10, 2020. https://themalaysianreserve.com/2020/12/10/only-10-grab-drivers-protected-by-socso/.
UN. 1982. “Report of the World Assembly on Aging.” New York: The United Nations.
———. 2000. “Enhancing Social Protection and Reducing Vulnerability in a Globalizing World.” Report of the Secretary General to the Thirty-Ninth Session E/CN. 5/2001/2. United Nations Economic and Social Council Washington, DC.
———. 2015. “Transforming Our World: The 2030 Agenda for Sustainable Development.” 2015. https://sdgs.un.org/2030agenda.
———. 2019a. “World Population Ageing 2019: Highlights.” New York: The United Nations.
———. 2019b. “World Population Prospects 2019.” Translated by Population Division Department of Economic and Social Affairs. United Nations.
———. n.d. “Youth.” United Nations. n.d. https://www.un.org/en/global-issues/youth.
UN General Assembly. 1989. “Convention on the Rights of the Child.” 1989. https://www.refworld.org/docid/3ae6b38f0.html.
UNDESA. 2018. Promoting Inclusion through Social Protection: Report on the World Social Situation 2018. Report on the World Social Situation 2018. New York, NY: United Nations Department of Economic and Social Affairs.
UNDP. 2021. “Issue Brief: Unified Social Registry: Towards An Efficient Social Protection System.”
UNFA. n.d. “Demographic Dividend.” United Nations Population Fund. https://www.unfpa.org/demographic-dividend.
UNICEF. 2019a. Children Out of School. Putrajaya: United Nations Children’s Fund.
———. 2019b. The State of the World’s Children 2019. Children, Food and Nutrition: Growing Well in a Changing World. New York, NY: United Nations Children’s Fund.
———. 2019c. “Universal Child Benefit Case Studies: The Experience of Argentina.” New York: UNICEF.
———. 2019d. “Universal Child Benefit Case Studies: The Experience of Mongolia.” New York: UNICEF.
———. 2019e. “Universal Child Benefit Case Studies: The Experience of South Africa.” New York: UNICEF. https://www.unicef.org/media/70486/file/ZAF-case-study-2020.pdf.
———. n.d.-a. “Child Poverty.” United Nations Children’s Fund. n.d.-. https://www.unicef.org/social-policy/child-poverty.
———. n.d.-b. “Frequently Asked Questions on the Convention on the Rights of the Child.” UNICEF. https://www.unicef.org/child-rights-convention/frequently-asked-questions.
UNSDG. n.d. “Leave No One Behind.” United Nations Sustainable Development Group. https://unsdg.un.org/2030-agenda/universal-values/leave-no-one-behind.
WHO. n.d.-a. “Body Mass Index - BMI.” Copenhagen: World Health Organization. https://www.euro.who.int/en/health-topics/disease-prevention/nutrition/a-healthy-lifestyle/body-mass-index-bmi.
———. n.d.-b. “Global Health Observatory Data Repository.” World Health Organization.
Woo, Wing Thye. 2009. “Getting Malaysia Out of the Middle-Income Trap.” SSRN Scholarly Paper ID 1534454. Rochester, NY: Social Science Research Network. https://doi.org/10.2139/ssrn.1534454.
World Bank. 1999. Social Risk Management Conceptual Underpinnings for the Social Protection Sector Strategy Paper. Washington, DC: The World Bank.
———. 2015. “Safety Nets in Africa : Effective Mechanisms to Reach the Poor and Most Vulnerable.” Washington, DC: The World Bank.
———. 2018. “Case Study on the Employees Provident Fund of Malaysia.” Washington, DC: World Bank.
———. 2020a. “A Silver Lining: Productive and Inclusive Aging for Malaysia.” Washington, DC: The World Bank.
———. 2020b. “Malaysia Economic Monitor, June 2020: Surviving the Storm.” Washington, DC: World Bank.
———. 2020c. “Surviving the Storm.” Washington, DC: The World Bank.
———. 2021a. “Aiming High : Navigating the Next Stage of Malaysia’s Development.” Washington, DC: The World Bank.
———. 2021b. “June 2021 Global Economic Prospects: A Strong but Uneven Recovery.” Washington, DC: The World Bank.
———. 2021c. “Malaysia Economic Monitor, June 2021: Weathering the Surge.” Washington, DC: World Bank.
———. n.d.-a. “ASPIRE: The Atlas of Social Protection Indicators of Resilience and Equity.” https://www.worldbank.org/en/data/datatopics/aspire.
———. n.d.-b. “World Bank Open Data.” https://data.worldbank.org/.
Xiaoqing, Yu. 2016. “Social Protection Tools for the 21st Century.” 2016. https://blogs.worldbank.org/voices/social-protection-tools-21st-century.
Zainal Abidin Mohd Kassim. 2003. “The Annuity Malaysia Experience.” Kuala Lumpur: MERCER.


Level 25 Mercu UEM Jalan Stesen Sentral 5 Kuala Lumpur Sentral 50470 Kuala Lumpur MALAYSIA Tel: +603 2034 0000
www.KRInstitute.org