KRI Basics for Financial Institutions - Galvanize
13
KRI BASICS FOR FINANCIAL INSTITUTIONS HOW BANKS, CREDIT UNIONS, & NON-BANK LENDERS CAN IMPLEMENT THIS CRUCIAL PART OF RISK MANAGEMENT White Paper
-
Upload
khangminh22 -
Category
Documents
-
view
3 -
download
0
Transcript of KRI Basics for Financial Institutions - Galvanize
KRI BASICS FOR FINANCIAL INSTITUTIONSH O W B A N K S , C R E D I T U N I O N S , & N O N - B A N K L E N D E R S C A N I M P L E M E N T T H I S C R U C I A L PA R T O F R I S K M A N A G E M E N T
Whi
te P
aper
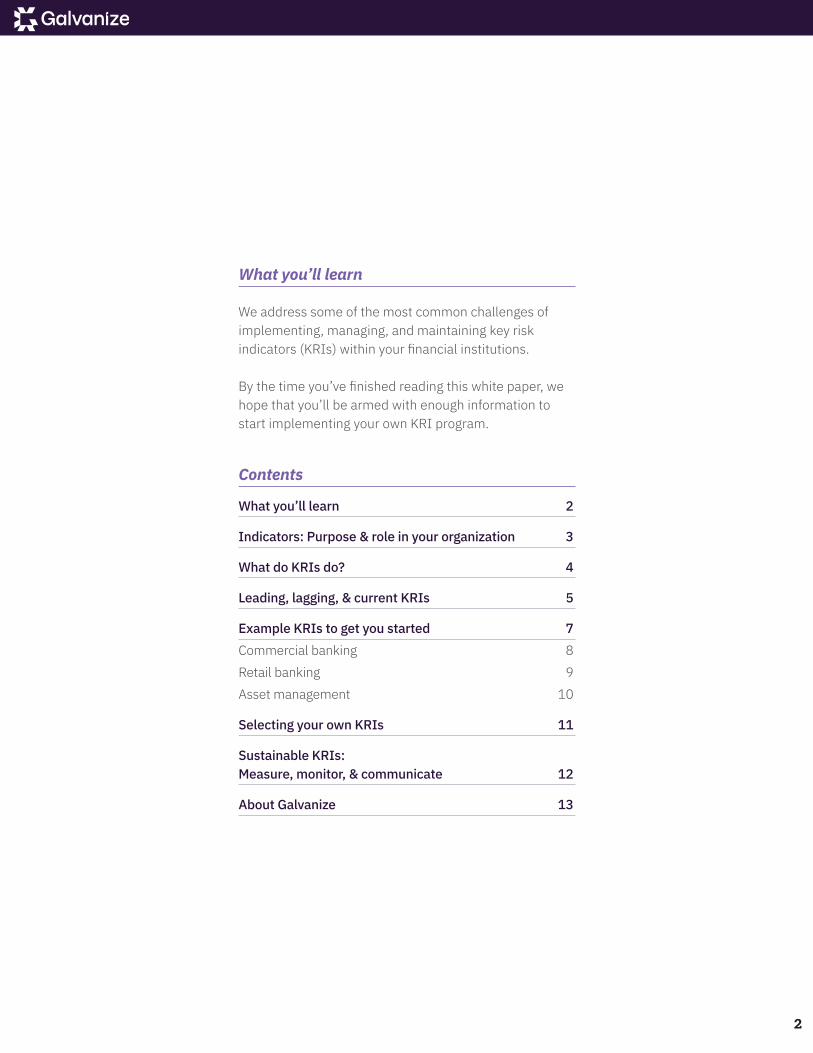
What you’ll learn
We address some of the most common challenges of implementing, managing, and maintaining key risk indicators (KRIs) within your financial institutions. By the time you’ve finished reading this white paper, we hope that you’ll be armed with enough information to start implementing your own KRI program.
Contents
What you’ll learn 2
Indicators: Purpose & role in your organization 3
What do KRIs do? 4
Leading, lagging, & current KRIs 5
Example KRIs to get you started 7Commercial banking 8Retail banking 9Asset management 10
Selecting your own KRIs 11
Sustainable KRIs: Measure, monitor, & communicate 12
About Galvanize 13
2

Indicators: Purpose & role in your organization
Well-governed organizations track three types of indicator metrics.
INDICATOR METRIC WHAT DOES IT MEASURE? WHAT’S THE PURPOSE? WHO IS THE AUDIENCE?
Key performance indicator (KPI)
KPIs measure how effectively the organization is achieving its business objectives.
They provide directional insight on how you’re progressing toward strategic objectives, or the effectiveness of specific business processes or control objectives.
Strategic KPIs
Most often executive management and the board.
Operational KPIs
Most often managers, operational process owners, and department heads.
Key risk indicator (KRI)
KRIs measure how risky certain activities are in relation to business objectives.
They provide early warning signals when risks (both strategic and operational) move in a direction that may prevent the achievement of KPIs.
Strategic KRIs
Most often executive management and the board.
Operational KRIs
Most often managers, operational process owners, and department heads.
Key control effectiveness indicator (KCI)
KCIs measure how well controls are working.
They provide direct insight into a specific control activity, procedure, or process that wasn’t implemented or followed correctly.
Most often front-line control activity owners.
The Institute of Operational Risk states that the difference between risk, control effectiveness, and performance indicators is largely conceptual.
“The same piece of data may indicate different things to different users of that data, implying that the nature of an indicator changes
depending on its use.”
3
What do KRIs do?
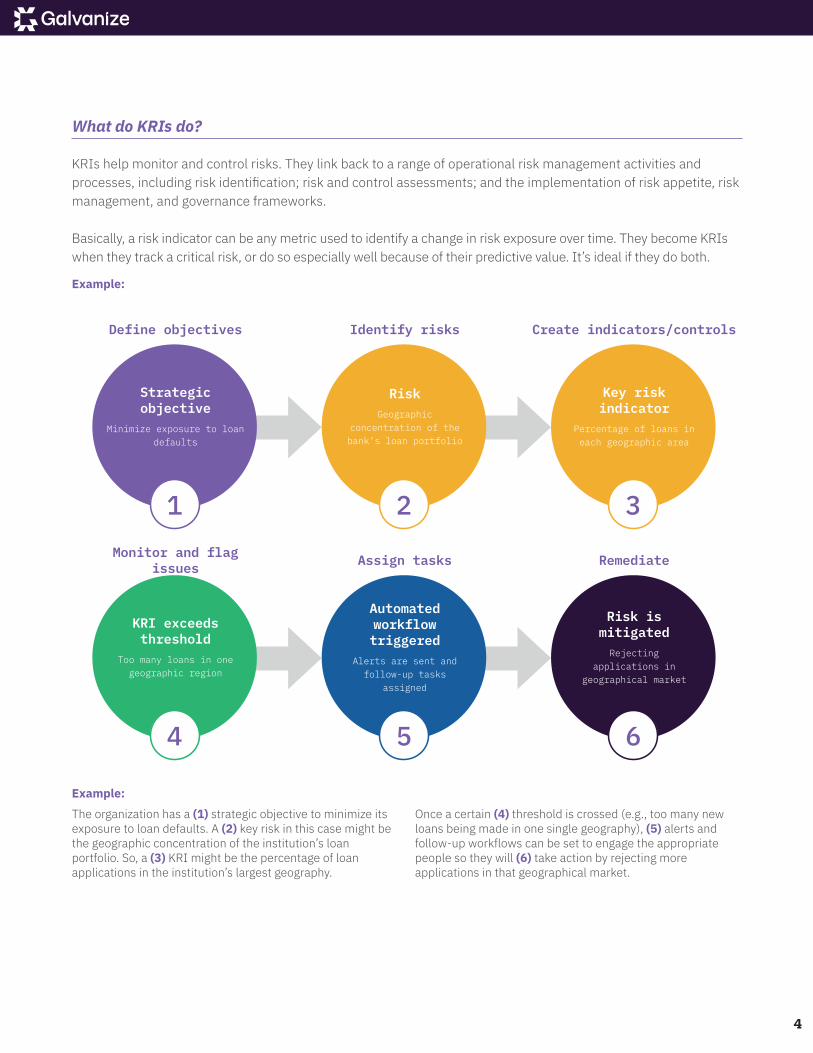
KRIs help monitor and control risks. They link back to a range of operational risk management activities and processes, including risk identification; risk and control assessments; and the implementation of risk appetite, risk management, and governance frameworks. Basically, a risk indicator can be any metric used to identify a change in risk exposure over time. They become KRIs when they track a critical risk, or do so especially well because of their predictive value. It’s ideal if they do both.
Example:
Example:The organization has a (1) strategic objective to minimize its exposure to loan defaults. A (2) key risk in this case might be the geographic concentration of the institution’s loan portfolio. So, a (3) KRI might be the percentage of loan applications in the institution’s largest geography.
Once a certain (4) threshold is crossed (e.g., too many new loans being made in one single geography), (5) alerts and follow-up workflows can be set to engage the appropriate people so they will (6) take action by rejecting more applications in that geographical market.
4
KRI exceeds threshold
Too many loans in one geographic region
5
Automated workflow triggered
Alerts are sent and follow-up tasks
assigned
6
Risk is mitigatedRejecting
applications in geographical market
3
Key risk indicator
Percentage of loans in each geographic area
2
RiskGeographic
concentration of the bank’s loan portfolio
1
Strategic objective
Minimize exposure to loan defaults
Monitor and flag issues Assign tasks Remediate
Create indicators/controlsIdentify risksDefine objectives
4
Leading, lagging, & current KRIs
KRIs can provide information on the current state of your risk, as well as events that might happen in the future, or events that happened in the past. These are classified as: 1 Leading indicators. Emerging risk trends for events that
might happen in the future and need to be addressed. For example, the number of employees who click on fake phishing emails.
2 Current indicators. Where you currently sit with your risk exposure. For example, the number of staff who haven’t completed mandatory security training.
3 Lagging indicators. Past events that could occur again. For example, the time between employee termination and deletion of accounts.
“In my experience, KRIs deliver substantially more value when they’re
either leading or current. This is because of their predictive nature relative to the business objective or KPI that they support. While current indicator KPIs measure performance, the best KRIs help us predict how
to improve that performance.”
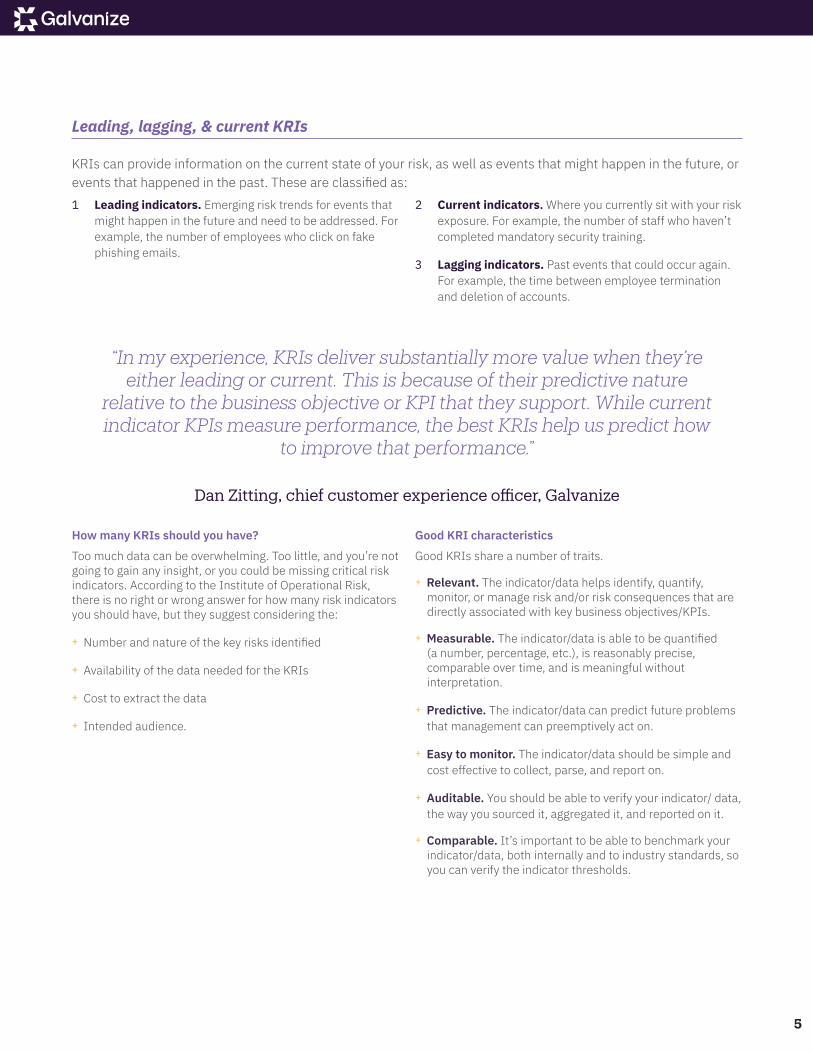
Dan Zitting, chief customer experience officer, Galvanize
How many KRIs should you have?Too much data can be overwhelming. Too little, and you’re not going to gain any insight, or you could be missing critical risk indicators. According to the Institute of Operational Risk, there is no right or wrong answer for how many risk indicators you should have, but they suggest considering the:
+ Number and nature of the key risks identified
+ Availability of the data needed for the KRIs
+ Cost to extract the data
+ Intended audience.
Good KRI characteristicsGood KRIs share a number of traits.
+ Relevant. The indicator/data helps identify, quantify, monitor, or manage risk and/or risk consequences that are directly associated with key business objectives/KPIs.
+ Measurable. The indicator/data is able to be quantified (a number, percentage, etc.), is reasonably precise, comparable over time, and is meaningful without interpretation.
+ Predictive. The indicator/data can predict future problems that management can preemptively act on.
+ Easy to monitor. The indicator/data should be simple and cost effective to collect, parse, and report on.
+ Auditable. You should be able to verify your indicator/ data, the way you sourced it, aggregated it, and reported on it.
+ Comparable. It’s important to be able to benchmark your indicator/data, both internally and to industry standards, so you can verify the indicator thresholds.
5
“The intended audience and purpose is really the most important thing to consider,” says Dan Zitting, chief customer experience officer at Galvanize. “By clearly separating strategic KRIs that support strategy-level business objectives from operational KRIs that support operational or process-level objectives, KRIs become naturally managed into groups that are digestible and useful to the intended audiences.
At the strategic/enterprise level, I’ll typically target no more than 15–30 strategic risks (depending on the size and scope of strategic objectives in the organization’s strategic plan), and no more than a few KRIs per strategic risk. So at the strategic level, we often find a KRI library of 20–30 total—one that can cover the strategic health of the enterprise, but also roughly the high end of what can be consumed in the strategy-level executive and board conversation. At the operational/process level, good value is found in the range of 3–12 operational risks per process, as outside that range probably indicates a process either really isn’t a process or a process needs to be broken up into multiple processes. Typically, an operational risk has a one-to-one relationship with the relevant KRI, thus typically no more than 5–15 KRIs per process area. Summary KRIs (i.e., a KRI itself that is the number of positive or negative KRIs below) may be used for business unit managers to get a more holistic perspective on the operational health of their complete sphere of accountability.”
6
Example KRIs to get you started
Now you know what KRIs do, what makes a good KRI, and how KRIs differ (and relate to) KPIs and KCIs. The next step is identifying the KRIs that would work for your organization. But choosing which KRIs to implement at your organization isn’t always as easy as picking from a universal set of indicators. First, each business or organization has a number of different factors that come into play—like objectives, culture, products, processes, and other activities—that will define which KRIs should be monitored. For IT governance, your lists of KRIs will vary based on the products you offer, your regulator(s), where you’re operating, and your organization’s unique objectives and priorities. Second, KRIs aren’t static. They need to be monitored and updated as your business objectives change and evolve. This will be unique to almost every organization and is the main reason why going off a list shouldn’t be your only approach. That said, we’ve included a couple of lists of potential KRIs for financial services organizations here for you to consider as inspiration for defining your own initial set. These lists come from the Institute of Operational Risk, Key Risk Indicators.
For banks and credit unions, your list of KRIs will vary
based on the products you offer, your regulators, where you’re operating, and your institution’s unique objectives
and priorities.
7
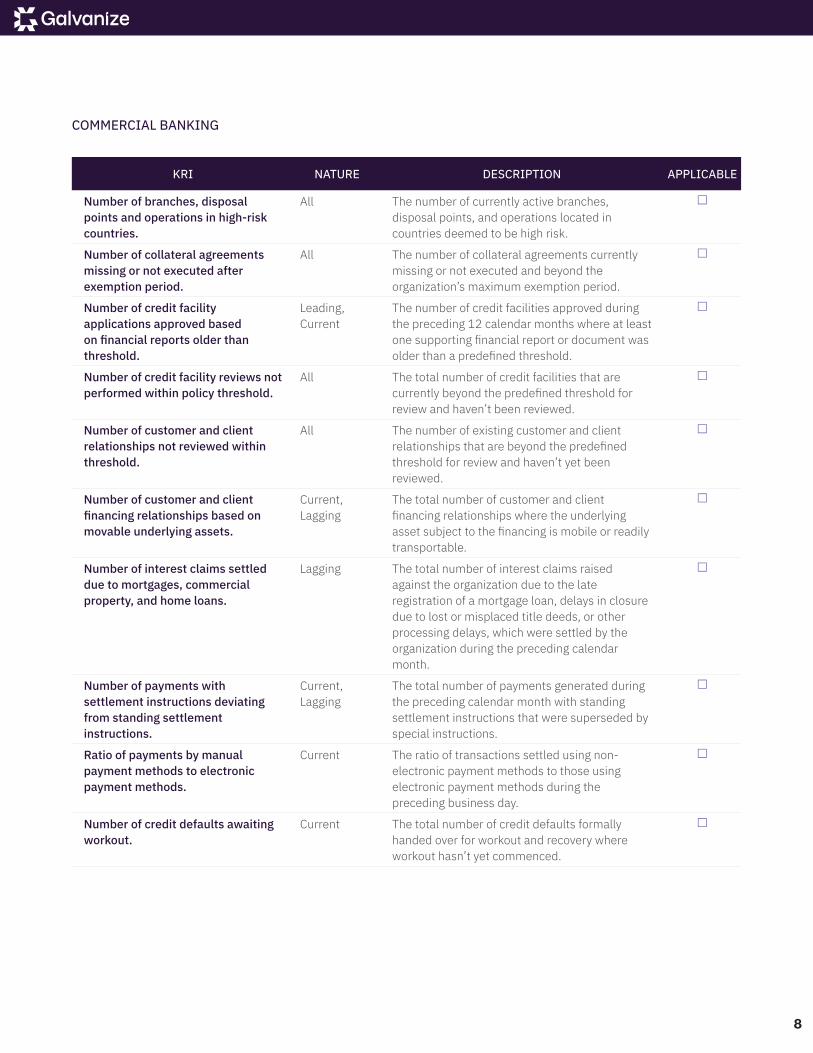
COMMERCIAL BANKING
KRI NATURE DESCRIPTION APPLICABLE
Number of branches, disposal points and operations in high-risk countries.
All The number of currently active branches, disposal points, and operations located in countries deemed to be high risk.
n
Number of collateral agreements missing or not executed after exemption period.
All The number of collateral agreements currently missing or not executed and beyond the organization’s maximum exemption period.
n
Number of credit facility applications approved based on financial reports older than threshold.
Leading, Current
The number of credit facilities approved during the preceding 12 calendar months where at least one supporting financial report or document was older than a predefined threshold.
n
Number of credit facility reviews not performed within policy threshold.
All The total number of credit facilities that are currently beyond the predefined threshold for review and haven’t been reviewed.
n
Number of customer and client relationships not reviewed within threshold.
All The number of existing customer and client relationships that are beyond the predefined threshold for review and haven’t yet been reviewed.
n
Number of customer and client financing relationships based on movable underlying assets.
Current, Lagging
The total number of customer and client financing relationships where the underlying asset subject to the financing is mobile or readily transportable.
n
Number of interest claims settled due to mortgages, commercial property, and home loans.
Lagging The total number of interest claims raised against the organization due to the late registration of a mortgage loan, delays in closure due to lost or misplaced title deeds, or other processing delays, which were settled by the organization during the preceding calendar month.
n
Number of payments with settlement instructions deviating from standing settlement instructions.
Current, Lagging
The total number of payments generated during the preceding calendar month with standing settlement instructions that were superseded by special instructions.
n
Ratio of payments by manual payment methods to electronic payment methods.
Current The ratio of transactions settled using non-electronic payment methods to those using electronic payment methods during the preceding business day.
n
Number of credit defaults awaiting workout.
Current The total number of credit defaults formally handed over for workout and recovery where workout hasn’t yet commenced.
n
8
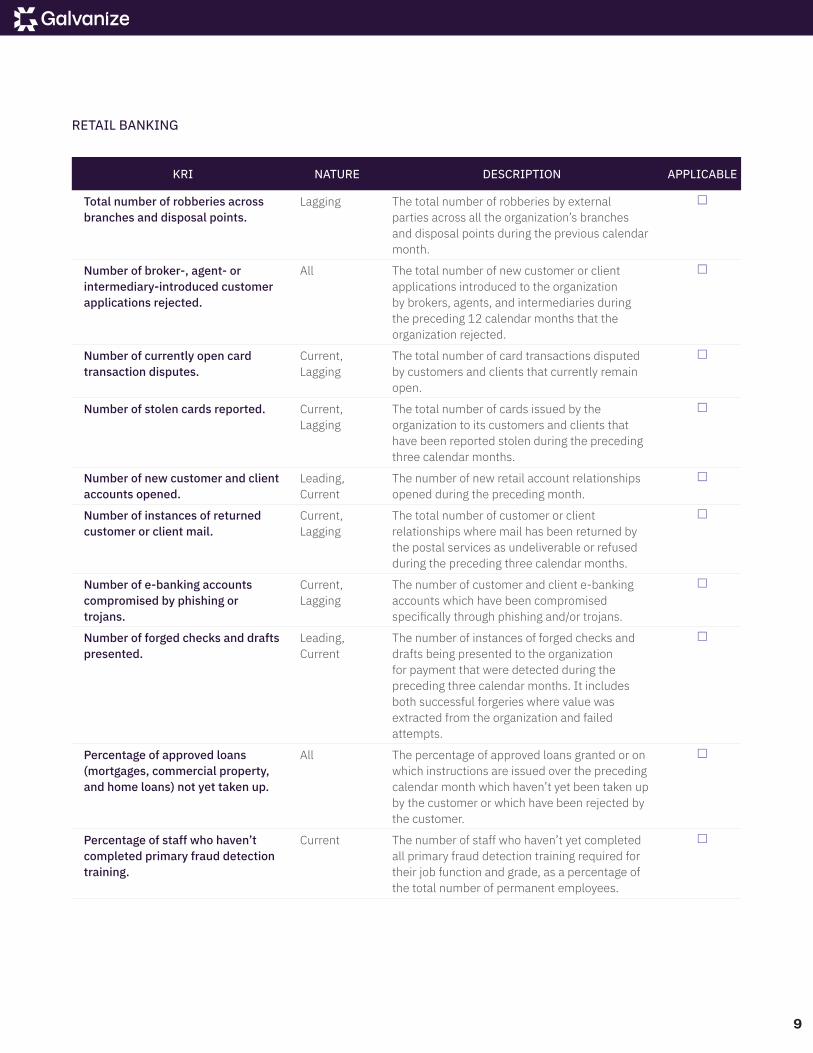
RETAIL BANKING
KRI NATURE DESCRIPTION APPLICABLE
Total number of robberies across branches and disposal points.
Lagging The total number of robberies by external parties across all the organization’s branches and disposal points during the previous calendar month.
n
Number of broker-, agent- or intermediary-introduced customer applications rejected.
All The total number of new customer or client applications introduced to the organization by brokers, agents, and intermediaries during the preceding 12 calendar months that the organization rejected.
n
Number of currently open card transaction disputes.
Current, Lagging
The total number of card transactions disputed by customers and clients that currently remain open.
n
Number of stolen cards reported. Current, Lagging
The total number of cards issued by the organization to its customers and clients that have been reported stolen during the preceding three calendar months.
n
Number of new customer and client accounts opened.
Leading, Current
The number of new retail account relationships opened during the preceding month.
n
Number of instances of returned customer or client mail.
Current, Lagging
The total number of customer or client relationships where mail has been returned by the postal services as undeliverable or refused during the preceding three calendar months.
n
Number of e-banking accounts compromised by phishing or trojans.
Current, Lagging
The number of customer and client e-banking accounts which have been compromised specifically through phishing and/or trojans.
n
Number of forged checks and drafts presented.
Leading, Current
The number of instances of forged checks and drafts being presented to the organization for payment that were detected during the preceding three calendar months. It includes both successful forgeries where value was extracted from the organization and failed attempts.
n
Percentage of approved loans (mortgages, commercial property, and home loans) not yet taken up.
All The percentage of approved loans granted or on which instructions are issued over the preceding calendar month which haven’t yet been taken up by the customer or which have been rejected by the customer.
n
Percentage of staff who haven’t completed primary fraud detection training.
Current The number of staff who haven’t yet completed all primary fraud detection training required for their job function and grade, as a percentage of the total number of permanent employees.
n
9

ASSET MANAGEMENT
KRI NATURE DESCRIPTION APPLICABLE
Number of advisory staff with out-of-date accreditation.
All The number of accredited advisors representing or acting on behalf of the organization whose advisory license or accreditation is out of date at the point of measurement.
n
Number of best execution exceptions.
Leading The number of transactions not executed at the best price or terms available (or not following best practices intended to ensure they are) that were identified during the preceding three calendar months.
n
Percentage of customer and client product suitability approvals outstanding.
Leading, Current
The total number of currently outstanding customer and client product suitability approvals for products already offered to customers and clients, as a percentage of the total number of customer and client relationships.
n
Number of dealer, trader, or investment manager license exceptions.
Current The number of transactions executed by approved dealers, traders, and investment managers during the preceding 12 calendar months that didn’t comply with restrictions imposed by their trading licenses or where the individual lacked a current trading license.
n
Number of front-running instances detected.
Lagging The total number of front-running instances detected by the organization during the preceding three calendar months.
n
Number of investment guideline breaches detected.
Current, Lagging
The number of breaches of investment guidelines detected by the organization during the preceding 12 calendar months.
n
Number of investment portfolios without guidelines.
Leading, Current
The number of investment portfolios currently under the management of the organization for which no formal investment guidelines have been agreed upon with the customer.
n
Concentration growth of investments in new or high-risk investments, vehicles, or products.
All The growth by value in the composition of the value of a portfolio under management represented by investments, vehicles, and products that are either new or deemed to be high risk, during the preceding calendar month.
n
Number of orders and instructions executed without required authorization.
Current, Lagging
The total number of orders and instructions executed without the required authorization during the preceding calendar month.
n
Number of disputed transactions. Current, Lagging
The number of staff who haven’t yet completed all primary fraud detection training required for their job function and grade, as a percentage of the total number of permanent employees.
n
10
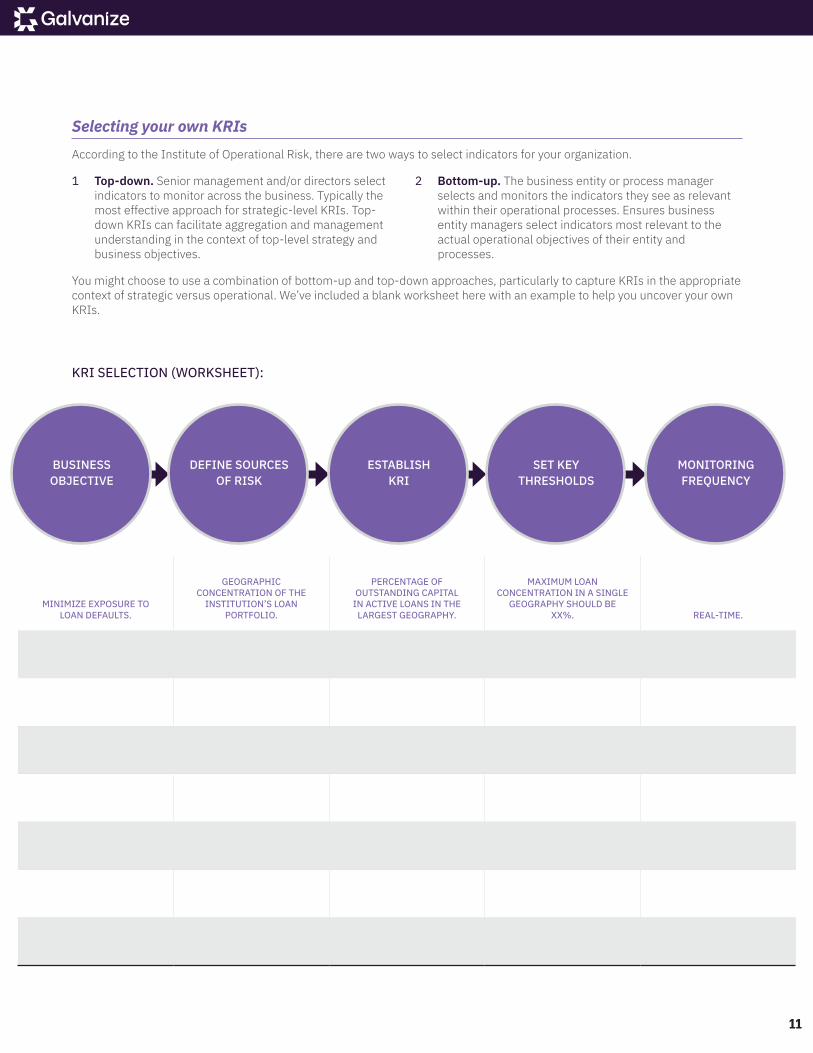
Selecting your own KRIsAccording to the Institute of Operational Risk, there are two ways to select indicators for your organization.
1 Top-down. Senior management and/or directors select indicators to monitor across the business. Typically the most effective approach for strategic-level KRIs. Top-down KRIs can facilitate aggregation and management understanding in the context of top-level strategy and business objectives.
2 Bottom-up. The business entity or process manager selects and monitors the indicators they see as relevant within their operational processes. Ensures business entity managers select indicators most relevant to the actual operational objectives of their entity and processes.
You might choose to use a combination of bottom-up and top-down approaches, particularly to capture KRIs in the appropriate context of strategic versus operational. We’ve included a blank worksheet here with an example to help you uncover your own KRIs.
KRI SELECTION (WORKSHEET):
BUSINESS OBJECTIVE
DEFINE SOURCES OF RISK
ESTABLISH KRI
SET KEY THRESHOLDS
MONITORING FREQUENCY
MINIMIZE EXPOSURE TO LOAN DEFAULTS.
GEOGRAPHIC CONCENTRATION OF THE
INSTITUTION’S LOAN PORTFOLIO.
PERCENTAGE OF OUTSTANDING CAPITAL
IN ACTIVE LOANS IN THE LARGEST GEOGRAPHY.
MAXIMUM LOAN CONCENTRATION IN A SINGLE
GEOGRAPHY SHOULD BE XX%. REAL-TIME.
11
Sustainable KRIs: Measure, monitor, & communicateSelecting and building alignment around which KRIs are right for your organization is the first step. Developing a program for sustainable, durable, and accurate measurement—as well as ongoing communication—of KRIs is the second step. WHY KRI PROGRAMS FAILIt may be quick to compile KRIs in Excel each month and then email your stakeholders, but if you take that approach, your program will inevitably fail, because:
+ Inaccuracies creep into spreadsheets
+ The staff who created them will eventually turn-over
+ People will drop the ball
+ Emails get overlooked.
KRI programs fail when they’re not implemented in a way that makes them easily consumable, flexible to change, and durable to deliver. It’s not because you’ve selected the wrong KRIs.
A single KRI that’s properly implemented and easily consumable online will grow into a sustainable KRI program almost every time. With the key skills and technology needed to deliver value, it’s easy to grow the number of KRIs in the library over time.
By contrast, a massive Excel-based library of the most fabulous KRIs will fail with certainty because they:
+ Aren’t accessible or timely
+ Are overly manual to prepare
+ Are vulnerable to error
+ Usually disappear when people leave or change jobs.
It’s better to start with fewer KRIs and lay the groundwork to implement them correctly, than to start with a full shopping list of KRIs that are poorly executed.
To create a solid, sustainable program that will deliver consistent value indefinitely, you need to go back to the basics and take an approach that considers people, process, and technology. PEOPLE
You need to have a solid understanding of what you expect from your KRI program to enable your team and put the right people in play to deliver. Specifically, consider the following:
+ Industry/business expertise. Who will evaluate and select the KRIs? The individual or team will require a solid level of risk management experience, industry experience, and general business savvy.
+ Software skills. How will you compile and deliver the KRIs? Assuming you’re making use of a sustainable data automation tool that has built-in reporting and dashboards, the individual or team will require basic software skills and baseline data analysis ability.
+ Analytical ability. Will any KRIs require statistical calculation or other complex data analytics? For example, “monthly total of anomalously large cash deposits” likely requires an underlying calculation, which requires knowledge of statistical concepts like standard deviation. The individual or team would need basic quantitative and statistical skills.
+ Advanced analysis. Will your KRIs require data science skills? For complex KRIs like “forecasted loss in market value on fixed income security options contract,” advanced data analysis models would be needed and you may consider hiring a data scientist.
+ Data access. Where will you get your data? If the individual or team managing the KRI program isn’t also the functional owner of all the data necessary to compile the KRIs, they will need skills around negotiating access to data, including implications on security and privacy.
12
PROCESSConsider and create sustainable processes for the KRI program itself. This is often overlooked or done ad hoc. Define and communicate each of the following processes:
1 Who will calculate, validate, and compile KRI measurement, how often, and using what methods?
2 How and when will you publish and communicate your KRIs?
3 How easy is it for stakeholders to get “self-service” with KRI reports and dashboards when they need data?
4 What’s the notification and remediation workflow when KRIs cross key thresholds or violate defined levels of risk appetite?
5 What’s the schedule for periodic program review, stakeholder feedback collection, and continuous improvement protocols for the overall program?
TECHNOLOGYExcel causes KRI programs to fail because the underlying analysis needed to create the KRI can’t be audited for accuracy by the program. There are no notifications for updates or violations of thresholds. The logic needed to calculate the KRI from source data can’t be captured and automated. And the KRI tends to go stale since it can’t be reported in real-time. The good news is where Excel fails, a proven risk and control monitoring solution like HighBond succeeds. When selecting the solution to suit your needs, you’ll want to consider the following:
+ Who will calculate, validate, and compile KRI measurement, how often, and using what methods?
+ How and when will you publish and communicate your KRIs?
+ How easy is it for stakeholders to get “self-service” with KRI reports and dashboards when they need data?
+ What’s the notification and remediation workflow when KRIs cross key thresholds or violate defined levels of risk appetite?
+ What’s the schedule for periodic program review, stakeholder feedback collection, and continuous improvement protocols for the overall program?
Now you know what goes into a successful KRI program, it’s time to get started on building one of your own.
About Galvanize
Galvanize builds award-winning, cloud-based security, risk management, compliance, and audit software to drive change in some of the world’s largest organizations. We’re on a mission to unite and strengthen individuals and entire organizations through the integrated HighBond software platform. With more than 7,000 customer organizations in 140 countries, Galvanize is connecting teams in 60% of the Fortune 1,000; 72% of the S&P 500; and hundreds of government organizations, banks, manufacturers, and healthcare organizations.
Whether these professionals are managing threats, assessing risk, measuring controls, monitoring compliance, or expanding assurance coverage, HighBond automates manual tasks, blends organization-wide data, and broadcasts it in easy-to-share dashboards and reports. But we don’t just make technology—we provide tools that inspire individuals to achieve great things and do heroic work in the process.
Visit us online at weGalvanize.com.
13
©2019 ACL Services Ltd. ACL, Galvanize, the Galvanize logo, HighBond, and the HighBond logo are trademarks or registered trademarks of ACL Services Ltd. dba Galvanize.
All other trademarks are the property of their respective owners.
white-paper-kris-financial
Learn more about what you can accomplish with Galvanize1.888.669.4225 | wegalvanize.com | [email protected]