KNOW THE NETWORK, KNIT THE NETWORK: APPLYING SNA TO N2C2 MATURITY MODEL EXPERIMENTS
25
1 15 th ICCRTS “The Evolution of C2” KNOW THE NETWORK, KNIT THE NETWORK: APPLYING SNA TO N2C2 MATURITY MODEL EXPERIMENTS Topic 5: Experimentation and Analysis Topic 2 (alternative): Networks and Networking Topic 8 (alternative): C2 Assessment Metrics and Tools Authors: Bárbara Manso, Marco Manso Point of Contact : Bárbara Manso EDISOFT, S. A. Rua Quinta dos Medronheiros / Monte Caparica 2826 – 801 CAPARICA / Portugal Direct Phone: +351 212 945 994 Mobile: +351 932 351 618 Fax: +351 212 945 999 E-mail: [email protected]
-
Upload
independent -
Category
Documents
-
view
3 -
download
0
Transcript of KNOW THE NETWORK, KNIT THE NETWORK: APPLYING SNA TO N2C2 MATURITY MODEL EXPERIMENTS

1
15th
ICCRTS
“The Evolution of C2”
KNOW THE NETWORK, KNIT THE NETWORK:
APPLYING SNA TO N2C2 MATURITY MODEL EXPERIMENTS
Topic 5: Experimentation and Analysis
Topic 2 (alternative): Networks and Networking
Topic 8 (alternative): C2 Assessment Metrics and Tools
Authors: Bárbara Manso, Marco Manso
Point of Contact:
Bárbara Manso
EDISOFT, S. A.
Rua Quinta dos Medronheiros / Monte Caparica
2826 – 801 CAPARICA / Portugal
Direct Phone: +351 212 945 994
Mobile: +351 932 351 618
Fax: +351 212 945 999
E-mail: [email protected]
2
1 INTRODUCTION
ELICIT aims to investigate social and cognitive impacts of command and control approaches and organisational structures within
the context of information sharing, shared awareness and knowledge task. Nowadays, command and control is increasingly seen
as the result of multidimensional factors and processes that intertwine the physical, information, cognitive and social domains,
highlighting the decisive human element. Thus, the ELICIT experiments reflect (social) networking from which patterns of
interaction (key command and control factor) may be drawn.
For years, social network analysis (SNA) has been a scientific methodology to assist in the explanation of networking and inter-
relationships between actors. Rather than seeing individuals as discrete units of analysis, SNA focuses on how the structure of
ties affects individuals and their relationships. Its long-time established metrics seem therefore suitable for application in the
ELICIT Case Study. In fact, SNA is a main concept of the Office of Force Transformation to study dynamics and personal
interactions occurring in the battlefield and to explain forces and influences that determine how decisions and choices are
made, especially in critic periods (Edison, 2005).
Benefiting from SNA teachings and NetDraw software, we select a relevant analytical view, encompassing the network’s
structure and location properties (roles and positions), based upon the geodesic distance concept. From this concept,
conclusions may be derived with respect to underlying patterns in the network, prefigured in terms of centrality,
embeddedness, activity, clustering and also network reach (paths) and structural cohesion. Through SNA, we recognise the
emergence of individuals that find their connection mutually beneficial, giving form to a social interaction based on trust, shared
values and beliefs, and allowing the sharing of information. This social networking in ELICIT significantly affect the group’s
performance and effectiveness. Therefore, SNA may provide additional means to assess the social networks that seem most
critical to success and even develop different forms to promote collaboration, identifying weak spots, bottlenecks and key
connectors and helping to improve the network’s ability to be aware and responsive to information so as to create a more
efficient and effective organisation.
2 UNDERSTANDING HUMAN INTERACTION
Already for a long time sociologists have realized the importance of information flows and of patterns of interaction between
individuals to the understanding of the human society's functioning.
In 1922, Professor John Almack published a paper – The Influence of Intelligence On The Selection of Associates – that foresaw a
sociometric tool capable of identifying relationships within a group of preschool children. Twenty years later, Radclife-Brown
invented the expression network of relations to describe the interaction patterns that construct social structures (Zack, 2000).
Since then, and framed in the global concern towards more relational, contextual and systemic understandings, the notion of
social networks has provided a new way of thinking about social structure.
Maintaining a dynamic essence and rejecting a reductionist perspective, social network expertise continues to develop
increasingly complex concepts to apply to all sorts and levels of networks. In fact, social network analysis has proven itself as an
extremely successful method to describe organisations, to measure the effects of organisations and to explain diversified social
phenomena, from friendship patterns to disease spread. Eighty years after Almack's article, Cross, Parker and Borgatti state that
SNA makes the invisible visible and the intangible tangible, praising it as the metaphor for understanding organisation forms or
structures (Cross, Parker and Borgatti, 2002).
Focusing on the two core elements of network data (the nodes or actors and the edges or relations), we combined the relational
view, in which the organisation is considered a product of the density and strength of its relationships (cohesion), and the
positional approach, advocating the importance of role sets and status (in the 1968 book Social Theory and Social Structure,
Robert K. Merton already called attention to role setting, that is, the set of relationships that emerge because one occupies a
given role or status). In fact, if the first major emphasis of SNA is to see how actors are located or embedded in the overall
network, then its second major emphasis is to understand how the whole pattern of individual choices gives rise to more holistic
patterns.
3
Departing from positional and relational approaches, SNA undertakes a major interpreting work that builds upon diversified
metrics and measurements to accomplish successfully a few management tasks, including the identification of issues that hinder
organisations, requiring modification to specific behaviours and organisational design elements in order to improve
organisational efficiency, competitiveness, effectiveness and success.
2.1 Sociograms – A Picture Worth a 1000 Words
Assessing the patterns of relationships in organisations does indeed reveal a number of interesting and actionable
considerations, from identifying individuals that are highly central in networks (controlling information diffusion or decision-
making processes) to understanding who is peripheral in the network so that an effort may be implemented to strengthen those
individuals' ties so that resident expertise in the network may be effectively utilized.
Mathematical and graphical techniques have then made it possible to represent those SNA findings as a compact and systematic
visual network description. In the Thirties, Jacob Moreno was the first to use visual images to display the patterning of linkages
among social actors, with each actor being represented by a point and each link shown by a line connecting a pair of points.
When sociologists applied this graphing technique, using colours, shapes, lines' thickness, node sizes and node relocation to
visualise information on actors and their relations, they re-named those graphics sociograms.
Representing network information (relations among nodes) as a graph is therefore an extremely efficient form to describe a
social structure, for it straightforwardly suggests some of the most important features of overall network structure. Apart from
the visual focus, sociograms and associated network metrics allow exploring patterns of interaction, handling the complexity of
social network data and understanding the construction and evolution of social structures.
3 MAPPING SNA TO ELICIT
In 1892, Durkheim said the essential is not the number of persons subject to the same authority but the number bound by some
form of relationship (Breiger, 2004). Social network analysis enables access to this essence: the disciplined mapping of relations'
patterning that create social structures. As an interdisciplinary behavioural science specialty, SNA defends that social actors are
interdependent and that the links among them have important consequences for every individual. Those links permit the flow of
information, affect, power, influence, social support and social control, they provide opportunities and, at the same time,
potential constraints on individuals' behaviour.
On its own, ELICIT promotes a social structure. ELICIT is an experimentation platform that instruments the actions of a group of
seventeen participants engaged in a situational awareness problem, with the goal to identify the who, what, when and where of
a pending attack. Exploring the differences between different organisational structures, ranging from isolated to hierarchical and
to edge organisations, the ELICIT participants build situational awareness by gathering and analyzing factoids and interacting
with one another through factoids' sharing directly with each other or factoids' posting to websites. No participant is given
sufficient information to solve the assigned problem without receiving information from others. Thus, interactions between and
among participants are required by the ELICIT platform (Hayes and Hayes, 2008).
It is then possible to establish similarities between the ELICIT experiment and socio-centric networks, an expression of Russell
Bernard’s to characterize actors in closed system networks (Kadushin, 2004). Considering the connectionist explanation as well
as the structuralist approach, it is possible to visualise graphically and understand important tendencies arising from ELICIT
experiments, for we benefit from most of the basic network measurements, measures of position, of connection, of cohesion
and power, that enable the characterisation of how much, and in what ways, the seventeen players are embedded in relations.
In this context, a relevant part of the ELICIT’s SNA is dedicated to network governance, that is, to the network's own response to
the environment uncertainty, the task complexity and the assets specificity (Jones, Borgatti and Hesterly, 1997). As we all are
well aware of, the coordination of complex endeavours in uncertain and competitive environments is extremely difficult and
informal social systems seem to respond better than bureaucratic structures (this assumption has been confirmed by several
case studies analysed by NATO SAS-065 members in 2009 and 2010). Although not yet addressing a complex endeavour, the
ELICIT experiment does provide elements to compare the performance of social systems upholding different organisational
4
structures. Whether hierarchical-oriented or edge-tailored the organisational structures embodied by the ELICIT experiments,
understanding the information-seeking behaviours, the sources of decisions and the usage of information provides critical
insight into ways to improve the ELICIT network's efficiency and effectiveness.
And this is exactly how network analysis has become relevant to management, how it is transforming how we study social
relationships, how it can be used to understand how to improve networking and affect performance. Even the United States'
Office of Force Transformation upholds social network analysis as one of the main concepts used to study the dynamics and
personal interactions occurring in the battlefield, being its ultimate goal to understand its potential use in war and peacetime
operations (Edison, 2005).
4 CONDUCTING SOCIAL NETWORK ANALYSIS IN ELICIT
ELICIT stands for Experimental Laboratory for Investigating Collaboration, Information Sharing and Trust and it is an investigation
platform focused on the informational, social and cognitive impacts of the command and control approach space (allocation of
decision rights, patterns of interaction and information sharing), comparing organisational structures within the context of
information sharing, shared awareness and knowledge task. In this framework, it is important to recall the ELICIT's Information
Value Chain: Networked organisations enable enhanced information sharing, which enables better situational awareness and
improved shared awareness, which, on turn, results in increased effectiveness. This conceptual scheme directly derives from the
fundamental aspects of Network Centric Warfare (NCW), namely the NCW tenets, the NCW Value Chain, the Command and
Control (C2) Domains, the C2 Conceptual Research Model (CRM) and the C2 Approach Space. The NCW tenets (1999, Alberts et
al) state that:
1. A robustly networked force improves information sharing.
2. Information sharing and collaboration enhance the quality of information and shared situational awareness.
3. Shared situational awareness enables self-synchronization.
4. These, in turn, dramatically increase mission effectiveness.
These tenets have been encapsulated into the SAS-065 Group’s NCW Value Chain and are visible across the four C2 domains: the
Physical (all entities are robustly networked), the Information (all entities have the capability to share, access, display, store,
process and protect information), the Cognitive (each entity has the capability to develop high quality awareness) and the Social
domains (encompassing the C2 processes and the interactions between and among individuals and entities). Based upon the
NCW legacy, the SAS-065 Group is defining the NATO NEC C2 Maturity Model (N2C2M2), a framework capable of assessing
organisations’ C2 capabilities, through the definition of operational coherence (ability to generate synergy across organisations)
towards the five NATO NEC operational capability levels and the possibility to associate the capability to adopt one or more C2
approaches with the different levels of C2 maturity: increased C2 maturity enables an organisation to adopt a wider range of C2
approaches. Table 1 presents the qualitative characterisation for each maturity level per C2 approach:
ADR-C PI-C DI-C
Edge C2
Not Explicit, Self Allocated (Emergent, Tailored and Dynamic)
Unlimited Sharing as Required All Available and Relevant
Information Accessible
Collaborative C2
Collaborative Process and Shared Plan Significant Broad Sharing Additional Information Across Collaborative Areas/Functions
Coordinated C2
Coordination Process and Linked Plans Limited Focused Sharing Additional information about coordinated Areas/Functions
Deconflicted C2
Established Constraints Very Limited Sharply
Focused Sharing Additional information about
constraints and seams
Conflicted C2
None No interactions across entities Organic information
Table 1 – Qualitative Values for C2 Dimensions per Maturity Level
The NATO SAS-065 Group findings have thus supported that the N2C2M2 depicts as main assumption that more mature
collective C2 Approaches (more distribution of decision rights across the collective, less constrained patterns of interaction and

5
broader dissemination of information) achieve higher levels of shared awareness and understanding which, in turn, result in
increased endeavour effectiveness, efficiency (given effectiveness) and agility.
For the purpose of this work, it is especially the (social) networking of ELICIT experiments that will be explored, allowing the
opportunity to observe relevant patterns of interaction (a key command and control factor) and of information sharing, the
relative effectiveness of different organisational structures and the impact of influence and collaboration in social processes.
Therefore, SNA is the scientific methodology chosen to assist in explaining ELICIT networking and patterns of interaction
between the seventeen involved actors. The collected data of ELICIT runs and transaction logs shall be analysed based upon
observations associated with metrics (direct when possible, indirect when needed) and network visualisation.
To conduct the exploratory SNA in ELICIT, it is important to establish correlations between the ELICIT collected data, the selected
SNA metrics and indicators and the notable efforts towards understanding and modelling C2, published in Understanding
Command and Control (Alberts & Hayes, 2006), in the NATO SAS-050 Final Report (SAS-050, 2006) and in the NATO SAS-050
Final Report (SAS-065, 2010). More specifically, SNA shall explore patterns of interaction, namely its sub-variables as defined by
SAS-065 (cluster attractor, degree of inter-cluster connectivity and frequency or continuity of interaction). With respect to the
selected SNA metrics and indicators, we shall highlight:
1. Node related:
• Node Degree – the number of nodes to which a node is adjacent or directly related to, composed of: o In-degree – number of ingoing links (also called Node Popularity); o Out-degree – number of outgoing links (also called Node Activity).
• Node Activity – number of times that the node’s links have been used: o In-degree Activity – number of times ingoing links have been used; o Out-degree Activity – number of times outgoing links have been used.
• Node Betweeness – number of nodes that have a direct relation with nodes belonging to other circles; • Node Centrality – a compound variable, measured by:
o Node Degree; o Closeness – degree to which a node is close to all other nodes (see also Geodesic Distance); o Betweeness – frequency by which the node is located between pairs of other nodes.
• Node Geodesic Distance – shortest path between two nodes. • Node Embeddedness – a compound variable, measured by:
o Link Density – the relation between the node’s links and the total number of links; o Link Strength – number of times a link has been used; o Link Flow – number of in-degrees and out-degrees of a node.
• Node Neighbourhood – number of adjacent nodes (dyads, if 2; Triads, if 3; Clusters, if more than 3). • Node Path Length – number of nodes in path between two nodes. • Node Reciprocity Index – level of reciprocating activity (replies to a link). • Structural Holes – nodes in high risk of becoming isolated from the network.
2. Network related:
• Network Activity – number of times each link has been used; • Network Mode Path Length – the mode of all nodes’ path lengths; • Network Balance – symmetry of connections (ingoing and outgoing) between nodes; • Network Density – number of links in the network; • Network Connectedness – capability of each node reaching all other nodes in the network; • Network Diameter – maximum path within the network; • Network Inclusiveness – relation between the number of isolated nodes and the total number of nodes; • Network Clustering Coefficient – likelihood that two associates of a node are associates themselves; • Network Structural Cohesion – minimum number of nodes that, if removed, the network collapses.
These quantitative measurements will be complemented with a qualitative analysis, giving insights on the content and nature of nodes’ and the network’s interaction. Part of this supportive analysis will refer to a new ELICIT software analysis application (Manso, 2009), which provides charting, tables and relevant information concerning the sharing activity, the quality of information position, information awareness and understanding, as well as measures of effectiveness and efficiency.

6
4.1 Early Expectations
Considering the concepts and definitions presented herein, whether concerning C2 literature, whether referring to the SNA methodology, we shall essay to observe in ELICIT experiments the following early expectations:
SNA Variable Expected SNA Variable Behaviour From Less Mature To More Mature C2 Approaches
Node Centrality From VERY LOW (isolated node) to HIGH (central node sets) and to MEDIUM (decentralised network)
Node Embeddedness From LOW (low density) to HIGH (high density) and to MEDIUM (distributed density)
Network Activity From LOW (minimal degrees) to MEDIUM (limited degrees) and to HIGH (multiple degrees)
Network Path Length From HIGH (first order zone) to LOW (hierarchical rules) and to LOW (geodesics)
Network Diameter From LOW (adjacency) to MEDIUM (hierarchical setting) and to LOW (wider neighbourhood of geodesics)
Network Inclusiveness From LOW (one isolate) to NOT APPLICABLE (no isolates) and to MEDIUM (isolated node behaviour)
Network Clustering Coefficient From HIGH (small node sets) to LOW (rigid node association) and to VERY LOW (free node association)
Network Connectedness From LOW (minimum node reach) to MEDIUM (limited node reach) and to HIGH (full node reach)
Network Structural Cohesion From LOW (small network cohesion) to VERY LOW (minimum network cohesion) and to HIGH (high network cohesion)
Table 2 – Expected SNA Variable Behaviour from Less Mature to More Mature C2 Approaches
4.2 The N2C2M2 ELICIT Experiments
At the core of the N2C2M2 ELICIT experiments is the experimental design of the ELICIT platform, implemented by Marco Manso
(Manso, 2009), which recreates each of the collective command and control approaches that correspond to different level of C2
maturity described in the N2C2M2. To best capture the N2C2M2 model, the experimental design required modifying the ELICIT
baseline organizational specifications, so that the conditions for each organizational model to operate at a specific collective C2
approach would be in place.
Still, it was maintained the ELICIT scenario of an imminent terrorist attack, with related information being provided to each of
the seventeen individuals, so that no individual or team possesses sufficient information to accomplish the task of identifying
the “who”, “what”, “where” and “when” of the attack, within a specific timeframe. Only through sharing information (factoids),
would the task be accomplished.
In what concerned the modeling of the Conflicted collective C2 approach in the ELICIT experiments, it is assigned one isolated
Coordinator and four isolated teams (one for each “w” of the problem), composed of four elements, being one the team leader.
Acting independently, each team focus on its specific problem space (the assigned team’s “w”), whereas the isolated
Coordinator deals with the whole problem (the four “ws”), without the possibility of interacting with the teams and their
websites (the coordinator depends solely on the factoids received from the server). Mission is accomplished if each team leader
determines his or her team’s correct solution to the respective problem space, with overall organization success depending on
whether all teams reach the correct problem solution.
The next collective C2 approach modelled was the Deconflicted. In this case, there are one Deconflictor and four teams (one for
each “w” of the problem), composed of four elements, including the team leader. It is possible the communication or factoid
sharing between each of the four team leaders and the Deconflictor, and among team members, creating this limited, vertical
peer-to-peer interaction along stove-piped chains of command. Partitioning the problem space among the four teams helps to
avoid the negative cross-impact of the previous model, what may be perceived as the genesis of collective command and
control. Still, dealing with its own problem space (the specific “w”), each team pursues independent goals, being successful
when the team leader determines the correct solution to the team’s problem space. Theoretically, overall organization success
will be achieved as all teams find the correct solution.
The Coordinated collective C2 approach is played by one Coordinator and four teams (one for each “w” of the problem),
composed of four elements, including the team leader. It is possible the communication or factoid sharing between each of the
four team leaders and the Coordinator, and among team members, with the opportunity to generate synergies and combine

7
resources to meet effective goals. Likewise, the Coordinator has access to all four websites, and he works on the overall problem
space dimensions for the organization’s success depends on the Coordinator finding the correct solution.
The fourth collective C2 approach modeled was the Collaborative one, with a Facilitator and four teams (one for each “w” of the
problem), composed of four elements, including the team leader. Communication or factoid sharing is available to all
participants, being also possible to attach to each shared or posted factoid the relevance and the trustworthiness indicators, in
what preconfigures the catalytic environment for increased interaction and improved shared awareness. Organizational success
depends upon the Facilitator finding the correct solution to all problem spaces or the team leaders finding the correct solution
to their respective problem space.
Finally, Edge is the fifth collective C2 approach modelled to ELICIT. Illustrating close working entities that are able to identify and
implement the best collective C2 approach to meet the challenge, this design depicts a flat organization of seventeen
participants, involved in a widespread rich information sharing, so that each participant may find the correct solution to the
overall problem space dimensions.
To implement the SNA analysis, it were considered a set of ELICIT runs. Their list is presented in the following table:
Run Date Log File C2 Approach Factoid Set
L1 01 13-05-2009 20090513-1053-21812-group_1_CONFLICTED.log CONFLICTED 4
L1 02 28-05-2009 20090528-1246-32783-group_1_CONFLICTED.log CONFLICTED 1
L1 03 03-06-2009 20090603-1135-40719-group_1_CONFLICTED.log CONFLICTED 3
L2 01 29-04-2009 20090429-1308-24386-group_1_B.log DECONFLICTED 1
L2 02 29-04-2009 20090429-1402-18407-group_1_B.log DECONFLICTED 4
L2 03 12-05-2009 20090512-1511-12023-group_1_DECONFLICTED.log DECONFLICTED 1
L2 04 02-06-2009 20090602-1413-19588-group_1_DECONFLICTED.log DECONFLICTED 3
L3 01 07-05-2009 20090507-1413-26985-group_1_COORDINATED.log COORDINATED 1
L3 02 13-05-2009 20090513-1142-59475-group_1_COORDINATED.log COORDINATED 3
L3 03 03-06-2009 20090603-1212-12301-group_1_COORDINATED.log COORDINATED 2
L3 04 03-06-2009 20090603-1332-06152-group_1_COORDINATED.log COORDINATED 4
L4 01 06-05-2009 20090506-1133-24903-group_1_COLLABORATIVE.log COLLABORATIVE 1
L4 02 06-05-2009 20090506-1225-19696-group_1_COLLABORATIVE.log COLLABORATIVE 4
L4 03 12-05-2009 20090512-1415-19171-group_1_COLLABORATIVE.log COLLABORATIVE 3
L4 04 02-06-2009 20090602-1515-03801-group_1_COLLABORATIVE.log COLLABORATIVE 2
L5 01 29-04-2009 20090429-1101-06528-group_1_A.log EDGE 1
L5 02 29-04-2009 20090429-1152-08894-group_1_A.log EDGE 4
L5 03 07-05-2009 20090507-1500-37261-group_1_EDGE.log EDGE 4
Table 3 – ELICIT Experiment Runs
4.3 SNA Findings in the N2C2M2 ELICIT Experiments
Network analysis and the production of social science data involve a process of interpretation. To carry out such interpretation
robustly it is understood that it is imperative to conduct more runs to verify these first SNA findings. Additionally, it is important
to recall that, otherwise stated, for analysis purposes, the interaction measures observed the strict sharing behaviour, being
therefore excluded every resource to websites.
Node Centrality
The proposition that an actor’s position in a network has consequences for the actor as well as the network has occupied a
central place in network thinking. Networks are understood as the actor’s environment for action, source of behavioural
opportunities and constraints, and the structure of ties inherent of the actor’s location pinpoint which are the key players, the
individuals best connected or that have most influence. This is the very core of centrality’s issues, first introduced by Bavelas in
1950.
8
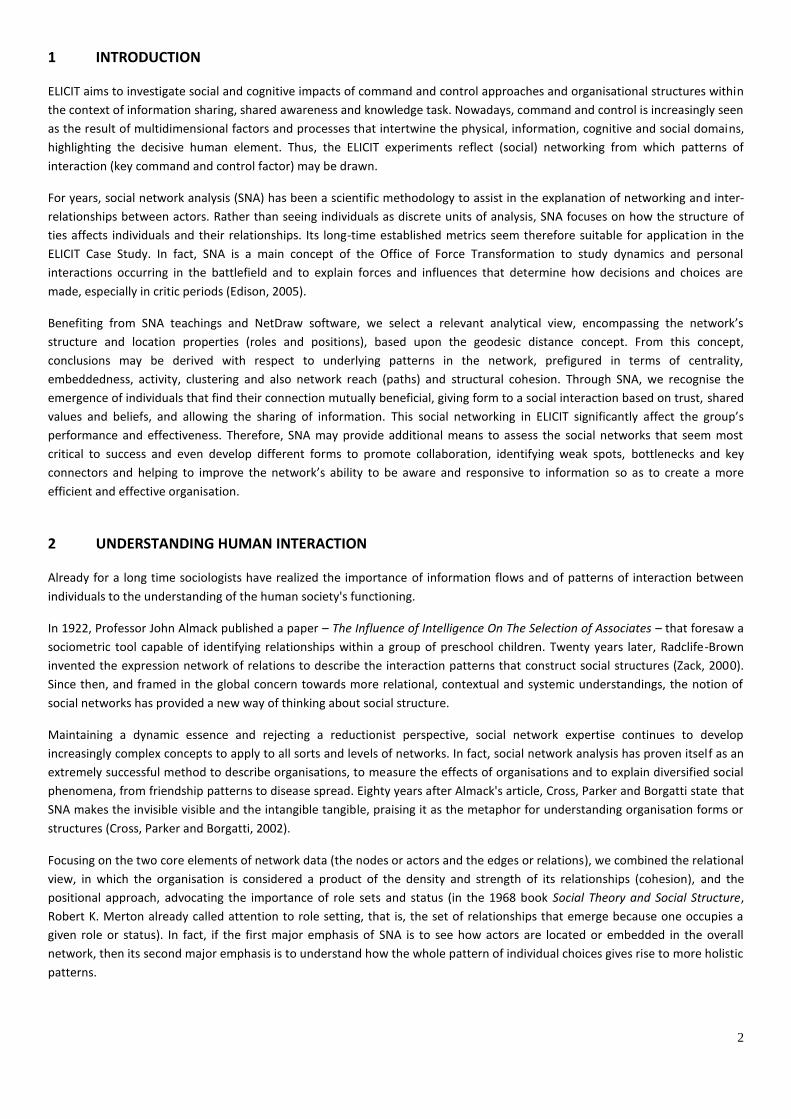
Extracted from ELICIT runs, the following sociograms illustrate how a node occupies a central position within a network. In L1
Conflicted, the centrality levels are extremely reduced for the network is broken in five isolated blocks. In L3 Coordinated,
centrality is a major element, since communication among the different teams flows through intermediary central nodes (the
four team leaders and the Isolated Coordinator). In L5 Edge, centrality is no longer a relevant element, since all nodes are quite
able to reach each other directly.
L1 01 Sociogram
L3 03 Sociogram
L5 02 Sociogram
Figure 1 – ELICIT Runs Set of Sociograms
Centrality has been used to determine group activity and efficiency in problem-solving and the perception of leadership,
becoming such an important SNA variable that three competing conceptual constructions essay to explain how centrality affects
group processes: the first is centred in communication activity (degree measure), the second is focused in the control of
communication (betweeness measure) and the last is based on efficiency (closeness measure). Centrality as activity is measured
in degrees, that is, the number of connections an actor or node has, being it outward and, therefore, expressing the actor’s
influence, or inward, displaying the actor’s prominence (status). Centrality as control derives from the frequency with which a
node falls between pairs of other nodes on the shortest path connecting them, a strategic location on communication paths that
can influence the whole group by facilitating, impeding or biasing the transmission of information. Finally, centrality as
independence or efficiency derives from the ability of a node to be close to all other nodes in the network, avoiding the
potential control of other relayers or intermediaries and therefore reaching a certain level of independence. At the same time,
because that node is close to all other nodes, this particular central node may reach the entire network in minimum time or
cost, achieving what Beauchamp called in 1965 the optimum efficiency in communication.
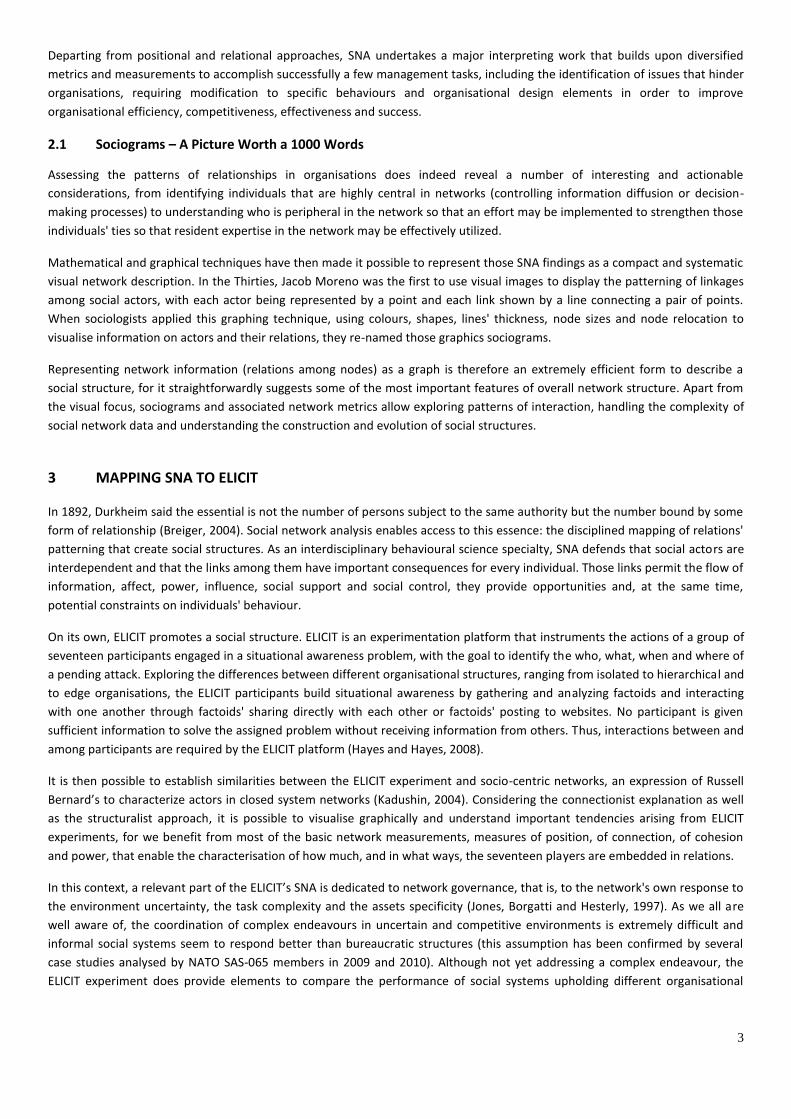
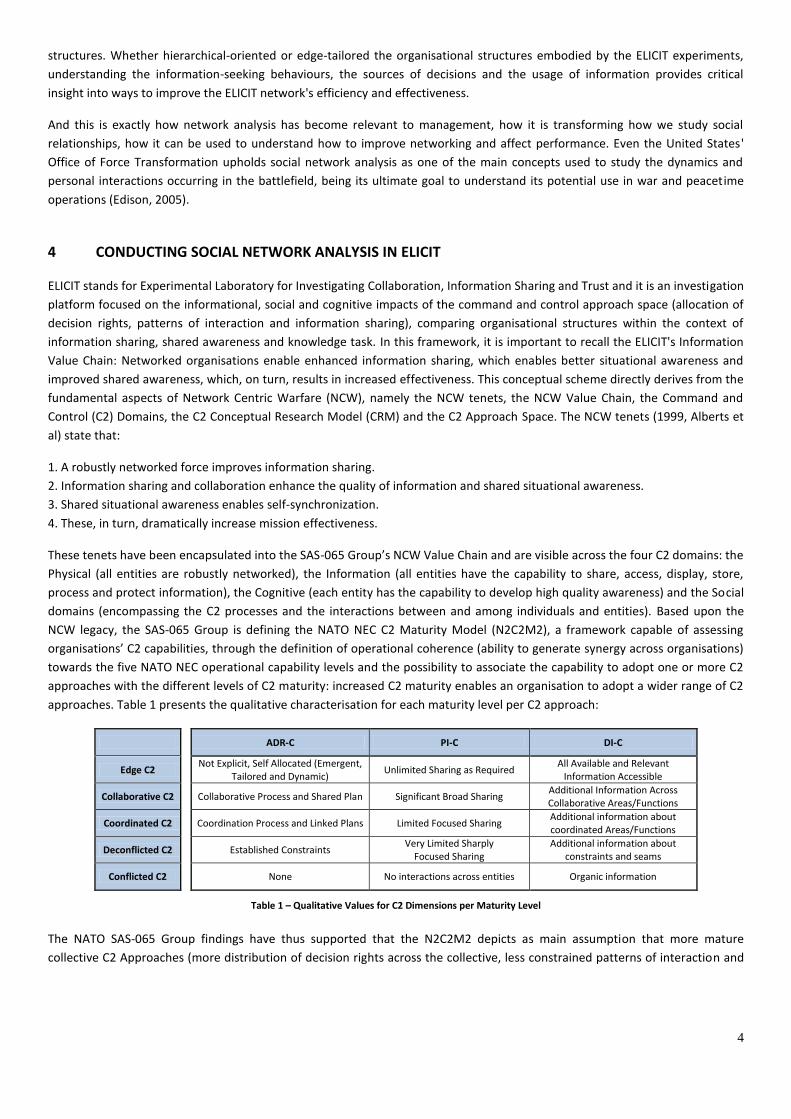
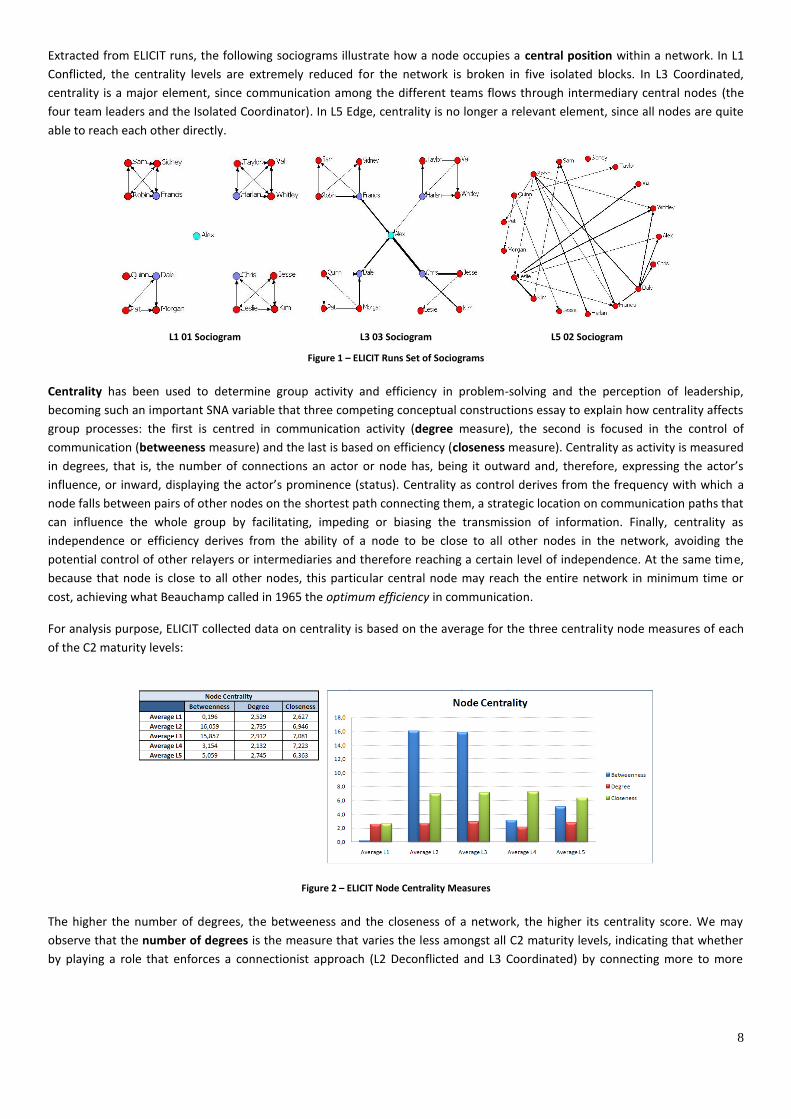
For analysis purpose, ELICIT collected data on centrality is based on the average for the three centrality node measures of each
of the C2 maturity levels:
Figure 2 – ELICIT Node Centrality Measures
The higher the number of degrees, the betweeness and the closeness of a network, the higher its centrality score. We may
observe that the number of degrees is the measure that varies the less amongst all C2 maturity levels, indicating that whether
by playing a role that enforces a connectionist approach (L2 Deconflicted and L3 Coordinated) by connecting more to more
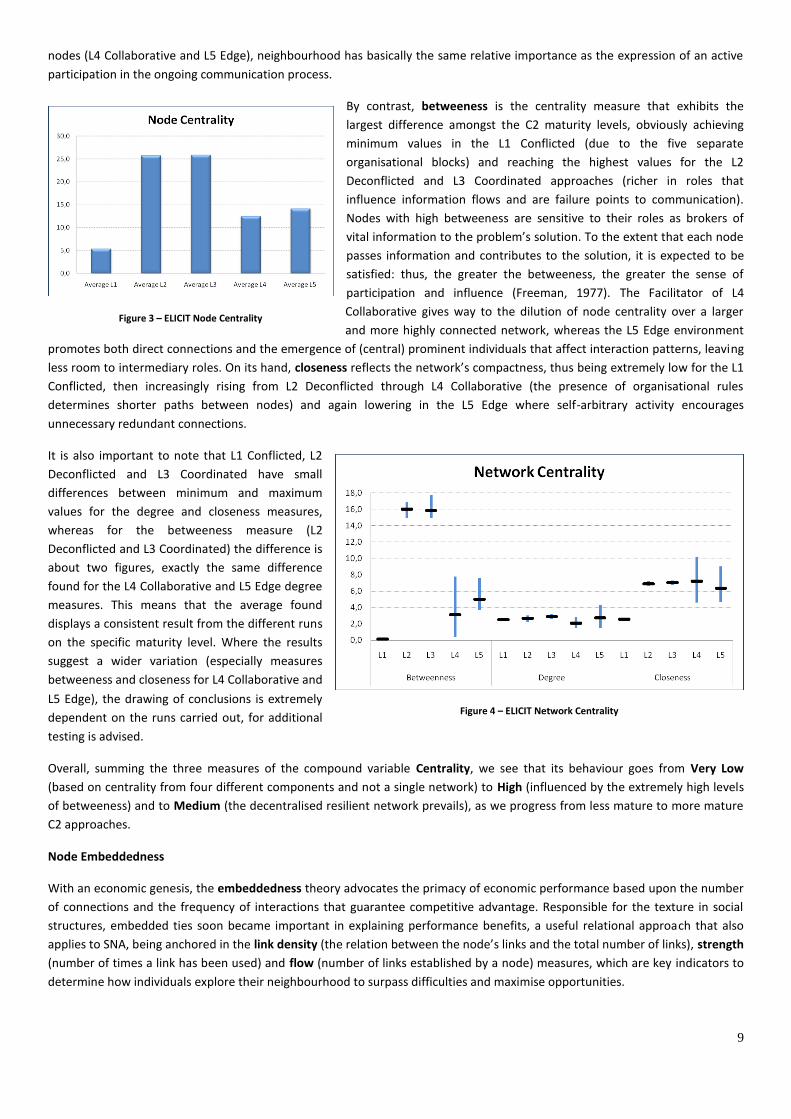
9
nodes (L4 Collaborative and L5 Edge), neighbourhood has basically the same relative importance as the expression of an active
participation in the ongoing communication process.
By contrast, betweeness is the centrality measure that exhibits the
largest difference amongst the C2 maturity levels, obviously achieving
minimum values in the L1 Conflicted (due to the five separate
organisational blocks) and reaching the highest values for the L2
Deconflicted and L3 Coordinated approaches (richer in roles that
influence information flows and are failure points to communication).
Nodes with high betweeness are sensitive to their roles as brokers of
vital information to the problem’s solution. To the extent that each node
passes information and contributes to the solution, it is expected to be
satisfied: thus, the greater the betweeness, the greater the sense of
participation and influence (Freeman, 1977). The Facilitator of L4
Collaborative gives way to the dilution of node centrality over a larger
and more highly connected network, whereas the L5 Edge environment
promotes both direct connections and the emergence of (central) prominent individuals that affect interaction patterns, leaving
less room to intermediary roles. On its hand, closeness reflects the network’s compactness, thus being extremely low for the L1
Conflicted, then increasingly rising from L2 Deconflicted through L4 Collaborative (the presence of organisational rules
determines shorter paths between nodes) and again lowering in the L5 Edge where self-arbitrary activity encourages
unnecessary redundant connections.
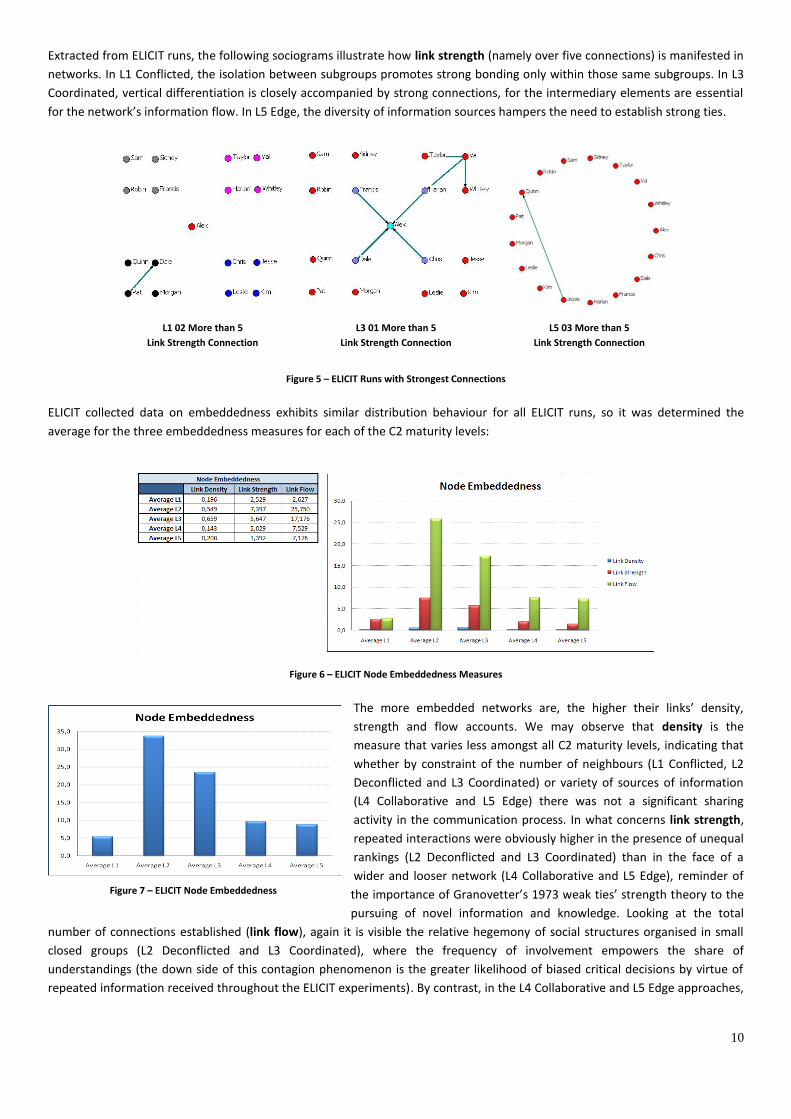
It is also important to note that L1 Conflicted, L2
Deconflicted and L3 Coordinated have small
differences between minimum and maximum
values for the degree and closeness measures,
whereas for the betweeness measure (L2
Deconflicted and L3 Coordinated) the difference is
about two figures, exactly the same difference
found for the L4 Collaborative and L5 Edge degree
measures. This means that the average found
displays a consistent result from the different runs
on the specific maturity level. Where the results
suggest a wider variation (especially measures
betweeness and closeness for L4 Collaborative and
L5 Edge), the drawing of conclusions is extremely
dependent on the runs carried out, for additional
testing is advised.
Overall, summing the three measures of the compound variable Centrality, we see that its behaviour goes from Very Low
(based on centrality from four different components and not a single network) to High (influenced by the extremely high levels
of betweeness) and to Medium (the decentralised resilient network prevails), as we progress from less mature to more mature
C2 approaches.
Node Embeddedness
With an economic genesis, the embeddedness theory advocates the primacy of economic performance based upon the number
of connections and the frequency of interactions that guarantee competitive advantage. Responsible for the texture in social
structures, embedded ties soon became important in explaining performance benefits, a useful relational approach that also
applies to SNA, being anchored in the link density (the relation between the node’s links and the total number of links), strength
(number of times a link has been used) and flow (number of links established by a node) measures, which are key indicators to
determine how individuals explore their neighbourhood to surpass difficulties and maximise opportunities.
Figure 3 – ELICIT Node Centrality
Figure 4 – ELICIT Network Centrality
10
Extracted from ELICIT runs, the following sociograms illustrate how link strength (namely over five connections) is manifested in
networks. In L1 Conflicted, the isolation between subgroups promotes strong bonding only within those same subgroups. In L3
Coordinated, vertical differentiation is closely accompanied by strong connections, for the intermediary elements are essential
for the network’s information flow. In L5 Edge, the diversity of information sources hampers the need to establish strong ties.
L1 02 More than 5
Link Strength Connection
L3 01 More than 5
Link Strength Connection
L5 03 More than 5
Link Strength Connection
Figure 5 – ELICIT Runs with Strongest Connections
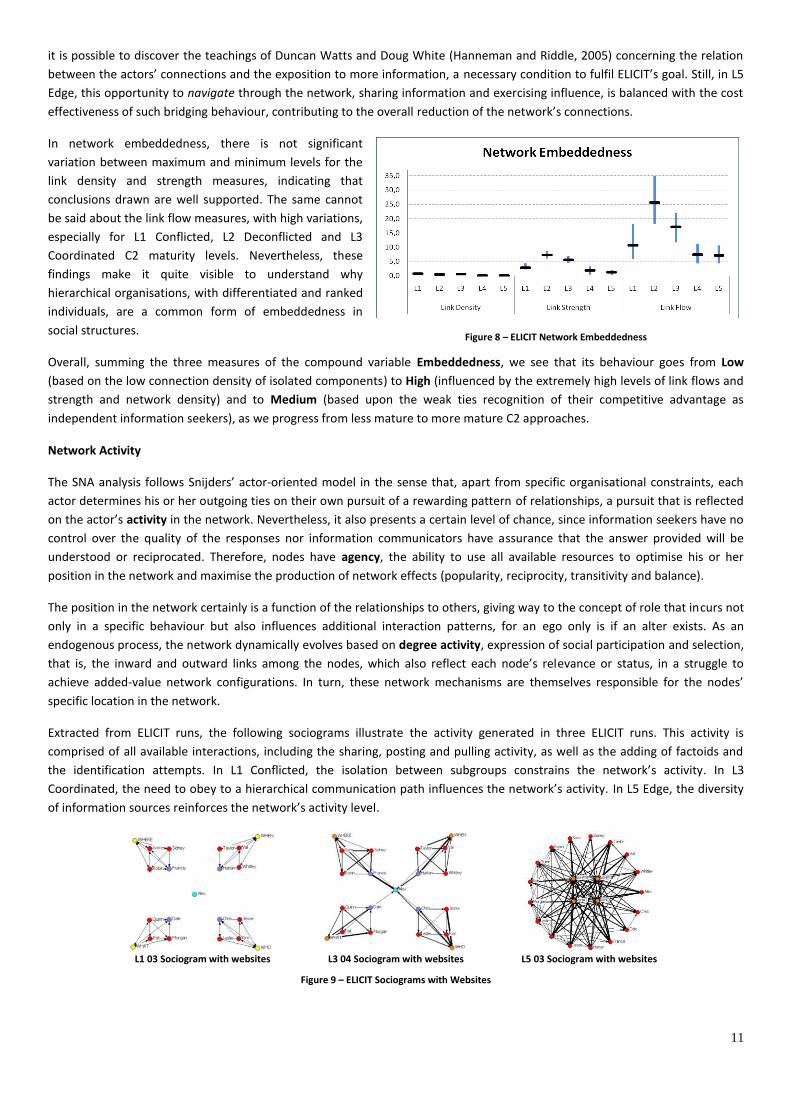
ELICIT collected data on embeddedness exhibits similar distribution behaviour for all ELICIT runs, so it was determined the
average for the three embeddedness measures for each of the C2 maturity levels:
Figure 6 – ELICIT Node Embeddedness Measures
The more embedded networks are, the higher their links’ density,
strength and flow accounts. We may observe that density is the
measure that varies less amongst all C2 maturity levels, indicating that
whether by constraint of the number of neighbours (L1 Conflicted, L2
Deconflicted and L3 Coordinated) or variety of sources of information
(L4 Collaborative and L5 Edge) there was not a significant sharing
activity in the communication process. In what concerns link strength,
repeated interactions were obviously higher in the presence of unequal
rankings (L2 Deconflicted and L3 Coordinated) than in the face of a
wider and looser network (L4 Collaborative and L5 Edge), reminder of
the importance of Granovetter’s 1973 weak ties’ strength theory to the
pursuing of novel information and knowledge. Looking at the total
number of connections established (link flow), again it is visible the relative hegemony of social structures organised in small
closed groups (L2 Deconflicted and L3 Coordinated), where the frequency of involvement empowers the share of
understandings (the down side of this contagion phenomenon is the greater likelihood of biased critical decisions by virtue of
repeated information received throughout the ELICIT experiments). By contrast, in the L4 Collaborative and L5 Edge approaches,
Figure 7 – ELICIT Node Embeddedness
11
it is possible to discover the teachings of Duncan Watts and Doug White (Hanneman and Riddle, 2005) concerning the relation
between the actors’ connections and the exposition to more information, a necessary condition to fulfil ELICIT’s goal. Still, in L5
Edge, this opportunity to navigate through the network, sharing information and exercising influence, is balanced with the cost
effectiveness of such bridging behaviour, contributing to the overall reduction of the network’s connections.
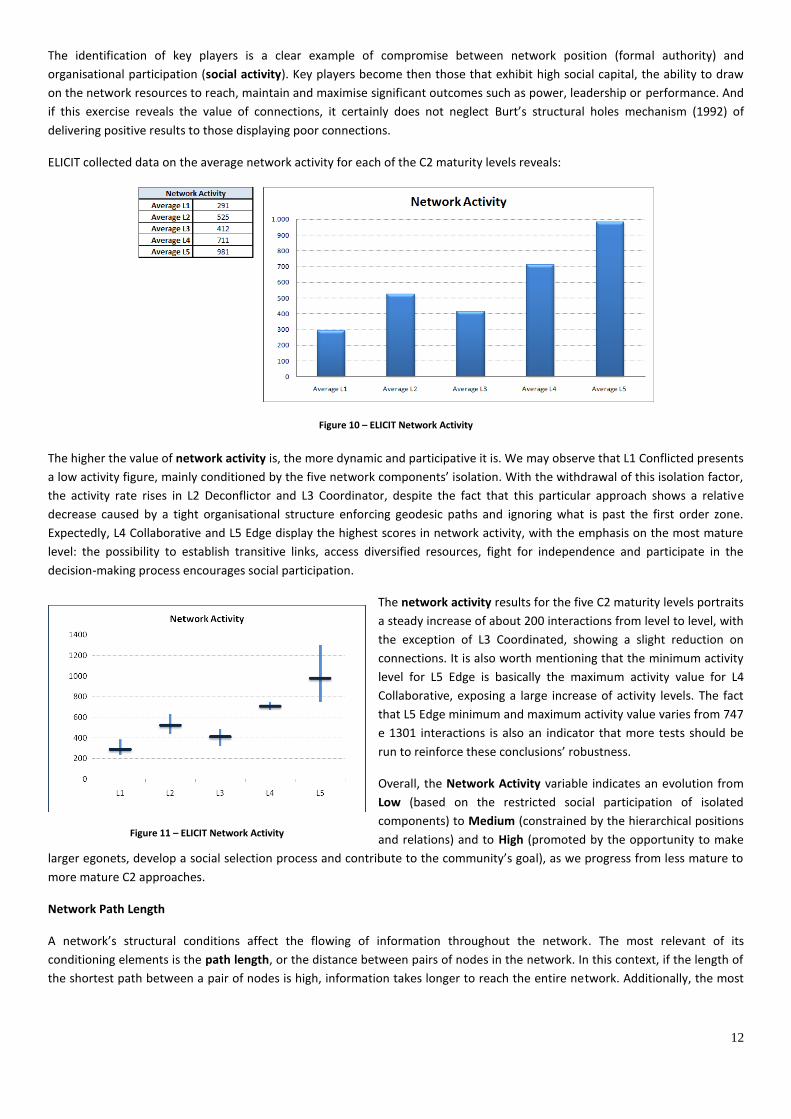
In network embeddedness, there is not significant
variation between maximum and minimum levels for the
link density and strength measures, indicating that
conclusions drawn are well supported. The same cannot
be said about the link flow measures, with high variations,
especially for L1 Conflicted, L2 Deconflicted and L3
Coordinated C2 maturity levels. Nevertheless, these
findings make it quite visible to understand why
hierarchical organisations, with differentiated and ranked
individuals, are a common form of embeddedness in
social structures.
Overall, summing the three measures of the compound variable Embeddedness, we see that its behaviour goes from Low
(based on the low connection density of isolated components) to High (influenced by the extremely high levels of link flows and
strength and network density) and to Medium (based upon the weak ties recognition of their competitive advantage as
independent information seekers), as we progress from less mature to more mature C2 approaches.
Network Activity
The SNA analysis follows Snijders’ actor-oriented model in the sense that, apart from specific organisational constraints, each
actor determines his or her outgoing ties on their own pursuit of a rewarding pattern of relationships, a pursuit that is reflected
on the actor’s activity in the network. Nevertheless, it also presents a certain level of chance, since information seekers have no
control over the quality of the responses nor information communicators have assurance that the answer provided will be
understood or reciprocated. Therefore, nodes have agency, the ability to use all available resources to optimise his or her
position in the network and maximise the production of network effects (popularity, reciprocity, transitivity and balance).
The position in the network certainly is a function of the relationships to others, giving way to the concept of role that incurs not
only in a specific behaviour but also influences additional interaction patterns, for an ego only is if an alter exists. As an
endogenous process, the network dynamically evolves based on degree activity, expression of social participation and selection,
that is, the inward and outward links among the nodes, which also reflect each node’s relevance or status, in a struggle to
achieve added-value network configurations. In turn, these network mechanisms are themselves responsible for the nodes’
specific location in the network.
Extracted from ELICIT runs, the following sociograms illustrate the activity generated in three ELICIT runs. This activity is
comprised of all available interactions, including the sharing, posting and pulling activity, as well as the adding of factoids and
the identification attempts. In L1 Conflicted, the isolation between subgroups constrains the network’s activity. In L3
Coordinated, the need to obey to a hierarchical communication path influences the network’s activity. In L5 Edge, the diversity
of information sources reinforces the network’s activity level.
L1 03 Sociogram with websites L3 04 Sociogram with websites L5 03 Sociogram with websites
Figure 9 – ELICIT Sociograms with Websites
Figure 8 – ELICIT Network Embeddedness
12
The identification of key players is a clear example of compromise between network position (formal authority) and
organisational participation (social activity). Key players become then those that exhibit high social capital, the ability to draw
on the network resources to reach, maintain and maximise significant outcomes such as power, leadership or performance. And
if this exercise reveals the value of connections, it certainly does not neglect Burt’s structural holes mechanism (1992) of
delivering positive results to those displaying poor connections.
ELICIT collected data on the average network activity for each of the C2 maturity levels reveals:
Figure 10 – ELICIT Network Activity
The higher the value of network activity is, the more dynamic and participative it is. We may observe that L1 Conflicted presents
a low activity figure, mainly conditioned by the five network components’ isolation. With the withdrawal of this isolation factor,
the activity rate rises in L2 Deconflictor and L3 Coordinator, despite the fact that this particular approach shows a relative
decrease caused by a tight organisational structure enforcing geodesic paths and ignoring what is past the first order zone.
Expectedly, L4 Collaborative and L5 Edge display the highest scores in network activity, with the emphasis on the most mature
level: the possibility to establish transitive links, access diversified resources, fight for independence and participate in the
decision-making process encourages social participation.
The network activity results for the five C2 maturity levels portraits
a steady increase of about 200 interactions from level to level, with
the exception of L3 Coordinated, showing a slight reduction on
connections. It is also worth mentioning that the minimum activity
level for L5 Edge is basically the maximum activity value for L4
Collaborative, exposing a large increase of activity levels. The fact
that L5 Edge minimum and maximum activity value varies from 747
e 1301 interactions is also an indicator that more tests should be
run to reinforce these conclusions’ robustness.
Overall, the Network Activity variable indicates an evolution from
Low (based on the restricted social participation of isolated
components) to Medium (constrained by the hierarchical positions
and relations) and to High (promoted by the opportunity to make
larger egonets, develop a social selection process and contribute to the community’s goal), as we progress from less mature to
more mature C2 approaches.
Network Path Length
A network’s structural conditions affect the flowing of information throughout the network. The most relevant of its
conditioning elements is the path length, or the distance between pairs of nodes in the network. In this context, if the length of
the shortest path between a pair of nodes is high, information takes longer to reach the entire network. Additionally, the most
Figure 11 – ELICIT Network Activity
13
efficient link between two nodes is the shortest path between them, that is, their geodesic path. But it is not only the pathways
length that matters, for also the number of paths is decisive to understand networks’ behaviour and potential: networks with
few connections tend to disaggregation, whereas more and adjacent connections indicate robustness, flexibility and the ability
to act swiftly. Through the pathways, nodes seek opportunities, exert influence and share information, and each transaction
made sustains a specific cost that, in more dense networks, may degenerate in obsessing behaviour towards sharing, in
constantly receiving the same information or contradictory information and even in information overload.
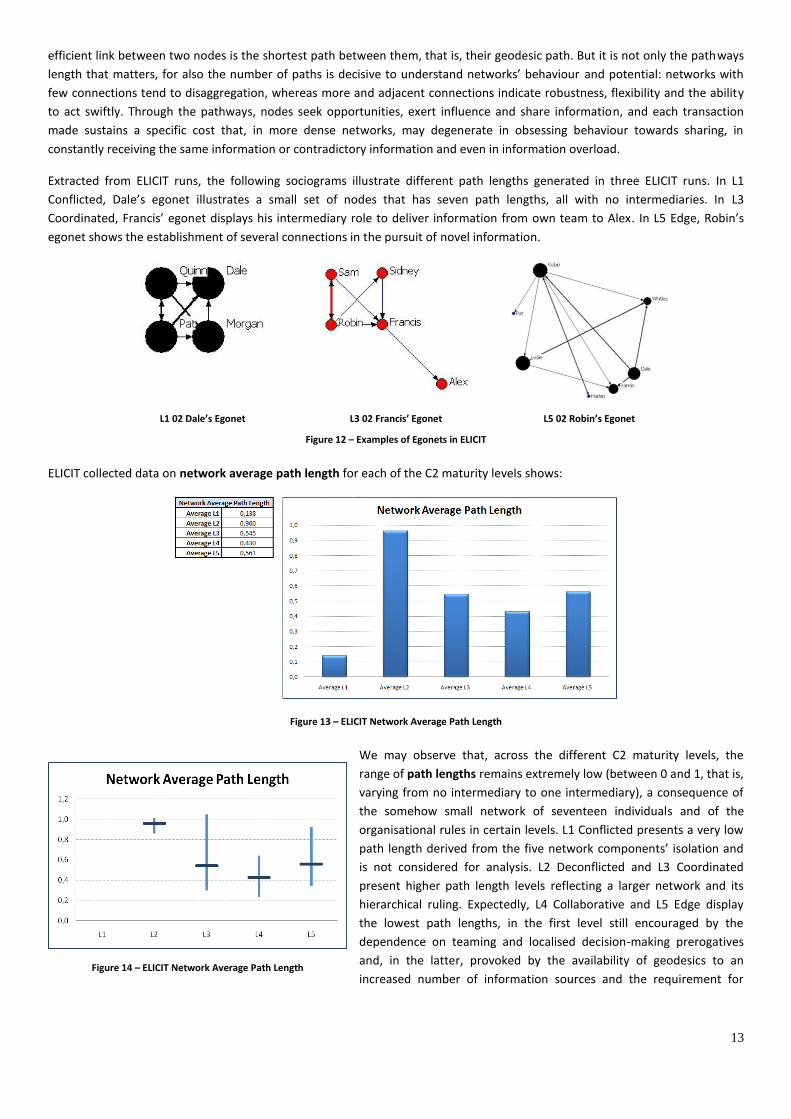
Extracted from ELICIT runs, the following sociograms illustrate different path lengths generated in three ELICIT runs. In L1
Conflicted, Dale’s egonet illustrates a small set of nodes that has seven path lengths, all with no intermediaries. In L3
Coordinated, Francis’ egonet displays his intermediary role to deliver information from own team to Alex. In L5 Edge, Robin’s
egonet shows the establishment of several connections in the pursuit of novel information.
L1 02 Dale’s Egonet
L3 02 Francis’ Egonet
L5 02 Robin’s Egonet
Figure 12 – Examples of Egonets in ELICIT
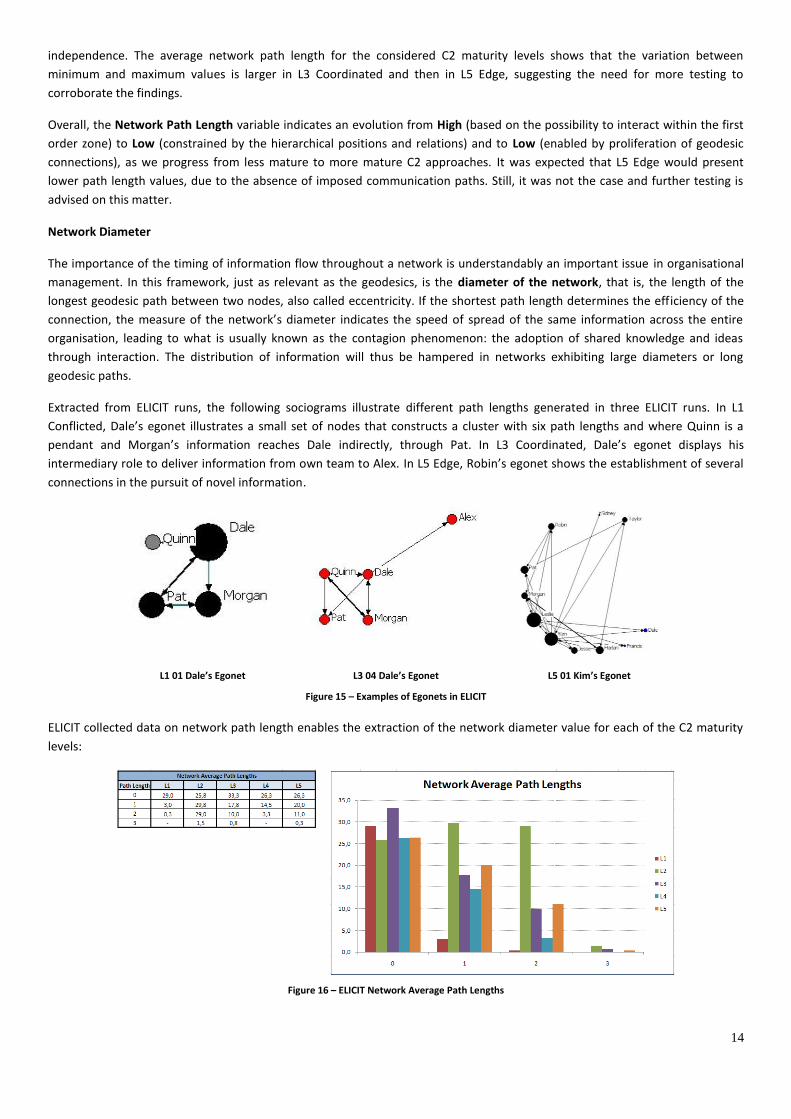
ELICIT collected data on network average path length for each of the C2 maturity levels shows:
Figure 13 – ELICIT Network Average Path Length
We may observe that, across the different C2 maturity levels, the
range of path lengths remains extremely low (between 0 and 1, that is,
varying from no intermediary to one intermediary), a consequence of
the somehow small network of seventeen individuals and of the
organisational rules in certain levels. L1 Conflicted presents a very low
path length derived from the five network components’ isolation and
is not considered for analysis. L2 Deconflicted and L3 Coordinated
present higher path length levels reflecting a larger network and its
hierarchical ruling. Expectedly, L4 Collaborative and L5 Edge display
the lowest path lengths, in the first level still encouraged by the
dependence on teaming and localised decision-making prerogatives
and, in the latter, provoked by the availability of geodesics to an
increased number of information sources and the requirement for Figure 14 – ELICIT Network Average Path Length
14
independence. The average network path length for the considered C2 maturity levels shows that the variation between
minimum and maximum values is larger in L3 Coordinated and then in L5 Edge, suggesting the need for more testing to
corroborate the findings.
Overall, the Network Path Length variable indicates an evolution from High (based on the possibility to interact within the first
order zone) to Low (constrained by the hierarchical positions and relations) and to Low (enabled by proliferation of geodesic
connections), as we progress from less mature to more mature C2 approaches. It was expected that L5 Edge would present
lower path length values, due to the absence of imposed communication paths. Still, it was not the case and further testing is
advised on this matter.
Network Diameter
The importance of the timing of information flow throughout a network is understandably an important issue in organisational
management. In this framework, just as relevant as the geodesics, is the diameter of the network, that is, the length of the
longest geodesic path between two nodes, also called eccentricity. If the shortest path length determines the efficiency of the
connection, the measure of the network’s diameter indicates the speed of spread of the same information across the entire
organisation, leading to what is usually known as the contagion phenomenon: the adoption of shared knowledge and ideas
through interaction. The distribution of information will thus be hampered in networks exhibiting large diameters or long
geodesic paths.
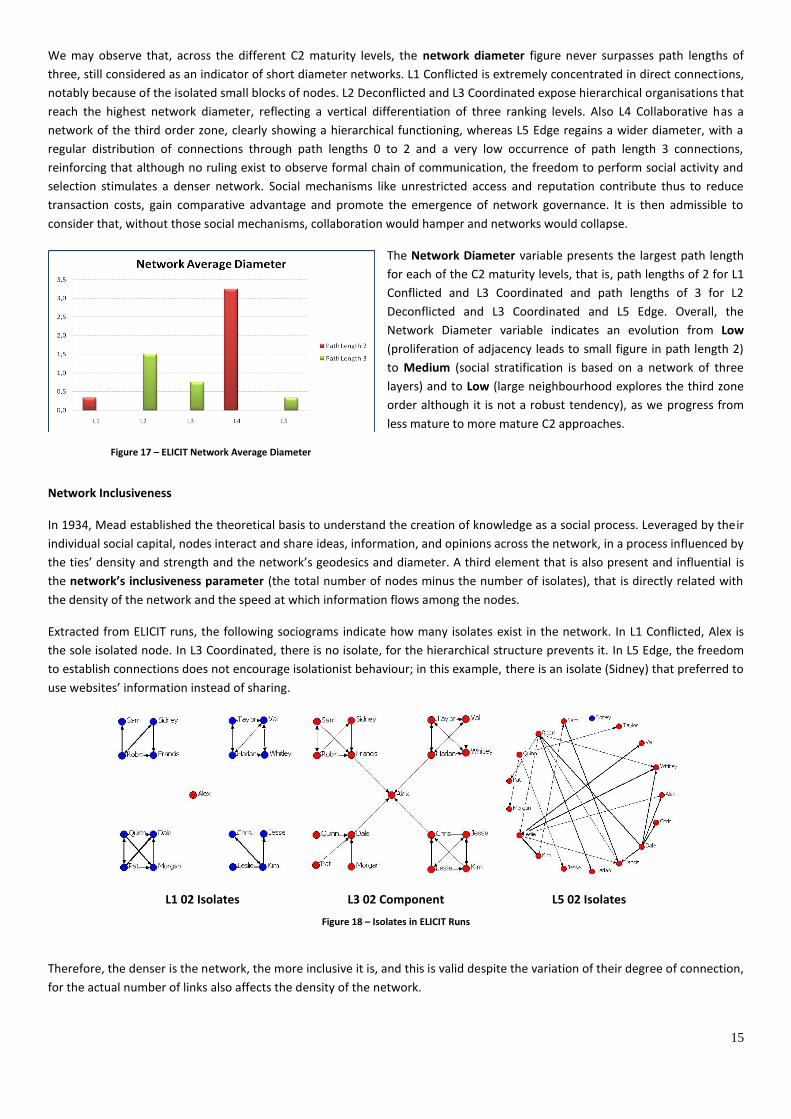
Extracted from ELICIT runs, the following sociograms illustrate different path lengths generated in three ELICIT runs. In L1
Conflicted, Dale’s egonet illustrates a small set of nodes that constructs a cluster with six path lengths and where Quinn is a
pendant and Morgan’s information reaches Dale indirectly, through Pat. In L3 Coordinated, Dale’s egonet displays his
intermediary role to deliver information from own team to Alex. In L5 Edge, Robin’s egonet shows the establishment of several
connections in the pursuit of novel information.
L1 01 Dale’s Egonet
L3 04 Dale’s Egonet
L5 01 Kim’s Egonet
Figure 15 – Examples of Egonets in ELICIT ELICIT collected data on network path length enables the extraction of the network diameter value for each of the C2 maturity
levels:
Figure 16 – ELICIT Network Average Path Lengths
15
We may observe that, across the different C2 maturity levels, the network diameter figure never surpasses path lengths of
three, still considered as an indicator of short diameter networks. L1 Conflicted is extremely concentrated in direct connections,
notably because of the isolated small blocks of nodes. L2 Deconflicted and L3 Coordinated expose hierarchical organisations that
reach the highest network diameter, reflecting a vertical differentiation of three ranking levels. Also L4 Collaborative has a
network of the third order zone, clearly showing a hierarchical functioning, whereas L5 Edge regains a wider diameter, with a
regular distribution of connections through path lengths 0 to 2 and a very low occurrence of path length 3 connections,
reinforcing that although no ruling exist to observe formal chain of communication, the freedom to perform social activity and
selection stimulates a denser network. Social mechanisms like unrestricted access and reputation contribute thus to reduce
transaction costs, gain comparative advantage and promote the emergence of network governance. It is then admissible to
consider that, without those social mechanisms, collaboration would hamper and networks would collapse.
The Network Diameter variable presents the largest path length
for each of the C2 maturity levels, that is, path lengths of 2 for L1
Conflicted and L3 Coordinated and path lengths of 3 for L2
Deconflicted and L3 Coordinated and L5 Edge. Overall, the
Network Diameter variable indicates an evolution from Low
(proliferation of adjacency leads to small figure in path length 2)
to Medium (social stratification is based on a network of three
layers) and to Low (large neighbourhood explores the third zone
order although it is not a robust tendency), as we progress from
less mature to more mature C2 approaches.
Network Inclusiveness
In 1934, Mead established the theoretical basis to understand the creation of knowledge as a social process. Leveraged by their
individual social capital, nodes interact and share ideas, information, and opinions across the network, in a process influenced by
the ties’ density and strength and the network’s geodesics and diameter. A third element that is also present and influential is
the network’s inclusiveness parameter (the total number of nodes minus the number of isolates), that is directly related with
the density of the network and the speed at which information flows among the nodes.
Extracted from ELICIT runs, the following sociograms indicate how many isolates exist in the network. In L1 Conflicted, Alex is
the sole isolated node. In L3 Coordinated, there is no isolate, for the hierarchical structure prevents it. In L5 Edge, the freedom
to establish connections does not encourage isolationist behaviour; in this example, there is an isolate (Sidney) that preferred to
use websites’ information instead of sharing.
L1 02 Isolates
L3 02 Component
L5 02 Isolates
Figure 18 – Isolates in ELICIT Runs
Therefore, the denser is the network, the more inclusive it is, and this is valid despite the variation of their degree of connection,
for the actual number of links also affects the density of the network.
Figure 17 – ELICIT Network Average Diameter
16
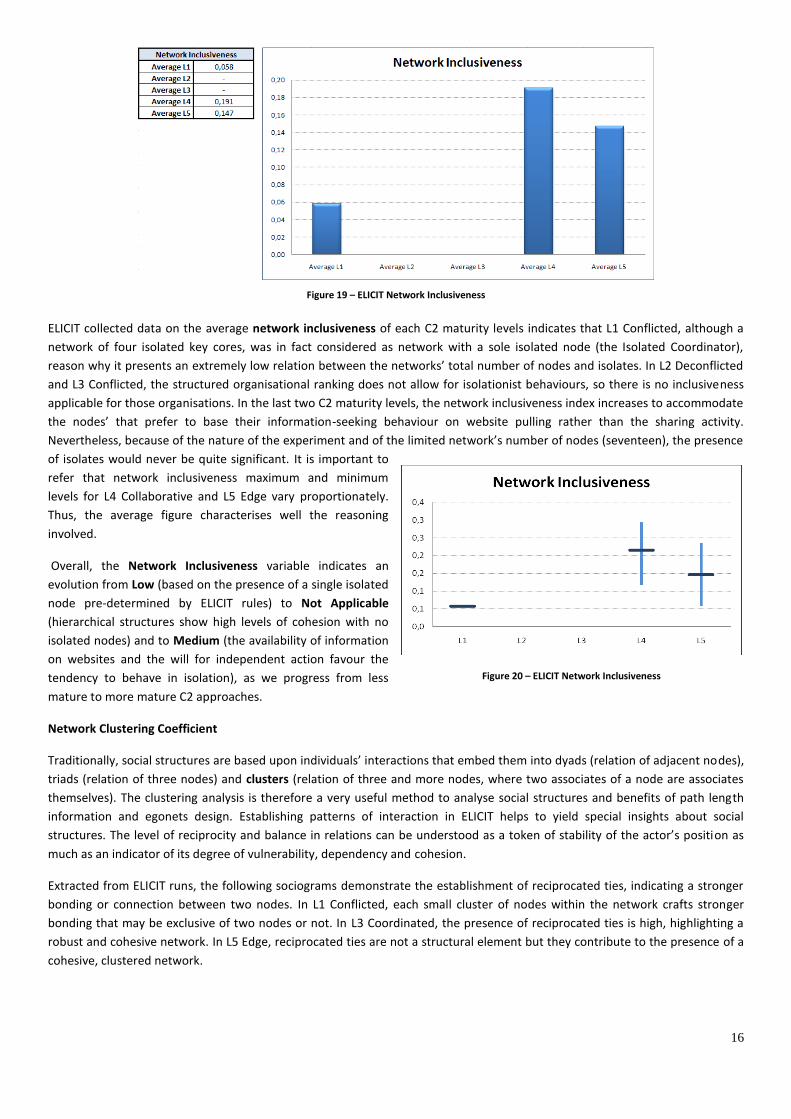
Figure 19 – ELICIT Network Inclusiveness
ELICIT collected data on the average network inclusiveness of each C2 maturity levels indicates that L1 Conflicted, although a
network of four isolated key cores, was in fact considered as network with a sole isolated node (the Isolated Coordinator),
reason why it presents an extremely low relation between the networks’ total number of nodes and isolates. In L2 Deconflicted
and L3 Conflicted, the structured organisational ranking does not allow for isolationist behaviours, so there is no inclusiveness
applicable for those organisations. In the last two C2 maturity levels, the network inclusiveness index increases to accommodate
the nodes’ that prefer to base their information-seeking behaviour on website pulling rather than the sharing activity.
Nevertheless, because of the nature of the experiment and of the limited network’s number of nodes (seventeen), the presence
of isolates would never be quite significant. It is important to
refer that network inclusiveness maximum and minimum
levels for L4 Collaborative and L5 Edge vary proportionately.
Thus, the average figure characterises well the reasoning
involved.
Overall, the Network Inclusiveness variable indicates an
evolution from Low (based on the presence of a single isolated
node pre-determined by ELICIT rules) to Not Applicable
(hierarchical structures show high levels of cohesion with no
isolated nodes) and to Medium (the availability of information
on websites and the will for independent action favour the
tendency to behave in isolation), as we progress from less
mature to more mature C2 approaches.
Network Clustering Coefficient
Traditionally, social structures are based upon individuals’ interactions that embed them into dyads (relation of adjacent nodes),
triads (relation of three nodes) and clusters (relation of three and more nodes, where two associates of a node are associates
themselves). The clustering analysis is therefore a very useful method to analyse social structures and benefits of path length
information and egonets design. Establishing patterns of interaction in ELICIT helps to yield special insights about social
structures. The level of reciprocity and balance in relations can be understood as a token of stability of the actor’s position as
much as an indicator of its degree of vulnerability, dependency and cohesion.
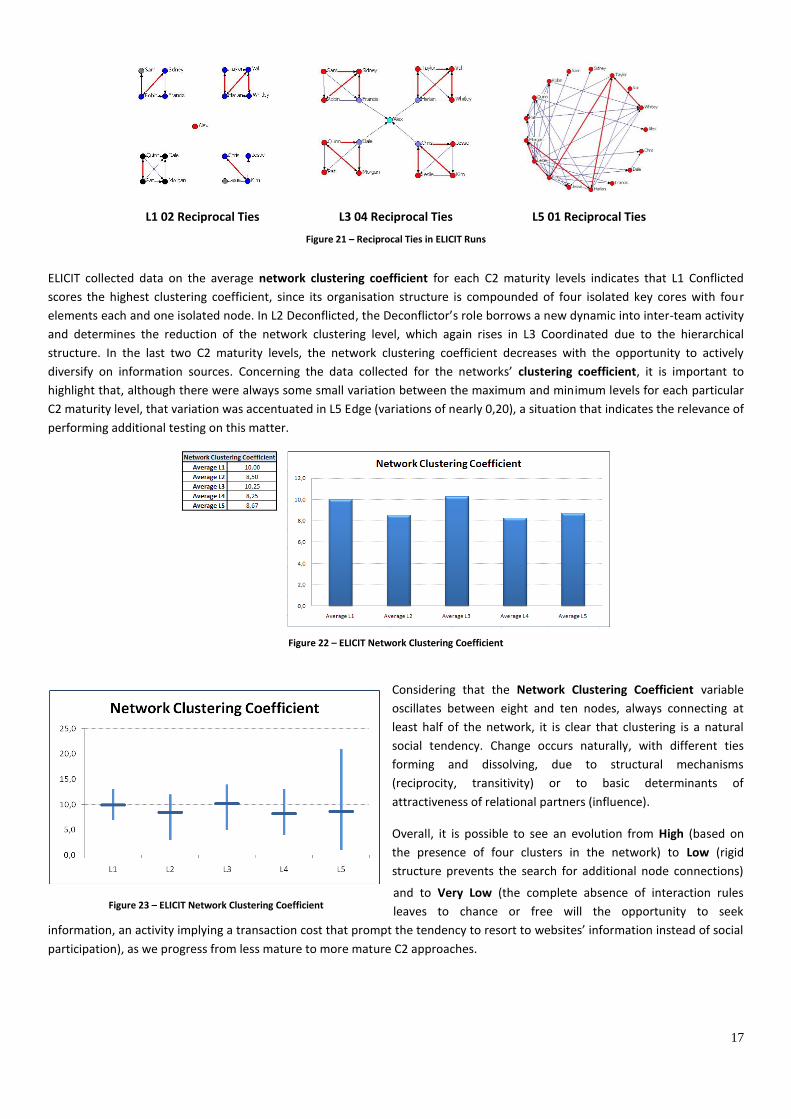
Extracted from ELICIT runs, the following sociograms demonstrate the establishment of reciprocated ties, indicating a stronger
bonding or connection between two nodes. In L1 Conflicted, each small cluster of nodes within the network crafts stronger
bonding that may be exclusive of two nodes or not. In L3 Coordinated, the presence of reciprocated ties is high, highlighting a
robust and cohesive network. In L5 Edge, reciprocated ties are not a structural element but they contribute to the presence of a
cohesive, clustered network.
Figure 20 – ELICIT Network Inclusiveness
17
L1 02 Reciprocal Ties
L3 04 Reciprocal Ties
L5 01 Reciprocal Ties
Figure 21 – Reciprocal Ties in ELICIT Runs
ELICIT collected data on the average network clustering coefficient for each C2 maturity levels indicates that L1 Conflicted
scores the highest clustering coefficient, since its organisation structure is compounded of four isolated key cores with four
elements each and one isolated node. In L2 Deconflicted, the Deconflictor’s role borrows a new dynamic into inter-team activity
and determines the reduction of the network clustering level, which again rises in L3 Coordinated due to the hierarchical
structure. In the last two C2 maturity levels, the network clustering coefficient decreases with the opportunity to actively
diversify on information sources. Concerning the data collected for the networks’ clustering coefficient, it is important to
highlight that, although there were always some small variation between the maximum and minimum levels for each particular
C2 maturity level, that variation was accentuated in L5 Edge (variations of nearly 0,20), a situation that indicates the relevance of
performing additional testing on this matter.
Figure 22 – ELICIT Network Clustering Coefficient
Considering that the Network Clustering Coefficient variable
oscillates between eight and ten nodes, always connecting at
least half of the network, it is clear that clustering is a natural
social tendency. Change occurs naturally, with different ties
forming and dissolving, due to structural mechanisms
(reciprocity, transitivity) or to basic determinants of
attractiveness of relational partners (influence).
Overall, it is possible to see an evolution from High (based on
the presence of four clusters in the network) to Low (rigid
structure prevents the search for additional node connections)
and to Very Low (the complete absence of interaction rules
leaves to chance or free will the opportunity to seek
information, an activity implying a transaction cost that prompt the tendency to resort to websites’ information instead of social
participation), as we progress from less mature to more mature C2 approaches.
Figure 23 – ELICIT Network Clustering Coefficient
18
Network Connectedness
Network connectedness addresses whether and how individuals are connected to one another through the network, a useful
measure to understand notions of dependency and vulnerability. A network’s component consists of all nodes that can be
connected to each other by at least one path, establishing thus the minimum setting for a cohesive structure. In fact, it is rare to
find a network where all nodes are adjacent (directly connected) to one another.
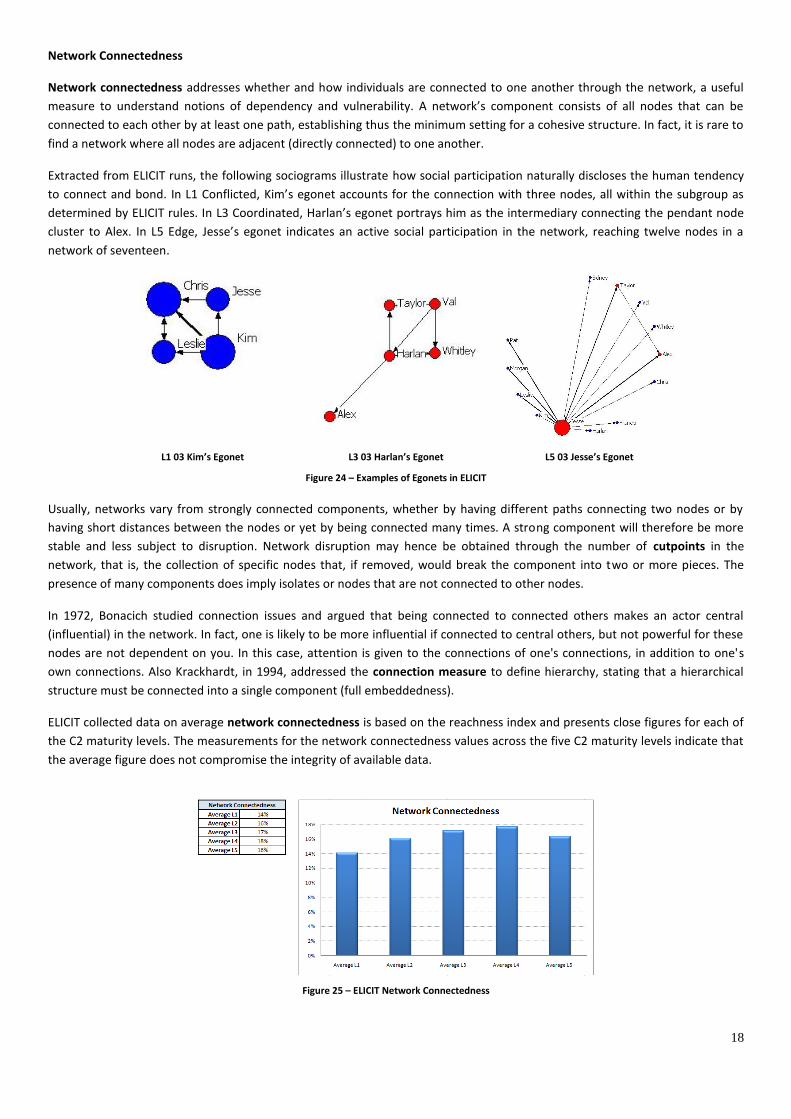
Extracted from ELICIT runs, the following sociograms illustrate how social participation naturally discloses the human tendency
to connect and bond. In L1 Conflicted, Kim’s egonet accounts for the connection with three nodes, all within the subgroup as
determined by ELICIT rules. In L3 Coordinated, Harlan’s egonet portrays him as the intermediary connecting the pendant node
cluster to Alex. In L5 Edge, Jesse’s egonet indicates an active social participation in the network, reaching twelve nodes in a
network of seventeen.
L1 03 Kim’s Egonet
L3 03 Harlan’s Egonet
L5 03 Jesse’s Egonet
Figure 24 – Examples of Egonets in ELICIT Usually, networks vary from strongly connected components, whether by having different paths connecting two nodes or by
having short distances between the nodes or yet by being connected many times. A strong component will therefore be more
stable and less subject to disruption. Network disruption may hence be obtained through the number of cutpoints in the
network, that is, the collection of specific nodes that, if removed, would break the component into two or more pieces. The
presence of many components does imply isolates or nodes that are not connected to other nodes.
In 1972, Bonacich studied connection issues and argued that being connected to connected others makes an actor central
(influential) in the network. In fact, one is likely to be more influential if connected to central others, but not powerful for these
nodes are not dependent on you. In this case, attention is given to the connections of one's connections, in addition to one's
own connections. Also Krackhardt, in 1994, addressed the connection measure to define hierarchy, stating that a hierarchical
structure must be connected into a single component (full embeddedness).
ELICIT collected data on average network connectedness is based on the reachness index and presents close figures for each of
the C2 maturity levels. The measurements for the network connectedness values across the five C2 maturity levels indicate that
the average figure does not compromise the integrity of available data.
Figure 25 – ELICIT Network Connectedness
19
We may observe that L1 Conflicted displays the lowest average figure for network connectedness, since the total number of
connected nodes in this network is low due to its partition into five network blocks. In L2 Deconflicted and L3 Conflicted, the
hierarchical structure determines the presence of a single component with localised connections. L4 Collaborative registers the
highest score in network connectedness, leveraged by the opportunity to connect to the seventeen network nodes and the
existence of a cohesive team structure. L5 Edge’s network connectedness average suffers from the preference to establish weak
connections and to consult websites’ posting. Still, because the variation between minimum and maximum network
connectedness for L5 Edge is relatively large, it would be advisable to perform more ELICIT experiments.
Overall, considering that the Network Connectedness measure
varies between 14% and 19%, rates that are all equivalent to a
three-node connection, we cannot see this average as a major
differentiation among C2 maturity levels. Nevertheless, it is
possible to observe an evolution from Low (minimum node reach)
to Medium (limited node reach) and to High (a full node reach that
is combined with the effects of connection costs and independent
information-seeking behaviour), as we progress from less mature
to more mature C2 approaches.
Network Structural Cohesion
Based on node connectedness, the network’s structural cohesion is defined as the minimum number of actors who, if removed
from a group, would disconnect the group, in other words, the number of nodes pertaining to smallest key core of the network
(a key core is the set of nodes that are more closely connected). As an emergent property of patterns of interaction, structural
cohesion rests upon embeddedness and reachability (Markovsky and Lawler, 1994), illustrates node stability and
institutionalisation and hints on trust and confidence issues. In fact, if the frequency of bonding suggests hierarchical nests
(asymmetric connections), the predominance of reciprocated ties indicates a balanced network where social capital is unified
with trust.
In 1992, Ronald Burt focused on node embeddedness and created a new concept, structural holes, designating the lack of
connection between an ego’s alters, nodes that incurred in serious danger of becoming either isolated or connected to a
different network. On one hand, this new approach reinforced the notion of betweeness (the powerful intermediary condition
controlling the flow of information), while it highlighted the idea of brokerage, a form of social capital centred in the ability to
reduce dependency effects, extending own neighbourhood and attracting new sources of information.
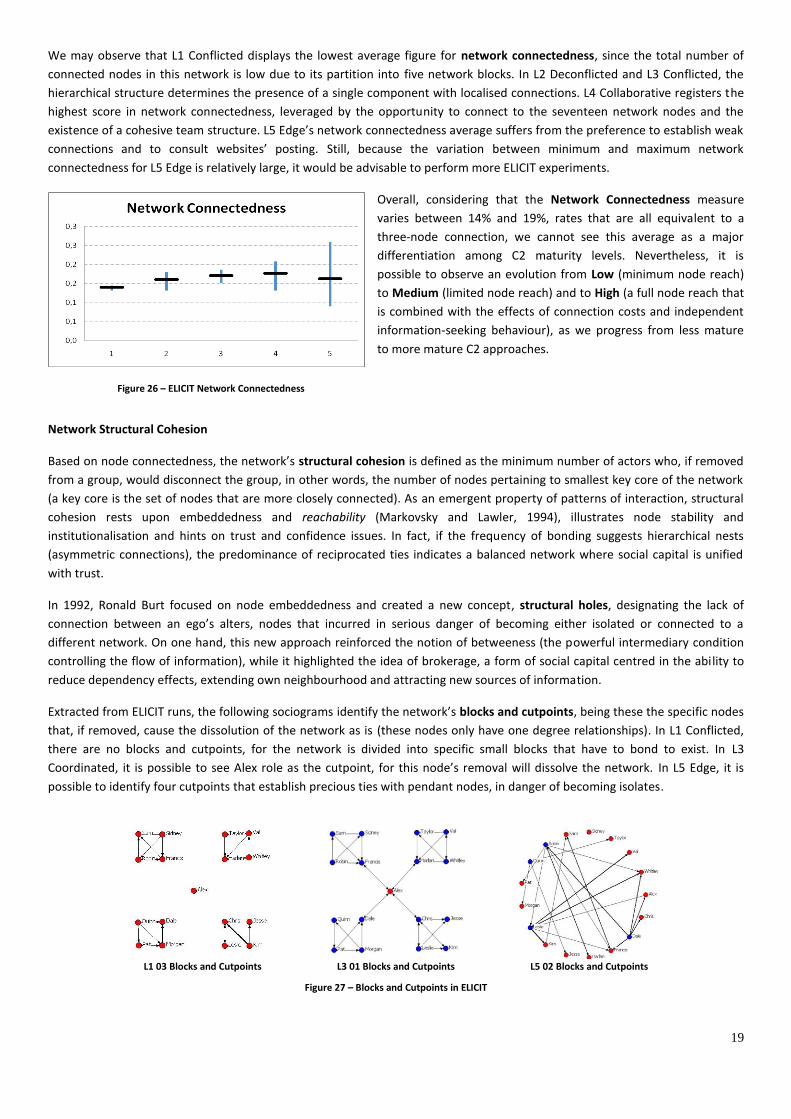
Extracted from ELICIT runs, the following sociograms identify the network’s blocks and cutpoints, being these the specific nodes
that, if removed, cause the dissolution of the network as is (these nodes only have one degree relationships). In L1 Conflicted,
there are no blocks and cutpoints, for the network is divided into specific small blocks that have to bond to exist. In L3
Coordinated, it is possible to see Alex role as the cutpoint, for this node’s removal will dissolve the network. In L5 Edge, it is
possible to identify four cutpoints that establish precious ties with pendant nodes, in danger of becoming isolates.
L1 03 Blocks and Cutpoints L3 01 Blocks and Cutpoints L5 02 Blocks and Cutpoints
Figure 27 – Blocks and Cutpoints in ELICIT
Figure 26 – ELICIT Network Connectedness
20
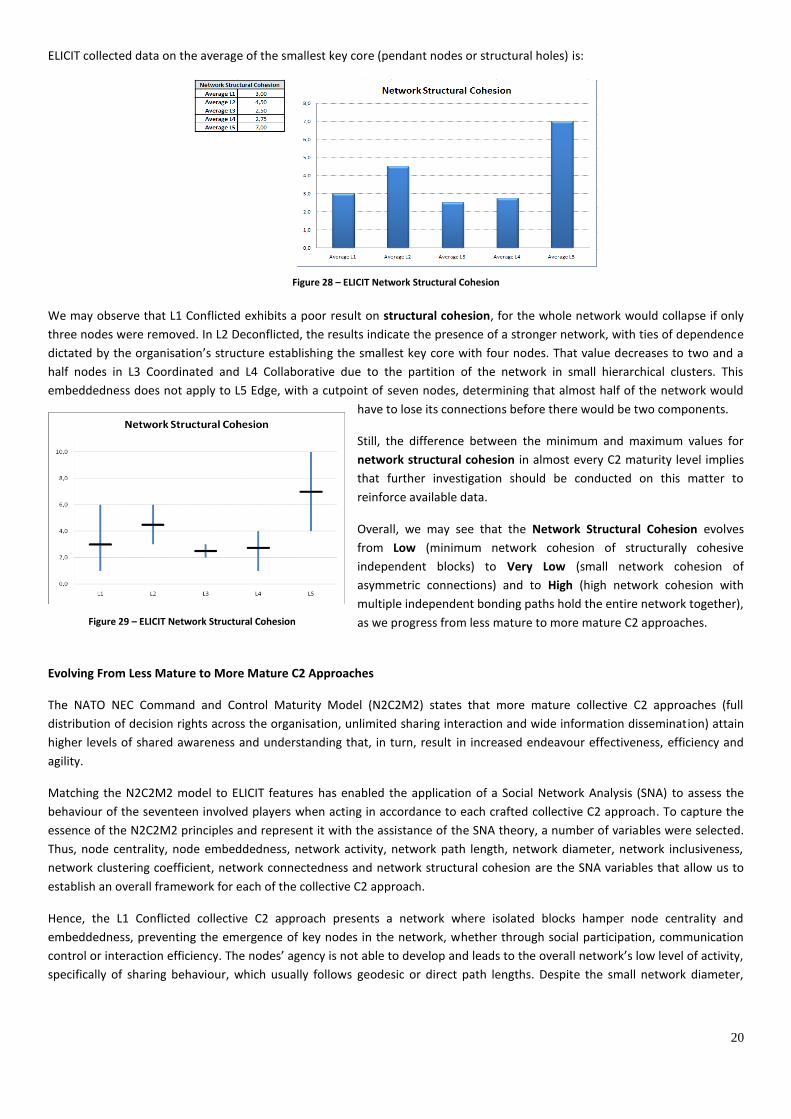
ELICIT collected data on the average of the smallest key core (pendant nodes or structural holes) is:
Figure 28 – ELICIT Network Structural Cohesion
We may observe that L1 Conflicted exhibits a poor result on structural cohesion, for the whole network would collapse if only
three nodes were removed. In L2 Deconflicted, the results indicate the presence of a stronger network, with ties of dependence
dictated by the organisation’s structure establishing the smallest key core with four nodes. That value decreases to two and a
half nodes in L3 Coordinated and L4 Collaborative due to the partition of the network in small hierarchical clusters. This
embeddedness does not apply to L5 Edge, with a cutpoint of seven nodes, determining that almost half of the network would
have to lose its connections before there would be two components.
Still, the difference between the minimum and maximum values for
network structural cohesion in almost every C2 maturity level implies
that further investigation should be conducted on this matter to
reinforce available data.
Overall, we may see that the Network Structural Cohesion evolves
from Low (minimum network cohesion of structurally cohesive
independent blocks) to Very Low (small network cohesion of
asymmetric connections) and to High (high network cohesion with
multiple independent bonding paths hold the entire network together),
as we progress from less mature to more mature C2 approaches.
Evolving From Less Mature to More Mature C2 Approaches
The NATO NEC Command and Control Maturity Model (N2C2M2) states that more mature collective C2 approaches (full
distribution of decision rights across the organisation, unlimited sharing interaction and wide information dissemination) attain
higher levels of shared awareness and understanding that, in turn, result in increased endeavour effectiveness, efficiency and
agility.
Matching the N2C2M2 model to ELICIT features has enabled the application of a Social Network Analysis (SNA) to assess the
behaviour of the seventeen involved players when acting in accordance to each crafted collective C2 approach. To capture the
essence of the N2C2M2 principles and represent it with the assistance of the SNA theory, a number of variables were selected.
Thus, node centrality, node embeddedness, network activity, network path length, network diameter, network inclusiveness,
network clustering coefficient, network connectedness and network structural cohesion are the SNA variables that allow us to
establish an overall framework for each of the collective C2 approach.
Hence, the L1 Conflicted collective C2 approach presents a network where isolated blocks hamper node centrality and
embeddedness, preventing the emergence of key nodes in the network, whether through social participation, communication
control or interaction efficiency. The nodes’ agency is not able to develop and leads to the overall network’s low level of activity,
specifically of sharing behaviour, which usually follows geodesic or direct path lengths. Despite the small network diameter,
Figure 29 – ELICIT Network Structural Cohesion
21
inclusiveness is again reduced to the presence of a single isolated node and of four isolated blocks, which promote significantly
the network’s clustering coefficient, that is, the association of a small group of nodes. Still, the reduced index of connectedness
among those groups is then translated to a poor network structural cohesion. As a consequence of these social characteristics,
the L1 Conflicted network presents no shared information in the network (no interaction patterns across entities) with a
constrained distribution of information occurring within the small group of nodes (teams) and accounting for a reach that never
surpassed 14% of the network. As a result, despite some teams having attained the solution for their specific problem space,
overall organisation success, with all teams finding the correct solution, is not achieved.
The L2 Deconflicted collective C2 approach presents a network of four teams and a Deconflictor whose role is to pass
information forward from and to every team, enabling and controlling information sharing and flow. The network is therefore
characterised by limited peer-to-peer interactions and a stove-piped chain of command, making specific nodes in the network
very central or relevant for the ongoing communication and contributing to the overall node embeddedness in the
organisational structure (not strong in terms of density but reinforced in terms of link strength and flows). The Deconflictor does
contribute to the increased level of network activity, across higher path lengths, built upon a larger network (comparing to L1
Conflicted) and hierarchical ruling. In fact, the network’s diameter enters the fourth order zone (three intermediaries), reaching
an average of 16% of the network and rejecting all possibilities of isolation, while contributing to the reduction of the network
clustering coefficient. The network’s structural cohesion benefits therefore from these enlarged dependency links that generate
a limited information sharing pattern and result in improved effectiveness, despite overall organisation success did not occur.
The traditional hierarchic formation is depicted in L3 Coordinated collective C2 approach, with the organisation depending on
the Coordinator to perform the role of having to gather, process and understand all information available so as to make the
correct identifications. This network displays high levels of node centrality and embeddedness (influenced by the flow and the
strength of links established on account of node positioning and role setting) but decreased activity, for social dynamics and
participation is focused in feeding the Coordinator with information, using the formal network configuration. As a consequence,
the network’s average path length diminishes to accommodate a three-tier hierarchical relationship that isolates no node and
encourages a clustering behaviour, exhibiting a medium structural cohesion index. Having the organisation’s success depend on
the Coordinator determines a single point of failure that, three out of four times, has proven to be unwise for the network’s
effectiveness was severely compromised. In the end, it is mainly the quality of the Coordinator that determines the quality of
the overall organisation.
The L4 Collaborative collective C2 approach has demonstrated to be a solid and resourceful network configuration, whose
performance is facilitated when organisational success depends of the Facilitator or the four Team Leaders finding the correct
solution. Still, as expected, the network displays reduced centrality and embeddedness levels and higher social participation
activity, prompted by the increased relevance of each node’s agency. The dependence on teams for a localised decision-making
activity is reflected by the establishment of lower path lengths (the network’s diameter is of a third order zone) and the
tendency to prevent vulnerability by relying on a limited number of sources. Therefore, isolated undertakings are possible,
affecting network inclusiveness (the highest score of all five collective C2 approach due to higher number of isolates), clustering
(the lowest score of all five collective C2 approach due to an independency trend), connectedness (the highest score of all five
collective C2 approach reaching 18% of the network) and structural cohesion (one of the lowest scores of all collective C2
approach for the network had less than three pendant nodes). In the end, the freedom to pursue information does not imply the
problem of handling with eventual information overload, for it is balanced with the dismissal of responsibility in the decision-
making process. As a result, and considering the benevolent performance assessment, it is possible to observe the best
effectiveness level of all five collective C2 approach organisations.
Finally, the L5 Edge collective C2 approach explored the opportunity to have all information accessible and reachable, to entail
on unlimited sharing as required and to promote the dynamic emergence of decision rights, empowering a resilient,
decentralised and networked organisation. By comparison with the previous collective C2 approach, the L5 Edge organisation
regains some centrality, in the sense that it is possible to note individual prominence: key or central nodes within the network
emerge due to their influential communication activity, or bridging ability to reach out to all nodes in the network or yet
circumventing skill to avoid dependency on a particular source of information. These features are reinforced by the reduction of
all embeddedness variables (link density, strength and flow) in the face of the recognition of weak ties’ strength in the pursuit of
a rewarding network configuration. And this pursuit is extremely well represented in the network’s activity score, the highest of
22
all five collective C2 approaches and a sign that massive social participation forwards empowerment and leads to increased
satisfaction levels. As a consequence, the network establishes a larger neighbourhood and a wider diameter, and even
comprises the lowest number of path length 3 connections and a reduced occurrence of isolationist behaviours, up to the
moment where the transaction costs advise the resource to website pulling and posting. In fact, L5 Edge collective C2 approach
presents the highest risks on interactions engagement: subjects have to balance the wonder of full network reach with the
unawaress of potential beneficial outcomes, the lack of assurance on reciprocity and the compromise of their status and
prominence. To downplay these negative effects on social capital, it is the human nature to flock in small groups and, based on
the stability provided by clustering, reach out to novel information through multiple, redundant and independent paths that
bond the network together and determine that almost half of its nodes would have to lose their connections before the whole
network collapsed. Indeed, this collective C2 approach reveals the highest structural cohesion of all five collective C2
approaches, reinforced by the highest levels of shared awareness and understanding. Still, the limitations imposed on the
effectiveness assessment for this particular organisation (the organisation’s success is determined by the mode of answers
provided) has taken a negative toll on the overall performance, although the extremely promising time-efficiency levels.
5 KNOWING THE NETWORK, KNITTING THE NETWORK
Organisations are built on complex interactions. But how does success emerge from the complex collaboration connections within organisations?
SNA may prove the first statement but the improvement of connectivity requires more than knowing the network, it requires knitting the network.
Social network analysis enables the understanding of the embedded network system, not forsaking the answer to particularly relevant enigmas for the emergence of an efficient and effective organisation: are the key connections in place, which are the influential actors involved, are ideas shared and acted upon?
A network map is an excellent tool for visually tracking your ties and design strategies to create new connections. When local interactions lead to global patterns, scientists call it emergence (Krebs and Holley), the goal is to understand and catalyze interactions.
Successful organisations run on common goals or governance. Successful organisations view the diversity of interactions as the requirement to maximize innovation. Successful organisations are robust networks in which several paths between any two nodes guarantee uninterrupted information flow and knowledge exchange. Successful organisations know that some individuals are more prominent than others, for they act as hubs (distribution and diffusion of information), as brokers (liaisons to novel information and knowledge) or as boundary spanners (bridging relevant groups).
Empowered with the knowledge of the networked organisation, it is vital to actively manage the network, that is, to knit the network, so that a more robust, resilient, responsive, flexible, innovative, adaptive and sustainable network structure is built and a creative organisation emerges.
And social network analysis reveals the progress of network knitting the organisation, through the process of relationship building (access to information and innovation) and of collaboration facilitation. The culture of collaboration increases the organisation's scale, impact and reach, creating a state of emergence, where the outcome — the creative organisation — is more than the sum of the many collaborations, is a new dynamic for work flow, information exchange and knowledge sharing.
The creative organisation (Manso, 2008) presents thus a network core model featuring the key organisation members, while the periphery of the network embraces the new elements of the organisation that ambition to reach its core, the bridge nodes that liaise to diversified communities and external unique resources that represent an added-value to the organisation whenever it is required. In the core/periphery network structure, the porous periphery functions are the organisation's radar, reaching out to new ideas, information and knowledge, whereas the strong core allows the organisation to act on those ideas, information and knowledge.
Throughout this network knitting process, social network analysis guides the path ahead, revealing what we should know and uncovering what we ought to know. SNA enables to gather the necessary skills and resources to build a more agile organisation (Alberts and Hayes, 2003), maximized for collaboration, learning and implementation.
23
6 BIBLIOGRAPHY
Alberts, David and Richard E. Hayes. Planning: Complex Endeavors. CCRP Publication Series. 2007.
Alberts, David and Richard E. Hayes. Understanding Command and Control. CCRP Publication Series. 2006.
Alberts, David and Richard E. Hayes. Power to the Edge: Command … Control … in the Information Age. CCRP Publication Series. 2003.
Biggs, Michael. Sociological Theory. 2009. http://users.ox.ac.uk/~sfos0060/SociologicalTheory.shtml.
Borgatti, Stephen P.. Identifying sets of key players in a social network. Comput Math Organiz Theor. Springer Science+Business Media. 2006.
Borgatti, Stephen P. and José Luís Molina. Ethical and Strategic Issues in Organizational Social Network Analysis. The Journal of Applied Behavioral Science. September 2003.
Borgatti, Stephen P. and Pacey C. Foster. The Network Paradigm in Organizational Research: A Review and Typology. Department of Organization Studies. Carroll School of Management. Boston College. May 2003.
Borgatti, Stephen P. and Rob Cross. A Relational View of Information Seeking and Learning in Social Networks. Carroll School of Management. Boston College. Chestnut Hill. Management Science. Informs. Vol. 49. No. 4. April 2003.
Borgatti, Stephen P., Candace Jones and William S. Hesterly. A General Theory of Network Governance: Exchange Conditions and Social Mechanisms. Academy of Management Review. Vol. 22. No. 4. 1997.
Brass, Daniel J. Connecting to Brokers: Strategies for Acquiring Social Capital. Chapter 10.
Breiger, Ronald L.. The Analysis of Social Networks. Handbook of Data Analysis. SAGE Publications. 2004.
Burk, William J., Christian E. G. Steglich and Tom A. B. Snijders. Beyond Dyadic interdependence: Actor-oriented Models for Co-Evolving Social Networks and Individual Behaviors. International Journal of Behavioral Development. 31 (4). The International Society for the Study of Behavioural Development. 2007.
Burton, Ronald. Brokerage and Closure – Introduction to Social Capital. University of Chicago Graduate School of Business. Autumn, 2004. http://gsbwww.uchicago.edu/fac/ronald.burt/research.
Burton, Ronald. Securing The Bridge, With The Questions We Ask. University of Chicago Graduate School of Business. 2005. http://gsbwww.uchicago.edu/fac/ronald.burt/research.
Burton, Ronald. Emotional Activity Around Structural Holes. University of Chicago Graduate School of Business. http://gsbwww.uchicago.edu/fac/ronald.burt.
Burton, Ronald. Strategic Leadership. University of Chicago. Booth School of Business. Winter 2009.
Chen, Wenhong and Justin Tan. Roots And Wings: Glocalized Networks And Transnational Entrepreneurship. Academy of Management Proceedings.
Clark, Louise. Network Mapping As a Diagnostic Tool. Centro Internacional de Agricultura Tropical (CIAT). Bolivia. March 2006.
Cross, Rob, Stephen P. Borgatti and Andrew Parker. Making Invisible Work Visible: Using Social Network Analysis to Support Strategic Collaboration. California Management Review. Vol. 44. No. 2. Winter 2002.
Edison, Tom. Social Networking Analysis: One of the First Steps in Net-Centric Operations. Defense Acquisition Review Journal. Defense Acquisition University. 2005.
Fischbach, Kai, Schoder, Detlef and Gloor, Peter. Analysis of Informal Communication Networks – A Case Study. Business & Information Systems Engineering. February 2009.
Freeman, Linton C.. Graphical Techniques for Exploring Social Network Data. University of California. June 23, 2001.
24
Freeman, Linton C.. Some Antecedents of Social Network Analysis. Connections 19 (1). INSNA. University of California. Irvine. 1996.
Freeman, Linton C. and Cynthia M. Webster. Interpersonal Proximity in Social and Cognitive Space. Social Cognition. Vol. 12. No. 3. 1994.
Freeman, Linton C., Stephen P. Borgatti and Douglas R. White. Centrality in Valued Graphs: A Measure of Betweenness Based on Network Flow. Social Networks 13. Holland. 1991.
Freeman, Linton C.. Centrality In Social Networks – Conceptual Clarification. Social Networks 1, 215-239. Lehigh University. Lausanne. 1979.
Freeman, Linton C.. A Set of Measures of Centrality Based on Betweeness. Sociometry. Volume 40. No 1. 35-41. Lehigh University. Lausanne. 1977.
Freeman, Linton C., Thomas J. Fararo, Warner Bloomberg Jr. and Morris H. Sunshine. Locating Leaders in Local Communities: A Comparison of some Alternative Approaches. American Sociological Review. Vol. 28. No. 5. American Sociological Association. October 1963.
Gloor, Peter. You Are Who Remembers You. Detecting Leadership Through Accuracy Of Recall.
Gloor, Peter et al.. Studying Microscopic Peer-to-Peer Communication Patterns. Americas Conference on Information Systems.
Gloor, Peter, Maria Paasivaara, Detlef Schoder and Paul Willems. Correlating Performance With Social Network Structure Through Teaching Social Network Analysis. August 2006.
Gloor, Peter, Maria Paasivaara, Detlef Schoder and Paul Willems. Finding Collaborative Innovation Networks Through Correlating Performance With Social Network Structure. August 2006.
Gretchko, Susan, Peter Gloor, Anne Taylor and Richard Kleinert. Collaborative Knowledge Networks - Driving Workforce Performance Through Web-enabled Communities. Delloite Research. Deloitte Consulting and Deloitte & Touche LLP. 2001
Hanneman, Robert A. and Mark Riddle. Introduction to Social Network Methods. Department of Sociology. University of California. 2005.
Hayes, Richard E. and Margaret Daly Hayes. Statistical Analyses of ELICIT Experimentation Data - C2 Maturity Model Experimental Validation. Homeland Security Seminar. Military Academy. Lisbon. July 2008.
Hoppe, Bruce and Claire Reinelt. Network Analysis And the Evaluation of Leadership Networks. Leadership Quarterly. January 2009
Huisman, Mark and Marijtje A. J. Van Duijn. Software for Social Network Analysis. University of Groningen. 3rd October 2003.
Jones, Candace, Stephen Borgatti and William S. Hesterly. A General Theory of Network Governance. Academy of Management Journal. 1997.
Kadushin, Charles. Basic Network Concepts - Introduction to Social Network Theory. February 17, 2004.
Krebs, Valdis and June Holley. Building Smart Communities through Network Weaving.
Knoke, David. Social Capital. Department of Sociology. University of Minnesota.
Lazer, David. Bavelas Revisited. Complexity and Social Network Blog. posted at April 23, 2007 9:17AM. http://www.iq.harvard.edu/blog/netgov/2007/04/bavelas_revisited_hubspoke_vs.html.
Leavitt, Harold J.. Some Effects Of Certain Communication Patterns On Group Performance. January 1950.
Lee, L. Lock. The Role of Corporate Social Capital in Business Innovation Networks. University of Sidney. Optimice.
Maggio, M. de, Peter Gloor and G. Passiante. Collaborative Innovation Networks, Virtual Communities And Geographical Clustering. Inderscience Enterprises Ltd.

25
Manso, Bárbara. Corações e Mentes – O Novo Mundo, As Organizações Criativas e A Liderança Sábia. 2008.
Mathieson, Graham, et al.. Coping with Social and Cultural Variables in C2 modeling for Networked Enabled Forces. Defence Science and Technology Laboratory. 10th International Command and Control Research and Technology Symposium. Ref Dstl/CP14613. 2005.
Moody, James and Douglas R. White. Structural Cohesion and Embeddedness: A Hierarchical Concept of Social Groups. American Sociological Review. February 2003.
Nann, Stefan, Jonas Kraussa, Michael Schoberb, Peter Gloor, Kai Fischbacha and Hauke Führesb. Comparing The Structure Of Virtual Entrepreneur Networks With Business Effectiveness. Collaborative Innovation Networks (COINS) 2009. Procedia - Social and Behavioral Sciences (2009).
Snijders, Tom A.B., Christian E. G. Steglich and Michael Schweinberger. Modeling the Co-Evolution of Networks and Behavior. ICS. Department of Sociology. University of Groningen. October 6, 2005.
Snijders, Tom A. B.. Models for Longitudinal Network Data. ICS. Department of Sociology. University of Groningen. July 27, 2004.
Webster, Cynthia M., Linton C. Freeman and Christa G. Aufdemberg. The Impact of Social Context on Interaction Patterns. 2001.
Yoo, Y. and M. Alavi. Electronic Mail Usage Pattern of Emergent Leaders in Distributed Teams. Sprouts: Working Papers on Information Environments, Systems and Organizations. Volume 2. Issue 3 (Summer). 2002.
Zack, Michael H.. Researching Organizational Systems using Social Network Analysis. Proceedings of the 33rd Hawai'i International Conference on System Sciences. Maui. Hawai'i. January, 2000.