Mathematical practices and mathematical modes of enquiry: same or different?
Upload
khangminh22Category
view
1download
0
1
Vol.:(0123456789)
Scientific Reports | (2021) 11:21266 | https://doi.org/10.1038/s41598-021-00690-z
www.nature.com/scientificreports
Kinetics, energy efficiency and mathematical modeling of thin layer solar drying of figs (Ficus carica L.)Lahcen Hssaini1*, Rachida Ouaabou2, Hafida Hanine3, Rachid Razouk1 & Ali Idlimam4
First convectional thin layer drying of two fig (Ficus carica L.) varieties growing in Morocco, using partially indirect convective dryer, was performed. The experimental design combined three air temperature levels (60, 70 and 80 °C) and two air-flow rates (150 and 300 m3/h). Fig drying curve was defined as a third-order polynomial equation linking the sample moisture content to the effective moisture diffusivity. The average activation energy ranged between 4699.41 and 7502.37 kJ/kg. It raised proportionally with the air flow velocity, and the same patterns were observed for effective moisture diffusivity regarding drying time and velocity. High levels of temperature (80 °C) and velocity (300 m3/h) lead to shorten drying time (200 min) and improve the slices physical quality. Among the nine tested models, Modified Handerson and Pabis exhibited the highest correlation coefficient value with the lowest chi-square for both varieties, and then give the best prediction performance. Energetic investigation of the dryer prototype showed that the total use of energy alongside with the specific energy utilization (13.12 and 44.55 MWh/kg) were inversely proportional to the velocity and drying temperature. Likewise, the energy efficiency was greater (3.98%) in drying conditions.
AbbreviationsCDC Characteristic drying curveCDE Curve drying equationDv Drying volume flow rate (m3/h)d.b Dry basis(
−dMdt
)
0 Initial drying rate (kg water/(kg dry matter.min))
(
−dMdt
)
t Drying rate at a specific drying time (kg water/(kg dry matter.min))
f Relative drying rate (dimensionless)M Moisture content (% dry weight)M0 Initial moisture content (% dry weight)Me Equilibrium moisture content (% dry weight)Mf Final moisture content (kg water/kg dry weight)MR Moisture ratioSE Standard errorR Correlation coefficientw.b Weight basisGLM General linear modelΔE Total color differenceχ2 Chi squarei Observation numberBTU British thermal unit
OPEN
1National Institute of Agricultural Research (INRA), Rabat, Morocco. 2Department of Chemistry, Faculty of Science Semlalia, Cadi Ayyad University, B.O. 2390, 40000 Marrakesh, Morocco. 3Laboratory of Bioprocess and Bio-Interfaces, Faculty of Science and Technics, BO 523, Beni-Mellal, Morocco. 4Laboratory of Solar Energy and Medicinal Plants, Teacher’s Training College, Cadi Ayyad University, BP 2400, Marrakesh, Morocco. *email: [email protected]
2
Vol:.(1234567890)
Scientific Reports | (2021) 11:21266 | https://doi.org/10.1038/s41598-021-00690-z
www.nature.com/scientificreports/
ft FootW WattABS Absolute humidityHR Relative humidity
Figs (Ficus carica L.) are important source of essential dietary nutrients such as fibers, carbohydrates, minerals and vitamins1. Since the moisture content of fresh figs is, generally, more than 80%, they are classified as highly perishable. Keeping the fruits fresh, has always been the best way to maintain their health promoting compounds, but most storage techniques require low temperatures, which are difficult to maintain throughout the distribution chain2. However, even in low temperature or refrigerated conditions, figs may not be stored for a long period, and thus maintain their nutritional value. Traditionally, many preservation technics of fruits have been applied since generations ago like salting, dehydration and fermentation3. Drying is among the most appropriate food preservations means that is still being widely practiced until today. Drying has been recognized as a promising alternative to extend figs shelf-life and for postharvest management, as figs are among the world’s largest dried crops4,5. It is also one of the apparent technics to increase its production to meet the market demand by reduc-ing wastage, especially in undeveloped countries where exist poorly established logistics for low temperature distribution and handling facilities6. Drying can be processed using several solar drying technics.
Numerous studies dealt with innovative indirect solar dryer, such as the photovoltaic-thermal hybrid solar reported by Slimani et al.7, where the results showed the effectiveness of the used configuration, with low electrical power requirements. In the study of Vijayan et al.8, a dryer prototype combined with porous sensible heat storage medium, was investigated for drying bitter gourd, which was more consistent and produced better quality product as compared to open sun drying. Likewise, Chaouch et al.9, used solar dryers with different principles to study camel meat drying with very satisfactory final quality of dried camel meat with better preservation of protein rate of 83.5%. The indirect solar convective drying may become a more convenient alternative for small exploitations in rural sector and other areas where electricity is scarce and in regular supply3. Likewise, it can reduce wastages, improve dried products quality and is economically advantageous compared to traditional drying methods6. Furthermore, several problems which are associated with open-air drying can be solved by using a solar dryer10.
Drying depicts a complex process of heat and mass transfer of removing moisture from biological products. In food processing, the main role of drying technologies is to preserve agricultural commodities quality, extend their shelf life and produce new products, that would not otherwise be feasible3. Furthermore, drying allows to obtain a desired moisture content, physical form, flavor, color, or texture, and to reduce the volume or the weight for low cost transportation11. Using drying is technically convenient and the cost associated for process-ing, packaging, transportation, and storage is sensitively less for dried fruits than canned and frozen products12. The simulation of drying experimental results with help of empirical and semi-empirical models is valuable for designing new or in improving existing drying systems. They are also helpful in drying process configuration and control13. In food drying kinetics, the constant K is used instead of transport proprieties (thermal diffusiv-ity, thermal conductivity and moisture diffusivity), that describes the drying process. Simply put, the constant K combines all the transport properties and defined the drying process. Numerous thin layer equations exist in the literature and are useful for investigating drying of several agricultural products, such as, apricot14, mullbery15, Strawberry13, eggplant16, citrus17, banana18 and cherry19. These models were useful in describing the drying kinetics of numerous products under different aerothermal conditions and to estimate their drying time. They also serve to upsurge the drying efficiency and to generalize drying curves for the design and operation of dryers.
Nowadays, figs are an important crop worldwide with is an increasing interest in their consumption either fresh or dried as they are an important component for highly nutritive diet20. Morocco ranks 3rd in the world’s fig production with about 153,472 tons, representing about 8% of the worldwide fig production, after Turkey (310,000 tons) and Egypt (225,295 tons)21,22. The total production of these top three fig producers accounts for more than 52% of the world’s total23. Turkey is the first fig exporter worldwide with about 41.6% of the world’s total. Most of these exportations concerns dried figs with an export value of 29,291,000 $, representing about 31.6% worldwide23,24.
Most of the Moroccan fig production is concentrated in the northern mountainous regions, where its cul-tivation is the main agricultural activity after olive (Olea europaea). However, because of the poor postharvest infrastructure and handling facilities needed to maintain product freshness and nutritional value, figs were, until recently, considered as a secondary crop and have been underexploited. Nowadays, an important interest was given to solar drying technics, since Morocco receives an intensive daily average solar radiation intensity of 5.3 kW h/m2 and 5 to 6 h of sunshine duration in the winter and 9 to 10 h during the summer25. The exploitation of this abundantly available source of energy could be very useful in most of Moroccan regions, particularly during summer and can be used for many applications such as drying, heating, distilling water, etc.26. This makes solar thermal application for agricultural products drying, particularly figs to be integrated. Furthermore, while a few numbers of studies have been published over the last decade on drying of some Moroccan crops like prickly pear27, sweet cherry19, the conducted literature review, revealed that no similar studies have been carried out on figs. In this context, two fig varieties growing in Morocco, namely, ‘Rey Blanche’ and ‘Conidria’ were studied for their drying behavior using partially indirect convective dryer. This study aims to : (1) study the fig drying kinetics using two of the most cultivated varieties in Morocco, (2) investigate the effect of drying temperature and velocity on the fig drying kinetics, (3) determine the characteristic drying curve (CDC) of each fig variety, (4) calculate the effective diffusivity and the average activation energy, (5) fit the fig drying curves using several semi-theoretical and theoretical models in order to select the one providing the highest prediction throughput resolution, and to (6) determine the specific thermal consumption and overall thermal efficiency of the dried used.
3
Vol.:(0123456789)
Scientific Reports | (2021) 11:21266 | https://doi.org/10.1038/s41598-021-00690-z
www.nature.com/scientificreports/
This work contributes to a detailed research and information about figs drying proprieties and modeling grow-ing in Morocco. In the present study is the first systematic investigation of thin layer behavior in figs during hot air forced convection, alongside with the energy consumption and efficiency in a solar dryer under the Moroccan conditions. It, therefore, investigates, the possibility of adopting forced convection solar drying to reduce post-harvest losses of figs, harvesting and optimizing free solar energy, and helping local farmers economically. The herein proposed solar dryer prototype can be manufactured locally; cheaply, thus it will be totally affordable by smallholder farmers along with traditional cooperatives clusters. This prototype can have wide application espe-cially in remote mountainous areas as well as in the south area where sunshine is abundant during the whole year.
Materials and methodsPreparation. Fresh figs belonging to ‘Rey Blanche’ and ‘Conidria’ varieties planted in the ex-situ collection the National Institute for Agricultural Research (INRA) in Meknes, Morocco. They were harvested at their full repining during August of 2019. The experimental research complies with IUCN Policy Statement on Research Involving Species at Risk of Extinction and the Convention on the Trade in Endangered Species of Wild Fauna and Flora. The fruits were kept in polyethylene bags and transported in portable cooler. The figs initial moisture was determined by the standard gravimetric method at 105 °C for 24 h according to AFNOR NF V03-40. Each measurement was performed in triplicate.
Drying experiments. The samples were cut in thin slices of 70 g following a uniform thickness of ~ 6 mm using ceramic knife. The experimental design combined three air temperatures levels (60, 70 and 80 °C) and two drying velocity levels 150 and 300 m3/h. The dryer was started about 40 min before drying experiments to achieve steady-state conditions. The fig slices were spared uniformly on the first rack of stainless-steel mesh (mesh size 10 × 10 mm) to ensure homogeneity of diffusion during the process. The heated air goes through the drying chamber trays, from the bottom and flowed upwards to carry out the samples’ moisture. The auxiliary heater served for controlling and keeping the air temperature constant.
The fig slices wet Mh(t) was monitored through time using a precision balance (± 0.01 g). Initially, the sam-ples weighing Mh(t) was performed every 5 min for the first hour, then increased to 10 min for the second hour and 20 min until constant weight. Dry weight Md was measured after each experiment by keeping samples at 105 °C for 24 h. The moisture content was determined using Eq. (1). The temperature and air humidity at drying entrance unit were measured using a HI 9564 Thermo Hygrometer (Hanna Instruments Ltd, Bedfordshire, UK).
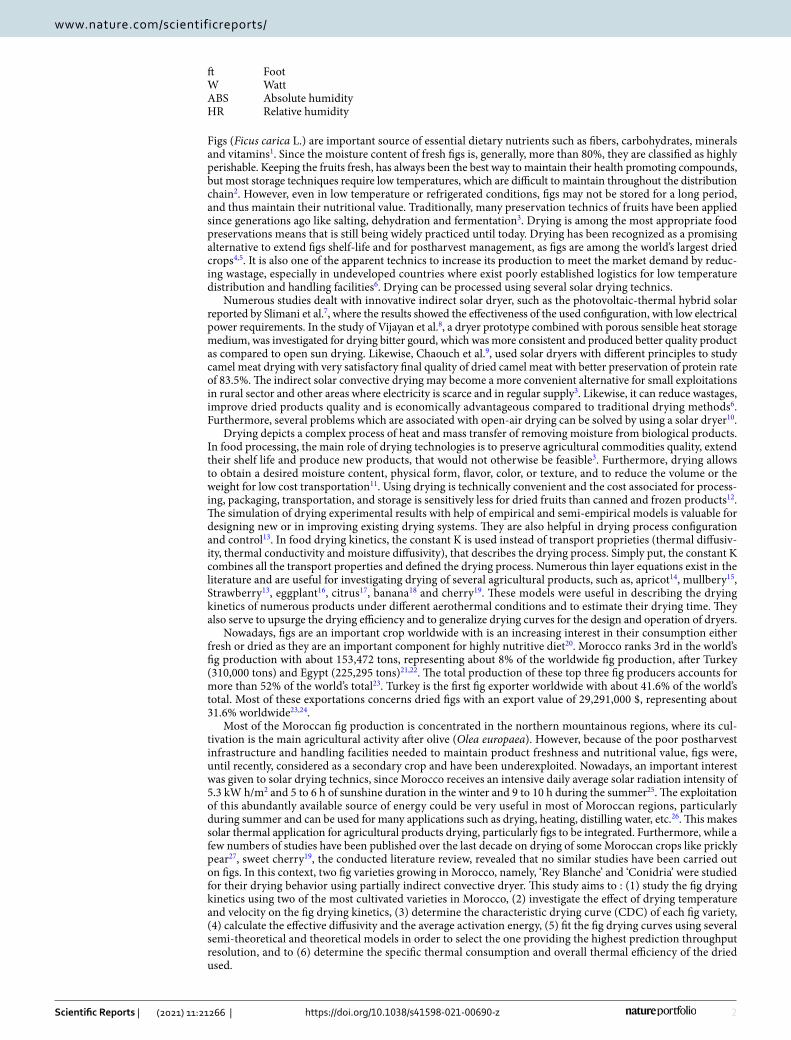
Experimental set up. Figs slices were dehydrated in hybrid convection solar dryer (Fig. 1). The prototype produces 80% of solar radiation, and is basically composed of four main parts that are: solar air collector, drying chamber, circulation fan and auxiliary heater. The solar collector was a 10° inclined black galvanized sheet iron with dimensions of 1 m by 2.5 m and a thickness of 0.5 mm. It was a non-selective surface-oriented southward with a single circulation and glazed. The drying chamber was 1.40 m of height, 0.5 m width, and 0.90 m depth and has 10 racks. A centrifugal fan (0.0833 m3/s; 80 mm CE, 220 V) provides a theoretical velocity of 1.7 m/s with a regulator which allows to fixed the air flow rate within a range of 150 to 300 m3/h. The circulation fan that supplies fresh air has a power of 0.1 kW. The auxiliary heater has a power of 4 kW. It was connected to a ther-moregulator which allows to set the temperature (0 to 99 ± 0.1 °C) of drying chamber. Further details regarding accuracy of different drying compartments alongside that of other devices herein are summarized in the Table 1.
(1)M(t) =Mh(t)−Md
Md
Figure 1. Schematic diagram of the solar dryer. (1) Solar collector, (2) circulation fan, (3) fan, (4) air flow direction, (5) control box, (6) auxiliary heating system, (7) shelves, (8) drying cabinet, (9) recycling air, (10) control foot, (11) exit of air, (12) humidity probes and (13) thermocouples (14) sample holder (Ouaabou et al.19).
4
Vol:.(1234567890)
Scientific Reports | (2021) 11:21266 | https://doi.org/10.1038/s41598-021-00690-z
www.nature.com/scientificreports/
Determination of moisture ratio and dimensionless drying rate. The final moisture content meas-urement is critical. It helps to investigate the drying progression and determines whether the process was accom-plished or not. This variable is a great indicator on the sample physicochemical quality. The moisture ratio (MR) and the dimensionless drying (f: ratio of sample initial drying rate and drying rate at a specific time of the experi-ment) of samples were determined as follow:
where M(t) is the sample moisture content versus time (kg water/kg dry weight), M0 is the initial water content (kg water/kg dry weight), Me is equilibrium moisture content of fig samples (kg water/kg dry solid),
(
−dMdt
)
0 :
initial drying rate, (kg water/(kg dry matter.min)) and (
−dMdt
)
t : drying rate at a specific drying time (kg water/
(kg dry matter.min)).The determination of the drying kinetics is achieved using appropriate software calculation (DOS Smoothing,
Curve Expert 3.1 and Originpro 8.1). The drying rate corresponding to each experiment was calculated using Lissage software under MS-DOS.
The effective moisture diffusivity. The effective moisture diffusivity Deff is an important transport prop-erty in food drying processes modeling. It indicates the flow of moisture within the drying product. Moisture migrates from the inside of the product and reaches the outer surfaces under the action of various moisture transport mechanisms that can be combined (i.e. capillary flow, Knudsen diffusion, surface diffusion, evapo-ration and condensation, pure diffusion, ect.). This moisture thereafter, is evaporated through the air due to convection28. Fick’s equation might be performed to depict the drying behavior through falling rate period. It is presented in Eq. (4):
Assuming that the transport of moisture carries out by diffusion, the shrinkage is neglected, the particle is homogenous and isotropic, initial moisture and temperature distribution are uniform, the analytical solution of Fick’s can be developed as shown in Eq. (5) 29.
For a sufficiently long drying period, the above equation becomes30:
where L (in m) is the half-thickness of the used samples.Deff could be determined through the slope method. Indeed, Eq. (6) is transformed into Eq. (7):
The Deff may be deduced from the slope of Eq. (8) by fitting the drying experimental data. The activation energy Ea, is the lowest energy level (minimum), that must be exceeded for this process to occur. The Ea value is
(2)MR(t) =M(t)−Me
M0 −Me
(3)f =
(
−dMdt
)
t(
−dMdt
)
0
(4)∂MR
∂t= Deff∇2 MR
(5)MR =8
π2
∞∑
n=1
1
n2exp
(
−(2n+ 1)2π2Deff t
R2
)
(6)ln (MR) = ln
(
8
π2
)
−
(
π2Defft
4L2
)
(7)Deff = −B4L2
π2
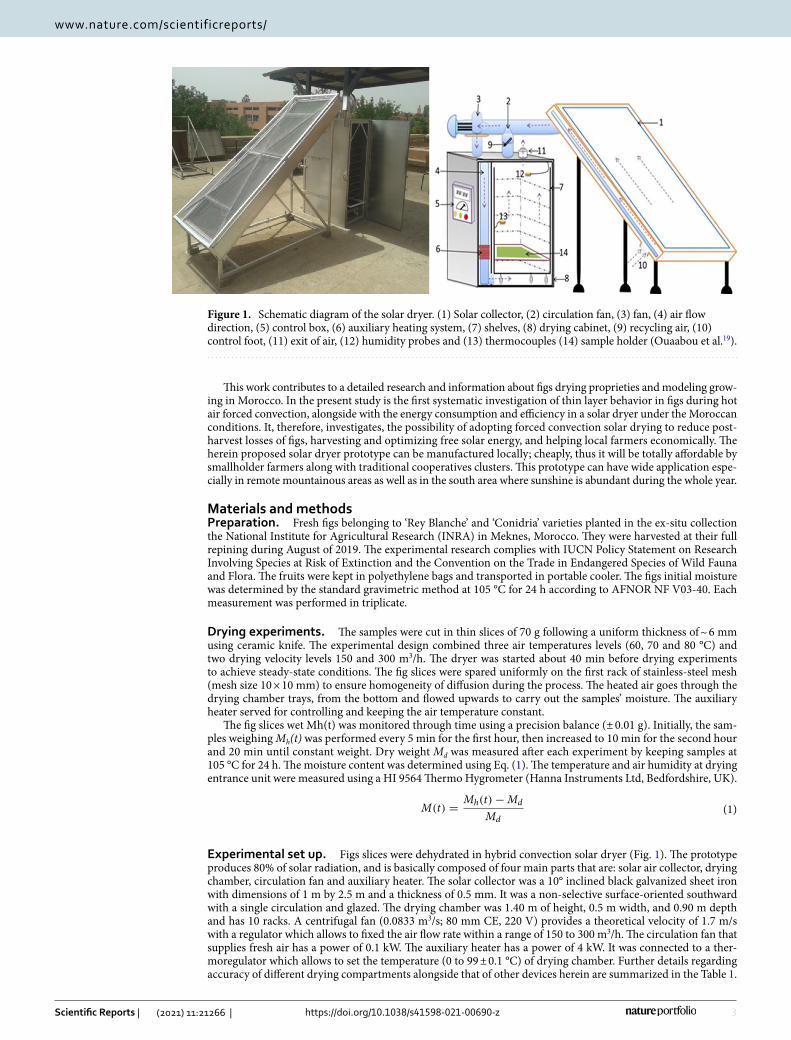
Table 1. Estimated uncertainties for different measurements. BTU British thermal unit; ft foot; W Watt; ABS absolute humidity; HR relative humidity.
Measured property Uncertainty Range
Inlet air temperatures by a thermo-regulator connected to a PT100 platinum probe acting on the electric auxiliary heater ± 0.1 0–100 °C
Inlet and outlet air humidity (relative humidity sensor) by ABS body RH probe with built-in microchip, °C/°F temperature readout 250-h battery life with a battery level indicator ± 3 0 to 100%
Flow rate (A centrifuge fan) ± 1.0 0.028 to 0.083 m3 s−1
Ambient air temperature measurement by HI 935,005 K-Thermocouple probe °C/°F temperature readout 200-h battery life with a battery level indicator ± 0.2 0–100 °C
Sunlight measurement by Solar Power meter; Data hold function to hold measurement values High accuracy and rapid response ± 10 up to 1999 W/m2 or 634 BTU/(ft2*h)
Weigh sample by Digital weighing device, RS232 Interface Glass wind-shield ± 0.1 0–5 kg
5
Vol.:(0123456789)
Scientific Reports | (2021) 11:21266 | https://doi.org/10.1038/s41598-021-00690-z
www.nature.com/scientificreports/
related to Deff and its dependence on temperature is expressed by Arrhenius model11. The self-diffusion origin is closely related to the thermal agitation. Afterword, the diffusion is activated, and the Deff is calculated following the Arrhenius law as shown in the Eq. (8):
where D0 is the Arrhenius law pre-exponential factor (m2 s−1), Ea is the activation energy (kJ mol−1), R is the perfect or ideal gas constant (8.314 kJ mol−1), and T (in K) is the air temperature31.
The activation energy is calculated by plotting the ln(Deff) as a function of the reciprocal of the temperature (
1T
)
.
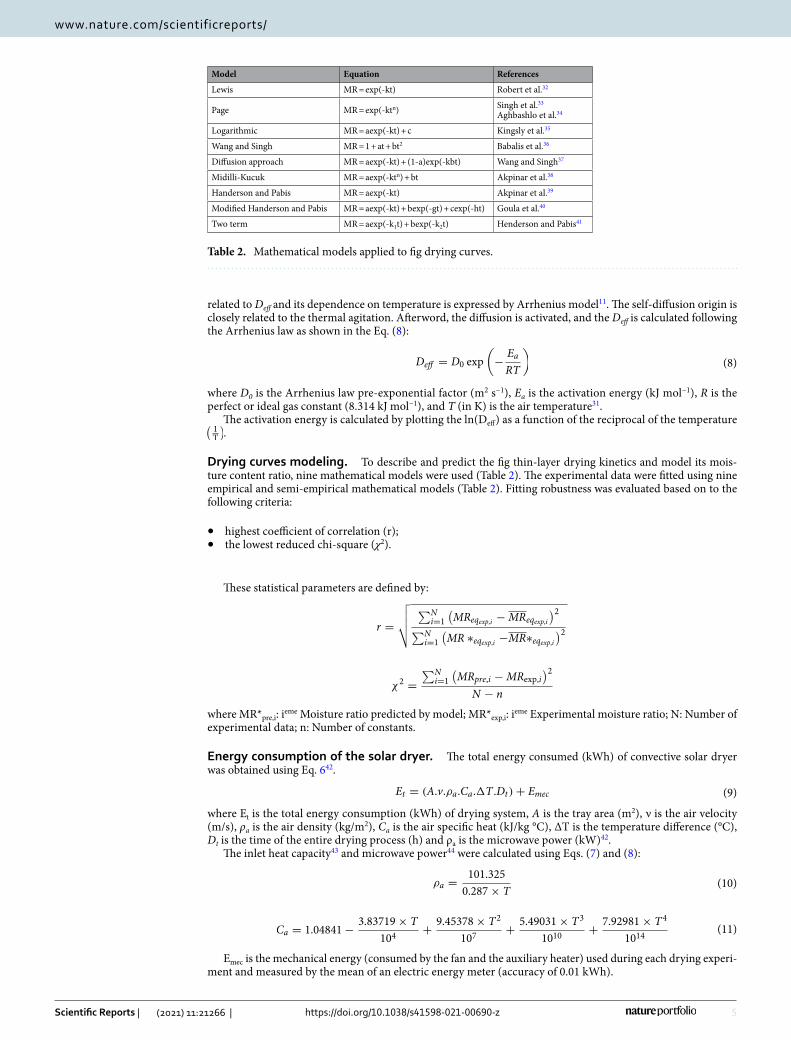
Drying curves modeling. To describe and predict the fig thin-layer drying kinetics and model its mois-ture content ratio, nine mathematical models were used (Table 2). The experimental data were fitted using nine empirical and semi-empirical mathematical models (Table 2). Fitting robustness was evaluated based on to the following criteria:
• highest coefficient of correlation (r);• the lowest reduced chi-square (χ2).
These statistical parameters are defined by:
where MR*pre,i: ieme Moisture ratio predicted by model; MR*exp,i: ieme Experimental moisture ratio; N: Number of experimental data; n: Number of constants.
Energy consumption of the solar dryer. The total energy consumed (kWh) of convective solar dryer was obtained using Eq. 642.
where Et is the total energy consumption (kWh) of drying system, A is the tray area (m2), ν is the air velocity (m/s), ρa is the air density (kg/m2), Ca is the air specific heat (kJ/kg °C), ΔT is the temperature difference (°C), Dt is the time of the entire drying process (h) and ρa is the microwave power (kW)42.
The inlet heat capacity43 and microwave power44 were calculated using Eqs. (7) and (8):
Emec is the mechanical energy (consumed by the fan and the auxiliary heater) used during each drying experi-ment and measured by the mean of an electric energy meter (accuracy of 0.01 kWh).
(8)Deff = D0 exp
(
−Ea
RT
)
r =
√
√
√
√
∑Ni=1
(
MReqexp,i −MReqexp,i
)2
∑Ni=1
(
MR ∗eqexp,i −MR∗eqexp,i)2
χ2=
∑Ni=1
(
MRpre,i −MRexp,i)2
N − n
(9)Et = (A.v.ρa.Ca.�T .Dt)+ Emec
(10)ρa =101.325
0.287× T
(11)Ca = 1.04841−3.83719× T
104+
9.45378× T2
107+
5.49031× T3
1010+
7.92981× T4
1014
Table 2. Mathematical models applied to fig drying curves.
Model Equation References
Lewis MR = exp(-kt) Robert et al.32
Page MR = exp(-ktn) Singh et al.33
Aghbashlo et al.34
Logarithmic MR = aexp(-kt) + c Kingsly et al.35
Wang and Singh MR = 1 + at + bt2 Babalis et al.36
Diffusion approach MR = aexp(-kt) + (1-a)exp(-kbt) Wang and Singh37
Midilli-Kucuk MR = aexp(-ktn) + bt Akpinar et al.38
Handerson and Pabis MR = aexp(-kt) Akpinar et al.39
Modified Handerson and Pabis MR = aexp(-kt) + bexp(-gt) + cexp(-ht) Goula et al.40
Two term MR = aexp(-k1t) + bexp(-k2t) Henderson and Pabis41

6
Vol:.(1234567890)
Scientific Reports | (2021) 11:21266 | https://doi.org/10.1038/s41598-021-00690-z
www.nature.com/scientificreports/
The specific thermal energy (SEC (kWh/kg)) needed to remove 1 kg of moisture from the fig sample was calculated using Eq. 1245
where mw is the mass of removed water (kg) and was calculated using Eq. 1346:
where W0 is the initial weight of sample (kg), Y0 refers to the initial moisture content (% d.b) at time (t = 0) and Yf, the sample final moisture content (% d.b).
Color and water activity determination. The L*, a* and b* color coordinates were determined before and after each drying experiment using a NH310 colorimeter (Shenzhen 3NH Technology, China)47. The color-imeter was calibrated to a white calibration plate. The peels color measurements were obtained from two spots located on opposite sides of the slice diameter, while the pulp color was determined from two arbitrary spots on the both sides of the slice. The mean of the two measurements was considered as one replicate. Color differences of fig peels and pulp between the dry and fresh samples were used to describe the color change during drying, defined using Eq. (14), as follows:
where L*represents on the scale CIELAB the lightness of the sample ranging from 0 (black) to 100 (white), coordinate a* represents red color ( +) or green (−), and coordinate b* represents yellow color ( +) or blue (−). Subscript 0 refers to the color of the fresh fig slices. High DE values indicate large color changes compared to the reference. Water activity of fresh and dried slices was assessed by a calibrated electric hygrometer (HygroLab, Rotronic, Bassersdorf, Switzerland). All measurements were carried out in triplicates.
Statistical analysis. The results herein reported are expressed as means ± SE (standard error). Analysis of variance was performed by GLM procedures (SPSS 22 for Windows). The p value < 0.05 was considered statisti-cally significant.
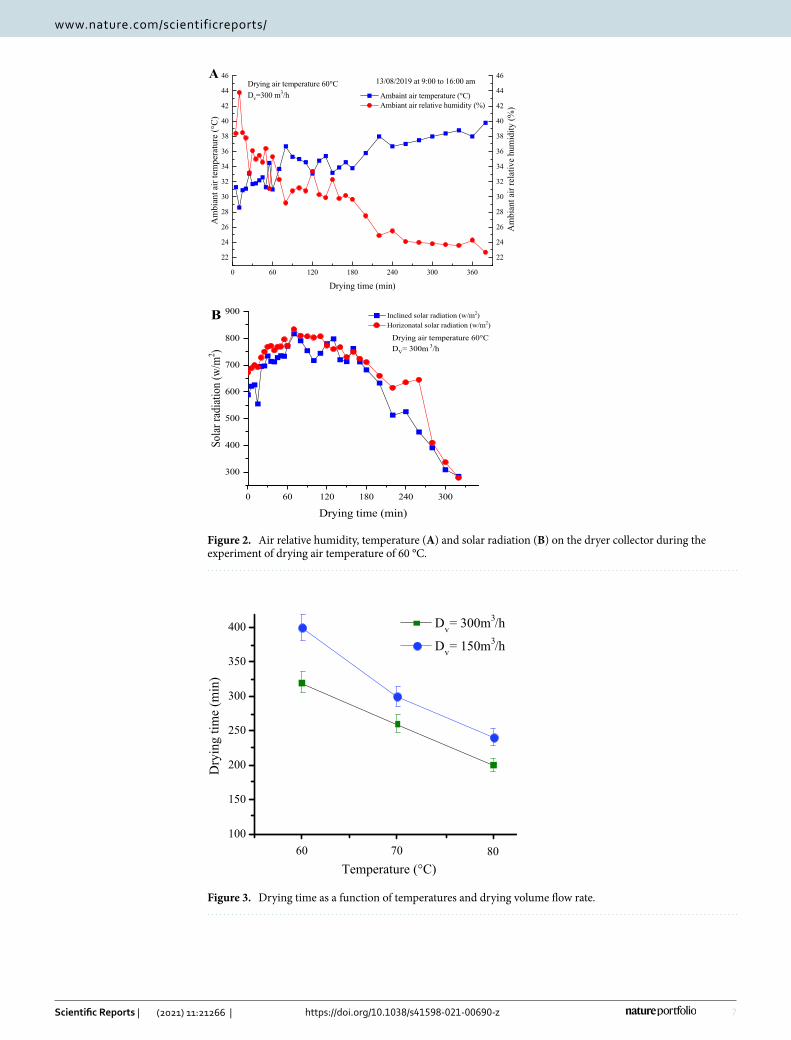
Results and discussionsAll experiments started at 9:00 a.m. and continued till 6:00 p.m., during which the city receives the maximum of solar radiation. Figure 2 shows data of the ambient air temperature, relative humidity and solar radiation for fig drying experiment at 60 °C and velocity of 300 m3/h. The temperature of the ambient air was found between 30 and 40 °C, while the ambient air humidity varied between 23 and 44%. Horizontal solar radiation was slightly higher than the inclined. Thus, the values ranged from 280 to 850 W/m2 and 280 to 830 W/m2, respectively. The initial moisture content of the studied samples (wet basis) was 78 ± 1% for ‘Rey Blanche’ and 75 ± 1.2% for ‘Conidria’. This initial moisture was reduced for both samples to a final moisture content of 23 ± 1%.
Drying curves. Drying time was determined by jointly using drying temperature and velocity variables. It defines the time required to lower the moisture content of samples to the moisture content suitable for their conservation. The drying time of fig slices for different aero-thermal conditions is given in Fig. 3. According to the results, drying temperature and volume velocity displayed a significant effect on drying time, particularly due the osmotic pressure increase. Hence, at a constant air velocity, arising the air temperature from 60 to 80 °C decreased significantly the drying time. Also, at a constant air temperature, increasing air velocity from 150 to 300 m3/h decreased substantially the drying time, as a result of increasing convective heat and mass transfer coefficient between the drying air and the samples. For almost all agricultural products, the drying process took place in the falling rate period where the water molecule is strongly linked to the structure of the product; therefore, the effect of the drying temperature is more important comparatively to the air velocity. Indeed, drying temperature of 80 °C coupled to air flow rate of 300 m3/h, provide the optimum condition for fig slices drying in a shortened period of 200 min. These results are consistent with those reported by Garba et al.48, Ouaabou et al.19 and Bahammou et al.49, who attributed the great impact on drying kinetics, primary to the temperature and then velocity.
As observed from Fig. 4, the drying curves showed a sharp decrease of moisture content as the drying time increases. The figure shows an absence of phase 0, period of the increasing drying-rate, where the sample temperature increased without any significant loss of moisture, and phase I, known as the period of constant drying-rate. Therefore, only the falling drying rate period (phase II) was observed. This may be due to the small difference between the wet air temperature and the sample initial temperature. These results are in agreement with previous reports19,48–51. Obviously, increasing the drying temperature implies an important rise of the drying rate, and thus a substantial decrease of the drying time. It is noteworthy that the drying flow rate of 300 m3/h leaded to sharp decrease of the moisture content and drying time shortening. Similar pattern was observed at a low flow rate (150 m3/h), but the drying time was lengthened. The varieties ‘Rey Blanche’ and ‘Conidria’ showed approximately the same behavior to different air-drying conditions on account of small difference in their initial moisture. In general, the time needed to obtain the targeted moisture content to any given level was dependent on
(12)SEC =Et
mw
(13)mw =W0
(
Y0 − Yf
)
100− Yf
(14)�E =
√
(
L∗0 − L∗)2
+(
a∗0 − a∗)2
+(
b∗0 − b∗)2
7
Vol.:(0123456789)
Scientific Reports | (2021) 11:21266 | https://doi.org/10.1038/s41598-021-00690-z
www.nature.com/scientificreports/
0 60 120 180 240 300
300
400
500
600
700
800
900
Sol
ar r
adia
tion
(w
/m2 )
Drying time (min)
Inclined solar radiation (w/m2)
Horizonatal solar radiation (w/m2)
Drying air temperature 60°C
DV= 300m 3/h
B
0 60 120 180 240 300 360
22
24
26
28
30
32
34
36
38
40
42
44
46
22
24
26
28
30
32
34
36
38
40
42
44
46
Am
bia
nt
air
rela
tive
hum
idit
y (
%)
Am
bia
nt
air
tem
per
ature
(°C
)
Drying time (min)
Ambaint air temperature (°C)
Ambiant air relative humidity (%)
Drying air temperature 60°C
Dv=300 m3/h
13/08/2019 at 9:00 to 16:00 amA
Figure 2. Air relative humidity, temperature (A) and solar radiation (B) on the dryer collector during the experiment of drying air temperature of 60 °C.
60 70 80
100
150
200
250
300
350
400
Dry
ing t
ime
(min
)
Temperature (°C)
Dv= 300m
3/h
Dv= 150m
3/h
Figure 3. Drying time as a function of temperatures and drying volume flow rate.

8
Vol:.(1234567890)
Scientific Reports | (2021) 11:21266 | https://doi.org/10.1038/s41598-021-00690-z
www.nature.com/scientificreports/
the aerothermal factors, being the highest at the temperature of 60 °C and lowest at 80 °C. Thus, for both varie-ties, the drying time at Dv = 300 m3/h varied from 200, 260 to 360 min at 80, 70 and 60 °C, respectively, whereas, at 150 m3/h, the drying time was 240, 300 and 400 min at air temperature of 80, 70 and 60 °C, respectively. At a constant drying flow rate, the drying time was decreased for 70% and 60%, as the temperature increased from 60 to 80 °C, respectively for 300 and 150 m3/h. On the other hand, decreasing the air flow rate from 300 to 150 300 m3/h, the drying time was lengthened by 26 and 16% at 60 and 80 °C, respectively.
Influence of temperature and air flow rate. The influence of temperature and air flow rate on drying rate was shown in Fig. 5. In fact, the samples show that drying rate took place only in the falling rate period and no constant stage was noticed. It was observed that, for the same air flow rate, drying rate of fig slices increased as drying temperature increased. Consequently, the drying kinetics of fig is particularly linked to the variation in drying air temperature. Comparable findings were reported by Akanbi et al.52 for tomato slices, Krokida et al.53 for some different vegetables and Doymaz15 for thin carrot and mulberry and Doymaz30 for figs. This implies that no water film did exist at the exterior of the fig slices and that the moisture transfer from the interior of the samples to its surface occurred under the action of several complicated transport mechanisms (liquid diffusion or vapor diffusion or capillary forces). Those mechanisms change during the drying process54. So far there is no theory which explains the real mechanism behind moisture transfer in the falling drying rate. Nevertheless, diffusion remain the only probable mechanism which describes the mass transfer in agri-foods31. Indeed, there was no difference in drying rate between the two fig varieties. Similar result was reported in other studies19,55,56.
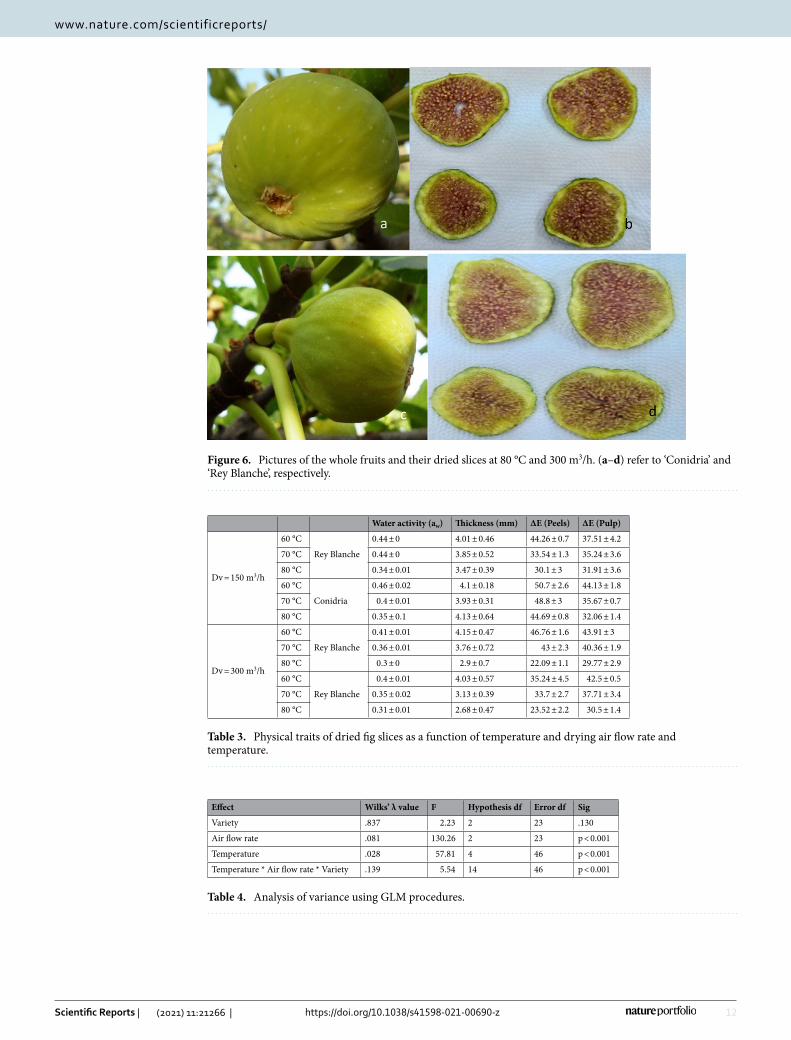
Change in physical and color characteristics. Figure 6 shows the photos of fig samples in the fresh state and the aspect of their dried slices at 80 °C and 300 m3/h. Both varieties showed significant impact of tem-
0.0
0.2
0.4
0.6
0.8
1.0
Mois
ture
rat
io (
Kg w
ater
/ K
g d
.b)
Drying time (min)
60°C/Rey Blanche
70°C/Rey Blanche
80°C/Rey Blanche
60°C/Conidria
70°C/Conidria
80°C/Conidria
Dv=300m3/h
0 60 120 180 240 300 360
0 60 120 180 240 300 360
0.0
0.2
0.4
0.6
0.8
1.0
Mois
ture
rat
io (
Kg w
ater
/Kg d
.b)
Drying time (min)
60°C/Rey Blanche
70°C/Rey Blanche
80°C/Rey Blanche
60°C/Conidria
70°C/Conidria
80°C/Conidria
DV=150 m3/h
Figure 4. Experimental curves of fig moisture content as a function of time, at various air temperatures (60, 70 and 80 °C) and drying volume flow rate (150 and 300 m3/h).

9
Vol.:(0123456789)
Scientific Reports | (2021) 11:21266 | https://doi.org/10.1038/s41598-021-00690-z
www.nature.com/scientificreports/
0.00
0.01
0.02
0.03
0.04
0.05
0.06
0.07
0.08
0.09
0.10
0.00
0.01
0.02
0.03
0.04
0.05
0.06
0.07
0.08
0.09
0.10
Dry
ing
rat
e (%
MS
,min
-1)
Drying time (min)
80°C; 300m3/h
80°C; 150m3/h
Rey Blanche
0.00
0.01
0.02
0.03
0.04
0.05
0.06
0.07
0.08
0.09
0.10
Dry
ing
rat
e (%
MS
,min
-1)
Drying time (min)
70°C; 300m3/h
70°C; 150m3/h
Rey Blanche
0 60 120 180 240 300 360 420
0 60 120 180 240 300 360 420
0 60 120 180 240 300 360 4200 60 120 180 240 300 360 420
0.00
0.01
0.02
0.03
0.04
0.05
0.06
0.07
0.08
0.09
0.10
Dry
ing r
ate
(% M
S,m
in -1
)
Drying time (min)
60°C; 300m3/h
60°C; 150m3/h
Rey Blanche
Dry
ing
rat
e (%
MS
,min
-1)
Drying time (min)
60°C; 300m3/h
60°C; 150m3/h
70°C; 300m3/h
70°C; 150m3/h
80°C; 300m3/h
80°C; 150m3/h
Rey Blanche
Figure 5. Drying rate of fig slices as a function of drying time. Curves for each temperature are embedded separately.

10
Vol:.(1234567890)
Scientific Reports | (2021) 11:21266 | https://doi.org/10.1038/s41598-021-00690-z
www.nature.com/scientificreports/
perature and drying air-drying flow rate (Dv) on their physical traits. Slice thickness, water activity (aw) and total color difference (ΔE) was used as a parameters of dried fig quality (Table 3). The Aw of dried fig water activity, is important to the quality and stability of the product. It is a determinant for the growth of microorganisms and related as well to degradation reactions of a chemical, enzymatic, and physical nature. Aw of dried samples varied from 0.3 to 0.46 which fell within the standard aw of dried food57. Fig slice thickness were significantly reduced by temperature. The values varied, generally, between 2.6 and 4.15 mm. The total color difference during thin layer drying is also an important indicator of the dried product quality. It indicates the browning reaction reac-tions linked to the color change that could occurred during drying period58. According to the Table 3, ΔE of both peels and pulp decrease significantly when temperature and Dv increase. It is noteworthy that all these param-eters were significantly higher at low temperature and air flow rate (Dv). Therefore, best physical conditions of figs’ slices conservation were obtained at high temperature and air-drying flow rate (80 °C and 300 m3/h, respec-tively). Table 4 shows a highly significant impact of temperature and Dv on the quality of samples. However, both varieties displayed similar behavior an then no statistically significant difference was spotted. Furthermore, the interaction between temperature, Dv and variety was statistically significant.
Determination of the characteristic drying curve. Drying rate and time vary continuously according to the experiment conditions. Based on the Van Meel concept59 of the characteristic drying curve (CDC) may be exploited to establish a drying law for the samples from the experimental data. The principal interest of CDC is normalizing the kinetics of drying in a theoretical model to predict other drying curves under any aerothermal conditions, with regards to the sample initial water content and equilibrium moisture content. Indeed, to plot the CDC, it is required to gather all the data on a single curve using the non-linear optimization method of Lev-enberg Marquard. Figure 7a displays the dimensionless drying rate (f) as a function of the MR. The CDC was expressed in terms of the reduced moisture content as the following third-order polynomial function: f = 0.7945 MR-0.8774 MR2 + 0.6000MR3. Two criteria were used to evaluate fitting quality of the polynomial model, which were the standard error (SE = 0.1434) and the correlation coefficient (r = 0.9171).
0.00
0.01
0.02
0.03
0.04
0.05
0.06
0.07
0.08
0.09
0.10
0.00
0.01
0.02
0.03
0.04
0.05
0.06
0.07
0.08
0.09
0.10
Dry
ing r
ate
(% M
S . m
in-1
)Drying time (min)
80°C;300m3/h
80°C;150m3/h
Conidria
0.00
0.01
0.02
0.03
0.04
0.05
0.06
0.07
0.08
0.09
0.10
Dry
ing r
ate
(% M
S . m
in-1
)
Drying time (min)
60°C;300m3/h
60°C;150m3/h
Conidria
0 60 120 180 240 300 360
0 60 120 180 240 300 360
0 60 120 180 240 300 3600 60 120 180 240 300 360
0.00
0.01
0.02
0.03
0.04
0.05
0.06
0.07
0.08
0.09
0.10
Dry
ing
rat
e (%
MS
. m
in-1
)
Drying time (min)
70°C;300m3/h
70°C;150m3/h
Conidria
Dry
ing r
ate
(% M
S . m
in-1
)
Drying time (min)
60°C;300m3/h
60°C;150m3/h
70°C;300m3/h
70°C;150m3/h
80°C;300m3/h
80°C;150m3/h
Conidria
Figure 5. (continued)

11
Vol.:(0123456789)
Scientific Reports | (2021) 11:21266 | https://doi.org/10.1038/s41598-021-00690-z
www.nature.com/scientificreports/
The kinetics of moisture ratio versus dimensionless drying rate f of both fig varieties is presented in Fig. 7b. This curve determines the values of the initial water content and that of equilibrium, which are needed to describe the kinetics of drying at variables air-drying conditions.
The fig slices moistures ratios spatial pattern versus dimensionless drying rates attained at polynomial models for the two fig varieties and their respective correlation coefficients and standard deviations values were provided in Table 5. It is noteworthy that these curves displayed almost similar correlation coefficients (r), which were 0.9192 and 0.9174 for Rey Blanche and Conidria, respectively, whereas, the standard deviations were success-fully 0.1449 and 0.1406.
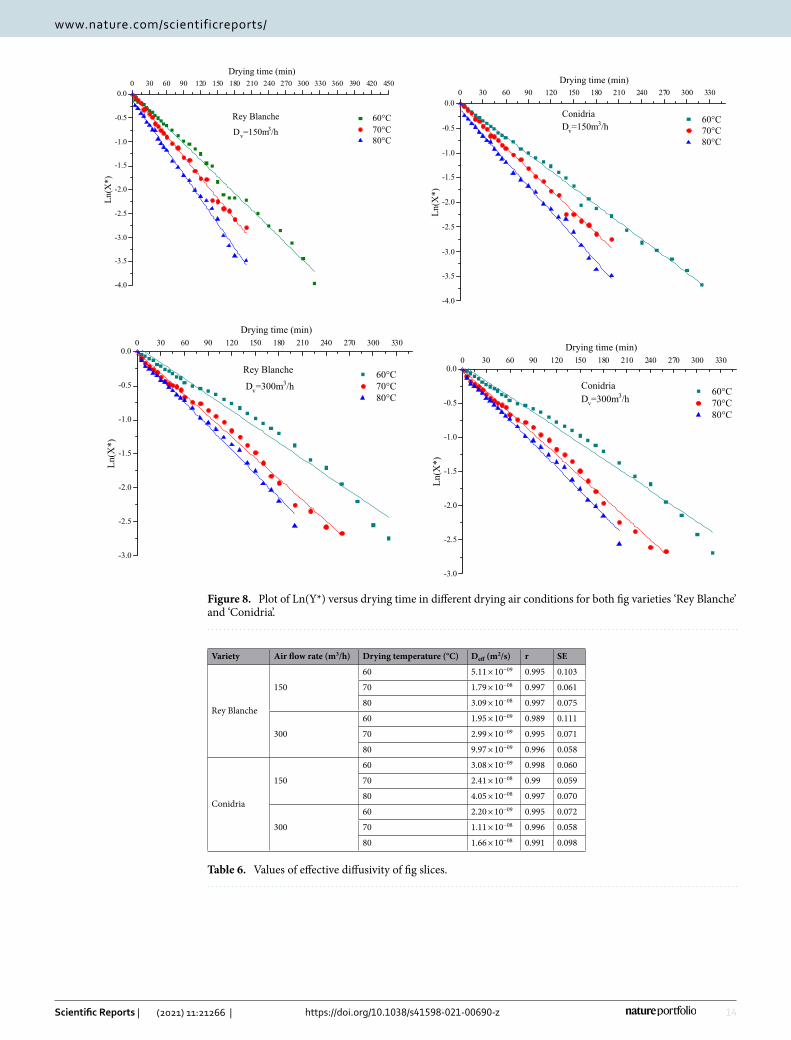
Effective moisture diffusivity (Deff). Deff is an important indicator that helps in designing and modeling of the mass transfer processes, such as drying or moisture adsorption during storage. It is mainly linked to the product’s temperature, the moisture content, and the structure. The Deff, is graphically determined using the log-arithmic representation of the reduced moisture content X* as a function of the drying time. The plot of Ln(X*) versus drying period for different experimental sets was presented in Fig. 8. It illustrates the effect of temperature and velocity on the effective diffusion coefficient of fig slices. Thus, at a constant velocity level, Deff increases continuously as the drying temperature increased. It is also noted that for both varieties, the Deff increased sub-sequently as the drying air flow rate increases (Fig. 8). Table 6 presents Deff values for both varieties at different experiment conditions. In general, Deff varied between 1.9556 × 10⁻⁹ and 4.0511 × 10⁻⁸, that lie within the range 10−8 to 10−12 m2/s for drying of food materials. In general, when fig slices were dried at higher air temperature and air flow rate, increased heating energy systematically accelerates the activity of water molecules leading to higher moisture diffusivity2. These results were in agreement with those reported by60 on grape and19 on sweet cherry, who revealed that the moisture effective diffusivity increased proportionally to the drying temperature.
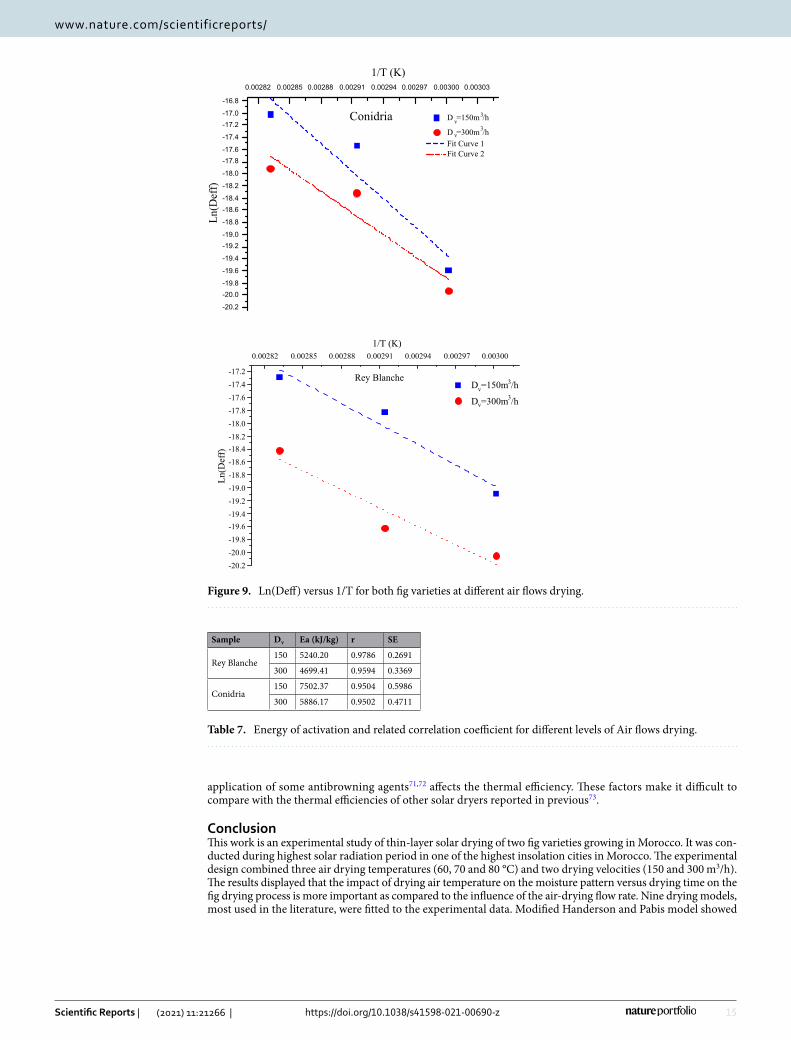
Energy of activation. The energy of activation (Ea) was concluded by plotting Ln(Deff) versus 1/T, which the results were presented in the Fig. 9. Ea value was calculated in different drying experiments and listed in Table 7. The activation energy is considered as a great indicator of the required energy to remove moisture from the sample. Higher Ea value indicates high temperature sensitivity of diffusion coefficient. The obtained values of Ea were in the range of 4699.41 to 7502.37 kJ/kg. Ea required for water diffusion in “Rey Blanche” regardless the air velocity was lower than activation energy of “Conidria”. The coefficient of determination was slightly superior to 0.95 with a small standard error that was in average inferior to 0.6 for the two variables considered together (Table 7). In general, at the beginning of drying a little energy is required to remove moisture, and passing the time, the Ea increases because of the moisture resistance in fig tissues30. The results are comparable to those reported in similar studies on sweet cherry19, on banana slices61 and on peach and strawberry slices62.
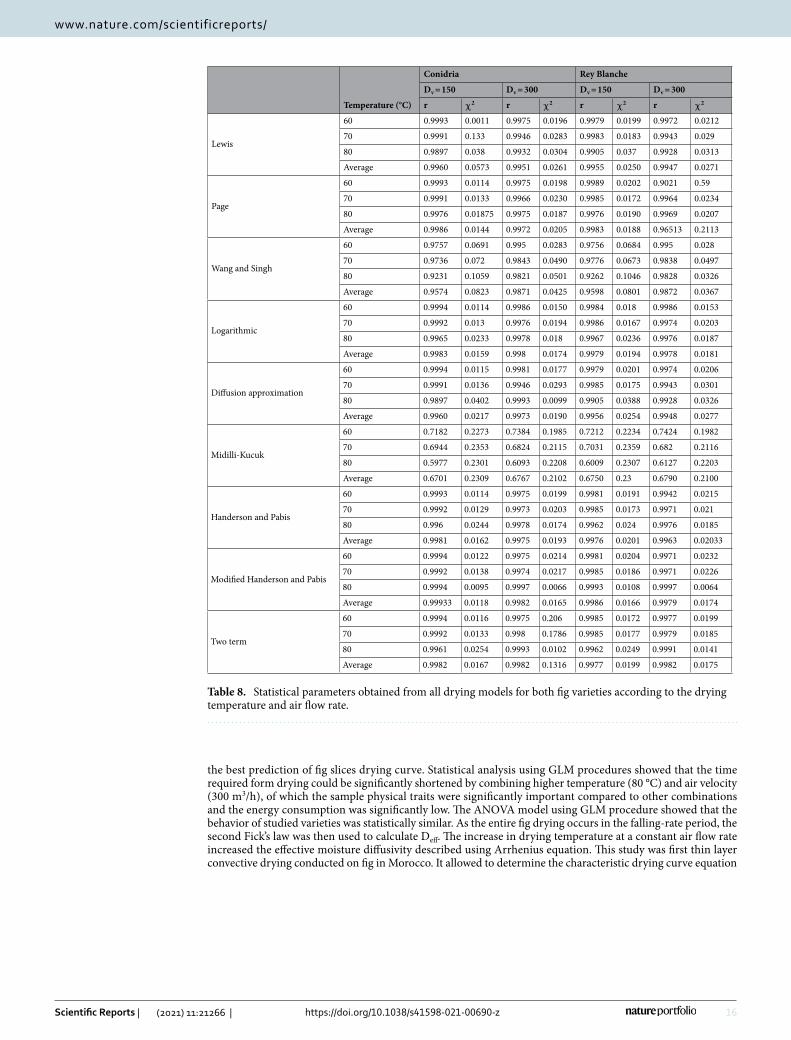
Modelling of fig drying curves. The samples moisture content at each drying temperature were converted afterwards to dimensionless moisture ratio and afterward fitted to nine empirical and non-empirical mathemati-cal models (Table 2) to determine the statistics values, that give the best fit of models. The statistics of these mod-els were estimated using non-linear regression analysis and summarized in Table 8. The correlation coefficient (r) was the primary criterion for choosing the model with the highest accuracy in drying curve prediction. Other than r, the mean square of the deviations (khi-square) between the calculated and predicted values for the mod-els was used to determine the accuracy of the fit. Indeed, the model presenting the best prediction of fig drying curve was determined as the one with the highest r and the lowest of χ2. In fact, the r values ranged from 0.5977 to 0.9997 for ‘Conidria’ and from 0.6009 to 0.9997 for ‘Rey Blanche’, while χ2 were in the range of 1.13 × 10⁻³ to 0.2353 and 6.4 × 10⁻³ to 0.59 for ‘Conidria’ and ‘Rey Blanche’, respectively (Table 8). Among all the models tested, the modified Handerson and Pabis model provided the best prediction throughput resolution by display-ing the highest r and the lowest value of χ2. In the literature, this model was successfully applied to pistachio63, kiwifruit64 and coconut65 to determine the drying curve.
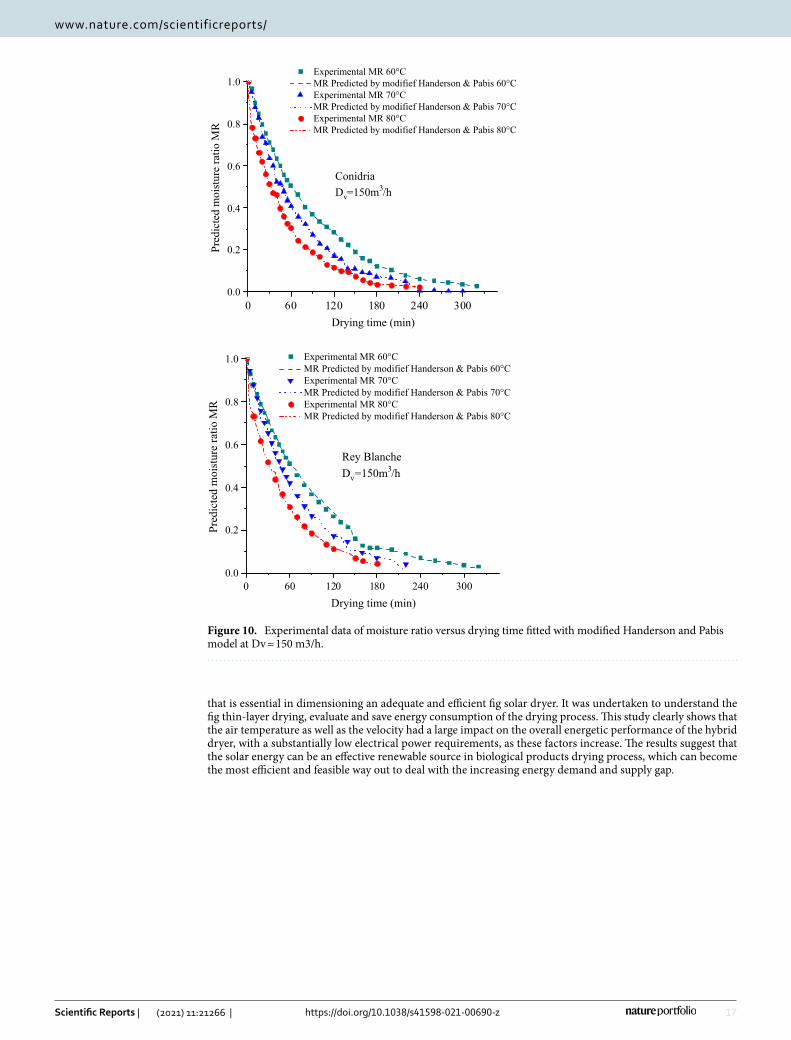
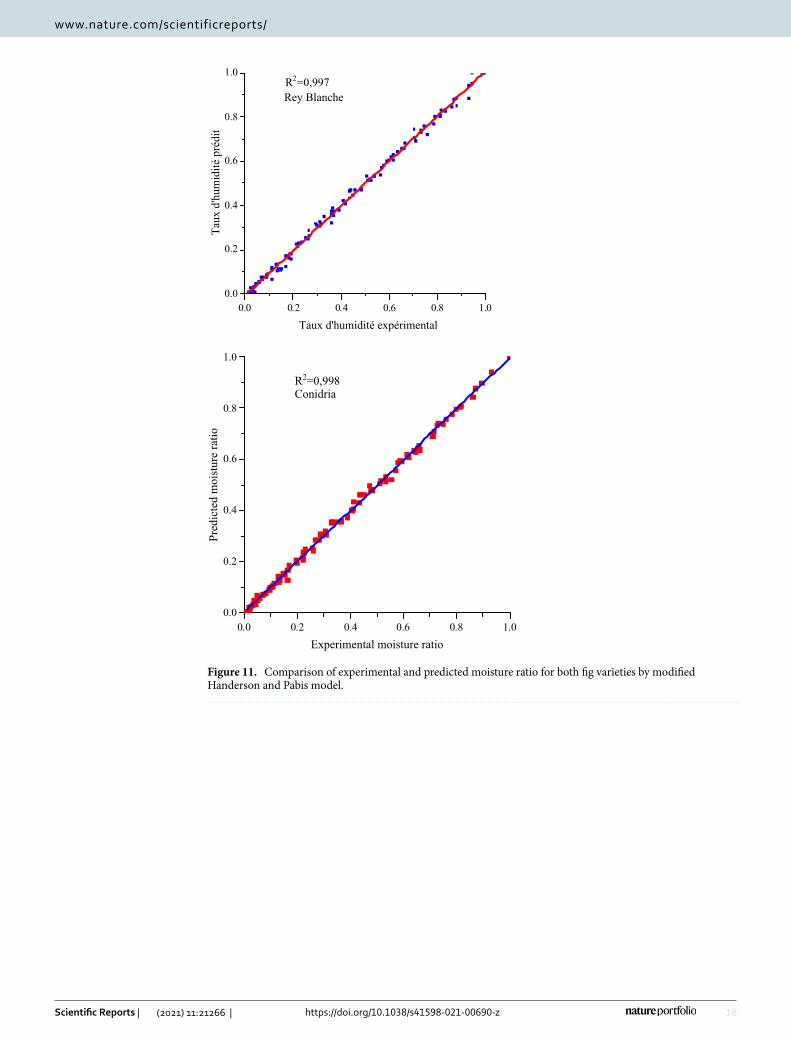
The experimental moisture ratios and those predicted by the selected model were plotted according to dif-ferent air temperatures and flow rates in order to validate the model (Figs. 10 and 11). The fitting results dem-onstrates that Modified Handerson and Pabis prediction is suitable to describe the kinetics drying of fig slices. Figure 10 compared the temporal variation of experimental MR and those predicted by the selected model at Dv = 150 m3/h, where both curves are perfectly matching. In Fig. 11, the prediction using modified Handerson and Pabis model showed MR values banded along a straight line with a highly important value of the coefficient of determination, that generally exceeded 0.99, which attests the suitability of the selected model in describing the fig slices drying process.
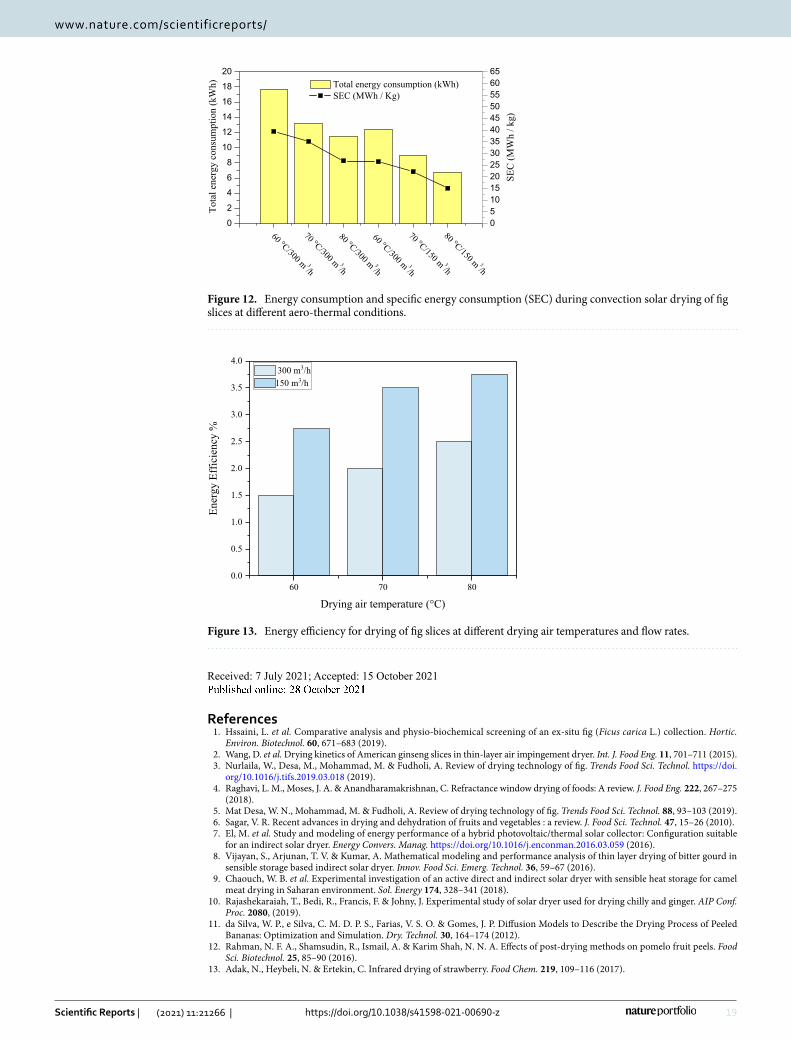
Total energy consumption in solar convective drying. Figure 12. shows the total energy consump-tion in solar convection drying of fig at different air temperatures and flow rates. It was observed that the total energy consumption decreases as the air flow increases under the entire experimental temperature range. Like-wise, at a constant air flow rate, the drying total energy consumption decreases substantially as the air tem-perature increases. That implies that the temperature increase leads to a substantial decrease of the drying time, which impacts significantly the dryer total energy consumption. These findings are in agreement with multiples studies previously published regarding several agri-foods products drying such as pomegranate arils, Russian olive, and chamomile66–68.
Figure 12, Made it possible to illustrate the specific energy consumption (SEC) values for the fig convective solar drying. Under all the experimental aerothermal conditions (temperatures of 60, 70 and 80 °C and air flow rate of 150 and 300 m3/h), the SEC values were obtained in the range of 13.12 and 44.55 MWh/kg. Similar results were described in a previous study on air drying of peppermint leaves45. Furthermore, it was observed that an
12
Vol:.(1234567890)
Scientific Reports | (2021) 11:21266 | https://doi.org/10.1038/s41598-021-00690-z
www.nature.com/scientificreports/
Figure 6. Pictures of the whole fruits and their dried slices at 80 °C and 300 m3/h. (a–d) refer to ‘Conidria’ and ‘Rey Blanche’, respectively.
Table 3. Physical traits of dried fig slices as a function of temperature and drying air flow rate and temperature.
Water activity (aw) Thickness (mm) ΔE (Peels) ΔE (Pulp)
Dv = 150 m3/h
60 °C
Rey Blanche
0.44 ± 0 4.01 ± 0.46 44.26 ± 0.7 37.51 ± 4.2
70 °C 0.44 ± 0 3.85 ± 0.52 33.54 ± 1.3 35.24 ± 3.6
80 °C 0.34 ± 0.01 3.47 ± 0.39 30.1 ± 3 31.91 ± 3.6
60 °C
Conidria
0.46 ± 0.02 4.1 ± 0.18 50.7 ± 2.6 44.13 ± 1.8
70 °C 0.4 ± 0.01 3.93 ± 0.31 48.8 ± 3 35.67 ± 0.7
80 °C 0.35 ± 0.1 4.13 ± 0.64 44.69 ± 0.8 32.06 ± 1.4
Dv = 300 m3/h
60 °C
Rey Blanche
0.41 ± 0.01 4.15 ± 0.47 46.76 ± 1.6 43.91 ± 3
70 °C 0.36 ± 0.01 3.76 ± 0.72 43 ± 2.3 40.36 ± 1.9
80 °C 0.3 ± 0 2.9 ± 0.7 22.09 ± 1.1 29.77 ± 2.9
60 °C
Rey Blanche
0.4 ± 0.01 4.03 ± 0.57 35.24 ± 4.5 42.5 ± 0.5
70 °C 0.35 ± 0.02 3.13 ± 0.39 33.7 ± 2.7 37.71 ± 3.4
80 °C 0.31 ± 0.01 2.68 ± 0.47 23.52 ± 2.2 30.5 ± 1.4
Table 4. Analysis of variance using GLM procedures.
Effect Wilks’ λ value F Hypothesis df Error df Sig
Variety .837 2.23 2 23 .130
Air flow rate .081 130.26 2 23 p < 0.001
Temperature .028 57.81 4 46 p < 0.001
Temperature * Air flow rate * Variety .139 5.54 14 46 p < 0.001

13
Vol.:(0123456789)
Scientific Reports | (2021) 11:21266 | https://doi.org/10.1038/s41598-021-00690-z
www.nature.com/scientificreports/
increase in the air temperature implies a sharp decrease in the SEC. Moreover, an increase in the air flow rate also leads to a significant decrease in the specific energy consumption, for all air-drying temperatures. Comparable results were found on chamomile, berberis fruit, pomegranate arils, and peppermint leaves45,66–69.
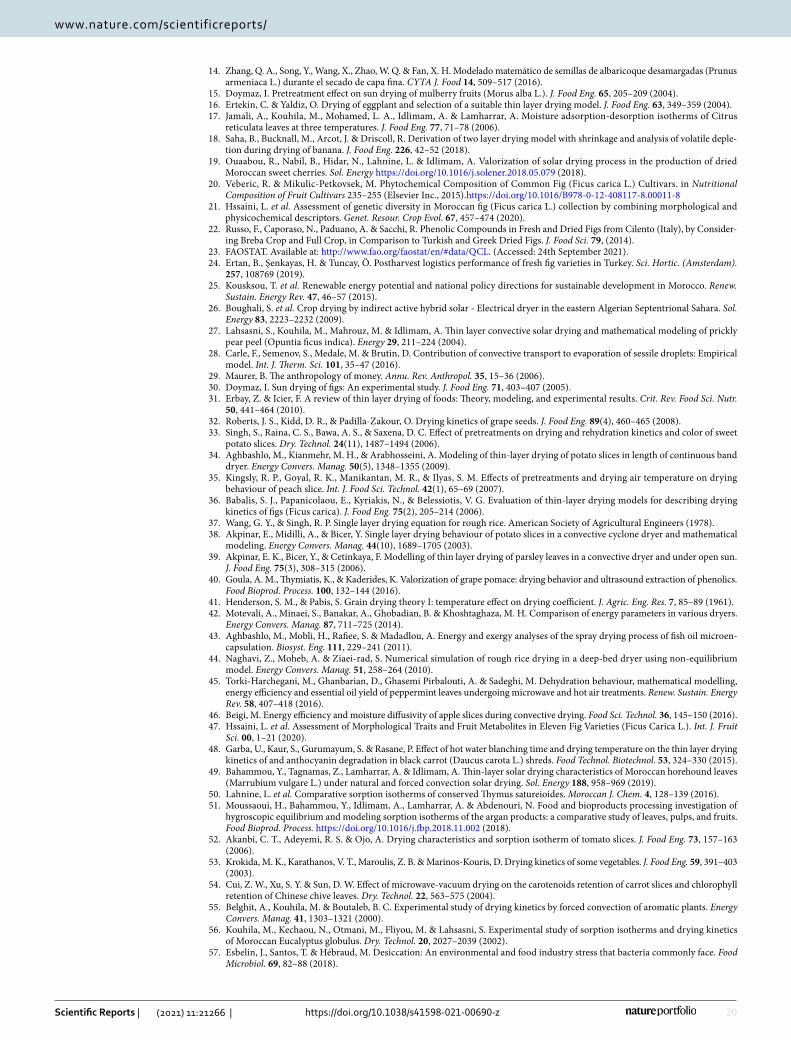
Energy efficiency. The Fig. 13 displays the values of energy efficiency for multiple drying conditions of fig. The thermal efficiency represents the ratio between the amount of energy used for moisture elimination and the one supplied to the hybrid solar dryer. As it is described in the figure, the energy efficiency substantially decreases as the air flow rate and the drying temperature increase. According to this figure, the lowest energy efficiency was about 1.54%, and was found in the combination of a temperature of 60 °C and a velocity of 300 m3/h, while the maximum value was around 3.98%, and was achieved in the combination of 80 °C and 150 m3/h. The fig drying data generated using a solar convective dryer shows similar trends in comparison to the thin dry-ing air convection of peppermint leaves (3.5- 5.3%) and convective drying of chamomile (1.9- 6.7%). The energy efficiency values obtained are in agreement with those found for most convection dryers45,68.
Fundamentally, it was stated that the final moisture in biological products generally requires higher drying energy than the initial moisture, and the preparation of the samples prior to drying such as osmotic treatment70,
0.0
0.2
0.4
0.6
0.8
1.0
Dim
ensi
onle
ss d
ryin
g r
ate
f
Moisture ratio MR
a
0.0 0.2 0.4 0.6 0.8 1 .0
0.0 0.2 0.4 0.6 0.8 1.0
0.0
0.2
0.4
0.6
0.8
1.0
Rey Blanche
Polynomial fit of Rey Blanche
Conidria
Polynomial fit of Conidria
Dim
ensi
onle
ss d
ryin
g r
ate
f
Moisture ratio MR
b
Figure 7. Characteristic drying curve of fig (a) and dimensionless drying rate versus moisture ratio of Rey Blanche and Conidria varieties (b).
Table 5. Polynomial equations of the characteristic drying equations for both tested fig varieties.
Varieties CDE r SE
Rey Blanche 0.9544MR -0.5549MR2 + 0.2122MR3 0.9192 0.1449
Conidria 0.9810 MR -1.1576MR2 + 0.9582MR3 0.9174 0.1406
14
Vol:.(1234567890)
Scientific Reports | (2021) 11:21266 | https://doi.org/10.1038/s41598-021-00690-z
www.nature.com/scientificreports/
-4.0
-3.5
-3.0
-2.5
-2.0
-1.5
-1.0
-0.5
0.0
Drying time (min)
Ln(X
*)
60°C
70°C
80°C
Rey Blanche
Dv=150m3/h
-3.0
-2.5
-2.0
-1.5
-1.0
-0.5
0.0
Drying time (min)
60°C
70°C
80°C
Ln
(X*
)
Rey Blanche
Dv=300m3/h
-4.0
-3.5
-3.0
-2.5
-2.0
-1.5
-1.0
-0.5
0.0
Drying time (min)
60°C
70°C
80°C
Ln
(X*
)
Conidria
Dv=150m3/h
0 30 60 90 120 150 180 210 240 270 300 330 360 390 420 450
0 30 60 90 120 150 180 210 240 270 300 330
0 30 60 90 120 150 180 210 240 270 300 330
0 30 60 90 120 150 180 210 240 270 300 330
-3.0
-2.5
-2.0
-1.5
-1.0
-0.5
0.0
Drying time (min)
60°C
70°C
80°C
Ln
(X*
)
Conidria
Dv=300m3/h
Figure 8. Plot of Ln(Y*) versus drying time in different drying air conditions for both fig varieties ‘Rey Blanche’ and ‘Conidria’.
Table 6. Values of effective diffusivity of fig slices.
Variety Air flow rate (m3/h) Drying temperature (°C) Deff (m2/s) r SE
Rey Blanche
150
60 5.11 × 10−09 0.995 0.103
70 1.79 × 10−08 0.997 0.061
80 3.09 × 10−08 0.997 0.075
300
60 1.95 × 10−09 0.989 0.111
70 2.99 × 10−09 0.995 0.071
80 9.97 × 10−09 0.996 0.058
Conidria
150
60 3.08 × 10−09 0.998 0.060
70 2.41 × 10−08 0.99 0.059
80 4.05 × 10−08 0.997 0.070
300
60 2.20 × 10−09 0.995 0.072
70 1.11 × 10−08 0.996 0.058
80 1.66 × 10−08 0.991 0.098
15
Vol.:(0123456789)
Scientific Reports | (2021) 11:21266 | https://doi.org/10.1038/s41598-021-00690-z
www.nature.com/scientificreports/
application of some antibrowning agents71,72 affects the thermal efficiency. These factors make it difficult to compare with the thermal efficiencies of other solar dryers reported in previous73.
ConclusionThis work is an experimental study of thin-layer solar drying of two fig varieties growing in Morocco. It was con-ducted during highest solar radiation period in one of the highest insolation cities in Morocco. The experimental design combined three air drying temperatures (60, 70 and 80 °C) and two drying velocities (150 and 300 m3/h). The results displayed that the impact of drying air temperature on the moisture pattern versus drying time on the fig drying process is more important as compared to the influence of the air-drying flow rate. Nine drying models, most used in the literature, were fitted to the experimental data. Modified Handerson and Pabis model showed
0.00282 0.00285 0.00288 0.00291 0.00294 0.00297 0.00300 0.00303
-20.2
-20.0-19.8
-19.6
-19.4
-19.2-19.0
-18.8
-18.6-18.4
-18.2
-18.0
-17.8-17.6
-17.4
-17.2-17.0
-16.8
Dv=150m3/h
D v=300m3/h
Fit Curve 1
Fit Curve 2
Ln(D
eff)
Conidria
1/T (K)
0.00282 0.00285 0.00288 0.00291 0.00294 0.00297 0.00300
-20.2
-20.0
-19.8
-19.6
-19.4
-19.2
-19.0
-18.8
-18.6
-18.4
-18.2
-18.0
-17.8
-17.6
-17.4
-17.2
1/T (K)
Dv=150m3/h
Dv=300m3/h
Ln
(Def
f)
Rey Blanche
Figure 9. Ln(Deff) versus 1/T for both fig varieties at different air flows drying.
Table 7. Energy of activation and related correlation coefficient for different levels of Air flows drying.
Sample Dv Ea (kJ/kg) r SE
Rey Blanche150 5240.20 0.9786 0.2691
300 4699.41 0.9594 0.3369
Conidria150 7502.37 0.9504 0.5986
300 5886.17 0.9502 0.4711
16
Vol:.(1234567890)
Scientific Reports | (2021) 11:21266 | https://doi.org/10.1038/s41598-021-00690-z
www.nature.com/scientificreports/
the best prediction of fig slices drying curve. Statistical analysis using GLM procedures showed that the time required form drying could be significantly shortened by combining higher temperature (80 °C) and air velocity (300 m3/h), of which the sample physical traits were significantly important compared to other combinations and the energy consumption was significantly low. The ANOVA model using GLM procedure showed that the behavior of studied varieties was statistically similar. As the entire fig drying occurs in the falling-rate period, the second Fick’s law was then used to calculate Deff. The increase in drying temperature at a constant air flow rate increased the effective moisture diffusivity described using Arrhenius equation. This study was first thin layer convective drying conducted on fig in Morocco. It allowed to determine the characteristic drying curve equation
Table 8. Statistical parameters obtained from all drying models for both fig varieties according to the drying temperature and air flow rate.
Temperature (°C)
Conidria Rey Blanche
Dv = 150 Dv = 300 Dv = 150 Dv = 300
r χ2 r χ2 r χ2 r χ2
Lewis
60 0.9993 0.0011 0.9975 0.0196 0.9979 0.0199 0.9972 0.0212
70 0.9991 0.133 0.9946 0.0283 0.9983 0.0183 0.9943 0.029
80 0.9897 0.038 0.9932 0.0304 0.9905 0.037 0.9928 0.0313
Average 0.9960 0.0573 0.9951 0.0261 0.9955 0.0250 0.9947 0.0271
Page
60 0.9993 0.0114 0.9975 0.0198 0.9989 0.0202 0.9021 0.59
70 0.9991 0.0133 0.9966 0.0230 0.9985 0.0172 0.9964 0.0234
80 0.9976 0.01875 0.9975 0.0187 0.9976 0.0190 0.9969 0.0207
Average 0.9986 0.0144 0.9972 0.0205 0.9983 0.0188 0.96513 0.2113
Wang and Singh
60 0.9757 0.0691 0.995 0.0283 0.9756 0.0684 0.995 0.028
70 0.9736 0.072 0.9843 0.0490 0.9776 0.0673 0.9838 0.0497
80 0.9231 0.1059 0.9821 0.0501 0.9262 0.1046 0.9828 0.0326
Average 0.9574 0.0823 0.9871 0.0425 0.9598 0.0801 0.9872 0.0367
Logarithmic
60 0.9994 0.0114 0.9986 0.0150 0.9984 0.018 0.9986 0.0153
70 0.9992 0.013 0.9976 0.0194 0.9986 0.0167 0.9974 0.0203
80 0.9965 0.0233 0.9978 0.018 0.9967 0.0236 0.9976 0.0187
Average 0.9983 0.0159 0.998 0.0174 0.9979 0.0194 0.9978 0.0181
Diffusion approximation
60 0.9994 0.0115 0.9981 0.0177 0.9979 0.0201 0.9974 0.0206
70 0.9991 0.0136 0.9946 0.0293 0.9985 0.0175 0.9943 0.0301
80 0.9897 0.0402 0.9993 0.0099 0.9905 0.0388 0.9928 0.0326
Average 0.9960 0.0217 0.9973 0.0190 0.9956 0.0254 0.9948 0.0277
Midilli-Kucuk
60 0.7182 0.2273 0.7384 0.1985 0.7212 0.2234 0.7424 0.1982
70 0.6944 0.2353 0.6824 0.2115 0.7031 0.2359 0.682 0.2116
80 0.5977 0.2301 0.6093 0.2208 0.6009 0.2307 0.6127 0.2203
Average 0.6701 0.2309 0.6767 0.2102 0.6750 0.23 0.6790 0.2100
Handerson and Pabis
60 0.9993 0.0114 0.9975 0.0199 0.9981 0.0191 0.9942 0.0215
70 0.9992 0.0129 0.9973 0.0203 0.9985 0.0173 0.9971 0.021
80 0.996 0.0244 0.9978 0.0174 0.9962 0.024 0.9976 0.0185
Average 0.9981 0.0162 0.9975 0.0193 0.9976 0.0201 0.9963 0.02033
Modified Handerson and Pabis
60 0.9994 0.0122 0.9975 0.0214 0.9981 0.0204 0.9971 0.0232
70 0.9992 0.0138 0.9974 0.0217 0.9985 0.0186 0.9971 0.0226
80 0.9994 0.0095 0.9997 0.0066 0.9993 0.0108 0.9997 0.0064
Average 0.99933 0.0118 0.9982 0.0165 0.9986 0.0166 0.9979 0.0174
Two term
60 0.9994 0.0116 0.9975 0.206 0.9985 0.0172 0.9977 0.0199
70 0.9992 0.0133 0.998 0.1786 0.9985 0.0177 0.9979 0.0185
80 0.9961 0.0254 0.9993 0.0102 0.9962 0.0249 0.9991 0.0141
Average 0.9982 0.0167 0.9982 0.1316 0.9977 0.0199 0.9982 0.0175
17
Vol.:(0123456789)
Scientific Reports | (2021) 11:21266 | https://doi.org/10.1038/s41598-021-00690-z
www.nature.com/scientificreports/
that is essential in dimensioning an adequate and efficient fig solar dryer. It was undertaken to understand the fig thin-layer drying, evaluate and save energy consumption of the drying process. This study clearly shows that the air temperature as well as the velocity had a large impact on the overall energetic performance of the hybrid dryer, with a substantially low electrical power requirements, as these factors increase. The results suggest that the solar energy can be an effective renewable source in biological products drying process, which can become the most efficient and feasible way out to deal with the increasing energy demand and supply gap.
0.0
0.2
0.4
0.6
0.8
1.0
Pre
dic
ted m
ois
ture
rat
io M
R
Drying time (min)
Experimental MR 60°C
MR Predicted by modifief Handerson & Pabis 60°C
Experimental MR 70°C
MR Predicted by modifief Handerson & Pabis 70°C
Experimental MR 80°C
MR Predicted by modifief Handerson & Pabis 80°C
Conidria
Dv=150m3/h
0 60 120 180 240 300
0 60 120 180 240 300
0.0
0.2
0.4
0.6
0.8
1.0
Pre
dic
ted
mo
istu
re r
atio
MR
Drying time (min)
Experimental MR 60°C
MR Predicted by modifief Handerson & Pabis 60°C
Experimental MR 70°C
MR Predicted by modifief Handerson & Pabis 70°C
Experimental MR 80°C
MR Predicted by modifief Handerson & Pabis 80°C
Rey Blanche
Dv=150m3/h
Figure 10. Experimental data of moisture ratio versus drying time fitted with modified Handerson and Pabis model at Dv = 150 m3/h.
18
Vol:.(1234567890)
Scientific Reports | (2021) 11:21266 | https://doi.org/10.1038/s41598-021-00690-z
www.nature.com/scientificreports/
0.0
0.2
0.4
0.6
0.8
1.0
Tau
x d
'hum
idit
é pré
dit
Taux d'humidité expérimental
R2=0,997
Rey Blanche
0.0 0.2 0.4 0.6 0.8 1.0
0.0 0.2 0.4 0.6 0.8 1.0
0.0
0.2
0.4
0.6
0.8
1.0
Pre
dic
ted m
ois
ture
rat
io
Experimental moisture ratio
R2=0,998Conidria
Figure 11. Comparison of experimental and predicted moisture ratio for both fig varieties by modified Handerson and Pabis model.
19
Vol.:(0123456789)
Scientific Reports | (2021) 11:21266 | https://doi.org/10.1038/s41598-021-00690-z
www.nature.com/scientificreports/
Received: 7 July 2021; Accepted: 15 October 2021
References 1. Hssaini, L. et al. Comparative analysis and physio-biochemical screening of an ex-situ fig (Ficus carica L.) collection. Hortic.
Environ. Biotechnol. 60, 671–683 (2019). 2. Wang, D. et al. Drying kinetics of American ginseng slices in thin-layer air impingement dryer. Int. J. Food Eng. 11, 701–711 (2015). 3. Nurlaila, W., Desa, M., Mohammad, M. & Fudholi, A. Review of drying technology of fig. Trends Food Sci. Technol. https:// doi.
org/ 10. 1016/j. tifs. 2019. 03. 018 (2019). 4. Raghavi, L. M., Moses, J. A. & Anandharamakrishnan, C. Refractance window drying of foods: A review. J. Food Eng. 222, 267–275
(2018). 5. Mat Desa, W. N., Mohammad, M. & Fudholi, A. Review of drying technology of fig. Trends Food Sci. Technol. 88, 93–103 (2019). 6. Sagar, V. R. Recent advances in drying and dehydration of fruits and vegetables : a review. J. Food Sci. Technol. 47, 15–26 (2010). 7. El, M. et al. Study and modeling of energy performance of a hybrid photovoltaic/thermal solar collector: Configuration suitable
for an indirect solar dryer. Energy Convers. Manag. https:// doi. org/ 10. 1016/j. encon man. 2016. 03. 059 (2016). 8. Vijayan, S., Arjunan, T. V. & Kumar, A. Mathematical modeling and performance analysis of thin layer drying of bitter gourd in
sensible storage based indirect solar dryer. Innov. Food Sci. Emerg. Technol. 36, 59–67 (2016). 9. Chaouch, W. B. et al. Experimental investigation of an active direct and indirect solar dryer with sensible heat storage for camel
meat drying in Saharan environment. Sol. Energy 174, 328–341 (2018). 10. Rajashekaraiah, T., Bedi, R., Francis, F. & Johny, J. Experimental study of solar dryer used for drying chilly and ginger. AIP Conf.
Proc. 2080, (2019). 11. da Silva, W. P., e Silva, C. M. D. P. S., Farias, V. S. O. & Gomes, J. P. Diffusion Models to Describe the Drying Process of Peeled
Bananas: Optimization and Simulation. Dry. Technol. 30, 164–174 (2012). 12. Rahman, N. F. A., Shamsudin, R., Ismail, A. & Karim Shah, N. N. A. Effects of post-drying methods on pomelo fruit peels. Food
Sci. Biotechnol. 25, 85–90 (2016). 13. Adak, N., Heybeli, N. & Ertekin, C. Infrared drying of strawberry. Food Chem. 219, 109–116 (2017).
0
2
4
6
8
10
12
14
16
18
20
80 °C/150 m 3
/h
70 °C/150 m 3
/h
60 °C/300 m 3
/h
80 °C/300 m 3
/h
70 °C/300 m 3
/h
Total energy consumption (kWh)
SEC (MWh / Kg)
Tota
l en
ergy c
onsu
mpti
on (
kW
h)
60 °C/300 m 3
/h
05101520253035404550556065
SE
C (
MW
h /
kg)
Figure 12. Energy consumption and specific energy consumption (SEC) during convection solar drying of fig slices at different aero-thermal conditions.
60 70 80
0.0
0.5
1.0
1.5
2.0
2.5
3.0
3.5
4.0
EnergyEfficiency
%
Drying air temperature (°C)
300 m3/h
150 m3/h
Figure 13. Energy efficiency for drying of fig slices at different drying air temperatures and flow rates.
20
Vol:.(1234567890)
Scientific Reports | (2021) 11:21266 | https://doi.org/10.1038/s41598-021-00690-z
www.nature.com/scientificreports/
14. Zhang, Q. A., Song, Y., Wang, X., Zhao, W. Q. & Fan, X. H. Modelado matemático de semillas de albaricoque desamargadas (Prunus armeniaca L.) durante el secado de capa fina. CYTA J. Food 14, 509–517 (2016).
15. Doymaz, I. Pretreatment effect on sun drying of mulberry fruits (Morus alba L.). J. Food Eng. 65, 205–209 (2004). 16. Ertekin, C. & Yaldiz, O. Drying of eggplant and selection of a suitable thin layer drying model. J. Food Eng. 63, 349–359 (2004). 17. Jamali, A., Kouhila, M., Mohamed, L. A., Idlimam, A. & Lamharrar, A. Moisture adsorption-desorption isotherms of Citrus
reticulata leaves at three temperatures. J. Food Eng. 77, 71–78 (2006). 18. Saha, B., Bucknall, M., Arcot, J. & Driscoll, R. Derivation of two layer drying model with shrinkage and analysis of volatile deple-
tion during drying of banana. J. Food Eng. 226, 42–52 (2018). 19. Ouaabou, R., Nabil, B., Hidar, N., Lahnine, L. & Idlimam, A. Valorization of solar drying process in the production of dried
Moroccan sweet cherries. Sol. Energy https:// doi. org/ 10. 1016/j. solen er. 2018. 05. 079 (2018). 20. Veberic, R. & Mikulic-Petkovsek, M. Phytochemical Composition of Common Fig (Ficus carica L.) Cultivars. in Nutritional
Composition of Fruit Cultivars 235–255 (Elsevier Inc., 2015).https:// doi. org/ 10. 1016/ B978-0- 12- 408117- 8. 00011-8 21. Hssaini, L. et al. Assessment of genetic diversity in Moroccan fig (Ficus carica L.) collection by combining morphological and
physicochemical descriptors. Genet. Resour. Crop Evol. 67, 457–474 (2020). 22. Russo, F., Caporaso, N., Paduano, A. & Sacchi, R. Phenolic Compounds in Fresh and Dried Figs from Cilento (Italy), by Consider-
ing Breba Crop and Full Crop, in Comparison to Turkish and Greek Dried Figs. J. Food Sci. 79, (2014). 23. FAOSTAT. Available at: http:// www. fao. org/ faost at/ en/# data/ QCL. (Accessed: 24th September 2021). 24. Ertan, B., Şenkayas, H. & Tuncay, Ö. Postharvest logistics performance of fresh fig varieties in Turkey. Sci. Hortic. (Amsterdam).
257, 108769 (2019). 25. Kousksou, T. et al. Renewable energy potential and national policy directions for sustainable development in Morocco. Renew.
Sustain. Energy Rev. 47, 46–57 (2015). 26. Boughali, S. et al. Crop drying by indirect active hybrid solar - Electrical dryer in the eastern Algerian Septentrional Sahara. Sol.
Energy 83, 2223–2232 (2009). 27. Lahsasni, S., Kouhila, M., Mahrouz, M. & Idlimam, A. Thin layer convective solar drying and mathematical modeling of prickly
pear peel (Opuntia ficus indica). Energy 29, 211–224 (2004). 28. Carle, F., Semenov, S., Medale, M. & Brutin, D. Contribution of convective transport to evaporation of sessile droplets: Empirical
model. Int. J. Therm. Sci. 101, 35–47 (2016). 29. Maurer, B. The anthropology of money. Annu. Rev. Anthropol. 35, 15–36 (2006). 30. Doymaz, I. Sun drying of figs: An experimental study. J. Food Eng. 71, 403–407 (2005). 31. Erbay, Z. & Icier, F. A review of thin layer drying of foods: Theory, modeling, and experimental results. Crit. Rev. Food Sci. Nutr.
50, 441–464 (2010). 32. Roberts, J. S., Kidd, D. R., & Padilla-Zakour, O. Drying kinetics of grape seeds. J. Food Eng. 89(4), 460–465 (2008). 33. Singh, S., Raina, C. S., Bawa, A. S., & Saxena, D. C. Effect of pretreatments on drying and rehydration kinetics and color of sweet
potato slices. Dry. Technol. 24(11), 1487–1494 (2006). 34. Aghbashlo, M., Kianmehr, M. H., & Arabhosseini, A. Modeling of thin-layer drying of potato slices in length of continuous band
dryer. Energy Convers. Manag. 50(5), 1348–1355 (2009). 35. Kingsly, R. P., Goyal, R. K., Manikantan, M. R., & Ilyas, S. M. Effects of pretreatments and drying air temperature on drying
behaviour of peach slice. Int. J. Food Sci. Technol. 42(1), 65–69 (2007). 36. Babalis, S. J., Papanicolaou, E., Kyriakis, N., & Belessiotis, V. G. Evaluation of thin-layer drying models for describing drying
kinetics of figs (Ficus carica). J. Food Eng. 75(2), 205–214 (2006). 37. Wang, G. Y., & Singh, R. P. Single layer drying equation for rough rice. American Society of Agricultural Engineers (1978). 38. Akpinar, E., Midilli, A., & Bicer, Y. Single layer drying behaviour of potato slices in a convective cyclone dryer and mathematical
modeling. Energy Convers. Manag. 44(10), 1689–1705 (2003). 39. Akpinar, E. K., Bicer, Y., & Cetinkaya, F. Modelling of thin layer drying of parsley leaves in a convective dryer and under open sun.
J. Food Eng. 75(3), 308–315 (2006). 40. Goula, A. M., Thymiatis, K., & Kaderides, K. Valorization of grape pomace: drying behavior and ultrasound extraction of phenolics.
Food Bioprod. Process. 100, 132–144 (2016). 41. Henderson, S. M., & Pabis, S. Grain drying theory I: temperature effect on drying coefficient. J. Agric. Eng. Res. 7, 85–89 (1961). 42. Motevali, A., Minaei, S., Banakar, A., Ghobadian, B. & Khoshtaghaza, M. H. Comparison of energy parameters in various dryers.
Energy Convers. Manag. 87, 711–725 (2014). 43. Aghbashlo, M., Mobli, H., Rafiee, S. & Madadlou, A. Energy and exergy analyses of the spray drying process of fish oil microen-
capsulation. Biosyst. Eng. 111, 229–241 (2011). 44. Naghavi, Z., Moheb, A. & Ziaei-rad, S. Numerical simulation of rough rice drying in a deep-bed dryer using non-equilibrium
model. Energy Convers. Manag. 51, 258–264 (2010). 45. Torki-Harchegani, M., Ghanbarian, D., Ghasemi Pirbalouti, A. & Sadeghi, M. Dehydration behaviour, mathematical modelling,
energy efficiency and essential oil yield of peppermint leaves undergoing microwave and hot air treatments. Renew. Sustain. Energy Rev. 58, 407–418 (2016).
46. Beigi, M. Energy efficiency and moisture diffusivity of apple slices during convective drying. Food Sci. Technol. 36, 145–150 (2016). 47. Hssaini, L. et al. Assessment of Morphological Traits and Fruit Metabolites in Eleven Fig Varieties (Ficus Carica L.). Int. J. Fruit
Sci. 00, 1–21 (2020). 48. Garba, U., Kaur, S., Gurumayum, S. & Rasane, P. Effect of hot water blanching time and drying temperature on the thin layer drying
kinetics of and anthocyanin degradation in black carrot (Daucus carota L.) shreds. Food Technol. Biotechnol. 53, 324–330 (2015). 49. Bahammou, Y., Tagnamas, Z., Lamharrar, A. & Idlimam, A. Thin-layer solar drying characteristics of Moroccan horehound leaves
(Marrubium vulgare L.) under natural and forced convection solar drying. Sol. Energy 188, 958–969 (2019). 50. Lahnine, L. et al. Comparative sorption isotherms of conserved Thymus satureioides. Moroccan J. Chem. 4, 128–139 (2016). 51. Moussaoui, H., Bahammou, Y., Idlimam, A., Lamharrar, A. & Abdenouri, N. Food and bioproducts processing investigation of
hygroscopic equilibrium and modeling sorption isotherms of the argan products: a comparative study of leaves, pulps, and fruits. Food Bioprod. Process. https:// doi. org/ 10. 1016/j. fbp. 2018. 11. 002 (2018).
52. Akanbi, C. T., Adeyemi, R. S. & Ojo, A. Drying characteristics and sorption isotherm of tomato slices. J. Food Eng. 73, 157–163 (2006).
53. Krokida, M. K., Karathanos, V. T., Maroulis, Z. B. & Marinos-Kouris, D. Drying kinetics of some vegetables. J. Food Eng. 59, 391–403 (2003).
54. Cui, Z. W., Xu, S. Y. & Sun, D. W. Effect of microwave-vacuum drying on the carotenoids retention of carrot slices and chlorophyll retention of Chinese chive leaves. Dry. Technol. 22, 563–575 (2004).
55. Belghit, A., Kouhila, M. & Boutaleb, B. C. Experimental study of drying kinetics by forced convection of aromatic plants. Energy Convers. Manag. 41, 1303–1321 (2000).
56. Kouhila, M., Kechaou, N., Otmani, M., Fliyou, M. & Lahsasni, S. Experimental study of sorption isotherms and drying kinetics of Moroccan Eucalyptus globulus. Dry. Technol. 20, 2027–2039 (2002).
57. Esbelin, J., Santos, T. & Hébraud, M. Desiccation: An environmental and food industry stress that bacteria commonly face. Food Microbiol. 69, 82–88 (2018).
21
Vol.:(0123456789)
Scientific Reports | (2021) 11:21266 | https://doi.org/10.1038/s41598-021-00690-z
www.nature.com/scientificreports/
58. Gupta, S., Huinink, H. P., Prat, M., Pel, L. & Kopinga, K. Paradoxical drying of a fi red-clay brick due to salt crystallization. Chem. Eng. Sci. 109, 204–211 (2014).
59. Koukouch, A. et al. Experimental determination of the effective moisture diffusivity and activation energy during convective solar drying of olive pomace waste. 101, (2017).
60. Yaldiz, O. Mathematical modeling of thin layer solar drying of sultana grapes. Energy 26, 457–465 (2001). 61. Doymaz, I. Evaluation of mathematical models for prediction of thin-layer drying of banana slices. Int. J. Food Prop. 13, 486–497
(2010). 62. Johnson, A. C. & Ali Al Mukhaini, E. M. Drying studies on peach and strawberry slices. Cogent Food Agric. 2, 1–10 (2016). 63. Aktas, T. & Polat, R. Changes in the drying characteristics and water activity values of selected pistachio cultivars during hot air
drying. J. Food Process Eng. 30, 607–624 (2007). 64. Doymaz, I. Mathematical modelling of thin-layer drying of kiwifruit slices. J. Food Process. Preserv. 33, 145–160 (2009). 65. Madhiyanon, T., Phila, A. & Soponronnarit, S. Models of fluidized bed drying for thin-layer chopped coconut. Appl. Therm. Eng.
29, 2849–2854 (2009). 66. Abbaszadeh, A., Motevali, A., Ghobadian, B., Khoshtaghaza, M. H. & Saeid, M. Effect of air velocity and temperature on energy
and effective moisture diffusivity for Russian Olive (Elaeagnusan gastifolial L.) in thin-layer drying. Iran. J. Chem. Chem. Eng. 31, 75–79 (2012).
67. Motevali, A., Minaei, S. & Khoshtagaza, M. H. Evaluation of energy consumption in different drying methods. Energy Convers. Manag. 52, 1192–1199 (2011).
68. Motevali, A. Comparison of energy parameters in various dryers. ENERGY Convers. Manag. 87, 711–725 (2014). 69. Aghbashlo, M., Kianmehr, M. H. & Samimi-Akhijahani, H. Influence of drying conditions on the effective moisture diffusivity,
energy of activation and energy consumption during the thin-layer drying of berberis fruit (Berberidaceae). Energy Convers. Manag. 49, 2865–2871 (2008).
70. Lewicki, P. P. & Lukaszuk, A. Effect of osmotic dewatering on rheological properties of apple subjected to convective drying. J. Food Eng. 45, 119–126 (2000).
71. Bußler, S., Ehlbeck, J. & Schlüter, O. K. Pre-drying treatment of plant related tissues using plasma processed air: Impact on enzyme activity and quality attributes of cut apple and potato. Innov. Food Sci. Emerg. Technol. 40, 78–86 (2017).
72. Hssaini, L. et al. Effects of pre-storage ascorbic and salicylic acids treatments on the enzymatic browning and nutritional quality of dried fig: Combined use of biochemical and ATR-FTIR analyses. Vib. Spectrosc. 115, 103269 (2021).
73. El Khadraoui, A., Bouadila, S., Kooli, S., Farhat, A. & Guizani, A. Thermal behavior of indirect solar dryer: Nocturnal usage of solar air collector with PCM. J. Clean. Prod. 148, 37–48 (2017).
AcknowledgementsThe authors thank Zahra Oussi Ali and Ali Hssaini for their support in this study.
Author contributionsL.H.: conceptualization, methodology, validation, formal analysis, investigation, resources, data curation, writ-ing—original draft, writing—review and editing, visualization and project administration; H.H. and R.R..: con-ceptualization, validation and data curation; R.O. and A.I.: formal analysis, validation, investigation, methodol-ogy, review and editing.
FundingThis research did not receive any specific grant from funding agencies in the public, commercial, or not-for-profit sectors.
Competing interests The authors declare no competing interests.
Additional informationCorrespondence and requests for materials should be addressed to L.H.
Reprints and permissions information is available at www.nature.com/reprints.
Publisher’s note Springer Nature remains neutral with regard to jurisdictional claims in published maps and institutional affiliations.
Open Access This article is licensed under a Creative Commons Attribution 4.0 International License, which permits use, sharing, adaptation, distribution and reproduction in any medium or
format, as long as you give appropriate credit to the original author(s) and the source, provide a link to the Creative Commons licence, and indicate if changes were made. The images or other third party material in this article are included in the article’s Creative Commons licence, unless indicated otherwise in a credit line to the material. If material is not included in the article’s Creative Commons licence and your intended use is not permitted by statutory regulation or exceeds the permitted use, you will need to obtain permission directly from the copyright holder. To view a copy of this licence, visit http:// creat iveco mmons. org/ licen ses/ by/4. 0/.
© The Author(s) 2021, corrected publication 2021
Copyright © 2022 FDOKUMEN