Kinetics and Thermodynamics of Amyloid Assembly Using a High‐Performance Liquid...
41
[3] Kinetics and Thermodynamics of Amyloid Assembly Using a High‐Performance Liquid Chromatography–Based Sedimentation Assay By BRIAN O’NUALLAIN,ASHWANI K. THAKUR,ANGELA D. WILLIAMS, ANUSRI M. BHATTACHARYYA,SONGMING CHEN,GEETHA THIAGARAJAN , and RONALD WETZEL Abstract Nonnative protein aggregation has been classically treated as an amorphous process occurring by colloidal coagulation kinetics and pro- ceeding to an essentially irreversible endpoint often ascribed to a chaotic tangle of unfolded chains. However, some nonnative aggregates, particu- larly amyloid fibrils, exhibit ordered structures that appear to assemble according to ordered mechanisms. Some of these fibrils, as illustrated here with the Alzheimer’s plaque peptide amyloid , assemble to an endpoint that is a dynamic equilibrium between monomers and fibrils exhibiting a characteristic equilibrium constant with an associated free energy of for- mation. Some fibrils, as illustrated here with the polyglutamine repeat sequences associated with Huntington’s disease, assemble via highly regu- lar mechanisms exhibiting nucleated growth polymerization kinetics. Here, we describe a series of linked methods for quantitative analysis of such aggregation kinetics and thermodynamics, focusing on a robust high‐ performance liquid chromatography (HPLC)–based sedimentation assay. An integrated group of protocols is provided for peptide disaggregation, setting up the HPLC sedimentation assay, the preparation of fibril seed stocks and determination of the average functional molecular weight of the fibrils, elongation and nucleation kinetics analysis, and the determination of the critical concentration describing the thermodynamic endpoint of fibril elongation. Introduction Some of the first analytical techniques applied to the understanding of purified individual proteins involved monitoring their aggregation in re- sponse to solvent changes, heat, or other conditions of stress (Neurath et al., 1944). Despite this history, our understanding of the mechanisms of formation, structures, and structural dynamics of protein aggregates has lagged well behind our appreciation of the behavior of globular proteins in 34 amyloid, prions, and other protein aggregates, part C [3] METHODS IN ENZYMOLOGY, VOL. 413 0076-6879/06 $35.00 Copyright 2006, Elsevier Inc. All rights reserved. DOI: 10.1016/S0076-6879(06)13003-7
Transcript of Kinetics and Thermodynamics of Amyloid Assembly Using a High‐Performance Liquid...

34 amyloid, prions, and other protein aggregates, part C [3]
[3] Kinetics and Thermodynamics of Amyloid AssemblyUsing a High‐Performance Liquid Chromatography–Based
Sedimentation Assay
By BRIAN O’NUALLAIN, ASHWANI K. THAKUR, ANGELA D. WILLIAMS,ANUSRI M. BHATTACHARYYA, SONGMING CHEN, GEETHA THIAGARAJAN,
and RONALD WETZEL
Abstract
Nonnative protein aggregation has been classically treated as anamorphous process occurring by colloidal coagulation kinetics and pro-ceeding to an essentially irreversible endpoint often ascribed to a chaotictangle of unfolded chains. However, some nonnative aggregates, particu-larly amyloid fibrils, exhibit ordered structures that appear to assembleaccording to ordered mechanisms. Some of these fibrils, as illustrated herewith the Alzheimer’s plaque peptide amyloid �, assemble to an endpointthat is a dynamic equilibrium between monomers and fibrils exhibiting acharacteristic equilibrium constant with an associated free energy of for-mation. Some fibrils, as illustrated here with the polyglutamine repeatsequences associated with Huntington’s disease, assemble via highly regu-lar mechanisms exhibiting nucleated growth polymerization kinetics. Here,we describe a series of linked methods for quantitative analysis of suchaggregation kinetics and thermodynamics, focusing on a robust high‐performance liquid chromatography (HPLC)–based sedimentation assay.An integrated group of protocols is provided for peptide disaggregation,setting up the HPLC sedimentation assay, the preparation of fibril seedstocks and determination of the average functional molecular weight of thefibrils, elongation and nucleation kinetics analysis, and the determinationof the critical concentration describing the thermodynamic endpoint offibril elongation.
Introduction
Some of the first analytical techniques applied to the understanding ofpurified individual proteins involved monitoring their aggregation in re-sponse to solvent changes, heat, or other conditions of stress (Neurathet al., 1944). Despite this history, our understanding of the mechanisms offormation, structures, and structural dynamics of protein aggregates haslagged well behind our appreciation of the behavior of globular proteins in
METHODS IN ENZYMOLOGY, VOL. 413 0076-6879/06 $35.00Copyright 2006, Elsevier Inc. All rights reserved. DOI: 10.1016/S0076-6879(06)13003-7

[3] kinetics and thermodynamics of amyloid assembly 35
solution. To some extent, this is attributable to a historical lack of interestin protein aggregation (Neurath et al., 1944) that only began to change asthe importance of the process to basic cellular biology (Kopito, 2000;Meijer and Codogno, 2004), protein folding (Stefani and Dobson, 2003),biotechnology (Mitraki and King, 1989; Wetzel, 1994), and human disease(Falk et al., 1997; Martin, 1999; Merlini and Bellotti, 2003) became appar-ent. An additional constraint, however, has been the lack of developmentof analytical technologies of sufficient precision to allow extraction ofinterpretable mechanistic information. As interest in protein aggregationhas increased over the past 30 years, newer methods have been developed.This is especially true over the past decade, a time of rapid growth in thenumber of laboratories working on protein aggregation in general and onamyloid in particular.
To approach a mechanistic understanding of any physicochemicaltransformation, it is important to monitor molecular conversions quantita-tively—to know how many molecular different species exist along thereaction profile, to be able to assign numbers of molecules to each of thesemolecular bins, and to know how these change with reaction time. This hasbeen a problem in protein aggregation studies. Turbidity assays have beenused effectively to develop some basic understanding of aggregation kinet-ics (Andreu and Timasheff, 1986; Mulkerrin and Wetzel, 1989) but sufferfrom the tendency of the largest aggregates to dominate the signal. Moresophisticated static and dynamic light‐scattering methods (Lomakin et al.,1999) offer significant improvements over turbidity assays but also sufferfrom a dominant contribution to the signal from larger aggregates, whichcan make it difficult to get reliable data on small components, particularlythe monomer pool. Dye‐binding assays, such as with Congo red (Klunket al., 1999) and thioflavin T (ThT) (LeVine, 1999) offer some advantages(e.g., discrimination between fibrils and protofibrils) but also some limita-tions (e.g., widely varying fluorescence yields per weight of fibril). Infavorable cases, circular dichroism (CD) performs so well that it candistinguish different conformations of amyloid (Yamaguchi et al., 2005),but CD also can suffer from interference from light scattering by largeaggregates (Colon, 1999) and is less useful if the native state is rich in�‐sheet. Fourier transform infrared (FTIR) spectroscopy has also beenused to follow amyloid formation (Nilsson, 2004) but is not convenientfor monitoring reaction time points at the relatively low concentrationsnormally used for fibril formation reactions. These and other methods arecapable of qualitatively monitoring aggregate formation but are less usefulat rigorously quantifying both aggregates and unreacted monomer. Thislimits their utility in serving detailed kinetics analysis (Chen et al., 2002b;O’Nuallain et al., 2005).
36 amyloid, prions, and other protein aggregates, part C [3]
This chapter is devoted to studies focusing on the amount of materialremaining in solution as low‐molecular‐weight species during the aggrega-tion reaction. The major advantage of this approach is that it is relativelystraightforward to quantify the soluble material with great accuracy andreproducibility. A disadvantage is that by only focusing on the soluble,nonsedimentable fraction, one risks oversimplifying the aggregation pro-cess. This is an important concern, because it is now clear there aremultiple aggregated states, including multiple amyloid states in some cases(Petkova et al., 2005; Tanaka et al., 2004), which are available to manyproteins and peptides and can coexist at intermediate times during amyloidformation. It is therefore important to conduct preliminary studies of anynew aggregation system to convince oneself that one understands thenature of the reactants, intermediates, and products using methods, suchas hydrogen–deuterium exchange protection (see Chapter 8 by Kheterpaland colleagues in this volume) that allow accurate discrimination andquantitation of various molecular states. Such studies should establish thefeasibility of studying aggregation reaction flux using a monomer‐centricmethod, such as the sedimentation assay described here. Where it is notpossible to quantify intermediates, the ability to conduct detailed kineticsanalysis is diminished and one is constrained to focus on the reactionendp oint (see sect ion on thermod ynamics of amyl oid fibril elongat ion ).
The examples used in this chapter to illustrate the use of high‐performance liquid chromatography (HPLC) sedimentation assays arerelatively simple peptides from the point of view of their exhibiting nodetectible stable structure in native buffer. This can be a tremendousadvantage, because it removes the elements of precursor unfolding ormisfolding, which are otherwise required initiating steps for the aggrega-tion of many globular proteins (Hurle et al., 1994; McCutchen et al., 1993).One approach to studying aggregation of globular proteins is to study theaggregation reaction under conditions where native globular structure hasbeen destabilized (Ignatova and Gierasch, 2005) (see Chapter 4 by Chitiand colleagues in this volume).
This chapter describes our laboratory’s techniques built around the useof the HPLC sedimentation assay to study amyloid formation by peptides.These methods were developed for studies on the Alzheimer’s plaquepeptide amyloid � (A�) (Cannon et al., 2004; O’Nuallain et al., 2004,2005; Shivaprasad and Wetzel, 2004, 2006; Williams et al., 2004, 2005,2006; Wood et al., 1996) and the polyglutamine (polyGln) sequence impor-tant in Huntington’s disease and other expanded CAG repeat diseases(Bhattacharyya et al., 2005, 2006; Chen et al., 2001, 2002b; Sharma et al.,2005; Thakur and Wetzel, 2002; Yang et al., 2002). The various elementsinclude: (1) disaggregation of peptides prior to initiation of aggregation,

[3] kinetics and thermodynamics of amyloid assembly 37
(2) preparation of seeds for use in elongation studies, (3) the basic HPLCsedimentation assay, (4) determination of the average functional molecularweight of an aggregate population, (5) elongation kinetics, (6) nucleationkinetics, and (7) thermodynamics of amyloid fibril elongation. The chapteris necessarily lengthy, and it might be argued that it could have beendivided into multiple chapters. However, because the methods are allinterlinked, the most efficient way of describing them all is to describethem all together.
Disaggregation of Peptides
The realization that many peptide preparations can be contaminatedwith small but functionally important levels of preexisting aggregates capa-ble of acting as cytotoxic agents (Howlett et al., 1995), as seeds to acceler-ate the aggregation of the monomeric peptides (Evans et al., 1995), or asinhibitors to poison spontaneous aggregation (Wood et al., 1996) and thedescription of methods for the effective removal of these aggregates wereimportant advances allowing the field to achieve some degree of controland reproducibility of in vitro studies. A number of disaggregation methodshave been described. These include filtration of dimethyl sulfoxide(DMSO) solutions (Evans et al., 1995), sequential, transient treatment withtrifluoroacetic acid (TFA) and hexafluoroisopropanol (HFIP) (Zagorskiet al., 1999), transient treatment with HFIP (Wood et al., 1996), ultracen-trifugation of aqueous solutions (Zhang et al., 2000), dissolution in basicaqueous solution (see Chapter 2 by Teplow in this volume), and transienttreatment in a 1:1 mixture of TFA and HFIP followed by ultracentrifuga-tion in aqueous solution (Chen and Wetzel, 2001; Wetzel, 2005). Each haspotential advantages and disadvantages. Some workers successfully usematerial directly from the lyophilized powder, without even a centrifuga-tion step to remove any aggregates. For some applications, disaggregationmay not be necessary, for example, if one is making aggregates for asubsequent use and is less interested in details of assembly kinetics andmechanism. However, even in this case, the decision to skip the disaggre-gation step may carry with it unappreciated consequences. For example,the structure of any adventitious aggregate seed present in the peptidesolution will self‐propagate and therefore determine the structure of theaggregated product; in some cases, this might differ from the structure ofan aggregate formed by spontaneous aggregation from fully disaggregatedmonomer under the same conditions. Until recently, this concern was onlyhypothetical, but it has become real with the description of different con-formers of amyloid fibrils being formed from the same peptide sequence(Petkova et al., 2005; Tanaka et al., 2004).

38 amyloid, prions, and other protein aggregates, part C [3]
Experimental Results
The basic method described here involves two steps: (1) the dissolutionand breakdown of aggregated structures through treatment with TFA orTFA‐HFIP mixtures, followed by removal of these volatile solvents, and(2) aqueous dissolution of the resulting disaggregated peptide film, fol-lowed by high‐speed centrifugation to remove trace aggregates. For pep-tide samples that are obtained in highly aggregated form, both steps areimportant. For peptide samples that appear to dissolve readily in water orphosphate‐buffered saline (PBS), it is possible that the centrifugation stepmight be sufficient. We routinely carry out both steps, however. Althoughthis method in outline is general, if this approach is applied to otheramyloidogenic peptides, it must be kept in mind that modifications, forexample, based on awareness of peptide’s pI, may be required.
The sometimes subtle importance of aggregates in apparently solublepeptides is illustrated by work with a short polyGln peptide D2Q15K2
(Chen and Wetzel, 2001). When this peptide is dissolved from the lyophi-lized powder in pH 3 water, it appears to dissolve completely, giving a clearsolution with very low Rayleigh light scattering. Adjusting this ‘‘solution’’to PBS conditions, however, and incubating at 37� lead to rapid aggrega-tion that is over after 5–10 min (Fig. 1). After pretreatment of anothersample of lyophilized peptide with a TFA/HFIP/centrifugation protocol,
FIG. 1. Time course of aggregation of a 7‐�M solution of D2Q15K2 at pH 7.5 and 37�
when synthetic peptide was dissolved directly in pH 3 water before adjusting to pH 7.5 (top
curve, rapid aggregation) or pretreated with the trifluoroacetic acid‐hexafluoroisopropanol(TFA‐HFIP) protocol before dissolving in pH 3 water and then adjusting to pH 7.5 (bottom
curve,▪; no aggregation). Reproduced with permission from Chen and Wetzel (2001).

[3] kinetics and thermodynamics of amyloid assembly 39
however, the same concentration of the peptide in PBS and 37� does notaggregate appreciably after hours or even days of incubation, only reachingan approximate equilibrium position after about 6 months. Thus, evenwhen peptide solutions appear to be soluble, they may harbor levels ofseed aggregates that can dramatically change the course of aggregation.
As peptides become less soluble, disaggregation conditions must bemade more stringent. The Q15 peptide discussed above can be disaggre-gated by sequential treatments of TFA and HFIP. The TFA has thecombined ability of a strong organic acid to dissolve H‐bonded proteinaggregates, on the one hand, although being relatively volatile and there-fore easy to remove on the other hand. The primary function of the HFIP isnormally to facilitate the removal of TFA (Zagorski et al., 1999), althoughit has some ability itself to break down aggregates (Wood et al., 1996). A1:1 mixture of TFA and HFIP was found, surprisingly, to have superiordisaggregation properties to TFA alone, such that long polyGln peptidesthat are not disaggregated by TFA alone can be handled by the 1:1 mixture(Chen and Wetzel, 2001). Incubation time is also important. Optimalincubation time can be determined empirically by occasionally removingaliquots for a microscale workup, followed by a light‐scattering test foraggregate formation (Chen and Wetzel, 2001; Wetzel, 2005). The ultimatemeasure of success of a disaggregation protocol is the presence of a lagphase of reproducible and maximal length when the treated peptide isincubated under appropriate conditions. Thus, application of a modifica-tion of the 1:1 TFA/HFIP protocol to the problematic islet amyloid poly-peptide (IAPP) led to spontaneous aggregation reactions featuring ameasurable lag time (O’Nuallain et al., 2004), which is generally notobserved when IAPP is disaggregated by other protocols.
It should be pointed out that although nucleation is a stochastic processat the molecular level, in a solution containing many molecules and ex-hibiting multiple independent nucleation events (i.e., multiple fibrils), oneexpects lag times to be reproducible. Variation in observed lag times inmultiple ensemble experiments is not evidence for a nucleated growthmechanism but rather an indication of lack of experimental control overthe system.
Whatever the details of the TFA/HFIP treatment, the manner by whichthese volatile solvents are removed can be extremely important. It isconvenient to remove the bulk of the volatile solvent under a stream ofgas in a chemical fume hood. For peptides containing easily oxidizableamino acids like methionine or cysteine, it is probably important to use anoxygen‐free gas. Oxygen‐free nitrogen is available, or argon can be used.Once the peptide has been disaggregated and the bulk of the organicsolvent has been removed so that only a peptide film remains, it is

40 amyloid, prions, and other protein aggregates, part C [3]
important to remove traces of HFIP under high vacuum. This is becausebuffers containing low percentages of HFIP can radically alter the aggre-gation pathway of amyloidogenic peptides (Nichols et al., 2005). Perhaps inpart because of the importance of removing HFIP, when scaling the TFA/HFIP step for larger amounts of peptide, it is important to retain approxi-mately equivalent surface‐to‐volume ratios. One simple way to scale upa disaggregation protocol reliably is to set up parallel, multiple smallreactions rather than place all the material in a single large vessel.
It may be possible to achieve satisfactory results using a rotary evapo-rator or speed‐vac to remove the bulk of the TFA and HFIP; we have notattempted to do this. Some cautions are in order for those attempting oneof these adaptations. Using a speed‐vac in place of gentle volatilizationunder a stream of nitrogen or argon may lead to all of the protein beingconcentrated in a small volume of gum at the base of the flask rather thanbeing spread over a large area. This may affect the efficiency of dissolu-tion in the aqueous solvent and lead to insoluble material. A rotary evapo-rator may produce the desired thin film of peptide residue, but it is notadvisable to use a water aspirator to provide the vacuum. Exposure of dryfilms of an amyloidogenic peptide to water vapor can lead to rapid conver-sion to a �‐sheet‐rich structure (Heller et al., 1996), most likely indicative ofaggregation.
In addition to TFA treatment conditions, other parameters that affectpeptide solubilities include the pH of the aqueous solvent used to dissolvethe peptide after removal of TFA/HFIP, the aqueous solvent used for thecentrifugation step, and the details of the centrifugation conditions. ThepH is important, because undue exposure of an amyloidogenic peptide to apH near its pI can lead to rapid isoelectric precipitation to an alternativelystructured aggregate that may even poison amyloid growth (Wood et al.,1996). For example, weak acid is used for dissolving polyGln peptidescontaining flanking Lys residues, but this is contraindicated for the peptideA� (pI �6), for which the preferred aqueous solvent is dilute aqueoussodium hydroxide quickly followed by addition of 2� PBS. Centrifugationconditions are important, because some highly aggregation‐prone peptides,such as A�(1‐42), are completely lost to solution on prolonged high‐speedcentrifugation. The centrifugation buffer can also be adjusted to minimizethe possibility of aggregation during centrifugation; for example, if aggre-gation is greatly favored by salt, the centrifugation can be conducted inlow‐salt conditions and the buffer adjusted to the desired salt concentrationafter the supernatant has been harvested.
Using this protocol, we obtain reproducible spontaneous aggrega-tion kinetics for various A�(1–40) molecules and for polyGln peptides ofvarious repeat lengths. Difficult peptides, such as A�(1–42), IAPP, and

[3] kinetics and thermodynamics of amyloid assembly 41
polyGln peptides of repeat lengths in the range of 50, have also been success-fully treated.Whether organic solvent dissolution can be an effective protocolfor amyloidogenic globular proteins is not clear, because it requires the abilityof the protein to refold efficiently when resuspended in aqueous buffer. Withappropriate concern for the variables discussed above, however, the methodshould be applicable to many amyloidogenic peptides.
Because biological activity normally requires solubility, the ability of abioactive peptide to aggregate, facilitated by small amounts of seeds, cancompromise any experiment exploring the activity or properties of pep-tides. These methods may thus prove useful for working with syntheticpeptides in all sorts in applications other than aggregation studies (Chenand Wetzel, 2001).
Protocols
Disaggregation of Polyglutamine Peptides
1. Suspend approximately 2 mg dry peptide in 4 ml of a 1:1 mixture(v/v) of TFA (Pierce) and HFIP (Acros) in a sealed 20‐ml glassErlenmeyer flask and incubate at room temperature (RT) for 5 h or untila test for residual aggregates is negative.
2. In a chemical fume hood, dry the peptide solution under a stream ofargon gas, and then immediately place it under vacuum to remove anyresidual volatile solvents. In humid climates, it may be advisable to ventthe vacuum with dry air or gas.
3. Dissolve the residue in pH 3 aqueous TFA to a concentration in therange of 100 �M and centrifuge at 386,000g for 3 h (or overnight ifnecessary) at 4� in a table‐top ultracentrifuge.
4. Carefully remove the top two thirds of the solution, place on ice, anddetermi ne the polyG ln concent ration using the HPL C assay (see sectionon HPLC sedim entation assay for amyloid transform ation s). Add anappropriate volume of a buffer concentrate, such as 10� PBS, to adjust thepeptide to buffered reaction conditions, and dilute as necessary with bufferto adjust to the desired concentration.
5. Disaggregated peptide should normally be prepared fresh, becauseaggregates build up even when the peptide is stored at �80�. If storage isattempted, avoid exposing the polyGln to frozen conditions above theeutectic points of the solutes (typically above �30�), because this willlikely lead to aggregation attributable to freeze concentration (Chen et al.,2002a ) (see section on pr eparation of stocks of aggrega te seeds ). Thus ,snap‐freeze in dry ice and ethanol or liquid nitrogen, and store at �80�.It may be possible to remove trace aggregates from stored samples by

42 amyloid, prions, and other protein aggregates, part C [3]
repeating the centrifugation step after thawing. If this is done, it may beadvisable to redetermine the peptide concentration in the supernatant.
6. Aggregate test. To test TFA/HFIP‐incubated peptide for degreeof disaggregation, remove a small aliquot, dry under argon followed by briefexposure to vacuum, dissolve in pH3water, and add a 1:9 volumeof 10�PBS(or buffer concentrate later to be used in the reaction). This solution shouldbe analyzed in a fluorometer in which emission and excitation wavelengthsare set at 450 nm. The Rayleigh light‐scattering signal obtained should becomparable to scattering from buffer alone and significantly lower thandilutions of an equivalent weight concentration of completely aggregatedpeptide in the samebuffer.Analysis of aliquots shouldbe continued at longerincubation times until the signal is that of buffer alone or, failing that, hasreached a minimum not far from buffer alone.
Disaggregation of Ab(1–40) Peptides
1. Suspend 1 mg lyophilized peptide powder in 1 ml TFA in a smallglass vial. Cap the vial, and sonicate the sample in a water bath sonicatorfor 10 min.
2. In a chemical fume hood, dry the peptide solution under a gentlestream of argon gas that distributes material to the flask walls as it reducesvolume. When done properly, you should see a thin film on the walls ofthe vial.
3. Dissolve the peptide in 1 ml HFIP. Swirl carefully to make sure allthe monomer has gone into solution and is not clinging to the sides of thevial. Incubate the closed solution of peptide at 37� for 1 h.
4. Transfer a small, measured aliquot of the HFIP solution into 0.05%TFA in water and chromatograph on HPLC to determine the amount ofpepti de in the HFIP solution (see section on HPLC sedim entation assayfor amyloid transformations). This value will be approximate, because thelow surface tension of HFIP makes accurate pipetting difficult (transferrapidly). However, because lyophilized peptide contains significant andvariable amounts of water, it will be more accurate than the powder weightof the peptide from step 1.
5. In a chemical fume hood, dry the peptide solution under a streamof argon.
6. For a second time, dissolve the residue in 2 ml HFIP. This step isdone to ensure that all of the TFA is removed from the sample.
7. Based on the HPLC determination of the amount of peptide in thesample, aliquot sample into glass tubes at 0.25 mg per tube. Do not putmore peptide in any one tube so as to avoid precipitation of A� duringstep 10.
[3] kinetics and thermodynamics of amyloid assembly 43
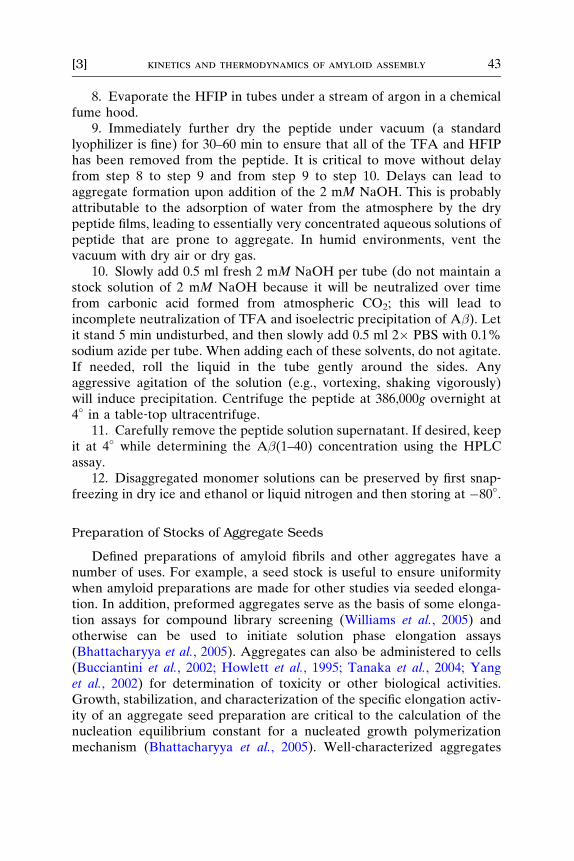
8. Evaporate the HFIP in tubes under a stream of argon in a chemicalfume hood.
9. Immediately further dry the peptide under vacuum (a standardlyophilizer is fine) for 30–60 min to ensure that all of the TFA and HFIPhas been removed from the peptide. It is critical to move without delayfrom step 8 to step 9 and from step 9 to step 10. Delays can lead toaggregate formation upon addition of the 2 mM NaOH. This is probablyattributable to the adsorption of water from the atmosphere by the drypeptide films, leading to essentially very concentrated aqueous solutions ofpeptide that are prone to aggregate. In humid environments, vent thevacuum with dry air or dry gas.
10. Slowly add 0.5 ml fresh 2 mM NaOH per tube (do not maintain astock solution of 2 mM NaOH because it will be neutralized over timefrom carbonic acid formed from atmospheric CO2; this will lead toincomplete neutralization of TFA and isoelectric precipitation of A�). Letit stand 5 min undisturbed, and then slowly add 0.5 ml 2� PBS with 0.1%sodium azide per tube. When adding each of these solvents, do not agitate.If needed, roll the liquid in the tube gently around the sides. Anyaggressive agitation of the solution (e.g., vortexing, shaking vigorously)will induce precipitation. Centrifuge the peptide at 386,000g overnight at4� in a table‐top ultracentrifuge.
11. Carefully remove the peptide solution supernatant. If desired, keepit at 4� while determining the A�(1–40) concentration using the HPLCassay.
12. Disaggregated monomer solutions can be preserved by first snap‐freezing in dry ice and ethanol or liquid nitrogen and then storing at �80�.
Preparation of Stocks of Aggregate Seeds
Defined preparations of amyloid fibrils and other aggregates have anumber of uses. For example, a seed stock is useful to ensure uniformitywhen amyloid preparations are made for other studies via seeded elonga-tion. In addition, preformed aggregates serve as the basis of some elonga-tion assays for compound library screening (Williams et al., 2005) andotherwise can be used to initiate solution phase elongation assays(Bhattacharyya et al., 2005). Aggregates can also be administered to cells(Bucciantini et al., 2002; Howlett et al., 1995; Tanaka et al., 2004; Yanget al., 2002) for determination of toxicity or other biological activities.Growth, stabilization, and characterization of the specific elongation activ-ity of an aggregate seed preparation are critical to the calculation of thenucleation equilibrium constant for a nucleated growth polymerizationmechanism (Bhattacharyya et al., 2005). Well‐characterized aggregates

44 amyloid, prions, and other protein aggregates, part C [3]
are also important in cross‐seeding experiments that can inform aboutstructure–function aspects of amyloid fibril elongation, and hence amyloidstructure (Jones and Surewicz, 2005; O’Nuallain et al., 2004).
Experimental Results
The particular conformation of an amyloid fibril appears to ‘‘breedtrue’’ when fibrils are used as seeds for stimulating growth of additionalaggregates by elongation (Petkova et al., 2005), and this appears to be thebasis of strain effects and species barriers in prion diseases (Tanaka et al.,2004). Seeded fibril elongation thus provides a way of maintaining individ-ual ‘‘lines’’ of fibrils distinguished by their conformations and uniqueproperties. At the same time, this places a premium on conformationalpurity in the seed stock, because, in principle, the conformational purity ofthe aggregated product is unlikely to be any better than that of the seedsused to produce it. In some cases, the ratio of amyloid conformationswithin an aggregate population can shift during sequential rounds ofelongation (Yamaguchi et al., 2005). Under special circumstances, a partic-ular amyloid can be prepared in a conformationally pure state fromaggregates prepared in vitro by using microbial cloning methods (Tanakaet al., 2004). Except for such methods, however, the field is currentlylimited in its ability to create absolutely pure conformational states. Newseparation methods (see Chapter by Silveira and colleagues and Chapterby Bagriantsev and co‐workers, in this volume) or a cloning strategy (seeChapter by Tanaka and Weissman in this volume) may ultimately facilitatepreparation of pure or enriched states of conformational variants.
The specific conformational features of aggregates formed by sponta-neous growth from pure monomeric (disaggregated) populations can varysignificantly with growth conditions. Traditionally, amyloid fibrils of theA�(1‐40) peptide have been grown either with shaking (Esler et al., 1997;Evans et al., 1995) or under quiescent conditions (Hilbich et al., 1992; Woodet al., 1996). The Tycko group showed that the amyloid fibrils formed bythese two approaches differ both in macroscopic structure and in the de-tails of how A� is folded within the fibril (Petkova et al., 2005). Althoughfibrils formed under a particular set of conditions may be dominated bycertain conformational types, they may still harbor a variety of minor statesas well, which presumably also breed true and will continue to contaminatethe elongated aggregation products. It may eventually be possible to esti-mate the conformational purity of a preparation with the aid of convenientphysical measurements.
The polyGln peptides also exhibit a wide range of amyloid‐like aggre-gate morphologies, many of which are capable of seeding aggregate growth

[3] kinetics and thermodynamics of amyloid assembly 45
by monomer addition. Product structure ranges from typical amyloidfibrils, to ribbons and bundles of long rigid protofilaments, to smallerprotofibril‐like structures (Chen et al., 2002a). Aggregate structure is con-trolled both by polyGln repeat length and growth conditions (Chen et al.,2002a). Longer polyGln sequences favor amyloid fibril formation, as do thelow‐salt growth conditions that tend to slow down aggregate assembly.Formation of protofibril‐like structures requires the unusual growth condi-tion of freezing a PBS solution in the �20� to �5� range. Aggregates formefficiently in the space of 24 h because of the process of freeze concentra-tion (Franks, 1993), which forces solutes (both the polyGln and the salts)into small fissures within the imperfect ice lattice and thereby creates veryhigh concentrations that drive aggregate formation (A� solutions appearnot to be susceptible to this effect). Freezing monomer at �70�, below theeutectic points of the solutes, preserves the monomer state.
Seeding efficiency, which is related to the average number of growthsites per weight of aggregate, can be increased by sonication (Jarrett andLansbury, 1992). Effective shearing of fibril products normally requires aprobe (as opposed to a bath) sonicator. The ability of sonication to magnifythe seeding potential of a preparation is the basis of a method for increas-ing the sensitivity of detection methods for mammalian prions (see Chapterby Soto and colleagues in this volume). Sonication apparently shears fibrils,altering their conformational integrity, although more work is required toconfirm this. Sonication is normally used to enhance seeding potential, butit also can be used to increase the uniformity of a fibril preparation(O’Nuallain et al., 2004) and enhance the ability of cells to take up aggre-gates (Yang et al., 2002). Although electron microscopy (EM) analysisconfirms that isolated fibrils have a shorter average length after sonication,it appears that sonication does not necessarily significantly reduce theaverage particle size of fibril particles in suspension phase, presumablybecause of fibril clustering (see Chapter 11 by Mok and Howlett in thisvolume).
For many applications, it is useful to be able to characterize a fibrilpreparation according to weight concentration and the number of growthsites per unit weight. Weight concentration can be indirectly determined bymeasuring the amount of monomer left unreacted at the end of a fibrilformation reaction. The assumption that all peptide not accounted for inthe monomer pool must be in the aggregate pool is fine, so long as theaggregate has not been subjected to any transfers or concentration steps inthe interim. If that is the case, however, it is better to assess the aggregateweight concentration of the final aggregate stock suspension directly, asdescribed below. Methods for titrating fibril growth sites are described inthe sect ion on titrat ion of fibril grow ing end s .

46 amyloid, prions, and other protein aggregates, part C [3]
Stock aggregate suspensions are best stored by snap‐freezing in liquidnitrogen or dry ice and ethanol, followed by storage at �80�. Even underthese conditions, their properties, such as seeding potential, may degradesomewhat over a period of months. There is not enough experienceto formulate general rules; aggregate stability under storage should beconfirmed for each system and aggregate type.
Protocols
Growth and Storage of Ab(1–40) Aggregates Under Conditions ofQuiescent Growth
1. For spontaneous growth of A�(1–40) fibrils, incubate 20–60 �Mfreshly disaggregated A�(1–40) in PBS with 0.05% sodium azide in anEppendorf or Falcon tube at 37�. The samples are kept undisturbed for theduration of the growth. This procedure also works for many mutants of A�(1–40), although some require higher starting concentrations of peptidebecause of their high critical concentration (Cr) values. Other buffersand temperatures can also be used but may lead to alternate fibrilconformations (Petkova et al., 2005).
2. Assay time points should be taken for the HPLC sedimentationassay and/or ThT assay by gently inverting the reaction several times tomix before removing aliquots to be tested.
3. When the aggregation is complete as determined by the ThT and/orHPLC sedimentation assay, collect the A�(1‐40) aggregates by centrifuga-tion for 30 min at 20,800g (14,000 rpm in an Eppendorf 5417R centrifuge).Resuspend in buffer with gentle swirling or vortexing. This step removes theazide and buffer components as well as any unpolymerized monomer andallows for generation of a concentrated aggregate suspension, if desired.Determine the weight concentration of aggregates, if desired. Preserve thestock suspensions by snap‐freezing in dry ice and ethanol or liquid nitrogenand then placing the stocks at �80� for long‐term storage.
4. If desired, sonicate the aggregate stock suspension using a probesonicator. We typically sonicate on ice five times using a cycle of a 30‐s pulsefollowed a by 1‐min delay. We normally include 1 mMDTT as a precautionagainst air oxidation during the sonication, but, of course, this is notadvisable, for example, formutatedA� fibrils containing disulfidebonds.Wehavenodata indicating that theDTT is required, butMet 35ofA� is themostchemically labile amino acid residue in wild‐type A� under most conditions.
5. It should be noted that removal of unpolymerized monomer in step3 may create a situation where aggregate is prone to dissociate partially ifallowed to stand for extended periods under dissociation conditions. This ismore of a concern with aggregates that exhibit significant Cr values and

[3] kinetics and thermodynamics of amyloid assembly 47
dissociation kinetics. In some cases, where the projected use of theaggregate is not compromised by small amounts of azide or monomer,it may be better simply to store the reaction mixture without taking stepsto remove these soluble molecules.
Growth and Storage of polyGln Aggregates (37�)
1. Dilute the disaggregated peptide stock in a Falcon tube to a 10‐�Mfinal concentration in PBS containing 0.05% sodium azide. Cap and sealthe Falcon tube with parafilm, and incubate at 37�.
2. Monitor by HPLC sedimentation assay and/or ThT assay until thesignal plateaus. This may take several to many days, depending on repeatlength (Chen et al., 2002a) and features of the sequence.
3. Collect aggregates by centrifugation, wash, and concentrate in freshbuffer, if desired, as described previously. Determine the weight concen-tration of aggregates if desired, snap‐freeze, and store at �80�.
4. Different growth conditions at 37� give different morphologies(Chen et al., 2002a). The above protocol leads to ribbon‐like parallelassemblies of protofilament‐like structures with intermediate repeat lengthpolyGln peptides in PBS. Amyloid‐like twisted ropes can be prepared bygrowing the same peptides in Tris HCl, pH 7, without added salts, but thisrequires significantly longer incubation times. Longer polyGln peptides (45or more Gln) grow into fibrils even in PBS.
Growth and Storage of polyGln Aggregates (�20�)
1. Another polymorphism of polyGln aggregates with many interestingproperties and uses is the short, curvilinear filaments with amyloid‐likeseeding activity and properties formed in frozen PBS solutions (Chen et al.,2002a).
2. Dilute the peptide from a disaggregated stock solution to a 10‐�Mfinal concentration in PBS with 0.05% sodium azide in an Eppendorf orFalcon tube. Incubate the aggregates for 24 h at 37�, and then snap‐freezein liquid nitrogen and store at �20� for 24 h. It may be necessary toeliminate the 37� preincubation step for peptides that begin to aggregateover this 24‐h period. The role of this preincubation step is not clear, butwe have observed somewhat different properties of aggregated product ifit is eliminated.
3. Thaw on the bench‐top and check for aggregation by ThT, lightscattering, or HPLC sedimentation assay. Collect aggregates at 20,800g,and resuspend the pellet in PBS to prepare a suspension of the desiredapproximate weight concentration. Determine the exact weight concentra-tion by the protocol below.
4. Aliquot if desired, snap‐freeze, and store at �80�.

48 amyloid, prions, and other protein aggregates, part C [3]
Determination of Aggregate Weight Concentration
1. Remove an aliquot of the aggregate stock suspension sufficient todeliver at least 10 �g (or, alternately, the smallest volume of suspensionthat can be accurately transferred), and add 100% formic acid to give 70%formic acid. Vortex vigorously, and incubate at room temperature for10 min.
2. Add water to give a final volume of 120 �l and vortex.3. Inject 100 �l onto the HPLC sedimentation assay using a reverse‐
phase column and gradient sufficient for resolution of the monomeric formof the aggrega te co mponent (see sect ion on HPL C sediment ation assay foramyloid transformations).
4. Integrate the peak of the correct retention time, and obtain the micro-grams of peptide from the standard curve (see section on HPLC sedimentationassay for amyloid transformations). Based on the dilution scheme, calculatethe weight concentration of aggregates in the stock suspension.
An HPLC Sedimentation Assay for Amyloid Transformations
The dilemma in trying to rigorously track amyloid transformations isthat there is no reproducible, convenient method that allows quantitationof all the reaction species, ranging from monomers to various types ofaggregates. The most discriminating assays for amyloid, for example, areEM and atomic force microscopy (AFM), but they are not quantitative foraggregates and give no concentration information at all on small mono-meric peptides. ThT gives a relatively strong response to amyloid, but it canvary over at least a 20‐fold range depending on the fibril (Shivaprasad andWetzel, 2006) (Fig. 2) and does not appear to give a significant response tosome A� protofibrils (Williams et al., 2005). Sedimentation assays can giveinformation on concentrations of unreacted monomer but can provide littleinformation on the nature of the aggregated, sedimented fraction. If theaggregates exhibit radically different sedimentation coefficients, somegross features of the aggregate product profile can be assessed by varyingcentrifugation conditions (see Chapter 11 by Mok and Howlett in thisvolume). Other techniques must be used to confirm the nature of theaggregates along the reaction coordinate.
There are a number of ways of measuring protein in the supernatantafter sedimentation of the aggregates. The advantage of HPLC is that itallows one to monitor multiple monomeric species independently, and thus,for example, observe chemical degradation during the aggregation process,or to monitor the parallel aggregation of multiple peptides in the samereaction. Disadvantages include a modest sensitivity, a relatively lengthy

FIG. 2. Comparisons of weight‐normalized thioflavin T (ThT) fluorescence signals for
amyloid fibrils of amyloid � (A�)(1‐40) point mutants containing single Cys point mutations
in various chemical states. Free Cys, cross‐hatched bars; carboxymethyl‐Cys, filled bars;
methyl‐Cys, open bars. Reprinted with permission from Shivaprasad and Wetzel (2006).
[3] kinetics and thermodynamics of amyloid assembly 49
analysis time, and the need to ensure that supernatants in the HPLCanalysis queue do not degrade (e.g., continue to aggregate) before injection.
Experimental Results
The sedimentation assay requires a standard curve relating the inte-grated area of a peptide HPLC peak to the mass of the peptide. The assayrequires reproducible recovery of injected peptide throughout the dynamicrange of the assay and, preferably, nearly quantitative recovery. Wave-lengths in the range of 215 to 220, where the peptide bond (and otheramides) strongly absorb, are normally used for quantitation. Figure 3 showsthe excellent linearity of response for A�(1‐40) and for the peptideK2Q25K2 using peptide stock solutions that were independently calibratedfor concentration using amino acid composition analysis. Figure 3 alsoshows that because of somewhat different extinction coefficients of differ-ent amino acids, different peptides can exhibit different standard curves.In a practical compromise, we typically use the same repeat length polyGlnpeptide standard for all polyGln peptides regardless of repeat length andthe existence of occasional mutations. Similarly, we use a wild‐type A�(1–40) stock solution for point mutants of A�.
It is recommended that one establish the appropriateness of the HPLCsedimentation assay as a faithful reporter of a reaction by carrying out apreliminary validation in which the aggregation reaction is monitored bymultiple measures. Figure 4A shows the time course of a spontaneousaggregation reaction of a polyGln peptide as monitored by the sedimentationassay, the ThT assay, a Rayleigh light‐scattering assay, and CDmonitoring of

FIG. 3. Standard curves for high‐performance liquid chromatography (HPLC) determina-
tion of peptide mass as described in section on the HPLC sedimentation assay for amyloid
transformations (amyloid � (A�)(1‐40),▪; K2Q25K2, ¨).
50 amyloid, prions, and other protein aggregates, part C [3]
the random coil to �‐sheet transition (Chen et al., 2002b). Figure 4B shows acontrasting case, in which the HPLC sedimentation assay of A� aggregationpicks up a significant loss of monomer from solution during the ThT lagphase, a discontinuity explained by the early generation of ThT‐unresponsiveoligomers and/or protofibrils (Williams et al., 2005).
Protocols
Construction of the Standard Curve
1. Disaggregate a sample of purified peptide, and dissolve the driedfilm in a volume of 1% TFA in water sufficient to produce a solution ofapproximately 100 �g/ml. Aliquot this solution into volumes of about500 �l, snap‐freeze, and store at �80�. This is the standard solution to beused for routine construction of the standard curve. For the polyGlnstandard, we use the peptide K2Q25K2 so that there are no major concernsabout the peptide aggregating in the autosampler.
2. To determine the peptide concentration in the standard solutionaccurately, dilutewith the highest possible accuracy (by serial dilutions and/orby determining aliquot volumes gravimetrically) into 1% aqueous TFA toa concentration of approximately 10 �g/ml. Seal in an ampoule, and submit(including duplicate or triplicate independent dilutions from the samestock solution) for amino acid composition analysis (e.g., CommonwealthBiotechnologies, Inc., 601 Biotech Drive, Richmond, VA 23235). Use thereturned mean value to calculate the exact concentration of the standardsolution.

[3] kinetics and thermodynamics of amyloid assembly 51
3. In separate runs, inject (preferably with escalating peptide amounts)aliquots of the standard solution on an analytical HPLC instrument withanalytical‐quality gradient reproducibility and ultraviolet (UV) detectorsensitivity (we use the Agilent 1100 binary gradient system with eithera diode array or a variable wavelength detector), using an analyticalreverse‐phase column (C3 works well for A�(1‐40) and for many polyGln
FIG. 4. Testing for aggregation reaction complexity with parallel assays. (A) Aggregation
progress of 0.39 mg/ml K2Q42K2 in 10 mM Tris‐trifluoroacetic acid (TFA), pH 7.0, with
monitoring by circular dichroism (CD; [�]200) (▪), high‐performance liquid chromatography
(HPLC) (●), light scattering (□), and thioflavin T (ThT) (○) methods, consistent with one class
of aggregated product. Reprinted with permission from Chen et al. (2002b). (B) Solution phase
spontaneous aggregation of disaggregated amyloid � (A�)(1–40) in phosphate‐buffered saline
(PBS) at 37�, monitored by ThT (¨) and HPLC of high‐speed centrifugation supernatants (▪),
suggests the existence of a ThT‐insensitive aggregate populated before fibril formation ensues on
days 4–6. Modified and reprinted with permission from Williams et al. (2005).
52 amyloid, prions, and other protein aggregates, part C [3]
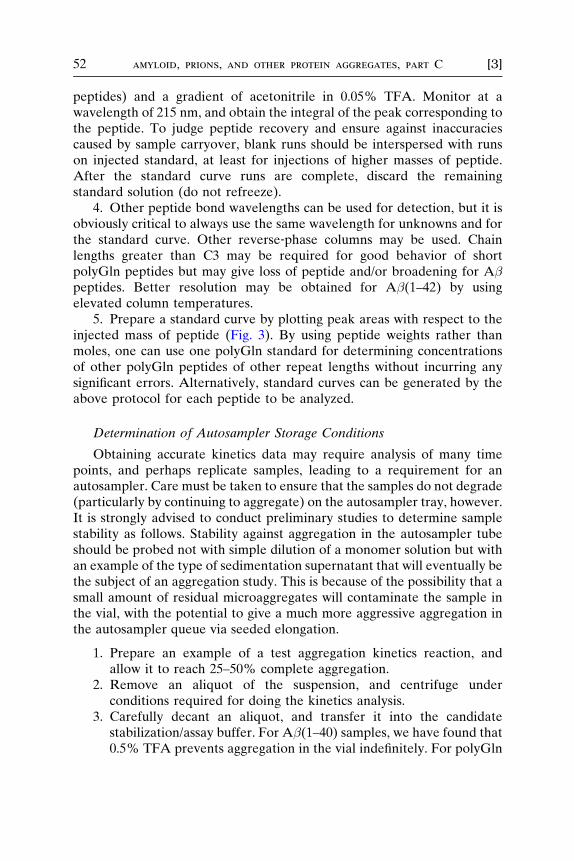
peptides) and a gradient of acetonitrile in 0.05% TFA. Monitor at awavelength of 215 nm, and obtain the integral of the peak corresponding tothe peptide. To judge peptide recovery and ensure against inaccuraciescaused by sample carryover, blank runs should be interspersed with runson injected standard, at least for injections of higher masses of peptide.After the standard curve runs are complete, discard the remainingstandard solution (do not refreeze).
4. Other peptide bond wavelengths can be used for detection, but it isobviously critical to always use the same wavelength for unknowns and forthe standard curve. Other reverse‐phase columns may be used. Chainlengths greater than C3 may be required for good behavior of shortpolyGln peptides but may give loss of peptide and/or broadening for A�peptides. Better resolution may be obtained for A�(1–42) by usingelevated column temperatures.
5. Prepare a standard curve by plotting peak areas with respect to theinjected mass of peptide (Fig. 3). By using peptide weights rather thanmoles, one can use one polyGln standard for determining concentrationsof other polyGln peptides of other repeat lengths without incurring anysignificant errors. Alternatively, standard curves can be generated by theabove protocol for each peptide to be analyzed.
Determination of Autosampler Storage Conditions
Obtaining accurate kinetics data may require analysis of many timepoints, and perhaps replicate samples, leading to a requirement for anautosampler. Care must be taken to ensure that the samples do not degrade(particularly by continuing to aggregate) on the autosampler tray, however.It is strongly advised to conduct preliminary studies to determine samplestability as follows. Stability against aggregation in the autosampler tubeshould be probed not with simple dilution of a monomer solution but withan example of the type of sedimentation supernatant that will eventually bethe subject of an aggregation study. This is because of the possibility that asmall amount of residual microaggregates will contaminate the sample inthe vial, with the potential to give a much more aggressive aggregation inthe autosampler queue via seeded elongation.
1. Prepare an example of a test aggregation kinetics reaction, andallow it to reach 25–50% complete aggregation.
2. Remove an aliquot of the suspension, and centrifuge underconditions required for doing the kinetics analysis.
3. Carefully decant an aliquot, and transfer it into the candidatestabilization/assay buffer. For A�(1–40) samples, we have found that0.5% TFA prevents aggregation in the vial indefinitely. For polyGln

[3] kinetics and thermodynamics of amyloid assembly 53
samples, a final concentration of 20% formic acid was required toprevent aggregation in the vial for up to 20 h at RT.
4. Analyze injections from this test vial at periodic intervals usinga standard HPLC gradient and appropriate standard curve toestablish whether the test solvent is adequate to preserve sampleconcentration over time.
Sedimentation Assay Protocol
1. Take a 100‐�l aliquot of the sample, and centrifuge to removeaggregates. If it can be established that amyloid‐scale aggregates are the onlyaggregated product, 30min at 20,400g is sufficient. Ifmicroaggregates, such asprotofibrils, are a possibility, higher speeds, such as 386,000g for 1 h at 4� in atable‐top ultracentrifuge, may be required. Smaller aggregates may remainbehind in the supernatant if shorter times and slower speeds are used (Fig. 4B)(Chen et al., 2002b;Williams et al., 2005; seeChapter 11byMokandHowlett inthis volume).At the sametime, in somebuffers, protofibrils appear to clump togive superaggregates that pellet well at 20,400g.
2. Remove 75 �l of supernatant carefully from the centrifuge tube, andplace it in an Eppendorf tube along with any reagents found necessary tostabilize the supernatant against aggregation in the vial.
3. Transfer the major portion of the sample onto a reverse‐phaseHPLC column (directly or by queuing in an autosampler), and developwith a linear gradient of acetonitrile in aqueous 0.05% TFA.
4. Integrate the peak of the correct retention time, and obtain themicrograms of peptide from the standard curve. If automated softwareintegration is used, it is best to confirm that it is giving appropriatenumbers, especially as the signal‐to‐noise ratio decreases toward the end ofthe aggregation reaction, by manual integration.
5. Be vigilant for the time‐dependent appearance of new peaks in theHPLC assay that may indicate oxidation or hydrolysis of side chains in thepeptide. Significant formation of chemical degradation products severelycomplicates kinetic and thermodynamic interpretations of the data.
Titration of Fibril Growing Ends
Analysis of many aspects of fibril growth reactions requires knowledgeof the average number of growth/elongation sites per unit weight of aggre-gate. Although fibril elongation reactions can be easily fit to pseudo‐first‐order kinetics, the rate constant obtained is only valid for the particularpreparation of fibrils used as seeds, because the reaction is of the first orderin bothmonomer and aggregate (O’Nuallain et al., 2004) and aggregates can
54 amyloid, prions, and other protein aggregates, part C [3]
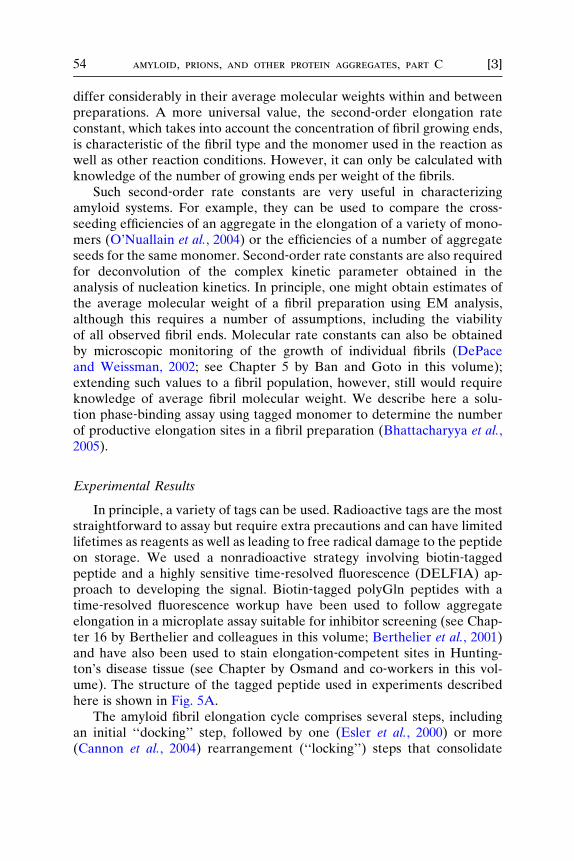
differ considerably in their average molecular weights within and betweenpreparations. A more universal value, the second‐order elongation rateconstant, which takes into account the concentration of fibril growing ends,is characteristic of the fibril type and the monomer used in the reaction aswell as other reaction conditions. However, it can only be calculated withknowledge of the number of growing ends per weight of the fibrils.
Such second‐order rate constants are very useful in characterizingamyloid systems. For example, they can be used to compare the cross‐seeding efficiencies of an aggregate in the elongation of a variety of mono-mers (O’Nuallain et al., 2004) or the efficiencies of a number of aggregateseeds for the same monomer. Second‐order rate constants are also requiredfor deconvolution of the complex kinetic parameter obtained in theanalysis of nucleation kinetics. In principle, one might obtain estimates ofthe average molecular weight of a fibril preparation using EM analysis,although this requires a number of assumptions, including the viabilityof all observed fibril ends. Molecular rate constants can also be obtainedby microscopic monitoring of the growth of individual fibrils (DePaceand Weissman, 2002; see Chapter 5 by Ban and Goto in this volume);extending such values to a fibril population, however, still would requireknowledge of average fibril molecular weight. We describe here a solu-tion phase‐binding assay using tagged monomer to determine the numberof productive elongation sites in a fibril preparation (Bhattacharyya et al.,2005).
Experimental Results
In principle, a variety of tags can be used. Radioactive tags are the moststraightforward to assay but require extra precautions and can have limitedlifetimes as reagents as well as leading to free radical damage to the peptideon storage. We used a nonradioactive strategy involving biotin‐taggedpeptide and a highly sensitive time‐resolved fluorescence (DELFIA) ap-proach to developing the signal. Biotin‐tagged polyGln peptides with atime‐resolved fluorescence workup have been used to follow aggregateelongation in a microplate assay suitable for inhibitor screening (see Chap-ter 16 by Berthelier and colleagues in this volume; Berthelier et al., 2001)and have also been used to stain elongation‐competent sites in Hunting-ton’s disease tissue (see Chapter by Osmand and co‐workers in this vol-ume). The structure of the tagged peptide used in experiments describedhere is shown in Fig. 5A.
The amyloid fibril elongation cycle comprises several steps, includingan initial ‘‘docking’’ step, followed by one (Esler et al., 2000) or more(Cannon et al., 2004) rearrangement (‘‘locking’’) steps that consolidate

[3] kinetics and thermodynamics of amyloid assembly 55
amyloid structure and create a new binding site for addition of the nextmonomer. If the locking steps are relatively slow compared with the dock-ing step, it is theoretically possible to count the number of growth sitesusing a tagged version of the monomer. Appropriately timed addition ofunlabeled monomer during the workup can stimulate additional cycles ofelongation and thus prevent the loss of label (Fig. 5B). Alternatively, itmay be possible to identify a temperature and binding conditions at whichthe docking step is favored, whereas the subsequent steps are not. Wefound that conducting the binding assay on polyGln aggregates at 25�
allowed us to observe saturable binding without the need for a ‘‘coldchase’’ with unlabeled polyGln (Bhattacharyya et al., 2005). It cannot beassumed that this will be true for other aggregate systems, however. UsingpolyGln aggregates prepared as described above, we conducted a prelimi-nary time course of binding at 37� (Fig. 5C). The observed binding is lost ifunlabeled monomer is left out of the workup buffers (Fig. 5C), consistentwith the unstable nature of peptide docked onto the growing end of thefibril. Consistent with the molecular specificity of amyloid elongation(O’Nuallain et al., 2004), significant binding does not occur using taggedA�(1–40) (Fig. 5C). Significant binding also does not occur using a taggedaggregation‐incompetent proline mutant of polyGln (Fig. 5C). Binding issaturable (Fig. 5D) and amounts to only a fraction of a percent of the totaltagged monomer in solution (Bhattacharyya et al., 2005).
With the determination of the molar concentration of aggregate elon-gation sites, it is possible to convert the pseudo‐first‐order elongationrate constant obtained in reactions seeded with these aggregates (seesection on elongat ion kinet ics ) into a second ‐ order rate constan t. Forexample, the rate constant for elongation (see below) of a Q47 peptide bya Q47 aggregate at 37� in PBS is in the range of 104 M�1s�1 (Bhattacharyyaet al., 2005).
Two phase kinetics associated with the dock and lock mechanism areobserved in microtiter plate elongation assays (Berthelier et al., 2001; Esleret al., 1997); because of the relative convenience of these assays, it istempting to attempt to determine growth site concentrations of aggregatesby extrapolation of the kinetic plot (Bhattacharyya et al., 2005). However,although relatively good agreement with suspension phase‐binding assayscan be obtained in some cases, more generally, the values obtained in themicroplate assay can be significantly lower than in the suspension phaseassay (A. K. Thakur, unpublished data), possibly because some sites aremasked in the binding to plastic. Our recommendation is to use the sus-pension phase assay described below rather than a microtiter plate–basedmethod.
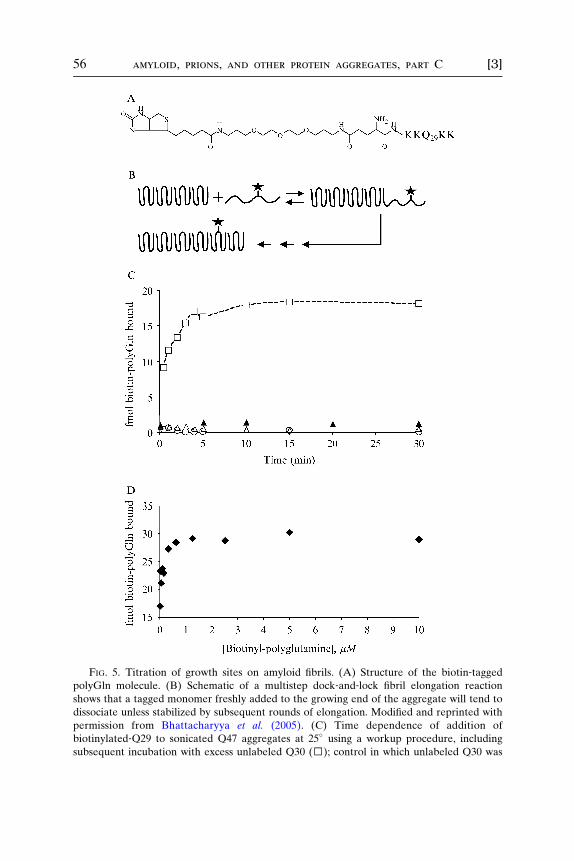
FIG. 5. Titration of growth sites on amyloid fibrils. (A) Structure of the biotin‐taggedpolyGln molecule. (B) Schematic of a multistep dock‐and‐lock fibril elongation reaction
shows that a tagged monomer freshly added to the growing end of the aggregate will tend to
dissociate unless stabilized by subsequent rounds of elongation. Modified and reprinted with
permission from Bhattacharyya et al. (2005). (C) Time dependence of addition of
biotinylated‐Q29 to sonicated Q47 aggregates at 25� using a workup procedure, including
subsequent incubation with excess unlabeled Q30 (□); control in which unlabeled Q30 was
56 amyloid, prions, and other protein aggregates, part C [3]

[3] kinetics and thermodynamics of amyloid assembly 57
Protocol
Determination of the Growth Site Concentration of an AggregateSuspension
1. Following purification, disaggregation, and ultracentrifugation steps,place 500 �l of different concentrations (0.05–10 �M) of biotin‐PEG‐Q29
(Fig. 5A) (obtained by custom synthesis from the Keck Center at YaleUniversity) in PBS in 1.5‐ml Eppendorf tubes.
2. Prepare an appropriate volume of a stock of a known concentrationof aggregates (e.g., 1.9 mg/ml).
3. From this suspension, deliver 200‐ng aggregates into each Eppen-dorf tube containing 500 �l biotin‐PEG‐Q29 from step 1. Vortex tubesgently at RT.
4. As a control, process 200‐ng aggregates in 500 �l PBS with nobiotinyl peptide. Data obtained from the control provide the background.
5. Immediately transfer all the tubes to a water bath set at 25�, andincubate for 30 min.
6. Immediately transfer all the tubes to a precooled 4� Eppendorfcentrifuge, and centrifuge at 14,000 rpm (20,400g) for 1 h. These conditionsshould be followed exactly in order to produce a tight pellet.
7. Gently remove the supernatant with the help of gel loading tips, andput 100 �l Eu‐streptavidin (use 1:1000 dilution from the solution providedby the manufacturer, PerkinElmer) to each pellet, vortex gently to resus-pend, and incubate at RT in the dark for 1 h. Because the pellet is notvisible, it is best to leave around 5% supernatant in each wash cycle toavoid disturbing the pellet. Signal can be lost if the pellet is disturbed.
8. Wash the pellet three times by centrifugation for 1 h at 4�, followedby careful decantation (leaving 5% of the supernatant each time) andresuspension in PBS.
9. Resuspend the pellet in 100 �l of enhancement solution (Perkin-Elmer). Keep the suspension for 10 min at RT in the dark.
10. Transfer the 100‐�l suspension from each tube to enzyme‐linkedimmunosorbent assay (ELISA) plate wells, and determine the europiumcounts by DELFIA/time‐resolved fluorescence (Diamandis, 1988) in aPerkinElmer/EG&G Wallac Victor2 microtiter plate reader.
left out (○); experiment adding biotin‐linked amyloid � (A�)(1–40) to the Q47 aggregate,
followed by incubation with unlabeled A� (▴); and experiment adding biotin‐linked,elongation incompetent proline mutant of polyGln, followed by incubation with unlabeled
version of the same peptide. Modified and reprinted with permission from Bhattacharyya et al.
(2005). (D) Concentration dependence of binding of biotinyl‐Q30 to Q47 aggregates in 30 min
at 25�. Reprinted with permission from Bhattacharyya et al. (2005).

58 amyloid, prions, and other protein aggregates, part C [3]
11. Convert counts to femtomoles of europium by using a standardcurve established with a calibrated europium solution (PerkinElmer).Convert femtomoles of europium to femtomoles of bound biotin‐peptideusing the manufacturer’s determination of europium atoms per streptavi-din molecule and an assumption of 1 M biotin bound per 1 M streptavidintetramer.
12. Subtract the background signal obtained in the control experiment(step 4).
13. Convert femtomoles of biotin‐peptide bound per 200‐ng aggregateinto femtomoles bound per microgram of aggregate.
14. This number can be used to calculate the molar concentration ofgrowth sites for a given aggregate preparation used in an elongation reaction.
15. Note that this protocol is for polyGln aggregates, for which it hasbeen validated that there is only one addition of biotinyl‐polyGln to eachgrowth site when incubation is at 25�. For other aggregate systems, until itis established to be unnecessary, it is strongly recommended that unlabeledpeptide chaser be added during the workup (Fig. 5B,C). This promoteselongation with unlabeled peptide and thus stabilizes the embeddedbiotinylated peptides.
Elongation Kinetics
The reversible addition of a monomer to a fibril to extend the fibril byone unit is shown in Fig. 6A. Assuming that there is no multiplication offibril growing ends over the course of the reaction attributable to secondarynucleation pathways (Ferrone, 1999), the forward elongation kinetics foran amyloid fibril in a seeded reaction are then described by the simplesecond‐order rate expression shown in Eq. (1), in which 2kþ is the second‐order rate constant. Again, assuming no change in fibril growth site con-centration over the course of the reaction, this expression reduces to onedescribing a pseudo‐first‐order reaction, as shown in Eq. (2), where c1kþ isthe pseudo‐first‐order rate constant. This rate constant is only valid for thereaction mixture in which it was determined, however, because the con-centration of growing ends normally is not known. If this concentration canbe determ ined (see section on titrat ion of fibril grow ing end s), the morerobust second‐order rate constant can be calculated according to Eq. (3).
Some amyloid fibrils are sufficiently unstable that their dissociation canbe easily observed. The dissociation rate is of the first order in fibril growthsites and is described by Eq. (4), where 2k� is the first‐order dissociationrate constant. This expression should be valid for early stages of fibrildissociation but only to the point where fibrils begin to dissolve completely

[3] kinetics and thermodynamics of amyloid assembly 59
and disappe ar; at that point, the concent ration of growth sites begins todecline. Ass uming an unc hanging concen tration of fibr ils, Eq. (4) reducesto the pseud o‐ zero ‐ order express ion sho wn in Eq. (5) , in which the pseudo ‐zero‐ ord er rate consta nt c0 k� is eq uivalent to the observed diss ociationrate and, again, is only valid for the fibril dissocia tion reaction studi ed.
The existence of a signifi cant fibr il disso ciation rate ha s two conse-quences. First, the obs erved fibril elongation rate will be the sum of theforward and revers e rates . Second, fibril formati on will arrive at a poin t ofdynamic equilibr ium descri bed by an equilibr ium consta nt that is the ratioof forward and revers e rate consta nts, as shown in Eq. (6) .
Elongatio n rate ¼ 2 kþ½ Fibril �½ Monome r � ð1Þ
El ongation rate ¼ c1 kþ½Mon omer � ð2Þ
2kþ ¼ c1 kþ=½ Fibril � ð3Þ
Dissociat ion rate ¼ 1 k�½Fibri l� ð4Þ
Dissoci ation rate ¼ c0 k� ð 5Þ
ka ¼ 2 kþ=
1 k� ¼ c1 kþ=
c0 k � ð 6Þ
In spite of the many technical diffic ulties and caveats, it is pos sible toobtain good approximations of these rate constants for robust fibril elon-gation and dissociation reactions. Experimental determination of such rateconstants is important for a number of reasons. As will be seen in thesection on nuclea r kinet ics analys is, knowl edge of the second ‐or der e lon-gation rate constant allows a fuller understanding of nucleation kineticsand a determination of the equilibrium constant controlling nucleation. Inaddition, the second‐order elongation rate constants describing homolo-gous and heterologous seeded elongation reactions are the key parametersfor making comparisons in cross‐seeding experiments, which, for example,can provide information on fibril structure (O’Nuallain et al., 2004).
Elongation kinetics can be monitored by a number of methods. ThTgenerally works well, especially for fibril formation reactions that go essen-tially to completion. Because ThT fluorescence varies with instrumentationconditions as well as fibril structure (Shivaprasad and Wetzel, 2006), theabsolute mass of fibrils associated with a particular ThT signal has to beindependently determined, for example, by also doing a sedimentationassay. For such reactions, the pseudo‐first‐order rate constant determined

FIG. 6. Amyloid elongation reactions. (A) Model for fibril growth by monomer addition;
(B) 25 �M amyloid � (A�)(1–40) seeded with 8.4% by weight of A�(1–40) fibrils and
60 amyloid, prions, and other protein aggregates, part C [3]

[3] kinetics and thermodynamics of amyloid assembly 61
for fibril elongation using ThT fluorescence is a composite of the elonga-tion and dissociation rate constants (O’Nuallain et al., 2005). An HPLCsedimentation assay focusing on the amount of monomer left unreacted atdifferent times allows determination of kinetics in more complex reactions,such as when one is monitoring the simultaneous aggregation of severalmolecules in a mixture of molecules (Bhattacharyya et al., 2006).
Experimental Results
Freshly disaggregated A�(1–40) was seeded with previously preparedfibrils and incubated in PBS at 37�. Aliquots were removed and subjectedto ThT analysis, and the results were plotted by first‐order kinetics treat-ment to determine c1kþ (Fig. 6B). This could equally well be monitoredand analyzed using the HPLC sedimentation assay to give the same rateconstant (O’Nuallain et al., 2005). After the reaction reached completion(a position of dynamic equilibrium), it was gently mixed and an aliquotwas diluted by a known amount into reaction buffer, being careful to keepthe total A� concentration above the previously determined Cr. The rateof dissociation, equivalent to the apparent c0kþ, was determined (Fig. 6C)using the HPL C sedimen tation assay (see section on HPL C sedim entationassay for amyloid transformations) and then multiplied by the dilutionfactor used to prepare this reaction in order to calculate the apparentdissociation rate constant for a fibril concentration equivalent to that inthe forward elongation reaction. An estimate of the elongation equilibriumconstant of 3.8 �M was obtained from the c1kþ and c0k� values substitutedinto Eq. (6) (O’Nuallain et al., 2005).
In another example of the use of elongation kinetics analysis, to facili-tate the analysis of polyGln nucleation kinetics of a Q47 peptide, a Q47
aggregate elongation reaction was carried out using an aliquot of a stocksuspension of Q47 aggregate previously grown in PBS at 37� and titrated forgrowth sit e concent ration as de scribed in the section on titration of fibrilgrowing ends. Aggregates were diluted into a solution of freshly disaggre-gation Q47 monomers in PBS, and the reaction was incubated at 37�.
monitored by thioflavin T (ThT) fluorescence (inset: pseudo‐first‐order plot of initial rate).
Reprinted with permission from O’Nuallain et al. (2005). (C) Equilibrium reaction mixture
from the above reaction was diluted 25‐fold and incubated at 37�, and the A�(1–40) released
was monitored by high‐performance liquid chromatography (HPLC) sedimentation assay
(inset: initial rate). Reprinted with permission from O’Nuallain et al. (2005). (D) Pseudo‐first‐order elongation of Q47 aggregates by monomeric Q47 in phosphate‐buffered saline (PBS) at
37�, which was monitored by the HPLC sedimentation assay. Reprinted with permission from
Bhattacharyya et al. (2005).

62 amyloid, prions, and other protein aggregates, part C [3]
Aliquots were removed and analyzed by centrifugation, followed by HPLCanalysis of the supernatant, yielding the aggregation kinetics profileshown in Fig. 6D. The pseudo‐first‐order rate constant for elongation,c1kþ, was determined to be 4.7 � 10�6 s�1. Dividing this value by theconcentration of fibril growth sites available in the seeded reaction yieldeda second‐order elongation rate constant, 2kþ, equal to 11,400 M�1s�1
(Bhattacharyya et al., 2005).
Protocol
Determination of the Pseudo‐First‐Order Rate Constant c1kþ
1. Prepare aggregates of Q47 at 37� in PBS, and determine the weightconcentration as described above.
2. If desired, sonicate the aggregate stock suspension using a probesonicator five times with 30‐s pulses, with each pulse followed by a 1‐mindelay, on ice. If required, preserve some of the sonicated stock forindependent determination of growth site concentration as describedabove. Because the number of growth sites in an aggregate, includingsonicated aggregates, can decay on storage, it is best to conduct allmeasurements on a particular aggregate in the same time frame or to storethe aggregates at �80� after snap‐freezing.
3. Prepare disaggregated monomers of Q47 peptide as described in thesection on disag gregation of pep tides . Prep are a volume (chosen toprovide the desired number of data points) of a 20‐�M solution ofdisaggregated peptide in PBS in an Eppendorf or Falcon tube, andpreincubate at 37�. Add 5% weight (fibril seeds to monomer) of sonicatedaggregates, and incubate without agitation at 37� to initiate elongation.
4. At different time intervals, remove a 100‐�l aliquot from the gentlymixed reaction and centrifuge at 14,000 rpm for 30 min at 4� in a 5417REppendorf centrifuge. Transfer 70 �l of the supernatant to an autosamplervial, and add formic acid to give 20% formic acid. Inject 50 �l ofsupernatant from each processed time point. If injection is immediate (noautosampler), the formic acid can be eliminated.
5. Determine the concentration of Q47 monomer at each time pointfrom the HPLC trace by reading the polyGln mass from the standard curve(see sect ion on HPLC sediment atio n assay for amyloid trans formatio ns ),converting to moles using the molecular weight of the Q47 peptide,correcting for volume manipulations during assay, and calculating themolar concentration.
6. Plot the data according to a first‐order kinetic model, and determinec1kþ.

[3] kinetics and thermodynamics of amyloid assembly 63
Nucleation Kinetics Analysis
The assumed high degree of structural order of amyloid fibrils, plus theobservation of a lag phase in the spontaneous growth of fibrils frommonomeric proteins, led to speculation that fibril growth might bemediated by a process of nucleation‐dependent polymerization (Jarrettand Lansbury, 1992) similar to how protein crystallization is thought tobe initiated. As pointed out by Ferrone (Ferrone, 1999), however, thepresence of a lag phase, even one that can be eliminated by providingexogenous seeds, is not sufficient to prove nucleated growth by a monomeraddition mechanism. In fact, for many amyloids, the situation must bemore complex, because significant amounts of nonfibrillar aggregates areobserved to form relatively rapidly, often coinciding with the observedlag phase in the development of amyloid‐dependent ThT fluorescence.These have been implicated in alternative mechanisms to explain amyloidnucleation and growth (Harper et al., 1997; Serio et al., 2000).
The nature of the nucleation event in such mechanisms is not clear.According to one formulation, nucleation involves the association ofseveral protofibrils to form a nascent fibril with a much enhanced ability,compared with the isolated protofibrils, to grow (Harper et al., 1997). Incontrast, others have obtained data for some amyloid fibril formationreactions more consistent with models, in which the nonamyloid aggregatesformed early in spontaneous amyloid formation reactions are off‐pathwayassemblies (Collins et al., 2004; Goldsbury et al., 2005; Gosal et al., 2005),such that their role in amyloid formation is to deplete reversibly theenvironment of monomers. The question of whether oligomers are on‐pathway or off‐pathway would appear to be experimentally approachable,albeit challenging. For the purpose of this chapter, the discussion of theanalysis of nucleation kinetics will be limited to the formation of amyloid‐like (Chen et al., 2002a) aggregates from simple polyGln peptides, which isan apparently relatively rare case of amyloid formation that does notinvolve the early formation of nonamyloid aggregates.
Determining this mechanism involves the collection of aggregation datarepresenting the earliest portions of the spontaneous aggregation reaction.A variety of methods can be used, each with advantages and disadvantages.In this section, we show the application of data obtained using the HPLC‐linked sedimentation assay discussed above. The data are then analyzed byequations describing nucleated growth by monomer addition. A number ofapproaches can be taken to model such data (Ferrone, 1999). Here, we usean analytic approach based on a ‘‘thermodynamic’’ model for nucleation,in which the nucleus is considered to be less stable than the monomerground state and, in fact, the least stable species on the aggregation

FIG. 7. Nucleation kinetics analysis. (A) General mechanism for the nucleation phase of a
nucleated growth polymerization reaction, based on a thermodynamic, pre‐equilibrium model
for nucleation (M ¼ monomer; N* ¼ aggregation nucleus; Nþ1 and Nþ2, elongated nuclei/
64 amyloid, prions, and other protein aggregates, part C [3]

[3] kinetics and thermodynamics of amyloid assembly 65
reaction profile (Ferrone, 1999). This is illustrated in the reaction schemeshown in Fig. 7A. The kinetics expression for nucleation kinetics thatcomes out of this scheme is shown in Eq. (7), where � is the molar con-centration of monomers that has been converted to aggregates at time t,2kþ is the second‐order elongation rate constant for nucleus elongation andaggregate elongation (which are assumed to be identical), c is the molarconcentration of monomers at the start of the reaction, n* is the criticalnucleus (the number of monomers that associate together to form thenucleus), and Kn* is the nucleation equilibrium constant. Ideally, a fulldescription of the nucleation kinetics will include determination of thenucleation equilibrium constant, the critical nucleus, and the elongationsecond‐order rate constant; together, these control the nucleation andoverall aggregation reaction.
D ¼ f1=2gð2kþ2ÞðKn� Þ cðn�þ2Þt2 ð7Þ
logðslope AÞ ¼ log½f1=2gð2kþ2ÞðKn� Þ� þ ðn� þ 2Þ logðcÞ ð8Þ
x-intercept ¼ log½f1=2gð2kþ2ÞðKn� Þ� ð9Þ
Experimental Results
The polyGln aggregation passes the first two tests of a nucleated growthpolymerization reaction: (1) it exhibits a lag phase that (2) is shortened orabrogated when a small amount of previously formed aggregate is includedin the reaction mixture (Chen et al., 2002a). Further tests are required,however, before the mechanism is convincingly established. These aredescribed here. Equation (7) predicts that in a nucleated growth polymeri-zation reaction, the increase in the amount of monomer converted intoaggregate should give a linear plot with respect to time2 with a slope(slope A) equal to f1=2gð2kþ2ÞðKn� Þ cðn�þ2Þ (Chen et al., 2002b); Fig. 7B(Bhattacharyya et al., 2005) shows that for a Q47 peptide, this is indeed thecase. Equation (8), derived from Eq. (7), further predicts that a log‐log plotof the slopes of these time2 plots with respect to the starting monomerconcentrations should give a straight line of positive slope (i.e., an increase
nascent aggregates). (B) Representative time2 plots of the early portion of Q47 aggregation in
phosphate‐buffered saline (PBS), 37�, at two different concentrations (▴, 36 �M, left y‐axis;●, 105 �M, right y‐axis). (C) Log‐log plot of the slopes of the time2 plots versus Q47
concentration. (D) Mechanism of nucleated growth polymerization of amyloid‐like polyGln
aggregates, featuring a monomeric nucleus. Figures B–D reprinted with permission from
Bhattacharyya et al. (2005).

66 amyloid, prions, and other protein aggregates, part C [3]
in aggregation with increasing concentration) (Chen et al., 2002b); Fig. 7C(Bhattacharyya et al., 2005) shows that this is also the case.
These additional tests not only confirm the mechanism as being nucleatedgrowth with monomer addition but provide experimental parameters thatprovide key details of the nucleation mechanism. Thus, the slope of the log‐log plot (Fig. 7C) is equal to n* þ 2. Classically, n* has been visualized as aninteger greater than 1. In contrast, n* for polyGln aggregation, as determinedfrom plots like that shown in Fig. 7C, consistently (Bhattacharyya et al., 2005,2006; Chen et al., 2002b; Thakur and Wetzel, 2002) gives values close to 1.That is, nucleus formation in polyGln aggregation involves the formationfrom bulk phase monomer of a highly unfavorable folded form of themonomer required for aggregation initiation (Fig. 7D) (Chen et al., 2002b).The x‐intercept of the log‐log plot is an equally important parameter contain-ing the second‐order rate constants for elongation of the nucleus and matureaggregate, along with the nucleation equilibrium constant Kn*. Making theassumption that the two elongation rate constants are identical, the expres-sion reduces to that shown in Eq. (9). If one can independently obtain anexperimental value for the second‐order elongation rate constant 2kþ for thetype of aggregate formed early in the Q47 aggregation process, Kn* can thenbe calculated from 2kþ and the x‐intercept using Eq. (9). Our ability todetermine 2kþ by determining both c1 kþ (see section on HPLC sedimenta-tion assay for amyloid transformations) and the concentration of aggregationgrowth sites in the aggregate (see section on titration of fibril growing ends)allows us to solve Eq. (9) for Kn*. For Q47 aggregation in PBS at 37�, thecalculated Kn* ¼ 2.6 � 10�9 (Bhattacharyya et al., 2005).
Protocol
Nucleation Kinetics Analysis
1. Make at least five different concentrations (e.g., 40, 20, 10, 5, and 2.5�M) of freshly disaggregated polyGln in PBS as described in earlierprotocols, and set up aggregation reactions at 37� in Falcon tubes.
2. For each time point, remove a 100‐�l aliquot and centrifuge at14,000 rpm (20,400g) for 30 min at 4�. Carefully remove 70 �l of thesupernatant, and determine the concentration of residual monomer usingthe HPL C assay (see sect ion on HPLC sed imentation assay for amyl oidtransformations). Strive to obtain as much data as possible for the first20% of the aggregation reaction final amplitude. It may be helpful to usethe ThT assay to follow the reaction time course semiquantitatively in realtime so as to judge better the number and frequency of time pointsrequired for the HPLC assay.

[3] kinetics and thermodynamics of amyloid assembly 67
3. For the data analysis, tabulate all the data for each reaction in termsof monomer concentration (moles) and reaction time (seconds).
4. Using only the portion of the data covering the initial 20% (or less)of the reaction amplitude, and construct plots of remaining monomerconcentration (moles) versus time2 (s2) for each reaction.
5. Calculate slopes of the t 2 plots for all concentrations.6. Plot the log of the starting concentrations (moles) of each reaction in
the series versus the log of the t 2 plot slopes, and fit to a straight line. Fromthe slope of this line, calculate n* using the expression ‘‘slope ¼ n* þ 2.’’
7. From the x‐intercept of the log‐log plot, calculate the nucleationequilibrium constant (Kn*) using Eq. (9) and the second‐order elongationrate constant value (2kþ ) obtai ned as de scribed in the sect ion onelongation kinetics.
8. It should be noted that although we defined � in Eq. (7) as themolar concentration of monomers converted into aggregates at time t, thedata analysis shown here consistently plots the molar concentration ofunaggregated monomer. This is legitimate only because [soluble mono-mer] ¼ [soluble monomer]t¼0 � �, such that the absolute value of theslope is the same for either treatment of the data.
9. The centrifugation conditions recommended in this protocol arevalid for reactions in which there is essentially no development of smalloligomeric aggregates in the early stages of the aggregation reaction. Thishypothesis should be rigorously confirmed to validate the use of theseequations. For example, one can compare the amount of monomerremaining in the supernatant of low‐speed (e.g., 20,400g for 30 min) andhigh‐speed (e.g., 350,000g for 3 h) centrifugation runs at several time pointsin the aggregation kinetics; mature aggregates as formed in even the earlyphases of polyGln aggregation will pellet at 20,400g (Chen et al., 2002b),whereas some A�(1–40) early aggregates require 350,000g (Williams et al.,2005). An additional test is whether the earliest formed aggregates aregood seeds for elongation of monomer solutions. If they are not, theequations used here, which were specifically derived for ensemble data fornucleated growth with monomer addition, are not valid.
Thermodynamics of Amyloid Fibril Elongation
As discussed in the section on elongation kinet ics , at least some amy-loid fibril formation reactions arrive at an endpoint at which there remainsa measurable amount of monomer remaining in solution. Although this isconsistent with an endpoint represented by a dynamic equilibrium betweenmonomer additions and dissociations, steps must be taken to confirm that

68 amyloid, prions, and other protein aggregates, part C [3]
the residual monomer does not result from an artifact. If further testsconfirm the equilibrium, theKa describing it can be converted to a standardfree energy describing the fibril elongation reaction. This value corre-sponds to the difference in free energy between fibril plus monomer, beforethe addition step, and fibril elongated by one additional monomer, afteraddition. Ka is simply the reciprocal of Cr, the concentration of monomermeasured when fibril formation has reached equilibrium. Figure 6A showsa single, reversible step in the fibril elongation reaction. Because, nearequilibrium, fibril molar concentration does not change as the fibril elon-gates by one monomer (and because the fibrils differing in length by onemonomer differ negligibly in activity coefficients), the fibril concentrationterms in the expression for Ka cancel, leaving only the concentration ofmonomer, which, at equilibrium, is equal to Cr:
Ka ¼ ½Fibrilnþ1�=½Fibriln�½Monomer� ¼ 1=½Monomer� ¼ 1=Cr ð10Þ
One important use of the derived �G values for amyloid fibril elonga-tion is the derivation of��G values reflecting the effect of point mutationson fibril elongation energetics. As in the parallel derivation of ��Gfolding
values associated with mutational changes in folding stability of globularproteins, there are a number of caveats associated with this interpretation(Williams et al., 2006). For example, formally, the��G is a measure of thedifference in net free energy change between reactants and products withand without mutation, such that the value will reflect mutational effects notonly on fibril stability but on monomer stability. In addition, although it isdesirable to interpret the ��G value in terms of structural effects local tothe site of mutation, it is possible for the mutational effect to be propagateddistally from the site of mutation, allowing for compensation and under-estimation of the local destabilizing effect of the mutation in some cases.Much more work will be required to probe the utility of these fibrilelongation �G and ��G values, but preliminary results suggest that thesevalues, if interpreted conservatively, can provide significant insights intoamyloid structure and the energetics of amyloid formation (Williams et al.,2006).
Experimental Results
Whether fibril formation by A�(1–40) takes place spontaneously fromdisaggregated monomer or via seeded elongation, the reaction in PBS at37� arrives at a plateau value in the range of 0.6–1.0 �M monomer. Theresidual monomer is chemically unchanged and, in fact, is capable offurther fibril growth if concentrated and seeded with A� fibrils (O’Nuallainet al., 2005). The fibrils at plateau also are active seeds for further A�(1–40)

[3] kinetics and thermodynamics of amyloid assembly 69
elongation. In addition, fibrils diluted into PBS dissociate to an equilibriumposition with the same Cr (O’Nuallain et al., 2005). Both the Ka estimatedfrom the ratio of elongation and dissociation rate constants and the Ka
propagated from microscopic forward and reverse rate constants deter-mined by surface plasmon resonance (Cannon et al., 2004) are in goodagreement with the Ka from the Cr value (O’Nuallain et al., 2005).
A�(1–40) fibril formation reactions allowed to incubate for extendedperiods (longer than 1 week) appear to undergo a further assembly reac-tion, perhaps involving fibril superassociation, that leads to a substantialfurther decrease in the measured monomer concentration (O’Nuallainet al., 2005). This further assembly is fragile, however, because the Cr fordissociation of these aged fibrils is identical (�0.8 �M) to that of ‘‘fresh’’fibrils if the aged fibrils are vortexed to initiate the dissociation reaction(O’Nuallain et al., 2005). We assume that the Cr value at the initial plateaurepresents the stability of individual fibrils or small clusters of fibrils and istherefore a better indication of the energetics of structure formation withinthe individual fibril. It is thus important to be able to distinguish this initialplateau and not to be confused by the second phase of further diminutionof monomer concentration. To make observation of this initial plateaumore straightforward, we grow fibrils using a relatively high level of seeds,which eliminates the lag time and promotes a rapid approach to theequilibrium position (O’Nuallain et al., 2005). When analyzing the stabilityof fibrils from mutant peptides, seeding with wild‐type fibrils may also helpto bias fibril structure toward the wild‐type conformer, allowing for cleanerinterpretation of the derived ��G (Williams et al., 2006).
Cr‐derived �G and ��G values have been used to quantify the effectson the A�(1–40) fibril stability of proline (Williams et al., 2004) and alanine(Williams et al., 2006) replacements. In addition, the effect of side chaincharge and hydrophobicity has been explored by determining the Cr valuesfor fibril stability of a series of Cys point mutants alkylated with eitheriodoacetic acid or methyl iodide (Shivaprasad and Wetzel, 2006). Thecompatibility of disulfide bonds engineered into the fibril has also beenassessed by Gs derived from Cr determination (Shivaprasad and Wetzel,2004) (see Chapter 10 by Shivaprasad and Wetzel in this volume). Cr‐derived �G and ��G values have also been used to assess the effect ofa C‐terminal oligoproline sequence on fibril stability, an effect that appearsto be attributable to an effect on the free energy of the monomer poolrather than on the free energy of the fibril (Bhattacharyya et al., 2006).
Support for the significance of such ��G values comes from a compar-ison of the energetic consequences to fibril stability and globular proteinstability by identical Ala replacements. The similarity of effects of muta-tions within the parallel �‐sheets of an amyloid fibril (Williams et al., 2006)

70 amyloid, prions, and other protein aggregates, part C [3]
and the small, globular protein G�1 (Merkel et al., 1999) suggest that thefibril ��G values obtained as described here are valid. At the same time,proline replacements within the A�‐sheet (Williams et al., 2004) are some-what less devastating than expected based on G�1 studies, perhaps becauseof the formation of additional stabilizing backbone H‐bonds within thefibril in response to proline mutations (Williams et al., 2004).
Protocol
Seeded and Unseeded Quiescent Growths of Ab(1–40) to Calculate theCritical Concentration
1. For both seeded and unseeded growth of A�(1–40) fibrils, 20–60 �Mfresh ly disag gregat ed A � (1–40) is prepared in 1� PBS contain ing 0.0 5%sodium azide (see section on disagg regation of pep tides ).
2. Confirm the concentration of the PBS solution of A�(1–40)obtained after disaggregation, by diluting 20 �l A�(1–40) sample with100 �l 1% TFA aqueous solution and analyzing 100 �l by the HPLC assayto determ ine the mi crogra ms of A � pe ptide (see sect ion on HPL C sedi-mentation assay for amyloid transformations). The starting concentrationis adjusted as desired using PBS.
3. Appropriate volumes of the A�(1–40) are incubated undisturbedat 37� with and without the addition of 0.1% by weight of wild‐type A�(1–40)‐sonicated seed fibrils.
4. Time points are taken periodically for the HPLC sedimentationassay and ThT assay during the course of growth. Depending on the A�mutant, the seeded reaction should proceed quickly, with little or no lagtime. Once the reaction appears to be complete by a lack of furtherincreases in the ThT signal, aliquots are analyzed daily by the HPLCsedimentation assay to confirm that the remaining level of monomer is nolonger dropping. This plateau value in the residual monomer concentrationis the Cr.
Concluding Remarks
Many technically sophisticated methods have been applied to the studyof protein aggregation reactions and have provided valuable information.Because many of these methods are more suited for analysis of aggregatesthan quantitation of the small molecular‐weight pool of starting material,they are of limited use in putting together quantitative descriptions of someaspects of aggregation reactions, such as the early phases of aggregationand equilibrium positions at the reaction endpoint, where monomer con-centrations are low. Quantitation by HPLC is reasonably sensitive and has

[3] kinetics and thermodynamics of amyloid assembly 71
the added major advantage of being able to quantify multiple chemicalspecies independently in a mixture of peptides, whether this mixture isarranged by design or is the result of chemical decay of the startingmaterial. In the context of other methods done in parallel, sedimentationresults can also provide information on the existence of multiple aggre-gated species on (or off) the reaction coordinate. The power of this simpleset of methods is illustrated in the examples described here, which includethe determination of reliable macroscopic rate constants, including truesecond‐order rate constants for elongation, nucleation kinetics analysis,and the determination of equilibrium constants and derived free energychanges associated with fibril nucleation and elongation reactions. Thesetools should allow the determination of reaction parameters for otheramyloid systems in addition to A�(1–40) and polyGln, which will help toimprove our understanding of the general features of amyloid structure andassembly.
Acknowledgment
This work was supported by grants R01 AG18416 and R01 AG19322 from the National
Institutes of Health.
References
Andreu, J. M., and Timasheff, S. N. (1986). The measurement of cooperative protein self‐assembly by turbidity and other techniques. Methods Enzymol. 130, 47–59.
Berthelier, V., Hamilton, J. B., Chen, S., and Wetzel, R. (2001). A microtiter plate assay for
polyglutamine aggregate extension. Anal. Biochem. 295, 227–236.Bhattacharyya, A. M., Thakur, A., and Wetzel, R. (2005). Polyglutamine aggregation nuclea-
tion: Thermodynamics of a highly unfavorable protein folding reaction. Proc. Natl. Acad.
Sci. USA 102, 15400–15405.
Bhattacharyya, A. M., Thakur, A. K., Hermann, V. M., Thiagarajan, G., Williams, A. D.,
Chellgren, T. P., Creamer, T. P., and Wetzel, R. (2006). Oligoproline effects on
polyglutamine conformation and aggregation. J. Mol. Biol. 355, 524–535.
Bucciantini, M., Giannoni, E., Chiti, F., Baroni, F., Formigli, L., Zurdo, J., Taddei, N.,
Ramponi, C. M., Dobson, C. M., and Stefani, M. (2002). Inherent toxicity of aggregates
implies a common mechanism for protein misfolding diseases. Nature 416, 507–511.
Cannon, M. J., Williams, A., Wetzel, R., and Myszka, D. G. (2004). Kinetic analysis of A�
fibril elongation. Anal. Biochem. 328, 67–75.Chen, S., Berthelier, V., Hamilton, J. B., O’Nuallain, B., and Wetzel, R. (2002a). Amyloid‐like
features of polyglutamine aggregates and their assembly kinetics. Biochemistry 41, 7391–
7399.
Chen, S., Berthelier, V., Yang, W., and Wetzel, R. (2001). Polyglutamine aggregation behavior
in vitro supports a recruitment mechanism of cytotoxicity. J. Mol. Biol. 311, 173–182.
Chen, S., Ferrone, F., and Wetzel, R. (2002b). Huntington’s disease age‐of‐onset linked to
polyglutamine aggregation nucleation. Proc. Natl. Acad. Sci. USA 99, 11884–11889.

72 amyloid, prions, and other protein aggregates, part C [3]
Chen, S., and Wetzel, R. (2001). Solubilization and disaggregation of polyglutamine peptides.
Protein Sci. 10, 887–891.Collins, S. R., Douglass, A., Vale, R. D., and Weissman, J. S. (2004). Mechanism of prion
propagation: Efficient amyloid growth in the absence of oligomeric intermediates. PLoS 2,
1582–1590.
Colon, W. (1999). Analysis of protein structure by solution optical spectroscopy. Methods
Enzymol. 309, 605–632.
DePace, A. H., and Weissman, J. S. (2002). Origins and kinetic consequences of diversity in
Sup35 yeast prion fibers. Nat. Struct. Biol. 9, 389–396.Diamandis, E. P. (1988). Immunoassays with time‐resolved fluorescence spectroscopy:
Principles and applications. Clin. Biochem. 21, 139–150.
Esler, W. P., Stimson, E. R., Ghilardi, J. R., Felix, A. M., Lu, Y. A., Vinters, H. V.,
Mantyh, P. W., and Maggio, J. E. (1997). A beta deposition inhibitor screen using synthetic
amyloid. Nat. Biotechnol. 15, 258–263.
Esler, W. P., Stimson, E. R., Jennings, J. M., Vinters, H. V., Ghilardi, J. R., Lee, J. P.,
Mantyh, P. W., and Maggio, J. E. (2000). Alzheimer’s disease amyloid propagation by a
template‐dependent dock‐lock mechanism. Biochemistry 39, 6288–6295.Evans, K. C., Berger, E. P., Cho, C.‐G., Weisgraber, K. H., and Lansbury, P. T., Jr. (1995).
Apolipoprotein E is a kinetic but not a thermodynamic inhibitor of amyloid formation:
Implications for the pathogenesis and treatment of Alzheimer disease. Proc. Natl. Acad.
Sci. USA 92, 763–767.
Falk, R. H., Comenzo, R. L., and Skinner, M. (1997). The systemic amyloidoses [see
comments]. N. Engl. J. Med. 337, 898–909.
Ferrone, F. (1999). Analysis of protein aggregation kinetics. Methods Enzymol. 309, 256–274.Franks, F. (1993). Storage stabilization of proteins. In ‘‘Protein Biotechnology: Isolation,
Characterization and Stabilization’’ (F. Franks, ed.), pp. 489–531. Humana Press, New York.
Goldsbury, C., Frey, P., Olivieri, V., Aebi, U., and Muller, S. A. (2005). Multiple assembly
pathways underlie amyloid‐beta fibril polymorphisms. J. Mol. Biol. 352, 282–298.Gosal, W. S., Morten, I. J., Hewitt, E. W., Smith, D. A., Thomson, N. H., and Radford, S. E.
(2005). Competing pathways determine fibril morphology in the self‐assembly of beta2‐microglobulin into amyloid. J. Mol. Biol. 351, 850–864.
Harper, J. D., Lieber, C. M., and Lansbury, P. T., Jr. (1997). Atomic force microscopic
imaging of seeded fibril formation and fibril branching by the Alzheimer’s disease
amyloid‐beta protein. Chem. Biol. 4, 951–959.
Heller, J., Kolbert, A. C., Larsen, R., Ernst, M., Bekker, T., Baldwin, M., Prusiner, S. B.,
Pines, A., and Wemmer, D. E. (1996). Solid‐state NMR studies of the prion protein H1
fragment. Protein Sci. 5, 1655–1661.
Hilbich, C., Kisters‐Woike, B., Reed, J., Masters, C. L., and Beyreuther, K. (1992).
Substitutions of hydrophobic amino acids reduce the amyloidogenicity of Alzheimer’s
disease bA4 peptides. J. Mol. Biol. 228, 460–473.
Howlett, D. R., Jennings, K. H., Lee, D. C., Clark, M. S., Brown, F., Wetzel, R., Wood, S. J.,
Camilleri, P., and Roberts, G. W. (1995). Aggregation state and neurotoxic properties of
Alzheimer beta‐amyloid peptide. Neurodegeneration 4, 23–32.
Hurle, M. R., Helms, L. R., Li, L., Chan, W., and Wetzel, R. (1994). A role for destabilizing
amino acid replacements in light chain amyloidosis. Proc. Natl. Acad. Sci. USA 91, 5446–
5450.
Ignatova, Z., and Gierasch, L. M. (2005). Aggregation of a slow‐folding mutant of a beta‐clamprotein proceeds through a monomeric nucleus. Biochemistry 44, 7266–7274.

[3] kinetics and thermodynamics of amyloid assembly 73
Jarrett, J. T., and Lansbury, P. T., Jr. (1992). Amyloid fibril formation requires a chemically
discriminating nucleation event: Studies of an amyloidogenic sequence from the bacterial
protein OsmB. Biochemistry 31, 12345–12352.
Jones, E. M., and Surewicz, W. K. (2005). Fibril conformation as the basis of species‐ andstrain‐dependent seeding specificity of Mammalian prion amyloids. Cell 121, 63–72.
Klunk, W. E., Jacob, R. F., and Mason, R. P. (1999). Quantifying amyloid by Congo red
spectral shift assay. Methods Enzymol. 309, 285–305.
Kopito, R. R. (2000). Aggresomes, inclusion bodies and protein aggregation. Trends Cell.
Biol. 10, 524–530.LeVine, H. (1999). Quantification of �‐sheet amyloid fibril structures with thioflavin T.
Methods Enzymol. 309, 274–284.
Lomakin, A., Benedek, G. B., and Teplow, D. B. (1999). Monitoring protein assembly using
quasielastic light scattering spectroscopy. Methods Enzymol. 309, 429–459.Martin, J. B. (1999). Molecular basis of the neurodegenerative disorders [published erratum
appears in N. Engl. J. Med. [1999] 341, 1407]. N. Engl. J. Med. 340, 1970–1980.
McCutchen, S. L., Colon, W., and Kelly, J. W. (1993). Transthyretin mutation Leu‐55‐Prosignificantly alters tetramer stability and increases amyloidogenicity. Biochemistry 32,12119–12127.
Meijer, A. J., and Codogno, P. (2004). Regulation and role of autophagy in mammalian cells.
Int. J. Biochem. Cell. Biol. 36, 2445–2462.Merkel, J. S., Sturtevant, J. M., and Regan, L. (1999). Sidechain interactions in parallel beta
sheets: The energetics of cross‐strand pairings. Structure Fold Des. 7, 1333–1343.
Merlini, G., and Bellotti, V. (2003). Molecular mechanisms of amyloidosis. N. Engl. J. Med.
349, 583–596.Mitraki, A., and King, J. (1989). Protein folding intermediates and inclusion body formation.
Biotech. 7, 690–697.
Mulkerrin, M. G., and Wetzel, R. (1989). pH dependence of the reversible and irreversible
thermal denaturation of � interferons. Biochem. 28, 6556–6561.Neurath, H., Greenstein, J. P., Putnam, F. W., and Erickson, J. O. (1944). The chemistry of
protein denaturation. Chem. Rev. 34, 157–265.
Nichols, M. R., Moss, M. A., Reed, D. K., Cratic‐McDaniel, S., Hoh, J. H., and
Rosenberry, T. L. (2005). Amyloid‐beta protofibrils differ from amyloid‐beta aggregates
induced in dilute hexafluoroisopropanol in stability and morphology. J. Biol. Chem. 280,
2471–2480.
Nilsson, M. R. (2004). Techniques to study amyloid fibril formation in vitro. Methods 34, 151–160.
O’Nuallain, B., Shivaprasad, S., Kheterpal, I., and Wetzel, R. (2005). Thermodynamics of
abeta(1‐40) amyloid fibril elongation. Biochemistry 44, 12709–12718.
O’Nuallain, B., Williams, A. D., Westermark, P., and Wetzel, R. (2004). Seeding specificity in
amyloid growth induced by heterologous fibrils. J. Biol. Chem. 279, 17490–17499.
Petkova, A. T., Leapman, R. D., Guo, Z., Yau, W. M., Mattson, M. P., and Tycko, R. (2005).
Self‐propagating, molecular‐level polymorphism in Alzheimer’s �‐amyloid fibrils. Science
307, 262–265.
Serio, T. R., Cashikar, A. G., Kowal, A. S., Sawicki, G. J., Moslehi, J. J., Serpell, L.,
Arnsdorf, M. F., and Lindquist, S. L. (2000). Nucleated conformational conversion and the
replication of conformational information by a prion determinant. Science 289, 1317–1321.Sharma, D., Shinchuk, L. M., Inouye, H., Wetzel, R., and Kirschner, D. A. (2005). Poly-
glutamine homopolymers having 8–45 residues form slablike beta‐crystallite assemblies.
Proteins 61, 398–411.

74 amyloid, prions, and other protein aggregates, part C [3]
Shivaprasad, S., and Wetzel, R. (2004). An intersheet packing interaction in A� fibrils mapped
by disulfide crosslinking. Biochemistry 43, 15310–15317.Shivaprasad, S., and Wetzel, R. (2006). Scanning cysteine mutagenesis analysis of A�(1‐40)
amyloid fibrils. J. Biol. Chem. 281, 993–1000.
Stefani, M., and Dobson, C. M. (2003). Protein aggregation and aggregate toxicity: New
insights into protein folding, misfolding diseases and biological evolution. J. Mol. Med. 81,
678–699.
Tanaka, M., Chien, P., Naber, N., Cooke, R., and Weissman, J. S. (2004). Conformational
variations in an infectious protein determine prion strain differences. Nature 428, 323–328.Thakur, A., and Wetzel, R. (2002). Mutational analysis of the structural organization of
polyglutamine aggregates. Proc. Natl. Acad. Sci. USA 99, 17014–17019.
Wetzel, R. (1994). Mutations and off‐pathway aggregation. Trends Biotechnol. 12, 193–198.
Wetzel, R. (2005). Protein folding and aggregation in the expanded polyglutamine repeat
diseases. In ‘‘The Protein Folding Handbook. Part II.’’ (J. Buchner and T. Kiefhaber, eds.),
pp. 1170–1214. Wiley‐VCH, Weinheim.
Williams, A. D., Portelius, E., Kheterpal, I., Guo, J. T., Cook, K. D., Xu, Y., and Wetzel, R.
(2004). Mapping abeta amyloid fibril secondary structure using scanning proline
mutagenesis. J. Mol. Biol. 335, 833–842.
Williams, A. D., Sega, M., Chen, M., Kheterpal, I., Geva, M., Berthelier, V., Kaleta, D. T.,
Cook, K. D., and Wetzel, R. (2005). Structural properties of A� protofibrils stabilized by a
small molecule. Proc. Natl. Acad. Sci. USA 102, 7115–7120.
Williams, A. D., Shivaprasad, S., and Wetzel, R. (2006). Alanine scanning mutagenesis of A�
(1‐40) amyloid fibril stability. J. Mol. Biol. in press.
Wood, S. J., Maleeff, B., Hart, T., and Wetzel, R. (1996). Physical, morphological and
functional differences between pH 5.8 and 7.4 aggregates of the Alzheimer’s peptide Ab.
J. Mol. Biol. 256, 870–877.
Yamaguchi, K., Takahashi, S., Kawai, T., Naiki, H., and Goto, Y. (2005). Seeding‐dependentpropagation and maturation of amyloid fibril conformation. J. Mol. Biol. 352, 952–960.
Yang, W., Dunlap, J. R., Andrews, R. B., and Wetzel, R. (2002). Aggregated polyglutamine
peptides delivered to nuclei are toxic to mammalian cells. Hum. Mol. Genet. 11, 2905–
2917.
Zagorski, M. G., Yang, J., Shao, H., Ma, K., Zeng, H., and Hong, A. (1999). Methodological
and chemical factors affecting amyloid‐� amyloidogenicity. Methods Enzymol. 309, 189–
204.
Zhang, S., Iwata, K., Lachenmann, M. J., Peng, J. W., Li, S., Stimson, E. R., Lu, Y.,
Felix, J. E., Maggio, J. E., and Lee, J. P. (2000). The Alzheimer’s peptide a beta adopts a
collapsed coil structure in water. J. Struct. Biol. 130, 130–141.