Kinetic assessment of breast tumors using high spatial resolution signal enhancement ratio (SER)...
10
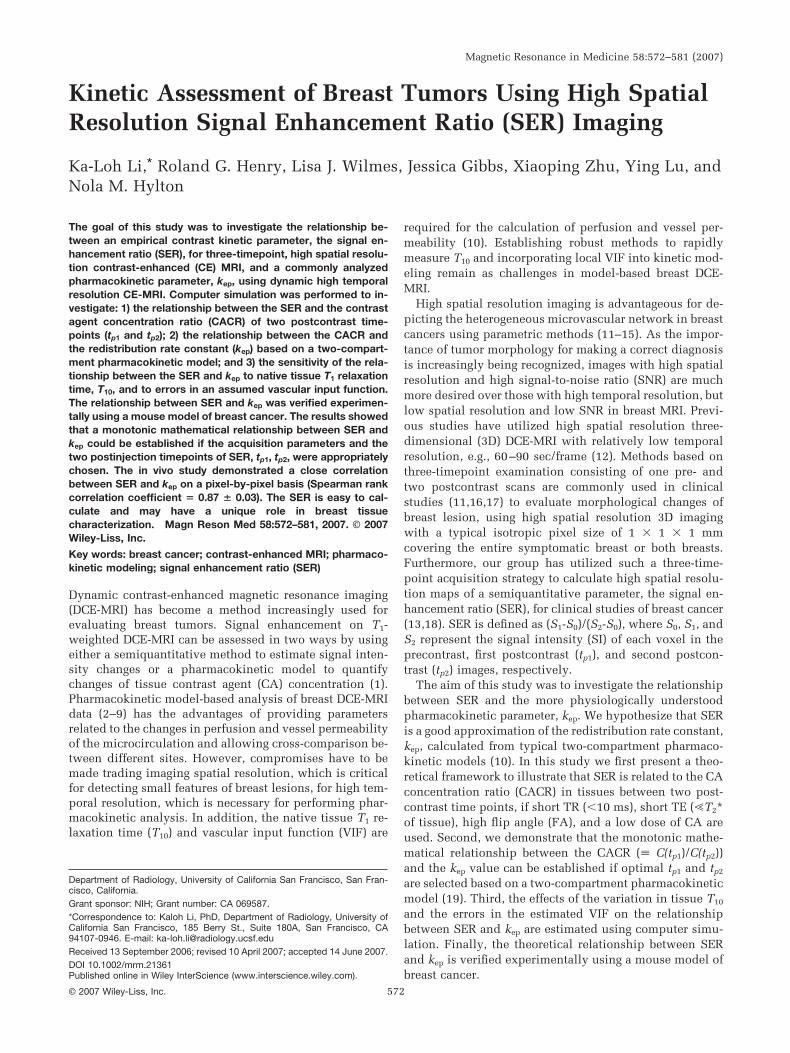
Kinetic Assessment of Breast Tumors Using High Spatial Resolution Signal Enhancement Ratio (SER) Imaging Ka-Loh Li, * Roland G. Henry, Lisa J. Wilmes, Jessica Gibbs, Xiaoping Zhu, Ying Lu, and Nola M. Hylton The goal of this study was to investigate the relationship be- tween an empirical contrast kinetic parameter, the signal en- hancement ratio (SER), for three-timepoint, high spatial resolu- tion contrast-enhanced (CE) MRI, and a commonly analyzed pharmacokinetic parameter, k ep , using dynamic high temporal resolution CE-MRI. Computer simulation was performed to in- vestigate: 1) the relationship between the SER and the contrast agent concentration ratio (CACR) of two postcontrast time- points (t p1 and t p2 ); 2) the relationship between the CACR and the redistribution rate constant (k ep ) based on a two-compart- ment pharmacokinetic model; and 3) the sensitivity of the rela- tionship between the SER and k ep to native tissue T 1 relaxation time, T 10 , and to errors in an assumed vascular input function. The relationship between SER and k ep was verified experimen- tally using a mouse model of breast cancer. The results showed that a monotonic mathematical relationship between SER and k ep could be established if the acquisition parameters and the two postinjection timepoints of SER, t p1 , t p2 , were appropriately chosen. The in vivo study demonstrated a close correlation between SER and k ep on a pixel-by-pixel basis (Spearman rank correlation coefficient 0.87 0.03). The SER is easy to cal- culate and may have a unique role in breast tissue characterization. Magn Reson Med 58:572–581, 2007. © 2007 Wiley-Liss, Inc. Key words: breast cancer; contrast-enhanced MRI; pharmaco- kinetic modeling; signal enhancement ratio (SER) Dynamic contrast-enhanced magnetic resonance imaging (DCE-MRI) has become a method increasingly used for evaluating breast tumors. Signal enhancement on T 1 - weighted DCE-MRI can be assessed in two ways by using either a semiquantitative method to estimate signal inten- sity changes or a pharmacokinetic model to quantify changes of tissue contrast agent (CA) concentration (1). Pharmacokinetic model-based analysis of breast DCE-MRI data (2–9) has the advantages of providing parameters related to the changes in perfusion and vessel permeability of the microcirculation and allowing cross-comparison be- tween different sites. However, compromises have to be made trading imaging spatial resolution, which is critical for detecting small features of breast lesions, for high tem- poral resolution, which is necessary for performing phar- macokinetic analysis. In addition, the native tissue T 1 re- laxation time (T 10 ) and vascular input function (VIF) are required for the calculation of perfusion and vessel per- meability (10). Establishing robust methods to rapidly measure T 10 and incorporating local VIF into kinetic mod- eling remain as challenges in model-based breast DCE- MRI. High spatial resolution imaging is advantageous for de- picting the heterogeneous microvascular network in breast cancers using parametric methods (11–15). As the impor- tance of tumor morphology for making a correct diagnosis is increasingly being recognized, images with high spatial resolution and high signal-to-noise ratio (SNR) are much more desired over those with high temporal resolution, but low spatial resolution and low SNR in breast MRI. Previ- ous studies have utilized high spatial resolution three- dimensional (3D) DCE-MRI with relatively low temporal resolution, e.g., 60 –90 sec/frame (12). Methods based on three-timepoint examination consisting of one pre- and two postcontrast scans are commonly used in clinical studies (11,16,17) to evaluate morphological changes of breast lesion, using high spatial resolution 3D imaging with a typical isotropic pixel size of 1 1 1 mm covering the entire symptomatic breast or both breasts. Furthermore, our group has utilized such a three-time- point acquisition strategy to calculate high spatial resolu- tion maps of a semiquantitative parameter, the signal en- hancement ratio (SER), for clinical studies of breast cancer (13,18). SER is defined as (S 1 -S 0 )/(S 2 -S 0 ), where S 0 , S 1 , and S 2 represent the signal intensity (SI) of each voxel in the precontrast, first postcontrast (t p1 ), and second postcon- trast (t p2 ) images, respectively. The aim of this study was to investigate the relationship between SER and the more physiologically understood pharmacokinetic parameter, k ep . We hypothesize that SER is a good approximation of the redistribution rate constant, k ep , calculated from typical two-compartment pharmaco- kinetic models (10). In this study we first present a theo- retical framework to illustrate that SER is related to the CA concentration ratio (CACR) in tissues between two post- contrast time points, if short TR (10 ms), short TE (T 2 * of tissue), high flip angle (FA), and a low dose of CA are used. Second, we demonstrate that the monotonic mathe- matical relationship between the CACR ( C(t p1 )/C(t p2 )) and the k ep value can be established if optimal t p1 and t p2 are selected based on a two-compartment pharmacokinetic model (19). Third, the effects of the variation in tissue T 10 and the errors in the estimated VIF on the relationship between SER and k ep are estimated using computer simu- lation. Finally, the theoretical relationship between SER and k ep is verified experimentally using a mouse model of breast cancer. Department of Radiology, University of California San Francisco, San Fran- cisco, California. Grant sponsor: NIH; Grant number: CA 069587. *Correspondence to: Kaloh Li, PhD, Department of Radiology, University of California San Francisco, 185 Berry St., Suite 180A, San Francisco, CA 94107-0946. E-mail: [email protected] Received 13 September 2006; revised 10 April 2007; accepted 14 June 2007. DOI 10.1002/mrm.21361 Published online in Wiley InterScience (www.interscience.wiley.com). Magnetic Resonance in Medicine 58:572–581 (2007) © 2007 Wiley-Liss, Inc. 572
Transcript of Kinetic assessment of breast tumors using high spatial resolution signal enhancement ratio (SER)...
Kinetic Assessment of Breast Tumors Using High SpatialResolution Signal Enhancement Ratio (SER) Imaging
Ka-Loh Li,* Roland G. Henry, Lisa J. Wilmes, Jessica Gibbs, Xiaoping Zhu, Ying Lu, andNola M. Hylton
The goal of this study was to investigate the relationship be-tween an empirical contrast kinetic parameter, the signal en-hancement ratio (SER), for three-timepoint, high spatial resolu-tion contrast-enhanced (CE) MRI, and a commonly analyzedpharmacokinetic parameter, kep, using dynamic high temporalresolution CE-MRI. Computer simulation was performed to in-vestigate: 1) the relationship between the SER and the contrastagent concentration ratio (CACR) of two postcontrast time-points (tp1 and tp2); 2) the relationship between the CACR andthe redistribution rate constant (kep) based on a two-compart-ment pharmacokinetic model; and 3) the sensitivity of the rela-tionship between the SER and kep to native tissue T1 relaxationtime, T10, and to errors in an assumed vascular input function.The relationship between SER and kep was verified experimen-tally using a mouse model of breast cancer. The results showedthat a monotonic mathematical relationship between SER andkep could be established if the acquisition parameters and thetwo postinjection timepoints of SER, tp1, tp2, were appropriatelychosen. The in vivo study demonstrated a close correlationbetween SER and kep on a pixel-by-pixel basis (Spearman rankcorrelation coefficient � 0.87 � 0.03). The SER is easy to cal-culate and may have a unique role in breast tissuecharacterization. Magn Reson Med 58:572–581, 2007. © 2007Wiley-Liss, Inc.
Key words: breast cancer; contrast-enhanced MRI; pharmaco-kinetic modeling; signal enhancement ratio (SER)
Dynamic contrast-enhanced magnetic resonance imaging(DCE-MRI) has become a method increasingly used forevaluating breast tumors. Signal enhancement on T1-weighted DCE-MRI can be assessed in two ways by usingeither a semiquantitative method to estimate signal inten-sity changes or a pharmacokinetic model to quantifychanges of tissue contrast agent (CA) concentration (1).Pharmacokinetic model-based analysis of breast DCE-MRIdata (2–9) has the advantages of providing parametersrelated to the changes in perfusion and vessel permeabilityof the microcirculation and allowing cross-comparison be-tween different sites. However, compromises have to bemade trading imaging spatial resolution, which is criticalfor detecting small features of breast lesions, for high tem-poral resolution, which is necessary for performing phar-macokinetic analysis. In addition, the native tissue T1 re-laxation time (T10) and vascular input function (VIF) are
required for the calculation of perfusion and vessel per-meability (10). Establishing robust methods to rapidlymeasure T10 and incorporating local VIF into kinetic mod-eling remain as challenges in model-based breast DCE-MRI.
High spatial resolution imaging is advantageous for de-picting the heterogeneous microvascular network in breastcancers using parametric methods (11–15). As the impor-tance of tumor morphology for making a correct diagnosisis increasingly being recognized, images with high spatialresolution and high signal-to-noise ratio (SNR) are muchmore desired over those with high temporal resolution, butlow spatial resolution and low SNR in breast MRI. Previ-ous studies have utilized high spatial resolution three-dimensional (3D) DCE-MRI with relatively low temporalresolution, e.g., 60–90 sec/frame (12). Methods based onthree-timepoint examination consisting of one pre- andtwo postcontrast scans are commonly used in clinicalstudies (11,16,17) to evaluate morphological changes ofbreast lesion, using high spatial resolution 3D imagingwith a typical isotropic pixel size of 1 � 1 � 1 mmcovering the entire symptomatic breast or both breasts.Furthermore, our group has utilized such a three-time-point acquisition strategy to calculate high spatial resolu-tion maps of a semiquantitative parameter, the signal en-hancement ratio (SER), for clinical studies of breast cancer(13,18). SER is defined as (S1-S0)/(S2-S0), where S0, S1, andS2 represent the signal intensity (SI) of each voxel in theprecontrast, first postcontrast (tp1), and second postcon-trast (tp2) images, respectively.
The aim of this study was to investigate the relationshipbetween SER and the more physiologically understoodpharmacokinetic parameter, kep. We hypothesize that SERis a good approximation of the redistribution rate constant,kep, calculated from typical two-compartment pharmaco-kinetic models (10). In this study we first present a theo-retical framework to illustrate that SER is related to the CAconcentration ratio (CACR) in tissues between two post-contrast time points, if short TR (�10 ms), short TE (�T2*of tissue), high flip angle (FA), and a low dose of CA areused. Second, we demonstrate that the monotonic mathe-matical relationship between the CACR (� C(tp1)/C(tp2))and the kep value can be established if optimal tp1 and tp2
are selected based on a two-compartment pharmacokineticmodel (19). Third, the effects of the variation in tissue T10
and the errors in the estimated VIF on the relationshipbetween SER and kep are estimated using computer simu-lation. Finally, the theoretical relationship between SERand kep is verified experimentally using a mouse model ofbreast cancer.
Department of Radiology, University of California San Francisco, San Fran-cisco, California.Grant sponsor: NIH; Grant number: CA 069587.*Correspondence to: Kaloh Li, PhD, Department of Radiology, University ofCalifornia San Francisco, 185 Berry St., Suite 180A, San Francisco, CA94107-0946. E-mail: [email protected] 13 September 2006; revised 10 April 2007; accepted 14 June 2007.DOI 10.1002/mrm.21361Published online in Wiley InterScience (www.interscience.wiley.com).
Magnetic Resonance in Medicine 58:572–581 (2007)
© 2007 Wiley-Liss, Inc. 572
MATERIALS AND METHODS
Theory: Relationship between SER and kep
Computer Simulation of the Relationship between TissueSER and Contrast Agent Concentration Ratio
Tissue SER calculated from the three-timepoint CE-MRIdata, using a short TE (TE � T2* of tissue), short TR (TR �T1 of tissue) transverse-spoiled gradient-echo sequencewith low dose Gd-DTPA administration, can be expressedas SER � A�CACR. Factor A can be expressed as (see theAppendix for derivation):
A �SER
CACR�
1 � cos� � cos��TR�(R10 � C�tp2 � �1)1 � cos� � cos��TR�(R10 � C�tp1 � �1)
[1]
where R10 (�1/T10) is the precontrast longitudinal relax-ation rate of breast tissue, � is the flip angle, and ℜ1 (�4.52 s�1 mM�1 (20)) is the T1 relaxivity of Gd-DTPA.
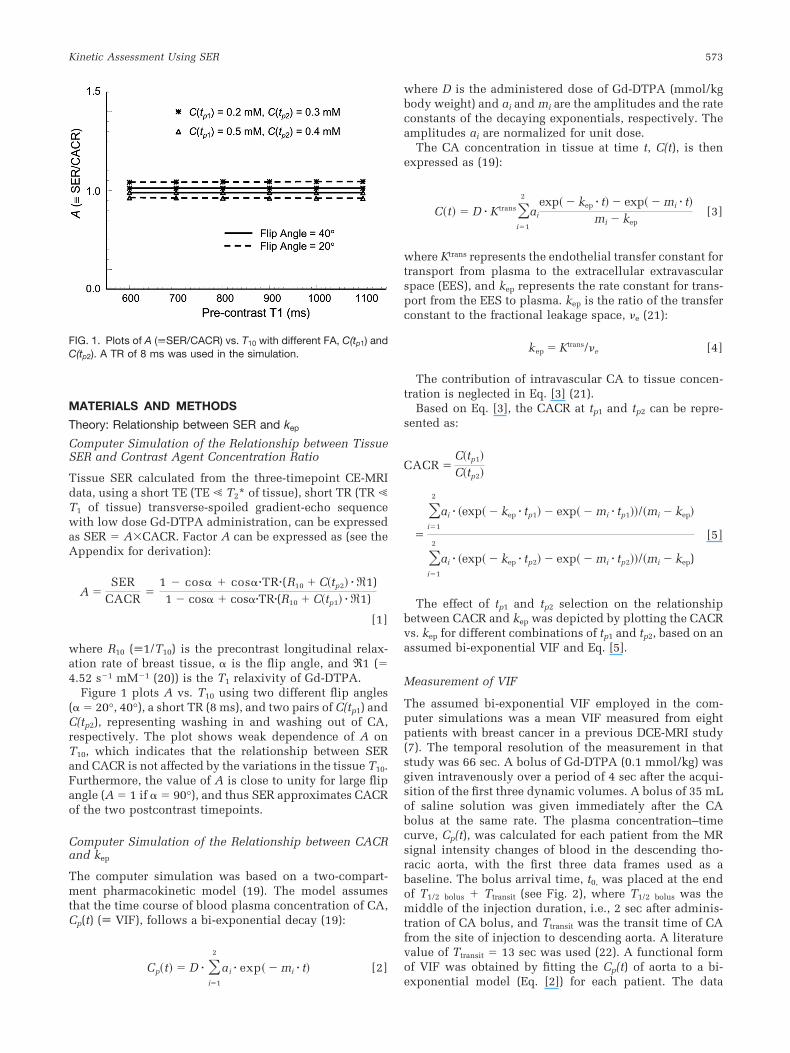
Figure 1 plots A vs. T10 using two different flip angles(� � 20°, 40°), a short TR (8 ms), and two pairs of C(tp1) andC(tp2), representing washing in and washing out of CA,respectively. The plot shows weak dependence of A onT10, which indicates that the relationship between SERand CACR is not affected by the variations in the tissue T10.Furthermore, the value of A is close to unity for large flipangle (A � 1 if � � 90°), and thus SER approximates CACRof the two postcontrast timepoints.
Computer Simulation of the Relationship between CACRand kep
The computer simulation was based on a two-compart-ment pharmacokinetic model (19). The model assumesthat the time course of blood plasma concentration of CA,Cp(t) (� VIF), follows a bi-exponential decay (19):
Cp�t � D � �i�1
2
ai � exp� � mi � t [2]
where D is the administered dose of Gd-DTPA (mmol/kgbody weight) and ai and mi are the amplitudes and the rateconstants of the decaying exponentials, respectively. Theamplitudes ai are normalized for unit dose.
The CA concentration in tissue at time t, C(t), is thenexpressed as (19):
C�t � D � Ktrans�i�1
2
ai
exp� � kep � t � exp� � mi � tmi � kep
[3]
where Ktrans represents the endothelial transfer constant fortransport from plasma to the extracellular extravascularspace (EES), and kep represents the rate constant for trans-port from the EES to plasma. kep is the ratio of the transferconstant to the fractional leakage space, e (21):
kep � Ktrans/e [4]
The contribution of intravascular CA to tissue concen-tration is neglected in Eq. [3] (21).
Based on Eq. [3], the CACR at tp1 and tp2 can be repre-sented as:
CACR �C�tp1
C�tp2
�
�i�1
2
ai � �exp� � kep � tp1 � exp� � mi � tp1/�mi � kep
�i�1
2
ai � �exp� � kep � tp2 � exp� � mi � tp2/�mi � kep)
[5]
The effect of tp1 and tp2 selection on the relationshipbetween CACR and kep was depicted by plotting the CACRvs. kep for different combinations of tp1 and tp2, based on anassumed bi-exponential VIF and Eq. [5].
Measurement of VIF
The assumed bi-exponential VIF employed in the com-puter simulations was a mean VIF measured from eightpatients with breast cancer in a previous DCE-MRI study(7). The temporal resolution of the measurement in thatstudy was 66 sec. A bolus of Gd-DTPA (0.1 mmol/kg) wasgiven intravenously over a period of 4 sec after the acqui-sition of the first three dynamic volumes. A bolus of 35 mLof saline solution was given immediately after the CAbolus at the same rate. The plasma concentration–timecurve, Cp(t), was calculated for each patient from the MRsignal intensity changes of blood in the descending tho-racic aorta, with the first three data frames used as abaseline. The bolus arrival time, t0, was placed at the endof T1/2 bolus � Ttransit (see Fig. 2), where T1/2 bolus was themiddle of the injection duration, i.e., 2 sec after adminis-tration of CA bolus, and Ttransit was the transit time of CAfrom the site of injection to descending aorta. A literaturevalue of Ttransit � 13 sec was used (22). A functional formof VIF was obtained by fitting the Cp(t) of aorta to a bi-exponential model (Eq. [2]) for each patient. The data
FIG. 1. Plots of A (�SER/CACR) vs. T10 with different FA, C(tp1) andC(tp2). A TR of 8 ms was used in the simulation.
Kinetic Assessment Using SER 573
frame acquired at the first timepoint after administration ofcontrast (the fourth point in the DCE series), ti � 4 �tbaseline � 33 sec, was excluded from the fit to allow thesteady-state part of Cp(t), after the systemic recirculation ofCA bolus, to dominate the fit, reducing the effect of peakfluctuation on the value of (a1 � a2) (23).
Error Estimation
The effects of variations in tissue T10 on the relationshipbetween SER and kep were investigated by simulations ofthe SER vs. kep curves at various tissue T10 values. A rangeof “true” kep values of 0.1–2.0 min�1 and “true” e � 0.3 or0.6 were assumed. Corresponding “true” Ktrans values werecalculated using Eq. [4] with each of the assumed values ofkep and e. Theoretical SER corresponding to each kep wasgenerated based on Eq. [A5] using 1) TR � 8 ms; 2) � � 40°or 20°; 3) an array of R10 (� 1/ T10) ranged from 0.77–1.67 s�1 (24); and 4) The R11 and R12, calculated using R11 �C(tp1) � ℜ1� R10 and R12 � C(tp2) � ℜ1� R10. The values ofthe C(tp1) and C(tp2) were calculated with Eq. [3] using D �0.1 mmol/(kg body weight), [tp1, tp2] � [1 min, 9 min] or[2.5 min, 7.5 min], the assumed “true” Ktrans and “true” kep
values, and the bi-exponential VIF as described above. Thecurve of CACR vs. kep was also generated using the samebi-exponential VIF for comparison. For an assumed kep, e,FA, and [tp1, tp2] combination, eight SERs were generatedwith the array of R10 values. Values of mean and standarddeviation (SDser) of the eight SERs were obtained. Themean value was used to assess the agreement between SERand CACR, and the SDser was used to estimate the variabil-ity of SER resulting from variation in tissue T10. The con-tribution from the intravascular CA to tissue SI was nottaken into account in the simulation (21).
In order to visually inspect the effects of variations inthe assumed bi-exponential VIF on the relationship be-tween SER (approximated by CACR) and kep, we replottedthe curve of CACR vs. kep by changing each of the four VIFparameters (a1, a2, m1, and m2) in turn by �20% of itsnominal value. The size of variations used in the simula-tions is consistent with a recent report that the percent SDof Cp(t) was �25% in the washout period (25). We alsoestimated the sensitivity of the assumed CACR vs. kep
curve to errors in each of the assumed VIF parametersusing the error propagation method suggested by Tofts etal. (3): A representative curve of CACR vs. kep was obtainedusing Eq. [5] with a range of “true” kep values of 0.1–2.0 min�1, [tp1, tp2] � [1 min, 9 min] or [2.5 min, 7.5 min],and the bi-exponential VIF described in the previous sec-tion. Each VIF parameter, a1, a2, m1, and m2, in turn wasreduced to 99% of its nominal value. The curve of CACRvs. kep was recalculated with the reduced VIF parametervalue using Eq. [5]. For each kep the fractional change inthe corresponding CACR was obtained and divided by 1%to give the error propagation ratio (EPR), defined as (frac-tional change in the estimate of the CACR correspondingto a kep value)/(fractional change in a VIF parameter). TheEPR values give quantitative guidance on which parame-ters are most critical (3).
Experimental Validation of the Relationship between SERand kep
We employed the Gd-DTPA-enhanced MRI data acquiredin a previous study (26) to produce the kep and SER mapsfor verifying the relationship between the two parameters.Details regarding the tumor model, the imaging protocol,and the pharmacokinetic analysis of the data have beenpreviously described (26). In brief, six nude mice im-planted with the human breast cancer line BT474 under-went DCE-MRI before and after treatment with a VEGF-receptor tyrosine kinase inhibitor (n � 3) or vehicle (n �3). MRI was performed on a 1.5 T whole-body MRI scanner(General Electric Medical Systems, Milwaukee, WI) usinga wrist RF coil (Medical Advances, Milwaukee, WI). Micewere anesthetized by inhalation of 1.5% isoflurane. Axialimages were obtained for tumor localization. Tissue T10
was measured using a coronal 3D variable flip angle fastgradient echo technique (27). Dynamic contrast-enhancedimaging was performed using a coronal T1-weighted 3Dgradient echo sequence with TR � 9.3 ms, TE � 4.2 ms,FA � 20°, FOV � 10 � 10 cm, imaging matrix � 256 �256 � 28, slice thickness � 1.0 mm, NEX � 1. The DCE-MRI series were of a time resolution of 66 sec over a periodof 22 min. Five precontrast scans were acquired, and thenmice were injected via the tail vein with 0.2 mmol/kgGd-DTPA (Magnevist; Schering, Berlin, Germany) over aperiod of 4 sec. The postinjection scan started immediatelyafter completion of the injection. The animal studies wereperformed with institutional approval according to insti-tutional and national guidelines.
kep Mapping
Pharmacokinetic analysis was performed on a pixel-by-pixel basis for the regions of interest (ROIs) encompassingthe entire tumor. The time course of the intravascular CAconcentration measured from the abdominal aorta of themouse was used to calculate an effective VIF for eachexamination by fitting the plasma CA concentration timecourse data to a bi-exponential decay curve. The estimatedbolus arrival time was 6 sec after completion of the injec-tion (28). Ktrans and e were estimated using the Tofts-Kerm(T-K) model (10). Maps of scaled fitting error (SFE) (26,29)were generated as an integral part of each fitting procedureto assess the discrepancy between the derived curve andthe original data. Maps of kep were calculated using Eq. [4].
SER Mapping
SER was computed on a pixel-by-pixel basis. For eachvoxel within the tumor volume, S0 was calculated as themean SI of the five precontrast scans; S1 was the SI of thefirst postcontrast scan (tp1 � 0.55 min) or the third post-contrast scan (tp1 � 2.75 min); S2 was the SI of the ninthpostcontrast scan (tp2 � 9.35 min). We use SER0.55 to de-note the SER calculated with [tp1, tp2] � [0.55 min,9.35 min], and SER2.75 to denote the SER calculated with[tp1, tp2] � [2.75 min, 9.35 min].
574 Li et al.
Exclusion Criteria for Correlation Analysis
Voxels that fell into the following criteria were excludedfrom the correlation analysis: 1) voxels associated withpoor fits (SFE 35%) in pharmacokinetic analysis (30); 2)voxels showing pseudo-Ktrans due to contributions fromlarge vessel (Ktrans 1.2 min�1) (3,30) or exceedingly low orhigh e (e �0.1 or e 1.0) (3); 3) voxels with excessivelysmall kep (�0.1 min�1) (3).
Correlation Analysis
The relationship between the pixel-by-pixel calculationsof SER and the pixel-by-pixel calculations of kep was eval-uated from a scatterplot of the ordered pairs of the twoparameters in a region of tumor for each mouse. The effectof tp1 selection on the monotonic relationship betweenSER and kep was assessed by visual inspection of thescatterplots generated from the same DCE-MRI dataset butusing different tp1 values. To measure the monotonicity ofthe relationship between the SER and kep, Spearman’s rankorder correlation was used. The Spearman rank correlationcoefficient (Splus 7, Insightful, Seattle, WA) between thepaired pixel values of SER0.55 (or SER2.75) and kep wascalculated for each tumor xenograft, denoted as r0.55 andr2.75, respectively. To test the difference between the twooverlapping (in the sense of having a variable in common)correlation coefficients, r0.55 and r2.75, measured on each ofthe tumor xenografts, a Z-test as described by Meng et al.(31) was used:
Z � �zr1 � zr2� N � 32�1 � rxh
[6]
where N is the number of pixels in the tumor xenograft, Zr1
and Zr2 are the Fisher z-transformed r0.55 and r2.75, respec-tively, and rx is the correlation between SER0.55 andSER2.75,
h �1 � fr�
2
1 � r�2 � 1 �
r�2
1 � r�2�1 � f [7]
f �1 � rx
2�1 � r�2
[8]
and r�2 � �r0.55
2 � r2.752 /2. An “R” program (R Foundation
for Statistical Computing v. 2.0.1) for the calculation of theZ values in the Meng-Rosenthal-Rubin method is availableonline (Li K-L, Zhu XP. http://lib.stat.cmu.edu/R/CRAN/src/contrib/Descriptions/compOverlapCorr.html). A sig-nificance level of 0.05 was used for all tests.
For assessing the impact of using population VIF as op-posed to individual VIFs on the relationship between SERand kep, we recalculated kep maps for each mouse using thegroup mean VIF, denoted as kep, group VIF. Spearman rankcorrelation coefficients between the paired pixel values ofSER0.55 and kep, group VIF were calculated for each tumor xeno-graft, and denoted as r0.55, group VIF. A paired t-test was used tocompare the mean value for r0.55, group VIF and r0.55.
RESULTS
Computer Simulation and Error Estimation
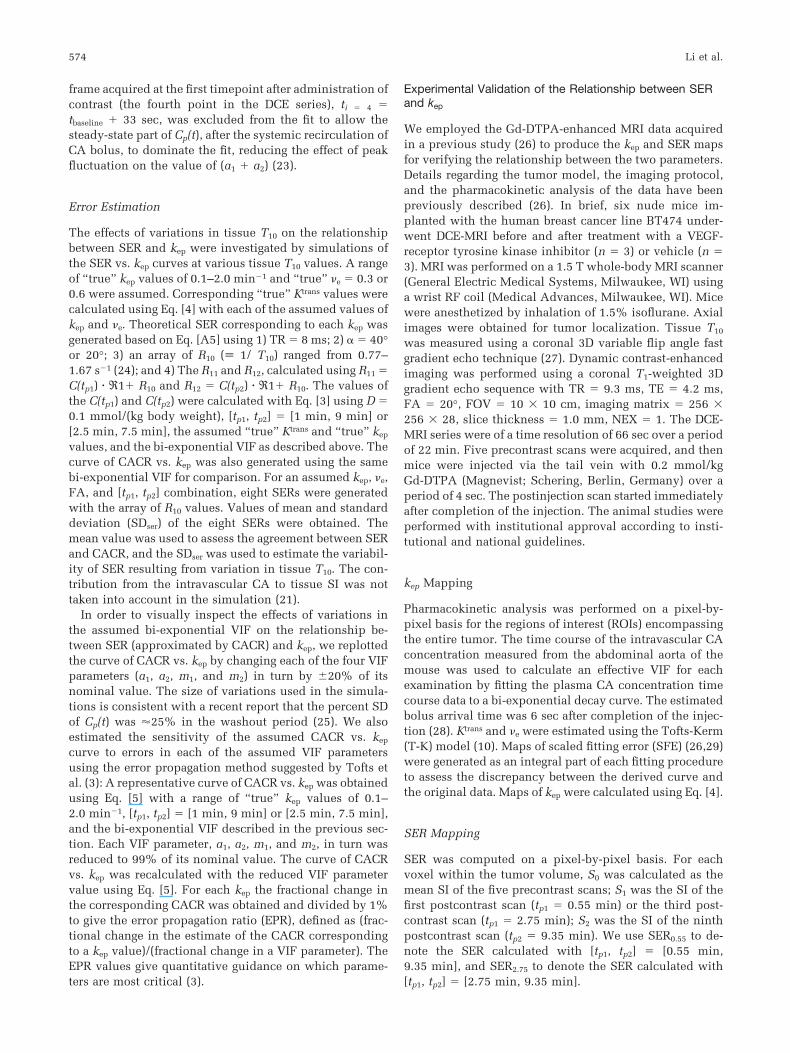
Figure 2 shows an example of VIF measured from blood inthe descending thoracic aorta of a patient with breast can-cer. A mean bi-exponential VIF was obtained from thegroup of patients (n � 8) with parameters a1 � 11.3 � 1.75kg/L, a2 � 8.13 � 1.68 kg/L, m1 � 0.46 � 0.11 min�1, andm2 � 0.042 � 0.012 min�1. The mean bi-exponential VIFwas then used for the computer simulations.
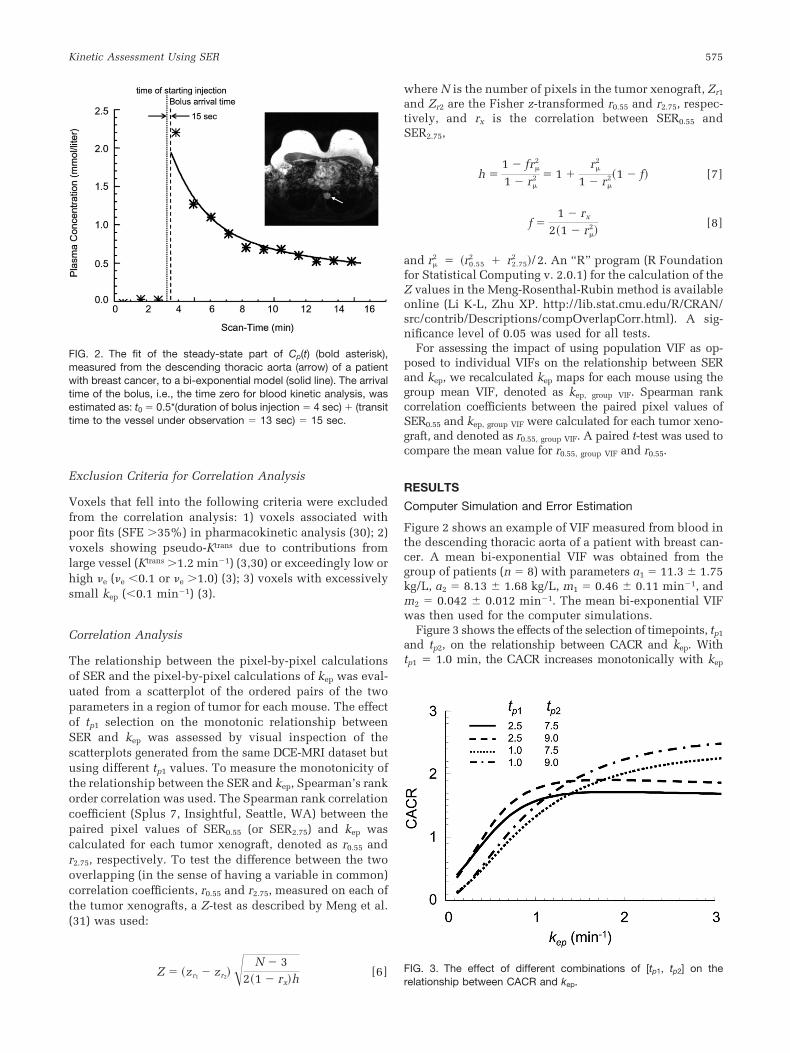
Figure 3 shows the effects of the selection of timepoints, tp1
and tp2, on the relationship between CACR and kep. Withtp1 � 1.0 min, the CACR increases monotonically with kep
FIG. 2. The fit of the steady-state part of Cp(t) (bold asterisk),measured from the descending thoracic aorta (arrow) of a patientwith breast cancer, to a bi-exponential model (solid line). The arrivaltime of the bolus, i.e., the time zero for blood kinetic analysis, wasestimated as: t0 � 0.5*(duration of bolus injection � 4 sec) � (transittime to the vessel under observation � 13 sec) � 15 sec.
FIG. 3. The effect of different combinations of [tp1, tp2] on therelationship between CACR and kep.
Kinetic Assessment Using SER 575
over a wide range of kep values (0 � 3 min�1). With tp1 �2.5 min, the CACR maintains the monotonic relationshipwith kep over the kep range of 0 � 1 min�1; it, however,exhibits a plateau where kep is higher than 1 min�1. Prolong-ing tp2 enlarges the dynamic range of CACR (i.e., the sensi-tivity); e.g., the CACR range increases from 0.2–2.15 for [tp1,tp2] of [1 min, 7.5 min] to 0.2–2.35 for [tp1, tp2] of [1 min,9 min].
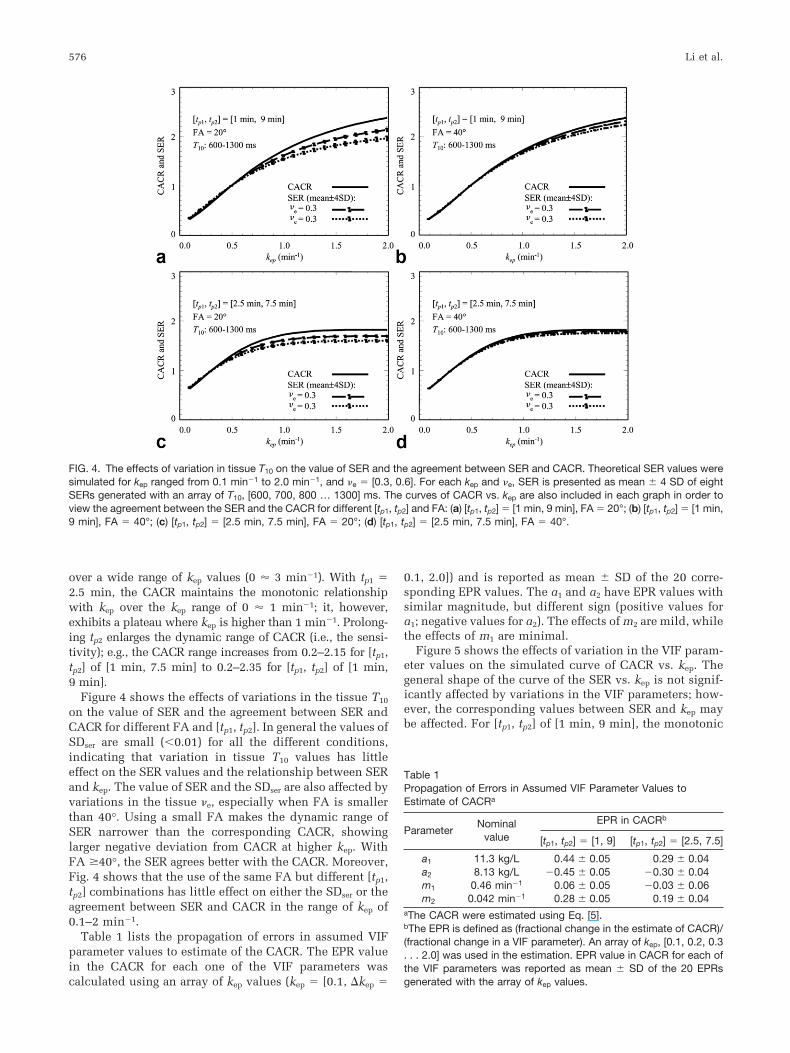
Figure 4 shows the effects of variations in the tissue T10
on the value of SER and the agreement between SER andCACR for different FA and [tp1, tp2]. In general the values ofSDser are small (�0.01) for all the different conditions,indicating that variation in tissue T10 values has littleeffect on the SER values and the relationship between SERand kep. The value of SER and the SDser are also affected byvariations in the tissue e, especially when FA is smallerthan 40°. Using a small FA makes the dynamic range ofSER narrower than the corresponding CACR, showinglarger negative deviation from CACR at higher kep. WithFA �40°, the SER agrees better with the CACR. Moreover,Fig. 4 shows that the use of the same FA but different [tp1,tp2] combinations has little effect on either the SDser or theagreement between SER and CACR in the range of kep of0.1–2 min�1.
Table 1 lists the propagation of errors in assumed VIFparameter values to estimate of the CACR. The EPR valuein the CACR for each one of the VIF parameters wascalculated using an array of kep values (kep � [0.1, �kep �
0.1, 2.0]) and is reported as mean � SD of the 20 corre-sponding EPR values. The a1 and a2 have EPR values withsimilar magnitude, but different sign (positive values fora1; negative values for a2). The effects of m2 are mild, whilethe effects of m1 are minimal.
Figure 5 shows the effects of variation in the VIF param-eter values on the simulated curve of CACR vs. kep. Thegeneral shape of the curve of the SER vs. kep is not signif-icantly affected by variations in the VIF parameters; how-ever, the corresponding values between SER and kep maybe affected. For [tp1, tp2] of [1 min, 9 min], the monotonic
FIG. 4. The effects of variation in tissue T10 on the value of SER and the agreement between SER and CACR. Theoretical SER values weresimulated for kep ranged from 0.1 min�1 to 2.0 min�1, and e � [0.3, 0.6]. For each kep and e, SER is presented as mean � 4 SD of eightSERs generated with an array of T10, [600, 700, 800 … 1300] ms. The curves of CACR vs. kep are also included in each graph in order toview the agreement between the SER and the CACR for different [tp1, tp2] and FA: (a) [tp1, tp2] � [1 min, 9 min], FA � 20°; (b) [tp1, tp2] � [1 min,9 min], FA � 40°; (c) [tp1, tp2] � [2.5 min, 7.5 min], FA � 20°; (d) [tp1, tp2] � [2.5 min, 7.5 min], FA � 40°.
Table 1Propagation of Errors in Assumed VIF Parameter Values toEstimate of CACRa
ParameterNominal
value
EPR in CACRb
[tp1, tp2] � [1, 9] [tp1, tp2] � [2.5, 7.5]
a1 11.3 kg/L 0.44 � 0.05 0.29 � 0.04a2 8.13 kg/L �0.45 � 0.05 �0.30 � 0.04m1 0.46 min�1 0.06 � 0.05 �0.03 � 0.06m2 0.042 min�1 0.28 � 0.05 0.19 � 0.04
aThe CACR were estimated using Eq. [5].bThe EPR is defined as (fractional change in the estimate of CACR)/(fractional change in a VIF parameter). An array of kep, [0.1, 0.2, 0.3. . . 2.0] was used in the estimation. EPR value in CACR for each ofthe VIF parameters was reported as mean � SD of the 20 EPRsgenerated with the array of kep values.
576 Li et al.
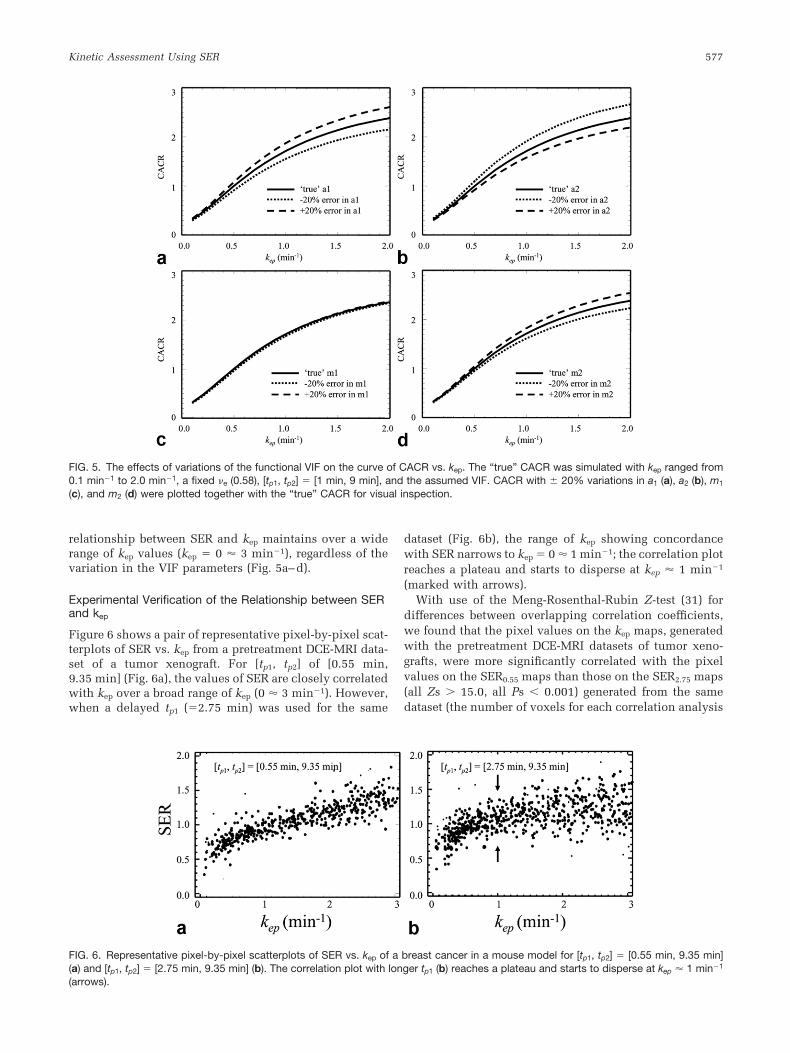
relationship between SER and kep maintains over a widerange of kep values (kep � 0 � 3 min�1), regardless of thevariation in the VIF parameters (Fig. 5a–d).
Experimental Verification of the Relationship between SERand kep
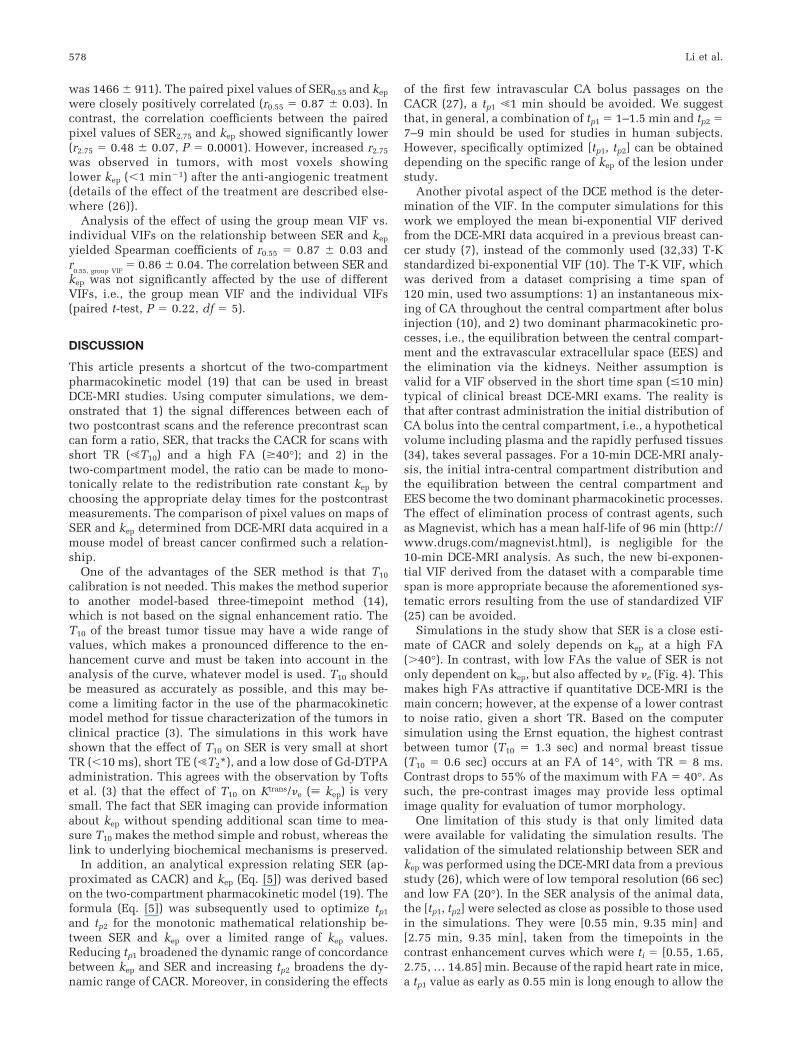
Figure 6 shows a pair of representative pixel-by-pixel scat-terplots of SER vs. kep from a pretreatment DCE-MRI data-set of a tumor xenograft. For [tp1, tp2] of [0.55 min,9.35 min] (Fig. 6a), the values of SER are closely correlatedwith kep over a broad range of kep (0 � 3 min�1). However,when a delayed tp1 (�2.75 min) was used for the same
dataset (Fig. 6b), the range of kep showing concordancewith SER narrows to kep � 0 � 1 min�1; the correlation plotreaches a plateau and starts to disperse at kep � 1 min�1
(marked with arrows).With use of the Meng-Rosenthal-Rubin Z-test (31) for
differences between overlapping correlation coefficients,we found that the pixel values on the kep maps, generatedwith the pretreatment DCE-MRI datasets of tumor xeno-grafts, were more significantly correlated with the pixelvalues on the SER0.55 maps than those on the SER2.75 maps(all Zs 15.0, all Ps � 0.001) generated from the samedataset (the number of voxels for each correlation analysis
FIG. 5. The effects of variations of the functional VIF on the curve of CACR vs. kep. The “true” CACR was simulated with kep ranged from0.1 min�1 to 2.0 min�1, a fixed e (0.58), [tp1, tp2] � [1 min, 9 min], and the assumed VIF. CACR with � 20% variations in a1 (a), a2 (b), m1
(c), and m2 (d) were plotted together with the “true” CACR for visual inspection.
FIG. 6. Representative pixel-by-pixel scatterplots of SER vs. kep of a breast cancer in a mouse model for [tp1, tp2] � [0.55 min, 9.35 min](a) and [tp1, tp2] � [2.75 min, 9.35 min] (b). The correlation plot with longer tp1 (b) reaches a plateau and starts to disperse at kep � 1 min�1
(arrows).
Kinetic Assessment Using SER 577
was 1466 � 911). The paired pixel values of SER0.55 and kep
were closely positively correlated (r0.55 � 0.87 � 0.03). Incontrast, the correlation coefficients between the pairedpixel values of SER2.75 and kep showed significantly lower(r2.75 � 0.48 � 0.07, P � 0.0001). However, increased r2.75
was observed in tumors, with most voxels showinglower kep (�1 min�1) after the anti-angiogenic treatment(details of the effect of the treatment are described else-where (26)).
Analysis of the effect of using the group mean VIF vs.individual VIFs on the relationship between SER and kep
yielded Spearman coefficients of r0.55 � 0.87 � 0.03 andr
0.55, group VIF� 0.86 � 0.04. The correlation between SER and
kep was not significantly affected by the use of differentVIFs, i.e., the group mean VIF and the individual VIFs(paired t-test, P � 0.22, df � 5).
DISCUSSION
This article presents a shortcut of the two-compartmentpharmacokinetic model (19) that can be used in breastDCE-MRI studies. Using computer simulations, we dem-onstrated that 1) the signal differences between each oftwo postcontrast scans and the reference precontrast scancan form a ratio, SER, that tracks the CACR for scans withshort TR (�T10) and a high FA (�40°); and 2) in thetwo-compartment model, the ratio can be made to mono-tonically relate to the redistribution rate constant kep bychoosing the appropriate delay times for the postcontrastmeasurements. The comparison of pixel values on maps ofSER and kep determined from DCE-MRI data acquired in amouse model of breast cancer confirmed such a relation-ship.
One of the advantages of the SER method is that T10
calibration is not needed. This makes the method superiorto another model-based three-timepoint method (14),which is not based on the signal enhancement ratio. TheT10 of the breast tumor tissue may have a wide range ofvalues, which makes a pronounced difference to the en-hancement curve and must be taken into account in theanalysis of the curve, whatever model is used. T10 shouldbe measured as accurately as possible, and this may be-come a limiting factor in the use of the pharmacokineticmodel method for tissue characterization of the tumors inclinical practice (3). The simulations in this work haveshown that the effect of T10 on SER is very small at shortTR (�10 ms), short TE (�T2*), and a low dose of Gd-DTPAadministration. This agrees with the observation by Toftset al. (3) that the effect of T10 on Ktrans/e (� kep) is verysmall. The fact that SER imaging can provide informationabout kep without spending additional scan time to mea-sure T10 makes the method simple and robust, whereas thelink to underlying biochemical mechanisms is preserved.
In addition, an analytical expression relating SER (ap-proximated as CACR) and kep (Eq. [5]) was derived basedon the two-compartment pharmacokinetic model (19). Theformula (Eq. [5]) was subsequently used to optimize tp1
and tp2 for the monotonic mathematical relationship be-tween SER and kep over a limited range of kep values.Reducing tp1 broadened the dynamic range of concordancebetween kep and SER and increasing tp2 broadens the dy-namic range of CACR. Moreover, in considering the effects
of the first few intravascular CA bolus passages on theCACR (27), a tp1 �1 min should be avoided. We suggestthat, in general, a combination of tp1 � 1–1.5 min and tp2 �7–9 min should be used for studies in human subjects.However, specifically optimized [tp1, tp2] can be obtaineddepending on the specific range of kep of the lesion understudy.
Another pivotal aspect of the DCE method is the deter-mination of the VIF. In the computer simulations for thiswork we employed the mean bi-exponential VIF derivedfrom the DCE-MRI data acquired in a previous breast can-cer study (7), instead of the commonly used (32,33) T-Kstandardized bi-exponential VIF (10). The T-K VIF, whichwas derived from a dataset comprising a time span of120 min, used two assumptions: 1) an instantaneous mix-ing of CA throughout the central compartment after bolusinjection (10), and 2) two dominant pharmacokinetic pro-cesses, i.e., the equilibration between the central compart-ment and the extravascular extracellular space (EES) andthe elimination via the kidneys. Neither assumption isvalid for a VIF observed in the short time span (�10 min)typical of clinical breast DCE-MRI exams. The reality isthat after contrast administration the initial distribution ofCA bolus into the central compartment, i.e., a hypotheticalvolume including plasma and the rapidly perfused tissues(34), takes several passages. For a 10-min DCE-MRI analy-sis, the initial intra-central compartment distribution andthe equilibration between the central compartment andEES become the two dominant pharmacokinetic processes.The effect of elimination process of contrast agents, suchas Magnevist, which has a mean half-life of 96 min (http://www.drugs.com/magnevist.html), is negligible for the10-min DCE-MRI analysis. As such, the new bi-exponen-tial VIF derived from the dataset with a comparable timespan is more appropriate because the aforementioned sys-tematic errors resulting from the use of standardized VIF(25) can be avoided.
Simulations in the study show that SER is a close esti-mate of CACR and solely depends on kep at a high FA( 40°). In contrast, with low FAs the value of SER is notonly dependent on kep, but also affected by e (Fig. 4). Thismakes high FAs attractive if quantitative DCE-MRI is themain concern; however, at the expense of a lower contrastto noise ratio, given a short TR. Based on the computersimulation using the Ernst equation, the highest contrastbetween tumor (T10 � 1.3 sec) and normal breast tissue(T10 � 0.6 sec) occurs at an FA of 14°, with TR � 8 ms.Contrast drops to 55% of the maximum with FA � 40°. Assuch, the pre-contrast images may provide less optimalimage quality for evaluation of tumor morphology.
One limitation of this study is that only limited datawere available for validating the simulation results. Thevalidation of the simulated relationship between SER andkep was performed using the DCE-MRI data from a previousstudy (26), which were of low temporal resolution (66 sec)and low FA (20°). In the SER analysis of the animal data,the [tp1, tp2] were selected as close as possible to those usedin the simulations. They were [0.55 min, 9.35 min] and[2.75 min, 9.35 min], taken from the timepoints in thecontrast enhancement curves which were ti � [0.55, 1.65,2.75, … 14.85] min. Because of the rapid heart rate in mice,a tp1 value as early as 0.55 min is long enough to allow the
578 Li et al.
first couple of CA bolus to pass and the tp1 of 0.55 min canbe used to maximize SER-kep concordance range. The scat-terplots of the pixel-by-pixel comparison of SER and kep inFig. 6 show the same trend as shown by the simulation,even though the VIFs used in the animal study were dif-ferent from the human VIF used in the simulations. Therelatively large dispersion was partially due to the rela-tively low SNR in the animal DCE-MRI data and the vari-ation of e in tumors. The effects of various e on therelationship between SER and kep were more prominent atlow FA (20°) as demonstrated in the simulation (Fig. 4).Prolonging tp2 enlarges the dynamic range of SER, and mayhelp in reducing such dispersion.
Finally, the results from this study suggest the impor-tance of adequate quality control in the parametric map-ping. The importance of quality control in model-basedanalysis using a fitting procedure has been previouslyaddressed in the pharmacokinetic model-based DCE-MRIstudies (26,27,35). However, such quality control has notyet become the common practice in semiquantitative para-metric mapping. For pharmacokinetic parameters esti-mated using a fitting procedure, voxel elimination wasperformed using numerical criteria assessing the good-ness-of-fit (29,36). Criteria for the voxel elimination werealso set according to the physiological range of the phar-macokinetic parameters (35). Fitting error, defined as ameasure of the difference between modeled and measureddata, arises from both the modeling error and the randomnoise, which may be assessed separately as reported in arecent article (36). The fitting procedure, generally basedon least-squares regression, renders the model-based para-metric mapping more robust (insensitive) to noise than thesemiquantitative parametric mapping. However, acciden-tal modeling of some of the random noise and covarianceerror in multiparameter curve fitting (37) may occur, espe-cially for data with low SNR. In contrast, for the semiquan-titative parametric mapping we do not estimate fittinguncertainties. Possible bias in the measurements of theparameter due to physiological and random noise becomesmajor concern, although SER images, in general, are inher-ently of higher SNR than other high temporal resolutionDCE-MRI data. It has been demonstrated that the voxelselection using empirical criteria (16) is effective in pre-venting errors resulting from noise. Figure 7 shows the kep
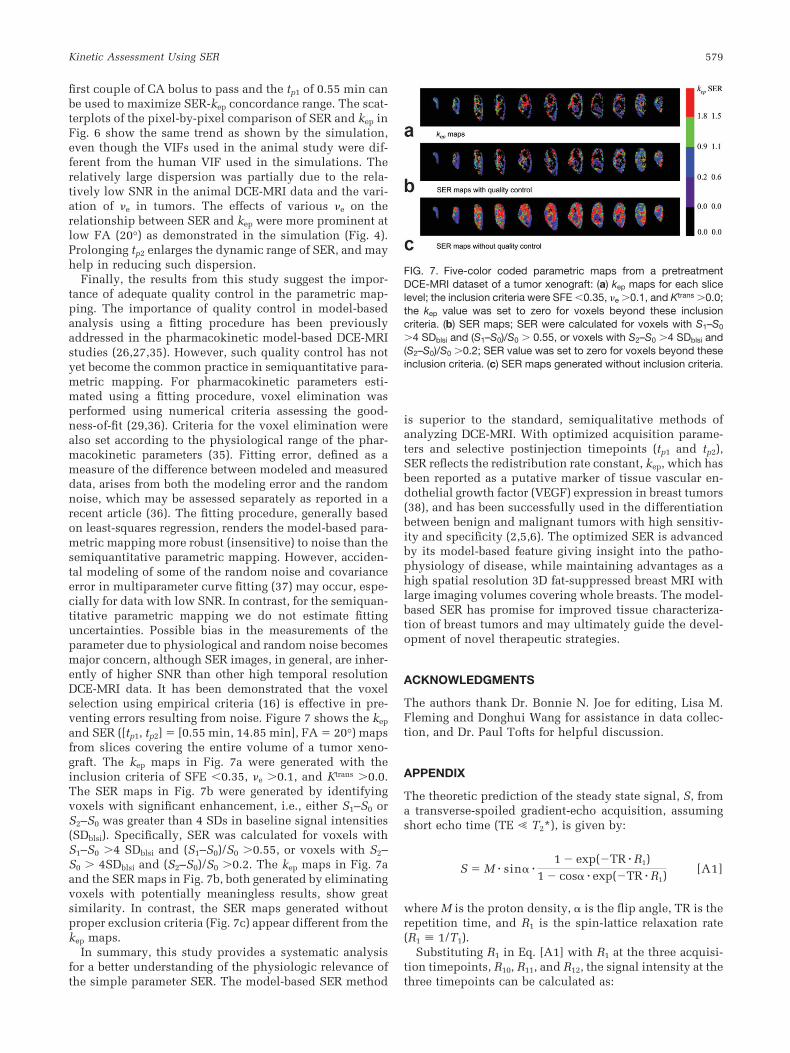
and SER ([tp1, tp2] � [0.55 min, 14.85 min], FA � 20°) mapsfrom slices covering the entire volume of a tumor xeno-graft. The kep maps in Fig. 7a were generated with theinclusion criteria of SFE �0.35, e 0.1, and Ktrans 0.0.The SER maps in Fig. 7b were generated by identifyingvoxels with significant enhancement, i.e., either S1–S0 orS2–S0 was greater than 4 SDs in baseline signal intensities(SDblsi). Specifically, SER was calculated for voxels withS1–S0 4 SDblsi and (S1–S0)/S0 0.55, or voxels with S2–S0 4SDblsi and (S2–S0)/S0 0.2. The kep maps in Fig. 7aand the SER maps in Fig. 7b, both generated by eliminatingvoxels with potentially meaningless results, show greatsimilarity. In contrast, the SER maps generated withoutproper exclusion criteria (Fig. 7c) appear different from thekep maps.
In summary, this study provides a systematic analysisfor a better understanding of the physiologic relevance ofthe simple parameter SER. The model-based SER method
is superior to the standard, semiqualitative methods ofanalyzing DCE-MRI. With optimized acquisition parame-ters and selective postinjection timepoints (tp1 and tp2),SER reflects the redistribution rate constant, kep, which hasbeen reported as a putative marker of tissue vascular en-dothelial growth factor (VEGF) expression in breast tumors(38), and has been successfully used in the differentiationbetween benign and malignant tumors with high sensitiv-ity and specificity (2,5,6). The optimized SER is advancedby its model-based feature giving insight into the patho-physiology of disease, while maintaining advantages as ahigh spatial resolution 3D fat-suppressed breast MRI withlarge imaging volumes covering whole breasts. The model-based SER has promise for improved tissue characteriza-tion of breast tumors and may ultimately guide the devel-opment of novel therapeutic strategies.
ACKNOWLEDGMENTS
The authors thank Dr. Bonnie N. Joe for editing, Lisa M.Fleming and Donghui Wang for assistance in data collec-tion, and Dr. Paul Tofts for helpful discussion.
APPENDIX
The theoretic prediction of the steady state signal, S, froma transverse-spoiled gradient-echo acquisition, assumingshort echo time (TE � T2*), is given by:
S � M � sin� �1 � exp(�TR � R1)
1 � cos� � exp(�TR � R1)[A1]
where M is the proton density, � is the flip angle, TR is therepetition time, and R1 is the spin-lattice relaxation rate(R1 � 1/T1).
Substituting R1 in Eq. [A1] with R1 at the three acquisi-tion timepoints, R10, R11, and R12, the signal intensity at thethree timepoints can be calculated as:
FIG. 7. Five-color coded parametric maps from a pretreatmentDCE-MRI dataset of a tumor xenograft: (a) kep maps for each slicelevel; the inclusion criteria were SFE �0.35, e 0.1, and Ktrans 0.0;the kep value was set to zero for voxels beyond these inclusioncriteria. (b) SER maps; SER were calculated for voxels with S1–S0
4 SDblsi and (S1–S0)/S0 0.55, or voxels with S2–S0 4 SDblsi and(S2–S0)/S0 0.2; SER value was set to zero for voxels beyond theseinclusion criteria. (c) SER maps generated without inclusion criteria.
Kinetic Assessment Using SER 579
S0 � M � sin� �1 � exp(�TR � R10)
1 � cos� � exp(�TR � R10)
S1 � M � sin� �1 � exp(�TR � R11)
1 � cos� � exp(�TR � R11)
and
S2 � M � sin� �1 � exp(�TR � R12)
1 � cos� � exp(�TR � R12)[A2]
The signal enhancement at tp1 is:
S1 � S0 � M � sin�
��exp(�TR � R11 � exp(�TR � R10))�cos� � 1
�1 � cos� � exp(�TR � R11)�1 � cos� � exp(�TR � R10)
[A3]
Similarly, the signal enhancement at tp2 is:
S2 � S0 � M � sin�
��exp(�TR � R12 � exp(�TR � R10))�cos� � 1
�1 � cos� � exp(�TR � R12)�1 � cos� � exp(�TR � R10)
[A4]
The ratio of signal enhancement at the two points is:
S1 � S0
S2 � S0
�exp(�TR � R11) � exp(�TR � R10)exp(�TR � R12) � exp(�TR � R10)
�1 � cos� � exp(�TR � R12)1 � cos� � exp(�TR � R11)
[A5]
For a short TR typically used for rapid acquisition and alow dose (0.1 mmol/kg) of Gd-DTPA administration, it canbe assumed that TR � T1; therefore, exp(-TR � R1) � 1-TR �R1. Eq. [A5] can be rewritten as:
S1 � S0
S2 � S0�
R11 � R10
R12 � R10�1 � cos� � cos� � TR � R12
1 � cos� � cos� � TR � R11[A6]
Remembering that C(tp1) � (R11 � R10)/ ℜ1 and C(tp2) �(R12 � R10)/ ℜ1, where ℜ1 is T1 relaxivity of Gd-DTPA, SERin tissues can therefore be expressed as:
SER �S1 � S0
S2 � S0�
C�tp1
C�tp2�1 � cos� � cos� � TR � R12
1 � cos� � cos� � TR � R11[A7]
By defining a factor, A, as SER/CACR, where CACR �C(tp1)/C(tp2), we can rewrite Eq. [A7] as:
A �SER
CACR
�1�cos� � cos� � TR � �R10 � C�tp2 � �1
1 � cos� � cos� � TR � �R10 � C�tp1 � �1). [A8]
REFERENCES
1. Collins DJ, Padhani AR. Dynamic magnetic resonance imaging of tumorperfusion. Approaches and biomedical challenges. IEEE Eng Med BiolMag 2004;23:65–83.
2. Knopp MV, Brix G, Junkermann HJ, Sinn HP. MR mammography withpharmacokinetic mapping for monitoring of breast cancer treatmentduring neoadjuvant therapy. Magn Reson Imaging Clin N Am 1994;2:633–658.
3. Tofts P, Berkowitz B, Schnall M. Quantitative analysis of dynamicGd-DTPA enhancement in breast tumours using a permeability model.Mag Res Med 1995;33:564–568.
4. den Boer JA, Hoenderop RK, Smink J, Dornseiffen G, Koch PW, MulderJH, Slump CH, Volker ED, de Vos RA. Pharmacokinetic analysis ofGd-DTPA enhancement in dynamic three-dimensional MRI of breastlesions. J Magn Reson Imaging 1997;7:702–715.
5. Mussurakis S, Buckley DL, Drew PJ, Fox JN, Carleton PJ, Turnbull LW,Horsman A. Dynamic MR imaging of the breast combined with analysisof contrast agent kinetics in the differentiation of primary breast tu-mours. Clin Radiol 1997;52:516–526.
6. Issa B, Buckley DL, Turnbull LW. Heterogeneity analysis of Gd-DTPAuptake: improvement in breast lesion differentiation. J Comput AssistTomogr 1999;23:615–621.
7. Zhu X, Hawnaur JM, Stringfellow J, Li K-L, Watson Y, Boggis CRM,Jackson A. Quantification of relative blood volume and endotheliumpermeability of breast neoplasm using dynamic MR imaging. In: Pro-ceedings of the 7th Annual Meeting of ISMRM, Philadelphia, PA, 1999.p 1076.
8. Su MY, Cheung YC, Fruehauf JP, Yu H, Nalcioglu O, Mechetner E,Kyshtoobayeva A, Chen SC, Hsueh S, McLaren CE, Wan YL. Correla-tion of dynamic contrast enhancement MRI parameters with microves-sel density and VEGF for assessment of angiogenesis in breast cancer. JMagn Reson Imaging 2003;18:467–477.
9. Brix G, Kiessling F, Lucht R, Darai S, Wasser K, Delorme S, Griebel J.Microcirculation and microvasculature in breast tumors: pharmacoki-netic analysis of dynamic MR image series. Magn Reson Med 2004;52:420–429.
10. Tofts PS, Kermode AG. Measurement of the blood-brain barrier perme-ability and leakage space using dynamic MR imaging. 1. Fundamentalconcepts. Magn Reson Med 1991;17:357–367.
11. Degani H, Gusis V, Weinstein D, Fields S, Strano S. Mapping patho-physiological features of breast tumors by MRI at high spatial resolu-tion. Nat Med 1997;3:780–782.
12. Kuhl CK, Mielcareck P, Klaschik S, Leutner C, Wardelmann E, GiesekeJ, Schild HH. Dynamic breast MR imaging: are signal intensity timecourse data useful for differential diagnosis of enhancing lesions? Ra-diology 1999;211:101–110.
13. Hylton NM. Vascularity assessment of breast lesions with gadolinium-enhanced MR imaging. Magn Reson Imaging Clin N Am 2001;9:321–332, vi.
14. Furman-Haran E, Degani H. Parametric analysis of breast MRI. J Com-put Assist Tomogr 2002;26:376–386.
15. Ah-See MW, Padhani AR. Dynamic magnetic resonance imaging inbreast cancer. In: Jackson A, Buckley DL, Parker GJM, editors. Dynamiccontrast-enhanced magnetic resonance imaging in oncology. Berlin:Springer; 2005. p 145–173.
16. Esserman L, Hylton N, George T, Weidner N. Contrast-enhanced mag-netic resonance imaging to assess tumor histopathology and angiogen-esis in breast carcinoma. Breast J 1999;5:13–21.
17. Bone B, Szabo BK, Perbeck LG, Veress B, Aspelin P. Can contrast-enhanced MR imaging predict survival in breast cancer? Acta Radiol2003;44:373–378.
18. Hylton NM. Vascularity assessment of breast lesions with gadolinium-enhanced MR imaging. Magn Reson Imaging Clin N Am 1999;7:411–420, x.
19. Tofts PS. Modeling tracer kinetics in dynamic Gd-DTPA MR imaging. JMagn Reson Imaing 1997;7:91–101.
20. Weinmann HJ, Laniado M, Mutzel W. Pharmacokinetics of GdDTPA/dimeglumine after intravenous injection into healthy volunteers.Physiol Chem Phys Med NMR 1984;16:167–172.
21. Tofts PS, Brix G, Buckley DL, Evelhoch JL, Henderson E, Knopp MV,Larsson HB, Lee TY, Mayr NA, Parker GJ, Port RE, Taylor J, WeisskoffRM. Estimating kinetic parameters from dynamic contrast-enhancedT(1)-weighted MRI of a diffusable tracer: standardized quantities andsymbols. J Magn Reson Imaging 1999;10:223–232.
580 Li et al.
22. Boos M, Scheffler K, Haselhorst R, Reese E, Frohlich J, Bongartz GM.Arterial first pass gadolinium-CM dynamics as a function of severalintravenous saline flush and Gd volumes. J Magn Reson Imaging 2001;13:568–576.
23. Jackson A, Jayson GC, Li KL, Zhu XP, Checkley DR, Tessier JJ, WatertonJC. Reproducibility of quantitative dynamic contrast-enhanced MRI innewly presenting glioma. Br J Radiol 2003;76:153–162.
24. Bottomley PA, Hardy CJ, Argersinger RE, Allen-Moore G. A review of1H nuclear magnetic resonance relaxation in pathology: are T1 and T2diagnostic? Med Phys 1987;14:1–37.
25. Parker GJ, Roberts C, Macdonald A, Buonaccorsi GA, Cheung S, Buck-ley DL, Jackson A, Watson Y, Davies K, Jayson GC. Experimentally-derived functional form for a population-averaged high-temporal-reso-lution arterial input function for dynamic contrast-enhanced MRI.Magn Reson Med 2006;56:993–1000.
26. Li KL, Wilmes LJ, Henry RG, Pallavicini MG, Park JW, Hu-Lowe DD,McShane TM, Shalinsky DR, Fu YJ, Brasch RC, Hylton NM. Heteroge-neity in the angiogenic response of a BT474 human breast cancer to anovel vascular endothelial growth factor-receptor tyrosine kinaseinhibitor: assessment by voxel analysis of dynamic contrast-enhancedMRI. J Magn Reson Imaging 2005;22:511–519.
27. Zhu XP, Li KL, Kamaly-Asl ID, Checkley DR, Tessier JJ, Waterton JC,Jackson A. Quantification of endothelial permeability, leakage space,and blood volume in brain tumors using combined T1 and T2* con-trast-enhanced dynamic MR imaging. J Magn Reson Imaging 2000;11:575–585.
28. Pickup S, Zhou R, Glickson J. MRI estimation of the arterial inputfunction in mice. Acad Radiol 2003;10:963–968.
29. Li KL, Zhu XP, Jackson A. Parametric mapping of scaled fitting error indynamic susceptibility contrast enhanced MR perfusion imaging. Br JRadiol 2000;73:470–481.
30. Li KL, Zhu XP, Waterton J, Jackson A. Improved 3D quantitative map-ping of blood volume and endothelial permeability in brain tumors. JMagn Reson Imaging 2000;12:347–357.
31. Meng X-L, Rosenthal R, Rubin DB. Comparing correlated correlationcoefficients. Psychol Bull 1992;111:172–175.
32. Horsfield MA, Morgan B. Algorithms for calculation of kinetic param-eters from T1-weighted dynamic contrast-enhanced magnetic reso-nance imaging. J Magn Reson Imaging 2004;20:723–729.
33. Jayson GC, Parker GJ, Mullamitha S, Valle JW, Saunders M, BroughtonL, Lawrance J, Carrington B, Roberts C, Issa B, Buckley DL, Cheung S,Davies K, Watson Y, Zinkewich-Peotti K, Rolfe L, Jackson A. Blockadeof platelet-derived growth factor receptor-beta by CDP860, a human-ized, PEGylated di-Fab’, leads to fluid accumulation and is associatedwith increased tumor vascularized volume. J Clin Oncol 2005;23:973–981.
34. Metzler CM. Usefulness of the two-compartment open model in phar-macokinetics. J Am Stat Assoc 1971;66:49–53.
35. Galbraith SM, Lodge MA, Taylor NJ, Rustin GJ, Bentzen S, Stirling JJ,Padhani AR. Reproducibility of dynamic contrast-enhanced MRI inhuman muscle and tumours: comparison of quantitative and semi-quantitative analysis. NMR Biomed 2002;15:132–142.
36. Balvay D, Frouin F, Calmon G, Bessoud B, Kahn E, Siauve N, ClementO, Cuenod CA. New criteria for assessing fit quality in dynamic con-trast-enhanced T1-weighted MRI for perfusion and permeability imag-ing. Magn Reson Med 2005;54:868–877.
37. Li KL, Jackson A. New hybrid technique for accurate and reproduciblequantitation of dynamic contrast-enhanced MRI data. Magn Reson Med2003;50:1286–1295.
38. Knopp MV, Weiss E, Sinn HP, Mattern J, Junkermann H, Radeleff J,Magener A, Brix G, Delorme S, Zuna I, van Kaick G. Pathophysiologicbasis of contrast enhancement in breast tumors. J Magn Reson Imaging1999;10:260–266.
Kinetic Assessment Using SER 581