Kewaunee Revision to Emergency Action Levels, 2.2 Location ...
661
2.2 LOCATION The site is in the Town* of Carlton in the southeast corner of Kewaunee County, Wisconsin, on the west shore of Lake Michigan. The city of Green Bay is about 27 miles WNW of the site. Milwaukee is about 90 miles to the SSW. It is located at longitude 870 32.I1W and latitude 440 20.61N, and is shown in Figure 2.2-1. The closest distance to the international boundary between Canada and the United States is approximately 200 miles northeast of the site. The site as shown on Figure 2.2-2 is all owned by WPS except for the highways and one cemetery site (1.13 acres) located on the highway north of the plant. Total acreage owned as plant site is 907.57 acres. The cemetery site is owned by and will remain in the ownership of the Town of Carlton with perpetual care provided by the Town. There are no dwellings or public buildings on the cemetery site. Wisconsin townships are referred to as Town of...... Rev. 16 12/01/2000 2.2-1
-
Upload
khangminh22 -
Category
Documents
-
view
1 -
download
0
Transcript of Kewaunee Revision to Emergency Action Levels, 2.2 Location ...

2.2 LOCATION
The site is in the Town* of Carlton in the southeast corner of Kewaunee County, Wisconsin, onthe west shore of Lake Michigan. The city of Green Bay is about 27 miles WNW of thesite. Milwaukee is about 90 miles to the SSW. It is located at longitude 870 32.I1W and latitude440 20.61N, and is shown in Figure 2.2-1. The closest distance to the international boundarybetween Canada and the United States is approximately 200 miles northeast of the site.
The site as shown on Figure 2.2-2 is all owned by WPS except for the highways and onecemetery site (1.13 acres) located on the highway north of the plant. Total acreage owned asplant site is 907.57 acres.
The cemetery site is owned by and will remain in the ownership of the Town of Carlton withperpetual care provided by the Town. There are no dwellings or public buildings on thecemetery site.
Wisconsin townships are referred to as Town of......
Rev. 1612/01/20002.2-1

2.6 HYDROLOGY
2.6.1 SUMMARY
The plant's circulating water is drawn from Lake Michigan. All radioactive liquid wastesgenerated at the plant are collected, treated and monitored in accordance with 10 CFR 20 so thatrelease concentrations at the circulating water discharge are maintained ALARA. The nearestpotable water intake is I Il/2 miles north at the Rostok Plant intake near Kewaunee. Circulatingwater released from the plant is diluted by a factor of approximately 60 by the time the waterflow reaches the Rostok intake, assuming an average lake current flow of 0.35 ft/sec. Thisdilution factor is calculated according to Equation (5) in Section 2.6.4.
As mentioned above, normal operation of the plant results in releases ALARA at the point ofdischarge, consequently, normal operation results in insignificant drinking water radioactivitycontent at the nearest point of such use. The Point Beach Nuclear Plant wastes, which are alsodischarged to the lake ALARA, produce a concentration of less than 2E-9 pCi/cc at the RostokPlant water intake. Consequently, the normal effluent to the lake waters from both plantssimultaneously is more than adequately diluted at the water intake near Kewaunee.
2.6.2 GENERAL LAKE HYDROLOGY
The normal water level in Lake Michigan is approximately 577.0 feet, based upon theInternational Great Lakes Datum, 1955 (IGLD, 1955). The maximum-recorded water level was582.3 feet in 1986 and the minimum recorded level was 575.4 feet in 1964. At the time IGLD1955 was established, it was recognized that this common datum would have to be periodicallyrevised due to isostatic rebound, sometimes referred to as crustal movement. Isostatic rebound isthe gradual rising or "bouncing back" of the earth's crust from the weight of the glaciers thatcovered the Great Lakes-St. Lawrence River region during the last ice age. This movement isvery gradual and has been occurring since the retreat of the glaciers.
The IGLD was revised to the 1985 standard (IGLD, 1985) when the standard was issued (1992).This new standard affects the reporting of water levels in Lake Michigan. The U.S. Army Corpsof Engineers has established a delta of 0.7 feet between the older standard (1955) and the newerstandard (1985) due to this rebound effect. Due to the simultaneous movement of the water andlandmass, there is no difference in the vertical position of the Kewaunee plant in relation to LakeMichigan. The difference exists in the currently reported water levels in relation to historicvalues. This is a result of the benchmark elevation changes due to adjustments for crustalmovement, more accurate measurement of elevation differences, a new reference zero pointlocation, and an expanded geodetic network. The zero point for IGLD 1985 is at Rimouski,Quebec.
Current, Tides, Waves and Littoral Drift (Reference 1)
On the west side of Lake Michigan, the surface current is largely parallel to the shore and nearly220 to the right of the prevailing wind. The predominant current direction near the western shore
USAR -Rev. 182.6-1 11/01/2003

during the period of greatest stratification is in the northerly direction. However, temporaryreversals of the general trend may take place (Reference 2).
Current velocity was measured (Reference 3) at 20-minute intervals from August to October,2-miles off the coast of Sheboygan. The measurements were taken from the surface of the lakedown to a depth of 30 feet. The observed persistence patterns for different current velocities areshown in Table 2.6-1. It is fairly certain that this pattern does not differ greatly during the othermonths of the year.
Tides on Lake Michigan created by the attraction of the moon and sun are insignificant. Thetotal range of oscillation does not exceed 2 inches. However, squalls may raise the surface ofthelake by several feet. Deep-water wave heights in the general vicinity of the site due to storms orseiches, and the expected frequency, are shown in Table 2.6-2. Waves are responsible for mostof the littoral drift on Lake Michigan. The predominant drift appears to be to the north.
Waves are potentially damaging to the shore structures from impact and run-up. Shore stabilityis well established as evidenced by the stable location of the shoreline over the long period oftime that records are available. Historical publications making reference to the lake commerce atthe site occupied by the Kewaunee plant, old photographs, and reports by old-time residents inthe area indicate that the shoreline has not changed significantly over the last sixty years. Themost recent occurrence of shore erosion was during construction of the plant in 1969. Waveerosion during a severe storm undercut the bank at the promontory protruding into the lake at thesoutheast end of the site. The damage was repaired and the bank was stabilized with large riprap,which also serves to protect the circulating water discharge.
The shore protection fronting the plant consists of riprap starting at the lake bottom at aboutElevation 575.0 feet, a layer of riprap, consisting of face stones about 1,500 pounds to 3 tonseach, is laid on the ground rock fill (a mixture of 50 pounds to 150 pounds graded rock and pitrun gravel) at a slope of 2.0 horizontal to 1.0 vertical and extends up to a 5-foot-wide promenadeat Elevation 586.0 feet.
From the shore side of the promenade a layer of riprap consisting of face stones about 500pounds each is laid at a slope of 1.5 horizontal to 1.0 vertical on the pit run gravel fill andextends up to the edge of the bank.
Specific gravity of the riprap is about 2.4 with a 2.3 minimum. All riprap stones have a2% maximum absorption, as per AASHO T-85 with a maximum abrasion loss of 45%.
In addition to the continuous riprap along the shoreline, riprap protection is also installed on bothsides of sheet-pile walls of the discharge structure and in the overflow canal immediately in frontof the screenhouse forebay.
At Kewaunee, the circulating water screenhouse-forebay structure is the plant structure nearest tothe shoreline and is the structure most likely to be affected by waves. The screenhouse-forebaystructure is located 180 feet from the normal shoreline. Waves cannot impact directly on the
USAR - Rev. 182.6-2 11/01/2003

structure. It is possible for wave run-up to reach the screenhouse-forebay structure on occasion.Wave run-up that reaches the screenhouse-forebay structure will have negligible effect and willneither endanger the structure nor adversely affect the operation of the circulating water system.Any water that reaches the screenhouse-forebay structure will spill harmlessly into thescreenhouse-forebay through the forebay overflow weir.
Computations of maximum wave run-up are based on information from the Office of the Chiefof Engineers (Reference 4). Wave height data given in Table 2.6-2 were used to establishmaximum expected run-up and frequencies of occurrence. The run-up at the Kewaunee site isthat for a protective beach, which in this case is the submerged and unsubmerged terrainextending from the plant into the lake. The beach is characterized by a rather uniform 1%slope. For maximum run-up there is a "significant wave" height which can be related to thedeepwater waves summarized in this section. In general, waves remain intact until bottominfluences near shore cause them to break. A wave's energy is transmitted relativelyundiminished until it breaks. Upon breaking, energy is rapidly dissipated on the unsubmergedbeach.
The analysis in Reference 4 was modified to determine hurricane surge height. This resulted in amaximum surge height of 1.9 feet, produced by the combined effects of wind andpressure. Based upon the study by the Corps of Engineers (Reference 20), the result isconsidered satisfactory. As previously stated, the maximum recorded lake level in the vicinity ofthe Kewaunee site is 582.3 feet. This figure in combination with the 1.9 foot storm surge resultsin a probable-maximum water level resulting from probable-maximum meteorological eventscoincident with maximum lake level of 584.2 feet. However, since most severe storms occurduring the winter months and highest lake levels usually occur during the summer months; theprobability of maximum level and maximum storm surge occurring simultaneously is relativelysmall, and therefore, the analysis is considered to be conservative.
The Atomic Energy Commission (AEC) independently calculated the maximum lake level forKewaunee to be 589.9 feet (see Reference 21). To accommodate this higher water level theKewaunee screenhouse was modified during original construction. These modificationsincluded:
1) two bulkhead type doors on exterior access doors to the screenhouse,2) screenhouse floor covers and manholes to be bolted down,3) low interior bulkheads,4) gasketed traveling water screen covers to be sealed and strengthened, and5) a 4-inch high ramp across the access tunnel to prevent seepage water from reaching the diesel
generator room.
These modifications were considered adequate by the AEC to prevent damage to safety-relatedequipment.
At the Kewaunee site, the "significant deep water wave" is 22.5 feet high and will probably havea period of 11.4 seconds. The wave will break in 28.1 feet of water, which occurs approximately
USAR - Rev. 182.6-3 11/01/2003

2000 feet from the shoreline at high water. The resulting maximum run-up, for maximum sizewaves attendant to probable maximum lake level, is at an elevation of 585.4 feet. The topelevation of the wall nearest the lake is 582.5 feet. This is the crest of the forebay overflow(shown in Figure 10.2-10). The top of the non-overflow section of the screenhouse-forebay is atan elevation of 592.5 feet. These wave run-up computations show that on rare occasions somewaves may reach the lakeward wall of the screenhouse-forebay structure. The depth of the waterreaching the wall will be minimal and will not contain sufficient energy to cause any structuraldamage. That part of the wave reaching the lakeward wall will spill harmlessly into thecirculating water forebay. No part of the wave will overtop the non-overflow part of the wall.
Investigations were made of the structures that could be possibly affected by the dynamic loadscaused by high lake levels. The bottom elevation of the discharge channel is 572.0 feet. Thus,the maximum water depth in the discharge channel is 11.8 feet. Based on the breaking wavetheory described in Reference 4, the maximum non-breaking wave that can enter the channel is9.22 feet, disregarding height limitations imposed by lake bottom topography. By applying theSainflow method for wave forces due to non-breaking waves described in the same reference, thecalculated maximum wave force acting on the discharge structures such as concrete wall andsheet piling, is about 15 psi which is well within the capability of these structures.
Regarding the wave force on the screenhouse structure, the maximum waves, which canpenetrate into the forebay, are much lower because of shallow water depth in the overflowchannel. The maximum non-breaking wave height reaching the forebay is only 1.90 feet. Thecalculated dynamic force is less than 1.0 psi, which is well below the force, which this structurecan absorb.
The discharge structure, intake crib and screenhouse have been designed for the dynamic forcescaused by the probable maximum lake level conditions or conditions which exceed themaximum lake level conditions.
These structures are discussed in greater detail below.
Discharge Structure
The major element of the discharge structure subject to the effects of high water is the sheet pilewall forming the afterbay. The condition determining the design of the sheet piling was theconstruction condition, which is as follows:
1. Computed back fill (Moist Granular Sand) behind sheets to elevation 582 feet and oppositeside excavated to elevation 564 feet. This produced a cantilevered sheet pile design, whichwas the critical condition.
Since the elevation of the top of the sheets varied from 586.5 feet to 577 feet, it was determinedthat dynamic forces due to wave action after completion of construction would not be as severeas the construction condition. Dynamic forces due to the maximum lake level condition was not
USAR- Rev. 182.6-4 11/01/2003

considered during the construction condition because the entire discharge construction work wasprotected by a cofferdam.
The concrete work of the discharge structure was designed for the following dynamic loading.
1. Ice pressure of 10-kpf thrust due to expansion of an 18-inch thick sheet of ice. This loadingwas applied to the east side of the structure and is based on information in Vol. 112 ASCETransactions 1947, Thrust Exerted by Expanding Ice Sheet by E. Rose, utilizing thefollowing assumptions:
a. Ice Thickness - 18 inchesb. Solar Energy Consideredc. Rate of Air Temperature Rise - 100F Per Hourd. Complete Lateral Restraint of Ice Sheet Exists
2. Baffle pier walkway was designed for an uplift pressure of 200 psf due to surge.
3. Baffle wall was designed for a uniformly applied horizontal load of 70 psf due to surge.
Screenhouse
The relative location of the screenhouse with respect to the shoreline eliminated the necessity forapplying dynamic load conditions due to probable maximum lake level conditions. Whereapplicable, the maximum static high water level conditions were considered throughout thedesign of the screenhouse.
Intake Crib
The intake crib top is about 20 feet below still water level during the probable maximum waterlevel. Therefore, there is no possibility that wave dynamic forces will endanger this structure.
Pack ice, in the form of frozen spray and ice floes, has been reported to a height of 20 feet at theshore by local residents. No measurements of the extent or depth of the pack ice have beenmade, and no official observations or records have been kept by any agency to verify the reportsof local residents. The extent of the pack ice was established by interviewing land ownersbordering the site from which it was determined that the maximum offshore extent of pack iceranges between approximately 800 feet to 950 feet. It is shown in Table 2.6-2 that 17-foot wavesmay be expected on Lake Michigan once each ten years. If such waves occurred towards theshore at a time of ice break-up on the lake (a very remote possibility), it is conceivable that therewould be some ice pile-up on the shore. Experience at three plants of the Wisconsin ElectricPower Company on Lake Michigan has shown that no significant problems have arisen fromicing as a result of design features incorporated in these plants. The Kewaunee Plant designincorporates features to insure a continuous supply of cooling water.
USAR - Rev. 182.6-5 11/01/2003

Lake Temperatures and Effect of Warm Watcr Discharges
The temperature stratification and circulation patterns of water in Lake Michigan have verydistinct characteristics, as follows:
At the beginning of March, a warming trend starts in the lake water and at the end of May all ofthe water in the lake has reached approximately 40'F, which is the temperature of maximumwater density. Until the temperature reaches this point, the surface water is colder than thedeeper water in the lake. The colder surface water, which remains at approximately 340F, islighter than the 40'F deeper water. This layer of colder water circulates on the surface of thewarmer deep water, reaching depths of 25 to 30 feet from the surface.
When all the water in the lake reaches approximately 40'F, the thermocline layer disappears andthorough mixing of the water in the lake takes place. However, when the ambient airtemperature warms up the surface water, a thermocline layer is formed again at depths of 30 to50 feet from the surface.
This occurs from May to July and at this time parts of the water in the lake reach 650F to70'F. Consequently, the warmer and lighter surface water circulates above the denser andrelatively stagnant 40'F water at the bottom of the lake. This condition continues until a coolingtrend starts in September, reaching a peak about the last part of January, at which time the waterin the lake again reaches an overall temperature of 40'F. At this time, mixing of the waters inthe lake takes place until a colder and lighter layer of surface water starts to build up. Seasonallake temperatures are given by Church (Reference 5 and 6).
The circulating water intake is a submerged crib-type intake located in approximately 15 feet ofwater. A thermocline does not exist in the vicinity of the intake since it is located at depthsgreater than the intake structure. Summertime water temperatures are generally above thethermocline. Historical data for lake water temperatures applied to the Kewaunee site were takenfrom the city of Green Bay's Rostok intake located near Kewaunee, at approximately 50-footwater depth. The water temperatures at the Rostok intake are generally above the thermocline.
The circulating water discharge facility is an onshore structure discharging at the shoreline anddesigned for minimum impact on the lake environment. The discharge at the shore edge is froma 40-foot wide channel, 5 feet deep (at normal lake level). Design outlet velocities range from aminimum 2.5-fps to 4.7-fps. The discharge structure provides the termination forthe circulatingwater discharge pipe, a transition from the 120-inch pipe to the open discharge bay, and theoutlet to the lake. The discharge bay (or afterbay) receives the discharge circulating water fromthe submerged pipe transition outlet. At the upstream end, the floor of the discharge bay rises asthe sides widen. The downstream portion of the discharge bay is a rectangular channel, 40 feetwide. The discharge bay is normally 5 feet deep but may range from a minimum of 3.4 feet atlowest lake level to 9.9 feet at highest lake level. With two pumps in operation, the discharge is420,000 gpm but on occasion may be 220,000 gpm with one circulating water pump operating.The discharge flows into the shallow beach area, and generally tends to stratify at the surface.Flow disperses away from the discharge point mixing with the cooler substrata, as water depths
USAR - Rev. 182.6-6 11/01/2003

become greater. Surface water temperatures will decrease as distance from the plant increases.This apparent cooling is the combined effect of mixing and heat loss to the air. At approximatelyI mile from the plant, surface water temperature returns to within one degree of the laketemperature.
2.6.3 GENERAL SITE HYDROLOGY
Rainfall
Lake Michigan and Lake Huron are considered a unity from the standpoint of drainage and waterlevel since these two lakes are connected. The drainage basin for these two lakes comprises115,700 square miles and has an average annual rainfall of about 31 inches. The average andmaximum precipitation recorded at various locations on the Wisconsin Shore of Lake Michiganis given in Table 2.6-3.
Floods
There are no large rivers or streams in the vicinity of the site. The major part of the site is 20 feetor more above the normal lake level, and there is no record that it was flooded by the lake atanytime.
The small stream directly south of the plant is one of several drainage channels lying in theimmediate vicinity of the plant, that drain storm water from a high ridge located some 7,000 feetwest. The close proximity of these drainage channels and their associated drainage areas relievesthe total maximum floodwater flow to the plant drainage channel.
The maximum probable rainfall may be determined from the one-hundred-year hourly rainfallintensity of 2.5 inches as shown in the "Rainfall Frequency Atlas of The United States",Technical Paper No. 40, U.S. Weather Bureau, which compares favorably with the greatesthourly rainfall shown in the Weather Bureau records for Green Bay, Wisconsin. (Total recordavailable at time of license application was 10 years.)
The maximum hourly rainfall intensity falls on the area drained by the plant channel which iscentered between two other channels; one lying immediately north of the plant area and oneimmediately south. The drainage area is pie-shaped, with its nose at the westerly high ridge, andits base at the Lake Michigan shoreline. The total area is not more than 640 acres.
The drainage channel has an effective length of 1 mile and averages 30 feet in width. Thechannel only flows during heavy rains. The side contours of the ditch are such that a depth of 4feet of water can be carried through the plant area without overflowing.
In considering the maximum probable runoff, the rational method was used and was then relatedto the interval of time, starting from the onset of the period of precipitation for the runoff fromthe most remote portion of the drainage area. This time interval, when related to a maximum
USAR - Rev. 182.6-7 11/01/2003

hourly rainfall intensity, results in a rainfall equivalent of 1.75 inches per hour. (From Rouse"Engineering Hydraulics", Chapter IV, Hydrology.)
Thus, using the rational method, the peak run to the drainage channel is 336 CFS. The peak flowthat the drainage ditch can handle, without overflowing, is 466.53 CFS. It was concluded that noflooding of the plant could occur from the probable maximum flood flow.
Based on the improbability of flooding from rain and the height of the safety equipment abovethe maximum lake water level (585.5 feet), it was concluded that flooding is not a problem. Anysafety equipment that is located below ground level is further protected by plastic sheetingassociated with the concrete construction.
Flooding of the service water pumps, circulating water pump room, and plant access tunnel is notprobable. These are shown in Figure 10.2-10. The maximum probable water levels that canoccur in the open forebay under the most adverse weather conditions either from pump-tripupsurge (585.5 feet) or from maximum wave run-up (585.4 feet) are below the floor level(586.0 feet) of the service water pump room and access tunnel. The only flood water access tothe circulating pump room is from this floor level. Hence, none of these areas are subject toflooding.
A review and re-evaluation of external flooding was performed in response to Generic LetterGL 88-20, Individual Plant External Events (IPEEE) for Severe Accident Vulnerabilities andresolution of generic issue GI-1 03, Design for Probable Maximum Precipitation (PMP). Using arevised PMP of 16.5 inches per hour, it was concluded that the site continued to have adequatedesign capability to handle the 100-year hourly rain intensity, which historical experience has notchallenged (Reference 26).
Ground Water
Observations of surface drainage and water levels at the site borings indicate that the staticground water level inland from the lake ranges from 10 to 25 feet below the ground surface. Thewater table at the site generally slopes to the east, indicating a migration of ground water in thatdirection. At the base of the bluffs, ground water levels are controlled by the elevation of LakeMichigan.
The regional movement of ground water is from west to east. Therefore it is unlikely thatdischarge into the aquifers at the site would affect any municipal well fields. Fluctuations in thelevel of Lake Michigan are not of sufficient magnitude to affect the direction of ground watermovement. Heavy pumpage from the glacial drift or the Niagara dolomite aquifers in the vicinityof the site would reverse the direction of ground water movement for a distance of only a fewhundred yards.
Because of the clay composition of the glacial drift, it is not likely that appreciable amounts ofany surface discharge from the plant would seep into the ground. Most of the effluent wouldflow into Lake Michigan.
USAR - Rev. 182.6-8 11/01/2003

The principal water-bearing formations underlying the site are the glacial drift and Niagaradolomite aquifers, which are described in detail in Appendix A.
Potable Water Sources
Lake Michigan is used as the source of potable water supplies in the vicinity of the site for thecities of Two Rivers (13 miles south) and Green Bay (intake at Rostok 11.5 miles north). Noother potable water uses are recorded within 50 miles of the site along the lakeshore. All publicwater supplies drawn from Lake Michigan are treated in purification plants with steps consistingof chemical addition of alum, activated carbon, mechanical mixing, flocculation, sedimentation,filtration and disinfection. The nearest surface waters used for drinking, other than LakeMichigan, are the Fox River at a point 43 miles west and Lake Winnebago 40 miles west of thesite.
Ground water provides the remaining population with potable supplies. Public ground watersupplies within a 20-mile radius of the site are listed in Table 2.6-4. Additional wells for privateuse are in existence throughout the rural region.
The sole users of ground water to be found within the general area of the plant are farmresidences. No public water supplies, nor any surface water users, are to be found within thisarea.
However, those users relative to the plant, as shown in Figure 2.6-1, are only those rural wellslocated in the south half of Sections 23 and 24, in the west half of Sections 26 and 35, and thesouth half of Section 36 (all in T22N).
No public record of these wells has been made. It is known, however, that about half of the wellswithin the general plant area use ground water found in a glacial drift that lies about 100 feetbelow ground level. This drift consists of clayey soils inter-bedded with water bearing sand andgravel out washes. These out washes are irregular and arc not continuous at the plant site. Thewells that draw from this glacial drift are typically 6 inches in diameter and 100 feet deep.
Each well typically produces about 17 gallons per minute. There are a total of 18 wells thatrelate to the plant site, of which only 17 are ground water users; therefore, water usage fromground water sources is (18 + 2) x 17, or 153 gallons per minute, and 220,320 gallons per day.
Fishing (Reference 7)
Commercial fishing in Lake Michigan has decreased in the last twenty-five years due toproliferation of the sea lamprey, causing a reduction in lake trout and an increase in less desirablerougher species of fish. Alewives, chubs and yellow perch accounted for 89% of the 1968production from Lake Michigan. Efforts are being made by various organizations to reduce thesea lamprey population and increase the abundance of edible fish.
USAR -Rev. 182.6-9 11/01/2003
Fishing is practiced generally throughout the lake. Fishing depths are greater than 12 fathoms(72 feet). These depth restrictions place the fishing grounds at least 5 miles offshore. Inshorefishing is licensed occasionally when alewives (a shad-like food fish) are schooling in along theshore. This fish is used mostly for fertilizer and fishmeal manufacture.
Fishing in Lake Winnebago (40 miles west of the site) is confined primarily to rough species;most of which go to mink ranchers in the area for use as animal food.
Sport fishing is one of Wisconsin's prime tourist attractions. It may be considered as existingthroughout the state and along all shoreline areas of the lake. Brown, rainbow, lake trout,chinook and coho salmon accounted for 95% of the sport fishing catch in 1980.
2.6.4 DILUTION AND DIFFUSION IN LAKE MICHIGAN
Water from Lake Michigan is used extensively for municipal and domestic water supplies. Asdescribed in Section 11, all radioactive liquid wastes generated at the plant are collected andtreated for possible reuse and monitored before being discharged from the site. All liquid wasteis released consistent with KNPP's ALARA commitment before it reaches the nearest watersupply intake. The nearest municipal and domestic water intakes are located at Rostok and TwoRivers (approximately 11.5 miles north and 13 miles south of the site, respectively).
Radioactivity discharged to the plant circulating water can occur in two modes. The first is thenormal controlled release of small amounts of activated corrosion products and fission productsinto the circulating water stream. The second, conceivable only as a result of an operating erroror equipment failure, may be regarded as a short-term release before the waste release is shut off.
Computational models for evaluating the dilution of both types of radioactive releases arediscussed below.
Short Term Release
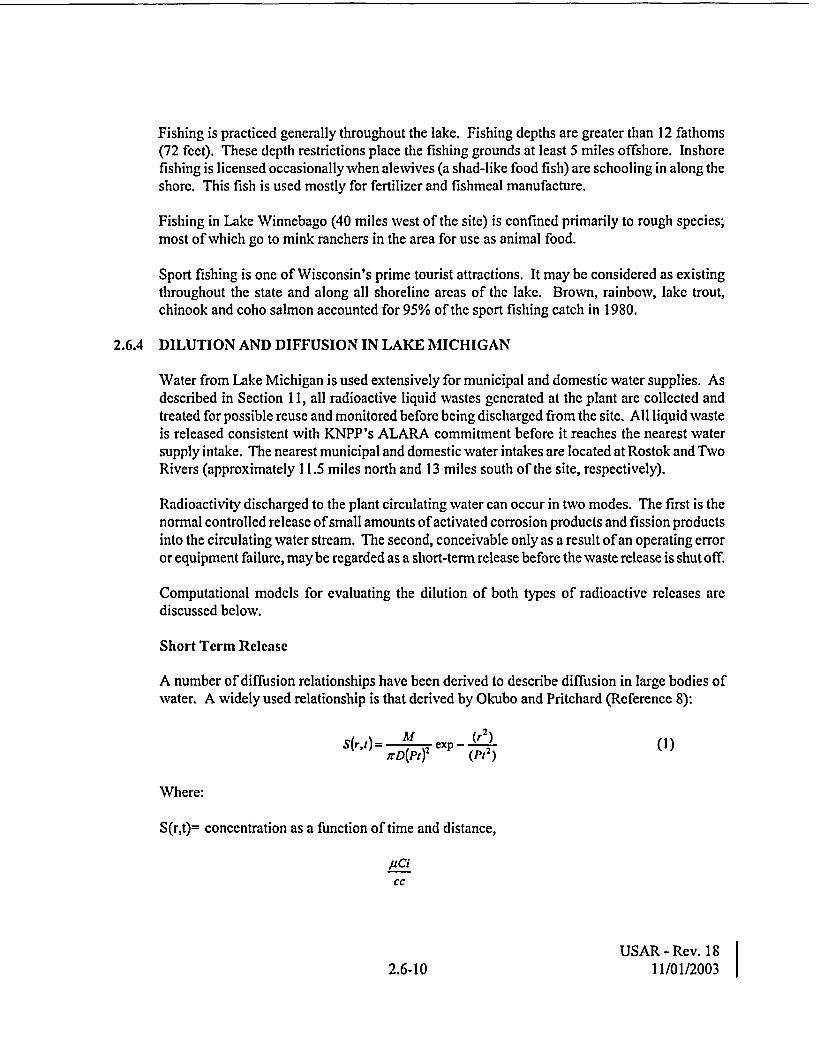
A number of diffusion relationships have been derived to describe diffusion in large bodies ofwater. A widely used relationship is that derived by Okubo and Pritchard (Reference 8):
S(ra) cM exp- (r 2) (1)S Yr~t=D(PI)2 CXp----2 I
Where:
S(r,t)= concentration as a function of time and distance,
p4icc
USAR - Rev. 182.6-10 11/01/2003

M = total activity release, XCi
D = depth of mixing layer, cm
P = diffusion velocity, cm/sec
r = distance downstream from release point at which S is determined, cm
t = time after start of release, sec
Experimental measurements in Lake Ontario for the Ginna Nuclear Station resulted in estimatesof the diffusion velocity ranging from 0.2 to 2 cm/sec.
Based on studies of Lake Michigan currents and water masses (Reference 1) it was determinedthat the mixing depth of the lake is 25 to 50 feet, depending on the time of the year.
For the purposes of this analysis, it was assumed that:
P 0.5 cm/secD 103 Cm
Furthermore, since the conditions of most interest are those that will transport the radioactivematerial along the shore rather than into the open reaches of the lake, the equation forconcentration is multiplied by a factor of 2. This factor accounts for the restricted diffusion inthe direction of the shore.
The peak concentration at any given time can be assumed to exist at the center (origin) of thedrifting plume and is a function of time only:
Sat = 2M (2),rlk D(Ply
The velocity of the current and its persistence at various speeds has been discussed previously(Section 2.6.2). An average velocity calculated from these values is approximately0.35 ft/sec. The peak concentration as a function of distance from the site, assuming this averagecurrent velocity, is given in Table 2.6-5.
As required by 10 CFR 20, the annual average concentrations of unknown radionuclides inunrestricted areas must not exceed 2E-9 ACi/cm3. It may be seen that short-period release ofradioactivity at the site will be diluted at the nearest municipal water intake (11.5 miles) to apeak concentration of 8.54E- 14 giCi/cm3 per gCi of activity released. Furthermore, it should benoted that the above concentration would be a transient value and not the average concentration,which would enter the water intake.
USAR - Rev. 182.6-11 11/01/2003 I
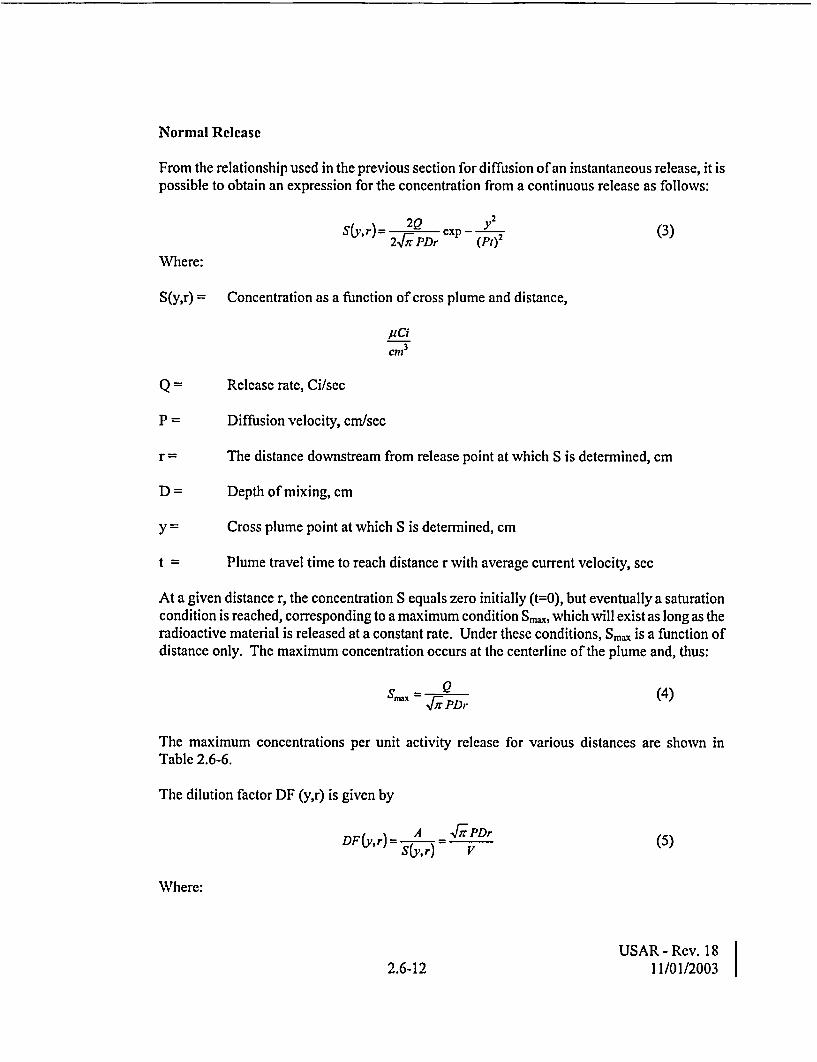
Normal Release
From the relationship used in the previous section for diffusion of an instantaneous release, it ispossible to obtain an expression for the concentration from a continuous release as follows:
S(y,r)= 2Q exp - Y2 (3)2,r;1rPDr (p)
Where:
S(y,r) = Concentration as a function of cross plume and distance,
pcicm3
Q = Release rate, Ci/sec
P Diffusion velocity, cm/sec
r = The distance downstream from release point at which S is determined, cm
D = Depth of mixing, cm
y = Cross plume point at which S is determined, cm
t Plume travel time to reach distance r with average current velocity, sec
At a given distance r, the concentration S equals zero initially (t=O), but eventually a saturationcondition is reached, corresponding to a maximum condition 5max, which will exist as long as theradioactive material is released at a constant rate. Under these conditions, S ,, is a function ofdistance only. The maximum concentration occurs at the centerline of the plume and, thus:
S." = 1 (4)fit; PD,
The maximum concentrations per unit activity release for various distances are shown inTable 2.6-6.
The dilution factor DF (yr) is given by
DF (y, r) = A PD,
Where:
USAR - Rev. 182.6-12 11/01/2003

Q= AV
V = Discharge volume in cc/sec
A = Activity concentration ,iCi/cc
Using equation (5), it is calculated that a continuous discharge of radioactivity from the plantwould be diluted by a factor of approximately 60 by the time the flow reached the nearestmunicipal drinking water intake, based on a 420,000 gpm circulating water flow.
The effluent from the Point Beach Nuclear Plant (4.5 miles south of the site) has not created anysignificant problems. Although lake flow is normally in the direction from the Point Beach sitetoward the Kewaunee site, the concentration of any radioactivity in the effluent from the PointBeach Plant will be diluted by a factor of 35 by the time the effluent reaches the Kewaunee Plantintake, based on a discharge flow from the Point Beach plant of 300,000 gpm.
USAR - Rev. 182.6-13 11/01/2003

5.2 CONTAINMENT SYSTEM STRUCTURE DESIGN
5.2.1 REACTOR CONTAINMENT VESSEL DESIGN
Design Conditions
The Reactor Containment Vessel is designed for a maximum internal pressure of 46 psig anda temperature of 2681F. The Reactor Containment Vessel design internal pressure as definedby ASME Boiler and Pressure Vessel Code is 41.4 psig.
The vessel is 105 ft. inside diameter, 206 ft. high, and contains an internal net free volume of1,320,000 V3.
The vessel plate nominal thickness does not exceed I '2" at the field welded joints so thevessel, as an integral structure, did not require field stress relieving. The hemispherical domeis 3/4" thick and the ellipsoidal bottom is 1 /2" thick. A polar crane of 230 tons capacity ismounted on a girder attached to the vessel wall. Reinforcing plates at penetration openingsexceed I '/2" in thickness; however, these were fabricated as penetration weldment assembliesand were stress-relieved before they were welded to adjacent vessel shell plates.
The following loadings were considered in the design of the Reactor Containment Vessel, inaddition to the pressure and temperature conditions described above:
* Dead Loads* Design Basis Accident (DBA) Loads* Operating Loads+ External Pressure Loads* Seismic Loads* Foundation Deformation Loads* Internal Test Pressure* Thermal Stresses (in steel shell due to temperature gradients)* Pipe Reaction and Rupture Forces
Design Leakage Rate
The Reactor Containment Vessel, including penetrations, is designed for low leakage. At thecompletion of erection, the Reactor Containment Vessel was tested with the penetrationscapped. The measured leakage rate was 0.02% of the Reactor Containment Vessel's net, freevolume at a nominal internal pressure of 46 psig. The Reactor Containment Vessel wasre-tested with all penetrations installed to assure that the leakage requirements as set forth inthe analysis of Section 14, have been met. Testing is described in Section 5.7.
Rev. 165.2-1 12/01/2000

Design Loadings
Dead Loads
Dead loads consist of the dead weight of the Reactor Containment Vessel and itsappurtenances, the weight of internal concrete, and the weight of structural steel andmiscellaneous building items within the Reactor Containment Vessel.
Weights used for dead load calculations are as follows:
* Concrete: 143 PCF* Steel Reinforcing: 489 PCF using nominal cross-section areas reinforcing
bar sizes as defined in ASTM A 615* Steel Containment Vessel: 489 PCF
Design Basis Accident (DBA) Loads
This load was determined by analysis of the transient pressure and temperature effects thatcould occur during the Design Basis Accident (see Section 14.3.4).
Operating Loads
Operating loads include the following:
* Gravity loads from all equipment and piping,* Weight of water in the refueling cavity,+ Weight of crane,* Loads resulting from the restraint of the free movement of the vessel at the line of
embedment in concrete,* Piping reactions at nozzles resulting from thermal movement.
The analysis of piping reaction forces acting on the steel shell penetration nozzles is based onthe algebraic summation of the loading and movements derived from the analysis of thecontainment vessel, interior and exterior structures, and the attached piping systems.
This analysis included:
1. Piping systems under dead load, live load, thermal, and seismic conditions.
2. Containment vessel and interior and exterior structures under dead load, live load,thermal and seismic conditions.
The analysis considered the interactions between the exterior and interior structures and thecontainment vessel and included any reversal of penetration reaction forces that could occur.
Rev. 165.2-2 12/01/2000

Major piping systems are not anchored to the containment shell, but are allowed to movefreely through the shell penetration. Indirect piping loads on the penetration bellows that areused to seal these systems at the containment boundary have been included in thecontainment vessel penetration analysis and design.
Piping systems that are directly attached to the containment shell (without expansionbellows) are of small pipe sizes and are of such geometry and design as to be flexiblesystems imposing minimal loads on the containment shell.
The moment, shear, and radial thrust structural capabilities of all the vessel shell penetrationshave been analyzed by the Chicago Bridge and Iron Co. and have been provided anddocumented in the Containment Vessel Stress Report on file at the site.
The appropriate combinations of loads, moments, shears, and radial thrusts have been appliedto the vessel penetrations in conjunction with the operating load parameters of the pipingsystem analysis. The resulting stresses were found to be within suitable margins of thespecified design criteria so as to preclude any damage to the steel shell or any anchoragesystem.
Equipment loads used were those specified on the drawings supplied by the manufacturers ofthe various pieces of equipment. Floor loadings for the design of internal slabs are consistentwith their intended use.
External Pressure Load
During normal operation, annulus pressure will be essentially ambient barometricpressure. The Reactor Containment Vessel's shell plates are of suitable thickness to meet thespecified internal pressure requirements and are capable of withstanding an external pressuredifferential of 0.8 psi in accordance with Section VIII of the ASME Boiler and PressureVessel Code.
Automatic vacuum relief devices are used to prevent the Reactor Containment Vessel fromexceeding the external design pressure in accordance with the requirements of the ASMEBoiler and Pressure Vessel Code, Section 111, Article 17.
During and following the Design Basis Accident, the annulus pressure will not exceed 1-inchwater column positive or 5-inches water column negative. These values include results ofanalysis examining the effects of a single failure in the Shield Building Ventilation System.
Two valves in series are used in each of two lines to the annulus. One valve is actuated by adifferential pressure signal and is independent of electrical power. The second valve is self-actuating. The vacuum breaker system is sized to provide air flow into the ReactorContainment Vessel at a rate to meet the following conditions, assumed to occursimultaneously without exceeding the maximum internal pressure differential (vacuum) of0.8 psi below the external pressure:
Rev. 165.2-3 12/01/2000
a. Atmospheric pressure increasing at a rate equivalent to the maximum recorded by thenearest weather station,
b. Internal air being cooled at the maximum rate expected with all four fan-coil units andboth internal spray units operating, with cooling water temperatures of 551F for sprayunits and 321F for fan-coil units;
c. No heat energy entering the containment atmosphere.
The vacuum breaker system has sufficient capability to meet single-failure design criteria,and is capable of proper functioning during a Design Basis Earthquake.
Seismic Loads
Seismic loads were computed using the following:
a. Operational Basis Earthquake seismic ground acceleration of 0.06g horizontal; (seeAppendix A)
b. Design Basis Earthquake seismic ground acceleration of O.12g horizontal.
A vertical component of 2/3 of the horizontal ground acceleration is applied simultaneouslywith the horizontal acceleration.
The Reactor Containment Vessel earthquake design included the seismic effects of theinertial mass of the air locks and equipment hatch, and the seismic effects of the air locksvibrating as an independent system. The independent vibration effects are considered to actin two directions:
a. Along the longitudinal axis of the air lock
b. In the rotational direction about the point of support on the vessel shell.
The seismic effects of the inertial mass of the crane is included in the Reactor ContainmentVessel earthquake design.
The plots of the seismic response spectra are shown in Appendix A. The classification ofplant structures and equipment and the applicable damping factors are shown in Appendix B.
Foundation Deformation Loads
During grouting, while the Vessel was supported on temporary columns, deformations of thebase slab due to the weight of grout were not imposed on the Reactor Containment Vessel.Deformations of the base slab at this time were accommodated by the manner in which thegrout was placed.
Rev. 165.2-4 12/01/2000

The bottom internal deck structure that was fitted to the inside contour of the vessel bottom,the grout base that confines the outside of the vessel bottom, and the heavily reinforced slabfoundation mat formed a stiff integral structural system capable of transmitting all internalbuilding loads directly into the supporting soil without relative deformation of the system.
Internal Test Pressure
The vessel was designed to be internally pressure tested on temporary supports. The vesselcan also be tested to 46 psig at any time during its service life with the reactorshutdown. Prior to reactor operation the vessel was tested at an over-pressure of 51.8 psig.
Pipe Reaction and Rupture Forces
Pipe ruptures were postulated in the high pressure portions of all piping systems and theresulting jet forces considered in the design of the containment vessel and vesselpenetrations.
In the design of the vessel shell, consideration was given to potential hazards from jetimpingement resulting from ruptures of adjacent piping. The force of the jet impinging uponthe vessel was computed as a function of distance from the hypothetical rupture. All highpressure piping within containment was examined to assure that the selected routingsimposed no potential hazard.
The combination of loading which are to include pipe rupture forces (faulted condition), andthe associated stress limits, are given in Appendix B. The load combinations to beconsidered are given in Table B.7-5 and the associated stress limits given for pressure vesselsin Table B.7-2.
Thermal Stresses in Steel Shell Due to Temperature Gradients
The steel shell in the knuckle region was designed for the combined pressure and temperaturegradients present.
Codes
Design Codes
The design, fabrication, inspection, and testing of the Reactor Containment Vessel complywith the requirements of the ASME Boiler and Pressure Vessel Code, Section II, Materials;Section III, Nuclear Vessels, Subsection B, Requirements for Class B Vessels, and applicableparagraphs of Appendix IX, Nondestructive Examination Methods; Section VIII, UnfiredPressure Vessels; and Section IX, Welding Qualifications.
The Reactor Containment Vessel design and construction meet all the requirements of stateand local building codes.
Rev. 165.2-5 12/01/2000

Vessel Classification
The Reactor Containment Vessel is a Class B vessel as defined in the ASME Boiler andPressure Vessel Code, Section III, Nuclear Vessels N-132.
Code Stamp
The Reactor Containment Vessel is code-stamped for pressures of both 46 psig and 41.4 psigin accordance with Paragraph N-1500, ASME Boiler and Pressure Vessel Code, Section III.
Materials
The Reactor Containment Vessel is fabricated of SA 516 Grade 70 steel plate meeting SA300 requirements except that impact test requirements are as specified in the ASME Boilerand Pressure Vessel Code, Section III, N-1211 (a) for a minimum service metal temperatureof 301F.
Charpy V-Notch specimens (ASTM A 370 Type A) used for impact testing materials of allproduct forms were in accordance with the requirements of the ASME Boiler and PressureVessel Code, Section III, N-330. All material except austenitic stainless steels or non-ferrousmetal associated with the Reactor Containment Vessel have an NDT temperature of at least00F or less when tested in accordance with the appropriate code for the material.
The containment vessel has been specified to have Charpy V-notch temperature requirementsnot higher than 00F. Charpy V-notch test data which demonstrate that the nil-ductilitytransition temperature is at least as low as 00F are to be found in a voluminous record ofimpact test data on file at the site.
The Shield Building, as described in Section 5, protects the entire containment vessel fromdirect exposure to the outside atmosphere. An analysis of temperature gradients across theshell itself, the bulk air within the annulus, and the Shield Building (assuming an outsidetemperature of -20'F) shows that an internal containment air temperature of 380 F results in ashell temperature of 301F. Containment air temperature of 381F or less is not consideredcredible for the following reasons:
a. Containment air temperatures are periodically monitored to verify proper operation of thecontainment air cooling system and, if necessary, manual action can be taken to preventovercooling.
b. The heat load from internal equipment within containment is approximately 4E+6 Btu/hr,while the heat loss to the surroundings at -201F is 4.7E+5 Btu/hr. This suggests that thecontainment air could be heated at a rate of 3.81F/min if the fan coil units are notremoving heat. Thus the operating equipment provides an excellent heat source forassuring an adequate operating temperature of the containment vessel shell.
Rev. 165.2-6 12/01/2000

c. The containment purge and ventilation system heaters are designed to supply 751F air ata rate of 33,000 CFM. The equivalent net heat input of this system is 1.3E+6 Btu/hr withrespect to the lowest permissible containment air temperature 381F. Since this heat inputis almost a factor of 3 higher than the heat loss of 4.7E+5 Btu/hr, the containment purgesystem heaters are capable of maintaining containment air temperature above 381F whenthe reactor is shutdown, even if the fan coil units are in operation.
d. Normal maximum and minimum daily temperatures at Kewaunee are about 201F and 00Fin January. Therefore, the assumption of constant outside temperature at -201F isconservative, in spite of a few hours of extreme minimum at -401F being recorded inJanuary.
In the event of a LOCA, the initial inn tmbient ig, temperature will exceed KoF, asspecified under thEequirements for containment 6i i.
For any break, which released the stored energy of the reactor coolant, the air temperatures inthe containment and in the annulus will remain above NDT considerations until long after theShield Building Ventilation System is in the full recirculation mode.
Beyond this time, the containment air temperature can readily be maintained above UOF bydeliberately not overcooling the containment atmosphere with the post-accident heat removalsystems. During eventual containment purge, the purge air heaters can be used if the outsideair requires warming.
Calculations based on -20'F outside air and 321F cooling water temperatures, heat input onlyfrom the containment, 200 cfm of annulus in-leakage, and a combined convective-radiativeheat transfer coefficient of 1.5 Btu/hr ft2 'F yield the following values:
* Annulus air temperature 251F* Containment air temperature 50'F* Minimum penetration temperature 321F (Fan-coil coolant inlet)
These values assure that the containment shell NDT limit of 00F will not be approached orbreached.
The lower portion of the shell, which is embedded in concrete, is also afforded significantprotection by the Shield Building.
Of the entire lower shell, the portion in the transition zone between El. 584'-0" and El. 605'-6", as shown in Figure 5.2-1, is the most critical because of its minimum distance to theoutside surfaces. Analysis indicated that the shell between these two elevations would be at30'F or higher if the outside temperature is constant at -20WF and the inside temperatureis 341F or higher. As previously discussed, the inside temperature will always be maintainedabove 340F. Therefore, the containment vessel temperature in this region could never bebelow 30WF in normal operation.
Rev. 165.2-7 12/01/2000

The reactor will not be operated unless the containment vessel air temperatureexceeds O0 F. This will assure a minimum OF margin above the if critical tern eratureof 380F. ae ale cn o e ontaiment aIr EJ eraure s. F rs
Code Requirements
The design internal pressure for the Reactor Containment Vessel is as specified in theprovisions of the "Winter 1965 Addenda" to Section III of the ASME Boiler and PressureVessel Code.
The design requirements for Class B vessels are contained in Paragraph N-1311 throughN-1314 ofthe Addenda. Paragraph N-1312 states that the design internal pressure may differfrom the maximum internal pressure but may not be less than 90% of the maximumcontainment internal pressure. A maximum internal pressure of 46 psig and a designpressure of 0.9 x 46.0 = 41.4 psig have been specified.
The Reactor Containment Vessel has been pressure-tested for acceptance of the vessel, airlocks, equipment door and all vessel penetration nozzles in accordance with the rules ofSection VIII, UG-100 and Section III, N-1314(d). The maximum test pressure was 1.25times the design internal pressure i.e., 1.25 x 41.4 = 51.8 psig.
In-Service Inspection
The basis of the In-Service Inspection Program is ASME Boiler and Pressure Vessel Code,Section XI, 1992 Edition including 1992 Addenda Subsection IWE, "Requirements for ClassMC and Metallic Liners of Class CC Components of Light-Water Cooled Power Plants".
Design Stress Criteria
The Reactor Containment Vessel will retain the capability to restrict leakage to theacceptable specified level under all conditions of loading that might occur during itslifetime. The vessel is designed to exhibit a general elastic behavior under accident and allearthquake-loading conditions. No permanent deformations due to primary stresses arepermitted in the design under any conditions of loading.
For the Operational Basis Earthquake, designated as loading Condition I in Table 5.2-1, theReactor Containment Vessel is capable of continued safe operation during a DBA. For thisloading condition, the structure will function within the normal design limits specified bySection III of the ASME Boiler and Pressure Vessel Code, Figure N-414 and as listed inTable 5.2-1. Loading Condition I provides the design basis upon which the ReactorContainment Vessel is code-stamped.
For the Design Basis Earthquake, designated as Loading Condition 2, the margin provided inthe design assures the capability to maintain the vessel in a safe operating condition. For this
Rev. 165.2-8 12/01/2000

loading condition, the basic design was reviewed to insure that the Reactor ContainmentVessel and its components retain their capability to perform their containment function.
Primary stress intensities are conservatively limited to 90% of the yield strength ofSA 516-GR70 carbon steel plate at the accident temperature. The application of this criterionto Table N-414, ASME Boiler and Pressure Vessel Code, Section III is shown under LoadingCondition 2 of Table 5.2-1.
Earthquake stresses are added linearly and directly to stresses caused by the Design BasisAccident, dead loads, and the appropriate operating loads to obtain the total stresses. Thesetotal stresses are within the maximum stress limits allowed by the design criteria, listed inTable 5.2-1.
Prior to the special ruling of ASME Code Case 1392 (Reference 1). The interpretation of theASME Code for the design of containment vessels was to treat all vessel configurations andloading under the design rules of Section III(b) and satisfy the basic stress intensity limits ofparagraphs N-414.1, N-414.2, N-414.3 and N-414.4 of Section III.
The interpretation presently permitted by this code case is to accept the design provisions ofSection VIII in the absence of substantial mechanical or thermal loads other than pressure.
The design rules of Section VIII are satisfied for all configurations and loadings explicitlytreated by Section VIII, using "Sm" [See N-1314(b)] in place of "S" in the various formulas.
The Reactor Containment Vessel in this application is applicable to the requirements ofASME Code Case 1392. The minimum thickness of the bottom configuration is predicatedon the design rules of Section VIII.
In consideration of the large diameter of the vessel the shell bottom was analyzed by the"Yale Shell Program" (Reference 2).
Circumferential compressive stresses resulting from internal pressure forces were calculatedand held below the critical buckling stress by a margin of safety compatible with goodpressure vessel design practice.
The design was reviewed to assure that any resulting deflections or distortions would notprevent the proper functioning of the structure or pieces of equipment and would notendanger adjacent structures or components. The ASME Boiler and Pressure Vessel Codeprovisions, for out-of-roundness tolerance was not considered appropriate for the cylindricalvessel of the magnitude of the Reactor Containment Vessel. Therefore, it was specified tohave an out-of-roundness tolerance of not greater than one half of the ASME Boiler andPressure Vessel Code permissible tolerance, i.e., one-half percent of the normal diameter.
All other applicable tolerances of fabrication and erection as specified in the ASME Boilerand Pressure Vessel Code were applied to the Reactor Containment Vessel.
Rev. 165.2-9 12/01/2000

The ellipsoidal bottom of the Reactor Containment Vessel is bonded to and in intimatecontact with the support grout under the vessel bottom. It is noted that those surfaces internaland external to the vessel that are in contact with concrete will not be readily available forinspection.
This concept of Reactor Containment Vessel support and internal concrete construction isrecognized by the ASME Boiler and Pressure code and has been approved on numerousnuclear power plants.
The successful application of this method of support is predicated on the inherent built-inquality of construction associated with pressure vessels, and the test requirements ofacceptance and code certification.
All weld seams on the bottom are fully radiographed and have been leak tested at 5 psig andalso at the design internal pressure.
Design Review and Analysis
The Reactor Containment Vessel was designed, fabricated, constructed, and stamped inaccordance with the rules of Section III, Subsection B, of the ASME Boiler and PressureVessel Code.
The bottom head of the Reactor Containment Vessel was designed using the formulas ofSection VIII of the ASME Code as allowed by Paragraph N-1314(a)(1), (Summer 1968Addenda) when substantial mechanical or thermal loads other than pressure are not present.
Temporary stiffeners were added to protect the structure during the overload pressure testand prevent the possibility of any damage to the vessel during construction. Following theoverload pressure test, the temporary stiffeners on the bottom head were removed by arc airgouging the metal to within '/4" of the vessel plate surface. Then grinding the remainingmetal smooth to the surface of the vessel, to prevent damage to the internal concrete or thevessel that could result from movements of the vessel. After removal of the stiffeners, thearea was examined using the magnetic particle method.
The Reactor Containment Vessel's concrete fill support under the ellipsoidal bottom wasplaced using a concrete placement and grout. The grout is a two component epoxypolysulfide material containing no solvent and does not shrink. The mixture consists of anepoxy resin, an organic amine, and a polysulfide. It is chemically inert to the steel andconcrete and therefore will not promote corrosion of these materials. The technique used isas follows:
a. The concrete fill was placed in a predetermined sequence of pours. The size, locationand timing of placement of the individual pours were all considered in determining thepattern and sequence of pours.
Rev. 165.2-10 12/01/2000

b. The placement of low-viscosity chemical grout proceeded in sequence during the aboveoperation after the concrete grout had completed its cycle of hydration andshrinkage. The chemical grout was pressure injected through grouting ducts. Injectioncontinued at each duct until the chemical grout appeared around the periphery of thepour. This method ensured full bearing under every part of the Reactor ContainmentVessel's ellipsoidal bottom.
After embedment in concrete, the bottom head is subject to both thermal and pressure loadsnot considered by the formulas of Section VIII. A detailed thermal study and stress analysiswas performed to show compliance with the stress intensity limits of N-414.1, N-414.2,N414.3 and N-414.4 as required by N-1342(a)(2). This analysis is of the type normallyrequired for a Class A vessel.
The top of the internal concrete and the interior surface of the steel shell above the floor hasbeen coated with a nuclear grade coating capable of withstanding a DBA. At the intersectionof the concrete floor and the steel shell, a sealant was provided to prevent moisture frompenetrating the joint.
The exterior concrete and the steel shell have been chemically bonded tight to assure nopenetration of moisture. Above the chemical grout at the "air gap" between the steel shelland the concrete, the steel surface has been sandblasted, primed and coated with a rustinhibitive, high temperature paint. The "air gap" was formed with two layers of styrofoamwith all joints staggered and taped and concrete poured against it.
The top of the concrete in the annular space has been provided with sumps and a concretecurb all around (Figures 5.2-1 and 5.2-2) to collect any moisture.
The space between the concrete curb and the steel shell was caulked with a sealant to assurethat moisture will not penetrate into the air gap.
Reactor Containment Vessel at Embedment Region
In its final configuration, the containment shell knuckle is embedded by the internal concreteto a point 2 feet-3 inches above the shell tangent line and externally to a point approximately2 feet-9 inches below the tangent line. A transition zone exists in a region that extends fromthe top of the internal concrete to some point on the shell below the temporarystiffeners. This condition is shown in Figure 5:2-1.
Embedment of the Reactor Containment Vessel knuckle in concrete produces bendingstresses, resulting from thermal and pressure expansion, at the interface between the encasedand non-encased portions of the shell. These bending stresses were minimized by providinga smooth transition between the part of the shell, which is free to expand and the part, whichis fixed in concrete.
Rev. 165.2-11 12/01/2000

Figures 5.2-la and 5.2-lb show the typical arrangement of the reinforcing steel patterns forthe base slab and at the lower portion of the wall. The reinforcement in the discontinuityzone of the wall with the base is shown in Figure 5.2-1 a.
Figures 5.2-Ic and 5.2-ld show the typical arrangement of the reinforcing steel pattern forthe dome and the upper portion of the wall. The reinforcement in the discontinuity zone ofthe wall with the dome is shown on Figure 5.2-Ic.
Figure 5.2-le shows the typical arrangement of the reinforcing steel pattern at a typical largeopening. In this illustration the opening was provided for an airlock. It is to be noted thatwhere the general pattern of wall reinforcement has been interrupted by an openingadditional perimeter beam reinforcing has been added.
Since the Shield Building is not subjected to any significant internal pressure, reinforcementbar anchorage will generally not occur in tension zones.
When the Reactor Containment Vessel is pressurized, in operational configuration, it willexert a pressure on the internal concrete in the knuckle region as the shell attempts to deforminward. Also, the vessel will exert a pressure on the concrete outside of the vessel where theelliptical head is tending to deform outward. These reactions on the concrete are due to thetendency of the elliptical head to become hemispherical in shape when pressurized.
The analysis of the concrete-steel shell interaction in the embedded zone is basically aflexibility method of analysis of the concrete-steel structural systems.
The primary objective of the analysis is to determine stresses in the steel shell and the contactpressures on the concrete from the steel in the embedment region.
Three structures are used in the analysis:
* Internal concrete* Steel shell, and* External concrete
The model of the ellipsoidal bottom shell structure is divided into carefully selected segmentsto best represent the shape of the model.
The restraint of the concrete on the steel shell is modeled using "Analogous Springs" and adistributed pressure. The "Analogous Springs" are represented by a flexibility model of boththe internal and external concrete supplied by Pioneer Service & EngineeringCompany. This model is in the form of load per unit length of circumference per unit ofconcrete displacement and is given for various positions on a meridian line of the shellbottom. The pressures applied at the selected loading points of the shell bottom are equal tothe algebraic sum of the internal pressure plus the reaction pressure of the concrete. Thepressure distribution between loading points specified in the program is assumed to be linear.
Rev. 165.2-12 12/01/2000

Continuity and interaction are established by assuring that the deflections are equal at thepoints where concrete is in contact with the steel shell. Equations for the internal andexternal and contact points are constructed and solved for redundants. A trial and errorprocedure is used for the solution since the equations corresponding to the redundants withnegative contact pressure must be eliminated.
A. Kalnins' method (Reference 2) is used to develop the equations to be used in theflexibility analysis; i.e., deflections, shears, and loads.
The compatibility of deformations of the structures is amply demonstrated when the solutionof the flexibility model is carried to the point where the deflections of structures in contactare equal. This has been done and the final internal and external contact pressures of theconcrete on the steel are in equilibrium with the structures as a free body for axisymmetricloads. There are no non-axisymmetric loads considered acting on the bottom in this analysis.
Concrete and Steel Interface Design
The final stress report demonstrated that the Reactor Containment Vessel, as specified,analyzed, and designed, meets all applicable requirements of the ASME Code.
As a further verification of the design, a second overpressure test (1.25 times designpressure), not required by ASME Code, was performed at a pressure of 51.8 psig with thetemporary vessel stiffeners removed and the internal concrete support system in place, butbefore fuel was loaded. The maximum pressure was maintained only long enough to verifythe pressure level.
Non-Axisymmetric Loading Due to Concrete Shielding at Fuel Transfer Tube
An area 43.5 ft high and about 24 ft wide on the inside of the containment vessel is coveredby interior concrete walls. This area will be referred to as the "cold spot".
The design basis for the steel containment vessel is that after a LOCA the internal pressurewill peak at 46 psi at about 10 seconds, and the internal temperature will peak at 2681F, alsoat about 10 seconds. After that, both pressure and internal temperature will decline (seeSection 14.3.4).
During the first 10 seconds after a LOCA the temperature of the inner surface of thecontainment vessel shell rises from 120'F to 1551F, and the outer surface rises from 1201Fto 1290F. Thereafter, the shell temperature continues to rise to 1650F at the inner surfaceand 1551F at the outer surface. This increase does not occur in the portion of the shellprotected by the internal concrete thus producing the "cold spot" which results in additionalstresses in the steel shell. These stresses are classified as Thermal Stresses.
The area behind the "cold spot" is assumed not to be subject to the 46-psi internalpressure. Thus, the pressure around the circumference of the steel shell is unbalanced givingrise to local pressure stresses.
Rev. 165.2-13 12/01/2000

Kalnins' Static Shell Program was used to determine the effects of the missing temperaturerise and the missing pressure increase at the "cold spot". For each investigation, 21 Fourierharmonics were combined to represent the sudden changes at the edges of the "cold spot".
Additional stresses due to missing temperature at the "cold spot", after 10 seconds, wereobtained and are given in Table 5.2-7.
The circumferential stresses are the maximum stresses at the three elevations listed in thetable.
In determining the effect of the missing pressure, cognizance was taken of the fact that theincrease in pressure and temperature of the steel shell after a LOCA would cause an increasein diameter. This would result in a theoretical finite gap between the steel shell and theexterior face of the concrete walls. However, the unbalance in forces around thecircumference of the shell, due to the missing pressure against the portion of the shellprotected by the concrete wall, would cause the steel shell to press against the concrete andthus prevent the gap from opening. At the maximum internal pressure of 46 psi, a pressuredifferential of 3 psi is required to close the gap. Thus, the steel shell will then press againstthe concrete with a pressure of 43 psi. The additional stresses in the steel shell werecalculated on this basis and are given in Table 5.2-8.
The additional stresses given in the table must be added to the stresses, which would exist ifno "cold spot" were present. These stresses are summarized in Table 5.2-9.
The total, combined stresses in the containment vessel steel shell due to the presence of the"cold spot" are summarized in Table 5.2-10. These stresses occur 10 seconds after the startof LOCA. The stress intensity for each loading condition is also shown in this table. Thestress intensity is calculated in accordance with Paragraph N-413 of Section III of the ASMEBoiler and Pressure Vessel Code (1968 Edition).
The allowable stresses in the containment vessel steel shell were established by the criterialisted in Table 5.2-1. For the Operating Basis Earthquake condition, this table refers toFigure N-414 of Section III of the ASME Boiler and Pressure Vessel Code (1968Edition). The limits of stress intensities in Figure N-414 are based upon the allowable stressintensity S(m). For Class B vessels, this allowable stress intensity is obtained from SectionVIII of the ASME Code, and is 17,500 psi for A-516 Grade 70 steel. This allowable stressintensity is applicable to general membrane stress intensities when local membrane andbending stresses are not present. When the latter stresses are present, the allowable stressintensity is increased to 1.5S(m) or 26,250 psi. When secondary stresses due to differentialthermal expansion are included, the allowable stress intensity is increased to 3.0S(m) or52,500 psi.
Allowable stress criteria for the Design Basis Earthquake are given in Table 5.2-1 underloading condition 2. The allowable stress intensities computed in accordance with thesecriteria are:
Rev. 165.2-14 12/01/2000

* General membrane = 1.16(Sm) =20,300 psi* General membrane plus bending = 1.6 x (1.5Sm) = 30,450 psi* All stresses including = 3Sm = 52,500 psi secondary stresses
The OBE and DBE dynamic vertical and horizontal seismic loads and overturning momentsof the containment vessel are transmitted into the concrete foundation and sub-foundationthrough the combined action of friction and bearing on the shell bottom.
The lateral and vertical loads caused by earthquake are of such a minimal nature that thefriction is neglected to simplify the analysis and a simplified but conservative approximationof the reaction bearing load is considered.
The seismic overturning moment of the containment vessel will produce vertical reactionpressures on the shell bottom. The horizontal seismic forces will produce lateral pressurereactions on the shell bottom. Since the forces are minimal, a conservative, simplified modeof lateral load transfer and analysis of steel and concrete is made.
First, the load analysis consists of using John A. Blume's modal analysis seismic accelerationcurves for the containment vessel. The calculation of the vessel shear, membrane and surfacestresses is by the application of the Kalnins' program to shells. The most critical area ofstress in the steel shell under these conditions occurs in the discontinuity zone at the line ofthe external embedment in the concrete. The calculated stresses and allowable stresses at thisline are given in Table 5.2-9a. The allowable stresses are based on the criteria ofTable 5.2-1.
Next, the total lateral seismic load of the containment vessel is conservatively assumed to becarried by tangential shear above the embedment line into the vessel plates whose planes aremost nearly oriented in the direction of the seismic loads. These loads will then be carried bymembrane action into a hoop band of limited width at or near the mezzanine floor line as anintegral internal member. This lateral load is thereby transferred to the diametricallyopposite surface of the internal concrete member. The load is then transferred through theshell plate onto an expanded area of the external concrete foundation.
To further simplify the analysis, this band is conservatively assumed to be 20 in. wide andthe resulting stresses and allowable stress criteria are shown in Table 5.2-9b.
The allowable stress intensities are also shown in Table 5.2-10.
It can be determined from an examination of Table 5.2-10 that the presence of the "coldspot" does not result in any case in which actual stress intensity exceeds the allowable stressintensity.
After the first ten seconds following a LOCA, the internal pressure drops and the temperaturedifferential between the two surfaces of the steel shell also declines, but the averagetemperature of the shell increases another 181F to 1601F. The change in stresses due to the
Rev. 165.2-15 12/01/2000

first two effects is greater than that caused by the third effect. The net result is a decline intotal stresses after about ten seconds.
It has previously been pointed out that at ten seconds after a LOCA, the steel shell exerts a43-psi pressure against the outer surface of the concrete wall. At the same time there is aninternal pressure of 46-psi against the inner surface of the concrete wall. The 3-psi pressuredifferential must be carried by the concrete wall.
During the first ten seconds following a LOCA the pressures do not increase linearly, so thepressure differential could, briefly, exceed 3-psi during this interval. For instance, at onesecond the interior pressure is 12 psi. This 12-psi pressure was used to calculate stresses inthe concrete wall on the conservative assumption that the steel shell had not had time to reactand press against the concrete.
STRESS computer program was used to calculate moments and shears, and Pioneer Service& Engineering Co. Program S-020 was used to determine the required reinforcing steel. Theamount of reinforcing steel thus determined did not exceed 35% of the steel required by otherloading conditions. Thus, the internal concrete structure will not be overstressed by the loadscaused by the presence of the "cold spot".
In conclusion, it has been demonstrated that all stress combinations, which include thosecomputed on the basis of non-axisymmetric loading at the "cold spot" meet the criteria forallowable stress for the steel containment vessel and the interior concrete construction.
Testing of the Reactor Containment Vessel on Temporary Supports
The vessel was erected on a temporary support system. To fulfill the requirements of theASME Code and provide a basis for acceptance of the vessel, the acceptance overpressuretest was made while the vessel was supported on the temporary support system. To provideadditional safety margin for those engaged in the erection and testing of the vessel, internalstiffeners were provided as a precautionary measure.
The temporary internal stiffeners ns of four flat bars that were attached by fillet weldsto the inside surface of the shell in the knuckle area. These bars are circumferential ringsspaced about two feet apart. The stiffener bars are shown in Figure 5.2-1. These stiffenerbars were installed to provide lateral stability of the knuckle plate during pressure testing.
This was necessary because the knuckle plate is subject to circumferential compression stresswhen it is pressurized for testing. After the vessel was acceptance-tested, the temporarystiffeners were removed and the required lateral support was provided by internal concretestructures.
The vessel was temporarily supported on fifteen laterally-braced pipe columns shaped to thecontour of the vessel. The columns were welded to the shell plate immediately below thetangent line at the knuckle and also to the horizontal web of an external horizontal tee
Rev. 165.2-16 12/01/2000

member. This horizontal tee ring-girder developed the lateral stiffness of the temporarybracing. These temporary supports are shown in Figure 5.2-2.
The temporary structure supported the weight of the vessel (2300 tons) and specifiedconstruction loads. In addition, it resisted lateral loads, such as wind, which were imposedduring construction. The vessel loads were then transferred to the grout support. Thetemporary legs, bracing, and external tee member have been removed by cutting to within 4A"
of the vessel face and then ground smooth.
Wind Analysis
The Reactor Containment Vessel and penetrations associated with Primary Containment arecompletely enclosed by the Shield Building and are therefore not directly subjected to theforces and effects of wind and tornadoes.
Seismic Analysis
The seismic analysis of the Containment System, critical appurtenances, structures, andequipment were based on the ground response acceleration spectra, the building responsespectra (Reference 3) and the floor response acceleration spectra (Reference 4). For detailssee Appendix B.
Building Response Spectra
Building response spectral analyses (Reference 3) were performed, based on OperationalBasis Earthquake (0.06g) and Design Basis Earthquake (0.12g). The analyses developedvalues for maximum translational accelerations, displacements, shears and moments andmaximum torsional accelerations, moments and rotations of the building structures.
The mathematical model considered the three major structures (Reactor, Auxiliary andTurbine Building) in a combined idealized three-dimensional model with 630 of freedom-translation for symmetrical elements, and both translation and torsional rotation forunsymmetrical and irregular elements.
Floor Response Acceleration
The floor response acceleration spectral analyses (Reference 4) are based on the OperationalBasis Earthquake (0.06g) and the Design Basis Earthquake (0.12g). The analyses developedthe generated acceleration time-history response spectra at mass points designated for theseismic analysis of critical equipment and piping located throughout the structuralcomplex. The mathematical model utilized for this analysis is the same one used for thebuilding response spectra analysis.
Rev. 165.2-17 12/01/2000

Airlock Seismic Analysis
The specification for the Reactor Containment Vessel requires that the Earthquake designinclude the effects of the airlocks vibrating as an independent system. The ReactorContainment Vessel contractor, Chicago Bridge & Iron Co., (CB&1) developed an analysisof the airlock system under their seismic consultant, John A. Blume & Associates. Thecalculations were performed according to this method, and the results show that the stressesin the airlocks do not exceed the allowable stresses given in Table 5.2-1.
In this method of analysis, the horizontal earthquake is assumed to act in one of twodirections as shown below. Case I will result in seismic forces and moments from the airlockbeing applied to the Containment Vessel in the circumferential direction. Case 11 will resultin a radial thrust being applied to the Containment Vessel.
Dynamic Constants for Airlocks
Since the airlocks are completely separated from the concrete Shield Building and adjacentconcrete structures by an air space, there will be no interaction between airlock structures andconcrete structures.
Case I - Vertical and Circumferential Directions
The spring constant for the seismic analysis of airlocks in the circumferential direction of thevessel shell is evaluated by applying a unit moment (1,000 in-lbs) at the shell anddetermining the rotation (0) at the shell-to-nozzle junction (Reference 5):
K = I Where: K = Spring constant shellq
ITV= K6 W = Angular frequency of lock
I = Moment of inertia of lock about point of support on shell
T = Fundamental period of lockM = Unit moment at shell0 = Rotation at shell to nozzle junction
Case 11 - Radial Direction
In a similar manner the spring constant in the radial direction of the vessel shell is determinedby applying a unit thrust (1,000 lbs) at the shell and determining the deflections (w) at theshell-to-nozzle junction (Reference 6):
Rev. 165.2-18 12/01/2000

K = Where: W = Weight of lock plus insertIV
g = 386.4 (in/sec2)
T= 2p P = Unit load
w = Deflection at shell to nozzle junction
Seismic Forces on Airlocks
The vibrational driving force on the airlocks was determined from accelerations derived fromthe response acceleration spectra prepared by the seismic consultants, John A. Blume &Associates (Reference 4). Using the fundamental period of the airlock (T) and 1% damping(as recommended by John A. Blume & Associates), the acceleration in percent of gravity isobtained. The airlock dead loads were then multiplied by this acceleration to obtain theseismic forces acting on the airlock.
The applicable ASME Section III allowable stress intensities for stresses due to pressure andapplied loads at the containment vessel shell to airlock nozzle junction were calculated asfollows:
For Operating Basis Earthquake (OBE)
* Membrane Stress: PL =(1.5) (17500) = 26250 psi* Surface Stress: PL + Q = (3) (17500) = 52500 psi
For Design Basis Earthquake (DBE)
* Membrane Stress: PL = (1.16) (1.5) (17500) =30450 psiPL + Q = (3) (17500) = 52500 psi
Seismic Stresses
Stresses in the shell due to the airlocks vibrating as an independent system from a horizontaland vertical earthquake were determined by the use of Welding Research Council Bulletin107 and Chicago Bridge and Iron Computer Program 6-20N.
Stresses were limited to the allowable stress criteria as set forth in Table 5.2-1.
A horizontal earthquake acting perpendicular to the airlock (Case 1) will result in acircumferential shear and moment being applied to the shell. An earthquake acting parallelto the airlock (Case II) will subject the shell to a radial thrust.
Rev. 165.2-19 12/01/2000

Stresses were checked at three locations: at the neck-to-insert-plate junction, at the insert-to-shell junction, and at a distance of 0.5(Rt)% from any local stress area. (R = radius ofcurvature and t = thickness).
Stresses in the reinforcing insert-plate and in the shell due to the applied earthquake loadswere calculated. Pressure stresses were added directly to the earthquake stresses, and anequivalent stress intensity was calculated (per maximum shear theory) compared to allowablevalues in Table 5.2-1.
The designs are based on the Operational Basis Earthquake and are reviewed for the case ofDesign Basis Earthquake to assure that the stress limits for this loading are not exceeded.
A summary of the membrane and surface stresses at the connecting weld of the containmentvessel shell plate to the airlock barrel nozzle plate for the two earthquake loading conditionsis given in Table 5.2-6.
Vertical Earthquake
A vertical earthquake acceleration applied to the Vessel and airlocks was assumed to actsimultaneously with the horizontal earthquake.
Soil - Structure Interaction
The problem of soil-structure interaction was accounted for by introducing rotational andtranslational springs in the model used for seismic analysis. The rotational springs accountfor the deformation of the soil under the building, i.e., rocking, and the translational springsaccount for frictional resistance of the soil on the bottom and sides of the building, as well assoil bearing against the sides of the building. The stiffness of these springs was determinedby using elastic finite element method of analysis and checked using equations developed forthe case of rigid plate on a semi-infinite elastic half space.
Foundation Damping Factor
The following recommendation on damping factor to be employed for the foundationmaterials was made by Dr. Ralph B. Peck:
"Damping values for the rocking mode have not been well established for claysoils. Although some laboratory information is available, it seems preferable to use values(expressed as percent of critical damping) that have been back calculated from prototypeinstallations, such as machine bases. Values from 5.1 to 7.1% were determined for a soft clayon this basis by D. D. Barkan (Reference 7) "Dynamics of Bases and Foundations".McGraw-Hill Book Company, New York, p. 126 (1962). The data quoted in Whitman(Reference 8) and Richart "Design Procedures for Dynamically Loaded Foundations",ASCE, Journ. Soil Mechanics and Foundations Division, Vol. 93, No. SM6, Nov. 1967pg.178, which refer to Barkan's text, p. 67, are based on laboratory tests and may be inerror."
Rev. 165.2-20 12/01/2000

-- -
"The damping factor can be expected to be smaller for a stiff clay than for a soft clay. On theother hand, the presence of granular material with an average thickness on the order of 10 ftbetween the clay and the bedrock at the Kewaunee site will introduce considerably moredamping than would the presence of an equivalent amount of stiff clay. For this reason, thedamping factor would be greater than for clay alone. I would recommend, therefore, the useof a factor of 4% for the design earthquake and 6% for the maximum earthquake. Theincrease is permissible because the deformations associated with the greater earthquakewould involve greater strains and loss of energy".
Dr. Peck's recommendation was the subject of discussion between John A. Blume &Associates (Seismic Design Consultants), Pioneer Service & Engineering Co., and Dr.Peck. As a result of these discussions it was agreed that 5% damping factor would be usedfor both Operational Basis Earthquake and Design Basis Earthquake. For further details referto Appendix E.
Penetrations
Design Basis
To maintain designed containment integrity, containment penetrations have the followingdesign characteristics:
a. They are capable of withstanding the maximum internal pressure, which could occur dueto the postulated rupture of any pipe inside the Reactor Containment Vessel.
b. They are capable of withstanding the jet forces associated with the flow from a postulatedrupture of the pipe in the penetration or adjacent to it, while still maintaining the integrityof containment.
c. They are capable of accommodating the thermal and mechanical stresses, which may beencountered during all modes of operation and test.
d. Materials of piping penetrations furnished as a part of the Reactor Containment Vesselare either ASME SA-333 GR. 6 or ASME SA-312 TP. 304. All hot penetrations arefabricated of ASME SA-333 GR. 6. The cold penetrations are fabricated of either of theforegoing materials, but in all cases are compatible with the material of the process line,which is to be welded directly to the penetration nozzle.
e. The materials for penetrations, including the personnel access airlocks and the equipmentaccess hatch, conform to the requirements of the ASME Boiler and Pressure VesselCode, Section 111, Nuclear Vessels, Code Case 1392, Rev 0. The process and guard pipesand flued heads were designed, specified and fabricated in accordance with the Code forPressure Piping, USASI B31.1.0-1967, N-7, and ASME Boiler and Pressure Vessel CodeSection 111, 1968, Class B, Code cases 1177, 1330, and 1425.
Rev. 165.2-21 12/01/2000

Charpy V-notch tests were performed on the material used for construction of the carbonsteel flued heads and penetrations. The test temperature was 0F with break values based onthree material samples from each penetration or flued head. All test data showed that thesamples had greater than 20 ft-lbs energy capability. The description of the tests and data arefiled at the Kewaunee site.
Electrical Pcnetrations
The electrical penetration assemblies are designed for field installation by welding to theinside end of the nozzle type penetration passing through the Reactor Containment Vesselwall. Each penetration assembly is provided with a single connection to allow pressuretesting for leaks. All components of the penetration assemblies are designed to withstand,without damage or interruption of operations, the forces resulting from an earthquake, inaddition to the normal and accident design requirements.
All materials used in the design are selected for their resistance to the environment existingunder normal operation and the DBA.
Figure 5.2-3 shows the D.G. O'Brien penetration configuration for the following types ofelectrical penetrations provided in the design:
* Type I Medium Voltage Power (MVP) - 5000 Volt Insulation for use on 4160 voltResistance Grounded System - 4 provided
* Type 11 Low Voltage Power (LVP) - 600 volt insulation for use on 480V groundedsystem - 18 provided
* Type III Instrument & Control (I&C) - 600 volt insulation - 22 provided* Type IV Control Rod Drive Power (CRDP) - 1000 volt insulation for use on 140V DC-
5 provided* Type V Nuclear Instrumentation Systems (NIS) Triax Cables - 4 provided.* Type VI Radiation Monitor Cables (RM) - I provided
The electrical penetrations entering the Reactor Building are subdivided into six basic groupshaving twelve penetration nozzles in each group. Electrical penetration assemblies areinstalled in the penetration nozzles. Spare penetration nozzles in each group are sealed witha welded cap. Instrument and control leads are segregated from power leads by placementinto different electrical penetration assemblies. The circuit arrangements are as follows:
* Group A Normal power and Train "B" power* Group B Normal power and Train "B" power, control and instrumentation, and
"White" Reactor Protection Channel* Group C Normal instrumentation, Train "B" instrumentation, and "Blue" Reactor
Protection Channel.* Group D Normal instrumentation, Train "A" instrumentation, and "Red" Reactor
Protection channel.
Rev. 165.2-22 12/01/2000

* Group E Normal control, Train "A" control and instrumentation, and "Yellow" ReactorProtection channel.
* Group F Normal power and Train "A" power.
In addition to the above, there are penetrations into the two airlocks which are used for doorposition signal circuits, internal airlock lighting and communication circuits.
The approximate sequence of testing and tests performed on both prototype and productionDG O'Brien penetrations are listed in Table 5.2-la. Detailed descriptions of themanufacturer's test procedures are contained in D.G. O'Brien, Inc. Test ProcedureManual. The test data for all the tests performed are filed at the Kewaunee Reactorsite. Since the specifications are different for each application, it is not possible tosummarize the data into a concise form.
Leak Tests were performed on the D.G. O'Brien penetrations using helium leak-detectionprocedures. The tests were performed at a temperature of 270'F with a helium differentialpressure of 52 psig. Maximum allowable leak rate was E-6 cc per second. Leak tests wereperformed at least twice during the sequence of tests on prototype models and once on eachproduction unit. The leak rates measured were all less than the allowable leak rate(E-6 cc/sec).
Two Conax electrical penetration assemblies were installed to provide additionalinstrumentation and low voltage power circuits required for the RVLIS and Appendix Rmodifications. The Conax penetration assemblies, designed and tested in accordance withIEEE Standard 317-1976 as modified by Reg. Guide 1.63-1978; will withstand, withoutdamage or interruption of operations, the forces resulting from an earthquake, in addition tothe normal and accident design requirements. The Conax penetration assemblies aredesigned for field installation by welding to the inside end of a spare nozzle type penetrationpassing through the reactor containment vessel wall. Each Conax penetration assembly isprovided with a single connection to allow pressure testing for leaks. The Conax low voltageinstrumentation assembly is installed in Group C. The Conax low voltage power and controlassembly is installed in Group F.
Piping Penetrations
All penetrations listed in Table 5.2-2, except the vacuum breakers, penetrate the ShieldBuilding as well as the Reactor Containment Vessel. Both the Reactor Containment Vesseland Shield Building are provided with capped spare penetrations for possible futurerequirements.
General Design Description
All process lines traverse the boundary between the inside of the Reactor ContainmentVessel and the outside of the Shield Building by means of piping penetration assembliesmade up of several elements. Two general types of piping penetration assemblies areprovided; i.e., those that are not required to accommodate thermal movement (designated as
Rev. 165.2-23 12/01/2000
cold penetrations in Figure 5.24) and those which accommodate thermal movement (hotpenetrations depicted in Figures 5.2-5 and 5.2-5a). All piping penetration assemblies arelisted in Table 5.2-2.
Both hot and cold piping penetration assemblies consist of a containment penetration nozzle,a process pipe, a Shield Building penetration sleeve and a Shield Building flexible seal. Inthe case of a cold penetration, the Containment Vessel penetration nozzle is an integral partof the process pipe. For hot penetrations, a multiple-flued head becomes an integral part ofthe process pipe, and is used to attach a guard pipe and an expansion joint bellows. Theexpansion joint bellows is welded to the Reactor Containment Vessel penetrationnozzle. The flued head fitting is the only part of the penetration assembly, which comes intocontact with the Shield Building at any time.
At the termination of a piping penetration assembly near the Shield Building, a low-pressureleakage barrier, is provided in the form of a Shield Building flexible seal as shown inFigures 5.24, 5.2-5 and 5.2-7. These devices provide a flexible membrane type closurebetween the Shield Building penetration sleeve, which is embedded in the Shield Building,and the process pipe. In the case of hot penetrations 8 and 1 1, a circular plate is being usedrather than a flexible seal as shown in Figure 5.2-5a. This plate will serve as both an anchorand a Shield Building seal.
Design Basis Common to Hot and Cold Piping Penetrations
All Containment Vessel penetration nozzles are designed to meet the requirements forClass B vessels under Section III of ASME Boiler and Pressure Vessel Code. In compliancewith the code, the operating stresses in a containment vessel penetration nozzle caused by theattached penetration assembly are limited to the allowable values given in the code. Forearthquake analysis, Section III of the ASME code permits the use of 1.5 times the allowablestress value for the material being used.
The double-bellows expansion joints in the hot-pipe penetration assemblies and the ShieldBuilding flexible seals for all pipes are designed to accommodate the maximum combinationof vertical, radial, and horizontal differential movements of the Reactor Containment Vessel,the Shield Building, and the piping. The design considers the calculated displacementsresulting from earthquake, pressure, and temperature, as presented in Figure 5.2-6, and alsoaccounts for the actual measured displacement of representative penetration nozzles madeduring the initial pressure testing of the Containment Vessel.
Design Evaluation Common to Hot and Cold Piping Penetrations
Seismic loads on Containment Vessel penetration nozzles were determined by performing adynamic model analysis of the piping systems. Response spectra at the piping system anchorpoints were used in this analysis. These response spectra were developed from the results ofa dynamic time-history seismic analysis of the plant structures. Differential movementbetween points in the various structures have been included in the analysis of the piping.
Rev. 165.2-24 12/01/2000

The validity of the computer program used to perform the piping system seismic analysis wasproven by comparison with an independent analysis of selected systems performed byrecognized consultants.
Loads on Containment Vessel penetration nozzles due to thermal expansion of the pipe,thermal and pressure movements of the Reactor Containment Vessel, and piping systemweight were determined by a flexibility analysis of the piping system. This analysis wasperformed with the aid of a computer program using established methods documented incurrent technical literature. The piping configuration and supports, restraints, or anchors oneach side of the penetrations were designed to limit the stresses in the Containment Vessel atthe penetration nozzle to the criteria defined in Appendix B.
Design Description - Hot Penetrations
A hot piping penetration assembly is used when the differential between the normaloperating temperature of the fluid carried by a process line and the Reactor ContainmentVessel wall temperature would create unacceptable thermal or cyclic stress at the attachmentof the vessel penetration nozzle.
In addition to the elements contained in a cold piping penetrations assembly, as shown inFigure 5.2-4, a hot assembly has a multiple-flued i, a guard pipe, an expansion bellowsand an impingement ring. The multi le-flued head is machined from a solid forging.Zl___iiol. ec-omes in e arpaof. the7prodes A R e u pro._ Eunnorts ~urme MIMMR" rawn M414 M rewn I~- 6ro~v-i de~~ 0s R~ iB METIMM WIM111M. I'M M. V 'WI 1.9_rrSrc-3er Or,. . ar- . -: - 7
en at Reato on am inen~ ~essl.iol~
The only interaction between the hot penetration assemblies and the Shield Building isthrough the multiple-flued head. This interaction takes place in one of hvo ways and isdescribed as follows:
I. For the main steam, feedwater and residual heat removal penetrations, the multiple-fluedhead passes through a sleeve in the Shield Building as shown in Figures 5.2-5 and5.2-7. The sleeve acts as a horizontal and vertical guide, which allows rotational andaxial movements. The piping system and hence the flued head is allowed to rotate ormove axially within the Shield Building sleeve but is restrained by the sleeve frommoving in any direction perpendicular to the axis of the process line for all seismic,temperature, weight and jet loads. There are no pressure loads that have any effect on theflued head - Shield Building interaction for these assemblies other than the vertical andtransverse movements of the containment vessel due to internal vessel pressure. Theloads due to this movement are small, being a function of the transverse spring constantof the penetration expansion bellows, and have been considered in the design of theprocess line, the multiple flued head and the Shield Building sleeve.
Rev. 165.2-25 12/01/2000

2. For the steam generator blowdown and letdown line penetrations the multiple-flued headis anchored to a sleeve in the Shield Building as shown in Figure 5.2-5A. All movementof the flued head and consequently the process line is restrained at this point. The designof this anchor and the process line considered all loads due to seismic, weight,temperature, pressure and pipe rupture jet effects of both the piping system and thestructures.
The expansion joint bellows is attached at one end to the outer flue of the flued head and atthe other end to the Reactor Containment Vessel nozzle. The expansion joint is providedwith a double-layered bellows that has a connection between bellows for integritytesting. An impingement ring is mounted on the guard pipe to protect the expansion jointbellows from jet forces that might result from a pipe rupture inside containment.
The multiple-flued head with its associated guard pipe and expansion joint bellows providesa leak-tight seal for the extension of the containment boundary where the hot penetrationassembly traverses the Shield Building annulus.
Design Basis - Hot Penetrations
Hot piping penetration assemblies are provided to:
a. Prevent unacceptable thermal and cyclic stress on Reactor Containment Vesselpenetration nozzles,
b. Accommodate thermal movement, and
c. Protect containment from the effects of a hot process pipe rupture in the annulus betweenthe Shield Building and the Reactor Containment Vessel.
Where hot penetration assemblies traverse the Shield Building annulus, they are designed toprovide considerable margin between code allowable stress values and maximum calculatedstresses in the pipe. This was accomplished by using 1.5 times the system design pressure tocalculate the pipe wall thickness for the process and guard pipe, using the formula andallowable stresses given in USASI-B 31.1.0-1967. Under the normal B31.1.0 code practice,the system design pressure alone is adequate for calculating the pipe wall thickness. Thesame procedure was used to set the thickness of the guard pipe and the multiple-flued head.
Design Evaluation - Hot Penetrations
Stresses resulting from the combination of loads defined in Appendix B, Paragraph 7.2 werecalculated for a typical process pipe in a hot piping penetration assembly using the crosssectional area of the pipe wall thickness as required to meet 1.5 times system designpressure. Comparison of calculated stress values with code allowable stresses shows:
* Thermal stresses are less than 50% of allowable;* Combined longitudinal stresses are less than 50% of allowable;
Rev. 165.2-26 12/01/2000

* Hoop stresses are less than 60% of allowable.
The design criterion applied to the hot penetration guard pipes is defined in Table B.7-3 ofAPPENDIX B and is the same as that applied to all Class I piping. The allowable stressvalues and stress analysis results for normal, upset and faulted loading conditions for themain steam and feedwater guard pipes are shown in Table 5.2.12. The values listed representthe peak values that will occur at any given location in the guard pipe. This table shows thatcalculated guard pipe stress levels are well within those allowed by the criteria given inTable B.7-3 for all loading conditions. The main steam and feedwater penetrations wereselected for this study because their failure would have the most severe consequences in theShield Building annulus. A review of the design of the other hot penetration guard pipesindicates that calculated stress levels for these guard pipes would be of the same order ofmagnitude as for the main steam and feedwater guard pipes and well within allowable values.
Main Steam Piping Penetrations
The main steam piping penetration assembly, shown in Figure 5.2-7, uses the same elementsas a hot piping penetration assembly. In addition, the main steam piping is anchored to theinterior concrete of the Reactor Containment Vessel.
A limit stop designed to control lateral movement but permit axial movement is providedaround the main steam piping inside containment. This limit stop serves to limit pipemovement in the event of a longitudinal pipe break, thus serving to control pipe whip insidecontainment. The multiple-flued head is also designed to transfer lateral loads that couldresult in the event of a main steam piping rupture exterior to the Shield Building, to aspecially designed structural arrangement in the Shield Building. A lateral axial limit stopsimilar to the one provided inside containment is also provided exterior to the ShieldBuilding.
Design Basis - Main Steam Piping Penetrations
The main steam piping between the anchor inside containment and the first isolation valveoutside of the containment has a wall thickness selected by using 1.5 times the systempressure and normal code allowable stress values. The main steam piping anchor insidecontainment is designed to sustain the full force resulting from a 360' circumferential breakof the main steam piping. The other requirements previously discussed for a hot pipingpenetration assembly are also met.
Equipment and Personnel Access
The equipment hatch and air locks are supported entirely by the Reactor Containment Vesseland will not be connected either directly or indirectly to any other structure.
The equipment hatch and air lock was fabricated from welded steel and furnished with adouble-gasketed flange and bolted dished door. Provision is made to pressure-test the spacebetween the double gaskets of its flange.
Rev. 165.2-27 12/01/2000

Two personnel air locks are provided. Each personnel air lock is a double-door welded steelassembly. Quick-acting type equalizing valves are provided to equalize pressure in the airlock when entering or leaving the Reactor Containment Vessel. Provision is made topressure test the air locks for periodic leak-rate tests.
The two doors in each personnel air lock are interlocked to prevent both from being openedsimultaneously and to ensure that one door is completely closed before the other door can beopened. Remote indicating lights and annunciators in the control room indicate the dooroperational status. Provision is made to permit by-passing the door interlocking system witha special tool, to allow doors to be left open during plant cold shutdown. Each door lockhinge can be adjusted to assist proper seating. A lighting and communication system, whichcan be operated from an external emergency supply is provided within each air lock.
Fuel Transfer Penetration
The fuel transfer penetration provided is for fuel movement between the reactor refuelingcavity in the Reactor Containment Vessel and the spent fuel pool. This penetration consistsof a 20-inch stainless steel pipe installed inside a 24-inch pipe. The inner pipe acts as thetransfer tube and is fitted with a testable double-gasketed blind flange in the reactor refuelingcavity, which provides containment integrity. A standard, normally closed gate valve in thespent fuel pool canal is also provided to isolate the refueling cavity from the spent fuelpool. This arrangement prevents leakage through the transfer tube in the event of anaccident. The outer pipe is welded to the Reactor Containment Vessel. Bellows expansionjoints are provided between the two pipes to compensate for any differential movement.
Containment Supply and Exhaust Purge Duct Penetrations
The ventilation system purge duct and make-up duct penetrations are welded directly to thepenetration nozzles in a manner similar to the cold piping penetration. The ducts are circularin section and designed to withstand the Reactor Containment Vessel maximum internalpressure. They are provided with isolation valves as described in Section 5.3.
Missile Protection Features
High-pressure Reactor Coolant System equipment, which could be the source of missiles issuitably protected either by the concrete wall enclosing the reactor coolant loops or by theconcrete operating floor to block any passage of missiles to the containment walls. Thesteam drum, which forms an integral part of the steam generator, represents a mass of steelwhich provides protection from missiles originating in the section of the containment withinthe shield wall and below the operating floor. A concrete structure is provided over theRCCA drive mechanisms to block any missiles generated from a hypothetical fracture of aRCCA housing.
Rev. 165.2-28 12/01/2000

The missile shield structures inside Containment were analyzed using the conservation ofmomentum method. The penetration depth was calculated by the Ballistic ResearchLaboratories Formula for steel and concrete.
Missile protection is designed to the following criteria:
a. The Reactor Containment Vessel is protected from loss of function due to damage bysuch missiles as might be generated in a loss-of-coolant accident for break sizes up to andincluding the double-ended severance of a main coolant pipe (DBA);
b. The Engineered Safety Features Systems and components required to maintaincontainment integrity are protected against loss of function due to damage by missiles.
During the detailed plant design, the missile protection concept necessary to meet thesecriteria was developed. These concepts are:
a. Components of the Reactor Coolant System are examined to identify and to classifymissiles according to size, shape and kinetic energy for purposes of analyzing theireffects.
b. Missile velocities are calculated considering both fluid and mechanical driving forces,which could act during missile generation.
c. The structural design of the missile shielding takes into account both static and impactloads.
d. The Reactor Coolant System is surrounded by reinforced concrete and steel structuresdesigned to withstand the forces associated with double-ended rupture of a main coolantpipe, and designed to stop these missiles.
The types of missiles for which protection is provided are:
* Valve Stems* Valve bonnets+ Instrument thimbles* Various types and sizes of nuts and bolts* Complete RCCA drive mechanisms, or parts thereof* Piece of pipe* Pressurizer valves, instrumentation thimbles and heaters
Removable slabs, blocks and partitions were evaluated to determine whether or not theycould become possible missiles. These items were reviewed to assure that the functions ofsafety related structures and equipment will not be affected during an OBE or tornado.
Removable slabs or plates, which were found to be potential missiles are anchored to Class Istructures by means of bolts and anchor bolts. Concrete inserts and bolts provided for
Rev. 165.2-29 12/01/2000

removing the slabs, are designed with lifting capacities equal to two times their normaldesign stress capabilities.
Concrete block walls and partitions which are adjacent to Class I (seismic) equipment orform the boundary of zone "SV" are designed under Class I seismic requirements, reinforcedand anchored to Class I structures. Recommended construction practices of the UniformBuilding Code were used as a minimum requirement.
The Reactor Building crane is also regarded as a potential earthquake-produced missile. TheReactor Building crane was analyzed for seismic forces under maximum expected crane loadconditions during refueling. The procedure for seismic analysis is treated as described hereinbefore in this Section. The design provides for no loss of crane support or structural integrityduring a DBE, and that no parts will shake loose.
To assure the stability of the crane during an earthquake, the bridge and trolley are equippedwith fitted rail yokes that will allow free-rolling movement but will prevent the wheels frombeing lifted or derailed. The structural steel and Reactor Containment Vessel wall supportingthe crane are designed to withstand these earthquake-induced forces.
The bridge and trolley wheels are equipped with electrically activated, spring setbrakes. Upon loss of power or when the crane or trolley is not under operator control, thesprings activate the brakes locking the wheels firmly in place to prevent rolling. The positivewheel stops provided and designed to prevent overtravel of the trolley also prevent the trolleyfrom leaving the rails even in the unlikely event of brake failure. For details about missileprotection of the Reactor Containment Vessel and Shielding Building, refer to Appendix B,Paragraph B.9.
Insulation
Insulation is not required for the Reactor Containment Vessel or the Shield Building.
Shielding
The primary performance objective of radiation shielding within the Reactor Containr~entVessel is to minimize the exposure of plant personnel to radiation tmanating from the realtorand auxiliary systems. The rpdiation levels prevalent during plant operation, as well as thpseexperienced upon shutdowfp, are recognized in the determination of the shielqingrequirements as described in Section 11.2. The secondary performance objective of theradiation shielding is to minimnize radiation effects upon operating equipment as described inSection 1 1.2.
Rev. 165.2-30 12/01/2000

5.2.2 SHIELD BUILDING DESIGN
Design Conditions
The Shield Building is a reinforced concrete structure of vertical cylindrical configurationwith a shallow dome roof. An annular space is provided between the Reactor ContainmentVessel shell and the wall of the Shield Building to permit construction operations andperiodic visual inspection of the Reactor Containment Vessel. The volume contained withinthis annulus is approximately 374,000 cubic feet.
The Shield Building concrete wall is 2'-6" thick and the dome is 2'-0" thick for biologicalshielding requirements. The design bases for shielding requirements for operational radiationprotection are discussed in Section 11.2. The results of analysis with respect to assumedpost-accident conditions using these design parameters are discussed in Section 14.3.5.
The normal ambient temperature in the annular space is set by heat loss through the ReactorContainment Vessel and Shield Building. The design assures that the Reactor ContainmentVessel metal temperature can be maintained above 30'F.
Following the Design Basis Accident (DBA), displacement of the containment shell due tothe post-LOCA pressure/temperature increase inside the containment and heat transferred tothe air in the annular space could cause a slight pressure rise. This annulus pressure transientis limited to less than 4.0" H20 by venting the annular space. Conservative assumptions fortemperature transmission to the space, and pressure drop in the Shield Building Ventilation(SBV) system were used in sizing the ventilation system. Following this initial pressuretransient, the Shield Building is maintained at a slight negative pressure with respect to theAuxiliary Building-between l/2" and 2Y/2" H20. The Shield Building seals are designed toaccommodate these pressures.
The structure was analyzed to assure adequate strength to accommodate thermal stressesresulting from the above temperature-induced thermal gradients.
The following loadings are considered in the design of the Shield Building:
* Structure dead load* DBA load* Live loads* Wind load* Tornado load+ Uplift due to buoyant forces* Earthquake loads* External missiles
Rev. 165.2-31 12/01/2000

Design Leakage Rate
The Shield Building is designed so that its inleakage rate is not greater than the amountsindicated in Figure 5.2-8. The inleakage rates shown in Figure 5.2-8 are total leak ratesincluding the leakage through the personnel doors. The originally calculated contribution tototal leak rate from the various sources of inleakage, with a differential pressure of '/4" ofwater is shown in Table 5.2-3. These leak rates will in most cases vary linearly withpressure, and extrapolations made on this basis are shown in Figure 5.2-8.
Figure 5.2-8 also shows the measured as-built leakage rate and a modified design basisleakage rate. For discussion ofthese leakage rates see Section 5.5.1.
Design Loadings
Dead Load
Dead load consists of the dead weight of the Shield Building, the Reactor ContainmentVessel, grout under the Containment Vessel, the foundation slab, and the weight of concrete,structural steel, equipment, and miscellaneous building items within the Reactor ContainmentVessel.
The basis for calculation of weights is given in Section 5.2. 1.
Design Basis Accident (DBA) Load
The DBA load is determined by analysis of the pressure and temperature transients in theannulus during a Design Basis Accident (See Section 14.3.4).
Live Load
Live load consists of snow loads on the dome applied uniformly to the top surface of thedome at 40 pounds per horizontal square foot (PSF).
Wind Load
Wind loading for the Shield Building is based on Figure l(b) ASCE Paper 3269, "WindForces on Structures," using the fastest wind speed for a 1 00-year period of recurrence. Thisresults in a 100-mph basic wind at 30 feet above grade. In addition, this paper was used todetermine shape factors, gust factors and variation of wind velocity with height.
Tornado Load
The structure was analyzed for tornado loading (not coincident with accident or earthquake)on the following basis:
Rev. 165.2-32 12/01/2000
a. The Shield Building is designed for an internal pressure of 3 psi acting outward anduniformly over the entire inside surface of the building, and
b. Lateral force on the Shield Building assumed as the force caused by a "funnel" of windhaving a peripheral tangential velocity of 300 mph and a forward progression of 60 mph.
The design tornado that is assumed corresponds to a large funnel of arbitrary radius with aband of maximum velocity wind (300 mph) which is at least 150 feet wide and whichextends from the ground surface to at least 200 feet.
The forces induced in the Shield Building by the external pressure of the above hypotheticaltornado are considered in two cases. In the first case the structure is considered as an annularcantilever beam loaded with maximum wind pressure over the entire horizontally projectedarea of the structure. This case gives the maximum overturning moments, and membrane,shear and axial stresses. In the second case, it is assumed that the exterior pressure at anyhorizontal section varies from a maximum at the sub-wind centerline of the building to zeroat each end of the diameter, which is perpendicular to this centerline. This pressure pattern isassumed to be the same at all elevations. This case gives the maximum ring moments andshears.
Uplift Due to Buoyant Forces
Uplift forces, which are created by the displacement of ground water by the structure, areaccounted for in the design of the structure.
Earthquake Loads
Seismic loads were computed using the following:
+ Operational Basis Earthquake seismic ground acceleration of 0.06g. (See Appendix A).+ Design Basis Earthquake seismic ground acceleration of 0.12g.
A vertical component of 3 of the horizontal ground acceleration is applied simultaneouslywith the horizontal acceleration. The plots of the seismic response spectra are shown inAppendix A. The classification of plant structures and equipment and the applicabledamping factor are shown in Appendix B. The general procedure for seismic analysis istreated in Section 5.2.1.
External Missiles
The design tornado missile was chosen to be equivalent to an airborne 4" x 12" x 12' - 0"long wood plank traveling 300 mph. Other possible sources of tornado missiles wereevaluated, as reported in Appendix B, but none were as destructive as the wood plank. Theturbine missile is discussed in Appendix B.
Rev. 165.2-33 12/01/2000

Codes
Design Codes
Concrete structures are designed in accordance with the ACI Code 318-63 "Building CodeRequirements for Reinforced Concrete". Structural steel is designed in accordance with the"AISC Specification for Design, Fabrication and Erection of Structural Steel for Buildings".
Welding is in accordance with the ASME Boiler and Pressure Vessel Code and AWS"Standard Code for Arc and Gas Welding in Building Construction".
In addition to the above, the Shield Building is designed and constructed in accordance withapplicable state and local building code requirements.
Material
Specifications and working drawings for materials and their installation are of such scopeand detail that the desired integrity of the Shield Building was assured.
Basic specifications for these materials include the following:
a. Concrete
All concrete work is in accordance with ACI 318-63 "Building Code Requirements forReinforced Concrete".
The concrete was tested to assure a minimum compressive strength of 4000 psi at 28days. Where the heat of hydration was not a factor, Portland cement Type I, conformingto Specification ASTM C150, was used. In other applications, Type 1I cement was usedfor its lower heat of hydration and slower rate of heat generation.
Testing of aggregates, cement, concrete mixes and sampling were undertaken by aqualified independent testing laboratory. Concrete samples were taken at a point nearestto placement as was possible.
Standards and specification for concrete materials, testing and construction methods areas follows:
* ACI 306* ACI 347* ACI 605* ACI 614* ASTM C31
* ASTM C33* ASTM C39
Recommended Practice for Winter ConcretingRecommended Practice for Concrete FormworkRecommended Practice for Hot Weather ConcretingRecommended Practice for Measuring, Mixing and Placing ConcreteMaking and Curing Concrete Compression and Flexure TestSpecimens in the FieldSpecifications for Concrete AggregatesTest for Compressive Strength of Molded Concrete Cylinders
Rev. 165.2-34 12/01/2000

* ASTM C87
* ASTM C98* ASTM C143* ASTM C150* ASTM C172* ASTM C175* ASTM C227
* ASTM C231
* ASTM C260* ASTM C289* ASTM C295* ASTM C350
Test for Effect of Organic Impurities in Fine Aggregate on Strength ofMortarSpecification for Ready-Mixed ConcreteTest for Slump of ConcreteSpecification for Portland CementMethod of Sampling Fresh ConcreteSpecification for Air-Entraining Portland CementTest for Potential Alkali Reactivity of Cement AggregateCombinationsTest for Air Content of Freshly Mixed Concrete by the PressureMethodSpecification for Air-Entraining Admixtures for ConcreteTest for Potential Reactivity of AggregatesPetrographic ExaminationFly Ash for use as a Concrete Admixture
b. Reinforcement
All reinforcing is new billet steel and specified as follows:
Type & ASTMSpec No.
GradeDesignation
MinimumTensile-PSI
MinimumYield-PSI
Minimum Elongationin 8" Spec
A-15 Intermediate 70,000 40,000 7-12%*A-408 Intermediate 70,000 40,000 10%A-432 -- 90,000 60,000 7%ASTM A305 Specification for Deformations of Deformed Steel bars for
Concrete ReinforcementAWS D12.1 Recommended Practices for Welding Reinforcing Steel, Metal
Inserts and Connections in Reinforced Concrete Construction* Varies with size of bar.
All reinforcing steel was shipped to the job site in bundles bearing a tag identifying its size,grade and code number keyed to heat numbers. This information was verified by certifiedmill test reports, which accompany each shipment of reinforcing steel.
All reinforcing steel bars were clearly identified with markings legibly rolled into the surfaceof each bar at the producer's plant showing the point of origin, size, designation and type ofsteel. High-strength steel bars were further identified with the minimum yield strength rolledinto the surface of each bar.
All reinforcing steel was tested in accordance with ASTM Specifications. Tests included onetension and bend test per heat number or mill shipment; whichever is less, for each full sizediameter bar.
Rev. 165.2-35 12/01/2000

The Quality Control Engineer followed construction to assure that steel bars as specified onthe drawings were placed in their proper location and were of the designated size andstrength.
The fabricator was required to furnish assurance that the steel as detailed, fabricated andshipped to the job site, bearing identification tags, was the same as that received from themill.
Reinforcing steel bars were generally lap-spliced except where the design indicated thatwelded splices were structurally required, because the lap splice could not adequately meetthe joint requirements within practical limits, or where welded splices were economicallyadvantageous. Welded splices were made by full penetration fusion butt-welding. OnlyA-I5 reinforcing bars were used.
Whenever the integrity of structure was dependent upon welding, the weld splicing of A-15bars was as follows:
a. A fully pre-qualified, written welding procedure was used
b. All welders were pre-qualified by tests
c. The chemistry of the bars to be welded was determined, and no bar with a carbon contentgreater than 0.35% was welded;
d. Welded splices in adjacent bars were staggered at least 24 inches
e. An extra ring of bars was added and was in addition to those required by the design; and
f. Not less than one in each twventy-five welds were tested radiographically. Each weld wasinspected visually.
Shield Building wall reinforcement in each direction was governed by the structuralrequirements of tornado pressure loadings, wall temperature gradients, and missileloading. The structural requirements were in excess of the minimum percentages ofreinforcement required by ACI-318. The design indicates that the minimum percentage ofreinforcement in any case is not less than 0.4%.
Design Basis
The Shield Building completely encloses the Reactor Containment Vessel, the accessopenings, the equipment door, and that portion of all penetrations that are associated withPrimary Containment. The design of the Shield Building provides for:
* Biological shielding,* Controlled releases of the annulus atmosphere under accident conditions,* Environmental protection of the Reactor Containment Vessel.
Rev. 165.2-36 12/01/2000

The Shield Building is primarily a shielding structure and as such it is not subjected to theinternal pressure loads of a pressure-containment vessel. The structure therefore will not besubject to bi-axial tension and cracking due to pressure loads.
Since the Shield Building need not be designed for internal pressures, the reinforcementarrangements are based primarily on the need to withstand the more conventional structuralloads from environmental effects.
The design criteria for the openings are:
a. To provide reinforcement around the openings to carry all loads by frame action. Becausethe Shield Building wall thickness is set to meet radiation shielding requirements, thethickness is generally in excess of that necessary for structural requirements; therefore, itwas necessary to add additional bars around the perimeter of the opening to provide areinforced concrete frame.
b. To provide for horizontal and vertical shearing forces acting in the plane of the opening,diagonal bars are provided forming an octagonal pattern of reinforcement around theperimeter of the opening.
The reinforced concrete and structural steel of the Shield Building and foundation weredesigned by the working stress method and are based on allowable stresses as set forth inTable 5.2-4.
Earthquake stresses were added linearly and directly to stresses caused by the Design BasisAccident, snow, wind, dead loads, and the appropriate operating loads, to obtain the totalstresses. These total stresses are within the maximum stress limits allowed by the applicabledesign criteria.
The summation of loads as stated in Conditions I and 2 of Table 5.24 provided the designbasis for the Shield Building.
The summation of loads as stated in Condition 3 of Table 5.24 provided the design basis tomaintain the integrity of the Shield Building so that a proper shutdown can be made duringthe ground motion having twice the intensity of the Operational Basis Earthquake. Thedesign was reviewed to assure that resulting deflections or distortions did not prevent theproper functioning of the structure or piece of equipment and would not endanger adjacentstructures or components.
Adequate reinforcing was placed in the concrete walls and dome to control cracking due toconcrete shrinkage and temperature gradients.
The summation of loads as stated in Condition 4 of Table 5.2-4, provided the basis for adesign review to assure that the Shield Building will suffer no loss of shielding orcontainment function due to a 300-mph design tornado.
Rev. 165.2-37 12/01/2000

The allowable stress values shown in Table 5.2-4 assure an elastic behavior of steelreinforcement during a Design Basis Earthquake, thus minimizing the cracking of concreteand the impairment of leaktight integrity.
It is demonstrated by the stress criteria of Table 5.2-5 that during the maximum conditions ofearthquake loading, the allowable stress values of Table 5.2-4 provide adequate marginswithin the elastic range of the material to assure the elastic behavior of the structure.
Concrete Cracks in Walls of Shield Building During Post-Earthquake Conditions
It is expected that only negligible amounts of inleakage could occur through cracks duringpost-earthquake conditions and accordingly, leakage due to an earthquake has been indicatedas "negligible" in Table 5.2-3.
This is primarily a consequence of the combination of low shear stresses and the predominanteffect of the dead load of the structure on the moment and shear stresses produced byearthquakes.
The maximum expected tangential shear stress on a horizontal cross-section of the ShieldBuilding wall at the base of the structure during a Design Basis Earthquake will be in theorder of 90 psi. This shear stress will vary from zero to a maximum and will be distributedover the cross-section as outlined in Section 5.2.1.
The ratio of the structure deadload to the Design Basis Earthquake moment uplift forces is inthe order of 1:0.95 with a deadload stress of about 220-psi and a maximum moment upliftstress of 21 0-psi at the outer fibers of the cross-section where the shear stresses are zero.
The structure dead load acts as a pre-stress on the structural system and modifies thetrajectories of tensile and compressive principal stresses from their characteristic curved linesto near straight orthogonal lines. For example, where the horizontal tangential shear stress iszero, the principal stress trajectory will be vertical and there will be no normal horizontalstress and associated cracking of concrete. This condition occurs in the walls at theextremities of a diameter normal to the neutral axis. A second limiting condition occurswhere the horizontal tangential stress is a maximum (90-psi) at the extremities of a diametercoincident with the neutral axis. The vertical dead load stress (220-psi) will combine withthe shear stress to generate a principal stress trajectory that will be oriented near vertical(approximately 200 to the vertical) with a normal principal tensile stress of 30-psi.
It is evident that earthquake conditions cannot produce sufficient horizontal forces to initiateand open vertical shear cracks to any appreciable degree. It is further evident that whatevercracks might form would only open and be exposed to inleakage for an average time lengthof only one-half of the duration of the earthquake. Since the elastic action of the structuralsystem will alternately open and close stress cracks during earthquake stress cycling andfinally remain closed after the earthquake has subsided. In addition, the stresses due to an
Rev. 165.2-38 12/01/2000

earthquake will vary from a maximum at the base of the structure to zero at the very top,thereby further minimizing any leakage.
Finally, it can be concluded that earthquake forces will not provide any stresses ofappreciable magnitudes that might contribute to any significant cracking and associatedinleakage to the Shield Building Ventilation System.
Concrete Cracks and Leakage at the Springline of the Shield Building
The construction of the Shield Building roof consisted of two stages. First, a thin reinforcedconcrete dome roof was placed (about 5" thick). This dome was supported by the ReactorContainment Vessel shell dome by means of temporary construction shores. When thisconcrete dome had sufficient strength, the temporary shores were removed and the balance ofroof concrete was placed.
The design and construction of the dome roof and walls at the springline are monolithic. Thedome roof and walls are reinforced in a meridional direction for structural discontinuitymoments and shears. The dome roof and walls are also reinforced in a circumferentialdirection to resist the hoop tensile stresses caused by springing of the dome roof at its pointof support. The hoop reinforcing is proportioned in accordance with the discontinuity strainsof the concrete shell near the springline to achieve an efficient use of the steel for crackcontrol. The concrete dome roof is under continual compression due to dead load; therefore,cracking in the dome will be negligible.
It is estimated that the thrust of the dome roof will result in a maximum tensile stress of120-psi in the hoop concrete section at the springline.
This stress is well within the limiting stress at which cracking in concrete can be expected tooccur. However, in keeping with a conservative approach, the concrete is assumed tocrack. The resulting inleakage through these cracks is shown in Table 5.2-3.
The wall and dome surfaces are provided with a minimum of 2" concrete cover over thereinforcing bars as required by ACI-3 18, to provide an adequate protection of reinforcementagainst freezing and thawing.
Foundation Slab and Support and Adjacent Building Construction
This foundation slab of the Containment System will have structural continuity with thefoundation slab of the adjacent building.
The design provides for the relative static settlements that could occur between structures asdead load is placed on the slab during construction. The design assumes a zero relativesettlement between structures during an earthquake. The design takes into account localfoundation deformations during an earthquake due to the dynamic action of a rockingstructure.
Rev. 165.2-39 12/01/2000

Structures adjacent and exterior to the Shield Building walls are designed with provision forthe movements of the Shield Building during an earthquake. Walls originating in theAuxiliary Building that abut the Shield Building wall are isolated from the Shield Buildingby an adequate physical separation to prevent damage to either structure due to hammeringduring an earthquake.
Floors in the building adjacent to the Shield Building wall are not supported by the ShieldBuilding wall but are cantilevered from columns. These floor slabs and beams are separatedfrom the Shield Building wall by a flexible expansion joint that will permit independentbuilding movements that might occur during an earthquake. Adequate physical separationbetween these floor slab terminal edges and the Shield Building walls are provided to preventhammering.
The Shield Building and Auxiliary Building were dynamically analyzed for seismicity byJohn A. Blume & Associates (References 3 and 4).
The results of these two analyses were correlated to determine the separation requiredbetween the two structures to assure that there would be no physical contact between thestructures under earthquake conditions.
The separation space in walls and floors, which are a part of the leak barrier, is sealed bymeans of a flexible membrane attached to the concrete surfaces at the separation joint. Thisseal is of a type that will provide for movements that expand or contract the separation jointand for movements in the two other coordinate axes.
The Shield Building is monolithic with and integrally connected to the Auxiliary Building upto and including the mezzanine floor.
Flexible expansion joints have been provided between the Shield Building and adjacentAuxiliary Building structures above the mezzanine floor to provide for the relative lateralmovements of the buildings during an earthquake.
A polyvinylchloride foam plastic joint filler is used to form the joint and a two-componentpolysulfide base sealant provides a watertight seal at the top of the joint. At the periphery ofthe roof, the "SV" zone and the Shield Building airlock concrete enclosures, an additionalflexible non-plasticized chlorinated polyethyline reinforced with polyester mesh flashing wasprovided to assure continued leaktight integrity.
Prior to placement of the foundation slabs and exterior walls below grade, a 40-mil thickpolyvinylchloride sheet was placed to act as a vapor barrier. This sheet acts in a dual role,preventing out-leakage of radioactive fluids from the plant, and at the same time preventinginfiltration of ground water. The waterproofing membrane extends up to an elevation onefoot below grade, which is approximately fifteen feet above the subsurface drainage systemcircumscribing the plant and twenty-two feet above high water lake level.
Rev. 165.2-40 12/01/2000

Analysis and Design for Missiles
The Shield Building is designed to withstand the tornado missile without loss of function. Itis also designed to intercept the turbine missile and prevent it from damaging the ReactorContainment Vessel. Details of design analysis methods and criteria are given inAppendix B.
Design Analysis
The Shield Building was analyzed for individual cases of dead load, wind load, tornado,earthquake, and internal pressure loads.
The basis of the wind analysis is identified herein before in this Section.
The analysis for tornado winds considered the combined frontal pressure effects of both the300 mph tangential and the 60 mph forward velocities acting on one-half of the ShieldBuilding.
The seismic analysis of the Shield Building is given in Section 5.2.1.
The resulting stresses from individual loadings are combined as indicated inTable 5.2-4. Under loading condition "4" in Tables 5.2-4 and 5.9-1, the maximum allowableconcrete stress is indicated to be 0.85 f,.
In the actual design of the structures the maximum concrete stresses for condition "4" in theShield Building never exceeded 0.53 to and the actual stresses in the internal structures(Table 5.9-1) never exceeded 0.75 M.
Therefore, with a maximum allowable concrete stress of 0.75 f, there is no lack ofconsistency in the safety margins for concrete and reinforcement steel. In the final design, abalanced design of concrete and steel reinforcement has been achieved.
The Shield Building is subjected to two distinct types of shear action. These are:
a. A radial shear normal to the building walls developed by discontinuity conditions andtornado internal pressure, and
b. A tangential and accompanying longitudinal shear taken on a radial plane through thewalls induced by the flexural action of the structure under the effects of wind orearthquake loads (Reference 9).
The Shield Building was analyzed for effects of thermal stress.
The containment atmosphere during normal operation varies depending on the time ofyear. The average temperature at any one time can be as high as 11 5PF.
Rev. 165.2-41 12/01/2000

The steady-state temperature distribution in the Shield Building was determined, using theconservative assumption that the containment vessel and the annulus air are both at 120'Fand the outside temperature is at -351F. The calculated inside and outside wvall temperaturesare 990F and -70F, respectively.
The transient temperature distributions following a LOCA were calculated by superimposingon the steady-state temperature profile the effects of radiative and convective heat transfer tothe wall from the annulus air and the containment vessel due to the energy release inside thecontainment vessel. The maximum wall temperature is 1171F on the inside surface at 45.2minutes following a LOCA and temperature changes at a depth beyond 10 inches are thennegligible. The physical properties as well as the assumptions used to calculate the steadyand transient temperature profiles are listed in Table 5.2-11.
The total concrete and steel stresses, including thermal stress due to the transient conditionare also presented in the table, and these are below the allowable limits.
The calculation described is conservative in most respects, rather than realistic. The LOCAconditions are those associated with a double-ended break and calculations of outercontainment wall temperatures following smaller breaks indicates very little difference inheat input to the annulus for these cases. The dominant thermal effect is the gradientresulting from initial temperatures on opposite sides of the wall and these temperatures havebeen chosen conservatively.
The Shield Building is a structure of conventional reinforced concrete design andconstruction. The Shield Building is designed to resist the internal pressure of 3-psi due totornado loading, however this does not subject the structure to significant membrane forcesthat are ordinarily associated with pressure vessels. This low internal pressure minimizes thecracking of concrete and assures that concrete will function as a shear-carrying member. Inaddition, the structural discontinuity stresses are small since no significant pressure forces arepresent. Therefore, radial shears will be very low.
The shear provisions of the ACI Code are applicable to concrete members under thecombined action of moments and applied axial compressive or tensile loads. Theseprovisions are applicable to the transverse and tangential shear actions noted above.
The tangential and longitudinal shear distribution over the annular cross-section and at anypoint will be given by:
VI = . cos q
The tangential and longitudinal shear will vary from zero over a thickness of wall located atthe extremes of a diameter normal to the neutral axis to a maximum on a wall thicknesslocated on both extremes of a diameter coincident with the neutral axis, and is given by:
Rev. 165.242 12/01/2000

V. vhra
V= Total shear on the annular cross-section;VC= Unit tangential or longitudinal shear on the annual cross-section;r Mean radius of Shield Building wall;t = Thickness of Shield Building wall;0 = Polar angle measured on either side of the neutral axis locating the point at which the
unit shear is to be determined;vm,,, = Maximum tangential and longitudinal shear.
The maximum unit shear is limited in the design by the allowable values of the ACI 318-63Code, Chapter 12.
Construction
The reinforced concrete vertical cylindrical wall of the Shield Building was constructed usingthe slip-form method as described in Chapter 5 of ACI Code 347-68.
Several minor changes were made to the fixed-form designs to facilitate slip forming. Thechanges effected the following:
a. Length of forms for block-outs, plate inserts and embedded items were shortened for easyplacement in forms,
b. Spacing of form-supporting yokes required shorter lengths of reinforcement,
c. Concrete slump increased to 6 inches and maximum aggregate size was limited to 3/4,
and
d. Form to be tapered to avoid adhesion as form is raised.
Penetrations
The Shield Building penetrations for piping ducts and electrical cable are designed towithstand the normal environmental conditions which may prevail during plant operation andalso to retain their integrity during and following postulated accidents.
The openings into the Shield Building, including personnel access openings, equipmentaccess openings and penetrations for piping, duct, and electrical cable, are designed toprovide containment which is as effective as the Shield Building and consistent with theShield Building leak rate.
The Shield Building is provided with two access openings, one located adjacent to themaintenance air lock and the other adjacent to the personnel air lock.
Rev. 165.2-43 12/01/2000

Each access opening is provided with double-interlocked doors. A bolted, sealed door isprovided at the equipment opening.
Pipe penetrations through the Shield Building are sealed with low-pressure flexibleclosures. The seals are of a rubber-impregnated canvas material or equal and seal the processline to the embedded sleeve in the Shield Building.
Flexibility of all cables is provided between the Shield Building and the ReactorContainment Vessel so that no damage can occur to the cables or structures due todifferential movements between the two structures.
All electrical cables in the annulus are provided with support systems of various methods.
Generally the cables will be supported by tiers of cable tray, which are supported bystructural members bearing on the external support concrete and tied back to the ShieldBuilding. The cables will not be clamped to the cable tray system and will have slackallowed in them at both ends.
The large 5000-volt cables used for the reactor coolant pump are supported somewhatdifferently. A supporting framework is clamped to the penetration nozzle (part of thecontainment vessel) to provide a rigid support for the cables at the outboard end of theporcelain bushings. The cables will have approximately 18" of length available for slackprior to entering the embedded conduit in the Shield Building.
Annulus lighting system cables are all supported by clamps fastened only to the ShieldBuilding.
All of the above systems are designed to accommodate differential movements between thetwo buildings without interaction.
Further discussion of penetrations is presented in Section 5.2.1.
Rev. 1612/01/20005.2-44

8.2 ELECTRICAL SYSTEM
8.2.1 NETWORK INTERCONNECTIONS
Electrical energy generated at 20-kV is transformed to 345-kV by the Main Transformer, a bankof three single-phase units, which in total arc rated at 580-mVA. It is delivered through a345-kV, 25,000-mVA (interrupting rating), 1600-ampere (552-mVA) circuit breaker to the345/138-kV switching station located at the plant site, as shown in Figure 8.2-1. The electricaloutput is integrated into the American Transmission Company's 345-kV and 138-kVtransmission systems. These systems are interconnected at the plant site substation by atransformer rated at 300 mVA. The 345-kV transmission system has interconnections withNorthern States Power Company. Two 345-kV transmission lines are connected to the plantswitching station and are on separate line structures in order to minimize the possibility of losingmore than one circuit at a time. Either line is capable of carrying the full output of thegenerator. In addition, two 138-kV lines are connected to the plant switching station from the138-kV grid system. These two lines together are capable of carrying the full output of thegenerator, but would be limited by the 300-mVA Autotransformer on a loss of both 345-kVlines.
An analysis of the integrated 345/138-kV power system has been made and shows that a fault onany one of the transmission lines, any bus section at the Kewaunee Substation, or the loss of theKewaunee generator will not cause a cascading failure on the transmission system, therebyinsuring an off-site power supply to the plant for any of the aforementioned failures. (SeeStability Study in Reference 6).
The centerline of the two 138-kV lines is 265 feet south of the southern-most two 345-kV lineson a separate right-of-way as they leave the plant property. About one-half mile west of thesubstation the two 345-kV lines turn: one, line R-304, goes north and the other, line Q-303, turnssouth at a dead-end tower. Line Q-303 crosses over both 138-kV lines, one before the dead-endtower and one after (see Figure 8.2- 1 a). Since dead-end tower failure is not considered a credibleaccident, failure of a 345-kV line structure at some point could only cause a failure of one138-kV line. There is no area where a failure of a 138-kV line structure can cause a failure ofeither 345-kV line. Thus, there is no single failure that can disable more than two lines. Thisresults in three pairs of physically independent sources of offsite power (see NRC SER inReference 1).
The 138-kV overhead transmission line from the substation into the plant on-site distributionsystem through the Reserve (Startup) Auxiliary Transformer is bifurcated at the substation toconnect to either the East or West 138-kV buses. Each leg of the bifurcation is separated fromthe respective bus with a 138-kV oil circuit breaker. The controls for the 138-kV breakers areseparated into two distinct 125-V d-c branch circuits; one serving the breaker closing circuit andone of the two trip circuits with the primary relaying; the other serving the second trip coil andthe backup relaying. These breakers are manually controlled from the plant Electrical VerticalPanel A.
USAR - Rev. 188.2-1 11/01/2003

Similar connections to the East and West 138-kV buses are made to the 345-138-kVautotransformer, which can be used to energize the autotransformer if the need arises. Thesebreakers are manually controlled from the plant Electrical Vertical Panel A, or local control inthe substation control house and by operator choice can be transferred to system operating officesupervisory control.
The West 138-kV bus is connected to a capacitor bank with a 138-kV oil circuit breaker (seeFigure 8.2-1). Each of the four-capacitor banks have switching devices. The breaker andswitching devices are normally under system operating office supervisory control and by operatorchoice, can be transferred to control from Electrical Vertical Panel A.
The 345-kV system can be and normally will be used to energize the 345-138-kVAutotransformer. The 345-KV oil circuit breakers arc controlled similar to the East and West138-kV bus oil circuit breakers described above.
The tertiary winding of the autotransformer is used to furnish power to the 13.8-kV TertiaryAuxiliary Transformer via an underground insulated power cable. This cable becomes thesecond of the two physically independent circuits to provide off-site power to the on-sitedistribution systems.
Both of the above circuits will normally be energized at all times and will be connected to one orthe other of the engineered safeguards buses at all times. Thus, loss of the reactor, turbinegenerator, Main Station Auxiliary source of power does not even require a transfer for thesafeguards buses. In the case of an engineered safeguards bus energized by one of the on-sitepower sources, i.e., the diesel-generator, and subsequent loss of the diesel-generator, theautomatic transfer system will search for a transformer source and automatically close in itsbreaker. The above postulated condition could only occur after a loss of all off-site power andsubsequent restoration of at least one source, prior to manual operator actions per emergencyinstructions.
Thus, loss of power from the nuclearunit should not affect the availability ofpower from the twooff-site transmission circuits or the two standby power sources. Loss of either transmissioncircuit should not affect the other transmission circuit, the two standby power sources or thenuclear unit as a source. Finally, loss of one or both of the standby power sources should notaffect the availability of the transmission sources or the nuclear unit.
Substation D-C System
The substation d-c system consists of two separate systems; the 48-V d-c distribution systemfurnishing power to the solid-state relay systems and the 125-V d-c distribution systemfurnishing control power and additional electromechanical and microprocessor based relaysystems.
The 48-V d-c distribution system consists of redundant battery chargers, one battery and twodistribution cabinets.
USAR - Rev. 188.2-2 11/01/2003

The 125-V d-c distribution system consists of redundant battery chargers, one battery and fourdistribution cabinets.
The battery chargers are furnished with a-c and d-c (output) failure relays and redundant a-csources. High and low voltage alarms are provided for the d-c circuit.
The 125-V d-c distribution system is arranged so that the two circuits used to control each high-voltage circuit breaker emanate from different distribution cabinets. Each branch circuit in thethree breaker distribution cabinets is individually monitored and alarmed on loss of d-cvoltage. These alarms are displayed in the substation control house and are transmitted to theplant control room annunciator as a substation alarm. The branch circuits in the fuse distributioncabinet are not individually monitored and alarmed on loss of d-c voltage. A loss of power toany of the microprocessor based relays fed from the fuse cabinet would be indicated locally onthe relay and transmit an alarm to the transmission system operator. The overall effect is that ofa dual supply to the high-voltage breaker control trip elements with alarm should any portion ofthe supply system become abnormal.
The oil circuit breakers can close on 90-V d-c and trip on 70-V d-c. Each battery charger isequipped with a low voltage alarm set at 122-V d-c. The battery is considered to be fullydischarged when the voltage reaches 105-V d-c. The actual closing energy is supplied from aircompressors also integral with each circuit breaker. The air compressors are a-c powered. Thestorage cylinders have sufficient capacity when fully charged for five operations if a-c werelost. These breakers can be manually tripped at the breaker.
Loss of the substation battery and a concurrent fault on one of the transmission lines wherein theplant would continue to supply power to the fault is a set of postulated conditions, which wouldlead to an undetected failure. Under these postulated conditions, the fault would clear when thetransmission-line remote terminal breakers opened. The Kewaunee breakers can be manuallytripped and, thus, isolate the fault, thereby restoring off-site power to the plant via the remainingtransmission lines.
Thus, given an undetected failure, the capability to clear and restore off-site power to theKewaunee plant will not be lost, and the restoration of off-site power (assuming the grid isavailable) will be made within the time period (seven days) in which the plant can be maintainedin a safe condition without off-site a-c power.
8.2.2 PLANT DISTRIBUTION SYSTEM
The Auxiliary Electrical System is designed to provide a simple arrangement of buses requiringthe minimum of switching to restore power to a bus in the event that the normal supply to thatbus is lost.
USAR - Rev. 188.2-3 11/01/2003

Single Line Diagrams
The basic components of the plant electrical system are shown on the Single Line or CircuitDiagrams, Figures 8.2-2 and 8.2-3. These figures show the 20-kV, 4160-V, 480-V andinstrument bus a-c systems and the 125-V and 250-V d-c systems. In addition, Figures 8.2-1,8.2-2 and 8.2-3 show the basic elements of the 13.8-kV, 138-kV and 345-kV substation systems.
Main Auxiliary, Reserve Auxiliary and Tertiary Auxiliary Transformers
The plant turbine-generator serves as the primary source of auxiliary electrical power during "on-the-line" operation. Power is supplied via a 20-4.16-kV, three-winding, Main AuxiliaryTransformer, which is connected to the main leads from the turbine generator.
The primary sources of electrical power for the auxiliaries associated with engineered safetyfeatures during "on-the-line" operation of the plant are the Reserve Auxiliary Transformer andthe Tertiary Auxiliary Transformer. Power is normally supplied to one bus (Bus 1-6) through the138-4.16-kV, three-winding Reserve Auxiliary Transformer which is connected to the 138-kVportion of the Kewaunee Substation. Power is normally supplied to the second bus (Bus 1-5)through the 13.8-4.16-kV, two-winding Tertiary Auxiliary Transformer which is connected, byan underground line, to the 13.8-kV tertiary winding of the 345/138/13.8-kV auto transformer inthe Kewaunee Substation. Either source can supply both buses.
Auxiliary power required during plant startup, shutdown and after reactor trip is supplied fromthe 13.8/138/345-kV Kewaunee Substation via the Reserve Auxiliary and Tertiary Auxiliarytransformers. After turbine-generator trip, the auxiliaries on the 4160-V buses being fed by theMain Auxiliary Transformer are transferred by a fast bus transfer scheme using stored energybreakers to the Reserve Auxiliary Transformer. Control power for the plant auxiliarybreakers issupplied by the plant batteries. The high-side (substation) breakers use the substation battery forcontrol power.
4160-V System
The 4160-V system is divided into six buses, as shown in Figure 8.2-2. Buses 1-1 and 1-2 areconnected via bus main breakers to the Main Auxiliary and Reserve AuxiliaryTransformers. These buses supply power to the Reactor Coolant Pumps and the FeedwaterPumps.
Buses 1-3 and 1-4 are also connected via bus main breakers to the Main Auxiliary and ReserveAuxiliary Transformers. These buses supply power to the normal balance-of-plant auxiliaries,and each bus supplies power to three 4160 - 480-V station service transformers. A fourthtransformer connected to bus 1-4 supplies power to the Technical Support Center. In addition,the Circulating Water Pumps, Condensate Pumps and the Heater Drain Pumps are directlyconnected to buses 1-3 and 14.
USAR - Rev. I88.2-4 11/01/2003

Buses 1-5 and 1-6 are connected via bus main breakers to the Main Auxiliary, Reserve Auxiliary,and Tertiary Auxiliary Transformers. In addition, each bus is directly fed via a main breaker by adiesel generator. The two buses are tied together via two bus tiebreakers in series, one on eachbus. Each bus supplies two of the four 4160 - 480-V station service transformers for the plant's480-V engineered safety features equipment. In addition, the Service Water Pumps, AuxiliaryFeedwater Pumps, Safety Injection Pumps and the Residual Heat Removal Pumps are directlyconnected to buses 1-5 and 1-6.
Bus 1-5 is normally supplied from the Tertiary Auxiliary Transformer and Bus 1-6 is normallysupplied from the Reserve Auxiliary Transformer. Thus, no transfer is required for theengineered safety features in the event of an incident.
The bus tie breakers between Bus 1-5 and Bus 1-6 can only be manually closed, but areinterlocked so that the diesel generators cannot be operated in parallel.
480-V System
The 480-V system is divided into 11 load center or switchgear buses, as shown inFigure 8.2-2. Those fed from 4160-V buses 1-3 and 1-4 serve balance-of-plant loads, those fedfrom 4160-V buses 1-5 and 1-6 serve the loads associated with the engineered safety featuresequipment.
Transformers 1-32 and 1-42 are connected to 4160-V buses 1-3 and 1-4,respectively. Transformer 1-32 feeds 480-V bus 1-32; transformer 1-42 feeds 480-Vbus 1-42. These components including the 480-V bus tie are assembled as a conventional,double-ended switchgearunit. In a similarmannerbuses 1-33/1-43 and 1-35/1-45 are connectedto 4160-V buses 1-3 and 1-4. Bus 1-46, supplying the TSC, is connected to 4160-V bus 1-4.
The various motor control centers throughout the plant are then connected to these switchgearbuses.
The power required for the 480-V engineered safety features and other vital plant loads issupplied from four 480-V buses fed from 4160-V buses 1-5 and 1-6. Transformer 1-51 is fedfrom 4160-V bus 1-5 through breaker 1-505 and supplies bus 1-51. This transformer, bus andbreakers, including one bus tie, are assembled as a switchgear unit. In a similar manner, bus1-52 is also connected via breaker 1-505 to 4160-V bus 1-5.
The large 480-V engineered safety features motors are connected to bus 1-51. Motor ControlCenters supplying the smaller loads are fed from bus 1-52.
A redundant 480-V system is supplied by 4160-V bus 1-6 through 4160-V breaker 1-607.
MCC 1-5262 may be fed from either 480-V switchgear bus 1-52 or 480-V switchgear bus 1-62through breakers 15209 or 16209 respectively, via a manually operated transfer switch. 480-Vswitchgear bus 1-52 may ultimately be fed from on-site power source Diesel Generator IA and
USAR - Rev. 188.2-5 11/01/2003

480-V switchgear bus 1-62 may ultimately be fed from on-site power source DieselGenerator IB. 480-V MCC 1-5262 does function as a swing bus between the two redundant on-site power distribution systems as discussed in Safety Guide 6. However, the mechanicaloperation of this switch allows MCC 1-5262 to be connected to only one 480-V switchgear busat a time. Hence the redundant 480-V switchgear buses can never be paralleled through theoperation of this switch. Therefore, the transfer of MCC 1-5262 does conform to the criteriaoutlined in Safety Guide 6. Furthermore, the components fed from MCC 1-5262 are not part of aredundant load group. The components are:
* Turbine Turning Gear* Turbine HP Hydrogen Seal Oil Backup Pump* Condensate Bypass All Heaters to Feedwater Pumps Motor-Operated Valve* Waste Gas Compressor lB* Station and Instrument Air Compressor IA
The intent of the transfer switch is to provide maintenance flexibility for these loads.
It should also be noted that 480-V switchgear buses are each protected from the transfer switchwith a breaker.
The automatic transfer switch associated with MCC I -52E provides BRA-1 06 with two possiblesources of power, MCC 1-52E or MCC 1-52C. However, both MCC 1-52E and MCC 1-52C areassociated with the same on-site power source (Diesel Generator IA). Therefore, the transfer isnot between power systems of redundant load groups and does not fall into the category of swingbuses discussed in Safety Guide 6.
Likewise, the automatic transfer switch associated with 1-62E allows BRB-106 to be fed fromeither MCC 1-62E or MCC 1-62C. These MCCs are both within the same load group.
125-V and 250-V D-C System
The 125V and 250-V DC system is divided into five buses (two safeguard and three non-safeguard, see Figure 8.2-3) each with one battery and a battery charger, distribution panels andinverters. Components prefixed with BRA and BRB make up the safeguard DC system andthose prefixed with BRC, BRD and BRE make up the non-safeguard system.
The DC power requirements of the engineered safety features (ESF) and other vital plant loadsare supplied by the safeguard batteries (numbered BRA-101 and BRB-101). Each safeguardbattery consists of 59 cells, each of which are the lead calcium type. The batteries are rated 125VDC, 1304 ampere-hours at the eight-hour rate without discharging below 1.78V per cell. Twomain DC distribution panels (BRA-102 and BRB-102) are fed from these batteries via mainfuses. The main distribution panels connect the battery to the battery charger, to the sub-distribution panels, and allow for the interconnection of the two buses through the bustiebreakers.
USAR-Rev. 188.2-6 11/01/2003
BRA-102 supplies sub-distribution panel BRA-104. BRA-104 in turn supplies the control andexcitation power for diesel generator 1A, the control power for ESF buses 1-5, 1-51, and 1-52,control and power to one-half of the redundant essential plant equipment required for safeshutdown in the event of loss of AC power and provides a standby power source for thesafeguard inverters BRA-I 11 and BRA-1 12.
BRB-102 supplies sub-distribution panel BRB-104. BRB-104, in turn, supplies the control andexcitation power for diesel generator 1 B, the control power for ESF buses 1-6, 1-61, and 1-62,control and power to one-half of the redundant essential plant equipment required for safeshutdown in the event of loss of AC power and provides a standby power source for thesafeguard inverters BRB-I 1 1 and BRB-1 12.
The balance of plant DC power requirements are supplied by three non-safeguard batteries(designated BRC-101, BRD-101 and BRE-101). Batteries BRC-101 and BRD-101 each consistof 59 cells and are of the lead calcium type, rated at 125V DC, 1680 ampere-hours at the eighthour rate to reach 1.78V per cell. Battery BRE-101 consists of 120 cells of the lead calciumtype, rated at 250 V d-c, 694 ampere-hours at the two hour rate to reach 1.75V per cell. Eachbattery is connected to a main distributionpanel (BRC-102, BRD-102 and BRE-102). The maindistribution panel connects each battery to a battery charger, sub-distribution panel, bus tie (125Vd-c batteries only) and inverter(s).
Distribution panels BRC-102 and BRD-102 supply sub-distribution panels BRC-103 andBRD-103, respectively. Panel BRC-102 is also a standby source for inverter BRC-109. TheBRC and D-103 panels, in turn, supply Technical Support Center diesel generator control andexcitat-ion power, control power for non-ESF buses 1-1, 1-2, 1-3, 1-4, 1-32, 1-33, 1-35, 1-42,1-43, 1-45, and 1-46, other non-safety related equipment sensitive to a loss of AC power and area standby source for inverter BRD-109 and a proprietary inverter.
Distribution panel BRE- 102 supplies AC drive units BRE- 109 and BRE-l 1 0, which convert the250V d-c input power to 230-V a-c output power for the turbine emergency oil pump and air sideseal oil backup pump motors.
Each of the five battery buses is served by one connected battery charger. Each safeguard batteryhas provisions for connection of a spare portable charger. The spare safeguard charger can bemoved to its designated mounting in either safeguard battery room and connected to the DC busin the event of charger failure. The battery life to minimum voltage under maximum load willallow sufficient time to make this connection. The non-safeguard spare charger is permanentlymounted between the normal 125V d-c chargers and can be connected to either bus asrequired. There is no spare 250V d-c charger.
The two bus tie breakers between 125-V d-c distribution cabinet BRA-102 and 125-V d-cdistribution cabinet BRB-102, are manually operated. These breakers are strictlyadministratively controlled to prevent them from being closed during plant operation.
USAR - Rev. 188.2-7 11/01/2003

Instrument Bus
The 120-V a-c instrument supply is split into several buses as shown on the one line diagramFigure 8.2-3. There are four independent instrument buses, each fed by an inverter which, inturn, is fed from each of the d-c buses. A fifth independent non-interruptible bus, fed by an ESFmotor control center, supplies the rod position indicators. The sixth and seventh independentbuses, each fed by an inverter, supply the plant process control computer and cabinet BRD-1 15,respectively. There are two additional independent buses; each fed from an ESF motor controlcenter through a transformer.
Evaluation of Layout and Load Distribution
The physical location of electrical distribution system equipment is such as to minimizevulnerability of vital circuits to physical damage as a result of accidents.
The Main Auxiliary, Reserve Auxiliary and Tertiary Auxiliary Transformers are located outdoorsand are physically separated from one another by firewalls. Each transformer cell, formed by thefirewalls, has an automatic water spray system to extinguish and prevent the spread of fires.
The 4160-V switchgear and 480-V load centers are located in areas which minimize theirexposure to mechanical, fire and water damage. This equipment is coordinated electrically topermit safe operation of the equipment under normal and short-circuit conditions.
The 480-V motor control centers are located in the areas of electrical load concentration. Thoseassociated with the turbine-generator auxiliary system in general are located in the TurbineBuilding. Those associated with the nuclear steam system are located in the Auxiliary Building.
The application and routing of control, instrumentation and power cables are such as to minimizetheir vulnerability to damage from any source. The construction design drawings had secondlevel review in accordance with the Kewaunee Construction Quality Assurance Program.
All cables are specified using conservative margins with respect to their current-carryingcapacities, insulation properties and mechanical construction. The power conductors are threeconductor, galvanized armored and installed in a single layer in ladder type cable trays, andclamped to insure that ample ventilation spacing is maintained throughout the run.
Bulk control power supply cables are treated as noted in the previous paragraph.
Control cables normally employ minimum size of # 12 AWG when run in multi conductor cablesin control trays. As there are few continuous loads on these circuits no attempt was made atderating. Continuously loaded circuits (current transformer secondaries) are sized by burdenrequirements of the circuit. In special cases #14 AWG multi-conductor control cable wasallowed in cable trays. In these identified cases, a safety evaluation has been performed. Specialcases may continue to allow #14 AWG multi-conductor cable to be used. These will require asafety evaluation and approval by the responsible engineer.
USAR - Rev. 188.2-8 11/01/2003
Cables that are run in trays have fire resistant jackets. Safety-related cables meet theenvironmental qualifications required by 10 CFR 50.49. Appropriate instrumentation cables areshielded as required to minimize induced-voltage interference. Wire cables related to engineeredsafety features and reactor protective systems are routed and installed to maintain the integrity oftheir respective redundant channels and protect them from physical damage.
Supports and cable trays for safety feature power cable systems are designed for 100% loadingplus the forces generated by a seismic disturbance. Other cable systems are designed for 100%loading. The ladder fill is restricted to one layer, clamped in place to maintain 2 to 12 inchspacing between cables.
Cable trays for control and signal cable support systems and other safety-related systems aredesigned for forces generated by a seismic disturbance assuming maximum fill. Other cablesystems are seismically designed for maximum fill. The tray fill is restricted to 50% of the tray'scross sectional area for safety-related cable and 60% for non-safety related cable.
Separation Criteria
Cable separation provides sufficient isolation between redundant systems so that no single failureor electrical incident can render both redundant systems inoperable or remove them from service.
To assure complete separation of Class IE circuitry that initiates and controls the transfer ofpower sources to the emergency a-c and emergency d-c distribution system, the following cableand cable tray separation techniques are used:
a. Each tray section of the cable tray system has an identifying code indicated on the electricaldesign drawings and this same identification is stenciled on the tray after it isinstalled. Stenciling is applied at each straight section of tray where the identifying codechanges.
On the electrical design drawings, the trays are identified by a number placed in a rectangularsymbol. The trays used for the redundant safeguards equipment are further identified with avertical line adjacent to the tray name symbol.
The identifying code contains the designation "S5" or 'S6" where applicable to identify thesafeguard train.
b. The two Safeguard tray systems are independent of each other such that they are physicallyseparated a minimum of 3 feet horizontally and 3 feet vertically, except in the Relay Roomwhere 1-foot minimum horizontal and vertical separation is required.
c. Each electrical cable has an identifying code indicated on the electrical design drawings andcable routing lists. This same cable number is affixed at each end of the cable withpermanent tags.
USAR - Rev. 188.2-9 11/01/2003

The identifying code is based on the following systems.
The cable codes for the 4160-V switchgear; the 480-V switchgear and the 480-V motorcontrol centers are a combination of letters and numbers that form a four part codingcontaining:
* Unit Number I* Source of Power+ Power or Control* A serially assigned number which provides uniqueness.
A "5" in the second digit from the left is a cable in the "Safeguards 5" system; a "6" a cablein the "Safeguards 6" system (Example IS5 xxx or 1S6 xxx).
Normal cable being fed from safeguards distribution equipment should have cable codesstarting with I NP followed by a serially assigned number which provides uniqueness. Somenormal cables remain with their original safeguards power source type cable codes, since nocomprehensive re-labeling program was implemented.
Redundant circuitry for reactor protection and engineered safety systems are separated intogroups as follows.
Class IE cables are divided into the following groups:
+ Group I (color code red)Red Instrument ChannelInstrument Bus I
+ Group 2 (color code yellow)Yellow Instrument ChannelInstrument Bus IV
+ Group 3 (color code green)Safeguard Train A, Battery IA, Diesel Generator IA, 4160-V Bus 1-5, 480-V Bus 1-51,480-V Bus 1-52 and its associated Motor Control Centers.
* Group 4 (color code blue)Blue Instrument ChannelInstrument Bus III
* Group 5 (color code white)White Instrument ChannelInstrument Bus II
USAR - Rev. 188.2-10 11/01/2003

* Group 6 (color code orange)Safeguard Train B, Battery 1B, Diesel Generator IB, 4160-V Bus 1-6, 480-V Bus 1-61,480-V Bus 1-62 and its associated Motor Control Centers.
Each group is run in a separate tray, ladder, trough or conduit. These trays are identified onelectrical drawings for engineered safety features, and are marked and color-coded on the actualhardware. All trays for the engineered safety feature equipment are Class I structures.
Within containment the tray systems for the four reactor protection instrument channels areseparated 3 feet horizontally where they involve 2/4 logic and are separated approximately 20feet where they involve 2/3 logic. Vertical separation is 5 feet where practical, and whereimpractical, barriers are installed. These barriers are solid metal covers on the lower trays.
For the non-Class-Er systems throughout the remainder of the plant, trays installed in stacks arespaced vertically with a minimum of 12 inches bottom to bottom in all areas. However, Class Etrays have a minimum of 15 inches bottom to bottom between trays of the same train. Class IEtrays containing instrument, control or power cables have a minimum horizontal separationbetween redundant circuits of 36 inches. Redundant circuits are not permitted in the same tray orconduit. If closer spacing than 36 inches cannot be avoided, an approved barrier must be placedbetween the circuits. Cable trays are routed to avoid a fire hazard area, such as oil storage rooms,oil tanks, etc., whenever possible. When this cannot be done, the cable tray system is protectedby fire resisting barriers. Where practical, these barriers will be tray covers. Whenever possible,a wall or floor has been introducted between trays carrying redundant safeguard circuits. Barriersare required where mutually redundant trays cross. The barriers shall extend to each side of theprotected tray by a distance equal to approximately three times the wider of the two trays.
Mixing of power cables with control or instrument cable in the same tray is not permittedthroughout the plant. Whenever a control and/or instrument cable tray and a power tray are inthe same stack, the power tray is located in the top tier.
Trays for Train A and Train B are separated 3 feet horizontally and vertically except in the RelayRoom where practical design considerations require 1-foot vertical and horizontal'separation. The two trains are separated by 40 feet at the reactor containment vesselpenetrations.
Power cables for engineered safeguards are kept strictly in cable trays sodesignated. Occasionally, a non-safety-related power cable may be run in a safeguards cable traybut a safeguards cable will never run in any tray other than its own system. Control cables aresimilarly separated and control and instrumentation of the same train designation may be run inthe same control cable tray. Non-safety-related power, control or instrumentation cable shall notbe permitted to cross over from one safeguards tray to another.
Where the wiring for redundant engineered safety features is within a single panel or panelsection, this wiring is separated one group from the other, by a 6-inch air space or a fireproofbarrier. The barriers are sheet metal or flexible metallic conduit. The flexible conduit may be
USAR - Rev. 188.2-11 11/01/2003

applied to one train to separate it from the other train. Wiring not associated with either trainmay be grouped with one train but may not cross from one train bundle to the other train.
Where the approved logic required recognition of input signals from both A train and B traindevices into common terminal blocks or operational devices, the interconnecting wiring can nolonger retain train identity. Train A and B wiring shall maintain physical and electricalseparation up to the termination point prior to where the interconnecting wiring loses itsidentity. This is an allowable exception to the above paragraph. The interconnecting wiringcommon to both trains shall not be termed "Normal", nor shall it be routed with normal wiring.
Cable trays used for redundant reactor protection systems, engineered safeguards systems andClass IE electrical systems have an identifying code number stenciled on them in color paint afterthey are installed. The number is applied whenever there is a change in identity or when passingthrough floor or wall openings. This number is applied prior to the pulling of any cables, and thecolor establishes the system to which it is assigned.
During the cable pulling operation, an intermittent colored stripe is applied to the cable as itleaves the reel. This color must match the color of the tray system in which it isinstalled. Normal (or non-Class IE) cables, ifpulled into a colored tray system, will not have anidentifying stripe on them.
The following colors are used for identification:
* Green - Safeguard Train A circuits+ Orange - Safeguard Train B circuits* Red - Reactor Protection system* White - Reactor Protection system* Blue - Reactor Protection system+ Yellow - Reactor Protection system
Relay Room
The main (original) relay room is arranged in two groups of four rows of cabinets. The group tothe east contains blue and white reactor protection channels, reactor protection train A,engineered safeguard train A, and other miscellaneous relay circuits (including two cabinets onthe east wall). The group to the west contains yellow and red reactorprotection channels, reactorprotection train B, engineered safeguard B, and miscellaneous relay and metering circuits.
A relay room expansion to the south has two rows of cabinets with provision for a third. Thecabinets contain plant process computer input/output and miscellaneous monitoring equipment.
The upper levels of the relay room are used for cable routing, as there is no separate room labeled"cable routing room".
USAR - Rev. 188.2-12 11/01/2003

Within the room the trays are arranged in four tiers. The arrangement of these tiers is such thatinstrument and control circuits of reactor protection and engineered safety features of like trainsare stacked together or with normal instrumentation and control. The colored instrumentchannels for reactor protection are converted from trays to rigid conduit systems where they enterthe relay room and then to 6-inch metal raceway as they pass over the instrument racks tofacilitate rack output interconnections.
Horizontal fire barriers are provided between the Control Room and the Relay Room at thecontrol consoles and panels.
Testing
Testing of the operator-activated Class IE circuitry that initiates and controls the connection ofthe buses to the power sources for the a-c emergency power system; the Main AuxiliaryTransformer, the Tertiary Auxiliary Transformer, the Reserve Auxiliary Transformer, and theDiesel Generators; can be done by transferring the buses, one at a time, from one source toanother with controls available to the operator in the Control Room. Manual switching of thesesource breakers occurs during periodic breaker maintenance, bus maintenance and dieselgenerator testing. Testing of the automatic-initiated Class IE circuitry that initiates and controlsthe connection of the buses to these sources can be performed by utilizing a switch in the ControlRoom which disconnects two bus undervoltage relays of one safeguard bus, thereby simulatingloss of voltage, and activates the associated logic circuitry that is required to automaticallyrestore power to the bus.
A sequential events recorder prints out the operation of each relay in the scheme providingprinted proof of the circuitry's proper response. Upon successful completion of this test a greenlight glows to the right of the test switch.
Both the automatic circuitry and the manual circuitry can be tested by these methods during plantoperation. Portions of the circuitry that cannot be conveniently tested with the plant in operationwithout temporarily interrupting circuit protection are the bus lockouts and the transformerlockouts. A switch is provided for each lockout, which isolates its output contacts allowing thelockout to operate without actually tripping any breakers. The continuity of transformer lockoutrelays is continually monitored by indicating lamps located in the Control Room.
The power sources for the d-c emergency power system associated with the Train A load groupare Station Battery IA and 480-V MCC 1 -52C (via Battery Charger I A). The power sources forthe d-c emergency power system associated with the Train B load group are Station Battery I Band 480-V MCC I -62C (via battery charger IB). The transfer of a d-c bus between its respectivebattery and battery charger can be tested by opening the 480-V breaker supplying power to thecharger, thus simulating a loss of power to the 480-V bus. The d-c system should transfer to thebattery as its source of power. If, after opening the 480-V breaker to the charger the d-c busretains its voltage, the transfer was successful.
USAR - Rev. 188.2-13 11/01/2003
8.2.3 EMERGENCY POWER
Sources Description
Power sources for the engineered safety features are 4160-V Bus 1-5 and Bus 1-6. The normalsource of power to Bus 1-5 is the Tertiary Auxiliary Transformer. The Reserve Auxiliary andMain Auxiliary Transformers provide backup sources, in that order. The normal source of powerto Bus 1-6 is the Reserve Auxiliary Transformer. The Tertiary Auxiliary and Main AuxiliaryTransformers provide backup sources, in that order. Thus, since the normal source of power forthese buses is the 138/345-kV Kewaunee Substation, no transfer is required in the event of aturbine-generator trip.
If all other power sources should fail, two diesel generators are provided, one connected to4160-V Bus 1-5 and one connected to 4160-V Bus 1-6. Each of these is a General MotorsCorporation, Electro-Motive Division, Model A-20-C 1, diesel engine-generator unit rated at2600-kW, (2860-kW, 110% Overload, two thousand hours per year) 0.8 pf, 900 rpm, 4160-V,3 phase, 60 Hertz. The generator has emergency ratings of 2950-kW for seven days continuousand 3050-kW for thirty minutes per year.
Each diesel generator, as a backup to the normal standby a-c power supply, is capable ofsequentially starting and supplying the power requirements of one complete set of engineeredsafety features equipment. The electrical emergency power system logic diagrams are shown inFigures 8.2-4, 8.2-5, and 8.2-6. The units are located in separate rooms in Class I portion of theAdministration Building. These rooms are heated; assuring that the diesel generators can bestarted in cold weather.
Service water for the Diesel Engine Cooling Water Heat Exchanger is supplied from separateservice water headers for Diesel Generator 1 A and 1 B. The Cooling Water Heat Exchanger is anengine mounted water-to-water heat exchanger providing cooling for the engine jacket water andfor the engine oil heat exchanger. Vent fans for each room provide a supply of combustion airinto the Diesel Room. Separate startup air receivers and compressors are located just external tothe rooms. Primary and reserve tanks of the air receivers supply compressed air to the dual AirStart System, the DG cooling water isolation valve actuators, and the Diesel Room Ventilationand combustion air dampers.
Each diesel generator is automatically started by either one oftwo pairs of air motors mounted oneach side of the diesel (four air motors per engine). Each unit has its own independent startingsystem including a bank of four air storage tanks, two primary and reserve tanks, and onecompressor powered from the 480-V emergency bus. An air cooler/dryer is installed on thedischarge of each air start system compressor. The dry air improves the starting performance ofthe diesel engine. The primary or reserve tanks have sufficient storage to crank the engine fortwenty seconds. The generator is capable of being started and ready to accept load in tenseconds.
USAR - Rev. 188.2-14 11/01/2003

Starting air is admitted from the storage tanks to the starting system through a pressure-reducingvalve to supply air to the starters.
The following describes a typical diesel engine start sequence. The sequence stated assumes theair start motor priority selector switch is in the #1I position. The air start motor priority selectorswitch is typically rotated from set #1 to set #2 on a monthly basis. This ensures even run timeon the air start motors.
When the diesel start signal is initiated, a start attempt is made through air start motor set #1. Ifthe air start motor set #I fails to engage within 2 seconds, a second start attempt is made with thesame set of motors. If the air start motors still do not engage, and then after 5 seconds a thirdstart attempt is made, this time using the second pair of air start motors (set #2). Air start motorsset #2 will continue to attempt to start the diesel generator on a two second cycle, until the enginestarts or 15 seconds'after the start signal, whichever occurs first. The start signal also initiatesstarting of the fuel priming pump and the governor booster pump. If, after fifteen seconds, thediesel has not reached 200 rpm, a start failure signal opens the fault relay. Starting air is cut off,the fuel priming and governor booster pump are stopped. Operator action is then required forfurther start attempts. The fault relay in the diesel generator room must be reset and any faultscausing the fault lockout must be corrected before the start signal will be effective again.
The start failure relay serves to indicate an abnormally long period of engine cranking without anengine start (fifteen seconds) and to prevent subsequent engine starting attempts until the causeof the engine start failure has been determined by operating personnel. The total air capacityavailable to crank the engine is twenty seconds per air starter-tank combination.
The following interlocks must be satisfied to automatically start the diesel engine:
a. Engine mounted LOCALIREMOTE (AUTO/OFF/MAN) switch must be in REMOTE(AUTO) position for Diesel Generator IA(1B). Control Room and local annunciation isgiven when this local switch is not in the REMOTE (AUTO) position.
b. Control Room PULLOUT/STOP/AUTO/START switch must be in AUTO position(maintained position). (The other maintained position of this switch is the PULLOUTposition, which disables the engine starting circuit during engine maintenance).
c. 125-V d-c control power must be available at the diesel engine control panel. (The enginestarters cannot be engaged if control power is not available; loss of control power isannunciated in the Control Room).
d. The engine must not be running.
e. Air pressure must be available to the starting air system (loss of air pressure on each startingair system is annunciated locally and in the Control Room).
USAR - Rev. 188.2-15 11/01/2003

The diesel engine interlocks itemized above can be periodically tested as follows:
a. Turning the engine mounted LOCAL/REMOTE (AUTO/OFF/MAN) switch from theREMOTE (AUTO) position will alarm the local and Control Room annunciators for DieselGenerator IA(I B). Diesel generator operational testing verifies annunciator status; therefore,any failure to start due to mispositioning of the switch would identify the annunciator failure.
b. The stable PULLOUT position of the Control Room PULLOUT/STOP/AUTO/STARTswitch is visibly different than the stable AUTO position in that the switch handle is slantedto the left of its normally vertical position (AUTO) and a distinctive silver colored switchshaft extension is visible.
c. Opening the 125-V d-c distribution breaker to the engine control cabinet alarms the ControlRoom annunciator.
d. Response of the air receiver pressure switches can be tested and calibrated by valving in thestandby air receivers, valving out the on-line receivers, opening the air compressor circuitbreaker, and opening the receiver drain valve until an alarm occurs on the local and ControlRoom annunciators.
The motor-driven compressor associated with each diesel is fed from the emergency bus suppliedfrom the same diesel. The control voltage for each diesel starting system is from its associated125-V d-c station battery.
An audible and visual alarm system is located in the control room and will alarm off-normalconditions ofjacket water temperature, lube oil temperature, fuel oil level, starting air pressureand Diesel Generator stator hi temperature (1 of 12 inputs feeding the 4160 Volt StatorTemperature Hot annunciator). An alarm also sounds if a starting circuit is locked out, a controlswitch is not in "auto" position, or d-c power for the controls at the diesel generator is lost. Thealarm in the control room also alerts the operator to other various off-normal conditionsincluding jacket water expansion tank level and pressure, engine crankcase pressure, and fuel oilpressure. Local audio and visual alarms are also provided at each diesel generator.
Reference 2 is a safety evaluation in which the NRC has concluded that, based on the review ofsubmitted information and on-site inspections, the status annunciators for the diesel generatorsare acceptable. The review was specifically intended to ensure that any deliberately inducedcondition which may disable the diesel generators, and which is expected to occur morefrequently than once per year, is automatically annunciated in the Control Room with devicesworded to alert the operator of their abnormal status.
Two 850-gallon "day" tanks are located in enclosures within each diesel generator room. Thetwo tanks provide capacity for approximately four hours operation for one generator at fullload. Two 35,000-gallon underground storage tanks supply fuel oil through immersion pumps toeither pair of day tanks. Combined fuel capability of one storage tank and two day tanks wouldprovide a minimum of 7 days fuel supply for one diesel generator (36,000 gallons of fuel oil),
USAR - Rev. 188.2-16 11/01/2003

thus assuring adequate time to restore off-site power or to replenish fuel. The diesel fuel oilstorage capacity requirements are consistent with those specified in ANSIN195-1976/ANS-59.51, Sections 5.2, 5.4 and 6.1. See Reference 3 and TechnicalSpecification 3.7 for fuel oil storage requirements.
Loading Description
Each diesel generator is automatically started on the occurrence of either of the followingincidents:
a. Undervoltage on the associated 4160-V bus (Bus 1-5 or Bus 1-6) provided that the lowvoltage is not caused by a fault which operates the bus lockout relay (see Reference 5 andTechnical Specification);
b. Initiation of a Safety Injection Signal which will start both diesel generators.
With the occurrence of undervoltage on 4160-V Bus 1-5, whose normal source of power is theTertiary Auxiliary Transformer, the automatic sequence is as follows:
1) Start Diesel Generator IA,
2) Close Reserve Auxiliary Source Breaker (BKR503), ifvoltage is present. Ifthis source is notavailable, then
3) Close Tertiary Auxiliary Source Breaker (BKR501), if voltage is present and BKR611 istripped. If this source is not available, then
4) Shed load on the 4160-V and 480-V buses and close Diesel Generator IA Breaker(BKR509), if diesel generator voltage and frequency meet established criteria (maximum tenseconds from diesel engine start signal).
The automatic restoration of voltage sequence for 4160-V Bus 1-6, whose normal source ofpower is the Reserve Auxiliary Transformer, is as follows:
1) Start Diesel Generator 1B
2) Close Tertiary Auxiliary Source Breaker (BKR61 1), if voltage is present and BKR501 istripped. If this source is not available, then
3) Close Reserve Auxiliary Transformer Breaker (BKR601), if voltage is present. If this sourceis not available, then
4) Shed load on the 4160-V and 480-V buses and close Diesel Generator IB Breaker (BKR603)if voltage and frequency meet established criteria (maximum ten seconds from diesel enginestart signal).
USAR - Rev. 188.2-17 11/01/2003

Once started, the diesel continues to run even though voltage may be restored from an off-sitesource of power. Manual shutdown of the diesels by the Control Room operator is alwaysrequired (except for engine protection shutdowns).
Circuit breaker interlocks are provided to preclude interconnection of redundant emergencybuses.
Breakers 1-501 and 1-611 allowthe load groups associated with Diesel Generator IA and DieselGenerator IB, respectively, to be connected to a preferred power source, the Tertiary AuxiliaryTransformer. This combination of load group connections is referred to in Safety Guide 6,Section D.2, which states: "A preferred power source bus, however, may serve redundant loadgroups".
Breaker 1-501 must be tripped before Diesel Generator IA can be automatically connected toBus 1-5 and BKR 1-611 must be tripped before Diesel Generator lB can be automaticallyconnected to Bus 1-6. Therefore, the redundant standby power sources cannot be automaticallyparalleled, satisfying Section D.4a of Safety Guide 6.
Breakers 1-510 and 1-602 provide a bus tie between the load group associated with DieselGenerator IA and the load group associated with Diesel Generator lB. These breakers can beclosed by operator action only. To close BKR 1-510 or BKR 1-602, the following conditionsmust exist:
* No bus fault on Bus 1-5.+ No bus fault on Bus 1-6.* No fault on cable between 1-5 10 and 1-602 (as monitored by independent lockout circuits).* Breakers 1-503, 1-501, 1-511, 1-601, 1-610, and 1-611 are tripped.* Either Diesel Generator 1A is supplying power to Bus 1-5 and BKR 1-603 (for Diesel
Generator 1B) is tripped or Diesel Generator lB is supplying power to Bus 1-6 andBKR 1-509 (for Diesel Generator IA) is tripped.
These interlocks provide the necessary isolation as identified in Safety Guide 6 betweenredundant load groups.
Breakers 15211 and 16211 are bus tie breakers.
Both breakers can be closed only by operator action. The operator can close BKR 15211 or BKR16211 only if:
* No fault has occurred on either Bus 1-52 or Bus 1-62, and* No fault has occurred on the section of cable between 15211 and 16211, and* Breaker 15201 and/or 16201 is open.
USAR -Rev. 188.2-18 11/01/2003
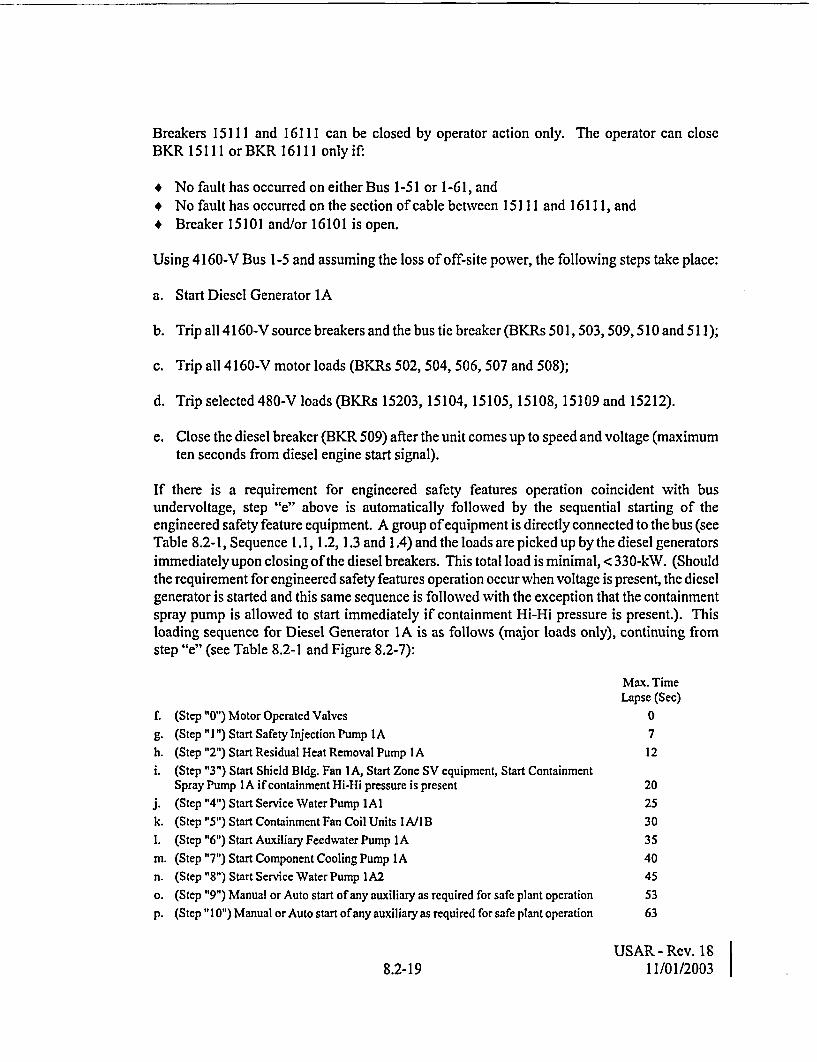
Breakers 15111 and 16111 can be closed by operator action only. The operator can closeBKR 15111 or BKR 16111 only if:
* No fault has occurred on either Bus 1-51 or 1-61, and* No fault has occurred on the section of cable between 15111 and 16111, and* Breaker 15101 and/or 16101 is open.
Using 4160-V Bus 1-5 and assuming the loss of off-site power, the following steps take place:
a. Start Diesel Generator 1A
b. Trip all 4160-V source breakers and the bus tic breaker (BKRs 501, 503,509,510 and 511);
c. Trip all 4160-V motor loads (BKRs 502, 504, 506, 507 and 508);
d. Tripselected480-Vloads(BKRs 15203, 15104, 15105, 15108, 15109 and 15212).
e. Close the diesel breaker (BKR 509) after the unit comes up to speed and voltage (maximumten seconds from diesel engine start signal).
If there is a requirement for engineered safety features operation coincident with busundervoltage, step "e" above is automatically followed by the sequential starting of theengineered safety feature equipment. A group of equipment is directly connected to the bus (seeTable 8.2-1, Sequence 1.1, 1.2, 1.3 and 1.4) and the loads are picked up by the diesel generatorsimmediately upon closing of the diesel breakers. This total load is minimal, < 330-kW. (Shouldthe requirement for engineered safety features operation occur when voltage is present, the dieselgenerator is started and this same sequence is followed with the exception that the containmentspray pump is allowed to start immediately if containment Hi-Hi pressure is present.). Thisloading sequence for Diesel Generator 1A is as follows (major loads only), continuing fromstep "e" (see Table 8.2-1 and Figure 8.2-7):
Max. TimeLapse (Sec)
f. (Step "0") Motor Operated Valves 0
g. (Step " I ") Start Safety Injection Pump IA 7h. (Step "2") Start Residual Heat Removal Pump IA 12i. (Step "3") Start Shield Bldg. Fan IA, Start Zone SV equipment, Start Containment
Spray Pump IA if containment Hi-Hi pressure is present 20j. (Step "4") Start Service Water Pump I Al 25k. (Step "5") Start Containment Fan Coil Units IA/lB 30
1. (Step "6") Start Auxiliary Feedwater Pump IA 35m. (Step "7") Start Component Cooling Pump IA 40n. (Step "8") Start Service Water Pump I A2 45
o. (Step "9") Manual or Auto start of any auxiliary as required for safe plant operation 53p. (Step "10") Manual or Auto start of any auxiliary as required for safe plant operation 63
USAR-Rev. 8 |8.2-19 11/01/2003

NOTE: "Max Time Lapse" is the maximum time to initiation of closing the branch feederbreaker following the closure of the diesel generator source breaker. The "Max Time Lapse"specified above through step "n" is a maximum time that should not be exceeded. The "MaxTime Lapse" specified above for step "o", as one input to service water isolation to the TurbineBuilding, is a maximum time that should not be exceeded. Because all other step "o" and "p"loads are defined above as those loads that will manually or automatically start as required, the"Max Time Lapse" specified above should not be considered absolute with nominal deviation ofminor safety significance.
Starting of the containment spray pumps, initiated by Hi-Hi containment pressure, isaccomplished simultaneously with any of the above steps following the starting of the residualheat removal pump when the diesel is required to supply power to the bus. When the bus issupplied from a transformer source the containment spray pump is started immediately on Hi-Hicontainment pressure. The diesel generator automatic loading sequence through step 8, including10 seconds for engine starting, will be accomplished in approximately fifty-five seconds asshown by Figure 8.2-7. As stated in Section 14.3.4, the containment pressure analysis assumes adelay of 137.7 and 85.3 seconds respectively, to supply design containment cooling fromcontainment spray and fan-coil units.
The automatic sequences for Bus 1-6 and for Buses 1-61 and 1-62 associated with DieselGenerator IB are similar to those described for Bus 1-5. Loads to be carried by a dieselgenerator are summarized in Table 8.2-1.
Should any of the feeder breakers, associated with the above (safety features) large (non-MCCfeed) pump or fan motors, trip due to overcurrent, they can be re-closed from the controlroom. The electrical overload protection for the engineered safety feature fan, pump, and valvemotors are not actually applied as overload protection. The motors are conservatively operatedwith respect to their rating and an overload occurs only as a major malfunction. Therefore, theoverload protection isolates the malfunctioning component before it can make the bus breakertrip, causing loss of power to all other components in that circuit. Overload trip elements on thereversing starters associated with the various motor-operated valves and non-reversing startersassociated with small pump or fan motors can and must be reset at the motor control centers. Ifthe diesel generator is overloaded, an alarm is annunciated in the control room. The diesel.generator is not protected by overload devices.
Load Evaluation
Diesel Generators
Each diesel generator is sized to start and carry the engineered safety features required for a post-blowdown containment pressure transient.
USAR - Rev. 188.2-20 11/01/2003

Selected generator nameplate data is as follows:
+ Electro-Motive Division of General Motors Corporation* Model A-20-C1, Serial Nos. 70-JI-1029 and 1039* 2400/4160-V, 60 Hertz, Amps 782/452, 3 phase+ 3250-kVA, Temperature rise 850C Stator-Thermometer+ Temperature rise 60'C, Rotor-Resistance* 900 RPM, Power Factor 0.8* 3575-kVA Peak, 2000 hours per year+ Temperature rise 105'C, Stator-Thermometer* Temperature rise 70'C, Rotor-Resistance.* Insulation Class, H-Stator and F-Rotor
Additional operating characteristics of the generator follow:
Capable of being started and ready to accept load in ten seconds and capable of being fullyloaded within twenty seconds.
Capable of operating continuously at rated kVA output at any power factor between rated laggingand unity, at any voltage within ±5% of rated voltage.
Capable of tolerating for thirty seconds without injury a three-phase short circuit at its terminalswhen operating at rated kVA and power factor, 5% overvoltage and fixed excitation.
Compliance to Regulatory Guide 1.9
1. Sizing of generator power requirements.
Motors - All motors are the standard rating above the normal load. The service factor isadded to the motor to cover fan and pump run-out. Checks have been made toassure the run-out is within the service factor. Motor power requirements werecalculated as follows:
100 hp and larger, at 93% efficiency from manufacturers certified test data andhandbooks. Less than 100 hp, at 88% efficiency from handbook data.
Brake hp was used for larger motors where certified test data was available.
KVA - Loads for transformers, etc., were calculated at 80% power factor.
Heater-Loads were taken at rated kW.
USAR - Rev. 188.2-21 11/01/2003

2. Generating load ratings:
Continuous 3250 kVA 100.0%Continuous 2600 kW at 0.8 P.F. 100.0%Overload, 2000 hours per year 2860 kV at 0.8 P.F. 110.0%Overload, 7 days per year 2950 kW at 0.8 P.F. 113.5%Overload, 30 minutes per year 3050 kW at 0.8 P.F. 117.3%
3. Generator rating criteria:
Regulatory Guide 1.9, dated December 1979 states that:
"Conformance with the requirements of IEEE Std 387-1977, "IEEE Standard criteria forDiesel Generator Units applied as Standby Power Supplies for Nuclear Power GeneratingStations", dated June 17, 1977 is acceptable for meeting the requirements of the principledesign criteria and qualification testing of diesel generator units used as on-site electricpower systems for nuclear power plants".
The IEEE Standard 387-1977 states that:
"5.2.3 Operation Application Rule (see 3.7.1 and 3.7.2). The diesel generator units maybeutilized to the limit of their power capabilities as defined by the continuous and short timeratings".
"3.7.1 Continuous Rating - The electric power output capability that the diesel generator unitcan maintain in the service environment for 8760 h of operation per (common) year with onlyscheduled outages for maintenance".
"3.7.2 Short Time Rating - The electric power output capability that the diesel generator unitcan maintain in the service environment for 2 h in any 24 h period, without exceeding themanufacturer's design limits and without reducing the maintenance interval established forthe continuous rating".
NOTE: "Operation at this rating does not limit the use of the diesel generator unit at itscontinuous rating".
Table 8.2-1 lists the diesel-generator loads and the times that they will sequence on ifrequired. The maximum connected loads are 3701.4 kW for DG IA and 3523.3 kW forDG 1B. Table 8.2-1 also gives a time dependent load list, which shows that the highestestimated loads are 2919.8 and 2899.1 kW for each respective diesel generatorwhich occursfrom one to sixty minute into the loading sequence. After adding safeguard station servicetransformer loss loads of 25.5 kW and 20.4 kW the maximum diesel generator loads are2945.3 kW forDG IA and 2919.5 kW forDG lB. These loads are both less than the seven-day per year overload rating of 2950 kW for the diesel generators.
USAR - Rev. 188.2-22 11/01/2003

Operation of the safeguard diesel generators at frequencies other than 60 hertz, as allowed bythe governor speed setting, have been shown by calculation to be within the various generatorratings.
The diesel generator ratings given in Item 2 above do not match the Short Time Ratingdefinition of IEEE Std. 387-1977, as they were determined before 1977. We do, however,meet the intent of the Standard in that the diesel generators do not exceed the defined (by themanufacturer) load ratings. Therefore, the requirements of Regulatory Guide 1.9 are met.
4. Generator loading and sequence on safety injection signal is shown in Figure 8.2-7. The timesequence is after the closing of the diesel generator breaker. The maximum allowable timelapse for the load to come on was originally specified by Westinghouse and is used tosupport transient analysis. The normal time to pick up the load is the automatic timersetting. Table 8.2-1 lists the specific loads.
The criteria used in determining the a-c loads assigned to the emergency buses were:
a. Those loads, which are essential to safety-related functions and which if the power sourcefailed, could affect public health and safety.
b. Those loads which if the power source failed would cause severe economic loss or cause theplant to experience an extended outage.
Batteries and Battery Chargers
Each of the plant's four 125-V station batteries has been sized to carry the expected shutdownloads following a plant trip and a loss of all AC power for a period of eight hours without thebattery terminal voltage falling below 105 V. The 250-V station battery has been sized to carryits loads following a plant trip and a loss of all AC power for a period of two hours.
The safeguard batteries (BRA101 and BRB 101) arc C and D CharterPower Type LCR-1 9 1304AH (8 hour), 1054 AH (3 hour), 647 AH (1 hour), and 1234 AH (1 min.). Major loads, withtheir approximate operating times on each battery, are listed in Table 8.2-2. The non-safeguardbatteries (BRC101 and BRD101) are Exide Corp. Type FTC-21 1680 AH (8 hour), 1236 AH(3 hour), 750AH (1 hour), and 1260AH (1 min.). The 250-V non-safeguard battery (BREI01)is a C and D Power Systems Type 2LCR-15, 700 AH (2 hour).
Each of the three safeguard battery chargers has been sized to recharge either of the abovepartially discharged safeguard batteries within twenty-four hours, while carrying its normalload. Partially discharged is defined as any condition between fully discharged (105-V) andnominal (125-V). Normal voltage when on charger is 129 to 135-V (2.19 to 2.29-V per cell).
The battery chargers are each supplied with a d-c ammeter to continuously indicate the charger'scurrent output. Each battery charger is also supplied with a d-c voltmeter on the line side of thecharger output circuit breaker. This voltmeter will indicate the charger or battery voltage
USAR - Rev. 188.2-23 11/01/2003

whichever is higher. A d-c ammeter on each of the main load side buses of the batteriescontinually indicate the total load current on each battery train. On a monthly basis the specificgravities of the pilot cells are checked and recorded.
The actual charge stored in the batteries can be related to the monitored parameters in thefollowing ways:
a. The batteries are of the lead calcium type and are floated at 132-V d-c. As long as thespecific gravities of the cells are at least 1.200 and the d-c voltmeter reads 132-V then thebattery is considered fully charged.
b. The battery chargers are each rated at 150-ampere d-c output and will supply the plant loadunder normal conditions. The current-limiting feature on these chargers is set atapproximately 172.5 amperes. In a situation when the ammeter on the battery main bus readsabove 0.0 amperes then the battery would be discharging as indicated on the main busammeter.
Since the battery and charger share the loads on the bus under the normal condition, the batterymust have sufficient ampere-hour capacity to carry the total loads consisting of two classes asfollows:
a. The momentary load, such as closing and tripping of switchgear, involves the one-minuterating of a battery, though the time duration of the operation is but a few cycles.
b. The continuous load usually involves the battery's three to eight-hour rating, although longertime periods are sometimes used. The load consists of indicating lamps, holding coils forrelays and any other equipment continuously drawing current from the control bus.
Reliability Assurance
The electrical system equipment is arranged so that no single incident can inactivate enoughengineered safety features equipment to jeopardize plant safety. The 4160-V equipment issupplied from 6 buses, the 480-V equipment from 11 buses.
All Class IE electrical equipment complies with IEEE Standard 344-1971, Trial Use Guide forSeismic Qualification of Class I Electrical Equipment for Nuclear Power Generating Stations.
Two separate off-site power sources serve the 4160-V buses supplying power to the engineeredsafety features equipment. One of these is from the 138-kV portion of the substation; the secondis from the tertiary winding of the substation autotransformner via an underground 13.8-kV circuitto the plant.
Separation is maintained in both the 4160-V and the 480-V systems to allow the plant auxiliaryequipment to be arranged electrically so that redundant items receive power from two differentbuses.
USAR - Rev. 188.2-24 11/01/2003

For example, one complement of engineered safety features equipment is supplied from Bus 1-5(4160-V) and Buses 1-51 and 1-52 (480-V) while the other complement is supplied from Bus 1-6(4160-V) and Buses 1-61 and 1-62 (480-V). The cable tray system for one complement isindependent of the cable tray system for the other complement; there are no crossties. Thisdesign assures the separation and independence of the two systems.
One off-site source of power can supply sufficient power to run normal operatingequipment. Any one of the four transmission lines can supply all the plant auxiliary power. Alow-voltage station auxiliary transformer can supply all the auxiliary loads for the plant.
Each diesel generator has capacity enough to sequentially start and run a fully loaded set ofengineered safety features equipment. These safety features can adequately cool the core for anyloss-of-coolant incident, and maintain the containment pressure within the design value.
One battery charger is in service on each battery so that the batteries are always at full charge inanticipation of loss of a-c power. This insures that adequate d-c power is available for startingthe diesel generators and for other emergency uses.
The physical barrier provided between the emergency diesel engine generator sets consists in partof a Class I reinforced concrete wall 18 inches thick and the remainder a reinforced concreteblock wall 12 inches thick. The doors and ventilation exhaust louvers are all Underwriters'Laboratories construction. All other openings in the barrier are sealed with fire retardantmaterials to maintain fire separation of the two diesel generator units.
The only potential for an explosion in the diesel generator rooms exists within a diesel enginecrankcase. The rooms have sufficient volume and are vented to preclude a pressure rise thatwould endanger the integrity of the room walls.
In the event of a service water line break in the area between diesel generator rooms some waterleakage would occur into the diesel generator rooms. Leakage through the door into dieselgenerator room IB would flow to the floor drain if enough water was present to overflow thecurb. Leakage through the door and through the trench into diesel generator room IA wouldflow to the trench drain. All other openings into the diesel generator rooms from the tunnel areat higher elevations.
Both diesel generator rooms have double doors appropriately strengthened to prevent possibleflooding. The trench into diesel generator room IA was plugged to restrict leakage into theroom.
Water flowing from the hypothetical service water line break would return to the screenhousealong the floor of the tunnel. Water entering the screenhouse would drain to the circulatingwater pump elevation where approximately 382,000 gallons are required to flood to the 586-footelevation. Maximum possible service water pump run-out for two pumps would be less than20,000 gpm total. The operator has over nineteen minutes to respond to the low service water
USAR - Rev. 188.2-25 11/01/2003

pressure alarm on one header, isolate that header from the auxiliary building and then trip thepumps.
The rupture of a service water line in an Emergency Diesel Generator Room could result in theloss of the generator or the Safeguards bus in that room. Administrative operation from theControl Room of Type I Service Water valving would isolate the break and if required, realignthe Service Water supplies through the intact piping from the operating Service Water Pumps.
Surveillance Requirements
The monthly tests specified for the diesel generators will demonstrate their continued capabilityto start and carry rated load. The fuel supplies and starting circuits and controls are continuouslymonitored, and abnormal conditions in these systems would be indicated by an alarm withoutneed for test startup (Reference 2).
The less frequent overall system test demonstrates that the emergency power system and thecontrol system for the engineered safety features equipment function automatically in the eventof loss of all other sources of a-c power, and that the diesel generators start automatically in theevent of a loss-of-coolant accident. This test demonstrates proper tripping of motor feederbreakers, main supply and tie breakers on the affected bus, and sequential starting of essentialequipment, to the extent possible, as well as the operability of the diesel generators.
The specified test frequencies provide reasonable assurance that any mechanical or electricaldeficiency is detected and corrected before it can result in failure of one emergency power supplyto respond when called upon to function.
Station batteries will deteriorate with time, but precipitous failure is extremely unlikely. Thecontinuous and periodic surveillance performed on the batteries will demonstrate batterydegradation long before a cell becomes unserviceable or fails.
If a battery cell has deteriorated, or if a connection is loose, the voltage under load will dropexcessively, indicating need for replacement or maintenance.
8.2.4 STATION BLACKOUT
Introduction
On July 21, 1988 the Code of Federal Regulations 10 CFR Part 50, was amended to include anew Section 50.63 entitled, "Loss of All Alternating Current Power", (Station Blackout). Thestation blackout (SBO) rule requires that each light-water-cooled nuclear power plant be able towithstand and recover from an SBO of specified duration.
USAR - Rev. 188.2-26 11/01/2003

Station Blackout Duration
The Kewaunee SBO duration is 4 hours, based on a plant AC power design characteristic GroupPI, an emergency AC (EAC) power configuration Group C, and a target Emergency DieselGenerator (EDG) reliability of 0.95 (see NRC SER in reference 4).
Alternate AC (AAC) Power Source
The existing Technical Support Center (TSC) diesel generator will be used as an AACsource. The TSC diesel generator is an independent, non-class IE, 600 kW (1000 hr/yearstandby rating) diesel generator that provides emergency power to 480-V Bus 1-46 for TSCequipment. For SBO purposes, a connection can be made between this bus and the 480-V safetyBus 1-52. Normal isolation between the two buses is provided by a Class 1E breaker at Bus 1-52and a non-class IE breaker at Bus 1-46. For SBO, selected non-essential loads will be strippedfrom each of the two buses and the two breakers will close to provide power to essential loads onboth buses. The total load to be powered within 1 hour following the onset of the SBO iscalculated to be approximately 587 kW.
Condensate Inventory
The Technical Specifications (TS) provide for a minimum of 39,000 gallons of condensateinventory. This is sufficient for 4 hours of decay heat removal.
Class IE Battery Capacity
Battery capacity calculations exist for the BRAI01 and BRB101 Class IE batteries and on theBRD101 non-class 1E battery. Theyare based on the IEEE-485 methodologyanda dutycycle of8 hours. The 8-hour duty cycle capability has been verified by test per the guidance ofIEEE 450-1987. Based on the above, the batteries are adequate, with considerable margin for therequired 4-hour SBO duration.
Compressed Air
The air-operated valves relied upon to cope with an SBO event for4 hours will be equipped withDC powered solenoid valves and backup air (nitrogen) supplies.
Effects of Loss of Ventilation
Steady state heat-up analyses were performed to determine the effects of loss of ventilation in thebattery rooms, control room, relay room, charging pump room, turbine driven auxiliary feedwaterpump room, containment and steam generator power operated reliefvalve areas. The calculatedsteady state temperatures for these rooms are well below the temperature limits described inNUMARC 87-00, Section 2.7. Kewaunee has procedures and operator training to ensureopening of doors #45 and #48 to Battery Rooms 1 A and I B, respectively, and relay room cabinetdoors within 30 minutes of the onset of an SBO event.
USAR - Rev. 188.2-27 11/01/2003

Containment Isolation
Table 5.2-2, "Containment Penetrations" in the Updated Safety Analysis Report has beenreviewed in accordance with the guidelines described in NRC Regulatory Guide (RG) 1.155 toensure that appropriate containment integrity will be provided during an SBO event.
Reactor Coolant Inventory
The TSC diesel generator will power one of two charging pumps each having a capability ofsupplying water at the rate of 60 gpm. This will provide makeup for a total of 50 gpm reactorcoolant pumps seal leakage (25 gpm per pump) and 10 gpm reactor coolant system leakage(maximum allowed by the TS). The water supply for the pumps will be from the refueling waterstorage tank, which has a TS minimum of 272,500 gallons of water.
Procedures and Training
Operator actions will be required for an SBO event. In addition to the opening of selected roomand cabinet doors, and the valve operations required to align the charging pump and AFW pump,a number of electrical breaker operations are required to shed loads not required during an SBO,and to align the TSC diesel generator to the required loads.
The physical location of the buses and MCCs involved are in close proximity to each other. Theinability of an operator to open any single motor control center (MCC) breaker will not result inthe TSC diesel generator exceeding its overload rating. In addition to proceduralized operatoractions and training provided to individuals, the breakers which are required to be opened arealso locally identified.
The actions required during an SBO event can be accomplished in the 1-hour time framespecified for the AAC source to power the SBO loads.
SBO Modifications
An air (nitrogen) supply has been provided for RCS inventory valve CVC-7 in order to providecontrol room control of the amount of charging flow to the reactor coolant loop versus the reactorcoolant pump seals.
The steam generator power operated relief valves SD3A and SD3B have each been equippedwith a DC solenoid valve and a backup air (nitrogen) supply. Additional lighting has beenprovided at MCC 1-52E (charging pump IA) and outside of Battery Room A.
Quality Assurance and Technical Specifications
The QA type 2 classification is consistent with the requirements of RG 1.155, Section 3.5.
USAR - Rev. 1 88.2-28 11/01/2003

EDG Reliability Program
The EDG reliability program, including the TSC diesel generator, meets the intent and guidanceprovided in RG 1.155, Section 1.2.
USAR -Rev. 188.2-29 11/01/2003

REFERENCES - SECTION 8.2
1. NRC Safety Evaluation Report, M.B. Fairtile (NRC) to D.C. Hintz (WPS), LetterNo. K-86-136dated July 3, 1986
2. NRC Safety Evaluation Report, S.A. Varga (NRC) to E.R. Mathews (WPS), LetterNo. K-81I-189dated November 12, 1981
3. NRC Safety Evaluation Report, A.T. Gody, Jr. (NRC) to K.H. Evers (WPS), Letter No.K-89-212 dated October 25, 1989
4. NRC Supplemental Safety Evaluation Report, A.G. Hansen (NRC) to C.A. Schrock (WPS),Letter No. K-92-215 dated November 19, 1992
5. NRC Safety Evaluation Reports:
a. A. Schwencer (NRC) to E.W. James (WPS), Letter dated June 3, 1977b. R.B. Licciardo (NRC) to E.R. Matthews (WPS), Letter No. K-82-074 dated April 30,1982c. J.D. Neighbors (NRC) to C.W. Giesler (WPS), Letter No. K-84-091 dated April 30, 1982d. R.J. Laufer (NRC) to C.A. Schrock (WPS), Letter No. K-93-203 dated September 30,1993e. R.J. Laufer (NRC) to M.L. Marchi (WPS), Letter No. K-96-098 dated June 12, 1996
6. "Stability Studies Associated With Nuclear Power Plants In Wisconsin", E.R. Mathews,Wisconsin Public Service Corporation, October 11, 1968
USAR - Rev. 188.2-30 11/01/2003

8.2 ELECTRICAL SYSTEM
8.2.1 NETWORK INTERCONNECTIONS
Electrical energy generated at 20-kV is transformed to 345-kV by the Main Transformer, a bankof three single-phase units, which in total are rated at 580-mVA. It is delivered through a345-kV, 25,000-mVA (interrupting rating), 1600-ampere (552-mVA) circuit breaker to the345/138-kV switching station located at the plant site, as shown in Figure 8.2-1. The electricaloutput is integrated into the American Transmission Company's 345-kV and 138-kVtransmission systems. These systems are interconnected at the plant site substation by atransformer rated at 300 mVA. The 345-kV transmission system has interconnections withNorthern States Power Company. Two 345-kV transmission lines are connected to the plantswitching station and are on separate line structures in order to minimize the possibility of losingmore than one circuit at a time. Either line is capable of carrying the full output of thegenerator. In addition, two 138-kV lines are connected to the plant switching station from the138-kV grid system. These two lines together are capable of carrying the full output of thegenerator, but would be limited by the 300-mVA Autotransformer on a loss of both 345-kVlines.
An analysis of the integrated 345/138-kV power system has been made and shows that afaultonany one of the transmission lines, any bus section at the Kewaunee Substation, or the loss of theKewaunee generator will not cause a cascading failure on the transmission system, therebyinsuring an off-site power supply to the plant for any of the aforementioned failures. (SeeStability Study in Reference 6).
The centerline of the two 138-kV lines is 265 feet south of the southern-most two 345-kV lineson a separate right-of-way as they leave the plant property. About one-half mile west of thesubstation the two 345-kV lines turn: one, line R-304, goes north and the other, line Q-303, turnssouth at a dead-end tower. Line Q-303 crosses over both 138-kV lines, one before the dead-endtower and one after (see Figure 8.2-1 a). Since dead-end tower failure is not considered a credibleaccident, failure of a 345-kV line structure at some point could only cause a failure of one138-kV line. There is no area where a failure of a 138-kV line structure can cause a failure ofeither 345-kV line. Thus, there is no single failure that can disable more than two lines. Thisresults in three pairs of physically independent sources of offsite power (see NRC SER inReference 1).
The 138-kV overhead transmission line from the substation into the plant on-site distributionsystem through the Reserve (Startup) Auxiliary Transformer is bifurcated at the substation toconnect to either the East or West 138-kV buses. Each leg of the bifurcation is separated fromthe respective bus with a 138-kV oil circuit breaker. The controls for the 138-kV breakers areseparated into two distinct 125-V d-c branch circuits; one serving the breaker closing circuit andone of the two trip circuits with the primary relaying; the other serving the second trip coil andthe backup relaying. These breakers are manually controlled from the plant Electrical VerticalPanel A.
USAR - Rev. 188.2-1 11/01/2003

Similar connections to the East and West 138-kV buses are made to the 345-138-kVautotransformer, which can be used to energize the autotransformer if the need arises. Thesebreakers are manually controlled from the plant Electrical Vertical Panel A, or local control inthe substation control house and by operator choice can be transferred to system operating officesupervisory control.
The Wrest 138-kV bus is connected to a capacitor bank with a 138-kV oil circuit breaker (seeFigure 8.2-1). Each of the four-capacitor banks have switching devices. The breaker andswitching devices are normallyundersystem operating office supervisorycontrol and byoperatorchoice, can be transferred to control from Electrical Vertical Panel A.
The 345-kV system can be and normally will be used to energize the 345-138-kVAutotransformer. The 345-KV oil circuit breakers are controlled similar to the East and West138-kV bus oil circuit breakers described above.
The tertiary winding of the autotransformer is used to furnish power to the 13.8-kV TertiaryAuxiliary Transformer via an underground insulated power cable. This cable becomes thesecond of the two physically independent circuits to provide off-site power to the on-sitedistribution systems.
Both of the above circuits will normally be energized at all times and will be connected to one orthe other of the engineered safeguards buses at all times. Thus, loss of the reactor, turbinegenerator, Main Station Auxiliary source of power does not even require a transfer for thesafeguards buses. In the case of an engineered safeguards bus energized by one of the on-sitepower sources, i.e., the diesel-generator, and subsequent loss of the diesel-generator, theautomatic transfer system will search for a transformer source and automatically close in itsbreaker. The above postulated condition could only occur after a loss of all off-site power andsubsequent restoration of at least one source, prior to manual operator actions per emergencyinstructions.
Thus, loss ofpower from the nuclear unit should not affect the availability ofpower from the twooff-site transmission circuits or the two standby power sources. Loss of either transmissioncircuit should not affect the other transmission circuit, the two standby power sources or thenuclear unit as a source. Finally, loss of one or both of the standby power sources should notaffect the availability of the transmission sources or the nuclear unit.
Substation D-C System
The substation d-c system consists of two separate systems; the 48-V d-c distribution systemfurnishing power to the solid-state relay systems and the 125-V d-c distribution systemfurnishing control power and additional electromechanical and microprocessor based relaysystems.
The 48-V d-c distribution system consists of redundant battery chargers, one battery and twodistribution cabinets.
USAR - Rev. 188.2-2 11/01/2003

The 125-V d-c distribution system consists of redundant battery chargers, one battery and fourdistribution cabinets.
The battery chargers are furnished with a-c and d-c (output) failure relays and redundant a-csources. High and low voltage alarms are provided for the d-c circuit.
The 125-V d-c distribution system is arranged so that the two circuits used to control each high-voltage circuit breaker emanate from different distribution cabinets. Each branch circuit in thethree breaker distribution cabinets is individually monitored and alarmed on loss of d-cvoltage. These alarms are displayed in the substation control house and are transmitted to theplant control room annunciator as a substation alarm. The branch circuits in the fuse distributioncabinet are not individually monitored and alarmed on loss of d-c voltage. A loss of power toany of the microprocessor based relays fed from the fuse cabinet would be indicated locally onthe relay and transmit an alarm to the transmission system operator. The overall effect is that ofa dual supply to the high-voltage breaker control trip elements with alarm should any portion ofthe supply system become abnormal.
The oil circuit breakers can close on 90-V d-c and trip on 70-V d-c. Each battery charger isequipped with a low voltage alarm set at 122-V d-c. The battery is considered to be fullydischarged when the voltage reaches 105-V d-c. The actual closing energy is supplied from aircompressors also integral with each circuit breaker. The air compressors are a-c powered. Thestorage cylinders have sufficient capacity when fully charged for five operations if a-c werelost. These breakers can be manually tripped at the breaker.
Loss of the substation battery and a concurrent fault on one of the transmission lines wherein theplant would continue to supply power to the fault is a set of postulated conditions, which wouldlead to an undetected failure. Under these postulated conditions, the fault would clear when thetransmission-line remote terminal breakers opened. The Kewaunee breakers can be manuallytripped and, thus, isolate the fault, thereby restoring off-site power to the plant via the remainingtransmission lines.
Thus, given an undetected failure, the capability to clear and restore off-site power to theKewaunee plant will not be lost, and the restoration of off-site power (assuming the grid isavailable) will be made within the time period (seven days) in which the plant can be maintainedin a safe condition without off-site a-c power.
8.2.2 PLANT DISTRIBUTION SYSTEM
The Auxiliary Electrical System is designed to provide a simple arrangement of buses requiringthe minimum of switching to restore power to a bus in the event that the normal supply to thatbus is lost.
USAR - Rev. 188.2-3 11/01/2003

Single Line Diagrams
The basic components of the plant electrical system are shown on the Single Line or CircuitDiagrams, Figures 8.2-2 and 8.2-3. These figures show the 20-kV, 4160-V, 480-V andinstrument bus a-c systems and the 125-V and 250-V d-c systems. In addition, Figures 8.2-1,8.2-2 and 8.2-3 show the basic elements of the 13.8-kV, 138-kV and 345-kV substation systems.
Main Auxiliary, Reserve Auxiliary and Tertiary Auxiliary Transformers
The plant turbine-generator serves as the primary source of auxiliary electrical power during "on-the-line" operation. Power is supplied via a 20-4.16-kV, three-winding, Main AuxiliaryTransformer, which is connected to the main leads from the turbine generator.
The primary sources of electrical power for the auxiliaries associated with engineered safetyfeatures during "on-the-line" operation of the plant are the Reserve Auxiliary Transformer andthe Tertiary Auxiliary Transformer. Power is normally supplied to one bus (Bus 1-6) through the138-4.16-kV, three-winding Reserve Auxiliary Transformer which is connected to the 138-kVportion of the Kewaunee Substation. Power is normally supplied to the second bus (Bus 1-5)through the 13.8-4.16-kV, two-winding Tertiary Auxil iary Transformer which is connected, byan underground line, to the 13.8-kV tertiary winding of the 345/138/13.8-kV auto transformer inthe Kewaunee Substation. Either source can supply both buses.
Auxiliary power required during plant startup, shutdown and after reactor trip is supplied fromthe 13.8/138/345-kV Kewaunee Substation via the Reserve Auxiliary and Tertiary Auxiliarytransformers. After turbine-generator trip, the auxiliaries on the 4160-V buses being fed by theMain Auxiliary Transformer are transferred by a fast bus transfer scheme using stored energybreakers to the Reserve Auxiliary Transformer. Control power for the plant auxiliarybreakers issupplied by the plant batteries. The high-side (substation) breakers use the substation battery forcontrol power.
4160-V System
The 4160-V system is divided into six buses, as shown in Figure 8.2-2. Buses 1-1 and 1-2 areconnected via bus main breakers to the Main Auxiliary and Reserve AuxiliaryTransformers. These buses supply power to the Reactor Coolant Pumps and the FeedwaterPumps.
Buses 1-3 and 1-4 are also connected via bus main breakers to the Main Auxiliary and ReserveAuxiliary Transformers. These buses supply power to the normal balance-of-plant auxiliaries,and each bus supplies power to three 4160 - 480-V station service transformers. A fourthtransformer connected to bus 1-4 supplies power to the Technical Support Center. In addition,the Circulating Water Pumps, Condensate Pumps and the Heater Drain Pumps are directlyconnected to buses 1-3 and 1-4.
USAR - Rev. 188.24 11/01/2003

Buses 1-5 and 1-6 are connected via bus main breakers to the Main Auxiliary, Reserve Auxiliary,and Tertiary Auxiliary Transformers. In addition, each bus is directly fed via a main breaker by adiesel generator. The two buses are tied together via two bus tiebreakers in series, one on eachbus. Each bus supplies two of the four 4160-480-V station service transformers for the plant's480-V engineered safety features equipment. In addition, the Service Water Pumps, AuxiliaryFeedwater Pumps, Safety Injection Pumps and the Residual Heat Removal Pumps are directlyconnected to buses 1-5 and 1-6.
Bus 1-5 is normally supplied from the Tertiary Auxiliary Transformer and Bus 1-6 is normallysupplied from the Reserve Auxiliary Transformer. Thus, no transfer is required for theengineered safety features in the event of an incident.
The bus tie breakers between Bus 1-5 and Bus 1-6 can only be manually closed, but areinterlocked so that the diesel generators cannot be operated in parallel.
480-V System
The 480-V system is divided into 11 load center or switchgear buses, as shown inFigure 8.2-2. Those fed from 4160-V buses 1-3 and 1-4 serve balance-of-plant loads, those fedfrom 4160-V buses 1-5 and 1-6 serve the loads associated with the engineered safety featuresequipment.
Transformers 1-32 and 1-42 are connected to 4160-V buses 1-3 and 1-4,respectively. Transformer 1-32 feeds 480-V bus 1-32; transformer 1-42 feeds 480-Vbus 1-42. These components including the 480-V bus tie are assembled as a conventional,double-ended switchgear unit. In a similar manner buses 1-33/1-43 and 1-35/1-45 are connectedto 4160-V buses 1-3 and 1-4. Bus 1-46, supplying the TSC, is connected to 4160-V bus 1-4.
The various motor control centers throughout the plant are then connected to these switchgearbuses.
The power required for the 480-V engineered safety features and other vital plant loads issupplied from four 480-V buses fed from 4160-V buses 1-5 and 1-6. Transformer 1-51 is fedfrom 4160-V bus 1-5 through breaker 1-505 and supplies bus 1-51. This transformer, bus andbreakers, including one bus tie, are assembled as a switchgear unit. In a similar manner, bus1-52 is also connected via breaker 1-505 to 4160-V bus 1-5.
The large 480-V engineered safety features motors are connected to bus 1-51. Motor ControlCenters supplying the smaller loads are fed from bus 1-52.
A redundant 480-V system is supplied by 4160-V bus 1-6 through 4160-V breaker 1-607.
MCC 1-5262 may be fed from either 480-V switchgear bus 1-52 or 480-V switchgear bus 1-62through breakers 15209 or 16209 respectively, via a manually operated transfer switch. 480-Vswitchgear bus 1-52 may ultimately be fed from on-site power source Diesel Generator 1 A and
USAR - Rev. 188.2-5 11/01/2003

480-V switchgear bus 1-62 may ultimately be fed from on-site power source DieselGenerator I B. 480-V MCC 1-5262 does function as a swing bus between the two redundant on-site power distribution systems as discussed in Safety Guide 6. However, the mechanicaloperation of this switch allows MCC 1-5262 to be connected to only one 480-V switchgear busat a time. Hence the redundant 480-V switchgear buses can never be paralleled through theoperation of this switch. Therefore, the transfer of MCC 1-5262 does conform to the criteriaoutlined in Safety Guide 6. Furthermore, the components fed from MCC 1-5262 are not part of aredundant load group. The components are:
* Turbine Turning Gear* Turbine HP Hydrogen Seal Oil Backup Pump+ Condensate Bypass All Heaters to Feedwater Pumps Motor-Operated Valve+ Waste Gas Compressor IB* Station and Instrument Air Compressor IA
The intent of the transfer switch is to provide maintenance flexibility for these loads.
It should also be noted that 480-V switchgear buses are each protected from the transfer switchwith a breaker.
The automatic transfer switch associated with MCC 1 -52E provides BRA- 106 with two possiblesources of power, MCC 1-52E orMCC 1-52C. However, both MCC 1-52E and MCC 1-52C areassociated with the same on-site power source (Diesel Generator 1 A). Therefore, the transfer isnot between power systems of redundant load groups and does not fall into the category of swingbuses discussed in Safety Guide 6.
Likewise, the automatic transfer switch associated with 1-62E allows BRB-106 to be fed fromeither MCC 1-62E or MCC 1-62C. These MCCs are both within the same load group.
125-V and 250-V D-C System
The 125V and 250-V DC system is divided into five buses (two safeguard and three non-safeguard, see Figure 8.2-3) each with one battery and a battery charger, distribution panels andinverters. Components prefixed with BRA and BRB make up the safeguard DC system andthose prefixed with BRC, BRD and BRE make up the non-safeguard system.
The DC power requirements of the engineered safety features (ESF) and other vital plant loadsare supplied by the safeguard batteries (numbered BRA-101 and BRB-101). Each safeguardbattery consists of 59 cells, each of which are the lead calcium type. The batteries are rated 125VDC, 1304 ampere-hours at the eight-hour rate without discharging below 1.78V per cell. Twomain DC distribution panels (BRA-102 and BRB-102) are fed from these batteries via mainfuses. The main distribution panels connect the battery to the battery charger, to the sub-distribution panels, and allow for the interconnection of the two buses through the bustiebreakers.
USAR - Rev. 188.2-6 11/01/2003

BRA-102 supplies sub-distribution panel BRA-104. BRA-104 in tum supplies the control andexcitation power for diesel generator IA, the control power for ESF buses 1 -5, 1-51, and 1-52,control and power to one-half of the redundant essential plant equipment required for safeshutdown in the event of loss of AC power and provides a standby power source for thesafeguard inverters BRA-I I I and BRA-I 12.
BRB-102 supplies sub-distribution panel BRB-104. BRB-104, in turn, supplies the control andexcitation power for diesel generator IB, the control power for ESF buses 1-6, 1-61, and 1-62,control and power to one-half of the redundant essential plant equipment required for safeshutdown in the event of loss of AC power and provides a standby power source for thesafeguard inverters BRB-1 11 and BRB-1 12.
The balance of plant DC power requirements are supplied by three non-safeguard batteries(designated BRC-101, BRD-101 and BRE-101). Batteries BRC- 101 and BRD-101 each consistof 59 cells and are of the lead calcium type, rated at 125V DC, 1680 ampere-hours at the eighthour rate to reach 1.78V per cell. Battery BRE-101 consists of 120 cells of the lead calciumtype, rated at 250 V d-c, 694 ampere-hours at the two hour rate to reach 1.75V per cell. Eachbattery is connected to a main distribution panel (BRC- 102, BRD- 102 and BRE- 1 02). The maindistribution panel connects each battery to a battery charger, sub-distribution panel, bus tie (I 25Vd-c batteries only) and inverter(s).
Distribution panels BRC-102 and BRD-102 supply sub-distribution panels BRC-103 andBRD-103, respectively. Panel BRC-102 is also a standby source for inverter BRC-109. TheBRC and D-103 panels, in turn, supply Technical Support Center diesel generator control andexcitation power, control power for non-ESF buses 1-1, 1-2, 1-3, 1-4, 1-32, 1-33, 1-35, 1-42,1-43, 1-45, and 1-46, other non-safety related equipment sensitive to a loss of AC power and area standby source for inverter BRD-109 and a proprietary inverter.
Distribution panel BRE-1 02 supplies AC drive units BRE- 109 and BRE- 110, which convert the250V d-c input power to 230-V a-c output power for the turbine emergency oil pump and air sideseal oil backup pump motors.
Each of the five battery buses is served by one connected battery charger. Each safeguard batteryhas provisions for connection of a spare portable charger. The spare safeguard charger can bemoved to its designated mounting in either safeguard battery room and connected to the DC busin the event of charger failure. The battery life to minimum voltage under maximum load willallow sufficient time to make this connection. The non-safeguard spare charger is permanentlymounted between the normal 125V d-c chargers and can be connected to either bus asrequired. There is no spare 250V d-c charger.
The two bus tie breakers between 125-V d-c distribution cabinet BRA-102 and 125-V d-cdistribution cabinet BRB-102, are manually operated. These breakers are strictlyadministratively controlled to prevent them from being closed during plant operation.
USAR - Rev. 188.2-7 11/01/2003

Instrument Bus
The 120-V a-c instrument supply is split into several buses as shown on the one line diagramFigure 8.2-3. There are four independent instrument buses, each fed by an inverter which, inturn, is fed from each of the d-c buses. A fifth independent non-interruptible bus, fed by an ESFmotor control center, supplies the rod position indicators. The sixth and seventh independentbuses, each fed by an inverter, supply the plant process control computer and cabinet BRD-1 15,respectively. There are two additional independent buses; each fed from an ESF motor controlcenter through a transformer.
Evaluation of Layout and Load Distribution
The physical location of electrical distribution system equipment is such as to minimizevulnerability of vital circuits to physical damage as a result of accidents.
The Main Auxiliary, Reserve Auxiliary and Tertiary Auxiliary Transformers are located outdoorsand are physically separated from one another by firewalls. Each transformer cell, formed by thefirewalls, has an automatic water spray system to extinguish and prevent the spread of fires.
The 4160-V switchgear and 480-V load centers are located in areas which minimize theirexposure to mechanical, fire and water damage. This equipment is coordinated electrically topermit safe operation of the equipment under normal and short-circuit conditions.
The 480-V motor control centers are located in the areas of electrical load concentration. Thoseassociated with the turbine-generator auxiliary system in general are located in the TurbineBuilding. Those associated with the nuclear steam system are located in the Auxiliary Building.
The application and routing of control, instrumentation and power cables are such as to minimizetheir vulnerability to damage from any source. The construction design drawings had secondlevel review in accordance with the Kewaunee Construction Quality Assurance Program.
All cables are specified using conservative margins with respect to their current-carryingcapacities, insulation properties and mechanical construction. The power conductors are threeconductor, galvanized armored and installed in a single layer in ladder type cable trays, andclamped to insure that ample ventilation spacing is maintained throughout the run.
Bulk control power supply cables are treated as noted in the previous paragraph.
Control cables normally employ minimum size of#l 2 AWG when run in multi conductor cablesin control trays. As there are few continuous loads on these circuits no attempt was made atderating. Continuously loaded circuits (current transformer secondaries) are sized by burdenrequirements of the circuit. In special cases #14 AWG multi-conductor control cable wasallowed in cable trays. In these identified cases, a safety evaluation has been performed. Specialcases may continue to allow #14 AWG multi-conductor cable to be used. These will require asafety evaluation and approval by the responsible engineer.
USAR - Rev. 188.2-8 11/01/2003

Cables that are run in trays have fire resistant jackets. Safety-related cables meet theenvironmental qualifications required by 10 CFR 50.49. Appropriate instrumentation cables areshielded as required to minimize induced-voltage interference. Wire cables related to engineeredsafety features and reactor protective systems are routed and installed to maintain the integrity oftheir respective redundant channels and protect them from physical damage.
Supports and cable trays for safety feature power cable systems are designed for 100% loadingplus the forces generated by a seismic disturbance. Other cable systems are designed for 100%loading. The ladder fill is restricted to one layer, clamped in place to maintain 2 to 12 inchspacing between cables.
Cable trays for control and signal cable support systems and other safety-related systems aredesigned for forces generated by a seismic disturbance assuming maximum fill. Other cablesystems are seismically designed for maximum fill. The tray fill is restricted to 50% ofthe tray'scross sectional area for safety-related cable and 60% for non-safety related cable.
Separation Criteria
Cable separation provides sufficient isolation between redundant systems so that no single failureor electrical incident can render both redundant systems inoperable or remove them from service.
To assure complete separation of Class IE circuitry that initiates and controls the transfer ofpower sources to the emergency a-c and emergency d-c distribution system, the following cableand cable tray separation techniques are used:
a. Each tray section of the cable tray system has an identifying code indicated on the electricaldesign drawings and this same identification is stenciled on the tray after it isinstalled. Stenciling is applied at each straight section of tray where the identifying codechanges.
On the electrical design drawings, the trays are identified by a numberplaced in a rectangularsymbol. The trays used for the redundant safeguards equipment are further identified with avertical line adjacent to the tray name symbol.
The identifying code contains the designation "S5" or 'S6" where applicable to identify thesafeguard train.
b. The two Safeguard tray systems are independent of each other such that they are physicallyseparated a minimum of 3 feet horizontally and 3 feet vertically, except in the Relay Roomwhere 1-foot minimum horizontal and vertical separation is required.
c. Each electrical cable has an identifying code indicated on the electrical design drawings andcable routing lists. This same cable number is affixed at each end of the cable withpermanent tags.
USAR - Rev. 188.2-9 11/01/2003

The identifying code is based on the following systems.
The cable codes for the 4160-V switchgear; the 480-V switchgear and the 480-V motorcontrol centers are a combination of letters and numbers that form a four part codingcontaining:
* Unit Number I+ Source of Power+ Power or Control* A serially assigned number which provides uniqueness.
A "5" in the second digit from the left is a cable in the "Safeguards 5" system; a "6" a cablein the "Safeguards 6" system (Example 15 xxx or IS6 xxx).
Normal cable being fed from safeguards distribution equipment should have cable codesstarting with INP followed by a serially assigned number which provides uniqueness. Somenormal cables remain with their original safeguards power source type cable codes, since nocomprehensive re-labeling program was implemented.
Redundant circuitry for reactor protection and engineered safety systems are separated intogroups as follows.
Class IE cables are divided into the following groups:
* Group I (color code red)Red Instrument ChannelInstrument Bus I
+ Group 2 (color code yellow)Yellow Instrument ChannelInstrument Bus IV
* Group 3 (color code green)Safeguard Train A, Battery IA, Diesel Generator IA, 4160-V Bus 1-5, 480-V Bus 1-51,480-V Bus 1-52 and its associated Motor Control Centers.
* Group 4 (color code blue)Blue Instrument ChannelInstrument Bus III
* Group 5 (color code white)White Instrument ChannelInstrument Bus II
USAR - Rev. 188.2-10 11/01/2003

* Group 6 (color code orange)Safeguard Train B, Battery IB, Diesel Generator IB, 4160-V Bus 1-6, 480-V Bus 1-61,480-V Bus 1-62 and its associated Motor Control Centers.
Each group is run in a separate tray, ladder, trough or conduit. These trays are identified onelectrical drawings for engineered safety features, and are marked and color-coded on the actualhardware. All trays for the engineered safety feature equipment are Class I structures.
Within containment the tray systems for the four reactor protection instrument channels areseparated 3 feet horizontally where they involve 2/4 logic and are separated approximately 20feet where they involve 2/3 logic. Vertical separation is 5 feet where practical, and whereimpractical, barriers are installed. These barriers are solid metal covers on the lower trays.
For the non-Class-lE systems throughout the remainder of the plant, trays installed in stacks arespaced vertically with a minimum of 12 inches bottom to bottom in all areas. However, Class IEtrays have a minimum of 15 inches bottom to bottom between trays of the same train. Class IEtrays containing instrument, control or power cables have a minimum horizontal separationbetween redundant circuits of36 inches. Redundant circuits are not permitted in the same tray orconduit. If closer spacing than 36 inches cannot be avoided, an approved barrier must be placedbetveen the circuits. Cable trays are routed to avoid a fire hazard area, such as oil storage rooms,oil tanks, etc., whenever possible. When this cannot be done, the cable tray system is protectedby fire resisting barriers. Where practical, these barriers will be tray covers. Whenever possible,a wall or floor has been introducted between trays carrying redundant safeguard circuits. Barriersare required where mutually redundant trays cross. The barriers shall extend to each side of theprotected tray by a distance equal to approximately three times the wider of the two trays.
Mixing of power cables with control or instrument cable in the same tray is not permittedthroughout the plant. Whenever a control and/or instrument cable tray and a power tray are inthe same stack, the power tray is located in the top tier.
Trays for Train A and Train B are separated 3 feet horizontally and vertically except in the RelayRoom where practical design considerations require 1-foot vertical and horizontalseparation. The two trains are separated by 40 feet at the reactor containment vesselpenetrations.
Power cables for engineered safeguards are kept strictly in cable trays sodesignated. Occasionally, a non-safety-related power cable maybe run in a safeguards cable traybut a safeguards cable will never run in any tray other than its own system. Control cables aresimilarly separated and control and instrumentation of the same train designation may be run inthe same control cable tray. Non-safety-related power, control or instrumentation cable shall notbe permitted to cross over from one safeguards tray to another.
Where the wiring for redundant engineered safety features is within a single panel or panelsection, this wiring is separated one group from the other, by a 6-inch air space or a fireproofbarrier. The barriers are sheet metal or flexible metallic conduit. The flexible conduit may be
USAR - Rev. 188.2-11 11/01/2003
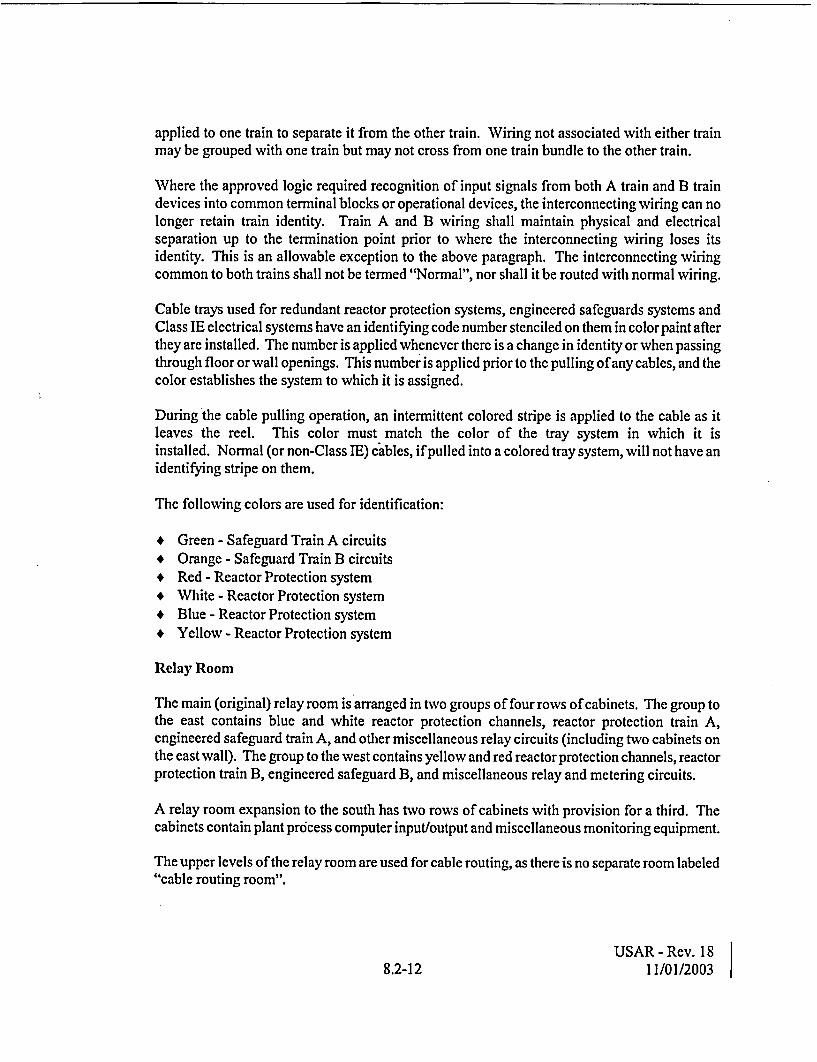
applied to one train to separate it from the other train. Wiring not associated with either trainmay be grouped with one train but may not cross from one train bundle to the other train.
Where the approved logic required recognition of input signals from both A train and B traindevices into common terminal blocks or operational devices, the interconnecting wiring can nolonger retain train identity. Train A and B wiring shall maintain physical and electricalseparation up to the termination point prior to where the interconnecting wiring loses itsidentity. This is an allowable exception to the above paragraph. The interconnecting wiringcommon to both trains shall not be termed "Normal", nor shall it be routed with normal wiring.
Cable trays used for redundant reactor protection systems, engineered safeguards systems andClass IE electrical systems have an identifying code number stenciled on them in colorpaint afterthey are installed. The number is applied whenever there is a change in identity or when passingthrough floor or wall openings. This number is applied prior to the pulling of any cables, and thecolor establishes the system to which it is assigned.
During the cable pulling operation, an intermittent colored stripe is applied to the cable as itleaves the reel. This color must match the color of the tray system in which it isinstalled. Normal (or non-Class IE) cables, if pulled into a colored tray system, will not have anidentifying stripe on them.
The following colors are used for identification:
* Green - Safeguard Train A circuits* Orange - Safeguard Train B circuits* Red - Reactor Protection system* White - Reactor Protection system* Blue - Reactor Protection system* Yellow - Reactor Protection system
Relay Room
The main (original) relay room is arranged in two groups of four rows of cabinets. The group tothe east contains blue and white reactor protection channels, reactor protection train A,engineered safeguard train A, and other miscellaneous relay circuits (including two cabinets onthe east wall). The group to the west contains yellow and red reactorprotection channels, reactorprotection train B, engineered safeguard B, and miscellaneous relay and metering circuits.
A relay room expansion to the south has two rows of cabinets with provision for a third. Thecabinets contain plant process computer input/output and miscellaneous monitoring equipment.
The upper levels of the relay room are used for cable routing, as there is no separate room labeled"cable routing room".
USAR - Rev. 188.2-12 11/01/2003

Within the room the trays are arranged in four tiers. The arrangement of these tiers is such thatinstrument and control circuits of reactor protection and engineered safety features of like trainsare stacked together or with normal instrumentation and control. The colored instrumentchannels for reactor protection are converted from trays to rigid conduit systems where they enterthe relay room and then to 6-inch metal raceway as they pass over the instrument racks tofacilitate rack output interconnections.
Horizontal fire barriers are provided between the Control Room and the Relay Room at thecontrol consoles and panels.
Testing
Testing of the operator-activated Class IE circuitry that initiates and controls the connection ofthe buses to the power sources for the a-c emergency power system; the Main AuxiliaryTransformer, the Tertiary Auxiliary Transformer, the Reserve Auxiliary Transformer, and theDiesel Generators; can be done by transferring the buses, one at a time, from one source toanother with controls available to the operator in the Control Room. Manual switching of thesesource breakers occurs during periodic breaker maintenance, bus maintenance and dieselgenerator testing. Testing of the automatic-initiated Class TE circuitry that initiates and controlsthe connection ofthe buses to these sources can be performed by utilizing a switch in the ControlRoom which disconnects two bus undervoltage relays of one safeguard bus, thereby simulatingloss of voltage, and activates the associated logic circuitry that is required to automaticallyrestore power to the bus.
A sequential events recorder prints out the operation of each relay in the scheme providingprinted proof of the circuitry's proper response. Upon successful completion of this test a greenlight glows to the right of the test switch.
Both the automatic circuitry and the manual circuitry can be tested by these methods during plantoperation. Portions of the circuitry that cannot be conveniently tested with the plant in operationwithout temporarily interrupting circuit protection are the bus lockouts and the transformerlockouts. A switch is provided for each lockout, which isolates its output contacts allowing thelockout to operate without actually tripping any breakers. The continuity of transformer lockoutrelays is continually monitored by indicating lamps located in the Control Room.
The power sources for the d-c emergency power system associated with the Train A load groupare Station Battery I A and 480-V MCC 1 -52C (via Battery Charger I A). The power sources forthe d-c emergency power system associated with the Train B load group are Station Battery I Band 480-V MCC 1-62C (via battery charger I B). The transfer of a d-c bus between its respectivebattery and battery charger can be tested by opening the 480-V breaker supplying power to thecharger, thus simulating a loss of power to the 480-V bus. The d-c system should transfer to thebattery as its source of power. If, after opening the 480-V breaker to the charger the d-c busretains its voltage, the transfer was successful.
USAR - Rev. 188.2-13 11/01/2003

8.2.3 EMERGENCY POWER
Sources Description
Power sources for the engineered safety features are 4160-V Bus 1-5 and Bus 1-6. The normalsource of power to Bus 1-5 is the Tertiary Auxiliary Transformer. The Reserve Auxiliary andMain Auxiliary Transformers provide backup sources, in that order. The normal source of powerto Bus 1-6 is the Reserve Auxiliary Transformer. The Tertiary Auxiliary and Main AuxiliaryTransformers provide backup sources, in that order. Thus, since the normal source of power forthese buses is the 138/345-kV Kewaunee Substation, no transfer is required in the event of aturbine-generator trip.
If all other power sources should fail, two diesel generators are provided, one connected to4160-V Bus 1-5 and one connected to 4160-V Bus 1-6. Each of these is a General MotorsCorporation, Electro-Motive Division, Model A-20-C I, diesel engine-generator unit rated at2600-kW, (2860-kW, 110% Overload, two thousand hours per year) 0.8 pf, 900 rpm, 4160-V,3 phase, 60 Hertz. The generator has emergency ratings of 2950-kW for seven days continuousand 3050-kW for thirty minutes per year.
Each diesel generator, as a backup to the normal standby a-c power supply, is capable ofsequentially starting and supplying the power requirements of one complete set of engineeredsafety features equipment. The electrical emergency power system logic diagrams are shown inFigures 8.2-4, 8.2-5, and 8.2-6. The units are located in separate rooms in Class I portion of theAdministration Building. These rooms are heated; assuring that the diesel generators can bestarted in cold weather.
Service water for the Diesel Engine Cooling Water Heat Exchanger is supplied from separateservice water headers for Diesel Generator 1 A and I B. The Cooling Water Heat Exchanger is anengine mounted water-to-water heat exchanger providing cooling for the engine jacket water andfor the engine oil heat exchanger. Vent fans for each room provide a supply of combustion airinto the Diesel Room. Separate startup air receivers and compressors are located just external tothe rooms. Primary and reserve tanks of the air receivers supply compressed air to the dual AirStart System, the DG cooling water isolation valve actuators, and the Diesel Room Ventilationand combustion air dampers.
Each diesel generator is automatically started by either one of two pairs of air motors mounted oneach side of the diesel (four air motors per engine). Each unit has its own independent startingsystem including a bank of four air storage tanks, two primary and reserve tanks, and onecompressor powered from the 480-V emergency bus. An air cooler/dryer is installed on thedischarge of each air start system compressor. The dry air improves the starting performance ofthe diesel engine. The primary or reserve tanks have sufficient storage to crank the engine fortwenty seconds. The generator is capable of being started and ready to accept load in tenseconds.
USAR - Rev. 188.2-14 11/01/2003

Starting air is admitted from the storage tanks to the starting system through a pressure-reducingvalve to supply air to the starters.
The following describes a typical diesel engine start sequence. The sequence stated assumes theair start motor priority selector switch is in the #1 position. The air start motor priority selectorswitch is typically rotated from set #1 to set #2 on a monthly basis. This ensures even run timeon the air start motors.
When the diesel start signal is initiated, a start attempt is made through air start motor set #1. Ifthe air start motor set #1 fails to engage within 2 seconds, a second start attempt is made with thesame set of motors. If the air start motors still do not engage, and then after 5 seconds a thirdstart attempt is made, this time using the second pair of air start motors (set #2). Air start motorsset #2 will continue to attempt to start the diesel generator on a two second cycle, until the enginestarts or 15 seconds after the start signal, whichever occurs first. The start signal also initiatesstarting of the fuel priming pump and the governor booster pump. If, after fifteen seconds, thediesel has not reached 200 rpm, a start failure signal opens the fault relay. Starting air is cut off,the fuel priming and governor booster pump are stopped. Operator action is then required forfurther start attempts. The fault relay in the diesel generator room must be reset and any faultscausing the fault lockout must be corrected before the start signal will be effective again.
The start failure relay serves to indicate an abnormally long period of engine cranking without anengine start (fifteen seconds) and to prevent subsequent engine starting attempts until the causeof the engine start failure has been determined by operating personnel. The total air capacityavailable to crank the engine is twenty seconds per air starter-tank combination.
The following interlocks must be satisfied to automatically start the diesel engine:
a. Engine mounted LOCALIREMOTE (AUTO/OFF/MAN) switch must be in REMOTE(AUTO) position for Diesel Generator IA(IB). Control Room and local annunciation isgiven when this local switch is not in the REMOTE (AUTO) position.
b. Control Room PULLOUT/STOP/AUTO/START switch must be in AUTO position(maintained position). (The other maintained position of this switch is the PULLOUTposition, which disables the engine starting circuit during engine maintenance).
c. 125-V d-c control power must be available at the diesel engine control panel. (The enginestarters cannot be engaged if control power is not available; loss of control power isannunciated in the Control Room).
d. The engine must not be running.
e. Air pressure must be available to the starting air system (loss of air pressure on each startingair system is annunciated locally and in the Control Room).
USAR - Rev. 188.2-15 11/01/2003

The diesel engine interlocks itemized above can be periodically tested as follows:
a. Turning the engine mounted LOCAL/REMOTE (AUTO/OFF/MAN) switch from theREMOTE (AUTO) position will alarm the local and Control Room annunciators for DieselGenerator IA(IB). Diesel generatoroperational testingverifies annunciatorstatus; therefore,any failure to start due to mispositioning of the switch would identify the annunciator failure.
b. The stable PULLOUT position of the Control Room PULLOUT/STOP/AUTO/STARTswitch is visibly different than the stable AUTO position in that the switch handle is slantedto the left of its normally vertical position (AUTO) and a distinctive silver colored switchshaft extension is visible.
c. Opening the 125-V d-c distribution breaker to the engine control cabinet alarms the ControlRoom annunciator.
d. Response of the air receiver pressure switches can be tested and calibrated by valving in thestandby air receivers, valving out the on-line receivers, opening the air compressor circuitbreaker, and opening the receiver drain valve until an alarm occurs on the local and ControlRoom annunciators.
The motor-driven compressor associated with each diesel is fed from the emergency bus suppliedfrom the same diesel. The control voltage for each diesel starting system is from its associated125-V d-c station battery.
An audible and visual alarm system is located in the control room and will alarm off-normalconditions ofjacket water temperature, lube oil temperature, fuel oil level, starting air pressureand Diesel Generator stator hi temperature (1 of 12 inputs feeding the 4160 Volt StatorTemperature Hot annunciator). An alarm also sounds if a starting circuit is locked out, a controlswitch is not in "auto" position, or d-c power for the controls at the diesel generator is lost. Thealarm in the control room also alerts the operator to other various off-normal conditionsincluding jacket water expansion tank level and pressure, engine crankcase pressure, and fuel oilpressure. Local audio and visual alarms are also provided at each diesel generator.
Reference 2 is a safety evaluation in which the NRC has concluded that, based on the review ofsubmitted information and on-site inspections, the status annunciators for the diesel generatorsare acceptable. The review was specifically intended to ensure that any deliberately inducedcondition which may disable the diesel generators, and which is expected to occur morefrequently than once per year, is automatically annunciated in the Control Room with devicesworded to alert the operator of their abnormal status.
Two 850-gallon "day" tanks are located in enclosures within each diesel generator room. Thetwo tanks provide capacity for approximately four hours operation for one generator at fullload. Two 35,000-gallon underground storage tanks supply fuel oil through immersion pumps toeither pair of day tanks. Combined fuel capability of one storage tank and two day tanks wouldprovide a minimum of 7 days fuel supply for one diesel generator (36,000 gallons of fuel oil),
USAR - Rev. 188.2-16 11/01/2003

thus assuring adequate time to restore off-site power or to replenish fuel. The diesel fuel oilstorage capacity requirements are consistent with those specified in ANSIN195-1976/ANS-59.51, Sections 5.2, 5.4 and 6.1. See Reference 3 and TechnicalSpecification 3.7 for fuel oil storage requirements.
Loading Dcscription
Each diesel generator is automatically started on the occurrence of either of the followingincidents:
a. Undervoltage on the associated 4160-V bus (Bus 1-5 or Bus 1-6) provided that the lowvoltage is not caused by a fault which operates the bus lockout relay (see Reference 5 andTechnical Specification);
b. Initiation of a Safety Injection Signal which will start both diesel generators.
With the occurrence of undervoltage on 4160-V Bus 1-5, whose normal source of power is theTertiary Auxiliary Transformer, the automatic sequence is as follows:
1) Start Diesel Generator IA,
2) Close Reserve Auxiliary Source Breaker (BKR503), ifvoltage is present. Ifthis source is notavailable, then
3) Close Tertiary Auxiliary Source Breaker (BKR501), if voltage is present and BKR611 istripped. If this source is not available, then
4) Shed load on the 4160-V and 480-V buses and close Diesel Generator IA Breaker(BKR509), if diesel generator voltage and frequency meet established criteria (maximum tenseconds from diesel engine start signal).
The automatic restoration of voltage sequence for 4160-V Bus 1-6, whose normal source ofpower is the Reserve Auxiliary Transformer, is as follows:
1) Start Diesel Generator lB
2) Close Tertiary Auxiliary Source Breaker (BKR61 1), if voltage is present and BKR501 istripped. If this source is not available, then
3) Close Reserve Auxiliary Transformer Breaker (BKR60 1), if voltage is present. If this sourceis not available, then
4) Shed load on the 4160-V and 480-V buses and close Diesel Generator lB Breaker (BKR603)if voltage and frequency meet established criteria (maximum ten seconds from diesel enginestart signal).
USAR - Rev. 188.2-17 11/01/2003

Once started, the diesel continues to run even though voltage may be restored from an off-sitesource of power. Manual shutdown of the diesels by the Control Room operator is alwaysrequired (except for engine protection shutdowns).
Circuit breaker interlocks are provided to preclude interconnection of redundant emergencybuses.
Breakers 1-501 and 1-611 allowthe load groups associated with Diesel Generator lA and DieselGenerator I B, respectively, to be connected to a preferred power source, the Tertiary AuxiliaryTransformer. This combination of load group connections is referred to in Safety Guide 6,Section D.2, which states: "A preferred power source bus, however, may serve redundant loadgroups'.
Breaker 1-501 must be tripped before Diesel Generator IA can be automatically connected toBus 1-5 and BKR 1-611 must be tripped before Diesel Generator lB can be automaticallyconnected to Bus 1-6. Therefore, the redundant standby power sources cannot be automaticallyparalleled, satisfying Section D.4a of Safety Guide 6.
Breakers 1-510 and 1-602 provide a bus tie between the load group associated with DieselGenerator IA and the load group associated with Diesel Generator l B. These breakers can beclosed by operator action only. To close BKR 1-510 or BKR 1-602, the following conditionsmust exist:
* No bus fault on Bus 1-5.* No bus fault on Bus 1-6.* No fault on cable between 1-5 10 and 1-602 (as monitored by independent lockout circuits).* Breakers 1-503, 1-501, 1-511, 1-601, 1-610,and 1-611 aretripped.* Either Diesel Generator IA is supplying power to Bus 1-5 and BKR 1-603 (for Diesel
Generator 1B) is tripped or Diesel Generator lB is supplying power to Bus 1-6 andBKR 1-509 (for Diesel Generator IA) is tripped.
These interlocks provide the necessary isolation as identified in Safety Guide 6 betweenredundant load groups.
Breakers 15211 and 16211 are bus tie breakers.
Both breakers can be closed only by operator action. The operator can close BKR 15211 or BKR16211 only if:
* No fault has occurred on either Bus 1-52 or Bus 1-62, and* No fault has occurred on the section of cable between 15211 and 16211, and* Breaker 15201 and/or 16201 is open.
USAR - Rev. 188.2-18 11/01/2003

Breakers 15111 and 16111 can be closed by operator action only. The operator can closeBKR 15111 or BKR 16111 only if:
* No fault has occurred on either Bus 1-51 or 1-61, and* No fault has occurred on the section of cable betwveen 15111 and 16111, and* Breaker 15101 and/or 16101 is open.
Using 4160-V Bus 1-5 and assuming the loss of off-site power, the following steps take place:
a. Start Diesel Generator IA
b. Trip all 4160-V source breakers and the bus tie breaker (BKRs 501,503, 509,510 and 511);
c. Trip all 4160-V motor loads (BKRs 502, 504, 506, 507 and 508);
d. Trip selected480-V loads (BKRs 15203, 15104, 15105, 15108, 15109 and 15212).
e. Close the diesel breaker (BKR 509) after the unit comes up to speed and voltage (maximumten seconds from diesel engine start signal).
If there is a requirement for engineered safety features operation coincident with busundervoltage, step "e" above is automatically followed by the sequential starting of theengineered safety feature equipment. A group of equipment is directly connected to the bus (seeTable 8.2-1, Sequence 1.1, 1.2, 1.3 and 1.4) and the loads are picked up by the diesel generatorsimmediately upon closing of the diesel breakers. This total load is minimal, < 330-kW. (Shouldthe requirement for engineered safety features operation occurwhen voltage is present, the dieselgenerator is started and this same sequence is followed with the exception that the containmentspray pump is allowed to start immediately if containment Hi-Hi pressure is present.). Thisloading sequence for Diesel Generator IA is as follows (major loads only), continuing fromstep "e" (see Table 8.2-1 and Figure 8.2-7):
Max. TimeLapse (Sec)
f. (Step "0") Motor Operated Valves 0g. (Step " I") Start Safety Injection Pump IA 7h. (Step "2") Start Residual Heat Removal Pump IA 12i. (Step "3") Start Shield Bldg. Fan IA, Start Zone SV equipment, Start Containment
Spray Pump IA if containment Hi-Hi pressure is present 20j. (Step "4") Start Service Water Pump IAl 25k. (Step "5") Start Containment Fan Coil Units IA/lB 301. (Step "6") Start Auxiliary Feedwater Pump IA 35m. (Step "7") Start Component Cooling Pump IA 40n. (Step "8") Start Service Water Pump I A2 45o. (Step "9") Manual or Auto start of any auxiliary as required for safe plant operation 53p. (Step " 10") Manual or Auto start of any auxiliary as required for safe plant operation 63
USAR - Rev. 188.2-19 11/01/2003

NOTE: "Max Time Lapse" is the maximum time to initiation of closing the branch feederbreaker following the closure of the diesel generator source breaker. The "Max Time Lapse"specified above through step "n" is a maximum time that should not be exceeded. The "MaxTime Lapse" specified above for step "o", as one input to service water isolation to the TurbineBuilding, is a maximum time that should not be exceeded. Because all other step "o" and "p"loads are defined above as those loads that will manually or automatically start as required, the"Max Time Lapse" specified above should not be considered absolute with nominal deviation ofminor safety significance.
Starting of the containment spray pumps, initiated by Hi-Hi containment pressure, isaccomplished simultaneously with any of the above steps following the starting of the residualheat removal pump when the diesel is required to supply power to the bus. When the bus issupplied from a transformer source the containment spray pump is started immediately on Hi-Hicontainment pressure. The diesel generator automatic loading sequence through step 8, including10 seconds for engine starting, will be accomplished in approximately fifty-five seconds asshown by Figure 8.2-7. As stated in Section 14.3.4, the containment pressure analysis assumes adelay of 137.7 and 85.3 seconds respectively, to supply design containment cooling fromcontainment spray and fan-coil units.
The automatic sequences for Bus 1-6 and for Buses 1-61 and 1-62 associated with DieselGenerator lB are similar to those described for Bus 1-5. Loads to be carried by a dieselgenerator are summarized in Table 8.2-1.
Should any of the feeder breakers, associated with the above (safety features) large (non-MCCfeed) pump or fan motors, trip due to overcurrent, they can be re-closed from the controlroom. The electrical overload protection for the engineered safety feature fan, pump, and valvemotors are not actually applied as overload protection. The motors are conservatively operatedwith respect to their rating and an overload occurs only as a major malfunction. Therefore, theoverload protection isolates the malfunctioning component before it can make the bus breakertrip, causing loss of power to all other components in that circuit. Overload trip elements on thereversing starters associated with the various motor-operated valves and non-reversing startersassociated with small pump or fan motors can and must be reset at the motor control centers. Ifthe diesel generator is overloaded, an alarm is annunciated in the control room. The dieselgenerator is not protected by overload devices.
Load Evaluation
Diesel Generators
Each diesel generator is sized to start and carry the engineered safety features required for a post-blowdown containment pressure transient.
USAR - Rev. 188.2-20 11/01/2003

Selected generator nameplate data is as follows:
* Electro-Motive Division of General Motors Corporation* Model A-20-C1, Serial Nos. 70-J1-1029 and 1039* 2400/4160-V, 60 Hertz, Amps 782/452, 3 phase* 3250-kVA, Temperature rise 850C Stator-Thermometer* Temperature rise 60'C, Rotor-Resistance* 900 RPM, Power Factor 0.8* 3575-kVA Peak, 2000 hours per year* Temperature rise 105'C, Stator-Thermometer* Temperature rise 70'C, Rotor-Resistance.* Insulation Class, H-Stator and F-Rotor
Additional operating characteristics of the generator follow:
Capable of being started and ready to accept load in ten seconds and capable of being fullyloaded within twenty seconds.
Capable of operating continuously at rated kVA output at any power factor between rated laggingand unity, at any voltage within ±5% of rated voltage.
Capable of tolerating for thirty seconds without injury a three-phase short circuit at its terminalswhen operating at rated kVA and power factor, 5% overvoltage and fixed excitation.
Compliance to Regulatory Guide 1.9
1. Sizing of generator power requirements.
Motors - All motors are the standard rating above the normal load. The service factor isadded to the motor to cover fan and pump run-out. Checks have been made toassure the run-out is within the service factor. Motor power requirements werecalculated as follows:
100 hp and larger, at 93% efficiency from manufacturers certified test data andhandbooks. Less than 100 hp, at 88% efficiency from handbook data.
Brake hp was used for larger motors where certified test data was available.
KVA - Loads for transformers, etc., were calculated at 80% power factor.
Heater-Loads were taken at rated kW.
USAR - Rev. 188.2-21 11/01/2003

2. Generating load ratings:
Continuous 3250 kVA 100.0%Continuous 2600 kW at 0.8 P.F. 100.0%Overload, 2000 hours per year 2860 kW at 0.8 P.F. 110.0%Overload, 7 days per year 2950 kW at 0.8 P.F. 113.5%Overload, 30 minutes per year 3050 kW at 0.8 P.F. 117.3%
3. Generator rating criteria:
Regulatory Guide 1.9, dated December 1979 states that:
"Conformance with the requirements of IEEE Std 387-1977, "IEEE Standard criteria forDiesel Generator Units applied as Standby Power Supplies for Nuclear Power GeneratingStations", dated June 17, 1977 is acceptable for meeting the requirements of the principledesign criteria and qualification testing of diesel generator units used as on-site electricpower systems for nuclear power plants".
The IEEE Standard 387-1977 states that:
"5.2.3 Operation Application Rule (see 3.7.1 and 3.7.2). The diesel generator units may beutilized to the limit of their power capabilities as defined by the continuous and short timeratings".
"3.7.1 Continuous Rating - The electric power output capability that the diesel generator unitcan maintain in the service environment for 8760 h of operation per (common) year with onlyscheduled outages for maintenance".
"3.7.2 Short Time Rating - The electric power output capability that the diesel generator unitcan maintain in the service environment for 2 h in any 24 h period, without exceeding themanufacturer's design limits and without reducing the maintenance interval established forthe continuous rating".
NOTE: "Operation at this rating does not limit the use of the diesel generator unit at itscontinuous rating".
Table 8.2-1 lists the diesel-generator loads and the times that they will sequence on ifrequired. The maximum connected loads are 3701.4 kW for DG IA and 3523.3 kW forDG lB. Table 8.2-1 also gives a time dependent load list, which shows that the highestestimated loads are 2919.8 and 2899.1 kW for each respective diesel generator, which occursfrom one to sixty minute into the loading sequence. After adding safeguard station servicetransformer loss loads of 25.5 kW and 20.4 kW the maximum diesel generator loads are2945.3 kW for DG IA and 2919.5 kW for DG lB. These loads are both less than the seven-day per year overload rating of 2950 kW for the diesel generators.
USAR-Rev. 18 |8.2-22 11/01/2003
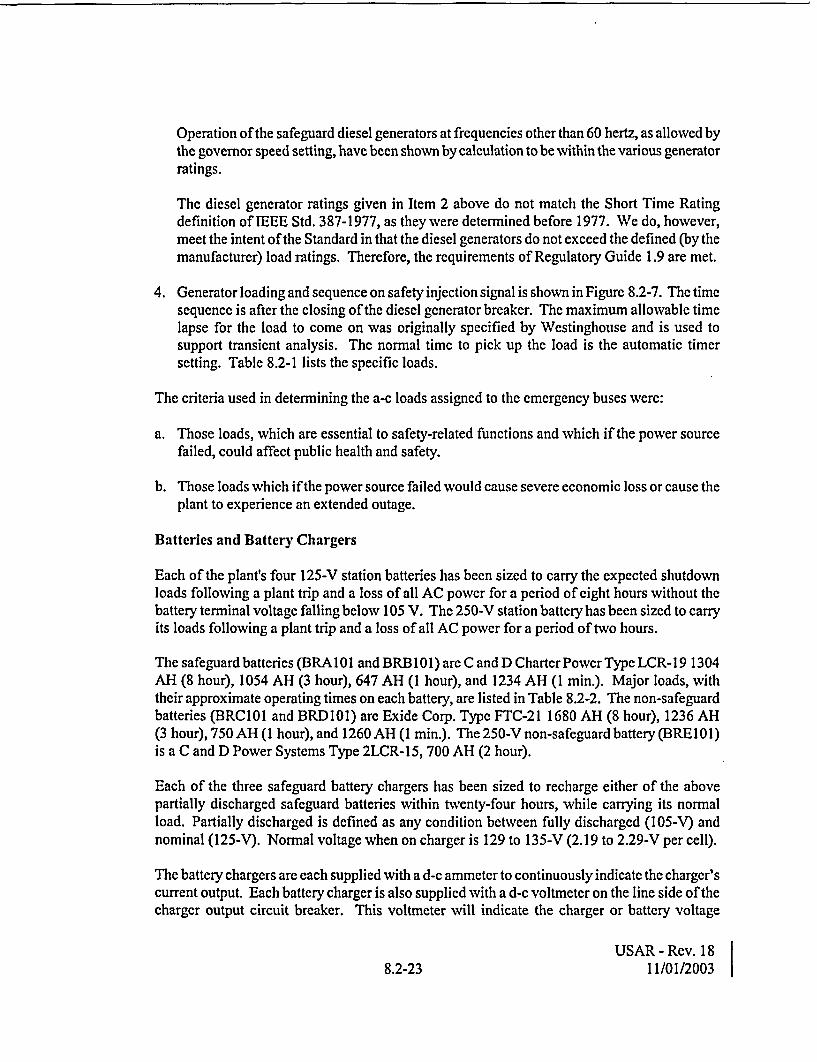
Operation of the safeguard diesel generators at frequencies other than 60 hertz, as allowed bythe governor speed setting, have been shown by calculation to be within the various generatorratings.
The diesel generator ratings given in Item 2 above do not match the Short Time Ratingdefinition of IEEE Std. 387-1977, as they were determined before 1977. We do, however,meet the intent of the Standard in that the diesel generators do not exceed the defined (by themanufacturer) load ratings. Therefore, the requirements of Regulatory Guide 1.9 are met.
4. Generator loading and sequence on safety injection signal is shown in Figure 8.2-7. The timesequence is after the closing of the diesel generator breaker. The maximum allowable timelapse for the load to come on was originally specified by Westinghouse and is used tosupport transient analysis. The normal time to pick up the load is the automatic timersetting. Table 8.2-1 lists the specific loads.
The criteria used in determining the a-c loads assigned to the emergency buses were:
a. Those loads, which are essential to safety-related functions and which if the power sourcefailed, could affect public health and safety.
b. Those loads which if the power source failed would cause severe economic loss or cause theplant to experience an extended outage.
Batteries and Battery Chargers
Each of the plant's four 125-V station batteries has been sized to carry the expected shutdownloads following a plant trip and a loss of all AC power for a period of eight hours without thebattery terminal voltage falling below 105 V. The 250-V station battery has been sized to carryits loads following a plant trip and a loss of all AC power for a period of two hours.
The safeguard batteries (BRA 101 and BRB 101) are C and D Charter Power Type LCR-l 9 1304AH (8 hour), 1054 AH (3 hour), 647 AH (1 hour), and 1234 AH (1 min.). Major loads, withtheir approximate operating times on each battery, are listed in Table 8.2-2. The non-safeguardbatteries (BRC101 and BRD101) are Exide Corp. Type FTC-21 1680 AH (8 hour), 1236 AH(3 hour), 750 AH (1 hour), and 1260 AH (1 min.). The 250-V non-safeguard battery (BREIOI)is a C and D Power Systems Type 2LCR-15, 700 AH (2 hour).
Each of the three safeguard battery chargers has been sized to recharge either of the abovepartially discharged safeguard batteries within twenty-four hours, while carrying its normalload. Partially discharged is defined as any condition between fully discharged (105-V) andnominal (125-V). Normnal voltage when on charger is 129 to 135-V (2.19 to 2.29-V per cell).
The battery chargers are each supplied with a d-c ammeter to continuously indicate the charger'scurrent output. Each battery charger is also supplied with a d-c voltmeter on the line side of thecharger output circuit breaker. This voltmeter will indicate the charger or battery voltage
USAR - Rev. 188.2-23 11/01/2003

whichever is higher. A d-c ammeter on each of the main load side buses of the batteriescontinually indicate the total load current on each battery train. On a monthly basis the specificgravities of the pilot cells are checked and recorded.
The actual charge stored in the batteries can be related to the monitored parameters in thefollowing ways:
a. The batteries are of the lead calcium type and are floated at 132-V d-c. As long as thespecific gravities of the cells are at least 1.200 and the d-c voltmeter reads 132-V then thebattery is considered fully charged.
b. The battery chargers are each rated at 150-ampere d-c output and will supply the plant loadunder normal conditions. The current-limiting feature on these chargers is set atapproximately 172.5 amperes. In a situation when the ammeter on the battery main bus readsabove 0.0 amperes then the battery would be discharging as indicated on the main busammeter.
Since the battery and charger share the loads on the bus under the normal condition, the batterymust have sufficient ampere-hour capacity to carry the total loads consisting of two classes asfollows:
a. The momentary load, such as closing and tripping of switchgear, involves the one-minuterating of a battery, though the time duration of the operation is but a few cycles.
b. The continuous load usually involves the battery's three to eight-hour rating, although longertime periods are sometimes used. The load consists of indicating lamps, holding coils forrelays and any other equipment continuously drawing current from the control bus.
Reliability Assurance
The electrical system equipment is arranged so that no single incident can inactivate enoughengineered safety features equipment to jeopardize plant safety. The 4160-V equipment issupplied from 6 buses, the 480-V equipment from 11 buses.
All Class IE electrical equipment complies with IEEE Standard 344-1971, Trial Use Guide forSeismic Qualification of Class I Electrical Equipment for Nuclear Power Generating Stations.
Two separate off-site power sources serve the 4160-V buses supplying power to the engineeredsafety features equipment. One of these is from the 138-kV portion of the substation; the secondis from the tertiary winding of the substation autotransformer via an underground 13.8-kV circuitto the plant.
Separation is maintained in both the 4160-V and the 480-V systems to allow the plant auxiliaryequipment to be arranged electrically so that redundant items receive power from two differentbuses.
USAR - Rev. 188.2-24 11/01/2003

For example, one complement of engineered safety features equipment is supplied from Bus 1-5(4160-V) and Buses 1-51 and 1-52 (480-V) while the other complement is supplied from Bus 1-6(4160-V) and Buses 1-61 and 1-62 (480-V). The cable tray system for one complement isindependent of the cable tray system for the other complement; there are no crossties. Thisdesign assures the separation and independence of the two systems.
One off-site source of power can supply sufficient power to run normal operatingequipment. Any one of the four transmission lines can supply all the plant auxiliary power. Alow-voltage station auxiliary transformer can supply all the auxiliary loads for the plant.
Each diesel generator has capacity enough to sequentially start and run a fully loaded set ofengineered safety features equipment. These safety features can adequately cool the core for anyloss-of-coolant incident, and maintain the containment pressure within the design value.
One battery charger is in service on each battery so that the batteries are always at full charge inanticipation of loss of a-c power. This insures that adequate d-c power is available for startingthe diesel generators and for other emergency uses.
The physical barrier provided between the emergency diesel engine generator sets consists in partof a Class I reinforced concrete wall 18 inches thick and the remainder a reinforced concreteblock wall 12 inches thick. The doors and ventilation exhaust louvers are all Underwriters'Laboratories construction. All other openings in the barrier are sealed with fire retardantmaterials to maintain fire separation of the two diesel generator units.
The only potential for an explosion in the diesel generator rooms exists within a diesel enginecrankcase. The rooms have sufficient volume and are vented to preclude a pressure rise thatwould endanger the integrity of the room walls.
In the event of a service water line break in the area between diesel generator rooms some waterleakage would occur into the diesel generator rooms. Leakage through the door into dieselgenerator room IB would flow to the floor drain if enough water was present to overflow thecurb. Leakage through the door and through the trench into diesel generator room IA wouldflow to the trench drain. All other openings into the diesel generator rooms from the tunnel areat higher elevations.
Both diesel generator rooms have double doors appropriately strengthened to prevent possibleflooding. The trench into diesel generator room IA was plugged to restrict leakage into theroom.
Water flowing from the hypothetical service water line break would return to the screenhousealong the floor of the tunnel. Water entering the screenhouse would drain to the circulatingwater pump elevation where approximately 382,000 gallons are required to flood to the 586-footelevation. Maximum possible service water pump run-out for two pumps would be less than20,000 gpm total. The operator has over nineteen minutes to respond to the low service water
USAR - Rev. 188.2-25 11/01/2003

pressure alarm on one header, isolate that header from the auxiliary building and then trip thepumps.
The rupture of a service water line in an Emergency Diesel Generator Room could result in theloss of the generator or the Safeguards bus in that room. Administrative operation from theControl Room of Type I Service Water valving would isolate the break and if required, realignthe Service Water supplies through the intact piping from the operating Service Water Pumps.
Surveillance Requirements
The monthly tests specified for the diesel generators will demonstrate their continued capabilityto start and carry rated load. The fuel supplies and starting circuits and controls are continuouslymonitored, and abnormal conditions in these systems would be indicated by an alarm withoutneed for test startup (Reference 2).
The less frequent overall system test demonstrates that the emergency power system and thecontrol system for the engineered safety features equipment function automatically in the eventof loss of all other sources of a-c power, and that the diesel generators start automatically in theevent of a loss-of-coolant accident. This test demonstrates proper tripping of motor feederbreakers, main supply and tie breakers on the affected bus, and sequential starting of essentialequipment, to the extent possible, as well as the operability of the diesel generators.
The specified test frequencies provide reasonable assurance that any mechanical or electricaldeficiency is detected and corrected before it can result in failure of one emergency power supplyto respond when called upon to function.
Station batteries will deteriorate with time, but precipitous failure is extremely unlikely. Thecontinuous and periodic surveillance performed on the batteries will demonstrate batterydegradation long before a cell becomes unserviceable or fails.
If a battery cell has deteriorated, or if a connection is loose, the voltage under load will dropexcessively, indicating need for replacement or maintenance.
8.2.4 STATION BLACKOUT
Introduction
On July 21, 1988 the Code of Federal Regulations 10 CFR Part 50, was amended to include anew Section 50.63 entitled, "Loss of All Alternating Current Power", (Station Blackout). Thestation blackout (SBO) rule requires that each light-water-cooled nuclear power plant be able towithstand and recover from an SBO of specified duration.
USAR - Rev. 188.2-26 11/01/2003

Station Blackout Duration
The Kewaunee SBO duration is 4 hours, based on a plant AC power design characteristic GroupP1, an emergency AC (EAC) power configuration Group C, and a target Emergency DieselGenerator (EDG) reliability of 0.95 (see NRC SER in reference 4).
Alternate AC (AAC) Power Source
The existing Technical Support Center (TSC) diesel generator will be used as an AACsource. The TSC diesel generator is an independent, non-class lE, 600 kW (1000 hr/yearstandby rating) diesel generator that provides emergency power to 480-V Bus 1-46 for TSCequipment. For SBO purposes, a connection can be made between this bus and the 480-V safetyBus 1-52. Normal isolation between the two buses is provided by a Class I E breaker at Bus 1-52and a non-class 1E breaker at Bus 1-46. For SBO, selected non-essential loads will be strippedfrom each of the two buses and the two breakers will close to provide power to essential loads onboth buses. The total load to be powered within I hour following the onset of the SBO iscalculated to be approximately 587 kW.
Condensate Inventory
The Technical Specifications (TS) provide for a minimum of 39,000 gallons of condensateinventory. This is sufficient for 4 hours of decay heat removal.
Class IE Battery Capacity
Battery capacity calculations exist for the BRAIOI and BRBO1I Class IE batteries and on theBRD 101 non-class 1 E battery. They are based on the IEEE-485 methodology and a duty cycle of8 hours. The 8-hour duty cycle capability has been verified by test per the guidance ofIEEE 450-1987. Based on the above, the batteries arc adequate, with considerable margin for therequired 4-hour SBO duration.
Compressed Air
The air-operated valves relied upon to cope with an SBO event for 4 hours will be equipped withDC powered solenoid valves and backup air (nitrogen) supplies.
Effects of Loss of Ventilation
Steady state heat-up analyses were performed to determine the effects of loss of ventilation in thebattery rooms, control room, relay room, charging pump room, turbine driven auxiliary feedwaterpump room, containment and steam generator power operated relief valve areas. The calculatedsteady state temperatures for these rooms are well below the temperature limits described inNUMARC 87-00, Section 2.7. Kewaunee has procedures and operator training to ensureopening of doors #45 and #48 to Battery Rooms lA and IB, respectively, and relay room cabinetdoors within 30 minutes of the onset of an SBO event.
USAR - Rev. 18 |
8.2-27 11/01/2003
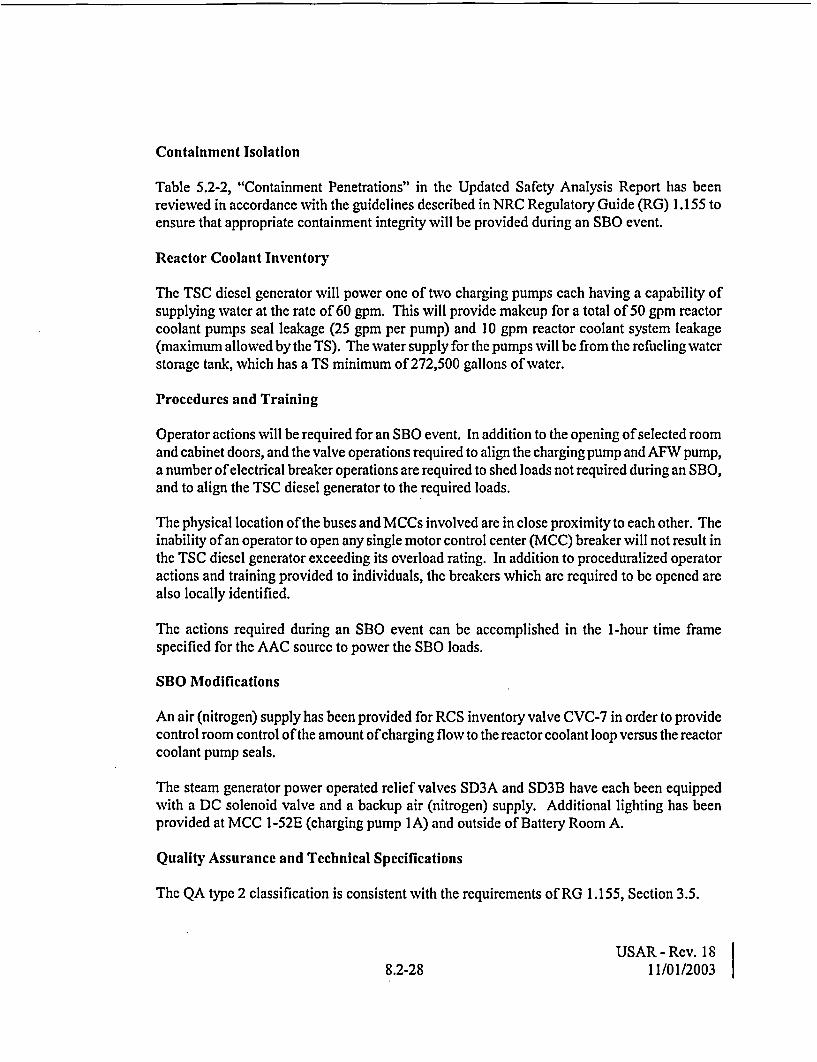
Containment Isolation
Table 5.2-2, "Containment Penetrations" in the Updated Safety Analysis Report has beenreviewed in accordance with the guidelines described in NRC Regulatory Guide (RG) 1.155 toensure that appropriate containment integrity will be provided during an SBO event.
Reactor Coolant Inventory
The TSC diesel generator will power one of two charging pumps each having a capability ofsupplying water at the rate of 60 gpm. This will provide makeup for a total of 50 gpm reactorcoolant pumps seal leakage (25 gpm per pump) and 10 gpm reactor coolant system leakage(maximum allowed by the TS). The water supply for the pumps will be from the refueling waterstorage tank, which has a TS minimum of 272,500 gallons of water.
Procedures and Training
Operator actions will be required for an SBO event. In addition to the opening of selected roomand cabinet doors, and the valve operations required to align the charging pump and AFW pump,a number of electrical breaker operations are required to shed loads not required during an SBO,and to align the TSC diesel generator to the required loads.
The physical location of the buses and MCCs involved are in close proximity to each other. Theinability of an operator to open any single motor control center (MCC) breaker will not result inthe TSC diesel generator exceeding its overload rating. In addition to proceduralized operatoractions and training provided to individuals, the breakers which are required to be opened arealso locally identified.
The actions required during an SBO event can be accomplished in the 1-hour time framespecified for the AAC source to power the SBO loads.
SBO Modifications
An air (nitrogen) supply has been provided for RCS inventory valve CVC-7 in order to providecontrol room control of the amount of charging flow to the reactor coolant loop versus the reactorcoolant pump seals.
The steam generator power operated relief valves SD3A and SD3B have each been equippedwith a DC solenoid valve and a backup air (nitrogen) supply. Additional lighting has beenprovided at MCC 1-52E (charging pump IA) and outside of Battery Room A.
Quality Assurance and Technical Specifications
The QA type 2 classification is consistent with the requirements of RG 1.155, Section 3.5.
USAR - Rev. 188.2-28 11/01/2003

EDG Reliability Program
The EDG reliability program, including the TSC diesel generator, meets the intent and guidanceprovided in RG 1.155, Section 1.2.
USAR - Rev. 188.2-29 11/01/2003 1

REFERENCES - SECTION 8.2
1. NRC SafetyEvaluation Report, M.B. Fairtile (NRC) to D.C. Hintz (WPS), LetterNo. K-86-136dated July 3, 1986
2. NRC Safety Evaluation Report, S.A. Varga (NRC) to E.R. Mathews (WPS), LetterNo. K-81i-189dated November 12, 1981
3. NRC Safety Evaluation Report, A.T. Gody, Jr. (NRC) to K.H. Evers (WPS), Letter No.K-89-212 dated October 25, 1989
4. NRC Supplemental Safety Evaluation Report, A.G. Hansen (NRC) to C.A. Schrock (WPS),Letter No. K-92-215 dated November 19, 1992
5. NRC Safety Evaluation Reports:
a. A. Schwencer (NRC) to E.W. James (WPS), Letter dated June 3, 1977b. R.B. Licciardo (NRC) to E.R. Matthews (WPS), Letter No. K-82-074 dated April 30,1982c. J.D. Neighbors (NRC) to C.W. Giesler (WPS), Letter No. K-84-091 dated April 30, 1982d. R.J. Laufer (NRC) to C.A. Schrock (WPS), LetterNo. K-93-203 dated September 30, 1993e. R.J. Laufer (NRC) to M.L. Marchi (WPS), LetterNo. K-96-098 dated June 12, 1996
6. "Stability Studies Associated With Nuclear Power Plants In Wisconsin", E.R. Mathews,Wisconsin Public Service Corporation, October 11, 1968
USAR - Rev. 18 |8.2-30 11/01/2003

9.2 CHEMICAL AND VOLUME CONTROL SYSTEM
The Chemical and Volume Control System:
a. adjusts the concentration of chemical neutron absorber for chemical reactivity control;
b. maintains the proper water inventory in the Reactor Coolant System;
c. provides the required seal water flow for the reactor coolant pump shaft seals;
d. processes reactor coolant letdown for reuse of boric acid;
e. maintains the proper concentration of corrosion inhibiting chemicals in the reactor coolant;and
f. keeps the reactor coolant fission product and corrosion product activities to within designlevels.
The system is also used to fill and hydrostatically test the Reactor Coolant System.
During normal operation, therefore, this system has provisions for supplying:
a. Hydrogen to the volume control tank
b. Nitrogen as required for purging the volume control tank
c. Hydrazine or pH control chemical, as required, via the chemical mixing tank to thecharging pumps suction.
9.2.1 DESIGN BASES
Redundancy of Reactivity Control
Criterion: Two independent reactivity control systems, preferably of different principles,shall be provided (GDC 27).
In addition to the reactivity control achieved by the Rod Control System described in Section 7,reactivity control is provided by the Chemical and Volume Control System which regulates theconcentration of boric acid solution neutron absorber in the Reactor Coolant System. The systemis designed to prevent uncontrolled or inadvertent reactivity changes, which might cause systemparameters to exceed design limits.
USAR - Rev. 1 89.2-1 11/01/2003

Reactivity Hot Shutdown Capability
Criterion: The reactivity control system provided shall be capable of making and holdingthe core sub-critical from any hot standby or hot operating condition (GDC 28).
The reactivity control systems provided are capable of making and holding the core sub-criticalfrom any hot standby or hot operating condition, including conditions resulting from powerchanges. The maximum excess reactivity expected for the core occurs for the cold, cleancondition at the beginning of life of the core. The full-length RCC assemblies are divided intotwo categories comprising control and shutdown groups.
The control group used in combination with boric acid as a chemical shim provides control of thereactivity changes of the core throughout the life of the core at power conditions. This group ofRCC assemblies is used to compensate for short term reactivity changes at power such as thoseproduced due to variations in reactor power requirements or in coolant temperature. Thechemical shim control is used to compensate for the more slowly occurring changes in reactivitythroughout core life such as those due to fuel depletion, fission product buildup and decay, andthe xenon transient associated with power level changes.
Reactivity Shutdown Capability
Criterion: One of the reactivity control systems provided shall be capable of making thecore sub-critical under any anticipated operating condition (including anticipatedoperational transients) sufficiently fast to prevent exceeding acceptable fueldamage limits. Shutdown margin should assure sub-criticality with the mostreactive control rod fully withdrawn (GDC 29).
The reactor core, together with the reactor control and protection system is designed so that theminimum allowable DNBR is no less than 1.30 and there is no fuel melting during normaloperation, including anticipated transients.
The shutdown groups are provided to supplement the control group of RCC assemblies to makethe reactor at least one percent sub-critical (k(eff) < 0.99) following trip from any credibleoperating condition to the hot, zero power condition assuming the most reactive RCC assemblyremains in the fully withdrawn position.
Sufficient shutdown capability is also provided to maintain the core sub-critical, with the mostreactive rod assumed to be fully withdrawn, for the most severe anticipated cooldown transientassociated with a single active failure, e.g., accidental opening of a steam bypass or reliefvalve. This is achieved with combination of control rods and automatic boron addition via theSafety Injection System.
USAR - Rev. 189.2-2 11/01/2003

Reactivity Hold-Down Capability
Criterion: The reactivity control systems provided shall be capable of making the coresub-critical under credible accident conditions with appropriate margins forcontingencies and limiting any subsequent return to power such that there will beno undue risk to the health and safety of the public (GDC 30).
Normal reactivity shutdown capability is provided by control rods with boric acid injection usedfor xenon transients and for plant cooldown. When the plant is at power, the quantity of boricacid available will exceed that quantity required to establish the cold shutdown boronconcentration. This quantity will always exceed the quantity of boric acid required to bring thereactor to hot shutdown and to compensate for subsequent xenon decay.
The normal supply of boric acid is maintained in the boric acid storage tanks. The boric acidsolution is transferred from the boric acid tanks to the suction of the charging pumps by eitherboric acid transfer pump. The charging pumps then inject the boric acid solution to the reactorcoolant. Any charging pump and any boric acid transfer pump can be energized from dieselgenerator power. The Refueling Water Storage Tank (RWST) provides a backup supply ofborated water that can be aligned to the suction ofthe charging pumps. The RWST normally hasadequate quantity of borated water to place the plant in the cold shutdown condition ifnecessary. Either boric acid supply to any charging pump will provide sufficient negativereactivity to the reactor coolant to compensate for xenon decay.
Boric acid could be injected to shutdown the reactor independent of the RCC assemblies, whichnormally serve this function in the short term. The quantity of acid maintained to establish thecold shutdown boron concentration is more than that needed to initially shutdown the reactorwithout using RCC assemblies.
On the basis of the above, the injection of boric acid is shown to afford backup reactivityshutdown capability and provides adequate long term hold-down capability necessary tocompensate for xenon transients and for plant cooldown.
Codes and Classifications
All pressure retaining components (or compartments of components) which are exposed toreactor coolant, comply with the following codes:
a. System pressure vessels - ASME Boiler and Pressure Vessel Code, Section III, Class C.
b. System valves, fittings, and piping - USAS B3 1.1, including nuclear code cases.
System component code requirements are tabulated in Table 9.2-1.
USAR-Rev. 189.2-3 11/01/2003
The tube and shell sides on the regenerative heat exchanger and the tube side of the excessletdown heat exchanger are designed to ASME Section Ill, Class C. This designation is based onthe following considerations:
a. each exchanger is connected to the Reactor Coolant System by lines equal to or less than 2inches; and
b. each is located inside the Reactor Containment Vessel.
Analyses show that the accident associated with a 2-inch line break does not result in claddamage or failure. Additionally, previously contaminated reactor coolant escaping from theReactor Coolant System during such an accident is confined to the Reactor Containment Vesseland no public hazard results.
9.2.2 SYSTEM DESIGN AND OPERATION
The Chemical and Volume Control System, shown in Figures 9.2-1 through 9.2-5, provides ameans for injection of the neutron control chemical in the form of boric acid solution, chemicaladditions for corrosion control, and reactor coolant cleanup, degasification and deboration. Thissystem also adds makeup water to the Reactor Coolant System, reprocesses water letdown fromthe Reactor Coolant System, and provides seal water injection to the reactor coolant pumpseals. Design seal injection to each reactor coolant pump is 8 gpm with 5 gpm leaking throughthe labyrinth seal into the reactor coolant system. The seal is designed to leak 3 gpm or less backto the Chemical and Volume Control System. Materials in contact with the reactor coolant areaustenitic stainless steel or equivalent corrosion resistant materials.
System components whose design pressure and temperature are less than the Reactor CoolantSystem design limits are provided with overpressure protective devices.
System discharges from overpressure protective devices (safety valves) and system leakage aredirected to closed systems. Effluents removed from such closed systems are monitored anddischarged under controlled conditions.
During plant operation, reactor coolant flows through the letdown line from a loop cold-leg onthe suction side of the reactor coolant pump and, after processing is returned to the cold-leg ofthe loop on the discharge side of the pump via a charging line and through the in leakage in thereactor coolant pump seals. An excess letdown line is also provided for removing coolant fromthe Reactor Coolant System.
Each of the connections to the Reactor Coolant System has an isolation valve located close to theloop piping. In addition, a check valve is located downstream of each charging line isolationvalve. Reactor coolant entering the Chemical and Volume Control System flows through theshell side of the regenerative heat exchanger where its temperature is reduced. The coolant thenflows through letdown orifices, which reduce the coolant pressure. The cooled, low-pressurewater leaves the Reactor Containment Vessel and enters the Auxiliary Building where it
USAR - Rev. 189.2-4 11/01/2003

undergoes a second temperature reduction in the tube side of the letdown heat exchangerfollowed by a second pressure reduction by the low-pressure letdown valve. After passingthrough the letdown filter and one of the mixed bed demineralizers, where ionic impurities areremoved, coolant flows through the reactor coolant filters and enters the volume control tankthrough a spray nozzle.
Hydrogen is automatically supplied, as determined by pressure control, to the vapor space in thevolume control tank, which is predominantly hydrogen and water vapor. The hydrogen withinthis tank is supplied to the reactor coolant for maintaining a low oxygen concentration. Ifrequired, fission gases can be removed from the system by venting the volume control tank to theWaste Disposal System.
From the volume control tank the coolant flows to the charging pumps which raise the pressureabove that in the Reactor Coolant System. The coolant then enters the containment, passesthrough the tube side of the regenerative heat exchanger, and is returned to the Reactor CoolantSystem.
The cation bed demineralizer, located downstream of the mixed bed demineralizers, is usedintermittently to control cesium activity in the coolant and also to remove excess lithium, whichis formed from B30 (n, a) Li7 reaction.
Boric acid is dissolved in hot water in the batching tank to a concentration of nominal 8.0% byweight. The lower portion of the batching tank is jacketed to permit heating of the batching tanksolution with low-pressure steam. A transfer pump is used to transfer the batch to the boric acidtanks. Small quantities of boric acid solution are metered from the discharge of an operatingtransfer pump for blending with reactor makeup water as makeup for normal leakage or forincreasing the reactor coolant boron concentration during normal operation. Electric heatersmaintain the temperature of the boric acid tanks solution high enough to preventprecipitation. The boric acid piping is heat traced to prevent precipitation.
Excess liquid effluents containing boric acid flow from the Reactor Coolant System through theletdown line and are collected in the holdup tanks. As liquid enters the holdup tanks, thenitrogen cover gas is displaced to the gas decay tanks in the Waste Disposal System through thewaste vent header. The concentration of boric acid in the holdup tanks varies throughout corelife from the refueling concentration to essentially zero at the end of the core cycle. Arecirculation pump is provided to transfer liquid from one holdup tank to another and torecirculate the contents of individual holdup tanks.
Liquid effluent in the holdup tanks is processed as a batch operation. This liquid is pumpedthrough the evaporation feed ion exchangers, which primarily remove lithium hydroxide(Li7OH), and fission products such as long-lived cesium. It then flows through the ionexchanger filter and into the gas stripper/boric acid evaporator package.
The dissolved gases are removed from the liquid by the gas stripper section and are vented to theWaste Disposal System. The liquid effluent from the gas stripper section then enters the
USAR - Rev. 189.2-5 11/01/2003

evaporator section. The distillate produced in the boric acid evaporator leaves the evaporatorcondenser and is pumped through a condensate cooler where the distillate is cooled to theoperating temperature of the two-evaporator condensate demineralizers. If it is required,evaporator carry over is removed by one of the two-evaporator condensate demineralizers, andthen the condensate flows through the condensate filter and accumulates in one of two monitortanks. The dilute boric acid solution originally in the boric acid evaporator remains as thebottoms of the distillation process and is concentrated to nominal weight 8.0% boric acid.
Subsequent handling of the condensate is dependent on the results of sample analysis. Dischargefrom the monitor tanks is recycled through the evaporator condensate demineralizers, returned tothe holdup tanks for reprocessing in the evaporator train or discharged to the environment withthe condenser circulating water, when within the allowable activity concentration as discussed inSection 11. If the sample analysis of the monitor tank contents indicates that it may bedischarged safely to the environment, at least two valves must be opened to provide a dischargepath. As the effluent leaves, it is continuously monitored by the Waste Disposal System liquideffluent monitor. If an unexpected increase in radioactivity is sensed, one of the valves in thedischarge line to the service water discharge header closes automatically and an alarm sounds inthe control room.
Boric acid evaporator bottoms are discharged through a concentrate filter to the concentratesholding tank. Solution collected in the concentrates holding tank is sampled and then transferredto the boric acid tanks if analysis indicates that it meets specifications for use as boric acidmakeup. Otherwise the solution is pumped to the holdup tanks for reprocessing by theevaporator train.
The concentrated solution can also be pumped from the evaporator to the Waste Disposal Systemto be placed in containers. These containers can then be stored at the plant site for ultimateshipment off-site for disposal.
The deborating demineralizers can be used intermittently to remove boron from the reactorcoolant near the end of the core life. When the deborating demineralizers are in operation, theletdown stream passes from the mixed bed demineralizers, through a deborating demineralizerand into the volume control tank after passing through the reactor coolant filter.
During plant cooldown, when the residual heat removal loop is operating and the letdownorifices are not in service, a flow path is provided to remove corrosion impurities and fissionproducts. A portion of the flow leaving the residual heat exchangers passes through the letdownheat exchanger, letdown filter, mixed bed demineralizers, reactor coolant filter, and volumecontrol tank. The fluid is then pumped, via the charging pump, through the tube side of theregenerative heat exchanger into the Reactor Coolant System. Flow may also bypass theregenerative heat exchanger and letdown orifices, by way of a direct connection from the IARHR heat exchanger to the letdown heat exchanger.
USAR- Rev. 189.2-6 11/01/2003

Expected Operating Conditions
Tables 9.2-2 and 9.2-3 list the system performance requirements, and data for individual systemcomponents. Reactor coolant equilibrium activities are given in Appendix D.
Reactor Coolant Activity Concentration
The parameters used in the calculation of the reactor coolant fission product inventory, includingpertinent information concerning the expected coolant cleanup flow rate and demineralizereffectiveness, are presented in Appendix D. In these calculations, 1% defects are assumed to bepresent in the fuel rods at initial core loading and are uniformly distributed throughout thecore. The fission product escape rate coefficients are therefore based upon an average fueltemperature.
The fission product activity in the reactor coolant during operation with small cladding pinholesor cracks in 1% of the fuel rods is computed using the following differential equations:
For parent nuclides in the coolant,
dN,= Dv,di =DviNc, - Ai+ +R77 + Bo - tB 1,N.,
For daughter nuclides in the coolant,
a' = DvjNc} - (Aj + R71 + B 0 NtBt w N
where:
N = population of nuclideD = fraction of fuel rods having defective claddingR = purification flow, coolant system volumes per sec.B0 = initial boron concentration, ppmB' = boron concentration reduction rate by feed and bleed, ppm per sec.1 = removal efficiency of purification cycle for nuclideX = radioactive decay constantu = escape rate coefficient for diffusion into coolant
Subscript C refers to coreSubscript w refers to coolantSubscript i refers to parent nuclideSubscript j refers to daughter nuclide
USAR - Rev. 189.2-7 11/01/2003

Tritium is produced in the reactor from ternary fission in the fuel, irradiation of boron in theburnable poison rods and irradiation of boron, lithium, and deuterium in the coolant. Thedeuterium contribution is less than 0.1 curie per year and maybe neglected. The parameters usedin the calculation of tritium production rate are also presented in Appendix D.
Reactor Makeup Control
The reactor makeup control consists of a group of instruments arranged to provide a manuallypre-selected makeup water composition to the charging pump suction header or the volumecontrol tank. The makeup control functions are to maintain desired operating fluid inventory inthe volume control tank and to adjust reactor coolant boron concentration for reactivity and shimcontrol.
Makeup for normal plant leakage is regulated by the reactor makeup control, which is set by theoperator to blend water from the reactor makeup water tank with concentrated boric acid tomatch the reactor coolant boron concentration.
The makeup system also provides concentrated boric acid or reactor makeup water to eitherincrease or decrease the boric acid concentration in the Reactor Coolant System. To maintain thereactor coolant volume constant, an equal amount of reactor coolant at existing reactor coolantboric acid concentration is letdown to the holdup tanks. Should the letdown line be out ofservice during operation, the excess letdown would be available which would aid in providingsufficient volume in the pressurizer to accept the amount of boric acid necessary for coldshutdown.
Makeup water to the Reactor Coolant System is provided by the Chemical and Volume ControlSystem from the following sources:
a. The reactor makeup water tanks, which provide water for dilution when the reactor coolantboron concentration is to be reduced.
b. The boric acid tanks, which supply concentrated boric acid solution when reactor coolantboron concentration is to be increased.
c. The refueling water storage tank, which supplies borated water for emergency makeup.
d. The chemical mixing tank, which is used to inject small quantities of solution when additionsof hydrazine or pH control chemical are necessary.
The reactor makeup control is operated from the control room by manually pre-selecting thedesired makeup composition to the charging pump suction header or the volume control tank inorder to adjust the reactor coolant boron concentration for reactivity control. Makeup is providedto maintain the desired operating fluid inventory in the Reactor Coolant System. The operatorcan stop the makeup operation at any time in any operating mode. The reactor makeup water
USAR - Rev. 189.2-8 11/01/2003
supply and boric acid transfer pumps are normally lined up for automatic operation as requiredby the makeup controller.
A portion of the high-pressure charging flow is injected into the reactor coolant pumps betweenthe pump impeller and the shaft seal so that the seals and the lower radial bearing are notexposed to high temperature reactor coolant. The injection flow splits and part becomes the shaftseal leak-off flow and the remainder enters the Reactor Coolant System through a labyrinth sealon the pump shaft. The shaft seal leak-off flow cools the lower radial bearing, passes through theseals, is cooled in the seal water heat exchanger, filtered, and returned to the volume controltank.
Seal water inleakage to the Reactor Coolant System requires a continuous letdown of reactorcoolant to maintain the desired inventory. In addition, bleed and feed of reactor coolant arerequired for removal of impurities and adjustment of boric acid in the reactor coolant.
Automatic Makeup
The "automatic makeup" mode of operation of the reactor makeup control provides boric acidsolution preset by the operator to match the boron concentration in the Reactor CoolantSystem. The automatic makeup compensates for minor leakage of reactor coolant withoutcausing significant changes in the coolant boron concentration.
Under normal plant operating conditions, the mode selector switch is set in the "AutomaticMakeup" position. A preset low level signal (17%) from the volume control tank level controllercauses the automatic makeup control action to open the makeup stop valve to the charging pumpsuction, modulate the concentrated boric acid control valve, open the reactor makeup watercontrol valve and to switch the boric acid transfer pumps to high speed operation. The flowcontrollers then blend the makeup stream according to the preset concentration. Makeupaddition to the charging pump suction header causes the water level in the volume control tank torise. At a preset high level set-point (27%), the makeup is stopped; the reactor makeup watercontrol valve closes, the concentrated boric acid control valve returns to its normal position(open), the makeup stop valve to charging pump suction closes, and the boric acid transferpumps are returned to their previous mode of operation.
Dilution
The "dilute" mode of operation permits the addition of a pre-selected quantity ofreactormakeupwater at pre-selected flow rate to the Reactor Coolant System. The operator sets the modeselector switch to "dilute", the reactor makeup water flow controller set point to the desired flowrate, and the reactor makeup water batch integrator to the desired quantity. Upon manual start ofthe system the makeup stop valve to the volume control tank opens, and the reactor makeupwater control valve opens. Makeup water is added to the volume control tank and then goes tothe charging pump suction header. Excessive rise of the volume control tank water level isprevented by automatic actuation (by the tank level controller) of a three-way diversion valve,which routes the reactor coolant letdown flow to the holdup tanks. When the preset quantity of
USAR - Rev. 189.2-9 11/01/2003
reactor makeup water has been added, the batch integrator causes the reactor makeup watercontrol valve and makeup stop valve to close.
Alternate Dilute
The "alternate dilute" mode is similar to the dilute mode except the dilution water, after passingthrough the blender, splits and a portion flows directly to the charging pump suction and aportion flows into the volume control tank via the spray nozzle and then flows to the chargingpump suction. The operator sets the mode selector switch to "alternate dilute", the reactormakeup water flow controller set point to the desired flow rate, the reactor makeup water batchintegrator to the desired quantity, and actuates the makeup start. The start signal causes themakeup control to open the makeup stop valve to the volume control tank, the makeup stop valveto the charging pump suction header, and the reactor makeup control valve. Reactor makeupwater is simultaneously added to the volume control tank and to the charging pump suctionheader. This mode is used for load follow and permits the dilution water to follow the initialxenon transient and simultaneously dilute the volume control tank. Excessive water level in thevolume control tank is prevented by automatic actuation of the volume control tank levelcontroller which routes the reactor coolant letdown flow to the holdup tanks. When the presetquantity of reactor makeup water has been added, the batch integrator causes the reactor makeupwater control valve and the reactor makeup stop valves to close. This operation may be stoppedmanually by actuating the makeup stop.
Boration
The "borate" mode of operation permits the addition of a pre-selected quantity of concentratedboric acid solution at a pre-selected flow rate to the Reactor Coolant System. The operator setsthe mode selector switch to "borate", the concentrated boric acid flow controller set point to thedesired flow rate, and the concentrated boric acid batch integrater to the desired quantity. Uponmanual start of the system the makeup stop valve to the charging pumps opens, the concentratedboric acid control valve modulates, the boric acid transfer pumps start, if not already running,and the concentrated boric acid is added to the charging pump suction header. The total quantityadded in most cases is so small that it has only a minor effect on the volume control tanklevel. When the preset quantity of concentrated boric acid solution has been added, the batchintegrater causes the boric acid control valve and the makeup stop valve to the charging pumpsuction to return to their normal position, and stops the Boric Acid Transfer Pumps.
The capability to add boron to the reactor coolant is such that it imposes no limitation on the rateof cooldown of the reactor upon shutdown. The maximum rates of boration and the equivalentcoolant cooldown rates are given in Table 9.2-2. One set of values is given for the addition ofboric acid from a boric acid tank with one transfer and one charging pump operating. The otherset assumed the use of refueling water but with two-of-the-three charging pumps operating. Therates are based on full operating temperature and on the end of the core life when the moderatortemperature coefficient is most negative.
USAR - Rev. 189.2-10 11/01/2003

By manual action of the operator, the boric acid transfer pumps can discharge directly to thecharging pump suction and bypass the blender and volume control tank.
Alarm Functions
The reactor makeup control is provided with alarm functions to call attention to the followingconditions:
* Deviation of reactor makeup water flow rate from the control set point by±5 gpm.+ Deviation of concentrated boric acid flow rate from the control set point by± 0.2 gpm.* Low level (makeup initiation point) in the volume control tank if the level decreases to the
low level makeup initiation set point.
Charging Pump Control
Three positive-displacement variable-speed-drive-charging pumps are used to supply chargingflow to the Reactor Coolant System.
The speed of each pump can be controlled manually or automatically. During normal operation,charging pumps are operated as necessary to maintain inventory in the reactor coolantsystem. During load changes, the pressurizer level set point is varied automatically tocompensate partially for the expansion or contraction of the reactor coolant associated with theTayg changes. Automatic control of charging pump speed does not change rapidly withpressurizer level variations due to the reset action of the pressurizer level controller.
If the pressurizer level increases, the speed of the pump decreases; likewise, if the leveldecreases, the speed increases. If the charging pump on automatic control reaches the high speedlimit, an alarm is actuated and a second pump is manually started. The speed of the secondpump is manually regulated. If the speed of the charging pump on automatic control does notdecrease and the second charging pump is operating at maximum speed, the third charging pumpcan be started and its speed manually regulated. If the speed of the charging pump on automaticcontrol decreases to its minimum value, an alarm is actuated and the speed of the pumps onmanual control is reduced.
A selector switch is used to choose one-of-two pressurizer water level channel signals for inputto a single level controller, which in turn controls charging pump speed.
The charging pump cannot overpressurize the system because:
1. The spray system in the pressurizer can suppress maximum charging flow.
2. Assuming a spray failure (single failure), the power operated relief valves can handle morethan the maximum charging flow (2 channels).
USAR - Rev. 189.2-11 11/01/2003

3. Assuming three failures (spray and two power operated relief valves), the code relief valvescan handle more than the maximum charging flow.
In addition, there are many redundant and diverse alarms to bring the operator's attention to thesituation (high pressurizer pressure, high pressurizer water level, pressurizer level deviation,etc.). There is also an alarm on reaching the high or low limits imposed on the automatic controlsignal to the pump controller. The operator would then go to manual control of the chargingpumps.
To ensure that the charging pump flow is always sufficient to meet the RCP seal waterrequirements, the pump has a control stop which can be preset and does not permit pump flowlower than the specified minimum. This control stop is adjustable to permit higher minimumflow limits to be set if mechanical seal leakage increases during plant life.
Components
A summary of principal component data is given in Table 9.2-3.
Regenerative Heat Exchanger
The regenerative heat exchanger is designed to recover the heat from the letdown stream byre-heating the charging stream during normal operation. This exchanger also limits thetemperature rise, 'which occurs at the letdown orifices during periods when letdown flow exceedscharging flow by a greater margin than at normal letdown conditions.
The letdown stream flows through the shell of the regenerative heat exchanger and the chargingstream flows through the tubes to place the lower pressure requirements on the shell. The unit isa three shell, multiple tube pass heat exchanger made of austenitic stainless steel, and is of all-welded construction.
Letdown Orifices
One of the three letdown orifices controls flow of the letdown stream during normal operationand reduces the pressure to a value compatible with the letdown heat exchanger design. Either oftwo letdown orifices, each 40 gpm, is used to pass normal letdown flow. The third orifice, 80gpm, is designed to be used for maximum purification flow at normal Reactor Coolant Systemoperating pressure and can pass twice the normal letdown flow. The orifices are placed in andtaken out of service by remote manual operation oftheir respective isolation valves. One orbothof the standby orifices may be used in parallel with the normally operating orifice in order tobring the letdown flow up to normal when the Reactor Coolant System pressure driving force isbelow normal. This arrangement provides a full standby capacity for control of letdown flow.Each orifice consists of bored pipe made of austenitic stainless steel.
USAR - Rev. 189.2-12 p 11/0 1/2 00 3

Letdown Heat Exchanger
The letdown heat exchanger cools the letdown stream to the operating temperature of the mixedbed demineralizers. Reactor coolant flows through the tube side of the exchanger whilecomponent-cooling water flows through the shell. The letdown stream outlet temperature isautomatically controlled by a temperature control valve in the component cooling water outletstream. The unit is a multiple-pass tube-and-shell heat exchanger. All surfaces in contact withthe reactor coolant are austenitic stainless steel, and the shell is carbon steel. Since the maximumoperating temperature for the components in question is considerably less than 200'F (maximumoperating temperatures are 1250F for the letdown heat exchanger shell, 130'F for the chargingpump, and 1 000F for the monitor tank pump), a design temperature of 200'F provides adequatemargin. An increase in design temperature to 250'F would not provide any significant changesin equipment design and would not affect reactor safety.
If a significant leak develops in the letdown heat exchanger, such that the charging system isunable to maintain pressurizer water level, the letdown line isolation valves near the reactorcoolant loop will trip closed. The excess letdown path can then be placed in service whilemaintenance is performed on the letdown heat exchanger.
Mixed Bed Demincralizers
Two flushable mixed bed demineralizers maintain reactor coolant purity. A lithium-7 (or H+form) cation resin and a hydroxyl form anion resin are initially charged into thedemineralizers. Both forms of resin remove fission and corrosion products, and, in addition, thereactor coolant causes the anion resin to be converted to the borate form. The resin bed isdesigned to reduce the concentration of ionic isotopes in the purification stream.
Each demineralizer is sized to accommodate the normal letdown flow. One demineralizer servesas a standby unit for use if the operating demineralizer becomes exhausted during operation.
The demineralizer vessels are made of austenitic stainless steel, and are provided with suitableconnections to facilitate resin replacement when required. The vessels are equipped with a resinretention screen. Each demineralizer has sufficient capacity, after operation for one core cyclewith 1% defective fuel rods, to reduce the activity of the reactor coolant to refuelingconcentration.
Cation Bed Demincralizer
A flushable cation resin bed in the hydrogen form is located downstream of the mixed beddemineralizers and is used intermittently to control the concentration of lithium-7 which buildsup in the coolant from the B10 (n, a) Li7 reaction. The demineralizer also has sufficient capacityto maintain the cesium-137 concentration in the coolant below 1.0 gCi/cc with 1% defectivefuel. The demineralizer would be used intermittently to control cesium.
USAR- Rev. 189.2-13 11/01/2003

The demineralizer is made of austenitic stainless steel and is provided with suitable connectionsto facilitate resin replacement when required. The vessel is equipped with a resin retentionscreen.
Deborating Demineralizers
When required, two anion demineralizers remove boric acid from the Reactor Coolant Systemfluid. The demineralizers are provided for use near the end of a core cycle, but can be used atany time. Hydroxyl-form ion-exchange resin is used to reduce Reactor Coolant System boronconcentration. Facilities are provided for regeneration. When regeneration is no longer feasiblethe resin is flushed to the spent resin-shipping cask.
Each demineralizer can remove the quantity of boric acid that must be removed from the ReactorCoolant System to maintain full power operation near the end of core life without the use of theholdup tanks or evaporators.
Resin Fill Tank
The resin fill tank is used to charge fresh resin to the demineralizers. The line from the conicalbottom of the tank is fitted with a dump valve and may be connected to any one of thedemineralizer fill lines. The demineralized water and resin slurry can be sluiced into thedemineralizer by opening the dump valve. The tank, designed to hold approximately one-thirdthe resin volume of one mixed bed demineralizer, is made of austenitic stainless steel.
Reactor Coolant Filter
This filter collects resin fines and particulates larger than 25 microns from the letdownstream. The vessel is made of austenitic stainless steel, and is provided with connections fordraining and venting. Design flow capacity of the filter is equal to the maximum purificationflow rate. Disposable synthetic bag filter elements are used.
Volume Control Tank
The volume control tank collects the excess water, released from zero power to full power that isnot accommodated by the pressurizer. It also receives the excess coolant release caused by thedeadband in the reactor control temperature instrumentation. Overpressure of hydrogen gas ismaintained in the volume control tank to control the hydrogen concentration in the reactorcoolant at 25 to 50 cc per kg of water (standard conditions).
A spray nozzle is located inside the tank on the VCT inlet line coming from the reactor coolantfilter. This spray nozzle provides intimate contact to equilibrate the gas and liquid phases. Aremotely operated vent valve discharging to the Waste Disposal System permits removal ofgaseous fission products which are stripped from the reactor coolant and collected in thistank. Post-accident the volume control tank vents gaseous fission products to containment. Thevolume control tank also acts as a head tank for the charging pumps and a reservoir for the
USAR - Rev. 189.2-14 11/01/2003

leakage from the reactor coolant pump controlled-leakage seal. The tank is constructed ofaustenitic stainless steel.
Charging Pumps
Three charging pumps inject coolant into the Reactor Coolant System. The pumps are thevariable-speed positive-displacement type, and all parts in contact with the reactor coolant arefabricated of austenitic stainless steel and other material of adequate corrosionresistance. Special low-chloride packing is used in the pump glands. These pumps havemechanical packing followed by a leakoff to collect reactor coolant before it can leak to theoutside atmosphere. Pump leakage is piped to the RHR sump pump pit. The pump designprecludes the possibility of lubricating oil contaminating the charging flow, and the integraldischarge valves act as check valves.
Each charging pump has sufficient capacity (60 gpm) to compensate for normal letdownpurification flow (40 gpm) and No. 1 seal leakage (normally 3 gpm/pump) and, thus, maintainthe proper reactor coolant total inventory, temperature and pressure. Each pump is designed toprovide rated flow against a pressure equal to the sum of the Reactor Coolant System maximumpressure (existing when the pressurizer power operated relief valve is operating) and the piping,valve and equipment pressure losses of the charging system at the design charging flows.
A suction stabilizer and pulsation dampener have been installed on the inlet and discharge pipingof each of the three charging pumps. The installation significantly reduces vibration and stresslevels on the charging pumps.
One of the three charging pumps can be used to hydrotest the Reactor Coolant System. A smallmotor can be directly coupled to the pump for hydrostatic test purposes. A design changeremoved the small motor, and disconnected the power and control cables; however, the hydrotestcapability still exists.
Chemical Mixing Tank
The primary use of the chemical mixing tank is in the preparation of pH control chemicalsolutions and hydrazine for oxygen scavenging.
The capacity of the chemical mixing tank is determined by the quantity of 35% hydrazinesolution necessary to increase the concentration in the reactor coolant by 10 ppm. This capacityis more than sufficient to prepare the solution of pH control chemical for the Reactor CoolantSystem. The chemical mixing tank is made of austenitic stainless steel.
The mixing tank is provided with an orifice located in the reactor makeup water inlet line to limitthe flow rate through the tank as the solution is flushed to the charging pump suction. Theorifice is designed to pass the tank volume within 2.5 minutes by the reactor makeup waterpressure.
USAR -Rev. 189.2-15 11/01/2003
Demineralizer Letdown Pre-Filter
The filters, a normal and a bypass, collect particulates larger than 1 5 microns from the letdownstream before it enters the demineralizers. The vessels are made of austenitic stainless steel, andare provided with connections for draining and venting. Design flow capacity of each filter isequal to the maximum purification flow rate. Disposable filter elements are used.
Excess Letdown Heat Exchanger
The excess letdown heat exchanger cools reactor coolant letdown flow at a rate equal to thenominal injection rate through the reactor coolant pump labyrinth seal, if letdown through thenormal letdown path is blocked. The unit is designed to reduce the letdown stream temperaturefrom the cold-leg temperature to 1950F. The letdown stream flows through the tube side andcomponent cooling water is circulated through the shell side. All surfaces in contact with reactorcoolant are austenitic stainless steel and the shell is carbon steel. All tube joints arewelded. Flanges have been installed in the excess letdown line to the heat exchanger to permittube bundle removal.
Seal Water Heat Exchanger
The seal water heat exchanger removes heat from the reactor coolant pump seal water returningto the volume control tank and reactor coolant discharge from the excess letdown heatexchanger. Reactor coolant flows through the tubes and component cooling water is circulatedthrough the shell side. The tubes are welded to the tube sheet to prevent leakage in eitherdirection, which would result in undesirable contamination of the reactor coolant or componentcooling water. All surfaces in contact with reactor coolant are austenitic stainless steel and theshell is carbon steel.
The unit is designed to cool the excess letdown flow and the seal water flow to the temperaturenormally maintained in the volume control tank if all the reactor coolant pump seals are leakingat the maximum design leakage rate.
Seal Water Filter
The filter collects particulates larger than 25 microns from the reactor coolant pump seal waterreturn and from the excess letdown heat exchanger flow. The filter is designed to pass the sumof the excess letdown flow and the maximum design leakage from the reactor coolant pumpcontrolled-leakage seals. The vessel is constructed of austenitic stainless steel and is providedwith connections for draining and venting. Disposable synthetic filter cartridges are used.
Seal Water Injection Filters
Two filters are provided in parallel, each sized for the injection flow. They collect particulateslarger than 5 microns from the water supplied to the reactor coolant pump seal. The vessel isconstructed of stainless steel and the filter elements are disposable cartridges.
USAR -Rev. 189.2-16 11/01/2003

Boric Acid Filter
The boric acid filter collects particulates larger than 25 microns from the boric acid solutionbeing pumped to the charging pump suction line. The filter is designed to pass the design flowof two boric acid transfer pumps operating simultaneously and at high speed. The vessel isconstructed of austenitic stainless steel and the filter elements are disposable syntheticcartridges. Provisions are available for venting and draining the filter.
Boric Acid Tanks
The boric acid tank capacities are sized to store sufficient boric acid solution for refueling plusenough boric acid solution for cold shutdown shortly after full power operation is achieved. Inaddition, each tank has sufficient boric acid solution to achieve cold shutdown if the mostreactive RCCA is not inserted.
The concentration of boric acid solution in storage is maintained between 7.5 and 8.5% byweight (13,000 to 15,000 ppm boron) at a temperature of at least 1251F. Periodic manualsampling is performed and corrective action is taken, if necessary, to ensure that these limits aremaintained.
As a consequence, measured amounts of boric acid solution can be delivered to the reactorcoolant to control the chemical poison concentration. The combination overflow and breathervent connection has a water loop seal to minimize vapor discharge during storage of thesolution. The tanks are constructed of austenitic stainless steel.
Boric Acid Tank Heaters
Two 100% capacity electric immersion heaters located near the bottom of each boric acid tankare designed to maintain the temperature of the boric acid solution at nominal 1350F with anambient air temperature of 40'F. Thus ensuring a temperature in excess of the solubility limit(for 8.5% weight boric acid solution, crystallization occurs at 105'F). The temperature ismonitored and is alarmed (high and low temperature alarms) in the control room. The heatersare sheathed in austenitic stainless steel.
Batching Tank
The batching tank is sized to hold 6 days makeup supply of nominal 8.0% boric acid solution forthe boric acid tank. The basis for makeup is reactor coolant leakage of 1/2 gpm at beginning ofcore life. The tank is also used for solution storage. A local sampling point is provided for.verifying the solution concentration prior to transferring it to the boric acid tank.
A tank manway is provided, with a removable screen to prevent entry of foreign material. Inaddition, the tank is provided with an agitator to improve mixing during batching operation. The
USAR - Rev. 189.2-17 11/01/2003

tank is constructed of austenitic stainless steel and is not used to handle radioactivesubstances. The tank is provided with a steam jacket for heating the boric acid solution to 1 350F.
The source of heat for the steam-jacketed boric acid batching tank is the process steam.
The boric acid batching tank is not required under post-accident conditions, since the boric acidtanks or the refueling water storage tank are used to supply the borated water required for safeshutdown.
Boric Acid Transfer Pumps
Two centrifugal pumps with two-speed motors are used to circulate or transfer boric acid. Thepumps circulate boric acid solution through the boric acid tanks and inject boric acid into thecharging pump suction header.
Normally one pump is used for boric acid batching and transfer. Both pumps are used for boricacid injection. The design capacity of each pump is equal to the normal letdown flow rate. Thedesign head at high speed is sufficient, considering line and valve losses, to deliver rated flow tothe charging pump suction header when volume control tank pressure is at the maximumoperating value (relief valve setting). All parts in contact with the solutions are austeniticstainless steel and other adequately corrosion-resistant materials.
The enclosures around the Boric Acid Transfer Pumps are heated to prevent boric acidsolidification. Each pump is heated by two cartridge heaters installed in stainless steel blocksmounted to the base of the pump. The suction piping within the enclosure is heated by fin stripheaters located on the sides of the piping. The electrical configuration maintains train separationof the heaters for each pump.
The transfer pumps are operated either automatically or manually from the main controlroom. The reactor makeup control operates both pumps automatically at high speed when boricacid solution is required for makeup or boration.
Boric Acid Blender
The boric acid blender enhances thorough mixing of boric acid solution and reactor makeupwater from the reactor makeup supply circuit. The blender consists ofa conventional pipe elbowfitted with a perforated tube insert. All material is austenitic stainless steel. The blenderdecreases the pipe length required to homogenize the mixture.
Recycle Process
Holdup Tanks
Three holdup tanks contain radioactive liquid, which enters from the letdown line. The liquid isreleased from the Reactor Coolant System during startup, shutdown, and load changes and from
USAR - Rev. 189.2-18 11/01/2003

boron dilution to compensate for burnup. The contents of one tank may be processed by the gasstripper/boric acid evaporator package while another tank is available as a standby. The totalliquid storage capacity of the three holdup tanks is designed to meet the liquid dilution requiredto return to power from cold shutdown when the unit is at approximately 90% of core life. Thetanks are constructed of austenitic stainless steel.
The tanks utilize the gas decay tanks, with nitrogen as a backup, to prevent oxygencontamination.
Holdup Tank Recirculation Pump
The holdup tank recirculation pump is a centrifugal type used to mix the contents of a holduptank or transfer the contents of one holdup tank to another. The pump is sized to transfer thecontents of one tank to another in less than two hours. The wetted surface of this pump isconstructed of austenitic stainless steel.
Gas Stripper Feed Pumps
Two canned rotor centrifugal gas stripper feed pumps supply feed from a holdup tank to the gasstripper/evaporator train. The capacity of each pump is equal to twice the gas stripper/evaporatorcapacity. The non-operating pump is a standby and is available for operation in the event theoperating pump malfunctions. These centrifugal pumps are constructed of austenitic stainlesssteel.
Evaporator Feed Ion Exchangers
Three flushable evaporator feed ion exchangers remove cation contamination from the holduptank effluent. Experiments performed by Westinghouse indicate that the decontamination factorfor cesium (see Appendix D) is conservative. One ion exchanger has sufficient capacity tosupply the gas stripper/evaporator train. These ion exchangers may be operated in parallel orseries. Each vessel is constructed of austenitic stainless steel and contains a resin retentionscreen.
Ion Exchanger Filters
These filters collect resin fines and particulates from the evaporator feed ion exchanger. Thevessels are made of austenitic stainless steel and are provided with connections for draining andventing. Disposable synthetic filter cartridges are used. The design flow capacity is equal to theboric acid evaporator flow rate.
Boric Acid Evaporator/Gas Stripper Package
One boric acid evaporator/gas stripper package is provided to remove radioactive gases andconcentrate boric acid for reuse in the reactor coolant system.
USAR - Rev. 189.2-19 11/01/2003

Liquid effluent from the holdup tanks is preheated and then passed through the gas strippercolumn where dissolved and entrained gases are removed. The feed stream leaving the columnenters the evaporator where the water and boric acid is concentrated in the evaporator shell to anominal 8.0% weight boric acid solution and then pumped out. All liberated noncondensiblegases flow to the vent header.
The evaporator/gas stripper package consists of a feed pre-heater, vent condenser, strippingcolumn, evaporator, absorption tower, evaporator condenser, distillate cooler and the followingpumps: two evaporator concentrates pumps and two distillate pumps. The package also includesvalves, piping and associated component and process instrumentation.
All evaporator/gas stripper package equipment in contact with the process fluid is constructed ofaustenitic stainless steel.
Evaporator Condensate Deemineralizers
Two demineralizers remove the radioactive contaminants carried over with the evaporatorcondensate. When the resin is exhausted, it is flushed to the Waste Disposal System. Normallyone demineralizer is used as needed, with one available as a standby. The demineralizer vesselsare constructed of austenitic stainless steel.
Condensate Filter
A filter collects resin fines and particulates larger than 25 microns from the boric acid evaporatorcondensate stream. The required flow capacity of the filter is based on the boric acid evaporatorflow rate. The vessel is made of austenitic stainless steel and is provided with a connection fordraining and venting. Disposable synthetic filter elements are used. The design flow capacity ofthe filter is equal to the boric acid evaporator flow rate.
Monitor Tanks
The monitor tanks permit continuous operation of the evaporator train. When one tank is filled,the contents are analyzed and discharged to the Waste Disposal System. The monitor tanks canalso be filled by water from the makeup water treatment system. The monitor tank capacitypermits the continuous evaporator operation at 15 gpm and requires sampling and laboratoryanalysis three times per day. These tanks are constructed of austenitic stainless steel.
Monitor Tank Pumps
Two monitor tank pumps discharge water from the monitor tanks. Each pump is designed toempty a monitor tank in 1.5 hours. The pumps are constructed of austenitic stainless steel.
USAR - Rev. 189.2-20 11/01/2003

- -
Reactor Makeup Water Tanks
Two reactor makeup-water tanks contain liquid supplied from the makeup waterdemineralizers. The monitor tanks, after sampling has shown the liquid to be of proper qualityand acceptable radioactivity level, could be transferred to the reactor makeup tank, ifdesired. These stainless steel tanks serve as a source of Reactor Coolant System makeup water.
Reactor Makeup Water Pumps
Two reactor makeup water pumps serve as a supply source for the Reactor Coolant MakeupSystem. These austenitic stainless steel pumps take suction from the reactor makeup watertanks.
Concentrates Filter
A disposable synthetic cartridge type filter removes particulates larger than 25 microns from theevaporator concentrates. Design flow capacity of the filter is equal to the boric acid evaporatorconcentrates transfer pump capacity. The vessel is made of austenitic stainless steel.
Concentrates Holding Tank
The concentrates holding tank is sized to hold one batch of concentrates from operation of theevaporator. The tank is supplied with an electrical heater, which prevents boric acidprecipitation and is constructed of austenitic stainless steel.
Concentrates Holding-Tank Transfer Pumps
Two holding-tank transfer pumps discharge boric acid to the boric acid tanks or to the holduptanks for recycling.
Electrical Heat Tracing
Electrical heat tracing is installed under the insulation on all piping, valves, line-mountedinstrumentation, and components normally containing concentrated boric acid solution. The heattracing compensates for heat loss due to cooling and prevents boric acid precipitation. The heattracing system was designed in accordance with the following criteria:
1. 100% redundant and separate heat tracing systems are provided, with the exceptions that theconcentrates holding tank is equipped with a single immersion heater, and the boric acidbatching tank is steam heated.
2. The heat tracing system is designed to maintain the fluid temperature between 1250 F and1350F with an ambient air temperature of 40'F.
USAR - Rev. 189.2-21 11/01/2003

3. Each redundant heat tracing system is supplied from a separate power source connected tothe redundant emergency diesel generators.
4. Normally, only one heat tracing system is energized. Failure of the energized heat tracingsystem is annunciated in the control room. An automatic transfer of control from the primaryto the standby heat tracing system is achieved by energizing the redundant system bydifferent settings in the two separate control thermostats, such that on failure of the primarysystem, the standby system will pick-up automatically without reaching the low temperaturealarm setting.
5. The boric acid tanks are equipped with individual means of heating by immersion heaterssupplied, as in (3) above.
The lines and components of the Chemical and Volume Control System (CVCS) which areprovided with heat tracing or heater enclosures are shown in Figures 9.2-1 through 9.2-5.
The boric acid tanks, boric acid batching tank, and the concentrates holding tank are providedwith individual means of heating and need not be electrically heat traced.
Redundant electrical heat tracing is installed on all sections of the CVCS normally containingboric acid solution, to provide standby capacity ifthe operating section malfunctions. The powersupply for the redundant lines of heat tracing is connected to the diesel-powered buses to ensurecontinuous operation during a prolonged outage of normal power supplies.
The combination of electrical heat tracing and insulation maintains the temperature of the pipingand contents at 1250F to 135WF with an ambient air temperature of 40'F. Separate thermostaticcontrols are provided for each of the duplicate sets of heat tracing to maintain the temperaturewithin the specified control band. A high/low alarm is provided in the control room to warn offailure to maintain the normal temperature control band for the piping and equipment containingconcentrated boric acid solution. Transfer of control between the redundant heat tracing is anautomatic operation. Any single failure of a heat tracing line, heater controller or alarm will notresult in a reduction of temperature below the point where precipitation of concentrated boricacid might occur.
Valves
Valves for radioactive service that perform a modulating function are equipped with two sets ofpacking and an intermediate leakoff connection that discharges to the Waste DisposalSystem. Manual and motor operated valves larger than 2 inches for radioactive service, withfluids at temperatures above 212'F, also have an intermediate leakoff connection that dischargesto the Waste Disposal System. Globe valves are installed with flow over the seats when such anarrangement reduces the possibility of leakage. Basic material of construction is stainless steelfor all valves except the batching tank steam jacket valves, which are carbon steel.
USAR - Rev. 189.2-22 11/01/2003

Isolation valves are provided at all connections to the Reactor Coolant System. Lines with flowinto the reactor containment also have check valves inside the containment to prevent reverseflow from the containment.
Relief valves are provided for lines and components that might be pressurized above designpressure by improper operation or component malfunction. Pressure relief for the tube side ofthe regenerative heat exchanger, is provided by the check valve, which bypasses the charging lineisolation valve.
Piping
All CVCS piping handling radioactive liquid is austenitic stainless steel. All piping joints andconnections are welded, except where flanges arc required to facilitate equipment removal formaintenance.
9.2.3 SYSTEM DESIGN EVALUATION
Availability and Reliability
A high degree of functional reliability is assured in this system byproviding standby componentsand by assuring fail-safe response to the most probable mode of failure. Special provisionsinclude duplicate heat tracing (with alarm protection) of lines, valves, and components normallycontaining concentrated boric acid.
The system has three high-pressure charging pumps, each capable of supplying the normalreactor coolant pump seal and makeup flow.
The electrical equipment of the Chemical and Volume Control System is arranged so thatmultiple items receive their power from various 480-V buses as described in Section 8.
The two boric acid transfer pumps are powered from separate 480-V buses. One charging pumpand one boric acid transfer pump are capable of meeting cold shutdown requirements shortlyafter full-power operation. In cases of loss of a-c power, any charging pump and boric acidtransfer pump can be energized from diesel generator power.
Control of Tritium
The Chemical and Volume Control System is used to control the concentration of tritium in theReactor Coolant System. Essentially all of the tritium is in the chemical combination withoxygen as a form of water. Therefore, any leakage of coolant to the containment atmospherecarries tritium in the same proportion as it exists in the coolant. Thus, the level of tritium in thecontainment atmosphere, when it is sealed from outside air ventilation, is a function of tritiumlevel in the reactor coolant, the cooling water temperature at the cooling coils, which determinesthe dew point temperature of the air, and the presence of leakage other than reactor coolant as asource of moisture in the containment air.
USAR - Rev. 189.2-23 11/01/2003

There are two major considerations with regard to the presence of tritium:
a. Possible plantpersonnel hazardduringaccessto the containment. Leakage of reactorcoolantduring operation with a closed containment causes an accumulation of tritium in thecontainment atmosphere. It is desirable to limit the accumulation to allow containmentaccess.
b. Possible public hazard due to release of tritium to the plant environment.
Neither of these considerations is limiting in this plant.
The concentration of tritium in the reactor coolant is maintained at a level, which precludespersonnel hazard during access to the containment. This is achieved by discharging thecondensate from the boric acid recovery process via the plant circulating water discharge.
The uncertainties associated with estimating the amounts of tritium generated are discussed inAppendix D.
Periodic determinations of tritium concentrations will be made by liquid scintillation counting ofcondensed water vapor from the containment.
Leakage Prevention
Quality control of the material and the installation of the Chemical and Volume Control Systemvalves and piping, which are designated for radioactive service, is provided in order to essentiallyeliminate leakage to the atmosphere. The components designated for radioactive service areprovided with welded connections to prevent leakage to the atmosphere. However, flangedconnections are provided in each charging pump suction and discharge, on each boric acid pumpsuction and discharge, on the relief valves inlet and outlet, on three-way valves, on the flowmeters and elsewhere where necessary for maintenance.
The positive displacement charging pumps stuffing boxes are provided with leakoffs to collectreactor coolant before it can leak to the atmosphere. All valves which are larger than 2 inchesand which are designated for radioactive service at an operating fluid temperature above 212'Fare provided with a stuffing box and lantern leakoff connections. Leakage to the atmosphere isessentially zero for these valves. All control valves are either provided with stuffing box andleakoff connections or are totally enclosed. Leakage to the atmosphere is essentially zero forthese valves.
Diaphragm valves are provided where the operating pressure and the operating temperaturepermit the use of these valves. Leakage to the atmosphere is essentially zero for these valves.
USAR - Rev. 189.2-24 11/01/2003

Incident Control
The letdown line and the reactor coolant pumps seal water return lines penetrate the reactorcontainment. The letdown line contains two air-operated valves inside the reactor containmentupstream of the regenerative heat exchanger. Three parallel air-operated orifice block valvesinside the reactor containment and an air-operated valve outside the reactor containment areautomatically closed by the containment isolation signal.
The reactor coolant pump's seal water return line contains one motor-operated isolation valveoutside and one inside the reactor containment which are automatically closed by thecontainment isolation signal.
The two seal-water injection lines to the reactor coolant pumps and the charging line are inflowlines penetrating the reactor containment. Each line contains tvo check valves inside the reactorcontainment to provide isolation of the reactor containment if a break occurs in these linesoutside the reactor containment.
Malfunction Analysis
To evaluate system safety, failures or malfunctions were assumed concurrent with a loss-of-coolant accident and the consequences analyzed and presented in Table 9.2-4. As a result of thisevaluation, it is concluded that proper consideration has been given to plant safety in the designof the system.
If a rupture were to take place between the reactor coolant loop and the first isolation valve orcheck valve, this incident would lead to an uncontrolled loss of reactor coolant. The analysis ofloss-of-coolant accidents is discussed in Section 14.
Should a rupture occur in the Chemical and Volume Control System outside the containment, orat any point beyond the first check valve or remotely operated isolation valve, actuation of thevalve would limit the release of coolant and assure continued functioning ofthe normal means ofheat dissipation from the core. For the general case of rupture outside the containment, thelargest source of radioactive fluid subject to release is the contents of the volume controltank. The consequences of such a release are considered in Section 14.
When the reactor is sub-critical; i.e., during cold or hot shutdown, refueling, and approach tocriticality, the relative reactivity status (neutron source multiplication) is continuously monitoredand indicated by fission chambers counters and count rate indicators. Any appreciable increasein the neutron source multiplication, including that caused by the maximum physical borondilution rate, is slow enough to give ample time to start a corrective action (boron dilution stopand/or emergency boron injection) to prevent the core from becoming critical. See Section 14for a more complete discussion of boron dilution accidents.
At least three separate and independent flow paths are available for reactor coolant boration; i.e.,the charging line or through the two reactor coolant pump labyrinths. The malfunction or failure
USAR-Rev. 189.2-25 11/01/2003

of one component will not result in the inability to borate the Reactor Coolant System. Analternate flow path is always available for emergency boration of the reactor coolant. As backupto the boration system, the operator can align the refueling water storage tank outlet to thesuction of the charging pumps.
Concentrated boric acid can be injected into the reactor coolant system by means ofthe chargingpumps through two flow paths:
a) normal charging line (30 gpm), or
b) seal water supply lines to the two reactor coolant pumps while bypassing seal injection filters(8 gpm per pump 3 gpm of which leaks back into the CVCS and 5 gpm of which passes intothe RCS).
Each flow path is provided with a flow indicator.
Suction to the charging pumps can be delivered through three flow paths:
a) the blender and flow control valve,
b) a local manual valve path, or
c) an emergency boration path through the motor operated valve.
Each flow path is provided with a flow meter.
A letdown or charging line break would be indicated by excessive auto-makeup to the volumecontrol tank. A break in the charging line or upstream of the letdown orifices in the letdown linewould also resultin an increase in charging pump speed and a possible hi-speed alarm,depending on the break size. If the break size is such that the charging/letdown system is unableto maintain pressurizer water level, the letdown line isolation valves near the reactor coolant loopwould be tripped closed by a low level signal from the pressurizer level instrumentation(redundant valves and level channels are provided to insure letdown isolation in the event of asingle active failure).
In the event that the letdown line must be isolated, except in an emergency, the charging line isalso isolated to avoid thermal shocking of the charging line penetrations into the Reactor CoolantSystem. If the charging line must be isolated, the letdown line is also isolated to avoid flashingof the letdown stream as the pressure of the high temperature flow is reduced.
With the letdown and charging lines isolated, the Reactor Coolant System can be borated via thereactor coolant pump labyrinth seals by allowing the pressurizer water level to increase. Ifletdown of reactor coolant is necessary, the excess letdown line is capable of letting down a flowequivalent to the total labyrinth seal in-leakage from both reactor coolant pumps. As the systemis cooled down, makeup water to maintain pressurizer level would be provided through the
USAR - Rev. 189.2-26 11/01/2003
labyrinth seals. Therefore, the normal charging and letdown paths are not required to go to coldshutdown condition.
The minimum rate of injection of boric acid solution into the Reactor Coolant System is 10 gpmfrom the labyrinth seal leakage through each reactor coolant pump. With this injection rate andcharging not in service, the time necessary to borate the system sufficiently for a cold shutdownis approximately five hours at EOL. Normal charging capability is 40 gpm (30 gpm through thecharging line plus 10 gpm through the reactor coolant pump labyrinth seals), which can boratethe reactor coolant system to the concentration necessary for a cold shutdown in approximately1.5 hours. With the charging and letdown lines out of service, the length of time necessary tobring the reactor to cold shutdown conditions is increased by the three additional hours necessaryto reach the appropriate boron concentration as discussed above.
Concentrated boric acid is normally injected into the Reactor Coolant System by means of thecharging pumps which take suction from the boric acid tanks via the boric acid transferpumps. Each operation is considered in turn:
1. Concentrated boric acid can be delivered to the suction of the charging pumps using thefollowing paths:
a. Through the blender and flow control valve. For this operation the operator may read theflow meter and the boric acid tank level indicators.
b. Through a local manual valve path. For this operation the operator may read the flowmeter and the boric acid tank level indicators.
c. In the event that neither flow path "a" nor "b" is available, the operator would use theemergency boration path through the motor operated valve. For this emergencyoperation the operator may read the emergency path flow meter and the boric acid tanklevel.
2. The charging pumps can deliver concentrated boric acid into the Reactor Coolant System viathe following paths:
a. Normal charging line with flow meter.
b. Seal water supply lines to the two reactor coolant pumps while bypassing the sealinjection filters. If either path had to be used, local and Control Room flow indicatorswould indicate flow.
3. The Safety Injection pumps can also take a suction from the RWST and provide boratedwater to the RCS, when the RCS pressure is less than Safety Injection pump shutoffhead. The quantity of boric acid stored in the RWST is sufficient to achieve Cold Shutdownat any time during core life.
USAR - Rev. 189.2-27 11/01/2003

On loss of seal injection water to the reactor coolant pump seals, seal water flow can be re-established by manually starting a standby-charging pump. Even if the seal water injection flowis not immediately re-established, the plant can continue to operate temporarily. The thermalbarrier cooler has sufficient capacity to cool the reactor coolant flow which will pass through thethermal barrier cooler and seal package, as long as seal leakoff flow is > 2.5 gpm. If seal leakoffflow is < 2.5 gpm when normal seal injection flow is lost, there will be one to two hours ofslowly increasing temperatures before the pump's operating limits are reached.
With > 2.5 gpm seal leakoff flow from each pump's # I seal, long term operation is possible, butin order to protect the reactor coolant pump seals from prolonged flow of unfiltered reactorcoolant it is recommended that this condition be only temporary. The effect of continuousreactor coolant pump operation without injection water would be to possibly cause clogging ofthe #1 seal with the introduction of unfiltered water.
The thermal barrier-cooling coil is a complete backup to seal injection for cooling the reactorcoolant pump bearings and seals and no overheating would result from continued operationwithout seal injection water, provided the pump's #1 seal leakoff flow rate is > 2.5 gpm.
Galvanic Corrosion
The only type of materials which are in contact with each other in borated water are stainlesssteels, Inconel, Stellite valve materials and Zircaloy fuel element cladding. These material havebeen shown (Reference 1) to exhibit only an insignificant degree of galvanic corrosion whencoupled to each other.
For example, the galvanic corrosion of Inconel versus 304 stainless steel resulting from hightemperature tests (5750F) in lithiated, boric acid solution was found to be less than 20.9 mg/dm5for the test period of nine days. Further galvanic corrosion would be trivial since the cellcurrents at the conclusion of the tests were approaching polarization. Zircaloy versus 304stainless steel was shown to polarize in 1 800 F lithiated, boric acid solution in less than eight dayswith a total galvanic attack of 3.0 mg/dm5. Stellite versus 304 stainless steel was polarized inseven days at 5750F in lithiated boric acid solution. The total galvanic corrosion for this couplewas 0.97 mg/dm5.
As can be seen from the tests, the effects of galvanic corrosion are insignificant to systemscontaining borated water.
Fuel Element Failure Detection
Fuel element failure detection is achieved by monitoring the letdown flow, using channel R-9 ofthe Area Radiation Monitoring System (see Section 11.2). This channel consists of a fixedposition, gamma sensitive GM tube detector. The radiation level is indicated locally outside theLetdown Heat Exchanger Room and remotely in the Control Room where it is recorded. A highradiation alarm is displayed on the radiation monitoring panels in the Control Room andlocally. A remotely operated, long half-life radiation check source is provided. The source
USAR - Rev. 189.2-28 11/01/2003

strength is sufficient to produce an approximately one decade above background meterindication. The range of the channel is 0.1 mr/hr to 100 r/hr.
Delay time for the monitor in detecting fuel element failure ranges from approximately oneminute to approximately three minutes, depending on the letdown flow rate. At the maximumletdown flow rate (80 gpm), approximately 1.5 minutes will pass before the reactor coolant,contaminated by fission product release from the failed fuel element, will reach the monitor. Atnormal letdowvn rate (40 gpm), approximately three minutes will pass before the contaminatedflow reaches the detection area.
The monitor will detect the release of failed fuel element fission products against a backgroundof:
* N-16 source (assuming a sixty-second decay) -- 4.5E+l mr/hr* Nominal corrosion product sources -- I .IE+I mr/hr+ Previous fuel element defects -- Determined during operation
Fuel failure severity can be determined by relating any increase in radiation detected to acorresponding increase in either rod gap release of general fuel element defects:
* Percent fuel element defects -- 7.2E+l mr/hr+ Rod gap release - 3.2E+2 mr/hr
USAR -Rev. 1811/01/20039.2-29

REFERENCES - SECTION 9.2
1. WCAP 1844, "The Galvanic Behavior of Materials in Reactor Coolants", D. G. Sammarone,August 1961
USAR - Rev. 189.2-30 11/01/2003

9.0 AUXILIARY AND EMERGENCY SYSTEMS
The Auxiliary and Emergency Systems are supporting systems required to insure the safeoperation or servicing of the Reactor Coolant System (described in Section 4).
In some cases the dependable operation of several systems is required to protect the ReactorCoolant System by controlling system conditions within specified operating limits. Certainsystems are required to operate under emergency conditions.
The systems considered in this Section are:
* Chemical and Volume Control System
This system provides for boric acid injection, chemical additions for corrosion control,reactor coolant cleanup and degasification, reactor coolant makeup, reprocessing of waterletdown from the Reactor Coolant System, and reactor coolant pump seal water injection.
* Auxiliary Coolant System
This system provides for transferring heat from reactor plant coolant to the Service WaterSystem and consists of the following three systems:
1. The Residual Heat Removal System removes the residual heat from the core and reducesthe temperature of the Reactor Coolant System during the second phase of plantcooldown.
2. The Spent Fuel Pool Cooling System removes the heat generated by spent fuel elementsstored in the spent fuel pool.
3. The Component Cooling System removes heat from the Reactor Coolant System, via theResidual Heat Removal System, during plant shutdown, cools the letdown flow to theChemical and Volume Control System during power operation, and provides cooling todissipate waste heat from various reactor plant components and the boric acid and wasteevaporators.
* Sampling System
This system provides the equipment necessary to obtain liquid and gaseous samples from thereactor plant systems.
* Facility Service Systems
These systems include Fire Protection, Service Water, and Auxiliary Ventilation Systems.
Rev. 169.1-1 12/01/00

* Fuel Handling System
This system provides for handling fuel assemblies, Rod Cluster Control (RCC) assembliesand material irradiation specimens.
* Equipment and System Decontamination Processes
These procedures provide for the decontamination of equipment, tools, and personnel.
9.1 GENERAL DESIGN CRITERIA
Criteria, which are specific to one ofthe auxiliary or emergency systems are listed and discussedin the appropriate system design basis subsection below. Criteria which apply primarily to othersystems (and are discussed in other Sections) are also listed and cross-referenced below becausedetails of closely related systems and equipment are given in this Section.
9.1.1 RELATED CRITERIA
Reactivity Control Systems Malfunction
Criterion: The Reactor protection systems shall be capable of protecting against any singlemalfunction of the reactivity control system, such as unplanned continuouswithdrawal (not ejection or dropout) of a control rod, by limiting reactivitytransients to avoid exceeding acceptable fuel damage limits (GDC 3 1).
As described in Section 7 and justified in Section 14, The Reactor Protection Systems aredesigned to limit reactivity transients to DNBR > 1.30 due to any single malfunction in thedeboration controls.
Engineered Safety Features Performance Capability
Criterion: Engineered Safety Features such as the emergency core cooling system and thecontainment heat removal system shall provide sufficient performance capabilityto accommodate the failure of any single active component without resulting inundue risk to the health and safety of the public (GDC 41).
Each of the auxiliary cooling systems which serves an emergency function provides sufficientcapability in the emergency mode to accommodate any single failure ofan active component andstill function in a manner to avoid undue risk to the health and safety of the plant personnel andthe public.
Containment Heat Removal Systems
Criterion: Where an active heat removal system is needed under accident conditions toprevent exceeding containment design pressure this system shall perform itsrequired function, assuming failure of any single active component (GDC 52).
Rev. 169.1-2 12/01/00

Each ofthe auxiliary cooling systems, which serve as emergency function to prevent exceedingcontainment design pressure, provides sufficient capability in the emergency mode toaccommodate any single failure of an active component and still perform its required function.
Rev. 169.1-3 12/01/00

11.2 RADIATION PROTECTION
11.2.1 DESIGN BASIS
Monitoring Radioactivity Releases
Criterion: Means shall be provided for monitoring the containment atmosphere and thefacility effluent discharge paths for radioactivity released from normal operations,from anticipated transients, and from accident conditions. An environmentalmonitoring program shall be maintained to confirm that radioactivity releases tothe environs of the plant have not been excessive (GDC 17).
The containment atmosphere, the Containment System vent, the Auxiliary Building vent, theControl Room Ventilation System, the spent fuel pool heat exchanger service water discharge,the RHR pump pit ventilation exhaust, the condenser air ejector exhaust, the containment fan-coil service water discharge, blowdown from the steam generators, the component cooling water,and the Waste Disposal System liquid effluent are monitored for radioactivity concentrationduring normal operations, anticipated transients, and accident conditions. High radiation in anyof these is indicated and alarmed in the Control Room.
All gaseous effluent from possible sources of accidental radioactive release external to theReactor Containment (e.g., the spent fuel pool and waste handling equipment) is exhausted froman Auxiliary Building vent, which is monitored. All accidental spills of liquids are containedwithin the Auxiliary Building and collected in a sump.
For any leakage from the Reactor Containment under accident conditions, the Shield BuildingVentilation System provides dilution, holdup and filtration capability to minimize the dosecontribution. The AuxiliaryBuilding Special Ventilation System provides filtration capabilitiesfor the containment leakage, which bypasses the Shield Building Ventilation System.
The Plant Radiation Monitoring System supplemented by portable survey equipment providesadequate monitoring of radioactivity release. An outline of the procedures and equipment to beused in the event of an accident is presented in Section 11.2.3. The environmental monitoringprogram is described in Section 2.8.
Monitoring Fuel and Waste Storage Areas
Criterion: Monitoring and alarm instrumentation shall be provided for fuel and wastestorage and associated handling areas for conditions that might result in loss ofcapability to remove decay heat and to detect excessive radiation levels(GDC 18).
Monitoring and alarm instrumentation is provided for fuel and waste storage and handling areasto detect inadequate cooling and excessive radiation levels. Radiation monitors are provided to
USAR - Rev. 1811.2-1 11/01/2003

maintain surveillance over the release of radioactive gases and liquids, and the permanent recordof activity releases is provided by radiochemical and analysis of known quantities of waste.
The Spent Fuel Pool Cooling System loop flow is monitored to ensure proper operation, asdescribed in Section 9.
A controlled ventilation system removes gaseous radioactivity from the atmosphere of the fuelstorage and waste treatment areas of the Auxiliary Building and discharges it to the atmospherevia the Auxiliary Building vent. Radiation monitors arc in continuous service in these areas toactuate high radiation alarms, as described in Section 1 1.2.3.
Fuel and Waste Storage Radiation Shielding
Criterion: Adequate shielding for radiation protection shall be provided in the design ofspent fuel and waste storage facilities (GDC 68).
Auxiliary shielding for the Waste Disposal System and its storage components are designed tolimit radiation to levels not exceeding 1 mR/hr in normally occupied areas, to levels notexceeding 2.5 mR/hr in periodically occupied areas and to levels not exceeding 15 mR/hr incontrolled occupancy areas.
Gamma radiation is continuously monitored in the Auxiliary Building. High level signals arealarmed locally and annunciated in the Control Room.
Protection Against Radioactivity Release from Spent Fuel and Waste Storage Areas
Criterion: Provisions shall be made in the design of fuel and waste storage facilities suchthat no undue risk to the health and safety of the public could result from anaccidental release of radioactivity (GDC 69).
All waste handling and storage facilities are contained and equipment is designed so thataccidental releases directly to the atmosphere are monitored and will not exceed the applicableguidelines, as discussed in Sections 11.1.2, 14.2.2 and 14.2.3.
11.2.2 PRIMARY AND SECONDARY SHIELDING
Design Basis
Radiation shielding is designed for operation at maximum radiation levels at the site boundary tobelow those levels allowed for continuous non-occupational exposure. The plant is capable ofcontinued safe operation with 1% fuel element defects.
In addition, the shielding and containment provided ensure that in the unlikely event ofa DesignBasis Accident, the subsequent off-site radiation exposures will be below the guidelines of10 CFR 50.67.
USAR - Rev. 1811.2-2 11/01/2003

Sufficient shielding exists to limit essential equipment exposure and to provide adequate accessto vital areas necessary to aid in the mitigation of, or recovery from, a Design BasisAccident. Plant shielding was inspected by a NRC representative and found to satisfy therequirements of Item II.B.2 of NUREG-0737 (see NRC SER in reference 1). Operatingpersonnel at the plant are protected by adequate shielding, monitoring, and operatingprocedures. Each area in the plant is classed according to the dose rate allowable in the area,based on the expected frequency and duration of occupancy. All plant areas capable of personneloccupancy are classified as one of the five zones of radiation level listed in Table 11.2-1. TheRadiation Control areas are shown in Figures 11.2-1 through 11.2-4. Typical Zone 0 areas arethe Turbine Building and turbine plant service areas. Typical Zone I areas are the offices andControl Room. Zone II areas include the local control spaces in the Auxiliary Building and theoperating floor of the Containment during reactor shutdown. Areas designated as Zone IIIinclude the sample room, valve galleries, fuel-handling areas, and intermittently occupied workareas. Typical Zone IV areas are the shielded equipment compartments enclosing the gas decaytanks and volume control tanks in the Auxiliary Building, waste-container storage area, and theReactor Coolant loop compartments after shutdown.
All radiation and high radiation areas are appropriately marked and isolated in accordance with10 CFR 20 and other applicable regulations.
The shielding is divided into four categories according to function.
These functions include the primary shielding, the secondary shielding, the fuel handlingshielding, and auxiliary shielding.
Primary Shielding
The primary shielding is designed to:
* Reduce the neutron fluxes incident on the reactor vessel to limit the radiation-inducedincrease in transition temperature.
* Attenuate the neutron flux sufficiently to prevent excessive activation of plant components.* Limit the gamma flux in the reactor vessel and the primary concrete shielding to avoid
excessive temperature gradients or dehydration of the primary concrete shield.* Reduce the residual radiation from the core, reactor internals and reactor vessel to levels
which will permit access to the region between the primary and secondary shields after plantshutdown.
* Reduce the radiation leakage contribution to obtain optimum division of the shieldingbetween the primary and secondary shields.
Secondary Shielding
The main function of the secondary shielding is to attenuate the radiation originating in thereactor and the reactor coolant. The major source in the reactor coolant is the Nitrogen-16
USAR - Rev. 1811.2-3 11/01/2003

activity, which is produced by neutron activation of oxygen, during passage of the coolantthrough the core. The secondary shielding limits the full power radiation levels outside thecontainment building to less than 1 mR/hr. The secondary shield also ensures that the designradiation levels are not exceeded following a Design Basis Accident.
Fuel Handling Shielding
The fuel handling shielding permits the safe removal and transfer of spent fuel assemblies androd cluster control assemblies (RCCAs) from the reactor vessel to the spent fuel pool. It isdesigned to attenuate radiation from spent fuel, RCCAs, and reactor vessel internals to less than2.5 mR/hr at the refueling cavity water surface and less than 1.0 mR/hr in the Auxiliary Building.
Auxiliary Shielding
The function of the shielding is to protect personnel working near various system components inthe Chemical and Volume Control System, the Residual Heat Removal System, the WasteDisposal System and the Sampling System. The shielding provided for the Auxiliary Building isdesigned to limit radiation levels to less than I mR/hr in normally occupied areas, and at orbelow 2.5 mR/hr in periodically occupied areas. Additional shielding has been provided andequipment has been relocated to minimize exposures to personnel and equipment wherenecessary.
Shielding Design
Primary Shielding
The primary shielding consists of the reactor internals, the reactor vessel wall, and a concretestructure surrounding the reactor vessel.
The primary shielding immediately surrounding the reactor pressure vessel consists of areinforced concrete structure extending from the base of the containment to a height of69.0 feet.. The lower portion of the shield is a minimum thickness of 7.0 feet of concrete and isan integral part of the main structural concrete support for the reactor vessel. It extends upwardto the operating floor, forming a portion of the refueling cavity. This cavity is approximatelyrectangular in shape, and has concrete sidewalls, which are 5 feet 5 inches thick adjacent to areasin which fuel is transported.
The primary concrete shielding is air cooled to prevent overheating and dehydration from theheat generated by radiation absorption in the concrete. Eight "windows" have been provided inthe primary shield for insertion of the out-of-core nuclear instrumentation. Cooling for theprimary shield concrete, nuclear instrumentation, and vessel supports is provided by circulating12,000 cfm of containment air between the reactor vessel wall and the surrounding concretestructure. The primary shield neutron fluxes and design parameters are listed in Table 11.2-2.
USAR - Rev. 1811.2-4 11/01/2003

Secondary Shielding
The secondary shield surrounds the Containment, the reactor coolant loops and the primaryshield. It consists of interior walls within the Containment, the operating floor, and the ShieldBuilding. The Shield Building also serves as the accident shield.
The total thickness of concrete provided for this function in the area above grade is 5 feet 8inches. Of this, approximately 3 feet 2 inches is concrete wall inside the Containmentimmediately surrounding the reactor coolant loops and 2 feet 6 inches is in the Shield Buildingwall. This shielding reduces the radiation intensity at the outside surface of the Shield Buildingto a negligible level during normal plant operation.
The Shield Building consists of the 2 foot 6 inch reinforced concrete cylinder capped by ashallow, reinforced concrete dome 2 feet thick. Supplemental shielding has been provided forthe Containment penetrations where required. Section 5 contains a detailed discussion of theShield Building. The secondary shielding design parameters are listed in Table 11.2-3. Theequipment access hatch is shielded by a 2 foot 6 inch thick concrete shadow shield. The controlroom is protected with concrete sidewalls 2 feet thick, and a concrete roof 2 feet thick.
The accident shielding design parameters are listed in Table 11.2-4.
Fuel Handling Shielding
The refueling cavity is formed by the upper portions of the primary shield concrete and othersidewalls of varying thicknesses. A portion of the cavity is used for storing the upper and lowerinternals packages. These are shielded with concrete walls 5 feet thick. The remaining wallsvary from 4 feet to 6 feet thick, and provide the shielding required for handling spent fuel.
The refueling cavity, flooded with borated water to a height of 40 feet 2 inches during refuelingoperations, provides a temporary water shield above the components being withdrawn from thereactor pressure vessel. The water height during refueling is approximately 24 feet above thereactor pressure vessel flange. This height ensures that a minimum of 10 feet of water will beabove the top of a withdrawn fuel assembly. Under these conditions, the radiation level is lessthan 50 mRlhr at the water surface.
The spent fuel assemblies and RCCAs are remotely removed from the reactor containmentthrough the horizontal spent fuel transfer tube and placed in the spent fuel pool. Concrete, 5 feetthick, shields the spent fuel transfer tube. This shielding is designed to protect personnel fromradiation during the time a spent fuel assembly is passing through the main concrete support ofthe Containment and the transfer tube.
Radial shielding, during fuel transfer is provided by the water and concrete walls of the fueltransfer canal. An equivalent of 6 feet of concrete is provided to insure a radiation level of1.0 mR/hr in the Auxiliary Building areas adjacent to the spent fuel pool.
USAR - Rev. 1811.2-5 11/01/2003
Spent fuel is stored in the spent fuel pool, which is located adjacent to the Containment. Radialshielding for the spent fuel is provided by 5-foot thick concrete walls. The pool is flooded withborated water to a level such that the normal water height above the stored fuel assemblies isapproximately 25 feet.
The fuel handling shielding design parameters are listed in Table 11.2-5.
Auxiliary Shielding
The auxiliary shield consists of concrete walls around certain components and piping whichprocess reactor coolant. In some cases, the concrete block walls are removable to allowpersonnel access to equipment during maintenance periods. Each equipment compartment isindividually shielded so those compartments may be entered without having to shut down theadjacent system for any reason.
The primary shield material provided throughout the Auxiliary Building is concrete. Theprincipal auxiliary shielding provided is tabulated in Table 11.2-6.
11.2.3 RADIATION MONITORING SYSTEM
The Radiation Monitoring System provides continuous radiological surveillance of plant systemand working areas. The system performs the following basic functions:
* Warns operating personnel of radiological health hazards, such as abnormal radiation fields.* Provides warning of plant malfunctions, which could lead to plant damage and/or
radiological hazards.* Prevents or minimizes inadvertent releases of radioactivity to the environment via automatic
action capability.* Provides monitoring of controlled radiological plant releases.
Radiation detection instruments are located in areas of the plant, which house equipmentcontaining or processing radioactive fluid. These instruments continually detect, compute, andrecord operating radiation levels. If the radiation level should rise above the set point for anychannel, an alarm is initiated in the Control Room or Radiation Protection Office. Somechannels also alarm locally. In stipulated cases, the alarm signal also provides the necessarysignal for automatic process controls (e.g., valve closure, damper isolation, etc.). The RadiationMonitoring System operates in conjunction with regular and special radiation surveys and withchemical and radiochemical analyses performed by the plant staff. Adequate information andwarning is thereby provided for the continued safe operation of the plant and assurance thatpersonnel exposure does not exceed the limits of 10 CFR 20.
Two high range detectors are located in the containment. These two-containment areamonitoring channels are the only components in the Radiation Monitoring System designed tooperate following a major loss-of-coolant accident.
USAR - Rev. 18 |11.2-6 11/01/2003

The components of the Radiation Monitoring System are designed according to the followingenvironmental conditions:
* Temperature - an ambient temperature range as specified in Table 11.2-8.* Humidity - 0 to 95% relative humidity.* Pressure - Components in the Auxiliary Building and Control Room are designed for normal
atmospheric pressure. Area Monitoring System components inside the Containment aredesigned to withstand containment test pressure.
* Radiation - Process and area radiation monitors are of a non-saturating design so that they"peg" full scale if exposed to radiation levels at over full-scale intensities. Critical processmonitors are located in areas where the normal and post-accident background radiation levelswill not affect their usefulness.
The Radiation Monitoring System consists of two types of components, the Process monitors andthe Area monitors.
+ The Process Radiation Monitoring System refers to those radiation monitors capable ofanalyzing fluid (air or water) flow for indication of increasing radiation levels.
* The Area Radiation Monitoring System monitors the direct radiation in various areas of theplant or indication of increasing radiation levels.
The Environmental Radiation Monitoring Program, as described in the RadiologicalEnvironmental Monitoring Manual (REMM), monitors radiation in various areas surrounding theplant. (This is described in Section 2.8.)
Main Process Radiation Monitoring System
The Main Process Radiation Monitoring System is designed to provide information to plantpersonnel on:
* Radioactivity levels present in fluid (air and water) systems.* Leakage across boundaries of closed systems.* Radioactivity concentrations in liquid and gaseous flow paths that lead to release from the
plant.
In conjunction with the design functions spelled out above, the system is capable of initiatingautomatic actions designed to prevent or minimize any inadvertent/uncontrolled release ofradioactivity to the environment.
The Main Process Monitoring System consists of 13 channels of monitoring equipment, 9 of,which are equipped with some level of automatic action upon receipt of a high radiationalarm. Seven of the 13 channels perform engineered safety related functions. The Main ProcessMonitoring System consists of the following:
USAR - Rev. 1811.2-7 11/01/2003

Process Monitors
+ R- 1I Containment System vent (Air Particulate)+ R-12 Containment System vent (Radioactivity Gas)* R-13 Auxiliary Building vent A* R-14 Auxiliary Building vent B* R-15 Condenser air ejector+ R-16 Containment fan coil water* R-17 Component Cooling System (Liquid Effluent)+ R-18 Waste Disposal System (Liquid Effluent)* R-19 Steam gen. blowdown (Liquid Sample)* R-20 Service Water System* R-21 Containment System vent (Activity)* R-22 Residual heat removal pump pit+ R-23 Control Room vent
The channels are capable of operational verification via the use of check sources that are eitherincorporated into the detector housing or externally mounted. In addition, there are alarmsprovided for channel failure and high radiation conditions. The alarms are indicated both at theindividual radiation monitor meter panel and on the main annunciator panel, as well as via theannunciator audible alarm. The radiation level is indicated by a meter and can be recorded onmultipoint recorders. Tables 11.2-7 and 11.2-8 contain the channel data pertinent to eachdetector.
Certain process radiation monitors also utilize flow alarms, which alert the operator or technicianto an abnormal flow situation in the process stream. Non-interruptible power for the system isprovided via inverters off the 125 V d-c supply.
Each channel contains a completely integrated modular assembly, which includes the following:
a. Level Amplifier
Amplifies and discriminates the detector output pulse to provide a discriminated and shapedpulse output to the log level amplifier.
b. Log Level Amplifier
Accepts the shaped pulse of the level amplifier output, performs a log integration (convertstotal pulse rate to a logarithmic analog signal). The analog signal is then converted to adigital signal that provides output for suitable indication and recording.
USAR - Rev. 1811.2-8 11/01/2003

c. Power Supplies
Three separate duel power supplies are used to power the control room equipment 1) Areamonitor, 2) Train A Process Monitors and 3) Train B Process Monitors. The field equipmentis powered by its associated control room supply.
d. Test-Calibration Circuitry
These circuits provide a predetermined value that pulses an LED into the NAI crystal thatgenerates a signal to perform a channel test, and a solenoid-operated radiation check sourceto verify the channel's operation.
e. Radiation Level Meter
This meter, mounted on the assembly drawer, has a scale calibrated logarithmically in countsper minute in the ranges from IE+1 to IE+7.
f. Indicating Lights/Annunciators
These lights indicate high, alert and normal radiation alarm levels and a channel failure. Anannunciator on the main control board is actuated on high and alert radiation signals andcheck source active, channel failure, high/low flow (process skids) and power supply failure.
g. Bistable Circuits
Several bistable circuits are provided, to alarm on high and alert radiation (actuation pointmay be set at any level over the range of the instruments), check source active, high/low flowand channel failure.
h. A remotely operated long-half-life radiation check source is furnished in each channel. Theenergy emissions are similar to the radiation energies being monitored. The source strengthis sufficient to indicate approximately one decade above background.
The Process Radiation Monitoring System consists of the following radiation monitoringchannels:
Containment or Containment System Vent - Air Particulate Monitor (R-11)
This monitor is provided to measure air particulate gamma radioactivity in the Containment withthe ability to alternately monitor the Containment purge exhaust. This application ensures thatthe release rate during purging is maintained below specified limits.
High radiation level for the channels initiates closure of the Containment purge supply andexhaust duct valves.
USAR - Rev. 1811.2-9 11/01/2003

This monitor has a measuring range of 1.06E-12 to 1.06E-6 giCi/cc.
This channel takes a continuous air sample from either the Containment atmosphere, or the purgeexhaust. The sample is drawn from the Containment discharge ductwork through a closed,sealed system monitored by a scintillation counter - filter paper detector assembly. The filterpaper collects particulate matter greater than I micron in size, on its constantly moving surface,and is viewed by a Beta Plastic-scintillation detector. In the case of the purge exhaust anisokinetic nozzle is used to obtain a representative sample. The sample is returned either to theContainment purge exhaust or the Auxiliary Building exhaust, after it passes through the seriesconnected (R-12) gas monitor.
The detector assembly is in a completely enclosed housing. The pulse signal is transmitted to theRadiation Monitoring System panels in the Control Room. Lead shielding is provided to reducethe background level to where it does not interfere with the detector's sensitivity. The filter papermechanism, an electromechanical assembly which controls the filter paper movement, isprovided as an integral part of the detector unit.
Containment or Containment System Vent - Radiogas Monitor (R-12)
This monitor is provided to measure gaseous gamma radioactivity in the Containment, and toensure that the radiation release rate during purging is maintained below specified limits. Highgas radiation level initiates closure of the Containment purge supply and exhaust duct valves.
This monitor has a measuring range of 4.31 E-7 to 4.3 I E-1 I Ci/cc.
A continuous air sample is taken from the Containment atmosphere or the purge exhaust after itpasses through the air particulate monitor, and draws the sample through a closed, sealed systemto the gas monitor assembly. The sample is constantly mixed in the fixed, shielded volume,where it is counted by a scintillation detector sensitive to both gamma and beta activity. Thesample is then returned to the Containment, the Containment System vent or the AuxiliaryBuilding exhaust.
The detector assembly is in a completely enclosed housing mounted in a constant volume gascontainer. Lead shielding is provided to reduce the background level to a pointwhere it does notinterfere with the detector's sensitivity. The detector output is transmitted to the RadiationMonitoring System Panels in the Control Room.
The Containment airparticulate and radioactivity gas monitors (R-1 1 and R-12) have assembliescommon to both channels. They are described as follows:
a. The flow control assembly includes a pump unit and selector valves that provide arepresentative sample (or a "clean" sample) to the detector.
b. The pump unit consists of:* A pump to obtain the air sample.
USAR -Rev. 1811.2-10 11/01/2003

* A flowmeter to indicate the flow rate.* A mass flow controller control valve to provide flow adjustment.* A flow alarm assembly to provide low and high flow alarm signals
c. Selector valves are provided to direct the desired sample to the detector for monitoring and toblock flow when the channel is in maintenance or "purging" condition.
d. A pressure sensor is provided to protect the system from high-pressure transients. This unitautomatically closes the inlet and outlet valves upon a high-pressure condition.
e. Detector purging is accomplished with a valve control arrangement whereby the normalsample flow is blocked and the detector purged with a "clean" sample. This facilitatesdetector calibration by establishing the background level and aids in verifying sample activitylevel.
f. The flow control panel in the Control Room radiation monitoring racks permits remoteoperation of the flow control assembly. By operating a sample selector switch on the controlpanel, either the Containment or the Containment System vent sample may be monitored.
Alarm lights are actuated by the following:
* Flow alarm assembly (low or high flow)* The pressure sensor assembly (high pressure)* The filter paper sensor (paper drive malfunction)* The pump power control switch (pump motor on)
Containment System Vent Air Activity Monitor (R-21)
The Containment System vent air activity monitor is designed primarily as a backup to theR-l IIR-12 detector systems. ShouldR-I I/R-12 be out of service,R-21 allows Containment airsampling and radioactivity analysis to be performed. This monitor system continuouslymonitorsthe Containment vent for iodine, particulate, and gas activity. The detector system consists of asample line and pump. The vent air is drawn through a fixed particulate filter, a charcoal filter,and an off-line gas monitor in series. The off-line gas monitor is a scintillation detector sensitiveto both gamma and beta activity.
The sample tank design provides a cyclonic airflow around the detector axis to precludestagnancy within the sensing volume. The detector output is transmitted to the RadiationMonitoring System panels in the Control Room.
The charcoal filter for this channel is for measuring the accumulation of iodine isotopeactivity. The particulate filter is for the collection of particulate activity such as Cs-134 andCs-137. Analysis of these filters is accomplished in the Count Room. These filters additionallyserve to protect the sensitive sample volume chamber of the radiogas detector.
USAR - Rev. 1811.2-11 11/01/2003

A high radiation alarm provides a closure signal to the Containment purge supply and exhaustvalves. This monitor has a measuring range of 4.3 IE-7 to 4.3 1E-1 [tCi/cc.
During routine fuel handling within Containment, ventilation air discharge passes throughparticulate filters. This discharge is monitored by two redundant Radiation Monitoring Systemchannels (R12 and R21). An alarm by either of these channels will initiate containmentventilation isolation. Manual realignment is subsequently required to place the system back intooperation utilizing the charcoal filters.
During these operations there is direct communication between the refueling group and theControl Room. If a fuel assemblywere damaged during handling, the physical configuration ofthe duct system requires a 65-foot free air transport of the radioactivity to the duct entrancebefore release from Containment. This assures a reasonable interval between the time of initialrelease and discharge to the environment. In view of this, the most probable mechanism forContainment isolation would be manual activation by the Control Room upon request from therefueling group, rather than through the aforementioned automatic Containment IsolationSystem.
Considering the least probable case of containment isolation initiated by the RadiationMonitoring System, the large transport distance would preclude highly concentrated puffs. Theresponse time for system isolation by radiation alarm is about four seconds, which includes theeffects of signal delay. This limits the potential for a significant release before isolation.
Auxiliary Building Vent Monitors (R-13, R-14)
The Auxiliary Building vent monitors are used to monitor the Auxiliary Building vent flowpathon a continuous basis. The detectors are used to measure airborne radioactivity in the air as it isdischarged out the stack. An off-line sampler is used to monitor and sample the AuxiliaryBuilding vent stack. Upon receipt of a high radiation alarm, the system performs the followingfunctions:
a. Shuts down normal Auxiliary Building ventilation.
b. Activates the Special Zone Auxiliary Building ventilation.
c. Initiates isolation of all normal ducting to the Auxiliary Building vent stack.
d. Closes the waste gas decay tank gas release valve.
e. Reroutes RI 1/12 sample exhaust flow from Auxiliary Bldg. vent to Containment.
f. Isolates the 2" containment depressurization line and stops the 2" containmentsupplyblower.
USAR- Rev. 1811.2-12 11/01/2003

g. Automatically diverts the Spent Fuel Pool Ventilation System exhaust through its charcoalfilter banks.
h. Automatically isolates the Waste Gas Analyzer via redundant isolation valves MG(R)-560,MG(R)-561, MG(R)-562 and MG(R)-563.
An impedance matching circuit is used to match the signal source to the coaxial cable andtransmit an alarm signal to the Control Room, where it is recorded on multipoint recorders andalarms on high activity.
Additionally, a sampler consisting of an isokinetic nozzle inserted in the vent to provide arepresentative sample to series connected particulate and charcoal collection filters isincluded. The charcoal filter is used for the accumulation of iodine isotope activity. Theparticulate filter is used for the collection of particulate activity such as Cs-134 and Cs-137.
Remote indication and annunciation are provided on the Waste Disposal System controlboard. A high level alarm shuts down normal ventilation fans, except Spent Fuel PoolVentilation System fans; activates the Auxiliary Building Special Ventilation System; divertsexhaust from the Spent Fuel Pool Ventilation System through charcoal filter banks; initiatesisolation of all ducting to the Auxiliary Building vent, with the exception of the Special ZoneVentilation discharge and the Spent Fuel Pool Ventilation discharge; and closes the gas releasevalve of the gas decay tanks.
This monitor has a measuring range of 4.31E-7 to 4.3 1E-I iCi/cc.
Condenser Air Ejector Gas Monitor (R-15)
The condenser air ejector gas monitor is used to monitor the condenser air ejector discharge flowpath on a continuous basis. The condenser air ejector discharges to the Auxiliary Building ventstack for HEPA filtration prior to release. The detector consists of a gamma scintillation tubeplaced in-line in the discharge flow path. The detector is designed to measure the gammaactivity of the non-condensable gases removed by the air ejector. A high alarm on R-1 5 initiatesautomatic action to ensure that the three-way control valve located in the air ejector dischargeheader is aligned to the Auxiliary Building vent stack. Since the plant is normally run in thismode, a high alarm will not normally affect this valve. The high alarm also initiates closure ofthe steam generator blowdown sample isolation valves and the steam generator blowdownisolation valves.
A gamma sensitive scintillation detector is inserted into a drywell in an in-line fixed volumecontainer, which includes adequate shielding to reduce the background radiation to where it doesnot interfere with the detector's maximum sensitivity. This monitor has a measuring range of2E-7 to 5E-3 giCi/cc.
USAR - Rev. 1811.2-13 11/01/2003

Control Room Ventilation Monitor (R-23)
This channel continuously monitors the Control Room environment for an indication of airborneactivity entering through the ventilation system. The detector is a beta-sensitive plasticscintillator that is mounted in the air supply duct.
Readout is in the Control Room on multipoint recorders and at a rate meter station with high-lowalarm setting. High alarm circuits actuate the necessary dampers and fans to isolate the ControlRoom environment and recirculate the air through a PAC filtering system. Redundant air intakesarc provided to allow for any makeup requirement.
This monitor has a measuring range of 4.3 1E-7 to 4.3 I E- I pCi/cc.
Residual Heat Removal Pump Pit Monitor (R-22)
This monitor provides continuous monitoring of the exhaust air from the RHR pump pits forindication of pump leakage while circulating liquid containing high gaseous activity.
The detector is a beta-sensitive plastic scintillator mounted directly in an off-line sampler. Thesample volume chamber design provides a cyclonic airflow through the detector to precludestagnation within the sensing volume. The detector output is transmitted to the RadiationMonitoring System panels in the Control Room. The detector has a measuring range of 4.31 E-7to4.31E-I gCi/cc.
A high radiation alarm alerts the operator so that a timely transfer to the standby pump may bemade. No automatic action is initiated by a high alarm, but operator action is assumed to occur ifan RHR pump is leaking..
Containment Fan Coil Water Monitor (R-16)
The containment fan coil unit water monitor is designed to monitor the fan coil cooling water(service water) discharge for gamma activity. The fan coil cooling water discharge returns to thelake via the Circulating Water System. The detector system consists of a gamma-sensitivescintillation detector mounted in an in-line sample chamber. The sample chamber receives acontinuous sample from the fan coil discharge headers. One sample line is connected to thedischarge header from the IA and IB fan coil units, with a similar arrangement for the IC andID units. A high alarm requires operator action to sequentially isolate each of the four fan coilunits in order to determine the faulted unit.
The range of this monitor is 4E-8 to 5E-2 ptCi/ml.
Component Cooling System Liquid Monitor (R-17)
This channel continuously monitors the Component Cooling System for radiation indicative of aleak of reactor coolant from the Reactor Coolant System and/or the Residual Heat Removal
USAR - Rev. 1811.2-14 11/01/2003

System to the Auxiliary Coolant System. The detector system consists of an in-line T-typemonitor located in the pumps discharge header downstream ofthe I A and I B component coolingwater heat exchangers.
The range of this monitor is 4E-8 to 5E-2 ltCi/ml.
Waste Disposal System Liquid Effluent Monitor (R-18)
This channel continuously monitors all Waste Disposal System liquid releases from theplant. Automatic valve closure action is initiated by this monitor to prevent further release aftera high radiation level is indicated and alarmed. The detector assembly consists of a scintillationdetector located in-line in the discharge header of the IA and lB waste condensatepumps. Remote indication and annunciation are provided on the Waste Disposal System localcontrol board and in the Control Room.
The range of this monitor is 4E-8 to 5E-2 glCi/ml.
Steam Generator Blowdown System Liquid Sample Monitor (R-19)
This channel monitors the liquid phase ofthe secondary side of the steam generator for radiation,which would indicate a primary-to-secondary system leak, providing backup information to thecondenser air ejector gas monitor. Samples from the bottom of each of the two steam generatorsare mixed in a common header and the common sample is continuously monitored by ascintillation counter and sample volume chamber assembly. Upon indication of a high radiationlevel, each steam generator is individually sampled in order to determine the source. Thissequence is achieved by manually selecting the desired steam generator to be monitored.
The steam generator blowdown and air ejector radiation monitors are interconnected, such thateither monitor isolates the blowdown and reroutes the air ejector exhaust.
A high radiation signal closes the isolation valves in the blowdown lines and sample lines.
The range of this monitor is 4E-8 to 5E-2 plCi/ml.
Service Water Monitor (R-20)
This channel continuously monitors the service water return path from the spent fuel pool andcomponent cooling heat exchangers. A scintillation counter and sample volume chamberassembly monitors these effluent discharges. An increase above ambient radiation levels wouldindicate a leak across one of these heat exchangers and selective component isolation would thenbe used to locate the malfunction.
System readout is in the Control Room on multipoint recorders, a rate meter station in theControl Room with a high-low alarm setting, and a rate meter station at the detector location. Ahigh level alarm is annunciated in the Control Room.
USAR - Rev. 1811.2-15 11/01/2003

The range of this monitor is 4E-8 to 5E-2 gCi/ml.
In channels R-16, R-17, R-18, R-19 and R-20 a photo-multiplier tube scintillation crystal (Na-I)combination, mounted in a hermetically sealed unit, is used for liquid effluent radiationactuation. Lead shielding is provided to reduce the background level so it does not interfere withdetector's sensitivity. The inline fixed volume container is an integral part of the detectorunit. In channel R-17, the detector is inserted into a dry well in the Component Cooling Systempiping.
Auxiliary Process Radiation Monitoring System
The Auxiliary Process Monitoring System consists of two sets of components, which have beeninstalled since plant construction. The motivating force behind many of the additional monitorswas the result of lessons learned from TMI-2. These components have been installed for thepurpose of an expanded, more reliable radiation monitoring capability (see NRC Order and NRCSERs in references 2, 3, and 4).
The first set of components is a group of eight high and low radiation monitors. These monitorsare area-type monitors, which have been installed on the outside of process flow piping. A pairof monitors, one high range and one low range, are located on the outside of the containmentvent ducting, the Auxiliary Building vent ducting, main steam IA piping, and main steam IBpiping. Each detector has a local readout and Control Room readout, with recorders also locatedin the Control Room. These radiation monitors are as follows:
Channel Area MonitorR-3 1 Steam line IA (low range)R-32 Steam line IA (hi range)R-33 Steam line 1B (low range)R-34 Steam line lB (hi range)R-35 Auxiliary building vent (low range)R-36 Auxiliary building vent (hi range)R-37 Containment building vent (low range)R-38 Containment building vent (hi range)
The second set of components are a pair of SPING4 monitors. The SPING-4 is a self-containedmicroprocessor-based radiation detection system used to monitor for particulate, iodine, andnoble gas activity in the air. The two SPING4 Process Monitors are installed off-line in thecontainment vent stack and the Auxiliary Building vent stack. All SPING system detectors aretied to the central control consoles for monitoring of each SPING4 stack process monitor, whichcontains nine individual detectors. The two SPING-4 Process Monitors and the nine individualdetectors are as follows:
Channel Area Monitor01 Auxiliary Building vent ducting (SPING-4)
USAR - Rev. 1811.2-16 11/01/2003

Address Code01-0101-0201-0301-0401-0501-0601-0701-0801-09
DetectorBeta particulateAlpha particulateIodineIodine backgroundLo-range gasGamma area monitorMid-range gasGas backgroundHi-range gas
Channel02
Area MonitorContainment building vent ducting (SPING-4)
Address Code02-0102-0202-0302-0402-0502-0602-0702-0802-09
DetectorBeta particulateAlpha particulateIodineIodine backgroundLo-range gasGamma area monitorMid-range gasGas backgroundHi-range gas
Information from the SPING- process monitors is available at either of the central controlconsoles, which are located in the Radiation Protection Office and the Radiological AnalysisFacility in the Technical Support Center.
Area Radiation Monitoring System
There are three area radiation monitoring systems providing continuous radiological surveillanceof critical plant systems and work areas. Detectors are located in Containment, the AuxiliaryBuilding and the Technical Support Center. The system provides operating personnel with earlywarning of certain plant malfunctions which might lead to a radiological health hazard or plantdamage.
The General Area Radiation Monitoring System consists of eight channels, which monitorradiation levels to various areas of the plant. These are as follows:
ChannelR-lR-2R-4
Area MonitorControl RoomContainment (by personnel hatch)Charging pump room
USAR - Rev. 1811/01/2003 l11.2-17

Channel Area MonitorR-5 Fuel handling areaR-6 Sampling roomR-7 In-Core instrument seal table areaR-9 Reactor coolant letdown lineR-10 New fuel pit (criticality monitor)
Each channel consists of a fixed position gamma sensitive GM tube or ion chamber (R-5, R-10)detector. The detector output is amplified and the log count rate is determined by the integralamplifier at the detector. The radiation level is indicated locally at the detector, and in theControl Room where it is recorded.
High radiation alarms are displayed on the radiation monitoring panels in the Control Room, andat the detector location. The Control Room annunciator provides a single window, which alarmsfor any channel detecting high radiation. Verification of which channel has alarmed is made atthe Radiation Monitoring System panels. A remotely operated, long half-life radiation checksource is provided in each channel. The source strength is sufficient to produce anapproximately one decade above background meter indication. Tables 11.2-7 and 11.2-8 containthe channel data pertinent to each detector.
The computer-indicator module amplifies the radiation level signal, as computed by the low-level amplifier, for indication and recording. The module also provides controls for actuation ofthe channel check source.
A meter is mounted on the front of each computer indicator module and is calibratedlogarithmically from 0.1 mR/hr to 100 R/hr for channels R-1 through R-10.
Radiation Monitoring System panel alarms consist of an indicator light for high radiation and alight to annunciate detector failure or loss of signal. The remote meter and alarm assembly at thedetector contains a red indicator light that is actuated on high radiation. The criticality monitorwill actuate a special evacuation alarm in the required areas.
The second area Radiation Monitoring System consists of seven channels (R-25 through R-30and R-39) which were installed after six years of operation as a result of needs identified throughexperience. The original equipment supplier was Eberline. One detector, R-30, is an ionchamber. The remainder are all GM tube-type detectors. Local indication is available near thedetectors. A local alarm is available only on channel R-30.
Remote indication is not available and trend data are not recorded for the following channels:
Channel Area MonitorR-25 Rad-waste drum areaR-26 SGBT ion exchange filter roomR-27 Spent resin storage tank roomR-28 Compacted drum storage area
USAR -Rev. 1811.2-18 11/01/2003

ChannelR-29R-30R-39
Area MonitorSGBT monitor tank roomReactor cavity sump CSludge intercept filter area
The third Auxiliary Area Radiation Monitoring System consists of23 channels. This system wasinstalled as a result of lessons learned after TMI and NRC requirements. The original equipmentsuppliers were Eberline and General Atomic. The detectors are ion chambers and energycompensated GM tubes. Local readout is available at field mounted data acquisition modules(DAM) and two central control consoles. An additional, five portable cart mounted beta airmonitors can be tied into the system and can be read out at either central control console. Highradiation alarms are displayed at the two central control consoles. Historical data is stored at thedata acquisition modules via a microcomputer. Two recorders in the Control Room are providedfor the wide range containment monitors (R40 and R4 1). These two monitors are designed tooperate in a post-LOCA environment. The Auxiliary Area Radiation System consists of thefollowing:
Address Code03-0103-0203-0304-0104-0204-0304-0405-0105-0205-0306-0106-0206-0306-0406-0507-0107-0207-0308-0108-0208-03
Instrument Number29064012906501
Area MonitorWaste disposalPost accident sampling roomComponent cooling heat exchangerMachine ShopMonitor roomMake-up demineralizerI&C Storage AreaRHR pump pitRadwaste compactorAuxiliary building loading dockI & C ShopShield building vent filtersControl Room A/C vent filtersContainment ventilation exhaust filtersZone SV exhaust filtersRAF count roomTechnical Support CenterTechnical Support Center StairwellSulfuric acid storage tankContainment spray pumpsHeating boiler
Area MonitorsIB contaim-nent hi level radiation monitor (R-41)IA containment hi level radiation monitor (R-40)
USAR - Rev. 1811/01/200311.2-19

Main Steam Line Primary to Secondary Leakage Monitors (R-42, R43)
These two channels continuously monitor the N-I 6 (nitrogen) concentration in both of the mainsteam lines using detectors, which are placed just outside of containment. In 2001, R-42 wasinstalled near main steam I A and R-43 was installed near main steam I B. No automatic actionsor automatic controls are associated with either of these channels. These channels will providean early indication of primary to secondary leakage similar to R-15 and R-19. Installation ofthese channels will meet the EPRI PWR Primary-To-Secondary Leak Guidelines(TR-104788-R2).
Radiation Monitoring System-Control Room Panel
All of the control room system equipment for one unit is centralized in three panels. Highreliability and ease of maintenance are emphasized in the design of this system. Sliding channeldrawers are used for rapid replacement of units, assemblies and entire channels. It is possible tocompletely remove the various chassis from the panels.
Recording
Data from each of the Control Room monitors is recorded by an electrical storage device.
Monitor Ranges
The ranges of the radiation monitors are given in Table 11.2-7 Calibration curves showing countrate versus radiation activity (jiCi/cc) are provided for all isotopes to be measured.
Operating Conditions
Table 11.2-8 indicates the detector operating condition during normal operation. Where fluidtemperature is too high for the monitor, a cooling device is included. The different operatingtemperature ranges are within the design limits of the sensors.
Radiation Protection Program
Personnel Monitoring
A permanent record of accumulated total effective dose equivalent (TEDE) exposure received byindividuals is maintained per 10 CFR 20 requirements. TEDE is the sum of the deep-doseequivalent (DDE) and the committed effective dose equivalent (CEDE). DDE exposures areprovided by the interpretation of TLD chips. Electronic dosimeters, or in some cases self-reading dosimeters, provide day-by-day indication of DDE exposure.
All persons who are required to be monitored are issued beta-gamma TLD badges and arerequired to wear such badges at all times while within the radiologically controlled areas of theplant. Personnel who are issued TLD badges pick them up prior to entry into the radiologically
USAR - Rev. 1811.2-20 11/01/2003

l
controlled area and deposit them after leaving the radiologically controlled area at the RadiationProtection Office.
Special or additional TLD badges are issued at the discretion of Radiation Protection personnel.
The TLD badges are processed on a routine basis at specified intervals. Badges are processedimmediately whenever it appears that an over exposure may have occurred, or any time deemednecessary by Radiation Protection personnel.
An electronic dosimeter or a self-reading dosimeter is issued for entry into the RadiologicallyControlled Area in addition to a TLD badge for individuals whose work conditions make a day-to-day indication of exposure desirable. Electronic dosimeters require the Radiological workerto sign in on the assigned Radiation Work Permit (RWP) using control stations outside of theRadiation Protection Office (RPO). If self-reading pocket dosimeters are used they are read,recorded and re-zeroed regularly and are issued for entry into the RCA when deemed necessaryby Radiation Protection. Electronic dosimeters are reset by signing out on the control stationslocated outside the RPO. Dosimeter and TLD records furnish the exposure data for theadministrative control of radiation exposure.
Personnel Bio-Assay Program
The Personnel Bio-Assay Program at the KewauneeNuclearPowerPlant consists ofwhole-bodycounting and Passive Monitoring with a portal monitor. Whole body counts are made for selectpersonnel routinely exposed to radioactive materials.
Personnel Protection Equipment
Personnel entering the radiologically controlled area are required to wear protective clothing asrequired by the radiation work permit. The nature of the work to be done and the conditions ofthe area are the governing factors in the selection of protective clothing to be worn byindividuals.
Personnel Respiratory Protection
The Kewaunee Nuclear Power Plant is designed to minimize concentrations of airborneradioactivity due to inadvertent leaks, spills or other causes by filtered ventilation systems andisolation of equipment in compartments. Further, a radiation protection program is provided tominimize airborne concentrations by detecting and controlling potential sources of airborneradioactivity. The normal concentrations present in areas occupied by personnel are much lessthan the derived air concentrations (DACs) and the use of respiratory protection equipment isnormally not necessary.
Usage of respiratory protection devices will be evaluated under unusual situations arising fromplant operations to limit CEDE (i.e. TEDE) below IOCFR20 requirements. When it is notpracticable to apply process or other engineering controls to control the concentrations of
USAR - Rev. 1811.2-21 11/01/2003

radioactive material in the air, consistent with maintaining the TEDE ALARA, the necessaryprotective devices will be specified and monitored by radiation protection personnel.
Three general types of respiratory protective equipment are utilized in the respiratory protectionprogram. The type used for a particular circumstance is determined by the concentration in theair and the protection factor needed to prevent personnel from breathing or being exposed toairborne radioactivity in excess of that specified by 10 CFR 20, Section 20.1201.
The three general types of respiratory protective equipment intended for use are:
a. Air-Purifying Respirators
These units are utilized for protection against airborne particulates only.
b. Atmosphere Supplying, Air-Line Respirators
These units provide protection from radioactive particulates, gases and vapors. Theserespirators use the plant's Service Air System to supply a filtered and regulated source ofbreathing air to either a full-face piece or hood.
c. Atmosphere Supplying, Self-Contained Breathing Apparatus (SCBA)
These respirators utilize back mounted compressed air cylinders to supply a full-face piece inthe pressure-demand mode of operation. The SCBA provides protection against radioactiveparticulates, gases and vapors and may also be used in atmospheres considered ImmediatelyDangerous to Life or Health (IDLH).
A Cascade System consisting of large cylinders of compressed air exists for refilling the SCBAcylinders on an as-needed basis.
After each use, non-disposable respirators are cleaned and sanitized before being reissued. TheRadiation Protection Group cleans, maintains and controls the use of all respiratory protectionequipment. Decontaminating and sanitizing agents are utilized which prevent damage to sealingsurfaces and transparent face pieces. Following air drying, the respirators are checked forradioactive contamination and re-cleaned or disposed of if necessary. Each respirator is thenvisually inspected for mechanical degradation, and stored in a clean, sealed plastic bag.
Routine maintenance on respiratory equipment is performed, as the need becomes apparentthrough visual inspection following cleaning. For SCBA respirators, the ability to provide asufficient, regulated air supply is periodically tested. For airline respirators, the quality of thebreathing air is also periodically tested by analyzing samples of the Service Air System.
Each individual whose work requires the use of respiratory protection is trained in propermethods of donning and use of the various types of equipment. Initial training is done bytraining group personnel. At this time, individual problems, such as interference with sealing
USAR - Rev. 1811.2-22 11/01/2003

due to eyeglasses, will become apparent. Periodic retraining is done by the training group basedon an individual's need for respiratory equipment use.
In accordance with 29 CFR 1910.134, a Licensed Health Care Professional performs evaluationsof medical fitness for individuals requiring the use of respiratory protectiveequipment. Quantitative mask fit tests are administered annually.
If prolonged use of respiratory equipment is necessary, personnel are relieved at reasonableintervals such that usage of the equipment does not endanger personnel or discourage observanceof proper work and safety procedures.
Action Levels
Arcas are posted as Airborne Radioactivity Areas whenever an individual present could exceed,during the hours in a week, an intake of 0.6% of an ALI or 12 DAC-hrs. ALI and DAC valuesare given in Table I of Appendix B of 10 CFR 20.
The use of respirator protection devices will be evaluated pursuant to 10 CFR 20.1702 consistentwith maintaining the TEDE ALARA. When respirators are deemed necessary, 10 CFR 20.1703shall govern their proper usage.
Facilities and Access Provisions
The plant site is divided into various areas depending on radiation and/or contamination levelspresent.
The Clean Area includes all areas in the plant, which are not designated as the RadiologicallyControlled Area and have radiation and contamination levels within the limits set for the CleanArea.
The Radiologically Controlled Area includes all areas in the plant in which radiation and/orcontamination levels or the potential of such levels exist above those limits as stated for theClean Areas. All entrances to the Radiologically Controlled Areas are posted as such and limitedto emergency access only. Normal entry to and exit from the Radiologically Controlled Area isthrough the designated Radiation Protection Office (RPO) only.
Exclusion Areas include all areas within the Radiologically Controlled Areas found to havelevels of radiation and/or contamination above those specified for Radiologically ControlledAreas. These are Radiation, High Radiation, Very High Radiation, Airborne Radioactivity,Contaminated, and Radioactive Materials Areas. Each area is posted with its respective sign andrequirements.
The Unrestricted Area includes all property owned by WPS immediately adjacent to andsurrounding the Restricted Area. Normal environmental radiation and control procedures applyhere.
USAR-Rev. 1811.2-23 11/01/2003

The general arrangement of the service facilities is designed to provide adequate personneldecontamination and change areas.
Locker rooms are used to store items of personal clothing not required or allowed in theRadiologically Controlled Area. A supply of various protective clothing items for personnel ismaintained within the RCA.
Personnel contamination monitors are located outside the Radiation Protection Office (RPO).All personnel are required to survey themselves on leaving the Radiologically Controlled Area.
A decontamination shower and wash sink are located adjacent to the RPO. Decontaminationfacilities are described in Section 9.7.3.
The fuel storage area has facilities to handle the decontamination of large items ofequipment. The decontamination area contains service facilities.
All visitors to the RCA are required to wear electronic dosimeters, or in some cases, self-readingdosimeters, TLD badges, or be provided with an escort having personnel monitoring devices.
Administrative and physical security measures are employed to prevent unauthorized entry ofpersonnel to any High Radiation Area. These measures include the following:
Personnel are restrained from entry by locks, interlocks, or similar devices that alert the ControlRoom of entries into High Radiation Areas (giving exposure rates greater than1000 mREM/hr). Administrative control requires the issuance of a Radiation Work Permit(RWP) prior to entry to any High Radiation Area.
a. Any individual or group of individuals entering a High Radiation Area is provided with aradiation-monitoring device, which continuously indicates the radiation, dose rate in the area.
b. Personnel are required to wear protective clothing as designated by Radiation Protectionpersonnel for entry into a contaminated area.
Normal access into the Radiologically Controlled Area is through electronic dosimeter (ED)activated turnstiles. Workers are required to sign onto an RWP using the sign-on terminals.After the system activates the ED, the workers proceed through the turnstiles. The ED must beturned on to activate the turnstile. Radiation protection personnel can provide guidance andreview applicable RWP requirements.
Instrumentation
Laboratory facilities are provided for the Radiation Protection Group. These facilities includeboth laboratory and calibration rooms. A Counting Room is equipped to analyze routine airsample and contamination swipe surveys. The Radiation Protection Office (RPO) also serves as
USAR -Rev. 1811.2-24 11/01/2003
a central location for portable radiation survey instruments, respiratory protection equipment andcontamination control supplies.
The survey equipment is supplemented with radioanalytical instrumentation located in theCounting Room and Radioanalytical Facility. Portal monitors are located in the SecurityBuilding as a final check on all personnel leaving the plant.
The types of portable radiation survey instruments available for routine monitoring functions areadequate for the performance of the surveys required by 10 CFR Part 20.
Survey and radioanalytical instruments are periodically calibrated. Calibration and maintenancerecords are recorded for each instrument.
11.2.4 EVALUATION
The whole body gamma dose in the Control Room under accident conditions is calculatedassuming TID-14844 releases of the following sources to reactor containment:
* 100% of the noble gases* 50% of the halogens* 1% of the nonvolatile fission product inventory.
The above sources tabulated in Table 11.2-11 are assumed to be homogeneously distributedwithinthe freevolume ofthe Containment. The source intensityinMevperphotonasafunctionof time after the accident is determined by considering decay only; no credit is taken for filtrationor wash down.
The direct dose (deep dose equivalent) in the Control Room due to the activity dispersed withinthe Containment is calculated by a digital computer program, which is based on a point kernelattenuation model. The source region is divided into a number of incremented source volumesand the associated attenuation, gamma ray buildup, and distance through regions between eachsource point and the control room are computed. The summation of all point sourcecontributions gives the total direct dose (deep dose equivalent) in the Control Room.
In addition to the direct dose (deep dose equivalent), the contribution of scattered radiation wasalso estimated. These estimates indicate that scattered radiation levels will contribute less than10% ofthe direct dose (deep dose equivalent). Scattered radiation levels include both scatteringfrom air (sky-shine) and scattering from large surfaces in the vicinity of the Control Room.
Without any credit for intervening walls and structures, the integrated four-week deep doseequivalent (forty hours per week) to Control Room operators would be less than 2.5 REM. Thisincludes contributions from the Control Room.
Further study (Reference 7) has shown that the maximum thirty-day doses would be:
USAR - Rev. 1811.2-25 11/01/2003

* Whole Body Dose (y) = 1.9 REM* Beta Skin Dose (f) = 57 REM* Thyroid Dose = 27 REM*
* Although not credited in the above study, in an effort to prevent a post-accident IN VIVO doseto the thyroid glands of operating personnel, iodide can be made available to personnel early inthe accident scenario. This medication, when taken six hours prior to an exposure to radioiodine,gives a minimum protective effect of 97% with respect to the localization of radioiodine in thehuman thyroid. The medication can be taken safely by most humans at 130 mg/day forapproximately ten days.
These dose estimates were determined using input assumptions found in Section 14.3.5 andReference 7.
While the halogen release is lower than the original estimates, it is consistent with currentindustry findings based on the post-TMI-2 investigations (Reference 6).
All components necessary for the operation of the external recirculation loop following a loss-of-coolant accident are capable of remote manual operation from the Control Room and can bepowered by the diesel generators so that it should not be necessary to enter the AuxiliaryBuilding in the vicinity of the recirculation loops.
To determine the possible exposure that an operator could receive under accident conditionswhile operating a manual backup item (e.g., valve), it is estimated rather conservatively that itwill require fifteen minutes to operate the valve. In addition, it is assumed that an additionalfifteen minutes is required to get to and from the manual equipment. The total integrated wholebody deep dose equivalent that an operator would receive performing the above operation wouldbe about 8 REM. This exposure is calculated at one-half hour following the accident andassumes that the equipment being operated or serviced is adjacent to the Shield Building. Thebasis for such a calculation relating to the RHR System are given in Figures 11.2-5 and 11.2-6.Exposures in the vicinity of equipment located within the Auxiliary Building would be much lessdue to the shielding afforded by intervening walls and structures in the Auxiliary Building.
Hazards due to the radioactive halogen gas exposure to operators in the Control Room during thecourse of a loss-of-coolant accident is minimized by providing a Control Room air conditioningsystem that filters all incoming air and is capable of internal recirculation within the ControlRoom to minimize the amount of outside air drawn into the Control Room. In the event of highradiation level in the Control Room ventilating air, makeup air from outside is shut off, andabsolute and charcoal filters are placed in service on the recirculating air stream. The ControlRoom ventilating fans are supplied by emergency power.
If maintenance on the loop is required, such operations would be limited in duration. Theradiation levels adjacent to equipment containing the sump water and fission products could beas high as 200 to 300 REM per hour shortly after the initiation of recirculation. Any emergency
USAR - Rev. 1811.2-26 11/01/2003

maintenance operations described above could be carried out using portable breathing equipmentto limit the inhalation hazard.
11.2.5 MINIMUM OPERATING CONDITIONS
All liquid waste releases are continuously monitored for gross activity during discharge to ensurethat the activity concentration limits are below those specified in 10 CFR 20 for unrestrictedareas.
11.2.6 TESTS AND INSPECTIONS
Complete radiation surveys were made throughout the Containment and Auxiliary Buildingduring initial phases ofplant start up. Survey data was taken and compared with levels at powerlevels of 0.01%, 1 0% and 100% of rated full power. Survey data were reviewed for conformancewith design levels before increasing to the next power range. The 100% power readings arerepeated after each refueling outage to ensure no degradation of shielding has occurred.
The radiation monitors are tested in accordance with the surveillance frequencies specified in theTechnical Specifications and Offsite Dose Calculation Manual (ODCM).
USAR - Rev. 1811.2-27 11/01/2003

REFERENCES - SECTION 11.2
1. NRC Safety Evaluation Report, SA Varga (NRC) to CW Giesler (WPS), Letter No. K-83-12dated January 12, 1983
2. NRC Order, SA Varga (NRC) to CW Giesler (WPS), LetterNo. K-83-59 dated March 14,1983
3. NRC Safety Evaluation Report, MB Fairtile (NRC) to DC Hintz (WPS), Letter No. K-85-14dated January 9, 1985
4. NRC Safety Evaluation Report, SA Varga (NRC) to DC Hintz (WPS), Letter No. K-85-7 datedJanuary 2, 1985
5. DELETED
6. "Iodine- 131 Behavior During the TMI-2 Accident" NSAC/30, Nuclear Safety Analysis Center,September 1981
7. Kewaunee Updated Control Room Habitability Evaluation Report, Letter from CR Steinhardt(WPS) to NRC Document Control Desk, dated February 28, 1989
11.2-28USAR -Rev. 18
11/01/2003

14.3 REACTOR COOLANT SYSTEM PIPE RUPTURES (LOSS OF COOLANTACCIDENT)
General
Condition III - Infrequent Faults
By definition, Condition III occurrences are faults which may happen very infrequentlyduring the life of the plant. They will be accommodated with the failure of only a smallfraction of the fuel rods although sufficient fuel damage might occur to preclude resumptionof the operation for a considerable outage time. The release of radioactivity will not besufficient to interrupt or restrict public use of those areas beyond the exclusion radius. ACondition III fault will not, by itself, generate a Condition IV fault or result in aconsequential loss of function of the Reactor Coolant System or of containment barriers.
The time sequence of events for the small breaks is shown in Table 14.3-la andTable 14.3-lb presents the results of the analysis.
Condition IV - Limiting Faults
Condition IV occurrences are faults which are not expected to take place, but are postulatedbecause their consequences would include the potential for the release of significant amountsof radioactive material. These are the most drastic occurrences which must be designedagainst, and they represent limiting design cases. Condition IV faults are not to cause afission product release to the environment resulting in an undue risk to public health andsafety in excess of guideline values of 10 CFR 50.67. A single Condition IV fault is not tocause a consequential loss of required functions of systems needed to cope with the faultincluding those of the Emergency Core Cooling System and the containment.
The analysis of total effective dose equivalent (TEDE) doses, resulting from events leadingto fission product release, appears in Section 14.3.5. The fission product inventories, whichform a basis for these calculations are presented in Appendix D. Sections 14.3.4, 14.3.5 andAppendix H also include the discussions of systems interdependency contributing to limitingfission product leakage from the containment following a Condition IV occurrence.
The time sequence of events for a large break is shown in Table 14.3.2-8 andFigure 14.3.2-1, and Table 14.3.2-9 presents the results of these analyses.
14.3.1 LOSS OF REACTOR COOLANT FROM SMALL RUPTURED PIPES OR FROMCRACKS IN LARGE PIPES WHICH ACTUATES EMERGENCY CORE COOLINGSYSTEM
Identification of Causes and Accident Description
A loss-of-coolant accident is defined as a rupture of the Reactor Coolant System piping or ofany line connected to the system. See Section 4.1.3 for a more detailed description of the
USAR - Rev. 1814.3-1 11/01/2003

loss of reactor coolant accident boundary limits. Ruptures of small cross sections will causeexpulsion of the coolant at a rate which can be accommodated by the charging pumps whichwould maintain an operational water level in the pressurizer permitting the operator toexecute an orderly shutdown. The coolant, which would be released to the containment,contains the fission products existing in it.
Should a larger break occur, depressurization of the Reactor Coolant System causes fluid toflow to the Reactor Coolant System from the pressurizer resulting in a pressure and leveldecrease in the pressurizer. Reactor trip occurs when the pressurizer low-pressure tripsetpoint is reached. The Safety Injection System is actuated when the appropriate setpoint isreached. The consequences of the accident are limited in two ways:
1) Reactor trip and borated water injection complement void formation in causing rapidreduction of nuclear power to a residual level corresponding to the delayed fission andfission product decay,
2) Injection of borated water ensures sufficient flooding of the core to prevent excessiveclad temperature.
Before the break occurs the plant is in an equilibrium condition, i.e., the heat generated in thecore is being removed via the secondary system. During blowdown, heat from decay, hotinternals and the vessel continues to be transferred to the Reactor Coolant System. The heattransfer between the Reactor Coolant System and the secondary system may be in eitherdirection depending on the relative temperatures. In the case of continued heat addition tothe secondary side, system pressure increases and steam dump may occur. Makeup to thesecondary side is provided by the auxiliary feedwater pumps. The safety injection signalstops normal feedwater flow by closing the main feedwater line isolation valves and initiatesemergency feedwater flow by starting auxiliary feedwater pumps. As discussed in Section6.6, manual initiation of auxiliary feedwater is acceptable at low power levels. Thesecondary flow aids in the reduction of Reactor Coolant System pressure. When the RCSdepressurizes to 700 psig, the accumulators begin to inject water into the reactor coolantloops. Reactor coolant pump trip is assumed to be coincident with the reactor trip and effectsof pump coast-down are included in the blowdown analyses.
Analysis of Effects and Consequences
Method of Analysis
The requirements of an acceptable ECCS Evaluation Model are presented in Appendix K of10 CFR 50 (Reference 1). The requirements of Appendix K regarding specific modelfeatures were met by selecting models, which provide a significant overall conservatism inthe analysis. The assumptions made pertain to the conditions of the reactor and associatedsafety system equipment at the time that the LOCA occurs and include such items as the corepeaking factors, the containment pressure, and the performance of the ECCS system. Decayheat generated throughout the transient is also conservatively calculated as required byAppendix K of 10 CFR 50. The small break Loss-of-Coolant Accident analysis is
USAR - Rev. 1814.3-2 11/01/2003

documented in KNPP Steam Generator Replacement and Tave Operating Window ProgramLicensing Report, November 2000.
Small Break LOCA Analysis Using NOTRUMP
The Westinghouse NOTRUMP Small Break Evaluation Model consists of the NOTRUMPand SBLOCTA computer codes. NOTRUMP is used to model the system hydraulics andSBLOCTA calculates the fuel rod cladding heatup.
The postulated small break LOCA is predominately a gravity dominated accident in whichthe slow draining of the RCS is accompanied by the formation of distinct mixture levelsthroughout the RCS. These mixture levels vary with time and are dependent upon thetransient two-phase transport of mass and energy, which takes place within the RCS duringthe course of the accident. Consequently, the degree of accuracy with which a system modelis capable of simulating the RCS response to a small break LOCA is dependent upon themodel's capability to accurately model the RCS transient mass and energy distribution.
For postulated LOCAs due to small breaks the NOTRUMP computer code is used tocalculate the transient depressurization of the RCS as well as to describe the mass andenthalpy of flow through the break. The NOTRUMP computer code is a state-of-the-art one-dimensional general network code incorporating a number of advanced features. Amongthese are calculation of thermal non-equilibrium in all fluid volumes, flow regime-dependentdrift flux calculations with counter-current flooding limitations, mixture level tracking logicin multiple-stacked fluid nodes and regime dependent heat transfer correlation. TheWestinghouse NOTRUMP Small Break Evaluation Model was developed to determine theRCS response to design basis small break LOCAs, and to address NRC concerns expressedin NUREG-061 1, "Generic Evaluation of Feedwater Transients and Small BreakLoss-of-Coolant Accident in Westinghouse-Designed Operating Plants".
NOTRUMP (Reference 2 and 3) is a general one-dimensional nodal network computer codewhich describes the spatial detail of the RCS with a network of fluid nodes (representingvarious system fluid volumes), flow links (representing various fluid flow paths), metalnodes (representing various metal masses), and heat transfer links (representing various heattransfer paths between metal structures and surrounding fluid). The use of NOTRUMP in theanalysis involves, among other things, the representation of the reactor core as heated controlvolumes with an associated phase separation model to permit a transient mixture heightcalculation. The broken loop and intact loop are each modeled explicitly. Transient behaviorof the system is determined from the governing conservation equations of mass, energy andmomentum. The multi-node capability of the program enables explicit, detailed spatialrepresentation of various system components which, among other capabilities, enables aproper calculation of behavior of loop seal during a postulated small break LOCA.
Peak clad temperature calculations are performed with the SBLOCTA code (Reference 4),using the NOTRUMP calculated core pressure, fuel rod power history, uncovered core steamflow and mixture heights as boundary conditions. The code evaluates the fuel cladding andthe coolant temperatures during the hypothetical small break LOCA. Each of the fuel rods
USAR - Rev. 1814.3-3 11/01/2003

modeled by SBLOCTA is analyzed using finite-difference conduction equations in both theaxial and radial directions. It calculates the effect of cladding swell and burst and considersthe exothermic reaction between zircaloy and water. A top skewed axial power shape ischosen for the hot rod because the power is concentrated in the upper regions of the core.Such a distribution is limiting for small-break LOCAs because it minimizes coolant swell,while maximizing vapor superheating and fuel rod heat generation at the uncoveredelevations. The small break LOCA analysis assumes the core continues to operate at fullrated power until the control rods are completely inserted.
Small break LOCA calculations are based on minimum safeguards assumptions designed tominimize pumped ECCS flow to the core. These calculations include loss of a train of ECCSand high head SI pump degradation of pump head by 10%. For a small break LOCA with anequivalent break diameter less than the inner diameter of the high head SI line, pumped highhead SI flow is delivered to both the intact and broken loop at the RCS backpressure (Figure14.3-la). Justification for this assumption is provided in Reference 6. The effect of flowfrom the RHR pumps is not considered since their shutoff head is lower than RCS pressureduring the portion of the transients considered here. For a small break LOCA with anequivalent break diameter greater than or equal to the inner diameter of the high head SI line,pumped high head SI flow is delivered only to the intact loop with one line spilling tocontainment back pressure (Figure 14.3-lb). This is assumed since the modeled break mayinclude the severance of the high head SI line or an area of a severed high head SI line. Flowfrom the RHR pumps into the upper plenum is assumed since transient RCS pressure isbelow the shutoff head (Figure 14.3-Ib). However, RHR flow was not fully credited sincethe NOTRUMP condensation models for the upper plenum have not been licensed by theNRC. The low head SI flow shown in Figure 14.3-lb was reduced by 50%, whichconservatively compensates for the effects of condensation in the upper plenum.
Delivery of the SI flow to the RCS was assumed to be delayed 30 seconds after thegeneration of a SI signal. This delay includes the time required for diesel startup and loadingof the SI pumps onto the emergency buses and for the pump to come to full speed in order todeliver full flow. The assumed delay time is sufficient to account for degraded gridconditions. Finally, the new and approved SI condensation model (Reference 6) was used forall analysis cases.
Results
Reactor Coolant System Pipe Breaks
This section, presents results of the limiting break size in terms of highest peak cladtemperature. The worst break size (small break) is a 3-inch diameter break. The |depressurization transient for this break is shown in Figure 14.3-2a. The extent to which thecore is uncovered is shown in Figure 14.3-2b.
During the earlier part of the small break transient, the effect of the break flow is not strongenough to overcome the flow maintained by the reactor coolant pumps through the core asthey are coasting down following reactor trip. Therefore, upward flow through the core is
USAR - Rev. 18 l14.3-4 11/01/2003

maintained. The resultant heat transfer cools the fuel rod and clad to very near the coolanttemperatures as long as the core remains covered by a two-phase mixture.
The maximum hot spot clad temperature calculated during the transient is 1030'F. Thisanalysis assumes the most limiting temperature conditions, fuel types (High-Tavg Siemens14x14 fresh heavy fuel) and includes the effects of fuel densification as described inReference 5. The peak clad temperature transients are shown in Figure 14.3-2c for the worstbreak size, i.e., the break with the highest peak clad temperature. When the mixture leveldrops below the top of the core, the steam flow computed by NOTRUMP provides cooling tothe upper portion of the core. The core heat transfer coefficients for this phase of thetransient are given in Figure 14.3-2g. The hot spot fluid temperature for the worst break isshown in Figure 14.3-2f.
The reactor shutdown time (5.0-sec) is equal to the reactor trip signal time (2.0 sec) plus 3.0sec for rod insertion. During this rod insertion period, the reactor is conservatively assumedto operate at rated power.
Conclusions
Analyses presented in this section show that the high head portion of the Emergency CoreCooling System, together with accumulators, provide sufficient core flooding to keep thecalculated peak clad temperatures below required limits of 10 CFR 50.46. Hence, adequateprotection is afforded by the Emergency Core Cooling System in the event of a small breakloss-of-coolant accident.
Following the TMI accident, Westinghouse performed generic studies of small break loss-of-coolant accidents. Results of these studies indicated that peak clad temperatures greater than2200'F may occur if the reactor coolant pumps are tripped after a significant loss of reactorcoolant inventory. To prevent such a loss, the operators are instructed to trip the pumps earlyin the accident.
Additional Break Sizes
Additional break sizes were analyzed. Figures 14.3-3a and 14.3-4a present the RCS pressuretransient for the 2- and 4-inch breaks, respectively and Figures 14.3-3b and 14.3-4b presentthe volume history (mixture height) plots for both breaks. The peak clad temperatures forboth cases are less than the peak-clad temperature of the 3-inch break. The peak cladtemperatures for the 2-inch break case is given in Figure 14.3-3c.
The time sequence of events for small breaks analyzed is shown in Table 14.3-la, andTable 14.3-lb presents the results for these analyses.
14.3.2 MAJOR REACTOR COOLANT SYSTEM PIPE RUPTURES (LOSS-OF-COOLANTACCIDENT)
The analysis specified by 10 CFR 50.46 (Reference 1), "Acceptance Criteria for Emergency |
USAR - Rev. 1814.3-5 11/01/2003 l

Core Cooling Systems for Light Water Power Reactors", is presented in this section. Theresults of the Best-Estimate large break loss-of-coolant accident (LOCA) analysis aresummarized in Table 14.3.2-8, and show compliance with the acceptance criteria.
For the purpose of ECCS analyses, Westinghouse (W.) defines a large break loss-of-coolantaccident (LOCA) as a rupture 1.0 ft2 or larger of the reactor coolant system piping includingthe double ended rupture of the largest pipe in the reactor coolant system or of any lineconnected to that system. The boundary considered for loss of coolant accidents as related toconnecting piping is defined in Section 4.1.3.
Should a major break occur, rapid depressurization of the Reactor Coolant System (RCS) to apressure nearly equal to the containment pressure occurs in approximately 35 seconds, with anearly complete loss of system inventory. Rapid voiding in the core shuts down reactorpower. A safety injection system signal is actuated when the low pressurizer pressuresetpoint is reached. These countermeasures will limit the consequences of the accident intwo ways:
I. Borated water injection complements void formation in causing rapid reduction of powerto a residual level corresponding to fission product decay heat. An average RCS/sumpmixed boron concentration is calculated to ensure that the post-LOCA core remainssubcritical. However, no credit is taken for the insertion of control rods to shut down thereactor in the large break analysis.
2. Injection of borated water provides heat transfer from the core and prevents excessivecladding temperatures.
Before the break occurs, the reactor is assumed to be in a full power equilibrium condition,i.e., the heat generated in the core is being removed through the steam generator secondarysystem. At the beginning of the blowdown phase, the entire RCS contains sub-cooled liquidwhich transfers heat from the core by forced convection with some fully developed nucleateboiling. During blowdown, heat from fission product decay, hot internals and the vessel,continues to be transferred to the reactor coolant. After the break develops, the time todeparture from nucleate boiling is calculated. Thereafter, the core heat transfer is unstable,with both nucleate boiling and film boiling occurring. As the core becomes voided, bothtransition boiling and forced convection are considered as the dominant core heat transfermechanisms. Heat transfer due to radiation is also considered.
The heat transfer between the RCS and the secondary system may be in either direction,depending on the relative temperatures. In the case of the large break LOCA, the primarypressure rapidly decreases below the secondary system pressure and the steam generators arean additional heat source. In the Kewaunee Nuclear Plant Large Break LOCA analysis usingthe WCOBRA/TRAC UPI methodology, the steam generator secondary is conservativelyassumed to be isolated (main feedwater and steam line) at the initiation of the event tomaximize the secondary side heat load.
USAR - Rev. 1814.3-6 11/01/2003

Performance Criteria for Emergency Core Cooling System
The reactor is designed to withstand thermal effects caused by a loss-of-coolant accidentincluding the double-ended severance of the largest reactor cooling system cold legpipe. Tile reactor core and internals together with the Emergency Core Cooling System(ECCS) are designed so that the reactor can be safely shut-down and the essential heattransfer geometry of the core preserved following the accident. Long-tcrm coolability ismaintained.
When the RCS depressurizes to approximately 750 psig, the accumulators begin to injectborated water into the reactor coolant loops. Borated water from the accumulator in thefaulted loop is assumed to spill to containment and be unavailable for core cooling for breaksin the cold leg of the RCS. Flow from the accumulator in the intact loop may not reach thecore during depressurization of the RCS due to the fluid dynamics present during the ECCSbypass period. ECCS bypass results from the momentum of the fluid fow up thedowncomcr due to a break in the cold leg, which entrains ECCS flow out toward thebreak. Bypass of the ECCS diminishes as mechanisms responsible for the bypassing arecalculated to be no longer effective.
The blowdown phase of the transient ends when the liquid level in the lower plenum reachesits minimum. After the end of the blowdown, refill of the reactor vessel lower plenumbegins. Refill is completed when emergency core cooling water has filled the lower plenumof the reactor vessel, which is bounded by the bottom of the active fuel region of the fuelrods (called bottom of core (BOC) recovery time).
The reflood phase of the transient is defined as the time period lasting from BOC recoveryuntil the reactor vessel has been filled with awater to the extent that the core temperature risehas been terminated. From the latter stage of blowdown and on into the beginning of reflood,the intact loop accumulator tank rapidly discharges borated cooling water into theRCS. Although a portion injected prior to end of bypass is lost out the cold leg break, theaccumulator eventually contributes to the filling of the reactor vessel downconler. Thedowncomer water elevation head provides the driving force required for the reflooding of thereactor core. The high head safety injection (HHSI) pump aids in the filling of thedowncomer and core and subsequently supply water to help maintain a full downcomer andcomplete the reflooding process. The low head safety injection (LHSI), which injects intothe upper plenum (hence, upper plenum injection - UPI) also aids the reflooding process byproviding water to the core through the vessel upper plenum.
Continued operation of the ECCS pumps supplies water during long-term cooling. Coretemperatures have been reduced to long-term steady state levels associated with dissipationof residual heat generation. After the water level of the refueling water storage tank (RWST)reaches a minimum allowable value, coolant for long-term cooling of the core is obtained byswitching from the injection mode to the sump recirculation mode of ECCSoperation. Spilled borated water is drawn from the engineered safety features (ESF)containment sumps by the LHSI pumps (also called the Residual Heat Removal pumps, orRHR pumps) and returned to the upper plenum and RCS cold legs. Figure 14.3.2-1 contains
USAR-Rev. 1814.3-7 11/01/2003

a schematic of the bounding sequence of events for the Kewaunee large break LOCAtransient.
For the Best-Estimate large break LOCA analysis, one ECCS train, including one high headsafety injection (HHSI) pump and one RHR (low-head) pump, starts and delivers flowthrough the injection lines. One branch of the HHSI injection line spills to the containmentbackpressure; the other branch connects to the intact loop cold leg accumulator line. TheRHR injection line connects directly into the upper plenum. Both emergency dieselgenerators (EDGs) are assumed to start in the modeling of the containment fan coolers andspray pumps. Modeling full containment heat removal systems operation is required byBranch Technical Position CSB 6-1 (Refcrencc 14) and is conservative for the large breakLOCA.
To minimize delivery to the reactor, the HHST branch line chosen to spill is selected as theone with the minimum resistance. In addition, the pump performance curves are degraded,with the high head degraded by 15% of design head and the low head degraded by 10% ofdesign head.
Large Break LOCA Analytical Model
In 1988, as a result of the improved understanding of LOCA thermal-hydraulic phenomenagained by extensive research programs, the NRC staff amended the requirements of 10CFR 50.46 and Appendix K, "ECCS Evaluation Models", so that a realistic evaluation modelmay be used to analyze the performance of the ECCS during a hypothetical LOCA(Reference 7). Under the amended rules, best-estimiate thennal-hydraulic models may beused in place of models with Appendix K features. The rule change also requires, as part ofthe analysis, an assessment of the uncertainty of the best-estimate calculations. It furtherrequires that this analysis uncertainty be included when comparing the results of thecalculations to the prescribed acceptance limits. Further guidance for the use of best-estimatecodes was provided in Regulatory Guide 1 .157 (Reference 8).
To demonstrate use of the revised ECCS nile, the NRC and its consultants developed amethod called the Code Scaling, Applicability, and Uncertainty (CSAU) evaluationmethodology (Reference 9). This method outlined an approach for defining and qualifying abest-estimate thennal-hydraulic code and quantifying the uncertainties in a LOCA analysis.
A LOCA evaluation methodology for three- and four-loop PWR plants based on the revised10 CFR 50.46 miles was developed by Westinghouse with the support of EPRI andConsolidated Edison and was approved by the NRC (Reference 10). The methodology isdocumented in WCAP-12945, "Code Qualification Document (CQD) for Best EstimateLOCA Analysis" (Reference 11). Extension of this methodology to plants equipped withresidual heat removal (RHR) injection into the upper plenum was approved in May 1999(Reference 15) and is documented in Reference 12.
The thermal-hydraulic computer code which was reviewed and approved for the calculationof fluid and thermal conditions in the PWR during a large break LOCA is WCOBRAITRAC
USAR - Rev. 1814.3-8 11/01/2003

Version MOD7A, Rev. 1 (Reference I 1).
WCOBRAITRAC combines two-fluid, three-field, multi-dimensional fluid equations used inthe vessel with one-dimensional drift-flux equations used in the loops to allow a completeand detailed simulation of a PWR. This best-estimate computer code contains the followingfeatures:
* Ability to model transient three-dimensional flows in different geometries inside thevessel
* Ability to model thermal and mechanical non-equilibrium between phases* Ability to mechanistically represent interfacial heat, mass, and momentum transfer in
different flow regimes* Ability to represent important reactor components such as fuel rods, steam generators,
reactor coolant pumps, etc.
The reactor vessel is modeled with the three-dimensional, three-field fluid model, while theloop, major loop components, and safety injection points are modeled with theone-dimensional fluid model.
The basic building block for the vessel is the channel, a vertical stack of single meshcells. Several channels can be connected together by gaps to model a region of the reactorvessel. Regions that occupy the same level form a section of the vessel. Vessel sections arcconnected axially to complete the vessel mesh by specifying channel connections betweensections. Heat transfer surfaces and solid structures that interact significantly with the fluidcan be modeled with rods and unheated conductors. The fuel parameters are generated usingthe Westinghouse fuel performance code (PAD 4.0, Reference 6).
One-dimensional components are connected to the vessel. Special purpose components existto model specific components such as the steam generator and pump.
A typical calculation using WCOBRA/TRAC begins with the establishment of a steady-stateinitial condition with all loops intact. The input parameters and initial conditions for thissteady-state calculation are discussed in the next section.
Following the establishment of an acceptable steady-state condition, the transient calculationis initiated by introducing a break into one of the loops. The evolution of the transientthrough blowdown, refill, and reflood follows continuously, using the same computer code(WCOBRA/TRAC) and the same modeling assumptions. Containment pressure is modeledwith the BREAK component using a time dependent pressure table. Containment pressure iscalculated using the COCO code (Reference 5) and mass and energy releases from theWCOBRA/TRAC calculation. The parameters used in the containment analysis to determinethis pressure curve are presented in Tables 14.3.2-1 through 14.3.2-3.
The methods used in the application of WCOBRAITRAC to the large break LOCA aredescribed in References 10 through 12. A detailed assessment of the computer codeWCOBRA/TRAC was made through comparisons to experimental data. These assessments
USAR - Rev. 1814.3-9 11/01/2003

were used to develop quantitative estimates of the code's ability to predict key physicalphenomena in a PWR large break LOCA. Modeling of a PWR introduces additionaluncertainties which are identified and quantified in the plant-specific analysis(Reference 13). The final step of the best-estimate methodology is to combine all theuncertainties related to the code and plant parameters and estimate the PCT at the 95thpercentile (PCT95 i). The steps taken to derive the PCT uncertainty estimate are summarizedbelow:
1. Plant Model DevelopmentIn this step, a WCOBRA/TRAC model of the Kewaunee Nuclear Power Plant (KNPP) isdeveloped. A high level of noding detail is used, in order to provide an accuratesimulation of the transient. However, specific guidelines are followed to assure that themodel is consistent with models used in the code validation. This results in a high levelof consistency among plant models, except for specific areas dictated by hardwaredifferences such as in the upper plenum of the reactor vessel or the ECCS injectionconfiguration.
2. Determination of Plant Operating ConditionsIn this step, the expected or desired range of the plant operating conditions to which theanalysis applies is established. The parameters considered are based on a "key LOCAparameters" list that was developed as part of the methodology. A set of theseparameters, at mostly nominal values, is chosen for input as initial conditions to the plantmodel. A split break in the cold leg (a longitudinal break along the side of the pipe) ismodeled initially, as was determined to be limiting for a typical two-loop plant(Reference 12). A transient is run utilizing these parameters and is known as the "initialtransient". Next, several confirmatory runs are made, which vary a subset of the keyLOCA parameters over their expected operating range in one-at-a-time sensitivities. Theresults of these calculations for KNPP are discussed in Section 4 of Reference 13. Themost limiting input conditions, based on these confirmatory runs, are then combined intoa single transient, which is then called the "reference transient".
3. PWR Sensitivity CalculationsA series of PWR transients are performed in which the initial fluid conditions andboundary conditions are ranged around the nominal conditions used in the referencetransient. The results of these calculations for KNPP form the basis for the determinationof the initial condition bias and uncertainty discussed in Section 5 of Reference 13.
Next, a series of transients are performed which vary the power distribution, taking intoaccount all possible power distributions during normal plant operation. The results ofthese calculations for KNPP form the basis for the determination of the powerdistribution bias and uncertainty (response surface) discussed in Section 6 ofReference 13.
Finally, a series of transients are performed -which vary parameters that affect the overallsystem response ("global" parameters) and local fuel rod response ("local"parameters). The results of these calculations for KNPP forn the basis for the
USAR- Rev. 1814.3-10 11/01/2003

deternination of the model bias and uncertainty (response surface) discussed in Section 7of Reference 13.
4. Response Surface CalculationsThe results from the power distribution and global model WCOBRA/TRAC runsperformed in Step 3 are fit by regression analyses into equations known as responsesurfaces. The results of the initial conditions run matrix arc used to generate a PCTuncertainty distribution.
5. Uncertainty EvaluationThe total PCT uncertainty from the initial conditions, power distribution, and modelcalculations is derived using the approved methodology (References 12). The uncertaintycalculations assume certain plant operating ranges which may be varied depending on theresults obtained. These uncertainties are then combined to determine the initial estimateof the total PCT uncertainty distribution for the split and limiting guillotine breaks. Theresults of these initial estimates of the total PCT uncertainty arc compared to determinethe limiting break type. If the guillotine break is limiting, an additional set of guillotinetransients are performed which vary overall system response ("global" parameters) andlocal fuel rod response ("local" parameters). The results of these calculations form thebasis for the determination of the model bias and uncertainty for guillotine breaksdiscussed in Section 8 of Reference 13. Finally, an additional series of runs is made toquantify the bias and uncertainty due to assuming that the above three uncertaintycategories are independent. The final PCT uncertainty distribution is then calculated forthe limiting break type, and the 95th percentile PCT (PCT95'V) is determined, as describedlater under Uncertainty Evaluation.
6. Plant Operating RangeThe plant operating range over which the uncertainty evaluation applies isdefined. Depending on the results obtained in the above uncertainty evaluation, thisrange may be the desired range established in step 2, or may be narrower for someparameters to gain additional margin.
There arc three major uncertainty categories or elements:* Initial condition bias and uncertainty* Power distribution bias and uncertainty* Model bias and uncertainty
Conceptually, these elements may be assumed to affect the reference transient PCT as shownbelow:
PCTi = PCTREFJ + APCTIc,i + APCTpDJi + APCTMoDJ (14.3.2-1)
where,
USAR -Rev. 1814.3-11 11/01/2003

PCTREFi = Reference transient PCT: The refercncc transient PCT is calculatedusing WCOBRAITRAC at the nominal conditions identified inTable 14.3.2-4, for the blowdown and reflood periods.
APCTic,i = Initial condition bias and uncertainty: This bias is the differcncebetween the reference transient PCT, which assumes several nominalor average initial conditions, and the average PCT taking into accountall possible values of the initial conditions. This bias takes intoaccount plant variations which have a relatively small effect onPCT. The elements which make up this bias and its uncertainty areplant-specific.
APCTPDi = Power distribution bias and uncertainty: This bias is the differencebetween the reference transient PCT, which assumes a nominal powerdistribution, and the average PCT taking into account all possiblepower distributions during normal plant operation. Elements whichcontribute to the uncertainty of this bias are calculational uncertainties,and variations due to transient operation of the reactor.
APCTMODi = Model bias and uncertainty: This component accounts foruncertainties in the ability of the WCOBRA/TRAC code to accuratelypredict important phenomena which affect the overall system response("global" parameters) and the local fuel rod response ("local"parameters). The code and model bias is the difference between thereference transient PCT, which assumes nominal values for the globaland local parameters, and the average PCT taking into account allpossible values of global and local parameters.
The separability of the bias and uncertainty components in the manner described above is anapproximation, since the parameters in each element may be affected by parameters in otherelements. The bias and uncertainty associated with this assumption is quantified as part ofthe overall uncertainty methodology and included in the final estimates of PCT955.
Large Break LOCA Analysis Results
A series of WCOBRA/TRAC calculations were performed using the Kewaunee NuclearPower Plant (KNPP) input model, to determine the effect of variations in several key LOCAparameters on peak cladding temperature (PCT). From these studies, an assessment wasmade of the parameters that had a significant effect as will be described in the followingsections.
LOCA Transient Description
The plant-specific analysis performed for the Kewaunee Nuclear Power Plant indicated thatthe split break is more limiting than the double-ended cold leg guillotine (DECLG)break. The plant conditions used in the split break reference transient are listed in
USAR - Rev. 1814.3-12 11/01/2003

Table 14.3.2-4. The results of the initial transient and the confirmatory calculationsperformed to determine the final reference transient are listed in Table 14.3.2-5. Note thatthe initial transient and confirmatory calculations were performed at a slightly lower power(1.4% lower) and a slightly larger Tavg operating window than the final referencetransient. This was done to incorporate a mid-analysis request to reduce the calorimetricuncertainty from 2.0% to 0.6%. Neither change is considered to be a significant perturbationto the plant initial operating conditions and will not affect the relative outcome of theconfirmatory and break spectrum calculations. Table 14.3.2-4 reflects the final referencetransient conditions at the higher power. Since many of these parameters are at theirbounded values, the calculated results are a conservative representation of the response to alarge break LOCA. The following is a description of the final reference transient.
The LOCA transient can be conveniently divided into a number of time periods in whichspecific phenomena are occurring. For a typical large break, the blowdown period can bedivided into the critical heat flux (CHF) phase, the upward core flow phase, and thedownward core flow phase. These are followed by the refill, reflood, and long term corecooling phases. The important phenomena occurring during each of these phases in tilereference transient are discussed below.
The containment back pressure curve used in all of the calculations is calculated using theCOCO code (Reference 5) and mass and energy releases from the WCOBRA/TRACtransient at the lower power. The parameters used in the containment analysis to determinethis pressure are listed in Tables 14.3.2-1 through 14.3.2-3. The mass and energy releasesfrom the lower powered transient are shown in Table 14.3.2-6. These mass and energyreleases were used to calculate the final containment pressure curve (Figure 14.3.2-1) used inthe reference transient shown on Table 14.3.2-5 and all of the subsequent WCOBRA/TRACcalculations. This containment pressure was assessed to be a lower bound to pressurecalculated using the mass and energy releases from the final reference transient at the finaluprated power.
Critical beat Flux (CHF) Phase (0-5 seconds)
The reactor coolant pumps arc assumed to trip coincident with the break opening. Shortlyafter the break is assumed to open, the vessel depressurizes rapidly and the core flowdecreases as subcooled liquid flows out of the vessel into the broken cold leg. The fuel rodsgo through departure from nucleate boiling (DNB) and the cladding rapidly heats up(Figure 14.3.2-3) while the core power shuts down due to voiding in the core. Control rodinsertion is not modeled. The hot water in the core and upper plenum flashes to steam. Thewater in the upper head flashes and is forced down through the guide tubes. The brrak flowbecomes saturated and is substantially reduced (Figure 14.3.2-4).
At approximately 4 seconds, the pressure in the pressurizer has fallen to the point where thesafety injection signals are initiated.
USAR - Rev. 1814.3-13 11/01/2003

Upward Core Flow Phase (4-8 seconds)
Tile colder water in the downcomer and lower plenum flashes, and the mixture swells. Sincethe intact loop pump is assumed to trip at the initiation of the break, it begins to coast downand does not serve to enhance upflow cooling by pushing fluid into the core. Tile upflowphase is short-lived for this reason. However, there is sufficient upflow cooling to beginsignificantly reducing the heat up in the fuel rods. As the lower plenum fluid depletes,upflowNv through the core ends (Figure 14.3.2-5).
Downward Core Flow Phase (8-30 seconds)
The break flow begins to dominate and pulls flow down through the core. Figure 14.3.2-5shows the total core flow at the core midplane. The blowdown PCT of 16540 F occurs as thedowvnflow increases in intensity and continues to decrease while downflow is sustained. Atapproximately 11 seconds, the pressure in the cold leg falls to the point vwhere accumulatorsbegin injecting cold water into the cold legs (Figure 14.3.2-6). Because the break flow is stillhigh, much of the accumulator emergency core cooling system (ECCS) water entering thedowncomer is bypassed out of the break. As the system pressure continues to decrease, thebreak flow, and consequently the core flow, is reduced. The break flow further reduces andthe accumulator water begins to fill the downcomer and lower plenum. The core flow isnearly stagnant during this period and the hot assembly experiences a near adiabatic heat up.
Refill Phase (30-40 seconds)
The high head safety injection (HHSI) pump begins to inject (Figure 14.3.2-7) into the coldleg at approximately 34 seconds assuming a delay time of 30 seconds after the SI signal isinitiated when a loss of offsite power is assumed. Since the break flow has significantlyreduced by this time, much of the ECCS entering the downcomer via the cold leg is retainedin the downcomer and refills the lower plenum. The low head safety injection (LIISI) pumpis assumed to begin injecting (Figure (14.3.2-8) cold ECCS water into the upper plenum atapproximately 39 seconds, assuming a delay of 35 seconds for the loss of offsite power case,after the SI signal has been actuated. The water enters the vessel at the hot lcg nozzlecentcrline elevation and falls down to the upper core plate through the outer globalchannels. The liquid drains down through the low power region via the open hole channel ofthe counter-current flow limiting (CCFL) region. The hot assembly experiences a nearlyadiabatic heatup as the lower plenum fills with ECCS water (Figures 14.3.2-3 and 14.3.2-10).
Reflood (40-250 seconds)
At approximately 40 seconds, the intact loop accumulator is empty of water, and beginsinjecting nitrogen into the cold leg (Figure 14.3.2-6). The insurge in the dowvncomer forcesthe downcomer liquid into the lower plenum and core regions (Figures 14.3.2-9 through14.3.2-11). During this time, core cooling is increased, and the hot assembly cladtemperature decreases slightly.
The clad temperature in the hot assembly returns to nearly adiabatic heatup for about
USAR - Rev. 1814.3-14 11/01/2003

30 seconds, until the core again begins to refill. The LHSI liquid flows down through thelow power region and crossflows into the average assemblies near the bottom of thecore. This water quenches the bottom of the core, which produces vapor that flows upthrough the average and hot assemblies, providing bottom-up cooling. The reflood PCT of17637F occurs at approximately 70 seconds.
Long Tcrm Core Cooling
At the end of the WCOBRA/TRAC calculation, the core and downcomer levels areincreasing as the pumped safety injection flow exceeds the break flow. The core anddowncomer levels would be expected to continue to rise, until the downcomer mixture levelapproaches the loop elevation. At that point, the break flowv would increase, until it roughlymatches the injection flowrate. The core would continue to be cooled until the entire core iseventually quenched.
Confirmatory Sensitivity Studies
A number of sensitivity calculations were carried out to investigate the effect of the keyLOCA parameters, and to develop the required data for the uncertainty evaluation. In thesensitivity studies performed, LOCA parameters were varied one at a time. For eachsensitivity study, a comparison between the base case and the sensitivity case transient resultswas made.
The results of the sensitivity studies are summarized in Tables 14.3.2-5 and 14.3.2-7. A fullreport on the results for all sensitivity study results is included in Section 4 ofReference 13. The results of these analyses lead to the following conclusions:
1. The limiting break type is a cold leg split break, and the limiting split break area is0.7 times the area of a cold leg pipe (CD = 0.7), which is 2.88 ft2. This split break size isthen modeled in the reference transient, as well as in the subsequent calculations used inthe determination of uncertainties.
2. Modeling the pressurizer on the broken loop results in a higher PCT than modeling thepressurizer on the intact loop.
3. Modeling loss-of-offsite power (LOOP) results in a higher PCT than when the reactorcoolant pumps are assumed to continue to run (no-LOOP).
4. Maximum steam generator tube plugging (10%) results in the highest PCT.
5. Modeling the minimum value of vessel average temperature (Tayg = 556.30 F) results inthe highest PCT.
6. Modeling the maximum power fraction (PLow= 0.6) in the low power/periphery channelof the core results in the highest PCT.
USAR - Rev. 1814.3-15 11/01/2003

Initial Conditions Sensitivity Studies
Several calculations werc performed to evaluate the effect of change in the initial conditionson the calculated LOCA transient. These calculations analyzed key initial plant conditionsover their expected range of operation. These studies included effects of ranging RCSconditions (pressure and temperature), safety injection temperature, and accumulatorconditions (pressure, temperature, volume, and line rcsistance). The results of these studiesare presented in Section 5 of Reference 13.
The calculated results were used to develop initial condition uncertainty distributions for theblowdown and reflood peaks. These distributions are then used in the uncertainty evaluationto predict the PCT uncertainty component resulting from initial conditions uncertainty(APCTIc,i).
Power Distribution Sensitivity Studies
Several calculations were performed to evaluate the effect of power distribution on thecalculated LOCA transient. The power distribution attributes which were analyzed are thepeak linear heat rate relative to the core average, the maximum relative rod power, therelative power in the bottom third of the core (PBOT), and the relative power in the middlethird of the core (PmnI). The choice of these variables and their ranges arc based on theexpected range of plant operation. The ranges for each of these variables can besuperimposed upon a scatter plot of all possible power shapes for a typical KNPP fuel cycle(including I 8-month fuel cycles). The box surrounding the power shapes encompasses therange on PBOT and PMID that was analyzed with this power distribution run matrix, as shownin Section 6 of Reference 13.
The power distribution parameters used for the reference transient are biased to yield arelatively high PCT. The reference transient uses the maximum Fiji, a skewed to the toppower distribution, and a FQ at the midpoint of the sample range.
A nn matrix was developed in order to vary the power distribution attributes singly and incombination. The calculated results are presented in Section 6 of Reference 13. Thesensitivity results indicated that power distributions with peak powers shifted towards themiddle of the core produced higher PCTs as a result of some steam cooling in the top of thecore for UPI plants.
The calculated results were used to develop response surfaces, as described in Step 4 ofSection 14.3.2.2, which could be used to predict the change in PCT for various changes in thepower distributions for the blowdown and reflood peaks. These were then used in theuncertainty evaluation, to predict the PCT uncertainty component resulting fromuncertainties in power distribution parameters, (APCTPD.i).
Global Model Sensitivity Studies
Several calculations were performed to evaluate the cffect of break flow path resistance and
USAR - Rev. 1814.3-16 11/01/2003

upper plenum drain distribution on the PCT for the split break with the limiting break area(CD = 0.7). As in the power distribution study, these parameters were varied singly and incombination in order to obtain a data base which could be used for response surfacegeneration. The run matrix and ranges of the break flow parameters are described inReference 12. The limiting guillotine break was also identified using the methodologydescribed in Reference 12. The plant specific calculated results are presented in Section 7 ofReference 13. The results of these studies indicated that the split break calculation resultedin much higher PCTs than the guillotine break calculations. Therefore, no further guillotinecalculations needed to be perfonned.
The calculated results were used to develop response surfaces as described inSection 14.3.2.2, which could be used to predict the change in PCT for various changes in theflow conditions. These were then used in the uncertainty evaluation to predict the PCTuncertainty component resulting from uncertainties in global model parameters (APCTMODj).
Uncertainty Evaluation and Results
The PCT equation was presented in Section 14.3.2.2. Each element of uncertainty is initiallyconsidered to be independent of the other. Each bias component is considered a randomvariable, whose uncertainty and distribution is obtained directly, or is obtained from theuncertainty of the parameters of which the bias is a function. For example, APCTPD.j is afunction of FQ, FAir, PBOT, and PMID. Its distribution is obtained by sampling the plant FQ,FAll, PBOT, and PjjnD distributions and using a response surface to calculate APCTPD;.l SinceAPCTi is the sum of these biases, it also becomes a random variable. Separate initial PCTfrequency distributions are constructed as follows for the split break and the limitingguillotine break size:
1. Generate a random value of each APCT element.
2. Calculate the resulting PCT using Equation 14.3.2-1.
3. Repeat the process many times to generate a histogram of PCTs.
A final verification step is performed in which additional calculations (known as"superposition" calculations) are made with WCOBRA/TRAC, simultaneously varyingseveral parameters which were previously assumed independent (for example, powerdistributions and models). Predictions using Equation 14.3.2-1 are compared to this data,and additional biases and uncertainties are applied.
The estimate of the PCT at 95% probability is determined by finding that PCT below which95% of the calculated PCTs reside. This estimate is the licensing basis PCT, under therevised ECCS rule.
The results for the Kewaunee Nuclear Power Plant are given in Table 14.3.2-8, which showsthe reflood 95th percentile PCT (PCT95 4) of 20840F. As expected, the difference betweenthe 95% value and the average value increases with increasing time, as more parameter
USAR - Rev. 1814.3-17 11/01/2003

uncertainties come into play.
Evaluations
The transition from Siemens Standard/Heavy Fuel Assemblies to Westinghouse 14x14Vantage+ fuel with Perfonrnance+ features (422V+) fuel has been evaluated for the effects ofhydraulic mismatch and differences in fuel designs. The Reference Transient for the KNPPwas used to determine the transition core effects.
Two additional calculations were performed for this assessment. For one calculation, the hotassembly was modeled with the fresh 422V+ fuel, surrounded by Siemens Heavy fuel, onceburned. For the second calculation, the hot assembly was modeled with Siemens Heavy fuel(once burned), surrounded by fresh 422V+ assemblies. In both calculations, the lowpowver/peripheral region was modeled with Siemens Heavy fuel (once burned). The resultsof the assessment indicate that the Best-Estimate analysis with a full core of 422V+ fuel forthe KNPP bounds the transition core cycles.
Large Break LOCA Conclusions
It must be demonstrated that there is a high level of probability that the limits set forth in10 CFR 50.46 are met. The demonstration that these limits are met for the KewauneeNuclear Power Plant is as follows:
1. There is a high level of probability that the peak cladding temperature (PCT) shall notexceed 2200'F. The results presented in Table 14.3.2-8 indicate that this regulatory limithas been met with a reflood PCT95"' of 20840 F.
2. The maximum calculated local oxidation of the cladding shall nowhere exceed 0.17 timesthe total cladding thickness before oxidation. The approved Best-Estimate LOCAmethodology assesses this requirement using a plant-specific transient which has a PCTin excess of the estimated 95 percentile PCT (PCT95"). Based on this conservativecalculation, a maximum local oxidation of 8.44% is calculated, which meets theregulatory limit.
3. The calculated total amount of hydrogen generated from the chemical reaction of thecladding with water or steam shall not exceed 0.01 times the hypothetical amount thatwould be generated if all of the metal in the cladding cylinders surrounding the fuel wereto react. The total amount of hydrogen generated, based on this conservative assessmentis 0.0074 times the maximum theoretical amount, which meets the regulatory limit.
4. Calculated changes in core geometry shall be such that the core remains amenable tocooling. This requirement is met by demonstrating that the PCT does not exceed 2200'F,the maximum local oxidation does not exceed 17%, and the seismic and LOCA forces arenot sufficient to distort the fuel assemblies to the extent that the core cannot becooled. The BE UPI methodology (References 1 and 12) specifies that the effects ofLOCA and seismic loads on core geometry do not need to be considered unless grid crush
USAR - Rev. 1814.3-18 11/01/2003

extends to in-board assemblies. Fuel assembly structural analyses performed forKewaunce indicate that this condition does not occur. Therefore, this regulatory limit ismet.
5. After any calculated successful initial operation of the ECCS, the calculated coretemperature shall be maintained at an acceptably low value and decay heat shall beremoved for the extended period of time required by the long lived radioactivityremaining in the core. The conditions at the end of the WCOBRA/TRAC calculationsindicates that the transition to long term cooling is underway even before the entire coreis quenched.
SER Requirements
The SER requirements for three- and four-loop plants (Reference I1) have been met for thisKNPP analysis. The BE UPI Evaluation Model has additional requirements to verify that theplant conditions fall within the range of conditions represented by the test simulations usedfor assessment of phenomena unique to upper plenum injection plants(Reference 15). Table 14.3.2-9 compares the plant conditions for KNPP to the testconditions utilized in the BE UPI methodology (References 12). From this table, it is clearthat KNPP conditions fall within the range of test conditions. Thus, the BE UPI SERrequirements have been met for Kewaunee.
Plant Operating Range
The expected PCT and its uncertainty developed above is valid for a range of plant operatingconditions. In contrast to current Appendix K calculations, many parameters in the base casecalculation are at nominal values. The range of variation of the operating parameters hasbeen accounted for in the estimated PCT uncertainty. Table 14.3.2-10 and Figures 14.3.2-12through 14.3.2-14 summarize the operating ranges for the Kewaunee Nuclear Power Plant. Ifoperation is maintained within these ranges, the LOCA analysis developed in Reference 13 isconsidered to be valid.
14.3.3 CORE AND INTERNALS INTEGRITY ANALYSIS
The response of the reactor core and vessel internals under excitation produced by asimultaneous complete severance of a reactor coolant pipe and seismic excitation of typicaltwo loop plant internals has been determined. A detailed description of the analysisapplicable to the Kewaunee Nuclear Power Plant design appears in WCAP 7822,(Reference I) Indian Point Unit 2 Reactor Internals Mechanical Analysis for BlowdownExcitation (Westinghouse Proprietary).
See Steam Generator Replacement and Tavg Operating Window Program Licensing Report(Reference 7), Section 5.2 for Updates to Internals Qualifications.
USAR - Rev. 1814.3-19 11/01/2003

Reactor Internals Response Under Blowdow^n and Seismic Excitation
A loss-of-coolant accident may result from a rupture of reactor coolant piping. During theblowdown of the coolant, critical components of the core are subjected to vertical andhorizontal excitation as a result of rarefaction waves propagating inside the reactor vessel.
For these large breaks, the reduction in water density greatly reduces the reactivity of thecore, thereby shutting down the core whether the rods are tripped or not. (The subsequentrefilling of the core by the Emergency Core Cooling System uses borated water to maintainthe core in a sub-critical state.) Therefore, the main requirement is to assure effectiveness ofthe Emergency Core Cooling System. Insertion of the control rods, although not needed,gives further assurance of ability to shut the plant down and keep it in a safe shutdowncondition.
The pressure waves generated within the reactor arc highly dependent on the location andnature of the postulated pipe failure. In general, the more rapid the severance of the pipe, themore severe the imposed loadings on the components. A one-millisecond severance time istaken as the limiting case.
In the case of the hot leg break, the vertical hydraulic forces produce an initial upward lift ofthe core. A rarefaction wave propagates through the reactor hot leg nozzle into the interior ofthe upper core barrel. Since the wave has not reached the flow annulus on the outside of thebarrel, the upper barrel is subjected to an impulsive compressive wave. Thus, dynamicinstability (buckling) or large deflection of the upper core barrel or both is the possibleresponse of the barrel during hot leg blowdown. In addition to the above effects, the hot legbreak results in transverse loading on the upper core components as the fluid exits the hot legnozzle.
In the case of the cold leg break, a rarefaction wave propagates along a reactor inlet pipearriving first at the core barrel at the inlet nozzle of the broken loop. The upper barrel is thensubjected to a nonaxisymmetric expansion radial impulse, which changes as the rarefactionwave propagates both around the barrel and down the outer flow annulus between vessel andbarrel. After the cold leg break, the initial steady-state hydraulic lift forces (upward)decrease rapidly (within a few milliseconds) and then increase in the downwarddirection. These cause the reactor core and lower support structure to move initiallydownward.
If a simultaneous seismic event with the intensity of the design basis earthquake (DBE) ispostulated with the loss-of-coolant accident, the imposed loading on the internals componentmaybe additive in certain cases, and therefore, the combined loading must be considered. Ingeneral, however, the loading imposed by the earthquake is small compared to the blowdownloading.
USAR - Rev. 1814.3-20 11/01/2003
Acceptance Criteria for Results of Analyses
The criteria for acceptability in regard to mechanical integrity analysis is that adequate corecooling and core shutdown must be assured. This implies that the deformation of the reactorinternals must be sufficiently small so that the geometry remains substantiallyintact. Consequently, the limitations established on the internals are concerned principallywith the maximum allowable deflections and/or stability of the parts, in addition to a stresscriterion, to assure integrity of the components.
Allowable Deflection and Stability Criteria
Upper Barrel - The upper barrel deformation has the following limits:
a) To insure a shutdown and cooldown of the core during blowdown, the basic requirementis a limitation on the outward deflection of the barrel at the locations of the inlet nozzlesconnected to the unbroken lines. A large outward deflection of the barrel in front of theinlet nozzles, accompanied with permanent strains, could close the inlet area and stop thecooling water coming from the accumulators. (The remaining distance between thebarrel and the vessel inlet nozzle after the accident must be such that the inlet flow areabe approximately the same as that of the accumulator pipes). Consequently, a permanentbarrel deflection in front of the unbroken inlet nozzles larger than a certain limit calledthe "no-loss of function" limit, could impair the efficiency of the Emergency CoreCooling System.
b) To assure rod insertion and to avoid disturbing the Control Rod Cluster guide structure,the barrel should not interfere with the guide tubes. This condition also requires astability check to assure that the barrel will not buckle under the accident loads.
Control Rod Cluster Guide Tubes - The guide tubes in the upper core support package housethe control rods. The deflection limits were established from tests.
Fuel Assembly - The limitations for this case are related to the stability of the thimbles in theupper end. The upper end of the thimbles shall not experience stresses above the allowabledynamic compressive stresses. Any buckling of the upper end of the thimbles due to axialcompression could distort the guideline and thereby affect the free fall of the control rod.
Upper Package - The maximum allowable local deformation of the upper core plate where aguide tube is located is 0.100 inch. This deformation will cause the plate to contact the guidetube since the clearance between plate and guide tube is 0.100 inches. This limit will preventthe guide tubes from undergoing compression. For a plate local deformation of 0.150 inches,the guide tube will be compressed and deformed transversely to the upper limit previouslyestablished; consequently, the value of 0.150 inches is adopted as the no loss-of-functionlocal deformation, with an allowable limit of 0.100 inches.
USAR -Rev. 1814.3-21 11/01/2003

Allowable Stress Criteria
For this faulted condition, the allowable stress criteria is given by Figure 14.3-21a. Thisfigure defines various criteria based upon their corresponding method of analysis.
To account for multi-axial stresses, the Von Mises Theory is also considered.
Method of Analysis
BlowdowNn Model
BLODWN-2 is a digital computer program developed for the purpose of calculating localfluid pressure, flow, and density transients that occur in PWR coolant systems during a loss-of-coolant accident (Reference 2). This program applies to the sub-cooled, transition, andsaturated two-phase blowdown regimes. BLODWN-2 is based on the method ofcharacteristics wherein the resulting set of ordinary differential equations, obtained from thelaws of conservation of mass, momentum, and energy, are solved numerically using a fixedmesh in both space and time.
Although spatially one-dimensional conservation laws are employed, the code can be appliedto describe three-dimensional system geometries by use of the equivalent pipingnetworks. Such piping networks may contain any number of pipes or channels of variousdiameters, dead ends, branches (with up to six pipes connected to each branch), contractions,expansions, orifices, pumps, and free surfaces (such as in the pressurizer). System lossessuch as friction, contraction, expansion, etc., are considered.
BLODWN-2 predictions have been compared with numerous test data as reported inWCAP-7401 (Reference 4). It is shown that the BLODWN-2 digital computer programcorrelates well with both the sub-cooled and the saturated blowdown regimes.
FORCE Model for Blowdown
BLODWN-2 evaluates the pressure and velocity transients for a maximum of 2400 locationsthroughout the system. These pressure and velocity transients are stored as a permanent tapefile and are made available to the program FORCE which utilizes a detailed geometricdescription in evaluating the loadings on the reactor internals.
Each reactor component for which FORCE calculations are required is designated as anelement and assigned an element number. Forces acting upon each of the elements arecalculated summing the effects of:
1) The pressure differential across the element.
2) Flow stagnation on, and unrecovered orifice losses across the element.
3) Friction losses along the element.
USAR -Rev. 1814.3-22 11/01/2003

- -------
Input to the code, in addition to the BLODWN-2 pressure and velocity transients includes theeffective area of each element on which the force acts, due to the pressure differential acrossthe element, a coefficient to account for flow stagnation, unrecovered orifice losses, and thetotal area of the element along which the shear forces act.
The mechanical analysis has been performed using conservative assumptions in order toobtain results with extra margin. Some of the most significant are:
a) The mechanical and hydraulic analysis has been performed separately without includingthe effect of the water-solid interaction. Peak pressures obtained from the hydraulicanalysis will be attenuated by the deformation of the structures.
b) When applying the hydraulic forces, no credit is taken for the stiffening effect of the fluidenvironment, which will reduce the deflections and stresses in the structure.
c) The multi-mass model described below is considered to have a sufficient number ofdegrees of freedom to represent the most important modes of vibration in the verticaldirection. This model is conservative in the sense that further mass-spring resolution ofthe system would lead to further attenuation of the shock effects obtained with the presentmodel.
Method of Blowdown Re-Analysis
Re-analysis performed in support of increased full power primary coolant temperature rangeand new fuel products (such as Siemens-Designed 14x14 fuel) have made use of theMULTIFLEX (References 5 and 6) computer code, rather than BLODWN-2 describedabove. These analyses use the FORCE2 computer code (described in Reference 6) to postprocess MULTIFLEX hydraulic transient results into vertical forces as described above forthe FORCE code. Lateral forces are computed using the LATFORC code (described inReference 6). Additional details of these re-analysis are found in Section 6.5 of the SteamGenerator Replacement and Tavg Operating Window Program Licensing Report (Reference7). As described in Section 5.2 of Reference 7, the core and internals integrity calculationsfound the re-analysis loads to remain bounded by the calculations described above.
Vertical Excitation Model for Blowdown
For the vertical excitation, the reactor internals are represented by a multi-mass systemconnected with springs and dashpots simulating the elastic response and the viscous dampingof the components. Also incorporated in the multi-mass system is a representation of themotion of the fuel elements relative to the fuel assembly grids. The fuel elements in the fuelassemblies are kept in position by friction forces originating from the preloaded fuelassembly grid fingers. Coulomb-type friction is assumed in the event that sliding between therods and the grid fingers occurs. Figure 14.3-21 shows the spring-mass system used torepresent the internals. In order to obtain an accurate simulation of the reactor internalsresponse, the effects of internal damping, clearances between various internals, snubbing
USAR -Rev. 18I14.3-23 11/01/2003

action caused by solid impact, Coulomb friction induced by fuel rods motion relative to thegrids, and pre-loads in holddown springs have been incorporated in the analyticalmodel. The reactor vessel is regarded as a fixed base while the internals undergo relativedisplacement with respect to their initial position. The modeling is conducted in such a waythat uniform masses are lumped into easily identifiable discrete masses while elastic elementsare represented by springs. Table 14.3-3 lists the various masses, springs, etc.
The appropriate dynamic differential equations for the multi-mass model describing theaforementioned phenomena are formulated and the results obtained using a digital computerprogram which computes the response of the multi-mass model when excited by a set of timedependent forcing functions. The appropriate forcing functions are applied simultaneouslyand independently to each of the masses in the system. The results from the program givethe forces, displacements and deflections as functions of time for all the reactor internalscomponents (lumped masses). Reactor internals response to both hot and cold leg piperuptures are analyzed. The forcing functions used in the study are obtained from hydraulicanalyses of the pressure and flow distribution around the entire reactor coolant system ascaused by double-ended severance of a reactor coolant system pipe.
Vertical Excitation Model for Earthquake
As shown in WCAP-7822 (Reference 1) the reactor internals are modeled as a single degree-of-freedom system for vertical earthquake analysis. The maximum acceleration at the vesselsupport is increased by amplification due to the building-soil interaction.
Transverse Excitation Model for Blowdown
Various reactor internal components are subjected to transverse excitation duringblowdown. Specifically, the barrel, guide tubes, and upper support columns are analyzed todetermine their response to this excitation.
Core Barrel
For the hydraulic analysis of the pressure transients during hot leg blowdown, the maximumpressure drop across the barrel is a uniform radial compressive impulse. The barrel is thenanalyzed for dynamic buckling using these conditions and the following conservativeassumptions:
a) The effect of the fluid environment is neglected (water stiffening is not considered);
b) The shell is treated as simply supported.
During cold leg blowdown, the upper barrel is subjected to a nonaxisymmetric expansionradial impulse, which changes as the rarefaction wave propagates both around the barrel anddown the outer flow annulus between vessel and barrel.
The analysis of transverse barrel response to cold leg blowdown is performed as follows:
USAR - Rev. 1814.3-24 11/01/2003

1) The upper core barrel is treated as a simply supported cylindrical shell of constantthickness between the upper flange weldment and the lower core barrel weldment withouttaking credit for the supports at the barrel mid-span offered by the outlet nozzles. Thisassumption leads to conservative deflection estimates of the upper core barrel.
2) The upper core barrel is analyzed as a shell with four variable sections to model thesupport flange, upper barrel, reduced weld section, and a portion of the lower core barrel.
3) The barrel with the core and thermal shield is analyzed as a beam fixed at the top andelastically supported at the lower radial support and the dynamic response is obtained.
Guide Tubes - The dynamic loads on RCC guide tubes are more severe for a loss-of-coolantaccident caused by hot leg rupture than for an accident by cold leg rupture since the cold legbreak leads to much smaller changes in the transverse coolant flow over the RCC guidetubes. Thus, the analysis is performed only for a hot leg blowdown.
The guide tubes in closest proximity to the ruptured outlet nozzle are the most severelyloaded. The transverse guide tube forces during the hot leg blowdown decrease withincreasing distance from the ruptured nozzle location.
A detailed structural analysis of the RCC guide tubes was performed to establish theequivalent cross-section properties and elastic and support conditions. An analytical modelwas verified both dynamically and statically by subjecting the control rod cluster guide tubeto a concentrated force applied at the transition plate. In addition, the guide tube was loaded
-experimentally using a triangular distribution to conservatively approximate the hydraulicloading. The experimental results consisted of a load deflection curve for the RCC guidetube plus verification of the deflection criteria to assure RCC insertion.
The response of the guide tubes to the transient loading due to blowdown may be found byutilizing the equivalent single freedom system for the guide tube using experimental resultsfor equivalent stiffness and natural frequency.
The time dependence of the hydraulic transient loading has the form of a step function withconstant slope front with a rise time to peak force of the same order of the guide tubefundamental period in water. The dynamic application factor in determining the response isa function of the ramp impulse rise time divided by the period of the structure.
Upper Support Columns - Upper support columns located close to the broken nozzle duringhot leg break will be subjected to transverse loads due to cross flow.
The loads applied to the columns were computed with a similar method to the one for theguide tubes, i.e., taking into consideration the increase in flow across the column during theaccident. The columns were studied as beams with variable section and the resulting stresseswere obtained using the reduced section modulus at the slotted portions.
USAR - Rev. 1814.3-25 11/01/2003

Transverse Excitation Model for Earthquake
The reactor building with the reactor vessel support, the reactor vessel, and the reactorinternals are included in this analysis. The mathematical model of the building, attached toground, is identical to that used to evaluate the building structure. The reactor internals aremathematically modeled by beams, concentrated masses and linear springs.
All masses, water and metal are included in the mathematical model. All beam elementshave the component weight or mass distribution uniformly, e.g., the fuel assembly-mass andbarrel mass. Additionally, wherever components are attached uniformly their mass isincluded as an additional uniform mass, e.g., baffles and formers acting on the corebarrel. The water near and about the beam elements is also included as a distributedmass. Horizontal components are considered as a concentrated mass acting on thebarrel. This concentrated mass also includes components attached to the horizontalmembers, since these are the media through which the reaction is transmitted. The waternear and about these separated components is considered as being additive at theseconcentrated mass points.
The concentrated masses attached to the barrel represent the following:
* the upper core support structure, including the upper vessel head and one-half the upperinternals;
* the upper core plate, including one-half the thermal shield and the other one-half of theupper internals;
+ the lower core plate, including one-half of the lower core support columns;* the lower one-half of the thermal shield, and* the lower core support, including the lower instrumentation and the remaining half of the
lower core support columns.
The modulus of elasticity is chosen at its hot value for the three major materials found in thevessel, internals, and fuel assemblies. In considering shear deformation, the appropriatecross-sectional area is selected along with a value for Poisson's ratio. The fuel assemblymoment of inertia is derived from experimental results by static and dynamic tests performedon fuel assembly modes. These tests provide stiffness values for use in this analysis.
The fuel assemblies are assumed to act together and are represented by a single beam. Thefollowing assumptions are made in regard to connection restraints. The vessel is pinned tothe vessel support and part of the containment building. The barrel is clamped to the vesselat the barrel flange and spring-connected to the vessel at the lower core barrel radialsupport. This spring corresponds to the radial support stiffness for two opposite supportsacting together. The beam representing the fuel assemblies is pinned to the barrel at thelocations of the upper and lower core plates.
The response spectrum method has been used in the calculation. After computing thetransverse natural frequency and obtaining the normal modes of the complete structure, themaximum response is obtained from the superposition of the usual mode response with the
USAR - Rev. 1814.3-26 11/01/2003

conservative assumptions that all the modes are in phase and that all the peaks occursimultaneously.
Conclusions - Mechanical Analysis
The results of the analysis applicable to the Kewaunee design are presented in Table 14.3-3aand Table 14.3-3b. These tables summarize the maximum deflections and stresses forblowdown, seismic, and blowdown plus seismic loadings.
The stresses due to the DBE (vertical and horizontal components) were combined in the mostunfavorable manner with the blowdown stresses in order to obtain the largest principal stressand deflection.
These results indicate that the maximum deflections and stress in the critical structures arebelow the established allowable limits. For the transverse excitation, it is shown that theupper barrel does not buckle during a hot leg break and that it has an allowable stressdistribution during a cold leg break. Section 5.9, under Primary Piping, discusses therestraints which were added to restrain the reactions of jet forces in the primary loop pipingcaused by pipe rupture, to limit the LOCA loads.
Even though control rod insertion is not required for plant shutdown, this analysis shows thatmost of the guide tubes will deform within the limits established experimentally to assurecontrol rod insertion with the exceptions shown in Table 14.3-3a. It can be seen in theTable that 31 of the 33 guide tubes are below the NLF limit. For those guide tubes deflectedabove the NLF limit, it must be assumed that the rods will not drop. However, theconclusion reached is that the core will shutdown in an orderly fashion due to the formationof voids, and this orderly shutdown will be aided by the great majority of rods that do drop.
14.3.4 CONTAINMENT INTEGRITY EVALUATION
14.3.4.1 Long Term LOCA Mass and Energy Releases
The uncontrolled release of pressurized high-temperature reactor coolant, termed a loss-of-coolant accident (LOCA), will result in release of steam and water into thecontainment. This, in turn, will result in increases in the local subcompartment pressures,and an increase in the global containment pressure and temperature. Therefore, there areboth long- and short-term issues reviewed relative to a postulated LOCA that must beconsidered at the conditions for the Kewaunee Nuclear Power Plant (KNPP) with Model54F steam generators.
The long-term LOCA mass and energy releases are analyzed to approximately 106 secondsand are utilized as input to the containment integrity analysis. This demonstrates theacceptability of the containment safeguards systems to mitigate the consequences of ahypothetical large-break LOCA. The containment safeguards systems must be capable oflimiting the peak containment pressure to less than the design pressure. For this program,Westinghouse generated the mass and energy releases using the March 1979 model,
USAR - Rev. 1814.3-27 11/01/2003

described in Reference 1. The Nuclear Regulatory Commission (NRC) review andapproval letter is included with Reference 1. The following sections discuss the long-termLOCA mass and energy releases. The results of this analysis were provided for use in thecontainment integrity analysis.
Input Parameters and Assumptions
The mass and energy release analysis is sensitive to the assumed characteristics of variousplant systems, in addition to other key modeling assumptions. Where appropriate,bounding inputs are utilized and instrumentation uncertainties are included. For example,the RCS operating temperatures are chosen to bound the highest average coolanttemperature range of all operating cases and a temperature uncertainty allowance of(+4.00 F) is then added. Nominal parameters are used in certain instances. For example,the RCS pressure in this analysis is based on a nominal value of 2250 psia plus anuncertainty allowance (+30 psi). All input parameters are chosen consistent with acceptedanalysis methodology.
Some of the most critical items are the RCS initial conditions, core decay heat, safetyinjection flow, and primary and secondary metal mass and steam generator heat releasemodeling. Specific assumptions concerning each of these items are discussed in thefollowing paragraphs. Tables 14.3.4-1 through 14.3.4-3 present key data assumed in theanalysis.
The core rated power of 1683 MWt adjusted for calorimetric error (i.e., 102% of 1650MWt) was used in the analysis. As previously noted, the use of RCS operatingtemperatures to bound the highest average coolant temperature range were used asbounding analysis conditions. The use of higher temperatures is conservative because theinitial fluid energy is based on coolant temperatures that are at the maximum levels attainedin steady-state operation. Additionally, an allowance to account for instrument error anddeadband is reflected in the initial RCS temperatures. The selection of 2250 psia as thelimiting pressure is considered to affect the blowdown phase results only, since thisrepresents the initial pressure of the RCS. The RCS rapidly depressurizes from this valueuntil the point at which it equilibrates with containment pressure.
The rate at which the RCS blows down is initially more severe at the higher RCSpressure. Additionally the RCS has a higher fluid density at the higher pressure (assuminga constant temperature) and subsequently has a higher RCS mass available forreleases. Thus, 2250 psia plus uncertainty was selected for the initial pressure as thelimiting case for the long-term mass and energy release calculations.
The selection of the fuel design features for the long-term mass and energy releasecalculation is based on the need to conservatively maximize the energy stored in the fuel atthe beginning of the postulated accident (i.e., to maximize the core stored energy). Thecore stored energy that was selected to bound the Siemens Power Corporation (SPC) fuelproduct that is currently in Kewaunee was 6.4 full power seconds (FPS), which isequivalent to the value for standard Westinghouse 14 x 14 fuel at beginning-of-life (BOL)
USAR - Rev. 18 |14.3-28 11/01/2003 I

conditions. The margins in the core stored energy include +15% in order to address thethermal fuel model and associated manufacturing uncertainties and the time in the fuelcycle for maximum fuel densification. Thus, the analysis very conservatively accounts forthe stored energy in the core.
Margin in RCS volume of 3% (which is composed of 1.6% allowance for thermalexpansion and 1.4% allowance for uncertainty) was modeled.
A uniform steam generator tube plugging level of 0% was modeled. This assumptionmaximizes the reactor coolant volume and fluid release by virtue of consideration of theRCS fluid in all steam generator tubes. During the post-blowdown period, the steamgenerators are active heat sources since significant energy remains in the secondary metaland secondary mass that has the potential to be transferred to the primary side. The 0%tube plugging assumption maximizes the heat transfer area and, therefore, the transfer ofsecondary heat across the steam generator tubes. Additionally, this assumption reduces thereactor coolant loop resistance, which reduces the AP upstream of the break for the pumpsuction breaks and increases break flow. Thus, the analysis conservatively accounts for thelevel of steam generator tube plugging.
The secondary-to-primary heat transfer is maximized by assuming conservative heattransfer coefficients. This conservative energy transfer is ensured by maximizing the initialinternal energy of the inventory in the steam generator secondary side. This internalenergy is based on full-power operation plus uncertainties.
Regarding safety injection flow, the mass and energy release calculation consideredconfigurations/failures to conservatively bound respective alignments. The casesinclude: (a) a minimum safeguards case (1 high-head safety injection (HHSI) and 1 low-head safety injection (LHSI) pumps) (see Table 14.3.4-2); and (b) a maximum safeguardscase, (2 HHSI and 2 LHSI pumps) (see Table 14.3.4-3). In addition, the containmentbackpressure is assumed to be equal to the containment design pressure. This assumptionwas shown in Reference I to be conservative for the generation of mass and energyreleases.
In summary, the following assumptions were employed to ensure that the mass and energyreleases are conservatively calculated, thereby maximizing energy release to containment:
1. Maximum expected operating temperature of the RCS (100% full-power conditions)
2. Allowance for RCS temperature uncertainty (+4.00 F)
3. Margin in RCS volume of 3% (which is composed of 1.6% allowance for thermalexpansion, and 1.4% allowance for uncertainty)
4. Core rated power of 1650 MWt
5. Allowance for calorimetric error (+2% of power)
USAR - Rev. 1814.3-29 11/01/2003

6. Conservative heat transfer coefficients (i.e., steam generator primary/secondary heattransfer, and RCS metal heat transfer)
7. Allowance in core stored energy for effect of fuel densification
8. A margin in core stored energy (+15% to account for manufacturing tolerances)
9. An allowance for RCS initial pressure uncertainty (+30 psi)
10. A maximum containment backpressure equal to design pressure (46.0 psig)
11. Steam generator tube plugging leveling (0% uniform)* Maximizes reactor coolant volume and fluid release* Maximizes heat transfer area across the steam generator tubes* Reduces coolant loop resistance, which reduces the AP upstream of the break for
the pump suction breaks and increases break flow
Thus, based on the previously discussed conditions and assumptions, an analysis ofKewaunee was made for the release of mass and energy from the RCS in the event of aLOCA at 1683 MWt.
Description of Analyses
The evaluation model used for the long-term LOCA mass and energy release calculationsis the March 1979 model described in Reference 1.
This report section presents the long-term LOCA mass and energy releases generated insupport of the Kewaunee SGR Program. These mass and energy releases are thensubsequently used in the containment integrity analysis.
The mass and energy release rates described form the basis of further computations toevaluate the containment following the postulated accident. Discussed in this section arethe long-term LOCA mass and energy releases for the hypothetical double-ended pumpsuction (DEPS) rupture with minimum safeguards and maximum safeguards and double-ended hot leg (DEHL) rupture break cases. The mass and energy releases for these threecases are shown in Tables 14.3.44 through 14.3.4-18. These three LOCA cases are usedfor the long-term containment integrity analyses in Section 14.3.4.2.
LOCA Mass and Energy Release Phases
The containment system receives mass and energy releases following a postulated rupturein the RCS. These releases continue over a time period, which, for the LOCA mass andenergy analysis, is typically divided into four phases.
USAR - Rev. 1814.3-30 11/01/2003

1. Blowdown - the period of time from accident initiation (when the reactor is at steady-state operation) to the time that the RCS and containment reach an equilibrium state.
2. Refill - the period of time when the lower plenum is being filled by accumulator andemergency core cooling system (ECCS) water. At the end of blowdown, a largeamount of water remains in the cold legs, downcomer, and lower plenum. Toconservatively consider the refill period for the purpose of containment mass andenergy releases, it is assumed that this water is instantaneously transferred to the lowerplenum along with sufficient accumulator water to completely fill the lowerplenum. This allows an uninterrupted release of mass and energy tocontainment. Thus, the refill period is conservatively neglected in the mass and energyrelease calculation.
3. Reflood - begins when the water from the lower plenum enters the core and ends whenthe core is completely quenched.
4. Post-reflood (Froth) - describes the period following the reflood phase. For the pumpsuction break, a two-phase mixture exits the core, passes through the hot legs, and issuperheated in the steam generators prior to exiting the break as steam. After thebroken loop steam generator cools, the break flow becomes two phase.
Computer Codes
The Reference 1 mass and energy release evaluation model is comprised of mass andenergy release versions of the following codes: SATAN VI, WREFLOOD, FROTH, andEPITOME. These codes were used to calculate the long-term LOCA mass and energyreleases for Kewaunee.
SATAN VI calculates blowdown, the first portion of the thermal-hydraulic transientfollowing break initiation, including pressure, enthalpy, density, mass and energy flowrates, and energy transfer between primary and secondary systems as a function of time.
The WREFLOOD code addresses the portion of the LOCA transient where the corereflooding phase occurs after the primary coolant system has depressurized (blowdown)due to the loss of water through the break and when water supplied by the ECCS refills thereactor vessel and provides cooling to the core. The most important feature ofWREFLOOD is the steam/water mixing model.
FROTH models the post-reflood portion of the transient. The FROTH code is used for thesteam generator heat addition calculation from the broken and intact loop steam generators.
EPITOME continues the FROTH post-reflood portion of the transient from the time atwhich the secondary equilibrates to containment design pressure to the end of thetransient. It also compiles a summary of data on the entire transient, including formalinstantaneous mass and energy release tables and mass and energy balance tables with dataat critical times.
USAR - Rev. 1814.3-31 11/01/2003

Break Size and Location
Generic studies have been performed with respect to the effect of postulated break size onthe LOCA mass and energy releases. The double-ended guillotine break has been found tobe limiting due to larger mass flow rates during the blowdown phase of thetransient. During the reflood and froth phases, the break size has little effect on thereleases.
Three distinct locations in the RCS loop can be postulated for a pipe rupture for mass andenergy release purposes:
* Hot leg (between vessel and steam generator)* Cold leg (between pump and vessel)* Pump suction (between steam generator and pump)
The break locations analyzed for this program are the DEPS rupture (10.46 ft2) and theDEHL rupture (9.154 ft2). Break mass and energy releases have been calculated for theblowdown, reflood, and post-reflood phases of the LOCA for the DEPS cases. For theDEHL case, the releases were calculated only for the blowdown. The followinginformation provides a discussion on each break location.
The DEHL rupture has been shown in previous studies to result in the highest blowdownmass and energy release rates. Although the core flooding rate would be the highest forthis break location, the amount of energy released from the steam generator secondary isminimal because the majority of the fluid that exits the core vents directly to containmentbypassing the steam generators. As a result, the reflood mass and energy releases arereduced significantly as compared to either the pump suction or cold leg break locationswhere the core exit mixture must pass through the steam generators before venting throughthe break. For the hot leg break, generic studies have confirmed that there is no refloodpeak (i.e., from the end of the blowdown period the containment pressure wouldcontinually decrease). Therefore, only the mass and energy releases for the hot leg breakblowdown phase are calculated and presented in this section of the report.
The cold leg break location has also been found in previous studies to be much less limitingin terms of the overall containment energy releases. The cold leg blowdown is faster thanthat of the pump suction break, and more mass is released into the containment. However,the core heat transfer is greatly reduced, and this results in a considerably lower energyrelease into containment. Studies have determined that the blowdown transient for the coldleg is, in general, less limiting than that for the pump suction break. During reflood, theflooding rate is greatly reduced and the energy release rate into the containment isreduced. Therefore, the cold leg break is bounded by other breaks and no furtherevaluation is necessary.
The pump suction break combines the effects of the relatively high core flooding rate, as inthe hot leg break, and the addition of the stored energy in the steam generators. As a result,
USAR - Rev. 1814.3-32 11/01/2003

the pump suction break yields the highest energy flow rates during the post-blowdownperiod by including all of the available energy of the RCS in calculating the releases tocontainment. Thus, only the DEHL and DEPS cases are used to analyze long-term LOCAcontainment integrity.
Application of Single-Failure Criterion
An analysis of the effects of the single-failure criterion has been performed on the massand energy release rates for each break analyzed. An inherent assumption in the generationof the mass and energy release is that offsite power is lost. This results in the actuation ofthe emergency diesel generators, required to power the safety injection system. This is notan issue for the blowdown period, which is limited by the DEHL break.
Two cases have been analyzed to assess the effects of a single failure. The first caseassumes minimum safeguards safety injection (SI) flow based on the postulated singlefailure of an emergency diesel generator. This results in the loss of one train of safeguardsequipment. The other case assumes maximum safeguards SI flow based on no postulatedfailures that would impact the amount of ECCS flow. The analysis of the cases describedprovides confidence that the effect of credible single failures is bounded.
Acceptance Criteria for Analyses
A large break loss-of-coolant accident is classified as an American Nuclear Society (ANS)Condition IV event, an infrequent fault. To satisfy the NRC acceptance criteria presentedin the Standard Review Plan, Section 6.2.1.3, the relevant requirements are the following:
* 10 CFR 50, Appendix A* 10 CFR 50, Appendix K, paragraph I.A
To meet these requirements, the following must be addressed:
* Sources of energy* Break size and location* Calculation of each phase of the accident
Blowdown Mass and Energy Release Data
The SATAN-VI code is used for computing the blowdown transient. The code utilizes thecontrol volume (element) approach with the capability for modeling a large variety ofthermal fluid system configurations. The fluid properties are considered uniform andthermodynamic equilibrium is assumed in each element. A point kinetics model is usedwith weighted feedback effects. The major feedback effects include moderator density,moderator temperature, and Doppler broadening. A critical flow calculation for subcooled(modified Zaloudek), two-phase (Moody), or superheated break flow is incorporated intothe analysis. The methodology for the use of this model is described in Reference 1.
USAR - Rev. 1814.3-33 11/01/2003

Table 14.3.44 presents the calculated mass and energy release for the blowdown phase ofthe DEHL break for Kewaunee. For the hot leg break mass and energy release tables,break path I refers to the mass and energy exiting from the reactor vessel side of the break;break path 2 refers to the mass and energy exiting from the steam generator side of thebreak.
Table 14.3.4-7 presents the calculated mass and energy releases for the blowdown phase ofthe DEPS break. For the pump suction breaks, break path 1 in the mass and energy releasetables refers to the mass and energy exiting from the steam generator side of thebreak. Break path 2 refers to the mass and energy exiting from the pump side of the break.
Reflood Mass and Energy Release Data
The WREFLOOD code is used for computing the reflood transient. The NVREFLOODcode consists of two basic hydraulic models - one for the contents of the reactor vesseland one for the coolant loops. The two models arc coupled through the interchange of theboundary conditions applied at the vessel outlet nozzles and at the top - of thedowncomer. Additional transient phenomena such as pumped safety injection andaccumulators, reactor coolant pump performance, and steam generator release are includedas auxiliary equations that interact with the basic models as required. The WREFLOODcode permits the capability to calculate variations during the core reflooding transient ofbasic parameters such as core flooding rate, core and downcomer water levels, fluidthermodynamic conditions (pressure, enthalpy, density) throughout the primary system,and mass flow rates through the primary system. The code permits hydraulic modeling ofthe two flow paths available for discharging steam and entrained water from the core to thebreak, i.e., the path through the broken loop and the path through the unbroken loops.
A complete thermal equilibrium mixing condition for the steam and ECCS injection waterduring the reflood phase has been assumed for each loop receiving ECCS water. This isconsistent with the usage and application of the Reference I mass and energy releaseevaluation model in recent analyses, e.g., D. C. Cook Docket (Reference 3). Even thoughthe Reference 1 model credits steam/water mixing only in the intact loop and not in thebroken loop, the justification, applicability, and NRC approval for using the mixing modelin the broken loop has been documented (Reference 3). Moreover, this assumption issupported by test data and is further discussed below.
The model assumes a complete mixing condition (i.e., thermal equilibrium) for thesteam/water interaction. The complete mixing process, however, is made up of two distinctphysical processes. The first is a two-phase interaction with condensation of steam by coldECCS water. The second is a single-phase mixing of condensate and ECCS water. Sincethe steam release is the most important influence to the containment pressure transient, thesteam condensation part of the mixing process is the only part that need beconsidered. (Any spillage directly heats only the sump.)
The most applicable steam/water mixing test data have been reviewed for validation of thecontainment integrity reflood steam/water mixing model. This data was generated in
USAR - Rev. 1814.3-34 11/01/2003

1/3-scale tests (Reference 4), which are the largest scale data available and thus mostclearly simulates the flow regimes and gravitational effects that would occur in apressurized water reactor (PWR). These tests were designed specifically to study thesteam/water interaction for PWR reflood conditions.
A group of 1/3-scale tests corresponds directly to containment integrity reflood conditions.The injection flow rates for this group cover all phases and mixing conditions calculatedduring the reflood transient. The data from these tests were reviewed and discussed indetail in Reference 1. For all of these tests, the data clearly indicate the occurrence of veryeffective mixing with rapid steam condensation. The mixing model used in thecontainment integrity reflood calculation is, therefore, wholly supported by the 1/3-scalesteam/water mixing data.
Additionally, the following justification is also noted. The post-blowdown limiting breakfor the containment integrity peak pressure analysis is the pump suction double-endedrupture break. For this break, there are two flow paths available in the RCS by which massand energy may be released to containment. One is through the outlet of the steamgenerator, the other via reverse flow through the reactor coolant pump. Steam that is notcondensed by ECCS injection in the intact RCS loops passes around the downcomer andthrough the broken loop cold leg and pump in venting to containment. This steam alsoencounters ECCS injection water as it passes through the broken loop cold leg, completemixing occurs and a portion of it is condensed. It is this portion of steam that is condensedthat is taken credit for in this analysis. This assumption is justified based upon thepostulated break location, and the actual physical presence of the ECCS injectionnozzle. A description of the test and test results are contained in References 1 and 3.
Tables 14.3.4-8 and 14.3.4-13 present the calculated mass and energy releases for thereflood phase of the pump suction double-ended rupture, minimum safeguards, andmaximum safeguards cases, respectively.
The transient response of the principal parameters during reflood are given inTables 14.3.4-9 and 14.3.4-14 for the DEPS cases.
Post-Reflood Mass and Energy Release Data
The FROTH code (Reference 2) is used for computing the post-reflood transient. TheFROTH code calculates the heat release rates resulting from a two-phase mixture present inthe steam generator tubes. The mass and energy releases that occur during this phase aretypically superheated due to the depressurization and equilibration of the broken loop andintact loop steam generators. During this phase of the transient, the RCS has equilibratedwith the containment pressure. However, the steam generators contain a secondaryinventory at an enthalpy that is much higher than the primary side. Therefore, there is asignificant amount of reverse heat transfer that occurs. Steam is produced in the core dueto core decay heat. For a pump suction break, a two-phase fluid exits the core, flowsthrough the hot legs, and becomes superheated as it passes through the steamgenerator. Once the broken loop cools, the break flow becomes two phase. During the
USAR - Rev. 1814.3-35 11/01/2003
FROTH calculation, ECCS injection is addressed for both the injection phase and therecirculation phase. The FROTH code calculation stops when the secondary sideequilibrates to the saturation temperature (Tsat) at the containment design pressure, afterthis point the EPITOME code completes the steam generator depressurization.
The methodology for the use of this model is described in Reference 1. The mass andenergy release rates are calculated by FROTH and EPITOME until the time of containmentdepressurization. After containment depressurization (14.7 psia), the mass and energyrelease available to containment is generated directly from core boil-off/decay heat.
Tables 14.3.4-10 and 14.3.4-15 present the two-phase post-reflood mass and energy releasedata for the pump suction double-ended break cases.
Decay Heat Model
On November 2, 1978, the Nuclear Power Plant Standards Committee (NUPPSCO) of theANS approved ANS Standard 5.1 (Reference 5) for the determination of decay heat. Thisstandard was used in the mass and energy release model for Kewaunee. Table 14.3.4-18lists the decay heat curve used in the Kewaunee steam generator replacement mass andenergy release analysis.
Significant assumptions in the generation of the decay heat curve for use in the LOCAmass and energy releases analysis include the following:
1. The decay heat sources considered are fission product decay and heavy element decayof U-239 and Np-239.
2. The decay heat power from fissioning isotopes other than U-235 is assumed to beidentical to that of U-235.
3. The fission rate is constant over the operating history of maximum power level.
4. The factor accounting for neutron capture in fission products has been taken fromReference 5.
5. The fuel has been assumed to be at full power for I08 seconds.
6. The total recoverable energy associated with one fission has been assumed to be200 MeV/fission.
7. Two sigma uncertainty (two times the standard deviation) has been applied to thefission product decay.
Based upon NRC staff review, (Safety Evaluation Report [SER] of the March 1979evaluation model [Reference 1]), use of the ANS Standard-5.1, November 1979 decay heat
USAR - Rev. 1814.3-36 11/01/2003
model was approved for the calculation of mass and energy releases to the containmentfollowing a LOCA.
Steam Generator Equilibration and Depressurization
Steam generator equilibration and depressurization is the process by which secondary-sideenergy is removed from the steam generators in stages. The FROTH computer codecalculates the heat removal from the secondary mass until the secondary temperature is thesaturation temperature (Tsa.) at the containment design pressure. After the FROTHcalculations, the EPITOME code continues the FROTH calculation for steam generatorcooldown removing steam generator secondary energy at different rates (i.e., first- andsecond-stage rates). The first-stage rate is applied until the steam generator reaches Tsat atthe user specified intermediate equilibration pressure, when the secondary pressure isassumed to reach the actual containment pressure. Then the second-stage rate is used untilthe final depressurization, when the secondary reaches the reference temperature of Tt at14.7 psia, or 2120F. The heat removal of the broken loop and intact loop steam generatorsare calculated separately.
During the FROTH calculations, steam generator heat removal rates are calculated usingthe secondary-side temperature, primary-side temperature and a secondary-side heattransfer coefficient determined using a modified McAdam's correlation. Steam generatorenergy is removed during the FROTH transient until the secondary-side temperaturereaches saturation temperature at the containment design pressure. The constant heatremoval rate used during the first heat removal stage is based on the final heat removal ratecalculated by FROTH. The steam generator energy available to be released during the firststage interval is determined by calculating the difference in secondary energy available atthe containment design pressure and that at the (lower) user-specified intermediateequilibration pressure, assuming saturated conditions. This energy is then divided by thefirst-stage energy removal rate, resulting in an intermediate equilibration time. At thistime, the rate of energy release drops substantially to the second-stage rate. The second-stage rate is determined as the fraction of the difference in secondary energy availablebetween the intermediate equilibration and final depressurization at 2120 F, and the timedifference from the time of the intermediate equilibration to the user-specified time of thefinal depressurization at 212'F. With current methodology, all of the secondary energyremaining after the intermediate equilibration is conservatively assumed to be released byimposing a mandatory cooldown and subsequent depressurization down to atmosphericpressure at 3600 seconds, i.e., 14.7 psia and 212'F (the mass and energy balance tableshave this point labeled as "Available Energy").
Sources of Mass and Energy
The sources of mass considered in the LOCA mass and energy release analysis are given inTables 14.3.4-5, 14.3.4-11, and 14.3.4-16. These sources are the RCS, accumulators, andpumped safety injection.
USAR - Rev. 1814.3-37 11/01/2003

The energy inventories considered in the LOCA mass and energy release analysis are givenin Tables 14.3.4-6, 14.3.4-12, and 14.3.4-17. The energy sources arc the following:
* Reactor coolant system water* Accumulator water (both inject)* Pumped safety injection water* Decay heat* Core-stored energy* Reactor coolant system metal (includes steam generator tubes)* Steam generator metal (includes transition cone, shell, wrapper, and other internals)* Steam generator secondary energy (includes fluid mass and steam mass)* Secondary transfer of energy (feedwater into and steam out of the steam generator
secondary)
The analysis used the following energy reference points:
* Available energy: 2120F; 14.7 psia [energy available that could be released]* Total energy content: 320F; 14.7 psia [total internal energy of the RCS]
The mass and energy inventories are presented at the following times, as appropriate:
* Time zero (initial conditions)* End of blowdown time* End of refill time* End of reflood time* Time of broken loop steam generator equilibration to pressure setpoint* Time of intact loop steam generator equilibration to pressure setpoint* Time of full depressurization (3600 seconds)
In the mass and energy release data presented, no Zirc-water reaction heat was consideredbecause the cladding temperature does not rise high enough for the rate of the Zirc-waterreaction heat to proceed.
14.3.4.2 Long-Term LOCA Containment Response (COCO) Analysis
Accident Description
The Kewaunee Nuclear Power Plant (KNPP) containment system is designed so that for allloss-of-coolant accident (LOCA) break sizes, up to and including the double-endedseverance of a reactor coolant pipe, the containment peak pressure remains below thedesign pressure. This section details the containment response subsequent to a hypotheticalLOCA. The containment response analysis uses the long-term mass and energy releasedata from Section 14.3.4.1.
USAR-Rev. 1814.3-38 11/01/2003

The containment response analysis demonstrates the acceptability of the containmentsafeguards systems to mitigate the consequences of a LOCA inside containment. Theimpact of LOCA mass and energy releases on the containment pressure is addressed toensure that the containment pressure remains below its design pressure at the licensed corepower conditions. In support of equipment design and licensing criteria (e.g., qualifiedoperating life), with respect to post-accident environmental conditions, long-termcontainment pressure and temperature transients are generated to conservatively bound thepotential post-LOCA containment conditions.
Input Parameters and Assumptions
An analysis of containment response to the rupture of the reactor coolant system (RCS)must start with knowledge of the initial conditions in the containment. The pressure,temperature, and humidity of the containment atmosphere prior to the postulated accidentare specified in the analysis and are shown in Table 14.3.4-19.
Also, values for the initial temperature of the service water (SW) and refueling waterstorage tank (RWST) are assumed, along with containment spray (CS) pump flow rate andcontainment fan coil unit (CFCU) heat removal performance. All of these values arechosen conservatively, as shown in Table 14.3.4-19. Long-term sump recirculation isaddressed via residual heat removal system (RHR) heat exchanger (HX) performance. Theprimary function of the RHR system is to remove heat from the core by way of low-headsafety injection. Table 14.3.4-19 provides the RHR system parameters assumed in theanalysis.
A series of analyses, using different break sizes and locations, was performed for theLOCA containment response. Section 14.3.4.1 documented the mass and energy releasesfor the minimum and maximum safeguards cases for a double-ended pump suction (DEPS)break and the releases from the blowdown of a double-end hot leg (DEHL) break.
For the maximum safeguards DEPS case, a failure of a containment spray pump wasassumed as the single failure. This leaves one containment spray pump and four CFCUsavailable as active heat removal systems. Table 14.3.4-20 provides the performance datafor one spray pump in operation. (Note: For the maximum safeguards case, a limitingassumption was made concerning the modeling of the recirculation system, i.e., heatexchangers. Minimum safeguards data were conservatively used to model the RHR HXs,i.e., one RHR HX was credited for residual heat removal. Emergency safeguardsequipment data are given in Table 14.3.4-19.)
The minimum safeguards case was based upon a diesel train failure. This leaves onecontainment spray pump and two CFCUs available as active heat removal systems. Due tothe duration of the DEHL transient (i.e., blowdown only), no containment safeguardsequipment is modeled.
The calculations for all of the DEPS cases were performed for 1 million seconds(approximately 11.6 days). The DEHL cases were terminated soon after the end of the
USAR - Rev. 18 |
14.3-39 11/01/2003 I

blowdown. The sequence of events for each of these cases is shown in Tables 14.3.4-21through 14.3.4-23.
The following are the major assumptions made in the analysis:
1. The mass and energy released to the containment are described in Section 14.3.4.1 forLOCA.
2. Homogeneous mixing is assumed. The steam-air mixture and the water phases eachhave uniform properties. More specifically, thermal equilibrium between the air andthe steam is assumed. However, this does not imply thermal equilibrium between thesteam-air mixture and the water phase.
3. Air is taken as an ideal gas, while compressed water and steam tables are employed forwater and steam thermodynamic properties.
4. For the blowdown portion of the LOCA analysis, the discharge flow separates intosteam and water phases at the breakpoint. The saturated water phase is at the totalcontainment pressure, while the steam phase is at the partial pressure of the steam inthe containment. For the post-blowdown portion of the LOCA analysis, steam andwater releases are input separately.
5. The saturation temperature at the partial pressure of the steam is used for heat transferto the heat sinks and the fan coolers.
Description of COCO Model
Calculation of containment pressure and temperature is accomplished by use of the digitalcomputer code COCO (Reference 6). COCO is a mathematical model of a generalizedcontainment. The proper selection of various options in the code allows the creation of aspecific model for particular containment design. The values used in the specific model fordifferent aspects of the containment are derived from plant-specific input data. The COCOcode has been used and found acceptable to calculate containment pressure transients formany dry containment plants, most recently including Vogtle Units 1 and 2, Turkey PointUnits 3 and 4, Salem Units I and 2, Diablo Canyon Units 1 and 2, Indian Point Unit 2, andIndian Point 3. Transient phenomena within the RCS affect containment conditions bymeans of convective mass and energy transport through the pipe break.
For analytical rigor and convenience, the containment air-steam-water mixture is separatedinto a water (pool) phase and a steam-air phase. Sufficient relationships to describe thetransient are provided by the equations of conservation of mass and energy as applied toeach system, together with appropriate boundary conditions. As thermodynamic equationsof state and conditions may vary during the transient, the equations have been derived forall possible cases of superheated or saturated steam and subcooled or saturatedwater. Switching between states is handled automatically by the code.
USAR - Rev. 1814.3-40 11/01/2003

Passive Heat Removal
The significant heat removal source during the early portion of the transient is thecontainment structural heat sinks. Provision is made in the containment pressure responseanalysis for heat transfer through, and heat storage in, both interior and exteriorwalls. Every wall is divided into a large number of nodes. For each node, a conservationof energy equation expressed in finite-difference form accounts for heat conduction intoand out of the node and temperature rise of the node. Table 14.3.4-24 is the summary ofthe containment structural heat sinks used in the analysis. The thermal properties of eachheat sink material are shown in Table 14.3.4-25.
The heat transfer coefficient to the containment structure for the early part of the event iscalculated based primarily on the work of Tagami (Reference 7). From this work, it wasdetermined that the value of the heat transfer coefficient can be assumed to increaseparabolically to a peak value. In COCO, the value then decreases exponentially to astagnant heat transfer coefficient which is a function of steam-to-air-weight ratio.
The h for stagnant conditions is based upon Tagami's steady-state results.
Tagami presents a plot of the maximum value of the heat transfer coefficient, h, as functionof "coolant energy transfer speed," defined as follows:
total coolant energy transferred into containment(containment volume) (time interval to peak pressure)
From this, the maximum heat transfer coefficient of steel is calculated:
0.60
h.. = (5 (Equation 1)
where:
hmax = maximum value of h (Btulhr fl2 0F).tp = time from start of accident to end of blowdown for LOCA and steam line isolation
for secondary breaks (see).V = containment net free volume (ft3).E = total coolant energy discharge from time zero to tp(Btu).75 = material coefficient for steel.
(Note: Paint is accounted for by the thermal conductivity of the material (paint) on the heatsink structure, not by an adjustment on the heat transfer coefficient.)
The basis for the equations is a Westinghouse curve fit to the Tagami data.
The parabolic increase of the heat transfer coefficient to the peak value is calculated byCOCO according to the following equation:
USAR - Rev. 1814.3-41 11/01/2003
=h 0 (Equation 2)
where:
h,= heat transfer coefficient between steel and air/steam mixture (Btu/hr ft2 0F).t = time from start of event (sec).
For concrete, the heat transfer coefficient is taken as 40 percent of the value calculated forsteel during the blowdown phase.
The exponential decrease of the heat transfer coefficient to the stagnant heat transfercoefficient is given by:
h. = h5,,g + (h. - h5,,g)e 005(1tP) t > t, (Equation 3)where:
hstag= 2 + 50X, 0 < X < 1.4.hstag= h for stagnant conditions (Btu/hr ft2 0F).X = steam-to-air weight ratio in containment.
Active Heat Removal
For a large break, the engineered safety features are quickly brought intooperation. Because of the brief period of time required to depressurize the RCS or the mainsteam system, the containment safeguards are not a major influence on the blowdown peakpressure. However, they reduce the containment pressure after the blowdown and maintaina low, long-term pressure and a low, long-term temperature.
Refueling Water Storage Tank, Injection
During the injection phase of post-accident operation, the low-head safety injection pumpswater from the RWST tank into the reactor vessel. Since this water enters the vessel atrefueling water storage tank temperature, which is less than the temperature of the water inthe vessel, it is modeled as absorbing heat from the core until the saturation temperature isreached. Safety injection and containment spray can be operated for a limited time,depending on the RWST capacity.
Residual Heat Removal, Sump Recirculation
After the supply of refueling water is exhausted, the recirculation system is operated toprovide long-term cooling of the core. In this operation, water is drawn from the sump,cooled in an RHR exchanger, then pumped back into the reactor vessel to remove coreresidual heat and energy stored in the vessel metal. The heat is removed from the RHR HX
USAR - Rev. 1814.3-42 11/01/2003

by the component cooling water (CCW). The RHR HXs and CCW HXs are coupled in aclosed-loop system, where the ultimate heat sink is the service water cooling to the CCWHX.
Containment Spray
Containment spray is an active removal mechanism that is used for rapid pressure reductionand for containment iodine removal. During the injection phase of operation, the CSpumps draw water from the RWST and spray it into the containment through nozzlesmounted high above the operating deck. As the spray droplets fall, they absorb heat fromthe containment atmosphere. Since the water comes from the RWST, the entire heatcapacity of the spray from the RWST temperature to the temperature of the containmentatmosphere is available for energy absorption. During the recirculation phase, credit istaken for the sprays.
When a spray droplet enters the hot, saturated, steam-air containment environment, thevapor pressure of the water at its surface is much less than the partial pressure of the steamin the atmosphere. Hence, there will be diffusion of steam to the drop surface andcondensation on the droplet. This mass flow will carry energy to thedroplet. Simultaneously, the temperature difference between the atmosphere and thedroplet will cause the droplet temperature and vapor pressure to rise. The vapor pressure ofthe droplet will eventually become equal to the partial pressure of the steam, and thecondensation will cease. The temperature of the droplet will essentially equal thetemperature of the steam-air mixture.
The equations describing the temperature rise of a falling droplet are as follows.
d (Mu) = mh, + q (Equation 4 - Heat transfer)
where,
M = droplet massu = internal energym = diffusion ratehg = steam enthalpyq = heat flow ratet = time
d (M) = m (Equation 5 - Mass transfer)
where,
q = hA * (T -T)m = kgA * (Ps - Pv)A = areah = coefficient of heat transfer
USAR - Rev. 1814.343 11/01/2003

kg = coefficient of mass transferT = droplet temperatureTs = steam temperaturePs = steam partial pressurePv = droplet vapor pressure
The coefficients of heat transfer (hJ) and mass transfer (kg) arc calculated from the Nusseltnumber for heat transfer, Nu, and the Nusselt number for mass transfer, Nu'. Both Nu andNu' may be calculated from the equations of Ranz and Marshall (Reference 8).
Nu = 2 + 0.6 (Re)1/2 (Pr)113 (Equation 6)
where,
Nu = Nusselt number for heat transferPr = Prandtl numberRc = Reynolds number
Nu' = 2 + 0.6(Re)12 (SC)"
3 (Equation 7)
where,
Nu' = Nusselt number for mass transferSc = Schmidt number
Thus, Equations 4 and 5 can be integrated numerically to find the internal energy and massof the droplet as a function of time as it falls through the atmosphere. Analysis shows thatthe temperature of the (mass) mean droplet produced by the spray nozzles rises to a valuewithin 99% of the bulk containment temperature in less than 2 seconds. Detailedcalculations of the heatup of spray droplets in post-accident containment atmospheres byParsly (Reference 9) show that droplets of all sizes encountered in the containment sprayreach equilibrium in a fraction of their residence time in a typical pressurized water reactorcontainment. These results confirm the assumption that the containment spray will be100% effective in removing heat from the atmosphere.
Containment Fan Coil Unit
The CFCUs are another means of heat removal. Each CFCU has a fan that draws in thecontainment atmosphere from the volume adjacent to the CFCU. Since the CFCUs do notuse water from the RWST, the mode of operation remains the same both before and afterthe low-head safety injection change to the recirculation mode. The steam/air mixture isrouted through the enclosed CFCU unit, past essential service water cooling coils. The fanthen discharges the air through ducting containing a check damper. The discharged air isdirected out emergency discharge dampers immediately adjacent to the CFCU. SeeTable 14.3.4-26 for CFCUs heat removal capability assumed for the containment responseanalyses.
USAR - Rev. 1814.3-44 11/01/2003

Acceptance Criteria
The containment response for design-basis containment integrity is an American NuclearSociety (ANS) Condition IV event, an infrequent fault. The relevant requirements tosatisfy Nuclear Regulatory Commission (NRC) acceptance criteria are as follows.
A. GDC 10 and GDC 49: To satisfy the requirements of GDC 10 and 49, the peakcalculated containment pressure should be less than the containment design pressureof 46 psig
B. GDC 52: To satisfy the requirements of GDC 52, the calculated pressure at 24 hoursshould be less than 50% of the peak calculated value. (This is related to the criteriafor doses at 24 hours.)
Analysis Results
The containment pressure, steam temperature and water (sump) temperature profiles fromeach of the LOCA cases are shown in Figures 14.3.4-1 and 14.3.4-6. Figures 14.3.4-1 and14.3.4-2 show the DEHL break transient and Figures 14.3.4-3 through 14.3.4-8 show theminimum safeguards and maximum safeguards DEPS break cases. Table 14.3.4-27summarizes the LOCA containment response results for the three cases studied.
Double-Ended Hot Leg Break
This analysis assumes a loss of offsite power coincident with a double-ended rupture of theRCS piping between the reactor vessel outlet nozzle and the steam generator inlet (i.e., abreak in the RCS hot leg). The associated single-failure assumption is the failure of adiesel to start, resulting in one train of low-head safety injection and containmentsafeguards equipment being available. This combination results in a minimum set ofsafeguards being available. Further, loss of offsite power delays the actuation times of thesafeguards equipment due to the required diesel startup time after receipt of the safetyinjection signal.
The postulated RCS break results in a rapid release of mass and energy to the containmentwith a resulting rapid rise in both the containment pressure and temperature. This rapidrise in containment pressure results in the generation of a containment high signal at 0.27seconds and a containment high-high signal at 3.0 seconds. The containment pressurecontinues to rise rapidly in response to the release of mass and energy until the end ofblowdown at 19.0 seconds, with the pressure reaching a value of 44.5 psig at 18.2seconds. The end of blowdown marks a time when the initial inventory in the RCS hasbeen exhausted and a process of filling the RCS downcomer in preparation for reflood hasbegun. Since the reflood for a hot leg break is very fast due to the low resistance to steamventing posed by the broken hot leg, Westinghouse terminates hot leg break mass andenergy release transients at end of blowdown. The basis for this is discussed in
USAR-Rev. 1814.3-45 11/01/2003

Section 14.3.4.1. Figures 14.3.4-1 and 14.3.4-2 show the pressure and steam temperaturetransients.
Double-Ended Pump Suction Break with Minimum Safeguards
This analysis assumes a loss of offsite power coincidence with a double-ended rupture ofthe RCS piping between the steam generator outlet and the RCS pump inlet (suction). Theassociated single-failure assumption is the failure of a diesel to start, resulting in one trainof safety injection pumps and containment safeguards equipment being available. Thiscombination results in a minimum set of safeguards being available. Further, loss of offsitepower delays the actuation times of the safeguards equipment due to the required dieselstartup time after receipt of the safety injection signal.
The postulated RCS break results in a rapid release of mass and energy to the containmentwith a resulting rapid rise in both the containment pressure and temperature. This rapidrise in containment pressure results in the generation of a containment high signal at0.28 seconds and a containment high-high signal at 2.7 seconds. The containment pressurecontinues to rise rapidly in response to the release of mass and energy until nearly the endof the blowdown phase. The end of blowdown phase at 14 seconds marks a time when theinitial inventory in the RCS has been exhausted and a slow process of filling the RCSdowncomer in preparation for reflood has begun. The accumulators, which began injectingat approximately 7 seconds, continue to inject until approximately 38 seconds when thenitrogen cover gas begins to be released to the containment. This increases thecontainment pressure to its overall peak of 43.0 psig during the early portion of the refloodphase at 58.8 seconds. Since the mass and energy release during the reflood period is lowand the containment fan coil units and containment sprays initiate, the containmentpressure decreases throughout the remainder of the reflood phase. At this juncture, bydesign of the model described in Section 6.3, energy removal from the steam generatorsecondaries begins at a very high rate. This results in a rise in containment pressure whilethe energy is being removed from the faulted loop steam generator, bringing the faultedloop steam generator secondary pressure into equilibrium with the containmentpressure. The result of this steam generator secondary energy release is a containmentpressure of approximately 39.5 psig at 900 seconds. After this event, the mass and energyreleased is reduced due to so much energy removal from the steam generators having beenaccomplished and the containment pressure slowly falls out to the time when the injectionsprays are terminated at 3802 seconds. The containment pressure is relatively stable untilthe recirculation begins at 3992 seconds when it again begins to decrease.
At this time, the low-head safety injection is realigned for recirculation resulting in anincrease in the safety injection temperature due to delivery from the hot sump. Thecontainment pressure continues to decrease due to lower decay heat, steam generatorenergy release, and continued CFCU cooling. This trend continues to the end of thetransient at 1.0E+06 seconds. Figures 14.3.4-3, 14.3.4-4, and 14.3.4-5 show the pressure,steam temperature, and sump temperature transients. Table 14.3.4-3 shows the detailedsequence of events.
USAR - Rev. 1814.3-46 11/01/2003

Double-Ended Pump Suction Break with Maximum Safeguards
The DEPS break with maximum safeguards has a transient history very similar to theminimum safeguards case. Table 14.3.4-4 provides the key sequence of events andTable 14.3.4-9 shows that a peak pressure of 42.5 psig at 58.6 seconds was calculated.
Conclusions
The LOCA containment response analyses have been performed as part of the SGRProgram for Kewaunee. The analyses included long-term pressure and temperatureprofiles for each case. As illustrated above, all cases resulted in a peak containmentpressure that was less than 46 psig. In addition, all long-term cases were well below 50percent of the peak value within 24 hours. Based on the results, all applicable criteria forKewaunee have been met.
14.3.5 OFF-SITE DOSE CONSEQUENCES
Introduction
The NRC has established guidelines in IOCFR 50.67 for radiation doses resulting fromaccidental releases of radioactivity from a reactor plant. This section shows the capability ofthe Kewaunee Nuclear Power Plant to stay within the dose criteria set forth in 10 CFR 50.67following the design basis accident with conservative assumptions including assumedconditions of release consistent with those of NRC Regulatory Guide 1 .183.
The Kewaunee Nuclear Power Plant Containment System is described in detail inSection 5. One feature of particular importance to the environmental consequences of a loss-of-coolant accident is the presence of two barriers, in series, to fission product leakage: theReactor Containment Vessel and the Shield Building.
Reactor Containment Vessel leakage is collected within an annular volume between thesebarriers before release; the annulus is, therefore, effective as a means of holding leakage fordecay and providing additional dilution prior to release. Release from the Shield Building tothe environment is through absolute and charcoal filters provided in the Shield BuildingVentilation (SBV) system. For reference in the evaluation of environmental consequences, aschematic diagram of this system is shown in Figure 14.3-35.
Shield Building Ventilation System fans establishes a negative pressure with respect to theatmosphere in the annulus within six minutes after the accident. The amount of filteredannulus air released to the environment is just sufficient to maintain the negative annuluspressure and compensate for in-leakage. The balance of the filtered annulus air isrecirculated to the Shield Building to provide for further decay and filtration.
A limited amount of containment leakage could potentially bypass the Shield Buildingannulus through certain lines that terminate in the Auxiliary Building. This leakage will becollected and processed by the Auxiliary Building Special Ventilation System. An even
USAR - Rev. 1814.3-47 11/01/2003

smaller amount of containment leakage may bypass both the Shield Building and theAuxiliary Building and go directly to the environment. Both of these pathways have beenevaluated.
Cause of Activity Release
The postulated cause of radioactivity release to the environment analyzed in this section is anextremely improbable double-ended rupture of a 29-inch inside diameter pipe in the reactorcoolant loop. Following the assumptions of NRC Regulatory Guide 1.183, it is assumed thatthe Design Basis Accident will release to the Reactor Containment Vessel the followingportions of the core activity:
+ 100% of the noble gases (Xe, Kr) (5%in the gap and 95% in the fuel)* 40%of the iodines (5% in the gap and 35% in the fuel)* 30% of the alkali metals (Cs, Rb) (5% in the gap and 25% in the fuel)* 5% of the tellurium metals (Te, Sb)+ 2% of the barium and strontium* 0.25% of the noble metals (Ru, Rh, Mo, Tc)* 0.05% of the cerium group (Ce, Pu, Np)+ 0.02% of the lanthanides (La, Zr, Nd, Nb, Pr, Y, Cm, Am)
The release of activity to containment occurs over a 1.8-hour interval. The gap activity isreleased in the first 30 minutes, and the fraction of the core activity that is released does soover the next 1.3 hours. A gap fraction of 5% is assumed for iodines, noble gases, and alkalimetals. Gap activity of the other nuclides is not considered. With the exception of theiodines and noble gases, all activity released to containment is modeled as particulates. Theiodine in containment is modeled as 4.85% elemental, 0.15% organic, and 95% particulate.A homogeneous mixture of this activity within the containment atmosphere is assumed tooccur instantaneously. Because of the multiple redundancy in engineered safety features,such a release is considered incredible.
Sequence of Events Following a LOCA
As discussed previously, the Shield Building Ventilation System is designed to provide threefunctions during the course of the loss-of-coolant accident:
* Provide a negative pressure region to control and limit environmental leakage;+ Enhance mixing and dilution of any Containment Vessel leakage to the annulus;+ Provide holdup and long-term filtration of annulus air.
Immediately following the accident, the Shield Building pressure increases due to heattransferred from the containment shell. Operation of one of the Shield Building VentilationSystem's two redundant fans establishes a negative pressure within ten minutes. During thisperiod no credit is taken for the filtered exhaust of air by the Shield Building VentilationSystem. Instead it is assumed that the Shield Building does not exist. From 0 to 10 minutes,90% of the containment leakage is assumed to be released directly to the atmosphere without
USAR - Rev. 1814.3-48 11/01/2003

holdup or filtering. The remaining 10% goes to the Auxiliary Building Special VentilationZone where it is filtered before release to the atmosphere.
At 10 minutes into the accident, the Shield Building Ventilation System is assumed to befully effective in controlling leakage into the Shield Building. It is assumed that from 10minutes on, 89% of the containment leakage is processed by the Shield Building VentilationSystem. Of the remaining 11%, 10% is assumed to go to the Auxiliary Building SpecialVentilation Zone where it is subject to processing by the Auxiliary Building SpecialVentilation System and 1% is assumed to be released directly to the atmosphere. Theseleakage assumptions are regarded as conservative upper limits as stated in the TechnicalSpecifications for Kewaunee. A filter efficiency of 90% is applied to the removal ofelemental and organic iodine and a filter efficiency of 99% is applied to the removal ofparticulates.
Figure 14.3-36 shows results of a shield building ventilation performance test. Also shown isa curve enveloping all data points with a considerable margin. This envelope is the basis forthe conservative exhaust rates used in calculating offsite doses following a LOCA.
As described in Section 5, the shield building ventilation fans take a filtered suction from theannulus and their discharge is apportioned between atmospheric discharge and annulusrecirculation flow. The atmospheric discharge (or SBV exhaust flow as shown inFigure 14.3-36) is dependent on the amount of annulus in leakage at the vacuum setpointchosen for the Shield Building Ventilation System Control. The SBV exhaust flow willreach 2700 cfm at 20 minutes post-LOCA. Using the envelope in Figure 14.3-36, thisexhaust flow will maintain a negative 1" we (water column) in the annulus. It is recognizedthat exhaust flow rates must be higher early in the accident due to annulus heating. This isshown in Figure 14.3-37A. To simplify the analysis a constant exhaust rate of 6000±10%cfm has been used from 10 to 30 minutes and 3100 cfm from 30 minutes to 30 days. Thissimplification can be made due to the size of the envelope in Figures 14.3-36 and 14.3-37A.
The Containment Vessel Internal Spray System is described in Section 6.4. The primarypurpose of the spray system is to spray cool water into the containment atmosphere in theevent of a LOCA and thereby ensuring that containment pressure does not exceed its designvalue. However, the spray system also has the property of removing iodine and particulates |from the containment vessel atmosphere. The iodine removal coefficients due tocontainment spray are given in Table 14.3-8. During spray operation, no credit is taken forsedimentation removal of particulates, although it would take place. Recirculation sprays arenot credited. Credit is taken for sedimentation removal of particulates after spraytermination. The analysis credits a sedimentation coefficient of 0.1l-l. Table 14.3-8 alsoprovides a summary of the other parameters used in the analysis, which was documented inReference 1.
Method of Analysis
The evaluation of the environmental consequences of a loss-of coolant accident consists ofdetermining the radiation dose resulting from inhalation of radioiodine discharged from the
USAR - Rev. 18 |14.3-49 11/01/2003

Shield Building and of determining the dose due to direct gamma radiation from theradioactive cloud created by the discharge of Containment Vessel leakage from the ShieldBuilding.
The evaluation of the environmental consequences of a loss-of-coolant is based on theassumptions of NRC Regulatory Guides 1.183. The analysis model describing the activityrelease is shown in Figure 14.3-35. This figure illustrates the basic assumptions of theanalysis. A portion of the Containment Vessel activity inventory is assumed to leak into theShield Building and form the Shield Building activity inventory. Activity leaves the ShieldBuilding by passing through the charcoal filters. Of the activity passing through the filters, aportion is released via the shield building vent and the rest is recirculated back into the ShieldBuilding. The Shield Building activity is also a function of the assumed annular participationfraction. This fraction is a measure of the mixing efficiency in the annulus.
When ECCS recirculation is established following the LOCA, leakage is assumed to occurfrom ECCS equipment outside containment. There arc two pathways considered for theECCS recirculation leakage. One is the leakage directly into the auxiliary building and theother is back-leakage into the RWST. Although recirculation is not initiated until the RWSThas drained to the pre-determined setpoint level the analysis conservatively considers leakagefrom the start of the event. For the ECCS leakage analysis, all iodine activity released fromthe fuel is assumed to be in the sump solution until removed by radioactive decay or leakagefrom the ECCS. The iodine activity that becomes airborne after being released by theleakage is modeled as 97% elemental and 3% organic.
The analysis models leakage to the auxiliary building of 12 gallon/hr. The analysis models aconservative airborne fraction of 10% when the sump temperature is above 212'F. Once thesump solution temperature drops below 2120F, the airborne fraction is reduced to 1%. Thereduction in airborne fraction is conservatively delayed until 3 hours from the start of theevent.
RHR back-leakage to the RWST is assumed at a rate of 3 gpm for the first 24 hours, and 1.5gpm for the remainder of the event. It is assumed that 1% of the iodine contained in the leakflow becomes airborne. The 1% value is applied even when the sump is above 2120F sinceany incoming water would be cooled by the water remaining in the RWVST. The RWSTvents to the auxiliary building.
It is assumed that half the iodine activity that becomes airborne in the auxiliary building fromthe two leak sources is removed by plateout on surfaces. Releases from the auxiliarybuilding are subject to filtration by the auxiliary building special ventilation system.
The analysis is documented in Reference 1. Dose results are listed in Table 14.3-9.Reference I also demonstrates that the 30 day dose to control room operators is within thelimit specified in 10 CFR 50.67.
USAR - Rev. 1814.3-50 11/01/2003

Conservatism Between Analysis and Physical Situation
Many conservative assumptions have been made in the application of the NRC RegulatoryGuide 1.183 to the Kewaunee Plant. Elimination of this conservatism would be expected toreduce the calculated dose by orders of magnitude. In order to place the above analysis inperspective, major assumptions applied in the analysis which affect the calculated dose arereviewed below:
1) In accordance with NRC Regulatory Guide 1.183, a release of activity from melted fuelto the containment atmosphere was assumed. As shown in Section 14.3.2, the SafetyInjection System will prevent fuel rod clad melting and will limit the zirconium-waterreaction to an insignificant amount. However, as a result of the cladding temperatureincrease and the rapid system depressurization following the accident, cladding failuresmay occur in the hotter regions of the core. These failures would release only theinventory of volatile fission products in the gap between the fuel pellet and the cladding.
2) No reduction of activity has been assumed by plateout in the Shield Building.
3) Recirculation filtration has been assumed to take place with only one of two redundantsystems operable. Since the combined flow capability of the two recirculating fans willbe double that used in the analysis, a significant reduction of iodine and particulateactivity in the Shield Building would result.
14.3.6 DELETED
14.3.7 DELETED
14.3.8 CHARCOAL FILTER IGNITION HAZARD DUE TO IODINE ABSORPTION
The radioactive iodine, which collects on the charcoal filters generates a significant amountof decay heat. A detailed analysis was made of the potential for spontaneous ignition of thecharcoal during post-LOCA operation of the Shield Building Ventilation (SBV) system. Tomaximize the charcoal filter temperature, it was assumed that forced air-cooling is lost at thetime of maximum heat load.
Using the assumptions of NRC Safety Guide 4, i.e., 50% halogen release from the fuel and50% plateout in the Reactor Containment Vessel, the iodine released and the heat generatedfrom that iodine are estimated to be:
Isotope Curies (107) Decay Heat (kW)I-131 1.21 41.55I-132 1.718 262.7I-133 2.26 143.71-134 2.575 450.3I-135 2.0 292.7
USAR - Rev. 1814.3-51 11/01/2003

The maximum amount of heat that can be generated on the filters is limited by the rate atwhich the iodine leaks out of the Reactor Containment Vessel onto the filters, and by thedecay of the isotopes that are collected on the filter.
In the analysis performed, the following conservative assumptions are made:
1) It is assumed that no holdup takes place in the Shield Building, i.e., all of the activityreleased via Containment Vessel leakage goes directly on the filters.
2) No credit is taken for plateout in the Shield Building.
3) All of the activity is assumed to collect on one train of the SBV filters with 100%efficiency.
With those assumptions, the maximum rate of heat generated on the charcoal filters waspredicted to occur at one day following the accident. At this time of maximum heat load, theforced air cooling through the filter assembly is assumed to be lost. Assuming the charcoalfilter is at 190'F (based on calculated post-accident shield building temperature) when forcedcooling is lost, results in a charcoal filter centerline temperature of 2587F, which issignificantly lower than the 6260F ignition temperature of the charcoal used. Thistemperature is also below the 3560F at which iodine desorption is expected to begin.
This analysis is conservative by at least an order of magnitude for the following reasons:
I) The analysis was based upon a NRC Safety Guide 4 release.
2) The maximum allowable containment vessel leak rate is assumed to occur for the firstday following accident initiation. Peak containment pressure occurs only a few minutesfollowing accident initiation and decays quickly. This would result in a leak rate muchless than maximum allowable.
3) All plateout of iodine in the Shield Building was neglected.
4) All activity was assumed to collect on one of two filters.
5) All activity leakage from the Containment Vessel was assumed to collect, at 100% filterefficiency, on the filter without holdup or decay in the Shield Building.
6) No heat dissipation from the filter housing to the surrounding room environment isassumed.
A spray system is provided which is activated automatically upon occurrence of hightemperature adjacent to the charcoal. The analysis has shown that actuation of this system isnot expected to occur.
USAR - Rev. 1814.3-52 11/01/2003

14.3.9 GENERATION AND DISPOSITION OF HYDROGEN
General
The design basis loss-of-coolant accident and its off-site consequences are discussed earlierin this section. It is recognized that a loss-of-coolant accident could be followed by thepossible generation of hydrogen from radiolysis of water, from chemical corrosion ofmaterials by spray liquids, and from possible metal-water reactions accompanying theaccident.
The equilibrium concentrations that could theoretically result have been calculated to exceedthe lower flammability limit of 4.1 volume percent hydrogen; therefore, it is necessary toprovide means of limiting the accumulation of hydrogen to an acceptable lowerconcentration.
The simplest means of control is to purge, venting the mixture of air and hydrogen to theenvironment, at a rate sufficient to maintain a hydrogen concentration that is below the lowerflammability limit.
The capability of venting is an essential part of any system of hydrogen control because theeventual containment cleanup must be by controlled dispersal of containment gases to theenvironment; hydrogen control and eventual containment purge by venting are inseparableconsiderations of the same loss-of-coolant accident because any primary means of controlcannot be terminated until conditions permit venting to proceed at a rate sufficient tosupplant it and prevent further rise in hydrogen concentration. Complete analysis must bebased on a reference condition of acceptable venting at which venting can later proceed at arate greater than that necessary to control hydrogen. This condition is conveniently definedas the occurrence of 1 MPC at the site boundary (i.e., when the summation of the fractions ofthe maximum permissible concentrations given in 10 CFR 20 equals unity).
Summary of Reanalysis Based on Safety Guide 7
Initial studies were based on conservative estimates of hydrogen sources provided by thereactor supplier, and they included the assumptions of Safety Guide 4. These studiesindicated that 3.5 v/o concentrations would be reached in 56 days, that venting could bedeferred until 86 days after the accident without the lower flammability limit being reached,and that initiation of venting through a charcoal filter at a rate sufficient to arrest hydrogenaccumulation would then result in instantaneous site boundary concentrations no greater than1 MPC. Thus, direct venting through charcoal was indicated to be sufficient means ofhydrogen control.
The present reanalysis uses a Containment Vessel leak rate of 1% per day. A conservativefilter efficiency of 90% for the Shield Building Ventilation System is used in the reanalysis,but doses are also given for a filter efficiency of 95%.
USAR - Rev. 1814.3-53 11/01/2003
Also, additional considerations are now incorporated in the analysis, based on informationpublished subsequent to initial submittal of this USAR:
1) Safety Guide 7 now prescribes even more conservative assumptions regarding hydrogensources.
2) Test data indicate that, at least for higher initial post-accident containment temperatures,substantial amounts of hydrogen could be released from painted surfaces during the firstday following the accident.
Both the time at which hydrogen control must be initiated and the doses associated withventing are extremely sensitive to the assumptions regarding hydrogen sources. The abovetwo effects, for example, would alone advance the calculated time of occurrence of 3.5%hydrogen concentration -- from 56 days to 18 days and from 56 days to 41 days,respectively. Together they result in occurrence of 3.5% concentration on the eleventh day.
The collective assumptions prescribed in Safety Guide 4 and Safety Guide 7 are regarded asbeing unnecessarily conservative. Also, for conservatism it is found necessary tooverestimate the potential contribution from protective coatings, which is the remainingsource, because the test data are for simulated post-accident conditions of temperature muchmore severe than those predicted. The hydrogen generation and venting problem willconsequently be far less severe than determined from these assumptions.
A method of venting is proposed which is indicated to attain reasonable off-site doses, evenunder these conditions of early venting requirements. In addition, means are provided todefer venting, if necessary, by compressing the containment atmosphere, thus diluting thehydrogen within the containment, and thereby reducing the potential dose from venting.
Methods of Control
Two modes of operation are being provided, any of which employed alone would provideadequate means of hydrogen control.
1) Controlled vent flow and processing of this flow with recirculation filtering by the SBVSbefore its release to the environment.
2) Deferment of venting, if necessary, by adding air to the containment to compress theatmosphere, and thus, dilute its hydrogen concentration.
In addition to these two methods of hydrogen control, the capability to utilize an externalhydrogen recombiner, has been provided.
Venting to the Shield Building Annulus
The Shield Building Ventilation System affords the benefit of recycle through charcoalfilters. When venting must first be initiated, at least one-of-two redundant trains of
USAR - Rev. 1814.3-54 11/01/2003

equipment will already be in continuous operation, maintaining vacuum and collecting andprocessing containment vessel leakage before its discharge to the environment. Any ventflow necessary to maintain acceptable hydrogen concentrations within the containment willbe directed into the Shield Building annulus at a controlled rate, to be processed along withthe containment leakage which would represent part of the required vent flow.
The effect of recycle through the filters of the Shield Building Ventilation System is toreduce the iodine effluent concentration by an additional factor that is essentially equal to theratio of recirculation flow to discharge flow to the environment. This is the same factor thathas been applied to the standby ventilation system for a boiling water reactor plant(Reference 1).
Analysis demonstrates that venting at greater than I MPC would be unnecessary on the basisof reasonably conservative assumptions, which include the conservative allowance forprotective coatings. The need to vent at higher activity concentrations might be requiredonly for the extremely conservative basis of Safety Guide 7. If post-accident hydrogengeneration were in accordance with this most conservative estimate, the resulting doses fromthe processed vent flow are indicated to be a small fraction of those of the accidentanalysis. The time delay before initiation of venting and the conservative allowances madein the initial phases of the accident analysis for direct filtered and unfiltered release ofcontainment leakage are not applicable during the equilibrium recycle operation which willbe established before venting is necessary.
Dilution by Containment Pressure Raise
Dilution of hydrogen concentration by modest increases in containment pressure is one ofseveral simpler methods of hydrogen control that were first proposed and investigated in1970 for Wisconsin Public Service Corporation and other participants of the same studyprogram.
Partial pressurizing of the containment can defer the occurrence of limiting hydrogenconcentrations, and consequently defer the need to vent until appreciable decay ofcontainment activity has occurred. The objective is to defer venting until venting at anacceptable dose level alone can arrest the further accumulation of hydrogen and permittermination of the method used to defer venting. Such deferral of venting is the identicalobjective of other methods, such as the use of recombiners.
Controlled venting with the accompanying replenishment of vented containment air requiresthat a pressure differential exist at least intermittently across the containment shell. Theventing system can readily be designed for an operating differential in either direction, butdesign for positive internal pressure during venting provides the option of deferred venting.
Analysis indicates that a rather small increase in pressure can significantly reduce the ventingdoses associated with the most conservative estimates of hydrogen sources, and that themethod provides a practical means of utilizing the benefits of recirculation filtration providedby the Shield Building Ventilation System.
USAR - Rev. 1814.3-55 11/01/2003

Hydrogen Recombination
In addition to the two methods of hydrogen control described above, the capability to use anexternal hydrogen recombiner for recombination of hydrogen and oxygen into water vaporhas been provided. Permanent piping, valving, and power source connections are provided attwo separate locations for the connection and operation of an external hydrogen recombinerwithin the Auxiliary Building. The two locations allow recombiner placement atapproximately opposite sides of Containment; in the unlikely situation that one of the twoareas will be unavailable or be required for continual personnel occupancy, the remaininglocation will remain available for recombiner placement and operation.
Analysis of Materials of Construction and Protective Coatings
Analysis has been made of the materials of construction and the protective coatings usedwithin the containment, particularly as they affect the potential of hydrogen generation byreaction with spray solution.
Description of Materials
The original specified coatings for structural steel items were 3 mils of Carbo-zinc 11 primerplus a 4-mil finish coat of Phenoline 305. The same protective coatings were specified forthe inner surface of the steel containment vessel, plus an additional 4-mil finish coat betweenelevations 606 feet and 660 feet. These coatings will be maintained by application of anappropriate Service Level I protective coating or coating system, depending on the extent ofrepair. Appropriate Service Level I coatings for use in containment are determined by KNPPengineering specifications and procedures. Periodic inspections are performed to assess thecondition of protective coatings on the vessel and structural steel.
All concrete walls, floors, ceilings, and other surfaces within the containment were originallyprotectively coated with sealer, surfacer, and/or finish coats of Carboline orPhenoline. Neither of these coatings included Carbo-zinc. The coatings on concrete walls,floors, ceilings, and other surfaces are also maintained by application of appropriate ServiceLevel I protective coatings. Periodic inspections are performed to assess the condition ofprotective coatings on concrete surfaces.
The use of unqualified coatings in containment is minimized. Unqualified coatings wereused in containment on structural and architectural steel, piping, various equipment andcomponents, and other miscellaneous items. Analysis has shown that the current amount ofunqualified paint will not affect the operability of the emergency core cooling system and theinternal containment spray system following a loss of coolant accident. Components withfactory coatings, which are unqualified will not be stripped of the coating andre-coated. This is in the interest of equipment reliability and nuclear safety.
Galvanized steel is used for ventilation ducts, gratings, stair treads, etc., and some aluminumis used in components and protective coatings associated with the reactor equipment and the
USAR - Rev. 1814.3-56 11/01/2003 I

reactor building crane. The use of these materials has been minimized in design to the extentpractical.
The surface areas and amount of the materials are summarized in Table 14.3-10.
Other materials in contact with the spray solution, such as stainless steel and copper alloys,are not significant with regard to corrosive generation of hydrogen.
The effects of corrosion on component integrity are of possible concern only with regard topotential chloride stress corrosion of stainless steel by the boric acid spraysolution. Sufficient caustic will be added with containment spray so that both the initialspray and the recirculated sump solution will be at pH of 7 or higher. Means are provided tomonitor the chloride content of the recirculated sump water. Corrosion effects are nototherwise of concern with regard to component integrity. For example, if the zinc-bearingcoating of galvanized ductwork were to be completely consumed by reaction with the spray,there would be negligible further corrosion of the exposed steel.
Zinc-Bearing Surfaces
A zinc-bearing primer is used as an undercoat on original structural steel and on the innersurface of the containment vessel.
The results of ORNL experiments indicate that substantial amounts of hydrogen can evolvefrom such undercoats during the initial conditions of a loss-of-coolant accident. This effectappears to be independent of the type of spray solution and of the amount and type of coatingover the primer. The outer coating is reported to typically appear unaffected after exposureconditions even though measurable releases of hydrogen from the under-coatings wereproduced.
The most relevant experiments (Reference 2) involved exposure of vendors' test coupons tospray solution under temperature conditions intended to simulate those of a loss-of-coolantaccident in a PWR: 5 minutes at 300'F, 105 minutes at 2840F, and the remainder of a day at2250F. For a boric acid spray solution of 3000 ppm boron without additives, the mostapplicable paint sample (3 mils of Carbo-zinc plus a 2 mil overcoat) yielded 2.3 cc ofhydrogen per cmO of surface or 0.075 scf/ft2. With 0.15N NaOH added to the solution, theyield was 2.0 cc/cm 2 or 0.066 sCf/ft2. The hydrogen release from these tests was typicallyabout 60% of that released in previous tests in which the exposure temperature wasmaintained constant at 2660F for 24 hours.
The test conditions for both sets of tests were much more severe than those predicted for thedesign basis accident, and substantially less hydrogen generation would therefore beexpected. It is conservatively assumed in the analysis that the first-day contribution from thepainted surface is given by half the product of the total area given in Table 14.3-10 and therelease per unit area given by the higher temperature experiments intended to simulateaccident conditions.
USAR - Rev. 18 |14.3-57 11/01/2003 l

The factor of two is perhaps justified alone on the basis of the fraction of total zinc-bearingsurface that will be directly exposed to the spray solution, but even greater reduction factorsshould result from the reduced temperatures relative to the experiment. The post-accident airand steam temperatures are predicted to be only 2650 F maximum during the first 5 minutes; adecrease from 2380F initial temperature to 140'F during the next 105 minutes; and 140'F orless thereafter.
An approximate indication of the effect of temperature is given by the relation of Arrheniusfor the case of constant activation energy: R(T1)JR(T0 ) = exp [ac(T1-T 0)/T1TJ]. Manyreactions double or triple in rate for a 100C rise in temperature in accordance with thisrelation (Reference 3). Its direct application to the typical relative yields of the ORNL tests(those for the simulated accident conditions vs those for constant temperature exposure at2660F for 24 hours) implies a doubling in rate for every 40C rise.
To obtain indication of the reduced reaction that might be expected at the lower temperaturespredicted for the design basis accident, the same relation is applied identically to the time-temperature sequence of the accident-simulation experiment and to the predicted first-daypost-accident temperature curve. With reaction rates near 300'F assumed to double fortemperature increments ranging from 40C to 30'C, the resulting reduction factors in the first-day reaction are indicated to vary from 109 to 4.2, respectively, relative to the accidentsimulation tests.
These indications suggest that a reduction factor of 10 to 100 would beappropriate. However, in the absence of lower temperature data or direct indication oftemperature sensitivity of the reaction rates, an overall reduction factor of only two isconservatively assumed.
Aluminum Surfaces
Corrosion of aluminum surfaces would be negligible with an acidic borated spray being afactor of a hundred or more less than with a basic spray solution (Reference 4).
For the case of buffered spray solution, reaction rates of aluminum are available as a functionof temperature (Reference 5). Application of this information to the temperature transientpredicted for the design basis accident indicates I mil reaction on the first day, plus acontinuing rate thereafter that is less than the 200 mils/year prescribed by Safety Guide 7.
Net Effect of Spray Additive
The total hydrogen production from protective coatings (see Table 14.3-11) has beencalculated with and without spray additive, and with first-day production from galvanizedcoating treated identically as the paint, because of the absence of relevant information for thecase of no additive and because the zinc content of most of the galvanized surface is similarto that of the paint. Addition of spray additive justifies use of a lower conservative estimatefor painted surfaces and neglect of the first-day contribution from the galvanized surface.
USAR - Rev. 1814.3-58 11/01/2003 l

An added allowance is made for aluminum reaction with additive, based on full consumptionof the 110 pounds of aluminum paint on the first day and 200 mils/year consumption of theremaining aluminum, assuming ¼/4-inch effective thickness and 20 scf hydrogen generationper pound consumed.
From Table 14.3-11, it can be noted that the calculated total coating contribution at 10 dayswould not increase with the use of additive. Also, the coating contribution is only a minorpart of total continuing production; therefore, the adjustment for additive is notsignificant. Effectively, the extremely conservative allowance for zinc-bearing surfaces thatis necessitated by the absence of lower temperature data, and the appropriate adjustments inthis conservative estimate, obscure the net increase in hydrogen that should result from thedirectly calculable effect of spray additive on aluminum.
Analysis of Methods of Hydrogen Control
Sources and Assumptions
Studies have been based primarily on the results of conservative hydrogen generationcalculations provided by the reactor supplier. The major assumptions for this "reasonablyconservative case" are summarized in Table 14.3-12, and compared with those for a "mostconservative case" which includes the assumptions of Safety Guide 7. Both cases describedin this table include the conservative allowance for first-day reaction of the zinc-bearingsurfaces described in the previous section.
The significant differences introduced by Safety Guide 7 are the increase in assumedzirconium reaction, the higher value of G, and the greater core gamma absorption in thecoolant. These assumptions add a half percent more hydrogen concentration for zirconiumand increase the radiolytic sources by factors of 1.67 in the core and 1.6 in the coolant. Theoverall effect is to alter entirely the urgency and magnitude of the hydrogen problem, asshown by comparison of the first several lines of Table 14.3-13.
The source contributions and venting requirements for the most conservative case that basedon Safety Guide 7 are shown in Figure 14.3-43.
Analysis of Venting Through Shield Building Annulus
The first case analyzed is that of controlled venting through the Shield Building VentilationSystem without pressurizing, and neglecting any effects of the positive pressure differentialthat would be used to accomplish such venting.
It is assumed that venting is initiated upon measured occurrence of 3.5 v/o concentration (asshown in Figure 14.3-43), and continued at a diminishing rate which maintains thatconcentration until the effects of decay and purge depletion result in instantaneous ventingconcentrations of I MPC at the site boundary. The purge and vent rate is then increased withfurther decay and purge depletion while maintaining 1 MPC off-site, causing containmentactivity and hydrogen content to decrease monotonically until purging is complete.
USAR - Rev. 1814.3-59 11/01/2003

Calculations with regard to venting are based on the initial activity inventories described inAppendix D, Table D.l-1 (consistent with Safety Guide 4) and on the dispersion factors andbreathing rate appropriate to the two-day to thirty-day period of the meteorological studies:
x/Q 3.882E-6 sec/M3 at the site boundary= 4.473E-7 sec/M3 at 4800 meters
B 2.32E-4 m3/sec
Venting is assumed to be through the Shield Building annulus with equilibrium recirculationflow of 4000 cfm through filters which remove 90% of the iodine and all solid fissionproducts, and with constant discharge flow of 200 cfm. These conservatively chosen flowconditions are consistent with the equilibrium phase of the calculations of shield buildingactivity discharge during the design basis accident.
The resulting venting doses are presented in Table 14.3-13.
The reasonably conservative case described in the Table 14.3-13 results in very low off-siteventing doses because it represents a rather trivial case of venting. For consistency incomparison of the two cases, it has been assumed that venting is initiated upon occurrence of3.5% hydrogen. However, the initial activity levels from venting at this time would be about7 MPC at the site boundary and, by simply deferring venting and allowing the concentrationto rise further (to 4.07%), venting could later be initiated at a rate sufficient to arrest theconcentration at this higher value without exceeding I MPC at the site boundary.
Greater venting doses are indicated in Table 14.3-13 for the most conservative case, but theserepresent a minor portion of the leakage doses associated with the maximum designaccident. They might be regarded as an added penalty from venting, except that occurrenceof the postulated accident leakage would have deferred and greatly reduced the consequenceof venting (or would have obviated the need to vent, for example, in the case of normal initialleak rate of 1% per day).
Thus, the need to vent at off-site concentrations greater than tolerance in order to maintainsafe hydrogen concentrations can be predicted only on the basis of the most conservativeassumptions -- those of Safety Guide 7.
For purposes of evaluation of the venting doses, it may be noted that the recycle advantagefactor which is incorporated in all the thyroid doses in Table 14.3-13, and which affects theoccurrence of I MPC vent capability, reduces effectively to nP/L2 = .90 x 4000 cfmi/200cfm = 18, where P is the recycle flow, L2 is the discharge flow, and n is the removalefficiency of the charcoal. This advantage factor is independent of the partition factor oreffective volume fraction assumed for mixing in the annulus. The reduction factor wouldinstead be 45 at the expected conditions of 5000-cfm recirculation and 100-cfm discharge,and the iodine doses would then be 40% of those indicated in Table 14.3-13. The thyroiddoses would be similarly affected by the removal of iodine by containment spray liquid,
USAR - Rev. I814.3-60 11/01/2003

which effect, with additive, should further reduce the indicated thyroid doses by a largefactor.
Analysis of Effects of Pressure Increase
The lower limit of flammability for hydrogen in air is reported to be 4.1 volume percent atatmospheric pressure, and this limit is reported to increase slightly with pressure, rather thanto decrease (Reference 6).
Thus, compression of a hydrogen-air mixture by addition of more air to a fixed volumedecreases the volume fraction of hydrogen and permits more hydrogen to be accumulated fora given limiting volume fraction. The calculation assumes that once a limiting concentrationC. is reached (3.5%), as hydrogen production continues, the containment pressure P is raisedby injecting air at a rate sufficient to maintain C., where a concentration C(t) wouldotherwise result if dilution by pressure increase did not occur:
P(1) = 14.7 C ()C.
Doubling of the absolute pressure, for example, would permit hydrogen to be maintained at3.5% until 7% would otherwise have accumulated.
A second effect is that, when purging and venting are initiated, the fractional vent-flownecessary to maintain a given concentration at any time is less at pressure. The mass flowrequired is independent of pressure, but the flow expressed in fraction of containment volumeis less by the ratio of absolute pressures, as is the fractional release rate of contained activity.
As well as deferring the need to vent, overpressure causes leakage to occur from thecontainment to the annulus. The assumed leakage is based on 1% per day at the designpressure of 42 psi:
L(t) =.01/day 14
Out-leakage and vented gases are necessarily processed identically by the Shield BuildingVentilation System. They are consequently equivalent from the standpoint of radiation dose,as well as with regard to their effectiveness in hydrogen control when they are replenished bypurge flow. Out-leakage, thus, simply represents a portion of the venting rate that is notdeferred when venting is otherwise deferred by pressure increase.
The effects of pressure increase on venting requirements and containment leakage aredescribed by Figures 14.3-44 and 14.3-45, and the resulting doses are presented inTable 14.3-14.
USAR - Rev. 1814.3-61 11/01/2003

The upper curves of Figure 14.344 are for a limited pressure rise of 6.1 psig, sufficient tomaintain 3.5% hydrogen up to 30 days. Venting is then initiated at the same rate thatcompressed air is being added, with pressure consequently remaining constant. This constantpressure purge continues at a rate no more than necessary to maintain constant concentration,until decay and diminishing vent rate cause the concentrations at the site boundary to reduceto I MPC. Purging then proceeds at the rate which theoretically maintains I MPC and whichrapidly increases as a consequence of further decay and purge depletion.
Pressure relief could be initiated between 30 and 62 days in this case, by allowing the ventrate to exceed the purging or replenishment rate necessary to maintain constant hydrogen, butthis would unnecessarily increase the venting dose. Similarly, beyond 62 days, pressurerelief cannot fully proceed by unreplenished vent relief at the vent rate permitted by off-siteconcentration limits. Continued existence of hydrogen sources requires instead that somepart of the permissible vent flow be replenished as a purging flow to prevent the limitingconcentration being exceeded during this period of final cleanup. The solid-line blowdowncurves in Figure 14.3-44 are the lines of earliest pressure relief, which maintain both thelimiting hydrogen concentration and the limiting off-site radiation concentration during acontrolled blowdown plus purge. The time for complete cleanup is independent of pressureor purging considerations; it is determined only by the venting rate and venting depletion ofthe contained activity, which effect is also idealized in the figures for the case of earliestcleanup.
The resulting doses are shown in Table 14.3-14 and compared with the previous case of nodeferment of venting. Deferment to 30 days is seen to gain a reduction of 10 in venting dose,but the containment leakage dose resulting from the overpressure reduces this factor to 5or6.
The out-leakage rates are shown in Figure 14.3-45 and compared with the vent rates. Thedose from leakage is additive only up to the time when venting is initiated because the purgerates are the total replenished out-flow required to maintain concentration, either by leakageor venting.
Out-leakage should be less than that estimated on the basis of the design leakage, and it willbe assured to be less by surveillance testing of the containment. The effects of out leakageare conservatively considered in the calculations but the compensating depletion, which itwould cause is neglected because the actual leakage that would occur is uncertain.
The effect of pressure on purge rate may be noted from Figure 14.3-45, where the top solidcurve is the fractional purge rate necessary to maintain concentration CO at atmosphericpressure:
L(t)= QC)N
with Q(t) the uncompressed volumetric production rate of hydrogen at time t in thecontainment air volume V that is used to define concentration.
USAR - Rev. 1814.3-62 11/01/2003

The dashed line describes the initial purge rate at time t that supplants a pressure increase thatwas maintaining C.:
L 4(t) = () QX )N Q(t)N
where C(t) is the concentration that would occur at time t without dilution by pressureincrease.
The solid curve for constant pressure purge initiated at thirty day is:
Q)N =14.7 Q(t)NC (3 0) P( 3 0) C,
Thus, required purge rate is reduced with pressure increase directly in the ratio of absolutepressures. Both solid curves in the figure correspond to the same mass flow of air andhydrogen, but they differ with regard to fractional release rate of the contained volume, andhence, with regard to fractional release rate of the contained activity.
The lower curves in Figure 14.3-44 correspond to sustained pressure rise until a 1 MPCventing capability is attained, sufficient to control hydrogen. As shown in Table 14.3-14, thedose is all from out-leakage and little is gained relative to initiating venting at thirtydays. However, the containment is tested initially at 46 psig, and thus, its design does notpreclude continuing the pressure rise as far as required.
An additional case has been considered wherein recycle credit for iodine is neglected, aswould be the case if all leakage and vent flow were somehow to be discharged directly to a90% filter without recirculation.
The diagonal line in Figure 14.3-45 corresponding to a I MPC vent of leak rate wouldeffectively be displaced downward in this case by loss of the recirculation advantage factorof 18.1 for iodine, and the I MPC venting intersection would be accordingly deferred intime. It can also be seen from the figure that further pressure rise would cause thecontainment leakage to exceed the vent rate necessary to control concentration, theintersection occurring at 67 days and 12.8 psi for a 1% leak rate. At this point leakage alonewould control hydrogen, the air supply could be reduced to match the leakage and preventfurther rise.
A I MPC venting capability is deferred in this case to about 90 days, and the total leakagedose is 18.1 rad to the thyroid and 0.107 R whole body radiation. The doses would be lessand the maximum useful pressure would be slightly greater for lower containment leak rates.
Thus, even without the recycle advantage at the Shield Building Ventilation System,acceptable doses are indicated for the method of pressure control alone.
USAR - Rev. 1814.3-63 11/01/2003 l
Provisions for Mixing, Sampling and Venting of Containment Gases
The provisions for mixing, sampling and venting of containment gases are shownschematically in Figure 14.346.
Mixing
Two containment dome vent fans are provided to circulate and mix gases within thecontainment during the period following the postulated loss-of-coolant accident whencombustible gases could conceivably accumulate. Each fan draws a combined 8000-cfmthrough two-of-four inlet ducts located in the dome area of the Containment Vessel. Thedischarge from each fan is conveyed downward through separate ductwork and returned tothe containment volume near the operating floor.
These systems are completely independent and redundant to each other, and they satisfy therequirements of Engineered Safety Features. The fans are started manually from the controlroom, and surveillance testing of the capability of these systems to start and operate asintended is performed during refueling outages.
Venting to Shield Building Annulus
Two vent valve systems are provided to accomplish venting of pressurized containment gasesto the Shield Building annulus. The two systems will each vent containment gases from theductwork associated with one of the containment dome vent fans and transfer them by meansof positive pressure differential through separate penetrations of the ContainmentVessel. Each penetration has remote-manually operated isolation valves that are normallyclosed and that can be separately opened to permit venting, or sampling, through eitherpenetration. Each penetration exhausts gases through a remotely controlled throttle valvedirectly into the Shield Building annulus where they will be processed and discharged by theShield Building Ventilation System.
Each penetration has a remote-indicating flow meter located in the annulus and upstream ofthe throttle valve so as to indicate fractional containment volume vent rate, independent ofcontainment pressure.
The vent relief systems are located entirely within the annulus to preclude concern forleakage. The systems and their power supplies meet the requirements for engineeredsafeguards.
The vent system flow requirements are:
* that each throttle valve can accomplish the maximum vent rate necessary to controlhydrogen (-25 scfm) at a nominal driving pressure (-2 psi, or greater if necessary); and
USAR - Rev. 1814.3-64 11/01/2003

* that the combined capacity should not present a significant limitation with regard to timerequirements for the completion of containment purge when transfer is eventually madeto direct filtered discharge.
Analysis indicates that, for a design leak rate of 1% per day, the resulting out-leakage limitsthe useful pressure increase to about 13 psi, and this, or an even lower pressure, can be set asan operational limit. The vent system was tested in conjunction with the Shield BuildingVentilation System to establish acceptable limits, and limits were set by operating proceduresand, if necessary, can be set by means of fixed orifices downstream of the throttle valves.
Compression and replenishment of containment gases is through either of two penetrationsthat span the annulus to admit fresh air through the instrument air system. These penetrationswill each initially be equipped with normally closed, remote manually opened isolationvalves, throttle valve, and connections for use of oil-free portable air compressors. Designsupply will be 100 scfm for each penetration at the maximum anticipated pressure.
Initial tests of the vent systems included startup, calibration of flow vs control position atvarying pressure following integrated leak rate tests, and establishment of limits with regardto the Shield Building Ventilation System.
Provisions for Sampling
Monitoring of the containment hydrogen concentration is accomplished by two ComsipModel K-I I1 hydrogen analyzers. As stated in reference 7, the analyzers fulfill therequirements of Item II.F.1.6 of NUREG-0737. The hydrogen monitors have indication inthe control room and a range of 0% to 10% by volume under positive or negativecontainment pressure. The monitors are normally kept in standby mode, but indication isavailable on demand. The system is operated from its remote control panel located outsidethe high radiation sampling room. A hydrogen sample is drawn from the post-LOCAhydrogen control system sample ports in containment. These ports are located near thedischarge of the containment dome fans, which permits rapid detection of hydrogen escapingfrom the reactor. The fans draw suction from the upper areas of containment, which preventsthe formation of a stratified atmosphere. The fans are powered from safeguard buses and aredesigned to operate in a post-LOCA environment (see NRC SER in reference 7).
14.3.10 STEAM GENERATOR TUBE PLUGGING
Steam generator tube plugs may be periodically installed to remove tubes from service basedon reported degradation. When installed, the plugs become the primary pressure boundaryfor the subject tube. Plugs are installed at both ends of the tube, effectively isolating tubewall defects (corrosion, etc.). Tube plugging levels up to and including 10% of the totaltubes have been analyzed.
A number of plug types and designs have been qualified for use in the KNPP steamgenerators. Plug types include expanded mechanical plugs, rolled plugs and weldedplugs. Plug integrity is ensured by the qualification of the design and installation process
USAR - Rev. 1814.3-65 11/01/2003

through laboratory testing and observed field performance. Analytical verification of plugintegrity used design and operating transient parameters selected to bound those loadsimposed during normal and postulated accident conditions. Fatigue and stress analysis ofsteam generator tube plugs were performed in accordance with the ASME B&PV CodeSection III.
14.3.11 STEAM GENERATOR TUBE SLEEVING
DELETED
14.3.12 STEAM GENERATOR TUBE FATIGUE ANALYSIS
The NRC issued Bulletin 88-02 which required several actions to be implemented in order tominimize the potential for a steam generator tube rupture event caused by a rapidlypropagating fatigue crack. This Bulletin is not applicable to the KNPP replacement steamgenerators due to material/manufacturing process upgrades.
14.3.13 VOLTAGE BASED REPAIR CRITERIA FOR STEAM GENERATOR TUBES
DELETED
14.3.14 F* AND ELEVATED F* ALTERNATE REPAIR CRITERIA FOR STEAMGENERATOR TUBES
DELETED
14.3.15 STEAM GENERATOR TUBE REMOVAL
Portions of steam generator tubes may be removed periodically for laboratory analysis todetermine degradation morphology, extent, and cause. Upon removal, the affected tubeportions remaining inside the steam generator are plugged on both ends to maintain theintegrity of the pressure boundary. Analyses have been performed which justify tubeplugging up to a level of 10% of the total tubes in the generator. The plugs installed torestore pressure boundary integrity are qualified to the requirements of ASME B&PV CodeSection III.
USAR - Rev. 1814.3-66 11/01/2003

REFERENCES - SECTION 14.3.1
1. "Acceptance Criteria for Emergency Core Cooling System for Light Water Cooled NuclearPower Reactors", 10 CFR 50.46 and Appendix K of 10 CFR 50. Federal Register,Volume 39, Number 3, January 4, 1974
2. Meyer, PE and Kornfilt, J., "NOTRUMP. A Nodal Transient Small Break and GeneralNetwork Code", WCAP-10079-P-A (Proprietary) and WCAP 10080-A, (Non-Proprietary),August 1985
3. Lee, N., Tauche, WD, Schwarz, WR, "Westinghouse Small Break ECCS Evaluation ModelUsing the NOTRUMP Code", WCAP-10054-P-A (Proprietary) and WCAP-10081-A (Non-Proprietary), August 1985
4. Bordelon, FM, et. al., "LOCTA-IV Program: Loss of Coolant Transient Analysis", WCAP-8301, (Proprietary) and WCAP-8305 (Non-Proprictary), June 1974
5. Hellman, JM, "Fuel Densification Experimental Results and Model For ReactorApplication", WCAP-8219, October 1973
6. CM Thompson, et al., "Addendum To The Westinghouse Small Break ECCS EvaluationModel Using The NOTRUMP Code: Safety Injection Into The Broken Loop and COSICondensation Model", WCAP-10054-P-A, Addendum 2, Revision I (Proprietary) andWCAP-10081-NP (Non-Proprietary), July 1997
7. DELETED
8. DELETED
9. DELETED
USAR - Rev. 1811/01/2003 l14.3-67

REFERENCES - SECTION 14.3.2
1. "Acceptance Criteria for Emergency Core Cooling Systems for Light Water Cooled NuclearPower Reactors: 10 CFR 50.46 and Appendix K of 10 CFR 50.46," Federal Register.Volume 39, Number 3, January 4, 1974.
2. Hochreiter, L. E., Sehwarz, W. R., Takeuchi, K., Tsai, C. K., and Young, M. Y., WestinghouseLarge-Break LOCA Best-Estimate Methodologv, Volume 1: Model Description andValidation, WCAP-10924-P-A, Volume 1, Revision 1, (Proprietary Version), December 1988.
3. Dederer, S. I., Hochreiter, L. E., Schwarz, W. R., Stucker, D. L., Tsai, C. K., and Young, M.Y., Westinghouse Large-Break LOCA Best-Estimate Methodology, Volume 2: Application toTwo-Loop PWRs Equipped with Upper Plenum Injection, WCAP-10924-P-A, Volume 2,Revision 2, December 1988.
4. NRC Staff Report, "Emergency Core Cooling System Analysis Methods," USNRC-SECY-83-472, November 1983.
5. Bordelon, F. M., and Murphy, E. T., Containment Pressure Analysis Code (COCO), WCAP-8327 (Proprietary Version), WCAP-8326 (Non-Proprietary Version), June 1974.
6. Foster, J.P., et al., Westinghouse Improved Performance Analysis and Design Model (PAD4.0), WCAP-15063-P-A, Revision 1, with Errata, 2000.
7. Federal Register, "Emergency Core Cooling Systems: Revisions to Acceptance Criteria,"V53, N180, pp. 35996-36005, September 16, 1988.
8. USNRC Regulatory Guide 1.157, "Best-Estimate Calculations of Emergency Core CoolingSystem Performances," May 1989.
9. Boyack, B., et al., 1989, "Qualifying Reactor Safety Margins: Application of Code ScalingApplicability and Uncertainty (CSAU) Evaluation Methodology to a Large Break Loss-of-Coolant-Accident," NUREG/CR-5249.
10. Letter, R. C. Jones (USNRC) to N. J. Liparulo (W), "Acceptance for Referencing of theTopical Report WCAP-12945 (P), Westinghouse Code Qualification Document for BestEstimate Loss-of-Coolant Analysis," June 28, 1996.
11. Bajorek, S. M., et al., 1998, "Westinghouse Code Qualification Document for Best EstimateLoss of Coolant Accident Analysis," WCAP 12945-P-A (Proprietary), Volume l, Revision 2,and Volumes 11-V, Revision 1, and WCAP-14747 (Non-Proprietary).
12. Dederer, S. I., et al., "Application of Best Estimate Large Break LOCA Methodology toWestinghouse PWRs with Upper Plenum Injection," W CAP-14449-P-A (Proprietary),Revision 1, and WCAP-14450 (Non-Proprietary), October 1999.
USAR -Rev. 1814.3-68 11/01/2003

REFERENCES - SECTION 14.3.2 (continued)
13. Kellerman, B. E., et al., "Best Estimate Analysis of the Large Break Loss of CoolantAccident for Kewaunee Nuclear Power Plant to Support Uprating and Transition toWestinghouse Fuel," WCAP-1 5708, July 2002.
14. Branch Technical Position CSB 6-1, "Minimum Containment Pressure Model for PWRECCS Performance Evaluation," July, 1981.
15. Letter, C. A. Carpenter (USNRC) to N. J. Lipanulo (E), "Acceptance for Referencing of theTopical Report WCAP-14449(P), "Application of Best Estimate Large Break LOCAMethodology to Westinghouse PWRs With Upper Plenum Injection," (TAC No. M94035),"May 21, 1999.
USAR - Rev. 1814.3-69 11/01/2003

REFERENCES - SECTION 14.3.3
1. GJ Bohm, "Indian Point Unit No. 2 Reactor Internals Mechanical Analysis for BlowdownExcitation", WCAP-7822, December 20, 1971, W Class III
2. S. Fabic, "BLODWN-2: Digital Computer Program for Calculation of Hydraulic TransientsDuring a Loss-of-Coolant Accident", Transactions Am. Nucl. Soc. p. 358, 1969 AnnualMeeting, Seattle, June 15-19
3. DELETED
4. S. Fabic, "Loss-of-Coolant Analysis: Comparison Between BLODWN-2 Code Results andTest Data", WCAP-7401, November 1969
5. K. Takeuchi, et al., "MULTIFLEX 3.0, A FORTRAN-IV Computer Program For AnalyzingThermal-Hydraulic-Structure System Dynamics Advanced Beam Model", WCAP-9735,Revision 2 (Proprietary), WCAP-9736, Revision I (Non-Proprietary), February 1998
6. K. Takeuchi, et al., "MULTIFLEX 3.0, A FORTRAN-IV Computer Program For AnalyzingThermal-Hydraulic-Structure System Dynamics", WCAP-8708-P-A (Proprietary),WCAP-8709-A (Non-Proprietary), February 1998
7. Kewaunee Nuclear Power Plant, Steam Generator Replacement and Tavg Operating WindowProgram Licensing Report, November 2000
USAR - Rev. 1814.3-70 11/01/2003

REFERENCES - SECTION 14.3.4
1. "Westinghouse LOCA Mass and Energy Release Model for Containment Design - March 1979Version," WCAP-10325-P-A (Proprietary), WCAP-10326-A (Nonproprietary), May 1983.
2. "Westinghouse Mass and Energy Release Data For Containment Design," WCAP-8264-P-A,Rev. 1 (Proprietary), WCAP-8312-A (Nonproprietary), August 1975.
3. "Amendment No. 126, Facility Operating License No. DPR-58 (TAC No. 71062), forD. C. Cook Nuclear Plant Unit I," Docket No. 50-315, June 9, 1989.
4. EPRI 294-2, "Mixing of Emergency Core Cooling Water with Steam; 1/3-Scale Test andSummary," WCAP-8423, Final Report, June 1975.
5. ANSI/ANS-5.1 1979, "American National Standard for Decay Heat Power in Light WaterReactors," August 1979.
6. "Containment Pressure Analysis Code (COCO)," WCAP-8327, July 1974 (Proprietary), WCAP-8326, July, 1974 (Non-Proprietary).
7. Takashi Tagami, "Interim Report on Safety Assessments and Facilities Establishment Project inJapan for Period Ending June 1965," No. 1.
8. E. W. Ranz and W. R. Marshall, J., "Evaporation for Drops," Chemical Engineering Progress, 48,pp. 141-146, March 1952.
9. L. F. Parsly, "Design Consideration of Reactor Containment Spray System, Part VI, The Heatingof Spray Drops in Air-Steam Atmospheres," ORNL-TM-2412 Part VI, January 1970.
USAR - Rev. 1814.3-71 11/01/2003

REFERENCES - SECTION 14.3.5
1. John Lamb (NRC) to Tom Coutu (NMC), transmitting the NRC SER for Amendmcnt No.166 to the Operating License, approving Implementation of Alteniate Source Term, LetterNo. K-03-040, dated March 17, 2003
2. DELETED
3. DELETED
USAR - Rev. 1814.3-72 11/01/2003

REFERENCES - SECTION 14.3.9
1. Docket 50-322, DRL Staff Evaluation of Shoreham Application, February 20, 1970
2. ORNL-TM-3342, "ORNL Safety Research and Development Program Bimonthly Report forJanuary-February, 1971"
3. Getman and Daniels, "Outlines of Theoretical Chemistry", sixth edition, John Wiley andSons, p. 332
4. T. H. Row, "Reactor Containment - Building Spray Systems for Fission Product Removal",Nuclear Safety, September-October, 1971, p. 516
5. Docket 50-255, Palisades FSAR, Figure 14.22-5
6. Wm B Cottrell and AW Savolainen, "U.S. Reactor Containment Technology",ORNL-NSIC-5, p. 5.82
7. NRC Safety Evaluation Report, SA Varga (NRC) to CW Giesler (WPS), Letter No.K-83-101, dated May 2, 1983
USAR - Rev. 1814.3-73 11/01/2003

REFERENCES - SECTION 14.3.10 - DELETED
REFERENCES - SECTION 14.3.11 - DELETED
REFERENCES - SECTION 14.3.12 - DELETED
REFERENCES - SECTION 14.3.13 - DELETED
REFERENCES - SECTION 14.3.14 - DELETED
REFERENCES - SECTION 14.3.15 - DELETED
USAR -Rev. 1811/01/200314.3-74

TABLE 5.2-1ALLOWABLE STRESS CRITERIA - REACTOR CONTAINMENT VESSEL
Material: ASTM A516 Grade-70
Loading Conditions Limits of Stress Intensity1
1. Dead loads plus operating loads plus DBA ASME Boiler and Pressure Vessel Code,loads plus Operational Basis Earthquake Section Ill, Figure N-414Loads (0.06 g)
2. Dead loads plus operating loads plus DBA Safe shutdown of plant can be achievedloads plus Design Basis Earthquake Loads (a) Pm < 1.16 Sm(0.12 g) (b) PL+ Pb < 1.16 (1.5 Sm)
(c) PL+Pb+Q•3.OSm
3. Dead loads plus operating loads plus pipe See Section 5.2-1, Pipe Reaction and Rupturerupture forces (faulted condition) plus Forces, and Tables B.7-2 and B.7-5, Appendix B(operational basis or Design BasisEarthquake Loads)
Pm - Primary general membrane stress intensityPL - Primary local membrane stress intensityPb - Primary bending stress intensityQ - Secondary stress intensitySm - Allowable stress intensity value
IRefer to Table N-414, ASME Boiler and Pressure Vessel Code, Section III
Rev. 1612/01/2000Page 1 of I

TABLE 8.2-2MAJOR SAFEGUARD BATTERY LOADS FOLLOWING LOSS OF OFF-SITE POWER
(All Loads in Amrnnrp.0Load Description Continuous Load Transient 1
Hot Shutdown Min. LoadBATTERY A Dist. Cab BRA-102 At-Power Following Following Loss
Loss of all AC of all AC
Dist. Cab. BRB-102 Alt. Feed 0 0 0
Dist. Cab. BRA-104Inverter BRA-I I I Instrument Bus I 0 53 45Inverter BRA-1 12 Instrument Bus IV 0 35 29Balance of BRA-104 16 15 250Total BRA-104 16 103 324
TOTAL BATTERY A 16 104 324Max @ 8 hr. Max @ I min.
Battery Rating 163 A 1234 ALoad Description Continuous Load Transient 1
Hot Shutdown Min. LoadBATTERY B Dist. Cab BRB-102 At-Power Following Following Loss
Loss of all AC of all AC
Dist. Cab. BRA-102 Alt. Feed 0 0 0
Dist. Cab. BRB-104Inverter BRB-I I I Instrument Bus II 0 49 41Inverter BRB-1 12 Instrument Bus III 0 44 37Balance of BRB-104 10 12 126Total BRB-104 10 105 204
TOTAL BATTERY B 0 106 204Max @ 8 hr. Max @ I min.
Battery Rating 163 A 1234 A
Rev. 1612/01/2000Page 1 of 1

NOR Ll ------- -ON SYSIEM WNTERCONNECtION
NOR .TH APPLETON
P AC
PT . BE ACHAUOTRt4
MAIN TRANS.345120KV.
MAIN AUX.UhIJTRANS. ffl1f
. I 1
fI:t,1:4
1
1
1iI
F
I 11
I
AUTO TRANS. .33451 38113. KV.L v
TERTIARY 4-X. TRANS.
ITOAL
I.
II
138KV.l
RESERVE AUX.TRANS.
E. KROCK
t 4.
r .
SHOTO
I
I
SANKI1
7-~ 16.2 WVAR
BANK 2
1 1AI - 4 .2 MVA I
E BANK 3
14.2 MVAW -
$ANK 4
16.2 MVA It
IttIIrIr
L.. .i A eI

i
FIG8.2- 1A
fi
To S~hoto
Offsite Power to KNPP Substation
ILine F-84 PassesUnderneath R-304and Q-303
/N
51. I . I

. s 8
lai
5 . if, .9'05*I------:^X& I. " I
030.3 Vol ION'-*1 1 c
l
N-WI *[
PA I1 E
_.m
- .19,--t40=
X, ... 2 1 1*51.0G.950.010JV
-- @lL.K0t
1
Il
I *0W000l0 35050, WI
0401.009- 40KV fSn F41- -t I I I
G 461 S 5 9 0 0 S n 9 .3 3* L 10 0. 1 -
V c .130 . O 11
_o. _ .4-
_j%33_ S0,. 1. 4. . - *4
493 BSIS 9.43
u I I X-.- 0:' _r
*W05101 * - 94
s 15 - 9 I T _ _ _i, 5so'
";?4P CC10
~:o9*O 005.
_ I Cf--_I M *lI C O181 00,550
Wf|- fC~8 -sP
-� m���lll
.103 - IOn
1.04 04144
- OS4
0-240
41..., Ns 9.0 .i~z' 1. 2. _1
IS I 0.0905 ,0 - 0- 4 - l i i-i- - -
_f W9
tI.. ..1
I W I W Ina f t
1 3 40 9. , C 04 5 0 1- s n
L =I.onobo goo
o.Fr _ lff 1
-- I . - -5
oaastoztn. 505 f lop
' s1 t -r. OW r m NOW~ 3105 0-0Yf 9I10W F o k-Y'IfftXaeLSSC.O a"C_
0- Tts . . - 1104 _ :5 _- o - -XlO 0 950 50 f * A-L1 -' _ . 9 e 10_mv ~- m ~ =~ o o" o * os ~ V . n .~~. [ i i ~ c~
V-p. 5 W I L 9 . L
W iW-H------Hf4 5" 6 f |. IV y
- … …- - - r - -1 -- -- --I "-:.9t,, *e I i~, SO| I0 I04 _
I40 If01 *_____4__WO_____J40 I I I4n1 1oI40 StOF v cl".* 0 1 1
NV-INS 6101050911.19 I NIOI ~ t-rt --
IV04s~ 009 00.I050Fs 04c e '1.0 SnI4 0.5 Itw t 1w. 504.5o -
m m
9 ~~WV O O~lin I 1
_ 401 =11 4 O X 95 , 0.1-j 1 ^.' e -q4 i"'y
3I . - oI
r g |10 - 3 - SOW0 ft140,
M O O , I t t . . , 9 5 0
I C lORI SOW
T I.,
O.;D1, rFhA IrsIor, *_ IK_ 30WVy * _ 141 00
5051.310. 15155010 50 104a OSOOIVVV5100 051fl :, 04wlo 90.0 /IIUI2 l59L l
110L 0Vn f4r01 09 0554. 051V 0h 9 ,-s9Oflaf.500 050 a *01
p'"'0
OcRtoc,. 404.54
fo V 1 1 1 6 0 OlI 3T^406f*V> ~l ~ t 0050,
1= wi_> -'| DO ,lZOU SVff
v *- otc ,S .1.._ ._ . ._ _ ... . __ . _ . _
-'p 10101 O4
llS�£ -
I.-4 sm f 5151 1.0 0
- t.=_ -1 -
t4ri.
I------v50l.SS a-um| * &b l V I
CAP 022094 tW K||CD
CIRCUIT DIACRAM4160V L 4eOV POWER SOURCES
WISCONSIN PUJLIC SERVICE CORP.I ,,, .,,
1. .. .. 1GI'-D
.. . _
9 9 3 9 0 9 I S S I 0 5 0 0'_.D~~~~~ _._ _ ._ .____ ..__ ................ ___ __........... . ,, _, ,_,.,"_'t_

EPA 4UU-R-92-UO1October 1991
.0.
MANUAL OF PROTECTIVE ACTION GUIDES
AND
-PROTECTIVE ACTIONS
FOR NUCLEAR INCIDENTS
C- I
Office of Radiation ProgramsUnited States Environmental Protection Agency
Washington, DC 20460
Revised 1991

FOREWORD
Public officials are charged with the responsibility to protect the health ofthe public during hazardous incidents. The purpose of this manual is to assistthese officials in establishing emergency response plans and in making decisionsduring a nuclear incident. It provides radiological protection guidance that maybe used for responding to any type of nuclear incident or radiological emergency,except nuclear war.
Under regulations governing radiological emergency planning andpreparedness issued by the Federal Emergency Management Agency (47 FR10758, March 11, 1982), the Environmental Protection Agency's responsibilitiesinclude, among others, (1) establishing Protective Action Guides (PAGs), (2)preparing guidance on implementing PAGs, including recommendations onprotective actions, (3) developing and promulgating guidance to State and localgovernments on the preparation of emergency response plans, and (4) developing,implementing, and presenting training programs for State and local officials onPAGs and protective actions, radiation dose assessment, and decision making.This document is intended to respond to the first two responsibilities.
e TThe manual begins with a general discussion of Protective Action Guides(PAGs) and their use in planning for protective actions to safeguard public health.It then presents PAGs for specific exposure pathways and associated time periods.These PAGs apply to all types of nuclear incidents. This is followed by guidancefor the implementation of PAGs. Finally, appendices provide definitions,background information on health risks, and other information supporting thechoice of the numerical values of the PAGs.
PAGs for protection from an airborne plume during the early phase of anincident at a nuclear power plant were published in the 1980 edition of thismanual. These have now been revised to apply to a much broader range ofsituations and replace the PAGs formerly published in Chapters 2 and 5.Recommendations and background information for protection from ingestion ofcontaminated food were published by the Food and Drug Administration in 1982.These are reprinted here as Chapter 3 and Appendix D. Recommendations forPAGs for relocation are presented in Chapters 4 and 7. Additional radiationprotection guidance for recovery will be developed at a later date. We arecontinuing work to develop PAGs for drinking water and, in cooperation withFDA, revised PAGs for food. When experience has been gained in the applicationof these PAGs, they will be reexamined and refined as necessary, proposed forreview, and then recommended to the President as Federal radiation protectionguidance.
0 iii
This manual is being re-published to consolidate existing recommendationsin a single volume. As revised and additional recommendations are developed, )they will be issued as revisions to this manual. These revised PAGs areappropriate for incorporation into emergency response plans when they are revisedor when new plans are developed. However, it is important to recognize thatregulatory requirements for emergency response are not provided by this manual;they are established by the cognizant agency (e.g., the Nuclear RegulatoryCommission in the case of commercial nuclear reactors, or the Department ofEnergy in the case of their contractor-operated nuclear facilities).
Users of this manual are encouraged to provide comments and suggestionsfor improving its contents. Comments should be sent to Allan C. B. Richardson,Criteria and Standards Division (ANR460), Office of Radiation Programs, U.S.Environmental Protection Agency, Washington, DC 20460.
T. OgeDirector, Office of (2)
Radiation Programs
Washington, D.C.
iv 0
CONTENTS
Page
Foreword....................................................
1. Overview .................... 1...................;.1-1
1.0 Introduction . 1-1.1 Nuclear Incident Phases and Protective Actions .1-21.2 Basis for Selecting PAGs .1-51.3 Planning .1-61.4 Implementation of Protective Action .1-6
References .1-7
2. Protective Action Guides for the Early Phase of an Atmospheric Release 2-1
2.1 Introduction .2-1
2.1.1 Applicability .2-12.1.2 Emergency Planning Zones and the PAGs .2-2
j 2.1.3 Incident Phase ................................... 2-3
2.2 Exposure Pathways .......... 2-32.3 The Protective Action Guides .......... 2-4
2.3.1 Evacuation and Sheltering .......... 2-52.3.2 Thyroid and Skin Protection .......... 2-7
2.4 Dose Projection .......... 2-82.5 Guidance for Controlling Doses to Workers Under
Emergency Conditions ............................ 2-9
References .2-13
3. Protective Action Guides for the Intermediate Phase (Food and Water) 3-1
4. Protective Action Guides for the Intermediate Phase(Deposited Radioactive Materials) .4-1
4.1 Introduction .. 4-1
4.1.1 Exposure Pathways .4-2
v

Page
4.1.2 The Population Affected ........................... 4-3
4.2 The Protective Action Guides for Deposited Radioactivity ...... 4-3
4.2.1 Longer Term Objectives of the Protective Action Guides ... 4-44.2.2 Applying the Protective Action Guides for Relocation ..... . 4-5
4.3 Exposure Limits for Persons Reentering the Restricted Zone .... 4-6
References ............... ............................... 4-6
5. Implementing the Protective Action Guides for the Early Phase ..... 5-1
0
5.1 Introduction ........................................ .5-15.2 Initial Response and Sequence of Subsequent Actions
5.2.1 Notification ...............................5.2.2 Immediate Protective Action .................
5.3 The Establishment of Exposure Patterns .............5.4 Dose Projection ................................
5.4.1 Duration of Exposure .......................
5.4.2 Dose Conversion Factors ....................
5.4.3 Comparison with Previously-Recommended PAGs
5.5 Protective Actions ..............................
5.5.1 Evacuation ...............................5.5.2 Sheltering ...............................
5.5.3 General Guidance for Evacuation and Sheltering
5.6 Procedures for Calculating Dose Conversion Factors ....
....... 5-1
.---.... 5-3
...... 5-3
.... %. 5-4...... 5-6
...... 5-6
...... 5-8
...... 5-16
...... 5-17
...... 5-18
...... 5-19
.. 5-21
...... 5-22
tJI
5.6.1 External Exposure to Gamma Radiation from the Plume5.6.2 Inhalation from the Plume ......................5.6.3 External Dose from Deposited Materials ...........
References ...........................................
.5-23.. 5-23.. 5-24
.. 5-42
vi 0

Page
6. Implementing the Protective Action Guides for the Intermediate Phase(Food and Water) ........................ 6-1
7. Implementing the Protective Action Guides for the Intermediate Phase(Exposure to Deposited Materials) ........................ 7-1
7.1 Introduction. ............. : ..... 7-1
7.1.1 Protective Actions ........ ............. 7-27.1.2 Areas Involved ..................... 7-27.1.3 Sequence of Events ........ ............. 7-4
7.2 Establishment of Isodose-Rate Lines ....... ............... 7-67.3 Dose Projection ....................................... 7-7
7.3.1 Projected External Gamma Dose .................... 7-87.3.2 Inhalation Dose Projection ........ ................ 7-14
7.4 Priorities .......................................... 7-177.5 Reentry .......................................... 7-177.6 Surface Contamination Control .......... ............... 7-19
7.6.1 Considerations and Constraints ....... ............. 7-197.6.2 Numerical Relationships .......... ............... 7-217.6.3 Recommended Surface Contamination Limits ..... ..... 7-21
References. ...... ............ 7-25
8. Radiation Protection Guidance for the Late Phase (Recovery) (reserved) 8-1
TABLES
1-1 Exposure Pathways, Accident Phases, and Protective Actions .... ... 1-4
2-1 Protective Actions Guides for the Early Phase of a Nuclear Incident . . 2-6
2-2 Guidance on Dose Limits for Workers Performing Emergency Services 2-10
2-3 Health Effects Associated with Whole-Body Absorbed DosesReceived Within a Few Hours (see Appendix B) ................. 2-12
vii

Page
2-4 Approximate Cancer Risk to Average Individuals from 25 Rem . .Effective Dose Equivalent Delivered Promptly (see Appendix C) .... 2-12
4-1 Protective Action Guides for Exposure to Deposited RadioactivityDuring the Intermediate Phase of a Nuclear Incident ..... ........ 4-4
5-1 Dose Conversion Factors (DCF) and Derived Response Levels (DRL)for Combined Exposure Pathways During the Early Phase ofa Nuclear Incident ........................................ 5-9
5-2 Dose Conversion Factors (DCF) and Derived Response Levels (DRL)Corresponding to a 5 rem Thyroid Dose Equivalent fromInhalation of Radioiodine .................................. 5-15
5-3 Dose Conversion Factors (DCF) and Derived Response Levels (DRL)for External Exposure Due to Immersion in Contaminated Air ..... 5-25
5-4 Dose Conversion Factors (DCF) and Derived Response Levels (DRL)for Doses Due to Inhalation ................................. 5-31
5-5 Dose Conversion Factors (DCF) and Derived Response Levels (DRL)for a 4-Day Exposure to Gamma Radiation C)from Deposited Radionuclides . .............................. 5-37
7-1 Gamma Exposure Rate and Effective Dose Equivalent (Correctedfor Radioactive Decay and Weathering) due to an Initial UniformConcentration of 1 pCi/m2 on Ground Surface ..... .............. 7-9
7-2 Exposure Rate and the Effective Dose Equivalent (Corrected forRadioactive Decay) due to an Initial Concentration of 1 pCi/mon Ground Surface ....................................... 7-10
7-3 Example Calculation of Dose Conversion Factors for Gamma ExposureRate Measurements Based on Measured Isotopic Concentrations .... 7-13
74 Dose Conversion Factors for Inhalation of Resuspended Material ... 7-16
7-5 Skin Beta Dose Conversion Factors for Deposited Radionuclides .... 7-25
7-6 Recommended Surface Contamination Screening Levels forEmergency Screening Levels for Emergency Screening of Persons
....-

Page
and Other Surfaces at Screening or Monitoring Stations in HighBackground Radiation Areas ............................... 7-23
7-7 Recommended Surface Contamination Screening Levels for Personsand Other Surfaces at Monitoring Stations in LowBackground Radiation Areas ................................. 7-24
FIGURES
7-1 Response Areas .......................................... 7-3
7-2 Time Frame of Response to a Major Nuclear Reactor Accident ....... 7-6
APPENDICES
A. Glossary
B. Risks to Health From Radiation Doses that may Result fromNuclear Incidents
C. Protective Action Guides for the Early Phase: Supporting Information
D. Background for Protective Action Recommendations: AccidentalContamination of Food and Animal Feeds
E. Protective Action Guides for the Intermediate Phase (Relocation)Background Information
F. Radiation Protective Criteria for the Late Phase: SupportingInformation (Reserved)
ix

(7� CHAPTER 1
Overview
1.0 Introduction
Public officials, in discharging theirresponsibility to protect the health ofthe public during hazardous situations,will usually be faced with decisionsthat must be made in a short period oftime. A number of factors influencingthe choice of protective actions willexist, so that the decisions may becomplex. Further, all of theinformation needed to make theoptimum choice will usually not beimmediately available. In such situ-ations, it will therefore be helpful if thecomplexity of the information uponwhich needed decisions are based canbe reduced by careful planning duringthe formulation of emergency responseplans.
The U.S. Environmental ProtectionAgency has developed this manual toassist public officials in planning foremergency response to nuclearincidents. In the context of thismanual, a nuclear incident is definedas an event or a series of events, eitherdeliberate or accidental, leading to therelease, or potential release, into theenvironment of radioactive materials insufficient quantity to warrantconsideration of protective actions.(The term "incident" includes accidents,in the context of this manual.) Aradiological emergency may result froman incident at a variety of types offacilities, including, but not limited to,
those that are part of the nuclear fuelcycle, defense and research facilities,and facilities that produce or useradioisotopes, or from an incidentconnected with the transportation oruse of radioactive materials at locationsnot classified as "facilities". Thismanual provides radiological protectioncriteria intended for application to allnuclear incidents requiringconsideration of protective actions,other than nuclear war. It is designedfor the use of those in Federal, State,and local government withresponsibility for emergency responseplanning. The manual also providesguidance for implementation of thecriteria. This has been developedprimarily for incidents at nuclearpower facilities. Although this imple-mentation guidance is intended to beuseful for application at other facilitiesor uses of radioactivity, emergencyresponse plans will require thedevelopment of additionalimplementation procedures whenphysical characteristics of theradionuclides involved are differentfrom those considered here.
The decision to advise members ofthe public to take an action to protectthemselves from radiation from anuclear incident involves a complexjudgment in which the risk avoided bythe protective action must be weighedin the context of the risks involved intaking the action. Furthermore, the
1-1

decision may have to be made underemergency conditions, with little or nodetailed information available.Therefore, considerable planning isnecessary to reduce to a manageablelevel the complexity of decisionsrequired to effectively protect thepublic at the time of an incident.
- An objective of emergency planningis to simplify the choice of possibleresponses so that judgments arerequired only for viable and usefulalternatives when an emergencyoccurs. During the planning process itis possible to make some valuejudgments and .to determine whichresponses are not required, . whichdecisions can be made on the basis ofprior judgments, and which judgmentsmust be made during an actualemergency. From this exercise, it isthen possible to devise operationalplans which can be used to respond tothe spectrum of hazardous situationswhich may develop.
The main contribution to theprotection of the public from abnormalreleases of radioactive material isprovided by site selection, design,quality assurance in construction,engineered safety systems, and thecompetence of staff in safe operationand maintenance. These measures canreduce both the probability and themagnitude of potential consequences ofan accident. Despite these measures,the occurrence of nuclear incidentscannot be excluded. Accordingly, emer-gency response planning to mitigatethe consequences of an incident is anecessary supplementary level ofprotection.
During a nuclear incident, whenthe source of exposure of the public isnot under control, the public usuallycan be protected only by some form ofintervention which will disrupt normalliving. Such intervention is termedprotective action.. A Protective ActionGuide (PAG) is the projected dose toreference man, or other definedindividual, from an unplanned releaseof radioactive material at which aspecific protective action to reduce oravoid that dose is recommended. Theobjective of this manual is to providesuch PAGs for the principal protectiveactions available to public officialsduring a nuclear incident, and toprovide guidance for their.use.
1.1 Nuclear Incident Phases andProtective Actions
it is convenient to identify threetime phases which are generallyaccepted as being common to allnuclear incident sequences; withineach, different considerations apply tomost protective actions. These aretermed the early, intermediate, andlate phases. Although these phasescannot be represented by preciseperiods and may overlap, they providea useful framework for theconsiderations involved in emergencyresponse planning.
a
0
The early phase (also referred to asthe emergency phase) is the period atthe beginning of a nuclear incidentwhen immediate decisions for effectiveuse of protective actions are requiredand must therefore usually, be basedprimarily on the status of the nuclear
0. 1-2

C.,facility (or other incident site) and theprognosis for worsening conditions.When available, predictions of radio-logical conditions in the environmentbased on-the condition of the source oractual environmental measurementsmay also be used. Protective actionsbased on the PAGs may be preceded byprecautionary actions during thisperiod. This phase may last fromhours to days.
The intermediate phase is theperiod beginning after the source andreleases have been brought undercontrol and reliable environmentalmeasurements are available for use asa basis for decisions on additionalprotective actions. It extends untilthese additional protective actions areterminated. This phase may overlapthe early and late phase and may lastfrom weeks to many months.
The late phase (also referred to asthe recovery phase) is the periodbeginning when recovery actiondesigned to reduce radiation levels inthe environment to acceptable levelsfor unrestricted use are commenced,and ending when all recovery actionshave been completed. This period mayextend from months to years.
The protective actions available toavoid or reduce radiation dose can becategorized as a function of exposurepathway and incident phase, as shownin Table 1-1. Evacuation and shel-tering (supplemented by bathing andchanges of clothing), are the principalprotective actions for use during theearly phase to protect the public fromexposure to direct radiation and
inhalation from an airborne plume. Itmay also be appropriate to initiateprotective action for the milk supplyduring this period, and, in cases whereemergency response plans includeprocedures for issuing stable iodine toreduce thyroid dose (FE-85), this maybe an appropriate protective action forthe early phase.
Some protective actions are notaddressed by assignment of a PAG.For example, the control of access toareas is a protective action whoseintroduction is coupled to a decision toimplement one of the other early orintermediate phase protective actionsand does not have a separate PAG.And, although the use of simple, ad hocrespiratory protection may beapplicable for supplementary protectionin some circumstances, this protectiveaction is primarily for use byemergency workers.
There are two types of protectiveactions during the intermediate phase.First, relocation and decontaminationare the principal protective actions forprotection of the public from wholebody external exposure due todeposited material and from inhalationof any* resuspended radioactiveparticulate materials during theintermediate and late phases. It isassumed that decisions will be madeduring the intermediate phaseconcerning whether areas from whichthe public has been relocated will bedecontaminated and reoccupied, orcondemned and the occupantspermanently relocated. The secondmajor type of protective action duringthe intermediate phase encompasses
, .. ..
H.
1-3

TABLE 1-1. EXPOSURE PATHWAYS, INCIDENT PHASES,AND PROTECTIVE ACTIONS.
POTENTIAL EXPOSURE PATHWAYSAND INCIDENT PHASES
PROTECrIVEACTIONS
I. External radiation from
1. Exteral radiation fromfacility
2. External radiation from plume
ShelteringEvacuationControl of access
ShelteringEvacuationControl of access
3. Inhalation of activity inplume
4. Contamination of skin andclothes
5. External radiation fromground deposition of activity
6. Ingestion of contaminatedfood and water
7. Inhalation of resuspendedactivity
Early
Intermediatle
Lae
ShelteringAdministration of stable iodineEvacuationControl of access
ShelteringEvacuationDecontamination of persons
EvacuationRelocationDecontamination of land
and property
Food and water controls
RelocationDecontamination of land
and property
10-7 '
Note: Thc use of stord animal feed and uncontaminated water to limit the uptake of mdionuclidesby domestic animals in the food chain can be applicable in any of the phases.
1-4 0---

restrictions on the use of contaminatedfood and water. This protective action,in particular, may overlap the early.and late phases.
It is necessary to distinguishbetween evacuation and relocation withregard to incident phases. Evacuationis the urgent removal of people from anarea to avoid or reduce high-level,short-term exposure, usually from theplume or deposited activity.Relocation, on the other hand, is theremoval or continued exclusion ofpeople (households) from contaminatedareas to avoid chronic radiationexposure. Conditions may develop inwhich some groups who have beenevacuated in an emergency may beallowed to return based on therelocation PAGs, while others may beconverted to relocation status.
1.2 Basis for Selecting ProtectiveAction Guides
The PAGs in this manualincorporate the concepts and guidancecontained in Federal Radiation Council(FRC) Reports 5 and 7 (FR-64 andFR-65). One of these is that thedecision to implement protectiveactions should be based on theprojected dose that would be received ifthe protective actions were notimplemented. However, since thesereports were issued, considerableadditional guidance has been developedon the subject of emergency response(IC-84, IA-89). EPA considered thefollowing four principles in establishingvalues for the PAGs:
1. Acute effects on health (those thatwould be observable within a shortperiod of time and which have a dosethreshold below which such effects arenot likely to occur) should be avoided.
*2. The risk of delayed effects onhealth (primarily cancer and geneticeffects for which linear nonthresholdrelationships to dose are assumed)should not exceed upper bounds thatare judged to be adequately protectiveof public health under emergencyconditions, and are reasonablyachievable.
3. PAGs should not be higher thanjustified on the basis of optimization ofcost and the collective risk of effects onhealth. That is, any reduction of riskto public health achievable atacceptable cost should be carried out.
4. Regardless of the above principles,the risk to health from a protectiveaction should not itself exceed the riskto health from the dose that would beavoided.
The above principles apply to theselection of any PAG. Principles 1, 3,and 4 have been proposed for use bythe international community asessential bases for decisions tointervene during an incident andPrinciple 2 has been recognized as anappropriate additional consideration(IA-89).. Appendices C and E applythese principles to the choice of PAGsfor evacuation and relocation.Although in establishing the PAGs it isprudent to consider a range of sourceterms to assess the costs associatedwith their implementation, the PAGs
1-5

are chosen so as to be independent ofthe magnitude or type of release.
1.3 Planning -
The planning elements fordeveloping radiological emergencyresponse plans for nuclear incidents atcommercial nuclear power facilities areprovided in a separate document,NUREG-0654 (NR-80), whichreferences the PAGs in this Manual asthe basis for emergency response.Planning elements for other types ofnuclear incidents should be developedusing similar types of considerations.
Similarly, guidance for nuclearpower facilities on time frames forresponse, the types of releases to beconsidered, emergency planning zones(EPZ), and the potential effectivenessof various protective actions is providedin NUREG-0396 (NR-78). The size andshape of the recommended EPZs wereonly partially based on consideration ofthe numerical values of the PAGs. Aprinciple additional basis was that theplanning zone for evacuation andsheltering should be large enough toaccommodate any urban and ruralareas affected and involve the variousorganizations needed for emergencyresponse. This consideration isappropriate for any facility requiringan emergency response plan involvingoffsite areas. Experience gainedthrough emergency response exercisesis then expected to provide an adequatebasis for expanding the response to anactual incident to larger areas, ifneeded. It is also noted that the10-mile radius EPZ for the early phase
is large enough to avoid exceeding thePAGs for the *early phase at itsboundary for low-consequence, nuclearreactor, core-melt accidents and toavoid early fatalities forhigh-consequence, nuclear reactorcore-melt accidents. The 50-mile EPZfor ingestion pathways was selected toaccount for the proportionately higherdoses via ingestion compared toinhalation and whole body externalexposure pathways.
0
1.4 Implementation of ProtectiveActions
The sequence of events during theearly phase includes evaluation ofconditions at the location of theincident, notification of responsibleauthorities, prediction or evaluation ofpotential consequences to the generalpublic, recommendations for action,and implementing protection of thepublic. In the early phase of response,the time available to implement themost effective protective actions may belimited.
Immediately upon becoming awarethat an incident has occurred that mayresult in exposure of the population,responsible authorities should make apreliminary evaluation to determinethe nature and potential magnitude ofthe incident. This evaluation shoulddetermine whether conditions indicatea significant possibility of a majorrelease and, to the extent feasible,determine potential exposurepathways, populations at risk, andprojected doses. The incident eval-uation and recommendations should
1-6 0'

then be presented to emergencyresponse authorities for action. In theabsence of recommendations forprotective actions in specific areas fromthe official-responsible for the source,the emergency plan should, wherepracticable, provide for protectiveaction in predesignated areas.
Contrary to the usual situationduring the early phase, dose projectionsused to support protective actiondecisions during the intermediate andlate phases will be based onmeasurements of environmentalradioactivity and dose models.Following relocation of the public fromaffected areas to protect them fromexposure to deposited materials, it willalso be necessary to compileradiological and cost ofdecontamination data to form the basisfor radiation protection decisions forrecovery.
The PAGs do not imply anacceptable level of risk for normal(nonemergency conditions). They alsodo not represent the boundary betweensafe and unsafe conditions, rather, theyare the approximate levels at which theassociated protective actions arejustified. Furthermore, under emer-gency conditions, in addition to theprotective actions specifically identifiedfor application of PAGs, any otherreasonable measures available shouldbe taken to minimize radiationexposure of the general public and ofemergency workers.
References
FE-85 F e d e r a l E m e r E e n c yManagement Agency. Federal Policy onDistribution of Potassium Iodide aroundNuclear Power Sites for Use as a ThyroidalBlockingAgent. Federal Register,: 5,30256;July 24, 1985.
FR-64 F e d e r a l R a d i a t i o nCouncil. Radiation Protection Guidance forFederal Agencies. Federal Register, 29,12056-7; August 22, 1965.
FR-65 F e d e r a l R a d i a t i o nCouncil. Radiation Protection Guidance forFederal Agencies. Federal Register. 306953-5, May 22, 1965.
IA-89 International AtomicEnergy Agency. Principles for EstablishingIntervention Levels for the Protection of thePublic in the Event of a Nuclear Accident orRadiological Emergency. Safety Series No.2, revision 1, International Atomic Energy
Agency, Vienna (1991). .
IC-84 I n t e r n a t i o n a lCommission on Radiological Protection.Protection of the Public in the Event ofMajor Radiation Accidents: Principles forPlanning, ICRP Publication 40, PergamonPress, Oxford (1984).
NR-78 N u c l e a r R e g u l a t o r yCommission. Planning Basis for theDevelopment of State and Local GovernmentRadiological Emergency Response Plans inSupport of Light Water Nuclear PowerPlants, U.S. Nuclear RegulatoryCommission, Washington (1978).
NR-80 N u c l e a r R e g u l a t o r yCommission. Criteria for Preparation andEvaluation of Radiological EmergencyResponse Plans and Preparedness in Supportof Nuclear Power Plants. U.S. NuclearRegulatory Commission, Washington (1980).
1-7

(7) CHAPTER 2
Protective Action Guides for the Early Phaseof an Atmospheric Release
2.1 Introduction
Rapid action may be needed toprotect members of the public duringan incident involving a large release ofradioactive materials to theatmosphere. This chapter identifiesthe levels of exposure to radiation atwhich such prompt protective actionshould be initiated. These are set forthas Protective Action Guides (PAGs) forthe general population. Guidance forlimiting exposure of workers duringsuch an incident is also provided. Thisguidance applies to any type of nuclearaccident or other incident (exceptnuclear war) that can result inexposure of the public to an airbornerelease of radioactive materials.
In the case of an airborne releasethe principal relevant protectiveactions are evacuation or sheltering.These may be supplemented by.additional actions such as washing andchanging clothing or by using stableiodine to partially block uptake ofradioiodine by the thyroid.
The former Federal RadiationCouncil (FRC), in a series ofrecommendations issued in the 1960's,introduced the concept of PAGs andissued guides for avoidance of exposuredue to ingestion of strontium-89,strontium-90, cesium-137, and
iodine-131. Those guides weredeveloped for the case of worldwideatmospheric fallout from weaponstesting, and are appropriate forapplication to intake due to long termcontamination from such atmosphericreleases. That is, they were notdeveloped for protective actionsrelevant to prompt exposure to anairborne release from a fixed facility.The guidance in this chapter thus doesnot supersede this previous FRCguidance, but provides new guidancefor different exposure pathways andsituations.
2.1.1 Applicability
These PAGs.are expected to beused for planning purposes: forexample, to develop radiologicalemergency response plans and toexercise those plans. They provideguidance for response decisions andshould not be regarded as dose limits.During a real incident, because ofcharacteristics of the incident and localconditions that cannot be anticipated,professional judgment will be requiredin their application. Situations couldoccur, for example, in which a nuclearincident happens when environmentalconditions or other constraints makeevacuation impracticable, In thesesituations, sheltering may be the
2-1

protective action of choice, even atprojected doses above the PAG forevacuation. Conversely, in some casesevacuation may be useful at projecteddoses below the PAGs. Each case willrequire judgments by those responsiblefor decisions on protective actions atthe time of an incident.
The PAGs are intended for generaluse to protect all of the individuals inan exposed population. To avoid socialand family disruption and thecomplexity of implementing differentPAGs for different groups underemergency conditions, the PAGs shouldbe applied equally to most members ofthe population. However, there aresome population groups that are atmarkedly different levels of risk fromsome protective actions - particularlyevacuation. Evacuation at highervalues is appropriate for a few groupsfor whom the risk associated withevacuation is exceptionally high (e.g.,the infirm who are not readily mobile),and the PAGs provide for this.
Some incidents may occur undercircumstances in which protectiveactions cannot be implemented prior toa release (e.g., transportationincidents). Other incidents mayinvolve only slow, small releases overan extended period, so that the urgencyis reduced and protective action may bemore appropriately treated asrelocation (see Chapter 4) than asevacuation. Careful judgment will beneeded to decide whether or not toapply these PAGs for the early phaseunder such circumstances.
The PAGs do not imply anacceptable level of risk for normal(nonemergency) conditions. PAGs alsodo not represent the boundary betweensafe and unsafe conditions; rather, theyare the approximate levels at which theassociated protective actions arejustified. Furthermore, underemergency conditions, in addition tothe protective actions specificallyidentified, any other reasonablemeasures available should be taken toreduce radiation exposure of thegeneral public and of emergencyworkers. These PAGs are not intendedfor use as criteria for the ingestion ofcontaminated food or water, forrelocation, or for return to an areacontaminated by radioactivity.Separate guidance is provided for thesesituations in Chapters 3 and 4.
2.1.2 Emergency Planning Zones andthe PAGs
0:
For the purpose of identifying thesize of the planning area needed toestablish and test radiologicalemergency response plans, emergencyplanning zones (EPZs) are typicallyspecified around nuclear facilities.There has been some confusion amongemergency planners between theseEPZs and the areas potentially affectedby protective actions. It is notappropriate to use the maximumdistance where a PAG might beexceeded as the basis for establishingthe boundary of the EPZ for a facility.For example, the choice of EPZs forcommercial nuclear power facilities hasbeen based, primarily, on considerationof the area needed to assure an
,.*. 0U,2-2

n adequate planning basis for localresponse functions and the area inwhich acute health effects could occur.'These considerations will also beappropriate for use in selecting EPZsfor most other nuclear facilities.However, since it will usually not benecessary to have offsite planning ifPAGs cannot be exceeded offsite, EPZsneed not be established for such cases.
2.1.3 Incident Phase
The period addressed by thischapter is denoted the "early phase."This is somewhat arbitrarily defined asthe period beginning at the projected(or actual) initiation of a release andextending to a few days later, whendeposition of airborne materials hasceased and enough information hasbecome available to permit reliabledecisions about the need for longerterm protection. During the earlyphase of an incident doses may accrueboth from airborne and from depositedradioactive materials. Since-the -doseto persons who are not evacuated willcontinue until relocation can beimplemented (if it is necessary), it isappropriate to include in the early
'The development of EPZs for nuclear powerfacilities is discussed in the 1978 NRC/EPAdocument "Planning Basis for the Developmentof State and Local Government RadiologicalEmergency Response Plans in Support of LightWater Nuclear Power Plants" NUREG-0396.EPZs for these facilities have typically beenchosen to have a radius of approximately 10miles for planning evacuation and shelteringand a radius of approximately 50 miles forplanning protection from ingestion ofcontaminated foods.
phase the total dose that will bereceived prior to such relocation. Forthe purpose of planning, it will usuallybe convenient to assume that the earlyphase will last for four days -- that is,that the duration of the .primaryrelease is less than four days, and thatexposure to deposited materials afterfour days can be addressed throughother protective actions, such asrelocation, if this is warranted.(Because of the unique characteristicsof some facilities or situations, differenttime periods may be more appropriatefor planning purposes, withcorresponding modification of the doseconversion factors cited in Chapter 5.)
2.2 Exposure Pathways
The PAGs for members of thepublic specified in this chapter referonly to doses incurred during the earlyphase. These may include externalgamma dose and beta dose to the skinfrom direct exposure to airbornematerials . and from.., depositedmaterials, and the committed dose tointernal organs from inhalation ofradioactive material. Exposurepathways that make only a smallcontribution (e.g., less than about 10percent) to the dose incurred in theearly phase need not be considered.Inhalation of resuspended particulatematerials will, for example, generallyfall into this category.
Individuals exposed to a plumemay also be exposed to depositedmaterial over longer periods of time viaingestion, direct external exposure, andinhalation pathways. Because it is
(1_
2-3

usually not practicable, at the time ofan incident, to project these long-termdoses and because different protectiveactions maybe appropriate, these dosesare not included in the dose specifiedin the PAGs for the early phase. Suchdoses are addressed by the PAGs forthe intermediate phase (see Chapters 3and 4).
The first exposure pathway froman accidental airborne release of-radioactive material will often be directexp.sure to an overhead pli ne ofradioactive material carried by winds.The detailed content of such a plumewill depend on the source involved andconditions of the incident. Forexample, in the case of an incident at anuclear power reactor, it would mostcommonly contain radioactive noblegases, but may also containradioiodines and radioactive particulatematerials. Many of the these materialsemit gamma radiation which canexnose people nearby, as the plumepasses. In the case of some other typesof incidents, particularly thoseinvolving releases of alpha emittingparticulate materials, direct exposureto garnma radiation is not likely to bethe most important pathway.
A second exposure pathway occurswhen people are directly immersed in aradioactive plume, in which caseradioactive material is inhaled (and theskin and clothes may also becomecontaminated), e.g., when particulatematerials or radioiodines are present.When this occurs, internal body organsas well as the skin may be exposed.Although exposure from materialsdeposited on the skin and clothing
could be significant, generally it will beless important than that fromradioactive material taken into thebody through inhalation. This isespecially true if early protectiveactions include washing exposed skinand. changing clothing. Inhaledradioactive particulate materials,depending on their solubility in bodyfluids, may remain in the lungs ormove via the bloodstream to otherorgans, prior to elimination from thebody. Some radionuclides, once in thebloodstream, are concentrated in asingle body organ, with only smallamounts going to other organs. Forexample, if radioiodines are inhaled, asignificant. fraction moves rapidlythrough the bloodstream to the thyroidgland.
As the passage of a radioactiveplume containing particulate materialand/or radioiodine progresses, some ofthese materials will deposit onto theground and other surfaces and create athird exposure pathway. Peoplepresent after the plume has passed willreceive exposure from gamma and betaradiation emitted from these depositedmaterials. If large quantities ofradioiodines or gamma-emittingparticulate materials are contained ina release, this exposure pathway, overa long period, can be more significantthan direct exposure to gammaradiation from the passing plume.
011---
0.J
2.3 The Protective Action Guides
The PAGs for response during theearly phase of an incident aresummarized in Table 2-1. The PAG for
0,2-4

C)7-, evacuation (or, as an alternative incertain cases, sheltering) is expressedin terms of the projected sum of theeffective dose equivalent from externalradiation and the committed effectivedose equivalent incurred frominhalation of radioactive materials fromexposure and intake during the earlyphase. (Further references to dose tomembers of the public in this Chapterrefer to this definition, unlessotherwise specified.) Supplementaryguides are specified in terms ofcommitted dose equivalent to thethyroid and dose equivalent to the skin.The PAG for the administration ofstable iodine is specified in terms of thecommitted dose equivalent to thethyroid from radioiodine. This morecomplete guidance updates andreplaces previous values, expressed interms of whole-body dose equivalentfrom external gamma exposure andthyroid dose equivalent from inhalationof radioactive iodines, that wererecommended in the 1980 edition ofthis document. -.
2.3.1 Evacuation and Sheltering
The basis for the PAGs is given inAppendix C. In summary, this analysisindicates that evacuation of the publicwill usually be justified when theprojected dose to an individual is onerem. This conclusion is based prim-arily on EPA's judgment concerningacceptable levels of risk of effects onpublic health from radiation exposurein an emergency situation. Theanalysis also shows that, at thisradiation dose, the risk avoided isusually much greater than the risk
from evacuation itself. However, EPArecognizes the uncertainties associatedwith quantifying risks associated withthese levels of radiation exposure, aswell as the variability of risksassociated with evacuation underdiffering conditions.
Some judgment will be necessarywhen considering the types ofprotective actions to be implementedand at what levels in an emergencysituation. Although the PAG isexpressed as a range of 1-5 rem, it isemphasized that, under normalconditions, evacuation of members ofthe general population should beinitiated for most- incidents at aprojected dose of 1 rem. (It should berecognized that doses to someindividuals may exceed 1 rem, even ifprotective actions are initiated withinthis guidance.) It is also possible thatconditions may exist at specificfacilities which warrant considerationof values other than those recom-mended for general use here.3
Sheltering may be preferable toevacuation as a protective action insome situations. Because of the higherrisk associated with evacuation of somespecial groups in the population (e.g.those who are not readily mobile),sheltering may be the preferredalternative for such groups as a
3EPA, in accordance with its responsibilitiesunder the regulations governing radiologicalemergency planning (47FR10758; March 11,1982) and under the Federal RadiologicalEmergency Response Plan, will consult withFederal agencies and the States, as requested,in such cases.
0--J;
2-5

Table 2-1 PAGs for the Early Phase of a Nuclear Incident 0)Protective PAG CommentsAction - (projected dose)
Evacuation 1-5 remb Evacuation (or, for some
(or shelteringa) situations, sheltering)
should normally be
initiated at 1 rem.
Further guidance is
provided in Section 2.3.1
Administration of 25 rem' Requires approval of
stable iodine State medical officials.
'Sheltering may be the preferred protective action when it will provide protection equal to orgreater than evacuation, based on consideration of factors such as source term characteristics, andtemporal or other site-specific conditions (see Section 2.3.1).
bThe sum of the effective dose equivalent resulting from exposure to external sources and thecommitted effective dose equivalent incurred from all significant inhalation pathways during theearly phase. Committed dose equivalents to the thyroid and to the skin may be 5 and 50 timeslarger, respectively.
'Committed dose equivalent to the thyroid from radioiodine.
protective action at projected doses upto 5 rem. In addition, under unusuallyhazardous environmental conditionsuse of sheltering at projected doses upto 5 rem to the general population (andup to 10 rem to special groups) maybecome justified. Sheltering may alsoprovide protection equal to or greaterthan evacuation due to the nature ofthe source term and/or in the presenceof temporal or other site-specific
conditions. Illustrative examples ofsituations or groups for whichevacuation may not be appropriate at 1rem include: a) the presence of severeweather, b) competing disasters, c)institutionalized persons who are notreadily mobile, and d) local physicalfactors which impede evacuation.Examples of situations or groups forwhich evacuation at 1 rem normallywould be appropriate include: a) an
2-6

C -.) incident which occurs at night, b) anincident which occurs when childrenare in school, and c) institutionalizedpersons who are :readily mobile.Evacuation'seldom will be justified atless than 1 rem. to The examplesdescribed above regarding selection ofthe most appropriate protective actionare intended to be illustrative and notexhaustive. In general, shelteringshould be preferred to evacuationwhenever it provides equal or greaterprotection.
No specific minimum level isestablished for initiation of sheltering.Sheltering in place is a low-cost,low-risk protective action that canprovide protection with an efficiencyranging from zero to almost 100percent, depending on the circum-stances. It can also be particularlyuseful to assure that a population ispositioned so that, if the need arises,communication with the population canbe carried out expeditiously. For theabove reasons, planners and decisionmakers should consider implementingsheltering at projected doses below 1rem; however, implementing protectiveactions for projected doses at very lowlevels would not be reasonable (e.g.below 0.1 rem); (This guidance shouldnot be construed as establishing anadditional lower level PAG forsheltering.) Sheltering should alwaysbe implemented in cases whenevacuation is not carried out atprojected doses of 1 rem or more.
Analyses for some hypothesizedaccidents, such as short-term releasesof trinsuranic materials, show thatsheltering in residences and other
buildings can be highly effective atreducing dose, may provide adequateprotection, and may be more effectivethan "evacuation when evacuationcannot be completed before plumearrival (DO-90). However, reliance onlarge, dose reduction.. factors forsheltering should be accompanied bycautious examination ofpossible failuremechanisms, and, except in veryunusual circumstances, should never berelied upon at projected doses greaterthan 10 rem. Such analyses should bebased on realistic or 'best estimate"dose models and include unavoidabledose during evacuation. Sheltering andevacuation are discussed in more detailin Section 5.5.
2.3.2 Thyroid and Skin Protection
Since the thyroid is atdisproportionately high risk forinduction of nonfatal cancer andnodules, compared to other internalorgans, additional guidance is providedto limit the-risk of-these effects (seefootnote to Table 2-1). In addition,effective dose, the quantity used toexpress the PAG, encompasses only therisk of fatal cancer from irradiation oforgans within the body, and does notinclude dose to skin. Guidance is alsoprovided, therefore, to protect againstthe risk of skin cancer (see Table 2-1,footnote b).
The use of stable iodine to protectagainst uptake of inhaled radioiodineby the thyroid is recognized as aneffective alternative to evacuation forsituations involving radioiodinereleases when evacuation cannot be
2-7

implemented or exposure occurs duringevacuation. Stable iodine is mosteffective when administeredimmediately prior to exposure toradioiodine. - However, significantblockage of the thyroid dose can beprovided by administration within oneor two hours after uptake of radio-iodine. If the administration of stableiodine is included in an emergencyresponse plan, its use may beconsidered for exposure situations inwhich the committed dose equivalent tothe thyroid can be 25 rem or greater(see 47 FR 28158; June 29, 1982).
Washing and changing of clothingis recommended primarily to provideprotection from.beta radiation fromradioiodines and particulate materialsdeposited on the skin or clothing.Calculations indicate that dose to skinshould seldom, if ever, be a controllingpathway. However, it is good radiationprotection practice to recommend theseactions, even for alpha-emittingradioactive materials, as soon aspractical for persons significantlyexposed to a contaminating plume (i.e.,when the projected dose from inhala-tion would have justified evacuation ofthe public under normal conditions).
2.4 Dose Projection
The PAGs are expressed in termsof projected dose. However, in theearly phase of an incident (either at anuclear facility or other accident site),parameters other than projected dosemay . frequently provide a moreappropriate basis for decisions toimplement protective actions. When a
facility is operating outside its designbasis, or an incident is imminent buthas not yet occurred, data adequate todirectly estimate the projected dosemay not be available. For such cases,provision should be made during theplanning stage for decisions to be madebased on specific conditions at thesource of a possible release that arerelatable to ranges of anticipatedoffsite consequences. Emergencyresponse plans for facilities shouldmake use of Emergency Action Levels(EALs)4, based on in-plant conditions,to trigger notification of andrecommendations to offsite officials toimplement prompt* evacuation orsheltering in specified areas in theabsence of information on actualreleases or environmentalmeasurements. Later, when these databecome available, dose projectionsbased on measurements may be used,in addition to plant conditions, as thebasis for implementing furtherprotective actions. (Exceptions mayoccur at sites with large exclusionareas where some field and source datamay be available in sufficient time forprotective action decisions to be basedon environmental measurements.) Inthe case of transportation accidents orother incidents that are not related toa facility, it will often not bepracticable to establish EALs.
0.,
The calculation of projected dosesshould be based on realistic dose
4Emergency Action Levels related to plantconditions at commercial nuclear power plantsare discussed in Appendix 1 to NUREG-0654(NR-80).
..U2-8
I( ."-)
models, to the extent practicable.Doses incurred prior to initiation of aprotective action should not normallybe included. Similarly, doses thatmight be received following the earlyphase should not be included fordecisions on whether or not to evacuateor shelter. Such doses, which mayoccur from food and water, long-termradiation exposure to depositedradioactive materials, or long-terminhalation of resuspended materials,are chronic exposures for which neitheremergency evacuation nor shelteringare appropriate protective actions.Separate PAGs relate the appropriateprotective action decisions to thoseexposure pathways (Chapter 4). Asnoted earlier, the projection of doses inthe early phase need include only thoseexposure pathways that contribute asignificant fraction (e.g., more thanabout 10 percent) of the dose to anindividual.
In practical applications, doseprojection will usually begin at thetime of the anticipated (or actual)initiation of a release. For thosesituations where significant dose hasalready occurred prior to implementingprotective action, the projected dose forcomparison to a PAG should notinclude this prior dose.
2.5 Guidance for Controlling Doses toWorkers Under Emergency Conditions
The PAGs for protection of thegeneral population and dose limits forworkers performing emergency servicesare derived under differentassumptions. PAGs consider the risks
to individuals, themselves, fromexposure to radiation, and the risksand costs associated with a specificprotective action. On the other hand,workers may receive exposure under avariety of circumstances in order toassure protection of others and ofvaluable property. These exposureswill be justified if the maximum riskspermitted to workers are acceptablylow, and the risks or costs to othersthat are avoided by their actionsoutweigh the risks to which workersare subjected.
Workers who may incur increasedlevels of exposure under emergencyconditions may include those employedin law enforcement, fire fighting;radiation protection, civil defense,traffic control, health services,environmental monitoring, transpor-tation services, and animal care. Inaddition, selected workers atinstitutional, utility, and industrialfacilities, and at farms and otheragribusiness maybe required to protectothers, or to protect valuable propertyduring an emergency. The above areexamples - not designations - ofworkers that may be exposed toradiation under emergency conditions.
Guidance on dose limits forworkers performing emergency servicesis summarized in Table 2-2. Theselimits apply to doses incurred over theduration of an emergency. That is, incontrast to the PAGs, where only thefuture dose that can be avoided by aspecific protective action is considered,all doses received during an emergencyare included in the limit. Further, thedose to workers performing emergency
2-9

Table 2-2 Guidance on Dose Limits for Workers Performing Emergency Services0
Dose limit' Activity Condition(rem)
5 all
10 protecting valuable lower dose not practicableproperty
25 life saving or lower dose not practicableprotection of largepopulations
>25 lifesaving or only on a voluntary basisprotection of large to persons fully aware ofpopulations the risks involved (See
Tables 2-3 and 2-4)
'Sum of external effective dose equivalentand committed effective dose equivalent to nonpregnantadults from exposure and intake during an emergency situation. Workers performing services duringemergencies should limit dose to the lens of the eye to three times the listed value and doses to anyother organ (including skin and body extremities) to ten times the listed value. These limits apply toall doses from an incident, except those received in unrestricted areas as members of the public duringthe intermediate phase of the incident (see Chapters 3 and 4).
0
services may be treated as a once-in-a-lifetime exposure, and not added tooccupational exposure accumulatedunder nonemergency conditions for thepurpose of ascertaining conformance tonormal occupational limits, if this isnecessary. However, any radiationexposure of workers that is associatedwith an incident, but accrued duringnonemergency operations, should belimited in accordance with relevantoccupational limits for normalsituations. Federal RadiationProtection Guidance for occupationalexposure recommends an upper bound
of five rem per year for adults and onetenth this value for minors and theunborn (EP-87). We recommend use ofthis same value here for the case ofexposures during an emergency. Toassure adequate protection of minorsand the unborn during emergencies,the performance of emergency servicesshould be limited to nonpregnantadults. As in the case of normaloccupational exposure, doses receivedunder emergency conditions should alsobe maintained as low as reasonablyachievable (e.g.,. use of stable iodine,where appropriate, as a prophylaxis to
02-10

C>.) reduce thyroid dose from inhalation ofradioiodines and use of rotation ofworkers).
Doses to all workers duringemergencies should, to the extentpracticable, be limited to 5 rem. Thereare some emergency situations,however, for which higher exposurelimits may be justified. Justification ofany such exposure must include thepresence of conditions that prevent therotation of workers or othercommonly-used dose reductionmethods. Except as noted below, thedose resulting from such emergencyexposure should be limited to 10 remfor protecting valuable property, and to25 rem for life saving activities and theprotection of large populations. In thecontext of this guidance, exposure ofworkers that is incurred for theprotection of large populations may beconsidered justified for situations inwhich the collective dose avoided bythe emergency operation is signif-icantly larger than that incurred by theworkers involved.
Situations may also rarely occur inwhich a dose in excess of 25 rem foremergency exposure would beunavoidable in order to carry out alifesaving operation or to avoidextensive exposure of large populations.It is not possible to prejudge the riskthat one should be allowed to take tosave the lives of others. However,persons undertaking any emergencyoperation in which the dose will exceed25 rem to the whole body should do soonly on a voluntary basis and with fullawareness of the risks involved,including the numerical levels of dose
at which acute effects of radiation willbe incurred and numerical estimates ofthe risk of delayed effects.
Tables 2-3 and 2-4 provide somegeneral information that may be usefulin advising emergency workers of risksof -acute and delayed health effectsassociated with large doses of radia-tion. Table 2-3 presents estimatedrisks of early fatalities and moderatelysevere prodromal (forewarning) effectsthat are likely to occur shortly afterexposure to a wide range of whole bodyradiation doses. Estimated averagecancer mortality risks for emergencyworkers corresponding to a'whole-bodydose equivalent of 25 rem are given inTable 2-4, as a function of age at thetime of exposure. To estimate averagecancer mortality for moderately higherdoses the.results in Table 24 may beincreased linearly. These values werecalculated using a life table analysisthat assumes the period of riskcontinues for the duration of theworker's lifetime. Somewhat smallerrisks of serious genetic effects (ifgonadal tissue is exposed) and ofnonfatal cancer would also be incurred.An expanded discussion of healtheffects from radiation dose is providedin Appendix B.
Some workers performingemergency services will have little orno health physics training, so doseminimization through use of protectiveequipment cannot always be assumed.However, the use of respiratoryprotective equipment can reduce dosefrom inhalation, and clothing canreduce beta dose. Stable iodine is alsorecommended for blocking thyroid
2-11

Table 2-3 Health Effects Associated with Whole-Body Absorbed Doses ReceivedWithin a Few Hours' (see Appendix B)
Whole Body Early Whole Body Prodromal Effects'Absorbed dose Fatalitiesh Absorbed dose (percent affected)
(rad) (percent) -(rad)
140 5. 50 2200 .5-15 p" r 100 15300 50 150 50400 85 200 85460 95 250 98
'Risks will be lower for protracted exposure periods.
'Supportive medical treatment may increase the dose at whichthese frequencies occur by approximately 50 percent.
'Forewarning symptoms of more serious health effects associatedwith large doses of radiation.
Table 2-4 Approximate Cancer Risk to Average Individuals from 25 Rem EffectiveDose Equivalent Delivered Promptly (see Appendix C)
0OW
Appropriate risk Average years ofAge at of premature death life lost if premature
exposure (deaths per 1,000 death occurs(years) persons exposed) (years)
20 to30 9.1 2430 to 40 7.2 1940to 50 5.3 1550 to 60 3.5 11
02-12

0-uptake .of radioiodine in personnelinvolved in emergency actions whereatmospheric releases includeradioiodine. The decision to issuestable - iodine should includeconsideration of established Statemedical procedures, and planning isrequired to ensure its availability andproper use.
References
DO-90 U.S. Department of Energy.Effectiveness of Sheltering in Buildings andVehicles for Plutonium, DOE/EH-0159, U.S.Department of Energy, Washington (1990).
EP-87 U.S. Environmental Protection Agency.Radiation Protection Guidance to FederalAgencies for Occupational Exposure. FederalRegister 5, 2822; January 27, 1987.
NR-80 U.S. Nuclear Regulatory Commission.Criteria for Preparation and Evaluation ofRadiological Emergency Response Plans andPreparedness in Support of Nuclear PowerPlants. NUREG-0654, U.S. NuclearRegulatory Commission, Washington, (1980).
Q- .s...KJ~-
2-13

CHAPTER 3
C)
Protective Action Guides for the Intermediate Phase(Food and Water)
a) Accidental Radioactive Contamination of Human Food and Animal Feeds;Recommendations for State and Local Agencies*
b) Drinking Water**
* These recommendations were published by FDA in 1982.
Protective action recommendations for drinking water are under development byEPA.
C) 3-1

Federal Register / Vol. 47. No. 205 7 Friday. October 22. 1982 / Notices 47073
DEPARTMENT OF HEALTH AMDHUMAN SERVICES
Food and Drug Administraaon
*DodWt Mm 75N1OOSOl
Accidental Radiawti Contuekwtionof Human Food and Animal FoifdRecommenattons for State and LocalAgenciesAOrucY Food and Drug Admihistration.Acrtop Notice.
sumMArt The Food and DrugAdministration (FDA) is publishing thisnotice to provide to State and localagencies responsible for emergencyresponse planning for radiologicalincidents recommendations for takingprotective actions in the event that anincident causes the contamination ofhuman food or animal feeds. Theserecommendations can be used todetermine whether levels of radiationencountered In food after a radiologicalIncident warrant protective action andto suggest appropriate actions that maybe taken ifaction Is warranted FDA has
O) -a responsibility to issue guidance on

470,41 Federal Register | Vol. 47. No. 205 1 Frid.y. October 22. 1902 / Notices
appropriate planning actions neccssaryfor evaluating and preventingcontamination of human food andanimal feeds and on the control and useof these products should they becomecontaminated.FOR FURTHER INFORMATION CONTACTGail D. Schmidt, Bureau of Radiulogic:.ilHealth (HFX-1). Food and DrugAdministration. 5600 Fishers lane.Ruckville. iMD 20857. 301-443-2Ms.ZtUPPLSMENTARY INFORMATI00
BackgroundThis guidance on accidental
radioactive contamination of food fromfixed nuclear facilities. transportationaccidents. and fallout is part of aFederal interagency effort coordinatedby the Federal Emergency ManagementAgency (FEMA). FEMA issued a finalregulation In the Federal Register ofMarch 11 1982 (47 FR 10758). whichreflected governmental reorganizationsand reassigned agency responsibilitiesfor radiological incident emergencyresponse planning. A responsibilityassigned to the Department of Healthand Human Services (HHS) land in turndelegated to FDA) is the responsibilityto develop and specify to State and localgovermnents protective actions andassociated guidance for human food andanimal feed.
In the Federal Register of December15. 1978 (43 FR 58790). FDA publishedproposed recommendations for Stateand local agencies regarding accidentalradioactive contamination of humanfood and animal feeds. Interestedpersons were given until February 13.1979 to comment on the proposal.Twenty-one comments were receivedfrom State agencies. Federal agencies.nuclear utilities, and others. Two of thecomments from environmentallyconcerned organizations were receivedafter the March 28.1979 accident atThree Mile bsland. which Increasedpublic awareness of protective actionguidance. Although these commentswere received after the close of thecomment period, they were consideredby the agency in developing these finalrecommendations.
The Office of Radiation Progrms.Environmental Protection Agency (EPA).submitted a detailed and exhaustivecritique of the proposedrecommendations. EPA addressed thedosimetry data, the agricultural modelsused in calculating the derived responselevels, and the philosophical basis forestablishing the numerical value of theprotective action guides. FDA advisesthat, to be responsive to the EPAcomments. FDA staff met with staff ofthe Office of Radiation Programs. EPA.
d.aring the develapni.nt of these tfnjlrecommendations. Although EPA'sfornial commn.nts are re:.punded to inthis notice. FPA staff revii'wed a draft ofthe final reconmendations. and FDAhas considered their additional informalcummPrls. These contacts we Xconsidered oppiopra;tc er..iuse EPAhas indicated that it intends to use therecomrendatinns us the basis forrevising its guidance to Federal a~encieson proteective a.lion guidesi iorrdiouctivity in food.Protective Action Guidarce
Although not raised in the commentsreceived. kVA has reconsidered itsproposal to codify theserecommendations in 21 UR Part 1090.Because these recommendations arevoluntary guidance to State and localagencies (not regulations). FDA hasdecided not to codify therecoimmenlddtions: rather, it is Issuingthem in this notice. Elsewhere in thisissue of the Federal Register. FDA iswithdrawing the December 15.1978proposal
The recommendations contain basiccriteria, defined as protective actionguides (PAGs). for establishing the levelof radioactive contamination of humanfood or animal feeds at which actionshould be taken to protect the publichealth and assure the safety of food. Therecommendations also contain specificguidance on what emergency protectiveactions should be taken to preventfurther contamination of food or feeds orto restrict the use of food. as well asmore general guidance on thedevelopment and implementation ofemergency Ltion. The PAC's have beendeveloped on the basis ofconsiderations of acceptable risk toidentify that level of contamination atwhich action Is necessary to protect thepublic health.
In preparing these recommendations.FDA has reviewed and utilized theFederal guidance on protective actionscontained in Federal Radiation Council(FRC Reports No. 5. July 1064 (Ret. 1)and No. 7 May 1965 (Ref. 21. .1eFederal guidance provides that eachFederal agency. by virtue of itsimmediate knowledge or its operatingproblems. would use the applicable FRCguides as a basis for developing detailedstandards to meet the particular needsof the agency. FDA's recommendationsincorporate the FRC concepts and theFRC guidance that protective actions, inthe event of a contaminating accident.should be based on estimates of theprojected radiation dose that would bereceived in the absence of takingprotective actions. Similarly. protectiveactions should be Implemented for a
sufficient time to avoid most of theprojected radiation dose. Thus, the ^PAGCs define the numerical value of Wprojected radiation doses for whichprotective actions are recommended.
FDA has reviewed the recent report *the Nation:al Academy of Scio-ncs/National Rcsc:rch Council (Ref. 3) unradiul;on risks and biological effectsdat;. th:!t berame availabie after;'i..licali n of the FRC guidance and hasri'- icwcd the impact of taking action inthe p;osturo/cow/milk/person pathwayir light of the current concerns inradii tion protection. Based on thesemirnsidlration3 and the commentsrecrived on the proposedrecommendations. FDA has concludedthat protective actions of low impactshould be undertaken at projectedradiation doses lower than thoserecommended by FRC (Refs. I and 2).Accordingly. FDA Is recommending low-impact protective actions (termed thePreventive PAC) at projected radia2iondoses of 0.5 rem whole body and 1.5 remthyroid. FDA Intends that suchprotective actions be implemented toprevent the appearance of radioactivityin food at levels that would require itscondemnation. Preventive PAC'sInclude the transfer of dairy cows fromfresh forage (pasture) to unconttaminatr'stored feed and the diversion of vholtmilk potentially contaminated withshort-lived radionuclides to productswith a long shelf life to allowradioactive decay of the radioactivematerial.
In those situations where the onivprotective actions that are feasiblepresent high dietary and social costs orimpacts (termed the Emergency PAC)action is recommended at projectedradiation doses of 5 rem whole bouyand 1S rem thyroid. At the EmergencyPAC level responsible officials shouldisolate food to prevent its introductioninto commerce and determine whethercondemnation or other disposition isappropriate. Action at the EmergencyPAC level is most likely for thepopulation that is near to the source ofradioactive contamination and thatconsumes home-grown produce andmilk.
The PAC's represent FDA's judgmentas to that level of food contaminationresulting from radiation Incidents atwhich action should be taken to protectthe public health. This Is based on theagency s recognition that safety involvesthe degree to which risks are judgedacceptable. The risk from naturaldisasters (approximately a one in amillion annual individual risk of deatd ( )and the risk from variations in naturalbackground radiation have provided

Federal Register / Vol. 47. Ni. 205 / Friday. October 22. 1982 / Notices - _ 47075
perspective In selecting the PAG values.This Issue Is further discussed In theresponses to specific comments later inthis notice, especially In paragraph 9. Amore detailed treatment of the rationale.risk factors. dosimetric and agriculturalmodels, and methods of calculation iscontained in the "Background forProtective Action Recommendations:Accidental Radioactive Contaminationof Food and Animal Feeds" (Ref. *J
Organ PAG ValuesCurrent scientific evidence. as
reflected by BEIRUT (Ref. 18).UNSCEAR-1g77 (Ref. 81. and BEIR-1lI(Ref, 3). Indicates that the relativeimportance of risk due to specific organexposure is quite different from theearlier assumptions. The InternationalCommission on Radiological Protection(ICRP) clearly recognized this in its 1977recommendations (ICRP-26 (Ref. 61e.which changed the methodology fortreating external and internal radiationdoses and the relative Importance ofspecific organ doses. ICRP-26 assignedweighting factors to specific organsbased on considerations of theincidence grid severity (mortality) ofradiation cancer induction. For theradionuclides of concern for food PAG's.ICRP-28 assigned weighting factors of0.03 for the thyroid and 0.22 for red bonemarrow. Thus. the organ doses equal inrisk to 2 rem whole body radiation doseC) are 33 rem to the thyroid and a rem toRed bone marrow. (The additionalICRP-2. nonstochastic limit, however.restricts the thyroid dose to 50 rem or 10times the whole body occupational limitof 5 rem.)
In the Federal Register of January Z3.1981 (46 FR 7838). EPA proposed torevise the Federal Radiation ProtectionGuidance for Occupational Exposuresusing the ICRP approach for internalorgan radiation doses. modified toreflect specific EPA concerns. The EPAproposal has been subject toconsiderable controversy. Also, theNational Council on RadiationProtection and Measurements (NCRP)curently Is evaluating the need to reviseits recommendations. FDA does not.however, expect the protection modelfor internal organ radiation doses to beresolved rapidly in the United Statesand has based the relative PAC doseassignments In these recommendationson current U.S. standards and the 1971recommendations in NCRP-39 (Ref. 19).Thus, the red bone marrow is assignedthe same PAC dose as the whole body(0.5 rem Preventive PAC). and thethyroid PAG is greater by a factor ofthree (1.5 rem Preventive PAC). This*results In PAG assignments for thethyroid and red bone marrow that are
lower by factors of 3.3 and a.respectively, than values based onICRP-25 (Ref. B). FDA advises that itwill make appropriate changes inrecommendations for internal organdoses when a consensus in the UnitedStates emerges.
Analysis of Comments
The following is a summary of thecomments received on the December 15.1978 proposal and the agency's responseto them:
1. Several comments requestedclarification of the applicability andcompatibility of FDA'srecommendations with other Federalactions, specifically the PAG guidanceof EPA (Ref. 7). the FRC Reports No.5(Ref. 2) and No. 7 (Ref. 2). and theNuclear Regulatory Commission (NRC)definition of 'Extraordinary NuclearOccurrence" in 10 CFR Part 140. Acomment recommended that the term.Protective Action Cuide (PAGC). not be
used because that term traditionally hasbeen associated with the FRC. and thegeneral public would confuse FDA'srecommendations with Federalguidance.
The FRC Report Nu. 5 specificallyrecommended that the term. "protectiveaction guide.' be adopted for Federaluse. The report defines the term as the.projected absorbed dose to theindividuals In the general populationwhich warrants protective actionfollowing a contaminating event." aconcept that Is addressed by FDA'srecommendations. To use the conceptwith a different description would, inFDA's opinion. be unnecessarilyconfusing to State and local agencies aswell as Federal agencies.
These recommendations are beingissued to fulfill the HHS responsibilitiesunder FEMA's March 11. 1982regulation. FDA fully considered FRCReports No. 5 and No. 7 and the basicconcepts and philosophy of the FRCguidance form the basis for theserecommendations. The specific PAGvalues are derived response levelsincluded in these recommendations arebased on current agricultural pathwayand radiation dose models and currentestimates of risk. The FRC guidanceprovided that protective actions may bejustified at lower (or higher) projectedradiation doses depending on the totalimpact of the protective action. Thus.FDA's recommendation that protectiveactions be Implemented at projectedradiation doses lower than thoserecommended by FRC doses isconsistent with the FRC guidance. TheFRC guidance is applicable to Federalagencies in their radiation protectionactivities. FDA's recommendations are
for use by State and local agencies inresponse planning and implementationof protective actions in the event of acontaminating incident. Further. FDA'srecommendations would also be used byFDA In Implementing Its authority forfood In interstate commerce under theFederal Foud. Drug. and Cosmetic Act.
FDA's recommendations are beingforwarded to EPA as the basis forrevising Federal guidance on foodaccidentallv contaminated byradionuclides. EPA has advised FDAthat It intends to forward the FDArecommendations to the President underits authority to "advise the Presidentwith'respect to radiation mattersdirectly or indirectly affecting health.including guidance for all Federalagencies in the formulation of radiationstandards * *". (This authority wastransferred to EPA in 1t970 when FRCwas abolished.)
The r-comnmr~endations established inthis document apply only to human foodand animal feeds accidentallycontaminuted by radionuclides. Theyshould not be applied to any othersource of salizain- si.:posure. EPAalready has issued protective actionguidance for ihe shonrterm accidental--exposure to airborne releases ofradioactive materials and Intends alsoto forward the EPA guides to thePresident as Federal guidance. EPA alsois considering the development ofguidance for acidentally contaminatedwater and for long-term exposures dueto contaminated land, property, andmaterials. Guidance for each of theseexposure pathways is mutuallyexclusive. Diffcrevt guidance for eachexposure pathway is appropriatebecause different criteria of risk, cost.and benefit are involved. Also, eachexposure pathway may Involve differentsets of protective or restorative actionsand would relate to different periods oftime when such actions would be taken.
2. Several comments expressedconcern about radiation exposure frommultiple radionuclides and from multiplepathways. e.g.. via inhalation. ingestion.and external radiation from the cloud(plume exposure) and questioned whyparticular pathways or radionuclidesand the does received beforeassessment were not addressed In therecommendations. Several commentsrecommended that the PAG's includespecific guidance for tap water (andpotable water). Other comments notedthat particular biological forms ofspecific radionuclides (i.e.cyanocubalamin Co 80). would lead tosignificantly different derived responselevels.

.2'7076 7Federal Register Vol. 47. No. ais / Friday. Octuber 22. 1982 I Notices
FDA advisei that the PAG's and thep.rnitective action concepts of FRC applyto actinns taken to avoid or preventprujected radiation dose for futuredose). Thus, by definition, the PAG's furfood do not consider the radiation dosesalready incurred from the plumepathway or from other sources. Thepopulation potentially exposed byingestion of contaminated food can bedivided into that population near thescource of contamination and a generallymuch larger population at distanceswhere the doses from the cloud arm notsignificant. The NRC regulations providethat State and local planning regardingplume exposure should extend for 10miles and the Ingestion pathway shouldextend for S0 miles (see 45 FR 55402August 19. 1980). The total populationex posed by ingestion. however. is afunction of the animal feed and humanfood production of any given area and isnot limited by distance from the sourceof contamination. Exposure frommultiple pathways would not be aconcern for the more distant populationgroup. Further. individuals In this largerpopulation would most likely receivedoses smaller than that projected for.continuous intake because thecontaminated food present In the retaildistribution system would be replacedby uncontaminated food.
FRC Report No. 5 states that. furrepetitive occurrences, the totalprojected radiation dose and the totalimpact of protective actions should beconsidered. Similar considerations on acase-by-case basis would then appear tobe appropriate in the case of multipleexposures from the plume and theingestion pathway. Accordingly, thefinal recommrendations are modified tonote that. specifically In the case of thepopulation near the site that consumeslocally grown produce, limitations of thetotal dose should be considered (seeparagraph a 1(2)). The agency concludes.however. that a single unified PAGcovering multiple pathways. e.g.external radiation. Inhalation, andIngestion Is not practical becausedifferent actions and impacts areinvolved. Further. FDA's responsibilityin radiological Incident emergencyresponse planning extends only tohuman rood and animal feeds.
The agency's primary charge Is to setrecommended PAG dose commitmentlimits for the food pathway. nus.dcriving response levels for only theradionuclides-most likely to enter therood chain and deliver the highest doseto the population permits FDA toestablish recommendations that arepractical for use In an emergency. Indiscussing with EPA the list of definitive
mudcla. FDA inti r s:.Asaffri: 4red !hitfu::her pathway studie s wouldi bruseful. Elsewhere In this notice. DlAr feirences models for otherridlonuclides. providing a resuurrr fir!hose requiring more detaIls.
The chemical form of radionui.lide:. inthe environment may be Important wh nconsideri:g the deriavation of anappropriate "response level" in speLificsituations. but would not change thePAG's. which are in terms of projecteddose commitments. C4unocoba lamin Co60 has not been identified ap a likelyconstituent of health importance to bereleased from a nuclear reactor accidentand. therefore. the agency rejects therecommendation that It provide derivedresponse levels for this radionuclide.However, after reviewing currentagricultural and dose models, theagency concludes that cesium-134 wouldlikely be released and has added it tothe tables in paragraph (d) of therecommendations identifyingradionuclide concentrations equivalentto the PAG response levels
FDA rejects the commentrecommending that the PAG's includeguidance for water. A memorandum ofunderstanding between EPA and FDAprovides that FDA will have primaryresponsibility over direct and Indirectadditives and other substances Indrinking water (swe 44 FR 42775: July 20.1979). Thus. FDA defers to EPA fordeveloping guides specifically fordrinking water.
3. Three comments requestedclarification of the proposedrecumendatiuns. including the timeover which the guides apply, the time ofIngestion required to reach the PAG, andthe time that protective actions bhouldbe Implemented.
FDA advises that therecommendations are intended toprovide guidance for actions to beImplemented In an emergency, and theduration of protective action should notexceed I or 2 months. The agencybelieves that the actions identified inparagraphs (a) and (h) of therecommendations should be continuedfor a sufficient time to avoid most of theemergency radiation dose and to assurethat the remaining dose Is less than thePreventive PAG. This period of time ranbe estimated by considering theeffective half-life of the radioactivematerial taking Into account bothradioactive decay and weathering. Eachcase must be examined separatelyconsidering the actual levels ofcontamination and the effective half-lireof the radioactive material present. Forthe pasture/cow/tnilk pathway. theeffective half-lives are 5 days for Iodine-
131 aind 14 ddvs fur cc;um ;r s!:onti.im.Aasuming that initial cuntamina:iun Lyth"%e rudionuclides w4Y at thcPrevcntive PAG level. radioacIavc d41 UL .sand weathering would reduce thr Ievel *so that protective actiosIS couli be*:a.end after 1 or 2 months.
The model ust-d to cnmnpulte thederived response levels specified inparagraph (dl of the recommenditionsus.'iomes a continou% or infinite ingestionpcriud. i.e.. innake that is limited only byr; J oartive decay and weathering. Thisis the apprnach recommended Inestimating the projected radiaifon dosefin the absence of protective actions.LFurther revisions have been made in therecommendations to clarify these.tspects.
4. A comment stated that actionshould he initiated by notificationreceived from the facility Itself. Anothercninint noted the importance of timely;announcements to the public of theneceshity for protective actions.
IThese recommendations on protectiveaction guides for food and feed are notintended to cover other aspects ofemergency planning for radiologicalIncidents. The general responsibilities ofNRC licensees In radiation emergencieshave been further deined in a ruleissued by NRC (45 FR 55402: August 19.190J. FDA recognizes. however, thatnotification and public announcements fure vital to effective protective actions 1and. in paragraph (el(5) of therecommendations, urges that State andlocal emergency plans should providefor such notice.
5. A comment offered clarification ofproposed 1 1000.400(g) regardingverification of sample measurements.while another comment suggested thatPreventive PAG's should be based onprojected levels and that EmergencyPAGs require verification.
lhe FRC concepts and philosophy.which FDA fully endorses, use estimatesot pruiected radiation dose as thecriteria fnr taking protective action. FDAbelieves that projected radiation doseestimates should be based on ver:fiedmeasurements of radioactivity in thefood pathway. Such verification mightinclude the analysis of replicateSamples. laboratory measurements.sample analysis by other agencies.samples of various environmentalmedia, and descriptive data of theradioactive release and has so providcdin paragraph (g) of the.recommendations.
f. A comment suggestcd that someStates do not have the resources toevaluate projected radiation doses. Thecomment asked what regulatory agencwould have control over interstate 1,,)

Federai Register / VoL 47. No. 205 / Friday. October Z..1982 I Notices 47,0
r. .
shipment of conthrainsuted foods fromStates without sufficient resources andwhat would bi the applicable PAC.
FMA. as the lead agency for theFcderal effort. is providing to Statesguidance aad assistance an emergencyresponse planning including evaluationor projected does Also. NRC requiresnuclear power plant licensees to havethe capability to assess the off-siteconsequences of radioactivity releasesand to provide notifcation to State crdlocal agencies (45 FR S= August 19.
' 960). FDA h'as authorily under theFederal Faood Drug. and Cosnetic Act toremove radioactively contaminated foodfrom the channels of interstatecommerce. In this circumstance. FDAwould use these PAC recommendationsas the basis for implementingregulatory action.Risk Esimates
7.UMany comments questioned the riskestimates on which FDA based theproposed PAG's. The commentsaspecially suggested that risk estimatesfrom WASH-1400 (Ref' 41 were ofquestionable validity. Other commentsargued thiatihec'roposedrsacmmeindadons used an analysis ofonly lethal effects: that they used anabsolute risk modaL' and that geneticeffects were not adequately consideredThe risk estimates themselves werealleged to be erroneous because recentstudies show that doubling doses arelower than are those suggested byWASH- 1400. The tines capitis study byRon and Modan. whici Indicates anircrased probability of thyroid canceratan estimated radiation dosc of 9 remto the thyroid (Ref. 5). was cited asevidence that the PAG limits for thethyroid were too bigh. The commentsre uastd further identification andsupport for using the critical populationselectad.
Most of these issues were addressrdin &ha preamble to the FDA proposaLThe final recommendations issued intlis notice employ the most recent riskestimates (somatic ad genetic) of theNatinnal Academy of SciencesCommitme on Biological Effects ofIonizing Radiation (Ref 31.
The thyroid FAC limits are based onthe relative radiation protection guidefor thyroid compared to whole bodycontained in NRC's current regulations(1t CFR Part 0J. The derived responselevels for thyroid are based an riskfactors (or extcrnal x-ray irradiation.Thcreforc. the criticism nf the PAGLimits for the thyroid is not applicable.no -credit" khving been taken for an
l- apparert lower radiation risk due tolodine-131 irradiation of the thyroidglinid. Further. ai discuseed above
under 'ORGAN PAG VALUES-, the useof BEIR-ll rusik estimates or the ICRP 26recomnmedationa would result in anIncrease of the thyroid PAG relative tothe whole body PAG. For these reasonsFDA believes the PAC limits forprojected dose commitment to thethyroid are conservative whenconsidered Ln light of current kmowledgeof radiation to produce equal-healthrsks from whole body andspecificorgan doses.
Although It may be desirable toconsider total health effects. not justlethal effects. there Is a lack of data fortotal health effects to use in suchcomparisons. In the case of thevariability of natural background. as anestimate of acceptable risk.consideration of lethal effects or totalhealth effects is not Involved becausethe comparison Is the total dose over alifetime.
Rational. Several comments questioned the
rational FDA used in :etting the specificPAG values included in the DecemberI=78 proposaL .A commioent from EPAstated that the guidance levels should beJustified On the grounds that It is notpractical or reasonable to takeprotective actions at lower risk levels.Further. EPA argued that the protectiveatc.in concept for emergency planningand response should incorporate theprinciple of keeping radiation exposuresas low as reasonably achievable(ALARA). EPA noted that the principleof acceptable risk involves a perceptiono f risk that m~ay vary from person toperson and that the implication that anacceptable genetic rik has beenestablished qhould be avoided.
FDA accepts and endorses theALARA concept. but the extent to whicha concept. which is used in occupationalsettings. should be applied to emergencyprotective actions Is not clear. To usethe ALARA concept as the basis forspecific PAG values and also requireALARA during the implementation ofemergency protective actions appears tobe redundant and may not be practicalunder emergency conditions.
FDA advises that these guides do notconstitute acceptable occupationalradiation dose limits nor do theyconstitute acceptable limits for otherapplicatinns (e.g. acceptable geneticrisk). The guides are nut intended to beused to limit the radiation dose thatpeople may receive but instead are to becompared to the calculated projecteddose. ie. the future dose that the peoplewould receive if no protec:ive act.onwere taken In a radiationiemergency. Inthis respect. the PACs represent triggerlevels calling for the initiation or
mecommanded protective actlons. Oncethe protective action is initiated. itshould be executed so as to prevent asmuch of the calculated projected dosefrom being received as is reasonablyachievable. This does not mhowever, that all doses above gukdancelevels can be prevented..
Further, the guides ae naot intcled toprohibit taking actons at projecalexposures lower than the PAG dauesThey have been derived for g8}rlcases and am jest what theirImplies. guides. As provided In FRCReports No. 5 and No. 7 andasdiscussed in paragraph 1 of this atimcIn the absence of ainific:mt coosuintrresponible authcsity "my find itappropriate to Implement low-iapactprotective actions at projected adationdoses less than those spiecfled in the.guides. Simllay..highi impact ationmay be justified at higher projecteddoses. These judgments -ns be madeaccor nig to te cts f each aitnParagraphs (a) (2) and (3) have beeadded to the final recaoedauiao,.h,Incorporate this concepL
9. Several commants quedonad thadequacy of the level of risk juddacceptable in deriving the -p-o--edPAG values. A commect std tht theestimated one in a mill, -uazIndividual risk of death from nanoudisasters Ls extremely acooervative EPAsuggeted that cap yve risk isappropriate for perspective but nc forestablishing the limiL.EPA f&rithesuggested that the poipulatiooweigtedaverage of the vanrhillty mi naturalbackground dost or thUi variatn isidose due to the natural radio.crty infood sbould be the basis for Judgingacceptable risk.
FDA concludes that the differesbetween EPA's suggested approah andthat employed by FDA largely involvethe semantics of the rationaledescriptions. As discussed In thepreamble to the proposal. FDA believesthat safety for a safe level of ik) needsto be defined asrthe degree to which therisks are judged acceptable. because itIs not possible to achieve zero risk froehuman endeavors. Further. IMP (Ref. 8)reconmends that, for a givenapplication involving radiation. the netbenefit to society should be positive.considering the total costs and impactsand the total benefit (this is termed.'lustificationi. FDA believes that. toestablish a PAC. the primary concern isto provide adequate protection (or safelevel of risk) for members of the public.To decide on 3afety or levels afacceptable risk to the public from acontaminating event. FDA ine'oducedthe estimates of acceptable risk fom

4i7078 Federal Register I Vol. 47. No. 205 / Friday. October 22. 19H2 / Notices
natural disasters and backgroundra;diation.These values providedbackground or perspective fOr FDA'sjudgment that the proposed PAG srepresent that level of rood or feedradiation contamination at whichprotective actions should be taken toprotect the public health: judgmentwhich. consistent with FRC Report No.5. also Involves consideration of theimpacts of the action and the possibilityof future events. The recommendationsare based on the assumption that theoccurrences of environmentalcontamination requiring protectiveactions in a particular area is anunlikely event, that most Individualswill never be so exposed. and that anyindividual Is not likely to be exposed toprojected doses at the PAG level morethan once in his or her lifetime.
FDA continues to believe that theaverage risks from natural disasters andvariation of background radiationprovide appropriate bases for judgingthe acceptability of risk represented bythe Preventive PAG. Theserecommendations incorporate thephilosophy that action should be takenat the Preventive PAG level ofcontamination to avoid a potentialpublic health problem Should thisaction not be wholly successful, theEmergency PAG provides guidance fortaking action where contaminated foodis encountered. FDA expects that actionat the Emergency PAG level ofcontamination would most likelyinvolve food produced for consumptionby the population near the source ofcontamination. As discussed Inparagraph 2. this Ire also the populationwhich might receive radiation dosesfrom multiple pathways. Thus, theEmergency PAG might be considered tobe an upper bound for limiting the totalradiation dose to individuals. FDAemphasizes. however, that theEmergency PAG Is not a boundarybetween safe levels and hazardous orinjury levels of radiation. Individualsmay receive an occupational dose of Srem each year over their workinglifetime with the expectation of minimalIncreased risks to the individual.Persons in high elevation areas such asColorado receive about 0.04 rem peryear (or 2.3 rem in a lifetime) above theaverage background radiation dose forthe United States population as a whole.The Emergency PAG Is also consistentwith the upper range of PAGCs proposedby EPA for the cloud (plume) pathway(Ref. 7..
FDA agrees that a population-weighted variable is as applicable to theevaluation of comparative risks as is ageographic rariable. Arguments can be
made for using either variable. Becuusepersons rather than geopraphic arerisarc the important parameter in theevaluation or risk associated with theseguides. FDA has used population-weighting in estimating the variability ofthe annual external dose from naturalradiation. A recent EPA study (Ref. 201indicates that the average populationdose from external backgroundradiation dose is 53 millirem (mremr peryear. and the variability in lifetime dosetaken as two standard deviations isabout 2000 mrem. The proposal. whichindicated that the variation in externalbackground was about 600 inmrem.utilized a geographic weighting of Stateaverages.
Radioactivity in food contributesabout 20 mrem per year to averagepopulation doses and about 27 mmern peryear of this dose results from potassium.40 (ReL 8). Measurements of potassium.40 (and stable potassium) Indicate thatvariability (two standard deviations) ofthe potassium4O dose Is about 28percent or a lifetime dose of 350 mirm. Itshould be noted that body levels ofpotassium are regulated by metabolicprocesses and not dietary selection orresidence. The variation of the Internaldose is about one-filth of the variationfrom external background radiation.FDA has retained the proposedpreventive PAG of 500 tnrem wholebody even though the newer dataindicate a greater variation in externalbackground radiation.
FDA did not consider perceived risksin deriving the proposed PAG valuesbecause perceived risk presentsnumerous problems in itsappropriateness and application. If thefactor of perception is added to theequation. scientific analysis Isimpossible.
10. Two comments questioned theassumptions that the Emergency PAGmight apply to 25 million people andthat the Preventive PAG might apply tothe entire United States. One commentnoted that 15 million persons are morethan that population currently within 25miles of any United States reactor sites:thus, using this figure results in guidesmore restrictive than necessary. Theother comment noted that. by reducingthe population involved. andunacceptably high value could result.
The ratio of total United Statespopulation to the maximum number ofpeople In the vicinity of an operatingreactor could be erroneously interpretedso that progressively smallerpopulations would be subject toprogressively larger Individual risks.This Is not the intent of therecommendations. Hence. the risk from
nuturNI disasters. the variation in thepliptlation-weighted natlural backgrour"'r~adi ition dose to the total population.and :he variation in dose due toingestion of rood, have been used to ~S7provide the basis for the PreventivePAG. The basis for the Emergency PAGinvolves considerations of (1) The ratiobetween average and maximumindividual radiation doses (taken as I to10l. (2) the cost of low and high Impactprotective actions. (3) the relative risksfrom natural disasters. (4) health impact.(5) the upper range of the PAG'sproposed by EPA (5 rem projectedradiation dose to the whole body and 25rem projected dose to the thyroid). and(6) radiation doses from multiplepathways.
II. A Comment citing experience withother contaminants. suggested thatfurther consideration should be given tothe problem of marketability of foodscontaining low levels of radioactivity.
Marketability Is not a concern forPAG development However, thepublication of the PAG's should enhancemarketability of foods because It willenhance public confidence in foodsafety. so. FEMA has beenspecifically directed to undertake apublic information program related toradiation emergencies to allay publicfears and perceptions.
I2. A comment noted the difficulty it 1t-assessing the Impacts of and thebenefits to be gained from protectiveactions. Another comment suggestedthat there were lower impict actionswhich could be implemented to keepfood off the market until radiation levelsin the food approach normalbackground.
The recommendation that planningofficials consider the impacts ofprotective actions In implementingaction does not imply that amathematical analysis Is required.Rather, FDA-intends that the localsituation.resources. and impacts thatare Important in assuring effectiveprotective actions be considered inselecting any actions to be Implemented.As discussed In paragraph 8. If the localconstraints permit a low impact action.this can be appropriate at lowerprojected doses. Because It is notpossible In general guidance to considerfully ill local constraint. the PACerepresent FDA's judgment as to whenprotective actions are appropriate.Agricultural and Dose Models
13. Several comments noted errorseither In approach or calculationsregarding the proposed agricultura ane ''dose models, while others specifically ( )noted that there are newer and better

Federal Rezister / Vol. 47, No. 205 / Fritlay, October 22. 1982 / Notices 470n
models tor use In computatIon of thederived response levels.
FDA appreciates the careful reviewand the suggestions as to belier dataand models. The references suggested.is well as other current reports. havebeen carefully reviewed and appropriateones are being used as the basis forcomputation of the derived responselevels for the final PAGC. The specificmodels and data being used are asfollows:
Agriculhural tode4-UCRL-5I3. 1977(Ref. ).
Intake per unit depouition.-Table B-LUCRL-51939 (R*L 9)
Peak milk activity-Equation L UCRL-51939 (Ref. 91.
Area grazed by cow-.4S squats meters/day. UCRL-519 (Ref. *).
ntial retention on forage--S fraction.UCRL-31939 lRef. 0).
Forag* yitld-O.25 klosranlsquare meter(dry woight). UCtY.-109 (ReE 91.
I Milk consumptioo-O litr/dary Infant.ICRP-23. 294 (RefL 10o;-05S liter/day adulLUSDA. 1985 (Ref. 11).
Dose conversion factors (rem permicrocurie inrested).
I =�I
.. - ... - .- 1W * 13t'
ceb-,�134__
1t
si1s
I.Co~~137 0.07i
SMMIKMm410 0.iU
3'.2-
"d IIj* wn Wd -W.
* DU A&A-O0P0JU*9I
lowt M" sanwa
70kMOwS "no a7.7 tQ -d
VW 15.5 say. 80iam - o
OWN 142.
Call E. IS-. W
V~aEI 13 72.
recommendations and are listed under"Forage Concentration".Other Comments
14. A comment addressed thedefinition of the critical or sensitivepopulation for the tables in proposedI 1090400(d) and observed that there isa greater risk per rem to the younger agegroups than to adults. Another commentrequested further explanation of therelative ability to protect children andadults.
FDA agrees that Ideally. the criicalsegment of the population should bedefined in terms of the greatest risk perunit intake. However thiWs wouldintroduce greater complexity Into therecommenaions than is justified.because the risk estimates are uncertain.The final recommendations providederived response levels for infants at thePreventive PAG and Infants and adultsfor the Emergency PAC.
FDA has reexamined the availabledata and concludes that taking action atthe Preventive PAC (based on- the iWantas the critical or sensitive population)will also provide protection of the fetusfrom the mother's ingestion of milk. Thedefinitinn of newborn infant in thetables in pargraph (d) of the PAG's hasbeen revised to reflect this conclusion.
15. EPA commented that itsregulations governing drinking water (40CFR Subchapter D) permit blending ofwater to meet maximum contaminantlevels. EPA suggested that FDA's 5hort-term recommendations should becompatible with the long-term EPAregulations.
As stated In paragraphs I and 2 of thisnotice. FDA's recommendations apply tohuman food and animal feed. whereasEPA is responsible for providingguidance on contaminated water. Also.as discussed in paragraph 3 of theproposal. there is a long-standing FDApolicy that blending of food is unlawfulunder the Federal Food. Drug. andCosmetic Act. Further, these guides areintended for protective actions underemergency situations and are nnt fnrcontinuous exposure app!il;atinns. Forthese reasons FDA concludes that thedifferences between itsrecommendations and EPA's regulationsare appropriate.
16. Two comments were received onthe adequacy or availability ofresources for sampling and analysis ofState. local, and Federal vqrgncies andthe adequacy of guidance on samplingprocedures.
These recommendations are notdesigned to provide a compendium ofsampling techniques, methods. orresourcs Tne Department of Energythrough its Interagency Radiological
Assistance Plan (IRAP) coordinates theprovision of Federal assistance and anOfisite Instrumentation Task Force ofthe Federal Radiological PreparednessCoordinating Committee administeredby FELMA Is developing specificguidance on instrumentation andmethods for sampling food (Ref. 21).
Cost Analysis17. Several comments argued that
FDA's cost/benenlt analysis used toestablish the PAG levels wasinadequate. Comments stated that it Isnot appropriate to as#g a unique fixeddollar value to tJe adverse healtheffects associated with one person-remof dose.
FDA advises that its coat/benefltanalysis was not conducted to establishthe PAG levels. FDA considers such useInappropriate in part because of theinability to assess definitively the totatsocietal impacts (positive and negative)of such actions. Rather. the cost/bencefitanalysis was used to determine whetherprotective actions at the recommendedPAG's would provide a rnet societalbenefitL To make such an assessment itIs necessary to place a dollar value an aperson-rem of dose.
18. Several comments also questionedthe appropriateness of the aasumptio inthe cost/benefit analysis of 23 days ofprotective action. the need to address-rsdionuclides other than iodine-13L andthe need to consider the Impact of otherprotective actions.
The cost assessments have beenextensively revised to consider all theradionuclides for wbich derivedresponse levels are provided in tierecommendations and to incorporateupdated cost data and risk estimates(Ref. 223. The cost/benefit analysis Islimited to the condemnation of milk andthe use of stored feed because accidentanalyses Indicate that the milk pathwayis the most likely to require protectiveaction. Further, these two actions aethe most likely protective actions thatwill bIe implemented.
FDA approached the cost/benefitanalysis by calculating theconcwntration of radioactivity in milk atwhich the cost of taking action equalsthe risk uvoided by the action taken ona daily milk intake basis. Theassessment was done on a populationbasis and considered only the directcosts of the protective actions. Theanalysis mndicates that, for restrictingfeed to stured feed, the cost-equals-benefit concentrations are about one-fiftielh to oneLeighteeth of the PreventivePAG level (derived peak milkconcentlation) for iodine-13l. cesiumn-134 and cesium-t37 and about one-third
The use of the newer agriculturalmodel IRef. 9) has resilted in a 20prrcent increase In the Iodine-131derived response levels Identified inparagraph (dI(1 end Idli2l of therecommendations. Generally. similarmagnitiwd changes are reflected in thederived response levels for the otherradionuclides. Newer data on lodine-13Idose conversion factors (Ref. 17) wouldhave further increased the derivedresponse levels for that radionuclide byabout 40 percent but these data havenot been used pending their acceptancehy United States recommendingauthorit3es. In addition. the proposalcontained a systematic error In that thepasture derived response levels weremdaled to be based on fresh weight butwere in fact based on dry weight. Freshweight values (l( of dry weight values)ire identified in the final

47080 Fedetal Register I Vol. 47. No. 205 / Friday. October 22. 1982 / Notices
of the level for strontium o9 andstrontium-90. For condemnation of milk.based. on value at the farm. the cost-equals-benefit concentrations aresimilar fractions of the Emergency PAClevels (derived peak milkconcentration). If condemnation of milkis based on retail market value, the cost-equals benefit concentrations aregreater by a factor of two. Thus. Itappears that protective actions at thePreventive or Emergency PAG levelswill yield a net societal benefit.Hiowever. In the case of strontiume89and strontium-9O, protective action willyield a benefit only for concentrationsgreater than about one-third the derivedpeak values. In the case of iodine-131.cesium-134. and cesium-137. protectiveactions could be continued to avoid 95percent of the projected radiation dosefor initl peak concentrations at thePAG leveLReferstcas
The following Information has been placedon display in tha Dockets ManagementBranch (HFA-=L Food and DrugAdministration. Rm. 4-2 5m00 Fishers Lane.Rockville, MD 257. and may be seenbetween t aim and 4 p. Monday throughFriday,
2. Federal Radiation Council. Memorandumfor the Preident, "Radiation ProtectionGuidan for Federl Agencies, FederalRegister. August 22, 194 (29 FR 120563. andReport No.5 (July 2194).
2 Federal Radialion Council Memorandumfor the President. "Radiation ProtectionCuidance for Federal Agencies." FederalRegister." May 22 1985130 FR 6953t. andReport No. 7 (May 985).
3. National Academy of Sciences/NationalResearch Council. 'The Effects on Populationor Exposure to Low Levels of IonizingRadiation." Report of the AdvisoryCommittee on Biological Effects of IonizingRadiation (BEIR411) (1980)
4. United Slati Nuclear RegulatoryCommision. Reactor Safety Study. WASH-1400. Appendix VI (October 1975).
5. Ron. E. and B. Modsn. 'Benign andMalignant Thyroid Neoplasms AfterChildhood Irradiation for Tilnea Capitisb'lournol of Me National Cancer Institute. Vol.81. No. (luly 1980)
6. International Commission onRadiological Protection IICRP)Recommendations of the InternationalCommission on Radiologicsi Protection. ICRPPublication 2. Annals of the ICRP. PergamonPress (197i).
7. Environmenial Protection Agency.-Manual of Protective Action Guides andProtective Actlons for Nuclear Incidents.-EPA 52011-75-00. revised June 1980.
. United Nations Scientific Committee onthe Effects olAtomic Radiatlion. 977 Report.United Nations. New York (12977.
9. Ng. Y. C. C. S. Colaher. D. 1. Quinn. andS. E Thompson. 7Transer Coefficients forthe Prediction of the Dose to Man Via theForage-Cow-Milk Pathway fromRadionuclides Released to the Biosphere.-
UCR1,51939. Lawrence LivermoreLaboratory (July 1S 19?71
10. International Commission onRadiological Protection. Report of a TdskGmup of Committee 2 on Reference i-n.Publication 213 p. 360 Pergamon Press.Oxford 11974).
11. UT Department nf Agnculture."llousehold F. rd Consumption Survey 1965-1988.
12. Wellman. H. N. end R. T. Anxer.'Radioodine Dosimetry and the Use ofRadiomodines Other Than "'I in ThyroidDiagnosis.- S-'minrx in Nuclareo Mi'dae.J 356(119711.
13. Killough. C. C. D. E. Dunning. S. R.Bernard. and 1. C Plensant. "Estimates ofInternal Dose Equivalent to 2 Target Organsfor Radionuclides Occumng in RoutineReleases from Nuclear Fuel-Cycle Facilities.Vol 1: ORNLINURECITM-190. Oak RidgeNational Laboratory (June 19781.
14. National Council on RadiationProtection and Measurements. -Cesiumt137From the Environment to Man: Metabulismand Daoe." NCRP Report No. 52. Washington(January 15.1977).
I5. International Commission onRadiological Protection. Umits for Intakes ofRadionuclidn by Workers. ICRP Publication30 Part 1. Annals of the ICRP. PergSmonPres 11979).
28 Pepworth. D. C. and I. Vennart.'Retention of Sr in Human Bone at DifferentAes and Rasultisn Radiation Doses.-Physics in Medicine and Biology. 11 .169-8 86(1973i.
17. Kereisie. J. C. P. A. Feller. F. A.Ascoli. S. R Thomas. M. 1. Celland. and E LSaener. 'Pediatric RadiopharmaceuticaIDosimetry in "RadiopharmitceuticalDosimetry Symposium." April 26-29. 197t.HEW Publication (FDA) 76-84 (June 2978).
18. National Academy of Sciences/National Research Council. 'The Effects onPopulations of Exposure to Low Levels ofIonizing Radialion." Repon of the AdvisoryCommittee on Biological Effects of IonizingRadiation (BFIR-I) (19723.
19. National Council on RadiationProtection and Measurements INCRPJ. "BasicRadiation Protection Criteria.- NCRP Repor1No. 39, Washington (19711.
20. Bolen. I. T. end A. S. Goldrn."Population Exposure to External NaturalRadiation Background in the United States."ORPISEPD12'IL Environmental ProtectionAgency, Washington. DC (April 19813.
21. Federal Interagency Task Force onOfftite Emergency Instrumentation forNuclear Accidents. "Cuidance on OffsiteEmergency Radiation Measurement Systems:Phase 2. Monitoring and Measurement ofRadionuclides to Determine DoseCommitment in the Milk Pathway."developed by Exxon Nuclear Iddho Co. Inc..Idaho Falls. ID. Draft. July 1981 Ito bepublished by FEMA).
22 ShIien. B. C. D. Schmidt. and R. P.Chiacehierini. "Background for ProtectiveAction Recommendations; AccidentalRadioactive Contamination of Food andAnimal Feeds," September 1981. Departmentof Health and Human Services. Food andDrug Administration. bureau of RadiologicalIlealth. Rockvile. MD.
Pertinent background data andanformation on the recommendations areon file in the Dockets ManagementBranch. and copies are available fromthat office liddress above).
Based upon review of the commentsreceived on the proposal of December15. 19Y8 (43 FR 55790). and FDA's furthereonsideration of the need to provideguidance to State and local agencies foruse in emergency response planning inthe event that an incident results in theradioactive contamination of humanfood or anima! feed, the agency offersthe following recommendationsregarding protective action planning forhuman food and animal feeds:
Accidental Radioactive Contaminationof Human Food and Animal Feeds;Recommendations for State and LocalAgencies
IaI iApplicobilily. (1) Theserecommendations are for use byappropriate State or local agencies inresponse planning and the conduct ofradiatton protection activities involvingthe production. processing. distribution.and use of human food and animal feedsin the event of an Incident resulting inthe lease of radioactivity to theenvironment. The Food and DrugAdministration (FDA) recommends thatthis guidance be used on a case-by casebasis to determine the need for taking tappropriate protective action in theevent of a diversity of cuntaminating 'events, such as nuclear facilityaccidents, transportation accidents, andfallout from nuclear devices.
(2) Protective actions are appropriatewhen the health benefits associatedwith the reduction in exposure to beachieved are sufficient to offset theundesirable features of the protectiveactions. The Protective Action Guides(PAG's) in paragraph (c) of theserecommendations represent FDA'sjudgment as to the level of foodcontamination resulting from radiationincidents at which protective actionshould be taken to protect the publichealth. Further, as provided by Federalguidance issued by the FederalRadiation Council. if in a particularsituation, and effective action with lowtotal impact is available. initialion ofsuch action at a projected dose lowerthan the PAG may be justifiable. If onlyvery high-impact action would beeffective. Initiation of such action at aprojected dose higher than the PAG maybe Justifiable. (See 29 FR 12056: August2_. 1964.) A basic assumption in thedevelopment of protective actionguidance is that a condition requiringprotective action is unusual and should .not be expected to occur frequently.

Federal Register / Vol. 47, No. 205 / Friday. October 22. 1982 / Notices 47081
Circumstances that Involve repetitiveoccurrence. a substantial probability ofrecurrence within a period of I or 2years, or exposure from multiple sourrcs(such as airborne cloud and foodpathway) would require specialconsideration. In such a case. the totalprojected dose frum the several eventsand the total impact of the protectiveactions that might be taken to avoid thefuture dose from one or more of theseevents may need lo be considered. Inany event, the numerical values selectedfor the PAC's are not intended toauthorize deliberate releases expectedto result in absorbed doses of thesemagnitudes.
(31 A protective action is an action ormeasure taken to avoid most of theradiation dose that would occur fromfuture ingestion of foods contaminatedwith radioactive materials. Theserecommendations are intended forimplementation within hours or daysfrom the time an emergency isrecognized. The action recommended tobe taken should be continued for asufficient time to avoid most of theprojected dose. Evaluation of when tocease.a protective action should bemade on a case-by-case basisconsidering the specific incident and thefood supply contaminated. In the case ofthe pasture/cowimilk/person pathway.for which derived -response levels" areprovided in paragraph (dl of theserecommendations. It is expected thatactions would not need to extendbeyond I or 2 months due to thereduction of forage concentrations byweathering (14.day. half-life assumed).In the case of fresh produce directlycontaminated by deposition from thecloud. actions would be necessary at thetime of harvest This guidance is notintended to apply to the problems oflong-tern food pathway contaminationwhere adequate time after the incidentis available to evaluate the public healthconsequences of food contaminationusing current recommendations and theguidance in Federal Radiation Council(FRC) Report No.5. July 1964 and ReportNo. 7. May 1965.
(b) Definitions. (1) "Dose" is a generalterm denoting the quantity of radiationor energy absorbed. For specialpurposes it must be appropriatelyqualified. In these recommendations itrefers specifically to the term "doseequivalent."
(2) "Dose commitment" means theradiation dose equivalent received byan exposed individual to the organ citedover a lifetime from a single event.
(3) "Dose equivalent" is a quantitythat expresses all radiation on a.common scale for calculating theeffective absorbed dose. It Is defined asthe product of the absorbed dose in radsand certain modifying factors. The unitof dose equivalent Is the rem.
(4) "Projected dose commitment"means the dose commitment that wouldbe received in the future by individualsIn the population group from thecontaminating event if no protectiveaction were taken.
(5) -Protective action" means anaction taken to avoid most of theexposure to radiation that would occurfrom future ingestion of foodscontaminated with radioactivematerials.
(6) "Protective action guide (PAG)"means the projected dose commitmentvalues to individuals In the generalpopulation that warrant protectiveaction following a release of radioactivematerial. Protective action would bewarranted if the expected individualdose reduction i3 not offset by negativesocial. economic. or health effects. ThePAC does not include the dose that hasunavoidably occurred before theassessment.
17) 'Preventive PAG" is the projecteddose commitment value at whichresponsible officials should takeprotective actions having minimal ipactto prevent or reduce the radioactivecontamination of human food or animalfeeds.
(8a) Emergency PAG" is the projecteddose commitment value at whichresponsible officials should isolate foodcontaining radioactivity to prevent itsIntroduction into commerce and at
which the responsible officials shoulddetermine whether condemnation oranother disposition is appropriate. Atthe Emergency PAC. higher impactactions are justified because of theprojected health hazardsi.
(9) "Rad" means the unit of absorbeddose equal to 0.01 joule per kilogram inany medium.
(10) "Rem" Is a special unit of doseequivalent The dose equivalent in remsIs numerically equal to the absorbeddose in rads multiplied by the qualityfactor, the distribution factor. and anyother necessary modifying factors.
(ll) "Response level" means theactivity of a specific radionuclide (i)initially deposited on pasture: or (ii) perunit weight or volume of food or animalfeed. or (iii) in the total dietary intakewhich corresponds to a particular PAG.
(c) Protective action guides IPA C's).To permit flexibility of action for thereduction of radiation exposure to thepublic via the food pathway due to theoccurrence of a contaminating event thefollowing Preventive and EmergencyPAG's for an exposed individual In thepopulation are adopted.
(1) Pretentive FAG which is (iJ S.5rem projected dose commitment to thethyroid. or (ii) 0.5 rem projected dosecommitment to the whole body. bonemarrow, or any other organ.
(2) Emergency PAG which is (i) l5 remprojected dose commitment to thethyroid. or (ii) 5 rem projected dosecommitment to the whole body. bonemarrow, or any other organ.
(d) Response levels equivalent toPAC. Although the basic PAGrecommendations are given in terms ofprojected dose equivalent, it is oftenmore convenient to utilize specificradionuclide concentrations upon whichto initiate protective action. Derivedresponse levels equivalent to the PAC'sfor radionuclides of interest are:
(I) Response levelfor PreventivePAG. Infant ' as critical segment ofpopulation.
INewborn infant tnciudes fetus (pregnantwomnJ as cntical Asent o(poputauom foe iodine-1l1. For other radionucJide. -infant' refers la citdlose than I year of age.
b~ A.O ̂m 1,bP a w- Q'ee.wtwc~b~ow.nb~~ .fWM ~CM Dapso go" CC3W P.OIe.j eta 3 Of 9~.t
ff-f a WM4 a PWOW of alaw- 31 ua"~V~ $W."" depsvoI
WOuio of aww v toi~ 0-I~of vaaea. soW Sainwq NO VWaa of aegi bek DOuC" 8w 165db'c WV inU W-& 1Wta. cw"* 9wtowA bn powep b a * eWw.a

417082 Federal Register / Vol. 47, No. 205 I Friday. October 22. 2982 1 Notices
(2) Response lecel for Emncrjency PAC. The response levels equivalent to the Emergency PAC. are presented fur bothInfants and adults to permit use of either level and thus assure a flexible approach to taking artinn in cases where exposureof the most critical portion of the population (infants and pregnant womrcn) can be prevented:
-A1. ' 13.VL. 12,- -I . ,,3* _, _ . . . .. f .---1A" &A ~0I 'AdI
ro. ................... .2 _. _i w * i; 20 ! 40 20 so l I 20 so lowI; s 7. 5 I? 12 1 . i s , 2
fM,. CiII 2 5 2 241 4! oo 41 x 0
T_, *0, 40 | 70 ' °° l t 40.
'I ___I "O t%1l~8% 06 W-Wt Ml*W-a__ 0l 0 t Flcs¢mewn geMMMWeb131_- a-* t o" sJ ~ I low of _t'5,in 1~6t. .dw.131 a wo vv, Of 000cove w.. M..Os U W-f ConsffMMan U6 ,yMa III I"i My, h case at a .wolwO accem4 ww ClsUMAM" 0Q* 0 4 o4ad* .122
IN as OWA a pwaer 0 ww.l131 eftUwwv 9MAM"
11VAN 0 *O WA31 go ffiutps,"M S9w #W *0*0 W"y Cm10 *WI 0f VW W- ogMr1. r~W4 % PU0 ~ v~od c.r lmv~ 0.4 "W"CI.a~. . *0-mg. WM it 60hfe.134 aS ee-IZ137& 90,eily ip~ e WWI t orvsca IW MW'o. 0W.c M. we .m..n. V c .. MO""~ e, a tOf ga
le) Implementotion. When using thePAGCr and associated response levelsfor response planning or protectiveactions, the following conditions shouldbe followed.
(1) Speaciffood items. To obtain theresponse level (microcurie/kilogramlequivalent to the PAG for other specificfoods. It is necessary to weigh thecontribution of the individual food to the
-total dietary intake' thus.Re v*X;Totall intake mimcrocuries)
Rasponhe Level -
Where: Tots! intake (microcunesl for theappropriate PAC and radionuclide Isgiven in paragraph (d) or theseirecommendationsand
Consumption is the product of the averasedaily crnsumption specified In paragraphleliN I) of these recommendutions andthe days of intake of the contaminatedfood as specified in pirsaraph (el1tilpii ofthese recommendations.
(i) The daily consumption of specificfoods in kilograms per day for thegeneral population is given in thefollowing table:
I A go. M.I
W W", 90wel
licalft.
, WRI PA&vrw
! 43to
pow
o.. _- I. - ! "O°_wwwo- .w . .00I
Too 2005'EWst ocla OWP01; 310 ELU VW , 0wyo
(U1) Assessment of the effective daysof intake should consider the specificfood, the population involved, the fooddistribution system. and theradionuclide. Whether the food :sdistributed to the retail market orproduced for home us'e will significantlyaffect the intake in most instances.Thus, while assessment of intake shouldbe on a Case-by-case basis, somegeneral comments may be useful inspecific circumstances.
(a) For short half-life radionuclides.radioactive decay will limit theingestion ofradioactive nutaerials andthe effective '.days of intake". Theeffective "days of intake' in this case is1.44 times the radiological half-life. Foriodine-131 (half-life-8.0S days). theeffective 'days of intake" is. thus. IIdays.
(hi Where the food product is beingharvested on a daily basis. it may bereasonable to assume reduction ofcontamination due to weathering. As anInitial assessment. it may be appropriateto assume a 14-day weathering half-life(used for forage in pasturelcowlmilkpathway) pending further evauto.Ithis case, the effective 'days of intake'is 20 days. A combination of radioactivedecay and weathering would result inan effective half-life for iodine-131 or sdays and reduce the "days of Intake' to7 days.
(c) In the case of.a food which is soldin the retail market, the effective "days
of Int;ake would probably be limited bythe quaintily purchased at a given time.For most food, especially fresh produce.this would probably be about a 1 weeksupply. In some cases, however. larerquantities would be purchased for homecanning or freezing. For mnnt foods andmembers of the public, an effective"days of intake" 30 days is probablyconservative.
(iiil For population groups havingsignificantily different dietary Intakes, anappropriate adjustment of dietaryfactors should be made.
(2) RAodianuclide mixtures. If amixture of radionuclides is present. thesum of all the ratios of the concentrationof each specific radionulide to itsspecific response level equivalent to th (PAG should be less than one.
13) Other rodionuiclides. The responselevel for the Preventive and EmergencyPAG for other radionuclides should becalculated from dose commitmentfactors available in the literatureIKillough. C. C. elt l. ORNL/NUREGI.TM-190 (19761 (adult onl03. and U.S.Nuclear Regulatory Commission Reg.Guide t.109 (Ig,1).
*(4) Other CriUicaO orscns. Dosecommitment factors in U.S. NuclearRegulatory Commission Reg. Guide 1.2eo(1977) refer to bone rather than bonemarrow dose commitments. For thepurpose of these recommendations, dosecommitment to the bone marrow isconsidered to be 0.3 of the bone dosecommitment. This is based on the ratioof dose rate per unit activity in the bonemarrow to dose rate per unit activity ina small tissue-filled cavity in bonet andassumes that strontium,90 is distributedonly in the minteral bone (Spiers. F. W.et al. in "Biomedical Implications ofRadiostrontium Exposure." AECSymposium 25 (1972. Tbe ratio forstrontium-O Is the same because themean particle energies re similar (OMMeV (megaelectronvoltsj). Situationscould arise in which an organ other tha?-those discussed in this paragraph coult
owb
r__ _00"
"kOKem..W am" '1111m. INP
U-Ar
s;M 9-"Rw se-CM -_--4- '--a---1-% 4
I - Imp. bwwIn V
PZ-K emvs~ *VwWw*m1_-- - 17

Federal Register I Vol. 4i, No. 205 / Friday. October 22, 1982 / Notices 47083
be considered to be the organ receivingthe highest dose per unit intake. In thecase of exposure via the food chain.depending on the radionuclide underconsideration, the gastrointestinal tractcould be the primary organ exposed.The references cited in paragraph (e)(3Jof these recommendations contain dosecommitment factors for the followingorgans: bone, kidneys. liver. ovaries.spleen. whole body, and gastrointestinaltract.
(5) Prompt notification of State andlocal agencies regarding the occurrenceof an incident having potential publichealth consequences Is of significantvalue In the implementation of effectiveprotectlve actions. Such notification isparticularly important for protectiveactions to prevent exposures from theairborne cloud but is also of value forfood pathway contamination.Accordingly this protective actionguidance should be incorporated inState/local emergency plans whichprovide for coordination with nuclearfacility operators Including promptnotification of accidents and technicalcommunication regarding public healthconsequences and protective action.
(f) Sampling parameter. Generally.sites or sample collection should be theretail market, the processing plant. andthe farm. Sample collection at the milkprocessing plant may be more effcient indetermining the extent of the foodpathway contamination. The geographic-area where protective actions areimplemented should be based onconsiderations of the wind direction and*atmospheric transport. measurements byairborne and ground survey teams of theradioactive cloud and surfacedeposition. *nd measurements in thefood pathway.
(g) Recommended methods ofanalysis. Techniques for measurementof radionuclide concentrations shouldhave detection limits equal to or lessthan the response levels equivalent tospecific PAC. Some useful methods ofradionuclide analysis can be found In:
(1) Laboratory Mcthods-iHASLProcedure Manual. edited by John H.Harley. HASL3ERDA. HealthandSafety Laboratory New York NY 1973;"Rapid Methods for Estimating FissionProduct Concentrations in Milk." U.S.Department of Health. Education, andWelfare. Public Health ServicePublication No. 999-R-Z. May 1963;"Evaluation of Ion Exchange Cartridgesfor Field Sampling of lodine-131 inMilk'" Johnson. R. H. and T. C. Reavy.Natumr. 208 (5012): 750-7S2 November20. 195; and
(2) FieldMethods-Keamy. C H.O) ORNL 490 November 1973; DistenfeldC. and 1. Ydemish. Brookhaven NationalLaboratory. NUREG/CR-M1S.
December 197& and InternationalAtomic Energy Agency. "EnvironmentalMonitoring In Emergency Situationt."196. Analysis need not be limited tothese methodologies but should providecomparable results. Action should notbe taken without verification of theanalysis. Such verificalion might includethe analysis of duplicate samples,laborajory measurements. sampleanalysis by other egencies. sampleanalysis of various environrmentalmedia, and descriptive data onradioactive release.
lh) Protective actions. Actions areappropriate when the health benefitassociated with the reduction in dosethat can be achieved is considered tooffset the undesirable health economic.and social factors. It is the intent ofthese recommendations that, not onlythe protective actions cited for theEmergency PAG be initiated when theequivalent response levels are reached.but also that actions appropriate at thePreventive PAC be considered. This hasthe effect of reducing the period of timerequired during which the protectiveaction with the greater economic andsocial impact needs to be taken. FBArecommends that once one or moreprotective actions are initiated, theaction or actions continue for asufficient time to avoid most of theprojected dose. There is a longstandingFDA policy that the purposeful blendingof adulterated food with unadulteratedfood Is a violation of the Federal Food.Drug, and Cosmetic Act. The followingprotective actions should be consideredfor Implementation when the projecteddose equals or exceeds the appropriatePAC:
(I) Preventive PAC. fi) For pasture: (a)Removal of lactating dairy cows fromcontaminated pasturage andsubstitution of uncontaminated storedfeed.
lb) Substitute source ofuncontaminated water.
(iI) For milk: (a) Withholding ofcontaminated milk from the market toallow radioactive decay of shurt-livedradionuclides. This may be achieved bystorage of frozen fresh milk, frozenconcentrated milk, or frozenconcentrated milk products.
(b) Slorage for prolonged times atreduced temperatures also is fensibleprovided ultrahigh temperaturepasteurization techniques are employedfor processing (Finley. R. D. H. B.Warren. and R. E. Hargrove. "StorageStability of Commercial Milk, Journalof MilA and Food Technology.31(121:3B2-387. December 1968).
(c) Divcrsiun oft fluid milk forproduction of dry whole milk, nonfat dry
milk, butter, cheese, or evaporated milk.(iii) For fruiti and vegetables: (a)
Washing, brushing. scrubbin;. or peelingto remove surface contamination.
(b) Preservation by canning. freezing...and dehydration or storage to permitradioactive decay of short-livedradionuclides.
(iv) For grains. to Milling and (b)polishing.
(v) For other food products. processingto remove surface contamination.
(vi) For meat and meat productsIntake of cesium.134 and cesium.137 byan adult via the meat pathway mayexceed that of the milk paLo'waytherefore, levels of cesium In milkapproaching the "response level' shouldcause surveillance and protectiveactions for meat as appropriate.
(vii) For animal feeds other thanpasture, action should be on a case-by-case basis taking into consideration therelationship between tlhe radionuclideconcentration in the animal feed and theconcentration of the radionuclide Inhuman food. For bay and silage led tolactating cows, the concentration shoulanot exceed that equivalent to therecommendations for pasture. -
(2)EmergencyPA.G Responsibleofficials should isolate food containingradioactivity.to prevent its introductionInto commerce and determine whethercondemnation or another disposition isappropriate. Before iaking this action,the following factors should beconsidered:
(1) The availability of other possibleprotective actions discussed inparagraph (h)(2) of theserecommendations.
(ii) Relative proportion of the totaldiet by weight represented by the itemin question.
(iii) The importance orthe particularfood in nutrition and the availability ofuncontaminated food or substituteshaving the same nutritional properties.
(iv) The relative contribution of otherfoods and other radionuclides to thetotal projected dose.
(v) The time and effort required toeffect corrective action.
This notice is issued under the PublicHealth Service Act (secs. 31. 3o. 311.58 Stat. 691-893 as amended, 88 Stat. 371(42 U.S.C. 241 2420 243)) and underauthority delegated to the Commissionerof Food and Drugs (21 CFR 5.10).
DMopd: October II. 198gArnhur llull Hayms. lr-Cnmmissvoner of Food and Drugs.
IMr co w-u c .6d 4t 10 Z O 4O aNLIN4 corn *10-1-10

071CHAPTER 4
Protective Action Guides for the Intermediate Phase(Deposited Radioactive Materials)
4.1 Introduction
Following a nuclear incident itmay be necessary to temporarilyrelocate the public from areas whereextensive deposition of radioactivematerials has occurred untildecontamination has taken place. Thischapter identifies the levels ' ofradiation exposure which indicate whenrelocation from contaminated propertyis warranted..
The period addressed by thischapter is denoted the "intermediate
\V -I- phase." This is arbitrarily defined asthe period beginning after the sourceand releases have been brought undercontrol -...and environmentalmeasurements are available for use asa basis for decisions on protectiveactions. and extending until these
' 'protective actions are terminated. This- '. phase may overlap the early and late
phases and may last from weeks tomany months. For the purpose of doseprojection, it is assumed to last for oneyear. Prior to this period protectiveactions will have been taken basedupon the PAGs for the early phase. Itis assumed that decisions will be madeduring the intermediate::: phaseconcerning whether particular areas orproperties from which persons have*been'relocated will be decontaminatedand reoccupied, or condemned and the
occupants permanently relocated.These actions will be carried out duringthe late or "recovery" phase.
Although these Protective ActionGuides (PAGs) were developed basedon expected releases of radioactivematerials characteristic of reactorincidents, they may be applied to anytype of incident that can result inlong-term exposure of the public todeposited radioactivity.
PAGs are expressed in terms ofthe projected doses above whichspecified- protective actions arewarranted. In the case of depositedradioactivity, the major relevantprotective action is relocation. Personsnot relocated (i.e., those in lesscontaminated areas) may reduce theirdose through the application of simpledecontamination techniques and byspending more time than usual in lowexposure rate areas (e.g., indoors).
The PAGs should be consideredmandatory only for use in planning,e.g., in developing radiologicalemergency response plans. During anincident, because of unanticipated localconditions and constraints, professionaljudgment by responsible officials willbe required in their application.Situations can be envisaged, wherecontamination from a nuclear incident
4-1

occurs at a site or time in whichrelocation of the public, based on therecommended PAGs, wou d beimpracticable. Conversely, under someconditions, relocation may be quitepracticable at projected doses below thePAGs. These. situations requirejudgments by those responsible forprotective action decisions at tlie timeof the incident. A discussion Iof theimplementation of these PAGs isprovided in Chapter 7.
The PAGs for relocation specifiedin this chapter refer only to estimatesof doses due to exposure durihg thefirst year after the incident. Exposurepathways include external exposure toradiation from deposited radioactivityand inhalation of resuspendedradioactive materials. PrdtectiveAction Guides for ingestion exposurepathways, which also apply durng theintermediate phase, are di cussedseparately in Chapter 3.
Individuals who live in areascontaminated by long-livedradionuclides may be exposed toradiation ...from these material at adecreasing rate, over the entire timethat they live in the area. Thist wouldbe the case for those who are notrelocated as well as for persons whoreturn following relocation. Because itis usually not practicable, at tWle timeof a decision to relocate, to calculatethe doses that might be incurred fromexposure beyond one year, and becausedifferent protective actions may beappropriate over such longer periods oftime, these doses are not included inthe dose specified in the PAbs forrelocation. |
4.1.1 Exposure Pathways
The principal pathways . forexposure of the public occupyinglocations contaminated by depositedradioactivity are expected to beexposure of the whole body to externalgamma radiation from depositedradioactive materials. (groundshine)and internal exposure from theinhalation of resuspended materials.For reactor incidents, external gammaradiation is expected to be thedominant source.
Almost invariably relocationdecisions will be based on doses fromthe above pathways. (However, in rarecases where food or.drinking water iscontaminated to levels above the PAGfor ingestion, and its withdrawal fromuse will create a risk from starvationgreater than that from the radiationdose, the dose from ingestion should beadded to the dose from the abovepathways.) PAGs related specifically tothe withdrawal of contaminated foodand water from use are discussed inChapter 3.
Other potentially. significantexposure pathways include exposure tobeta radiation from surfacecontamination and direct ingestion ofcontaminated soil. These pathways arenot expected to be controlling forreactor incidents (AR-89).
4.1.2 The Population Affected
The PAGs for relocation areintended for use in establishing theboundary of a restricted zone within an
0
0 .4-2
C-) area that has been subjected todeposition of radioactive materials.During their development,consideration was given to the higherrisk of effects on health to 6bildren andfetuses from radiation dose: and thehigher risk to some othe4 populationgroups from relocation. To avoid thecomplexity of implementing separatePAGs for individual members of thepopulation, the relocation PAC' isestablished at a level that! will provideadequate protection for |the generalpopulation.
Persons residing in contaminatedareas outside the restricted zone willbe at some risk from radiation dose.Therefore, guidance on thi reduction ofdose during the first year! toiresidentsoutside this zone is also provided. Dueto the high cost of relocation, it is morepractical to reduce dose. in thispopulation group by the- earlyapplication of simple, low-impact,protective actions other than byrelocation. I
the skin to beta radiation is warrantedat 50 times the numerical value of therelocation PAG for effective doseequivalent.
Persons who are not relocated, i.e.,*those in areas that receive relativelysmall amounts of deposited radioactivematerial, should reduce their exposureby the application of other measures.Possible dose reduction techniquesrange from the simple processes ofscrubbing and/or flushing surfaces,soaking or plowing of soil, removal anddisposal of small spots of soil found tobe highly contaminated (e.g., fromsettlement of water), and spendingmore time than usual in, lowerexposure rate areas (e.g., indoors), tothe difficult and time-consumingprocesses of removal, disposal, andreplacement of contaminated surfaces.It is anticipated that simple processeswill be most appropriate -for earlyapplication. Many can be carried outby residents themselves with supportfrom response officials for assessmentof the levels of contamination, guidanceon appropriate actions, and disposal ofcontaminated materials. Due to therelatively low cost and risk associatedwith these protective actions, they maybe justified as ALARA measures at lowdose levels. It is, however,recommended that response officialsconcentrate their initial efforts in areaswhere the projected dose from the firstyear of exposure exceeds 0.5 rem. Inaddition, first priority should be givento cleanup of residences of pregnantwomen who may exceed this criterion.
O ::
.-;A;. . .)
4.2 The Protective ActicDeposited Radioactivity
a Guides for
PAGs for protection from depositedradioactivity during the intermediatephase are summarized In Table 4-1.The basis for these value; is:presentedin detail in Appendix E. In summary,relocation is warranted when theprojected sum of the dose equiv'alentfrom external gamma radiation and thecommitted effective dose equivalentfrom inhalation of I resuspendedradionuclides exceeds 2 rmin the firstyear. Relocation to avoid exposure of
4-3

Table 4-1 Protective Action GiDuring the Intermei
ides for Exposure to Deposited RadioactivityHate Phase of a Nuclear Incident
Protective PAG (projected CommentsAction | dose)'
Relocate the general Ž22 rem Beta dose to skin may bepopulation.b up to 50 times higher
Apply simple dose 1 <2 rem These protective actionsreduction techniques.' l should be taken to-reduce
doses to as low aspracticable levels.
'The projected sum of effective dose equivalent from external gamma radiation and committedeffective dose equivalent from inhalation of resuspended materials, from exposure or intake duringthe first year.. Projected dose refers to lhe dose that would b ierceived in the absence of shieldingfrom structures or the application of dose reduction techniques. These PAGs may not provideadequate protection from some long-lived radionuclides (see Section 4.2.1).
'Persons previously evacuated from areL outside the relocation zone defined by this PAG mayreturn to occupy their residences. Cases involving relocation of persons at high risk from suchaction (e.g., patients under intensive care) should be evaluated individually.
'Simple dose reduction techniques incluplowing soil, minor removal of soil fromspending more time than usual indoors
4.2.1 Longer Term Objectives cProtective Action Guides
It is an objective of these PAassure that 1) doses in any singleafter the first will not exceed 0.5and 2) the cumulative dose oviyears (including the first and soyears) will not exceed 5 rem.source terms from reactor incicthe above PAG of 2 rem projectedin the first year is expected toboth of those objectives thu
le scrubbing and/or flushing hard surfaces, soaking orspots where radioactive materials have concentrated, andor in other low exposure rate areas.
f the
3s toyearrem,,r 50=cond
Forents,dosemeet'ough
radioactive decay, weathering, andnormal part time occupancy instructures. Decontamination of areasoutside the restricted area may berequired during the first year to meetthese objectives for releases consistingprimarily of long-lived radionuclides.For situations where it is impractical tomeet these objectives thoughdecontamination, consideration shouldbe given to relocation at a lowerprojected first year dose than thatspecified by the relocation PAG.
4-4

After the population has been.. protected in accordance with the PAGs
for relocation, return for Iccupancy of.previously restricted areas should begoverned' on the basis Of RecoveryCriteria as presented in Chapter 8.
Projected dose considers exposurerate reduction from radioactive decayand, generally, weathering. When onealso considers the anticipated effects ofshielding from partial ozcupancy inhomes and other structi~es, personswho are not relocated should receive adose substantially less! than theprojected dose. For commonly assumed-reactor source terms, we estimate that2 rem projected dose in the first yearwill be reduced to about' 1.2 rem bythis factor. The application lof simpledecontamination techniques shortlyafter the incident can be' assumed toprovide a further 30 percent or more
-reduction, so that the maximum firstyear dose to persons ybo are notrelocated is expected to le less thanone rem. Taking account of decay ratesassumed to be associated With releasesfrom nuclear power plant incidents(SN-82) and shielding from partialoccupancy and weathering a projecteddose of 2 rem in the first eair is likelyto amount to an actual ddse of 0.5 remor less in the second yearland 5 rem orless in 50 years. The application ofsimple dose reduction techniques wouldreduce these doses further. Results ofcalculations supporting theseprojections are summarized' in TableE-6 of Appendix E.
.0
4.2.2 Applying the Protective ActionGuides for.Relocation
Establishing the boundary of arestricted zone may result in threedifferent types of actions:
i. Persons who, based on the PAGs forthe early phase of a nuclear incident(Chapter 2), have already beenevacuated from an area which is nowdesignated as a restricted zone mustbe converted to relocation status.
2. Persons not previously evacuatedwho reside inside the restricted zoneshould relocate.
3. Persons who normally resideoutside the restricted zone, but werepreviously evacuated, may return. -Agradual return is recommended, asdiscussed in Chapter 7.
Small adjustments to the boundaryof the restricted zone from that givenby the PAG may be justified on thebasis of difficulty or ease ofimplementation. For example, the useof a convenient natural boundary couldbe cause for adjustment of therestricted zone. However, suchdecisions should be supported bydemonstration that exposure rates topersons not relocated can be promptlyreduced by methods other thanrelocation to meet the PAG, as well asthe longer term dose objectivesaddressed in Section 4.2.1.
Reactor incidents involvingreleases of major portions of the coreinventory under adverse atmosphericconditions can be postulated for which
4-5

large areas would have to be restrictedunder these PAGs. As the affectedland area increases, they will becomemore difficult and costly to implement,especially in densely populated! areas.For situations where implementationbecomes impracticable or impiossible(e.g., a large city); informed judgmentmust be exercised to assure pricrity ofprotection for individuals in] areashaving the highest exposure rates.: Insuch situations, the first prio'ty forany area should be to reduce dose topregnant women.
References
AR-89 Aaberg, Rosanne, Evaluation of Skinand Ingestion Exposure Pathways. EPA520/1.89.016. U.S. Environmental ProtectionAgency, Washington, (1989).
EP-87. U.S. Environmental Protection Agency.Radiation Protection Guidance to FederalAgencies for Occupational Exposure. FederalRegister 5, 2822; January 27, 1987.
SN-82 Sandia National Laboratory. TechnicalGuidance for Siting Criteria Development.NUREG/CR-2239. U.S. Nuclear RegulatoryCommission, Washington, (1982).
0.
4.3 Exposure Limits for PersonsReentering the Restricted Zone:
Individuals who are permi ted toreenter a restricted zone to worKl, or forother justified reasons, will requireprotection from radiation. | Suchindividuals should enter the restrictedzone under controlled conditions inaccordance with dose limitations andother procedures for control ofoccupationally-exposed workers(EP-87). Ongoing doses received bythese individuals from living: in acontaminated area outsidd therestricted zone need not be inchi ded aspart of this dose limitation applicableto workers. In addition, dose receivedpreviously from the plume andassociated groundshine, du ig theearly phase of the nuclear inmident,need not be considered.
0
.. )4-6

.1
7 ~CM
Implementing the Pfor theI
5.1 Introduction
This chapter provides generalguidance for implementing theProtective Action Guides iPAGs) setforth in Chapter 2. In particular, theobjective is to provide gunidance forestimating projected doses fromexposure to an airborne plume ofradioactive material, and for choosingand implementing protective actions.
Following an incident which has thepotential for an atmospherc release ofradioactive material, the responsibleState and/or local authorities will needtFdecide' whether offsite' protectiveactions are needed and, if so, whereand when they should be inplemented.These decisions will be based primarilyon (a) the potential for ieleases, (b)projected doses as a function of time atvarious locations in the environment,and '(c) dose savings :land risksassociated with variousj protectiveactions.
Due to the wide variet of nuclearfacilities, incidents, and releases thatcould occur, it is not practical toprovide specific implementikng guidancefor all situations. Exam'ples of thetypes of sources leading to airbornereleases that this guidance may beapplied to are nuclear power reactors,uranium fuel cycle facilities, nuclear
--0...
LPTER 5
rotective Action GuidesEarly Phase
weapons facilities, radiopharmaceuticalmanufacturers and users, space vehiclelaunch and reentry, and researchreactors. For many specificapplications, however, it will beappropriate to develop and useimplementing procedures that aredesigned for use on- a case-by-casebasis.
Dose conversion factors (DCF) andderived response levels (DRL) areprovided for radionuclides that aremost likely to be important in anincident involving an airborne releaseof radioactive materials. DCFs andDRLs for radioniclidsidi tilist'ed maybe developed from the sources refer-enced in the tables. The valuesprovided here are the best currentlyavailable. However, as new infor-mation is developed these values maychange. This chapter will be revisedfrom time to time to reflect suchchanges.
5.2 Initial Response and Sequence ofSubsequent Actions
In the case of an atmosphericrelease, the protective actions whichmay be required are those which pro-tect the population from inhalation ofradioactive materials in the plume,from exposure to gamma radiation
5-1

0 4. Estimation of offsite consequences(e.g., calculation of the plumecenterline dose rates and projecteddoses at various distances downwindfrom the release point).
5. Implementation of j protectiveactions in additional areas if needed.
6. Decisions to terminate existingprotective actions should Include, as aminimum, consideration of the status
of the plant and the:, PAGs forrelocation (Chapter 4). (Withdrawal ofprotective actions from areas wherethey have already been imnpemented isusually not advisable during the earlyphase because of the potential forchanging conditions and confusion.)
For other types of iLcidents thesequence of actions may vary in details,depending on the specific emergency
--- response--plan, but in 'general thesequence and general reportingrequirements will be the same.
5.2.1 Notification
The nuclear facility l operator orother designated individual shouldprovide the first notification to Stateand/or local authorities that a nuclearincident has occurred. In the case ofan incident with the potential foroffsite consequences, notification ofState and local response o'rganizationsby a facility operator should includerecommendations, based on plantconditions, for early evacuation and/orsheltering in predesignated areas.Early estimates of the- various
components of projected doses to thepopulation at the site boundary, as wellas at more distant locations, along withestimated time frames, should be madeas soon as.. the relevant source orrelease data become available.Emergency response planners shouldmake arrangements with the facility
.operator to assure that thisinformation will be made available ona timely basis and that dose projectionswill be provided in units that can bedirectly compared to the PAGs.Planners should note that the toxicchemical hazard is greater than theradiation hazard for some nuclearincidents, e.g. a uranium hexafluoriderelease.
For some incidents, such as re-entryof satellites or an incident in a foreigncountry, notification is most likely tooccur through the responsible Federalagency,. most commonyJ._the.___Environmental Protection Agency orthe National Aeronautics and SpaceAdministration. In such casesprojections of dose andrecommendations to State and localofficials for protective actions will bemade at the Federal level, under theFederal Radiological EmergencyResponse Plan (FE-85).
5.2.2 Immediate Protective Action
Guidance for developing emergencyresponse plans for implementation ofimmediate protective actions forincidents at commercial nuclear powerplants is contained in NUREG-0654(NR-80). Planning elements for
. . . ..... ... 5-3

0 measurements are unlikely to beavailable to project doses accurately.Doses must be projected using initialenvironmental measurements orestimates ofthe source term, and usingatmospheric transport i previouslyobserved under similar meteorologicalconditions. ' These projections areneeded to determine whether protectiveactions should be implemented inadditional areas during the earlyphase.
Source term measurements, orexposure rates or concentrationsmeasured in the plume at a fewselected locations, may be used toestimate the extent of the exposed areain a variety of ways, depending on thetypes of data and computation methodsavailable. The most accurate methodof projecting doses is through the use ofan atmospheric diffusion and transportmodel that- has been verified for use atthe site in question. A variety ofcomputer software can ibe used toestimate exposures in real time, or toextrapolate a series of' previously-prepared isopleths for unit releasesunder' various meteorologicalconditions. The latter can be adjustedfor the estimated source magnitude orenvironmental measurements at a fewlocations during the incident. If themodel-projections have some semblanceof consistency with environmentalmeasurements, extrapolation to otherdistances and areas can be made withgreater confidence. If projections usinga sophisticated site-specific model arenot available, a simple' but crude,method is to measure the plume cen-
terline exposure rate2 at ground level(approximately one meter height) at aknown distance downwind of therelease point and then to calculateexposure rates at other downwindlocations by. assuming that the plumecenterline exposure rate is a knownfunction of the distance from therelease point.
The following relationship can beused for this calculation:
D2 = DI (R1 R2)Y
where D, and D2 are measurements ofexposure rates at the centerline of theplume at distances R, and R2,respectively, and y is a constant thatdepends on atmospheric stability. Forstability classes A and B, y = 2; forstability classes C and D, y = 1.5; andfor stability classes E and F, y = 1.Classes A and B (unstable) occur withlight winds and strong sunlight, andclasses E and F (stable) with lightwinds at night. Classes C and Dgenerally occur with. winds strongerthan about 10 mph. This method ofextrapolation is risky because themeasurements available at thereference distance may beunrepresentative, especially if theplume is aloft and has a looping
'The centerline exposure rate can bedetermined by traversing the plume at a pointsufficiently far downwind that it has stabilized(usually more than one mile from the releasepoint) while taking continuous exposure ratemeasurements.
07-C).
. .
5-5

behavior. In the case of an elevatedplume, the ground level concentrationincreases with distance fromn thesource, and then decreases, whereasany high energy gamma radiation fromthe overhead cloud continuouslydecreases with distance. For thesereasons, this method of extrapolationwill perform best for surface releases orif the point of measurement for anelevated release is sufficiently distantfrom the point of release for the plumeto have expanded to ground level(usually more than one mile). Theaccuracy of this method Wrill *beimproved by the use of measurementsfrom many locations averaged overtime.
5.4 Dose Projection
The PAGs set forth in Chapter 2are specified in terms of the effectivedose equivalent. This dose includesthat due to external gamma exposureof the whole body, as well 'as thecommitted effective dose equivalentfrom inhaled radionuclides. Guiidanceis also provided on protective' actionlevels for the thyroid and skin; interms of the committed dose equivalentto these organs. Further references toeffective or organ dose equivalent referto these .two quantities, respectively.Methods for estimating projected dosesfor each of these forms of exposure arediscussed below. These requireknowledge of, or assumptions for, theintensity and duration of exposure andmake use of standard assumptions onthe relation, for each radioisotope,between exposure and dose. Exposure
and dose projections should be basedon the best estimates available. Themethods and models used here may bemodified as necessary for specific sitesto achieve improved accuracy.
0..
5.4.1 Duration of Exposure
The projected dose for comparisonto the early phase PAGs is normallycalculated for exposure during the firstfour days following the projected (oractual) start of a release. The objectiveis to encompass the entire period ofexposure to the plume and to depositedmaterial prior to implementation of anyfurther, longer-term protective action,such as relocation. Four days is chosenhere as the duration of exposure -todeposited materials during the earlyphase because, for planning purposes;it is a reasonable estimate of the timeneeded to make measurements, reachdecisions, and prepare to''implementrelocation. However, officials at thesite at the time of the emergency maydecide that a different time is moreappropriate. Corresponding changes tothe dose conversion factors found intables in Section 5.4.2 will be needed ifanother exposure period is selected.
0
Protective actions are taken toavoid or reduce projected doses. Dosesincurred before the start of theprotective action being consideredshould not normally be included inevaluating the need for protectiveaction. Likewise, doses that may beincurred at later times than thoseaffected by the specific protectiveaction should not be included. For
5-6 5. y }
0example, doses which may be incurredthrough ingestion pathways orlong-term exposure to depositedradioactive materials take place over adifferent, longer time period.Protective actions for such exposuresshould be based on guidance addressedin other chapters.
The projected dose i from eachradionuclide in a plume is proportionalto the time-integrated concentration ofthe radionuclide in the plume at eachlocation. This concentration willdepend on the rate and the duration ofthe release and meteorologicalconditions. Release rates will varywith time, and this time-dependencecannot usually be predicted accurately.In the absence of more specificinformation, the release, rate may beassumed to be constant.
Another factor affecting theestiiiimtion' of projected dose is theduration of the plume at a particularlocation. For purposes of calculatingprojected dose from most pathways,exposure will start at a particularlocation when the plume arrives andend when the plume is no longerpresent, due either to an end to therelease, or a change in wind direction.Expo'sure from one pathway (wholebody exposure to deposited materials)will continue for an extended period.Other factors such as the aerodynamicdiameter and solubility: of particles,shape of the plume, and. terrain mayalso affect estimated dose, and may beconsidered on a site- a'nd/or source-specific basis.
Prediction of time frames forreleases is difficult because of the widerange associated with the spectrum ofpotential incidents. Therefore,planners should consider the possibletime periods between an initiatingevent and arrival of a plume, and the
'duration of releases in relation to thetime needed to implement competingprotective actions (i.e., evacuation andsheltering). Analyses of nuclear powerreactors (NR-75) have shown that someincidents may take several days todevelop to the point of a release, whileothers may begin as early as one-halfhour after an initiating "-event.Furthermore, the duration of a releasemay range from less than one hour toseveral days, with the major portion ofthe release usually occurring withinthe first day.
Radiological exposure rates arequite sensitive to the wind speed. Theair concentration is inversely related tothe wind speed at the point of release.Concentrations are also affected by theturbulence of the air, which tends toincrease with wind speed -and sunlight,and by meandering of the plume, whichis greater at the lower wind speeds.This results in higher concentrationsgenerally being associated with lowwinds near the source, and' withmoderate winds at larger distances.Higher windspeed also shortens thetravel time. Planning information ontime frames for releases from nuclearpower facilities may be found inReference NR-78. Time frames forreleases from other facilities willdepend on the characteristics of thefacility.
5-7

Since a change in wind directionwill also affect the duration ofexposure, it is very important thatarrangements be made for a public,private, or. military professionalweather service to provide informationon current meteorological and windconditions and predicted wind directionpersistence during an incident, inaddition to information received fromthe facility operator.
5.4.2 Dose Conversion Factorsl
This section provides doseconversion factors (DCFs) and derivedresponse levels (DRLs) for | thoseradionuclides important for respondingto most types of incidents. These aresupplemented by an exnample todemonstrate their application." TheDCFs are useful where multipleradionuclides are involved, because thetotal dose from a single exposurepathway will be the sum of the dosescalculated for each radionuclide. TheDRLs are surrogates for the PAG andare directly usable for releasesconsisting primarily of a single nuclide,in'.ibvhih case 'the DRL can becompared directly to the measured orcalculated concentration. (DRLs alsocan be used for multiple radionuclidesby summing the ratios of theenvironmental concentration df eachnuclide to its respective DRL. To meetthe PAG, this summust be equal to orless than unity.)
DCFs and DRLs for each of thethree major exposure pathways for theearly phase (external exposure to
plume, plume inhalation, and externalexposure from deposited materials) areprovided separately in Section 5.6.They are all expressed in terms of thetime-integrated air concentration at thereceptor so they can be convenientlysummed over the three exposurepathways to obtain composite DRLsand DCFs for each radionuclide. Thesecomposite values are tabulated in Table5-1 for effective dose and in-Table 5-2for thyroid dose from inhalation ofradioiodines.
The tabulated DCFs and DRLsinclude assumptions on paiticle size,deposition velocity, the presence ofshort-lived daughters, and exposureduration as noted.. The existence ofmore accurate data for individualradionuclides may justify modificationof the DCFs and DRLs. Theprocedures described in Section 5.6 fordeveloping the DCFs and DRLs forindividual exposure pathways may bereferred to, to assist suchmodifications.
0
0To apply Tables 5-1 and 5-2 to
decisions on implementing PAGs, onemay use either the DCFs'or'DRLs.DCFs are used to calculate theprojected composite dose for eachradionuclide; these doses are thensummed and compared' fo the PAG.The DRLs may be used by summingthe ratios of the concentration of eachradionuclide to its corresponding DRL.If the sum of the ratios exceeds unity,the corresponding protective actionshould be initiated.
5-8 K-).

Table 5-1 Dose Conversion Factors (DCF) and Derived Response Levels (DRL) forCombineda Exposure Pathways During the Early Phase of a NuclearIncidentb
DCF DRL'Radionuclide rem per pCi * cm' 3 h
pCi * cm* h
H-3C-14Na-22Na-24P-32
P-33S-35C1-36K-40K-42
(2
Ca-45Sc-46Ti-44V-48Cr651
Mn-54Mn-56Fe-55Fe-59Co-58
Co-60Ni-63Cu-64Zn-65Ge-68
Se-75Kr-85Kr-85mKr-87Kr-88
2.8E+033.OE+032.6E+041.6E+042.OE+03
7.7E+012.5E+031.9E+047.3E+031.9E+04
8.OE+034.4E+041.2E+062.4E+045.5E+02
1.3E-042.3E-058.2E-074.2E-051.8E-03
1.3E-024.OE-045.3E-051.4E-045.4E-05
3.6E-043.4E-043.8E-056.5E-055.1E-04
1.2E+041.8E+033.2E+032.3E+041.7E+04
8.5E-055.7E-043.1E-044.4E-055.7E-05
2.7E+057.6E+035.9E+022.7E+046.2E+04
3.7E-061.3E-041.7E-033.7E-051.6E-05
1.2E+041.3E+009.3E+015.1E+021.3E+03
8.3E-057.8E-011.1E-022.OE-037.8E-04
5-9

Table 5-1, Continued
DCF DRLcRadionuclide rem per pCi -cm' h
iiCi cmrn- h
0
Kr-89Rb-86Rb-88Rb-89Sr-89
1.2E+038.3E+035.2E+021.4E+035.OE+04
8.6E-041.2E-041.9E-037.3E-042.OE-05
6.4E-074.2E-049.9E-051.7E-052.6E-06
Sr-90Sr-91Y-90Y-91Zr-93
1.6E+062.4E+031.OE+045.9E+043.9E+05
Zr-95Zr-97Nb-94Nb-95Mo-99
3.2E+045.5E+035.OE+051.OE+045.2E+03
3.2E-051.8E-042.OE-069.7E-051.9E-04
...... .. . .
l.OE-046.OE-037.7E-058.2E-041.7E-06
cmTc-99Tc-99mRu-103Ru-105RufRh-106'
Pd-109Ag-lOrmCd-109Cd-113mIn-114m
l.OE+041.7E+021.3E+041.2E+035.7E+05
1.3E+039.8E+041.4E+051.8E+061.lE+05
7.6E-04l.OE-057.3E-065.5E-079.4E-06
Sn-113Sn-123Sn-125Sn-126Sb-124
1.3E+043.9E+042.OE+041.2E+053.8E+04
7.8E-052.6E-055.1E-058.4E-062.6E-05
5-10 U

,_0
Table 5-1, Continued
DCF DRLeRadionuclide rem per pCi * cm':. h
iCi - cm3* h
C..
Sb-126Sb-127Sb-129Te-127mTe-129
Te-129mTe-131rmTe-132TeII-132'Te-134
1-1251-129I-131I-132'1-133
1-1341-135Xe-131mXe-133Xe-133m
Xe-135Xe-135mXe-137Xe-138Cs-134
Cs-136Cs/Ba-137dCs-138Ba-133Ba-139
2.6E+049.5E+032.OE+032.6E+041.4E+02
2.9E+048.6E+031.2E+042.OE+047.OE+02
3.5E-051.2E-048.5E-055.0E-051.4E-03
3.OE+042.1E+055.3E+044.9E+031.5E+04
3.3E-054.8E-061.9E-052.OE-046.8E-05
3.9E-051.1E-045.OE-043.9E-057.OE-03
3.1E+038.1E+034.9E+OO2.OE+011.7E+O1
1.4E+022.5E+021.1E+027.2E+026.3E+04
3.3E-041.2E-042.0E-015.OE-025.9E-02
7.OE-034.1E-039.3E-031.4E-031.6E-05
1.8E+044.1E+041.6E+031.E+04
2.3E+02
5.6E-052.4E-056.1E-048.9E-054.4E-03
5-11

* Table 5-1, Continued
DCF . DRLcRadionuclide rem per ji * cm*3 * h
-iCi *cm3 h
Bai-140La-140La-141La-142Ce-141
5.3E+031.1E+047.3E+022.3E+031.1E+04
1.9E-048.8E-051.4E-034.3E-049.OE-05
2.1E-042.2E-062.2E+061.1E-042.7E-05
Ce-143Ce-144CetPr-144dNd-147Pm-145
Pm-147Pm-149Pm-151Sm-151Eu-152
Eu-154Eu-155Gd-153Th-160Ho-166m
4.7E+034.5E+054.5E+058.8E+033.7E+04
4.7E+043.6E+032.8E+033.6E+042.7E+05
3.5E+055.OE+042.9E+043.5E+049.4E+05
2.1E-052.8E-043.5E-042.8E-053.8E-06 012.9E-062.OE-053.4E-052.9E-051.1E-06
Tm-170Yb-169Hf-181Ta-182W-187
3.2E+041.1E+042.1E+046.OE+041.7E+03
3.8E+045.2E+039.9E+032.9E+031.6E+07
3.2E-058.9E-054.8E-051.7E-056.OE-04
2.7E-051.9E-041.OE-043.5E-046.1E-08
Ir-192Au-198Hg-203T1-204Pb-210
5-12 Q)

0. Table 5-1, Continued
DCF DRLCRadionuclide rem per pCi cm':' h
: pCi crn 3 * h
Bi-207Bi-210Po-210Ra-226Ac-227
Ac-228Th-227Th-228Th-230Th-232
3.1E+041.9E+04 .1.1E+071.OE+078.OE+09
3.7E+051.9E+074.1E+083.9E+082.OE+09
1.5E+097.9E+081.6E+081.6E+081.5E+08
1.5E+081.4E+082.7E+036.SE+083.6E+03
3.2E-055.3E-058.9E-089.7E-081.2E-10
2.7E-065.2E-082.4E-092.6E-095.1E-10
Pa-231U-232U-233U-234U-235
6.5E-101.3E-096.2E-096.3E-096.8E-090 .
U-236U-238U-240Np-237Np-239
Pu-236Pu-238Pu-239Pu-240Pu-241
Pu-242Am-241Am-242mAm-243Cm-242
6.6E-097.OE-093.,7E-041.5E-092.8E-04
1.7E+084.7E+085.2E+085.2E+089.9E+06
* 5.8E-092.1E-091.9E-091.9E-091.OE-07
4.9E+O85.3E+085.1E+085.3E+082.1E+07
2.OE-091.9E-092.OE-091.9E-094.8E-08
5-13

Table 5-1, Continued
DCF DRLCRadionuclide rem per ixCi * cmr3 - h
pCi cm3 h
Cm-243 3.7E+08 2.7E-09Cm-244 . 3.OE+08 3.4E-09Cm-245 5.5E+08 1.8E-09Cm-246 5.4E+08 1.9E-09Cf-252 1.9E+08 5.3E-09
'Sum of doses from external exposure and inhalation from the plume, and external exposure fromdeposition. "Dose" means the sum of effective dose equivalent from external radiation and committedeffective dose equivalent from intake.
bSee footnote a to Table 5-4 for assumptions on inhalation and footnote b to Table 5-5 for assumptionson deposition velocity. The quantity pCi- cinmh refers to the time-integrated air concentration at onemeter height.
'For 1 rem committed effective dose equivalent.
'aThe contribution from the short-lived daughter is included in the factors for the parent radionuclide.
'These factors should only be used in situations where 1.132 appears without the parent radionuclide.
Persons exposed to an airborneparticulate plume will receive dose toskin from beta emitters in the plumeas well as from those deposited on sldnand clothing. Although it is possible todetect beta radiation, it is not practical,for purposes of decisions on evacuationand sheltering, to determine dose toskin by field measurement of the betadose equivalent rate near the akinsurface. Such doses are determinedmore practically through calculationsbased on time-integrated lairconcentration, an assumed depositionvelocity, and an assumed time period
between deposition and skindecontamination. For the purpose ofevaluating the relative importance ofskin dose compared to the dose fromexternal gamma exposure andinhalation, dose conversion factorswere evaluated using a depositionvelocity of 1 cm/sec and an exposuretime before decontamination of 12hours. Using these* conservativeassumptions, it was determined thatskin beta dose should seldom, if ever,be a controlling pathway during theearly phase. Therefore, no DCFs orDRLs are listed for skin beta dose.
5-14 0.

C7)Table 5-2 Dose Conversion Factors (DCF) and Derived Response Levels (DRL)
Corresponding to a 5 rem Dose Equivalent to the Thyroid from Inhalationof Radioiodirie
DCF DRLRadionuclide rem per pCi.- cm3 -h
pCi*cm*h
Te/I-132b 2.9E+05 1.8E-05I-125 9.6E+05 5.2E-06I-129 6.9E+06 7.2E-071-131 1.3E+06 3.9E-061-132 7.7E+03 6.5E-04I-133 2.2E+05 2.3E-05I-134 1.3E+03 3.9E-031-135 3.8E+04 1.3E-04
'For a 5 rem committed dose equivalent to the thyroid.
O'he contribution from the shortlived daughter is included in the factors for the parent radionuclide.
0e_Because of large uncertainties in
the assumptions for' deposition, airconcentrations are an inadequate basisfor. decisions on. the need todecontaminate individuals. Fieldmeasurements shouldibe; used for this(See Chapter 7, Section 7.6.3.). Itshould be noted that, even in situationswhere the skin beta dose might exceed50 rem, evacuation would not usuallybe the appropriate protective action,because skin decontaraination andelothing changes are 'easily availableand effective. However, evacuationwould usually already be justified inthese situations due'. to dose frominhalation during plume passage.
The following example demonstratesthe use of the data in Tables 5-1 and 5-2 for a simple analysis involving threeradionuclides.
Based on source term andmeteorological considerations, it isassumed that the worst probablenuclear incident at an industrialfacility is a fire. that..could -disperseradioactive material into theatmosphere, yielding a time-integratedconcentration of radionuclides at anearby populated area, as follows:
RadionuclideZr-95Cs-1341-131
PCi- cm" - h2E-64E-8
1.2E-5
5-15

We examine whether evacuation iswarranted at these levels, based onPAGs of 1 rem for effective dose and 5rem for dose to the thyroid. We usethe DCFs in.Table 5-1 for effective doseand Table 5-2 for thyroid dose frominhalation of radioiodines to calculatethe relevant doses, H, as follows:
n
H=A DCF, x C,
where DCF1 = dose conversionfactor forradionuclide i,
C; = time-integratedconcentration ofradionuclide i,
and n -- the number ofradionuclidespresent.
For the committed effective doseequivalent (see Table 5-1):
(2 E-6 x 3.2E+4)+(4E-8 x 6.3 E+4)+(1.2E-5 x 5.3E+4) = 0.71 rem.
For the committed dose:equiva-lent to the thyroid (see Table 5-2):
1.2E-5 x 1.3E+6 = 16 rem.
The results of these calculationsshow that, at the location for whichthese time-integrated concentrationsare specified, the committed doseequivalent to the thyroid frominhalation would be over three timesthe PAG for dose to thyroid, thusjustifying evacuation. ' Usingmeteorological dilution factors, onecould calculate the additional distanceto which evacuation would be justified
to avoid exceeding the PAG for thyroiddose.
To use the DRLs from Table 5-1and 5-2, find the sum,
w Cia i
~DRLi
for both effective dose and thyroid dose,where DRL1 is the derived responselevel for radionuclide i, and C) isdefined above. If the sum in eithercase is equal to or greater than unity,evacuation of the general population iswarranted.
For effective dose (seeTable 5-1):
2E-6 + 4E-8 + 1.2E-5 00 73.2E-5 1.6E-5 1.9E-5
For dose to the thyroid (seeTable 5-2):
1.2E-5 =3.9E-6
It is apparent that these calculationsyield the same conclusions as thoseusing the DCFs.
5.4.3 Comparison with Previously-Recommended PAGs
Many emergency response planshave already been developed usingpreviously-recommenaed PAGs ""thatapply to the dose equivalent to thewhole body from direct (gamma)radiation from the plume and to thethyroid from inhalation of radioiodines.For nuclear power plant incidents, the
0
5-16

0. former PAG for whole body exposureprovides public health protectioncomparable to that provided by the newPAG expressed in terms of effectivedose equivalent. This is demonstratedin Table C-9 (Appendii C), whichshows comparative doses for nuclearpower plant fuel-melt: accidentsequences having a wide. range ofmagnitudes. The PAG f6r the thyroidis unchanged. On the other hand,application of these PAGs to alphaemitting radionuclides leads to quitedifferent derived response levels fromthose based on earlier health physicsconsiderations, because of new doseconversion factors and the weightingfactors assigned to the exposed organs(EP-88).
5.5 Protective Actions
This section provides guidance forimplementing the principal protectiveactions (evacuation and sheltering) forprotection against the various exposurepathways resulting from an airborneplume. Sheltering means the use ofthe closiest available structure whichwill provide protection from exposureto an airborne plume, and evacuationmeans the movement of individualsaway from the path of the plume.
Evacuation and' shelteringprovide different levels of dosereduction for the principal exposurepathways (inhalation of radioactivematerial, and direct gamma exposurefrom the plume or from materialdeposited on surfaces). Theeffectiveness of evacuation will depend
on many factors, such as how rapidly itcan be implemented and the nature ofthe accident. For accidents where theprincipal source of dose is inhalation,evacuation could increase exposure if itis implemented during the passage of ashort-term plume, since movingvehicles provide little protectionagainst exposure (DO-90). However,studies (NR-89a) continue to show that,for virtually all severe reactor accidentscenarios, evacuation during plumepassage does not increase the risk ofacute health effects above the riskwhile sheltering. Sheltering, which inmost cases can be almost immediatelyimplemented, varies in usefulnessdepending upon the type of release, the.shelter available, the duration of theplume passage, and climatic conditions.
Studies have been conducted toevaluate shelter (EP-78a) andevacuation (HA-75) as protectiveactions for incidents at nuclear powerfacilities. Reference EP-78b suggestsone method for evaluating andcomparing the benefits of these twoactions. This requires collectingplanning information before and datafollowing an incident, and usingcalculations and graphical means toevaluate whether evacuation,sheltering, or a combination ofsheltering followed by evacuationshould be recommended at differentlocations. Because of the manyinteracting variables, the user is forcedto choose between making decisionsduring the planning phase, based onassumed data that may be grosslyinaccurate, or using a time-consumingmore comprehensive process after the
..-. 5-17

incident when data may be available.In the former situation, the decisionmay not have a sound basis, whereasin the latter, the decision may come toolate to be useful.
The recommended approach is touse planning information for makingearly decisions. The planned responseshould then be modified following theincident only if timely detailedinformation is available to support suchmodifications.
The planner should first compilethe necessary information about theemergency planning zone (EPZ) aroundthe facility. For the case of powerreactors,,some of this information isdescribed in NUREG-0654 (NR-80). Itshould include identifying thepopulation distribution, the shelteringeffectiveness of residences and otherstructures, institutions containingpopulation groups that require specialconsideration, evacuation routes, logicalboundaries for evacuation zones,transportation systems,communications systems, and specialproblem -areas. In addition,. theplanner should identify the informationthat may be available following anincident, such as environmentalmonitoring data, meteorologicalconditions, and plant conditions. Theplanner should identify key data orinformation that would justify specificprotective actions. The evaluation andplanning should also include theselection of institutions where personsshould be.provided with stable iodinefor thyroid protection in situations
where radioiodine inhalation isprojected.
The following sections discuss keyfactors which affect the choice betweenevacuation and sheltering.
5.5.1 Evacuation
The primary objective of evacuationis to avoid exposure to airborne ordeposited radioactive material bymoving individuals away from the pathof the plume. Evacuation, if completedbefore plume arrival, can be 100percent effective in avoiding futureexposure. Even if evacuation coincideswith or follows plume passage, a largereduction of exposure may be possible.In any case, the maximum doseavoided by evacuation rill be the dosenot avoidable by sheltering.
Some general conclusionsregarding evacuation (HA-75) whichmay be useful for planning purposesare summarized below:
1. Advanced planning is essential toidentify potential problems that mayoccur in an evacuation.
2. Most evacuees use their ownpersonal transportation.
3. Most evacuees assume -theresponsibility of acquiring food andshelter for themselves.
4. Evacuation costs are highlylocation-dependent and usually will not
0-
-I
5-18

be a deterrent to carrying out anevacuation.
5, Neither panic nor hysteria hasbeen observed when evacuation of largeareas is managed by public officials.
6. Large or small population groupscan be evacuated effectively withminimal risk of injury or death.
7. The risk of injury or death toindividual evacuees from transporta-tion does not change as a function ofthe number of persons evacuated, andcan be conservatively estimated usingNational Highway Safety Councilstatistics for motor vehicle accidents(subjective information suggests thatthe risks will be lower).
Evacuation of the elderly, thehandicapped, and inhabitants ofmedical and other institutions maypresent special problems. Whensheltering can provide adequateprotection, this will often be theprotective action of choice. However, ifthe general public is evacuated andthose in institutions are sheltered,there is a risk that attendants at theseinstitutions may leave and make laterevacuation of institutionalized personsdifficult because of a lack ofattendants. Conversely, if evacuationof institutions is attempted duringevacuation of the public, traficconditions may cause unacceptabledelays. If evacuation of institutions isattempted before evacuating the public,increased risk to the public from adelayed evacuation could occur, unlessthe incident is very slow in developing
to the point of an atmospheric release.Because of the above difficulties,medical and other institutions locatedwithin the EPZ should be evaluated todetermine whether there are anylogical categories of persons thatshould be evacuated after the public(or, when time permits, before).
5.5.2 Sheltering
Sheltering refers here to the use ofreadily available nearby structures forprotection against exposure to anairborne plume.
Sheltering may be an appropriateprotective action because:
1. It positions the public to receiveadditional instructions when thepossibility of high enough doses tojustify evacuation exists, but is small.
2. It may provide protection equal toor greater than evacuation.
3. It is less expensive and disruptivethan evacuation.
4. Since it may be implementedrapidly, sheltering may be theprotective action of choice if rapidevacuation is impeded by, a) severeenvironmental conditions-e.g. severeweather or floods; b) healthconstraints-e.g. patients and workersin hospitals and nursing homes; or c)long mobilization times--certainindustrial and farm workers, orprisoners and guards; d) physical
5-19

constraints to evacuation--e.g.inadequate roads.
5. Sheltering may be more effectiveagainst inhalation of radioactiveparticulates than against externalgamma exposure, especially for short-term plumes.
The use of large structures, such asshopping centers, schools, churches,and commercial buildings, as collectionpoints during evacuation mobilizationwill generally provide greaterprotection against gamma radiationthan use of small structures.
As with evacuation, delay.in takingshelter during plume passage willreduce the protection from exposure toradiation. The degree of protectionprovided by structures is governed byattenuation of gamma radiation bystructural components (the mass ofwalls, ceilings, etc.) and byoutside/inside air-exchange rates.
If external dose from the plume orfrom deposited materials is thecontrolling criterion, shelterconstruction and shelter size are themost important considerations;ventilation control and filtering are lessimportant. Although sheltering willreduce the gamma exposure rate fromdeposited materials, it is not a suitable
.. protective action for this pathway .forlong duration exposure. The mainfactors which reduce whole bodyexposure are:
1. Wall materials and thickness andsize of structure,
2. Number of stories overhead, and
3. Use of a central location withinthe structure.
If a major release of radioiodine orrespirable particulate materials occurs,inhalation dose will be the controllingpathw'ay. For releases consistingprimarily of noble gases, externalgamma exposure will be mostimportant. However, when inhalationis the primary exposure pathway,consideration should be given to thefollowing
1. Ventilation control is essential foreffective sheltering.
2. Dose reduction factors forsheltering can be improved in severalways for the inhalation pathway,including reducing air exchange ratesby sealing cracks and openings withcloth or weather stripping, tape, etc.Although the risk to health from theaction could be a constraint(particularly for infants and theinfirm), using wet towels orhandkerchiefs as a mask to filter theinhaled air will reduce dose frominhalation.
0_
3. Following plume passage, peopleshould open shelters to reduce airborneactivity trapped inside, and they shouldleave high exposure areas as soon aspossible after cloud passage to avoidexposure to deposited radioactivematerial.4. Consideration should be given tothe prophylactic administration ofpotassium iodide (KI) as a
5-20 0
thyroid-blocking agent to 'workersperforming emergency services andother groups in accordance with thePAGs in Table 2-1 and the provisionsin reference FD-82.3
5.5.3 General Guidance for Evacuationand Sheltering
The process of evaluating,recommending, and implementingevacuation or shelter for the.public isfar from an exact science, particularlyin view of time constraints that preventthorough analysis at the time of anincident. Their effectiveness, however,can be improved considerably byplanning and testing. Early'decisionsshould be based on informationcollected from the emergency planningzone during the planning phase and oninformation regarding conditions at thenuclear, facility at the time of theincident. Best estimates of 'doseprojections should be used for decisionsbetween evacuation and sheltering.
The following is a summary ofplanning1 guidance for evacuation andsheltering, based on the information inSections 5.5.1 and 5.5.2.
1. For severe incidents, where PAGsmay be significantly exceeded,
'Each State has the responsibility forformulating guidance to define when (and if)the public should be given potassium iodide.Planning for its use is discussed in"PotassiumIodide as a Thyroid-blocking Akent in aRadiation Emergency: Final Recommendationson Use" (FD-82).
evacuation may be the only effectiveprotective action close to the facility.
2. Evacuation will provide totalprotection from any airborne release ifit is. completed before arrival'of theplume.
3. Evacuation may increase exposureif carried out during the plumepassage, for accidents involvinginhalation dose as a major contributor.
4. Evacuation is also appropriate forprotection from groundshine .in areaswith high exposure rates fromdeposited materials.
5. Sheltering may be appropriate(when available) for areas notdesignated for immediate evacuationbecause:
a. It positions the public to receiveadditional instructions; and
b. It may provide protection equal toor greater than evacuation.
6. Sheltering is usually notappropriate where high doses areprojected or for exposure lasting longerthan two complete air exchanges of theshelter.
7. Because sheltering may beimplemented in less time thanevacuation, it may be the temporaryprotective action of choice if rapidevacuation is impeded by a) certainenvironmental conditions-e.g. severeweather or floods; b) healthconstraints--e.g. patients and workers
CI
5-21

in hospitals and nursing homes; or c)long mobilization times--e.g. certainindustrial and. farm workers, orprisoners and guards; d) physicalconstraints- to evacuation--e.g.inadequate roads.
8. If a major release of radioiodine orparticulate materials occurs, inhalationdose may be the controlling criterionfor protective actions. In this case:
a. Breathing air filtered throughcommon household items (e.g.,fclded wet handkerchiefs or towels)may be of significant help, ifappropriate precautions are takento avoid possible suffocation.
b.: After confirmation that -theplume has passed, shelters shouldbe opened to avoid airborne activitytrapped inside, and persons shouldleave high exposure areas as soonas -possible after cloud passage toavoid exposure to depositedradioactive material.
c. Consideration should be given tothe prophylactic administration ofpotassium iodide (KI) as athyroid-blocking agent to emergencyworkers, workers in criticalindustries, or others in accordancewith the PAGs in Table 2-1 andreference FD-82.
9. If dose from external gammaradiation is the controlling criterion,shelter construction and size are themost important considerations;ventilation control and filtering are lessimportant. The main factors 'which
reduce whole body external dose are; a)wall thickness and size of structure, b)number of stories overhead, c) centrallocation within the structure, and d)the height of the cloud with respect tothe building.
5.6 Procedures for Calculating DoseConversion Factors
This section provides informationused in the development of the DCFs inTables 5-1 and 5-2. Three exposurepathways are included: whole ..bodyexposure to gamma radiation from'theplume, inhalation from the plume, andwhole body exposure - -to gammaradiation from deposited materials.Although exposure of the skin"frombeta radiation could be significant,evaluations show that other exposurepathways will be controlling forevacuation and sheltering decisions.Therefore, DCFs for skin are notprovided. Individual DCFs for thethree exposure pathways are providedin the following sections. -They areeach expressed in terms of the time-integrated air concentration so thatthey may be combined to yield acomposite DCF for each radionuclidethat reflects all three pathways. Thesedata may be used to facilitate revisingthe DCFs in Tables 5-1 and 5-2 whenmore specific or technically improvedassumptions are available,-as .well.as -toevaluate the relative importance of theindividual pathways for specificradionuclide mixes.
0B
) -: 1I _:;;
5-22

Th 5.6.1 External Exposure to GammaRadiation from the Plume
Table 5-3 provides DCFs and DRLsfor exteinal exposure to:; gammaradiation due to immersion inconitiminated -air. The values forgamma radiation will' provideconservative estimates for exposure toan overhead plume. They are derivedunder the assumption that the plumeis correctly approximated by a semi-infinite source.
The DCFs given in Table 5-3 are usedto calculate the effective doseequivalent from external exposure togamma radiation from, the plume.They are based on dose-rate conversionfactors for effective dose in Table A.1 ofreference DO-88. The units given inTable A.1 are converted to those inTable 5-3 as follows:
of radioactive particulate materials andfor committed dose equivalent to thethyroid due to inhalation ofradioiodines. It is assumed that theradionuclides are in the chemical andphysical form that yields the highestdose, and that the particle size is onemicrometer mean aerodynamicdiameter. For other chemical andphysical forms of practical interest thedoses may differ, but in general only bya small factor. If the chemical and/orphysical form (e.g. solubility class orparticle size) is known or can bepredicted, the DCFs for inhalationshould be adjusted as appropriate.
The dose factors and breathing rateused to develop the DCFs in Table 5-4are those given in Table 2.1 of FederalGuidance Report No.11 and werederived for "standard man" (EP-88).Although the DCFs for someradionuclides would be slightly higherfor children, the conservatism in thePAGs and procedures for theirapplication provide an adequate marginfor safety. The advantage of using asingle source of current data for thedevelopment and timely 'revision ofDCFs for these and any other relevantradionuclides is also a consideration inthe selection of this data base for usein emergency response applications.
The units given in Table 2-1 of EP-88are converted to the units in Table 5-4,using a breathing rate of 1.2E+6 cms -h'', by the factor
Sv.Bq7' * 4.4E+12 = rem peruci- cm h.
(-I, . .-_
mrem *y- 1 x 0.1142 =PCi *m 43
rempCi *cm4 *-h
Only the short-lived daughters of Ru-106 and Cs-137 emit gamma radiationand, therefore, the DCFs from TableA.1 for these entries are attributable totheir daughters. The DCF for Ce-144is combined with that for its short-liveddaughter, it is assumed they are inequilibrium. Since the DRLs apply toa PAG of 1 rem, they are simply thereciprocals of the DCFs.
5.6.2 Inhalation from the Plume
Table 5-4 provides DCFs and DRLsfor committed effective dose equivalentdue to inhalation of an airborne plume
5-23

The DRLs are simply the reciprocal ofthe DCF.
5.6:3 External Dose from DepositedMaterials
Table 5-5 provides DCFs and DRLsfor 4-day exposure to gamma radiationfrom selected radionuclides followingdeposition of particulate materials onthe ground from a plume. Thedeposition velocity (assumed to be 1cm/s for iodines and 0.1 cm/s for otherparticulate materials) could varywidely depending on the physical andchemical characteristics of thedeposited material and the surface, andmeteorological conditions. In the caseof precipitation, the amount ofdeposition (and thus the doseconversion factors for this exposurepathway) will be much higher. Toaccount for the ingrowth of short-liveddaughters in deposited materials aftermeasurements are made, the tabulatedvalues include their contribution todose over the assumed 4-day period ofexposure. Because the depositionvelocity can be much lower or higherthan assumed in developing the dose.conversion factors for depositedmaterials, decision makers arecautioned to pay particular attention toactual measurements of gammaexposure from deposited materials forevacuation decisions after plumepassage.
deposited radioactive materials. Inorder to be able to sum the doseconversion factors with those for otherexposure pathways, the DOF isexpressed in terms of dose per unittime-integrated air concentration,where the deposition from the plume isassumed to occur at approximately thebeginning of the incident. Thefollowing equation was used togenerate Table 5-5:
DCF = Vg- DCRF - 1.14E-3[ 1- ]
Where:DCF= the dose per unit air
concentration (pCi- cm - h)V,= the deposition velocity,
assumed to be 3600 cm- h 'for iodines and 360 cm- h-1for other particulatematerials
DRCF = the dose rate conversionfactor (mrem- y" per)xCi mn2) (DO-88)
1.14E-3 = a factor convertingmrem, y' per m2 torem- hIl per cmF
X = the decay constant for theradionuclide (h*')
t = duration of exposure(hours),assumed to be 96hours (4 days)
0
0~)
The objective is to calculate DCFs forsingle radionuclides in terms ofeffective dose equivalent from 4 daysexposure to gamma radiation from
35-24

.0Table 5-3 Dose Conversion Factors (DCF) and Derived Response Levels (DRL) for
External Exposure Due to Immersion in Contaminated Air
DCP DRLbRadionuclide rem per piCitnrh
pCi *cm* h
H-3C-14Na-22Na-24P-32
P-33S-35C1-36K-40K42
O.OE+00O.OE+001.3E+032.7E+03O.OE+00
O.OE+00O.OE+007.8E-043.7E-04O.OE+00
O.OE-+00O.OE+004.8E-069.2E+011.7E+02
O.OE+00O.OE+002.1E+051.1E-026.OE-03
0Ca-45Sc-46Ti-4V-48Cr-51
9.3E-091.2E+037.7E+011.7E+031.8E+01
1.1E+088.4E-041.3E-025.8E-045.6E-02
Mn-54Mn-56Fe-55*Fe-59Co-58
Co-60Ni-63Cu-64Zn-65Ge-68
Se-75Kr-85Kr-85mKr-87Xr-88
5.OE+021.1E+031.SE-027.OE+025.8E+02
2.OE-039.4E-047.6E+011.4E-031.7E-03
1.5E+03O.OE+001.1E+023.4E+025.2E-02
6.7E-04O.OE+009.2E-032.9E-031.9E+01
2.3E+021.3E+009.3E+015.1E+021.3E+03
4.4E-037.8011.1E-022.OE-037.8E-04
el 5-25
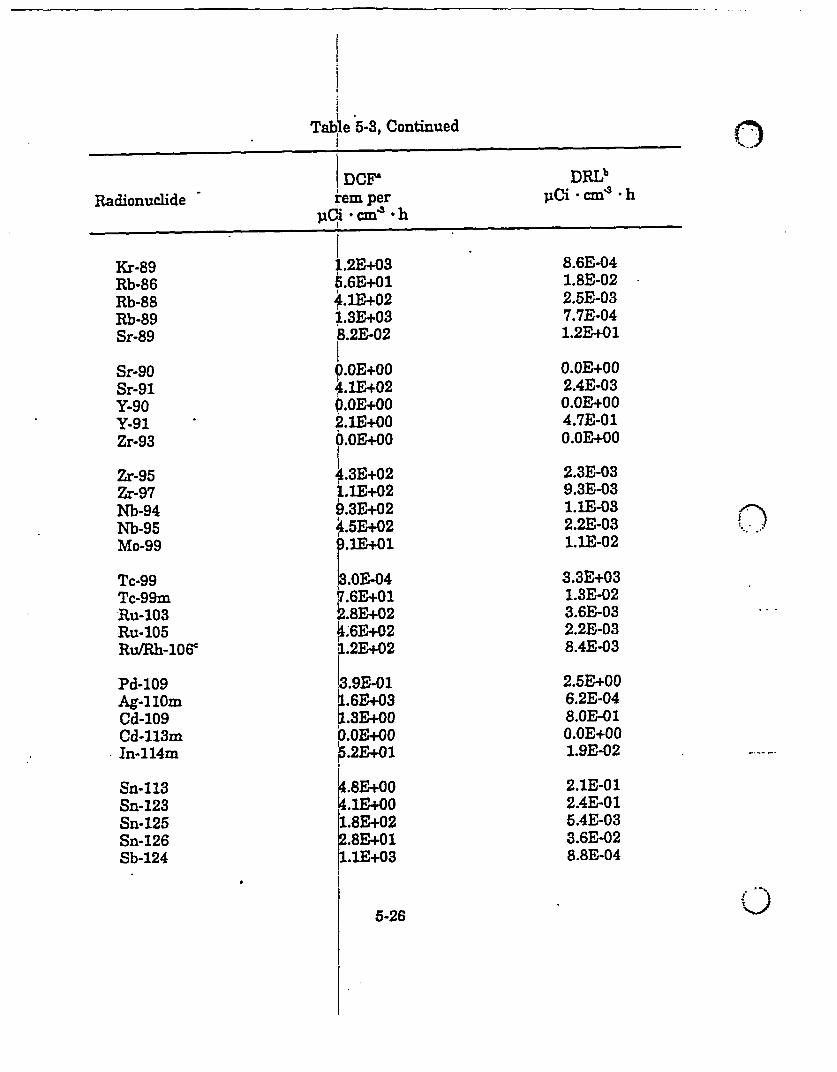
Tabie 5.3, Continued 0CI DCF DRILb
Radionuclide i rem per iCi cm * hIICi * cm 4 h
Kr-89Rb-86Rb-88Rb-89Sr-89
Sr-90Sr-91Y-90Y-91Zr-93
Zr-95Zr-97Nb-94Nb-95Mo-99
Tc-99Tc-99mRu-103Ru-105RuARh-106'
Pd-109Ag-llOmCd-109Cd-113mIn-114m
Sn-113Sn-123Sn-125Sn-126Sb-124
p.2E+035.6E+014.1E+021.3E+03~.2E02
9.OE+OO4.1E+029.OE+OO2.1E+OOO.OE+O0
0.3E+021.1E+02b.3E+024.5E+02
.1E+01
.OE-04p.6E+01
2.8E+0241.6E+021.2E+02
8.6E-041.8E-022.5E-037.7E-041.2E+01
O.OE+002.4E-03O.OE+O04.7E-01O.OE+O0
2.3E-039.3E-031.lE-032.2E-031.1E-02
3.3E+031.3E-023.6E-032.2E-0384E-03
2.5E+006.2E-048.OE-O1O.OE+001.9E-02
3.9E-011.6E+031.3E+OOO.OE+OO5.2E+01
4.8E+OO4.1E+OO1.8E+022.8E+011.lE+03
2.1E-012.4E-015.4E-033.6E-028.8E-04
.U5-26

0 Table 5-3, Continued
i . .
I DCFa DRLbRadionuiclide I rem per pCi * cmo3 - h
_ pCi * cm -h
Sb-126Sb-127Sb-129Te-127mTe-129
Te-129mTe-131mTe-132Te-1341-125
I-1291-1311-132I-133I-134
I-135Xe-131mXe-133Xe-133mXe-135
Xe-135mXe-137Xe-138Cs-134Cs-136
Cs/Ba-137'Cs-138Ba-133Ba-139Ba-140
1.6E+033.9E+028.6E+021.8E+003.1E+01
2.OE+018.5E+021.2E+025.1E+026.3E+00
4.8E+002.2EE+021.4E+033.5E+021.6FE+03
9.5E+024.9E+002.OE+011.7E+011.4E+02
2.5E+021.1E+027.1E+029.1E+021.3E+03
3.5E+021.4E+032.1E+022.1E+011.1E+02
6.2E-042.6E-031.2E-035.6E-01.3.2E-02
5.1E-021.2E-038.OE-032.0E-031.6E-01
2.1E-O14.6E-037.4E-042.9E-036.4E-04
1.1E-032.0E-015.OE-025.9E-027.OE-03
4.1E-039.2E-0314E-031.1E-037.8E-04
2.9E-036.9E-044.8E-034.9E-029.3E-03
5-27

Table 5-3, Continued
0I
I DCF DRIbRadionuclide rem per lCi. cm 3 h
Ci - cm3 * h. S I
La-140La-141La-142Ce-141Ce-143
Ce-144CefPr-144cNd-147Pm-145Pm-147
Pm-149Pm-151Sm-151Eu-152Eu-154
Eu-155Gd-153Tb-160Ho-166mTm-170
Yb-169Hf-181Ta-182W-187Ir-192
Au-198Hg-20311-204Pb-210Bi-207
1.4E+032.5E+011.8E+034.4E+011.5E+02
7.1E-043.9E-025.6E-042.3E-026.6E-03
1.OE+013.1E+017.6E+019.5E+002.1E-03
6.7E+oo1.9E+025 .2E-046.7E+027.4E+02
9.7E-023.2EB02.1.3E-021.OE-014.8E+02
1.5E-015.2E-031.9E+031.5E-031.3E-03
1�,
3.3E+011i 5.1E+01
6.4E+029.4E+022.7E+00
1.6E+023.1E+02
i 7.6E+021 2.7E+02
4.7E+02
2.3E+021.3E+025.8E-017.6E-019.1E+02
3.1-022.OE-021.6E-031.1E-033.8E-01
6.1B-033.2E-031.3E-033.6E-032.1E-03
4.3E-037.6E-031.7E+001.3E+001.1E-03
5-28

0-. Table 5-3, Continued
I DCr DRIb
Radionuclide .rem per pci * cmn3 * hpCi * cm9 * h
Bi-210Po-210Ra-226Ac-227Ac-228
Th-227Th-228Th-230Th-232Pa-231
O.OE+OO5.1E033.9E+007.2E-025 .5E+02
O.OE+002.OE+022.6E-011.4E+011.8E-03
s' .6.OE+011.1E+002.2E-01l.lE-011.7E+01
1.7E-028.9E-014.5E+009.4E+005.8E-02
C)U-232U-233U-234U-235U-236
1.5E-011.E-018.7E-028.8E+O16.9E-02
6.6E+007.3E+00l.1E+011.1E-021.4E+01
U-238U-240Np-237Np-239Pu-236
- - Pu-238Pu-239Pu-240Pu-241Pu-242
Am-241Am-242mAm-243Cm-242Cm-243
5.9E-024.1E-011.3E+O19.6E+016.8E-02
1.7E+012.4E+007.6E-021.OE-021.5E+01
5.0E-024.7E-024.9E-02O.OE+004.2E-02
2.OE+012.1E+012.OE+01O.OE+002.4E+01
I 1.1E+012.7E-012.9E+015.6E-027.3E+01
9.2E-023.7E+003.4E-021.8E+011.4E-02
o,5-29

ble 5-3, Continued ON)%
DCP DRLbRadionuclide I rem per ,iCi * cm4 * h
PCi cmz * h
Cm-244 1 4.8E-02 2.1E+01Cm-245 [4.1E+O1 2.5E-02Cm-246 14.OE-02 2.5E+01Cf-252 ! 4.3E-02 2.3E+01
'DCFs are expressed in terms of commilreference (DO-88).
ed effective dose equivalent and are based on data from
bAssumes a PAG of one rem committed effective dose equivalent.
'The contribution from the short-lived d.radionuclide.
ktghter is included in the factors for the parent
C.
U5-30

0Table 5-4 Dose Conversio
Doses Due to Iia Factors (DCF) and Derived Response Levels (DRL) forkhalation
Lung I DCF DRIbRadionuclide Class I rem per pCi cm- h
It pCi cm' -hI
H1-3C-14Na-22Na-24P-32
VrL ORDDw
rn~7.7E+012.5E+039.2E+031.5E+031.9E+04
P-33S-35C0-36K-40K-42
wwwDD
Ca-45Sc-46Ti-44V-48Cr-51
wyywyC;
Mn-54Mn-56Fe-55Fe-59Co-58
wDDDy
2.8E+033.OE+032.6E+041.5E+O41.6E+03
7.9E+033.6E+041.2E4061.2E+044.OE+02
8.OE+034.5E+023.2E+031.8E+041.3E+04
2.6E+057.5E+033.3E+022.4E+046.2E+04
1.OE+047.9E+031.OE+025.2E+015.OE+04
1.3E-024.OE-041.IE-046.9E-045.4&05
3.6E-043.4E-043.8E-056.7E-056.1E 04
1.3E-042.8E-058.2E-078.2E-052.5E-03
1.2E-042.2E-033.1E-045.6E-057.7E-05
3.8E-061.3E-043.OE-034.1E-051.6E-05
9.8E-051.3E-04I.OE-021.9E-022.OE-05
Co-60Ni-63Cu-64Zn-65Ge-68
yVapoyyw
r
Se-75Rb-86Rb-88Rb-89Sr-89
wDDDy
0 D 5-31

I
T~abl ,a 54, Continued.
Lung | I DCF DRLbRadionucide Class i rem per aCi - cm h
_I_|_Ci 4 u i m -h
Sr-90Sr-91Y-90Y-91Zr-93
Zr-95Zr-97Nb-94Nb-95Mo-99
Tc-99Tc-99mRu-103Ru-105Ru/Rh-106l
Pd-109Ag-ll0mCd-109Cd-113mIn-114m
Sn-113Sn-123Sn-125Sn-126Sb-124
Sb-126Sb-127Sb-129Te-127mTe-129
yyyyD
Dyyyy
wDyyy
YYDDD
wwwwwwwwwD
1.6FE+06-2.OE+03l.OE+045.9E+043.8E+05
2.8E+045.2E+035.OE+057.OE+034.8E+03
l.OE+043.9E+O1l.lE+045.5E+025.7E+05
1.3E+039.6E+041.4E+051.8E+06l.lE+05
1.3E+043.9E+041.9E+041.2E+053.OE+04
1.4E+047.2E+037.7E+022.6E+04l.1E+02
6.4E-075.OE-049.9E-051.7E-052.6E-06
3.5E-051.9E-042.OE-061.4E-042.1E-04
1.OE-042.6E-029.3E-051.8E-031.7E-06 0..
*7.6E-04l.OE-057.3E-065.5E-079.4E-06
7.8E-052.6E-055.4E-058.4E-063.3E-05
7.1E-051.4E-041.3E-033.9E-059.3E-03
5-32,) ,N

i .
C) Table 5-4, Continued.
Lung | I DCF DRLbRadionuclide Class : I rem per paCi * cm * h
I | PCi * cm"3 h
Te-129mTe-131mTe-132TelI-132'Te-134
I-1251-129I-131I-1321-133
1-134I-135Cs-134Cs-136Cs/Ba-137"
.0...
Cs-138Ba-133Ba-139Ba-140La-140
La-141La-142Ce-141Ce-143Ce-144
Ce/Pr-144'Nd-147Pm-145Pm-147Pm-149
HD
:1DD
D
DD .1
DDDiD�I
DDy:I
y
y .1yyY iiy
2.9E+047.7E+031.1B+041.2E+041.5E+02
2.9E+042.1E+053.9E+044.6E+027.OE+03
1.6E+021.5E+035.6E+048.8E+033.8E+04
1.2E+029.4E+032.1E+024.5E+035.8E+03
7.OE+023.OE+021.1E+044.1E+034.5E+05
4.5E+058.2E+033.7E+044.7E+043.5E+03
3.5E-051.3E-048.8E-058.5E-056,5E-03
3.4E-054.8E-062.5E-052.2E-031.4E-04
6.3E-03*6.8E-041.8E-051.1E-042.6E-05
8.2E-031.1B-044.9E-032.2E-041.7E-04
1.4E-033.3E-039.3E-052.5E-042.2E-06
2.2E-061.2E-042.7E-052.1B-052.8E-04
5-33

Tab] le5-4, Continued. 07-i.
Lung ,I DCF DRLbRadionuclide Class rem per pCi cm3 *h
Ci *cm *h
Pm-151Sm-151Eu-152Eu-154Eu-155
Gd-153Tb- 160Ho-166mTm-170Yb-169
Hf-181Ta-182W-187Ir-192Au-198
Hg-203TI-204Pb-210Bi-207Bi-210
ywwwwDwwwy
DyDyy
DDDwD
2.1E+033.6E+042.7E+053.4E+055.OE+04
2.9E+043.OE+04
j 9.3E+053.2E+049.7E+03
1.9E+045.4E+047.4E+023.4E+043.9E+03
8.8E+032.9E÷031.6E+072.4E+041.9E+04
1.lE+071.OE+078.OE+093.7E+051.9E+07
4.1E+083.9E+082.OE+091.5E+097.9E+08
4.8E-042.8E-053.8E-062.9E-062.OE-05
3.5E-053.3E-05l.lE-063.2E-05l.OE-04
5.4E-051.9E-051.3E-033.OE-052.5E-04
1.IE-043.5E-046.1E-084.2E-055.4E-05
8.9E-089.7E-081.2E-1o2.7E-065.2E-08
2.4E-092.6E-095.1E-106.5E-101.3E-09
a. .
Po-210Ra-226Ac-227Ac-228Th-227
D
Th-228Th-230Th-232Pa-231IJ-232
VYDDDy 1
y
W "t
w
wwy
5-34

I1
IiTable 5-4, Continued.
0.1L mg DCF DRIb
Radionuclide Class . rem per pCi * cm73 - h- i 1pCi cmq - h
. ~. .
C,)
U-233U-234U-235U-236U-238
U-240Np-237Np-239Pu-236Pu-238
Pu-239Pu-240Pu-241Pu-242Am-241
Am-242mAm-243Cm-242Cm-243Cm-244
Cm-245Cm-246Cf-252
Te/I-132I-1251-129I-131
yyyyy
ywwwwwwwwww *!
wwwwww1y
* .1
1.6E+081.6E+081.6E+081.5E+081.4E+08
2.7E+036.5E+083.OE+031.7E+084.7E+08
5.2E+085.2E+089.9E+064.9E+085.3E+08
5.1E+085.3E+082.1E+073.7E+O83.OE+08
5.5E+085.4E+081.9E+08
6.2E-096.3E-096.8E-096.6E-097.OE-09
3.7E-041.5E-093.3E-045.8E-092.1E-09
1.9E-091.9E-091.OE-072.OE-091.9E-09
2.OE-091.9E-094.8E082.7E-093.4E-09
1.8E-091.8E-095.3E-09
Thyroid Dose
0
DD :D
2.9E+059.6E+056.9E+061.3E+06
1.8E-055.2E-067.2E-073.9E-06
5-35

Table 5-4, Continued. n..
Lung DCF DRLbRadionuclide Class rem per iCi cmt' * h
pCi - cm h
I-132 D 7.7E+03 6.5E-041-133 D 2.2E+05 2.3E-05I-134 D 1.3E+03 3.9E-03I-135 D S.8E+04 1.3E-04
*- -- i .,0r
'These factors and levels apply to adults (IC-75) and are based on Federal Guidance Report No. 11(EP-88). They are also based on the lung class that results in the most restrictive value. DCFs areexpressed in terms of committed effectiv'edose equivalent, except for those for thyroid dose, whichare in terms of committed dose equivvaleinL
bDRLs are based on a dose of 1 rem committed effective dose equivalent, except those for thyroiddose radionuclides, which are based on a 6ommitted dose equivalent of 5 rem.
'V denotes water vapor.
'L ORG C denotes labelled organic compounds.
'Contributions from short-lived daughter5 are included in the factors for parent radionuclides.
5-36

n Table 5-5 Dose Conversion Factors (DCF) and Derived Response Levels (DRL)for a 4-Day Exposire to Gamma Radiation from DepositedRadionuclides'm
: DCFb DRLbIRadionuclide rem per Ci . cm3 h
' . pCi -cm 4 *h
H-3C-14Na-22Na-24P-32
O.OE+00O.OE+OO8.3E+033.1E+03O.OE+00
O.OE+00O.OE+001.2E-043.2E-04O.OE+00
P-33S-35Cl-36K-40K-42
O.OE+00O.OE+OO1.8E-045.4E+021.8E+02
O.OE+OOO.OE+005.4E+031.9E-035.7E-03
0)Ca-45Sc-46Ti-4V-48Cr-51
8.4E-077.5E+036.7E+021.OE+041.3E+02
3.3E+032.4E+028.7E-014.2E+033.8E+03
1.2E+061.3E-041.5E-031.OE-047.8E-03
Mn-54Mn-56Fe-55Fe-59Co-58
Co-60Ni-63Cu-64Zn-65Ge-68
Se-75Rb-86Rb-88Rb-89Sr-89
3.OE-044.1E-031.lE+OO2.4E-042.6E-04
.
8.9E+03O.OE+001.5E+022.1E+034.5E+00
1.7E+033.3E+021.OE+012.9E+015.2E-01
5.37
1.1E-04O.OE+006.8E-034.7E-042.2E-01
5.9E-043.OE-039.8E-023.4E-021.9E+oO
0):: ::* .
.:
. . .

Radionuclide
Sr-90Sr-91Y-90Y-91Zr-93
Zr-95Zr-97Nb-94Nb-95Mo-99
Tc-99Tc-99mRu-103Ru-105RuIRh-106d
Pd-109Ag-ll0mCd-109Cd-113mIn-114m
Sn-113Sn-123Sn-125Sn-126Sb-124
Sb-126Sb-127Sb-129Te-127mTe-129
Table 5-5, Continued.
DCFbrem per
pCi * n * h
O.OE+OO3.8E+02O.OE+OO1.SE+O1O.OE+OO
2.9E+031.7E+026.SE+032.9E+034.OE+02
2.5E-035.3E+O11.9E+032.1E+02
'8.3E+02
5.6E-O11.2E+023.7E+O1O.OE+OO3.8E+02
5.9E+Ol2.6E+O11.OE+032.4E+026.8E+03
9.9E+03l.9E+03S.7E+022.6E+O13.9E+OO
5-38
DRLbhcpCi * cm;' * h
O.OE+OO2.6E-03O.OE+OO7.8E-02O.OE+OO
3.5E-045.8E-031.6E-043.4E-042.5E-03
4.OE+02l.9E-025.2E-044.7E-031.2E-03
0--1.8E+OO8.2E-032.7E-02O.OE+OO2.7E-03
1.7E-023.9E-02l.OE-034.1E-031.5E-04
l.OE-045.2E-042.7E-033.8E-022.6E-O1
0: .-

C I Table 5-5, Continued.
: . .DC~I DRLVX
Radionulide rem per jICi cm' * hpCi ' c3 .h
Te-129mTe-131mTe-132Te/I-132dTe-134
1-1251-129I-1311-132I-133
1-134I-135Cs-134Cs-136Cs/Ba-137d
Cl-Cs-138Ba-133Ba-139Ba-140La-140
La-141La-142Ce-141Ce-143Ce-144
Ce/Pr-144dNd-147Pm-145Pm-147Pm-149
9.5E+028.7E+021.3E+043.1E+037.3E+03
1.OE-031.2E-037.4E-053.2E-0414E-04
1.3E+035.7E+036.2E+037.6E+032.4E+03
7.5E-041.8E-041.6E-041.3E-044.1E-04
1.4E+023.5E+016.6E+026.7E+033.8E+01
7.2E-03. 2.8E-02
1.5E-031.SE-042.7E-02
6.8E+011.7E+033.2E+007.OE+024.1E+03
8.9E+002.3E+023.3E+024.8E+028.5E+01
1.5E-026.1E-043.1E-011.4E-032.4E-04
1.1E-014.3E-033.OE-032.1E-031.2E-02
2.OE+025.2E+021.1E+021.6E-022.8E+01
5.OE-031.9E-038.7E-036.2E+013.6E-02
0 5-39

I 7able 5-5, Continued. 10i..
DCF4 DRL4$Radionuclide rem per PCi cm" x * h
', PCi * cm-3 * h
Pm-151Sm-151Eu-152Eu-154Eu-155
Gd-153Tb-160*Ho-166mTm-170Yb-169
Hf-181Ta-182W-187Ir-192Au-198
.Hg-203T1-204Pb-210Bi-207Bi-210
Po-210Ra-226Ac-227Ac-228Th-227
Th-228Th-230Th-232Pa-231'U-232
�i
5.5E+022.1E-021.5E+O14.8E+032.8E+02
1.8E-034.9E+O16.7E-022.1E-043.5E-03
5.OE+024.1E+036.5E+032.4E+O11.3E+03
2.2E+034.8E+036.6E+023.4E+031.1E+03
9.6E+02'5.1E+OO1.22E+Ol6.OE+03'O.OE+OO
2.OE-032.4E-041.5E-04'4.1E-027.4E-04
4.5E-042.1E-041.5E-033.OE-049.5E-04 0l.OE-032.OE-O18.5E-0217E-04O.OE+OO
3.OE+O13.3E-021.2E+OO3.OE-032.3E-03
p .
i
3.4E-023.OE+O18.4E-O13.3E+024.3E+02
-1.lE+O1-3.6E+OO'2.6E+OO1.4E+024.1E+OO
9.2E-022.8E-O13.8E-O17.1E-032.5E-O1
(U.5-40

0 Table 5-5, Continued.
DCFb DRLbORadionuclide rem per iCi - cm 3 * h
pCi * cmt. h
U-233 2.OE+00 5.1E-01U-234 3.2E+00 3.1E-01U-235 6.7E+02 1.5E-03U-236 2.9E+00 3.5E-01U-238 2.5E+00 3.9E-01
U-240 3.3E+00 3.OE-01Np-237 1.3E+02 7.8E-03Np-239 4.5E+02 2.2E-03Pu-236 3.9E+00 2.6E-01Pu-238 3.4E+00 3.OE-01
Pu-239 1.5E+00 6.7E-01Pu-240 3.2E+00 3.1E-01Pu-241 O.OE+00 O.OE+00Pu-242 2.7E+00 3.7E-01Am:241 1.2E+02 8.5E-03
Am-242m 1.1E+01 9.2E-02Am-243 2.6E+02 3.8E-03Cm-242 3.7E+00 2.7E-01Cm-243 5.8E+02 1.7E-03
'Cm-244 3.3E+00 3.1E-01
Cm-245 3.4E+02 3.OE-03Cm-246 2.9E+00 3.5E-01Cf-252 2.5E+OO 4.OE-01
'Entries are calculated for gamma exposure at 1 meter above the ground surface (DO-88).
bAll radioactivity is assumed to be deposited at the beginning of the incident. Deposition'velocitiesare taken as 1 cm- sec" for radioiodines and 0.1 cm- sec' for other radionuclides. (See p. 5-24).
'Assumes a PAG of 1 rem committid effective dose equivalent.
dContributions from short-lived daughters are included in the factors for parent radionuclides.
0: 5-41

References
DO-88 U.S. Department of Energy. 'ExiternalDose-Rate Conversion Factors for Cailclationof Dose to the Public, DOE/EH- 0070, U.S.Department of Energy, Washington (1988).
DO-90 U.S. Department of Energy.Effectiveness of Sheltering in Buildings andVehicles for Plutonium. DOEIEH-0159,: U.S.Department of Energy, Washington' (1990).
EP-78a U.S. Environmental ProtectionAgency. Protective Action Evaluation Part I -The Effectiveness of Sheltering as a ProdtectiveAction Against Nuclear Accidents InvolvingGaseous Releases. EPA 520/1-78-OO1A U.S.Environmental Protection kAiency,Washington (1978).
EP-78b U.S. Environmental PrdtectionAgency. Protective Action Evaluation PaIt U -Evacuation and Sheltering as ProtectiveActions Against Nuclear Accidents 'InvolingGaseous Releases. EPA 620/1-78-001B, U.S.Environmental Protection 'Agency,Washington (1978).
EP-88 U.S. Environmental Protection Aency.Federal Guidance Report No.'11. imitingValues of Radionuclide Intake and AirConcentration and Dose Conversion Factors
1for Inhalation, Submersion, and Ingestion.EPA 52011-88-020. U.S. Environmiental
*Protection Agency, Washington (1988).:
TD-82 U. S. Department of Health andHuman Services, Food and DrugAdministration. Potassium Iodide as aThyroid-Blocking Agent in a RaidiationEmergency: Final Recommendations 'on Use.Federal Register 47* 28158; June 29j 1982.
FE-85 Federal Emergency ManagementAgency. Federal Radiological EmergencyResponse Plan. Federal Reeister '0'46542;November 8, 1985.
HA-75 Hans, J.M. Jr., and Sell! T.C.Evacuation Risks - An Evaluation.
EPA-520/6-74-002, U.S. EnvironmentalProtection Agency, Washington, (1975).
IC-75 International Commission OnRadiological Protection. Report of the TaskGroup on Reference Man. ICRP Publication23, Pergamon Press, New York, (1975).
NR-75 U.S. Nuclear Regulatory Commission.An Assessment of Accident Risks in U.S.Commercial Nuclear Power Plants.WASH-1400, U.S. Nuclear RegulatoryCommission, Washington, (1975).
NR-78 U.S. Nuclear Regulatory Commissionand U.S. Environmental Protection Agency.Task Force Report. Planning Basis for theDevelopment of State and Local GovernmentRadiological Emergency Response' Plans inSupport of Light Water Nuclear Power Plants.NUREG-0396 or EPA-520/1-78-016, U.S.Environmental Protection Agency,Washington, (1978).
NR-80 U.S. Nuclear Regulatory Commission.Criteria for Preparation and Evaluation ofRadiological Emergency Response Plans andPreparedness in Support of Nuclear PowerPlants. NUREG-0654, FEMA-REP-1, Rev.1.,Washington, (1980).
NR-88 U.S. Nuclear Regulatory Commission.A Regulatory Analysis on EmergencyPreparedness for Fuel Cycle and OtherRadioactive Material Licensees. NUREG-1140, U.S. Nuclear Regulatory Commission,Washington, (1988).
NR-89 U.S. Nuclear Regulatioy Commission.Appendix E - Emergency Planning andPreparedness for Production and UtilizationFacilities. Title 10, CFR Part 50, U.S.Nuclear Regulatory Commission, Washington,(1975).
NR-89a U.S. Nuclear Regulatory'Comfnisisioi.Severe Accident Risks: An Assessment forFive U.S. Nuclear Power Plants. NUREG-1150, U.S. Nuclear Regulatory Commission,Washington, (1990).
0,,:
01k
05-42

(in
CHAPTER 6
Implementing the PAGs for the Intermediate Phase
(Food and Water)
K-.
See Chapter 3 and Appendix D for Current ImplementationRecommendations for Food. Also refer to the
following documents:
Federal Emergency Management AgencyGuidance Memorandum IN-1, The Ingestion Exposure
Pathwavy February 26, 1988 Federal EmergencyManagement Agency. Washington, DC 20472
Guidance on Offsite Emergencv Radiation Measurement SystemsPhase 2. The Milk Pathway FEMA REP-12, September 1987.
Guidance on Offsite Emergencv Radiation Measurement Systems.Phase 3, Water and Non-Dairy Food Pathway, September 1989.
C, -6-1

HHS Publication FDA 82-8196
'_,*Backgroun
Recommi* Radioacti
Food
offil
R.Div
..)
J for Protective ActionMdations: Accidentalve Contamination ofind Animal Feeds
B. iShkien, Pharm.D.G.D. Schmidt
x of the Bureau Director
K and.
P. Chiacchierini, Ph.D.sibn of Biological s
V Codlborat Cetm for.Sanizof PronaK Nhing Radiabons
Tainng and Genetl Tasls mnRadiation MedicinrNiucler Medicine
'August 1982
OF HEALTH AND HUMAN SERVICESPublic Health ServiceLand Drug Administration
eau of Radiological Healtheckville. Maryland 20857
BRHtad_
'I
I4
0..
U.S. DEPARTMEN1
FoodBL

a
The Bureau of Radlologlcalcontrol unnecessary human expradiations and to ensure the saferthe results of its work in scientfll
These reports provide a mecprojects. They are distribedpitals; the medical prof essIon;organizations; the pres; and otOffice and/or the National Techni
The Bureau also makes its terUnder a memorandum of agreedHuman Services, three WHO CoiLof Radiological Health, PDA:
WHO Collaborating CenterRadiations;
WHO Collaborating Center
WHO Collaborating Center I
Please report errors or omisfurther information are also encoi
FOREWORD
Health develops and carries out a national program topsure to potentially hazardous ionizing and nonionizing1 efficacious use of such radiations. The Bureau publishesc journals and In its own technical reports.
anism for disseminating results of Bureau and contractor, Federal, State, and local governments; industry; hos-wducator; researchers; .lbraries; professional and trade
ken. The reports are sold by the Government Printinglail Information Service.
Licaj reports available to the World Health Organization.hnet between WHO and the Department of Health andiberating Centers have been established within the Bureau
for Standardlition of Protection Against Nonionizing
.or Training and General Tasks in Radiation Medicine; and
~or Nuclear Medicine.
ilons toraged.
the Bureau. Your comments and requests for
Bureau of Radiological Health
'UIJ

PREFACE
By.FEDERAL REGISTER adtion of March 11, 1982 (47 FR 10758), the Federal Emer-gency Management Agency (FEA) outlined the responsibilities of several Federal agendesconcerning emergency response lanning guidance that the agencies should provide to Stateand local authorities. This updated a prior notice published in the FEDERAL REGISTER bythe General Services Administraion (GSA) on December 24, 1975 (40 FR 59494), on thesame subject. GSA responslblllc for emergency management was transferred by ExecutiveOrder to FEMA. The Department of Health and Human Services (HHS) Is responsible forassisting State and local authorloes in developing plans for preventing adverse effects fromexposure to radiation in the evet that radioactivity Is released into the environment. Thisincludes developing and specifying protective actions and associated guidance to State andlocal governments for human food and animal feeds.
Proposed recommendations re published In the FEDERAL REGISTER on December 15,1978 (43 FR 538790) and a background document accompanied their publication. Twenty-one
.comment letters were received :n response to the proposal in addition to comments fromvarious Federal agencies. Review of these comments led to changes in the recommenda-tions and supporting rationale, dolmetric and agricultural models, and cost/benefit analysis.These changes have been incorp4rated into this. background document, which is intended to(9 i accompany and support FDAs final recommendations on Accidental RadioactiveContamination of Human Foods lnd Animal Feeds: Recommendations for State and LocalAgencies. The final recommendations will appear in the FEDERAL REGISTER.
This background report discusses the rationale for the Protective Action Guides; thedosimetric and agricultural models used in their calculation; some methods of analysis forradionucllde determination; appropriate protective actions; and cost considerations.
Bernard Shielen, Pharm. D.Assistant Director for
Scientific AffairsBureau of Radiological Health
0-.iII

ABSTRACT
Shlelen, B., G.D. Schmidt, and R.P. ChlacchierinL Background for-Protective ActionRecommendatlons: Accidental Radioactive Contamination of Food and Animal Feeds. HHSPubllcadon FDA 824196 (August 1982) (pp. 44).
This report provides background material for the development of FDA'sProtective Action Recommnendadlons. Accidencal Radioactive Contaminationof Food and Animal Feeds. The rationale, dosimecric and agricultural transportmodels for the Protective Action Guides are presented, along with Informationon dietary. intake. In adaltion, the document contains a diussion of fLeL.methods .of analysis of radlonuelides deposited. on the ground or containedIn milk and herbage. Various'protective actions are descried and evaluated,and a cost-effectiveness aialysis-for the recommendations performed.
The .opinions and statements contained in this report may notnecessarily represent the vlews or the stated policy of the WorldHealth Organization '(WHO). The mention of commercial products,their sources, or their use In connection with material reportedherein Is not to be construed as either an actual or impliedendorsement of suchi products by the Department' of Health andHuman Services (HHS) or the World Health Organization.
! K
iv
CONTENTS
Page
Foreword ii .. 00
Fref rac . . .. . . . . . .. . . . .. . . . . . . . . . . . iU
Abstract 1. Rational for Determinat on of t Protectiv Action Guides
Chapter 1. Rationale for Determination of the Pro tective Action Guides . . . . 1
1.1 Introduction . . . . .:. 0 . . . . . . . . . . . . . . . . . . . .
(I '
1.2 Models for Evaluation of Risk. . . . . . . ..
1.2.1 Somatic Risk Evaluation . . . . . . . . . . . ..1.2.2 Genetic Risk Evaluation . . . . . . . . . ....
1.3 Assessment of Common Societal and Natural BackgroundRadiadion Risks ks. . .. .. .. .. .. .. .. ....
1.3.1 Common Societal'Risks . . . . . . . . . . . .1.3.2 Risks from NaturAl Radiation. . . . . . ....
1.4 Preventive and Emergency PAG's. . . . . . . . ....
1. 4.1 Preventive PAG i . . . . . . . . . . . . . .1.4.2 Emergency PAG . . . . . . . . . . . . . . . .
1.5 Evaluation of PAG Risks. . . . . . . . . . . . ....
Chapter 2. Dosimetric Models, Agricultural Transport Models,Dietary Intake, and Calculations . . . . . . . . .
2.1 Dosimetric Models . . . . . . . . . . . . . . . . .
2.1.1 Introduction . . . . . . . . . . . . . . .2.1.2 Iodine-131: Dose to Thyroid . . . . . . . .2.1.3 Cesium-137 and -134: Dose to Whole Body . . . . .2.1.4 Strontium: Dose to Bone Marrow . . . . . . ...2.1.5 OtherRadionuclides. . . . . . . . . . . . . ..
2.2 AgricultureTransport Models. . . . . . . . . . ....
2.2.1 Transport Models . . . . . . . . ..
2.2.2 Total Intake . . . . . . ..2.2.3 Peak Concentration . . . . ...... . . .
2.3 Dietary Intake . . . ... . ..............
2.4 Calculations . . . . ... . . . . . . . . . . . . . . .
* . * *
. . . . .
. . . . .
. . . . ..
. . . . .
. . . . ..
I
1
2
3
34
5
6
7
7
8
8
889
1011
12
121314
14
IS
* .*
. ..
. .
v

somatic risk. Mortality rather. than Incidence estimates are employed in the comparisons.In the case of comparisons to natural background radiation, use of mortality data orincidence estimates would yield the same numerical PAG limits, because these limits arebased on a comparison between ris rather than an evaluation of absolute risk. )
The radiation doses In the event of a contaminating accident will most likely result fromingestion of the fssion products ceslum-134 and -137; strontdum-89 and -90; and iodine-131.For the purpose of this analysis It is assumed that all projected extra cancers can beattributed to Internal radiation via the food pathway (I.e, the risks from ingestedradioactive material is the same as that fro.n external radiation).
The BEIR-M (3) best esdimate of lifetime cancer risk (linear quadratic model) for asingle exposure to low-dose, low LET radiation Is from 0.77 to 2.26 x 10" deaths per person-rem, depending on whether the absolute or relative-risk projection model Is used (calculatedfrom Table 1). The equivalent risk estimate from BEIR-l (2) is 1.17 to 6.21 x 10' deathsper person-rem.
Table I. Risk estimates for single dose
Deaths per million persons per 10rads single dose whole-body BEIR-fI1
Dose response model Absolute risk Relative risk
Linear quadratic 766 2255Linear 1671 ,014Quadratic 95 276
These risk estimates are for a single dose of 10 rem, because limitations of the scientificInformation do not justify estimates at lower doses according to the BEIR Committee.Because of the uncertainty of risk estimates at low doses, BEIR-M provided risk estimatesfbased on a linear model and a pure quadratic dose response model as well as estimates based j)on the preferred linear quadratic model. The risk estimates for the linear model are abouta factor of 2 higher and those of the quadratic model and about a factor of 8 lower thanthose of the linear quadratic model. It should further be noted, that BEIR-1il does notrecommend that their risk estimates be extrapolated to lower doses because of theInadequacies of the scientific bisis. BEIR-M does recognize however that Federal agencieshave a need to estimate Impacts at lower doses. While BEIR-MIl prefers the lUnear-quadraticdose response model as the best estimate, regulatory agencies have continued to favor thelinear model as the basis for mfJdng risk estimates. While the BEIR-111 estimates will beused here to estimate the impact health effects) at lower doses, it Is fully recognizedthat current scientifIc opinion leaves alternatives as to which dose response and risk modelto use.
As previously stated, for thy purpose of setting PAG's, comparison of radiation risks tothose from natural disasters Is considered the approach of choice in this document.
i2.2 Genetic Risk Evaluation
The model for genetic risks from radiation exposure is described in the BEIR-Il1 report(3). In the first generation, It is estimated that 1 rem of parental exposure throughout thegeneral population will result lit an Increase of 5 to 75 additional serious genetic disordersper million ilveborn offspring. The precision for estimating genetic risks is less precise thanthose for somatic risks. Given the broad range, genetic risks are evaluated, but are notprecise enough to be a basis for setting the PAG3s.
U
2

0cm.
1.3 ASSESSMENT OF COMMON SOCIETAL AND NATURAL BACKGROUND RADIA-TION RISKS'
1.3.1 Common Societal Risks
As previously stated, one method of determining the acceptability of a risk is bycomparing prevalent or normal- risks from hazards common to society. A List of the annualrisks from common societal hazards is given in Table 2. Comparision of radiation risks tocommonly accepted societal risks 'ssumes that the age dependencies are similar and that allindividuals are equally exposed tr the hazard. This latter assumption is, of course, notentirely valid in that persons neartr a nuclear power plant or a dam, or in an earthquake ortornado area might be expected to be at greater risk than persons living at a distance fromthe particular hazard.
Table 2. Annual risk of death from hazards common to society
Risk of deathCategory Reference (per person per year)
All disease (4) a x 10oLeukemia and all other cancer (3) 1.3 x lo-,Motor vehicle accidents (6) 3 x 10-"Accidental poisoning (6) 1 x 10-Air travel (7) 9 x 10-Tornadoes (Midwest) (M) 2 x 10`5Earthquakes (Callf.); (a) 2 x 10⁻⁴
- Floods3(46 milllon a risk) (9) 2.2 x 10-Catastrophic accidents
(tornadoes, floods,hurricanes, etc.)- (10) 1.2 x 10'
Natural disasters (11) 9 x 10⁻⁷(6) 8 x I-"
Tornadoes (7) 0.4 x 10"(9) 0.6 x 10⁻⁹
Hurricanes (7) 0.4 x 10⁻⁵(9) 0.3 x 10⁻⁴
Floods (3) 2 x 10-'g} a 5 x 10⁻⁴
Lightning 7) 035 x 10Winter storms (9) 0.4 x 10-
Natural disasters (sum of above) 2.1 to 3.9 x 10⁻⁵
Table 2 indicates that the annual Individual risk from natural disasters is approximately1 to 4 x 10r. This risk represents a common risk level, which is generally not consideredin selecting place of residence. At this level of risk, some action to prevent further loss oflife could be expected by society following the occurrence of a natural disaster. It thusappears prudent to evaluate the somatic risks from radiation in relation to the risk of deathfrom a natural disaster. For comparison purposes, a value of I in a million (I x 10') annu-al risk of death, which is often quoted as an acceptable risk, will be used as the risk ofnatural disasters. Actual data Indicate that the risk of natural disasters may be a 2 or 3times greater risk than this value. For a risk of death of I x 10' per year, the lifetimeaccepted societal risk would be about 70 x 10-6. This is equivalent to a single radiationdose of 140 to 420 mrem, using the linear model, or 310 to 910 mrern using the BEIR-Ilinear quadratic model (see Table 1). The upper and lower ranges are those obtained fromemployment of relative and absolute risk models and the dose response extrapolationsmentioned above (from calculations based on data in Table 1). Genetic effects are notconsidered In evaluating common societal hazards because of the difficulty in assessing
3

deaths occurring from genetic consequences, either natural or radiation Induced. If sponca-neous abortions are deleted from this category, then fatal genetic effects are a smallportion of the overall genetic Impact on health. However, It Is dilfficul to accuratelyevaluate genetic effects, and even more dlff iculr to compare Its Impact to the impact of ()somatic effects In an eff ective manner.
1.3.2 RisksFrom Natural Radiation
Further perspective on acceptable risk can be obtained by examining the risks of naturalbackground radiation. In risk assessments where a radiation risk ls compared to that fromthe natural radlatIon h.kground, the question Is which variable associated with naturalbackground shoud be used to determine "acceptable risk?" Since background radiation hasalways been a part of the natural evirornent, a plausible argument might be to assumethat the risks associated with the average natural radiation dose represent an "acceptablerisk."
It has also been argued hat. because of the ever present risk from natural radiation, alevel of manmade radiation ought to be acceptble if It ls nsmall" compared to naturalbackground (12). It has been suggested that "small" be taken as the standard deviation ofthe populatonr-weighted naturalbacckground (13). In previous evaluations that led to theFDA's proposed PAG recommendations (l) the geographic variable (two standarddeviadons).in the nanral radiadon dose waused as a point of comparison for judgingacceptable radlation risk (15). This value, .lculated on aStare-by-State basis assurning alog-normal dlstributionad. notwceighced for population, Is Si mrem per year. Thecumuladve Illf eie dose equivalent would thus be about 500 mrem, which was the basis forthe proposed PAG recommendation for the whole body at the Preventive PAG leveL TheEnvlronnenral Protection Agency (EPA), In a further analysis of previously published data(16), has calculated the cumulative distribution of dose equivalent In the U.S. population.These data show thar 9 perceni of the population receives between 23 and 8# mrem/yearfrom cosmic and terrestrial background radiation (17). The actual distribution Is 1asymmetric and not log-normaL Thus, one-half of this 95-percent Increment range, or 23mrem/year, will be taken as the value for judging acceptable risk. Adler (13) notes that onestandard deviation of the natural external and internal radiation background derived fromearlier sources (13) Is 20 mrem. Personal conversations with Adler revealed that tlisestimate is based on air exposures rather than dose equivalent (mean whole body) andInvolved a broad rounding off of values. At the 95-percent incremenc value (latest EPAdata) of 28 mrem/year (19), the additional lifetime dose over 70 years is about 2000 mrem.About 6 mlLIon persons (2-1/2 percent of the population) receive Ulfetime doses dtat exceedthe mean background radiation dose by this amount or more.
Another possIbility, especially applIcable to setting limits for Internal emitters, is usingthe variation In Internal natural radiation dose as a reference for estabIlshing an acceptablestandard for PAG's. For PAG limis for radionuclides via the Ingesdion pathway, doses toorgans other than the lungs are most pertinent. Using this suggestion still requres ajudgmental decision as to whether the variation in Internal natural radiation dose is "smalL"A summary of Internal natural radiation doses is given In Table 3. It Is apparent thatnatural radiation doses to human tissues and organs Is determined mainly by potasszun-m 0concentration. The average annual Internal whole-body radiation dose per person fromIngested natural radioactivity ls 19.6 mrem, of which 17 mrern Is due to potasslum-40.
In poran-40 whole-body measurements of 10,000 persons, a standard deviation ofabout 12 percent (95-percent coniidence level of 23.52 percent) was observed (20). Thestudy further concluded that the standard deviation 1s also the same for different groups ofage and sex, and therefore, it may be conduded that the same biological variation exist forall the dlfferent age-sex groups. In another study based on the chemical determlnations oftotal body potassiun the average amount In a 70-kg man was estimated to be 136 g with a()standard deviation of ±28 g or 120 percent (95-percent confidence Increment of %40percent) (21).
4

Table 3. Annual internal radiation dose per personfor non-nhaled natural radioacrivicya
Annual dose (Grads/year) whole-body average(unless otherwise noted)
H-3 0.001Be-7 0.008C-1* 1.3Na-22 0.02K-40 17Rb-87 0.4U-238-U-234 series 0 043bRa-222 0 . 06 4bPo-210 0.7Ra-226 0.03cbTh-230 0 .0 4Th-232 0 .y04b
Total 19.65AUNSCEAR (1977).bBased on soft tlssue dose (lung, testes, and ovaries)
An indirect means of determining the variability of whole-body potassliun values Isbased on the constant rado of mean pocassium values to total body water up to age 50(20). The 95-Wrcent confidence Increment for the variability of total body water in males,ages-16 to 90 is 16 percent, while for fernales it is 13 percent for ages 16 to 30 and 21percent for ages 31 to 90 (22).
From the above dta, it appears that the incremenc for the 95-percenit confidence--level for whole-body pocussiun, and hence pocassitumr40, is between 15 percent and ± 40percent. Note chac this variability may be due to differences In body wacer or body weight.Only in the case of one stiny (21) is it clear the total body weight is considered a constant.It is apparent that a range of values between approximately 3 to 7 mrad per year may beused to describe the variability in narural potassiumn40 dose to the population on a whole-body dosimetric basis. The mid-point of this range is 5 mrad per year or a ilferime dosecommitment (70 years) of 350 mrem.
(,- )4
Thus, the llfetime radiatIon dose associated with the variability in natural radiation isabout 350 mrem (Internal) and 2000 mrem (external).
1.# PREVENTIE AND EMERGENCY PAG'S
PAG's have been proposed for two levels of response:
1. Preventive PAG - applicable to situations where protective actions causingminimal Impact on the food supply are appropriate. A preventive PAG establishes a level atwhich responsible officials should take protective action to prevent or reduce theconcentration of radioactivity In food or animal feed.
2. Emergency PAG - applicable to incidents where protective actions of great impacton the food supply are justifIed because of the projected healrh haards. An EmergencyPAG establishes a level at which responsible officials should isolate food containingradioactivity to prevent its Introduction into commerce, and at which the responsible offi-cials must determine whether condemnation or another disposition is appropriate.
S

1.4.1 Preventive PAG
Ouring recent years numerous reports on risks and risk/benefle assessments for theevalua.don of technological Irmults have been publIshed. A number of these have concluded Ithat an annual risk of death of 1 In a million is acceptable to the public (8). The total aver-age annual risk to the U.S. population from natural disasters appears to be about 2 or 3times greater than the 1 In a miicn annual risk. Those individuals living in certain floodplaire, tornado, or earthquake areas accept risks that may be greater than the average by afacti of 2 or more (See data for tornadoes and earthquakes in Table 2).
As previously mentioned1 based on BEIR-III (3) upper risk estimates, a I In a million annu-al risk of death corresponds to a single radiation dose of 140 to 910 mrem.
It is our conclusion that an annual risk of I in a million provides a proper perspective forsetting food protective actions guides (PAG's) for radiation contamination accidents of lowprobability. It appears that most Indivietals In the United States will never be exposed tosuch a radiation contnation accIdent and that any one Individual is not likely to bepotentially exposed more than once In his lifetime.
Based on the above coansideratiorn, the uicertalnty In radiation risk estimates and thencertalnty in.the average natural dsaster risks, a value of 0.5 rem whole body Is selected
for the Preventive PAG. u, at projected doses of 0.5 rem from contaminated food, It isrecommended that protective actions having low. impacts be taken for procection of .thepublic. The specific value of 0. eem represents a judgment decision rather than a specifl-cally derived value from specific models and assumptions.
Further perspective on acceptable risks for setting the PAG's Is the risks associated withnatural backround radiation. The discussion above indicates that llfetime dose associatedwith the 95-percent Increment of the variability In natural radiation Is about 350 mrernInternal and 2000 mrem externil (thas is, 2-1/2 percent of the population receives dosesgreater than the average by this amount or more).
This Preventive PAG is applicable to whole-body radiation exposure and to majorportions of the body Including active marrow (Ingestion of strontium) in conformity withcurrent U.S. radiation protection practice. Coincidently, 0.5 rem Is the Federal RadiationCouncil's (FRC) annual limit for individuals of the general population (23).
Present convention, recommended by the Federal Radiation Council (23) based on priorestimates of relative radiation risks for various organs Indicates that radiation limits for thethyroid gland be set at 3 times those for the whole body. More recent scientific InformationIndicates that the riks from orpn doses relative to whole body differ from those assumedwhen the current U.S. regulations and FRC guidance were established. The InternationalCommission on Radiological Protection (ICRP) in revising Its recommendations on internalexposure derived weighting factors that represent the ratio of risk from Irradiation to agiven tissue (organ) to the total cancer risk due to unif orm Irradiation to the whole body.The ICRP weighting factors are 0.12 for red bone marrow. and 0.03 for thyroid, Indicatingthat the cancer risk ls 3 times less for red bone marrow and 33 times less for thyroid thanfor whole body exposure (24). Further considerations of effects other than cancer resultedIn the limitation of organ doses to 50 rems per year for occupational workers. ` Thus theICRP recommendations In effect provide for or allow single organ doses tht are S timesgreater for red bone marrow and :10 times greater for thyroid than for-whole body. The EPAhas recentiyproposed Federal giildance for occupational radiadon protection that Incorpo-rates the basic ICRP recommendations (46 FR 7336, 3an. 23, 1980). Secting the PreventivePAG at 0J rem for whole body and red bone marrow and 1.5 rem for thyroid providessignificantly more protection from the iactual risks of organ doses than from whole-bodyrisks. To the extent that the while-body risk is considered acceptable, the red bone marrow ,.and thyroid limits are conservative by factors of 8 and 3.3, respectively.
6

1.4.2 Emegency PAG
The philosophy of the protective action guidance of FDA is that low impact protectiveactions should be Initiated when contamination of food exceeds the Preventive PAG. Theintent Is that such protective actions be implemented to prevent the appearance ofradioactivity In food at levels that would require the condemnation of food. If such actionsare ineffective, or high levelsiappear in food, then the Emergency PAG is that level atwhich higher Impact (cost) protective actions are warranted. At the Emergency PAGradiation level, action should be taken to Isolate and prevent the Introduction of such foodInto commerce and to determine whether condemnation or other disposition Is appropriate.
With regard to the numerical relationship between the Preventive PAG level and theEmergency PAG level, prior conventions may be considered. For example, the FederalRadiation Council (23) asstumed that the dose to the most highly exposed Individual does notvary from the average dose to the whole population by a factor greater than three; Hence, afactor of 3 was wed to define the difference between maximwn and average populationlimits. Traditionally, It has been more common to we a factor of 10 as a safety factor,such as between occupational and general public limits A factor of 10 difference betweenthe Emergency and Preventive PAG levels, based on these traditional radiation protectionapproaches has In the past been thought to introduce a sufficient level of conservatsmn. Theproposed PAG's (14) adopted this rationale In setting the Emergency PAG's. The analyses ofcosts, to follow, also Indicate that a factor of 10 between the Preventive PAG andEmergency PAG is appropriate. As calculated in the last chapter of this report the cost ofcondemnation of milk (high Impact protective action) Is about a factor of 10 greater thanthe cost of wing uncontamnirated stored feed Clow Impact protective action). Since._ntamlnation of the milk pathway is considered to be the most probable and slinlilcancfood problem, tdis Is the only pathway that is cost analyzed.
The use of a factor of 10 adopted here results In an Emergency PAG of 5 rem for theC whole body which numerically Is equivalent to the current occupational annual limit. Thislimit permitted each year over a working lifetime Is associated with the expectation ofminimal increased radiation risks.
1.5 EVALUATION OF PAG RISKS
The risks associated with a radiation dose equal to the PAG's can be readily calculatedf rom the BEIR-MI! risk estimates In Table 1. For the Preventive PAG of 0.5 rem, the deathsper million persons exposed are one-twentieth of those given for the 10-rad single dose (orabout 38 to 250 deaths for the linear quadratic and linear models respectively). On anindividual basis, this is a risk of death of 0.38 to 2.50 x 10- (0.0038 to 0.025 percent)over a lifetime. BEIR-M gives the expectation of cancer deaths in the U.S. populationas 167,000 per million or an individual expectation of cancer death of 16.7 percent.
As noted above, the BEIR-M estimate of serious first generation genetic disorders 1s 5 to75 per million live offspring per rem of parental exposure. Thus, for a dose of 0.5 rem, theexpectation is 2.5 to 38 disorders per million live offspring. BEIR-Il1 notes the carentestimate of the incidence of serious human disorders of genetic origin as roughly 10 percentof fiveborn offspring.
7
CHAPTER 2. DOSIMETRIC MODELS, AGRICULTURAL TRANSPORT MODELS,DIETARY INTAKE, AND CALCULATIONS
2.1 DOSIUETRIC MODELS
2 1.1 Introducon
The dosimetric models and metabolic parameters lor estimating the dose from Internallydeposited radionuclides are In a state of flux. The recent reports and current activityrepresent the first major revision since the adoption of ICRP Publlcation 2 (25) and NCRPReport 22 (26) In 1959. ICRP Publication 30 (27) superseded ICRP Publication 2 and revisedthe basic approach In setting limits for Intake of radlonuilides by workers. The ICRP recom-mendations are Intended to avoid nonstochasic effects and to limit the occurrence ofstochastic effects to an acceptable leveL This approach includes the use of weightingfactwrs to sun the risk from .organ doses In setting the limits for intake. This systemcontrasts with the earlier approach where limits were based on the dose to the "criticalorgan."
The IQ.P Publication 30 approach has considerable merit, but Is not yet widely acceptedIn the United States. Its use In calculating the derived response Ilkvels would represent amajor change.: AccordIngly, the approach Is to use the organ to whole-body dose relation-ship of current U.S. regulations and to select critical organ dose conversion factors that arebased on current dosimetric models and metabolic parameters. Where apropriace, therecent ICRP and NCRP organ dose models will be accepted as representing current scientif-ic opinion. It should be noced that funure reports and revisions by NCRP, MIRD (MedicalInternal Radiation Dose Committee of The Society of Nuclear Medicine) and ocher Federal (agencies may necessitate a revision of the dose conversion values selected here.
The PAG3s are applicable to the most critical or sensitive segment of the population. Inmost cases this means that the infant or child is the critical segment. In the case of theEmergency PAG, derived response levels are also presented for the adults. This permitsgreater fleibility In the choice of protective actions in cases where infants are not presentor can be excluded from we of the specific food item being considered.
2.1.2 bdine-131: Dose To Thyroid
Fecal uptake of Iodlne begins at about the 9th week of gestation and reaches a maximunin the newborn Irdan: (23,29) before returning to adult levels. Kereiakes et al. (30) reportthat thyroid uptake during the flrst 2 weeks of lfe is very high and report a value of 70percent of that administered for the newborn. The radilodilne uptake expressed per unitthyroid weight remains high for the newborn and infant and only gradually decreasesthroughouc childhood and adolescence to adult levels. The newborn Infant will be taken asthe most critical segment of the population because factors concerning intake, uptake, andradiosensitivity Indicate that the thyroid gland of an infant receives a higher radiation doseper unit 1-131 Ingested than anylother age group (30). However, it is interesting to note thatdata Indicate chat only about 3 percent of Infants are given whole cow's milk at 1 month ofage and about 1 percent at 10 days (31). Hence, assuming that all infants are given wholemilk provides a conservative estimate of infant thyroid doses.
Data on the dose to the fetal thyroid from 1-131 Ingested by the mother Is rather limit-ed. The study of Dyer and Bril (29) reports an increase in the fetal thyroid dose from 0.7 to5.9 rads per uCi administered to the mother for fetal ages of 13 to 22 weeks. It thus ki3
8

appears that the fetal thyroiddose is less than that of the newborn infant ingesting 1-131contaminated milk.
The current Literature on normal thyroid uptake in U.S. adults shows 24-hour uptake hasdecreased from about 30 percent reported in the 1960's to about 20 percent or less in cur-rent comparable studies. Kerelakes et al. (32) use a 20-percent uptake for all ages. Thisreduced uptake apparently results from changes In the U.S. diet, whereas ICRP 30 (27) hascontinued to use an uptake of 30 percent to reflect world averages.
The Medical. Internal Radiation Dose (MIRD) Committee schema. (33) has be En used byWellman and Anger (34) to calculate dose factors per lCI ingested for the newborn for the1-, 5-, 10-, and l5-year-old child, and for the adult. These factors were then modified byKereiakes et al. (32) to reflect a 20-percent uptake for all ages. A biological half-lf e of 68days is used for all ages, which results in an effective half-lfe of 7.2 days. Although thereis some evidence that the biological half-life for the infant is less, the radiation dose islargely controlled by the radiological half-life and use of a single value appears appropriatehere. Because of some uncertainty regarding the fetal thyroid dose and lack of acceptanceby national and international groups, the older data (27-percent uptake) of Wellman andAnger (34) will be used. This provides some additional conservatism in the derived responselevels for 1-131. The cumulative activity is 2.08 iCl-days per uiCI ingested(administered).
Table 4. tunmary of 1-131 dose conversion factors
Age Thyroid weight (g) Dose rad
Newborn 1.5 16.01 yr. 2.2 10.95 yrs. 4.7 *5.1
10 yrs. 8.0 3.015 yrs. 11.2 2.1Adult 16.0 1.35.
For the infant and adult, the dose conversion factors to be used are 16.0 and 1.5 rad/ ujClingested.
2.1.3 Ceslum-137 and -134: Dose To Whole Body
The NCRP (35) has reviewed the behavior of Cs-137 in the environment and its metabo-lism and dose to man. From studies of Cs-137 in food chains, the biological half-life isfound to vary from 15 ±5 days in Infants to [00 ±5 days in adults. The biological half-life in pregnant women Is reported to be 1/2 to 2/3 that in nonpregnant women andconsequently the dose to the fetus is also reduced.
Retention of Cs-137 in the adult is stated to be well represented by a 2-exponentialequation with biological half-times of 1.4 days and 135 days applicable to retention in bodyfluid and soft tissues, respectively. Integration of this equation yields an accumulated activ-ity of 170 uCl-days per yC1 of intake. This accumulated activity may be expressed interms of a single retention function yielding a value of 118 days.
The dosimetry of internally deposited Cs-137 in infants and adults is treated separatelyfor the beta particle and photon components. The difference between infants and adults is asmaller photon contribution to the infant because of the smaller body size. For a uniformconcentration of I uCi/kg of body weight, the total beta and photon dose rate is 19mrad/day to the infant and 25 mrad/day to the adult. Use of the above accumulated activ-ity factor of 170 uCi-days per uCi intake yields a dose of 0.061 rad/ uCi intake for theadult. Assuming an effective retention time of 20 days for the infant, the correspondingfactor for the infant is 0.071 rad/uCi intake. The use of a smaller effective retention
9

rime (15 days as noted In NCRP (26)) or 10 days as used in NUREG-0172 (36) would reducethe infant dose conversion factor. The use of 20 days thus tends to overestimate the infantdose.
It Is also important co consider the dose from Cs-134 which, depending on operatinghistory, occurs in nuclear reactor fuel at levels equal to or greater than that of Cs-137.Unfortunacely, published dosimetry data for Cs-134 for the infant are rather limited.Conversion factors for the adult that use current models and metabolic data are found InORNL/NUREG/TM-190 (37). Johnson et aL (38) have used this same data base ro computecommitted effective dose equivalent conversion factors for both infants and adults. Themean absorbed dose per cunulated activity factor for the infant were modified by the ratioof adult and Wnfant organ mass (with a further correction to phoron component based onabsorbed fraction) to produce the Infant factors. It was staged that. this procedure mayunderestimate the Infant dose.
The approach adopted here will be w modify the adult dose conversion factor InORNL/NUREG/TM-190 (37) based only on relative body weight and cumulated activity(effective retention half-tines). The dose conversion factor for cesium-134 fromORNL/NUREG/TM-190 adult whole body Is 0.062 rem/uCl ingested and the estimatedfactor for the Infant is then 0.118 rem/uCi ingested. This value should overestimate theInfant dose and is conservative.
Summary of Cs-134 and C.-137 Dose Conversion Factors
Table 5. Summary of dose factors for Cs- 134 and Cs- 137
Wnant Adult
Body Mas 7,700s 70,0008Uptake to whole bodya 1.0 1.0T blological (days) 20 118T effective C3-134 (days) 19.5 102
C3-137 (days) 20 118
Dose conversion (rem/ uCI ingestion)C.-134 0.118 0.068Cs-137 0.071 0.061
ador ceslum-134, ORNL/NUREG/TM-190 uses uptake of 0.95.
0.N
21.4 Strontiun: Dose To Bone Marrow
The tissues at greatest risk In the skeleton have been Identified as the active red marrowin trabecular bone and endos teal cells near bone surfaces (generally referred to as bonesurface). Splers and his coworkers (39,40) have developed methods to calculate the absorbeddoses, Dm and 0, received by red marrow and bone surfaces, respectively from beta-emitting radlaZnjdes uniformly distributed throughout the volume of bone. They considerthe dose, D., In a sma tissue-fllled cavity in an Infinite extent of mineral bone uniformlycontaminated with the radlonucllde and give dose factors D5/Do and Dm/Do for obtainingthe absorbed doses. For both Sr89 and Sr-90, the ratio of D5/Dm is about 1.5. Therefore,since the dose limit recommendations are 15 rem to bone and 5 rem to red marrow(occupational limits), the dose to red marrow Is the limiting criterion and will be used in thisreport (26).
The work of Spiers and hLi coworkers has been used by the ICRP (27) In calculating dosecommitment factors for adiuts and by Pipworth and Vennart (41) for doses as a function ofage at times of ingestion. The dose commitment values from Papworth and Vennart in red fmarrow per tiCl of Sr-89 and Sr-90 ingested are as follows (Table 6). V
10

. Table 6. Dose commitment values-. for Sr-89 and Sr-90 .
Age at Ingestion rem per UCI ingested'
0 0.414 4.030.5 0.194 2.491 0.130 1.332 0.080 1.203 0.060 0.914 0.050 0.775 0.044 0.706 0.039 0.697 0.035 0.713 0.032 0.769 0.029 0.83
10 0.026 0.8911 0.023 0.94
i.Adultsa 0.012 0.70'Ages 0-11 from Papworth and Vennart (41),
Ad t.bfrom ICRP-30 Supplement to Part I(27).
Thus die dose conversion factors adopted In rem,/ Cl ingested are for Sr-89, 0.194 and0.012, and for Sr-90, 2.49 and 70., for the Infant and adult, respectively. Asbefore,.the 0.5-t_year Want is taken as the cll population. The values for the adult are those given inICRP 30 (27) whIch also used the work of Sples and coworkers.
2.1.5 Other-Radlonucildes
Adult - The* most authoritative reference using current data and models for doseconversion factors per UCl Ingested Is that of the ICRP 30 (27) Part 1, 1979; Part 2, 1980;Part 3, 1981; and the Supplemiets, Pergamon Press (42). ICRP 30 Parts 1, 2, and 3 (andSupplements) provide data only for adults (occupational workers) for the radionuclides of 94elements.
As a further resource,. ORNL/NUREG/TM-190 Is suggested (37). This documentrepresents initial efforts by ORNL under contract to NRC to provide review and updateon Internal dosimetry.
Infant, Child - Urdortunitely. the Initial efforts to update internal dosimetry have all.been directed at the adult or occupational worker and comprehensive dosimetry using cur-rent data for the younger age groups do not exist. Further efforts are In process or contem-plated by the U.S. Nuclear Regulatory Commission (NRC), Medlcal Internal Radiation DoseCommittee, (MIRD), Societyfof Nuclear Medicine, and NCRP, and generally will involve oruse the models developed by Oak Rldge National Laboratory (ORNL). Until such time thatnew dosimetric calculations jappear for the younger age group, it is suggested that NuclearRegulatory Commission Regulatory Guide 1.109 be used: "Calculation of Annual Doses toMan from Routine Releases of Reactor Effluents for the Purpose of Evaluating Compliancewith 10 CFR Part 50, Appendix I," Regulatory Guide 1.109, Revision 1, Oct. 1977, U.S.Nuclear Regulatory Commission, Washington, D.C. 20555.
(;;'
011

2.2 AGRICULTURE TRANSPORT MODELS
A review of the agriculitral transport mechanism for radionuclides, which employs parameters appropriate for the U.S. experience, is contained In the Reactor Safety Study, rWASH-1400, Appendix VI (7). An analysis specific for calculacing derived response levels(concentration values) In agricultural media for emergency action that reflects th Britishexperience Is found in a report of the Medical Researdc Council (43).
A morerecent and comprehensive aessiment of the transport mechanls~ms for the forage-cow-milk pathway Is found in!UCRL-31939 and will be used here (44)
2.21 Transport Models
According to Ng et aL, the time dependency of the concentration of a radionuclide inthe milk of a cow continuously grazing pas tre contaminated by a single event can bedescribed by (44):
CM( )w CX° i1 in XMF-It _ e xp tCM(t) =IC(O) E A !-X -~ -1= *P - AMEI
where CM(t) a concentration of radionuclide in milk at time tyClill)
ILc0 ) a Initial rate of ingestion of radionudlide by the cow (izCl/d)
A1 := cefflcienof lchexponential term, whichdescribes thesecretionlnmilk(liter)
XMEI effective ellmination rate of the It milk component (d-r)
AMEi AR +XMBI
= radiological decay'constant (d-')
XAMB1 = biological ellmiiation rate of 1th milk component (d-1)
Ap _ effective rate of removal of the nucilde from pascure (dr ), and
Ap * AR + Xwt where 1W Is removal rate for a stable element from pascureand
t = time of milk sereaton (d).
The total activity Ingested by a person who drinks this milk can now be determined byIntegration:
flo dt fo 3CM(t)dt 3JIc 0)0 0
where I rate of ingestion of the radionuclide by a person (U Ci/d) and
3 = rate of consumption of milk (11ter/d).
The solution for the total activity Ingested by man ixs
~I dc - 3 1C(O)fMo d0 = XP0
12

I
where fM = transfer coefficlent; Le., the fraction of daily Intake by cow that is se-creted per liter of milk at equilibrium (d/liter)
IM 1Z ZM,i.B.:
Ng et al. have conducted a comprehensive review of the literature relevant to the deter-mination of transfer coeffl=ienu for both stable elements and radionuclides (4b). Thesedata are summarized in UCRL-51939, which also include values :' the normalized co-efflclents, A,. the biologicl half-life TMBI (related to AMBl) for selected elements andvalues of fM for all stable elements. This information Is then used witF the radioactive half-life to calculate values of fM for specific radionuclldes of interest (l able B-1 of Ng et al.
An examination of the logistics of the forage-cow-milk-man pathway shows that there isgenerally a delay time between the production of milk by the cow and Its consumption bythe general public. Therefore, It Is appropriate to introduce a factor, S, to account forradioactive decay between production and consmnption, where
S z e w where A = the'decay consat for a given radlonuclide (d-)and t u the delay between production and consumption (d).
Slnce the delay time for fresh whole milk is assumed to be 3 days only 1-131 of theradlonuclides of Interest here has a sufficiently short half-llfe to result in a value of Ssignificantly smaller than one. Thus, for 1-131:
5(e131 =e -4.865 x iS(J-131) 0.772
Therefore, the total activity ingested as calculated by the above formula (4dt) must 6emultiplied by 0.772 in the cWie of Iodine-131.
2.2.2 Total intake
The calculated values of integrated activity ingested per uCl/m deposition fromAppendix B of UCRL-31939 will be accepted as the basis for deriving the response levelsequivalent to the PAG (44). The values in Appendix B are based on these values ofparameters:
-() IC(0), initial rate i4 intake by cow
UAF a "utilized ar:a factor" (93)
UAF a 45 m 2/d
Initial Retention on" Forage 3 0.5 fraction
Initial Deposition * I uClC/m
thus IC(O) = 22fi uCl/d,
(2) 3 = 1 llter/day constuzption of milk, and
(3) Half-resIdence time on forage is 14 days.
13

The UAF of 45 m 2/d assumes a forage consumption by Phe cow of 11.25 kg/d dry weightor 56 kg/d wet weight based on a forage yield of 0.25 kg/m (dry weight) (43).
The values of the total intake per unit deposition ( uCi UCI m 2) for a 1-liter per daymilk Intake from Ng et al., are given in Table 7, line 1 (44).
T-be J. Drlwivt0mO wi~ _1OI Hnintl to I A - i ~ tct to MAddma
1- IJM Cs - 134 * . 137 5o- 90 Se Tr
1. PutuInaha '02) 1.34 3.12 3.22 .534ruCUuCIamn Ajt ant Adait Itda¶t Ad.ig hdat Aett Want
2. Doew wwMunta 14 1.3 .118 .043 .071 .041 2.19 .70 .1* .012
3. b ts per aw n .47 1.3 1*.7 14.1 16.4 .I0 1.43 3.2 23' e~o lint
*. 5T1c 7 acta Cy I * .i 2.11 1.72 2.23 I. .43 .33 .322 .23Ir O W1.(CI soaw CmWi;
3. ad~M sudaw dopo'd t!! .03 1.17 3.3 3. 6.3 .3 .X0 4.1 14 329
*. Pf - i (an t 0.11. 0.073 0. an 0.01% 0.013(uCUL oaw U CUm I _
7. Pmhrniakkmlk da, .0100 .134 .303 .57 .*3 .72 .0177 .0o .2Z1 3J.(I1,wxzty4)ICUL a_ eon)
3. IWdgvifmsc.eansvti .034 .47 1.33 3.43 2.X0 3.7 .361 1.63 4.40 L32
(1MAI VW PM) 'DIA%;CTffZW 2i O Alsli GonrtMM IJ "Vs He= .77Z)
2.3 DIETARY INTAKE
Infant less than 1 year old ! For the purposes of these recommendations, the dietaryintake of milk Is estimated to be 0.7 liters per day for a newborn infant.
Based on the average intake up to and including I year of age, the daily intake of milkfor an infant less than 1 year of age Is 0.7 lIters (46). An additional 300 g of food may alsobe assumed to be ingested by an infant less than I year of age (based on intake of 6 month-old Infants - Kahn, B. (47)).
Adult - Based on U.S. Department of Agriculture Household Food Consumption Survey1965-1966, the average consuniption for the general population is given in Table 8. Thedietary intake of milk is taken io be 0.53 liters per day for the adult.
In addition to water Ingested In food and drink, an estimated 150 ml of tap water is alsoIngested each day (46) for a totil dally food intake of 2.2 kg.
,!
14

Table S. Average consumption for the general population
Average consumptionfor the general population
Food g/day % of total diet
MlIk, cream, cheese, ice creara 567.3 Z7.2Fats, Oils 54.5 2.6Flor, cereal ; 90.3 4.3Bakery products 149.8 7.2Meat 217.9 10.4Poultry 54.5 2.6Fish and shellfish 22.7 1.1Eggs 54.5 2.6Sugar, syrups, honey, molasses, etc. 72.6 3.5Potatoes, sweet potatoes 104.4 5.0Vegetables (excluding potatoes) fresh 145.3 7.0Vegetables canned, frozen, dried 77.2 3.7Vegetables juice (singlestrength) 9.1 0.4Fruit, fresh 163.4 7.8Fruit canned, frozen, dried 36.3 1.7Fruit juice (single'strength) 45.4 2.2Other beverages i(softdrinks, coffee, alcoholicbvgs.) 177.1 8.5Soup and gravies (mostly condensed) 36.3 1.7Nuts and peanut butter 9.1 0.4
Total i 2088.1 99.9Expressed as calcium equivalent; that Is, te quantity of whole fluidmilk to which dairy products are equivalent in calcium content.(). (From the U.S. Department of Agriculture Household Food Consump-tion Surey, 1965S1966)
2.4 CALCULATIONS
The calculation ofde derived response levels equivalent to 1 rem dose commitmentto critical organ for the lrasow-milk-man pathway Is summarized In Table 7. An explana-don of Table 7 and the calculations follow:
Lin 1 Pathway Intake Factor Is due total intake (WCi for a I liter per day milkIngestion per 1 uCIm" of Initial area deposition (44).
Line 2 Doe Conversion Factor Is the dose commitment In rem/UCI ingested. Seesection 1for mnmary.
* Lle 3 Intake per rem Is Intake In u Cl to yield a I rem organ dose.
COMPUTATION - The reciprocal of line 2.
Lim 4 Specific Intake Factor is the product of dte Pathway Intake Factors (line 1) andthe milk Ingestion rate of 0.7 1/day infant or .55 1/day adult. In the case of 1-131, afactor of 0.772 is Included to adjust for 3 day's decay between production and consumption.
COMPUTATION - LIne I x (1 or .772) x (0.7 or 0.55)
Line 5 Initial Surface Deposition is initial area deposition of a specific radionuclide inC uCl/r' which gives a 1-rem dose commitment.
15

COMPUTATION - Line 3 divided by Line 4
Line 6 Peak Concentration Factor is the peak maximum concentraicin in milk (UCI/l)from ian I0ial area deposition of I PCI/m . Summary In Section 2.2.3 per model ofNg et aL. (44).
LIne 7 Peak Milk Concenkration Is the maximum milk concentration ( uCilI) that yieldsa dose commitment of I rem from continuous ingestion of the contaminated milk supply.
COMPUTATION - Llne 5 x Line 6
Llne 8 InItial Grass Concencracion Is the activity concentration (uCl/kg) on grass(edlble forage) chat results from the Initial Surface Deposition giving a I-rem dosecommitment.
Retention fraction on forage - 0.5
Forage yield - 1.25 kg/m2 (wet weight)
COMPUTATION - Llne ;S x 0.51.25 kgm'
The derived response levelsidhat correspond to the Preventive PAG (1.5 rem thyrold 0.5rem whole body and bone marrow) and the Emergency PAG (15 rem Lhyrold; 5 rem wholebody and bone marrow) are given In Tables 9 and 10.
Table 9. Derived response levels for grass-cow-milk pachway equivalentto Preventive PAG dose commitment of 1.5 rem thyroid, 0.5 whole body
or red bone marrow to infant1
Response levels forPreventive PAG I-1312 Cs-134' Cs-1373 Sr-90 Sr-89
Initial activityarea deposition(3jCl/m2 ) 0.13 2 3 0.5 8
Forage concentration'(uCI/kg) 0.05 0.3 1.3 0.13 3
Peak milk acitivicy(yCI/l) 0.015 0.15 0.24 0.009 0.14
Total intake (uCI) 0.09 4 7 0.2 2.6'Newborn infant includes fetus (pregnant women) as crtical segment of populationfor iodlne-31. For ocher; radlonucldes, "inrdante refers to child less than 1 year ofage.
'From fallout, lodine-131 is the only radlolodine of significance with respect to milkcontamination beyond the tflrst day. In case of a reactor accidentthe cumulativeIntake of iodlne-133 via nmilk Li about 2 percent of iodlne-131, assuming equivalent
.deposition.Ilntake of cesium via the meat-man pathway for adult may exceed that of the milkpathway; therefore, such levels In milk should cause surveillance and protective ac-tions for meat, as appropiate. If both Cs-134 and Cs-137 are equally present, asmIght be expected in reactor accidents, the response levels should be reduced by afactor of 2.
'Fresh weight.
B . J
w._,
16

Table 10. Derived response levels for grass-cow-milk pathway equivalent to emergency PAG dose commitmentof 13 rem thyroid, S rem whole body or red bone marrow
Response levels for I - 131' Cs - 13U Cs - 137' Sr - 90 Sr - 89emergency PAG Infant Adult Infant2 Adult Infant! Adult Infant2 Adult Infant2 Adult
Initial activityarea deposition
(I/rn) 1.3 la 20 40 30 50 5 20 80 1600
Forage concentration(OCl/kg)" 0.5 7 a 17 13 19 1.8 a 30 700
14 Peak milk activity(pCIt) 0. 15 2 1.5 3 2.4 4 0.09 0.4 1.4 30
Total Intake (pzCI) 0.9 10 40 70 70 to 2 7 26 400'Newborn Infant Includes fetus (pregnant women) as critical segment of population for lodine-131.2"Infant" refers to child less than I year of age.'From fallout, Iodine- 131 Is the only radlolodine of significance with respect to milk contamination beyond first day. In caseof a reactor accident, the cumulative Intake of lodine-133 via milk Is about 2 percent of lodine-131 assuming equivalent de-position.Fresh weight.
sIntake of ceslum via the meat-man pathway for adult may exceed that of the milk pathways therefore, such levels in milkshould cause surveillance and protective actions for meat, as appropriate. If both Cs- 134 and Cs- 137 are equally present asmight be expected for reactor accidents, the response levels should be reduced by a factor of 2.

CHAPTER 3. METHODS OF ANALYSES FOR RADIONUCLIDE DETERMINATION r3.1 INTRODUCTION
The measurement of radilonuclides in food can be accomplished by either laboratorymethods or field methods using portable survey instrumentation. Unfortunately, neithermethod of analysis was developed expressly for the purpose of implementing protectiveactions. In order to provide Instrumentation guidance to the States, the Federal Radiologi-cal Preparedness Coordinating Committee formed a Task Force on offsite instrumentation.A draft report on Instrumentation analysis methods for the milk pathway is now undergoingreview by the Task Force and a second report on other food is under development. Thiseffort is being fostered by past and current contracts of Nuclear Regulatory Commission(NRC) and Federal Emergency Management Agency (FEMA) with Brookhaven National Lab-oratory and Idaho National E ineering Laboratory.
The material and methoifs are given as Interim guidance dtil these more definitivereports are available. It should be noted that laboratory methods of Chapter 3.2, below,were developed for environmental monitoring purposes and are more sensitive than requiredfor protective actions Implementation. And, conversely, the field methods of Chapter 3.3are generally inadequate for; the purpose of Implementing action at the Preventive PAGleveL Analysis methods should be able to measure radionucllde concentrations in food lowerby a factor of 10 than the derlved levels for Preventive PAG. Thus, It may be necessary touse a combination of laboratory and field methods In implementing and ceasing protectiveactions.
3.2 DETERMINATIONS OF RADIONUCUDE CONCENTRATIONS BY SENSITIVE 0LABORATORY METHODS
Many compendia of metods of analysis of environmental samples are available. TheEML Procedure Manual recommended is noted for its up-to-date methodologies, whichcontinuously undergo revisuoti and improvement (48). Analysis need not be limited to refer-ence 48 but laboratory ana.jsis of food should provide limits of detection as listed below,which are lower than required for protective action:
i d Limit of detection*Ridionucl de PCi/Ilter or kg
1-131 10Cs-137 10Sr-90 1Sr-89 5
*Concentration detectable at the 95-percent confidence level.
A source of more rapid methods of analysis of radionuclides In milk, applicable to theserecommendations is descrlbea by B. Kahn et al. (49). The methods for gamma radionuclideanalysis (applicable to 1-131, nd Cs-137 presented in this reference are also applicable topasture. The gamma scan -determinations of 1-131 and Cs-137 in milk (or water) cangenerally be accomplished wIthin 2 or 3 hours. For samples measuring in the 0-100 pCi/literrange, the error at the 95-percent confidence level (2 sigma) Is 5 to LO pCilliter. Forsamples measuring greater than 100 pCI/liter the error Is 5 to 10 percent.
18

Radiostrondlum procedtes perric anayses of several samples simultaneously in 5 hoursof laboratory bend me plu 1-2 weeks for lngrowth of yctrium daughters If the laboraco-
N ry Is set up for route analysis of these dlonucldes recovery in tracer studies is o t 5percent.
An Ion exchange field method for determination of 1-131 In miLk, whid. uses gammaspectroscopy after sample cillecton, has also been described (50) . The main advantage ofthis method Is that It permits a large number of samples to be processed In the field orshipped and analyzed In a central laboratory.
For analysiis of samples other than milk the HASL reference (#3) 1s recmfn ended.
3.3 DETERMINATIONS OF1 RADIONUCLIDE CONCENTRATIONS BY FIELD METHODS
33.1 Ground Contamination (Beta Rai1ation)
The conversion of ground survey readings to contamination levels can be accomplishedby using the following equatioin and factors (assuming a metal tube wall thicks (seel) of30 mg/cm2)%
1. Use a GM rvey meter calbrated to yield 3,000 counts/min per I mR/h of Ra y.
2. Hold the probe not more than cmn above- the ground with the betashdeld open.
3. Asstre that 100 couics/min can be detected above a normal 50 to 100 counis/minbackground.
k# Take readings in open terrainq that is, not In close proxdmity to heavy vegetationj cover, or bulldIngs.
For determinations of groizd depositionr
D=RxcF
where, D ground deposItion (In ji C/m2),
R x G-M reading (In units of 10 couns/min) (backgroundcorrectd), and
F x factor given In Table 11.
For determination of concentrations In vegetation:
C- (D xf) d
where, C x concentration (In li CIkg),
D a ground deposition (in u Cl/m2),
f * fraction of deposited nuclide in dte vegetation, and
d x density of vegetation cover (in kg/m 2).
Generally, f ranges from .1 co I and 1s usually caken co be 0.25 for 1-131 in theUnited Kingdom, and 0.5 In the United States.
19

Data of a similar nature may also be found in "Emergency Radiological Plans and Proce-dures," in the Chapter (Item 04.3.4) on "Conversion of Survey Meters to Concentration," (51).
Table 11. Ground :surface contamination levelsa of various nuclides -
required to yield 100 counts/min (net) on a G-M meter (open window) C)F
Nucllde (u Ci/ml per 100 counts/min)
Zr-93 + Nb-95 6
Ce- 141 2
1-131, Ru-103m, mixed RuRh (100-d old)b 1
Co-60, Sr-89, Y-90, Y-91, Cs-137, Ba-140, La-140Ce-144 + Pr-144, Ru-103 + Rh-106, 0.3mixed radlolodines (1-h coiI-week old),mixed fission-products (100-d old)
'Level varies with background readings, ground roughness, and vegetation cover.bAge refers o time since irradlation of the fuel from which the Fission Products werereleased.
332 Herbage
A field method for es imacion of radionucllde contamination at the response levelsequivalent to the Emergency PAG for pasture (forage) which has been suggested byInternational A omic Energy Agency (=2) is as follows
full.fromfrom
1. Obtain enough vegetation to fill a 30 cm x 40 cm plastic bag approximately hal CThis is about one-thlrd!of a kilogram (Note: the vegetation cover should be obtainedat least I m2 of ground. The vegetation should be cut at approximately I to 2 cmthe ground and should not be contaminated In the process by soil).
2. Note the area represented by this quantity of material.
3. Compress the air from the bag and seal.
4. Transf er the sample to a low background area.
5. Flatten bag and lay probe of a portable G-M survey meter on the center of the bag.
6. Wrap bag around probe and note reading (window open and background corrected).
7. Calculate the contamination from the following equation:
C x R/k
where, C z vegetation concentration (in u Cl/kg),
R a G-M reading (In units of 102 counts/min) (background corrected), and
k = 102 counts/mmn per u Cl/kg as given in Table 12.
u Cl/kg to li Cl/mr on the basis of the area represented by the sample.S. Convert) I
20

9. The limiting radionualde (Le., having the lowest recommended PAG relative -toits deposition on pasture) is iodlne-131. According to Table 12, this radlonuclideis detected. with the lowest efficiency. Thus, If the operator assurnes thisradionuclide to be exclusively present In the pasture the most conservativeestimates relative to the Emergency PAG would be reached.
Table 12. Typical G-M survey-meter readings probeinserted in the center of a large
sample tf vegetation
kNucllde I (10' x counts/min per UlI/kg)
Sr-89, Sr-90 4 Y-90 20Ru-106 + Rh-106 50Ba-140 + La-140 101-131, Cs-137 4
3.3.3 Ml~k
The experimental data for fleld determination of radlonuclides in milk are limited todetermination of iodlne-131, an'd the details are rather sketchy. What material is availableEs abstracted below.
1. Although no data are available for field determination of radlonucLides other than--4odlne-131-in milk,- Table-13-presents experimental information obtained in water (52.33).
To the extent milk is more self-shielding than water, the following data is presented as aguide rather than a means of analysis
Table 13. G-M survey-meter open window readings (counts/minper uClillter) (probe Immersed in contaminated water)
Size of sample containerNuclide I liter 5 liters >10 liters
Counts/min per UCiti
Sr-89 2000 2000 2000Sr-90 + Y-90 2000 2000 200:Ru-106 + Rh-105 6000 8000 100001-131 500 0OO 1000Cs-137 400 600 800Ba-140 * La-140 1000 1500 2000
z- Metnod of Kearney U04:
a. Instrument: CDV-700 Model No. 6B with beta window closed at all times.
b. Geometry: See Figure 1.
c. The count rate is determined by ar. If the counts per minute recorded bvear are more than 60 to 70 cpm, then the milk should be diluted with "pure"water so as to produce a sample having a 30%-30%, 25%-75% or otherconcentration low enough to produce counts per minute somewhat less than60 to 70 cpm.
d. Background: The experimental conditions dupllcated "sky shine" from a trans-Pacific transfer -of fallout. If the exposure around the test hole was 0.75mR/hr a couple of feet above the hole, the sky shine increased cpm recorded
21
'i

by the probe lelded within the test hole by 3 cpm. Background, on the -aver-age, was me sted (in "pure" water) to be 12 to 1 cpm (In an uncontaminatedenvironment). u, total background counts (with sky shine)-is-on the averagearound 19 cpm. (
e. From Figure 2,the Emergencypopulation) Is al
the net counts per minute equivalent to the response level forPAG applicable for milk (Infant as critidI segment of
Pproxdmately 20.
3. Method of C. Dls4feld and J. Klemlsh (.5).
a. Instruments
b.
d.
L CDV 700 unrument turned to 10 X cale and calibration adjustment turnedto require tt e meter to Indicate 2 mR/hr. (NB: Dlscrepencies were notedbe n dat from scale and pulse counting with an oscilloscope).
IL Modified CDV 700 M with factory calibration. Good agreement betweenscale readIn and electronc chedc.
Geometry The'basic container was a .5-galon heavy-wal polyethylene "3erri"type mer ^| 12x9xlO Inches. A 2-Inch O.D. blInd tube was installed toallow the G-M probe to sample the center of the container.
Coznts were tal an Inside and at the top. (external) to the container.
Bakgound w determined In a water flle d plastic container (15x25x20 on)about 7 meters Trom the sample vessel.
e. Net count per.PAG formilk ar
minute equivalent to the response levels for the Emergency <, summarized In Table 14. 7J
4 The International Altomlc Energy Agency repos on a series of experiments (53).The data are dupllcated In Table 15.
5. A forthcoming report of the Federal Interagency Task Force on OffsiteEmergency Instrumwntation for Nuclear Incidents to be published by FEMA Is"Monitortg and MsrunSantem of Radlonucildes to Determine Dose CommitmentIn the Milk Pathwr." A subsequent report by the Task Force will address fieldmethods and rnonitorin strategies for other food pathways.
6. The relative etn ttr of the Various tectniques Is summarized In Table 16.
0
22

Wat eight..Al or ptlsti tube Ploodc lining
-- tis_|. Se r to .
\ 3**th Hlfl-6
OWN1 W on)
e) !'. qxc ta
for Ckgd °\^orA Figure 1. Geometry for maidng
5 ///g n=/L,
,,,mai~l S ,|.
O CD)V 700,1 MO" No Covred with small pwc bag taewd -to calsiot prob to futrther protect ogains dampnes
(After Koan ORNW-900)/
14 _-/
. * /
0 j .
02t _ /t.
0O6 I -- If i
o; 20 AC 9S 0 t 00 t120 1 40 I"1 010 200 220 240
Ne tCounts ter Mine(Ne lants per minute dse m d by ar- Not c nts p r
f M groasNountpermd n rmhuteatb edkground In pure toaere
Figure 2. Net couunts eper mioa tte*
23
1. AtrKaryON-90

I
Table 14. Net counts per minute equivalent to the responseIeveU for the Emergency PAG for milk
Approximatenet cowmTs p minute
Instrunent CDV-700 CDV-700MProbe Position Inside Outside Inside Outside
Response level forEmergency PAG
(Mltk-WLiant) 20P 8' 220 100
(Ml~k-Adult) 260 110 2,900 1.300
. I. ._ . . .
aAt or below backgrowd cpm - precision not adequate.
Table 135. Wvey-meter readings vermn concentrationof 1-131 ln a 40-l1ter milk can
Meter UaC 1-131/llter Net counst per mirnuteused I milk Iide can Outside can
Al-walled 0.9 1,500 300GM probe 0.5 500 200
0.1 100 500. 05 50 50Background 50 50
M ca-window 0.9 600 250GM probe ' 0.5 400 100
0.1 100 500.05 50 50Ba ckgroumd 50 50
0.9 5,500 3,000scintIllation J. 0.5 3,000 1,500swvey-metera 0.1 600 300
0.05 250 150Background 100 100
Transportable 0.10 1,200 -s ingle-dannel 0.05 6.50 -analyzer systemn 0.01 140 -
0.005 so -
lBackground 30 -
:_-j
OCrystal is 3-mm thidc disc of "5Boplastic scipll-ator sprayed with10 mg/crn of ZnS. Effective area Is 6.4 cm.
-.
I * 4
Ili
24
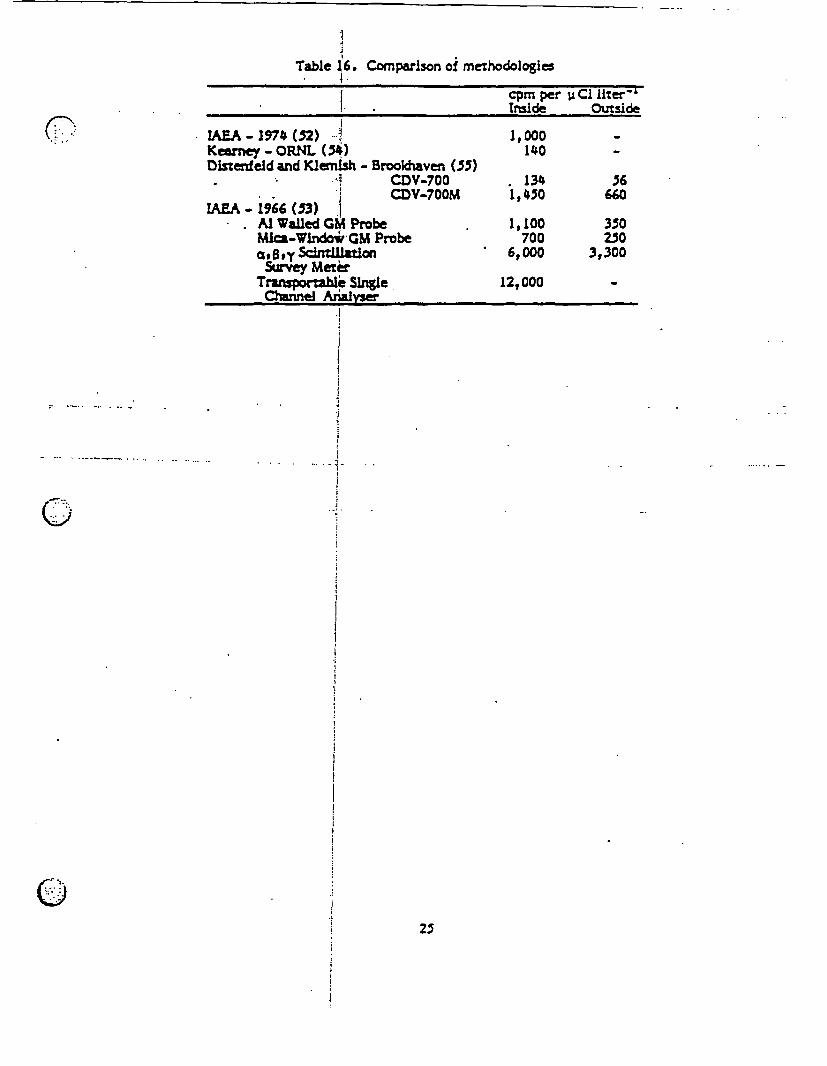
Table 16. Comparison oi methodologies
cpm per u C1 litersInsi . sde Outside
JAEA-1974 (52) -A 1,000Kerney - ORNL (5) 140Dlstenf ed and Klemish - Brokhaven (55)
CDV-700 134 56, CDV-700M 1,450 660
IUA - 1966 (53). .AI Walled G Probe t1,100 330Mla-WlndosGM Probe 700 250.Blnf S tllation 6,000 3,300Swvey Meter
Transporable Single 12,000Chuwnw Arnials
(21
C)I

CHAPTER 4. PROTECTIVE ACTIONS 0The National Advisory Commnittee on Radiation (56) (NACOR) made the following recom-
mendation that applies to action taken to reduce potential exposure following the accidentalrelease of radioactivity.
"A counterineasure, useful to public health, must fulfill a number of i retirments.First, it must be effecdtve tht is, It must substantially reduce population exposures belowthose which would prevail If the counter measure were not used. Second, it must be safe;Lee, the health risks associated with Its use must be considerably less than those of thecontaminant at the level at 1which the countermeasure Is applied. Third, it must bepracticaL The logstics of its application must be well worked out; its costs must be-reasonable; and all legal probl=m associated with its use must be resolved. Next,responsibility and authority for Its application must be well Identified. There must be noindecision due to jurisdictional and misunderstandings between health and other agenciesconcerned with radiation control. Finally, careful attention must be given to suchadditional considerations as Its Impact on the public, Industry, agriculture, and govern-ment.";
An action, In order to be useful must be effective, safe, and practical An action may- beapplied at the source In an attempt to control the release of radioactivity from the source;or, the action may be applied at the beginning of the food chain (soil, vegetation, or cattle),to the immediate vector prior to Ingestion by man (milk or food), or to the population itself.For the most part these recomimendations suggest protective actions to milk, human andanimal foods, or soil and this chapter is limited to actions concerning these media. Furtherrrecommendations by NACOR (56) extend the discussion of protective measures to public jhealth actions directly affecting the exposed population. For details of agriculture actions,several Department of Agriculture reports are available that deal with specific actions forcrops and soil (57,359).
Potential actions relative to the pasture-milk-man pathway are summarized in Table 17.For this pathway, only four countermeasures are rated as effective, safe, and practical (asomewhat arbitrary scale of judgment was used). Of the four, one has distinctivedisadvantages. Although removal of radionuclides from milk has been shown to be practicalno facilities for doing this exist. Another, diverting fresh milk to prosed milk products,freezing and/or storage, is effective only for short-lived radionudles. Thus, changingdairy cattle to an alternate source of uncontaminated feed and condemnation of milkare the only two protective actions rated good for effectiveness, safety, and practicality.
Of course the other countermeasures should also be considered, but they appear lesspromising.
Actions for fruit and vegetables are presented in Table 1X(60,61,62). Note that studiesin which these products were contaminated under actual conditions with fallout (Studies2 and 3) yielded a lower reduction in the radioactivity removed during preparation thanwas the case In an investigation (Study 1) In which radionuclides were sprayed on the food.Depending on the food, reductions between 20 and 60 percent in strontium-90 contaminationsare possible by ordinary home preparation or by food canning processes (60).
Milled grains contain only a small portion of the total radioactive contamination ofthe whole grain; removal of brain from wheat and pollihing of rice are effective methods ofreducing contaminating fallout (58). Todd indicated average concentration of Sr-90 (pCi/kg) (
26

in wheat of wheat berry (22%), wheat bran (68%), and only 4.4% in flour. In rice the corres-ponding values are: whole grain (4.9%), and milled rice (0.7%) (58).
Although these recommendations are intended for Implementation within hours or daysafter an emergency, long-term actions applicable to soil are shown for ibformation purposesonly In Table 19. Alternatives to decontamination and soil management should beconsidered, especially If the radloactive material is widespread, because great effort isrequired for effective treatment of contaminated land.
The concept of Protective Action asswues that the actions Implen ented will continuefor a sufficient period of time to avoid most of the projected dose. rie concentration ofradioactivity ina given food will decrease because of radioactive decay and weathering as afunction of time after the Incident. Thus, as discussed in Chapter 5 of this report, actionsthat have a positive cost-b&ielt ratio at the time of initial contamination or maximumconcentration may. not have alposltive cost-benefit ratio at later times. Therefore, depend-ent on the particular food and food pathway, It may be appropriate to implement a series ofprotective actions until the concentrations in the food have essentially reached backgroundlevels.
As an example of the Implementation of protective actions, consider the case where anincident contaminates the pasture-cow-milk-man pathway with a projected dose of 2-3times the Emergency PAG due to lodine-131. In such a situation these protective actionsmay be considered appropriate
1. immediately remove cows from pasture and place them on stored feed in order toprevent as much lodIne-131 as Is possible from entering the milk1;
-. L -Condemn any milk tit exceeds the Emergency PAG response at the farm or milkplant receiving station;
3. Divert mllk contaminated at levels below the Emergency PAG to milk products;C >i and
4. Since the supply of stored feed may be limited and the costs of this protectiveaction greater than diversion to milk products, the use of stored feed may be the firstaction to cease; this should not be done, however, until the concentration of 1-131 hasdropped below the Emergency PAG and preferably Is approaching the Preventive PAG.
5. The diversion of fresh milk to milk products must continue until most of theprojected dose has been avoided; this action might be ceased when the cost-effectivenesspoint1is reached or the concentration of lodlne-131 approaches the background levels.
This discussion assuimes that there is an adequate supply of whole milk from noncon-tarninated sources, that there is an available manufacturing capacity to handle the divertedmilk, and that the lodlne-131 is the only radlonuclide involved. In an actual situation theseconditions may not be present and other factors may affect the practicality of proposedprotective actions. The agency responsible for emergency action must identify and evaluatethose factors that affect the practicality of protective action, and thus develop a responseplan (with tentative protective action) that is responsive to local conditions and capabilities.
0.27

Table 17. Actions applicable to the pasture-milk-man pathway (compiled from references 57 and 59)
Radionucilde(s) for which protective action Is appflcablePracticality
Actfon Effectiveness Safety (elfort required)
Applicable to cattleProvide alternate source ofuncontaminated animal feed
Add stable lodine to cattle ration
Add stable calclum to cattle ration
Add binders to cattle ration
Substitute sources of uncontaminated water
Applicable to milkCondemnation of milk
Divert fresh milk to processed milk products
Process fresh - store
Process fresh - store
Remove radlonuclides from milk
N(t 9fteffectivebMarginals less than 90 elfectiveCDepends on avaliabilltydSomewhat dependent on volumeeNo processing plant presently available
C
'l'It "Sr, "Sr, IIICs ( .)a
lIot Marginaib
"- Sr, -Sr Marginalt 12Cs, ;Sr# 9ISr Marginal
""Cs, iSr, "Sr (. )
(4)
Some hazard
Some hazard
Questionable
(4.)
(4.)
(4)
Questionable
(W)
(4)
(4.)
(4.)
(4)
(+)
(,)C
C,)
(4.)
(4.)W+
Good
II ,sol Sr, is Sr, 187C.
'8'', I'Sr
'Sr, S'75r
III i Sr, 9ISr, I Cs
(4)
(4)
Marginal
(4)
(W)
Good
Good
Good
Good
)."
' J 3,

II
i S
Table 18. Percent reduction In radioactive contamination of fruits and vegetables by processing
Study I(60)... Normal food preparation for freezing, canning oir dehydration
Ex rnal CtaIptiona Intgn!ra ; ContagltionaStudy 2 (61)
CaffingStudy 3 (62)
Home paration
%a
J r, * - - 'a
Spinach 92 9S . U 22Snap beans - 62Carrots - 19 19Tomatoes - - 65 21 28Broccoli 94 92 72 89 - -Peaches "'0 "100 -1100 "100 ,50Onions - - - - - 37Potatoes - - - 24Cabbage - - - -Green beans - - - 36aContaminatlon on surface Is referred to as external contamination. Internal contamination Is contamination of fleshy portionof product from surface deposition of radlonuclide.

Table 19. Actions applicable to soil (compiled from references 57 and 59)
iladlonuclide(sl for which protective action Is applicablePracticality
Action Ellectlvenessa Safety (effort required)b
Applicable to soil
Soil management-minimum tillage-deep plowink with root InhilbitionIrrigation & leachingliming & fertilizing
" Sr"Sr9Sr" Sr
Poor to fairGood to fairPoorPoor to fair
Mt .l016 ....r ot appcable * GoodPoorGoodGood
Removing contaminated surf ace crops '6Sr%a
Most poor
Removal of soil surf ace contaminationswarm weather with vegetation cover "Sr Good to faircold weather no cover "Sr Good to poor
'Rating for reducing strontium-90Good- 95% reductionFair - 75-95% reductionPoor - 75% reduction
bRating for effort requiredGo not significantly more than normal field practiceFair - extra equipment or labor required KPoor - very great requirement of equipment, materials, and labor
N
Poor to fair
PoorGood to poor
i?'.

( CHAPTER . COST CONSIDERATIONS
5.1 COST/BENEFIT ANALYSE5
5.1.1 Introduction
The general expeczation is that protective action taken in the event of a nuclearincident will result in a net societal benefit considering the cost of the action and thecorresponding avoided dose. These cost assessments, inclui1ng cost/benefit analysis, havenot been used to set the nwnerical value of the PAG's but rather to evaluate the feasibilityof specific protective actions.
* Ac lesa two basically dIfferent approaches can be used to assess the cosc/benefic ratioof protective actions for the mlk. pathway. One approach would be to assune a protectiveaction scenario (naximum milk concentration and length of time of protective action) andto calculate the total ast of die action and the benefit because of the avoided dose. Theratio of die cosggbeneflc can then be used to scaledthe maxdmum milk concentration to thatconcentration that yields equal costs and benefits. The problem with this approach is that
* positive net benefits when milk concentration of radioactivity is high are used to offsetthe negative net benefits during the later times of action.
This deficiency leads to the second approach of calculating the milk concentration on aper Uiter basis where the cost of the protective action equals the benefit because of thedose avoided. This approach will be used here since it gives a clearer picture of the
(Ti identified costs and benefics. The specific concentration at which costs equals benefitsshould nor however be viewed as the appropriate level for taking protective action. Thephilosophy of protective action is to take action to avoid most of dhe projected doses.Further, the simple analysis considered here treats only the direct cost of protectiveactions and ignores the administrative costs of starting, monitoring, and ceasing action,and other related social and economic impacts.
Although the PAG ommendations provide that protective actions be taken on thebasis of projected dose to the infant, cost/benefit analysis must consider the cost impacton the milk supply and the benefit on a whole population basis. Accordingly the benefitrealized from avoiding the dose associated with a given level of milk contaminationC (UCI) must be summed over the age goups having different Intakes (D and DoseFactors (OF) and Is:
Benefit = C ( CI/l) x Value (Srem) El/(Id).DFi(rem/ uCl).
The total cost of the protective actions, which must also be summed over all the age intakegroups is:
Cost = PA COST x Eli
Cos ts are in 1930 - 1981 dollars. These equations can then be solved for the concentration(C) at which cost = benefit giving:
C (C=B) PA COST EliValue ({/rem) MU * DF1)
31

5.1.2 Benefit of Avoided Dose
In situations In which there has been an uncontrolled release of radioactivity to the oenvironment, both the health savings and cost of a protective action can be expressed interms of dollar values. This does not exclude the probability that undesirable features willresult from an action thau is difficult to evaluate in economic terms.
A previous cost-beneflt analysis desclbed the radioactive concentration of iodine-131 inmilk at which It would he justiflable to Initiate condemnation of milk (63). Following is asummary of the moneta-y benefit of radiation dose avoided using the approach suggested,with changes because of Increased costs over time and new data on the relative Incidence ofvarious tumors.
The International Commission on Radiological Protection, (64) has endorsed the principleof expressing the detriment from radiation In monetary terms in order co facilitatesimplified analysis of costs and benefits. This permits a direct comparison between thesocietal advantage gained in a reduction of the radiation dose and the cost of. achieving thisreduction. Cost-benefit analysis Is the evaluatlon procs by which one can determine thelevel at which, or above which, It would be justifiable to Initiate the protective actionbecause the health savings equaled or exceeded, the economic costs of the protectiveaction. Certain factors, such as loss of public confidence In a food supply, are notconsidered nor are economic factors because of hoarding and a shortage of supplyconsidered. A similar treatment of the problem with almost the same result hasbeen published (65). This type of xcse is useful prior to taking an action as one, andonly one, of a series of Inputs Into decsiootaldng.
The costs, and hence health savings to society, of 1 person-rem of whole-body dose (theproduct of a dose of 1 rem to the whole body and I person) has been estimated by variousauthors to be between $10 and $250 (66). The Nuclear Regulatory Commission (NRC) valuefor a cost-benefIt analysis for augmented equipment for light-water reactors to reducepopulation dose, sets radiation costs at $1000 per person-rem (67).
Based on medical expenses in 1970, the total future cost of the consequences of allgenetic damage of 1 person-rem (whole-body) was estimated by the BEIR Committee (2) tobe between $12 and $120. These costs are in good agreement with estimates made byArthur 0. Little, Inc, for the Environmental Protection Agency, which -calculated thatin terms of 1973 dollars, I personm of radiation yielded a tangible cost of between $5 and$181 due to excess genetic disorders. A tangible cost of between $7 and $24 per person-remwas estimated to be the result of excess cancer In the same report. Therefore, the totalhealth cost of a person-rem from these studies Is between $12 and $205 (63)..
Assuming that $200 is a reasonable estimate for the overall somatic health cost Co socie-cy per person-rem whole body, the proportionate cost for IndIvidual organ doses must thenbe derived. For the purposes of assessing health cost, it Is appropriate to use the relativeIncidence of cancer estimated to result from organ doses vs. whole body doses. From BER-m (3) (Table V-14 and V-17, and using an average of the male and female Incidence) thethyroid contributes 20 percent of cancer and leukemia (red bone marrow doses) 11 percentof the total cancer Incidence. Hence, the monetary costs per rem of radiation dose avoidedare: to thyroid $40; and to red bone marrow $22.
5.1.3 Protective Action Casts
The direct cost of protective action will be assessed for (1) cost of stored feed, (2)condemnation at the farm (farm value), and (3) condemnation at the processing plant (retailvalue). (9
1. Cost of stored feed. For the participating herds (May 1, 1978 - April 30, 1979)the Dairy Herd Improvement Letter (69) reports a consumption of 12,600 lbs. of succulent
32

forage and 3,000 lbs. of dry forage, with a corresponding annual milk production of 14,129lbs. 16200 liters). (The cows also consuned 5,800 lbs of concentrates, which are not ofconcern here.) Taking 3 lbs. of succulent forage (silage) as equivalent to I lb. of hay, theannual hay equivalent consutnption is 7,200 lbs (70).. Thus, 1.16 lbs. of hay equivalent isconsurned per liter of milk production. The 1980 average price received by farmers for allbaled hay was $67.10 per ton or $0.0333 psr lb. (71). The Protective Action (PA) cost ofbuying baled hay to replace pastwe as the sole forage source is then $0.039 per liter.
2. Mllk-farm value. The average pc ce received by farmers for fluid-ellgible milk,sold to plants and dealers in 1980, was $13.'1 per hundred weight (monthly range $12.70 to$14.20) (71). The lower prices are recelsed during the pasture seasn of April throughAugust. For 4# liters per hundred weight, tde farmer value of milk is $0.30 per liter.
3. Mllk-retail value. Since it may be necessary to take protective action at somestage In the milk processing and distribution system It is appropriate to consider the retailvalue of milk. If condemnation of milk Is taken at the receiving station or processing plantthere will be additional costs above farm value associated with disposal. It is felt thatretail price should represen. an appropriate value. The average city retail price of fortifiedfresh whole milk sold in stores, 3anuary through October 1980 was $1.037 per 1/2 gallon(72). The monthly price Increased from $1.01, in January to $1.067 in October, apparentlybecause of inflation. Based on the average price the value of $0.56 per Liter will be used.
5.1.4 Population Mhlk Intake and Dose
Table 20 summarizes the milk intake by population age groups and gives values of theage groupi-ntake factor lil/d).-The otal intake by a population of 1000 is 211. I/d or an..average individual daily intake of 0.28 L The intake factor (Ii) is used with the dose factorOFi listed in Table 21 to calculate the dose factor sunmed over the whole population
( D weighted by age per PCI/I of milk contamination.
3.1.5 Milk Concentration For Cost 5 Benefit
The above results are then used to calcultate the milk concentration at which theProtective Action (PA) costs equals the benefit from the dose avoided. The results arepresented in Table 22. The cost a benefit concentration for use of stored feed in place ofcontaminated pasture is about 0.2 to 0.3 of the Preventive PAG for strontium and 0.01 to0.02 for iodine and cesium. For condemnation, the cost a benefit concentrations based onfarm value of milk have ratios of the Emergency PAG similar to those above. The cost =benefit concentrations based an retail value of milk are about a factor of 2 greater thanthose based on the milks farm value. The fact that the cost a benefit concentrations are asignIficant percent of the PAG for strontium results largely because the value of the person-rem dose to red bone marrow is oni-ninth that of whole-body doses while the PAG's are setat equal doses consistent with current regulations. Further the controlling PAG's are forthe infant, while the cost/benefit reflects population averaged benefits.
Table 20. Populatlon milk intake 11 i)Persons per Intake (i)y1000 popu- Milk intakea age group
Age group lation (lid) (l/d)
Inutero 11 .4 4.40 < 1 14 .775 10.91 - 10 146 .470 68.611 - 20 196 .360 70.6>20 633 .200 126.7
fi 281.2QICRP, 1974
33

Table 21. Population dose factors
5r-89 Sr-90i x OFi li x OFi
DFI rem * 1 DFI rem * I Reference forAge groug rem/nuCl uCI d remttiCl uCl d DFI valuesa
Inutero .414 1.32 4.03 17.7 0 yr old0 < 1 .194 2.12 2.49 27.2 0.S yr-old1 - 10. .0565 3.98 .929 63.8 Average11 - 20 .0175 1.24 .82 57.9 Av 11 yr& adult> 20 .012 1.52 .70 83.7 Adult
VI1DFl 10.58 255.3aSee Chapter 2.
0
Cs-134 Cs-1371I xO O1 Li x DFi
DFi rem * I DFi rem * 1 ReferenceforAge roup rem/uCl 3CI d reminCl7-Cl d DFI valuesZ
In utero .063 .3 .061 .27 Adultb0 <1 .113 1.29. .071 .77 Infant.I - 10 .093 6.39 .066 4.53 Av. Infant
& adult-11 - 20 .093 6.57 .066 4.66>20 .063 8.51 .061 7.73 Adult
E£11FI 23.06 17.966aSee Chapter 2.bNo credit talken for reduced bioiogicaJ half-life In pregnant women.
0.
1-13111 x DFI
DFI rem * I Reference forAge -you. rem/uCl uCl d DFI valuesa
In utero .8 35 Max. estimate0 <1 16 174 NewbornI - 10 5.7 391 Average from
smooch curve11 - 20 2.1 148 15 yrold> 20 1.5 190 Adult
EHi DFI 938a5ee Chapter 2.
I ,
34

Table 22. Milk cogncenrratlon ar whidc cost = benefit(Population basis - value of EUxDFI for 1000 persons)
Sr-89 Sr-90 1-131 Cs-134 Cs-137
El x DFI 10.S8 255 938 23.1 17.96rem I .
Yalue ($/rem) 22 22 40 200 200
PA coast I' CONC. (Cost = Benefit) (uCi/l)
Stored Feed $0.039 .047 .002 .0003 .0025 .003Farm Milk 0.30 .36 .015 .0023 .018 .025Retail Milk 0.56 .68 .028 .0042 .034 .044
Peak CONC. (uCl/1) - -.E
Prevenive PAG .14 .009 .015 .1 .24Emergency PAG rdanc 4 1.4 409 .1 1.5 2.4Emergency PAG adult k 30 .4 2.0 3.0 4.0
- - ~~~~~~~~~~~~~~~~~~......-......... .. ............ _...
52 ECONOMIC IMPACT r
.
The Emergency Planning Zone (EPZ) for the Ingestion pathway has been set at S0 miles(73). The area Impacted chat requirei protective action is the major factor influencing cost.Assesment of the economic Impact, ill be considered for the cse of contamination of themilk pathway In one 22.5 Sector out to a distance of 50 miles. Table 23 gives data on theannual sales of whole milk and rtoallares of leading dairy States and selected Stares. Theannual milk sales in Wisconsin of 3.2 x 10' lbs. per sq. mile exceeds that of any ocherSae and will be ued to asess cheiconomic Impact. There may, of course, be Individualcounties and areas surrounding nuclear power plants-where milk production exceeds theWisconsin State average. The Wlscorsin average should, however, represent a maximum formost areas of the United States.
Table 23. Milk production of selected States(Statistical.Absracr of dte U.S., 1978)
Whole milk sold Total area Milk per uzir areaStare (10' lbs/vear) Wmi2) 105 lbs/mi3
WI 20.5 3 56,154 3.52VT 2.064 9,609 2.14NY 9.92 49,576 2.00PA 7.37 ; 45,333 1.64IA 4. 07r 56,290 1.38CT .595s 5,009 1.19MN 9.27 84,068 1.10OH 4.43 l 41,222 1.08Ml 4.63 58,216 0.80CA 11.53 158,693 0.73MA 0.55 3,257 0.67NJ 0. 52. 7,836 0.66
Another important factor in asessing the economic impact of protective actions in themilk pathway is the length of rime that such actions will be necessary. During most of theyear in northern parts of the U.S., caritle will already be on stored feed and there will be no
35

additional costs for the stored feed!protective action. For other situations and the Erner-gency PAG, the time over fhich .protective actions will be necessary is a function of anumber of parameters unique to each site and the causative accident. -Thus, what areintended as conservative as'3suptions will be selected. The time behavior of 1-131 onpasture grass is controlled bE the 8dy radioactive half-lif e and the 14-day weathering half- 0 /life (yielding an effective Oalf-llfe;'of about 5 days). Milk which contains 1-131 at theEmergency PAG of 0.15 uCi/l willibe reduced to the cost = benefit concentration (farmvalue) of 0.0023 vCi/l abobt 30 days later. Obviously in most cases of an atmosphericrelease, those areas closer to the release point will have higher levels of contamination andlonger tiunes of. protective aktion. The NRC and EPA in the Plannini, Basis Report NUREG-0396 (NR, 1978) assume that radiation doses from the airborne plu.ne decrease accordingto the r ti factor. Use of this''factor for contamination of pasture results in milkconcentrations at 2 miles thit are about 100 times that at 50 miles. For an effective half-life of 5 days this would re ar' additional 30-35 days of protective action at 2 milesover that at 50 miles to yield the iame milk levels upon ceasing action. Although thesemodels cannot be assumed to be rigorously accurate in a specific accident situation, they doindicate that action might bi reured for I or 2 months.
NUR.EG0396 notes that thu dose from milk pathway is of the order of 300 times thethyroid dose from inhalation|(74). Unrder this assumption (and above models), the food PAG'swould be exceeded at hundreds of VMiles If protective action because of inhalation wererequired at 10 miles. It shouild be noted that the meteorological models that are empiricallyderived are not likely to be Valld forl such long dlstances. Further changes in wind directionand meteorological disperslbh conditions may reduce the ievels of pasture contaminationand .the downwind dlstanc& For assessing ecomornic impact, contamination of a 22.5'Sector out to a distance ,f 50 mrles will be arbitrarily assumed, even though actualcontamination, patterns are ot likely to be similar.
Under these assumption; we then' have:
Area (Circle - 50 mile radius), 7850 ml2 .)Area (22. Sector- 5Qmile)-4 491 ml,
Milk Production - 3.52 x 10 I lbs/mi I per year - 2.93 x 10 Ibs/mi2 per month
Production (22.'/50 ml Sector) - 1.44 x 10⁷ lbs./month
Cost of Stored Feed -1 $0.017 per lb. milk
Cost Impact (2fI/50Imile Sector) - $2.46 x 10³ per month
Thus, the dlrect c o st cf 'pla! COWS on stored feed within a 22.5' Sector out to 50miles based on farm value,1would be about $0.25 million per month. The cost would be zeroduring that portion of the year and in geographical areas where cattle are already on storedfeed. While such protective actions might be required for periods up to 2 months at areasnear the accident site, suchl would not be the case at the greater distances which involve themajor portion of the area. Conderiination of milk is the protective action of last resort forareas of very high contamination. --As noted above, the farm value of milk Is $0.30 per liter.Thus, the condemnation ot milk ai the Emergency PAG for a 22.5"/50 mile sector wouldhave a cost of about $2 million for a month of protective action. Where 1-131 is the onlysignificant contaminant, vhole mlk can be diverted to manufactured products, such aspowdered milk, which can stored to allow disappearance of the radioactivity. We do nothave cost figures for this acion. ft
It is of interest to cot pare the arbitrary assumptions on land area used above to the .*contamination resulting frm the Windscale accident. (NB: This was not a power reactor ofthe type presently used in *e United States). According to Booker, the Windscale accidentresulted in milk values exceedlrig 0.015 uCi/l at about 200 kilometers or 125 miles
36

C' -downwind (73). Milk contamination was estimated as exceeding 0.01 uCI/I over 16,700
km 1. or 6400 ml 2. Thus, the - Widcle accident. resulted in contamination exceeding
the Preventive PAG over an area aboui 10 times greater than that assuned above. Protective
actions were taken at Wlniisrcle i tk milk concentrations of 0.1 piCi/l (approximately
the Emergency PAG) and i'vOlveda area of about 120 kml or 200 mia for periods
of 3f6 weeks. .. f ,. 2 km ' *i
3.3 COST-EFFECTIVENESS ALYSIS
Cost-effectiveness analyis is defined as the economy.with which a particular task may
be carried out. I1
The data available for this analysis was obtained with the cooperation of the Nuclear
Regulatory Commission. Briefly, the RC employed the models cited in the Reactor Safety
Study (7) to evaluate the agricultural costs and cumulative dose commitment that could
occur under two accident ='ndtlori - a design basis for siting purposes and a PWR 7
*accldent (7). 'A typlcil're ctor site in the northeastern United States was envisioned.
Unfortunately, the parameters emplojed are not directly comparable with the pathways and
dosimetric parameters associated with the PAG's. Nevertheless, a good indication of the
effects of taking a protective actIo6 (in this case the condemnation of milk) at specific
Interdiction levels can be airtained.
Figure 5 presents the agr icturalcosts at specific interdiction criteria. The costs are,
f or the most part, associated with thetmarket value of milk. The interdiccion criteria are in
terms of rem to an infant ttyrold. trom Figure 3, It can be seen that costs drop rapidly
between 0X. and 10 rem and!more giadualy after 20 rem. The ratio of costs for a design
basis accident (siting) to a PWR 7 remains constant.
10_
1:. U
X I1.. .1o.
4.\
i: U~.
C )
0>I...
Figuret 3.
lJ:
30 . 40 50
IRA (ramn-"r4id)60
Agr,cultural cost model accident.
37

Figure 4 is a graph of the dose ominmItent for a design basis accident and a PWR 7assumsng protective action js Initi ed at specific interdiction levels. *_The dose commit-ments are accrued via external as'! well as Internal exposure (inhalation and Inge ion )Therefore, they do not exactly fit the situation described in the PAG's under consideration. IcThe dose commitment risesmrapldly twhen the interdiction criteria are between 0.5 and 20rem. The increase in dose commitrient for a design basis accident is less rapid than for aPWR 7. Hence, at or abovelan inte dlction criteria of 20 rem, savings in radiation dose areminimal compared to the savings arued below 10 rem.
1::
jio ad *7d,
I1r
10; 1 AO I0 I f0
I MMiTtCN CUTSEM (u~nmet
Figu 4. Doe commitment model accident.
5.4 SUMMARY AND CONCLUSION
The milk concton at whic the population benefits (from dose avoided) equals thedirect costs of stored feed is equivalent to about one-third of the Preventive PAG for stron-tium and to one-flftieth or less fSo iodine-131 and cesium. If condemnation is based onretail milk value, then the iespecti e concentrations are about one-half and one-fiftieth ofthe Emergency PAG. Unless the ndrect costs of implementing protective actions aresignificantly greater than the direc costs, it appears feasible to take protective actions atthe respective PAG level Ond to Continue such action to avoid about 90 percent of theprojeirted dose for iodine and cesium. In the case of strontium contamination of milk, suchaction is only cost benefcial unift the concentration Is about 30 percent of the PAGresponse level. f
Estimated costs of taking protective action within the Emergency Planning Zone (EPZ)for a 22.r Sector to 50 miles (about 500 miz) is $Z million per month for condemnation(farm milk value) and $0.26 milliin per month for use of stored feed. In the case of
38

(r!
atmosperic dispersed contaminationnear th site.r
The 'recommended appr ach is 1contamination of milk at 4 s14ilfcmanufactured products that have aconsider condemnation of milk exceepublic can be limited to less|:than 10thyroid) by actions having direct cost
protective action may have to continue for 2 months
to place all coWS on stored feed to prevent theint levels, to divert iodine contaminated milk tolong shelf life to allow radioactive decay, and only
ding the Emergenc PAG. It appears thac doses to thepercentof the Preventive PAG (or less then 0.15 rems of a few millon dollars for a signifIcant accident.
1.
2.
3.
5.
C4 6.
8.
9.
10.
11.
12.
13.
14.
REFERENCES
Lowrance, W.W. Of Accepmbl Risk. William Kaudmann, Inc., Los Altos, CA, p. 8-11
(1976).
National Academy o' Sclen ', National Research Council. The Effecs onPopulations of Exposure to Lo4, Levels of Ionizing Radiation. Report of the AdvisoryCommittee on the Blol gica1 E fects of Ionizing Radiation (1972).
'National Academy of S iences,fNational Research Council. The Eff ects on Populationof Exposure to Low Leeils of ozing Radlation. Report of the Advisory Committeeon Biological Effects on laniziin Rdiation (1980). : - -
U.S. Department of Commerce Statical Abstract. Washington, D.C. (1979).
National Cancer Iretitue. End Results In Cancer. Report No. 4, National Institutes
of Health, DHEj, Washlngton, j1C, pp. 161-164 (1972).
Otway, HJ., R.K. Lohrdlng, and M.E. Battat. Nucl Tech 72:173 (1971).
United States Nuclear, Regulatory Commission. Reactor Safety Study. WASH-1400
Appendix VL Washington, DC (1975).
Dinman, BR. The reality and ptance of risk. AMA 244:1226 (September 1980).
National Oceanic and Atmospheric Administration (NOAA). A Federal Plan forNational Disaster WrIn and Preparedness. U.S. Department of Commerce,Washington, DC (June 19731.
Metropolitan Life Irntsance Company. Catastrophic Accidents - A 35-year Review.Statistical Bulletin VoL 58, N York, NY (March 1977).
Starr, C., M.A. Greefleld, and D.F. Hausknecht. Nucl News 15:37 (1972). UnitedNations Scientific C mittee*tn the Effects of Atomic Radiation (UNSCEAR) 1977Report. United Nations, New 'ork (1977).
Weinberg, A.W. On|Dose- Reponse and Standard Setting. Institute for EnergyAnalysis, Oak Ridge ssociated Universities, Oak Ridge, Tenn. ORAU/lEA 78-21(0).(December 1978).
Adler, H. An Approach to Setting Radiation Standards. Health Phys 34:719-720 (June1978).
Food and Drug Administration. Proposed Recommendations on Accidental RadioactiveContamnination of Human Food's and Annual Feeds. Federal Register (43 FR 58790)(December 15, 1978). !
39
0-

15.
16.
17.
18.
19.
20.
21.
22...
23.
24.
23.
26.
27.
28.
29.
30.
Shleien, B., G.D. Schmidt, and R. Chlacchierini. Variability in the natural radiationdose as a point of comparison Aor judging acceptable radiation risk. lAEA-SR-36/24 inTopical Seminar on The Prac cl Implications of The ICRP Recommendations, IAEA,Vienna, Austria (March 1979).
Oakley, D.T. Natural Radiation Exposure in the United States. ORP/SID 72-1,Environmental Protection Age cy, Washington, DC (1972).
Bogen, Kenneth T. and Abraham S. Goldin. Population Exposure to External NaturalRadiation Background'd In the United States. ORP/SEPD-30-12, EnvironmentalProtection Agency, Washlngco', DC (April 1981).
Klement, A.W., C.R. MllerJ R.P. Minx, and B. Shleien. Estimates of IonizingRadiation Doses in the United States 1960-2000. ORP/CSD 72-1, EnvironmentalProtection Agency, Washingtqot, DC (August 1972).
Environmental Protection Agenicy. Federal Radiation Protection Guidance for Occu-pational Exposures. Proposed ecommendations (46 FR 7836) (3anuary 23, 1981).
Oberhausen, E. and C.O. Ons0 ad. Relationship and Potassium Content of Man withAge and Sex. Radioactivity ir Man, 2d Symposium. Charles C. Thomas Co. (1965).
Yamagata, N. The concentracion of common cesium and r.:bidium in human body. 3Rad Res, pp. 3-1, 9-30 (Mairch 1962).
F.D. Moore et aL. The Body C11 Mass and Ics Supporting Structure, W.B. Saunders Co.(1963).
Federal RadiarionCouncil M orandum for the President. Radiation Protection Guid-ance for Federal Agen'ces. Ftderal Register (May S, 1960 and September 26, 1961).
International Commission on Fadiological Protection (ICRP). Publicaclion 26, PergamonPress (1977).
International Commission onlRadiological Protection. Report of Committee [I onPermissible Dose for .Intcrna Radiarion (1959). ICRP Publication 2, Pergarnon Press(1959).
National Council on .Radlatcin Protection and Measurements (NCRP). MaximumPermissible Body Burden and |Maximum Permissible Concentrations of Radionuclidesin Air and Water for Occuational Exposure. NCRP Report No. 22, Washington(19,9).I
International Commission on; Radiological Protection. Limits for Intakes of Radio-nuclides by Workers. ICRP P blicatlon 30, Part I and Supplement to Part 1, Annals ofthe ICRP, Pergamon Press (1979).
Evans, C.L, R.M. Krexczhm kr, R.E. Hodges, and C.W. Song. Radioiodine Uptake.Studies of the Human Fetal T iyroid. 3 Nucl Med 8:157-165 (1967).
Dyer yN.C. and A.B. Brill. F tal Radiation Dose from Maternally Administered Feand I1. AEC Symposium Series No. 17, p. 73 (1969).
Kereiakes; 3.G., H.N. Welim: , G. Simmons, and E.L. Saenger. RadiopharmaceutcalDosimetry in Pediatrics. 'S inars in Nuclear Medicine, 2(4):316-327 (1972).
0.7
kUJ
40

31. Durbin, W.D., 3. Lynct, and S. -,Murray. Average milk and mineral incakes (calcium,phosphorous, sodium, and potass&wn) of Infants in the United Scates from 19S4 to 1963;implicadlons for estimating annual intakes of radionuclides. Health Phys 19:187(Augus: 1970),-
32. Kereiakes, 3.G., P.A.:. Felerl F.A. Ascoll, S.R. Thomas, MJ3. Geltand, andEl.. Saenger. Pedlatric radl pharcaceucical dosimecry.: In: RadlopharmaceudicalDosimeery Symposium, "April 26-29, 1976. HEW Publicatlon (FDA) 768044 (3une1976).
33. Loevinger, R. and M. Berman. A Schema for Absorbed-Dose Calculations forBiologically-Dlstributed Radlonicldes. MIRD Sippl. No. 1, Pamphler 1(1968).
34. Wellman, H.N. and R.T. Angeri Radiolodine Dosimecry and the Use of RadioiodinesOcher Than 13 11 In Thyroid Diagnosis. Seminar of Nuclear Medicine 3:356 (1971).
35. National Council on Radiation Protection (NCRP). Ceslun-137 From the Environmentto Man: Metabolism and Dose. NCRP Report No. 52, Washington (January 1l, 1977).
36. Hoenes, G.R. and JX. Soldiar. Age-specifIc Radiation Dose Commitment Factors fora One Year Chronic Intake. NUREG-0172, Bacrelle Pacific Northwest Laboratories(19777.
37. KIllough, G.G., D.E. Duhing, S.SR. Bernard, and 3.C. Pleasant. Estimates of InternalDose Equivalent to 22 Target Orgins for Radionuclides Occuring in Routine Releasesfrom Nuclear Fuel-Cycle Faclicies. ORNL/NUREG/TM-190, VoL 1, Oak Ridge
- Natiorial Laboratory (Juie 19783)
38. Johnson, J.B., D.G. Scewiart, and M.B. Carver. Committed Effective Dose EquivalentC> by Infants and Adult3. Atomic Energy of Canada, Ltd., AECL-6540 (1979).
39. Spiers, F.W., G.D. Zaneill, P.J. Dailey, .R. Whirweil, and M. Goldman. Beca-ParticleDose Rates in Human and Animil Bone. Irm Biomedical Implications of RadiostrontiumExposure. AEC Symposium Series 25 (1972).
40. Whitehall, J.R., and F.W. Spiers. Calculated Beta-Ray Dose Factors for TrabecularBone. Phys Med Blol 21(1):16-38 (1976).
41. Papworth, D.G. and J. Vennari. Recendon of "Sr In human bone at different agesand resulting radiation doses. Phys Med Blol 18:169-186 (1973).-.
42. International Commission on Ridiological Procection, Part 2, Parr 3, and Supplementsto ICRP Report 30 (1980 and 1981).
43. Medical Research Counicli Crizerla for Controlling Radiation Doses to che PublicAfter Accidental Escape of Radioactive Material. HM Stationery Office (1975).
44. Ng, Y.C., C.S. ColsherDJ. Q7i0, and S.E. Thompson. Transfer Coefficients for thePrediction of the Dose co Man jYla che Forage-Cow-Milk Pathway from RadlonuclidesReleased to the Biosphere. UCRL-51939, Lawrence Livermore Laboratory (July 15,1977).
45. Koranda, J.J. Agricultural Factors Affecting the Daily Inrake of Fresh Fallouc byDairy Cows. University of California UCPL-12479.(1965).
46. International Commission on Radiological Protection. Report of a Task Group of Com-C) miccee 2 on Reference Man. Pdblication 23, p. 360, Pergamon Press, Oxford (1974).
41

47. Kahn, B. In: Conference o ithe Pediatric Significance of Peacetime Radioactive Fall-our. Pedlacril p. 212 (190 3).-
48. Health and Safety Labora ry. HASL Procedure Manual. HASL 300, DOE Heal& aiSafety Laboratory, New Y ri4, NY.
49. Kahn, B. and C.K. Murth Jc. Porter, G.R. Hiagel, G.3. Karches, and A.S. Goldin.Rapid Methods for Estirm dug Fission Product Concentrations in Milk. USDHEW,Public Health Service Pub cacon No. 999-R-2 (1963).
50. Johnson, R.H. and T.C; eavey. Evaluation of Ion Exchange Cartridges fer }leldSampling of lodine-131 in Ilk. Nature 208:750-752 (196S).
51. Held, K.R. Emergency R; iological Plans and Procedures. Item 04.3.4 on Conversionof Survey Meter Readin s lo Concentration. USAEC Report HW-70935, HanfordLaboratories (1962). A
S2. International Atomic E ^8Y Agency. Evaluation of Radiation Emergencies andAccidents. Technical R rt Series No. 152, pp.69-77, Vienna (1974).
S3. IncernatIonal Atomic Ena yiAgency. Environmental Monitoring In Emergency Sicua-cions. Safety Series No. 1 lenna (1966).
54. Kearney, C.H. Trans-Pa ific Fallout and Protective Councermeasures. Oak Ridge- National Laboratories, O iL4900 (1973).
5S. Dlscenfeld, C. and 3. Kl Ish Environmental Radiolodine Monitoring to Control,Exposure Expected fro Containment Release Accidents. BNL-NUREG/50882Brookhaven National L atories (December 1978).
56. -National Advisory Cornmi oee n Radiation. A Report to the Surgeon General, Radic )'active Concamination of he Environmenc Public Health Action. U.S. Depc. HEW,
-- PHS, Washington, DC (Ma 1962).
57. Park, A.B. Scatement be ore the 3CAE. Hearing on the Federal Radiation CouncilProtective Action Guides, ppo 4-83, Washington, DC (June 1965).
58. Todd, F.A. Protecting F acs and Water. In: Protection of the Public in the Event ofRadiation Accidents. Wt djHealth Organization, Geneva (1963).
59. Menzel, R.G. and P£. J Mes. Treatment for Farmland Contaminated with Radio-active Material. Departr rt of Agriculture, Washington, DC (June 1971).
60. National Canners Assoda ion, Fil Progress Report. Investigation on the Removal ofRadioactive Fallout from Vgerables and Fruits During Processing by Normal and byNew or Modified Procestsi Operaions. Agriculture Researdh Service Contract 12-14100-7187 (74) (May 1960). !
61. Laug, E.P. Temporal an Geographical Distributions of Scroncium-90 and Cesium-137in Food. Radiological He di Data 4(9):453 (September 1963).
62. Thompson, 3.C., Jr. k' Removal in Vegetables Prepared for Home Consumption.Health Phys 11(2):136 (F a 1965).
63. Shleden, B. A risk an cost effectiveness analysis of United States guidelinesrelative to radioactivity foods. Health Phys 29:307-312 (1975).
42
64. InternatIonal Commiss1ono o ajtaololcal Protection (ICRP). Impllcations of Commls-sion Recommendations That'! Ddses Kept as Low as Readily Achievable. ICRPPublUcaton 22 Washington, D (April 1973).
6S. Hedgran A. and B. Llndelj. |thc Swedish Policy with Regard to the Limitation ofRadioactive Discharges from 'Power Statono Annual Report cf the SwedishNational Institute of Radlat n Protection, "Verksamheten 1970." Stockholm, Sweden,(1971); 4
66. Cohen, 3. A Suggested GuLedeine for Low-Dese Radiation Exposure cc PopulationsBased on Bineflt-Rlsk Anal s4 UCRL-72848 (1971).
67. Code of Federal Regulatios TItle 10, Chapter 1, Part 50. Licensing of Productionand Utilization Facilities. Apendlx 1, FR VoL 40, No. 87, 19439, (May 3, 1975).
68. Environmental Protection A ncy Contract No. 68-01-0496. Development of CommonIndices of Radiation Health: fectst p. E-4. Archur 0. Little, Inc. (September 1974).
69. Dairy Herd Improvement Letter, VoL 35, No.2. Science and Education Aininlstration,U.S. Department of Agricul Beltsvile, MD, 20705 (December 1979).
70. Hoards Dairyman. VoL 1251 No. 23, p. 1S96. W.D. Hoard & Sons Company, FortAtkinson, Wlsconsin (DecemIrfl980)..
71. U.S. Department of Agriculet Agricultural Prices, Crop Reporting Board. ESS,USDA, Washington, DC 20250 t3an-ec 1980).
72. Bureau of Labor Statistics, D'' 'Department of Labor. Washington, DC 20212.
73. U.S. Nuclear RegulatoryConmission. CriterlaforPreparationandEvaluationof Radio-logicsl Emergency Responset Plans and Preparedness in Support of Nuclear PowerPlants. NUREG-0634/EMJ#,-REP-1. USNRC, Washington, DC 20555 (November1980).
74. U.S. Nuclear Regulatory Cor mlssion. Planning Basis for the Development of Stateand Local Government Raddlokical Emergency Response Plans in Support of LightWater Nuclear Power Plants. NUREG-03961EPA 52011-73-016. USNRC, Washington,DC 2055S (December 1978). l i
75. Booker, D.V. Physical Meas ements of Activity in Samples from Windscale. AEREHPIR2607. United KlngdoIt l tomic Energy Authority, Atomic Energy ResearchEstablishment, Harwell, BeWire (1958).
I.i
Of
.43

. i
* i1
Il
Implementing|theq
Expos6U
IiII
CHAPTER 7
7.1 Introduction
This chapter provides guida c'e forimplementing the PAGs set fqr inChapter 4. It is for use by Styli andlocal officials in developing| theirradiological emergency respons plansto protect the public from expo'ure toradiation .from. deposited- radi btive-materials. Due to the wide vaiety intypes of nuclear incidents [andradionuclide releases that could occur,it is not practical to Provideimplementing guidance four allsituations. The guidance ifi thischapter applies '. primariy Y toradionuclides that would be invo ved inincidents at nuclear power plait. Itmay be useful for radionuclidesincidents at other types of , iublearfacilities or from' incident; | notinvolving fixed facilities e.g.,transportation accidents).Hdwever,specific implementation procedures forincidents other than those at niulearpower plants should be develo Ded byplanners on a case-by-case bas'
Contrary to the situation! dutringthe early phase of ai nuclear indent,when decisions usually must b Madeand implemented quickly by Sttt andlocal officials before Federal as sstanceis available, many decisions 1 andactions during the intermediatel ase
I..
-j .
tective Action Guides forediate Phase:,posited Materials
can be delayed until Federal resourcesare present, as described in the FederalRadiological Monitoring andAssessment Plan (FE-85). Because ofthe reduced level of urgency forimmediate implementation of theseprotective actions, somewhat less detailmay be needed in State radiologicalemergency response plans than - isrequired for the early phase.
At the time of decisions onrelocation and early decontamination,sheltering and evacuation should havealready been completed to protect thepublic from exposure to the airborneplume and from high exposure ratesfrom. deposited materials. Theseprotective actions. may have beenimplemented prior to verification of thepath of the plume and therefore somepersons may have been unnecessarilyevacuated from areas' where actualdoses are much lower than wereprojected. Others who were in thepath of the plume may have beensheltered or not protected at all.During the intermediate phase of theresponse, persons must be relocatedfrom areas where the projected doseexceeds the PAG for relocation, andother actions taken to reduce doses topersons who are not relocated fromcontaminated areas. Persons
7-1

evacuated from areas outsidirelocation zone may return.
7.1.1 Protective Actions
ii
! theII
The main protective actio P forreducing exposure of the pu 9ic todeposited radioactivity are relo ion,decontami- nation, shielding imelimits on exposure; and control ~thespread of surface conRelocation is the most effectiv* 6nd,usually, the most costly and disrtptive.It is therefore only applied wh ni thedose is sufficiently high to warrxn it.The others are generally applied toreduce exposure of persons who i notrelocated, or who return Ii6omevacuation status "to areas >/hatreceived lower. levels of deji oxitedradioactivity. This chapter pr idesguidance for translating radio o icalconditions in the environne t' toprojected dose, to provide the b"'si' fordecisions on the appropriate prdteJtive
sheltered in area 3. Persons who havebeen evacuated from or sheltered inareas 2 and 3, respectively, asprecautionary actions for protectionfrom the plume, but whose homes areoutside the plume deposition area (area1), may return to their homes as soonas environmental monitoring verifiesthe boundary of the area that receiveddeposition (area 1).
0..
Area 4 is designated a restrictedzone and is defined as the area whereprojected doses are equal to or greaterthan the relocation PAG. Personsresiding just outside the boundary ofthe restricted zone may receive a dosenear the PAG for relocation ifdecontamination or other dosereduction efforts are not implemented.
actions.
7.1.2 Areas Involved|
Figure 7-1 provides a gene:example of the different areapopulation groups to be dealtThe path of the plume is assumerepresented by area 1. In Xvariations in meteorological con'would almost certainly producecomplicated shape, but the:principles would apply.
Because of plant conditionother considerations prior to dthe release, persons will alreadbeen evacuated from area
I .
Area 1, with the exception of therestricted zone, represents the area ofcontamination that may continue to beoccupied by the general public.Nevertheless, there will becontaminstion levels in this area thatwill require continued monitoring anddose reduction efforts other thanrelocation.
.V'
I'*alizeds iand
ilt beeality,litionsi snoresame
I[ and
r eI1and
1:..~
The relative positions of theboundaries shown in Figure 7-1 dependon areas evacuated and sheltered, andthe radiological characteristics of therelease. For example, area 4 (therestricted zone) could fall entirelyinside area 2 (area evacuated), so thatthe only persons to be relocated wouldbe those residing in area 4 who wereeither missed in the evacuation processor who, because of the high risk fortheir evacuation, had remainedsheltered during plume passage.
7-2 U

. .......
< ~~ARBITRARYSCL
co ~LEGEND-r-
[ 1. PLUME DEPOSITION AREA.LiE 2. AREA FROM WHICH POPULATION IS EVACUATED.
E 3. AREA IN WHICH POPULATION IS SHELTERED.
4. AREA FROM WHICH POPULATION IS RELOCATED (RE
FIGURE 7-1. RESPONSE AREAS.
. 1.

At the time the restricted zone isestablished, a temporary buffer zone(not shown in Figure 7-1) may b~eneeded outside portions of th'erestricted zone in which occupants willnot be allowed to return untlmonitoring confirms the stability ofdeposited contamination. Such zoneswould be near highly contaminatedareas in the restricted zone wheredeposited radionuclides might b;eresuspended and then redepositedoutside the restricted zone. This couldbe especially important at locationsclose to the incident site where theradioactivity levels are high and therestricted zone may be narrow. Theextent of the buffer zone will depend o'nlocal conditions. Similarly, a bufferzone encompassing the most highlycontaminated areas in which persorare allowed to reside may be needed.This area should be monitoredroutinely to assure acceptability forcontinued occupancy.
7.1.3 Sequence of Events
Following passage of the airborneplume, several tasks, as shown OnFigure 7-2, must be accomplishIdsimultaneously to provide for timelyprotection of the public. -The decisionson the early task of relocating personsfrom high exposure rate areas must bebased on exposure rate measurementsand dose analyses. It is expected thatmonitoring and dose assessment will bean on-going process, with priority givento the areas with the highest exposurerate. The general sequence of eventslisitemized below, but the time frames
-
will overlap, as demonstrated in Figure7-2. 0_
1. Based on environmental data,determine the areas where theprojected one-year dose will exceed 2rem and relocate persons from thoseareas, with priority given persons in*the highest exposure rate areas.
2. Allow persons who were evacuatedto return immediately to theirresidences if they are in areas wherefield gamma measurements indicatethat exposure rates are near normalbackground levels (not in excess oftwice the normal background in thearea before the incident). If, however,areas of high deposition are found to benear areas with low deposition suchthat resuspended activity could driftinto the occupied areas, a buffer zoneshould be established to restrictoccupancy until the situation isanalyzed and dose projections areconfirmed.
0
3. Determine the location of theisodose line corresponding to therelocation PAG, establish the boundaryof the restricted zone, and relocate anypersons who still reside within thezone. Also, convert any evacuees whoreside within the restricted zone torelocation status. Evacuated personswhose residence is in the area betweenthe boundary of the plume depositionand the boundary to the restricted zonemay return gradually as confidence isgained regarding the projected dose inthe area.
4. Evaluate the dose reductioneffectiveness of simple decontamination
7-4 7-4C''

C0? cm1I
. � I I I I III II T _FTl III II I I I-FIVIII - I ! I I I I 11 11
- -I CONDUCT AERIAL AND GROUND SURVEYS. DRAW ISODOSE RATE UNES.
I . I
MM ffl%�M.
IDENTIFY HIGH DOSE RATE AREAS. CHARACTERIZE CONTAMINATION.
IRELOCATE POPULATION FROM HIGH DOSE RATE AREAS.
toU
PERIOD OF
RELEASE,
DISPERSION,
0
w-ja.0
ALLOW IMMEDIATE RETURN OF EVACUEES TO NONCONTAMINATED AREAS.
ESTABUISH RESTRICTED ZONE BOUNDARY AND CONTROLS._ RELOCATE REMAINING POPULATION FROM WITHIN RESTRICTED ZONE.
GRADUALLY RETURN EVACUEES UP To RESTRICTED ZONE BOUNDARY.
= CONDUCT D-CON AND SHIELDING. EVALUATIONS AND ESTABLISH. PROCEDURESFOR REDUCING EXPOSURE OF PERSONS WHO ARE NOT RELOCATED.
'. .... :- ;- !-;- ' - . . .- -... f.~.I -"1#I. . Ib #Iuu.-..--.I-__ .- . I... -.... _.._--- .- - - I - - - - - - - - - ---.- '." I
z71 0
U.4
SHELTERING,
EVACUATION,
AND ACCESS
CONTROL
z0-
In00.ILII
I.
mffl���\11011N'NmmlI PERFORM DETAILED ENVIRONMENTAL MONITORING.
PROJECT DOSE BASED ON DATA.
DECONTAMINATE ESSENTIAL FACILITIES AND THEIR ACCESS ROUTES.RETRIEVE; VALUABLE AND ESSENTIAL RECORDS AND POSSESSIONS.
REESTABLISH OPERATION OF VITAL SERVICES.
m BEGIN RECOVERY ACTIVITIES.(No TIME SCALE)
CONTINUE RECOVERY.
MONITOR AND APPLYALARA IN OCCUPIEDCONTAMINATED AREAS.
I I I 111111 I I 11 1 1 I I-I 1 1 . I I I 11111
1\00MEMEMENNF
0.1 I., 0 la 100TIME AFTER DEPOSITION {DAYS)
1,000
FIGURE 7-2. POTENTIAL TIME FRAME OF RESP!ONSE TO A NUCLEAR INCIDENT.

techniques and of sheltering due ltopartial occupancy of residences andworkplaces. Results of theiseevaluations may influen'cerecommendations for reducing exposurerates for persons who are not relocaiedfrom areas near, but outside, iherestricted zone.
5. Establish a mechanism forcontrolling access to and egress fromthe restricted zone. Typically thiswould be accomplished through controlpoints at roadway accesses to {herestricted zone.
6. Establish monitoring anddecontamination stations to supp'brtcontrol of the restricted zone. |
7. Implement simple dec ontamina1iontechniques. in contaminated areasoutside the restricted zone, wivthpriorities for areas with higherexposure rates and for residencesi ofpregnant women.
8. Collect data needed to establishlong-term radiation protection critediafor recovery and data to determine theeffectiveness of variousdecontanmination or other reco rytechniques. ;
9. Begin operations to recovercontaminated property in the restritedzone.
7.2 Establishment of Isodose-rateLines
Ii
As soon ab Federal ori otherassistance is available for aerial ind
ground monitoring, a concentratedeffort should begin to establishisodose-rate lines on maps. and theidentification of boundaries to therestricted zone. Planning for this effortshould include the development ofstandard maps that can be used by allof the involved monitoring and doseassessment organizations to recordmonitoring data.
Aerial monitoring (e.g., theDepartment of Energy AerialMonitoring Service) can be used tocollect data for establishing generalpatterns of radiation exposure ratesfrom deposited radioactive material.These data, after translation toreadings at 1 meter above ground, mayform the primary basis for thedevelopment of isodose lines out to adistance where aerial monitoring showsno radiation above twice naturalbackground levels. Air samplemeasurements will also be needed toverify the contribution to dose frominhalation of resuspended materials.
Gamma exposure rates measuredat 1 meter will no doubt vary as. afunction of the location of themeasurement within a very small area.This could be caused -by -differentdeposition rates for different -types ofsurfaces (e.g., smooth surfaces versusheavy vegetation). Rinsing orprecipitation could also reduce levels insome areas and raise levels in otherswhere runoff settles. In general, whereexposure rates vary within designatedareas, the higher values should be usedfor dose projection for persons withinthese areas unless judgment can be
0
7-6

used to estimate an appropriateaverage exposure rate.
Measurements made at 1 mheter toproject whole body dose from [rammaradiation should be made: withinstruments. of the "closed W4indow"type so as to avoid the detectio4 of betaradiation. Although beta exposure willcontribute to skin dose, its cont ibutionto the overall risk of health effet fromthe radionuclides expected | to beassociated with reactor incidentsshould not be controlling in comparisonto the whole body gamma dose CAR-89).Special beta dose analyses Vay beappropriate when time:. pernits todetermine its contribution to sk dose.Since beta dose rate measu ementsrequire sophisticated equipment that isgenerally not available for field use,beta dose to the skin should be limitedbased on measured concentralions ofradionuclides per unit area.
7.3 Dose Projection |
The primary dose of interest forreactor incidents is the s of theeffective gamma dose equival4nt fromexternal exposure and the coin.-ittedeffective dose equivalent frominhalation. The exposure periods ofinterest are first year, second year, andup to 50 years after the incident.
Calculation of the: projectedgamma dose from measurements willrequire - knowledge of the -rincipalradionuclides contributing to posureand their relative abundances.Information on these radiologicalcharacteristics can be compiled either-
through the use of portable gammaspectrometers or by radionuclideanalysis of environmental samples.Several measurement locations may berequired to determine whether anyselective radionuclide depositionoccurred as a function of weather,surface type, distance from the point ofrelease, or other factors. As part of theFederal Radio- logical Monitoring andAssessment Plan (FE-85), the U. S.Department of Energy and the U. S.Environmental Protection Agency haveequipment and procedures to assistState officials in performingenvironmental measurements,including determination., of the..radiological characteristicsof deposited-materials.
The gamma exposure rate maydecrease rapidly if deposited materialincludes a significant fraction ofshort-lived radionuclides. Therefore,the relationship between instantaneousexposure rate and projected first- andsecond-year annual or the 50-yeardoses will change as a function of time,and these relationships must beestablished for the particular mix ofdeposited radioactive materials presentat the time of the gamma exposure ratemeasurement.
For incidents involving releasesfrom nuclear power plants, gammaradiation from deposited radioactivematerials is expected to be theprincipal exposure pathway, as notedabove; Other pathways should also beevaluated, and their contributionsconsidered, if significant. These mayinclude inhalation of resuspendedmaterial and beta dose to the skin.
7-7
l1
I,

Exposure from ingestion of food andwater is normally limitedindependently of decisions: forrelocation and decontamination (seeChapters 3 and 6). In rare instances,however, where withdrawal of foodand/or water from use would, in itself,create a health risk, relocation mayan appropriate protective' action forprotection from exposure via ingestion.In this case, the committed effectivedose equivalent from ingestion shouldbe added to the projected dose frdmother exposure pathways for decisionson relocation. 1
The following sections provilemethods for evaluating the projecteddose from whole body extersalexposure and from inhalation 6fresuspended particulate material,based on environmental information!
I,
7.3.1 Projected External Gamma Dose
Projected whole body externalgamma doses at 1 meter height l[tparticular locations during the firstyear, second year, and over the 50-yearperiod after the incident are theparameters of interest. ; Theenvironmental information availallefor calculating these doses is expectedto be the current gamma exposure' rateat 1 meter height and- the relativeabundance of each radionuclilaecontributing significantly to tlatexposure rate. Calculational modelsare available for predicting futdmreexposure rates as a function of tiitedue to radioactive decay, andweathering. Weathering is discusedin WASH-1400, Appendix VI (Nl-i5),
and information on the relationshipbetween surface concentrations andgamma exposure rate at 1 meter isaddressed in reference (DO-88).
e )tU,
Following the incident,experiments should be conducted todetermine the dose reduction factorsassociated with part-time occupancy ofdwellings and workplaces, and withsimple, rapid, decontaminationtechniques, so that these factors canalso be applied to the calculation ofdose to persons who are not relocated.However, these factors should not beincluded in the calculation of projecteddose for decisions on relocation.
Relocation decisions c'an generallybe made on the basis of the first yearprojected dose. However, projecteddoses during the second year and over50 years are needed for decisions onthe need for other protective actions forpersons who are not relocated.' Doseconversion factors are therefore neededfor converting environmentalmeasurements to projected dose duringthe first year, second year, and over 50years following the incident.. Of thetwo types of environmentalmeasurements that can be made toproject whole body external gammadose, gamma exposure rate in air is theeasiest to make and is the mostdirectly linked to gamma dose rate.However, a few measurements of thesecond type (radionuclideconcentrations on surfaces) will also beneeded to properly'project decreasingdose rates.
0
Tables 7-1 and 7-2 provideinformation to simplify development
7-8 7.')

Table 7-1 Gamma Exposure Rate and Effective Dose Equivalent (Corrected for Radioactive Decay andWeathering) due to an Initial Uniform Concentration of 1 pCi/mr2 on Ground Surface
Integrated dose(weathering factor includedP .
Initial exposure'rate at 1 m year one year two 0-50 years
Half-life (mR/h (mrem per (mrem per (mrem perRadionuclide (hours) per pCi/rn2 ) pCi/m ) pCi/M2 ) pCi/M2 )
Zr-95 1.54E+03 1.2E-08 3.3E-05 4.OE-07 3.4E-05Nb-95 8.4 1E+02 1.3E-08 . (b) (b) (b)Ru.103 9.44E+02 8.2E-09 7.1E-06 0 7.1E-06
Te-132 7.82E+01 4.OE49 3.2E-6
< 1-131 1.93E+02 6.6E-09 1.3E-06 0 1.3E-064D 1-132 2.30E+00 3.7E-08 (b) (b) (b)
1-133 2.08E+01 1.01-08 2.1E-07 0 2.1E-071-135 6.61E+00 2.4E-08 1.6E-07 0 1.6E-07Cs-134 1.81E+04 2.6E-08 1.OE-04 4.7E-05 2.4E-04
Cs-137 2.65E+05 1.OE-08 4.5E-05 2.9E-05 6.1E-04Ba.140 3.07E+02 3.2E-09 1.1E-05 0 11E-05La-140 4.02E+01 3.5E-08 (b) (b) (b)
'Estimated exposure rate at 1 meter above contaminated ground surface. Based on data from reference (1)0-88).
bRadionuclides that have short-lived daughters (Zr/Nb-95, Te/1-132, Ru/Rh-106, Cs-137/Ba-137m, Ba/la-140) are assumed to quicklyreach equilibrium. The integrated dose factors listed are the effective gamma dose due to the parent and the daughter. Based un dIatafrom reference (D0-88).
i.

Table 7-2 Exposure Rate and Effective Dose Equivalent (Corrected for Radioactive Decay) due to an InitialI Cdncentration of 1 pCi/rn2 on Ground Surface
Integrated doseInitial exposure' (weathering factor not included)'
rate at 1 m year one year two 0-50 yearsHalf-life (mR/h (mrem per (mrem per (mrem per
Radionuclide (hours) per pCi/M2 ) pCi/M2 ) pCi/M2) pCi/M2 )
Zr-95Nb-95Ru-103R- -1R06
Te-132b- . =
.. ....
01-1311-1321-1331-135Cs-134
1.54E+038.41E+029.44E+02
= -----=-8;.84E+03-7.82E+01
1.93E+022.30E+002.08E+016.61E+001.81E+04
2.65E+053.07E+024.02E+01
1.2E-08 3.8E-05U.E-08 (b)8.I .2Z-09' 7.8E-06'
- -, -- 3AE-09-. -- 1.5E,05-4.OE-09 3.3E-06
. ..........
6.6E-093.7E-081.OE-082.4E-082.6E-08
1.OE-083.2E-093.5E-08
1.3E.06(b)
2.1E-071.6E-071.3E-04
6.OE-051.2E-05
(b)
..... ;; .................
8.OE-07(b)0
,7 6E-060
0(b)W00
9.6E-05
5.9E-050
(b)
- ... I. . ... .....
3.9E-05(b)
7.8E-063.QE-053.3E-06
1.3E-06(b)
2.1E-071.6E-074.7E-04
1.8E-031.2E-05
(b)
.. ................. ................. _
Cs-137Ba-140La-140
'Estimated exposure rate at 1 meter above contaminated ground surface. Based on data from reference (DO-88).
bRadionuclides that have short-lived daughters (Zr/Nb-95, RuiRh-106, Te/1-132, Cs-137/Ba-137m, Ba/La-140) are assumed to quicklyreach equilibrium. The integrated dose factors listed are the effective gamma dose duo to the parent and the daughter. Based on datafrom reference (DO-88).
C .. 0I

of dose conversion factors thiouh theuse of data on the radionuclide Dmiix, asdetermined from environnientalmeasurements. These tables lat thedeposited radionuclides most likely tobe the major contributors to -dose fromincidents at nuclear power facilities.In addition to providing' integrated,effective doses per unit of surfaceconcentration, they provide, in columnthree, the exposure rate (mR/h)'tin airper unit of surface contamination. Allexposure rate values are based onthose given in reference (DO.88)1i Theywere estimated from the total bodyphoton dose rate conversion factlors for
-: exposure'- at' 1 m -above th~e -groundsurface. Since the ratio. of effective.dose to air exposure is about 0.7,dividing the effective dose rAte Iby 0.7results in an estimate of the" exposurerate in air. The integrated effectivedoses are based on dose conversionfactors also listed in reference (DO-88).Table 7-1 takes into accouni bothradioactive decay and weathering,whereas the values in Table 7-2 dncludeonly radioactive decay. The~ ect ofweathering is uncertain and w~ll vary.'dejnd~ig~ on the type of wieath, typeof surface, and the chemical forr of theradionuclides. The "user m'ay chooseeither table depending :.d ol theconfidence accorded the I assumedweathering factors.
The following steps can be Ledtodevelop dose conversion factrs tocalculate.projected future doses fromgamma exposure rate measurementsfor specific mixes of radionuclides:
1. Using spectral analysis' of Lammaemissions from an envirornental
sample of deposited radioactivity,determine the relative abundance ofthe principal gamma emittingradionuclides. Analyses of uniformsamples from several different locationsmay be necessary to determine whetherthe relative concentrations ofradionuclides are constant. The resultsmay be expressed as the activity (pCi)of each radionuclide in the sample.
2. Multiply each activity from step 1by the corresponding values in column3 of Table 7-1 or Table 7-2 (dependingon whether or not weathering is to be-considered) to determine the relativecontribution, to the gamma exposurerate (mR/h) at 1-meter height for eachradionuclide. Sum the results for eachsample.
3. Similarly, multiply each activityfrom step 1 by the correspondingvalues in columns 4, 5, and 6 todetermine the 1st-year, 2nd-year, and50-year relative integrated dosescontributed by each radionuclide. Sumthese results for each sample.Radionuclides listed in Tables 7-1 and7-2 that have short-lived daughters(Zr/Nb-95, Te/I-132, Ru/Rh-106,Cs-137/Ba-137m, Ba/La-140) - wereassumed to be in equilibrium withtheir daughters when the tabulatedvalues for integrated dose werecalculated. Since the values for theparents include the total dose from theparent and the daughter, do not doublecount these daughters in the sum. (Inthe cases of Cs-137/Ba- 37mandRu-106/Rh-106, the parents are notgamma emitters, so the listed exposurerates and doses are actually those fromthe daughters alone.)
7-11

4. Using the results from steps 2 and3, the relevant dose conversion fc~tors,DCF, for each sample 'are then 4givenby:
E Hi
DCP=L
E~ xi
where Hi effective dose equivo-actolent for radionutiden i(mrem),
Xi gamma exposure rate Pbrradionuclide i (mR/h)
n the number of radio:-nuclides in the saml:e'.
Since the samples .represented in the
p~ ' ;,i
numerator and denominator., areidentical, the effect of the size of th~esample cancels.
These dose conversion factobe applied to any measured gammaexposure rate for which the relat+econcentrations of radionuclides are thesame as those in the sample thatwasanalyzed.
The following examtpledemonstrates the use of the aboveprocedures for calculating a DCFr Forpurposes of the example it is aslumedthat environmental measuredgmmarevealed a mix of radionuclides artasshown in column 3 of Table 7-t. The(relative) exposure rate conversionfactors in column 4 of Table 7~-3 aretaken from column 3 of Table 71ap The(relative) exposure rates in cotumao' 5are the products of columns 3 nd F14.The (relative) doses for indivedrsioradionuclides in columns 6, 7, and'. 8
.i
were calculated by multiplying theconcentrations in column 3 by the doseconversion factors in columns 4, 5, and6 of Table 7-1, respectively. (Columns4, 5, and 6 of Table 7-2, which do notinclude weathering, could have beenused instead of those in Table 7-1.)
For this example, the conversionfactor for dose in the first year wasobtained for the assumed radionuclidemix from the totals of columns 5 and 6of Table 7-3, which indicate that acalculated dose of 0.023 mrem in thefirst year corresponds to. an initialexposure rate of 1.5E-4 mR/h.Therefore, the first year doseconversion factor (DCF,) for thisexample is 150 mrem for each mR/hmeasured at the beginning of theperiod.
This DCF may be multiplied byany gamma exposure- ratemeasurement to estimate the.dose inthe first year for locations where theexposure rate is produced by aradionuclide mix the same as assumedfor calculating the DCF, and whereweathering affects the exposure rate inthe same manner as assumed. Forexample, if a gamma exposure. ratemeasurement were taken . at thelocation where the contaminationsample in Table 7-3 was taken, thisexposure rate could be multiplied bythe DCF calculated in the aboveexample to obtain the projected firstyear dose at that point. Based on theexample analysis and a relocation PAGof 2 rem, for this case the exposurerate at the boundary of the restrictedzone should be no greater than
O0
C.. .I
7-12

(Th7 i
Table 7-3 Example' Calculation of Dose Conversion Factors for Gamma' Exposure Rate Measurements Based onMeasured Isotopic Concentrationsh
e m h Calculated effective dose at 1 meterMeasured mR/h' Calculated
Radionuclide Half-life concentration - Exposure rate year one year two 50 years(hours) (pCilsampled) pCdm at 1 m (mR/hr)' (mrem) (mrem). (mrem)
1-131 1.93E+2 2.6E+2 6.6E-9 1.7E-6 3.3E-4 0 3.3E-4
Te-132 7.8E+1 . 3.6E+3 4.OE-9 1.4E-5 1.2E-2 0 1.2E-2
1-132 2.3 3.6E+3 3.7E-8 13E-4 (e) (e) (e)
Ru-103 944E+2 -22E42- -- 8-2E-' --- 1.8E-63-- - - ...-.....
Rh-106' 8.84E+3 '5Ft 3Ag ''' '-7' - - : -9E - -:714 -S
- Cs-134 1.81E+4 6.8E+1 2.6E-8 1.8E-6 6.9E-3 3.2E-3 1.6E-2
' Ba-137m' 2.65E+5 4.2E+1 1.OE-8 4.2E-7 1.9E-3 1.2E-3 2.6E-2
Totals 1.5E-4 2.3E-2 4.6E-3 5.6E-2
'The data in this table are only examples to demonstrate a calculational process. The results should not be used in the prediction ofrelationships that would exist following a nuclear incident
bCalculations are based on data in Table 7-1, which includes consideration of both radioactive decay and weathering.
'External exposure rate rectors at 1 meter above ground ror a person standing on contaminated ground, based on data in Table 7-1.
"The size of the sample is not important for this analysis because only the relative concentrations are needed to calculate thle ratio ofintegrated dose to exposure rate.
'The integrated dose from 1-132 is not calculated separately because it is the short-lived daughter of Tc-132, antd is assumied to be inequilibrium with it. The assumed quantity present is that for a daughter in equilibrium with the parent.
'rhis is a short lived daughter of a parent that has no gammna emissions and the halnire given is that or the pareuiL

2000 mrem ''=13..mR/h,150 mremlmRdh
if the contribution to effective dosefrom inhalation of resuspendedradioactive materials is zero (SeeSection 7.3.2). The example DCF forthe second year and 50 years areobtained by a similar process, yieldingDCFs of 31 and 370 mrem per mnRh,respectively.
The ratio of the second year to firstyear dose is 31/150 = 0.21. If this isthe case, persons not relocated on' thebasis of a 2 rem PAG should, for bti.sexample, receive no more than 0.21 x 2= 0.4 rem in year 2. Similarly,: thedose in My years should be no morethan 4.9 rem. Actual doses should beless than these values to the extentthat exposure rates are reduced byshielding from structures and bydecontamination.
Prior to reaching conclusionsregarding the gamma exposure <ratethat would correspond to the relocationPAG, one would 'need to verify bymultiple sampling the consistency ofthe relative abundance of specificradionuclides as well as the relative
--importance of the inhalation pathway'.
Dose conversion factors will changeas a function of the radiologicalmakeup of the deposited material.Therefore, dose conversion factors mustbe calculated based on the best currenitinformation following the incidenit.Since the-relative concentrations ivWlchange as a function of time due 1t6different decay rates, dose conversionfactors must be calculated for specific
measurement times of interest. Bycalculating the decay of the originalsample(s), a plot of dose conversionfactors (mrem per mR/h) as a functionof time after the incident can bedeveloped. As weathering changes theradionuclide mix, and as more islearned about other dose reductionmechanisms, such predictions of doseconversion factors may requireadjustment.
7.3.2 Inhalation Dose Projection
It can be shown, for the mixture ofradionuclides assumed to be depositedfrom postulated reactor incidents, andan assumed average resuspensionfactor of 10-6 rnt , that the effective dosefrom inhalation is small compared tothe corresponding effective dose fromexternal exposure to gamma radiation.However, air sample analyses shouldbe performed for specific situations(e.g., areas of average and highdynamic activity) to determine themagnitude of possible inhalationexposure. The 50-year committedeffective dose equivalent (H50) resultingfrom the inhalation of resuspendedairborne radioactive materials iscalculated as follows:
07
0
H50 =I x DCF (1)
whereI = total intake (pCi), andDCF = committed effective dose
equivalent per unit intake(remlpCi).
It is assumed that the intake ratewill decrease with time due to
7-14

radioactive decay and weathering. Nomodel is available to calculat theeffect of weathering on resuspension ofdeposited materials, so thi m odeldeveloped- for calculating its'effect ongamma exposure rate (NR-76) isassumed to be valid. This shouldprovide conservative results. "'e totalintake (I) from inhalation'overIim e tmay be calculated for !!'eachradionuclide, using the followingequation: 'I
I = BCo 0 (i-eQ-4) )
O C
1 .7 (ie -~ , 2
where
B = average breathing rate foradults
= 1.05E+4 m3/a (EP-88),
C0 = initial measured concentration ofthe resuspended radionuclide inair (pCi/rn), I
t = time during which radionuclidesare inhaled (a), A
I= radioactive decay constant (al),
X= assumed weathering U ecayconstant for 63 percent ofrthedeposited activity, takdn'a.s 1.13a" (NR-75), and I
= assumed weathering idecay
constant for 37 percent of4thedeposited activity, takcn'as 7.48E-3 a' (NR-75).
Table 7-4 tabulates resultscalculated using the above assumptionsfor weathering. The table -containsfactors relating the committed effectivedose from exposure during the first andsecond years after the incident to aninitial air concentration of 1 pCi/m 3 foreach of the principal radionuclidesexpected to be of concern from reactorincidents. The dose conversion factorsare taken from FGR-11 (EP-88).Parent radionuclides and their shortlived daughters are grouped togetherbecause these dose conversion factorsare based on the assumption that bothparents and daughters will .occur inequal concentrations and will, decaywith the half life of the parent.Therefore, measured concentrations ofthe short lived daughters should beignored and only the parentconcentrations should be used incalculating long term projected doses.
Table 74 lists factors whichinclude the effects of both weatheringand radioactive decay, as well as thosethat include only the effects ofradioactive decay. Users of these datashould decide which factors to usebased on their 'confidence on theapplicability of the weathering modelsused (NR-75) to their environment.
The committed effective doseequivalent is calculated by multiplyingthe measured initial air concentration(pCi/rn3 ) for each radionuclide ofconcern by the appropriate factor fromthe table and summing the results.This sum may then be added to thecorresponding external whole bodygamma dose to yield the total com-
7-15

Table 7-4-- Dose Conversion Factors for Inhalation of Resuspended Material
Committed effective dose equivalent per unit air concentrationat the beginning of year one (mrem per pCi/m3 )
Considering radioactive Considering radioactivedecay and weathering decay only
.Radionuclideb .- Lung class - - .Year.one .... Yearto., ...... .. .,.. e Year.,one, , ..... Yeartw............ . ........... .... . ...... .. .. _ ... ... ___. .. _._._. ....... ____,____ __...._._. ___
Sr-90/Y-90 YIY 1.0E+1 5.5fE 0 1.4E+1 1.3E+1Zr-95/Nb-95 Y/Y 6.5E-2 - 7.9E-2Ru-103 Y 1.3E-2 - 1.5E-2Ru-l106/Rh-106 YID 2.8E 0 1.OE 0 3.7E 0 1.9E 0Te-132/1-132 W/D 1.3E-3 - 1.3E-31-131 D 1.1E-2 - 1.1E-2 -Cs-134 D 3.1E-1 1.5E-1 4.1E-1 3.0E-1Cs-137/Ba-137' D/D 2.5E-1 1.4E-1 3.3E-1 3.2E-1Ba-140/La-140 D/W 4.4E-3 - 4.7E-3Ce-144/Pr-144 Y/Y 2.0E 0 4.2E-1 2.7E 0 9.8E-I
OCalculated using the dose factors in EP-88, Table 2. 1.
'Short lived daughters are not listed separately because the entries include the dose from both the daughter and the parent Thesefactors are based on the concentration of the parent only, at the beginning of the exposure period.
'The lung clearance class chosen is that which results in the highest dose conversion Factor,
(,.' 'C.)

mitted effective dose equivalent fromthese two pathways.
The PAGs include a guide for doseto skin which is 50 tini's themagnitude of the PAG for effectivedose. Analysis (AR-89) indicates thatthis guide is not likely to be controllingfor radionuclide mixes expectid to beassociated with nuclear po'wer plantincidents. Dose conversion fa!tbrs areprovided in Table 7-5 for use in' case ofincidents where the source termconsists primarily of pure" betaemitters. The skin dose from eachradionuclide may be calculated bymultiplying the m as`uredconcentration (pCi/r 2)' by thecorresponding dose conversionlfactor inthe table. 'This will yield the fiist yearbeta dose to the skin at one meterheight from exposure to! depositedmaterials plus the estimated' dose tothe skin from materials deposited onthe skin as a result of bengin thecontaminated area. These 'ablors arecalculated based on inforaion inReference AR-89, which! usedweathering factors that ,'ajiply forgamma radiation and would, therefore,be conservative for applicatioilto betaradiation. Calculated doses based onthese factors should be high er than thedoses that would be received
7.4 Priorities
In most cases protective1 actionsdiuring the intermediate phase will becarried out over a period ofrnany days.It is therefore useful to codsider whatpriorities are appropriate. Firther, forsituations where the affected area is so
7-17
large that it is impractical to relocateall of the public, especially from areasexceeding the PAGs by only a smallamount, priorities are needed forprotective actions. The followingpriorities are appropriate:
1. As a first priority, assure that allpersons are protected from doses thatcould cause acute health effects fromall exposure pathways, includingprevious exposure to the plume.
2. Recommend the application ofsimple decontamination techniques andthat persons remain indoors as muchas possible to reduce exposure rates.
3. Establish priorities for relocationwith emphasis on high exposure rateareas and pregnant women (especiallythose in the 8th to 15th week ofpregnancy).
7.5 Reentry
After the restricted zone isestablished, persons will need toreenter for a variety of reasons,including recovery activities, retrievalof property, security patrol, operationof vital services, and, in some' cas'es,care and feeding of farm and otheranimals. It may be possible to quicklydecontaminate access ways to vitalinstitutions and businesses in certainareas so that they can be occupied byadults either for living (e.g.,institutions such as nursing homes,and hospitals) or for employment.Clearance of these areas for7.iuch.occupancy will require dose reductionto comply with occupational exposure

Table 7-5 Skin Beta Dose Conversion Factors for Deposited Radionuclides'
Dose conversion factorb(mrem per pCi/m2)
Radionuclide
Radioactive decay Radioactiveplus weathering decay only
.. .,
0
Co-58Co-60Rb-86Sr-89Sr-9o
Y-90Y-91Zr-95Nb-95Mo-99
Tc-99mRu-103Ru-106'Rh-105Sb-127
Te-127Te-127mTe-129 --Te-129mTe-131m
Te-132I-131I-132Cs-134Cs-136'
Cs-137'Ba-140La-140Ce-141
1.2E-74.2E-76.3E-51.5E-41.2E-5
2;2E-41.6E-47;2E-76.1E-74.4E-6
7.7E-96.8E-76.4E-76.5E-83.4E-6
1.OE-67.8E-75.OE-73.4E-52.9E-7
5.4E-98.5E-75.OE-52.6E-51.4E-7
2.1E-59.1E-61.2E-56.6E-7
1.4E-75.6E-76.7E-51.6E-41.7E-5
2.9E-41.9E-48.3E-77.4E-74.6E-6
7.7E-97.8E-78.7E-76.6E-83.4E-6
1.OE-69.5E-75.OE-73.6E-52.9E-7
C)f... *)
5.4E-98.7E-75.OE-53.3E-53.7E-7
2.9E-59.6E-61.3E-57.1E-7
K)7-18

; :1':,i
:. i
:. :,,. *!
TableS.,
7-5, ContinuedP..-
Dose conversion factorsb(mrem per pCi/m2)
Radionuclide :__
Radioactive decay Radioactiveplus weathering decay only
Ce-143 2.3E-6 2.3E-6Ce-144c 8.7E-7 1.1E-6Pr-143 1.3E-5 1.4E-5Nd-147 4.3E-6 4.5E-6Np-239 3.4E-8 3.4E-8Am-241 4.6E-8 6.4E-8
'Based on data from reference AR-89..:
bDose equivalent integrated for a one-year exposure at one meter height plus the estimated dose tothe skin from materials deposited on tli6 skin as a result of being ini the contaminated area.
'Contributions from short-lived (one hour or less) decay products are included in dose factors for theparent radionuclides (i.e., Rh-106, Ba-136, Ba-137, and Pr-144).
C)I;i
iiIi
limits (EP-87). Dose projections forindividuals should take nto' ac'ountthe maximum. expected durmation ofexposure.
: a,,
Persons working in areas incie therestricted zone should operate "underthe controlled conditions 2nonnal1yestablished for occupational:,exposure(EP-87).
7.6 Surface Contamination Control
Areas under the plume can beexpected to contain dep "sited
radioactive materials if aerosols orparticulate materials were releasedduring the incident. In extreme cases,individuals and equipment may behighly contaminated, and screeningstations will be required for emergencymonitoring and decontamination ofindividuals and to evaluate the needfor medical evaluation. Equipmentshould be checked at this point anddecontaminated as necessary to avoidthe spread of contamination to otherlocations. This screening service wouldbe required for only a few daysfollowing plume passage until all such
0. 7-19

, '.
persons have been evacuated ' orrelocated.
.. J
After the restricted zone A.,: isestablished; based on the PAGs; forrelocation, adults may reenter Ktherestricted zone under controlledconditions in accordance withoccupational exposure standards.Monitoring stations will be requir edalong roadways to control surfacecontamination at exits from :therestricted zone. Because of thepossibly high background radiationlevels at control points near exits,significant. levels of surfacecontamination on persons, andequipment may be undetectabled'atthese locations. Therefore, additionalmonitoring and decontaminationstations may be needed at nearbyllowbackground locationsDecontamination and other measuresshould be implemented to maintain'1owexposure xates At monitoring stations.
7.6.1 Considerations and Constraints
Surface contamination limits tocontrol routine operations at nuclearfacilities and to transport radioactivematerial are generally set at. levelslower than are practical for situationsinvolving high-level, widespreadcontamination of the environment.-,
The principal exposure pathways. orloose surface contamination on persons,clothing, and equipment are - ta)internal.doses from ingestion by directtransfer,.. (b) internal doses frominhalation of resuspended materials' (c)beta dose to skin from contaminated
skin or clothing or from nearbysurfaces, and (d) dose to the wholebody from external gamma radiation.
Because of the difficulties inpredicting the destiny of uncontrolledsurface contamination, a contaminatedindividual or item should not bereleased to an unrestricted area unlesscontamination levels are low enoughthat they produce only a smallincrement of risk to health (e.g., lessthan 20 percent), compared to the riskto health from the principle exposurepathway (e.g., whole body gamma dose)in areas immediately outside therestricted zone. On the other hand, alevel of contamination comparable tothat existing on surfaces immediatelyoutside the restricted zone may beacceptable on materials leaving therestricted zone. Otherwise, personsand equipment occupying areasimmediately outside the restricted zonewould not meet the surfacecontamination limits. These twoconstraints are used to set permissiblesurface contamination limits.
The contamination limit shouldalso be influenced by the potential forthe contamination to be ingested,inhaled, or -transferred-. to otherlocations. Therefore, it is reasonable toestablish lower limits for surfaceswhere contamination is loose than forsurfaces where the contamination isfixed except for skin. The expectedperiod of fixed contamination on skinwould be longer so a lower limit wouldbe justified.
.)
0.
For routine (nonincident)situations, measurement of gross
I97-20

(7) beag m a surface cotarnifiationlevels is commonly performed pihathin-window geiger counter (s'uc as aCDV-700). Since betaii-g mameasuregments made with siam fieldinstruments cannot be interpreted interms of dose or exposure rate, theguidance set forth below is related tothe background radiation levellin thearea where the measurement is{beingmade. Supplementary levels areprovided for gamma exposure tratesmeasured with the beta shield-'closed.Guidance levels expressed in this formshould be easily detectable and shouldsatisfy the above considerations.Corresponding or lower levelsexpressed in units related toinstrument designations ma'y beadopted for convenience or for ALARAdeterminations. Smears may ilso beused to detect loose surfacecontamination at very low lievels.However, they are not considerednecessary for emergency response and,therefore, such guidance is notprovided.
7.6.2 Numerical Relationships
As discussed in Section 7.3.1, arelationship can be established betweenprojected first year doses' andinstantaneous gamma exposure ratesfrom properly characterized surfacecontamination. Based on assumedradiological characteristics of releasesfrom fuel melt accidents, gammaexposure rates in areas where theprojected dose is equal to the relocationPAG of 2 rem in the first year'Inay bein the range of 2 to 5 mR/h during thefirst few days following the de"Position
:- .
from a type SST-2 accident (SeeSection E.1.2). (This relationship mustbe determined for each specific releasemixture.) Based on relationships inreference (DO-88) and a mixture ofradionuclides expected to be typical ofan SST-2 type accident, surfacecontamination levels of 2x10 pCi/zMwould correspond approximately to agamma exposure rate of 1 mR/h at Imeter height.
7.6.3 RecommendedContamination Limits
Surface
Surface contamination must becontrolled both before and afterrelocation PAGs are implemented.Therefore, this section deals with thecontrol of surface contamination onpersons and equipment being protectedduring both the early and intermediatephases of a nuclear incident.
For emergency situations, thefollowing general guidance regardingsurface contamination is recommended:
1. Do not delay urgent medical carefor decontamination efforts or for time-consuming protection of attendants.
2. Do not waste effort trying tocontain contaminated wash water.
3. Do not allow monitoring anddecontamination to delay evacuationfrom high or potentially high exposurerate areas.
4. (Optional provision, for use only ifa major contaminating event occurs,and rapid early screening is needed.)
7-21

After plume passage, it may benecessary to establish emiergencycontamination screening stations inareas not qualifying as low backgroundareas: Such areas should be less than5 mR/h gamma exposure rate. Thesescreening stations should be used onlyduring the early phase and for majdrreleases of particulate materials to theatmosphere to monitor personsemerging from possible high exposureareas, provide simple (rapid)decontamination if needed, and makedecisions on whether to send them fdrspecial care or to a monitoring anddecontamination station in a lowerbackground area. Table 7-6 providesguidance on surface contaminationlevels for use if such centers areneeded.
5. Establish monitoring and personnildecontamination (bathing) facilities'Atevacuation centers or other locations inlow background areas (less than0.1 mR/h). Encourage evacuatedpersons who were exposed in areaswhere inhalation of particulatematerials would have warrantedevacuation to bathe, change clothes,wash clothes, and wash other exposedsurfaces such as cars and trucks andtheir contents and then report to the.secenters for monitoring. Table 7-7provides surface contaminationguidance for use at these centers.These screening levels are examplesderived primarily on the basis of easilymeasurable concentrations usingportable instruments.
I.
6. After the restricted zone isestablished, set up monitoring anddecontamination stations at exits fromi
the restricted zone. Because of theprobably high background radiationlevels at these locations, low levels ofcontamination may be undetectable. Ifcontamination levels are undetectable,then they probably do not exceed thosein some unrestricted areas occupied bythe ' exposed population and nodecontamination is required.Nevertheless, these individuals shouldbe advised to bathe and change clothesat their first opportunity and certainlywithin the next 24 hours. If, afterdecontamination at the boundary of therestricted zone station, persons stillexceed the limits for this station, theyshould be sent for furtherdecontamination or for medical or otherspecial attention. As an alternative todecontamination, contaminated itemsother than persons or animals may beretained in the restricted zone forradioactive decay.
7. Establish auxiliary monitoring anddecontamination stations in lowbackground areas (background lessthan 0.1 mR/h). These stations shouldbe used to achieve ALARA surfacecontamination levels. Table 7-7provides surface contaminationscreening levels for use at thosestations.
0.
10 7)
7-22 U-

Recommended Surface Contamination Screening Levels for EmergencyScreening of Persons and Other Surfaces at Screening or MonitoringStations in High Backkround- Radiation Areas (0.1 mR/h to 5 mR/hGamma Exposure)'::
Table 7-6
Condition * Geiger-counter shielded- Recommended actionwindow reading
Before <2X bkgdIand <0.5 mR/h Unconditionaldecontamination above background release
>2X bkgd or >0.5 mR/h Decontaminateabove background Equipment may be
stored or disposedof as appropriate.
After <2X bkgd and <0.5 mR/h Unconditionaldecontamination above ba'cground release
>2X bkgd or >0.5 mR/h Continue toabove background decontaminate or
refer to low back-ground monitoringand d-con station.Equipment may alsobe stored fordecay or disposedof as appropriate.
'Monitoring stations in such high exposure rate areas are for use only during the early phase of anincident involving major atmospheric releases of particulates. Otherwise use Table 7-7.
7-23

Recommended Surface Contamination Screening Levels for Personsand Other Surfaces at Monitoring Stations in Low BackgroundRadiation Areas (<0.1 mR/h Gamma Exposure Rate)
Table 7-7
0
Ge~igei-counterCondition t in reading Recommended actionthin wlndow' reading
Before decontamination <2X .bkgd Unconditional release
>2X bkgd Decontaminate
b.
After simpler 2Xbkgd Unconditional releasedecontamination effort
>2X bkgd Full decontamination
After full' . <2X bkgd Unconditional releasedecontamination effort
>2X bkgd Continue to decontaminatepersons
<0.5`.mR/ld Release animals andequipment
After additional <2X.,-kgd Unconditional full releasefull decontamination effort
>2X',bkgd Send persons for specialevaluation
<0.5 , mR/h Release animals andequipment
>o.5 inmld Refer, or use informedjudgment onfurther control of animalsand equipment
f0111b
K)
'Window thickness of approximately 30 m/cm is acceptable. Recommended limits for openwindow readings are expressed as twice the exing background (including background) in thearea where measurements are being made. Corresponding levels, expressed in units related toinstrument designations, may be adopted for convenience. Levels higher than twice background
7-24

References
.AR-89 Aaberg, Rosanne. Evaluation of Skinand Ingestion Exposure Pathways. EPA520/1-89-016, U.S. Environmental ProtectionAgency, Washington (1989).
DO-88 U.S. Department of Energy ExternalDose-Rate Conversion Factors for a,Calculation of Dose to the Public..DOE/EH-0070, U.S. Department of Energy,Washington (1988).
EP-87 U.S. Environmental ProtectionjAgency. Radiation Protection Guidance toFederal Agencies for Occupational Eiposure.Federal Register A, 2822; January,1987.
EP-88 U.S. Environmental Protectionf|Agency. Limiting Values of RadionuclideIntake and Air Concentration and DoseConversion Factors for Inhalatioin, i,Submersion, and Ingestion. EPA520/1-88-020, U.S. Environmental ProtectionAgency, Washington (1988).
FE-85 Federal Emergency ManagementAgency. Federal Radiological EmergencyResponse Plan (FRERP). Federal Register50 46542; November 8, 1985.
NR-75 U. S. Nuclear RegulatoryCommission. Reactor Safety Study. AnAssessment of Accident Risks in U. S.Commercial Nuclear Power Plants.WASH-1400, NUREG-75/014, U.S. NuclearRegulatory Commission, Washington, (1975).
(footnote continued)
(not to exceed the meter reading eorresponding to 0.1 mR/h) may be used to speed the monitoringof evacuees in very low background siar'as_
. '
'.1
bFlushing with water and wiping -is an example of a simple decontamination effort.
: ,
'Washing or scrubbing with soap. or io'lvent followed by flushing is an example of a fulldecontamination effort
Closed shield reading includingdb ackround.
7-25

C>
Radiation Protection'
i'I
*1
* :-
* 3
ate Phase (Recovery)
ci,::)
C0I8-1

; ii l
: i FI:
i
ii
. !A,
: : !: !
:'. (
for : ,.''
{ , .
\. . > j
' '('; Jo
i
. A, . (
. ...
.;
.. , j
: :;';
.. ' .* ;
* Joe: *: '
;: .
a:
Of
i* At.
. .
'; *
, APPENDS A*;
. . .
- .. .
; Glossary. .. .
.. .
: % .
:,
.\ .
.,:
.,. . ., i
.. i
E
. , .
* ' ;
n t
A,: .:: : !
.. .
* ;:1 '
. Z .
. !..
,
.'.* ' i
.; .
', .
:,
.::
':.:
.:
. .. .
,> -.
. j
Jo
'. -.
-. ',
! ., .

C.. APPENDIX A
Glossary
The following definitionissnecificallv to terms used
i applyin this
manual.
Acute health effects: Prompt radiationeffects (those that would be observablewithin a short period of time) forwhichthe severity of the effect vanes withthe dose, and for which a piacticalthreshold exist.
Ablation: The functional destruction ofan organ through surgery or exposureto large doses of radiation.
Buffer zone: An expanded po~rion ofthe restricted zone selected fortemporary radiation protection controlsuntil the stability of radioactivity levelsin the area is confirmed. '
Cloudshine:. Gamma radiation fromradioactive materials in an airborneplume.
C )
proportional to the dose, withoutthreshold.
Derived response level (DRL): A levelof radioactivity in an environmentalmedium that would be expected toproduce a dose equal to itscorresponding Protective Action Guide.
Dose conversion factor: Any factor thatis used to change an environmentalmeasurement to dose in the units ofconcern.
Dose equivalent: The product of theabsorbed dose in rad, a quality factorrelated to the biological effectiveness ofthe radiation involved and any othermodifying factors.
Effective dose equivalent: The sum ofthe products of the dose equivalent toeach organ and a weighting factor,where the weighting factor is the ratioof the risk of mortality from delayedhealth effects arising from irradiationof a particular organ or tissue to thetotal risk of mortality from delayedhealth effects when the whole body isirradiated uniformly to the same dose.
Evacuation: The urgent removal ofpeople from an area to avoid or reducehigh-level, short-term exposure, usuallyfrom the plume or from depositedactivity. Evacuation may be a
Committed dose: The radiation dosedue to radionuclides in the body over a50-year period following", theirinhalation or ingestion.
Delayed health effects: Radiationeffects which are manifested 1bug afterthe relevant exposure. The vastmajority are stochastic, that' is, theseverity is independent of dose and theprobability is assumed 'to be
C)A-1

preemptive action taken in response toa facility condition rather than ' anactual release.
Genetic effect: An effect' in' adescendant resulting from themodification of. genetic material :in aparent.
Groundshine: Gamma radiation fromradioactive materials deposited on theground.
Incident phase: This gu idancedistinguishes three phases of | anincident (or accident) (a) early phase,(b) intermediate phase, and (c) latephase.
(a) Early phase: The period atthebeginning of a nuclear incident wvhenimmediate decisions for effective use ofprotective actions are required, 'andmust be based primarily on predictionsof radiological conditions in i theenvironment. This 'phase may' Ilastfrom hours to days. For the purpose ofdose projection, it is assumed to last forfour days.
V *I(b) Intermediate phase: The period
beginning after the incident source' andreleases have been brought findercontrol and reliable 'environ"nintalmeasurements are available for use asa basis for decisions on additionalprotective actions and extending' ntilthese protective actions are terriiated.This phase may overlap the eiarlyX andlate phases and may last from weeks tomany minonths. For the purpose otfdoseprojection, it is assumed to last for oneyear.
(c) Late phase: The periodbeginning when recovery actiondesigned to reduce radiation levels inthe environment to permanentlyacceptable levels are commenced, andending when all recovery actions havebeen completed. This period mayextend from months to years (alsoreferred to as the recovery phase).
Linear Energv Transfer (LET): Ameasure of the ability of biologicalmaterial to absorb ionizing radiation;specifically, for charged particlestraversing a medium, the energy lostper unit length of path as a result ofthose collisions with elections in whichthe energy loss is less than a specifiedmaximum value. A similar quantitymay be defined for photons.
Nuclear incident: An event or series ofevents, either deliberate or accidental,leading to the release, or potentialrelease, into the environment ofradioactive materials in sufficientquantity to warrant consideration ofprotective actions.
Prodromal effects: The forewarningsymptoms of more serious healtheffects.
Proiected dose: Future dose calculatedfor a specified time period on the basisof estimated or measured initialconcentrations of radionuclides orexposure rates and in the absence ofprotective actions.
Protective action: An activityconducted in response to an incident orpotential incident to avoid or reduceradiation dose to members of the public
.0
.tK)
A-2
.. i
I !
C>(sometimes called a protectivemeasure).
Protective Action Guide (PAG): Theprojected dose to reference man, orother defined individual, from anaccidental release of radioactivematerial at which a specific protectiveaction to reduce or avoid that dose iswarranted.
Recover. The process of reducingradiation exposure rates 'landconcentrations of radioactive materialin the environment to levels acceptablefor unconditional occupancy or use.
Reentr. Temporary entry into arestricted zone. under contiolledconditions.
Relocation: The removal or continuedexclusion of people (households) iromcontaminated areas to avoid chronicradiation exposure.
Restricted zone: An area 'iwithcontrolled access from which thepopulation has been relocated.
Return: The reoccupation of iareascleared for unrestricted residence oruse.
Sheltering: The use of a struce forradiation protection from an aiilorneplume and/or deposited radioactivematerials.
Short-lived daughters: Radioactiveprogeny of radioactive isotopesithathave half-lives on the order of a fewhours or less.
Weathering factor: The fraction ofradioactivity remaining after beingaffected by average weather conditionsfor a specified period of time.
Weiahting factor: A factor chosen toapproximate the ratio of the risk offatal cancer from the irradiation of aspecific tissue to the risk when thewhole body is irradiated uniformly tothe same dose.
Whole body dose: Dose resulting fromuniform exposure of the entire body toeither internal or external sources ofradiation.
aC.
01 A-3

\ S'
. 6 .
6|. ;:J ; -
: w
@ . .
CwA.** l:*
: . w .
i*
i.. .5 i -:i
i
| i .
j - *
; .i
l: . 6
i *1.
.
Risks To wealth From Radiation Doses* _ _ ^ e Sat May Result From
'i: , Nuclear Incidents! i ', ;
i .,
i . .
! ,
C '1 i'.. .. .
.l .' :
* :; ; -
.: .. :
_ . . . . ... .. . ... .. . : .
: *., 'a :. .
! a..
.' : ''
. . pi
. :.i
'! * ;,' ',
..- 4.'
.. . .
i .
O ,... ..',* ',
.: ' '
. . .
*' ',

Contents
Page
B.1 Introduction ....... ,. ........... B-1
B.1.1 Units of Dose . .........';.................... B-1B.1.2 Principles for Establishing Protective
Action Guides .B-2
B.2 Acute Effects ...... B-3.. . .. . .. . . . .. . ; . . . . .
B.2.1 Review of Acute Effects .B-3
B.2.1.1 The, Median Dose for Lethality. B-4B.2.1.2 Variation of Response for Lethality .B-5B.2.1.3 Estimiated Lethality vs Dose for Man .B-7B.2.1.4 Threshold Dose Levels for Acute Effects .B-10B.2.1.5 Acute Effects in the Thyroid .B-12B.2.1.6 Acute Effects in the Skin .B-12B.2.1.7 Clinical Pathophysiological Effects .B-12
C) B.2.2 Summary and ,ofidusions Regarding Acute Effects .B-17
B.3 Mental Retardation ................ B-17
B.4 Delayed Health Effects' . B-18
B.4.1 Cancer .... .......................................... B-18
B.4.1.1 Thyrrod. B-20B.4.1.2 S i ................................. B-21B.4.1.3 Fetus . B-21B.4.1.4 Age' Dependence of Doses .B-22
B.4.2 Genetic Risk ?.B-23
B.4.3 Summary of Risks of Delayed Effects .B-23
B.4.4 Risks Associatedwiith Other Radiation Standards .B-23
References ....... ;. B-25
0 ' iii

Figures0
Page
B-i Acute Health Effects as a Function of Whole Body Dose .. ..... B-9
Tables
B-i Radiation Doses Causing Acute Injury to Organs .. ....... B-14
B-2 Acute Radiation Exposure~as~a Function of RadEquivalent Therapy Units (rets) .. .............. B-15
B-3 Radiation Exposure to Organs ~Estimated to CauseClinical Pathophysiological Effects Within 5 Yearsto 0.1 Percent of the Expoised' Population............B-16
BA4 Average Risk of Delayed Health Effects in a Population .. ..... B-24
! ,:

C-
C.. .
APPENDIX B
Risks To Health From Radiation DosesThat May Result FromI Nuclear Incidents
B.1 Introduction is delivered not ointake from the
This appendix reviews the risks continues until allfrom radiation that form th'e basis for material has decaythe choice of Protective Action Guides from the body. Bec(PAGs) for the response to! a nuclear time over which sincident, as well as the choice of limits delivered, the PACfor occupational exposuret duing a terms of a quinuclear incident. "committed dose.
committed dose isover an individuals
B.1.1 Units of Dose following an intEmaterial. Howevei
The objective of protective action in physiology andis to reduce the risk to htealth from life, the committedexposure to radiation. I&eally, one internal radioactivwould like to assure the samne level of that to an adult. Fprotection for each member' of the physiology and a repopulation. However, f protective 50 years are assunactions cannot take into account of calculating comnindividual variations inradiosensitivity, since these Vare not Anotherimporlknown. Therefore; these PAGs are that different partsbased on assumed average values of different risk froxrisk. We further assumelthiat these Since the objective
'risks are proportional to the dose, for is the reduction oany level of dose below the threshold appropriate to usefor acute effects (see Sectio'n B.2.). "effective dose." E
sum of the product.The dose from exposure to organ or tissue o
radioactive materials may be delivered weighting factorduring the period of environmental relative risk. Thesexposure only (e.g., external igama (IC-77) are choseiradiation), or over a longer penod (e.g., mortality (from delinhaled radionuclides which deposit in from irradiation of Ibody organs). In the latter caise, dose tissues to the t4
B1i
rnly at the time ofenvironment, butof the radioactive
red or is eliminatedause of the variablesuch doses may beGs are expressed inantity called the
Conceptually:the dose delivered
; remaining lifetimeike of radioactiver, due to differencesremaining years ofdose to a child fromity may differ from'or simplicity, adulttmaining lifetime ofaed for the purposeaitted doses.
Lant consideration isi of the body are atn the same dose.of protective actionsf health risk, it ise a quantity calledifective dose is the; of the dose to eachf the body and arepresenting the
se weighting factorsn as the ratio ofayed health effects)particular organs orotal risk of such

Y.IS
mortality when the whole body isirradiated uniformly at the same' :'dose.
Finally, doses from different typesof radiation ie.g. alpha, beta, gamma,and neutron radiation) have differentbiological effectiveness. Thesedifferences are customarily accountedfor, for purposes of radiation protection,by multiplicative modifying factors.' Adose modified by these factors isdesignated the "dose equivalent." ThePAGs are therefore expressed inttennsof committed effective dose ecui alent.The PAGs are augmented by linits~fora few specific organs (skin and tlyroid)which exhibit special sensitivity. 6Theseare expressed in terms of committeddose equivalent (rem). In the processof developing PAG values, jit, isnecessary to evaluate the thresholddose levels for acute health 4ffects.These levels are generally expressed interms of absorbed dose (rad) !to thewhole body from short term (one moQnthor less) exposure. Other units(Roentgens, rem, and rets) are alsoused in information cited from variousreferences. They are all approxinatelynumerically equivalent to rads i''Itermsof the risk of acute health effects frombeta and gamma radiation. i;
PAGs are intended to apply to allindividuals in a population othert6anworkers performing emergencyservices. However, there nay,) Jbeidentifiable groups that have differentaverage sensitivity to radiationi or,because of their living situation,i ivillreceive higher or lower doses. Inaddition, some groups may be, atgreater risk from taking a givenprotective action. These factors are
separately considered, when it isappropriate, in establishing values forthe PAGs.
rn
B.1.2 Principles for EstablishingProtective Action Guides
The following four principlesprovide the basis for. establishingvalues for Protective Action Guides:
1. Acute effects on health (those thatwould be observable within a shortperiod of time and which have a dosethreshold below which they are notlikely to occur) should be avoided.
2. The risk of delayed effects on health(primarily cancer and genetic effects,for which linear nonthresholdrelationships to dose are assumed)should not exceed upper bounds thatare judged to be adequately protective *)
of public health, under emergencyconditions, and are reasonablyachievable.
3. PAGs should not be higher thanjustified on the basis of optimization ofcost and the collective risk of effects onhealth. That is, any reduction of riskto public health achievable atacceptable cost should be carried out.
4. Regardless of the above principles,the risk to health from a protectiveaction should not itself exceed the riskto health from the dose that would beavoided.
With the exception of the second,these principles are similar to those setforth by the International Commission
B-2 k.

C. on Radiological Protection (IC-84b) asthe basis for establishing interventionlevels for nuclear accidents. Weexamine, below, the ! basis forestimating effects on health!for use inapplying the first two lof theseprinciples.
.4,
B.2 Acute Effects1 -
This section provides informationrelev'ant to the first ' principle:avoidance of acute effects Ion healthfrom radiation.
Acute radiation health-effects arethose clinically observablejeffects onhealth which are manifested 'withintwo or three months after. exposure.Their severity depends on the amountof radiation dose that Iis: received.Acute effects do not occurlmnless thedose is relatively large, land there isgenerally a level of dose (ile.', threshold)below which an effect is not'expected tooccur. Acute effects may be' classifiedas severe or nonsevere clinicalpathophysiological effecist Severepathophysiological effects are thosewhich have clinicall,- observablesymptoms and may lead ~to seriousdisease and death. Other: patho-physiological effects! 4-such ashematologic deficiencies, Aitexporaryinfertility, and chroinosome changes,are not considered to be .!severe, butmay be detrimental in vaiying degrees.Some pathophysiological effects, suchas erythema, nonalidnant skindamage, loss of appetite,.. nausea,fatigue, and diarrhea, whven associatedwith- whole body gamma or neutronexposure, are prodromal (forewarning
of more serious pathophysiologicaleffects, including death).
B.2.1 Review of Acute Effects
This section summarizes theresults of a literature survey of reportsof acute effects from " short-term(arbitrarily taken as received in onemonth or less) radiation exposure insome detail. Many reports of observedeffects at lower doses differ, and someare contradictory; however, most havebeen included for the sake ofcompleteness. The results of thedetailed review described- in thisSection are summarized in SectionB.2.2.
The biological response to therapid delivery of large radiation dosesto man has been studied since the endof World War II. Dose-responserelationships for prodromal(forewarning) symptoms and for deathwithin 60 days have been developedfrom data on the Japanese A-bombsurvivors, Marshall Island nativesexposed to fallout, and patientsundergoing radiotherapy.j " This workhas been supplemented by a number ofanimal studies under controlledconditions.
The animal studies, usually usinglethality as the end point, show thatmany factors can influence the degreeof response. The rate at which thedose is delivered can affect the medianlethal dose (LD50) in many species,particularly at dose rates less than5 R/min (PA-68a; BA-68). However, inprimates there is less than a 50
B-3

percent increase in the LD50 as doserates are decreased from 50 HR/win toabout 0.01 R/min (PA-68a). There isgood evidence of species specificity(PA-68a; BO-69). The LD5 ' zangesfrom about 100 rad for burros to over1000 rad for lagomorphs (e.g., rabbits).Response is modulated by: age (CA-68),extent of shielding (partia I' bodyirradiation) (BO-65), radiation quality(PA-68a; BO-69), diet, and state ofhealth (CA-68).
While animal studies I providesupport and supplemental information,they cannot be used to infer .theresponse for man. This licEkofcomparability of man and aniains hadalready been noted by at reviewcommittee for the National Acadeniy ofSciences as early as 1956, inconsidering the length of tiAle overwhich acute effects might -beexpressed (NA-56): "Thus, an, Lso,30-day consideration is inadequate: tocharacterize. the acute lethal doseresponse of man, and an LD50, 6o dayswould be preferable."'
Several estimates of the' levels atwhich acute effects of radiation occurin man have been published.: Forexample, an early estimate of the
"Mhe committee (known as the: BEARCommittee) also noted 'Mhe reservation mustbe made here that the exposed Japanesepopulation was heterogeneous with respect toage, sex, physical condition and degree ofadded trauma from burns or blast. The ixtentto which these factors affected the' survivaltime has not been determined. Iii stdie'ds onlaboratory animals the cohv'erse istrue-homogeneous populations a're;stdidied'(NA-56, p.I-6).
j 1 ;
dose-response curves for prodromal(forewarning) symptoms and forlethality was made in the first editionof "The Effects of Nuclear Weapons"(1957) (GL-57), and a more recent andwell documented estimate is given in aNASA publication, "RadiobiologicalFactors in Manned Space Flight"(LA-67).
B.2.1.1 The Median Dose for Lethality
The radiation dose that wouldcause 50 percent mortality in 60 dayswas estimated as 450 Roentgens inearly reports (NA-56; GL-57; RD-51).The National Commission on RadiationProtection and Measurements (NCRP)calculated that this would correspondto a midline absorbed dose of 315 rad(NC-74). The ratio of 315 rad to 450Roentgens is 0.70, which is about theestimated ratio of the active marrowdose, in rads, to the tissue kerma inair, in rads (KE-80). The BEARCommittee noted that the customaryreference to LD60 in animal studies, asif it were a specific property,independent of age, was not justifiable(NA-56): "...it is evident, now, thatthe susceptibility of a whole populationis not describable by a single LDsO.The published values are usuallyobtained for young adults and aretherefore maximal or nearly maximalfor the strain. In attempts to estimateLD50 in man, this age dependenceshould be taken into consideration"(NA-56, pp.4-5). They observed thatthe LD50 approximately doubled as ratswent from neonates to young adultsand then decreased as the animalsaged further. Finally, the BEAR
0,~
C)
B4
C.' Committee concluded: "The Pituation iscomplex, and it became evident that itis not possible to extrapolAte. withconfidence from one condition ofradiation exposure to anotler, or fromanimal data to man" (NA-56, p.T-8).Nevertheless,, results frotm animalstudies can aid in inte4rreting thehuman data that are available.
The NCRP- suggested the 1LD50,somight be 10 to 20 percent lower for theold, very young, or sick, and somewhatgreater for healthy ladults ofintermediate age (RD-5i).1 Otherestimates of adult LDwm have rangedfr'om about 300 rad to 243 4 22 rad.These lower estimates aref apparentlybased on a ratio of air toltissue dosesimilar to those calculated for midlineorgans in the body, 0.54 to 0.66 (KE-80;OB-76; KO-81).
A NASA panel examined allpatient and accident studies, tried toremove confounding factors, andconcluded, "On this basis, It may beassumed that the LDf value of286 radobtained by a normal fit to the :patientdata is the preferred value for healthyman" (LA-67). - -
An LD5 ,mo of 286! + 25 rad(standard deviation) midline absorbeddose and an absorbed dose/air doseratio of 0.66, suggested by the NationalAcademy of Science !(IA-67), isprobably a reasonable value for healthymales. In the absence, of morecomplete information, we!assume thata value of 300 rad + 30 rad is areasonable reflection l of currentuncertainties for average me embers ofthe population.
B.2.1.2Lethality
Variation of Response for
Uncertainty in the dose-responsefunction for acute effects has beenexpressed in various ways.. The slope.of the estimated dose-response functionhas.most commonly been estimated onthe basis of the percent difference inthe LD,50 and the LD,)5,9 or LDu., (onestandard deviation from the LDE,,), aswas done by NASA (GL-57). These andother parameters derived in a similarmanner describe the uncertainty in thecentral risk estimate for thedose-response function.
Another means is to use anestimate of upper and lower bounds forthe central risk estimate, e.g., the 95percent fiducial limits. At any givenresponse point on the dose-responsefimction, for example, the LD~,, thedose causing that response has a95 percent probability of lying betweenthe lower and upper bounds of the95 percent fiducial limit for that point.To estimate this value, probit analyseswere run for each species using data inpublished reports (KO-81; TA-7 1). Thisprovided estimates for each species forcomparability analyses. The 95 percentfiducial limits at the LD50 response forLD5 =0 studies averaged +9 percent(range -9 to +26 percent) and for LD_,,0studies +17 percent (range -20 to +45percent). At the LDs response, valueswere +16 percent (range -12 to +50percent) for LD&,31 0 data and±26 percent (range -20 to +65 percent)for LD 1~so data. For the LDI85 response,values were +17 percent (range -36 to+36 percent) for the LD8g2 data and
B-5
+24 percent (range -46 to +331 percent)for LD8w6o data.
The differences in the magnitudeof the fiducial limits are a function ofthe differences in age, sex, radliationquality, degree of homogeneity, of theexperimental animals, husbandiy, andother factors. The estimates shovw thatthe fiducial limits, expressed as apercent of the dose at any response, getgreater the farther from the LD5, theestimate is made. For the purpose ofestimating fiducial limits for humans,the 95 percent fiducial limits 'will beconsidered to be LD,5 ±15 percent ,LDW+10 percent, and LDs ±156 peicent.Beyond these response levels,' thefiducial limits are too uncertain- andshould not be used.
If the median lethal dose, LDJO,is taken as 300 +30 rad midlineabsorbed dose, the response to higherand lower doses depends on the' degreeof biological variation in the exposedpopulation. The NASA panel decidedthe wide variation in the sensitivity ofpatients was a reflection 'of theheterogeneity of the sample; and thatthe variation in sensitivity, the Slope ofthe central estimate of the resonsefunction, would be stated in the form ofone standard deviation calculated as58 percent of the LDw. They !furtherdecided the deviation in the patients(58 percent) was too great, and thestandard deviation for "normal' manshould be closer to that of dogs andmonkeys (18 percent) (LA-67)J. (Therationale for selecting these sspecieswas not.given.) A
Jones attempted to evaluate thehematologic syndrome frommammalian lethality studies using theratio of dose to LD150 dose as anindicator of the steepness of the slopeof the dose-response function (JO-81).However, he evaluated LD50 studiesonly of species having a rather steepslope, i.e., dogs, monkeys, mice, andswine. He also looked at severaldifferent statistical models fordose-response functions and pointedout the problems caused by differentmodels and assumptions, particularlyin evaluating the. tails of thedose-response function (less than LDI,and greater than LD0). Jonesrecommended using a log-log model,which he felt provided a better fit atlow doses (JO-81).
Scott and Hahn also evaluatedacute effects from mammalianlethality, but suggested using a Weibullmodel (SC-80). One of the advantagesof the Weibull model is that in additionto developing the dose-responsefunction, it can also be used to develophazard functions. These hazardfunctions, if developed using the samemodel, can be summed to find the jointhazard of several different types ofexposure (SC-83). This would allowestimation of the total hazard frommultiple organ exposures to differenttypes of radiation.
As mentioned earlier, the humanmedian lethal dose is commonlyreported in terms of the LD5. Mostlaboratory animal median lethal dosesare reported in terms of the LDOr,. Inthose cases where estimates of bothLD50a, and LD5m are available, i.e.,
0'
iC)
B-6

- - -
the burro (ST-69), the vaiiation (thatis, the slope of the dose-resp6nse curve)is greater in the LDN,60 study than inthe LD.. study. Both the dog and themonkey data are for LD5 ,,and so arenot appropriate for direct comparisonto man.
If an estimate of the deviation ismade for data from other studies andspecies, those where most of thefatalities occur within 30 days (likedogs and monkeys) have standarddeviations of from around 20 Percent[swine (x-ray) (ST-69), dogs (NA-66),hamsters (AI-65), primates (Macaca)
. (DA-65)] to 30 percent [swine ( Co)(HO-68)J. Those in whic6 most deathsoccur in 60 days, like' man, havedeviations from around 20 .:.percent[sheep (CH-64)] to 40 percent [goats(PA-68b), .burros (TA-71)J. 'Nachtwey,et al. (NA-66) suggested the steepnessof the slope of the exposure responsecurve, depends on the inherentvariability of the subjects exposed andany variation induced by uncontrolledfactors, e.g., temperature,: diurnalrhythm, and state of stiriulation orarousal. So, while thet slope of theresponse curve for the patients studiedby the NASA panel '. may beunrealistically shallow ! for normalhuman populations, there is no reasonto think it should be as steep as thosefor dogs and monkeys.
The average deviation for thosespecies (burros, sheep, and goats) forwhich the standard deviation of theLD50= is available has been used as anestimator for man. The 6nean value is34 + 13 percent. This is 6nily slightlygreater than the average value for all
(JS.'
physically large animals (swine, burros,sheep, and goats), 32 +,12 percent.
B.2.1.3 Estimated Lethality vs Dosefor Man
As noted in Section B.2.1.1,dose-response estimates vary for anumber of reasons. Some factorsaffecting estimates for humans are:
1. Age:Studies on rats indicate the LD, isminimal for perinatal exposure, risesto maximum around puberty, andthen decreases again with increasingage (CA-68). The perinatal LD. 0 isabout one-third of that for the healthyyoung adult rats; that for the geriatricrat is about one-half of that for theyoung adult rat.
2. Sex:Females are slightly more sensitivethan males in most species (CA-68).
3. Health:Animals in poor health are usuallymore sensitive than healthy animals(CA-68), unless elevated hematopoieticactivity is occurring in healthyanimals (SU-69).
While these and other factors willaffect the LDwN and the responsecurve for man, there are no numericaldata available.
The variation in response at agiven dose level increases as thepopulation at risk becomes moreheterogeneous and as the length oftime over which mortality is expressed
B-7

increases. In general, larger speciesshow greater variance and lodngerperiods of expression than do; smallmammals, e.g., rodents. It is likelythat the human population would showat least the same amount of varationas do the larger animals, i.e., acoefficient of variation of aboutone-third.
The degree of variation exhibitedin animal studies follows a Gaus.siandistribution as well as or betterlthan alog normal distribution over that rangeof mortality where there are reasonablestatistics. We have assumed here thatthe functional form of human responseis Gaussian. Generally, sample sizesfor extreme values (the upper, andlower tails of the distribution) are toosmall to give meaningful results.Therefore, we have not project4d risksfor doses more than two st!idatddeviations from the LD^,,. Werecognize -that . estimates of, -acuteeffects may not be reliable even beyondone standard deviation for a populationcontaining persons of all ages andstates of health. However, in sprite ofthese uncertainties, previous estimateshave been made of the acute effectscaused by total body exposure :toionizing radiation as a function of themagnitude of the exposure (NCO71;LU-68; FA-73; NA-73).
Given the large uncertainties- inthe available data, a median lethaldose value of about 300 rad' at themidline, with a standard deviation of100 rad, may be assumed for planingpurposes. Such risk estimates shouldbe assumed to apply only in theinterval from 5 percent to 95 Spercent
\.''
fatality, as shown in Figure B-i. (Seealso section B.2.1.4.) 0
Figure B-ifollowing values:
Dose (rad)
<140140200300400460
is based on the
Percent fatalities
none2
515508595
For moderately severe prodromal(forewarning) effects, we believe thedose at which the same percentage ofexposed would show effects would beapproximately half of that causingfatality. This yields the followingresults (see also Figure B-1): 0
Dose (rad)
50100150200250
Percent affected
<215508598
Although some incidence ofprodromal effects has been observed atdoses in the range of 15 to 20 rads inpatients (LU-68) and in the 0 to10 rads range of dose in JapaneseA-bomb survivors (SU-80a; GI-84),
'ne risk of fatality below 140 rad is notnecessarily zero; rather, it is indeterminate andlikely to remain so. This also applies toprodromal effects below 50 rad.
1�jB-8
i '.
,, .:I '.i;I
: ,.
I;,

L
1 00
90
80
70
a 60
LLUa.4c
5 0z
0.ui
fIL A -
.C )aU
30
20
1 0
a {_I'_ 1.' I I_1 00 200 300 400 500 6
WHOLE -BODY ABSORBED DOSE (rad)
FIGURE B-1. ACUTE HEALTH EFFECTS AS A FUNCTIONOF WHOLE BODY DOSE.
B-9
00
there is great uncertainty ininterpreting the data. Patients maybeabnormally sensitive, so that thedose-response function in patients mayrepresent the lower bound of doses thatwould show a response in a healthypopulation (LU-67). The response' ofJapanese survivors in the lower doseranges is complicated by the blaAt andthermal exposure that occurred it thesame time (SU-80b). For thesereasons, care should be taken inapplying estimates of prodromaleffects. The prodomal dose-responsefunction listed above is more likely-tooverestimate the proportion of personsaffected than to underestimate it.
These estimated ranges and iffectsare in agreement with estimates madefor manned space flights (LA-67;LU-67), which included consideration ofthe effect of abnormal physiology! orsickness in the patients to which thedata apply. Uncertainty in estimatesof the biological effects of radiationexposure is great. It is probably flue inpart to variation in the health !'ofindividuals in exposed populations.These 'estimates 'assume a healthyyoung adult population and may hiot bea conservative estimate of risk forother population groups, such aschildren or the elderly. Lushbaigh,et al. (LU-68) found that prodromaleffects probably occur in both htealthyand ill persons in about the same doserange. However, Lushbaugh,et 'al.(LU-68) and NATO (NA-73) suggestthat acute mortality in a populationwhich is ill, injured, or in other waysdebilitated will occur in 50 percent ofthat population at doses of 200-250 radin about 60 days (LD..), in conrast to
an LD50/60 from doses of 220-310 rad fora healthy young adult population.Thus, the ill or injured are assumed tohave an increased risk of acutemortality at high doses.
The above estimates for LDs, 60 arealso based on the assumption ofminimal medical care followingexposure. UNSCEAR (UN-88)estimates that the threshold formortality would be about 50 percenthigher in the presence of more intensemedical care.
B.2.1.4 Threshold Dose Levels forAcute Effects
This section summarizesinformation available in the literatureregarding thresholds for health effects.It also reviews actions that have beentaken as a result of radiation exposureto provide insight on dose levels atwhich actions to avoid dose may beappropriate.
Some acute effects, such as cellularchanges, may occur at low doses withno dose threshold. Most such effectshave a minimum threshold ofdetectability; for example, five rad isabout the lower limit of whole bodydose which causes a cellular effectdetectable by chromosome or otherspecial analyses (NC-71; FA-73). Thisvalue'is recommended by UNSCEAR asthe starting point for biologicaldosimetry (UN-69). Purrott,et al. havereported a lower limit of detection ofchromosome aberrations of 4 rad forx-rays and 10 rad for gamma rays(PU-75).
B-10
0.

More recent advanced chriomosomebanding techniques permit detection ofincreased incidence of chiomnosomeabnormalities from continuousexposure to systematically depositedradioisotopes or radioisotopeshdepositedin the lung at very low levels,te.g., bodyburdens of 100 to 1200, pCi ofplutonium-239 (BR-77). While theexact dose associated with- suchburdens is not known, it is probably onthe order of 10 to 100 millirem peryear. Lymphocytes exposed to 5 rem invitro show severe metabolic drsfunctionand interpliase cell death (ST-64). Theextent to which similar effects occur
;-.ivo exposure is 'unkown.While chromosome abnormalities incirculating lymphocytes are reported topersist for long periods (UN-69), thesignificance of such abnormalities is
-- . ..... _. not known (BR-77).--:
Ct Hug has suggested 5 rem: as thelower limit of exposure whichi mightproduce acute effects (WH-65). Fiverad is also in the low dose, short-termexposure range defined by Cronkiteand Haley, and is below the 10 radwhich they thought would cause only a-slight detectable physiological effect ofunknown clinical significance (CR-71).
Although the ICRP has suggested.that annual doses of 15 rad! would notimpair the fertility of normal fertilemen (IC-69), an acute dose of 15 radcauses "moderates oligospermia(approximately 70 percent reduction insperm count) which lastsi for somemonths (LA-67). Poptescu andLancranjan reported alterations ofspermatogenesis and impaired fertilityin men exposed to from 500,millirad to
C: gB-11
3 rad per year for periods varying from2 to 22 years (PO-75). The shortestexposure period in which abnormalspermatogenesis was reported was 31to 41 months (PO-75); at the highestdose rate reported (3 radla), this is.acumulative dose of 8 to 10 rem. Whilemore study is required, these resultssuggest the need to restrict acute dosesto below 10 rem to avoid this effect,because a given acute dose isanticipated to be more effective thanthe same cumulative dose given over alonger period of time (NA-56; UN-58).
Many observations have indicatedthat doses of 10 rem or more to thepregnant woman are hazardous to thefetus. Mental retardation due toexposure of the fetus is discussed inSection B.3; this discussion is restrictedto acute effects. - The World- Health -
Organization (WHO) indicates thatthere is no evidence of teratogeniceffects from short term exposure of thefetus to a dose less than 10 rad duringthe early phase of gestation, the periodwhen the fetus is most sensitive tothese effects (WH-84).
A number - of -authorities haverecommended that exposures of 10roentgens or higher be considered as anindication for carrying out inducedabortion (HA-59, DE-70, BR-72,NE-76). Brent and Gorson also suggestthat 10 rad is a "practical" thresholdfor induction of fetal abnormalities(BR-72). The Swedish GovernmentCo mittee on Urban Siting of NuclearPower Stations stated the situation asfollows: "What we have calledunconditional indication of abortioninvolves the exposure of pregnant

women where radiation dose to thefetus is higher than 10 rad. Whensuch doses are received in connectionwith medical treatment, it has hithertobeen assumed- that the probability ofdamage to the fetus is so high that anabortion is recommended. Theprobability for such injury is stillmoderate compared with the normalfrequency of similar fetal injuries, andthe probability is particularly reducedwhen the dose is received late in thepregnancy" (NA-74).
B.2.1.5 Acute Effects in the Thyroid
Acute effects are produced in thethyroid by doses from radioiodine onthe order of 3,000 to 100,000 rad.Ablation of the thyroid requires dosesof 100,000 rad (BE-68). The thyroidcan be rendered hypothyroid by dosesof about 3,000 to 10,000 rad (IC-71). 'Athyroid dose from radioiodines of 1000rad in adults and 400 rad in childrenimplies an associated whole body doseof about 1 rad due to radioiodinescirculating in the blood. Followinginhalation of "1I, the committedthyroid dose is about one raddiCiintake of '311 in adults. In thedeveloping fetus, the thyroid doseranges from one to six rad per. Ci-of
I31J entering the mother's body (IL-74).
Although acute clinical effects areonly observed at high doses, subclinicalacute thyroid radiation effects mayoccur at lower doses (DO-72). Impairedthyroid capability may occur above athreshold of about 200 rad (DO-72).
Effects of radiation exposure of thethyroid have been shown in animalexperiments. Walinder and Siodenfound that doses in excess of 3,000 radfrom "3'I caused noticeable depressionof fetal and juvenile mouse thyroiddevelopment (WA-69). Moore andCalvin, working with the Chinesehamster, showed that an exposure aslow as 10 roentgens (x-rays) would giverise to 3 percent aberrant cells whenthe thyroid was cultured (MO-68).While the direct relationship of theseresults to human effects is not certain,mammalian thyroid cells can be inuredat exposures as low as 10 roentgens.
0.
B.2.1.6 Acute Effects in the Skin
The first stage of skin reaction toradiation exposure is erythema(reddening) with a threshold of from300 to 800 rad. Acute exudativeradiodermatitis results from doses of1,200 to 2,000 rad (WH-84).
7)
B.2.1.7 Clinical PathophysiologicalEffects
A large amount of anecdotalinformation is available on the injuryof organ tissues by high doses ofradiation. Acute injury to tissueincludes swelling and vacuolation ofthe cells which make up the bloodvessels, increased permeability ofvessels to fluids so that exudates form,formation of fibrin clots and thrombi,fibrinoid thickening in the walls ofblood vessels, and swelling andvacuolization of parenchymal cells. Insummary, there is an initial exudative
UB-12

C>, reaction followed in time by fibrosisand sclerosis (WH-76, CA-76).
Estimates of radiation dosesnecessary to cause severe tissueresponse in various organs are given inTable B-1. These tissue dose estimatesare based on response to radiotherapytreatment, which is normally given ona fractionated dose basis, but also maybe given as a continuous exposure.Therefore, these estimates must beadjusted to the equivalent ' singleradiation dose for use in the presentanalysis. The formalism of Kirk,'6t__.(KI-71) is used to estimate theequivalent dose for a single' acuteexposure in rad-equivalent therapyunits (rets: the dose calculated from
* the fractionated exposure which isequivalent to a single acute exposurefor-- a specific biological endpoint.)Table B-2 lists acute exposureequivalents in rets for various organs.
With the exception of bone marrow,the exposures required to.' cause5 percent injury within 5 years (TD5/5) in internal organs are in the rangeof 1,000 to 5,000 rad. Since, with thistype of injury, the dose response isnonlinear and has a threshold (i.e., isnonstochastic), there is an exposurebelow which injury is not expected. Ifthe shape of the injury dose-responsecurve is the same for all internalorgans as it is for the lung, plotting thetwo acute exposure equivalents (TD50/5 and 5/5) for each organ on logprobability paper allows a crudeestimation of the number of clinicalpathophysiological effects per 1000persons exposed as a function of doselevel. If one acute effect per 1000
persons within 5 years (TD 0.115) is'taken as the threshold for the initiationof clinical pathophysiological effects inorgans other than thyroid, theequivalent dose level for most organs is550 rets or more; testes 440 + 150 rets,ovary 170 + 70 rets, and bone marrow165 rets.
The radiation exposure to organs inrad units that will cause clinicalpathophysiological effects within 5years to 0.1 percent of the exposedpopulation as a function of the durationof a continuous level of exposure canthen be estimated by using Goitein'smodification of the Kirk methodology(GO-76). This relationship is shown inTable B-3.
Bone marrow is an organ ofparticular concern becauseradionuclides known to concentrate inthis organ system occur in nuclearincidents. The acute lethality due tothe hematologic syndrome (LA-67) isestimated to occur in the range of 200to 1,000 rad, so that the difference issmall between exposure levels thatmight cause acute lethality andexposure levels that might cause only"severe clinical pathophysiology," asderived from radiotherapy data.
In summary, organ systems are notexpected to show symptoms of severeclinical pathophysiology for projectedshort-term exposure doses less than afew hundred rad. Projected doses tobone marrow at this high level arerelatively more serious and more likelyto result in injury than doses to otherorgan systems.
(.i
B-13

Table B-1 Radiation Doses Causing Acute Injury to Organs (RU-72, RU-73)O)
Volume or Risk of injury in five years
Organ - area of 5 percent 50 percentexposure' (rad) (rad) Type of injury
Bone wholemarrow
Liver segmentwhole
Stomach 100 cm2
Intestine 400 cm2
100 cm2
Lung whole100 cm2
Kidney whole
Brain whole
Spinal 10 cmcord
Heart 60 percent
Skin
Fetus whole
Lens of wholeeye
Ovary whole
Testes whole
250
30002500
4500
4500 -
5000
15003000
2000
6000
4500
4500
5500:
200 .
500
200-300
500-1500
450
40004000
5500
55006500
25003500
2500
7000
5500
5500
7000
400
1200
625-1200
2000
aplasia andpancytopenia
acute and chronichepatitis
ulcer, perforation,hemorrhage
ulcer, perforation,hemorrhage
acute and chronicpneumonitis
acute and chronicnephrosclerosis
infarction,necrosis
infarction,necrosis
pericarditis andpancarditis
ulcers, fibrosis
death
cataracts
permanentsterilization
permanentsterilization
70-
'Dose delivered in 200-rad fractions, 5 fractions/week.
- Unspecified.t
B-14

C- Table B-2 Acute Radiation Exposure as a Function of Rad Equivalent Therapy Units(rets)
Volume or Risk of injury in five yearsOrgan area of 5 percent 50 percent
exposure (rets) (rets)
C-.
Bone marrow
Liver
Stomach
Intestine
Lung
Kidney
Brain
Spinal cord
Heart
Skin
Fetus
Lens of eye
Ovary
Testes
wholesegment
whole
* 100 cm2
400 cm2
100 cm2
whole100 cm2
75 percent
whole -
whole
10 cm
60 percent
whole
whole .
whole
whole .* (sterilization)
2301135
1000
- 1465
14651570
7201135770b
875
1770
1465
1465
1665
200
355
200-430'
340-720a
3401360
1360
1665
16651855
10001245
1000
1950
1665
1665
1950
315
620
410-875'
410-875'
'For a 200-rad/treatment, 5 treatments/week schedule (LU-76).
bReference WA-73.
Unspecified.
B-15

Table B-3 Radiation Exposure to Organs Estimated to Cause ClinicalPathophysiological Effects within 5 Years to 0.1 Percent of theExposed Population (GO-76)
Duration. ofexposure Ovary Bone marrow Testes Other organs(days) (rad) (rad) (rad) (rad)
(acute) (170 retsr (165 rets) (440 rets) (550 rets)1 315 300 810 10202 390 380 1010 12604 470 450 1210 15107 550 540 1430 1790
30 840 820 2190 27403 6 5 b 1740 1690 4510 5640
The dose in rets is numerically equal to the dose in rads.
bAssuming tissue recovery can continue at the same rate as observed during 30- to 60-daytherapeutic exposure courses.
k. _Even if severe clinicalpathophysiological effects can beavoided, there is still a possibility ofclinical pathophysiological effects of aless severe or transitory nature. The1982 UNSCEAR report (UN-82)reviewed much of the data on animalsand lman. In the animal studies, therewere reports of: changes in stomachacid secretion and stomach emptying at50 to 130 rad; stunting in growinganimals at the rate of 3 to 5 percentper 100 rad; degeneration of some cellsor functions in the brain at 100 rad,particularly in growing animals;temporary changes in weight -ofhematopoietic tissues at 40 rad; andmore damage in ovaries and testescaused by fractionated doses ratherthan acute doses. Some of the effects
B-16
are transitory, others are long-lasting,but with only minor reductions infunctional capacity.
Human data are limited and arereported primarily in the radiotherapyliterature. The data suggest -mosttissues in man are more radiationresistant than those in animals.However, the human hematopoieticsystem shows a transient response,reflected by decreased circulating whitecells and platelets, at about 50 rad.Temporary sterility has been observedafter doses of 150 rad to the ovariesand 10 rad to the testes, when given asfractionated doses.
There is not sufficient data todetermine dose-response functions
I .' I

l:
(7> nor to describe the duration and. severity of dysfunction expected.
B.2.2 Summary and ConclusionsRegarding Acute Effects
Based on the foregoing review ofacute health effects and other biologicaleffects from large doses delivered overshort periods of time, the followingwhole body doses from acute exposureprovide useful reference levels fordecisionmaking for PAGs:
50 rad - Less than 2 percent of the- exposed population would be
expected to exhibit prodromal(forewarning) symptoms.
25 rad -Below the dose whereprodromal. symptoms-have
t ~ been observed.
10 rad - The dose level below which afetus would not be expectedto suffer teratogenesis (butsee Secti6n B.3, MentalRetardation.).
5 rad - The approximate minimumlevel of detectability for acutecellular effects using the mostsensitive methods. Althoughthese are not severepathophysiological effects,they may be detrimental.
Based on the first principle to besatisfied by PAGs (paragraph -B.1.6),which calls for avoiding acute 1healtheffects, values of 50 rem for adults and10 rem for fetuses appear to representupper bounds.
B.3 Mental Retardation
Brain damage to the unborn is aclass of injury reported in atomic bombsurvivors which does not fall intoeither an acute or delayed effectcategory, but exhibits elements of both.What has been observed is asignificant, dose-related increase in theincidence and severity of mentalretardation, microencephaly (smallhead size), and microcephaly (smallbrain size) in Japanese exposed toradiation in utero during. the 8th..to15th week after conception (BL-73;MI-76). While the actual injury may beacute, it is not identified-u-itil-'oime 'time after birth.
In an early study Mole- (MO-82)suggested that, although radiationmay not be the- sole- ciuse-uf-these- --conditions, it is prudent to treat thephenomenon as radiation-related.More recently, Otake and Schull(OT-83) have concluded: (1) there is norisk to live-born due to doses deliveredup to 8 weeks after conception, (2) mostdamage occurs at the time when rapidproliferation of neuronal elementsoccurs, i.e., 8 to 15 weeks of gisiationalage, (3) the dose-response function forincidence during this period appears tofit a linear model, (4). the fisk ofoccurrence is about five times greaterduring the period 8-15 weeks ofgestation than in subsequent weeks,and (5) in later stages of gestation, e.g.,after the 15th week, a threshold fordamage may exist.
In their published reports, Otakeand Schull (OT-83) evaluated theincidence of severe mental retardation
C- B-17

using the T-65 dosimetry and thedosimetry estimates developed in theongoing dose reassessment program forthe atomic bomb survivors, and usingtwo tissue- dose models. Theirestimated ranges of risk were:
8 to 15 weeks after. gestation:3-4x10 3 cases/rad;
16 or more weeks after gestation:5-7x10⁴ cases/rad.
The higher values are based in theT-65 dosimetry and the Oak RidgeNational Laboratory estimate of tissuedose. The lower values are basedaonOak Ridge National Laboratorydosimetry and the Japanese NationalInstitute of Radiological Sciencesestimates of tissue dose. Laterestimates based on the dosereassessment completed in 1986 'areconsistent with these published results(SC-87).
in view of the foregoing, the risk ofmental retardation from exposure of afetus in the 8th to 15th week ofpregnancy is taken to be about 4x10'per rad. Because of this relatively highrisk, special consideration should :begiven to protection of the fetus duingthis period. The risk to a fetus exposedafter the 15th week is taken as 6xio 4
per rad. For the cases studied (OT 4),no increased incidence of mentalretardation was observed for exposureduring the 1st to the 7th week ofpregnancy.
Federal Radiation ProtectionGuidance, adopted in 1987,recommends that dose to occupationally
exposed pregnant women be controlledto keep the fetal dose below 0.5 remover the entire term of pregnancy, andthat no dose be delivered at more thanthe uniform monthly rate that wouldsatisfy this limit (i.e., approximately50-60 mrem/month)(EP-87). TheNCRP has, for many years,recommended a limit of 0.5 rem(NC-71). ICRP recommends controllingexposure of the fetus to less than 0.5rem in the first 2 months to provideappropriate protection during theessential period of organogenesis(IC-77).
0*
B.4 Delayed Health Effects
This section addresses informationrelevant to the second principle(paragraph B.1.5) for establishingPAGs, the risk of delayed health effectsin exposed individuals. The followingsubsections summarize the estimatedrisks of cancer and genetic effects, thetwo types of delayed effects caused byexposure to radiation.
..
B.4.1 Cancer
Because the effects of radiation onhuman health have been moreextensively studied than the effects ofmany other environmental pollutants,it is possible to make numericalestimates of the risk as a result of aparticular dose of radiation. Suchestimates, may, however, give anunwarranted aura of certainty toestimated radiation risks. Comparedto the baseline incidence of cancer andgenetic defects, radiogenic cancer and
K-,JB-18

a- wi'genetic defects do not occur' veryfrequently. Even in heavily irradiatedpopulations, the number of cance4 t andgenetic defects resulting from radiationis known with only limited accdracy.In addition, all members of existingexposed populations have not: beenfollowed for their full lifetimes, s dataon the ultimate numbers of effets isnot yet available. Moreover,:: whenconsidered in light of infor ationgained from experiments with animalsand from various theorie ofcarcinogenesis and mutagenesiA, theobserved data on the effects of hfimanexposure are subject to a number ofinterpreatiois. This, in turn, lcds todiffering estimates of radiation rjks byindividual scientists and expert doups.In summary, the estimatioh ofradiation risks is not a fully r4aturescience and the evaluation of radiationhazards will continue to charke asadditional information ' becomesavailable. t
L ... .... ...
distinguish it from previous reports ofthe BEIR committee.
The most important epidemi6logicaldata on radiogenic cancer is that fromthe A-bomb survivors. The JapaneseA-bomb survivors have been studied formore than 40 years, and most of themhave been followed in a major, carefullyplanned and monitored epidemiologicalsurvey, the Life Span Study Sample.since 1950 (KA-82, WA-83). They wereexposed to a wide range of doses andare, the largest group that has. beenstudied. They are virtually the onlygroup providing extensive informationon the response pattern .at variouslevels of exposure to low-LET radiation.
The estimated cancer risk fromlow-LET, whole body, lifetime exposurepresented here is based-on a-life tableanalysis using a linear response model.We use the arithmetic average ofrelative and absolute risk projections(the BEIR-3 L-L model) for solidcancers, and an absolute risk projectionfor leukemia and bone cancer (theBEIR-3 L-L model). For whole bodydose, this yields an estimated 280 (witha possible range of 120' to 1200)fatalities per million person-rem for apopulation cohort representative of the1970 U.S. population. We assume thisestimate also applies to high-LETradiation (e.g. alpha emitters); noreduction has been applied for doserate. (The rounded value, 3x10⁴
fatalities3 per person-rem, has beenselected for this analysis.)
'Preliminary reviews of new results fromstudies of populations exposed at Hiroshima
IMost of the observation's of
radiation-induced carcinogenesls inhumans are on groups exposed tolow-LET radiations. These groupsinclude the Japanese A-bomb survivorsand medical patients treated withx-rays for ankylosing spondylitis inEngland from 1935 to 1954 (S2-78).The National Academy of ScienceCommittee on the Biological Eff qcts ofIonizing Radiations (BEIR) an A-80)and UNSCEAR (UN-77) have p videdknowledgeable and exhaustive r viewsof these and other data o thecarcinogenic effects of Euman
exposures. The most recent. f theBEIR studies was published i4 1980and is here designated BEI i3 to
B-19
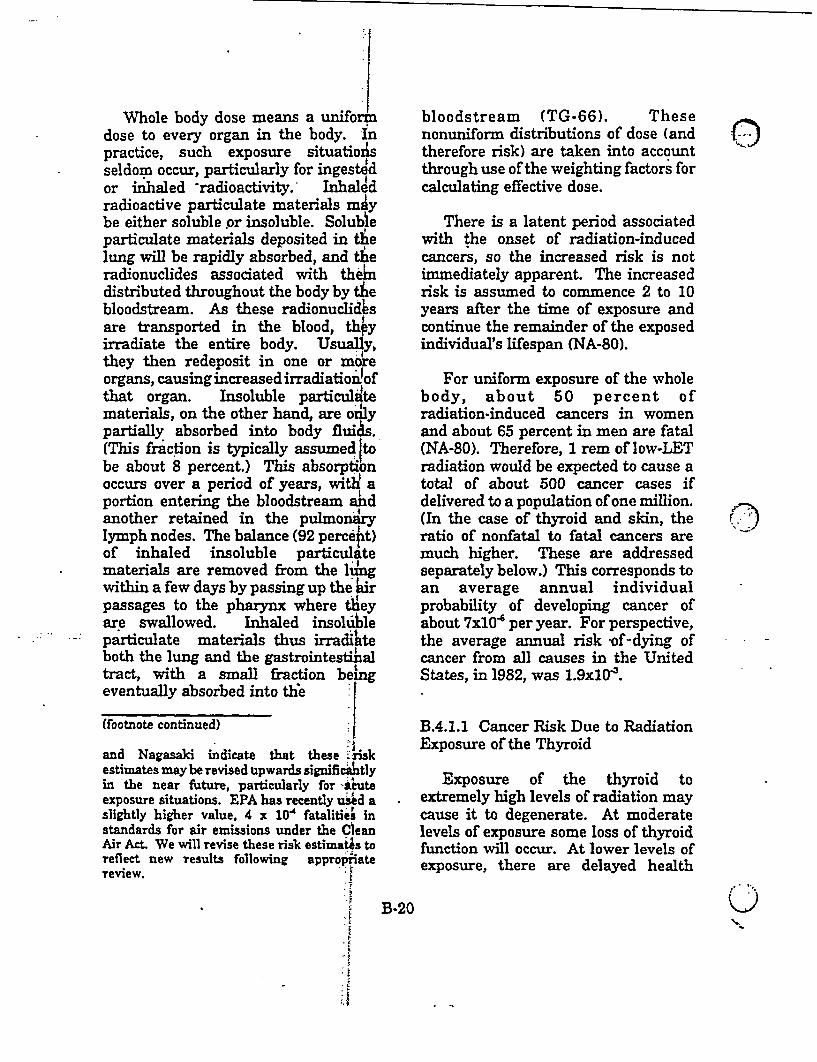
Whole body dose means a uniforLrdose to every organ in the body. Inpractice, such exposure situatioAsseldom occur, particularly for ingestedor inhaled -radioactivity. Inhaledradioactive particulate materials maybe either soluble or insoluble. Solubleparticulate materials deposited in tlhelung will be rapidly absorbed, and theradionuclides associated with thendistributed throughout the body by thebloodstream. As these radionuclidesare transported in the blood, thiyirradiate the entire body. Usu Y.they then redeposit in one or moreorgans, causing increased irradiationiofthat organ. Insoluble particul tematerials, on the other hand, are odlypartially absorbed into body flui6s.(This fraction is typically assumed tobe about 8 percent.) This absorptionoccurs over a period of years, witlW aportion entering the bloodstream ahdanother retained in the pulmondrylymph nodes. The balance (92 perceht)of inhaled insoluble particulatematerials are removed from the l'ngwithin a few days by passing up the Wirpassages to the pharynx where theyare swallowed. Inhaled insolubleparticulate materials thus irradiateboth the lung and the gastrointestinaltract, with a small fraction bengeventually absorbed into the
(footnote continued)
and Nagasaki indicate that these .Fislkestimates may be revised upwards significantlyin the near future, particularly for 'acuteexposure situations. EPA has recently used aslightly higher value, 4 x 1O4 fatalitie instandards for air emissions under the CleanAir Act We will revise these risk estimatis toreflect new results following appropriatereview.
bloodstream (TG-66). Thesenonuniform distributions of dose (andtherefore risk) are taken into accountthrough use of the weighting factors forcalculating effective dose.
0.
There is a latent period associatedwith the onset of radiation-inducedcancers, so the increased risk is notimmediately apparent. The increasedrisk is assumed to commence 2 to 10years after the time of exposure andcontinue the remainder of the exposedindividual's lifespan (NA-80).
For uniform exposure of the wholebody, about 50 percent ofradiation-inducea cancers in womenand about 65 percent in men are fatal(NA-80). Therefore, 1 rem of low-LETradiation would be expected to cause atotal of about 500 cancer cases ifdelivered to a population of one million.(In the case of thyroid and skin, theratio of nonfatal to fatal cancers aremuch higher. These are addressedseparately below.) This corresponds toan average annual individualprobability of developing cancer ofabout 7x10⁴ per year. For perspective,the average annual risk -of-dying ofcancer from all causes in the UnitedStates, in 1982, was 1.9x10⁴.
(7)
B.4.1.1 Cancer Risk Due to RadiationExposure of the Thyroid
Exposure of the thyroid toextremely high levels of radiation maycause it to degenerate. At moderatelevels of exposure some loss of thyroidfunction will occur. At lower levels ofexposure, there are delayed health
.t
. II
:.}
B-20 U1*

.: I
i: s
:rr
. itC
effects, which take the form of boththyroid_. nodules . and thlyroidmalignancies (NA-72; NA-80). 'PDoses.as low as 14 rad to the thyroid havebeen associated with tlyroidmalignancy in the Marshall Islanders(C0-70). The increased risk ofradiation-induced cancer is assum'ed tocommence about 10 years afterinitialexposure and to continue for theremaining lifespan of an exposedindividual.
The true nature of thyroid niodulescannot be established until yfey aresurgically removed and earnedhistologically, -- and those that aremalignant can lead to deathjif notsurgically removed (SA-68; DE-73;PA-74). Although thyroid malignanciesare not necessarily fatal, leffectsrequiring surgical removal ... f- thethyroid cannot be considered benign.In this analysis, all thyroid cancers,both fatal and nonfatal, are counted forthe purpose of estimating the severityof thyroid exposures.
Based on findings in BEIR-3, weestimate that 1 rem of thyroid exposurecarries a risk of producing a thyroidcancer of 3.6xlO4, of which a small'fraction (on the order of 1 in 10) will befatal (NA-80). Since the calculation ofeffective dose equivalent dotes notinclude consideration of nonfatalthyroid cancers and the severitjy of themedical procedures for their cure, it isappropriate to limit the dosed to thethyroid by an additional factorlbeyondthat provided by the PAG expr4ssed interms of effective dose equivalent.Protective action to limit dose tothyroid is therefore recommended at a
thyroid dose 5 times the numericalvalue of the PAG for effective dose.
B.4.1.2 Cancer Risk Due to RadiationExposure of the Skin
-The risk of fatal skin cancer isestimated to be on the order of onepercent of the total risk of fatal cancerfor uniform irradiation of the entirebody (IC-78). However, since theweighting scheme for calculatingeffective dose equivalent does notinclude skin, the PAG expressed interms of effective dose does not provideprotection against radionuclides whichprimarily expose skin. As in the caseof the thyroid, the ratio of nonfatal tofatal cancers from irradiation of theskin is high (on the order of 100 to 1).It would not be appropriate to ignorethis high incidence of nonfatal skincancers by allowing 100 times as muchdose to the skin as to the whole body.For this reason, evacuation isrecommended at a skin dose 50 timesthe numerical value of the PAG foreffective dose.
B.4.1.3 Cancer Risk Due to RadiationExposure of the Fetus
The fetus is estimated to be 5 to 10times as sensitive to radiogenic canceras an adult (FA-73; WH-65). Stewartreports increased relative incidence ofchildhood cancers following prenatalx-ray doses as low as 0.20 to 0.25 rem.and doubling of- childhood cancersbetween 1-4 rem (ST-73). Sheconcluded that the fetus is aboutequally sensitive to cancer induction in
B-21

each trimester. Her findings aresupported by similar results reportedby MacMahon and Hutchinson(MA-64), Kaplan (KA-58), Polhemnusand Kock (PO-59), MacMahon (MA-63),Ford, et al. (FO-59), Stewart and.Kneale (ST-70b), and an AEC report(AE-61). MacMahon reported thatalthough there were both positive andnegative findings, the combinationi ofweighted data indicates a 40 percentincrease in childhood cancer mortalityafter in vivo exposure to diagnostic xrays (1.0 to 5.0 rad): about 1 canxcerper 2,000 exposed children in the first10 years after birth (MA-63). JHeconcluded that although the range ofdose within which these effects tareobserved is wide, effects will be fewerat 1 rad than at 5 rad.
Graham, et al., investigaingdiagnostic x-ray exposure, founid asignificantly increased relative risk ofleukemia in children: by a factor of 1.6following preconception irradiation ofmothers or in utero exposure offthe.4.fetus; by a factor of 2 folloWingpostnatal irradiation of the childien;and by a factor of 2 following-preconception irradiation of the motherand in utero exposure of the ibild(GR-66).
B.4.1.4 Age Dependence of Doses
Almost all dose models are based onICRP "Reference Man," which adoptsthe characteristics of male and femaleadults of working age. ICA-30dosimetric models, which f use"Reference Man" as a basis; aretherefore appropriate for only adult
workers and do not take into accountdifferences in dose resulting from thedifferences in physiological parametersbetween children and adults, . e.g.,intake rates, metabolism, and organsize. Although it is difficult togeneralize for all radionuclides, in somecases these differences tend tocounterbalance each other. Forexample, the ratio of volume of airbreathed per unit time to lung mass isrelatively constant with age, so thatthe ICRP adult model for inhaledmaterials provides a reasonably goodestimate of the dose from a given airconcentration of radioactive materialthroughout life.
0
The thyroid is an exception becausethe very young have a relatively highuptake of radioiodine into a gland thatis much smaller than the adult thyroid(see Section B.4.2.2.). This results in alarger childhood dose and an increasedrisk which persists throughout life. Wehave examined this worst casesituation. Age-specific risk coefficientsfor fatal thyroid cancer (See Table 6-8of "Risk Assessment Methodology"(EP-89)) are about 1.9 higher per unitdose for persons exposed at ages 0 to 9years than for the general population.Age-dependent dose factors (seeNRPB-R162 (GR-85)) for inhalation ofI-131, are a factor of about 1.7 higherfor 10 year olds than for adults.Therefore, the net risk of fatal thyroidcancer from a given air concentration of1-131 is estimated to be a factor ofabout 3 higher for young children thanfor the remainder of the population.This difference is not considered largeenough, given the uncertainties ofexposure estimation for implementing
UB-22

protective actions, to warrantestablishing age-dependent PAGS.
. _--..-.---..-..._..._.. .. ... ..... -
B.4.2 Genetic'Risk
An average parental dose of i rembefore conception has been estimed toproduce 5 to 75 significantgenetically-related disorders per onilhionliveborn offspring (NA-80). For thisanalysis we use the geometric miiean ofthis range, i.e. 1.9x10⁴. This estimateapplies to effects in the first generationonly, as a result of dose to parents ofliveborn offspring. The sum of effectsover all generations is estimated to beapproiiiiately twelve times dgreaterxthat is, 2.3x10*. In addition, since anyradiation dose delivered after aparent's last conception has no-geneticeffect, and not all members tof thepopulation become parents, less thanhalf of the entire dose in an averagepopulation is of genetic signiicance.Taking the above factors into a'ccount,we estimate that the risk ofgenetically-related disorders tifin allgenerations is Wx10 4 per person"-rem toa typical population.
Although the overall severty of thegenetic effects included as "significant"in the above estimates is n"ot wellknown, rough judgements can le made.The 1980 BEIR report referred to"....disorders and traits that 'cause aserious handicap at some time duringlifetime" (NA-80). From the{ ypes ofdefects reported by Stevenson' (ST-59),it can be estimated that,. of allradiation-induced genetic effects, 50percent lead to minor to mzoderatemedical problems (i.e., hair} or ear
0 ,.:
anomalies, polydactyl, strabismus, etc.),25 percent lead to severe medicalproblems (i.e.-, congenital catdafcts,'diabetes insipidus, deaf mutism, etc.),23 percent would require extendedhospitalization (i.e., mongolism,pernicious anemia, manic-depressivepsychoses, etc.), and 2 percent woulddie before age 20 (i.e., anencephalus,hydrocephalus, pancreatic fibrocyticdisease, etc.).
B.4.3 Summary of Risks of DelayedEffects
Table B-4 summarizes averagelifetime risks of dalajyed health effectsbased on results from the abovediscussion. Because of the nature ofthe dose-effect relationships assumedfor delayed health effects fromradiation (linear, nonthreshold), thereis no dose value below which no riskcan be assumed to exist.
B.4.4 Risks Associated with OtherRadiation Standards
A review of radiation standards forprotection of members of the generalpopulation from radiation shows arange of values spanning several ordersof magnitude. This occurs because ofthe variety of bases (risk, cost,practicability of implementation, andthe situations to which they apply) thatinfluenced the choice of thesestandards. Some source-specificstandards are relatively protective, e.g.,the EPA standard limiting exposure ofthe public from nuclear poweroperations (25 mrem/y) from all path-
B-23

-k.Ir
.i
Average Risk of Delayed Health Effects in a Population'Table B-4
* Effects per person-rem
Whole Body Thyroid' Skin
Fatal cancers 2.8E-4b 3.6E-5 3.OE-6
Nonfatal cancers 2.4E4b 3.2E4 3.0E-4
Genetic disorders 1.OE-4(all generations)
0* C
0.)
* We assume a population with the same age aistribution as tnat of the U.:. population in 970U.
b Risk to the fetus is estimated to be 5 to6'10 times higher.
'Risk to young children is estimated to bF about two to three times as high.
I.
ways combined corresponds to .a risk(for cancer death) of 5x10⁴ for lifeiimeexposure. Similarly, regulations underthe Clean Air Act limit the dose due toemissions of radionuclides to air alonefrom all DOE and NRC facilitie's to0.01 rem per year, which corresp~ndsto a cancer risk of 2x10⁴ for lifetimeexposure. Other guides permit muchhigher risks. For example, the level atwhich'the'EPA recommends action toreduce exposure to indoor radon :'0.02working levels) corresponds to a xi'k ofabout 2x10² (for fatal lung cancer+) forlifetime exposure. All of thesestandards and guides apply* tononemergency situations and -.werebased -on considerations beyoiid asimple judgement of acceptable risk.
itFederal Radiation Protection
Guidance for nonemergency situationsrecommends that the, dose from allsources combined (except Ifrom
exposure to medical and naturalbackground radiation) to individuals inthe population not exceed 0.5 rem in asingle year (FR-60) and that the doseto the fetus of occupationally-exposedmothers not exceed 0.5 rem during the9-month gestation period (EP-87). Thisdose corresponds to an annualincremental risk of fatal cancer tomembers of the general population'ofabout 1.4x10⁴. If exposure' of thl-fet'usis limited to one ninth of 0.5 rem permonth over a 9-month gestation period,as recommended, the risk of severemental retardation in liveborn islimited to about 7x10⁴.
The International Commission onRadiation Protection recommends thatthe dose to members of the public notexceed 0.5 rem per year due tononrecurring exposure to all sources ofradiation combined, other than naturalsources or beneficial medical uses of
i
B-24

C>
VtJ1
radiation (IC-77). They alsorecommend a limiting dose to Membersof the public of 0.1 rem per Inr fromall such sources combined fo tcbronic(i.e., planned) exposure (IO-84&) Theseupper bounds may be taken asrepresentative of acceptable values forthe situations to which the4 apply.That is, these are upper b~6nds ofindividual risk that are acceptable forthe sum of all sources and leaposurepathways under internationalrecommendations, for circtstancesthat are justified on the basis' of publicbenefit, and when actual dos'es fromindividual sources are "aj4 Slow asreasonably achievable' (ALARA) withinthese upper bounds.
.4
References
Radioiodine: Principles of Nuclear Medicine.Ed. H.N. Wagner, Jr. pp. 343-369, W.B.
- Saunders Company, Philadelphia (1968); -
BL-73 Blot, W.J. and Miller, R.W. MentalRetardation Following in Utero Exposure tothe Atomic Bombs of Hiroshima andNagasaki. Radioloev 106(1973):617-619.
BO-65 Bond, V.P., T.M. Fliedner, andJ.D. Archchambeau Mammalian RadiationLethality. Academic Press, New York (1965).
BO-69 Bond, V.P. Radiation Mortality inDifferent Mammalian Species, pp. 5-19, inComparative Cellular and SpeciesRadiosensitivity. Eds. V. P. Bond and R.Sugabara. The Williams & Wilkins
- Company, Baltimore (1969).
-BR-72 Brent, RI. and Gorson, R.O.Radiation Exposure in Pregnancy, CurrentProblems in Radiology, Vol. 2, No. 5, 1972.
BR-77 Brandom, W.F. Somatic CellChromosome Changes in Humans Exposed to=Plutonium and rRadon. Progress Report,Contract No. E(29-2)-.3639, Modification No.1. U.S. Department of Energy, Washington(1977).
CA-68 Casarett, A.P. Radiation Biology.Prentice-Hall, Englewood Cliffs, NJ (1968).
CA-76 Casarett, G.W. Basic Mechanisms ofPermanent andDelayed Radiation Pathology.Cancer 37 (Suppl.)(1976):1002-1010.
CH-64 Chambers, F.W., Jr., et al. Mortalityand Clinical Signs in Swine Exposed toTotal-Body Cobalt-60 Gamma Irradiation.Rad. Research 22(1964):316-333.
CO-70 Conrad, R.A., Dobyns, B.M., andSutlow, W.W. Thyroid Neoplasia as LateEffect of Exposure to Radioactive Iodine inFallout. Jour. Amer. Med. Assoc.214(1970):316-324.
CR-71 Cronkite, E.P. and Haley, T.J. ClinicalAspects of Acute Radiation Haematology,
B-25
AE-61 U.S. Atomic Energy Commission.Prenatal X-ray and Childhood Ne4plasia, U.S.AEC Report TID-2373, U.§.l NuclearRegulatory Commission, Washineton (1961).
Al-65 Ainsworth, E.J., et al. ComparativeLethality Responses of Neuron andX-Irradiated Dogs: Influence ot, Dose Rateand Exposure Aspect. Rad.: Research26:32-43, 1965. 1:
BA-68 Bateman, J.L A iRflation ofIrradiation Dose-Rate Effects intMammalsand in Mammalian Cells, in} Dose RateMammalian Radiation Biology, pp.t3.1-23.19,CONF 680401, U.S. Atonlic EnergyCommission, Oak Ridge (1968).ji
BE-68 Beierwalter, W.H. and Wagner, H.N.,Jr. Therapy of Thyroid Disease With
001
1.f

Manual on Radiation Haematology, TechnicalReport Series No. 123. pp. 169.174,International Atomic Energy Agency, Vienrna,(1971).
DA-65 Dalrymple, G.V., Lindsay, I.R., 6ndGhidoni, J.J. The Effect of 2-Mev Whole BodyX-Irradiation on Primates. Rad. Research25(1965):377-400. I
DE-70 Devick, F. Intrauterine Irradiatiop byMeans of X-ray Examination of PregnantWomen and Abortus Provocatus. Jour.Norwegian Medical Society 90(1970):392-396.
DE-73 DeGroot, L. and Paloyan, E. ThyroidCarcinoma and Radiation, A ChicagoEndemic. Jour. Amer. Med. Assn.225(1973):487-491.
DO-72 Doniach, I. Radiation Biology. TheThyroid, pp. 185-192, 3rd Edition. Eds. S.C.Werner and S.K Ingbar. Harper and low,New York, (1972).
EP-87 Environmental Protection Agency.Radiation Protection Guidance to FejeralAgencies for Occupational Exposure. FederalRedster 52 2822; January 27, 1987.
EP-89 Environmental Protection Agency.' RiskAssessment Methodology, DIraftEnvironmental Impact Statement for ProosedNESHAPS for Radionuclides, Volule 1,Background Information Document. IU.S.
--Environmental Protection Agency, Washington(1989).
FA-73 Fabrikant, J.I. Public HealthConsiderations of the Biological Effects ofSmall Doses of Medical Radiation. HealthPhysics in the Healing Arts. JHEWPublication (FDA) 73-8029, pp. 31-42, Foodand Drug Administration (HHS), Washington(1973). 1
FR-60 Federal Radiation Council. RadiationProtection Guidance for Federal Agencies.Federal Reeister 4402-4403; May 18, 1960.
GI-84 Gilbert, E.S. The Effects of RandomDosimetry Errors and the Use of Data onAcute SymptomsforDosimetry Evaluation, inAtomic Bomb Survivor Data: Utilization andAnalysis, pp. 170-182. Eds. REL Prentice andD.J. -Thompson. Siam Institute forMathematics and Society, Philadelphia(1984).
GL.-57 Glasstone, S. The Effects of NuclearWeapons. U.S. Atomic Energy Commission,Washington (1957).
GO-76 Gortein, M. A Review of ParametersCharacterizing Response of NormalConnective Tissue to Radiation. Clin. Radiol.27(1976):389-404.
GR-66 Graham, S., et al. Preconception,Intrauterine and Postnatal Irradiation asRelated to Leukemia; EpidemiologicalApproaches to the Study of Cancer and OtherChronic Diseases. pp. 347-371, Monogravh 19,National Cancer Institute, Washington(1966).
GR.85 Greenhalgh, J.R., et al. Doses fromIntakes of Radionuclides by Adults andYoung People. (NRPB-R162). NationalRadiological Protection Board. Chilton, Didcot(1985).
0.-
C)
HA-59 Hammer-Jacobsen, E.Abortion on Account of X-rayDuring Pregnancy. Den.6(1959):113-122.
TherapeuticExaminationMed. Bull.
HO-68 Holloway, R.J. et al. Recovery fromRadiation Injury in the Hamster asEvaluated by the Split-Dose Technique. Rad.Research 33(1968):37-49.
lC-69 International Commission onRadiological Protection. Radiosensitivity andSpatial Distribution of Dose, ICRPPublication 14, Pergamon Press, Oxford(1969).
FO-59 Ford, D.J., Paterson, D.S.Treuting, W.L. Fetal Exposure to DiaiX-rays and Leukemia and Other MalDiseases of Childhood. Jour. National IInstitute 22(1959):1093-1104.
IV and'nosticignanthn ranssVrr
B-26
I'
(-(7.
IC-71 International Commission onRadiological Protection. Protectionl of thePatient in Radionuclide Investigatiois; ICRPPublication 17, Pergamon Press,! Oxford(1971).
IC-77, International Commission onRadiological Protection. RadiologicalProtection. ICRP Publication 26, PergamonPress, Oxford (1977).
I.,IC-78 International Commission onRadiological Protection. The Principles andGeneral Procedures for Handling Emergencyand Accidental Exposure of Workors, ICRPPublication 28, Pergamon Press' Oxford(1978).
IC-84a International Commission onRadiological Protection. Prindples forLimiting Exposure of the Public to NaturalSources of Radiation, ICRP Publi~ation 39,Pergamon Press, Oxford, England, 1984.
IC-84b International Commission onRadiological Protection. Protectioin of thePublic in thbe Event of Major lRadiationAccidents: Principles for Plannmig, ICRPPublication 40, Pergamon Presi, Oxford(1984).
IL-74 fl'in, LA, et al. Radioactive Iodine inthe Problem of Radiation Safety. Atomizdat,Moscow (1972), AEC-tr-7536, 1974!
JO-81 Jones, T.D. Hematologic Syndrome inMan Modeled from Mammalian Lethality.Health Physics 41(1981):83-103. i
KE-80 Kerr, G.D. A Review of Organ Dosesfrom Isotropic Fields of X-rays. HealthPhysics 39(1980):3-20.
KI-71 Kirk, J., Gray, W.M., and Watson, E.R.Cumulative Radiation Effect, Part 1:Fractionated Treatment Regimes. Clin.Radiol. 22(1971):145-155.
K041 Kocher, D.C. Dose Rate ConversionFactors for External Exposure to Photons andElectrons. NUREG/CR-1918,ORNL1NRG-79, Oak Ridge (1981).
LA-67 Langham, W.H. Radiobiological Factorsin Manned Space Flight. Publication 1487,National Academy of Sciences, Washington(1967).
LU-67 Lushbaugh, C.C., -Comasi F., andHofstra, R. Clinical Studies of RadiationEffects in Man. Rad. Research Suppl.7C1967).398-412.
LU-68 Lushbaugh, C.C. et al. ClinicalEvidence of Dose-Rate Effects in Total-BodyIrradiation in Man. Dose Rate inMammalian Radiation Biology. pp.17.1-17.25, (CONF-68041). Eds. D. G. Brown,R.G. Cragle, and T.R. Noonan U.S. NuclearRegulatory Commission, Washington, (1968).
LU-76 Lushbaugh, C.C. and Casarett, G.W.The Effects of Gonadal Irradiation in ClinicalRadiation Therapy: A Review. CancerSuppl. 37(1976):1111-1120.
MA-63 MacMahon, B. X-ray Exposure andMalignancy. JAMA 183(1963):721.
MA-64 MacMahon, B. and Hutchinson, C.B.Prenatal X-ray and Childhood Cancer, AReview. ACTA Union Intemational20(1964):1172-1174.
MI-76 Miller, R.W. and Mulvihill, J.J. SmallHead Size after Atomic IrradiationTeratology. 14(1976)M35-358.
MO-68 Moore, W. and Calvin, M.Chromosomal Changes in the Chinese
.
KA-58 Kaplan, H.S. An EvaluaSomatic and Genetic Hazards of dUses of Radiation. Amer. Jour. 1
80(1958):696-706.
ion of theie MedicalToentprnoli -�
KA-82 Kato, H. and Schull, W.J. I Studies ofthe Mortality of A-bomb Survivors, 7.Mortality, 19501978: Part ft, CancerMortality, Rad. Research 90(1982):395432.(Also published by the Radiation EffectResearch Foundation as: RERF TR 12-80,Life Span Study Report 9, Part 1.|
[B-27

Hamster Thyroid Following X-Irradiation uivivo. Int. Jour. Radia. Biol. 14(1968):161!167.
MO-82 Mole, R.H. Consequences of Pre-NatalRadiation Exposure for Post-:4talDevelopment: A Review. Int. Jour. RadiaLBiol. 42(1982):1-12.
NA.56 National Academy of Sciences. Reportof the Committee on Pathological Effects ofAtomic Radiation. Publication 452, NaionalAcademy of Sciences, National ResearchCouncil, Washington (1956).
NA-66 Nachtwey, D.S. et a]. Recovery, fromRadiation Injury in Swine as Evaluated by theSplit-Dose Technique. Rad. Rexearch31(1966):353-367.
NA.72 National Academy of Sciences.t TheEffects on Populations of Exposure t' LowLevels of Ionizing Radiation. Report AftheAdvisory Committee on the Biological Effectsof Ionizing Radiation, NAS-NRC. NationalAcademy Press, Washington (1972).
NA-73 NATO. NATO Handbook on$'theMedical Aspects of NBC Defensive Operstion.A-Med P-6; Part 1 - Nuclear, August 1973.
NA-74 Narforlaggningsutredningen.Narforlaggming av Karnkraftverk CUibanSiting of Nuclear Power Plants), EnglishLanguage Summary, SOU-1974:56, pp.276-310, 1974. ':
NA-B0 National Academy of Sciences. TheEffects on Populations of Exposure to LowLevels of Ionizing Radiation: 1980. Reports ofthe Committee on the Biological Effects ofIonizing Radiations. National Academy Press,Washington (1980).
NC-71 National Council on RadiationProtection and Measurements. BasicRadiation Protection Criteria, NCRP ReportNo. 39. National Council on RadiationProtection and Measurements, Bethesda, MD(1971)..
I
NC-74 National Council on RadiationProtection and Measureiments. RadiologicalFactors Affecting Decision Making in aNuclear Attack, Report No. 42, NationalCouncil on Radiation Protection andMeasurements, Bethesda, MD (1974).
0
OB-76 O'Brien, K and Sanner, R. TheDistribution of Absorbed Dose Rates inHumans from Exposure to EnvironmentalGamma Rays. Health Physics 30(1976):71-78.
OT-83 Otake, M.Sand Schull, W.J. MentalRetardation in Children Exposed in Utero tothe Atomic Bombs: A Reassessment. RERFTR1-83, Radiation Effects Research Foundation,Hiroshima (1983).
OT-84 Otake, M. and Schull, W.J. In UteroExposure to A-bomb Radiation and MentalRetardation: A Reassessment. BritishJournal of Radiolory 57(1984):409 84.
PA-68a Page, N.P. The Effects of DoseProtection on Radiation Lethality of LargeAnimals, pp. 12.1-12.23, in Dose Rate inMammalian Radiation Biology. CONF680401, U.S. Atomic Energy Commission,Oak Ridge (1968).
..PA.68b Page, N.P. et al. The Relationship of
Exposure Rate and Exposure Time toRadiation Injury in Sheep. Rad. Research33(1968):94-106.
PO-59 Polheinus, D.C. and Kock, R. Leukemiaand Medical Radiation. - Pediatrics23(1959):453.
PO-75 Popescu, H.I. and Lancranjan, I.Spermatogenesis Alteration DuringProtracted Irradiation in Man. HealthPhysics 28(1975):567-573.
PU-75 Purrott, R.J., et al. The Study ofChromosome Aberration Yield in HumanLymphocytes as an Indicator of RadiationDose, NRPB R 35. National -RadiationProtection Board. Harwell (1975).
B-28 I-)

1 :
(7) RD-51 Radiolceical Defense Vol. IL ArmedForces Special Weapons Project, (1951).
RU-72 Rubin, P. and Casarett, G. Frontiers ofRadiationTherapy and Oncology 6(1972):1-16.
RU-73 Rubin, P. and Casarett, G.W.A Conceptsof Clinical Radiation Pathology. pp. 160-189,in Medical Radiation Biology. Eds. G.V.Dalrymple, et al. W.B. Saunders Co.,Philadelphia (1973). -
SA-68 Samoson, R.J. et al. Prevalence ofThyroid Carcinoma at Autopsy, Hiroshima1957-68, Nagasaki 1951-67. Ato'mic BombCasualty Commission Technical ReoorL 25-68,(1968).
SC-80. Scott, BY, and Hahn, FYFL A ModelThat Leads to the Weibull DistributionFunction to Characterize Earlyl RadiationResponse Probabilities. Healti Physics39(1980):521-530. *
.. .
SC-83 Scott, B.R. Theoretical Models forEstimating Dose-Effect Relationihips afterCombined Exposure to Cytotoxicints. Bull.Mlth. Biol. 45(1983):323-345. A
SC-87 Schull, W.J., Radiation Affects ResearchFoundation. Personal Conversation withAllan C.B. Richardson. EPA! Office ofRadiation Programs. June 1987. 1:
SM-78 Smith, P.G. and Doll, R.Radiation-Induced Cancers in Patients withAnkylosing Spondylitis Following -a SingleCourse of X-ray Treatment, in: Proc. of theIAEA Symposium, Late Biologicoi.Effects ofIonizing Radiation 1, 205-214. InternationalAtomic Energy Agency, Vienna (1978).
ST-59 Stevenson, A.C. The Load ofHereditary Defects in Human Populations.Rad. Research Suppl. 1(1959):306-325.
ST-64 Stefani, S. and Schrek, R. CytotoxicEffect of 2 and 5 Roentgens" on HumanLymphocytes Irradiated in Vitro. Bad.Research 22(1964):126-129.
SU-69 Sugahara, T..et a). Variations in
ST-69 Still, E.T. et al. Acute Mortality andRecovery Studies in Burros Irradiated with 1MVP. X-rays. Rad. Research
* 39(1969):580-593.
ST-70b Stewart, A. and Kneale, G.W.Radiation Dose Effects in Relation to
* Obstetric X-rays and Childhood Cancer.Lancet 1(1970):1185-1188.
ST-73 Stewart, A. An Epidemiologist Takes aLook at Radiation Risks. DHEW PublicationNo. (FDA) 73-8024 (BRHYDBE 73-2). Foodand Drug Administration (HHS), Rockville,MD, (1973).
SU-69 Sugahara, T. et al. Variations inRadiosensitivity of Mce in Relation to Their
- Physiological Conditions. . pp.. 30-41,. inComparative Cellular and. SpeciesRadiosensitivity. Eds. V.P. Bond and T.Sugahara. The Williams & WilkinsCompany, Baltimore (1969).
SU-80a Summers, D.L. and Slosarik, W.J.Biological Effects of Initial-Nuclear RadiationBased on the Japanese Data, DNA 5428F.Defense Nuclear Agency, Washington (1980).
SU-80b Summers, D1L Nuclear CasualtyData Summary, DNA 5427F. DefenseNuclear Agency, Washington (1980).
TA-71 Taylor, J.F., et al. Acute Lethality andRecovery of Goats After 1 MVP X-Irradiation.Rad. Research 45(1971):110-126.
TG-66 Task Group on Lung Dosimetry(TGLD). Deposition and Retention Models forInternal Dosimetry of the Human RespiratoryTract. Health Physics, 12(1966):173-208.
UN-58 United Nations. Report of the UnitedNations Scientific Committee on the Effects ofAtomic Radiation, General Assembly, OfficialRecords: 13th Session Supp. No. 17(A'3838),United Nations, New York (1958).
UN-69 United Nations. Radiation-InducedChromosome Aberrations in Human Cells,
United Nations Scientific Committee on the
0 i
B-29

24th Session. Annex C, Geneva, pp. 98-i42,United Nations, New York (1969).
UN-77 United Nations. Sources and Effects ofIonizing Radiation. United Nations ScientificCommittee on the Effects of Atomic Radiation,Report to the General Assembly, withannexes, UN Publication E.77 IXL1., UnitedNations, New York (1977).
UN-82 United Nations. Ionizing Radiation:Sources and Biological. Effects. UnitedNations Scientific Committee on the Effects ofAtomic Radiation, 1982 Report to the GeneralAssembly, with annexes. United Nations, NewYork (1982).
UN-88 United Nations. Sources, Effects andRisks of Ionising Radiation. United NationsScientific Committee on the Effects of AtomicRadiation, 1988 Report to the GenieralAssembly, with annexes. United Nations,-NewYork (1988).
WA.69 Walinder, G. and Sjoden, A.M. ;TheEffect of "3'I on Thyroid Growth in MouseFetuses: Radiation Biology of the Fetal andJuvenile Mammal. AEC Symposium Series17, pp. 365-374, MR. Sikov and D.D. Mahlum,Editors. U.S. Atomic Energy Commission, OakRidge (1969).
* B-30
.-z
I.
WA-73 Wara, W.M. et al. RadiationPneumonitis: A New Approach to theDerivation of Time-Dose Factors. CancerResearch 32(1973):547-552.
0.WA-83 Wakabayashi, T. et al. Studies of the
Mortality of A-bomb Survivors, Report 7, Part1II, Incidence of Cancer in 1959-78 Based onthe Tumor Registry, Nagasaki, Rad. Research93(1983):112-142.
WH-65 World Health Organization.Protection of the Public in the Event ofRadiation Accidents, p. 123. World HealthOrganization, Geneva (1965).
WH-76 White, D.C. The Histopathologic Basisfor Functional Decrements in Late RadiationInjury in Diverse Organs. Cancer Research37 (Suppl.)1976:2046-2055.
WH-84 World Health Organization. Nuclearpower: Accidental releases principles of publichealth action. WHO Regional Publications,European Series No. 16. (1984).
*).

APPENDIX C
Protective Action Guides for the Early Phase:
Supporting Information
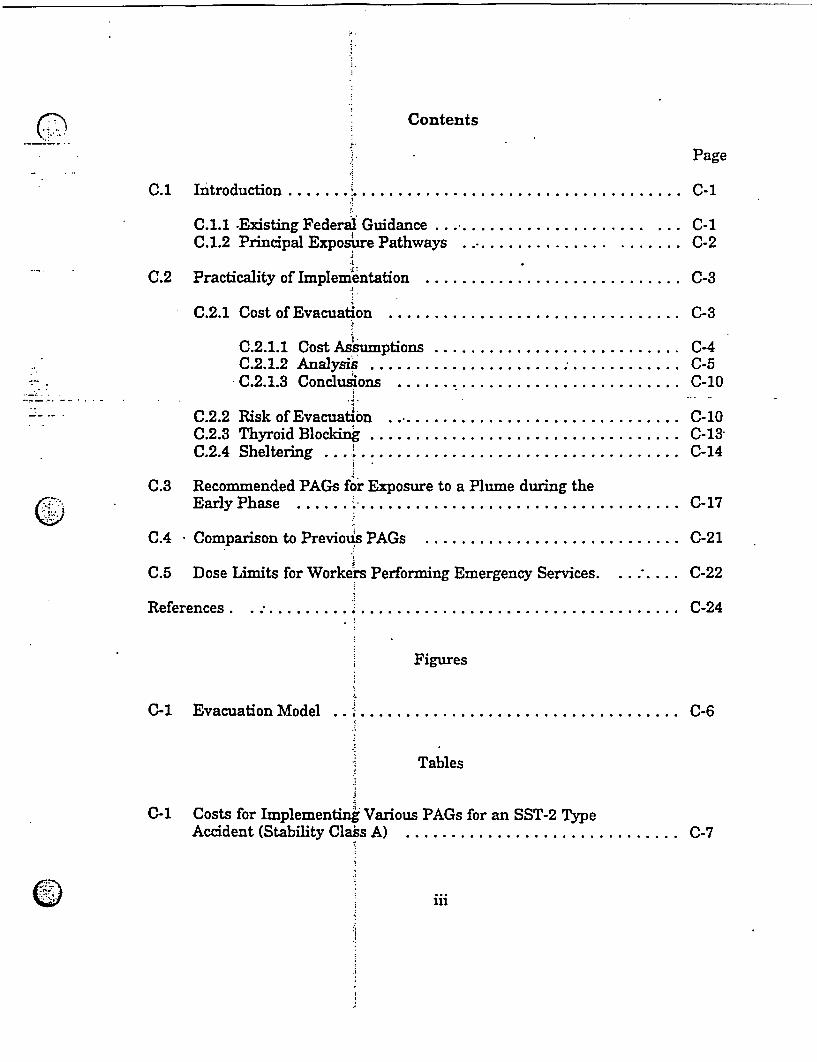
Contents
Page
C.1 Introduction .... .. .................................... C-i
C.1.1 .Existing Federal Guidance .......... .............. ... C-1C.1.2 Principal Exposure Pathways ....... .......... ....... C-2
C.2 Practicality of Implementation .. C-3
C.2.1 Cost of Evacuation. C-3
C.2.1.1 Cost Assumptions. C-4C.2.1.2 Analysi0 ..................... C-5C.2.1.3 Conclusions. C-10
-- C.2.2 Risk of Evacuation . C-10C.2.3 Thyroid Blocking . C-13C.2.4 Sheltering. C-14
C.3 Recommended PAGs for Exposure to a Plume during theC; Early Phase . C-17
C.4 Comparison to Previous PAGs. C-21
C.5 Dose Limits for Workers Performing Emergency Services.. C-22
References. .0 C-24
Figures
C-1 Evacuation Model C..0-6
Tables
i
C-1 Costs for Implementing Various PAGs for an SST-2 TypeAccident (Stability Class A). C-7
iii

I.
IJ
T1ibles (continued)
0.Page
C-2
C-3
C-4
C-5
C-6
C-7
C-8
C-9
C-10
Costs for Implementing Various PAGs for an SST-2 TypeAccident (Stability Class C) ...........................
Costs for Implementing Various PAGs for an. SST-2 TypeAccident (Stability Class F)' ........ ....................
Upper Bounds on Dose for Evacuation, Based on the Costof Avoiding Fatalities ................................
Average Dose Avoided per Evacuated Individual forIncremental Dose. Levels for Evacuation ..................
Representative Dose Reduction Factors for ExternalRadiation ........................................
Dose Reduction Factors for Sheltering from Inhalationof Beta-Gamnma Emitters .............................
Summary of Considerations'Ifor Selecting theEvacuation PAGs ...................................
Comparison of Projected Doses for Various ReactorAccident Scenarios .......................... :
Cancer Risk to Emergency Workers Receiving 25 Rem WholeBody Dose ............-
C-8
... C-9
... C-11
... C-12
... C-14
... C-16
C-18 II a
C-21
C-24
iv

APPENDIX C
Protective Action Guides for the Early Phase:Supporting Information
C.1 Introduction
This appendix sets forth supportinginformation for the choice of ProtectiveAction Guides (PAGs) for the earlyphase of the response to a nuclearincident involving the release ofairborne radioactive material -It thendescribes application' of the basicprinciples for selection of 'responselevels set. forth in Chapter i to theguidance 'on evacuation and shelteringin Chapters 2 and 5.
Response to a; radiologicalemergency will normally be carried out) in three phases, as discussed inChapter 1. Decisions during:the first(early) phase will usually be based onpredicted or potential radiologicalconditions in the environment, ratherthan on actual measurements. Theprincipal protective action isevacuation, with sheltering serrving asa suitable alternative under someconditions. This appendix eMa=inesthe potential magnitudes andconsequences of predicted exposures ofpopulations during the early phase, forselected nuclear reactor "ccidentscenarios, in relation to the. benefitsand detrimental consequences ofevacuation and sheltering. 'ENuclearreactor facilities are chosen forevaluation because, due to' theirnumber, size of source, and',.energyavailable to drive a release, they are
) .
IIl
most likely to provide an upper boundon the magnitude of the variety ofpossible sources of nuclear incidents.Although atmospheric releases fromother types of nuclear incidents arelikely to involve smaller consequences,the affected populations, and thereforethe costs and benefits of protectiveaction are each expected to scale inroughly the same proportion for lessermagnitude incidents.' Thus; basicconclusions developed for responses toreactor facilities are assumed to remainvalid for other types of nuclearincidents. Supplementary protectiveactions, such as washing and change ofclothing to reduce exposure of the skinand use of stable iodine to reduceuptake of radioiodine to the thyroid,are also considered, but in less detail.
C.1.1 Existing Federal Guidance
In the 1960's, the Federal RadiationCouncil (FRC) defined PAGs andestablished limiting' guides foringestion of strontium-89,strontium-90, cesium-137, andiodine-131 (FR-64; FR-65). Thatguidance applied to restricting the useof food products that had becomecontaminated as the result of release ofradioactivity to the stratosphere fromweapons testing. During the periodimmediately following an incident atany domestic nuclear facility, when the
C-1

critical source of exposure' is expectedto be a nearby airborne plume, !theprincipal protective actions areevacuation or sheltering. i The PAGsdeveloped here thus do not supersedeprevious guidance, but provideadditional guidance for promptexposure pathways specific to, adomestic nuclear incidentJ
C.1.2 Principal Exposure Pathways
The immediate exposure pathwayfrom a sub-stratospheric airbornerelease of radioactive rnaterials1 isdirect exposure from thte cloud¶. ofradioactive material carried i byprevailing winds. Such a plume cancontain radioactive noble gases,iodines, and/or particulate materials,depending on the source 'involved andconditions of the incident. Thesematerials emit gamma rays, which arenot significantly absorbed by air, andwill expose the-entire bodies of nearbyindividuals.
Another immediate exposurepathway occurs when [eople .aresubmerged in the cloud of radioactive.materials. In this case radioactivematerials are inhaled, and the skin andclothes may be contaminated. Inhaledradioactive materials, depending :ontheir solubility in body fluids, mayeither remain in the lungs bor move 1viathe blood to other organs. Manyradionuclides which enter thebloodstream tend to be predominantlyconcentrated in a single organ. Norexample, if radioiodines are inhale&, asignificant fraction will tend to moverapidly from the lungs through 'the
bloodstream to the thyroid gland wheremuch of the iodine will be depositedand most of the dose' will be delivered.Although dose to skin from materialsdeposited on the skin and clothingcould be significant, it will be lessimportant in terms of risk of fatalcancer than dose from inhalation, ifearly- protective actions includewashing of exposed skin and changes ofclothing.
'0
As the plume passes over an area,radioactive materials may settle ontothe ground and other surfaces. Peopleremaining in the area will thencontinue to be exposed throughingestion and external radiation, andthrough inhalation of resuspendedmaterials. The total dose from suchdeposited materials may be moresignificant than that due to directexposure to the plume, because theterm of exposure can be much longer.However, since the protective actions.considered here (evacuation and/orsheltering) may not be appropriate ormay not apply for this longer termexposure, doses from these exposuresbeyond the early phase are notincluded in the dose considered in thePAGs for the early phase. It isassumed that, within four days afteran incident, the population will be
'In this and all subsequent references, theword 'dose" means the committed doseequivalent to the specified organ, or; if noorgan is specified, the sum of the committedeffective dose equivalent from intake ofradionuclides and the effective dose equivalentfrom external sources of radiation. (SectionB.1.1 contains a more detailed discussion ofunits of dose for PAGs.)
-)C-2

0. . .... .
protected from these subsequent doseson the basis of the PAGs for relocationand for contaminated food and water.(See Chapters 3 and 4.) I
Based on the foregoingconsiderations, the PAGs for the earlyphase are expressed in terms ofestimated doses from exposure due toexternal radiation, inhalation, *andcontamination of the skin only duringthe early phase following an incident.
.1..
C.2 Practicality of Implementation
Whereas Appendix B deals`with therisk associated with the projected dosethat could be avoided[by any pjrotectiveaction, this section addresses ihe costsand risks associatedkwith evacuationitself. That is, these "nalyses relate toPrinciples 3 and 4 for deriving PAGs,set forth in Chapter l, which! addressthe practicality of protective: actions,rather than acceptability of risks underPrinciples 1 and 2, which is evaluatedin Appendix B.
The principal relevant p dotectiveactions during the early phase are, asnoted earlier, evacuation andsheltering. In some cases, washing andchanging of clothing, or thyroidblocking may also !be appropriateactions. The costs, risks, and degreesof protection associatea withevacuation are generally higher thanthose for sheltering. Although theremay be some costs and risks associatedwith the other protective actions, theyare small and not readily qua tiflable.Therefore, only the costs and risksassociated with eva uation twill be
evaluated here. These factors areevaluated to determine whether thecosts are low enough to justify lowerPAGs than would be required to satisfyupper bounds of acceptable risk underPrinciples 1 and 2.
C.2.1 Cost of Evacuation
Costs incurred to reduce theradiation risk from nuclear incidentscan be considered to fall into severalmajor categories. The first categoryincludes the design, construction, andoperation of nuclear facilities in such amanner as to minimize the probability.and consequences of radiologicalincidents. It is recognized that theprobability and consequences of suchincidents usually cannot be reduced tozero. Therefore, a second category isnecessary: the development ofemergency response plans to invokeactions which would reduce exposure ofpotentially exposed populations, andconsequently their risks, if a majornuclear incident should occur.
Both of the above categories of costare properly attributed to the cost ofdesign and operation of a nuclearfacility. A third category of costs is theactual expenses incurred by takingprotective actions as the result of anincident. In general, the choice oflevels for PAGs will affect only thisthird category of costs. That is, allcosts in the first two categories areassumed to be unaffected by decisions.on the levels of PAGs. (This will be thecase unless the PAGs were to be set sohigh as to never require protectiveaction, in which case response plans
C-3

would be unnecessary.) Therefore! thecosts associated with implementingt thePAGs are evaluated onlyi in terms ofthe actual cost of response. In asimilar manner, the risk' incur-red byprotective actions is comp ared only tothe risk associated with the radiationdose that would be avoided byi'theaction, and is unaffected by any o iermeasures taken to reduc6 risks thatfall in the first two categories of costidentified above.
0.2.1.1 Cost Assumptions'
The analyses in this; section ,arebased on evaluation of &h costs, ofevacuation and the doses that would bereceived in the absence of protectiveactions for nuclear reactor incide.nts.These were calculated as a function~ ofoffsite location, meteorological
: 92
condition, and incident type (TA-87).Dose anducost data are based on lithefollowing assumptions:
plume, inhalation of radioactivematerial in the plume, and from fourdays exposure to deposited radioactivematerial.
5. Population distributions are theaverage values observed around 111nuclear power reactor plants, based on1970 data.
6. The cost of evacuation is $185 perperson for a 4-day evacuation involvinga 100-mile round trip, with an averageof 3 persons per household. Theseevacuation costs include wages andsalaries of personnel directing theevacuation, transportation costs ofevacuees to and from the staginglocation, food and shelter for theevacuees during the evacuation period,loss of personal and corporate incomeduring the evacuation period, and thecosts of any special supplies (TA-87).
The estimated costs and dosesavoided are based on the followingidealized evacuation area model (seeFigure C.1.):
1. All people within a 2-mile radius ofthe incident are evacuated for allscenarios.
2. People are also evacuated from adownwind area bounded by equivalentrays on either side of the center line ofthe plume, which define the angularspread (70, 90, or 180 degrees) of thearea evacuated by an arc at thedistance beyond which the evacuationdose would not be exceeded on theplume centerline.
C-4
0'. '
-): 5
1. Airborne releases are tUassociated with fuel melt accidentnuclear reactor facilities followedcontainment failure.
ose; at!.by
2. Meteorological conditions rangefrom stable to unstable, andwindspeeds are those typical of thestability class.
3. Plume dispersion follows I aGaussian distribution, with a 0.01 in/sdry deposition velocity for, iodine andparticulate materials.
4. Doses are those incurred fromwhole body gamma radiation from the

(Th Figure C-1 shows' the relationshipbetween the area il in which theevacuation dose would be exceeded andthe larger area that might beevacuated. The figure shows the plumecentered in an idealized evacuationarea.
C.2.1.2 Analysis
Evaluation of costs for evacuationand doses to populations as a functionof the area evacuated depends on avariety of assumptions. Threefuel-melt accident categories, sixmeteorological stability classest, and thethree evacuation area models discussedabove were examined. Detailedassumptions and data are reportedelsewhere (EP-87a). i Selected data,including the cost periunit of collectivedose to the population Figure C.1(person-rem) avoided, fare presented inTables C-1, C-2, and C-3, for threestability classes, for the 11mediannuclear accident category evanined(SST-2). (SST accident categonies aredescribed in Section E.1.2).
The data are presented for both thetotal area and the inxcremental areaevacuated for each change in dose levelexamined. When evaluating'.he costper person-rem avoided for a specificset of circumstances, it is apptropriateto assess the ratio of fthe total cost tothe total dose avoided to calculate theaverage cost per person-rem avoided.However, when one is comparing thecost versus dose avoided to Snake ajudgment between a variety of differentlimiting dose values, it is appropriateto compare the dose savings and costs
at the margin, since the cost ofevacuating the. additional area. isincurred to avoid the incrementalcollective dose. Therefore, theappropriate quantities are the cost andrisk for the additional area evacuated.Results of analyses on both a total andincremental basis are presented inTables C-1, C-2, and C-3 for accidentcategory SST-2. This is the smallestcategory of fuel melt accident yieldingeffective dose equivalents during thefirst 4 days of exposure that aregreater than 0.5 rem outside theassumed 2-mile evacuation circle for allstability classes. Data on costs versusdose saved for all three accidentcategories are summarized in Table CA4in the next section.
Changes in population densitywould not affect the above results,since both cost and collective dose areproportional to the size of thepopulation affected. Factors that couldaffect these results are differentassumptions for cost of evacuation,accident scenarios, and evacuation areamodels. The results will be directlyproportional to different assumptionsfor the cost of evacuation. Some dataon the variation with accident scenarioare presented in the next section. Insituations where different widths ofevacuation area are assumed, thechange in cost per unit dose avoidedwill be approximately proportional tothe change in width in degrees. Thisapproximation is more accurate for thehigher stability classes (E and F).Evacuation within a 2 mile radiuscircle and a 90 degree sector in thedownwind direction is generallyconsidered to be adequate for release

I .
LCEEDED
ATED
EVACUATION MODEL.
C-6 -':

Table C-1
ID.
Costs for Implementing Various PAGs for an SST-2 Type Accident (Stability Class A)..
Total Area . Marginal AreaEvacuation PAGangle value Dose Dollars/ A Dose A Dollars/
(degrees) (rem) Cost avoided person-rem A Cost avoided Aperson-rem(dollars) (person-rem) avoided (dollars) (person-rent) avoided
70 0.5 2.83E+7 8.97E+4 315.- . -- .-. .. - - 6.68E+6 .. -.. 4.06E+4 . - -- -1 6 2.16+7
2 1.49E+6 1.73E+4. 88 5.19E+6 2.33E+4 22329E5.2E31.19E+i6 1.21E+4 '985 2.99E+5 5.22E+3 57 97E424E34
10 )970E+4 2.44E+3 40-10.---~ - - - . - - --- - - --- - . - - - - r - - - - .- -
90
180
0.5126
10
0.5125
10
3.63E+78.54E+61.86E+63.26E+5
(a)
7.16E+71.67E+73.48E+64.48E+5
(a)
9.29E+44.24E+41.82E+45.41E+3
(a)
9.33E+44.27E+41.84E+45.46E+3
(a)
891201102
60(a)
767391190
82(a)
2.78E+76.68E+61.54E+61.25E+6
5.49E+71.32E+73.04E+62.47E+6
6.05E+42.42E+41.28E+42.63E+3
5.06E+42.43E+41.29E+42.68E+3
56027612047
1080643235
92
* The 4-day dose does not exceed the PAG outside the 2-mile radius of the accident site.The total cost -of evacuation within this radius is 2.02E+5 dollars; the total dose avoidedis 2.78E+3 person-rem; and the total cost per person-rem avoided is $73.
C-7
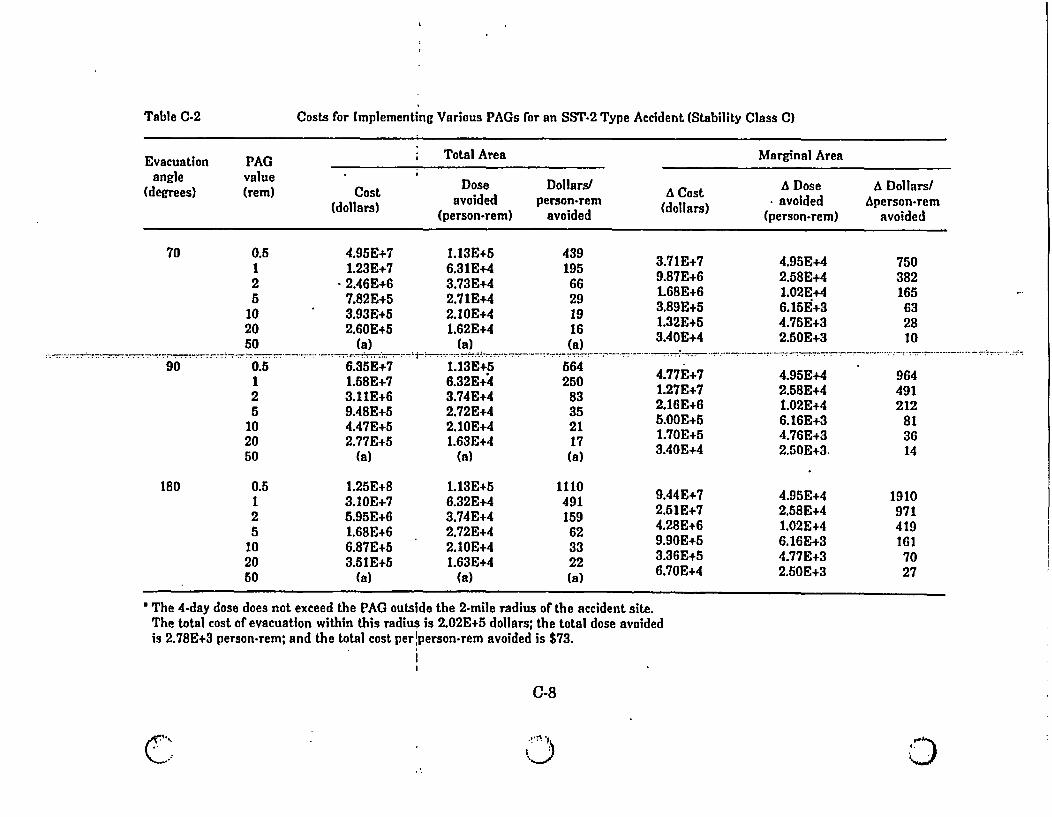
Table C-2 Tabl C.2Costs for Implementing Various PA~s for an SST-2 Type Accident (Stability Class C)
Evacuation PAOG Total Area Marginal Areaangle value DsDoar/A Dose A Dollars/
(d(ee) (rmdolast avoided person-rem A(Colas)t avoided Aperson-rem(olr)(person-rem) avoided (dolars (person-rem) avoided
70
90
180
0.5125
102050
0 .5125
102050
0.5125
102050
4.95E+71.23E+72.46E+67.82E+53.93E+52.60E+5
(a)
6.35E+71.58E+73.11E+69.48E+54.47E+52.77E+5
(a)
1.25E+83.10E+75.95E+61.68E+66.87E+53.51E+5
(a)
1.13E+56.31E+43.73E+42.7 1E+42. 10E+41.62E+4
(a)
1.13 E+56.32E+43.74E+42.72E+42.10OE+41.63E+4
(a)
1. 13E.56.32E+43.74E+42.72E+42.10E+41.63E+4
(a)
43919566291916(a)
3.71E+79.87E+61.68E+63.89E451.32E+53.dOE+4
4.95E+42.58E+41.02E+46.15E+34.75E+32.50E+3
750382165
632810
--- --- ......... - .- . . . . .. . ... . . I . . . 1. . .:-564250
83352117(a)
1110491159623322(a)
4.77E+71.27E+72.16E+65.OOE+51.70E+53.40E+4
9.44 Ei72.51E+74.28E*69.90E+53.36E+56.70E+4
4.95E+42.58E+41.02E+46.16E+34.76E+i32.50E+3.
4.95E+42.58E+41.02E.46.16E+34.77E+32.50E+3
964491212
813614
1910971419161
7027
a The 4-day dose does not exceed the PAG outside the 2-mile radius of the accident site.The total cost of evacuation within this radius is 2.02E+5 dollars; the total dose avoidedis 2.78E+3 person-rem; and the total cost per !person-rem avoided is $73.
C-8
C.- L" I .0

0
Costs for Implementing Various PAGs for an SST-2 Type Accident (Stability Class F)
.D
Table C-3
Evacuation PAG Total Area Marginal Areaangle value Dose Dollars/ A Dose . A Dollars/
(degrees) (rem) Cost avoided person-rem . A Cost avoided A person-rem(dollars) (person-rem) avoided (dollars) (person-rem) avoided
70 0.5126
- _ ---- -.__
2050
90 0.5125
102050
8.95E+74.95E+72.83E+71.23E+7
-6.6-8E+63.65E+61.49E+6
1.15E+86.35E+73.63E+71.58E+78.54E+64.64E+61.86E+6
2.27E+81.25E+87.16E+73.10E+71.67E+78.98E+63.51E+6
_ - L
4.61E+54.41E+54.19E+53.83E+53.53E+653.22E+52.68E+5
4.61E+54.4 1E+54.19E+53.83E+53.53E+53.22E+52.68E+5
4.61E+54.41E+54.19E+53.83E+53.53E+53.22E+52.68E+5
_
194112
6732
115.6
250144
87412414
6.9
493285171
81472813
-:.7 .....
' 4.01E+72.12E+71.59E+7
----. 65E+63.03E+69.70E+5
5.15E+72.72E+72.05Ei77.26E+63.90E+61.30E+6
1.02E+85.39E+74.05E+71.44E+77.71E+62.40E+6
, .- . H ...... .... .
1.98E+42.17E+43.66E+4:2.93E+4-3.18E+43.10E+4
1.98E+42.17E+43.66E+42.93E+43.18E+43.10E+4
1.99E+42.17E+43.66E+42.92E+43.18E+43.10E+4
....;-. - ... H.....
2020977436
-' 193-9532
2600126056024812341
512024801110492242
80
_ @ , ,, .. __, ........ ..
180 0.5I25
102050
C-9

durations not exceeding a few hoursand where reliable wind directionforecasts are available.
C.2.1.3 Conclusions
As shown in Tables C-1, C-2, andC-3 for an SST-2 accident, the costlperunit dose avoided is greatest for wideangle evacuation and for the moststable conditions, class (F). Although afew emergency plans call for evacuationover wider angles (up to 360 degrees),the model shown in Figure C-i with a90 degree angle is most common. [
To estimate an upper bound on dosefor evacuation based on cost, we firstconsider common values placed onavoiding risk. As one input into itsrisk management decisions, EPA hasused a range of $400,000 to $7,000,000as an acceptable range of costs [foravoiding *a statistical death frompollutants other than radiation. For arisk of 3x10 cancer deaths -perperson-rem (see Appendix B), thesedollar values are equivalent to a rangeof from about $120 to $2,000 perpers6n-rem avoided; These values tanbe compared to the marginalcost-effectiveness (dollars perperson-rem) of evacuation over J anangle of 90 degrees. The resultingranges of upper bounds on dose pLreshown in Table C-4 for SST-1, SST-2,and SST-3 accident scenarios. Themaximum upper bounds (based: ionminimum costs for avoiding risk) rangefrom 1 to' 10 rem, with most valuesbeing approximately 5 rem. Theminimum upper bounds (based [onmaximum costs for avoiding risk) range
'. 1
from 0.15 to 0.8 rem, with 0.5 rembeing representative of most situations.From these data we conclude that,based on the cost of evacuation, a PAGlarger than the range of values 0.5 to 5rem would be incompatible withPrinciple 3.
0-
C.2.2 Risk of Evacuation
Principle 4 requires that the risk ofthe protective action not exceed therisk associated with the dose that willbe avoided. Risk from evacuation cancome from several sources, including(1) transportation incidents for bothpedestrians and vehicle passengers, (2)exposure to severe weather conditionsor a competing disaster, and (3), in thecase of immobile persons, anxiety,unusual activity, and separation frommedical care or services. The firstsource, transportation incidents, is the Donly category for which the risk hasbeen quantified. An EPA report(HA-75) evaluated the risk oftransportation fatalities associatedwith emergency evacuations that haveactually occurred and concluded thatthe risk of death-per-mile traveled isabout the same as that for routineautomobile travel. Using this as abasis, the risk of death from travel isabout 9x10' deaths per person-mile, or9x10 6 deaths per person for the100-mile round trip assumed forevacuation. Assiuming a risk of fatalcancer from radiation of approximately3X10 4 per person-rem, such anevacuation risk is equivalent to a doseof about 0.03 rem.
C-10 K)

1:U.e
Upper Bounds on Dos 'for Evacuation, Based on the Cost of Avoiding Fatalities'. _ - , .. . ... ,. . .. ..C
Table C-4
I . Dose Upper Boundsb"Accident Atmospheric Maximum MinimumCategory Stability Class (rem) (rem)'
SST-1 A 5 0.4C 5 0.4'F 10 0.8
SST-2 A[l 1 0.15C1 3.5 0.25Fl 10 0.7
SST-3 A' (d) (d)C:. . (d) (d)Fi 5 0.45-
'Based on data from EP-87a.
b Windspeeds typical of each stabilit) class were chosen.
'Based on an assumed range of $400,000 to $7,000,000 per life saved.
i For stability classes A and C, the dIse from an SST.3 accident is not predicted to exceed 0.5 remoutside a 2-mile radius. It is assumed that evacuation inside this radius would be carried outbased on the emergency condition on'the site. No differential evacuation costs were calculatedwithin this area. :
In comparing this risk (or, moreexactly, its equivalent in doses to therisk avoided by evacuation it isimportant to note that protective action
1*must be implemented over a largerpopulation than will actually beexposed at the level of the PAG.Because of uncertainty orunpredictable changes in: winddirection, the exact location l:of theplume will not be precisely known.Dose projections are made or themaximum exposed individuals|- thoseat the assumed location of the plume
centerline. To assure that theseindividuals will be protected, it isnecessary that others on either sidetake protective action at exposures thatare less than at the plume centerline,and, in some cases, are zero. Thus, theentire evacuated population couldincur, on the average, a risk from theprotective action which exceeds the riskof the radiation dose avoided.Although it is not possible to assurethat no individuals incur risks fromevacuation greater than their radiationrisks, we can assure that this does not
C-ll

occur, on the average, at the outermargin of the evacuation area. Forthis reason, we also examined theaverage dose avoided for [theincrementally evacuated population forvarious choices of evacuation levels.Table C-5 presents the results, whichare derived from the data in TablesC-1, C-2, and C-3. For the levelsanalyzed, the average dose: avoided isalways significantly greater than 0.03rem. We conclude, therefore, that thechoice of PAGs will not be influencedby Principle 4, for persons in -thegeneral population whose risk fromevacuation is primarily the normal r'isk
of transportation, if the centerline doseavoided is at or above 0.5 rem.
As previously discussed, hazardousenvironmental conditions (e.g., severeweather or a competing disaster) couldcreate transportation risks fromevacuation that would be higher thannormal. It is therefore appropriate tomake an exception to allow higherprojected doses for evacuation decisionsunder these circumstances. In theabsence of any definitive informationon such higher risks from evacuation,we have arbitrarily assumed that itwould be appropriate to increase the
0-
Table C-5 Average Dose AvoidedLevels for Evacuation
per Evacuated Individual for Incremental Dose
;
Centerline dose Average dose avoided (rem perCentelinedoseI.
(rem) individual) by stability class
I: A C F
0.5 to 1I to 22 to 55to 10
0.34i. 0.67
0.190.380.87
0.070.150.33- -0.75
.1I!..1
recommended projected dose forevacuation of the general populationunder hazardous environmentalconditions up to a factor of 5 higherthan that used under normalenvironmenital conditions.
at higher risk from evacuation than areaverage members of the population. Itwould be appropriate to adopt higherPAGs for evacuation of individuals whowould be at greater risk fromevacuation itself than for the typicallyhealthy members of the population,who are at low risk from evacuation.In the absence of definitive information
It is also recognized that thcpersons who are not readily mobile a
C-12Vili.
i,:TI.i,
.i.
i:

Q) on the higher risk associated with theevacuation of this group, we havearbitrarily assumed: that. it isappropriate to adopt PAGs a factor offive higher for evacuation of high riskgroups under normal environmentalconditions. If both conditions exist,(high risk groups and hazardousenvironmental conditions) projecteddoses up to 10 times higher than thePAGs for evacuation of the Generalpopulation under normal conditionsmay be justified. These. doses areexpected to satisfy Principle 4 1ithoutviolating Principles 1 and 3. Althoughthey violate Principle 2, Priziciple 4becomes, for such cases,: the overridingconsideration.
C.2.3 Thyroid Blocking
0-1 The ingestion of stable potassiumiodide (KI) to block the uptake ofradioiodine by the thyroid ha beenidentified as an effective protectiveaction. The Food and !' DrugAdministration (FDA) analyzedavailable information on the risk ofradioiodine-induced thyroid cancersand the incidence and severity} Iof sideeffects from potassium i odide (FD-82).They concluded "...risks from theshort-term use of relatively lowi dosesof potassium iodide for thyroid blockingin a radiation emergency areoutweighed by the risks ofradioiodine-induced thyroid nodules orcancer at a projected: dose ,to thethyroid gland of 25 rem. ! FDArecommends that potassium iodide indoses of 130 milligrams (mg) per dayfor adults and children above }1 yearand 65 mg per day for children below 1
year of age be considered for thyroidblocking in radiation emergencies inthose persons who are likely t'ir'ueceivea projected radiation dose of 25 rem orgreater to the thyroid gland fromradioiodines released into theenvironment. To have the greatesteffect in decreasing the accumulation ofradioiodine in the thyroid gland, thesedoses of potassium iodide should beadministered immediately before orafter exposure. If a person is exposedto radioiodine when circumstances donot permit the immediateadministration of potassium iodide, theinitial administration will still havesubstantial benefit even if it is taken 3or 4 hours after acute . exposure".Evacuation and sheltering are,however, preferred alternatives formost situations because they provideprotection for the whole bodyand avoid the risk of misapplication ofpotassium iodide.
The Federal EmergencyManagement Agency has published aFederal policy developed by the FederalRadiological Preparedness CoordinatingCommittee regarding the use of KI asa protective action (FE-85). Insummary, the policy recommends thestock-piling of KI and distributionduring emergencies to emergencyworkers and institutionalized persons,but does not recommend requiringstockpiling or distribution to thegeneral public. The policy recognizes,however, that options on thedistribution and use of KI rests withthe States and, hence, the policystatement permits State and localgovernments, within the limits of theirauthority, to take measures beyond
01. Jo: C-13
J:l'
Y .I :

those recommended or requinationally.
red The protection factor may becharacterized by a dose reduction factor(DRF), defined as:
C.2.4 Sheltering DRF = dose with protective actiondose without protective action
Sheltering means staying inside astructure with doors and windows The shielding characteristics of mostclosed and, generally, with exterior structures for gamma radiation can beventilation systems shut off. categorized based on whether they areSheltering in place (i.e. at or near the "small" or'large." Small structures arelocation of an individual when the primarily single-family dwellings, andincident occurs) is a low-cost, low-risk large structures include office,protective action that can provide industrial, and commercial buildings.protection with an efficiency ranging The typical attenuation factors given infrom almost 100 percent to zero, Table C-6 show the importance of thedepending on the circumstances. It can type of structure for protection fromalso be particularly useful to assure external gamma radiation (EP-78a). Ifthat a population is positioned so that, the structure is a wood frame houseif the need arises, communication with without a basement, then shelteringthe population can be carried out from gamma radiation would provide aexpeditiously. The degree of protection DRF of 0.9; i.e., only 10 percent of theprovided by a structure is governed by dose would be avoided. The DRFsattenuation of radiation by structural shown in Table C-6 are initial valuescomponents (the mass ofwalls, ceilings, prior to infiltration of contaminatedetc.) and by its outside/inside air- air, and therefore apply only to shortexchange rate. These two protective duration plumes. The values willcharacteristics are considered increase with increasing time ofseparately. . exposure to a plume because of the
increasing importance of inside-outsideair exchange. However,,this reduction
Table C-6 Representative Dose Reduction Factors for External Radiation
Structure DRF ' Effectiveness(percent)
Wood frame house (first floor) 0.9 10Wood frame house (basement) 0.6 40Masonry house 0.6 40Large office or industrial building 0.2 or less 80 or better
A .
1-07
..
i:
.:.i.
.,..j
:
'>C-14

0in efficiency is not dramatic forl sourceterms involving, primarily gammaradiation, because most of thie dosearises from outside, not from the smallvolume of 'contaminated air2in'side ashelter. Therefore, most shelters willretain their efficiency as .. shieldsagainst gamma radiation, even 'if theconcentration inside equals theconcentration outside.
:,.
The second factor is theinside/outside air exchange rate'. Thisfactor primarily affects protectionagainst exposure by inhalation ofairborne radionuclides with liaif liveslong compared to the air exchange rate.The factor is expressed as the nuiamberof air exchanges per hour, L (h''), orthe volume of fresh air flowinginto andout of the structure per hour divided bythe volume of the structure. Virtuallyany structure that can be used forsheltering has some degree ofoutside/inside air exchange due tonatural ventilation, forced ventilation,or uncontrollable outside forces,primarily wind.
Assuming constant atmospheric andsource conditions and no effects fromfiltration, deposition, or radioactivedecay, the following model can be usedto estimate the buildup of indoorconcentration of radioactivity, .for agiven outdoor concentration, ,as afunction of time after appearance' of theplume and of ventilation rate:
C= C(1 - e'
where C, = concentration inside,
c= concentration outside,
L = ventilation rate (h'), and
t = elapsed time (h)..
Typical values for ventilation ratesrange from one-fifth to several airexchanges per hour. In the absence ofmeasurements, an air exchange rate of1.0/h may be assumed for structureswith no special preparation except forclosing the doors and windows. An airexchange rate of 0.3/h is appropriatefor relatively air-tight structures, suchas well-sealed residences, interiorrooms with doors 'chinked and nowindows, or large structures withventilation shut off. Using the abovemodel to calculate indoor concentrationrelative to outdoor concentration afterone, two, and four complete airexchanges, the indoor concentrationwould be about 64 percent, 87 percent,and 98 percent of the outsideconcentration, respectively. It isapparent that staying in a shelter formore time than that required for one ortwo complete air exchanges is not veryeffective for reducing inhalationexposure.
The inhalation DRF is equal to theratio of the average inside to outsideair concentration over the period ofsheltering. Studies have beenconducted of typical ventilation ratesfor dwellings (EP-78a) and for largecommercial structures (GR-86). Ineach case the rate varies according tothe air tightness of the structure,windspeed, and the indoor-to-outdoortemperature difference. For thepurpose of deriving PAGs, averageventilation rates were chosen for thetwo types of structures that are of
C-15

greatest interest. Table C-7 shows than a 10 percent increase in the dosicalculated dose reduction factors' for received during plume passageinhalation exposure as .a function of (EP-78b)), but can be greater fo:plume duration, for beta-gamma source inhalation dose.terms, assuming average ventilationrates for these structures. Doses from inhalation durin,
sheltering can be reduced in severa.A potential problem with sheltering ways, including reducing air exchang(
is that persons may not leave the rates by sealing cracks and openingsshelter as soon as the plume passes with cloth or weather stripping, tapeand, as a result, will receive exposure etc., and filtering the inhaled air withfrom radioactive gases trapped inside. commonly available items like welThe values for DRFs tabulated in Table towels and handkerchiefs. Analyses forC-7 ignore this potential ade tional some hypothesized accidents, such ascontribution. This effect is generally short-term transuranic releases, showminor for gamma dose (generally less that sheltering in residences and other
.:
Table C-7 Dose Reduction Factors for Sheltering from Inhalation of Beta-GammaEmitters
Ventilation rate Duration of(air changes/h) plume exposure(h) DRF
0.3 0.5 0.071 0.142 0.254 0.416 0.54
1 0.5 0.211 0.362 . 0.564 0.756 0.83
e
r0C)
I
1)r
SApplicable to relatively "airtight' structures such as well- sealed residences, interior rooms withchinked doors and no windows, or large structures with outside ventilation shut off.
bApplicable to structures with no special preparation except for closing of doors and windows.
C-16 ~'JYN as
1:V
J.

rC)buildings can be more effective than forbeta-gamma emitters, may' provideadequate protection, and may!be moreeffective than evacuation whenevacuation cannot be completed beforeplume arrival (DO-90). However,sheltering effectiveness for theinhalation exposure pathway: can bereduced drastically by open windowsand doors or by forced air ventilation.Therefore, reliance on protectionassumed to be afforded based'on largedose reduction factors for shelteringshould be accompanied by cautiousexamination of possible ' failuremechanisms, and, except in veryunusual circumstances, should not berelied upon at projected doses!greaterthan 10 rem. Such analysis should bebased on realistic or "best estimate"dose models and include considerationof unavoidable dose if evacuation werecarried out.
C.3 Recommended PAGs for Exposureto a Plume during the Early Phase
(avoidance of acute health effects) isassured by the low risk required tosatisfy Principle 2, and thus requiresno additional consideration. Principle2 (acceptable risk of delayed healtheffects) leads to the choice of 0.5 rem asan upper bound on the avoided dosebelow which evacuation of the generalpopulation is justified under normalconditions. This represents a risk ofabout 2E-4 of fatal cancer. Maximumlifetime risk levels consideredacceptable by EPA from routine'operations of individual sources rangefrom 1E-6 to 1E-4. Risk levels that arehigher than this must be justified onthe basis of the emergency nature of asituation. In this case, we judge that.up to an order of magnitude highercombined risk from all phases of anincident may be justifiable. The choiceof 0.5 rem avoided dose as anappropriate criterion for an acceptablelevel of risk during the early phase is asubjective judgment that includesconsideration of possible contributionsfrom exposure during other phases ofthe incident, as well as the possibilitythat risk estimates may increasemoderately in the near future as aresult of current reevaluations ofradiation risk.
Principle 4 (risk from the protectiveaction must be less than that from theradiation risk avoided) supplies a lowerbound of 0.03 rem on the dose at whichevacuation of most members of thepublic is justified. Finally, underPrinciple 3 (cost/risk considerations)evacuation is justified only at valuesequal to or greater than 0.5 rem. Thiswill be limiting unless lower values arerequired for purely health-based
Gf .:.;
The four principles which form thebasis for the selection of PAG valuesare presented in Chapter 1. The risksof health effects from radiation that arerelevant to satisfying Principles 1 and2 are presented in Appendix': B andanalyses of the costs and risksassociated with evacuation relative toPrinciples 3 and 4 have been presentedin this appendix. These results, forapplication to the early phase, aresummarized in Table C-8.
The following describes how theseresults lead to the selection of thePAGs. Conformance to Principle 1
O C-17

Table C-8 Summary of Considerations for Selecting the Evacuation PAGs.
Dose(rem) Consideration Principle Section
50 Assumed threshold for acutehealth-effects in adults. 1 B.2.1.4
10 Assumed threshold for acutehealth effects in the fetus. 1 B.2.1.4
5 Maximum acceptable dose for normaloccupational exposure of adults. 2 C.5
5 Maximum dose justified to averagemembers of the population, basedon the cost of evacuation. 3 C.2.1.3
0.5 - Maximum acceptable dose to thegeneral population from iallsources from nonrecurring, non-accidental exposure. F 2 B.4.4
0.5 Minimum dose justified to average BDmembers of the population, basedon the cost of evacuation. 3 C.2.1.3
0.5 Maximum acceptable dose' tthe fetus from occupationalexposure of the mother. :' 2 C.5
0.1 Maximum acceptable dose to thegeneral population from6allsources from routine (chronic),nonaccidental exposure. 2 B.4.4
0.03 Dose that carries a nsk assumedto be equal to or less than thatfrom evacuation. 4 C.2.2
This is also the dose to the 8- to 15-week-old fetus at which the risk of mental retardation is assumedto be equal to the risk of fatal cancer to adults from a dose of 5 rem.
C-18

reasons (Principle 2). But this is notthe case. The single lower purelyhealth-based value, 0.1 rem,' is onlyvalid as a health-based criterion forchronic exposure.
In summary, we have selected thevalue 0.5 rem as the avoided dosewhich justifies evacuation, because 1) itlimits the risk of delayed effects onhealth to levels adequately protective ofpublic health under emergencyconditions, 2) the cost ofimplementation of a lower value is notjustified, and 3) it satisfies the twobounding requirements to avoid acuteradiation effects and to; avoidincreasing risk through the protectiveaction itself. We note that this choicealso satisfies the criterion foracceptable risk to the fetus ofoccupationally exposed mothers (aswell as falling well below dose valuesat which abortion is recommended).
As noted in Section C.2.4, weassume that the dose normallyavoidable by evacuation (the dose thatis not avoided by the assumedalternative of sheltering) is one half ofthe projected dose. ' The value of thePAG for evacuation of the generalpublic under normal circumstainces istherefore chosen as one rem projectedsum of the committed effective doseequivalent from inhalation ofradionuclides and effective; doseequivalent from exposure to externalradiation.
The above considerations apply toevacuation of typical members' of thepopulation under normalcircumstances, and apply to effective
doses (i.e. the weighted sum of doses toall organs). As discussed in previoussections, it may be appropriate tofurther limit dose to the thyroid andskin, to adjust the value for specialgroups of the population at unusuallyhigh risk from evacuation, and toprovide for situations in which thegeneral population may be' at higherthan normal risk from evacuation.These are addressed, in turn, below.
In the case of exposure of thethyroid to radioiodine, action basedsolely on effective dose would not occuruntil a thyroid dose about 33 timeshigher than the corresponding effectivedose to the entire body. As noted inSection B.4.1.1, because the weightingfactor for thyroid used to calculateeffective dose does not reflect the highratio of curable to fatal thyroid cancers,protective action to limit dose to thethyroid is recommended at a thyroiddose 5 times the numerical value of thePAG.
Similarly, since effective dose doesnot include dose to the skin, and forother reasons discussed in SectionB.4.1.2, protective action to limit doseto skin is recommended at a skin dose50 times the numerical value of thePAG. As in the case of the thyroid,this includes consideration of the riskof both curable and noncurable cancers.
Special risk groups include fetuses,and persons who are not readilymobile. As noted in Sections B.4.1.3and B3, we assume that the risk ofradiation-induced cancer is about 5 to10 times higher for fetuses than foradults and that the risk of mental
C;
C) C-19

retardation in fetuses exposed duringthe 8th to 15th weeks of gestation isabout 10 times higher than the risk offatal cancer in equivalently exposedadults. However, due to the difficultyof rapidly evacuating only pregnantwomen in a population, aide theassumed higher-than-averagf ! riskassociated with their evacuation, it isnot considered appropriate to establishseparate PAGs for pregnant oinen.We note that the PAG is closensufficiently low to satisfy Federalguidance for limiting exposure' of thefetus in pregnant workers.
Higher PAGs for situationsinvolving higher risks from evacuationwere discussed in Section C.2.2.1 Undernormal,. low-risk, environmentalconditions, PAGs for evacuation ofgroups who present higher 'thanaverage risks from evacuation (e.g.,persons who are not readily mobile) arerecommended at projected dose's uip to5 rem. Evacuation of the Jenieralpopulation under high-riskenvironmental conditions ig alsorecommended at projected doses up to5 rem. If evacuation of hijh riskgroups under hazardous environinentalconditions is being "considered,projected doses up to 10 rem may,therefore, be justified. l
Short-term sheltering is recognizedas a low-cost, low-risk, protective actionprimarily suited for protection fromexposure to an airborne Plume.Sheltering will usually be clearlyjustified'to avoid projected doses above0.5 rem, on the basis of avoidance ofhealth risks. However, data are notavailable to establish a lower lI vel at
which sheltering is no longer justifiedbecause of its cost or the riskassociated with its implementation.Sheltering will usually have otherbenefits related to emergencycommunication with members of thepublic. It is expected that protectiveaction planners and decisionauthorities will take into account theadded benefits of sheltering (e.g.,communication and establishedplanning areas) for decisions onsheltering at levels below 0.5 rem.
Bathing and changing of clothingare effective for reducing beta dose tothe skin of persons exposed to anairborne plume of radioactivematerials. Since these are alsolow-cost, low-risk actions, no PAG isrecommended for initiating theirimplementation. It is expected thatany persons exposed in areas whereevacuation is justified based onprojected dose from inhalation will beroutinely advised by emergencyresponse officials to take these actionswithin 12 hours after exposure.
0.
0'.
The use of stable iodine to protectagainst uptake of inhaled radioiodineby the thyroid is recognized as aneffective alternative toevacuation forsituations involving radioiodinereleases where evacuation cannot beimplemented. If procedures areincluded in the applicable emergencyresponse plan, use of stable iodineshould be considered for any suchsituation in which evacuation orsheltering will not be effective inpreventing thyroid doses of 25 rem (seealso C.2.3).
C-20 to '

(N
C.4 Comparison to Previous PAGs
This section compares tie level ofprotection provided by the previouslypublished PAGs for evacuation (onerem- external gamma dose from theplume and 5 rem committed dose to thethyroid from inhalation, under normalevacuation circumstances) with thisPAG. The effective dose addressed bythis PAG, as well as skin, thyroid, andexternal gamma doses from jthe plumeduring the early phase fromr; the threemajor exposure pathways for an
airborne release were calculated forradionuclide mixes postulated for threenuclear power plant accidentsequences. The doses were thennormalized for each accident so thatthey represent a location in theenvironment where the controlling dosewould be equal to the current PAG.These results are shown in Table C-9.
Based on the results shown in TableC-9, the following condlusions are
for Various Reactor Accident Scenarios'Table C-9. Comparison of rrojected Doses
Accident Effective dose 1 Skin dosed Thyroid dose' Externalcategory equivalent' I (rem) (rem) dose'
(rem) (rem)
SST-1 0.7 6 5 0.02
SST-2 1 5 5 0.4
SST-3 0.4 i 6 5 0.1
'Doses are normalized to the limiting PAG.
bSee Table E-1 for a description ofithise accident scenarios.
'The dose is the sum of doses from 4-day exposure to external gamma radiation from depositedmaterials, external exposure to th6 plume, and the committed effective dose equivalent frominhalation of the plume.
'The dose equivalent from external beta radiation from the plume and from 12 hours exposure tomaterials deposited on skin and clothing.
'Committed dose equivalent to the thyroid from inhalation.
'External gamma dose equivalent Lomr the plume.
u-Z1

apparent, for the accident sanalyzed:
?quences
1. The PAG for the thyroid -iscon'trolling- for all three accidentcategories. For the SST-2 category,effective dose is also coitrolling.Thus,application of the previous PAG(5 rem) for thyroid would provide thesame protection as the revised PAG forall three accident categories.
2. Skin doses will not be coLtrollingfor any of the accident sequ nces (ifbathing and change of clothing iscompleted within 12 hours df plumepassage, as assumed).
3. Gamma dose from direct exposureto the plume is small compared to theeffective dose from the three majorexposure pathways combined. I
In summary, for the accidentsequences analyzed, the old PAGsprovide the same level of prot ction asthe new PAGs. For releases' thatcontain a smaller fraction rad'oiodinesthan these accident scenarios lthe newPAGs are slightly more protective.
C.5 Dose Limits for WtorkersPerforming Emergency Services
Dose limits for workersl duringemergencies are based on Avoiding-acute health effects and limiting therisk of delayed health effects, in thecontext of the need to assure protectionof the population and of Valuableproperties. It is assumed that mostsuch workers are accustomned toaccepting an element of risk :as a
condition of their employment.Examples of occupations that may beaffected include law enforcement,firefighting, radiation protection, civildefense, traffic control, health services,environmental monitoring, animal care,and transportation services. Inaddition, selected workers at utility,industrial, and at farms-'and otheragribusinesses may be required toprotect others, or to protect valuableproperty during an emergency. Theabove are examples -- not designations-- of workers that may be exposed toradiation during emergencies.
Radiation exposure of workersduring an emergency should normallybe governed by the Federal RadiationProtection Guidance for OccupationalExposure (EP-87). This guidancespecifies an upper bound of five remcommitted effective dose equivalent peryear for most workers. (Pregnant Cwomen, who, under this guidanceshould not normally engage in worksituations that involve more thanapproximately 50 mrem/month, wouldnormally be evacuated as part of thegeneral population.) The guidance alsospecifies that doses to -workers shouldbe maintained as low as reasonablyachievable; that doses should bemonitored; and that workers should beinformed of the risks involved and ofbasic principles for radiationprotection.
3
)
* There are some emergencysituations, however, for which higherdoses may be justified. These includelifesaving operations and the protectionof valuable property. Internationalguidance (IC-77) recognizes two
C-22 K)

additional dose levels lork workersunder speciallyjustified circumstances:two times the annual limtd for anysingle event, and five timek the annuallimit in a lifetime. The dose limitsrecommended here adopt the formervalue (10 rem) for operations limited tothe protection of valuable property.The latter value (25 rem) may bepermitted for situations involvinglifesaving operations or activities thatare essential to preventing, substantialrisks to populations. In this context"substantial risks" meant collectivedoses that are significantly larger thanthose incurred through the protective.Activities engaged in by the iworkers.Workers should not operate under doselimits higher than five rem unless thefollowing conditions are saiisfied:
1. Lower doses through the rotation ofworkers or other commonli-used dosereduction methods are not possible,and
2. Instrumentation is available tomeasure their exposure.
In addition to the limitation oneffective dose equivalent) the doseequivalent received in any year by,workers under normal o ccuationalconditions is limited to 15 1rem to thelens of the eye and 50 rem to any otherorgan, tissue (including skin), orextremity of the body. (Extremity isdefined as the forearms an'd hands orthe lower legs and feet (EP-87).) Byanalogy to these dose limit. for organsand extremities, the limits for workersperforming the various categories ofemergency services are esta~blished atnumerical values that are 5 times the
limits for effective dose to the lens ofthe eye and 10 times the limits foreffective dose to any other organ, tissue(including skin), or extremity of thebody.
* Situations may occur in which adose in excess of 25 rem would berequired for lifesaving operations. It isnot possible to prejudge the risk thatone person should be allowed to take tosave the life of another. However,persons undertaking an emergencymission in which the dose would exceed*25 rem to the whole body should do soonly on a voluntary basis and with fullawareness of. the*. risks.. involved,including the numerical levels of doseat which acute effects of radiation willbe incurred and numerical estimates ofthe risk of delayed effects.
The risk of acute health effects isdiscussed in B.2. Table C-10 presentsestimated cancer mortality rates for adose of 25 rem, as a function of age atthe time of exposure. The risk ofcancer from moderately higher doseswill increase proportionately. Thesevalues were calculated. using riskestimates from BEIR-3 (NA-80) asdiscussed in Section B.4, and life tableanalyses that assume the period' ofcancer risk lasts for the worker'slifetime (BU-81). The risk wascalculated for the midpoint of each agerange. Roughly equivalent risks ofnonfatal cancer and serious geneticeffects (if gonadal tissue is exposed)will also be incurred.
The dose limits of 75 rem to thewhole body previously recommended byEPA and 100 rem that has been
0 C-23

recommended by NCRP (GLL57) forlifesaving action represents a very highlevel of risk of acute and delayedhealth effects. A dose of 100 rem isexpected to result in an approximately15 percent risk of temporary incap-acity from nonlethal acute effects andan indeterminate, but less than 5
percent, chance of death within 60days. This is in addition to a risk ofabout 1 in 30 of incurring fatal cancer.Such high risk levels can only beaccepted by a recipient who has beenmade aware of the risks involved.Therefore, no absolute dose limit forlifesaving activities is offered.
0:
Table C-10 Cancer Risk to EnDose
,ergency Workers Receiving 25 Rem Whole Body
Age of the Approximate risk Average years ofemergency of premature death life lost if
worker at time (deaths per 1,000 premature deathof exposure persons exposed) occurs
(years) (years)
20 to 30 9.1 24
30to40 7.2 19
40 to 50 I 5.3 15
50to60: 3.5 11
Ie'-\
References
BU-81 Bunger, B.M., J.R.and M.K Barrick. Life Table Metfor Evaluating Radiation RiskApplication Based on OcculExposures. Health Physics 40. (1!455.
Buildings and Vehicles for Plutonium.DOEIEH-0159, U.S. Department of Energy,Washington (1990).
Cookiiodology
: Anrational81):439-
EP-78a U.S. Environmental ProtectionAgency. Protective Action Evaluation Part I- The Effectiveness of Sheltering as aProtective Action Against Nuclear AccidentsInvolving Gaseous Releases. EPA520/1-78-OO1A, U.S. EnvironmentalProtection Agency, Washington (1978).DO-90 U.S. Department: of
Energy. Effectiveness of Sheltering in
C-24 i. ,
EP-78b U.S. Environmental ProtectioriAgency. Protective Action Evaluation PartII -Evacuation and Sheltering as ProtectiveActions Against Nuclear AccidentsInvolving Gaseous Releases. EPA520/1-78-001B, U.S. EnvironmentalProtection Agency, Washington t1978).
EP-87 U.S. Environmental ProtectionAgency. Radiation Protection Guidance toFederal Agencies for Occupational Exposure.Federal Register.~, 2822; January 27, 1987.
EP-87a U.S. Environmental ProtectionAgency. An Analysis of Evacuation Optionsfor Nuclear Accidents. EPA 52011-87-023,U.S. Environmental Protection Agency,Washington (1987).
. ED.82. Food. and Drug Administration.Potassium Iodide as a Thy id-BlockingAgent in a Radiation Emergency: FinalRecommendations On Use. Fedeal Reeister.47 28158 - 28159; June 29, 1982.
FE-85 F e d e r a l E m e r g e n c yManagement Agency. Federal Policy onDistribution of Potassium Iodide AroundNuclear Power Sites for use as F ThyroidalBlocking Agent. Federal Register.50, 30256;July 24, 1985. I
0~ I.
FR-64 Federal Radiation Council.Radiation Protection Guidance for FederalAgencies. FederalRegister , 12056-12057;August 22, 1964.
FR-65 Federal Radiation Council.Radiation Protection Guidance for FederalAgencies. Federal Register 30, 6953-6955;May 22, 1965.
GL-57 Glasstone, S. The Effects ofNuclear Weapons. U.S. Atomic EnergyCommission, Washington (1957).
GR-86 Grot, RA and A.K Persily.Measured Air Infiltration Rates in EightLarge Office Buildings. Special TechnicalPublication 904, American Society for Testingand Materials, Philadelphia (1986).
IC-77 International Commission onRadiological Protection. RadiologicalProtection, ICRP Publication 26, PergamonPress, Oxford (1977).
NA-80 National Academy of Sciences.The Effects on Populations of Exposure toLow Levels of Ionizing Radiation: 1980.Reports of the Committee on the BiologicalEffects of Ionizing Radiations. NationalAcademy Press, Washington (1980).
C-25

C
APPENDIX D.
Protective Action Recommendations:1 Radioactive Contamination ofood and Animal Feeds*
Background forAccidents
F
C.
.
*This background documentthe Food and Drug Adminisl
concerning food and animal feeds was published byration in 1982.
C."

APPENDIX E
Protective Action Guides for the Intermediate Phase
(Relocation)
Background Information
....)

Contents
Page
E.1 Introduction ............ .............................. E-1
E.1.1 Response Duration ......... ................... .. E-1E.1.2 Source Term .E-2E.1.3 Exposure Pathways .E-3E.1.4 Response Scenario .E-4
E.2 Considerations for Establishing PAGs for the Intermediate Phase ... E-6
E.2.1 Principles .E-8E.2.1.1 Cost/Risk Considerations .E-8E.2.1.2 Protection of Special Groups .E-11
E.2.2 Federal Radiation Protection Guides .E-12
E.3 Dose from Reactor Incidents .E-12
E.4 Alternatives to Relocation .E-13
C E.5 Risk Comparisons .................................. . E-14
E.6 Relocation PAG Recommendations .E-15
E.7 Criteria for Reentry into the Restricted Zone ..... ............ E-19
References .. E-20
Figures
E-1 Response Areas .E-5
E-2 Potential Time Frame of Response to a Nuclear Incident .E-7
E-3 Cost of Avoiding Statistical Fatalities and Exposure RatesCorresponding to Various Total First Year Doses. E-10
* E-4 Average Lifetime Risk of Death from Whole Body Radiation DoseCompared to the Average Risk of Accidental Death from Lifetime(47 years) Occupation in Various Industries ....... ............ E-16
iii

Tabhlep
Page CE-1 Brief Descriptions Characterizing Various Nuclear Power Plant
Accident Types (SN-82) ................... E-2
E-2 Release Quantities for Postulated Nuclear Reactor Accidents . E-3
E-3 Annual Doses Corresponding to 5 Rem in 50 Years . E-13
E-4 Measure of Lifetime Risk of Mortality from a Variety of Causes ... E-17
E-5 Summary of Considerations for Selecting PAGs for Relocation . E-18
E-6 Estimated Maximum Doses to Nonrelocated Persons from Areas
Where the Projected Dose is 2 REM .E-20
i
*h r h rjce oei E ........ . . . . . . . .. E-2
.I

Appendix E
Protective Action Guides for the Intermediate Phasei (Relocation)Background Information
E.1 Introduction
This Appendix providesbackground information for the choiceof Protective Action Guides ](PAGs) forrelocation and other proteciive actionsto reduce exposure to depositedradioactive materials during theintermediate phase of the response to anuclear incident. The resulting PAGsand associated implementing guidanceare provided ini Chapters' 4 and 7,respectively.
This analysis is based on theassumption that an airborne plume ofradioactive material has already passedover an area and left a deposit ofradioactive material behind, or thatsuch material exists from tome othersource, and that the public has alreadybeen either sheltered or evacuated, asnecessary, on the basis of PAGs for theearly phase of a nuclear incident, asdiscussed in Chapters 2 anAd 5. PAGsfor subsequent relocation of the publicand other protective actions, as well asdose limits for persons reentering thearea from which the public is relocated,are addressed in this Appendix.
We first set forth the assumptionsused to derive information pertinent tochoosing the dose level! at whichrelocation of the public is appropriate.This is followed by an examiination of
information relevant to this decision,and selection of the PAG for relocation.The Appendix concludes with a briefdiscussion of the basis for dose limitsfor persons temporarily reenteringareas from which the public has beenrelocated.
E.1.1 Response Duration
In order to decide whether toinitiate relocation of the public fromspecific areas it is necessary to predictthe dose that would be avoided. Onefactor in this prediction is the durationof the exposure to be avoided.Relocation can begin as soon aspatterns of exposure from depositedradioactivity permit restricted areas tobe identified. For the purpose of thisanalysis, relocation of persons whohave not already been evacuated fromthe restricted zone is assumed to takeplace on the fourth day after theincident. Return of evacuated personsto their residences outside therestricted zone and transition torelocation status of persons alreadyevacuated is assumed to occur over aperiod of a week or more.
The period of exposure avoided byrelocation ends when the relocatedperson either returns to his property oris permanently resettled in a new
0 E-1

location. At the time of relocationdecisions, it will usually not be possibleto predict when either of these actionswill occur. Therefore, for convenienceof dbse projection, it is assumed thatthe period of exposure avoided is oneyear and that any extension beyondthis period will-be determined on thebasis of recovery criteria. Thisassumption corresponds to emergencyresponse planning guidance by ICRP(IC-84) and IAEA (IA-85).
following a nuclear incident. Nuclearincidents can be postulated with a widerange of release characteristics. Thecharacteristics of the source termsassumed for the development of thesePAGs are those postulated for releasesfrom various types of fuel-meltaccidents at nuclear power plants(SN-82). Table E-1 provides briefdescriptions of these accident types.Radionuclide releases have beenestimated for the three most severeaccident types (SST-1, SST-2, SST-3)based on postulated core inventories
.)
E.1.2 Source Term and release fractions (Table E.other types (SST-4 and SST-5
The "source term" for this analysis generally not produce offsite do,is comprised of the quantities and exposure to deposited ztypes of particulate radioactive sufficient to warrant considermaterial found in the envirdonment relocation.
Table E-1 Brief Descriptions Characterizing Various Nuclear Power PlantAccident Types (SN-82)
-2). The5) wouldses frommaterialation of
Type . Description
SST-1 Severe core damage. Essentially involves loss of all installed safetyfeatures. Severe directjbreach of containment.
SST-2 Severe core damage. Containment fails to isolate. Fission product releasemitigating systems (e.g., sprays, suppression pool, fan coolers) operate toreduce release.
SST-3 Severe core damage. Containment fails by base-mat melt-through. Allother release mitigation systems function as designed.
SST-4 Modest core damage. Containment systems operate in a degraded mode.
SST-5 Limited core damage. No failures of engineered safety features beyondthose postulated by thee various design basis accidents. Containment isassumed to function for' even the most severe accidents in this group.
I
E-2

Release Quantities for Postulated Nuclear Reactor Accidents{)'-
Table E-2
Principalradionuclides Estimated quantity released'contributing (Curies)to dose from Half-life
deposited (days)! SST-1 . SST-2 SST-3materials|
Zr-95 6.52E+1 1.4E+6 4.5E+4 1.5E+2Nb-95 3.50E+!1 1.3E+6 4.2E+4 1.4E+2
Ru-103 3.95E+!1 6.OE+6 2.4E+5 2.4E+2Ru-106 3.66E+2 1.5E+6 5.8E+4 5.8E+I1Te-132 3.25. 8.3E+7 3.9E+6 2.6E+3
I-131 8.05 3.9E+7 2.6E+5 1.7E+4CS-134 7.50E+2 8.7E+6 1.2E+5 1.3E+2CS-137 1.iOE 4 4.4E+6 5.9E+4 6.5E+1Ba-140 1.28E+1 1.2E+7 1.7E+5 1.7E+2La-140 1.67 1.5E+6 5.1E+4 1.7E+2
'Based on the product of reactor inventories of radionuclides and estimated fractions released forthree accident categories (SN-82).
t ., ;
For other types of source terms,additional analysis may be necessary toassure adequate protection. Forexample, if the release includes a largeproportion of long-lived radionuclides,doses will continue to be delivered overa long period of time, gnd, if noremedial actions are takei, the dosedelivered in the first |year mayrepresent only a small portion of thetotal dose delivered over a lifetime. Onthe other hand, if the relehse consistsprimarily of short-lived radionuclides,almost the entire :dose may bedelivered within the first year.
From the data in Table E-2, it isapparent that, for the groups ofaccidents listed, both long and short
lived radionuclides would be released.Consequently, doses due to depositedmaterials from such accidents would berelatively high during the first yearfollowed by long term exposures atlower rates.
E.1.3 Exposure Pathways
The principal exposure pathway tomembers of the public occupying landcontaminated by deposits of radioactivematerials from reactor incidents isexpected to be exposure of the wholebody to external gamma radiation.Although it is normally expected to beof only minor importance, theinhalation pathway would contribute
E-3

additional doses to internal organs.The health risks from other pathways,such as beta dose to the skin and directingestion of dirt, are also expected tobe minor in -comparison to the irisksdue to external gamma radiation(AR-89). Skin and inhalation! dosewould, however, be important exposurepathways for source terms withsignificant fractions of pure betaemitters, and inhalation dose would beimportant for source terms withsignificant fractions of alpha emitters.
Since relocation, in most cases,would not be an appropriate action toprevent radiation exposure fromingestion of food and water, :theseexposure pathways have not beenincluded in this analysis. They areaddressed in Chapters 3 and 6. Insome instances, however, ivherewithdrawal of food and/or water fromuse would, in itself, create a healthrisk, relocation may be an appropriatealternative protective action. In thiscase, the committed effective| doseequivalent from ingestion should beadded to the projected dose fromdeposited radionuclides via otherpathways, for decisions on relocation.
E.1.4 Response Scenario
This section defines the reszponsezones, population groups, and theactivities assumed for implementationof protective actions during theintermediate phase.
After passage of the radioactiveplume, the results of environm;entalmonitoring will become. available for
use in making decisions to protect thepublic. Sheltering, evacuation, andother actions taken to protect thepublic from the plume will havealready been implemented. The tasksimmediately ahead will be to (1) definethe. extent and characteristics ofdeposited radioactive material andidentify a restricted zone in accordancewith the PAG. for relocation, (2)relocate persons from and controlaccess to the restricted zone, (3) allowpersons to return to areas outside therestricted zone, (4) control the spreadof and exposure to surfacecontamination, and (5) apply simpledecontamination and other low-cost,low-risk techniques to reduce the doseto persons who are not relocated.
Because of the various source termcharacteristics and the differentprotective actions involved (evacuation,sheltering, relocation, decontamination,and other actions to reduce doses to "aslow as reasonably achievable" levels),the response areas for differentprotective actions may be complex andmay vary in size with respect to eachother. Figure E-1 shows a genericexample of some of the principal areasinvolved. The area covered by theplume is assumed to be represented byarea 1. In reality, variations inmeteorological conditions would almostcertainly produce a more complicatedshape.
0W
Based on plant conditions or otherconsiderations prior to or after therelease, members of the public areassumed to have already beenevacuated from area 2 and sheltered inarea 3. Persons who were evacuated or
(IE-4

C I C
PLUME TRAVEL _DIRECTION
~~~~~~~.... .......... . .... ... .- -- ------ - ...... ... ._. ............... ....... .........
An'
ARBITRARY SCALE
LEDGENDr-iI ILearna
1. PLUME DEPOSITION AREA.
2. AREA FROM WHICH POPULATION IS EVACUATED.
3. AREA IN WHICH POPULATION IS SHELTERED.
4. AREA FROM WHICH POPULATION IS RELOCATED (RESTRICTED ZONE).
FIGURE E-1. RESPONSE AREAS.

sheltered as a precautionary action forprotection from the plume but whosehomes are outside the plume depositionarea (area 1) are assumed to return totheir homes or discontinue shelteringwhen environmental monitoringverifies the outer boundary of area 1.
Area 4 is the restricted zone and isdefined as the area where projecteddoses are equal to or greater than therelocation PAG. The portion of area 1outside of area 4 is designated! as astudy zone and is assumed to beoccupied by the public. However,contamination levels may exist' herethat would be of concern for continuedmonitoring and decontamination tomaintain radiation doses "as low asreasonably achievable" (ALARA).
The relative positions of theboundaries shown in Figure E-1 aredependent on areas evacuated andsheltered. For example, area 41couldfall entirely inside area 2 (thei areaevacuated) so that relocation of personsfrom additional areas would not berequired. In this case, the relocationPAG would be used only to .determineareas to which evacuees could return.
Figure E-2 provides,| forperspective, a schematic representationof the response activities expected to bein progress in association I withimplementation of the PAGs during theintermediate phase of the response to anuclear incident.
E.2 Considerations for EstablishingPAGs for the Intermediate Phase
The major considerations inselecting values for these PAGs forrelocation and other actions during theintermediate phase are the fourprinciples that forn the basis forselecting all PAGs. Those arediscussed in Section E.2.1. Otherconsiderations (Federal radiationprotection guidance and riskscommonly confronting the public) arediscussed in Sections E.2.2 and E.5.
In addition, a planning groupconsisting of State, Federal, andindustry officials providedrecommendations in 1982 which EPAconsidered in the development of theformat, nature, and applicability ofPAGs for relocation. Abbreviatedversions of these recommendations areas follows:
a. The PAGs should apply tocommercial, light-water power reactors.
b. The PAGs should be basedprimarily on health effects.
c. Consideration should be given toestablishing a range of PAG values.
d. The PAGs should be established ashigh as justifiable because at the timeof the response, it would be possible tolower them, if justified, but it probablywould not be possible to increase them.
e. Only two zones (restricted andunrestricted) should be established tosimplify implementation of the PAGs.
...
q .
E-6it

I 0; Cl.:.l,,,'I- -
ImI I Iii,,1! I I Ii 11111
CONDUCT AERIAL AND GROUND SURVEYS. DRAW ISODOSE RATE LINES.
IDENTIFY HIGH DOSE RATE AREAS. CHARACTERIZE CONTAMINATION.
Im RELOCATE POPULATION FROM HIGH DOSE RATE AREAS.
........ . , .. .......
u
0
tUM atI. R
U3
PERIOD OF
RELEASE, w
DISPERSION, -f
DEPOSITION, °0
SHELTERING, o
2EVACUATIOH, ;
0AND ACCESS 'L
CONTROL
(NO TIME SCALE)
ALLOW IMMEDIATE RETURN OF EVACUEES TO NONCONTAMINATED AREAS.
ESTABUSH RESTRICTED ZONE BOUNDARY AND CONTROLS.RELOCATE REMAINING POPULATION FROM WITHIN RESTRICTED ZONE.GRADUALLY RETURN EVACUEES UP TO RESTRICTED ZONE BOUNDARY.
CONDUCT D-CON AND SHIELDING. EVALUATIONS AND ESTABLISH PROCEDURESFOR REDUCIHO EXPOSURE OF PERSONS WHO ARE NOT RELOCATED.
Emmmim PROECT DOETAILED ENVIRONMENTAL MONITORING.PROJCT DSE BASED ON DATA.
EmmmDECONTAMINATE ESSENTIAL FACILITIES AND THEIR ACCESS ROUTES.RETRIEVE VALUABLE AND ESSENTIAL RECORDS AND POSSESSIONS.
REESTABIUSH OPERATION Olt VITAL SERVICES.
BEGIN RECOVERY ACTIVITIES.
__vCONTINUE RECOVERY.
MONITOR AND APPLYI ALARA IN OCCUPIED
CONTAMINATED AREAS.
L I I I 1111 1 I I 1111U I I ILI ul 1 I 1111
I
-
0.1 1.I0 10 ITIME AFTER DEPOSITION (DAYS)
_ - |
00 ; ,000
FIGURE E-2 POTENTIAL TIME FRAME OF RESPONSE TO A NUCLEAR INCIDENT.

f. The PAGs should not include pastexposures.
g. Separate PAGs should be used foringestion pathways.
h. PAGs should apply only toexposure during the first year after anincident.
Although these PAGs apply to anynuclear incident, primary considerationwas given to the case of commercialU.S. reactors. In general, we havefound it possible to accommodate mostof the above recommendations.
E.2.1 Principles
In selecting values for these PAGs,EPA has been guided by the principlesthat were set forth in Chapter 1. Theyare repeated here for convenience:
1. Acute effects on health (those thatwould be observable within a shortperiod of time and which have a dosethreshold below which they are notlikely to occur) should be avoided.
2. The-'risk of delayed effects onhealth (primarily cancer and geneticeffects, for which linear nonthresholdrelationships to dose are assumed)should not exceed upper bounds thatare judged to be adequately protectiveof public health, under emergencyconditions, and are reasonablyachievable.
3. PAGs should not be higher thanjustified on the basis of optimization ofcost and the collective risk of effects on
health. That is, any reduction of riskto public health achievable atacceptable cost should be carried out.
4. Regardless of the above principles,the risk to health from a protectiveaction should not itself exceed the riskto health from the dose that would beavoided.
Appendix B analyzed the risks ofhealth effects as a function of dose(Principles 1 and 2). Considerationsfor selection of PAGs for theintermediate phase of a nuclearincident differ from those for selectionof PAGs for the early phase primarilywith regard to implementation factors(i.e., Principles 3 and 4). Specifically,they differ with regard to cost ofavoiding dose, the practicability ofleaving infirm persons and prisoners inthe restricted zone, and avoiding doseto fetuses. Although sheltering is notgenerally a suitable alternative torelocation, other alternatives (e.g.,decontamination and shielding) aresuitable. These considerations arereviewed in the sections that follow.
E.2.1.1 Cost/Risk Considerations
The Environmental ProtectionAgency has issued guidelines forinternal use in performing regulatoryimpact analyses (EP-83). Theseinclude consideration of the appropriaterange of costs for avoiding a statisticaldeath. The values are inferred fromthe additional compensation associatedwith employment carrying a higherthan normal risk of mortality and areexpressed as a range of $0.4 to $7
C)
E-8 'E8y /

million per statistical death avoided.The following discussion comparesthese values to the cost of avoidingradiation-induced fatal cancers throughrelocation.
The basis for estimating 'thesocietal costs of relocation are analyzedin a report by Bunger (BU-89).Estimated incremental societal costsper day per person relocated are shownbelow. (Moving and loss of inventorycosts are averaged over one year.)
Moving $1.70Loss of use of residence 2.96Maintain and secure vacatedproperty 0.74Extra living costs 1.28Lost business and inventories 14.10Extra travel costs 4.48Idle government facilities 1.29
Total $26.55
Using the values cited above, anda value for R of 3x10⁴ deaths/rem (SeeAppendix B), one obtains a range ofdoses of about 0.01 to 0.2 rem/day.Thus, over a period of one year thetotal dose that should be avoided tojustify the cost of relocation would beabout 5 to 80 rem.
These doses are based on exposureaccumulated over a period of one year.However, exposure rates decrease withtime due to radioactive decay andweathering. Thus, for any givencumulative dose in the first year, thedaily exposure rate continuallydecreases, so that a relocated personwill avoid dose more rapidly in the firstpart of the year than later. Figure E-3shows the effect of changing exposurerate on the relationship between thecost of avoiding a statistical death andthe time after an SST-2 accident (SeeTable E-1) for several assumedcumulative annual doses. The curvesrepresent the cost per day divided bythe risk of fatality avoided byrelocation per day, at time t, for theannual dose under consideration,where t is the number of days after theaccident. The right ordinate shows thegamma exposure rate (mR/h) as afunction of time for the postulatedradionuclide mix at one meter height.
The convex downward curvatureresults from the rapid decay ofshort-lived radionuclides during thefirst few weeks following the accident.Since the cost per day for relocation isassumed to be constant and the doseavoided per day decreases, the costeffectiveness of relocation decreaseswith time. For this reason it is cost
0The quantity of interest is the dose
at which the value of the risk avoidedis equal to the cost of relocation. Sincethe above costs are expressed indollars/person-day, it is convenient tocalculate the dose that must be avoidedper-person day. The equation for thisis:
HE C
where:HE = doseC = cost of relocationV = value of avoiding a
statistical deathR = statistical risk of death from
radiation dose
deCE-9

3
2
7to
-6S
z0P
0-J
sc
00C]c4
4
J
If
-J14
I-U,
I-
. I.xu,0U.
876
5
4
3
2
61 0
98
76
5
4
3
L~~r m-s 1 1 0 1 1
//1 2r
2 re MW
WWWWOO=OOOWIW'
-40.4
0° £0.3
0.5
0.60.70.80.9
1.0
wcn
0c
-Jn
z
0U
zEC0C-Ln
.,
C.IEa
3
-14
5
6
7891 0
_ 2 02
30
1 0-
i * -
0 5 10 15 20TIME AFTER ACCIDENT (days)
25 30
FIGURE E-3. COST OF AVOIDING STATISTICAL FATALITIES ANDEXPOSURE RATES CORRESPONDING TO VARIOUSTOTAL FIRST YEAR DOSES (ASSUMES AN SST-2ACCIDENT AND A $27 PER PERSON-DAY COST OFRELOCATION).
E-10
U,

effective to quickly recover areas wherethe population has been relocated atprojected doses only marginally greaterthan the PAG.
Only trends and generalrelationships *can be inferred fromFigure E-3 because it applies to aspecific mix of radionuclides. However,for this radionuclide mix, cost analysissupports relocation at doses as low asone rem for the first week and two remfor up to 25 days after an accident.
E.2.1.2 Protection of Special Groups
Contrary to the situation forevacuation during the early phase of anincident, it is generally not practical toleave a few persons behind when mostmembers of the general populationhave been relocated from a specifiedarea for extended periods of time.Further, no. data are available ondiffering risks of relocation for differentpopulation groups. In the absence ofsuch data, we have assumed that theserisks will be similar to those fromevacuation. Those risks were taken asequivalent to the health risk fromdoses of 30 mrem for members of thegeneral population and of 150 mrem forpersons at high risk from evacuation(see Appendix C). Therefore, to satisfyPrinciple 4 for populationr groups athigh risk, the PAG for relocationshould not be lower than 150 millirem.Given the arbitrary nature of thisderivation, it is fortunate that thisvalue is much lower than the PAGselected, and is therefore not animportant factor in its choice.
Fetuses are a special group atgreater risk of health effects fromradiation dose than is the generalpopulation, but not at significantlygreater risk from relocation itself. Therisk of mental retardation from fetalexposure (see Appendix B) issignificant. It is affected by the stageof pregnancy relative to the assumedone-year exposure, because the 8th to15th week critical period during whichthe risk is greatest, must be consideredin relation to the rapidly changing doserate. Taking these factors intoaccount, it can be postulated that therisk of mental retardation due toexposure of the fetus during theintermediate phase will range from oneto five times the cancer risk of anaverage member of the public,depending upon when conceptionoccurs relative to the time of theincident. The elevated risk ofradiation-induced cancer from exposureof fetuses is less significant, asdiscussed in Appendix B.
It will usually be practicable toreduce these risks by establishing ahigh priority for efforts other thanrelocation to reduce the dose in caseswhere pregnant women reside near theboundary of the restricted zone.However, women who are less thanseven months pregnant may wish torelocate for the balance of theirpregnancy if the projected dose duringpregnancy cannot be reduced below 0.5rem.
E-11

E.2.2 Federal Radiation ProtectionGuides
The choice of a PAG at whichrelocation should be implemented doesnot mean that persons outside theboundary of the restricted zone shouldnot be the.subject of other protectiveactions to reduce dose. Such actionsare justified on the basis of existingFederal radiation protection guidance(FR-65) for protecting the public,including implementation of theprinciple of maintaining doses "as lowas reasonably achievable" (ALARA).
The intended actions to protect thepublic from radiation doses on thebasis of Radiation Protection Guides(RPGs) are those related to sourcecontrol. Although it is reasonable formembers of the public to receive higherexposure rates prior to the source termbeing brought under control, theestablishment of acceptable values forrelocation PAGs must includeconsideration of the total dose over theaverage remaining lifetime of exposedindividuals (usually taken as 50 years).
The nationally and internationallyrecommended upper bound for dose ina single year from man-made sources,excluding medical radiation, is 500mrem per year to the whole body ofindividuals in the general population(IC-77, FR-65). .These .recommend-ations were not developed for nuclearincidents. They are also notappropriate for chronic exposure. TheICRP recommends an upper bound of100 mrem per year, from all sourcescombined, for chronic exposure (IC-77).The corresponding 50-year dose at 100
mrem/yr is 5 rem. We have chosen tolimit: a) the projected first year dose toindividuals from an incident to theRelocation PAG, b) the projected secondyear dose to 500 mrem, and c) the doseprojected over a fifty-year period to 5rem. Due to the extended duration ofexposures and the short half-life ofimportant radioiodines, no speciallimits for thyroid dose are needed.
E.3. Dose from Reactor Incidents
Doses from an environmentalsource will be reduced through thenatural processes of weathering andradioactive decay, and from theshielding associated with part timeoccupancy in homes and other struct-ures. Results of dose calculationsbased on the radiological character-istics of releases from three categoriesof postulated, fuel-melt, reactoraccidents (SST-1, SST-2, and SST-3)(SN-82) and a weathering model fromWASH-1400 (NR-75) are shown inTable E-3. This table shows therelationship between annual doses forthe case where the sum, over fiftyyears, of the effective dose equivalent-from gamma radiation and thecommitted effective dose equivalentfrom inhalation of resuspendedmaterials is 5 rem. Radioactive decayand weathering reduces the secondyear dose from reactor incidents to .20to 40 percent of the first year dose,depending on the radionuclide mix inthe release.
Based on studies reported inWASH-1400 (NR-75), the mostconservative dose reduction factor for
C)
E-12

IC>.Table E-3 Annual Doses Corresponding to 5 Rem in 50 Years'
Dose According to Accident Categoryb (rem)Year.
SST-1 SST-2 SST-3
1 1.25 1.60 1.912 0.52 0.44 0.383 0.33 0.28 0.244 0.24 0.20 0.175 0.18 0.16 0.136 0.14 0.12 0.117 0.12 0.11 0.0908 0.10 0.085 0.0709 0.085 0.075 0.065
10 0.080 0.070 0.06011 0.070 0.060 0.05012 0.060 0.055 0.05015 0.055 0.045 0.04020 0.045 0.040 0.03025 0.040 0.035 0.02530 0.030 0.030 0.02540 0.025 0.020 0.02050 0.020 0.015 0.010
'Whole body dose equivalent from gamma radiation plus committed effective dose equivalent frominhalation assuming a resuspension factor of 10' m'. Weathering according to the WASH-1400model (NR-75) and radioactive decay are assumed.
bRadionuclide abundance ratios are based on reactor inventories from WASH-1400 (NR-75).Release quantities for accident categories SST-1, SST-2 and SST-3 are shown in Table E.2. Initialconcentrations are assumed to have decayed for 4 days after reactor shutdown.
structures (frame structures) is about0.4 (dose inside divided by doseoutside) and the average fraction oftime spent in a home is about 0.7.Combining these factors yields a netdose reduction factor of about 0.6. Inmost cases, therefore, structuralshielding would be expected to reducethe dose to persons who are not
relocated to 60 percent (or less) of thevalues shown in Table E-3 before theapplication of decontamination.
E.4. Alternatives to Relocation
Persons Who are not relocated, inaddition to dose reduction provided by
E-13

partial occupancy in homes and otherstructures, can reduce their dose by theapplication of various techniques. Dosereduction efforts can range from thesimple processes of scrubbing and/orflushing surfaces, soaking or plowing ofsoil, removal and disposal of smallspots of soil found to be highlycontaminated (e.g., from settlement ofwater), and spending more time thanusual in lower exposure rate 'areas(e.g., indoors), to the difficult and timeconsuming processes of removal,disposal, and replacement ofcontaminated surfaces. It isanticipated that simple processeswould be most appropriate to reduceexposure rates for persons living incontaminated areas outside therestricted zone. Many of these can becarried out by the residents withsupport from officials for monitoring,guidance on appropriate actions, anddisposal. The more difficult processeswill usually be appropriate for recoveryof areas from which the population isrelocated.
Decontamination experimentsinvolving radioactive fallout fromnuclear weapons tests have shownreduction factors for simpledecontamination methods in thevicinity of 0.1 (i.e., exposure ratereduced to 10 percent of originalvalues). However, recent experimentsat the Riso National Laboratory inDenmark (WA-82, WA-84), usingfirehoses to flush asphalt and concretesurfaces contaminated with radioactivematerial of the type that might bedeposited from reactor accidents, showdecontamination factors forradionuclides chemically similar to
cesium that are in the range of 0.5 to0.95, depending on the delay time afterdeposition before flushing is applied.The factor for ruthenium on asphaltwas about 0.7 and was independent ofthe delay of flushing. The results ofthese experiments indicate thatdecontamination of the importantreactor fission products from asphalt orconcrete surfaces may be much moredifficult than decontamination ofnuclear weapons fallout. Other simpledose reduction methods listed abovewould be effective to varying degrees.The average dose reduction factor forgamma radiation from combinations ofsimple decontamination methods isestimated to be at least 0.7.Combining this with the 40 percentreduction estimated above forstructural shielding indicates that thedoses listed in Table E-3 may be morethan twice as high as those whichwould actually be received by personswho are not relocated.' 0 .-E.5 Risk Comparisons
Many hazardous conditions andtheir associated risks are --routinelyfaced by the public. A lingeringradiation dose will add to those risks,as opposed to substituting one risk foranother, and, therefore, radiationprotection criteria cannot be justifiedon the basis of the existence of otherrisks. It is, however, useful to reviewthose risks to provide perspective. Thissection compares the risks associatedwith radiation doses to those associatedwith several other risks to which thepublic is commonly exposed.
, .E-14
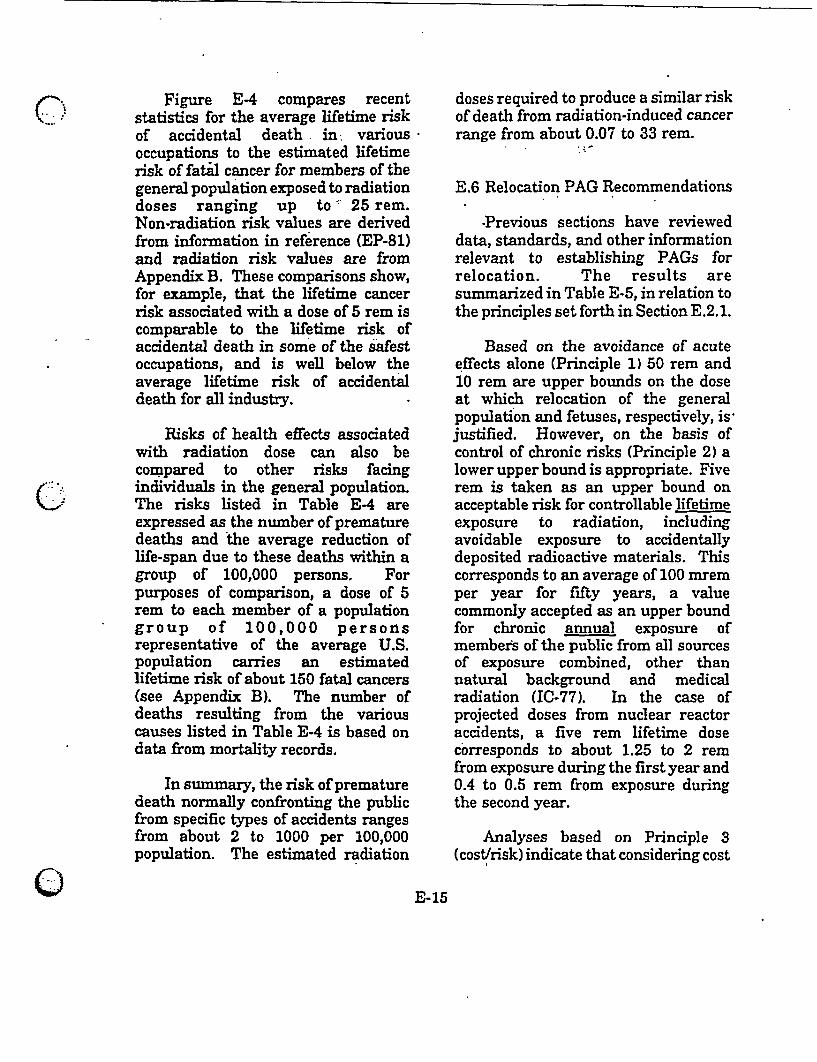
0(9
Figure E-4 compares recentstatistics for the average lifetime riskof accidental death in: variousoccupations to the estimated lifetimerisk of fatal cancer for members of thegeneral population exposed to radiationdoses ranging up to - 25 rem.Non-radiation risk values are derivedfrom information in reference (EP-81)and radiation risk values are fromAppendix B. These comparisons show,for example, that the lifetime cancerrisk associated with a dose of 5 rem iscomparable to the lifetime risk ofaccidental death in some of the safestoccupations, and is well below theaverage lifetime risk of accidentaldeath for all industry.
Risks of health effects associatedwith radiation dose can also becompared to other risks facingindividuals in the general population.The risks listed in Table E4 areexpressed as the number of prematuredeaths and the average reduction oflife-span due to these deaths within agroup of 100,000 persons. Forpurposes of comparison, a dose of 5rem to each member of a populationgroup of 100,000 personsrepresentative of the average U.S.population carries an estimatedlifetime risk of about 150 fatal cancers(see Appendix B). The number ofdeaths resulting from the variouscauses listed in Table E-4 is based ondata from mortality records.
In summary, the risk of prematuredeath normally confronting the publicfrom specific types of accidents rangesfrom about 2 to 1000 per 100,000population. The estimated radiation
doses required to produce a similar riskof death from radiation-induced cancerrange from about 0.07 to 33 rem.
E.6 Relocation PAG Recommendations
-Previous sections have revieweddata, standards, and other informationrelevant to establishing PAGs forrelocation. The results aresummarized in Table E-5, in relation tothe principles set forth in Section E.2.1.
Based on the avoidance of acuteeffects alone (Principle 1) 50 rem and10 rem are upper bounds on the doseat which relocation of the generalpopulation and fetuses, respectively, isjustified. However, on the basis ofcontrol of chronic risks (Principle 2) alower upper bound is appropriate. Fiverem is taken as an upper bound onacceptable risk for controllable lifetimeexposure to radiation, includingavoidable exposure to accidentallydeposited radioactive materials. Thiscorresponds to an average of 100 mremper year for fifty years, a valuecommonly accepted as an upper boundfor chronic annual exposure ofmembers of the public from all sourcesof exposure combined, other thannatural background and medicalradiation (IC-77). In the case ofprojected doses from nuclear reactoraccidents, a five rem lifetime dosecorresponds to about 1.25 to 2 remfrom exposure during the first year and0.4 to 0.5 rem from exposure duringthe second year.
Analyses based on Principle 3(cost/risk) indicate that considering cost
C..IE-15

1 0i2
CONSTRUCTION & MINING
AGRICULTURE'
-TRANSPORTATION & PUBLIC UTILITIES
AVERAGE FOR ALL UTILITIES'GOVERNMENT
25 rem
0 .A
I)
LU0
Lu
I-
IC
0.
U.0
teu2E
LU
FLUU-
C,
ocus
SERVICEMANUFACTURING
aRETAIL &WHOLESALTRADE
rem
1 a- 3
-1 rem
-0.5 rem
: I1 C)4
I0e .
2 4 6 8rem (
I . I I I I I l I
10 12 14 16 18 20 22 24 26effective dose equivalent)
FIGURE E-4. AVERAGE LIFETIME RISK OF DEATH FROM WHOLE BODY RADIATION DOSECOMPARED TO THE AVERAGE RISK OF ACCIDENTAL DEATH FROM LIFETIME(47 YEARS) OCCUPATION IN VARIOUS INDUSTRIES. (.,
E-16

0:@ Table E-4 Measure of. Lifetime Risk of Mortality from a Variety of Causes'(Cohort Size = 100,000)
C )
Aggregate years Reduction of Average yearsNature of Premature of life lost life expectancy of life lost toaccident deaths to cohort at birth (years) premature deaths
Falls 1,000 12,000 0.12 11
Fires 300 7,600 0.076 26
Drowning 190 8,700 0.087 45
Poisoning 69 2,500 0.025 37by drugs andmedicaments'
Cataclysmb 17 490 0.005 30
Bites and 8 220 0.002 27stings'
Electric 8 290 0.003 37currentin homesd
'All mortality effects shown are calculated as changes from the U.S. Life Tables for 1970 to lifetables with the cause of death under investigation removed. These effects also can be interpretedas changes in the opposite direction, from life tables with the cause of death removed to the 1970Life Table. Therefore, the premature deaths and years of life lost are those that would beexperienced in changing from an environment where the indicated cause of death is not present toone where it is present. All values are rounded to no more than two significant figures.
'Cataclysm is defined to include cloudburst, cyclone, earthquake, flood, hurricane, tidal waves,tornado, torrential rain, and volcanic eruption.
'Accidents by bite and sting of venomous animals and insects include bites by centipedes,venomous sea animals, snakes, and spiders; stings of bees, insects, scorpions, and wasps; and othervenomous bites and stings. Other accidents caused by animals include bites by any animal andnonvenomous insect; fallen on by horse or other animal; gored; kicked or stepped on by animal; antbites; and run over by horse or other animal. It excludes transport accidents involving riddenanimals; and tripping, falling over an animal. Rabies is also excluded.
'Accidents caused by electric current from home wiring and appliances include burn by electriccurrent, electric shock or electrocution from exposed wires, faulty appliances, high voltage cable,live rail, and open socket. It excludes burn by heat from electrical appliances and lighting.
Ar-%E-17

Table E-5 Summary of Considerations for Selecting PAGs for Relocation
Dose Consideration Principle(rem) -
50 Assumed threshold for acute health effects in adults. 1
10 Assumed threshold for acute health effects in the fetus. 1
6 Maximum projected dose in first year to meet 0.5 rem in the secondyear:. 2
5 Maximum acceptable annual dose for normal occupational exposureof adults. 2
5 Minimum dose that must be avoided by one year relocation basedon cost. 3
3 Minimum projected first-year dose corresponding to 5 remin 50 years. 2
3 Minimum projected first-year dose corresponding to 0.5 rem in thesecond year". 2
2 Maximum dose in first year corresponding to 5 rem in 50 years from areactor incident, based on radioactive decay and weathering only. 2
1.25 Minimum dose in first year corresponding to 5 rem in 50 years from areactor incident based on radioactive decay and weathering only. 2
0.5 Maximum acceptable single-year dose to the general population fromall sources from non-recurring, non-incident exposure. 2
0.5 Maximum acceptable dose to the fetus from occupational exposureof the mother. 2
0.1 Maximum acceptable annual dose to the general population from allsources due to routine (chronic), non-incident, exposure. 2
0.03 Dose that carries a risk assumed to be equal to or less than thatfrom relocation. 4
'Assumes the source term is from a reactor incident and that simple dose reduction methods areapplied during the first month after the incident to reduce the dose to persons not relocated fromcontaminated areas.
0-
nI..
E-18
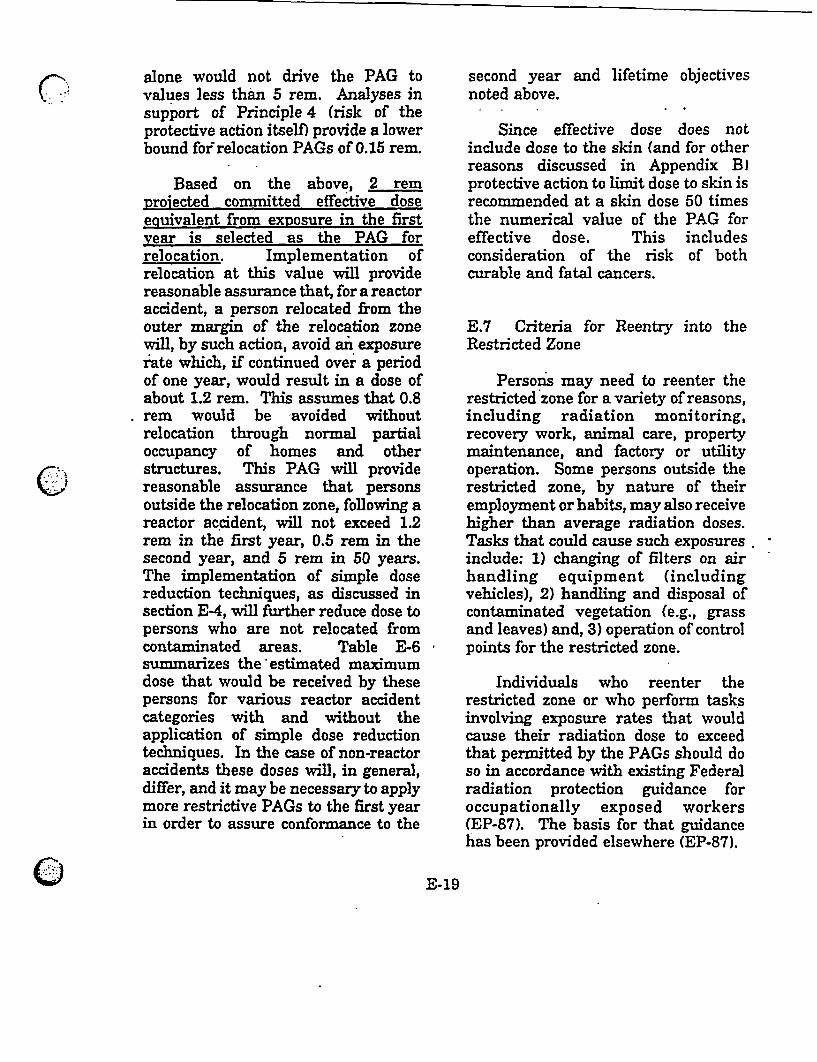
Cu
alone would not drive the PAG tovalues less than 5 rem. Analyses insupport of Principle 4 (risk of theprotective action itself) provide a lowerbound for relocation PAGs of 0.15 rem.
Based on the above, 2 remprojected committed effective doseequivalent from exposure in the firstyear is selected as the PAG forrelocation. Implementation ofrelocation at this value will providereasonable assurance that, for a reactoraccident, a person relocated from theouter margin of the relocation zonewill, by such action, avoid an exposurerate which, if continued over a periodof one year, would result in a dose ofabout 1.2 rem. This assumes that 0.8rem would be avoided withoutrelocation through normal partialoccupancy of homes and otherstructures. This PAG will providereasonable assurance that personsoutside the relocation zone, following areactor accident, will not exceed 1.2rem in the first year, 0.5 rem in thesecond year, and 5 rem in 50 years.The implementation of simple dosereduction techniques, as discussed insection E-4, will further reduce dose topersons who are not relocated fromcontaminated areas. Table E-6summarizes the estimated maximumdose that would be received by thesepersons for various reactor accidentcategories with and without theapplication of simple dose reductiontechniques. In the case of non-reactoraccidents these doses will, in general,differ, and it may be necessary to applymore restrictive PAGs to the first yearin order to assure conformance to the
second year and lifetime objectivesnoted above.
Since effective dose does notinclude dose to the skin (and for otherreasons discussed in Appendix B)protective action to limit dose to skin isrecommended at a skin dose 50 timesthe numerical value of the PAG foreffective dose. This includesconsideration of the risk of bothcurable and fatal cancers.
E.7 Criteria for Reentry into theRestricted Zone
Persons may need to reenter therestricted zone for a variety of reasons,including radiation monitoring,recovery work, animal care, propertymaintenance, and factory or utilityoperation. Some persons outside therestricted zone, by nature of theiremployment or habits, may also receivehigher than average radiation doses.Tasks that could cause such exposuresinclude: 1) changing of filters on airhandling equipment (includingvehicles), 2) handling and disposal ofcontaminated vegetation (e.g., grassand leaves) and, 3) operation of controlpoints for the restricted zone.
Individuals who reenter therestricted zone or who perform tasksinvolving exposure rates that wouldcause their radiation dose to exceedthat permitted by the PAGs should doso in accordance with existing Federalradiation protection guidance foroccupationally exposed workers(EP-87). The basis for that guidancehas been provided elsewhere (EP-87).
C0 E-19

Table E-6 Estimated Maidnum: Doses to Nonrelocated Persons From AreasWhere the Projected Dose is 2 REM' 0_
Dose (rem)
Accident No additional dose reduction Early simple dose reductionb
Category Year'l Year 2 50 years Year 1 Year 2 50 years
SST-1 1.2 0.5 5.0 0.9 0.35 3.5
SST-2 1.2 0.34 3.9 0.9 0.24 2.7
SST-3 1.2 0.20 3.3 0.9 0.14 2.3
'Based on relocation at a projected dose of 2 rem in the first year and 40 percent dose reduction tononrelocated persons from normal, partial occupancy in structures. No dose reduction is assumedfrom decontamination, shielding, or special limitations on time spent in high exposure rate areas.
'The projected dose is assumed to be reduced 30 percent by the application of simple dosereduction techniques during the first month. If these techniques are completed later in the firstyear, the first year dose will be greater.
*0. .References
AR-89 Aaberg, Rosanne. Evaluation of Skinand Ingestion Exposure Pathways. EPA520/1-89-016, U.S. Environmental ProtectionAgency, Washington (1989).
BU-89 Bunger, Byron M. Econoniic Criteriafor Relocation. EPA 52011-89-015, U.S.Environmental Protection Agency,Washington (1989)
EP-81 U.S. Environmental ProtectionAgency. Background Report. Proposed FederalRadiation Protection Guidance forOccupational Exposure. EPA 520/4-81-003,U.S. Environmental Protection Agency,Washington (1981).
EP-83 U.S. Environmental ProtectionAgency. Guidelines for Performing Regulatory
Impact Analysis. EPA-23-01-84-003, U.S.Environmental Protection Agency,Washington (1983).
EP-87 U.S. Environmental ProtectionAgency. Radiation Protection Guidance toFederal Agencies for Occupational Exposure.Federal Reister5.,2822; January 27,1987.
FR-65 Federal Radiation Council. RadiationProtection Guidance for Federal Agencies.Federal Register 30, 6953-6955; May 22, 1965.
IA-85 International Atomic Energy Agency.Principles for Establishing InterventionLevels for Protection of the Public in theEvent of a Nuclear Accident or RadiologicalEmergency. Safety Series No.72, InternationalAtomic Energy Agency, Vienna (1985).
IC-77 International Commission onRadiological Protection. Radiological
E-20 U.

0. -F Protection. ICRP Publication 26, PergamonPress, Oxford (1977).
IC-84 International Commission onRadiological Protection. Protection of thePublic in the Event of Major RadiationAccidents: Principles for Planning, ICRPPublication 40,. Pergamon Press, New York(1984).
NR-75 U.S. Nuclear Regulatory Commission.Calculations of Reactor AccidentConsequences. WASH-1400,. U.S. NuclearRegulatory Commission, Washington (1975).
SN-82 Sandia National Laboratories.Technical Guidance for Siting CriteriaDevelopment. NJREG/CR-2239, U.S. NuclearRegulatory Commission, Washington (1982).
WA-82 Warming, L Weathering andDecontamination of Radioactivity Deposited.on Asphalt Surfaces. Riso-M-2273, RisoNational Laboratory, DK 4000 Roskilde,Denmark (1982).
WA-84 Warming, L. Weathering andDecontamination of Radioactivity Depositedon on Concrete Surfaces. RISO-M-2473, RisoNational Laboratory, DK-4000 Roskilde,Denmark. December (1984).
.~
E-21

C.(
APPENDIX F
Radiation Protection Criteriafor the Late Phase
Background Information
(Reserved)
i
*b US. COVERNMENT PPINTSG OFFICE: to - 6 1 7 - 0 0 3; 4 7 0 8 6
C)

WISCONSIN PUBLIC SERVICE CORP. No. EPIP-AD-02 Rev. AKTitle Emergency Class Determination
Kewaunee Nuclear Power Plant
Entergency Plan Implementing Procedure Date OCT 5 2004 Page 1 of 22
Reviewed By John Egdorf Approved By Jerrie ColemanNuclear 0 Yes PORC 0 Yes SRO Approval Of Q YesSafety Review TemporaryRelated 0 No Required 0 No Changes Required 0 No
1.0 Purpose
1.1 This procedure provides instruction for determining proper emergency classification listed inorder to activate the appropriate level of response from the Kewaunee Nuclear PowerPlant (KNPP) emergency response organization and off-site response organization.
2.0 General Notes
2.1 None
3.0 Precautions and Limitations
3.1 Plant monitors used to determine whether emergency classification levels are being exceededshould be checked for accuracy prior to declaring an emergency class (e.g., compare againstredundant channels, determine if consistent with system status, or verification by sampleanalysis when required by Chart A(l).
3.2 This procedure is not written to facilitate de-escalation. Therefore, any decision to de-escalate must be based on a thorough review of procedures and plant conditions. Ifappropriate, it is preferable to terminate or enter recovery. However, there may be occasionswhere it is appropriate to de-escalate.
3.3 Once indication is available that an emergency action level has been met, classification mustbe made as soon as possible and must not exceed 15 minutes. A classification should not bemade before an emergency action level has been met. Once a classification has beendeclared, notification must be initiated and in progress to the State and County agencieswithin 15 minutes of event classification using "Event Notice," Form EPIPF-AD-07-01.During the initial 15-minute classification assessment, there may be rapidly changingconditions. Classification during this initial period should be based on currently availableplant status.
4.0 Initial Conditions
4.1 This procedure applies during any plant evolution that may result in an emergencydeclaration.
plg6dbl.doc-Christine Simmons/Christine Simmons-Paul SunderlandREFERENCE USE

WISCONSIN PUBLIC SERVICE CORP. No. EPIP-AD-02 Rev. AK
Title Emergency Class DeterminationKewaunee Nuclear Power Plant
Entergency Plan Implementing Procedure Date OCT 5 2004 Page 2 of 22
5.0 Procedure
5.1 Determine if a plant emergency exists during abnormal plant conditions by referring toTable 2-1, Emergency Action Level Charts.
5.2 IF a plant emergency exists, THEN perform the required actions of the appropriateemergency procedure listed below:
5.2.1 EPIP-AD-03, "KNPP Response to an Unusual Event"
5.2.2 EPIP-AD-04, "KNPP Response to Alert or Higher"
5.3 As plant conditions change, continue referring to the Emergency Action Level Charts.
5.4 Determine if the emergency should be reclassified.
5.5 IF the event is reclassified, THEN return to Step 5.2.
5.6 IF Final Conditions (Section 6.0) are not met, THEN return to Step 5.3.
5.7 IF Final Conditions (Section 6.0) are met, THEN use of this procedure may be suspended.
6.0 Final Conditions
6.1 Plant Emergency has been Terminated or Recovery actions have begun and the ResponsibleDirector has suspended the use of EPIPs.
7.0 References
7.1 Kewvaunee Nuclear Power Plant Emergency Plan
7.2 EPIP-AD-0 1, Personnel Response to the Plant Emergency Siren
7.3 EPIP-AD-03, KNPP Response to an Unusual Event
7.4 EPIP-AD-04, KNPP Response to Alert or Higher
7.5 COMTRAK 89-001, NRC Inspection Report 88-11, Improve Guidance for Fires Chart G
7.6 OEA 87-246, Report OE 2265, Improve Description of Unusual Aircraft Activity Chart P
7.7 NRC Letter 07-11-94, Branch Position on Acceptable Deviations to NUREG-0654
7.8 OEA 96-083, NRC IN 1997-045 Chart A(2)
REFERENCE USE

WISCONSIN PUBLIC SERVICE CORP. No. EPIP-AD-02 Rev. AK
Title Emergency Class DeterminationKewaunee Nuclear Power Plant
Enmergenc Plan Inmpleenting Procedure Date OCT 5 2004 Page 3 of 22
8.0 Records
8.1 The following QA records and non-QA records are identified in this directive/procedure andare listed on the KNPP Records Retention Schedule. These records shall be maintainedaccording to the KNPP Records Management Program.
8.1.1 OA Records
None
8.1.2 Non-OA Records
None
REFERENCE USE
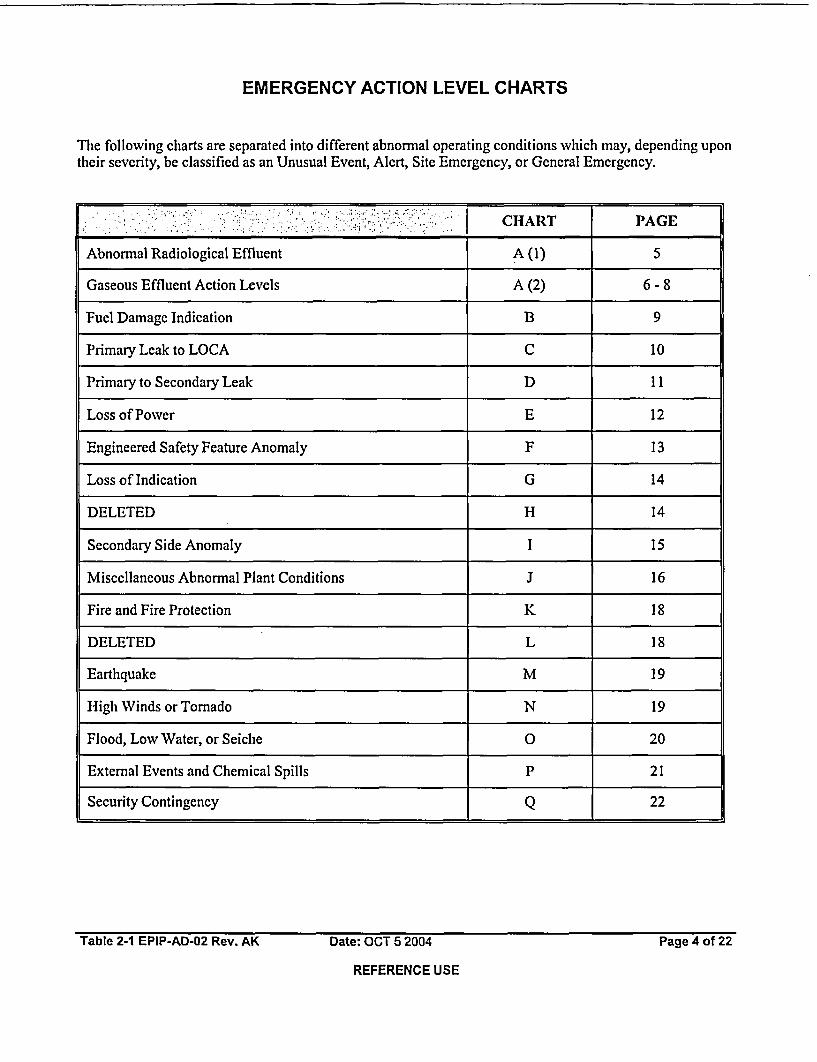
EMERGENCY ACTION LEVEL CHARTS
The following charts are separated into different abnormal operating conditions which may, depending upontheir severity, be classified as an Unusual Event, Alert, Site Emergency, or General Emergency.
CHAR :W - CART PAGE
Abnormal Radiological Effluent A (1) 5
Gaseous Effluent Action Levels A (2) 6 - 8
Fuel Damage Indication B 9
Primary Leak to LOCA C 10
Primary to Secondary Leak D 11
Loss of Power E 12
Engineered Safety Feature Anomaly F 13
Loss of Indication G 14
DELETED H 14
Secondary Side Anomaly I 15
Miscellaneous Abnormal Plant Conditions 16
Fire and Fire Protection K 18
DELETED L 18
Earthquake M 19
High Winds or Tornado N 19
Flood, Low Water, or Seiche 0 20
External Events and Chemical Spills P 21
Security Contingency Q 22
Table 2-1 EPIP-AD-02 Rev. AK Date: OCT 5 2004
REFERENCE USE
Page 4 of 22

CHART A(1)ABNORMAL RADIOLOGICAL EFFLUENT
EMERGENCYKNPP INDICATION CLASSIFICATION CLASSIFICATION
CRITERIA
Effluent monitors detect levelscorresponding to greater than I GENERAL
SEE CHART A(2) rem/hr whole body or 5 rem/hr EMERGENCYthyroid at the site boundary under"actual meteorological" conditions.
t oProjected or measured in the environsProjected or measured dose rates to be provided by the dose rates greater than 1 rem/hr whole GENERALRadiological Protection Director or Environmental body or 5 rem/hr thyroid at the site EMERGENCYMonitoring Teams. budr.
boundary.Effluent monitors detect levelscorresponding to greater than 50
SEE CHART A(2) mr/hr for 1/2 hour OR greater than 500 SITE EMERGENCYmr/hr for two minutes (or five timesthese levels to the thyroid) OR for"adverse meteorology."
At the site boundary, projected ormeasured dose rates greater than 50
Projected or measured dose rates to be provided by the mr/hr for 1/ hours OR greater thanRadiological Protection Director or Environmental 500 mr/hr for two minutes (or five SITE EMERGENCYMonitoring Teams. times these levels to the thyroid) or
EPA Protective Action Guidelines areprojected to be exceeded outside thesite boundary.
SEE CHART A(2) Radiological effluents greater than 10 ALERTtimes ODCM instantaneous limits.
a. Containment R-2 OR R-7 > 1,000 times baselineestablished in the Control Room, OR
b. Charging Area R-4 1,000 times baseline Radiation levels or airborneestablished in the Control Room, OR contamination which indicate a severe
degradation in the control of ALERTc. SFP Area R-5 2 1,000 times baseline established radioactive materials (e.g., radiation
in the Control Room, OR levels suddenly increase by a factor of1,000).
d. Plant area air sample indicates airbornecontamination > 1,000 times the occupationalDAC values.
(1) Gaseous Releases: See Chart A(2)
Offsite Dose Calculation Manual UNUSUALEVENT(2) Liquid Releases: Notification by the limits exceeded.
Rad-Chem Group of violating ODCM 3.3.1limits.
Table 2-1 EPIP-AD-02 Rev. AK Date: OCT 5 2004 Page 5 of 22
REFERENCE USE

CHART A(2)GASEOUS EFFLUENT ACTION LEVELS
1. AUX BUILDING VENT RELEASES - J7THSIGNIFILCANTT CORE DAAfAGE
Instrument readings assuming a post accident gas release AND Containment High Range Radiation Monitors42599 (R-40) and 42600 (R-4 1) reads 1000 R/hr for > 2 minutes within one-half hour of the accident.
NOTE: Use adverse meteorology conditions (ADV MET) only when, I Om and 60m wind speed < 5mph ANDDelta-T > +2.4 degrees F or Sigma Theta is < 3.01 degrees. All other cases are average meteorology(AVG MET).
NOTE: R-13 and R-14 are expected to be off scale high during all events on this page.
FANSF | AUX BLDG SPING MONITORS AUX BLDG STACK MONITORS CLASS.
MID RANGE HIGH RANGEcPM (01-07) CPMI (01-09) R-35 R-36
PPCS PT G9086G PPCS PT G9088G MRI/1/R -11
TOTAL
NUMBER AVG IET ADV NIET AVG MIET ADV IET T AVGAV ADV IETRUNNING MET MIET AGMTAVE
** I.E+4 6.5E+I * 7.9E+2 1.27E+2 7.9E-1
2 8.8E+5 5.5E+3 3.25E+1 * 3.9E+2 6.35E+1 4.0E-1 GENERAL
3 5.9E+5 3.7E+3 2.16E+ I 2.6E+2 4.2E+1 2.6E-1 EMERG.
4 4.4E+5 2.1E+3 I.62E+1 . 2.0E+2 3.175E+1 2.0E-I
I 8.8E+4 5.5E+2 3.OE+0 * 6.3E+3 3.9E+1 6.3E+O |___
2 4.4E+4 2.7E+2 I.5E+O 3.1E+3 I.9E+l 3.lE+0 SITEEMERG.
3 2.9E+4 I.8E+2 I.OE+0 * 2.IE+3 I.3E+1 2.IE+O *
4 2.2E+4 I.3E+2 1.5E+3 9.5E+0 1.5E+0
I L.OE+3 6.2E+0 * 7.0E+I * * *
2 5.0E+2 3.1E+o * * 3.5E+I * * | ALERT
3 3.3E+2 2.OE+0 * 2.3E+1 * *
4 2.5E+2 1.5E+0 1.75E+l * * 4
I 1.0E+2 6.2E-1 | __|___ | 7.OE+O *
2 5.0E+I 3.1E-1 | ______ | 3.5E+0 * * UNUSUALEVENT
3 3.3E+1 2.E-I 2.3E+O
4 2.5E+1 1.SE-1 1.7E+0 ** Offscale Low
Offscale High (Confirmation Only)
Table 2-1 EPIP-AD-02 Rev. AK Date: OCT 5 2004 Page 6 of 22
REFERENCE USE

CHART A(2)GASEOUS EFFLUENT ACTION LEVELS continued
2. AUX BUILDING VENT RELEASES 9ITHOUTCORE DAMAGE
NOTE: Use adverse meteorology conditions (ADV MET) only when, 10m and 60m wind speed < 5mphAND Delta-T > +2.4 degrees F or Sigma Theta is < 3.01 degrees. All other cases are averagemeteorology (AVG MET).
NOTE: R-13 and R-14 are expected to be off scale high during all events on this page.
SFA AUX BLDG SPING MONITORS CLASS.
MID RANGE HIGH RANGE ..... .TOTAL CPM (01-07) CPMN5 (01-09)
NUMBER PPCS PT G9086G PPCS PT G9088G ;RUNNING
AVG MET ADV MET AVG MET ADV MET
I ** 9.4E+4 I.6E+4 I.OE+2
2 ** 4.7E+4 8.0E+3 5.0E+I GENERAL
3 ** 3.1 E+4 5.3E+3 3.3E+1 EMERG.
4 . 2.3E+4 4.0E+3 2.5+1
I 7.5E+5 4.6E+3 8.0E+2 5.0E+0
2 3.7E+5 2.3E+3 4.0E+2 2.5E+0 SITE
3 2.51E+5 1.5+3 2.6E+2 I.6E+0 EMERG.
4 1.8E+5 I.IE+3 2.0E+2 1.2E+0
SV & SFP AUX BLDG SPING MONITORSFANS EEG
TOTAL LOWV RANGE MID RANGE CLASS.NUMBER Cl/cc (0 1-05) CPM (01-07)RUNNING PPCS PT G9084G PPCS PT 9086G
I ** 8.6E+3
2 ** 4.3E+3 ALERT
3 ** 2.8E+3
4 * | 2.1E+3
1 6.3E-2 8.6E+2
2 3.IE-2 4.3E+2 UNUSUAL
3 2.1E-2 2.8E+2 EVENT
4 1.5E-2 2.IE+2
** Offscale High (Confirmation Only)
Table 2-1 EPIP-AD-02 Rev. AK Date: OCT 5 2004 Page 7 of 22
REFERENCE USE

CHART A(2)GASEOUS EFFLUENT ACTION LEVELS continued
3. STEANI LINE RELEASE fY17T1LSCLGAlEANTCORE.DAAAGE
Instrument readings assuming radioactive steam is releasing at a total of 1.4E+5 pounds per hour to the atmosphere ANDContainment High Range Radiation Monitor 42599 (R-40) or 42600 (R141) reads 1000 R/hr for > 2 minutes within one-halfhour of the accident.
"All"B''
Steam Line Monitors Steam Line Monitors Emergency Classification
R-15 R-31 R-32 R-33 R-34(cpm) (mR/hr) (R/hr) (mR/hr) (R/hr) _ _ __;
** 1.3E+3 1.3E+0 1.3E+03 1.3E+0 General Emergency
** 6.0E+1 6.0E+1 Site Emergency
** 1.5E-1 1.5E-1 Alert
2.0E+05 Unusual Event
** Offscale High (Confirmation Only)
4. SHIELD BUILDING STACK RELEASE
Instrument readings assuming SBV System is operating in the recirculation mode.
Reactor Bldg. Discharge Vent SPING Emergency Classification
PPCS PT G9077G PPCS PT G9079G(02.07) (02-09)
Mid Range (cpm) High Range (cpm)
1.3E+05 1.5E+2 General Emergency
6.7E+03 7.0E+0 Site Emergency
1.5E+1 - Alert
Unusual Event
Table 2-1 EPIP-AD-02 Rev. AK Date: OCT 5 2004
REFERENCE USE
Page 8 of 22

CHART BFUEL DAMAGE INDICATION
KENPP INDICATION C ELSIF ERGENCYR I CLASSIFICATION
(I) CET > 1,200 Degrees for greater than 15 minutes,OR Plant conditions exist that make the
(2) R40 or R41 > 1,000 R/hr, OR release of large amounts of GENERALradioactivity in a short time period EMERGENCY
(3) SACRG-I, Severe Accident Control Room Guideline possible.Initial Response has been implemented.
(Major damage is more than one spent fuel elementdamaged.) Major damage to spent fuel in SITE
containment or auxiliary building. EMERGENCY(1) Fuel Handling accident in Containment
a. AlarmonR-II ORR-12,AND
b. Dropped spent fuel assembly, OR
c. Report of a large object dropped in Rx core,
OR
(2) Fuel Handling Accident in Auxiliary Bldg.
a. Alarm on R-13 or R-14, AND
b. A large object dropped in spent fuel pool, OR
c. A dropped spent fuel assembly, OR
d. A loss of water level below spent fuel.
(1) R-9 indication is offscale high, AND Severe loss of fuel cladding ALERT
(2) Laboratory analysis confirms RCS activity levels a. Very high coolant activitycomparable to USAR Appendix D, Table D.4-1. sample
b. Failed fuel monitor indicatesgreater than 1% fuel failureswithin 30 minutes or 5% totalfuel failures.
(I) Fuel Handling Accident in Containment Fuel damage accident with release ALERTa. A confirming report, AND of radioactivity to containment orb. AlarmionR-ll ORR-12, auxiliarybuilding.
OR
(2) Fuel Handling Accident in Auxiliary Bldg.
a. A confirming report, AND
b. Alarm on R-13 OR R-14.
(I) With RCS Temperature > 5000 F,1.0 . High reactor coolant activity UNUSUAL
a .> 1.0tpCi/gram DOSE Equivalent 1-131 for 48 sample. EVENThours, OR
b. Exceeding 60 pCi/gram for Dose Equivalent1-131, OR
c. > 91I/E JtCi/ccAs determined by SP-37-065 (from T.S. 3.L.c)
(I) R-9 is greater than 5.0 R/hr, AND Failed fuel monitor indicates greater UNUSUAL(2) Verified by RCS chemistry sample analysis. within 30 minutes. EVENT
Table 2-1 EPIP-AD-02 Rev. AK Date: OCT 5 2004REFERENCE USE
Page 9 of 22

CHART CPRIMARY LEAK TO LOCA
NOTE: This chart does not apply when leakage from the Reactor Coolant System is caused by a Steam Generatortube rupture.
KNPP INDICATION CLASSIFICATIONCRITERIA| CLASSIFICATION
(1) LOCA is verified per IPEOP E-1, "Loss of (1) Loss of coolant accident, GENERALReactor or Secondary Coolant," AND AND EMERGENCY
(2) ECCS failure is indicated by: (2) Initial or subsequent failure ofECCS, AND
a. SI and RHR pumps not running, OR(3) Containment failure or
b. Verification of no flow to the reactor potential failure exists (lossvessel, OR of 2 of 3 fission product
barriers with a potential lossc. Core exit thermocouples indicate greater of 3rd barrier).
than 1,200'F,AND
(3) Failure or potential failure of containment isindicated by:
a. Physical evidence of containmentstructure damage, OR
b. Containment Pressure is > 23 PSIG andloss of all containment fan coil units andboth trains of ICS, OR
c. Containment hydrogen monitor indicates2 10% hydrogen concentration, OR
d. Containment pressure exceeds 46 psig.
(I) SI System is activated and RCS leakage Reactor Coolant System leakage SITEexceeds charging system capacity as verified greater than make-up pump EMERGENCYby Control Room indications or IPEOPs. capacity.
(1) Charging flow verses letdown flow indicates Reactor Coolant System leak rate ALERTan unisolable RCS leak > 50 gpm. greater than 50 GPM.
(I) Initiation of reactor shutdown required by Exceeding Reactor CoolantTechnical Specification, Section T.S. 3.1.d. System leak rate, Technical UNUSUALIndicated leakage may be determined using Specifications, requiring reactor EVENTReactor Coolant System mass balance shutdown.calculations performed by SP-36-082.
Table 2-1 EPIP-AD-02 Rev. AK Date: OCT 5 2004REFERENCE USE
Page 10 of 22

CHART DPRIMARY TO SECONDARY LEAK
EMERGENCYKNPP INDICATION CLASSIFICATION CLASSIFICATION
CRITERIA
(1) Entry into IPEOP E-3, "Steam Generator Tube Rapid failure of steam generator SITERupture," is expected or has occurred, AND tubes with loss of off-site power. EMERGENCY
(2) Primary-to-secondary flow > 800 GPM OR RCSpressure decreasing uncontrollably, AND
(3) All three transformers Main Aux., Reserve Aux.,and Tertiary Aux., are de-energized.
Rapid gross failure of one steam ALERT(I) Entry into IPEOP E-3, "Steam Generator Tube Rator failof ofRupture," is expected or has occurred, AND off-site power. w
(2) All three transformers: Main Aux., ReserveAux., and Tertiary Aux., are de-energized.
(1) Entry into IPEOP E-3, "Steam Generator Tube Rapid failure of multiple steam ALERT(1) ntr int IPOP -3, Stem Gneraor ube generator tubes.Rupture," is expected or has occurred, AND
(2) Primary-to-secondary leak rate greater than800 GPM indicated by SI flow OR RWST levelchange.
UNUSUAL(1) Primary-to-secondary leakage > 150 gallons per Exceeding Primary-to-Secondary EVENTday for more than 4 hours (TS 3.1 .d.2). leak rate Technical Specification.
(Do not delay declaration if leakage suddenlyincreases above 150 gallons per day AND plantshutdown actions are initiated.)
Table 2-1 EPIP-AD-02 Rev. AK Date: OCT 5 2004REFERENCE USE
Page 11 of 22

CHART ELOSS OF POWER
EMERGENCYKNPP INDICATION CLASSIFICATION CLASSIFICATION
CRITERIA
(1) RCS is > 2O00'F,AND Failure of off-site and on-site GENERALAC power, AND EMERGENCY
(2) Buses 1 through 6 are de-energized including the Total loss of auxiliaryDIG supplies to buses 5 and 6, AND feedwater makeup capability
for greater than 2 hours. (Loss(3) Loss of the turbine driven AFW pump, AND of power plus loss of all AFW
would lead to clad failure and(4) Conditions exist for greater than 2 hours. potential containment failure.)(1) Buses I through 6 are de-energized including the Ls fofst oeADST
D/G supplies to buses 5 and 6 or longer than Loss of off-site power, AND SITE15 minutes. Loss of on-site AC power (for
more than 15 minutes).(1) Low voltage lockout OR de-energized condition
on all safeguards DC distribution cabinets for Loss of all vital on-site DC SITEgreater than 15 minutes. power (for more than 15 EMERGENCYa. BRA 102 and BRB 102, OR minutes).b. BRA 104 and BRB 104, ORc. BRA 102 and BRB 104, ORd. BRB 102 and BRA 104
(1) Low voltage lockout OR de-energized conditionon all safeguards DCdistribution cabinets for Loss of all vital on-site DC ALERTless than 15 minutes. power (for less than 15a. BRA 102 and BRB 102, OR minutes).b. BRA 104 and BRB 104, ORc. BRA 102 and BRB 104, ORd. BRB 102 and BRA 104
(1) Buses I through 6 are de-energized, AND Loss of off-site power, AND ALERT
(2) The D/G supplies to buses 5 and 6 do not Loss of on-site AC power (forrespond as designed. AC power is restored to bus less than 15 minutes.)5 or 6 within I minutes.
(1) All three transformers: Main Aux ReserveAux., and Tertiary are de-energized, OR Loss of off-site power, OR UNUSUAL
EVENTLoss of on-site power
(2) Both D/Gs unavailable (unable to supply bus 5 or capability.6 by any means).
(1) Core is unloaded or reactor cavity is flooded with Ls fofst oe N NSAinternals removed, AN Loss of off-site power, AND EVENT
Loss of on-site AC power (for(2) Buses I through 6 are de-energized including the more than 15 minutes).
D/G supplies to buses 5 and 6 or longer than15 minutes.
Table 2-1 EPIP-AD-02 Rev. AK Date: OCT 5 2004REFERENCE USE
Page 12 of 22

CHART FENGINEERED SAFETY FEATURE ANOMALY
EMERGENCYKNPP INDICATION CLASSIFICATION CLASSIFICATION
CRITERIA
(1) RCS > 200'F with a loss of cooling capability Complete loss of any function SITEor inventory control: needed when RCS > 2000F. EMERGENCY
a. Sustained loss of negative reactivitycontrol, OR
b. Steam dump, S/G safeties, and poweroperating reliefs not operable (> 350'F),
OR
c. Inability to feed S/Gs (No AFWV or MainFeedwater/Condensate Flow), OR
d. Sustained loss of RCS inventory control,OR
e. Sustained loss of both trains of RHR, AND
the inability to sustain either natural ORforced circulation with the steamgenerators (• 350'F).
(A Site Emergency should be declared upon theinitiation of bleed and feed per FR H. l, "Response toLoss of Secondary Heat Sink.")
(Apply this criteria when the RCS is < 200'F.) Complete loss of any function ALERTneeded when RCS < 200'F.
(1) Loss of both trains of RHR
(Does not apply when core is unloaded OR cavity isflooded with internals removed.)(1) Failure of both Rx trip breakers to open upon Failure of the Reactor
receipt of a valid signal. Applies even if Protection System to initiateIPEOP FR S.1 is not entered. and complete a reactor trip ALERT
which brings the reactorsubcritical.
(I) Loss of ESF function, required support function Inability to reach required UNUSUALor required Tech Spec instruments OR shutdown within Tech Spec EVENTExceeding Tech Spec Safety Limits, limits
AND
(2) upon discovery, inability or failure to takerequired shutdown or mode change actionswithin the required time.
(Total loss of AFW system when required (FR-H. Iimplemented) should be declared a UE regardless ofTech Spec action compliance.)
Table 2-1 EPIP-AD-02 Rev. AK Date: OCT 5 2004REFERENCE USE
Page 13 of 22

CHART GLOSS OF INDICATION
EMERGENCYKNPP INDICATION CLASSIFICATION CLASSIFICATION
CRITERIA
(1) Total loss of Annunciator System computer Most or all alarms (annunciators) SITEalarms, and sequence of events recorder, lost and a plant transient initiate EMERGENCYAND or in progress.
(2) Uncontrolled plant transient in progress orinitiated during the loss.
(1) Total loss of Annunciator System, computer Most or all alarms (annunciators) ALERTalarms, and sequence of events recorder. lost.
(1) Significant loss of ESF or Rx Protection Indications or alarms on process UNUSUALinstrumentation. An Unusual Event should or effluent parameters not EVENTNOT be declared for a non-emergency Tech functional in control room to anSpec backdown, when the affected parameter extent requiring plant shutdownremains monitorable. or other significant loss of
assessment capability.
CHART H
(DELETED)
_.. - . ____ __ __ - ---Table 2-1 EPIP-AD-02 Rev. AK Date: OCT 5 2004
REFERENCE USEPage 14 of 22

CHART ISECONDARY SIDE ANOMALY
EMERGENCYKNPP INDICATION CLASSIFICATION CLASSIFICATION
CRITERIA
(1) Main steam line break that results in a SI Steam line break, AND SITEactuation, AND EMERGENCY
Primary-to-secondary leak(2) a. R-15 orR-19 reads offscale high with >50 GPM, AND
confirmation by chemistry analysis, ORIndication of Fuel Damage.
b. Primary-to-secondary leakage > 50 gpm,
AND
(3) a. R-9 or CNTMT high range rad monitors(42599, 42600) indicate > 10 R/hr, OR
b. CNTMT hydrogen monitor indicates> 1%hydrogen concentration.
(1) Main steam line break that results in a SI Steam line break with ALERTactuation, AND significant (greater than
10 GPM) primary-to-secondarya. R-15 OR R-19 reads a factor of 1000 above leakage.
normal, OR(Applies even if events occur in
b. Primary-to-secondary leakage > 10 gpm. opposite steam generators.)
(I) Turbine trip and observation of penetration of Turbine rotating component UNUSUALcasing. failure causing rapid plant EVENT
shutdown.
(I) The uncontrolled depressurization of the Rapid depressurization of the UNUSUALsecondary system that results in an SI actuation. secondary side. EVENT(Unusual Event should be declared even iftransient was mitigated by closure of the MainSteam Isolation Valves.
Table 2-1 EPIP-AD-02 Rev. AK Date: OCT 5 2004REFERENCE USE
Page 15 of 22

CHARTJMISCELLANEOUS ABNORMAL PLANT CONDITIONS
NoteChart J is now a two page chart.
KNPP INDICATION CLASSIFICATION CRITERIA CLASSIFICATION
(1) Containment boundary failure or potential Other plant conditions that make a GENERALfailure: release of large amounts of EMERGENCY
radioactivity in a short time perioda. Containment pressure > 46 psig, OR possible; e.g., any core melt
situation.b. Loss of all containment fan coil units and
both trains of ICS, OR Examples:- Failure of main FW and AFW
c. Containment hydrogen monitor systems for greater than2 10% hydrogen concentration, 30 minutes without Safety
Injection and Residual HeatAND Removal flow. Plus a
containment failure is(2) Loss of core cooling capability: imminent.
a. Loss of SI and RHR flow, - Transient requiring theAND operation of shutdownAND systems with a failure of these
(3) Failure of shutdown system when required: sudon systems. In
a. Entry into IPEOP FR-S. 1, "Response to RHR and containment failureNuclear Power Generation/ATWS "OR is imminent.
b. Loss of AFW for greater than 30 minuteswith loss of mainF\V and condensate.
NoteChart J is continued on the next page.
Table 2-1 EPIP-AD-02 Rev. AK Date: OCT 5 2004REFERENCE USE
Page 16 of 22

CHARTJMISCELLANEOUS ABNORMAL PLANT CONDITIONS
KNPP IN'DICATION EMERGENCY CLASSIFICATIONCLASSIFICATION CRITERIA
Two fission product barriers are lost with the Other plant conditions that make a GENERALpotential or probability of losing the third barrier. release of large amounts of EMERGENCY
radioactivity in a short time periodIndications: possible; e.g., any core melt
situation.(1) Containment boundary potential failure:
Examples:a. Containment pressure > 46 psig, OR - Failure of main FW and AFW
systems for greater thanb. Loss of all containment fan coil units and 30 minutes without Safety
both trains of ICS, OR Injection and Residual HeatRemoval flow. Plus a
c. Containment hydrogen monitor containment failure is2 10% hydrogen concentration, imminent.
AND - Transient requiring theoperation of shutdown
(2) RCS Boundary: systems with a failure of theseshutdown systems. In
a. Loss of RHR and SI flow, OR addition, failure of SI and_ RHR and containment failure
b. LOCA is verified per IPEOP E-1, is imminent.
AND
(3) Fuel Cladding:
a. R-9 > 1O R/hr, OR
b. RCS Chemistry Analysis
(1) Evacuation of Control Room (E-0-06 event). Evacuation of control room and SITEcontrol of shutdown systems EMERGENCYrequired from local stations.
(1) Conditions that warrant increased awareness on Other plant conditions that warrant UNUSUALpart of the plant staff will be evaluated by the increased awareness on the part of EVENTPlant Manyer or his designate. This is to plant staff or state and/or localdetermine if conditions are applicable for authorities.activating the E.P.
Examnle: Loss of AFW system when required,validated upon implementation ofFR H.I "Response to Loss of SecondaryHeat Sink."
Table 2-1 EPIP-AD-02 Rev. AK Date: OCT 5 2004REFERENCE USE
Page 17 of 22

CHART KFIRE AND FIRE PROTECTION
KNPP INDICATION EMERGENCY CASFCTOCLASSIFICATION CRITERIA CLASSIFICATION
(1) A fire within the Auxiliary Building A fire compromising the functions SITETechnical Support Center, safeguards alley, of safety systems. EMERGENCYD/G rooms, Battery Rooms, or screenhousethat defeats redundant safety trains of ESFequipment causing the required ESF system tobe inoperable.
(1) A fire within the Auxiliary Building A fire potentially affecting safety ALERTTechnical Support Center, safeguards alley, systems.DIG rooms, Battery Rooms, or screenhousethat lasts more than 10 minutes OR causes asingle train of required ESF equipiiment to beinoperable. 11
(1) Any fire within the protected area lasting A fire within the plant lasting UNUSUALmore than 10 minutes. more than 10 minutes. EVENT
CHART L
(DELETED)
Table 2-1 EPIP-AD-02 Rev. AK Date: OCT 5 2004REFERENCE USE
Page 18 of 22

CHART MEARTHQUAKE
EMERGENCYKNPP INDICATION CLASSIFICATION CLASSIFICATION
CRITERIA
(1) Activation of seismic recorder with TRIGGER, An earthquake greater than SITEOBE and DBE lights lit in relay room on Design Basis Earthquake (DBE). EMERGENCYRRI39, AND
(2) Verification of a seismic eventb physicalexperience or from U. of W. - MilwaukeeSeismic Center.
(1) Activation of seismic recorder with TRIGGER, An earthquake greater than ALERTand OBE lights lit in relay room on RR159, Operational Basis EarthquakeAND (OBE).
(2) Verification of a seismic event by physicalexperience or from U. of W. - MilwaukeeSeismic Center.
(I) Activation of seismic recorder with TRIGGER An earthquake felt in plant or UNUSUALlight lit in relay room on RRI 59, OR detected on station seismic EVENT
instrumentation.(2) An earthquake felt in the Plant*.
(*Should be confirmed by evidence of physicalamage or verification from University of Wisconsin
Seismic Center.)
NOTE: 1.) Telephone numbers for U of W - Milwaukee Seismic Center are in the KPB Emergency TelephoneDirectory, ETD 02.
2.) The Point Beach Seismic Monitor may be used if the KNPP Monitor is out of service.
CHART NHIGH WINDS OR TORNADO
EMERGENCYKNPP INDICATION CLASSIFICATION CLASSIFICATION
CRITERIA
(I) Winds in excess of 100 mph for greater than Sustained winds in excess of SITEI hour, AND design levels with plant not in EMERGENCY
col shutdown.(2) Plant above cold shutdown condition.
(1) A tornado which strikes the facility, AND Any tornado striking facility. ALERT
(2) Causes damage that affects the continued safeoperation of the plant.
(1) A tornado within sight of the plant which has Any tornado on-site. UNUSUALcaused the loss of at least one of the off-site EVENTtransmission lines, OR
(2) A tornado observed on-site.
Table 2-1 EPIP-AD-02 Rev. AK Date: OCT 5 2004REFERENCE USE
Page 19 of 22

CHART 0FLOOD, LOW WATER, OR SEICHE
EMERGENCYCLASSIFICATION
KNPP INDICATION CRITERIA CLASSIFICATIONFOREBAY LEVEL Flood, low water, or
Indicated for > 15 minutes seiche near design ALERT
OPUMPS |I PUMP 2PUMPS CORRESPOND levels.o PUMS I UMP 2PUMP TO LAKE LEVEL
NOTE 3 NOTE I 2 94% * I 588 ft.<50%* NOTE 5 NOTE 5 < 568.5 ft.OR Deep water Wave 2 22.5 ft. l
FOREBAY LEVEL 50-year flood, lowIndicated for > 15 minutes water level or seiche UNUSUAL
O PUMPS I PUMP 2 PUMPS TO LAKE LEVEL EVENT
NOTE2 2Ž98%* 2 88%* Ž 586 ft.
<53.1%* <46.9%* NOTE5 < 569.5 ft.U.S.Coas NOTEt 4 Two Rivers)OR Deep water wave Ž 18 ft. (as confirmed by theU.S. Coast Guard, Two Rivers) __________ _ _ _ _ _ _ _ _ _
NOTE 1: Above the bottom of bar No. I painted on the south wall of the forebay.
NOTE 2: Above the bottom of bar No. 2 painted on the south wall of the forebay.
NOTE 3: Above the bottom of bar No. 3 painted on the south wall of the forebay.
NOTE 4: Applies to an uncontrollable decrease (cannot be restored by operator action. If the water box
inlet valves are throttled, use other means to determine lake level per E-CW-04, "Loss of
Circulating Water.")
NOTE 5: The corresponding forebay level for the associated lake level is below the circulating water pump
trip setpoint of 42%. Therefore, this criterion will not be reached.
* Computer point for forebay level is L09075A and should be used because of its greater accuracy.
Plant elevations and lake elevations are referenced to International Great Lakes Datum (IGLD), 1955
(IGLD 1955 = IGLD 1985 - 0.7 FEET)
Table 2-1 EPIP-AD-02 Rev. AK Date: OCT 5 2004REFERENCE USE
Page 20 of 22

CHART PEXTERNAL EVENTS AND CHEMICAL SPILLS
EMERGENCYKNPP INDICATION CLASSIFICATION CLASSIFICATION
CRITERIA
(1) An aircraft crash into plant buildings which causes structures by impact iare. EMERGENCYa complete loss of an ESF function. srcuebyiptRfe. E RGN
Severe damage to safe | SITE(1) A missile strikes plant buildings, OR shutda ment fe EM Eshutdown equipment from EMERGENCYmissiles or cxplosion.
(2) An explosion occurs within a plant building,which causes a complete loss of an ESF function.
Uncontrolled release of toxic SITE(I) Release of flammable or toxic gas from a ruptured or flammable gas is confirmed EMERGENCYcontainer which enters a vital area. Portable-2 within vital area.monitor detects explosive concentration of H2 invital area.
(1) An aircraft crashes into plant buildings OR Aircraft crash on facility. ALERTswitchyard which affects plant operation.
Missile impact from whatever ALERT(1) A missile strikes the facility which affects plant source on facility.operation.
Uncontrolled release of toxic ALERT(I) Release of toxic or flammable gas from a ruptured or flammable gas is confirmedcontainer such that the gases enter the plant within the protected area.protected area or buildings.
Known explosion damage to ALERT(1) Self-explanatory. facility affecting plantI_ operation.
( Aircraft crash on-site or UNUSUAL(1) An aircraft crash within the site boundary, OR unusual aircraft activity over EVENTfacility.
(2) Unusual aircraft activity such as erratic flying,dropped unidentified object, or other hostile acts,which threaten the plant or plant personnel. (Anyother persistent aircraft activity for whichidentification attempts through the FAA or otheragencies have been unsuccessful.)
Uncontrolled release of toxic UNUSUAL EVENT(1) Release of toxic or flammable gas on site, AND or flammable gas is confirmedon site.
(2) Portable monitors indicate toxic or explosiveconcentrations at life threatening levels of the gasnear the spill area.
Table 2-1 EPIP-AD-02 Rev. AK Date: OCT 5 2004REFERENCE USE
Page 21 of 22

CHART QSECURITY CONTINGENCY
EMERGENCYKNPP INDICATION CLASSIFICATION CLASSIFICATION
CRITERIA
(1) Physical attack on the lant that has resulted in Loss of physical control of the GENERALunauthorized personne occupying the control plant. EMERGENCYroom or any other vital areas as described inthe Security Plan.
(1) Physical attack on the plant involving Imminent loss of physical SITEimminent occupancy of the control room, control of the plant. EMERGENCYauxiliary shutdown panels, or other vital areasas defined by the Security Plan.
(1) Security safeguards contingency event that Ongoing security compromise. ALERTresults in a hostile force entering the protectedarea of the plants but not gaining control overshutdown capability or of any vital areas asdefined in the Security Plan, OR
(2) Security safeguards contingency event thatresults in a site specific H level CREDIBLEthreat as defined in the Security Plan.
(I) Security safeguards contingency event that Security threat or attempted UNUSUALresults in a site specific LO level CREDIBLE entry or attempted sabotage. EVENTthreat as defined in the Security Plan, OR
(2) Security safeguards contingency event thatresults in a Bomb threat accompanied byinterception of bomb materials, OR
(3) Security safeguards contingency event thatresults in an attempted entry into the protectedarea of the plant by a hostile force, OR
(4) Security safeguards contingency event thatresults in undetonated bomb found within theprotected area.
NOTE: Security staff will NOT act as notifier during security events. Utilize Control Room staff for notifications.
Table 2-1 EPIP-AD-02 Rev. AK Date: OCT 5 2004REFERENCE USE
Page 22 of 22

WISCONSIN PUBLIC SERVICE CORP. No. EPIP-AD-1 1 Rev. TTitle Emergency Radiation Controls
Kewaunee Nuclear Power Plant
Entergency Plan Implementing Procedure Date JAN 27 2004 Page 1 of 7
Reviewed By Rick Adams Approved By Jerrie ColemanNuclear 0 Yes PORC 0 Yes SRO Approval Of Q YesSafety Review TemporaryRelated El No Required 0 No Changes Required 0d No
1.0 Purpose
1.1 This procedure provides instruction for maintaining exposure to emergency workers As LowAs Reasonably Achievable (ALARA).
2.0 General Notes
2.1 Definitions
2.1.1 FEMA - Federal Emergency Management Agency
2.1.2 HP - Health Physics
2.1.3 PA - Protected Area
2.1.4 RCA - Radiologically Controlled Area
3.0 Precautions and Limitations
3.1 None
4.0 Initial Conditions
4.1 This procedure shall be implemented upon declaration of an Alert, Site Emergency,General Emergency, or when directed by the Shift Manager or Emergency Director.
5.0 Procedure
5.1 All emergency personnel are responsible for adhering to the requirements of this procedure.
5.1.1 The requirements of the Health Physics Procedures shall be applicable during allradiological emergencies, except as authorized by the Radiological Protection Director(RPD) or Emergency Director (ED).
5.1.2 For RCA entries, if any 1 OCFR20 dose limit is likely to be exceeded, an "EmergencyRadiation Work Permit" (ERWP), Form EPIPF-AD-1 1-01, shall be completed.Otherwise, use an existing Radiation Work Permit (RWP) or fill out a RWP inaccordance with NAD-08.03, "Radiation Work Permit."
pig2ed5.doc-Amy Kudick/Amy Kudick-Wayne GalameauREFERENCE USE
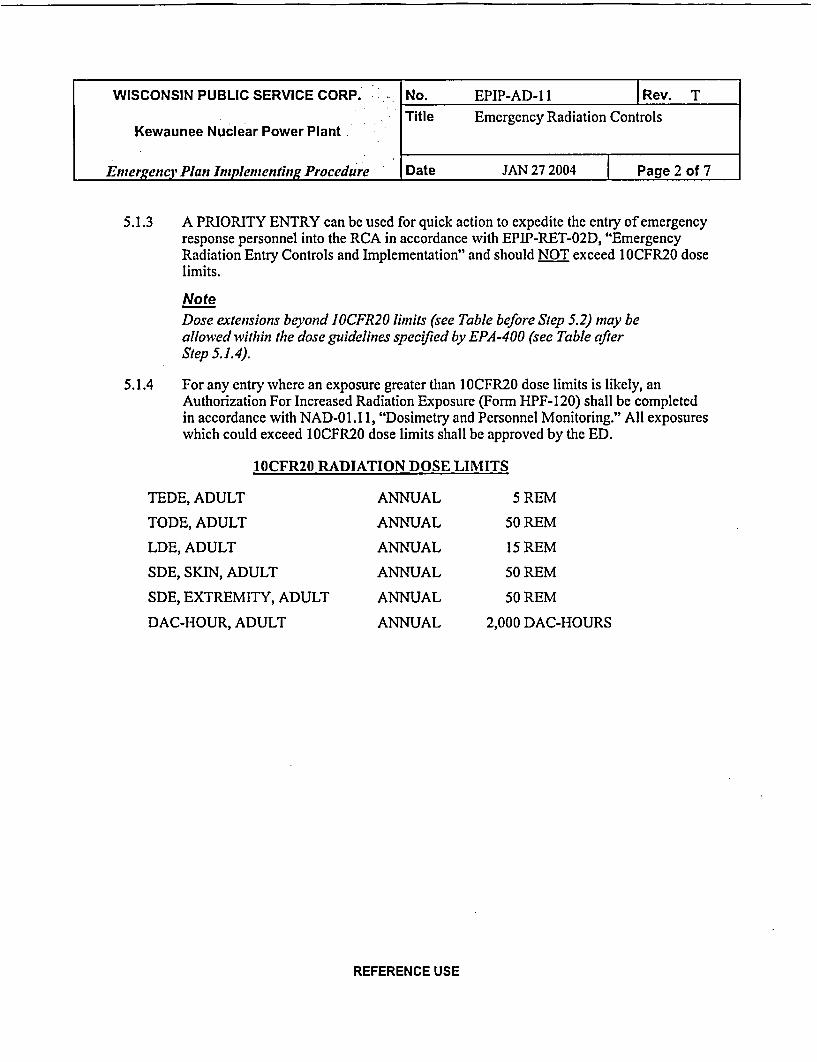
WISCONSIN PUBLIC SERVICE CORP. No. EPIP-AD-1 1 Rev. T
Title Emergency Radiation ControlsKewaunee Nuclear Power Plant
Emergency Plan Implementing Procedure Date JAN 27 2004 Page 2 of 7
5.1.3 A PRIORITY ENTRY can be used for quick action to expedite the entry of emergencyresponse personnel into the RCA in accordance with EPIP-RET-02D, "EmergencyRadiation Entry Controls and Implementation" and should NOT exceed 1OCFR20 doselimits.
NoteDose extensions beyond IOCFR20 limits (see Table before Step 5.2) may beallowed within the dose guidelines specified by EPA -400 (see Table afterStep 5.1.4).
5.1.4 For any entry where an exposure greater than I OCFR20 dose limits is likely, anAuthorization For Increased Radiation Exposure (Form HPF-120) shall be completedin accordance with NAD-01.1 1, "Dosimetry and Personnel Monitoring." All exposureswhich could exceed 1OCFR20 dose limits shall be approved by the ED.
10CFR20 RADIATION DOSE LIMITS
TEDE, ADULT ANNUAL 5 REM
TODE, ADULT ANNUAL 50 REM
LDE, ADULT ANNUAL 15 REM
SDE, SKIN, ADULT ANNUAL 50 REM
SDE, EXTREMITY, ADULT ANNUAL 50 REM
DAC-HOUR, ADULT ANNUAL 2,000 DAC-HOURS
REFERENCE USE

WISCONSIN PUBLIC SERVICE CORP. No. EPIP-AD-1 I Rev. T
Title Emergency Radiation ControlsKewaunee Nuclear Power Plant
Emergency Plan Implementing Procedure Date JAN 27 2004 Page 3 of 7
EPA RADIATION DOSE GUIDELINES(EPA400)
Projected Dose(rem) to Action/Condition Comments
EmergencyTeam Workers
TEDE < 5 rem Control exposure of emergency workers to "All Other Organs" include:these levels except for those instances listed Skin Extremities and Thyroid.
All Other Organs below. (Appropriate controls for emergency< 50 rem TODE workers include time limitations, respirators, Stable iodine may be made
and stable iodine.) available for use wherepredicted doses exceed 25 rem
TEDE < 10 rem to the thyroid. AlthoughEmergency workers' exposure should be respirators and stable iodine
All Other Organs controlled below these levels when their should be used where effective< 100 rem TODE mission involves protecting valuable property. to control dose to emergency
team workers, thyroid dose
TEDE < 25 rem Emergency workers' exposure should be may not be a limiting factorcontrolled below these levels when their for lifesaving missions.
All Other Organs mission involves life saving or protection of For Environmental/Monitoring< 250 rem TODE large populations. Teams, refer to RASCAL
"Maximum Doses at SelectedTEDE > 25 rem Exposures above these levels to emergency Distances" output screen.
workers will be on a voluntary basis only to Check bone, lung, and thyroidAll Other Organs persons fully aware of the risks involved. doses.> 250 rem TODE
5.1.5 Understand the risks and benefits of taking Potassium Iodide (KI) orally whenradioactive iodine levels warrant taking KI.
5.2 The Emergency Director (ED) is responsible for approving all requests for exposure inexcess of IOCFR20 dose limits and the distribution of Potassium Iodide.
5.3 The Radiological Protection Director (RPD) has the overall responsibility for in-plantpersonnel monitoring and shall:
5.3.1 Ensure that personnel within the protected area are issued the appropriate dosimetry.
REFERENCE USE

iIIi
WISCONSIN PUBLIC SERVICE CORP. No. EPIP-AD-l 1 Rev. T
Title Emergency Radiation ControlsKewaunee Nuclear Power Plant
Emergency Plan Implementing Procedure Date JAN 27 2004 1-Page 4 of 7
5.3.2 Evaluate any potential exposure to radiation in excess of 1 OCFR20 dose limits forapproval by the ED (Form HPF-1 10) in accordance with HP-05.001, "Survey andSampling Techniques." In the absence of the RPD, the ED may authorize anoverexposure after concurrence of the on-shift HP or an In-plant Radiation EmergencyTeam (IRET) member.
5.3.3 In accordance with EPIP-AD-l 8, "Potassium Iodide Distribution," advise the ED onthe need to make thyroid blocking agent (Potassium Iodide, a stable iodine) availableto Emergency Response Organization (ERO) members who may be subject toradioiodine intake.
5.3.4 Review all RWPs and ERWPs in use.
5.3.5 Establish control over radiation, high radiation or contamination areas discoveredoutside the normal RCA when levels are found to exceed the following:
* 2 mr/hr Direct Radiation
* 2,000 DPM/100 cm2 Beta-Gamma
* 200 DPM/100 cm2 Alpha
5.3.5.1 This control may include:
a. Roping off and posting additional areas within the plant
b. Roping off and posting all doors to an entire building
c. Designating and posting the entire PA as RCA
d. Establishing roadblocks in conjunction with the ED and Site ProtectionDirector (SPD), and designating the entire area within the roadblocks as RCA
NoteEmergency response personnel reporting to the plant shall NOT be required to initialtheir R "prior to RCA entry when the RCA is expanded. The R WR shall be initialedprior to making entries at the Radiation Protection Office (RPO) or RadiologicalAccess Facility (RAF). See Step 5.1, for Emergency R UP (ER WIP) requirements.
5.4 The In-Plant Radiation Emergency Team (IRET) is responsible for performing thoseactivities necessary to implement the purpose of this procedure.
5.4.1 Make radiological assessments of all in-plant areas requiring access during anemergency.
5.4.2 Report in-plant radiological conditions to the RPD.
REFERENCE USE

WISCONSIN PUBLIC SERVICE CORP.. No. EPIP-AD-1 1 Rev. TTitle Emergency Radiation Controls
Kewaunee Nuclear Power Plant
Entergency Plan Implemnenting Procedure - Date JAN 27 2004 Page 5 of 7
5.4.3 Determine the projected amount of time in-plant emergency workers will be allowed toremain in any radiation/contaminated area through pre-entry review of:
a. Projected route exposures
b. Measured dose rates and airborne concentrations
c. Personnel exposure history
d. Projected duration of task
e. Information on current plant conditions and the plant area underconsideration
5.4.4 Provide radiation monitoring coverage for all continuously occupied areas.
5.4.5 Perform air sample surveys and direct radiation surveys as directed.
5.4.6 Control exposure to airborne radionuclides in accordance with the following:
a. Use only Self-Contained Breathing Apparatus (SCBA) pressure demandrespirators when entering areas of unknown airborne concentrations.
b. Limit airborne particulate exposures to < 200 DAC-HOURS to themaximum extent possible.
c. Remove any worker from further emergency duties upon exceeding2,000 DAC-HOURS.
d. Assess internal dose by performing whole body counts in accordance withprocedure HP-03.008, "Evaluation of Inhalations or Ingestions."
NoteFor entry teanms originatingfrom the Operational Support Facility (OSF),document the items below (Steps 5.4. 7.a. through Step 5.4.7.h/) onForm EPIPF-OSF-03-01.
5.4.7 Review all planned entries with the entry team members and discuss the following:
a. Potential stress conditions and problems
b. Work methods, work location, and description of task
c. Number of personnel required and access routes inside the RCA
d. Allowable exposure limits, expected doses, stay times
e. Tools, equipment, and parts
f. Lighting
g. Communications requirements
h. Abort instructions
REFERENCE USE

WISCONSIN PUBLIC SERVICE CORP. No. EPIP-AD-1 I Rev. TTitle Emergency Radiation Controls
Kewaunee Nuclear Power Plant
Emergency Plan Implementing Procedure Date JAN 27 2004 Page 6 of 7
5.4.8 As directed, accompany any worker entering an area where radiological conditions areunknown.
5.4.9 Remove any individual who has exceeded IOCFR20 dose limits from work involvingadditional radiation exposure. The worker's exposure record shall be reviewed by theRPD and ED prior to further radiation work. Any further radiation work must beauthorized by the ED.
5.4.10 As directed, store samples collected post accident in designated storage locations.Liquid, air particulate, and halogen filter samples should be stored in the radioactivewaste storage areas of the Auxiliary Building.
6.0 Final Conditions
6.1 Plant Emergency has been Terminated or Recovery actions have begun and the EmergencyResponse Manager has suspended the use of EPIPs.
7.0 References
7.1 Kewaunee Nuclear Power Plant Emergency Plan
7.2 NUREG-0654/FEMA-REP-1, REV. 1, Criteria for Preparation and Evaluation ofRadiological Emergency Response Plans and Preparedness in Support of Nuclear PowerPlants (Nov. 1980)
7.3 EPA-400-R-92-001, Manual of Protective Action Guides and Protective Actions for NuclearIncidents (Oct. 1991)
7.4 1OCFR20, Standards for Protection Against Radiation
7.5 Kewaunee Nuclear Power Plant Health Physics Procedure Manual
7.6 KNPP Commitment Tracking System number 97-125, NRC Inspection Report 97-13, RepairPersonnel
7.7 Implementing Procedures
7.7.1 EPIP-RET-02D, Emergency Radiation Entry Controls and Implementation
7.7.2 NAD-08.03, Radiation Work Permit
7.7.3 EPIP-AD- 18, Potassium Iodide Distribution
7.7.4 EPIP Appendix B, Forms
7.7.5 HP-03.008, Evaluation of Inhalations or Ingestions
REFERENCE USE

WISCONSIN PUBLIC SERVICE CORP. No. EPIP-AD-1 1 Rev. T
Title Emergency Radiation ControlsKewaunee Nuclear Power Plant
Emergency Plan Implementing Procedure Date JAN 27 2004 Page 7 of 7
7.7.6 NAD-0 1.1 1, Dosimetry and Personnel Monitoring
7.7.7 HP-05.001, Survey and Sampling Techniques
8.0 Records
8.1 The following QA records and non-QA records are identified in this directive/procedure andare listed on the KNPP Records Retention Schedule. These records shall be maintainedaccording to the KNPP Records Management Program.
8.1.1 QA Records
* Emergency Radiation Work Permit, Form EPIPF-AD-1 1-01
8.1.2 Non-QA Records
None
REFERENCE USE

WISCONSIN PUBLIC SERVICE CORP.' No. EPIP-AD-19 Rev. T
Title Dctermining Protective ActionKewaunee Nuclear Power Plant Recommendations
Emergency Plan Implementing Procedure Date SEP 19 2003 Page 1 of 9
Reviewed By Dave Shields Approved By Jerrie MorlinoNuclear PORC SRO Approval OfSafety 0 Yes Review 0 Yes Temporary 0 YesRelated 0 No Required El No Changes Required El No
1.0 Purpose
1.1 This procedure provides instructions for determining Protective ActionRecommendations (PARs).
2.0 General Notes
2.1 The Shift Manager is the initial ED in all situations. Any transfer of this responsibility shouldbe documented in the Shift Manager's log and communicated to all other directors.
2.2 Upon declaration of a plant emergency, the Emergency Director (ED) is initially responsibleto provide off-site authorities with Protective Action Recommendations (PARs). When theEmergency Operations Facility (EOQ) has been activated, this responsibility will be assumedby the Emergency Response Manager (ERM). This responsibility shall NOT be delegated.
2.3 To be most effective protective actions must be taken before or shortly after the start of amajor release to the atmosphere. PARs must be determined and communicated as quickly aspossible.
2.4 Communication of PARs should be in progress to state and local emergency governmentauthorities within 15 minutes of the emergency being declared or as soon as possible withoutfurther compromise to plant or public safety.
2.5 As more information becomes available, the most current PAR should be reviewed andrevised, as necessary, in accordance with Section 5.0 of this procedure.
3.0 Precautions and Limitations
3.1 PARs are normally implemented for affected populations within the 10-mile plume exposurepathway EPZ. However, do NOT ignore populations outside the 1 0-mile plume exposurepathway if projected doses or field readings indicate doses > I rem TEDE or > 5 rem thyroid.
3.2 IF there is a PAR change due to a wind shift, THEN the new PAR should include thefollowing as downwind sectors:
3.2.1 All downwind sectors from all previous PARs for this emergency, AND
3.2.2 All downwind sectors from the new PAR, AND
3.2.3 All downwind sectors through which the wind shift occurred.
eAtempplgf2.doc-Christine Simmons/Dod Ziegler-Dan BoucheREFERENCE USE
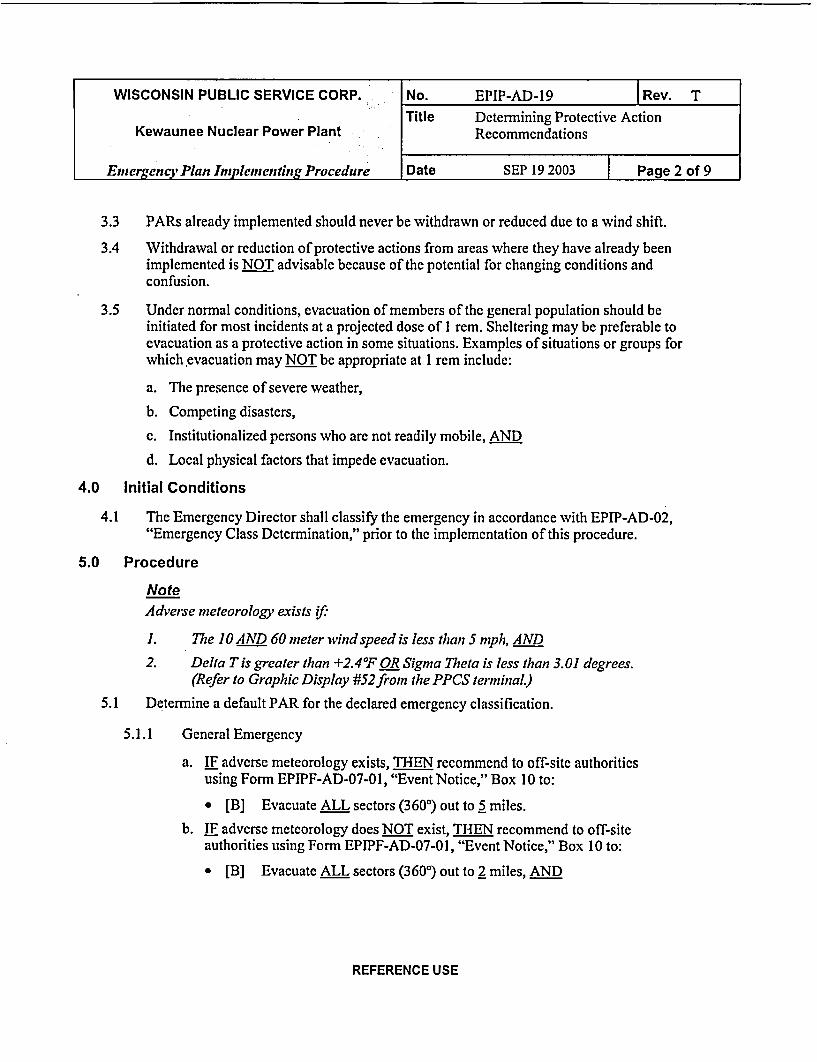
WISCONSIN PUBLIC SERVICE CORP. No. EPIP-AD-19 Rev. TTitle Dctermining Protective Action
Kewaunee Nuclear Power Plant Recommendations
Emergency Plan Implementing Procedure Date SEP 19 2003 Page 2 of 9
3.3 PARs already implemented should never be withdrawn or reduced due to a wind shift.
3.4 Withdrawal or reduction of protective actions from areas where they have already beenimplemented is NOT advisable because of the potential for changing conditions andconfusion.
3.5 Under normal conditions, evacuation of members of the general population should beinitiated for most incidents at a projected dose of I rem. Sheltering may be preferable toevacuation as a protective action in some situations. Examples of situations or groups forwhich evacuation may NOT be appropriate at 1 rem include:
a. The presence of severe weather,
b. Competing disasters,
c. Institutionalized persons who are not readily mobile, AND
d. Local physical factors that impede evacuation.
4.0 Initial Conditions
4.1 The Emergency Director shall classify the emergency in accordance with EPIP-AD-02,"Emergency Class Determination," prior to the implementation of this procedure.
5.0 Procedure
NoteAdverse meteorology exists if.
1. The 10AND 60 meter wind speed is less than 5 mph, AND
2. Delta T is greater than +2.47F OR Sigma Theta is less than 3.01 degrees.(Refer to Graphic Display #52 from the PPCS terminal.)
5.1 Determine a default PAR for the declared emergency classification.
5.1.1 General Emergency
a. IF adverse meteorology exists, THEN recommend to off-site authoritiesusing Form EPIPF-AD-07-0 1, "Event Notice," Box 10 to:
* [B] Evacuate ALL sectors (360°) out to 5 miles.
b. IF adverse meteorology does NOT exist, THEN recommend to off-siteauthorities using Form EPIPF-AD-07-01, "Event Notice," Box 10 to:
* [B] Evacuate ALL sectors (3600) out to 2 miles, AND
REFERENCE USE

WISCONSIN PUBLIC SERVICE CORP. No. EPIP-AD-19 Rev. T
Title Determining Protective ActionKewaunee Nuclear Power Plant Recommendations
Procedure Date Page 3 ofEm1ergency Plan Implemtenting~rcdr Dt SEP 19 2003 | Pae3o9
NoteTo determine sectors in [B] include the downivind sector(s) fromForm EPIPF-AD-07-01 Table 1.
* [B] Evacuate downwind sectors out to 5 miles.
c. Verify that security has implemented EPIP-SEC-02, "Security ForceResponse to Emergencies," to:
* Direct members of the general public (visitors, fisherman, tourists,etc.) to leave the site.
* Establish control measures for site access/egress.
5.1.2 Site Emergency
a. Immediate Planned Protective Action Recommendations fromForm EPIPF-AD-07-0 1, "Event Notice," Box 10 for the general publicare:
* [A] None
b. Verify that security has implemented EPIP-SEC-02, "Security ForceResponse to Emergencies," to:
* Direct members of the general public (visitors, fisherman, tourists,etc.) to leave the site.
* Establish control measures for site access/egress.
5.1.3 Alert
a. Immediate Planned Protective Action Recommendations fromForm EPIPF-AD-07-01, "Event Notice," Box 10 for the generalpublic are:
* [A] None
b. Verify that security has implemented EPIP-SEC-02, "Security ForceResponse to Emergencies," to:
* Direct members of the general public (visitors, fisherman, tourists,etc.) to leave the site.
* Establish control measures for site access/egress.
REFERENCE USE

WISCONSIN PUBLIC SERVICE CORP. No. EPIP-AD-19 Rev. T
Title Determining Protective ActionKewaunee Nuclear Power Plant Recommendations
Einergency Plan Implementing Procedure Date SEP 19 2003 Page 4 of 9
5.1.4 Unusual Event
a. Immediate Planned Protective Action Recommendations fromForm EPIPF-AD-07-0 1, "Event Notice," Box 10 for the general public are:
* [A] None
5.2 Determine a PAR using dose projections results from EPIP-ENV-03C.
NoteA PAR from a dose projection may identify areas of concern beyond IIhe defaultPAR. Any current default PAR should remain in place and be augmented withthe information obtainedfrom the dose projection, as necessary.
NoteDo NOT withdraw or reduce the default PAR based on dose projection results.
5.2.1 Obtain the most recent RASCAL dose projections for TEDE and thyroid doses fromthe Environmental Protection Director (EPD) or the Radiological Protection Director(RPD).
5.2.1.1 Compare the RASCAL dose projection results to EPIP-AD-19 Table 1.
5.2.1.1.1 IF dose projection results meet the criteria in Column 1, THEN determinerecommended protective actions (Column 2) considering the following:
* Plant conditions (past, present, projected)
* Radiological conditions
* Impact time
* Weather (current and forecasted)
* Evacuation time estimates using EPIP-AD-19 Table 2,"Evacuation Time Estimates (KNPP/EPZ)."
5.2.2 Upon determining recommended protective actions, immediately notify the ERM orED.
5.2.3 IF projected doses meet the criteria in EPIP-AD-02 Chart A(1), THEN relay theidentified classification criteria to the ERM or ED immediately.
5.3 Determine a PAR from field radiation dose rate survey results.
5.3.1 Obtain the most recent field radiation dose rate survey results from the EnvironmentalMonitoring Team Coordinator (ENVCd) or RPD.
REFERENCE USE

WISCONSIN PUBLIC SERVICE CORP. No. EPIP-AD-19 Rev. TTitle Determining Protective Action
Kewaunee Nuclear Power Plant Recommendations
Emergency Plan Implementing Procedure Date SEP 19 2003 Page 5 of 9
5.3.2 Determine the receptor exposure dose.
5.3.2.1 IF exposure duration is unknown, THEN multiply the field radiation dose rate fora given point by a default six (6) hours.
Field radiation dose rate x 6 hours = receptor exposure dose
5.3.2.2 IF exposure duration is known, THEN multiply the field radiation dose rate for agiven point times the known exposure duration.
Field radiation dose rate x Known exposure duration = receptor exposure dose
5.3.3 Compare the receptor exposure dose, from Step 5.3.2, to EPIP-AD-1 9, Table 1.
5.3.3.1 IF the receptor exposure dose meets the criteria in Column I, THEN determinerecommended protective actions (Column 2) considering the following:
* Plant conditions (past, present, projected)
* Radiological conditions
* Impact time
* Weather (current and forecasted)
* Evacuation time estimates using EPIP-AD-19 Table 2, "EvacuationTime Estimates (KNPP/EPZ)."
5.3.4 Upon determining recommended protective actions, immediately notify the ERM orED.
5.3.5 IF field radiation dose rate survey results meet the criteria in EPIP-AD-02 Chart A(1),THEN relay the identified classification criteria to the ERM or ED immediately.
5.4 Determine a PAR from air sample or ground deposition sample results.
5.4.1 Obtain the most recent air sample or ground deposition sample results from theEnvironmental Monitoring Team Coordinator (ENVCd) or RPD.
5.4.2 Perform a dose projection as per EPIP-ENV-03C using the air sample or grounddeposition sample results as inputs to the dose projection.
5.4.3 Use dose projection results to perform Step 5.2 of this procedure.
5.5 Complete Form EPIPF-AD-07-01 "Event Notice," to inform off-site authorities of any newlydeveloped or revised/upgraded PAR.
REFERENCE USE

WISCONSIN PUBLIC SERVICE CORP.. No. EPIP-AD-19 Rev. T
Title Determining Protective ActionKewaunee Nuclear Power Plant Recommendations
Emergency Plan Implementing Procedure Date SEP 19 2003 Page 6 of 9
NoteThefollowing step wvill normally be performed only if the State EmergencyOperations Center (EOC) in Madison has been activated.
5.5.1 If appropriate, instruct the State Radiological Coordinator Liaison (SRCL) to discussthe changes or potential changes in PARs with the State Radiological Coordinator(SRC) for the State of Wisconsin.
5.6 Submit the Form EPIPF-AD-07-0 1 "Event Notice," to the appropriate Communicator fortransmission to off-site authorities.
5.7 IF dose projections indicate a potential dose to the thyroid of > 25 rem, THEN verify"Potassium Iodide Distribution," EPID-AD-18, is being implemented.
5.8 IF dose projections or field readings indicate doses > I rem TEDE or > 5 rem thyroid to anypopulation outside of the I 0-mile plume exposure pathway EPZ, THEN report thisimmediately to the State and counties and if requested, provide assistance with ad hocplanning.
5.9 Repeat Steps 5.1, 5.2, 5.3, and 5.4 until the Final Conditions are met, see Section 6.0.
6.0 Final Conditions
6.1 Additional Protective Action Recommendations are no longer required when the plantemergency has been Terminated or Recovery Actions have begun and the responsibleDirector has suspended the use of EPIPs.
REFERENCE USE
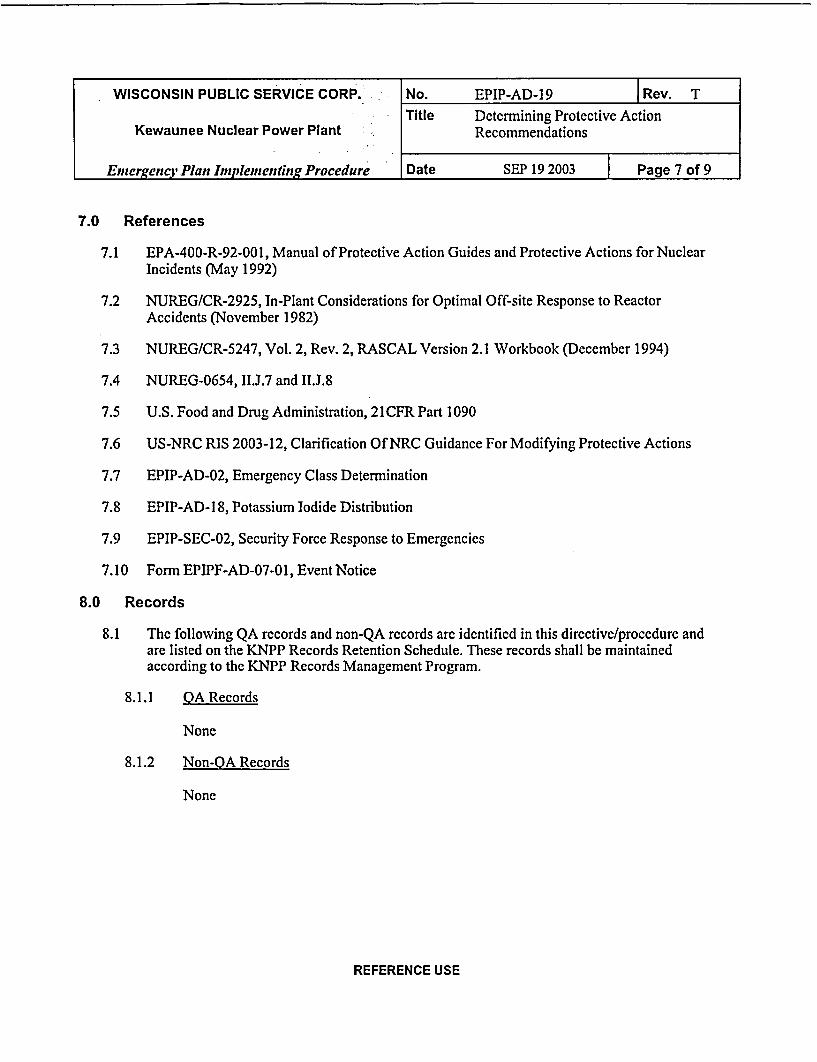
WISCONSIN PUBLIC SERVICE CORP. - No. EPIP-AD-9 Rev. TTitle Determining Protective Action
Kewaunee Nuclear Power Plant Recommendations
Emergency Plan Implementing Procedure Date SEP 19 2003 Page 7 of 9
7.0 References
7.1 EPA-400-R-92-001, Manual of Protective Action Guides and Protective Actions for NuclearIncidents (May 1992)
7.2 NUREG/CR-2925, In-Plant Considerations for Optimal Off-site Response to ReactorAccidents (November 1982)
7.3 NUREG/CR-5247, Vol. 2, Rev. 2, RASCAL Version 2.1 Workbook (December 1994)
7.4 NUREG-0654, ll.J.7 and IH.J.8
7.5 U.S. Food and Drug Administration, 21CFR Part 1090
7.6 US-NRC RIS 2003-12, Clarification Of NRC Guidance For Modifying Protective Actions
7.7 EPIP-AD-02, Emergency Class Determination
7.8 EPIP-AD-1 8, Potassium Iodide Distribution
7.9 EPIP-SEC-02, Security Force Response to Emergencies
7.10 Form EPIPF-AD-07-01, Event Notice
8.0 Records
8.1 The following QA records and non-QA records are identified in this directive/procedure andare listed on the KNPP Records Retention Schedule. These records shall be maintainedaccording to the KNPP Records Management Program.
8.1.1 QA Records
None
8.1.2 Non-QA Records
None
REFERENCE USE

Column I Column 2 Column 3PROJECTED DOSE (RENM) TO RECOMMENDED ACTIONS(a) COMMENTS
THE POPULATION
TEDE < I rem No planned protective actions.(b) If the conditions of Section 6.0 aresatisfied, previously recommended
Thyroid < 5 Rem Monitor environmental radiation protective actions may belevels. reconsidered.
TEDE > I rem Recommend evacuation in affected Seeking shelter would be ansectors. Monitor environmental alternative if evacuation were not
Thyroid > 5 rem radiation levels and adjust sectors immediately possible. 0)recommended for evacuation basedon these levels. Control access.
Column 1 Column 2 Column 3PROJECTED DOSE (REM) TO RECOMMENDED ACTIONS(d) COMMENTS
EMERGENCY TEAM WORKERS
TEDE < 5 rem Control exposure of emergency "All other Organs" include: skinworkers to these levels except for extremities and thyroid.
All other Organs < 50 rem TODE those instances listed below.(Appropriate controls for Stable iodine may be madeemergency workers include time available for use where predictedlimitations, respirators, and stable doses exceed 25 rem to the thyroid.iodine.) Although respirators and stable
iodine should be used whereTEDE < 10 rem Emergency workers exposure effective to control dose toshould be controlled below these efciet oto oet
All other Organs < 100 rem TODE levels when their mission involves emergency team workers, thyroidprtcigvaluable property. dose may not be a limiting factor
protecting vfor lifesaving missions.TEDE < 25 rem Emergency workers exposure
should be controlled below these For Environmental/MonitoringAll other Organs < 250 rem TODE levels when their mission involves Teams, refer to RASCAL
lifesaving or protection of large "Maximum Doses at Selectedpopulations. Distances" output screen. Check
bone, lung, and thyroid doses.
() These actions are recommended for planning purposes. Protective action decisions at the time of the incident musttake existing conditions into consideration. These conditions include containment activity, probability ofcontainment failure, plume transport time, release duration, and any other pertinent conditions.
(1) At the time of the incident, officials may implement low-impact protective actions in keeping with the principle ofmaintaining radiation exposures as low as reasonably achievable.
(c) Sheltering may be the preferred protective action when it will provide protection equal to or greater thanevacuation, based on consideration of factors such as source term characteristics, and temporal or othersite-specific conditions.
(d) These actions are recommended for planning purposes. Protective action decisions at the time of the incident musttake existing conditions into consideration. These conditions include containment activity, probability ofcontainment failure, plume transport time, release duration, and any other pertinent conditions.
Table 1 EPIP-AD-19 Rev. T Date: SEP 19 2003 Page 8 of 9
REFERENCE USE

EVACUATION TIME ESTIMATES (KNPP/EPZ)
1 - 2 3 ;4 .; 5 6 7 8 9
Total| -v. Travel NotiL. Plan Ttl -SevereArea, Total Route Av. Ta~l Ntf ln Evac. SvrSectors Speed Tme Time Time Weather(Pp)Vehicles (Miles) 'ph) (m m )(m Time (m )Enimn.):
2 All 64 Hwy.42 50 6 15 30 51 72(203) (4.75)
SN m,n,p,q, 89 Co. Tk. B 50 4 15 30 49 68(700) r,a,b (3)
130 Hwy.42 45 11 15 30 56 82(7.75)
5S j,k,l,m 47 Co. Tk. AB 50 4 15 30 49 68(585) (3)
136 Hwy.42 50 5 15 30 50 70(4)
ION ra,b 222 Co. Tk. B 45 6 15 30 51 72(3559) (4.5)
890 Hwy.42 50 9 15 30 54 78(7)
lONW p,qr 89 Co. Tk. B 45 6 15 30 51 72(530) (4.5)
77 Co. Tk. AB 50 3 15 30 48 66(2.5)
lOW n,p,q 84 Co. Tk. Q 45 6 15 30 51 72(803) (4)
167 Co. Tk. AB 50 11 15 30 56 82(8.5) _
|OSW I,m,n 455 Co. Tk. Q 45 6 15 30 51 72(1456) (4)
lOSSW k,l 92 Co. Tk. Q 45 6 15 30 51 72(2029) (4)
542 Co. Tk. AB 50 7 15 30 52 74(5.25) ___
lOS j,k 207 Hwvy.42 50 7 15 30 52 74(663) _ (5.25) .
December2, 1993
Table 2 EPIP-AD-19 Rev. T Date: SEP 19 2003
REFERENCE USE
Page 9 of 9

WISCONSIN PUBLIC SERVICE CORP. No. EPIP-RET-02B Rev. T
Title Gaseous Effluent Release Path,Kewaunee Nuclear Power Plant Radioactivity, and Release Rate
Determination
Emergency Plan Implementing Procedure Date SEP 19 2003 Page 1 of 16
Reviewed By Dan Bouche Approved By Jerrie MorlinoNuclear D Yes PORC 0 Yes SRO Approval Of 0 YesSafety Review TemporaryRelated El No Required 0 No Changes Required El No
1.0 Purpose
1.1 This procedure provides instruction for identifying the release path of radioactive gaseouseffluents, to ensure that appropriate effluent samples are taken and appropriate monitorreadouts are recorded, in order to quantify the release and provide input data for plumeprojection calculations.
2.0 General Notes
2.1 This procedure is used whenever radiological data is required to perform computerized doseprojections per EPIP-ENV-03C, "Dose Projection Using Rascal Software."
2.2 The reference by HP effluent procedures to a four digit numeric value representing theSPING address and channel, directly relates to the address/channel numbers on the SPINGCT unit. The first two digits refers to the address and the last two digits refer to the channel.
2.3 DNA (Distributed Network Architecture) is the name of the software used by RADSERV.
3.0 Precautions and Limitations
3.1 An Emergency Radiation Work Permit (ERWP) may be required as per EPIP-AD-1 1,"Emergency Radiation Controls" Step 4.1, for sampling within the Zone SV due to highairborne concentrations or other radiological concerns.
4.0 Initial Conditions
4.1 This procedure shall be implemented upon declaration of an Alert, Site Emergency,General Emergency, or when directed by the Radiological Protection Director.
e:\temp\pIg1ee.doc-Dori Ziegler/Dod Ziegler-Rick AdamsREFERENCE USE

WISCONSIN PUBLIC SERVICE CORP. No. EPIP-RET-02B Rev. TTitle Gaseous Effluent Release Path,
Kewaunee Nuclear Power Plant Radioactivity, and Release RateDetermination
Emergency Plan Implementing Procedure Date SEP 19 2003 Page 2 of 16
5.0 Procedure
NoteTable 5 is aflow chart of the steps in this procedure.
5.1 IDENTIFY THE RELEASE PATH by monitoring the following indications:
5.1.1 Auxiliary Building Stack Release
a. R-13cpmb. R-14 cpmc. R-22 cpmd. R-35 mR/hre. R-36 Rhrf. SPING 01
1. 01-05 gCi/cc2. 01-07 cpm3. 01-09 cpm
5.1.2 Containment Stack Release
a. R-ll cpmb. R-12 cpmc. R-21 cpmd. R-37 mR/hre. R-38 Rlhrf. SPING 02
1. 02-05 pCi/cc2. 02-07 cpm3. 02-09 cpm
5.1.3 Steam Line Release
a. R-15cpmb. R-l9 cpmc. IA Steam Line
1. R-31 mR/hr2. R-32 Rlhr
d. IB Steam Line1. R-33 mR/hr2. R-34 R/hr
REFERENCE USE

WISCONSIN PUBLIC SERVICE CORP. No. EPIP-RET-02B Rev. T
Title Gaseous Effluent Release Path,Kewaunee Nuclear Power Plant Radioactivity, and Release Rate
Determination
Entergency Plan Implementing Procedure Date SEP 19 2003 Page 3 of 16
5.2 DETERMINE THE APPROPRIATE SAMPLE POINT for the release path identified.
NoteIF it is NOT possible to obtain in-plant grab samples for any reason, THEN godirectly to Step 5. 7.
5.2.1 Auxiliary Building Stack Release
a. R-13 orR-14 (657')- Step 5.4
b. Auxiliary SPING (642') - Step 5.5
5.2.2 Containment Stack Release
a. R-11/12 (657) - Step 5.4
b. R-21 (657') - Step 5.4
c. Cont. SPING (642') - Step 5.5
5.2.3 Steam Relief's Release - go to Step 5.6
5.3 PRESAMPLE PREPARATION
5.3.1 Follow the instructions in Procedure EPIP-RET-02D, "Emergency Radiation EntryControls and Implementation" for entries into the controlled area.
5.3.2 Obtain the following equipment:
a. Marinelli Beaker
b. Particulate Filter Papers
c. Silver Zeolite Cartridges
d. Gas Syringes (10 cc, I cc, 0.1 cc)
REFERENCE USE

WISCONSIN PUBLIC SERVICE CORP. No. EPIP-RET-02B TRev. T
Title Gaseous Effluent Release Path,Kewaunee Nuclear Power Plant Radioactivity, and Release Rate
Determination
Emergency Plan Implementing Procedure Date SEP 19 2003 Page 4 of 16
IF radiation monitor R-35 reads greater than l OOOmnRRr, THEN discontinuesampling both the containment stack at R-J 1/12 or R-21 and the Auxiliary Buildingstack at the R-13 or R-14 sample locations on the 657 'elevation of the AuxiliaryBuilding.
NoteUse Silver Zeolitefilters for sampling for iodine radioisotopes.
5.4 OBTAIN AUXILIARY BUILDING OR CONTAINMENT STACK RELEASE DATA BYGRAB SAMPLE
5.4.1 Containment Stack Release
a. If required, obtain grab sample from R-21 or R-l 1/12 for the determinationof the effluent isotopic mixture.
b. Record the sample analysis conditions and results on Form EPIPF-RET-02B-0 1.
c. Calculate the total flow rate (cc/sec) by adding the operating fan flow ratesat the top of Form EPIPF-RET-02B-01.
d. Calculate the release rate (Ci/sec) for each isotope by multiplying therelease concentration (pCi/cc) by total fan flow rate (cc/sec) and by I 0-6(Ci/p.Ci). Record the results on Form EPIPF-RET-02B-01.
e. Transmit completed Form EPIPF-RET-02B-0I to the RadiologicalProtection Director (RPD) or Environmental Protection Director (EPD) forreview and/or input to dose projection using EPIP-ENV-03C.
5.4.2 IF grab samples are required from the Auxiliary Building stack for determination of theeffluent isotopic mixture, THEN collect the samples at either the R-13 or R-14 samplerlocated on the 657' elevation of the Auxiliary Building. Use normal samplingprocedures HP-05.004, "Radiation/Contamination Survey and Airborne RadioactivitySampling Schedules," and HP-05.020, "Counting of High Activity Samples," forsampling the Auxiliary Building stack.
REFERENCE USE

WISCONSIN PUBLIC SERVICE CORP. No. EPIP-RET-02B Rev. T
Title Gaseous Effluent Release Path,Kewaunee Nuclear Power Plant Radioactivity, and Release Rate
Determination
Emergency Plan Implementing Procedure Date SEP 19 2003 Page 5 of 16
5.4.3 Calculate a Radiological Release Rate for an Auxiliary Building Stack Release.
a. Record the sampling analysis on Form EPIPF-RET-02B-02.
b. Calculate the total flow (cc/sec) by adding the operating fan flow rates atthe top of Form EPIPF-RET-02B-02.
NoteUse back ofform for alternate methods of calculating tihe totalfan flowv rate forthe Auxiliary Building.
c. Calculate the release rate (Ci/sec) for each isotope by multiplying therelease concentration (pCi/cc) by the total fan flow rate (cc/sec) and by 10.6(Ci/pCi). Record the results on Form EPIPF-RET-02B-02.
5.4.4 Transmit completed Form EPIPF-RET-02B-02 to RPD or EPD for review and/or inputto dose projection using EPIP-ENV-03C.
5.5 OBTAIN AUXILIARY BUILDING or CONTAINMENT STACK RELEASE DATAFROM SPING (if required).
NoteSPING 01 designates Auxiliary Building Stack (See Form EPIPF-RET-02B-03).SPING 02 designates Containment Stack (See Form EPIPF-RET-02B-04).
5.5.1 Calculate the Total Stack Flow Rate using Form EPIPF-RET-02B-03 and/orForm EPIPF-RET-02B-04.
5.5.2 Noble Gas Release
a. View the current value of the Low, Medium, and High Range Gas channels(0105 or 0107 or 0109 for Auxiliary Building).Gas channels (0205 or 0207 or 0209 for Containment).
b. Select which channel to use based on the channel status information.Do NOT use a channel in the "FAIL HI" condition.
c. The Low Range Gas Channel (0105 or 0205) reads in JpCi/cc. IF thischannel is used to determine the release, THEN go to Step 5.5.2.e tocalculate the noble gas release rate.
d. The mid (0107 or 0207) and high (0109 or 0209) range channels read out incpm.
Convert the cpm reading obtained in "a" above to ItCi/cc soup using theconversion tables attached to the SPING-4 consoles (See Table 3 orTable 4).
REFERENCE USE

WISCONSIN PUBLIC SERVICE CORP. No. EPIP-RET-02B Rev. TTitle Gaseous Effluent Release Path,
Kewaunee Nuclear Power Plant Radioactivity, and Release RateDetermination
Energency Plan Implementing Procedure Date SEP 19 2003 Page 6 of 16
e. Multiply the concentration in j±Ci/cc by the stack flow rate in cc/sec and by10.6 Ci/ACi to determine the NOBLE GAS RELEASE RATE (Ci/sec).
5.5.3 Iodine Release Data
a. Identify the start of the release from the DNA history plot from theRADSERV control terminal.
Calculate the sample volume (X) x (Y) = Z
X = Time from start of release to either present time or toknee of plateau (maximum printout value)in minutes.
Y = Flow of the sample pump (4.5E + 4 cc/min)
Z = Total volume in (cc)
b. Enter this on Form EPIPF-RET-02B-03 or EPIPF-RET-02B-04.
c. Determine iodine release concentration (jiCi/cc) by dividing the maximumvalue from the history printout (pCi) by the sample volume in Step 5.5.3.a.
d. Enter this on Form EPIPF-RET-02B-03 or EPIPF-RET-02B-04.
e. Determine the iodine release rate (Ci/sec) by multiplying the iodine releaseconcentration (pCi/cc) by the total flow rate (cc/sec) and by 10-6 Ci/pCi.
5.5.4 Calculate and record the total (gross) release rate (Ci/sec) by adding the Noble GasRelease Rate (5.5.2.e) and the Iodine Release Rate (5.5.3.e) on Form EPIPF-RET-02B-03for Auxiliary Building and/or Form EPIPF-RET-02B-04 for containment.
5.5.5 Calculate and record the % Noble Gas and/or % Iodine by following equation:
Noble Gas or lodine Release Rate x 100=%NGorITotal Release Rate
5.5.6 Transmit completed Form EPIPF-RET-02B-02 to the RPD or EPD for review and/orinput to dose projection using EPIP-ENV-03C.
REFERENCE USE

WISCONSIN PUBLIC SERVICE CORP. No. EPIP-RET-02B Rev. T
Title Gaseous Effluent Release Path,Kewaunee Nuclear Power Plant Radioactivity, and Release Rate
Determination
Energency Plait Inplementing Procedure Date SEP 19 2003 Page 7 of 16
5.6 OBTAIN STEAM LINE RELIEF VALVE RELEASE DATA
5.6.1 Contact the Technical Support Center for the release path (valves open). Determine theSteam Line Monitor readings. Record reading on Form EPIPF-RET-02B-05 (X value).
5.6.2 Select the proper calibration factor from Table 2, based on T=0 being the time of thereactor trip, to calculate the gross release concentration. Record calibration factor onForm EPIPF-RET-02B-05 (Y value).
5.6.3 Contact the Technical Support Center for steam release flow rate calculationresults in cc/sec, per Form EPIPF-TSC-08A-04. Record steam flow rate onForm EPIPF-RET-02B-05 (Z value).
5.6.4 Refer to EPIP-RET-05, "Site Boundary Dose Rates During Controlled PlantShutdown" for additional information when the power operated relief valves are usedfor plant cooldown.
5.6.5 Calculate release concentration ([tCi/cc) using equation on Form EPIPF-RET-02B-05.
5.6.6 Calculate release rate (Ci/sec) using equation on Form EPIPF-RET-02B-05.
5.6.7 Transmit completed Form EPIPF-RET-02B-05 to RPD or EPD for review and/or inputto dose projection using EPIP-ENV-03C.
5.7 OBTAIN FIELD SAMPLES (if required)
5.7.1 IF it is impossible or impractical to obtain in-plant grab samples as previouslydescribed, THEN actual grab samples in the field taken in the downwind plume willbe required.
5.7.2 Inform the EPD of the need for field grab samples and to coordinate this task.
5.7.3 Field samples collected by the Environmental Monitoring (EM) Teams are ultimatelydelivered to the plant for counting and isotopic analysis.
5.7.4 Record field sample analysis results on Form EPIPF-RET-02B-06, and attach allsample results.
5.7.5 Transmit completed Form EPIPF-RET-02B-06 and attachments to RPD or EPD forreview and/or input to dose projection using EPIP-ENV-03C.
6.0 Final Conditions
6.1 Plant Emergency has been Terminated or Recovery actions have begun and the EmergencyResponse Manager has suspended the use of EPIPs.
REFERENCE USE

WISCONSIN PUBLIC SERVICE CORP. No. EPIP-RET-02B Rev. TTitle Gaseous Effluent Release Path,
Kewaunee Nuclear Power Plant Radioactivity, and Release RateDetermination
Emergency Plan Implementing Procedure Date SEP 19 2003 Page 8 of 16
7.0 References
7.1 COMTRAKS 89-028, 89-207, 89-208, and PLS 84-005
7.2 EPIP-AD-I 1, Emergency Radiation Controls
7.3 EPIP-AD-18, Potassium Iodide Distribution
7.4 EPIP-ENV-03C, Dose Projection Using RASCAL Softvare
7.5 EPIP-RET-02D, Emergency Radiation Entry Controls and Implementation
7.6 EPIP-RET-05, Site Boundary Dose Rates During Controlled Plant Cooldown
7.7 Form EPIPF-TSC-08A-04, Steam Release Data/Calculation Sheet (STMRLS Program)
7.8 HP-05.004, Radiation/Contamination Survey and Airborne Radioactivity SamplingSchedules
7.9 HP-05.018, SPING-4 Filter Change-Post-Accident
7.10 HP-05.020, Counting of High Activity Samples
7.11 HP-05.017, RADSERV Control Terminal
REFERENCE USE
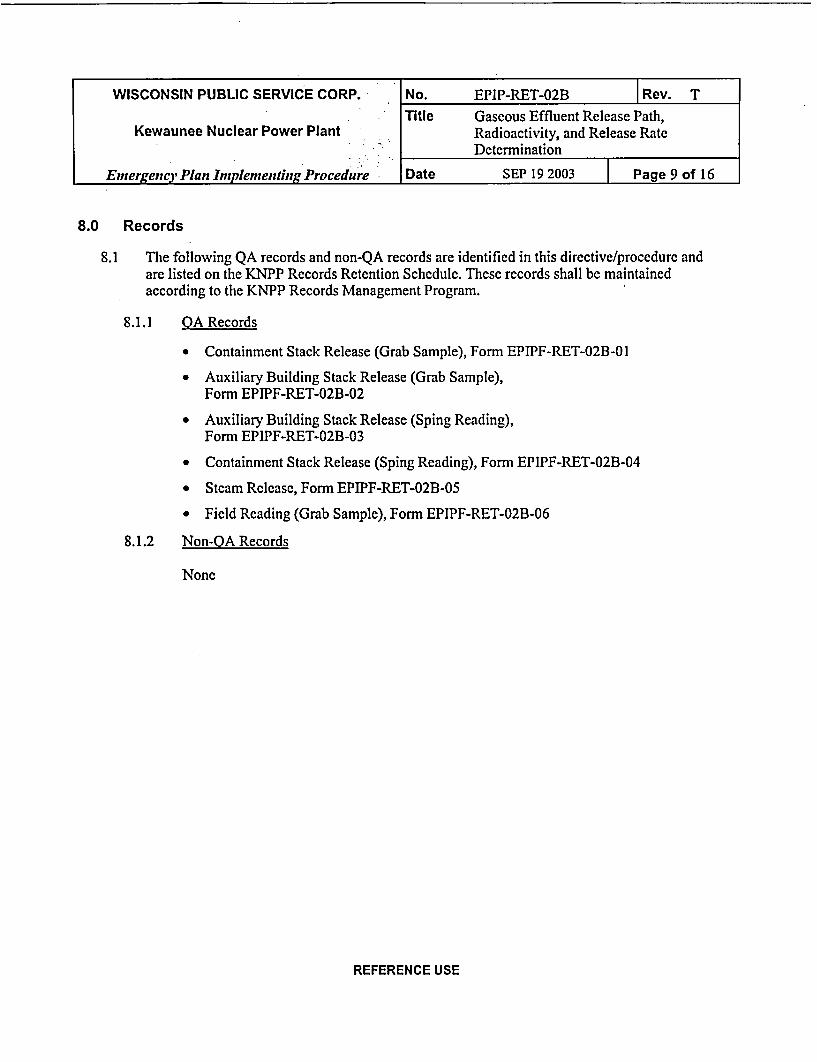
WISCONSIN PUBLIC SERVICE CORP. No. EPIP-RET-02B Rev. T
Title Gaseous Effluent Release Path,Kewaunee Nuclear Power Plant Radioactivity, and Release Rate
Determination
Emergency Plan Implementing Procedure Date SEP 19 2003 Page 9 of 16
8.0 Records
8.1 The following QA records and non-QA records are identified in this directive/procedure andare listed on the KNPP Records Retention Schedule. These records shall be maintainedaccording to the KNPP Records Management Program.
8.1.1 QA Records
* Containment Stack Release (Grab Sample), Form EPIPF-RET-02B-01
* Auxiliary Building Stack Release (Grab Sample),Form EPIPF-RET-02B-02
* Auxiliary Building Stack Release (Sping Reading),Form EPIPF-RET-02B-03
* Containment Stack Release (Sping Reading), Form EPIPF-RET-02B-04
* Steam Release, Form EPIPF-RET-02B-05
* Field Reading (Grab Sample), Form EPIPF-RET-02B-06
8.1.2 Non-QA Records
None
REFERENCE USE

ISOTOPE NORMALIZATION FACTOR
fi
ISOTOPES TIME SINCE REACTOR TRIP
I0.0 0.5 1.0 2.0 8.0 DA INTE IA1NHHOUR HOUR HOUR HOURS HOURS 1 DAY I WEEK 1 NTH
1. KR-83M 0.0171 .0.02340 0.02470 0.02130 0.00643 0.00010 -0- -0-
2. KR-85 0.0010 0.00148 0.00167 0.00148 0.00231 0.00280 0.00690 0.1230
3. KR-85M 0.0383 0.05460 0.05730 0.05330 0.02670 0.02650 -0- -0-
4. KR-87 0.0705 0.08580 0.07140 0.04550 0.00218 -0- -0- -0-
5. KR-88 0.1010 0.13300 0.13200 0.11600 0.03280 0.00077 -0- -0-
6. KR-89 0.1210 0.00027 -0- -0- -0- -0- -0- -0-
7. XE-131M 0.0010 0.00156 0.00167 0.00184 0.00231 0.00280 0.00545 0.0350
8. XE-133 0.2670 0.41300 0.46700 0.51400 0.64300 0.75200 0.94400 0.8410
9. XE-133M 0.0408 0.06320 0.07140 0.07750 0.09350 0.09810 0.04360 0.0065
10. XE-135 0.0605 0.09360 0.11500 0.13600 0.17000 0.11200 -0- -0-
11. XE-135M 0.0554 0.04450 0.03610 0.03200 0.02060 0.00471 -0- -0-
12. XE-138 0.2270 0.08580 0.02200 0.00126 -0- -0- -0- -0-
12X fi (DF) I 7.2400 4.26800 3.54200 2.93000 1.26800 0.57730 0.33040 0.2887I=1
Table 1 EPIP-RET-02B Rev. T Date: SEP 19 2003
REFERENCE USE
Page 10 of 16

GROSS RELEASE RATE DETERMINATION FOR STEAM RELEASES
GROSS RELEASE RA TE
X x Y xZx10 6 lo-, ci = Ci/sec
WHERE: X = Steam Header Monitor Reading ( R )
Y = Calibration Factor (i/cc
Z = Flow Rate (ccA Tec T
CALIBRATION FACTOR TABLE
TIME (SINCE REACTOR TRIP) /Ci/'ccR /hr
-0- 14.5
I HOUR 16.7
2 HOURS 20.3
4 HOURS 30.4
8 HOURS 67.9
1 DAY 887
1 WEEK 3.08 x 10⁴
1 MONTH 1.93 x 10⁴
Table 2 EPIP-RET-02B Rev. T Date: SEP 19 2003 Page 11 of 16
REFERENCE USE

MID RANGE
SPING MID-RANGE CPM TO pCi/cc SOUP
TIME 1 II IAFTER RX 0.0 HOUR 0J HOUR 1.0 hIOUR 2.0 HOURS 8.0 HOURS 24 IIOURS I NEK I bMONTH
TRIP hOUR
MPID-RANGE c pCi/c pi pci/cc pCi/cc l.Ci/cc pCi/cc - Ci/ccI.OOE + 01
2.OOE + 01
3.00E + 01
4.00E + 01
5.00E+01
6.00E+01
7.OOE + 01
8.OOE+01
9.OOE+01
l.OOE + 02
2.0OE + 02
3.OOE + 02
4.00E+02
5.00E+02
6.OOE + 02
7.00E+02
8.00E + 02
9.0OE + 02
.OOE + 03
2.00E + 03
3.00E + 03
4.00E + 03
5.00E + 03
6.00E + 03
7.00E + 03
8.00E + 03
9.00E + 03
1.00E + 04
2.00E + 04
3.00E + 04
4.00E + 04
5.00E + 04
6.00E + 04
7.00E + 04
8.00E + 04
9.00E + 04
I.WE + 05
2.00E + 05
3.00E + 05
4.00E + 05
5.00E + 05
6.00E + 05
7.00E + 05
8.00E + 05
9.00E + 05
1.00E + 06
7.40E -04
1.4SE- 03
2.22E - 03
2.96E - 03
3.70E - 03
4.44E - 03
5.18E . 03
5.92E 2 03
6.66E -03
7AoE 4 03
1.4SE -02
2.22E . 02
2.96E - 02
3.70E - 02
4.44E - 02
5.1SE - 02
5.92E - 02
6.66E - 02
7AOE - 02
IA8E.-01
2.22E - 01
2.96E - D0
3.70E - 01
4.44E- 01
5.1BE - 01
5.92E - 01
6.66E - 01
7.40E - 01
1.48E + 00
2.22E + 00
2.96E + 00
3.70E + 00
4.44E + 00
5.1SE+ 00
5.92E + 00
6.66E + 00
7.40E + 00
1.4SE + 01
2.22E + 01
2.96E + 01
3.70E + 01
4.44E + 01
5.19E + 01
5.92E+ 01
6.66E + 01
7.40E + 01
1.30E - 03
2.60E - 03
3.90E-03
5.20E - 03
6.50E - 03
7.80E - 03
9.10E - 03
1.04E - 02
1.17E - 02
1.30E - 02
2.60E - 02
3.90E - 02
5.20E - 02
6.50E - 02
7.80E -02
9.10E - 02
1.04E - 01
1.17E - 01
1.30E - 01
2.60E-01
3.90E-01
5.20E-01
6.50E-01
7.80E-01
9.10E - 01
1.04E + O0
1.17E+00
1.30E + 00
2.60E + 00
3.90E + 00
5.20E + 00
6.50E + 00
7.802 + 00
9.10E + 00
1.04E+ 01
1.17E + 01
1.30E+01
2.60E + 01
3.90E + 01
5.20E + 01
6.50E + 01
7.80E + 01
9.102 + 01
1.04E + 02
1.17E+02
1.30E + 02
.SOE - 03
3.00E - 03
4.50E - 03
6.00E - 03
7.50E- 03
9.00E - 03
1.05E - 02
1.20E - 02
1.35E - 02
1.50E - 02
3.00E - 02
4.502 - 02
6.002 - 02
7.50E - 02
9.00E - 02
1.05E-01
1.20E -01
135E -01
1.50E - 01
3.00E- 01
4.50E -01
6.00E -01
7.50E - 01
9.00E - 01
1.05E + 00
1.20E+00
1.35E+00
1.50E + 00
3.00E + 00
4.50E + 00
6.00E + 00
7.50E + 00
9.00E + 00
1.05E + 01
1.20E + 01
1.35E + 01
1.50E + 01
3.00E + 01
4.50E + 01
6.OOE + 01
7.50E + 01
9.DO2 + 01
1.05E + 02
1.20E + 02
1 35E+ 02
I.50E + 02
1.0E - 03
3.60E - 03
5.40E - 03
7.20E -03
9.00-E 03
1.08E - 02
1.26E - 02
1.44E - 02
1.62E - 02
.SOE - 02
3.60E - 02
5.40E - 02
720E - 02
9.00E - 02
1.0E - 01
1.26E - 01
1.44E-01
1.62E -01
I.SOE -01
3.60E - 01
5.40E - 01
7.20E - 01
9.WE - 01
1.0IE + 00
1.26E + 00
1.44E + 00
1.62E + 00
1.80 + 00
3.60E + 00
5AOE + 00
720E + 00
9.00E + 00
l.OSE+ 01
1.26E + 01
1A4E+ 01
1.62E + 01
1.SOE + 01
3.60E + 01
5.40E + 01
7.20E + 01
9.00E + 01
1.01E + 02
1.26E + 02
1.44E + 02
1.62E + 02
1.80E + 02
4.20E - 03
1.40E - 03
1.26E - 02
1.68E-02
2.10E-02
2.25E - 02
2.94E-02
3.36E - 02
3.71E - 02
4.20E - 02
S.40E -02
1.26E -01
1.6SE - 01
2.10E- 01
2.25E- 01
2.94E - 01
3.36E - 01
3.7SE - 01
4.20E - 01
8.40E - 01
126E + 00
1.6SE + 00
2.10E+ 00
2.25E + 00
2.94E + 00
3.36E + 00
3.78E + 00
4.20E + 00
8.40E + 00
1.26E+ 01
1.6SE + 01
2.10E + 01
2.25E+ 01
2.94E+01
3.36E + 01
3.78E+ 01
4.20E + 01
8.40E + 01
1.26E + 02
1.68E + 02
2.1 0E + 02
2.25E + 02
2.94E + 02
3.36E + 02
3.7SE + 02
4.20E + 02
9.30E-03
1.86E - 02
2.79E - 02
3.72E - 02
4.65E -02
5.5SE -02
6.51E - 02
7.44E -02
8.37E - 02
9.30E - 02
1.S6E - 01
2.79E -0 1
3.72E -01
4.65E - 01
5.5E - 01
6.51E - 01
7.44E - 01
S.37E- 01
9.30E - 01
1.6E + 00
2.79E + 00
3.72E + 00
4.65E + 00
5.51E + 00
6.51E+00
7.E2+ 00
8.37E + 00
9.30E + 00
1.6E + 01
2.79E + 01
3.72E + 01
4.65E + 01
5.5E + 01
6.51E+ 01
7.44E+ 01
S.37E+ 01
9.30E + 01
1.86E + 02
2.79E + 02
3.72E + 02
4.65E + 02
5.51E + 02
6.51E+ 02
7.44E + 02
8.37E + 02
9.30E + 02
1.60E - 02
3.20E - 02
4.80E - 02
6.40E - 02
8.00E - 02
9.60E - 02
1.12E- 01
12SE -01
1.44E -01
1.60E - 0 1
3.20E - 01
4.80E - 01
6.40E - 01
8.00E- 01
9.60E - 01
1.12E + 00
1.28E+ 00
1.44E + 00
1.60E + 00
3.20E + 00
4.80E + 00
6.40E + 00
8.00E + 00
9.60E + 00
1.12E + 01
21SE+ 01
I4E + 01
1.60E + 01
320E + 01
4.10E + 01
6.40E + 01
8.00E + 01
9.60E + 01
1.12E + 02
1.2SE + 02
1.44E + 02
1.60E + 02
3.20E + 02
4.80E + 02
6.40E + 02
8.00E + 02
9.60E + 02
1.1 2E + 03
I.2SE + 03
1.44E + 03
1.60E + 03
1.90E - 02
3.80E - 02
5.70E - 02
7.60E - 02
9.50E 2 02
1.14E -01
133E -01
1.52E - 01
1.71E - 01
1.90E - 01
3.80E - 01
5.70E - 2 1
7.60E - 01
9.50E - 01
1.14E + 00
1.33E+00
1.52E+00
1.71E + 00
1.90E + 00
3.10E + 00
5.70E + 00
7.60E + 00
9.50E + 00
I.14E + 01
1.33E+0I
1.52E + 01
1.71E + 01
1.90E+02
3.10E + 01
5.702 + 01
7.60E + 01
9.50E+02
1.14E+ 02
1.33E + 02
1.52E + 02
1.71E+ 02
1.90E + 02
3.10E + 02
5.70E + 02
7.60E + 02
9.50E + 02
1.14E + 03
1.33E + 03
2.52E + 03
1.71E + 03
1.90E + 03_ _ _. ._ _ _ .L
Table 3 EPIP-RET-02B Rev. T Date: SEP 19 2003 Page 12 of 16
REFERENCE USE

HIGH RANGE
SPING HIGH RANGE CPMI TO pCi/cc SOUP
RXTTRIP T IOUR 0.5 IIOUR 1.0 IOUR 2.0HOIURS 8.0IOURS 2411OURS I jNTEK I MONTH1GI-RANGE pU I I l lr111-AG A±Ci/cc I pCi/cc ~ I Ci/cc 1 C/c pic ~ /cpicic
L.OOE+0I
2.00E+ 01
3.00E+01
4.00E + 01
5.0OE+ 01
6.O0E+01
7.00E + 01
8.00E+ 01
9.00E+ 01
I .OOE + 02
2.OOE + 02
3.00E + 02
4.00E + 02
S.OOE + 02
6.OOE + 02
7.00E + 02
8.00E + 02
9.00E + 02
I.OOE + 03
2.OOE + 03
3.OOE + 03
4.00E + 03
5.00E + 03
6.00E + 03
7.00E + 03
8.00E + 03
9.00E + 03
.OOE + 04
2.00E + 04
3.O0E+04
4.OOE + 04
5.00E+04
6.00E+04
7.00E + 04
8.00E+04
9.OOE+04
l.OOE + 05
2.OOE + 05
3.00E + 05
4.00E + 05
5.00E + 05
6.00E + 05
7.00E + 05
8.OOE + 05
9.00E + 05
.OOE + 06
7.00E - 01
1.40E + 00
2.10E+00
2.80E + 00
3.50E+00
4.20E + 00
4.90E + 00
5.60E + 00
6.30E + 00
7.00E + 00
1.40E + 01
2.10E+ 01
2.80E + 01
3.50E+01
4.20E + 01
4.90E + 01
5.60E + 01
6.30E + 01
7.00E+01
1.40E + 02
2.10E + 02
2.80E + 02
3.50E + 02
4.20E + 02
4.90E + 02
5.60E + 02
6.30E + 02
7.00E + 02
1.40E + 03
2.10E + 03
2.80E + 03
3.50E + 03
4.20E + 03
4.90E + 03
5.60E + 03
6.30E + 03
7.00E + 03
1 .40E + 04
2.10E+ 03
2.80E + 04
3.50E + 04
4.20E+04
4.90E + 04
5.60E + 04
6.30E + 04
7.00E + 04
1.18E+00
2.36E + 00
3.54E + 00
4.72E + 00
5.90E + 00
7.08E + 00
8.26E + 00
9.44E + 00
1.06E + 01
1.18E+ 01
2.36E + 01
3.54E + 01
4.72E + 01
5.90E + 01
7.08E + 01
8.26E + 01
9.44E + 01
1.06E + 02
1.18E+ 02
236E + 02
3.54E + 02
4.72E + 02
5.90E + 02
7.08E + 02
8.26E + 02
9.44E + 02
1.06E + 03
1.18E+ 03
2.36E + 03
3.54E + 03
4.72E + 03
5.90E + 03
7.08E + 03
8.26E + 03
9.44E + 03
1.06E + 04
118E + 04
236E + 04
3.54E + 04
4.72E + 04
5.90E + 04
7.08E + 04
8.26E + W
9.44E + 04
1.06E + 05
1.18E+ 05
1.43E+00
2.86E + 00
4.29E + 00
5.72E + 00
7.15E+00
8.58E + 00
I.OOE + 01
1.14E + 01
1.29E + 01
1.43E + 01
2.86E + 01
4.29E + 01
5.72E+ 01
7.15E + 01
8.58E + 01
l.OOE + 02
1.14E+02
1.29E + 02
1.43E + 02
2.86E + 02
4.29E + 02
5.72E + 02
7.15E + 02
S.58E + 02
1.OOE + 03
1.14E + 03
1.29E + 03
1.43E + 03
2.86E + 03
4.29E + 03
5.72E + 03
7.15E+03
8.58E + 03
LOE + 04
1.14E + 04
1.29E+04
1.43E+04
2.86E + 04
429E+04
5.72E + 04
7. 15E + 04
S.58E + 04
1.OOE + 05
1.14E + 05
1.29E + 05
1.43E + 05
1.72E + 00
3.44E + 00
5.16E + 00
6.88E + 00
8.60E + 00
1.03E+01
1.20E + 01
138E + 01
I.55E + 01
1.72E + 01
3.44E + 01
5.16E + 01
6.88E + 01
8.60E + 01
1.03E + 02
1.20E + 02
1.38E + 02
1.55E + 02
1.72E + 02
3.44E + 02
5.16E + 02
6.88E + 02
S.60E + 02
1.03E + 03
1.20E + 03
138E + 03
1.55E + 03
1.72E + 03
3.44E + 03
5.16E + 03
6.88E + 03
S.60E + 03
1.03E + 04
1.20E + 04
1.38E + 04
1.55E + 04
1.72E + 04
3.44E+04
5.16E + 04
6.88E + 04
8.60E + 04
1.03E + 05
1.20E + 05
138E+ 05
1.55E + 05
1.72E + 05
3.98E + 00
7.96E + 00
1.19E+01
1.59E + 01
1.99E + 01
2.39E + 01
2.79E + 01
3.18E+ 01
3.58E + 01
3.98E + 01
7.96E + 01
1.19E + 02
1.59E + 02
1.99E + 02
2.39E + 02
2.79E + 02
3.18E+ 02
3.58E + 02
3.98E+ 02
7.96E + 02
1.19E+ 03
1.59E + 03
1.99E + 03
2.39E + 03
2.79E + 03
3.18E+ 03
3.58E + 03
3.98E + 03
7.96E + 03
I.19E+04
1.59E + 04
1.99E + 04
2.39E + 04
2.79E+04
3.18E+04
3.58E + 04
3.98E+ 04
7.96E + 04
1.19E+05
1.59E + 05
1.99E + 05
239E + 05
2.79E + 05
3.18E+ 05
3.58E + 05
3.98E + 05
8.70E + 00
1.74E+ 01
2.61E + 01
3.48E + 01
4.35E + 01
5.22E + 01
6.09E + 01
6.96E + 01
7.83E + 01
8.70E + 01
1.74E + 02
2.61E+ 02
3.48E+ 02
4.35E + 02
5.22E+ 02
6.09E + 02
6.96E + 02
7.83E + 02
8.70E + 02
1.74E + 03
2.61E+ 03
3.48E + 03
435E+ 03
5.22E + 03
6.09E + 03
6.96E + 03
7.83E + 03
8.70E + 03
1.74E + 04
2.61E+ 04
3.48E + 04
435E + 04
522E+ 04
6.09E + 04
6.96E + 04
7.83E + 04
8.70E + 04
1.74E + 05
2.61E+ 05
3.48E + 05
435E + 05
5.22E + 05
6.09E + 05
6.96E + 05
7.83E + 05
8.70E + 05
1.54E+ 01
3.08E + 01
4.62E + 01
6.16E + 01
7.70E + 01
9.24E+01
1.08E + 02
1.23E + 02
1.39E + 02
1.54E + 02
3.08E + 02
4.62E + 02
6.16E+02
7.70E + 02
9.24E + 02
1.08E+ 03
1.23E+ 03
1.39E + 03
1.54E + 03
3.08E + 03
4.62E + 03
6.16E + 03
7.70E + 03
9.24E + 03
.08E + 04
1.23E+04
1.39E + 04
1.54E+ 04
3.08E + 04
4.62E + 04
6.16E + 04
7.70E + 04
9.24E + 04
1.08E + 05
1.23E + 05
1.39E + 05
1.54E + 05
3.08E + 05
4.62E + 05
6.16E+ 05
7.70E + 05
9.24E + 05
.08E + 06
123E+ 06
1.39E + 06
1.54E + 06
1.75E+ 01
3.50E+0I
525E + 01
7.00E + 01
8.75E+01
1.05E + 02
1.23E + 02
I.40E + 02
1.58E + 02
1.75E + 02
3.50E + 02
5.25E + 02
7.00E + 02
8.75E + 02
1.05E + 03
1.23E + 03
1.40E + 03
1.58E + 03
1.75E + 03
3.50E + 03
5.25E + 03
7.00E + 03
8.75E + 03
1.05E+ 04
1.23E+04
1.40E + 04
1.58E+04
1.75E+ 04
3.50E + 04
525E + 04
7.00E + 04
8.75E + 04
1.05E + 05
1.23E + 05
1.40E + 05
1.58E + 05
1.75E + 05
3.50E + 05
525E + 05
7.00E + 05
8.75E + 05
1.05E + 06
123E+ 06
1.40E + 06
1.58E+06
1.75E+ 06I .1 L I I .8
Table 4 EPIP-RET-02B Rev. T Date: SEP 19 2003 Page 13 of 16
REFERENCE USE
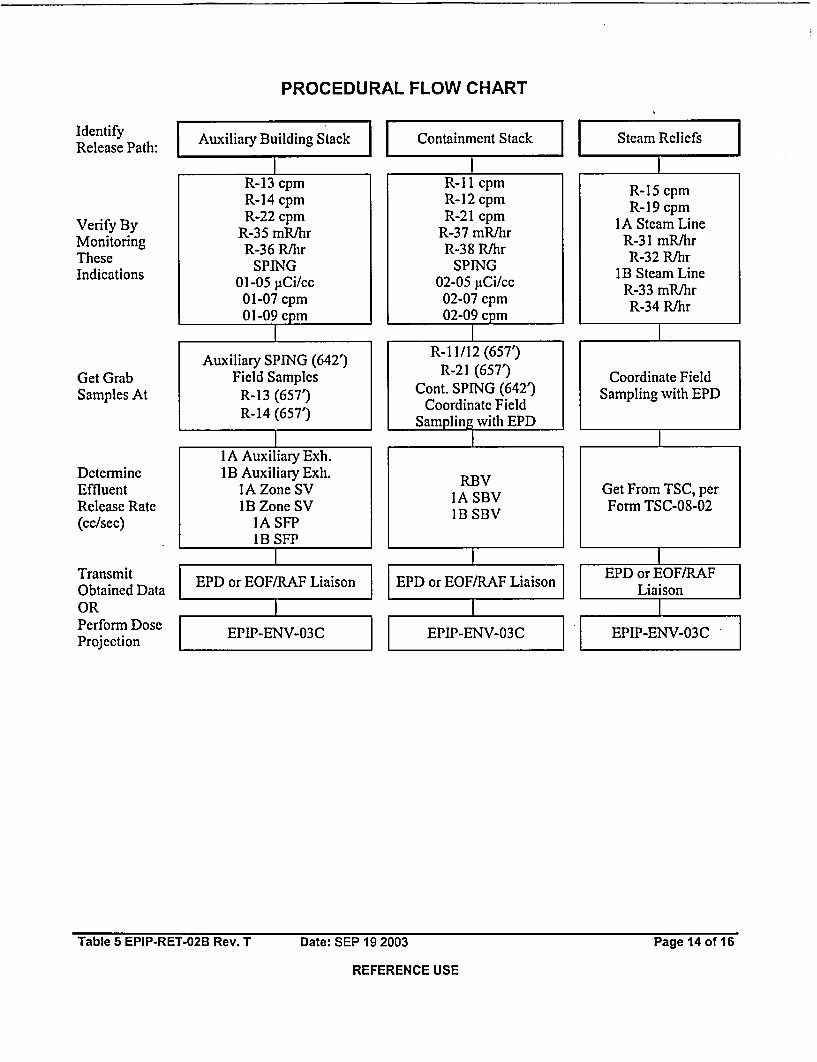
PROCEDURAL FLOW CHART
, . . .
IdentifyRelease Path:
Verify ByMonitoringTheseIndications
Get GrabSamples At
DetermineEffluentRelease Rate(cc/sec)
IAuxiliary Building Stack
II I
R-13 cpmR-14 cpmR-22 cpm
R-35 mR/hrR-36 R/hr
SPING01-05 1iCi/cc
01-07 cpm01-09 cpm
IAuxiliary SPING (642')
Field SamplesR-13 (657')R-14 (657')
1lA Auxiliary Exh.1B Auxiliary Exh.
1 iA Zone SVlB Zone SV
IA SFPIB SFP
Containment Stack
R-1l cpmR-12 cpmR-21 cpm
R-37 mR/hrR-38 R/hr
SPING02-05 pCi/cc02-07 cpm02-09 cpm
R-1 1/12 (657')R-21 (657')
Cont. SPING (642')Coordinate Field
Sampling with EPD
RBV1A SBVIB SBV
Tl~
I Steam Reliefs
R-15 cpmR-19 cpm
IA Steam LineR-31 mR/hrR-32 R/hr
lB Steam LineR-33 mR/hrR-34 R/hr
RIILIiZIh
I
Coordinate FieldSampling with EPD
Get From TSC, perForm TSC-08-02
TransmitObtained DataORPerform DoseProjection
IEPD or EOF/RAF Liaison I
I EPIP-ENV-03C j
IEPD or EOF/RAF Liaison
I EPIP-ENV-03C
EPD or EOF/RAF| Liaison
IEPIP-ENV-03C
Table 5 EPIP-RET-02B Rev. T Date: SEP 19 2003 Page 14 of 16
REFERENCE USE

FOR EASE OF DATA RETRIEVAL, SEE:
a) Honeywell Graphic Output 12 - For All SPING Datab) Honeywell Graphic Output 17 and 18 - For Selected Non-SPING Data
HONEYWELL MONITOR UNITS DESCRIPTION t LOCATIONPOINT NO. NO.
GOOOIG R-l mR/hr Control RoomG0002G R-2 mR/hr Containment, 649'G0004G R-4 mR/hr Charging PumpG0005G R-5 mR/hr Spent Fuel Pools, 649'G0006G R-6 mR/hr Sampling RoomG0007G R-7 mR/hr Seal TableG0009G R-9 R/hr Letdown LineGOOIOG R-10 mR/hr New Fuel PitGOOI IG R-l 1 cpm Containment Air ParticulateG0012G R-12 cpm Containment GasG0013G R-13 cpm Auxiliary Building VentG0014G R-14 cpm Auxiliary Building Vent StackG0015G R-15 cpm Air EjectorG0016G R-16 cpm Containment Fan Coil Southwest ReturnG0017G R-17 cpm Component Cooling Southwest ReturnG0018G R-18 cpm Liquid Waste Disposal LineG0019G R-19 cpm S/G BlowdownG002OG R-20 cpm Service Water StandpipeG0031G R-31 mR/hr IA Steam Line - LOG0102G R-32 R/hr IA Steam Line - HIG0105G R-33 mR/hr IB Steam Line - LOG0104G R-34 R/hr IB Steam Line - HIGOIOIG R-35 mR/hr Auxiliary Building Vent Duct - LOGOIOOG R-36 R/hr Auxiliary Building Vent Duct - HIG0113G R-37 mR/hr Containment Vent Duct - LOG0112G R-38 R/hr Containment Vent Duct - HIG0114G R-40 R/hr IA Containment lll-Range MonitorGOI 15G R41 R/hr IB Containment HI-Range Monitor
EBERLINE SPING AREA MONITORSG9041G 08-01 mR/hr 586' Sulfuric Acid TankG9042G 08-02 R/hr 586' Containment Spray PumpsG9043G 03-01 R/hr 586'Waste Disposal PanelG9044G 03-02 mR/hr 586' Hi-Rad Sample RoomG9045G 05-01 R/hr 586' RHR Pump Pit AreaG9046G 05-02 mR/hr 586' Waste CompactorG9048G 08-03 mR/hr 606' Heating BoilerG9049G 04-01 mR/hr 606' Machine ShopG9050G 04-02 mR/hr 606' RPO/Laundry Room
EBERLINE SPING AREA MONITORS (Continued on Page 2 of 2)
Table 6 EPIP-RET-02B Rev. T Date: SEP 19 2003 Page 15 of 16
REFERENCE USE

IIONEYNVELL | MONITOR | UNITS | DESCRIPTION / LOCATIONPOINT NO. NO. I ____________ _______
EBERLINE SPING AREA MONITORS (Continued)G9051 G 03-03 R/hr 606' Elevator/CC Heat ExchangerG9052G 05-03 mR/hr 606' Loading DockG9053G 04-03 mRlhr 626' Makeup Demineralizer AreaG9O5SG 04-04 mR/hr 626' I&C Shop - SouthG9056G 06-01 mR/hr 626' I&C Shop - NorthG9057G 06-02 R/hr 642' Shield Building Filter AreaG9058G 06-03 mR/hr 642' Control Room A/C RoomG9059G 06-04 R/hr 657' Containment Vent Filter AreaG9060G 06-05 R/hr 657' Zone SV Filter AreaG9061G 07-03 mR/hr 606' TSC Building StairwellG9062G 07-01 mR/hr 586' RAF Count RoomG9063G 07-02 mR/hr 586' Technical Support CenterG9066G 07-04 cpm 586' Technical Support CenterG9067G 03-04 cpm 586' Hi-Rad Sample RoomG9069G 03-06 cpm 586' Charging Pump AreaG9070G 03-08 cpm 606' VCT Area
CONTAINMENT STACK SPING
G9071G 02-01 pCi Beta ParticleG9072G 02-02 cpm Alpha ParticulateG9073G 02-03 pCi IodineG9074G 02-04 cpm Iodine BackgroundG9075G 02-05 pCi/cc Low-Range Noble GasG9076G 02-06 mR/hr Area Monitor - GammaG9077G 02-07 cpm Mid-Range Noble GasG9078G 02-08 cpm Background - Gas ChannelsG9079G 02-09 cpm Hi-Range Noble Gas
AUXILIARY BUILDING STACK FLOW
F7001G | N/A cfm Auxiliary Building Stack FlowN/A 106-10 1 milli-amps Auxiliary Building Stack Flow (Form EPIPF-RET-02B-02)
AUXILIARY BUILDING STACK SPINGG9080G 01-01 pCi Beta ParticulateG9081G 01-02 cpm Alpha ParticulateG9082G 01-03 pCi IodineG9083G 01-04 cpm Iodine BackgroundG9084G 01-05 pCi/cc Low-Range Noble GasG9085G 01-06 mR/hr Area Monitor - GammaG9086G 01-07 cpm Mid-Range Noble GasG9087G 01-08 cpm Background - Gas ChannelsG9088G 01-09 cpm Hi-Range Noble Gas
Table 6 EPIP-RET-02B Rev. T Date: SEP 19 2003 Page 16 of 16
REFERENCE USE

WISCONSIN PUBLIC SERVICE CORP. No. EPIP-TSC-07 Rev. JTitle RV Head Venting Time Calculation
Kewaunee Nuclear Power Plant
Emnergency Plan Implementing Procedure Date JUN 20 2002 Page 1 of 3
Reviewed By John Helfenberger Approved By W. L. YaroszNuclear 0 Yes PORC 0 Yes RO Approval Of 0 YesSafety Review TemporaryRelated D No Required 0 No Changes Required 0 No
1.0 Purpose
1.1 This procedure provides instruction for determining the maximum allowable venting periodof the reactor vessel head when noncondensable gases are present in the RCS.
2.0 General Notes
2.1 None
3.0 Precautions and Limitations
3.1 This procedure should be performed concurrently with FR-1.3, "Response to Voids inReactor Vessel," Section 4.17. Determine maximum allowable venting time.
3.2 The procedure may only be performed when containment hydrogen concentration isbelow 3%.
4.0 Initial Conditions
4.1 The range selector switch on each monitor must remain in the 0-10% position. The highrange is NOT calibrated and will result in false Control Room and computer indication.
4.2 The containment hydrogen analyzer has been placed in service per EPIP-RET-03C, "PostAccident Operation of the High Radiation Sample Room." Allow a minimum sample purgetime of 10 minutes.
4.3 All available containment air circulating equipment should be operating to prevent theformation of hydrogen gas pockets and ensure a representative sample is obtained. IF onlyone containment dome fan is operating, THEN the sample should be taken from theoperating fan discharge.
5.0 Procedure
5.1 Obtain the RCS Pressure from the PPCS/SPDS Computer Point ID P0420A or Control Roommeters and record it on Form EPIPF-TSC-07-0 1.
5.2 Obtain the Containment Pressure from the PPCS/SPDS Computer Point IDs P8004A,P8005A, or Control Room meters and record it on Form EPIPF-TSC-07-01.
e:\temp~pIgca68.doc-Christine Simmons/Christine Simmons-Ed CoenREFERENCE USE

WISCONSIN PUBLIC SERVICE CORP.' No. EPIP-TSC-07 Rev. JTitle RV Head Venting Time Calculation
Kewaunee Nuclear Power Plant
Enmergencj Plan Implementing Procedure Date JUN 20 2002 Page 2 of 3
5.3 Obtain the Containment Hydrogen Concentration from PPCS/SPDS Computer PointIDs X8001A, X8002A, or Control Room meters (41615 and 41616). IF only one containmentdome fan is running, THEN use the appropriate hydrogen analyzer channel to geta representative sample. IF both fans are running, THEN use the channel with the higherconcentration indication. Record the hydrogen concentration, the dome fans in service,and which analyzer was used on Form EPIPF-TSC-07-01.
5.4 Obtain the Containment Temperature from PPCS/SPDS Computer Point ID T1000A(instrument 15293) and record it on Form EPIPF-TSC-07-01.
5.5 Complete the calculations on Form EPIPF-TSC-07-01 and report the results (maximum headventing time) to the TSCD.
6.0 Final Conditions
6.1 Emergency declaration is terminated, OR
6.2 The Reactor Coolant System has been stabilized and recovery operations have been enteredper EPIP-AD-1 5, "Recovery Planning and Termination."
7.0 References
7.1 "Background Information for Westinghouse Emergency Response Guidelines, FR-I.3 Voidin Reactor Vessel," Rev. LP-BASIC, September 15, 1981
7.2 "FR-I.3, Response to Voids in Reactor Vessel," LP-Rev. 1, September 1, 1983
7.3 EPIP-AD-15, Recovery Planning and Termination
7.4 EPIP-RET-03C, Post Accident Operation of the High Radiation Sample Room
7.5 Flow Diagram, "Reactor Building Vent System Post-LOCA Hydrogen Control," M-403
8.0 Records
8.1 The following QA records and non-QA records are identified in this directive/procedure andare listed on the KNPP Records Retention Schedule. These records shall be maintainedaccording to the KNPP Records Management Program.
8.1.1 OA Records
* Head Venting Calculation, Form EPIP-TSC-07-01
8.1.2 Non-QA Records
None
REFERENCE USE

HYDROGEN FLOW RATE VERSUS RCS PRESSURE
3600
3400
3200
3000
2800
2600
2400
c; 2200U,n
E 2000
D 1800
> 1600
0
C 1400
1200
1000
800
600
400
200
0
________ J
0 400 800 1200 1600
RCS PRESSURE (PSIG)
2000 2400
Attachment A EPIP-TSC-07 Rev. J Date: JUN 20 2002
REFERENCE USE
Page 3 of 3

WISCONSIN PUBLIC SERVICE CORP. No. EPIP-TSC-09A Rev. KTitle Core Damage Assessment
Kewaunee Nuclear Power Plant
Emnergency Plan Implementing Procedure Date MAY 5 2003 Page 1 of 11
Reviewed By John Helfenberger Approved By Jerrie MorlinoNuclear 0 Yes PORC E0 Yes SRO Approval Of E YesSafety Review TemporaryRelated 0 No Required O No Changes Required 0 No
1.0 Purpose
1.1 This procedure provides instruction for assessing the degree of core damage during anaccident. In addition, the guideline provides information for the assessment of the appropriateEmergency Action Level for off-site radiological protective actions based on the degree ofcore damage. Specifically, the information contained in this guideline relates to:
* Determination of the degree of damage to the fuel rod cladding that results in therelease of the fission product inventory in the fuel rod gap space
* Determination of the degree of core overheating that results in the release of thefission product inventory in the fuel pellets
* Determination of the appropriate Emergency Action Level for off-siteradiological protective actions based on the degree of damage to the reactor core
2.0 General Notes
2.1 None
3.0 Precautions and Limitations
3.1 None
4.0 Initial Conditions
4.1 This guideline is to be used when Technical Support Center is activated and a Core DamageAssessment is requested.
plgca6d.doo-Arny KudicklArny Kudick-Edward D. CoenREFERENCE USE

WISCONSIN PUBLIC SERVICE CORP. No. EPIP-TSC-09A Rev. KTitle Core Damage Assessment
Kewaunee Nuclear Power Plant
Emergency Plan Implementing Procedure. Date MAY 5 2003 Page 2 of 11
5.0 Procedure
5.1 Identify Current Plant Status
5.1.1
5.1.2
5.1.3
5.1.4
Complete Form EPIPF-TSC-09A-05 except for the last column.
Using the table below, determine the possible status of the reactor core.
Record status on Form EPIPF-TSC-09A-05.
Go to the appropriate section of this guideline as indicated from the table.
High Level Core Damage Assessment
Plant Status Fuel RodPlant tatusFission Product Status
Core Exit Thermocouple TemperatureLESS THAN 7000F, AND No Core Damage
Containment Radiation Continue to Monitor Plant ParametersBelow Curve in Attachment A
Core Exit Thermocouple Temperature Possible Fuel RodLESS THAN 18000F, AND Clad Damage
Containment Radiation Go to step 5.2Below Curve in Attachment B
Core Exit Thermocouple Temperature Possible FuelGREATER THAN 18000F, OR Overtemperature Damage
Containment Radiation Go to step 5.3Above Curve in Attachment B
5.2 Estimate Fuel Rod Clad Damage
5.2.1 Estimate fuel rod clad damage based on containment radiation levels.
5.2.1.1 Complete lines 1-4 of Form EPIPF-TSC-09A-02.
5.2.2 Estimate fuel rod clad damage based on core exit thermocouple readings.
5.2.2.1 Complete lines 5-10 of Form EPIPF-TSC-09A-02.
5.2.3 Verify reasonableness of clad damage estimates.
5.2.3.1 Complete lines 11-17 of Form EPIPF-TSC-09A-02.
REFERENCE USE

WISCONSIN PUBLIC SERVICE CORP.- No. EPIP-TSC-09A Rev. KTitle Core Damage Assessment
Kewaunee Nuclear Power Plant
Emergency Plan Implementing Procedure Date MAY 5 2003 Page 3 of 11
5.2.3.2 IF expected response is not obtained, THEN determine if the deviation can beexplained
from the accident progression
* injection of water to the RCS
* bleed paths from the RCS
* direct radiation to the containment radiation monitors, OR
from conservatisms in the predictive model
* fuel burnup
* fission product retention in the RCS
* fission product removal form containment
5.2.3.3 Record explanation of deviations on Form EPIPF-TSC-09A-02.
5.2.4 Report Findings.
5.2.4.1 Fill out Form EPIPF-TSC-09A-07 if level of damage has changed and give toEmergency Director.
5.2.5 Go to Step 5.1.
5.3 Estimate Fuel Overtemperature Damage
5.3.1 Estimate fuel overtemperature damage based on containment radiation levels.
5.3.1.1 Complete lines 1-4 of Form EPIPF-TSC-09A-03.
5.3.2 Estimate fuel overtemperature damage based on core exit thermocouple readings.
5.3.2.1 Complete lines 5-7 of Form EPIPF-TSC-09A-03.
5.3.3 Estimate fuel overtemperature damage based on hydrogen concentration.
5.3.3.1 Complete lines 8-11 of Form EPIPF-TSC-09A-03.
5.3.4 Verify reasonableness of fuel overtemperature damage estimates.
5.3.4.1 Complete lines 12-18 of Form EPIPF-TSC-09A-03.
REFERENCE USE

WISCONSIN PUBLIC SERVICE CORP. No. EPIP-TSC-09A Rev. KTitle Core Damage Assessment
Kewaunee Nuclear Power Plant
Emergency Plan Inplementing Procedure Date MAY 5 2003 Page 4of 11
5.3.4.2 IF expected response is not obtained, THEN determine if the deviation can beexplained
from the accident progression
* injection of water to the RCS
* bleed paths from the RCS
* direct radiation to the containment radiation monitors
* hydrogen bum in containment or operation of hydrogen igniters, OR
from conservatisms in the predictive model
* fuel burnup
* fission product retention in the RCS
* fission product removal form containment
5.3.4.3 Record explanations of deviations on Form EPIPF-TSC-09A-03.
5.3.5 Report findings.
5.3.5.1 Fill out Form EPIPF-TSC-09A-07 if level of damage has changed and give toEmergency Director.
5.3.6 Go to Step 5.1.
6.0 Final Conditions
6.1 None
7.0 References
7.1 WCAP-14696-A Revision 1, "Westinghouse Owners Group, Core DamageAssessment Guidance," November 1999
7.2 Letter from John G. Lamb (NRC) to Mark Reddemann (NMC) transmitting the NRC SERfor Amendment 160 to the Operating License allowing removal of Post Accident SamplingSystem from Technical Specifications, Letter No. K-02-006, Dated January 16, 2002
7.3 COMTRAK's 89-026 and 89-027
7.4 Calculation C 11403, Determination of Setpoints for EPIP-TSC-09A
7.5 EPIP-EOF-04, EOF Staff Action for Alert or Higher
REFERENCE USE

WISCONSIN PUBLIC SERVICE CORP.- No. EPIP-TSC-09A Rev. K
Title Core Damage AssessmentKewaunee Nuclear Power Plant
EnmergencyPlan ImtplemtentingProcedure Date MAY 5 2003 Page 5 of 11
8.0 Records
8.1 The following QA records and non-QA records are identified in this directive/procedure andare listed on the KNPP Records Retention Schedule. These records shall be maintainedaccording to the KNPP Records Management Program.
8.1.1 OA Records
* Core Exit Thermocouple Data, Form EPIPF-TSC-09A-01
* Fuel Rod Clad Damage Estimate, Form EPIPF-TSC-09A-02
* Fuel Rod Overtemperature Damage Estimate, Form EPIPF-TSC-09A-03
* Core Damage Assessment (Monitoring Data), Form EPIPF-TSC-09A-05
* Core Damage Assessment Results, Form EPIPF-TSC-09A-07
8.1.2 Non-OA Records
None
REFERENCE USE

LIST OF ATTACHMENTS/FORMS
ATTACHMENT TITLE
Attachment A Containment Radiation Level vs. Time for RCS Release
Attachment B Containment Radiation Level vs. Time for 1% Fuel Overtemperature Release
Attachment C Containment Radiation Level vs. Time for 100% Clad Damage Release
Attachment D Containment Radiation Level vs. Time for 100% Fuel Overtemperature Release
Attachment E Hydrogen Concentration for 100% Core Overtemperaturc Damage
FORM TITLE
Form EPIPF-TSC-09A-01 Core Exit Thermocouple Data
Form EPIPF-TSC-09A-02 Fuel Rod Clad Damage Estimate
Form EPIPF-TSC-09A-03 Fuel Rod Overtemperature Damage Estimate
Form EPIPF-TSC-09A-05 Core Damage Assessment (Monitoring Data)
Form EPIPF-TSC-09A-07 Core Damage Assessment Results
Appendix A EPIP-TSC-09A Rev. K Date: MAY 5 2003 Page 6 of 11
REFERENCE USE

CONTAINMENT RADIATION LEVEL vs. TIME FOR RCS RELEASE
1.2E+01
-. 1.OE+01
a:
W 8.OE+000
q
E.? 6.OE+OO
W-
*11
0
e 4.OE+00r-
E
0LU 2flFrflf
0 5 10 15 20 25 30 35 40 45 50
Time (Hrs)
Attachment A EPIP-TSC-09A Rev. K Date: MAY 5 2003
REFERENCE USE
Page 7 of 11

CONTAINMENT RADIATION LEVEL vs. TIME FOR 1% FUELOVERTEMPERATURE RELEASE
1.E+05_ _ I _ _ i _ _ I _ _ I _ _ I _ _ I _ _ I _ _ I _ _ I _ _
4 *1- 4 *1- 4 + 4 4 +I 4 4 1 I-
tl.E+04
E0
02
0
01
E
0
I.E+02
I it i t i -i i t
�� q� - -,*�
I-,-�l
- I-.- I
. . . . . . . .
0 5 10 15 20 25 30
Time Since Shutdown (Hrs)
35 40 45 50
- RCS Press < 1600 psig No ICS -RCS Press < 1600 psig, ICS OnI RCS Press> 1600 psig No ICS - RCS Press> 1600 psig, lCS On
Attacfment H LFIFI-TbU-09A KeV. K Date: MAY 5 2003
REFERENCE USE
Page 8 of 11

CONTAINMENT RADIATION LEVEL vs. TIME FOR 100% CLADDAMAGE RELEASE
1.E+04
0
e- 1.E+03
to
*1
W
0
-
4,
E
0
kt .E+03
I I i I=It i ii i i ii _ _
1- 4 + 4 + 4 4 +
4 + 4 + 4 + 4 4 +
0 5 10 15 20 25 30Time Since Shutdown (Hrs)
35 40 45 50
I| RCS Press < 1600 psig No ICS - RCS Press < 1600 psig ICS On - RCS Press> 1600 psig No ICS - RCS Press> 1600 psig ICS On
Attachment C EPIP-TSC-09A Rev. K Date: MAY 5 2003
REFERENCE USE
Page 9 of 11

CONTAINMENT RADIATION LEVEL vs. TIME FOR 100% FUELOVERTEMPERATURE RELEASE
I
0
a:
W
0.
q
E0
4:
'ap
W
0
eE.EczTo
L.E*07
____I____I____ __
L.E+05 - = p
1I.--0I
0 5 10 15 20 25 30
Time Since Shutdown (Hrs)
35 40 45 50
IRRCS Press < 1600 psig No ICS - RCS Press < 1600 psig ICS On - RCS Press > 1600 psig No ICS - RCS Press > 1600 psig ICS On I
-.
Attachment D EPIP-TSC-09A Rev. K Date: MAY 5 2003
REFERENCE USE
Page 10 of 1I
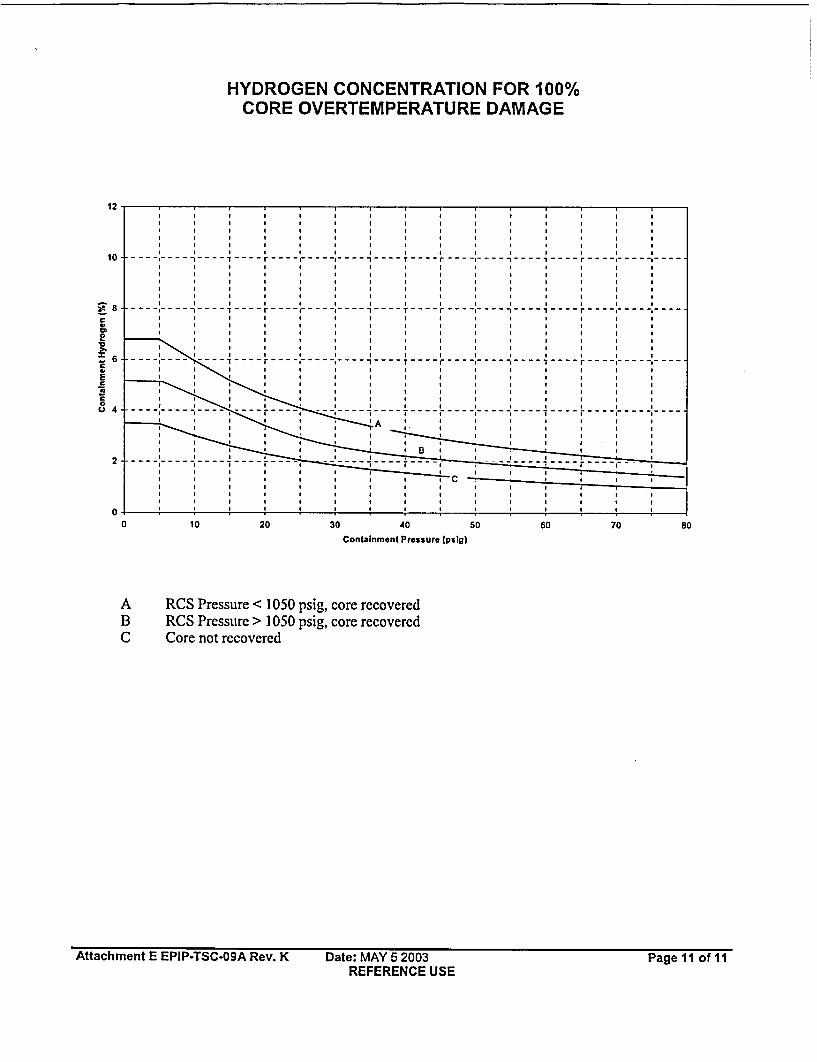
HYDROGEN CONCENTRATION FOR 100%CORE OVERTEMPERATURE DAMAGE
12
10
8
6CVEC
00 4
2
II Ir or S
- - - r - - - - - - - - - - - - - - - - - - -I
I- - --- - - I - -I -- - - -
I I I I- - - - --- - - -- - - - --- - - - Ti - -I
I I-- - - - - - - - - - - - - -I I I I
0
a 10 20 30 40
Containment Pressure (psig)
50 60 70 80
A RCS Pressure < 1050 psig, core recoveredB RCS Pressure > 1050 psig, core recoveredC Core not recovered
Attachment E EPIP-TSC-09A Rev. K Date: MAY 5 2003REFERENCE USE
Page 11 of 11

-S - . m M
Title Reactor Building Ventilation (RBV) &Post-LOCA Hydrogen Control I Da
stem No. 18 Rev. 1
ite 10/09/02 Page 1 of 39
Author Ops ReviewBruce R. Ileida Jeffrey L. Stoeger
Tech Review ApprovedJeffrev L Stoecer Mananer of Eneineerine
INDEX
1.0 Summary . . 21.1 Overview ..................................... 21.2 System Operation versus Plant Modes ..... ....... 21.3 Startup ...................................... 31.4 Normal ...................................... 31.5 Shutdown .................................... 41.6 Abnormal .................................... 4
2.0 Functions .. 23.0 Design Descriptions .. 5
3.1 System Arrangement and Flowpath ...... ........ 53.2 Design Bases .................................. 103.3 Containment Fan Coil Units ........ ............. 113.4 Reactor Support Cooling System ...... ........... 153.5 Reactor Gap & Neutron Detector Cooling Subsystem 163.6 Containment Dome Vent (CDV) Fans ..... ........ 173.7 CRDM Cooling Subsystem ........ .............. 183.8 Containment Vacuum Relief Subsystem ..... ...... 203.9 Containment Purge & Vent Subsystem ..... ....... 22
3.10 Post LOCA Hydrogen Control Subsystem .283.11 Controls - Mechanical Vertical Panel "A .313.12 Controls - Local .323.13 Indications .333.14 Alarms-RBV System and Post LOCA .353.15 Sequence of Event Recorder .353.16 System Interrelationships .363.17 System Interlocks .36
4.0 Precautions and Limitations .. 375.0 References .. 38
5.1 Technical Specifications .386.0 Procedures......................................... 397.0 Appendices .. 39
7.1 Attached Figures .39
h:\documents\ep\nrc cds\eal documentation\system descriptions\sd l 8.doc
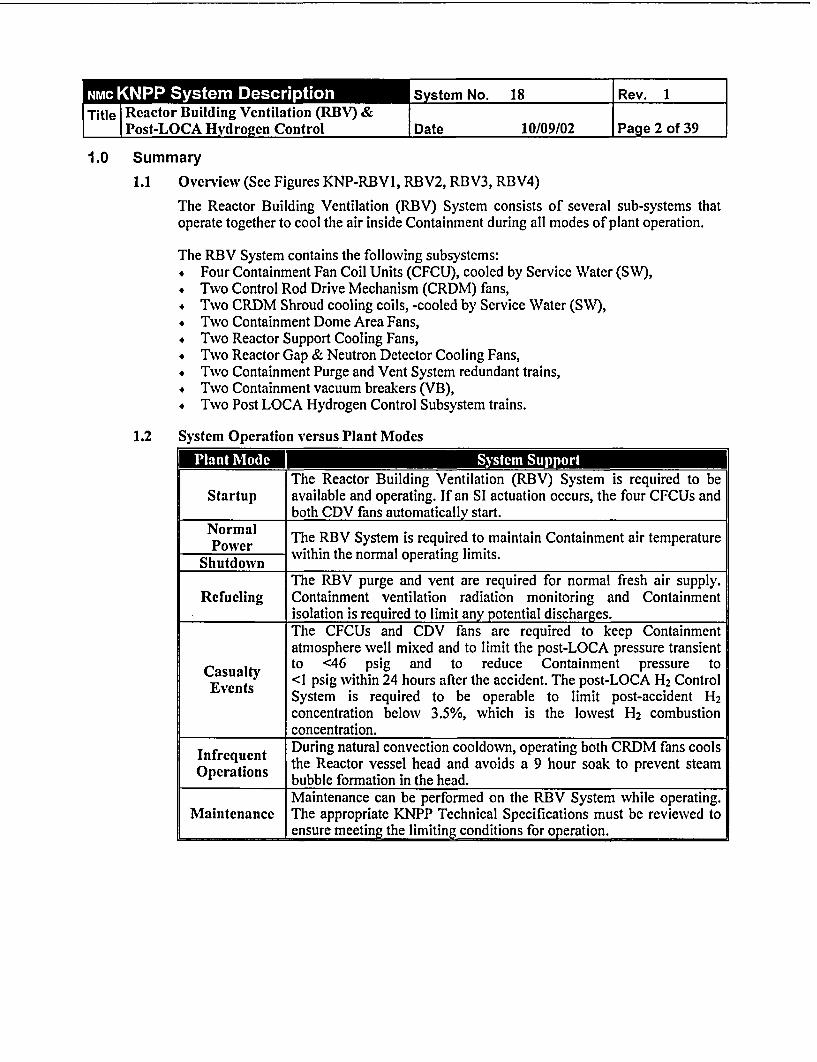
MRSys e m No. 18 Rev. ITitle Reactor Building Ventilation (RBV) &
Post-LOCA Hydrogen Control FDate 10/09/02 Page 2 of 39
1.0 Summary
1.1 Overview (See Figures KNP-RBVI, RBV2, RBV3, RBV4)
The Reactor Building Ventilation (RBV) System consists of several sub-systems thatoperate together to cool the air inside Containment during all modes of plant operation.
The RBV System contains the following subsystems:* Four Containment Fan Coil Units (CFCU), cooled by Service Water (SW),* Two Control Rod Drive Mechanism (CRDM) fans,* Two CRDM Shroud cooling coils, -cooled by Service Water (SW),* Two Containment Dome Area Fans,* Two Reactor Support Cooling Fans,* Two Reactor Gap & Neutron Detector Cooling Fans,* Two Containment Purge and Vent System redundant trains,* Two Containment vacuum breakers (VB),# Two Post LOCA Hydrogen Control Subsystem trains.
1.2 System Operation versus Plant Modes
Km M MThe Reactor Building Ventilation (RBV) System is required to be
Startup available and operating. If an SI actuation occurs, the four CFCUs andboth CDV fans automatically start.
Normal The RBV System is required to maintain Containment air temperaturePower
Shutdown within the normal operating limits.The RBV purge and vent are required for normal fresh air supply.
Refueling Containment ventilation radiation monitoring and Containmentisolation is required to limit any potential discharges.The CFCUs and CDV fans are required to keep Containmentatmosphere well mixed and to limit the post-LOCA pressure transient
Casualty to <46 psig and to reduce Containment pressure toEvents <1 psig within 24 hours after the accident. The post-LOCA H2 Control
System is required to be operable to limit post-accident H2concentration below 3.5%, which is the lowest H2 combustionconcentration.
IDuring natural convection cooldown, operating both CRDM fans coolsOnerequent the Reactor vessel head and avoids a 9 hour soak to prevent steam
Operations bubble formation in the head.
Maintenance can be performed on the RBV System while operating.Maintenance The appropriate KNPP Technical Specifications must be reviewed to
ensure meeting the limiting conditions for operation.

*_ S yste m No. 18 Rev. IReactor Building Ventilation (RBV) & a 1Post-LOCA Hydrogen Control Date 10/09/02 Page 3 of 39
1.3 Startup (OPs # N-RBV-I 8A, N-RBV-1 8B)During normal plant startup, the 36" Containment Vent Isolation Valves RBV-1, RBV-2,RBV-3, and RBV-4 are closed. CFCUs IA, 11B, IC and ID are started . Containmenttemperature is checked by means of the remote indication in the Control Room on theOmniguard Panel. E One CDV fan, one Reactor Gap & Neutron Detector Cooling Fan,one CRDM fan, and one Reactor Support Cooling Fan are manually started from theControl Room. The Operator selects which fan in each pair that is started. The switchesfor the above fans should be placed in the AUTO position which would allow the idle fanto start if the running fan trips off. An annunciator alarms if neither fan in a pair isrunning.
To start the Containment Purge & Vent Subsystem during maintenance or refuelingoperations, all isolation valves and dampers in the supply and exhaust ducts are opened.The Containment purge fan and the Containment vent exhaust fan are started in the purgemode. If the Containment sampling and vent stack radiation monitors indicate anacceptable low level of activity, the vent mode of exhaust may be initiated by a selectorswitch which closes the purge path and stops the purge fan. During the purge mode thevent and supply fan is shutdown. When proceeding to the vent mode, the Containmentsupply fan unit is started up.
The Post LOCA H2 Control Subsystem is normally in a non-operating status or isolation-mode status. Surveillance testing is routinely performed to verify system operability.
1.4 Normal (OP's # N-RBV-18A, N-RBV-1 8B, N-RBV-I 8C)During normal operation, indicating lights in the Control Room display which activecomponents are running and the position of valves and dampers. Status lights arenormally off and all temperatures and pressure points are constantly monitored. When theContainment Purge & Vent Subsystem is operating, the DP across each filter should bechecked and not allowed to exceed 3" water gauge.
The Post LOCA H2 Control Subsystem is not used during normal plant operation. Thesubsystem is designed for use after a loss of coolant accident to prevent H2 concentrationinside Containment from reaching 3.5%. Air pressurization of Containment is initiatedmanually by opening the manual Valve IA-1002A/B from the IA System. A portable aircompressor can be connected to the emergency connection provided. Operator control ofthe Post LOCA H2 Control Subsystem isolation valves is at the Post LOCA H2 ControlPanel (locally). Administrative controls are exercised to assure proper position of theisolation valves.
When venting the Containment atmosphere to the Shield Bldg annulus, the Operatoradjusts the air flow rate. A flow rate of 25 cfm should maintain H2 concentration below3.5% and the Kates control valve is adjusted based on H2 concentrations insideContainment. Reduced air flow rates may be desired because of the quantity ofradioactive gases that are being released to the Shield Bldg annulus. In this casepressurization can be used in conjunction with the venting operation. An air flow ratelimited to 100 cfm should ensure that the annulus is maintained at a negative differentialpressure.

1.5 ShutdownThe Containment Purge & Vent Subsystem can be shutdown and all isolation valvesclosed from the Control Room. The Reactor Gap & Neutron Detector Cooling Fans,Reactor Support Cooling Fans, and CRDM fans may be shutdown from the ControlRoom by turning both switches in each subsystem to OFF. Shutdown of the Post LOCAH2 Control Subsystem consists of closing all isolation valves at the local control panels.
1.6 Abnormal (OP #A-RBV-1 8)If an annunciator associated with the RBV System is actuated, the Control RoomOperator observes the indications and symptoms and carries out immediate andsubsequent actions in accordance with Procedure A-RBV-18. The abnormal procedureprovides action steps to take in the event of any annunciator being actuated (see Section3.13).
2.0 FunctionsThe functional requirements of the RBV System include several distinct functions under bothnormal and emergency operation. These functions are as follows:* Provides Containment cooling and pressure reduction during post-accident conditions* Provides adequate heat removal capacity during full power operation* Relieves the Containment vessel of excessive negative pressure if a rapid temperature drop
occurs* Disperses possible high concentrations of H2 in the Containment dome following a LOCA* Removes particulate and gaseous (non-noble gases) radioactive contamination from the
Containment air before discharge to atmosphere* Has Containment isolation valves to assure leak-tight Containment isolation whenever
Containment integrity is required* Provides a supply of fresh tempered air to Containment during refueling operations* Mitigates or prevents a H2 buildup above 3.5% in the Containment vessel after a LOCA
The specific purposes of the subsystems of the RBV System include the following:* The CRDM Subsystem cools the CRDMs. Each fan is capable of providing 100% capacity
based on heat generation rate as determined by Westinghouse. During normal operation, onefan is running and one fan is in standby. SW supplied cooling coils are added to increasenormal operations Containment cooling.
. The Reactor Support Cooling Subsystem has two fans to maintain proper temperatureprofiles in the Reactor vessel steel at its supports, shoes, shims, and supporting steel. Eachfan has 100% capacity. Heating coils aid in maintaining temperature profiles and ensuretemperatures do not drop below I 000 F. During normal operation one fan is operating and thesecond fan is in standby.
* The Reactor Vessel Gap & Neutron Detector Cooling Subsystem limits the maximumtemperature of the concrete surrounding the Reactor vessel and cools the neutron detectors.Each fan has 100% capacity. During normal operation, one fan is running and one fan is instandby.
* The Containment Dome Ventilation Subsystem consists of two fans and provides generalmixing of Containment air. This mixing aids in the prevention of explosive gas concentrationpockets.

M_ System No. 18 Rev. 1Reactor Building Ventilation (RBV) &Post-LOCA Hydrogen Control I Date 10/09/02 Page 5 of 39
. The Purge and Ventilation Subsystem reduces the radioactivity inside the Containmentvessel, following full power operation, to the level defined by 10 CFR 20 for a 40 houroccupational work week, within 2 to 6 hours after Reactor shutdown. The subsystem has twomodes of operation: exhaust or purge.
* The Vacuum Relief Subsystem consists of two isolation valves and two vacuum breakervalves. This subsystem prevents a Containment vessel internal pressure of <-0.8 psig.
* The Containment Air Cooling Subsystem consists of four CFCUs cooled by SW, operatingduring normal operation. Following an SI signal, all four CFCUs start automatically and havemaximum SW flow to the cooling coils.
# The Post LOCA Hydrogen Control Subsystem prevents H2 buildup in the Containment vesselafter a LOCA. The subsystem-consists of two independent trains with the capability ofallowing the installation of two H2 recombiners if necessary.
3.0 Design Description
3.1 System Arrangement and Flowpath (See Figure KNP-RBVI)
3.1.1 Control Rod Drive Mechanism (CRDM) Cooling SubsystemThe CRDM Cooling Subsystem is located above the CRDM shroud on top of theReactor vessel. Air is drawn from the refueling pool area, up through the CRDMenclosing shroud and out through three ducts. Air flows through two CRDMshroud cooling coils and the hvo fans mounted on the missile shield above theCRDMs. Discharge air is directed up at high velocity to mix with Containmentair. SW cooling coils were added to reduce the Containment ambient airtemperature.
3.1.2 Reactor Support Cooling SubsystemAir is drawn from the refueling floor and forced through ductwork to each ofthree pairs of Reactor support plenums. The Reactor support plenums contain heattransfer fins. From the plenums air returns to the I B RXCP vault and back to mixwith the Containment atmosphere. Normally one fan is operating and the secondfan is in standby.
3.1.3 Reactor Vessel Gap & Neutron Detector Cooling SubsystemCool air is drawn from the ring duct above the refueling floor and forced throughductwork to two branch ducts. One branch duct supplies air to the eight neutrondetector wells. The second branch duct supplies air to the bottom of the Reactorvessel and the liner. From these areas air passes to the general Containment space.Normally one fan is operating and the second fan is in standby.
3.1.4 Containment Dome Ventilation (CDV) SubsystemTwo CDV fans, safeguards Train A and Train B, are installed to recirculate andmix hot air and any post-accident H2 from the top of Containment vessel with theContainment atmosphere. Each CDV fan has separate ductwork which allows thefan to pull air from the Containment dome and discharge the air at the intakes ofthe CFCUs. The ductwork and fans are designed to withstand seismic forces andthe rapid pressure transient caused by a LOCA.

-_SUte St No. 18 Rev. 1RTitle | Ractor Building Ventilation (RBV) &
I Post-LOCA Hydrogen Control Date 10/09/02 Page 6 of 39
3.1.5 Purge and Ventilation SubsystemFresh outside air is drawn in through Intake Damper TAV-10/CD-34040, a filter,steam preheat coil, steam reheat coil, and to the Containment Purge & VentSupply Fan. The 33,000 cfm air flow enters the Containment through Shield BldgDamper TAV-12/CD-34036, Outside Containment Isolation Valve RBV-I/CV-31125, and Inside Containment Isolation Valve RBV-2ICV-31126. From theContainment Vent & Purge Supply Unit, air is supplied to the 626' elevation inContainment. Exhaust air from Containment is discharged to the Reactor BldgDischarge Vent using one of tvo following modes of operation:
High Flow Vent Mode - This mode provides a high rate of air circulation,33,000 cfm. Air is exhausted from Containment through ContainmentIsolation Valves RBV-3/CV-31127 and RBV-4/CV-31128. Air operatedDampers RBV-5/CD-34006 and RBV-6/CD-34009 are open in this mode ofoperation. The Containment exhaust air then passes through a prefilter, aHEPA filter, and through the Containment Vent Exhaust Fan. Air flow passesair operated Damper RBV-7/CD-34043, past high range Radiation Detector37/RE-29075 and low range Radiation Detector F38/RE-29076, then out
the vent stack to atmosphere.Low Flow Purge Mode - This mode recirculates a small amount (4000 cfm)of Containment air through Ventlqin l i6ileri prefilter,HEPA filter, a charcoal filter, and a purge exhaust fan. The air then passesthrough the prefilter and HEPA filter and is mixed with a large volume offresh air drawn through Outside Air Dilution Damper RBV-10/CD-34005.Any contamination that may still be present in the small volume ofContainment air is significantly diluted prior to discharging to atmosphere viathe Reactor Bldg Discharge Vent. In the Purge Mode, - Damper RBV-6 isclosed and the Containment vent & purge supply fan is not operating.
In either mode the same quantity of air is exhausted to atmosphere. In The PurgeMode only a small fraction of the air is from Containment. Mode selection isperformed in the Control Room. Vent and purge lines automatically close if ahigh Containment activity occurs. The exhaust mode is used when radiation levelinside Containment is below that defined in 10 CFR 20. The Containment air iscontinuously monitored by Radiation Monitors R-I 1, R-12, and R-21.
The Containment purge & vent air supply fan can be used to supply-air to theTurbine Bldg by opening Damper TAV-1 1. Before opening TAV-1 1, DamperTAV-12 is first closed. TAV-12 is the supply to the Containment purge & vent.
3.1.6 Vacuum Relief Subsystem (See Figure KNP-RBV2)This subsystem consists of• Isolation Valves VB-IOA/CV-31337 and VB-IOB/CV-31338, and Vacuum• Breaker Valves VB-IIA/CV-31339 and VB-IIB/CV-31340, in series in each
of two large vent lines.
Each vacuum relief line permits air to flow from the Shield Bldg annulus into theContainment vessel. The vent lines enter the Containment through independentand widely separated Containment penetrations.

M S S No. 18 Rev. 1TitleReactor Building Ventilation (RBV) &
Post-LOCA Hydrogen Control Date 10/09/02 Page 7 of 39
The subsystem is designed on the basis of inadvertent or simultaneous operationof all Containment air cooling systems during normal operation or following aplant shutdown. After plant shutdown, heat inputs to the Containment areminimal. The cooling water temperatures produce the largest heat removal ratesfor the respective cooling systems. A vacuum could result in Containment due tothe rapid air cooldown.
3.1.7 Containment Air Cooling SystemThe CFCUs pull air from the immediate vicinity through the SW supplied coolingcoils and into the fan intake plenum. The vane axial fan and motor are mountedabove the plenum and discharge into the RBV ductwork distribution system.
Immediately downstream of each CFCU, up to the associated emergencydischarge damper, the ductwork is designed to withstand seismic forces. EachCFCU has a passive pressure equalizing damper immediately downstream. Thisdamper opens and allows pressure to equalize if the duct external pressure everexceeds the duct internal pressure. These pressure equalizing dampers provideprotection from the rapid LOCA pressure transient causing the downstream duct-work to collapse.
Located within a short distance of the pressure equalizing damper are EmergencyDischarge Dampers RBV-l5OA/CD-34130, RBV-15OB/CD-34131, RBV-15OC/CD-34132, and RBV-15OD/CD-34133. These dampers are normally closedand receive an open signal if Containment pressure exceeds 3.85 psig. Thesedampers allow for the design basis flow rate through the CFCUs, which providesthe required post-accident heat removal. These dampers are air operated, fail openon a loss of air, fail closed on loss of power. These emergency discharge dampershave instrument air accumulators to assure an air supply to keep the dampersclosed. When an emergency discharge damper opens, normal flow through thedownstream ductwork is severely curtailed. If both dampers of a safeguards pairgo open, cooling air to the RXCP motor is lost. Downstream of the emergencydischarge dampers ductwork, the remaining ductwork is seismically supported butmay collapse during a LOCA pressure transient.* Downstream of RBV-l5OA/D: The cool air from CFCU IA and ID is
supplied to the respective RXCP Pump Vault supply header. These CFCUscan supply only the associated Pump Vault.
* Downstream of RBV-15OB/C: The cool air from CFCU lB and IC is suppliedto either the associated Pump Vault supply header or a header up to the ringduct located above the refueling floor, elevation 649' 6".
These CFCUs are connected at opposite ends of the ring duct to maintainsafeguards separation.
The flow path of cool air through CFCU lB or ID is controlled by motor operatedDampers RBV-IOOAB/MD-32348 and RBV-1OOCD/MD-32349, respectively.* If CFCU IA is off or RBV-15OA is open, RBV-IOOAB is closed to direct the
flow from CFCU lB to the associated Pump Vault.* If CFCU ID is off or RBV-15OD is open, RBV-IOOCD is closed to direct the
air flow from the CFCU IC to the associated Pump Vault.

i_ System No. 18 Rev. 1Tite |actor Building Ventilation (REV) &
T Post-LOCA Hydrogen Control Date 10/09/02 _Page 8 of 39
Backdraft dampers are installed in the CFCU supply headers upstream of thejunction to the Pump Vault header. The backdraft dampers prevent reverse airflow through an idle fan or open emergency discharge damper.
The Pump Vault supply headers direct cooling air to the intakes of the RXCPmotors and distribute the remainder to lower elevations in Containment. The ringduct has large registers to blow cool air over the refueling floor. The ring ductalso supplies cool air to the intakes of the Reactor Vessel Gap & Neutron DetectorCooling fans.
There are separate SW supply and return headers for each CFCU. OutsideContainment one 10" safeguards train supply header divides into two 8" supplyheaders, - one for each CFCU.* Manual Isolation Valves SW-900A/B/C/D, located outside the Containment
vessel penetrations, allow for isolating each individual CFCU.* Swing Check Valves SW-901A/B/C/D, located immediately inside the
Containment vessel penetrations, provide the second redundant SW supplyContainment isolation valve.
Downstream of the CFCUs, the SW return flows in separate headers through theCRDM Shroud Cooling coil control valve stations and out through theContainment vessel penetrations. Outside the Containment vessel penetrations aremanual Isolation Valves SW-902A/B/C/D and motor operated CFCU SW ReturnIsolation Valves SW-903A/B/C/D. These motor operated valves are high capacitytwvo position valves. These valves receive an open signal at SI sequence step 5 andwhen in the full open position, provide the required post-accident cooling waterflow through the respective CFCUs.
CFCU B and D have an air operated thermostatically controlled modulating valveSW-904B or D installed in parallel with the SW Return Isolation Valves SW-903B or D respectively. Valves SW-904B or D are used to control Containmenttemperature when full CFCU SW flow could overcool Containment. These valvesthrottle the SW return flow to maintain temperature at the value set on thetemperature controller. The temperature controller is located in the Control Roomon Mechanical Vertical Panel "A".
Downstream of Valves SW-903A/B/C/D and SW-904B/D, the separate CFCUreturn headers join into two 10" safeguards headers. These headers discharge intothe 24" Aux. Bldg. standpipe. Radiation monitor R-16 monitors the two 10"safeguards return headers for radioactivity. A high radiation signal indicates aleaking CFCU cooling coil or SW header. SW-903A/B/C/ or D is closed in orderto clear the alarm and isolate the leaking CFCU.
3.1.8 Post LOCA Hydrogen Control Subsystem (See Figure KNP-RBV4)The Post LOCA Hydrogen Control Subsystem consists of:* Two redundant safe-guards Train,* Sets of instrument air (IA) supply headers,* Flow regulators,* Control valves,

* Containment Air Hydrogen Analyzers,* Piping and tie-in locations for H2 recombiners.
Each Train can provide a Containment air sample from the CDV fan subsystemexhaust, through two Containment isolation valves to the Containment AirHydrogen Analyzers. The tubing from the penetration to the analyzers is heattraced to prevent condensation of the sample.
If H2 is detected in the sample, three distinct methods can be used to control theH2 concentration below 3.5%. The methods are:* Dilute the H2 concentration by pressurizing Containment using compressed
air.* Feed and Bleed using compressed air and a controlled release to the Shield
Bldg Annulus at a flow rate of up to 100 cfm.* Install H2 recombiners which process the Containment atmosphere. The
recombiners remove H2 and return the subsequent steam mixture back toContainment.
The specific system lineups are discussed below, using Train A valves andequipment (Train B equipment numbers are in parenthesis).
To sample the Containment atmosphere:* LOCA-2A/MV-32145 (LOCA-2B/MV-32146) and LOCA-IOA/CV-31387
(LOCA-IOB/CV-31389) are opened at the Local Control Panel to provide thesample to Containment Air Hydrogen Analyzer A or B.
* Valves SA-7003A/MV-32147 (SA-7003B/MV-32148) and LOCA-201A/CV-31726 (LOCA-20IB/CV-31727) are opened at the Local Control Panel toreturn the sample to Containment.
To dilute the Containment H2 concentration:* IA is supplied through Valve IA-IOO1A/CV-31391 or IA-IOOIB/CV-31392
and manual Isolation Valve IA-1002A or IA-1002B.* Or, a portable air compressor can be connected via SA-7007A (SA-7007B)
and SA-7001A (SA-7001B).. Containment Isolation Spring Loaded ball Check Valve SA-7003A (SA-
7003B) is opened from the Local Control Panel and air flows through theContainment Isolation Spring Loaded Check Valve SA-7004A (SA-7004B).
To "Feed and Bleed" or remove H2 via a controlled release:* A H2 free air source is provided via the dilution pathway.* The Containment atmosphere is released to the Shield Bldg Annulus via
LOCA-2A (LOCA-2B) and LOCA-3A/CV-31386 (LOCA-3B/CV-31388)controlled from the Local Control Panel.
The release flow rate is locally read at FI-18239 (F1-18240) and controlled usingLOCA-3A (LOCA-3B). The released gases and particulates are processed by theShield Bldg Vent System through HEPA and charcoal filters prior to discharge tothe environment.

NS m18 Rev. IReactor Building Ventilation (RBV) & |Post-LOCA Hydrogen Control I Date 10/09/02 Page 10 of 39
All piping, valves, control stations, and power sources necessary to connect theH2 recombiners are installed. When needed, one H2 recombiner can be installed inthe Machine Shop and the second in the Aux Bldg Loading Dock. Onceconnected, flow to the H2 recombiner package is through LOCA-2A (28), LOCA-100A/CV-31724 (LOCA-IOOB/CV-31725) controlled from the Local ControlStation and local manual Valves LOCA-IOIA (10 11).
The H2 recombiners will burn the H2 using a source of combustion air. Theburning takes place in a chamber and forms steam. The subsequent steam/airmixture is returned to Containment via manual Valves LOCA-109A (109B) andIsolation Valves SA-7003A (7003B) and LOCA-201A (201B) controlled from theLocal Control Panel.
Due to NRC (Nuclear Regulatory Commission) concerns, has committedto keeping RBV-1, RBV-2, RBV-3, and RBV-4 closed above hot shutdown.Evidence suggests these 36" diameter butterfly valves may not be able to closewhen exposed to LOCA forces. Therefore, Train B of the Post-LOCA H2 ControlSystem has been modified to allow a small continuous purge/vent flow throughthe system piping.
Fresh air is supplied by a 2" Containment supply blower capable of supplying upto 50 cfm. The fan discharges past a safety/relief valve, LOCA-200, set at 1.9 psigto prevent pressurizing the Containment above the administrative limit of 2.0psig. Flow is through LOCA-109B, SA-7001B, Check Valve SA-7002B andContainment Isolation Valves SA-7003B/MV-32147 and LOCA-201B/CV-31727.
The air flow from Containment is through Containment Isolation Valves LOCA-2B/MV-32146 and LOCA-IOOB/CV-31725, and local manual Control ValveLOCA-202 to the Aux. Bldg. exhaust ductwork.
When used during normal operation, Containment Isolation Valves LOCA-2B,LOCA-IOOB, SA-7003B, and LOCA-201B must be controlled from the ControlRoom. In addition, all four valves must be open and controlled from the ControlRoom in order for the supply fan to operate.
3.2 Design BasesThe system design bases include the following:# The RBV System is capable of cooling the Containment atmosphere following a
LOCA. The system ensures that Containment pressure does not exceed the designvalue of 46 psig at 268°F (100% relative humidity).
# The RBV System is designed to reduce Containment pressure to within 3 psig ofatmospheric pressure within the first 24 hours following the LOCA. This designassures all core residual heat is released to the Containment as steam and water.
* During normal full power operation, the RBV System maintains Containment airtemperature less than 120°F.
* The Containment ventilation supply unit is capable of providing I to 1-1/2 airchanges per hour to Containment.
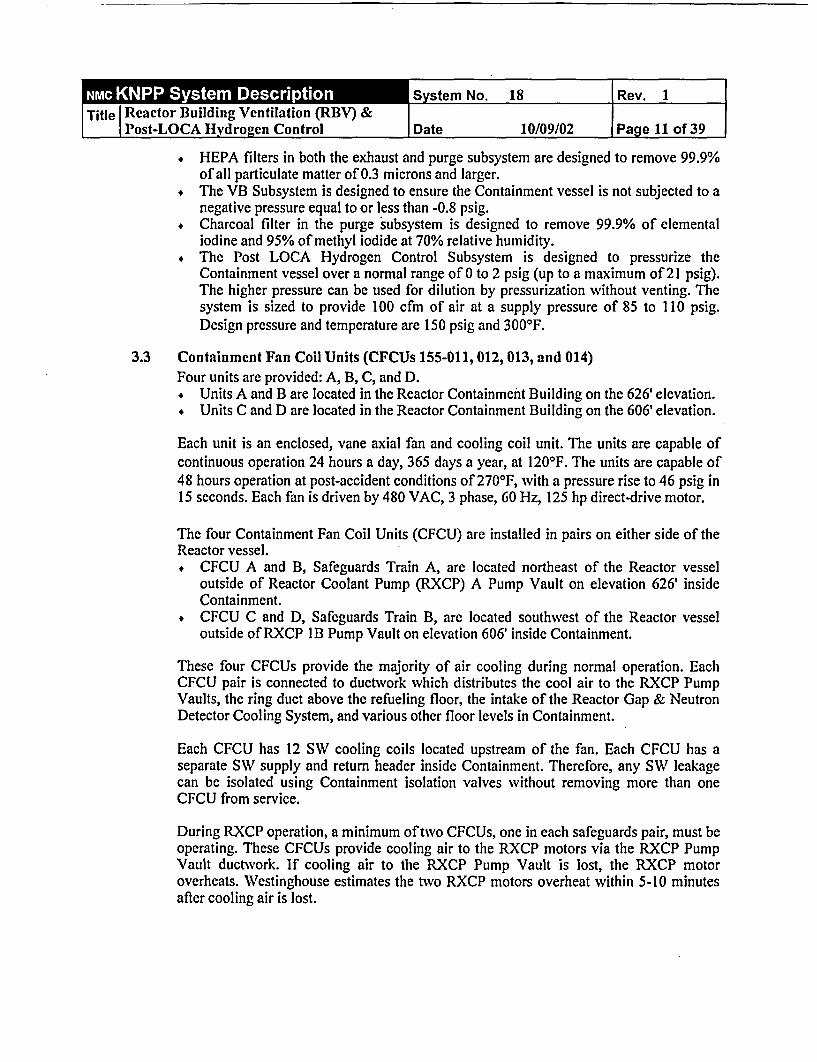
Reactor Building Ventilation (EPost-LOCA Hydrogen Control
* HEPA filters in both the exhaust and purge subsystem are designed to remove 99.9%of all particulate matter of 0.3 microns and larger.
* The VB Subsystem is designed to ensure the Containment vessel is not subjected to anegative pressure equal to or less than -0.8 psig.
* Charcoal filter in the purge subsystem is designed to remove 99.9% of elementaliodine and 95% of methyl iodide at 70% relative humidity.
* The Post LOCA Hydrogen Control Subsystem is designed to pressurize theContainment vessel over a normal range of 0 to 2 psig (up to a maximum of 21 psig).The higher pressure can be used for dilution by pressurization without venting. Thesystem is sized to provide 100 cfm of air at a supply pressure of 85 to 110 psig.Design pressure and temperature are 150 psig and 300'F.
3.3 Containment Fan Coil Units (CFCUs 155-011, 012, 013, and 014)Four units are provided: A, B, C, and D.* Units A and B are located in the Reactor Containment Building on the 626' elevation.* Units C and D are located in the Reactor Containment Building on the 606' elevation.
Each unit is an enclosed, vane axial fan and cooling coil unit. The units are capable ofcontinuous operation 24 hours a day, 365 days a year, at 120'F. The units are capable of48 hours operation at post-accident conditions of 270'F, with a pressure rise to 46 psig in15 seconds. Each fan is driven by 480 VAC, 3 phase, 60 Hz, 125 hp direct-drive motor.
The four Containment Fan Coil Units (CFCU) are installed in pairs on either side of theReactor vessel.* CFCU A and B, Safeguards Train A, are located northeast of the Reactor vessel
outside of Reactor Coolant Pump (RXCP) A Pump Vault on elevation 626' insideContainment.
* CFCU C and D, Safeguards Train B, are located southwest of the Reactor vesseloutside of RXCP 1B Pump Vault on elevation 606' inside Containment.
These four CFCUs provide the majority of air cooling during normal operation. EachCFCU pair is connected to ductvork which distributes the cool air to the RXCP PumpVaults, the ring duct above the refueling floor, the intake of the Reactor Gap & NeutronDetector Cooling System, and various other floor levels in Containment.
Each CFCU has 12 SW cooling coils located upstream of the fan. Each CFCU has aseparate SW supply and return header inside Containment. Therefore, any SW leakagecan be isolated using Containment isolation valves without removing more than oneCFCU from service.
During RXCP operation, a minimum of two CFCUs, one in each safeguards pair, must beoperating. These CFCUs provide cooling air to the RXCP motors via the RXCP PumpVault ductwork. If cooling air to the RXCP Pump Vault is lost, the RXCP motoroverheats. Westinghouse estimates the two RXCP motors overheat within 5-10 minutesafter cooling air is lost.

System No. 18 Rev. 1Title Reactor buinding ventilation k
I I Post-LOCA Hydrogen Control Date 10/09/02 1 Page 12 of 39
Typically three of the four (3/4) CFCUs are operating to provide proper air distribution.Optimum Containment temperature is maintained with thermostatically controlledmodulating valves downstream of CFCU lB and ID outside Containment. Valves SW-904B/CV-31120 and SW-904D/CV-31119, throttle the discharge flow from theirrespective CFCUs to maintain Containment temperature as selected at the Control Roomcontroller located on Mechanical Vertical Panel "A". During the summer or when laketemperature is abnormally high, the fourth CFCU is started.
If a Safety Injection (SI) signal is generated, all four CFCUs start automatically at therespective SI Train sequence step 5. At the same time, motor operated CFCU SW ReturnIsolation Valves SW-903A/CV-32060, SWV-903B/CV-32061, SW-903C/CV-32058, andSW-903D/CV-32059 go full open to provide the maximum SW flow through therespective CFCUs.
If Containment pressure exceeds 3.85 psig, the CFCU emergency discharge dampers gofull open. Dampers RBV-15OA/CD-34130, RBV-150B/CD-34131, RBV-15OC/CD-34132, and RBV-15OD/CD-34133 are located immediately downstream of the associatedCFCU. These emergency discharge dampers provide a post-LOCA (Loss Of CoolantAccident) or HELB (High Energy Line Break) flow path for cooling air. The dampers arepositioned to maximize the mixing of cooled air in the post-accident Containmentatmosphere.
In post-accident operation, the four fan coil units have sufficient capacity to maintainpost-accident Containment pressure below the design value (46 psig), even in the event ofthe failure of the Internal Containment Spray (ICS) System.
r g Sltll 00M 1011 1 S1~
Technical Manual 'XK-141422-2 Rev CHeat Removal Capability 5.588E +7 Btu/hr 2.21E+7 Btu/hrAir Flow Rate 44,000 hcfm 41,000 scfmSW Flow Rate 900 gpm >500 gpmAir Density (lb/ftl) 0.17 0.0685Air Pressure 46 psig 0 psigAir Temp Entering Coils 2700, F 1200 FSW Temp Entering Coils 85°, F 700 FAir Temp Leaving Coils 2660, F ---
Design Fouling Factor (Water Side) 0.001 0.001[Radiation Resistance, (RADS) 5.0 E+ 7
MToe | . E I -- 11--Power Supply Bus 1-51 Bus 1-61 Bus 1-51 Bus 1-61Control Room Switch ES46539 ES46540 ES-46541 ES46542DSP LOCAL/RENIOTE ES-87168 ES-87170 N/A N/ADSP START/STOP ES-87167 ES-87169 N/A N/ARing Duct Damper RBV-I00AB RBV-IOOAB RBV-IOOCD RBV-IOOCDMotor Operator MD-32348 MD-32348 MD-32349 MD-32349Fan Emerg Damper RBV-150A RBV-150B RBV-150C RBV-150DControl Oper. CD-34130 CD-34131 CD-34132 CD-34133Emerg Damp Control ES740013 ES40014 ES-40015 ES-40016
I

_ _ S y st e teNo. 18 Rev. 1
Title | Reactor Building Ventilation (RBV) &Post-LOCA Hydrogen Control Date 10/09/02 Page 13 of 39
Refer to Figure KNP-RBV5 during the following discussion of the CFCUs controls. EachCFCU is controlled by a four position switch, PULLOUT/STOP/AUTO/START, whichspring returns from STOP or START to AUTO. The PULLOUT position is maintained.The CFCU switches are located on Mechanical Vertical Panel "A" in the Control Room.* Placing a CFCU switch in the START position starts that particular fan coil unit.
Placing the switch in the STOP position stops the CFCU.# Placing the switch in AUTO allows the CFCU to be automatically started by the
respective safeguards Train SI sequence signal step 5.
CFCUs A and B respond to sequence signals from Train A and Fans C and D respond tosignals from Train B.
Separate temperature detectors are provided on the discharge of each fan. Thetemperature indications are provided on the Omniguard Panel in the Control Room.
CFCUs A and B can also be operated from the Dedicated Shutdown Panel (DSP). If theControl Room has been evacuated and the Operator is operating from the DSP, localcontrol of CFCUs A and B is taken with the associated LOCAL/REMOTE SwitchesES-87168 and ES-87170. The CFCUs are then operated using the three positionSTART/BLANK/STOP Control Switches ES-87167 and ES-87169. The controlswitches are maintained in each of the three positions.
Red (RUNNING) and green (STOPPED) indicating lights are located with the CFCUcontrol switches. If CFCUs A and B are switched to local, the DSP red and greenindicating lights are activated and the Control Room lights are deactivated. A white lightwith the switch indicates a CFCU has tripped when the unit was running. White statuslights are also supplied on the SI Ready and SI Active Status Panels, discussed later inSection 3.13.
Cooling water flow through the CFCUs (See Figure KNP-RBV3) is thermostaticallycontrolled by modulating Valves SW-904B/CV-31120 and SW-904D/CV-31119. Themodulating valves are designed to maintain optimum cooling during normal operations.Each modulating valve controls cooling water to one CFCU (SW-904B for CFCU B,SW-904D for CFCU D). If more cooling is needed, SW to a third CFCU can be cut in byopening the SW Outlet Valve SW-903A or SW-903C from the Control Room. The fourthCFCU coil cooling water can be placed in service in the same manner.
Following an accident (SI):* SW flow bypasses Modulating Valves SW-904B and SW-904D through high
capacity, two position (OPEN/CLOSE).* Valves SW-903A, 903B, 903C, 903D. SW Valves SW-903A and SW-903B can also
be controlled from the DSP.

I SystemNo. 18 Rev. IReactor Building Ventilation (RBV) &Post-LOCA Hydrogen Control Date 10/09/02 Page 14 of 39
3.3.1 CFCU Emergency Discharge Dampers (See Figures KNP-RB01, RBVO1,RBV-150A, RBV-150B, RBV-150C, and RBV-150D)
Four dampers are provided, one for each CFCU. The dampers are located a shortdistance downstream of the respective CFCU in the ductwork which is designedto withstand seismic and LOCA pressure transient forces.
I l, IIT.IT "1Manufacturer Quality Air DesignTechnical Manual XK-73317-1Design Flowrate 44,000 acfmDesign Temperature/Pressure 2930 F/46 psig
Actuator Bettis Model NCB-520-SR80,Fails open loss of air
So i VASCO Model NP-8321-A8EFails closed loss power
Each damper has a three position spring return to center, CLOSE/AUTO/OPEN,control switch mounted on Mechanical Vertical Panel "A".# When in OPEN, spring return to AUTO, the damper opens and is held open
by a damper limit switch contact.* When in CLOSE, spring return to AUTO, removes power from the solenoid
valve and the damper closes.. When in AUTO, 2 out of 3 Train A (Train B) Containment pressure
transmitters exceeding 3.85 psig causes the dampers to open. The dampersstay open until the initiating signal is removed by manually resetting Si at thepushbuttons on Mechanical Control Console "C".
Once the SI is reset, the dampers can be individually closed using the associatedcontrol switches. Red (OPEN) and green (CLOSE) indicating lights are locatedabove the associated control switches. A white status light on the SI Active StatusPanel is lit when all four dampers are open.
Two annunciators are used to alert Control Room Operators to abnormalconditions:* Annunciator 47011-35 actuates if either Train receives an automatic actuation
signal. This annunciator warns the Operators that the dampers should be open.* Annunciator 47007-44 is lit if a damper is open without an automatic signal
being received. This annunciator warns the Operator that the damper is openand should be closed. In this condition the CFCU is not capable of supplyingcooling air to the RXCP motor.

[m m 18 Rev.IReactor Building Ventilation (RBV) &
I Post-LOCA Hydrogen Control [Date 10/09/02 Page 15 of 39
RBV-150A/CD-34130 SV-33809 ES-40013 DC544RBV-150B/CD-34131 SV-33810 ES-40014 DC5-45RBV-150C/CD-34132 SV-33811 ES-40015 DC6-44RBV-15OD/CD-34133 SV-33812 ES-40016 DC6-45
Each damper has a 15 gallon capacity instrument air accumulator upstream of theactuator. This accumulator keeps the damper closed for a minimum of 4 hours ifIA is lost to Containment. Keeping the dampers closed allows continuedoperation of the RXCPs. The control power is DC from the vital buses. Thisfeature permits the damper to be energized to open per KNPP design basis insteadof fail open on loss of control power.
3.4 Reactor Support Cooling SubsystemThe purpose of the Reactor Support Cooling Subsystem is to maintain the propertemperature profile in the Reactor vessel steel at the supports, shoes, shims, andsupporting steel. This system draws air from the refueling floor and forces the air throughductwork to each of three pairs of Reactor support plenums. The six Reactor supportplenums contain heat transfer fins. From the plenums, air returns to the RXCP Vault lBand back to the refueling floor. One Reactor Support Cooling Subsystem fan is sufficientto provide air movement through the ductwork. Fans IA and lB are located at the 649'elevation on the west side of Containment.
Electric heating coils are installed directly in front of the Reactor Support Cooling fansand heat the air to maintain the proper temperature profile. The heating coils arethermostatically controlled so air temperature does not drop below 1000F. Two 100%capacity Reactor Support Cooling fans and coils are installed to provide redundancy.
Fans A and B are provided. The fans are located on the west side of the 649' elevation.Each fan is a horizontal, vane axial, direct drive unit.
" im. .Manufacturer Joy Mfg. Co.Technical Manual XK-141422-4hAir Flow Capacity 9,000 scfm (Each)Fan Pressure (Total) 110.15', waterMotor Horsepower 30 hpPower Supply 480 VAC, 3 phase, 60 HzPower Source IA / lB MCC 1-32E / 1-42EControl Switches IA / lB ES-46535 / ES-46536
Each Reactor Support Cooling fan has a motor operated damper (RBV-120A/MD-32344and RBV-120B/MD-32345) on the discharge side of the fan. (See Figure KNP-RBV6.) Athree position maintained, OFF/AUTO/ON, control switch is provided for each fanmotor. Control Switches ES-46535 and ES46536 are located in the Control Room onMechanical Vertical Panel "A".

IMS ei1 Rev. 1RTitle Ractor Building Ventilation (RBV) &Post-LOCA Hydrogen Control Date 10/09/02 Page 16 of 39
Electrical interlocks perform the following functions:* The motor operated dampers on the discharge side of a fan open automatically when
the fan motor starter is energized (Fan ON).* An annunciator is actuated if both fans are OFF, unless electric power to the fans is
off.* Only one fan can operate at a time, with Fan IA having priority over fan I B.* The electric air heaters on the suction side of the fan are turned on and off with the
respective fan operation.
The electric air heaters are coils with elements embedded in refractory steel sheaths. Theouter surfaces of the sheaths have welded fins which are coated with fired ceramic. Theelectric heater is enabled by the associated fan. The heater cycles automatically tomaintain air temperature above 1 000F. The heaters are powered from the same source asthe fans. The heater controls are located on the mezzanine level of the Aux. Bldg., justinside the entrance on the wall adjacent to the filter room.
The system draws air from the general Containment space and forces it through ductworkthrough three parallel balancing dampers. Approximately 3000 cfm is directed to threepairs of Reactor support plenums. The plenums are located below the Reactor vessel andhave heat transfer fins to improve heat transfer capability. The 9000 cfm is returned to theRXCP Vault 1B.
3.5 Reactor Gap & Neutron Detector Cooling SubsystemThe purpose of the Reactor Gap & Neutron Detector Cooling Subsystem is to limit themaximum temperature of the concrete surrounding the Reactor vessel and to keep theneutron detectors cool. The Reactor Gap & Neutron Detector Cooling Subsystem drawscool air from the ring duct above the refueling floor to two branch ducts. One branchsupplies air to the eight neutron detector wells. The other branch supplies air to thebottom of the Reactor vessel and up through the gap between the vessel and liner. Fromthese areas, air passes to the general Containment space. Two 100% capacity fans areinstalled. Normally one fan is operating and one is in standby. The two Reactor Gap &Neutron Detector Cooling fans are located at elevation 649' on the west side ofContainment.
Fans A and B are provided. The fans are located on the west side of the Containment649' elevation. Each fan is a horizontal, vane axial, direct drive unit.[ . . T M M OITM-M FNN
Manufacturer Joy Mfg. Co.Technical Manual NK-141422-4 Rev.0
dit rFlow Rate 12,000 scfmFan Pressure (Total) 6.18'1 waterMotor Horsepower 25 hpPower Supply 480 VAC, 3 phase, 60 Hz,Power Source lA/lB MCC 1-32E/1-42EControl Switches lA/IB ES-46537/ES-46538

NU SstemTitle Reactor Building Ventilation (RBV) &
Post-LOCA Hydrogen Control Date
No. 18 Rev. 1
10/09/02 Page 17 of 39
Each Reactor Gap & Neutron Detector Cooling fan has a motor operated damper (RBV-IOA/MD-32342, RBV- IIOB/MD-32343) on the discharge side of the fan. v iiTiR.~~~~~L i fs -t .Y.... Fs-1~@-di!Nerathe ratifig fcIir (See Figure
KNP-RBV6.) A three position maintained, OFF/AUTO/ON, control switch is providedfor each fan motor. Control Switches ES-46537 and ES-46538 are located in the ControlRoom on Mechanical Vertical Panel "A".
Electrical interlocks perform the following functions:* The motor operated dampers on the discharge side of a fan open automatically when
the fan motor starter is energized (Fan ON).* An annunciator is actuated if both fans are OFF, unless electric power to the fans is
off.* Only one fan can operate at a time, with Fan A having dominance over Fan B.
The system draws cool air from the fan coil unit discharge header and forces it throughductwork to two branch ducts. One branch duct supplies air to the bottom of the Reactorvessel and up through the gap between the vessel and the liner. The second duct suppliesthe eight neutron detector wells. From these areas, air passes to the general Containmentspace.
3.6 Containment Dome Vent (CDV) Fans (132-061, 132-062)Containment Dome Vent (CDV) Fans A and B prevent stratification of hot air. The CDVfans pull air and any post-LOCA hydrogen from the Containment vessel dome. EachCDV fan pulls air from the Containment vessel dome through separate supply ductworkand discharges the air at the intakes of the associated CFCU pair. The CDV ductwork andfans are designed to withstand seismic and post-LOCA pressure transients. These CDVfans are safeguards Train A and Train B respectively and receive a start signal at the SIsequence step 5.
Containment Dome Fans A and B are provided. Each fan is horizontal, vane axial, directdrive unit.
| I I !Manufacturer Joy Mfg. Co.Technical Manual XK-141422-3 Rev 0FAir Flow Rate 8,000 scfmStatic Pressure 2.0" waterMotor Horsepower 20 hpPower Supply 480 VAC, 3 phase, 60 Hz,Power Source A/B MCC 1-52B/1-62BControl Switches IA/lB ES-46589/ES-46590
(See Figure KNP-RBV6.) A three position OFF/AUTO/ON control switch is providedfor each fan motor. The control switch spring returns to AUTO from OFF or ONposition. Control Switches ES-46589 and ES-46590 are located in the Control Room onMechanical Vertical Panel "A".* Placing the switch in the ON position starts the CDV fan.* Placing the switch in the OFF position stops the fan.

Reactor Building Ventilation (I,Post-LOCA Hydrogen Control
When the Control Room switch is in AUTO, the CDV fan is automatically started by SIsignals. Automatic starting takes place on step 5 of the loading sequence. Afier sequencestarting, the fan can be turned OFF if the SI signal has been reset.
Red (ON) and green (OFF) indicating lights are located with the CDV fan controlswitches. White status lights are provided on the SI Ready Status Panel. Refer to SystemDescription 55, entitled, "Engineered Safety Features ( ESF)" for further details.
3.7 CRDM Cooling Subsystem (See Figure KNP-RBV3)
The CRDMs are cooled by drawing air from the refueling pool area up through theCRDM enclosing shroud and up through three ducts connected to the CRDM shroudplenum mounted on top of the missile shield above the CRDMs. The air leaving the ductsis pulled through two service water (SW) CRDM Shroud cooling coils to the fan inlets.The normal heat generation rate requires one fan to be operating and the second fan to bein standby. Discharge air from the CRDM fans is directed up at a high velocity so as tomix with the Containment air. If required to expedite a natural convection cooldown,both CRDM fans can be run at the same time.
Two CRDM Shroud Cooling coils, supplied with SW, were installed to increase normaloperations air cooling capacity. The air temperature at the coil intake surface is nominally237 0F.
The CRDM Shroud Cooling coils are supplied with SW from the discharge of the CFCUcooling coils. Two coils are installed to maintain safeguards Train separation. Eachcooling coil can be supplied from either CFCU of the safeguards pair.* SW Diversion Valves SW-901A-1/CV-31704, SW-901B-1/ CV-31705, SW-90IC-
I/CV-31706, and SW-901D-1/CV-31707, go partially closed to divert approximately75 gpm of CFCU flow through the CRDM shroud cooling coils.
* CRDM Shroud Cooling Coil Isolation Valves SW-910/A/B/CID, SW-913A/B/C/D,and SW-914A/B/C/D are open to permit flow through the CRDM Shroud Coolingcoils.
Upon receipt of an SI signal sequence step 5, the CRDM Shroud Cooling coils areisolated.. The SW diversion valves go full open to provide unrestricted flow through the
CFCUs,* The CRDM Shroud Cooling coils supply and return isolation valves go full closed.CRDM Cooling Fans IA and lB are provided. The fan intakes pull air through theCRDM cooling shroud. Each fan is a vertical, heavy duty centrifugal fan.
I gg I I'j
Manufacturer Westinghouse ElectricTechnical Manual XK-478-1Purchase Order XK-54106lAir:Flow Rate A 1 18,000 WcfmFan Pressure (Total) 3.0" waterMotor Horsepower 75 hpPower Supply 480 VAC 3 Phase, 60 HzPower Source IA / lB MCC 1-32E / 1-42E

18 Rev. IReactor Building Ventilation (RBV) & IPost-LOCA Hydrogen Control Date 10/09/02 Page 19 of 39
Control Switches IA / 1B ES-46823 / ES-46824Shroud Cooling Coils TwoSW Flow to each coil 75 gpmCooling Coil Heat Removal 2.13E + 6 Btu/hr
The CRDM shroud cooling coils (one in train A and one in train B) are supplied with SWfrom the discharge side of the CFCUs. (See Figure KNP-RBV3.) Each CRDM shroudcooling coil:* Is supplied from either CFCU of its respective train.* Gets approximately 75 gpm SW flow.
The SW supply and isolation valves for the CRDM shroud cooling coils operate asfollows:* To supply CRDM Shroud Cooling Coil IA/lB (IC/ID) from CFCU IA (IC), the
diversion valves SW-901A-1 (SW-901C-1) and SW-90IB-1 (SW-901D-1) gopartially closed.
* This diverts 75 gpm SW flow through the CRDM shroud cooling coil lA/lB(IC/ID).
* The CRDM Supply Isolation Valves SW-910A (SW-910C) and SW-911AB (SW-91 lCD) and the CRDM Return Isolation Valves SW-914A (SW-914C) go fully opento establish the flow path. The SW Supply Isolation Valves SW-91 lB (SW-91 ID)and the Return Isolation Valve 914B (SW-914D) remain closed, since the associatedCFCU is not supplying CRDM shroud cooling coil flow. Diversion Valves SW-901B-1 and SW-901D-1 are partially closed, even though the valves are not divertingflow through the CRDM shroud cooling coils, to balance flow through the CFCUssince they have a common header outside of Containment. To supply CRDM ShroudCooling Coil lA/1B (IC/ID) from CFCU 1B (ID), the following valves changeposition.* SW-91OB (SW-910D) and SW-914B (SW-914D) go fully open,* SWV-91OA (SW-910C) and SW-914A (SW-914C) go fully closed.
All other valves remain in the same position.
The CRDM Shroud Cooling Coils are not intended for use as post-accident cooling.Upon receipt of the safeguards CFCU start signal, SI sequence step 5:* SW Diversion Valves SW-901A-1 through D-I go fully open to provide unrestricted
SW flow through the CFCUs.* The CRDM Shroud Cooling Coils Supply Isolation Valves SW-910A through SW-
910D, and SW-91 lAB and SW-91 lCD, and the CRDM Shroud Cooling Coils ReturnIsolation Valves SW-914A through D go closed to isolate CRDM shroud coolingcoils SW.
All CRDM shroud cooling coil SW valves are air operated and fail to the safe post-accident position on loss of electrical power or loss of instrument air.

MUS yste m No. 18 Rev. IReactor Building Ventilation (RBV) &Post-LOCA Hydrogen Control IDate 10/09/02 Page 20 of 39
Each CRDM Cooling fan has a motor operated damper (RBV-1 1 IA/MD-32346, RBV-I IB/MD-32347) on the discharge side of the fan. (See Figure KNP-RBV6.) A three
position maintained OFF/AUTO/ON control switch is provided for each fan motor.Control Switches ES46823 and ES46824 are located in the Control Room onMechanical Vertical Panel "A". Red (ON) and green (OFF) indicating lights are locatedwith the fan control switches.* Normally, one fan is ON and the second fan is in standby.* If in AUTO, the standby fan starts when the running fan trips.
Electrical interlocks perform the following functions:* The motor operated dampers on the discharge side of a fan open automatically when
the fan motor starter is energized/fan ON.* An annunciator is actuated if both fans are OFF, unless electric power to the fans is
off.* Normally only one fan operates at a time with the idle fan in stand-by.
Both fans can be run at the same time to maximize the heat removal rate from the Reactorvessel head during a natural convection cooldown. Running both fans avoids a soak timeof 9 hours to prevent steam bubble formation in the Reactor vessel head area.
3.8 Containment Vacuum Relief Subsystem (See Figure KNP-RBV9)The Containment is protected from damage due to negative pressure by the VacuumBreaker (VB) Subsystem. The VB Subsystem consists of an isolation valve and a vacuumbreaker in series in each of two large vent lines. These large vent lines permit air flow forequalization between the Shield Bldg. and Containment. The vent lines enterContainment through independent and widely separated Containment penetrations. Thedesign basis for sizing the VB Subsystem is based on the inadvertent or simultaneousoperation of all Containment air cooling systems during normal operation or following aplant shutdown, when heat inputs to the Containment are minimal and the cooling watertemperatures produce the largest heat removal rates for the respective cooling systems.
Automatic vacuum relief is provided for the Reactor Containment Bldg. This subsystemcontains two vacuum relief lines between the Containment and the Shield Bldg annulus.Each vacuum relief line contains a power operated butterfly valve (VB-lOA/CV-31337),and a self actuated swing check valve (VB-I IA/CV-31339). Each power operated reliefvalve is individually controlled by a differential pressure (DP) switch. Each valve is alsocontrolled by a Containment isolation signal and a Control Room switch. Self actuatedSwing Check Valves VB-I IA or VB-I IB, have a test feature which allows testing whilethe Reactor is at power. The two power operated isolation valves (VB-IOA and VB-1OB)and swing check relief valves VB-IIA and VB-llB are located in the Shield Bldg.Annulus near the air locks.
Containment Vacuum Breaker Isolation Valves VB-IOA/CV-31337 and VB-IOB/CV-31338 are 18" wafer butterfly style with air to close, spring to open operator. Anaccumulator is provided with each valve. The valve closes in three seconds or less. Thevalve disk seats on EPT base material which maintains the valve leak-proof at maximumContainment pressure and temperature. The valve is capable of performing its designfunction after a total gamma radiation dose of 5.0E+7 rads.

System No. 18 1Rev. I1e 0 1Vi LS &IL: E-A'& "- IGLlII 111u s:_- I~Title Reactor Building Ventilation (REV) &
Post-LOCA Hydrogen Control Date 10/09/02 Page 21 of 39
Vacuum Breaker Valves VB-I IA/CV-31339 and VB-I IB/CV-31340 are swing disk typecheck valves with 21" diameter seats. A unique magnetic latch assures both tight closureup to the design opening DP and full open travel of the valve upon slightly higher DPs.The valve disk seats on EPT base material. An air cylinder exerciser is provided forperiodic cycling of the valve. A bracket and weights are provided for confirming crackingpressure and full open DP. Limit switches indicate valve position indication.
Power operated Containment Vacuum Breaker Isolation Valves VB-IOA/CV-31337 andVB-IOB/CV-31338 have air diaphragm operators which are controlled by independentthree way Solenoid Pilot Valves SV-33291 and SV-33292. The VB-IOA and VB-1OBvalves fail closed on a loss of air or solenoid power.
Each solenoid pilot valve air supply is equipped with a reservoir, capable of at least oneoperation of the VB-IOA (or VB-IOB) if the normal air supply fails. Each reservoir has apressure switch to provide a signal to the sequence of events recorder (SER) and toactuate an alarm in the Control Room when air pressure drops below 90 psig. If eithervalve VB-lOA or VB-IOB is not fully closed, an alarm is actuated in the Control Room.
0 I
Manufacturer Henry Pratt CompanyTechnical Manual XK-158-8, -9Air Operator CV-31337 CV-31338Control switch ES-46828 ES-46829Solenoid Pilot SV-33291 SV-33292Containment Isolation Train A Train BReservoir press switch DPS-16427 DPS-16428
Manufacturer GPE Division of SingerTechnical Manual XK-414-11Swing check air Operator CV-31339 CV-31340Swing Check Solenoid SV-33355 SV-33356Swing Check Valve Test PB PB-19585 PB-19586
The control logic input signals for the Containment relief isolation valves are identicaland receive inputs from the following.* Three position CLOSE/AUTO/OPEN Control Switches ES-46828, ES-46829, with
a spring return from CLOSE or OPEN to AUTO. The control switches are locatedon Mechanical Vertical Panel "A".
* Containment Isolation Signal Train A, Train B.* The Reactor Containment Bldg. to Shield Bldg. DP switch measures the difference
between the two buildings. The DP switch has a range of 0 to 1.0 psid. A reading onscale indicates that the atmosphere within Containment is at a vacuum compared tothe air pressure in the Shield Bldg. Annulus.
A reading of 0.3 psid or greater (Annulus pressure > Containment) actuates a trip signalfrom the associated DP switch to de-energize the solenoid pilot valve for Valves VB-IOAor VB-IOB. This action vents the air from the diaphragm operator causing it to open. The0.3 psid signal is dominant and prevents a Containment Isolation signal or the controlswitch from closing the VB-IOA or VB-10B. When the valve opens, air flows from the

MiSsstemNo. 18 Rev. 1Title Reactor Building Ventilation (RBV) &
Post-LOCA Hydrogen Control Date 10/09/02 Page 22 of 39
Annulus into Containment causing the DP to decrease.
With a reading of 0.3 to 0.2 psid, Valve VB-1OA or VB-lOB can be closed by turning thecontrol switch to the CLOSE position. Once closed and when the control switch springreturns to AUTO, the valve stays closed by a seal-in signal from the valve limit switch. AContainment isolation signal automatically closes the valve. When the control switch isin the AUTO position, the valve is open, and the DP switch reading is below 0.2 psid.
Valve VB-IOA or VB-lOB may be opened any time by holding the control switch in theOPEN position. If Containment pressure is greater than that in the Shield Bldg annulus,air flow from Containment is prevented by vacuum breaker Swing Check Valve VB-I IAor VB-I lB.
Self Operated Vacuum Relief Valves VB-1 IA and VB-I lB are provided, each with anair cylinder exerciser, a solenoid valve, and a test pushbutton.* When the local test pushbutton is pressed, the self operated relief valve opens.* When the test pushbutton is released, the relief valve closes.
Red (OPEN) and green (CLOSED) indicating lights are provided for the self operatedvacuum relief valves VB-I IA and VB-I1lB. Red (OPEN) and green (CLOSED)indicating lights for VB-IOA and VB-IOB are located directly above the control switches.White indicating lights for VB-IOA and for VB-lOB are on the Containment IsolationActive Status Panel and indicate the Containment isolation status.
3.9 Containment Purge & Vent SubsystemThe Purge and Vent Subsystem consists of a fresh air supply and exhaust and filtration.Isolation valves are installed both inside and outside the Containment where ducts fromthis system penetrate Containment. Air can be exhausted from the Containment by eitherof two modes.* Exhaust Mode - The first mode provides a high rate of air circulation through HEPA
(high efficiency particulate activity) filters and exhausts out the Reactor BldgDischarge Vent to the atmosphere. This mode is used when the radiation level inContainment is below the limits defined in IOCFR20. The Containment airradioactive level is constantly monitored by means of Radiation Monitors R-I 1, R-12,and R-21. High radiation, as detected by one of these monitors, generates aContainment Vent Isolation signal.
* Purge Mode - The second mode of operating the Purge and Vent Subsystem isthrough a purge fan and additional HEPA filter and charcoal filter. A small amount ofContainment air is exhausted via the prefilter, HEPA filter, charcoal filter, smallcapacity fan, through the second filter set, and then to the suction of the ventilationexhaust fan where it is mixed with fresh outside air. Any contamination that getsthrough the filters is significantly diluted before finally being discharged toatmosphere via the Reactor Bldg Discharge Vent. In either mode the same quantity ofair is exhausted to the atmosphere. In the purge mode, only a fraction of the air istaken from Containment.

MI SstemNo. 18 Rev. 1Title Rcactor Building Ventilation (RBV) &
Post-LOCA Hydrogen Control Date 10/09/02 Page 23 of 39
Both the exhaust and purge mode are controlled remotely from the Control Room onMechanical Vertical Panel "A". If Containment air activity increases above the setpointof the Containment Atmosphere Radiation Monitors R-l 1, R-12, and/or the ContainmentVent Radiation Monitor R-21, a Containment Vent Isolation signal closes ContainmentIsolation Valves RBV-1/CV31125, RBV-2/CV31126, RBV-3/CV31127, and RBV-4/CV31127.
NOTE: When the isolation valves close, the exhaust fans stop automatically.
3.9.1 Purge & Vent Supply UnitThe Purge & Vent Supply Unit is located in the Aux. Bldg. on the 657' elevationnext to the Turb Bldg Supply Fan Room. The supply unit has a conventionalsheetmetal housing with an external motor and V-belt drive to the fan. Theenclosed construction contains:* Control Dampers TAV-10/CD-34030 and TAV-l l/CD-34034,* A fresh air filter,* A steam preheat coil, and* A steam reheat coil.
During the high flow Vent Mode, the inlet fan supplies 33,000 cfm of fresh air toContainment. The Containment vent exhaust fan removes an equal quantity of airand exhausts the air through filters to the Reactor Bldg Discharge Vent. After theContainment vent exhaust fan is started, the purge & vent supply fan is started.An interlock requires the purge & vent supply fan or the purge exhaust fan to bestarted within 45 seconds or the Containment vent exhaust fan stops.
The steam preheat coil and the steam reheat coil are supplied from Heating Steamto maintain the supply air at 70'F. The purge & vent supply fan has a V-beltdrive.
____ ___ __ _.. __ __ __ __ _ __ __ _ __ __ __ _ __ __ _
Manufacturer I Westinghouse ElectricTechnical Manual XK-397-11Fan capacity 33,000 scfmStatic pressure (inches of water) 3.5"Motor Horsepower 25 / MCC 1-45EPower Supply 480 VAC, 3 phase, 60 HzAir Temp entering (minimum) -200 FAir Temp leaving 700 FFan Control Switch ES-46533Preheat Coil Air Operator CV-31057Reheat Coil Air Operator CV-31058Supply Unit Inlet Damper TAV-10/CD-34030Turb. Bldg. Makeup Damper TAV-1 I/CD-34034Supply Unit Exhaust Damper TAV-12/CD-34033

MU.18 Rev. 1Title Reactor Building Ventilation (RBV) &
Post-LOCA Hydrogen Control Date 10/09/02 Page 24 of 39
The Purge & Vent Supply Fan can be started to supply Containment for high flowvent or to supply the Turbine Bldg. with preheated air during the winter.Interlocks to start the supply fan are either the Turbine Bldg. Supply DamperTAV-1 I is open, or the Containment isolation valves are all open and theContainment vent exhaust fan is running. The fan has a three positionOFF/AUTO/ON Control Switch ES-46533 with a spring return to AUTOfeature. The purge & vent supply fan trips on any of the following conditions:* Low inlet (freezestat) temperature, below 40'F* Condensate temperature from either of the two preheat coils is less than 1000 F* DP across the inlet filter >1.5 inches of water on DPS-16403* Containment isolation signal closes all Containment valves* Loss of electrical power or loss of Instrument Air (IA)* Containment vent exhaust fan stops with all Containment dampers open* Containment purge exhaust fan starts* A high radiation level causes a Containment isolation
3.9.2 Containment Vent Exhaust FanThe Containment vent exhaust fan is a vane-axial type, direct-connected to amotor in the air stream. The fan is of the all welded steel construction. The fandelivers 33,000 scfm and is driven by a 100 hp motor. The motor is powered fromMCC 1-35E.
Ts S IManufacturer Joy Manufacturing Co.Technical Manual XK-4141422-'Rev 0Fan capacity 33,000 scfmFan Pressure (Total) 110.7'? W9Motor HP/ Power MCC 100 /MCC 1-35EPower Supply 480 VAC, 3 phase, 60 HzFan Control Switch ES-46831CNTMT Vent Exh Fan Damper RBV-7/CD-34043CNTMT Purge Exh Filter Bypass Damper RBV-6/CD-34009CNTMT Exhaust Damper RBV-5/CD-34006
The Containment Vent Exhaust Fan is provided with Control Switch ES-46831 onMechanical Vertical Panel "A". This switch is a three position OFF/AUTO/ONswitch with a spring return from ON to AUTO. The switch is maintained in theOFF and AUTO positions.
When the control switch is turned to ON, Vent Exhaust Fan Damper RBV-7 isopened by deenergizing Solenoid Valves SV-33301-01 and SV-33301-02.Simultaneously, - RBV-6 is opened by de-energizing the associated SolenoidValve SV-33286-01 and SV-33286-02.* When both dampers reach the full open position, the Containment vent
exhaust fan starts.* When the control switch is released and spring returns to AUTO, and all
Containment ventilation isolation valves are in the fully open position, the fancontinues to run for 45 seconds.

The vent exhaust fan continues to run if the Containment purge & vent supply fanis started, or if the purge exhaust fan is started. Red (RUNNING) and green(STOPPED) indicating lights are associated with the vent exhaust fan controlswitch.
3.9.3 Containment Purge Exhaust FanThe Containment Purge Exhaust Fan is a vane-axial type, direct-connected to amotor in the air stream. The fan is of the all welded steel construction. The fandelivers 4,000 scfm.
S! ~ ~ ;RT VTTIT. I2 ai.m Sl '.i 11 ti
Manufacturer Joy Manufacturing Co.Technical Manual IXK-141422-4Rev 0Air Flow Rate 4,000 scfmFan Pressure (Total) 6.8" WgMotor Horsepower 25HPPower Supply 480 VAC, 3 phase, 60 HzMCC MCC 1-35EFan Control Switch ES-46534CNTMT Vent Outside Air Damper RBV-10/CD-34005CNTMT Purge Exh Filter Assy Supply Damper RBV-20/CD-34008CNTMT Purge Exhaust Fan Damper RBV-21/CD-34042
The Containment purge exhaust fan is provided with Control Switch ES-46534 onMechanical Vertical Panel "A". This control switch is a three positionOFF/AUTO/ON switch with a spring return from ON to AUTO. The switch ismaintained in the OFF and AUTO positions.
When the control switch is turned to ON, Purge Exhaust Fan Damper RBV-21 isopened by deenergizing associated Solenoid Valve SV-33300.* Simultaneously RBV-20 is opened by deenergizing associated Solenoid Valve
SV-33285.* Containment Vent Exhaust Outside Air Dilution Damper RBV-10 is also
opened.* Containment Purge Exhaust Filter Assembly Bypass Damper RBV-6 is
closed.
When all dampers reach the fully open position and RBV-6 is closed, theContainment purge exhaust fan starts.
When the control switch is released and spring returns to AUTO, and allContainment ventilation isolation valves are in the fully open position, theContainment purge exhaust fan continues to run if the following conditions exist:* Containment vent exhaust fan is running* Inlet air freezstat indicates that the inlet air temperature is above 40'F* DP across the inlet damper TAV-10 is low* Condensate leaving the preheat coil is above I 000F
An auxiliary contact on the Purge Exhaust Fan provides a signal bypass to the 45second timer on the Containment vent exhaust fan.

NU_ System No. 18 Rev. 1T Reactor Building Ventilation (RBV) &
T Post-LOCA Hydrogen Control I Date 10/09/02 Page 26 of 39
Starting the Containment Purge Exhaust Fan also provides a signal to openContainment Purge & Vent Supply Unit Inlet Damper TAV-10 and activates thecontrol system for the flow of steam to the preheat and reheat coils.
The Containment purge exhaust filter assembly is provided with a water delugesystem. When high temperature is detected in the filter assembly by heatdetectors, Deluge Valve SV-33361 sprays water on the filter assembly and theContainment purge fan is tripped. Momentarily placing Containment PurgeExhaust Fan Control Switch ES46534 to the OFF position and removing the heatdetector signal ~hLatjdtor link that must be replaced t6renoveKiji) resets the retentive memory. Resetting the memory allows normaloperation of the Containment Purge Exhaust Fan. The removing of the heatdetector signal also stops the deluge flow of water.
The Containment Purge Exhaust Fan is stopped by any one of the followingconditions:. High DP, 0.3 psid, across the Containment purge & vent supply inlet damper* Freezstat temperature of 40'F* Turning the control switch to the OFF position* Operation of the exhaust filter deluge heat detectors* Closure of any Containment isolation valve or damper* Stopping the Containment ventilation exhaust fan* Loss of power or loss of instrument air* Condensate temperature from either of the two preheat or reheat coils below
I OO.F* A Containment isolation or high radiation signal
3.9.4 Containment Vent Exhaust Fan Filter AssemblyThis filter assembly is located on the Aux. Bldg. fan floor. The assembly consistsof a prefilter with an A5% SH -(AS9 efficiency rating and aHEPA filter with a 99.97% efficiency rating for removing particles of 0.3 micronsor larger. Local instrumentation includes a prefilter DP indicator and a HEPAfilter DP indicator.
3.9.5 Containment Purge Exhaust Filter AssemblyThis filter assembly is located on the Aux. Bldg. fan floor. The assembly consistsof a prefilter with 0 R efficiency rating and a HEPAfilter with a 99.97% efficiency rating for removing particles of 0.3 microns orlarger. A charcoal bank removes 99.9% elemental iodine and 95% methyl iodideat a 70% relative humidity. The fire protection deluge valve opens at 2000 F airtemperature. Local instrumentation includes a prefilter DP indicator, a HEPAfilter DP indicator, and a charcoal bank DP indicator.
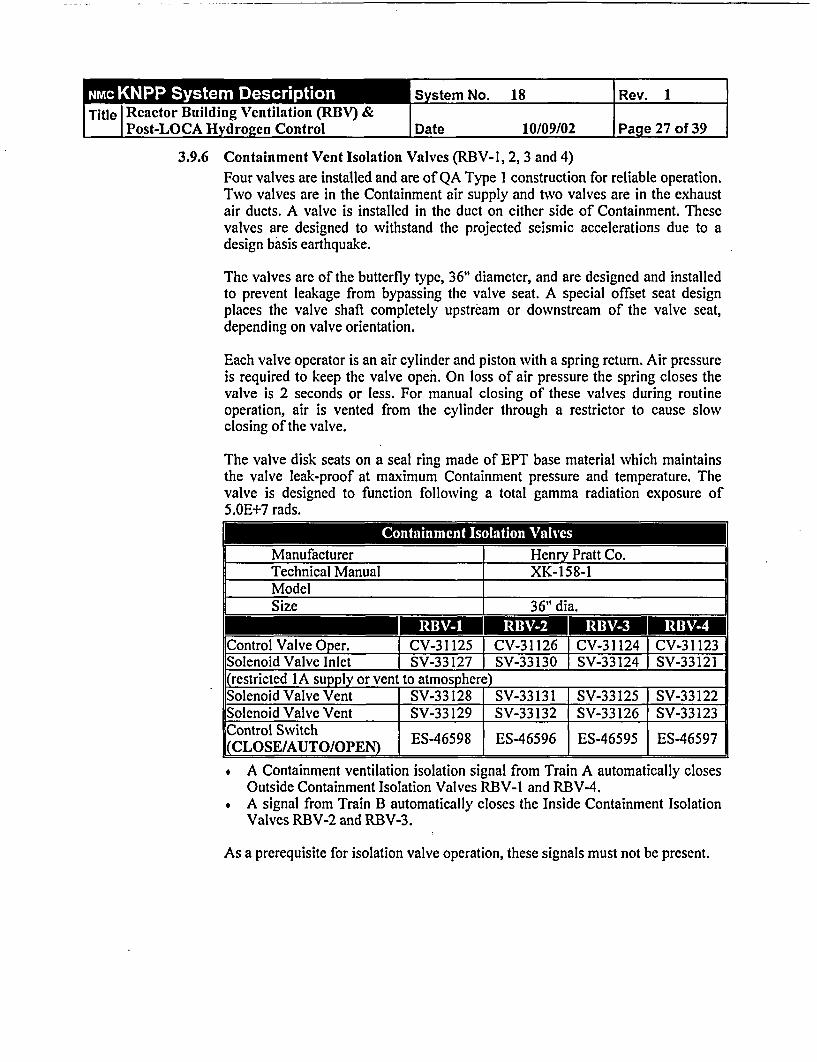
MISy Ste m No. 18 Rev. 1I RTitle Reactor Building Ventilation (RBV) &
Post-LOCA Hydrogen Control Date 10/09/02 Page 27 of 39
3.9.6 Containment Vent Isolation Valves (RBV-l, 2, 3 and 4)Four valves are installed and are of QA Type I construction for reliable operation.Two valves are in the Containment air supply and two valves are in the exhaustair ducts. A valve is installed in the duct on either side of Containment. Thesevalves are designed to withstand the projected seismic accelerations due to adesign basis earthquake.
The valves are of the butterfly type, 36" diameter, and are designed and installedto prevent leakage from bypassing the valve seat. A special offset seat designplaces the valve shaft completely upstream or downstream of the valve seat,depending on valve orientation.
Each valve operator is an air cylinder and piston with a spring return. Air pressureis required to keep the valve open. On loss of air pressure the spring closes thevalve is 2 seconds or less. For manual closing of these valves during routineoperation, air is vented from the cylinder through a restrictor to cause slowclosing of the valve.
The valve disk seats on a seal ring made of EPT base material which maintainsthe valve leak-proof at maximum Containment pressure and temperature. Thevalve is designed to function followving a total gamma radiation exposure of5.OE+7 rads.
IDM$ guManufacturer Henry Pratt Co.Technical Manual XK-158-1ModelSize 36" dia.
Control Valve Oper. | CV-31125 CV-31126 l CV-31124 CV-31123Solenoid Valve Inlet SV-33127 l SV-33130 l SV-33124 j SV-33121(restricted IA supply or vent to atmosphere)Solenoid Valve Vent SV-33128 SV-33131 SV-33125 SV-33122Solenoid Valve Vent SV-33129 SV-33132 SV-33126 SV-33123
(CLOSE/AUTO/OPEN) ES-46598 ES-46596 ES-46595 ES-46597
* A Containment ventilation isolation signal from Train A automatically closesOutside Containment Isolation Valves RBV-I and RBV-4.
* A signal from Train B automatically closes the Inside Containment IsolationValves RBV-2 and RBV-3.
i
As a prerequisite for isolation valve operation, these signals must not be present.

SystemNo 18 Rev. ITitle Reactor Building Ventilation (RBV) & l
Post-LOCA Hydrogen Control Date 10/09/02 Page 28 of 39
When no Containment ventilation isolation signals are present and the associatedControl Room switch is placed in the OPEN position, the inlet solenoid valve ispositioned to allow IA to flow to the cylinder operator of the control valve. At thesame time, the high capacity vent solenoid valves are energized to prevent ventingthe operator to atmosphere. The restricting solenoid valve allows air to be slowlyapplied to the Control Operator which slowly opens the associated Containmentisolation valve.
When the control valve reaches the fully open position and the Operator releasesthe control switch, the control switch spring returns to AUTO. The valve remainsin the fully open position. The Containment isolation valve closes due to any ofthe following conditions:* Control Room switch placed in the CLOSE position.* Containment ventilation isolation signal Train A or Train B* Loss of electrical power or loss of instrument air (IA)
If Containment Isolation Valves RBV-1, 2, 3, or 4 is closed using the ControlRoom switch, venting occurs only via the restricted solenoid valve and valveclosure is slow. The valve closes rapidly 2 seconds if the closing is a result ofdeenergizing the high capacity solenoid vent valves.
Red (OPEN) and green (CLOSE) indicating lights are provided with the ControlRoom switches. White status lights are provided on the Containment IsolationActive Status Panel.
3.10 Post LOCA Hydrogen Control SubsystemThe Post LOCA Hydrogen Control Subsystem controls the hydrogen (H2) concentrationin the post-accident Containment atmosphere. Venting and replacement of theContainment atmosphere, dilution by pressurization, or a combination of both methodscan be used. H2 free air can be introduced into and slightly pressurizes the Containment.The mixed air is discharged into the slightly negative Shield Bldg annulus at a rate up to100 cfm. The necessary piping, control valves, and power supplies for the H2recombiners has been installed. If required, the H2 recombiners are brought on site.
The Post LOCA Hydrogen Control Subsystem is connected to Instrument Air (IA) toassure an oil-free air supply. In an emergency, the supply line can be connected to aportable oil-free air compressor. The system is normally isolated. Following a LOCA, thesystem is started manually by Operations personnel, as required.

* * SstemNo. 18 Rev. 1Title Reactor Building Ventilation (RBV) & I
Post-LOCA Hydrogen Control rDate 10/09/02 Page 29 of 39
3.10.1 Air supply (See Figure KNP-RBV4)The 2" supply lines are redundant. Figure KNP-RBV4 displays the Train B side.The IA supply connects to both trains. A portable air compressor can beconnected to either train at the normally closed Valve SA-7000A/B.* A Kates constant air flow regulator (IA-IOOlA/CV-31391 or IA-IOOIB/CV-
31392) controls the air flow up to 100 cfm when IA is used. The air flow rateis manually adjustable at the valve (nominally 25 cfm). The IA is normallyisolated via Valves IA-1002A and IA-1002B.
. Isolation Check Valve SA-7004A/B (inside Containment) is a ball checkvalve with a 5 psig spring.
* Isolation Valves SA-7003A/ MV-32147 or SA-7003B/MV-32148 (locatedoutside Containment in the Shield Bldg. Annulus) are Limitorque motoroperated valve (MOV).
* Solenoid Valve SA-701OA/B vents to the annulus and prevents anythrough-line leakage to the Aux. Bldg.
Both the MOVs and solenoid operated valves are controlled with local SwitchesES-19578 and ES-19582.
3.10.2 Air VentingThe 2" vent lines draw air from the dome fan header discharge and vent into theAnnulus.* Isolation Valve LOCA-2A/MV-32145 or LOCA-2B/MV-32146 (inside
Containment) are Limitorque motor operated 2" ball valves.* Inside Containment Isolation Valves LOCA-2A or LOCA-2B are operated by
Local Control Switch ES-19571 or ES-19581.* Inside the Shield Bldg. Annulus a 1" air modulated ball valve, LOCA-3A/CV-
31386 or LOCA-3B/CV-31388, is used to regulate discharge air flow to theannulus.
* A I " air controlled valve, LOCA-1 OA/CV-31387 or LOCA-I OB/CV-31389, isalso located in the Annulus.
* LOCA-IOA and LOCA-1OB) are isolation valves in the gas sampling line tothe Containment Air H2 Analyzer A or B. LOCA-IOA and LOCA-IOB areoperated from a local panel with Control Switches CS-19580 and CS-19584respectively.
* Normally open ball Valves LOCA-1A and LOCA-IB is installed insideContainment in the line to isolate the MVs during leak testing. A 3/8" loopseal and test connection is located between the manual valve and the MV.During normal plant operation, the loop seal prevents any collection of waterin the vent line.

_ _ S ySte m No. 18 Rev. 1Reactor Building Ventilation (RBV) &Post-LOCA Hydrogen Control I Date 10/09/02 Page 30 of 39
3.10.3 Containment Supply BlowerA Containment supply blower is provided in the Train B Post LOCA H2 ControlSubsystem. The function of this blower is to continuously purge normally 30 cfmfrom the Containment atmosphere during normal power operations to the Aux.Bldg. Vent Exhaust. The Containment supply blower is powered from 120 VACRPB 8 circuit 16. The interlocks for this fan are that four Train B valves must beopen and all four local panel LOCAL/REMOTE switches are in REMOTE inorder to start this fan. The following valves must be open with the associated localcontrol switch in REMOTE:. LOCA-2B/MV-32146 * SA-7003B/MV-32148* LOCA- IOOB/CV-31725 * LOCA-20I B/CV-31727
6 I S ~I
-, gig --rLOCA-2A MV-32145 ES-19577 MCC 1-52BLOCA-3A CV-31386 CS-19579 IALOCA-10A CV-31387 CS-19580 IALOCA-100A CV-31724 ES-19686 IA/SV-33788LOCA-201A CV-31726 ES-19698 IA/SV-33814SA-7003A MV-32147 ES-19578 MCC 1-52BSA-7010A _ SA-7003A IA/SV-33394
0 , ITI~IMI In 6IseI M M I 1
LOCA-2B MV-32146 ES-40017 ES-19581 MCC 1-62BLOCA-3B CV-31388 CS-19583 -___-_S_____ IALOCA-10B CV-31389 CS-19584 !; IALOCA- 100B CV-31725 ES-40019 ES-19687 IA/SV-33789LOCA-201A CV-31727 ES-40021 ES-19715 IA/SV-33815SA-7003B MV-32148 ES-40018 ES-19582 MCC 1-62BSA-7010B I SA-7003B I ;1 '_;` '.:.' IA/SV-33395LOCA Valves K-565PO'S
Valve position indication and white status light indication is provided in theControl Room for all Containment isolation valves except check valves. Controlof the valves is exercised from local Post LOCA H2 Control Station Panels IAand lB in the CC Heat Exchanger Area. Red (OPEN) and green (CLOSE)indicating lights are provided with the control switches on the local panel.
The Post LOCA H2 Control Train B valves can be operated from the ControlRoom Mechanical Vertical Panel "A" provided the LOCAL/REMOTE switchesare in the REMOTE position.* If any LOCAL/REMOTE switch is placed in LOCAL, Alarm 47016-3 is
sounded in the Control Room.. Placing a Train B Post LOCA valve in LOCAL defeats the automatic
isolation signals from Containment Vent Isolation (CVI) and from Zone SVIsolation.
The local switches and indications are enabled and the Control Room indicationsand switches are disabled.

MI _18 Rev. 1Titleactor Building Ventilation (RBV) & 3o3
Post-LOCA Hydrogen Control I Date 10/09/02 Page 31 of 39
3.11 Mechanical Vertical Panel "A" ControlsThe Mechanical Vertical Panel "A" has the following control switches associated withthe RBV System and the Post LOCA H2 Control Subsystem:
UII I0Containment Purge & Vent Supply ES-46533FanOFF/AUTOONContainment Vent Exhaust Fan ES-46831 Spring return to AUTO from ONContainment Purge Exhaust Fan ES-46534
RBV-I ES-46598Containment Ventilation RBV-2 ES-46596 CLOSE/AUTO/OPENIsolation Valves RBV-3 ES-46595 Spring return to AUTO from OPEN
RBV-4 ES-46597Containment Purge & Vent Supply Is opened and closed in associationInlet Damper---TAV-10/ CD-34030 with various temperatures and DPSTurbine Bldg Makeup Air Winter OPEN/CLOSEOperations Damper ES-46830 Two posoPn/C ieTAV-l I/ CD-34034 position maintaiedContainment Purge & Vent SupplyUnit Exhaust Damper TAV- ES46532 CLOSE/AUTO/OPEN12/CD-34033 Spring return to AUTO from OPENContainment Exhaust Damper, ES-46531RBV-5/CD-34006
IA ES-46823 ON/AUTO/OFFCRDM Cooling Fans lB ES-46824 All three positions maintained
IA ES-46589 ON/AUTO/OFFContainment Dome Fans IB ES-46590 Spring return to AUTO
Reactor Support Cooling IA ES-46535Fans 1B ES-46536 OFF/AUTO/ONReactor Gap & Neutron IA ES-46537 All three positions maintainedDetector Cooling Fans lB ES46538Power Operated Vacuum Relief ES46828Valves VB-lI OA/CV-31337 CLOSE/AUTO/OPENPower Operated Vacuum Relief ES46829 Spring return to AUTOValves VB-1OB/CV-31338
IA ES-46539 PULLOUT/STOP/AUTO/STARTContainment Fan Coil Units IB ES-46540 With the switch spring return to
IC ES46541 AUTO from the STOP or START___ ___ ___ ___ ___ ___ ID , E S -4 6542 _ _ _ _ _ _ _ _ _ _ _ _ _ _

MISis Rev. 1Title Reactor Building Ventilation (RBV) &
I Post-LOCA Hydrogen Control FDate 10/09/02 J Page 32 of 39
mom M1- Imuff TV M1. 0111111,11
RBV-150ACD-34130 ES40013
Containment FanCoil EmergencyDischarge Dampers
RBV-150B ES01CD-34131 ES40014RBV-132 ESC0015CD-34132 E-01
The switches spring return toAUTO from CLOSE position.
RBV-150DCD-34133 ES40016
Post LOCA H2 Containment Vent, ES40017LOCA-2B/MV-32146Post LOCA H2 to Recombiner IB ES40019LOCA-1 OOB/CV-31725 OPEN/AUTO/CLOSEPost LOCA H2 Recombiner IB to Spring return to AUTOContainment Iso. LOCA-201B/CV- ES4002131727H2 Dilution to Containment ES40018Isolation SA-7003B/MV-32148
NOTE: Each of the above control switches has a red (RUNNING or OPEN) and a green(STOPPED or CLOSED) light indication with the associated switch.
3.12 Controls - LocalThe Post LOCA H2 Control valves for:* Train A are operated from Local Panel IA.* Train B valves are operated from Local Panel I B.
66111:171 _=111_Post LOCA H2 Vent Isolation, OPEN/NORMAL/CLOSELOCA-2A/MV-32145ES-19577 Spring return to NORMALPost LOCA H2 to Recombiner IA, ES 19686 CLOSE/ BLANK/OPENLOCA-1OOA/CV-31724 ES-19686 Spring return to BLANKPost LOCA H2 Recombiner IA toContainment Isolation LOCA- ES-19698 CLOSE/AUTO/OPEN201A/CV-31726 Spring return to AUTOHydrogen Dilution to Containment ES-19578Isolation SA-7003A/MV-32147Post LOCA H2 Vent Isolation,LOCA-3A/CV-31386 CS-19579(variable loader) OPEN/CLOSEH2 Sample to Gas Analyzer CS-19580LOCA-IOA/CV-31387Post LOCA H2 Vent Isolation ES-19581 OPEN/AUTO/CLOSELOCA-2B/MV-32146 Spring return to AUTO

MIS ystem No. 18 Rev. II ITitle Rcactor Building Ventilation (RBV) &
I Post-LOCA Hydrogen Control I Date 10/09/02 Page 33 of 39
w ! Mt M ! I . I !0 I 111SI1 M N O
Post LOCA H2 to Recombiner B,LOCA-1OOB/CV-31725 ES-19687
Post LOCA H2 Recombiner B toContainment Isolation, LOCA- ES-19715201B/CV-3 1727
CLOSE/AUTO/OPENSpring return to AUTO.
Hydrogen Dilution to ContainmentIsolation SA-7003B/MV-32148 ES-19582
Post LOCA H2 Vent Isolation,LOCA-3B/CV-313889 CS-19583(variable loader) OPEN/CLOSEH2 Sample to Containment Air H2 CS-19584Analyzer LOCA-IOB/CV-313892" Containment Supply Blower ES-19--- ON/OFFInstrument Air to Containment IA-IOOlA
Contol VlvesIA-10lB Local operation at the valve.Control Valves IA-100113r
CFCUs A and B can be operated from the Dedicated Shutdown Panel (DSP).
OFF/AUTO/ONCFCU A ES-87 167 Spring return to AUTO from ON
ES-87168 LOCAL/REMOTE
ES-87169 OFF/AUTO/ONCFCU B -876 Spring return to AUTO from ON
ES-87170 LOCAL/REMOTESW Cooling Valve for SW-903A ES-87123CFCU A Control SwitchesSW Cooling Valve for SW-903B ES-87125CFCU B I_ _ _ _ _ _ _ _ _ _
3.13 IndicationsThe Omniguard System is connected to monitor and alarm in the event of any abnormaltemperature conditions at the following points:* Outlet air at all Containment fan coils* Outlet air from the CRDM shroud* Outlet air from each pair of supports in the Reactor Support Cooling Subsystem* Ambient space conditions in each of the RXCP Vaults A and B* Ambient space conditions at Reactor Containment Bldg elevations 592', 606', and
626'
Six differential pressure (DP) measurements are taken between the Containment and theoutside atmosphere.
Three DP transmitters have a range of 0 to 30 psig,* Three DP transmitters have a range of 0 to 60 psig.
All six transmitters provide signals to the engineered safeguards circuits.

*System No. 18 Rev. ITitle Reactor Building Ventilation (RBV) &
Post-LOCA Hydrogen Control Date 10/09/02 Page 34 of 39
Four DP signals are used to provide initiation of the Vacuum Relief Subsystem.Containment relative humidity is measured and indicated in the Control Room.* One normal Containment DP transmitter provides indication in the Control Room of
-0.5 to +2.5 psig.* One DP transmitter having a range of 0 to 0.8 psid measures the difference in
pressure between the Shield Bldg. Annulus and the Reactor Containment Bldg.* Two DP switches measure the difference between Shield Bldg. Annulus and the
Reactor Containment Bldg.
In the Post LOCA H2 Control Subsystem:* Independent flow indicators provide the Operator with air flow information to adjust
the throttle valve through air loaders.* A secondary instrument (DPI-I 1407) for the Annulus to Aux. Bldg. DP, provides a
warning to the Control Room Operator if the air flow is causing a loss of normalShield Bldg. Annulus DP.
An IA flow of 25 cfm is sufficient to limit H2 concentration inside Containment. Amaximum air flow limit of 100 cfm on the Kates valve ensures the Shield Bldg. AnnulusDP is maintained.
11 film I Sun 7M, TIM�IA Supply (Kates) 0-1I00 cfm 0-25 113 MS Pen. Rm IA-1002AIA Supply (Kates) 0-100 cfm 0-25 1A MS Pen. Rm IA-I 002BEmerg. Air Supply -- -- lB MS Pen. Rm SA-7001AEmerg. Air Supply -- -- IA MS Pen. Rm SA-7001BIA Air Flow to CNTMT 20-200 cfm 0 lB MS Pen. Rm FI-18237IA Air Flow to CNTMT 20-200 cfm 0 IA MS Pen. Rm FI-18238IA Press Upstream 0-160 psig 93 psig IB MS Pen. Rm P1-I 1405IA Press Upstream 0-160 psig 93 psig IA MS Pen. Rm PI-11406IA Press Downstream 0-160 psig 93 psig lB MS Pen. Rm PI-11403IA Press Downstream 0-160 psig 93 psig IA MS Pen. Rm PI-11404Containment Pressure 0-30 psig 0 P141505-01Containment Pressure 0-30 psig 0 P141505-02Containment Pressure 0-30 psig 0 P141505-03Containment Pressure 0-60 psig 0 P141505-04Containment Pressure 0-60 psig 0 Control Room P141505-05Containment Pressure 0-60 psig 0 P141505-06Containment DP 0-0.8 psid 0 PI-41512-01Shield Bldg DP -.5-2.5 psid 0 P1-41512-02Annulus to Aux. Bldg. Psid 0 PI-11407

* _ 'S . 18 Rev. 1Reactor Building Ventilation (RBV) &
I Post-LOCA Hydrogen Control I Date 10/09/02 Page 35 of 39 I3.14 Alarms - RBV System and Post LOCA
ponse Ro LfO7 N t7s fms-
3.15
47005-32 CNTMT VACUUM BKR VALVES OPEN47005-33 CNTMT VAC BRKR AIR RSVR PRESS LOW47005-34 INLET DAMPERS AIR RSVR PRESS LOW47005-41 REAC GAP AND NEUTRON DET FAN OFF47005-42 REACTOR SUPPORT COOLING FANS OFF47005-43 CRDM COOLING FANS OFF47007-44 CNTMT FAN COIL EMERG DISCH DMPR ABNORMAL47011-35 CNTMT EMERG DISCH DMPRS ACTIVATED47016-33 POST LOCA H2 lB VALVES IN LOCAL CONTROL47022-13 TRAIN A CONT RM SWITCH IN PULL OUT47022-14 TRAIN B CONT RM SWITCH IN PULLOUT47023-15 CONTAINMENT VENTILATION ISOLATION47030-33 BUS 1-51 FEEDER BREAKER OVERCURRENT TRIP47032-33 BUS 1-61 FEEDER BREAKER OVERCURRENT TRIP
Sequence of Event Recorder iSER)A Response Sheets mi control Roo5m nfoSetpoint specifics!
49001202 RBV, VACUUM BKRR VLV IA OPEN49001203 RBV, VACUUM BRKR VLV 1B OPEN49001204 RBV, AIR RSVR TNK IA PRESS LOW49001205 RBV, AIR RSVR TNK lB PRESS LOW49001288 RBV, INLET DMPRS AIR RSVR PRESS LOW49001285 RBV, FAN COIL IC SWITCH PULLED OUT49001286 RBV FAN COIL ID SWITCH PULLED OUT49001296 RBV FAN COIL 1A SWITCH PULLED OUT49001298 RBV, FAN COIL lB SWITCH PULLED OUT49001580 CONT FAN COIL ID BKR 15104 TRIP49001581 CONT FAN COIL ID BKR 15104 OC TRIP49001582 CONT FAN COIL IC BKR 15105 TRIP49001583 CONT FAN COIL IC BKR 15105 OC TRIP49001584 CONT FAN COIL lB BKR 16104 TRIP49001585 CONT FAN COIL 1B BKR 16104 OC TRIP49001586 CONT FAN COIL 1A BKR 16105 TRIP49001587 CONT FAN COIL IA BKR 16105 OC TRIP

e18 Rev.RTitle Ractor Building Ventilation (RBV) &Post-LOCA Hydrogen Control Date 10/09/02 Page 36 of 39
3.16 System InterrelationshipsThe Reactor Building Ventilation System interrelates with the following systems inperforming its design functions:
Reactor Coolant The RBV provided cooling to various instrumentationSystem (RCS) associated with the RCS.Control Rod Drive Is provided with cooling to remove excess heat from theMechanisms (CRDMs) CRDMs to ensure proper operation without overheating.Neutron Detectors Are cooled to ensure the Nuclear Instrumentation System
provides accurate indication of Reactor power.Fuel Handling & Is provided cooling to the general spaces to maintainContainment General temperature conditions suitable for equipment and personnel.Instrument Air Operates many pneumatic valves and dampers.
* Provides cooling water to the CFCUs and to the CRDMshrouds.
SW System * Provides deluge water for the charcoal filter banks if theheat detectors exceed 2001F.
Connections are provided in various locations, for monitoringProcess Sampling for particulate activity, radioactive iodine, noble gases
(Xenon, Krypton), and tritium. (See Figure KNP-RBV4)HydrogenRecombiner Connects into the Post LOCA H2 Control Subsystem.(portable)Electrical Distribution Supplies electrical power for fans, fan coil units, motorSystem operated dampers, etc.
RBV System Interconnects with the Shield Bldg Ventilation (SBV) System_ and the Aux Bldg Ventilation (ACA) System.
3.17 System InterlocksThe 2" Containment Supply Blower in the 2" vent subsystem is interlocked to preventstarting unless all four Train B local panel LOCAL/REMOTE switches for valvesLOCA-2B, LOCA-lOOB, LOCA-201B, and SA-7003B are in REMOTE.
The CRDM Fans IA and lB are interlocked with the associated motor operated damperon each fan discharge. The damper automatically opens when the fan is started.Annunciator 47005-43 is actuated if both fans are off.
The Reactor Gap & Neutron Detector Cooling Fans IA and lB are interlocked with theassociated motor operated damper on each fan discharge. The damper automaticallyopens when the fan is started. Annunciator 47005-42 is actuated if both fans are off. Onlyone fan can operate at a time.
The Reactor Support Cooling Fans A and B are interlocked with the electrical heatingcoils upstream of each fan. The associated fan must be running for the heating coil tocycle to maintain temperature. Only one fan can operate at a time.

MUS yste m No. 18 Rev. 1Title Reactor Building Ventilation (RBV) &
Post-LOCA Hydrogen Control Date 10/09/02 Page 37 of 39
The Containment Purge Exhaust Fan trips on any one of the following:. High DP, 0.3 psid, across Containment Purge & Vent Supply Inlet Damper
TAV-10# Freezestat temperature of less than 401F* Initiation of the exhaust filter deluge heat detectors* Closure of any Containment isolation valve or damper* High Containment radiation, Aux. Bldg. vent exhaust high radiation, or any CVI
signal* Stopping the Containment vent exhaust fan* Loss of power or loss of IA# Temperature of the condensate from either of the two preheat coils is below IOOOF* Rotating the control switch to OFF
The four CFCUs receive an automatic start signal from an SI sequence step 5. If bothfans supplying a header are running, motor operated Dampers RBV-IOOAB or RBV-IOOCD (in the header) automatically open to permit direct air flow to the upperContainment elevations.
4.0 Precautions and LimitationsThe Containment should be kept at approximately atmospheric pressure at all times.
During plant startup from refueling to hot shutdown, thermal expansion of the Containment airmust be released by operation of the Containment Purge & Vent Subsystem, or via the 2" PostLOCA H2 vent subsystem.
Discharge permits should be obtained from Radiation Protection Group when Containmentpressure reaches 1.5 psig. A Discharge Permit is not required if using the 2" vent subsystem.
Do not initiate a Containment purge or vent if Annunciator 4701642 (AUTO CVI ON HI RADDISABLED) is in an alarmed condition.
Reactor Containment Building purge must be filtered through the purge filter (HEPA-charcoal)whenever the concentration of iodine and particulate isotopes is to be reduced on a batch basis.(TS 7.4.4)
When the Reactor is critical, NRC notification is required prior to ventilating Containment withthe 36 inch RBV valves.
During release of gaseous wastes from Containment, the following conditions must be met:
* R-12 or R-21 monitor is operable, R-21 Sampler is operable, and R-21 flow rate measuringdevices are operable.
* If less than minimum channels operable, take appropriate actions as described in TechnicalSpecifications, TS Table 7.2.

While performing a gaseous waste release to the Aux. Bldg. Vent System using the 2"Containment vent release path, at least one train of Aux. Bldg. Vent System must be operating.
All Containment Vent Operations must be recorded on the Containment Vent Data Sheet andlogged in the Control Operator Log. Upon completion of the Containment vent, the ContainmentVent Data Sheet is forwarded to the Health Physics Supervisor.
Do not allow Containment pressure to exceed 21 psig or H2 concentration to exceed 3.5%.
Do not allow the Shield Bldg annulus to become pressurized relative to the Aux Bldg asindicated on DPI-I 1407 at the Post LOCA H2 Control Panel.
5.0 References
Summa N-RBV-18-CL, N-RBV-18A, B & C, A-RBV-182.0 Functions
USAR 5.4 OPERM-601 E-1608 E-3104OPERM-403 OPERM-602 E-1609 E-3310
3.0 OPERM-547 E-2068Design I & C Description #18, WSHRAE-Std. 52.1 992
Description Annunciator Response 47005-,47007, 47011-, 47022-, etcFor complete listing of DCRs associated with System 18, see.
programs\KNPP applications\ Physical Changes\DCR Database\Sys 184.0 N-SBV-24-CL, N-RBV-18C
Precautions TS 3.3.c.l.C, 3.3.c.2.B & C, 3.6.c. & d.& Limitations Annunciator Response 47005-,47007, 47011-, 47022-, etc
I & C Description #18
References KNPP Technical Specifications6.0 iR~er oacntrolled copy of K1PP poEdfiii
Procedures
7.0 See attached Figures
5.1 Technical SpecificationsNOTE: Refer to a Controlled Copy of the KNPP Technical Specifications for plantoperations.
th FS 13 J.3 .c.1A.
II'S 3.3tc.1. A3
TS 3.3.c.2.C
The Reactor must not be taken critical unless tvo trains ofContainment fan coil units are operable with two fan coil units in eachtrain (all four fan coil units must be operable).During power operation or recovery from an inadvertent trip, any oneof the four trains of Containment fan coil units or Containment spraytrain may be out of service for a period of up 7 days provided theremaining three trains are operable.During power operation or recovery from an inadvertent trip, any twoof the four trains of Containment fan coil units or Containment spraytrain may be out of service for a period of up to 72 hours provided theremaining two trains are operable.

-I_ System No. 18 Rev. IRTitle Ractor Building Ventilation (RBV) &
I Post-LOCA Hydrogen Control Date 10/09/02 _ Page 39 of 39
TS 3.8.a.8
If the internal pressure of the Reactor Containment Building exceeds 2psig., the condition must be corrected within eight hours or theReactor must be shutdown. The Reactor must not be taken above thecold shutdown condition unless the Containment ambient temperatureis greater the 400 F.The Containment Ventilation & Purge Subsystem, including thecapability to initiate automatic CVI, must be tested and verified to beoperable immediately prior to and daily during refueling operations.
6.0 ProceduresNOTE Reert a intolle~py.pfNP~rocdurs~I
7.0 Appendices
7.1 Attached Figures
KNP-RBVI Reactor Building Ventilation (RBV) I EERM-602KNP-RBV2 Reactor Building Ventilation (RBV) 2 -------- I02KNP-RBV3 Reactor Building Ventilation 3 OPERM-547KNP-RBV4 Post LOCA Hydrogen Control - Train B OPERM-403KNP-RBV5 Containment Fan Coil Logic E-3104KNP-RBV6 Containment Vent & Purge Supply Fan/Rx Support OPERM-60l
______Cooling bPEkM-o2'
KNP-RBV7 RBV Fan Logics 160
KNP-RBV8 Containment Purge & Vent Supply & Exhaust Fans g-1608KNP-RBV9 Vacuum Relief& Containment Isolation Logic E-1608 & E-1609
QOTE-,sh "Figure" (drawings) 'p'#&9ously~associated with the-System Descriptionsiwl not be-evised and updated 'at this time: Instead (obsolete) copies of -these Figures have beenAam'6ped j1STORICAL and temporarily attached
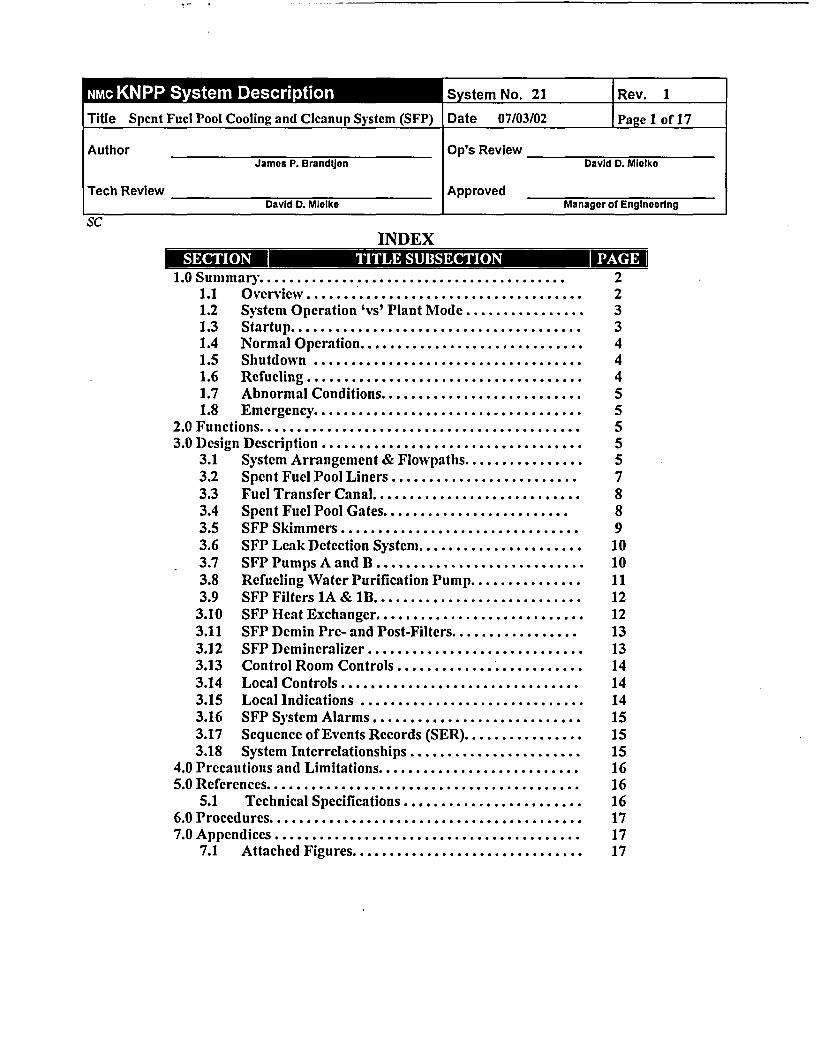
mm - IM stem No. 21 Rev. 1
te 07/03/02 Page 1 of 17Title Spent Fuel Pool Cooling and Cleanup System (SFP) I Dal
Author Op's ReviewJames P. Brandtjen David D. Mielke
Tech Review ApprovedDavid D. MWelke Manager of Engineering
SC
INDEX
1.0 Summary . ..................................... 21.1 Overview ....................................... 21.2 System Operation 'vs' Plant Mode ...... .......... 31.3 Startup ....................................... 31.4 NormalOperation .............................. 41.5 Shutdown .................................... 41.6 Refueling ..................................... 41.7 Abnormal Conditions ........................... 51.8 Emergency .................................... 5
2.0 Functions . . 53.0 Design Description .. 5
3.1 System Arrangement & Flowpaths. 53.2 Spent Fuel Pool Liners. 73.3 Fuel Transfer Canal. 83.4 Spent Fuel Pool Gates. 83.5 SFP Skimmers. 93.6 SFP Leak Detection System .103.7 SFP Pumps A and B .103.8 Refueling Water Purification Pump .113.9 SFP Filters 1A & 1B............................ 12
3.10 SFP Heat Exchanger .123.11 SFP Demin Pre- and Post-Filters .133.12 SFP Demineralizer .133.13 Control Room Controls .......................... 143.14 Local Controls ......................... .. 143.15 Local Indications .143.16 SFP System Alarms .153.17 Sequence of Events Records (SER) .153.18 System Interrelationships .15
4.0 Precautions and Limitations . .165.0 References .. 16
5.1 Technical Specifications .166.0 Procedures . ..................................... 177.0 Appendices .. 17
7.1 Attached Figures ............................... 17

- I- *o.21 WRev. 1Title Spent Fuel Pool Cooling and Cleanup System (SFP) Date 07/03/02 Page 2 of 17
1.0 Summary
1.1 Overview (Figure KNP-SFP1)
The purpose of the Spent Fuel Pool Cooling and Cleanup (SFP) System is to:* remove decay heat from the spent fuel,+ filter and demineralize the water in the spent fuel pools,* maintain hiOrum boron concentration in the SFP water with boron addition via the
Chemical and Volume Control System (CVCS),* maintain the SFP temperatures below a maximum temperature of 1500 F.
The Spent Fuel Pool currently has storage locations for [2C5 fuel assemblies in highdensity storage racks. Sgien~t Fe-lP6ol' ciliin y .m ;is desi removedecay
eat fro 1seiihiel sftored inAthe pools. 'The'systenm is' currently analyzed to ensure heatemovaapabilyj uiva t to hedea heat generated jys205fuel as embi es
The SFP System is located in the northwest portion of the Auxiliary Building (Aux.Bldg.). This arrangement and location allows accessibility for maintenance and visualinspection of the components within the system during normal operation. The SFP area issurrounded by a cyclone fence to prevent accidents and provide additional security forSpecial Nuclear Material. The immediate area is restricted. Flotation devices areavailable if the need arises.
The basic SFP System components for normal cooling and cleanup of the spent fuel poolsinclude:* SFP Liners+ SFP Pumps A and B* SFP Filters A and B+ SFP Heat Exchanger (HX)+ Associated valves, piping and instrumentation.Each SFP pump supplies about 1/2 the total design flow of the SFP heat exchanger tubeside.
The purification and cleanup components consist of:* SFP Demineralizer (Demin.) Prefilter* SFP Demin.* SFP Demin. Post-Filter* Refueling Water Purification Pump* Purification Flow Control Valve FPC-204# Associated piping, manual valves, and instrumentation
Redundancy of the components used in this system is not required because of the largeheat absorption capacity of the water in the spent fuel pools.* If one SFP pump should fail, the remaining duplicate SFP pump can handle the
maximum heat load following a normal refueling.* If a SFP pump failure should occur with [h-eeshly d fuelfo a complete
tore off-oaa m the pools, the water inventory is large enough to absorbiheat releasedllowig ffcin torepair oireplace the failed'pump.

S. - 3- 0*M
-
s No. 21 |Rev. 1 l
| Title Spent Fuel Pool Cooling and Cleanup System (SFP) I Date 07/03/02 | Page 3 of 17 |
Since the possibility of failure of the SFP Heat Exchanger exists, the Residual HeatRemoval (RHR) heat exchanger can be used as a backup by diverting SFP coolantthrough existing interconnections.
The return lines Oc t -- bbir the top of the fuel. Loss of coolant fromthe spent fuel pools by line failure and subsequent siphon action is prevented byinstallation of check valves. The SFP suction piping connects to the SFP well above thefuel assemblies to prevent loss of cooling or shielding due to a system failure. Vi'he7gint
.ife-esigned wit -netitron-ausorlng iplates-etvee the storage cells: -Theracks in pools A and lB c'6ntain boron carbide"plates.'The Canal Racks'c6ntain Boralplates.W Te fneut'on absorbing 6 pa.prevent _ c_ water in thepooisJ A leak detection system is installed and allows checking the liner welded seamsfor leaks.
1.2 System Operation versus. Plant Modes
I-la i1fllStartup The Spent Fuel Pool Cooling and Cleanup (SFP) System is normally
NormalPower operating at all times regardless of the plant conditions. Thismanually controlled system may be safely shut down for reasonable
Shutdown time periods provided the KNPP Technical Specifications (TS) arereviewed and met.
Refueling The SFP System may be aligned for refueling cavity purification.
Casualty See Section F of this System DescriptionEventsInfrequent Not applicableOperations
Maintenance may be performed on the SFP System while the plant isMaintenance operating as long as KNPP Technical Specifications are referred to
and limiting conditions for operation are met.
1.3 Startup (OP'sf N-SFP-21, N-SFP-21-CL)With all valves aligned to allow drawing water from both pools and return to Pool g
N-B with both pumps and filters aligned for service and with the heat exchanger(HX) properly aligned, the SFP loop is started by turning the Control Room controlswitch for one SFP pump to the ON position. Resins should be charged into the SFPdemineralizer prior to this time. Flow through the purification bypass loop is establishedby manually setting the desired flow rate through the loop on the self contained flowregulating valve FPC-204, and opening the inlet and return valves, FPC-200 andFPC-206 respectively, for the purification loop. The SFP System is now in its normaloperational mode. The SW System should be operable and aligned to provide water to theSFP HX.
Startup of the RWST purification loop is made by properly aligning valves to draw waterfrom the RWST and to return it to the RWST, while at the same time isolating the SFPloop from the purification loop. The RWST purification pump is started locally.

m 3-i: .2s, No. 21 1Rev. I
| Title Spent Fuel Pool Cooling and Cleanup System (SFP) I Date 07/03/02 Page 4 of 17
1.4 Normal Operation (OPI N-SFP-21)During normal operation of the SFP System, only one of the two SFP pumps is used todraw water from the pool and circulate the water through the filters, heat exchanger, andback to the pools. , 9io dbethju are us to jai
m During this process, approximately 10% of the SFP pumpdischarge flow is passed through a pre-filter, demineralizer, post-filter loop and returnedto the main flow path at the heat exchanger outlet. The purification loop is provided toremove fission products which can contaminate the pool as a result of leaking spent fuelassemblies. Also, the purification loop is capable of cleaning and purifying the waterstored in the refueling water storage tank (RWST). Simultaneous purification of the spentfuel pool water and the RWST is not possible.
Normal operation of the SFP loop is with one pump operating (red light ON, switch inON) and with one pump in AUTO (green light lit). Both SFP filters are in service. Wateris taken from an B through skimmers and returned to d B. Thepurification loop is in service at the design flow rate of 60 gpm. SW is available to theSFP HX. Low SFP level alarms should be investigated for leaks from the SFP System.
Low level alarms are most probably caused by excessive seal leakage from the SFPpumps or through valve stems. Misalignment of the RWST purification loop could alsobe a cause.
Normal makeup is made from the RWST through the use of the RWST purificationpump, or by the use of the boric acid blender in the CVC System. High level alarms aremost probably the result of SW in-leakage through the SFP HX. Misalignment of theRWST purification loop could also be a cause. High temperatures are caused by loss ofcooling, most probably by malfunction of the SW Flow Control Valve on the outlet of theSFP HX shell side.
1.5 ShutdownThe SFP cooling and purification loops may be safely shut down for reasonable times forthe maintenance and/or replacement of malfunctioning components. The entire SFPSystem may be shutdown from the Control Room by turning both SFP pump controlswitches to STOP.
1.6 RefuelingDuring refueling, the SFP System also provides the capability of filtering refueling cavitywater for improving visual clarity. Filtering is accomplished by passing water to thesuction of the SFP pumps through a spectacle flanged interconnection with the RHRSystem. Water is returned to the RHR heat exchanger outlet or to the SFP. If water isreturned to the SFP, water flow through the transfer tube is necessary to equalize waterlevels.
Es i Tnt drduf'aliid.

-M-7* * Sys. 21 Rev. 1
|Title Spent Fuel Pool Cooling and Cleanup System (SFP) |Date 07/03/02 Page 5 of 17 I
1.7 Abnormal Conditions (OP# A-SFP-21)This procedure describes the action to be taken on a pump trip, pool level high/low levelalarm, high temperature alarm, and a SFP HX DP low alarm. The procedure providessymptoms (annunciators), immediate actions and subsequent actions to correct the causeof the alarm and restore to normal conditions.
If a failure in the SFP HX occurs, the affected tubes could be plugged or RHR HX IAcan be made available through existing valving and piping. This action is accomplishedby manually closing the valves FPC-7 and FPC-8 at the inlet and outlet of the SFPexchanger and opening the spectacle flanges thereby diverting the coolant through theRHR HX and returning the cool water to the SFPs.
1.8 Emergency (OP# E-SFP-21)~ '-~ ;*~ , ',.' ,i-i.''ir 7 7e
Assuming that a leak or rupture might occur in the SFP pump suction lines, these linespenetrate the pools it below the high water level, elevation 4 . This level assuresthat adequate coolant remains in the pools to allow tmfor reair
If a SFP pump fails thj fl omesis harged fullcore ff-lad stored in thepools, the pools have large enough volumes to absorb the heat generated for a sufficienttime to allow the failed pump to be repaired or replaced.
X;-~~~~~ ~ ~~ -~v- -~ - v- _ _ _ ~ - _ P d w- . _6.V i , -.- a n -
If h$ig sad9ation 7lar tor recover the ,s~mevel.
2.0 FunctionsSpecific functions include the following:* Cooling is provided by two SFP pumps and a SFP heat exchanger.* Cleanup is provided by a pre-filter, demineralizer, post-filter, and a purification pump and
flow control valve.
All components in the system are QA Type 3. The piping between the pools and the isolationvalve at the point where the piping enters the concrete walls are QA Type 1. hdso','itheSWipingand componn s that provide the-emergency spyrQA The
piping and valves of the leak detection system of the spent fuel pools are QA Type 2.
A leakage collection and detection system allows checking the liner seam welds for leakage.
3.0 Design Description
3.1 System Arrangement and Flowpaths (See Figure KNP-SFPl)The SFP System was originally designed to remove the heat released from 1-1/3 Reactorcores stored in both pools A and B. SFP System heat removal requirements wereestablished on the assumption that:* 1/3 Reactor core is stored with a 30 day decay time,* 1/3 Reactor core is freshly discharged from the Reactor with 5 days decay time,* 1/3 Reactor core with 10 days decay time,* 1/3 Reactor core with 15 days decay time.

mI- . 2s No. 21 1 Rev. 1 -1| Title Spent Fuel Pool Cooling and Cleanup System (SFP) I Date 07/03/02 | Page 6 of 17 l
With the installation of high density storage racks, and the absence of commercial fuelreprocessing, the SFP heat removal capabilities have been re-evaluated. The revised heatremoval requirement is based on fl1o of6f-load that com lete yCis~i#he el ackcapacty. Assuming this decay heat load and normal operatingconditions, the SFP System can maintain the SFP water at less than 1500 F. Following anormal refueling cre d) the SFP System maintains a maximum of R'°FE
The two SFP pumps deliver approximately 60 gpm to the SFP demineralizer (purificationloop). The cleanup portion of the SFP System consists of two half-capacity filters that aresized to pass 425 gpm each. The filters remove particulate matter down to 15 micronabsolute. The maximum differential pressure (DP) across the filters is 10 psid.
The coolant in the SFP System is a solution of boric acid in water consisting of about20 ppm boron. Boric acid makeup is provided by the CVCS and is injected into theSFP System downstream of the SFP heat exchanger.
All material used in construction of the entire SFP System, including the SFP liners, isaustenitic stainless steel (SST).
During normal operation, one SFP pump is operating and one SFP pump is in AUTOstandby. The demin prefilter and post-filter are in operation. Surface skimmers are inservice with water taken from both PFols A an-d7Ba d 6eturned to FA and B. Thepurification loop is operating at a design flow rate of 60 gpm. SW is available to removethe heat from the SFP HX. Normal makeup is available from the boric acid blender in theCVCS.
Suction is taken on the spent fuel pools through 6" piping that penetrates the SFP lessthan 3' below the water surface. The location of the suction piping prevents E a singleactive failure from uncovering the fuel assemblies.
The operating SFP pump discharges into a common 6" header. Flow is through the SFPfilters, A and B in parallel, to the SFP HX. Some SFP flow (60 gpm) goes through theprefilter, demin, and post filter to remove fission products and reduce SFP water activity.Flow through the demin path is regulated by Flow Control Valve FPC-204/ CV-31293. Across-connect between the RWST and the SFP demin is provided. Either the SFP or theRWST may be connected to the demin for purification. Normally the SFP is connected tothe demin. The Flow Control Valve FPC-204 must compensate for the differingdischarge pressures of the SFP pumps and the RWST purification pump.
The SFP HX receives the water from the outlet of the SFP filters. SW flows through theshell side of the SFP HX. Cross-connects with spectacle flanges are provided to the RHR1A HX. If the SFP HX is out of service, RHR IA HX is the alternate heat removal path.The outlet from the SFP HX goes to the return header.
The SFP return header splits and enters SFP's A and B Wbo~v the top of fuel assemblies.Check valves in the return lines just before entering the pool prevent siphoning the poolin the event of a line failure. Tapping into the return header are the boric acid additionline from the CVCS, Reactor makeup water line, and 6" emergency fill line from the SWSystem.

S. - I I e1 S a
-
s No. 21 |Rev. I
Title Spent Fuel Pool Cooling and Cleanup System (SFP) I Date 07/03/02 | Page 7 of 17 l
The RWST purification loop is used to cleanup RWST water. This cleanup is normallyperformed after a refueling. A suction is taken from the RWST by the purification pump.The pump discharges to the SFP demin prefilter and to a RWST recirculation line.Purification is performed in accordance with chemistry specifications.
The SFP leak detection system functions to detect leakage through seam welds of thepool liner and the transfer canal. A total of ten detection zones are provided.
A solenoid operated valve, FPC-51, is a SFP flushing line. This connection can be usedby chemistry technicians in a post-accident situation to flush primary system sample lineswith a borated water source after obtaining a highly radioactive sample. This flush valveis controlled from the High Radiation Sample Room (HRSR). See System Description37, entitled, "Primary Sampling System," for more details on the HRSR and sampling.
3.2 Spent Fuel Pool LinersThe SFP consists of 6ir SST lined cavities.* The north pool (A) has an almost square configuration and is used for ~peni fuel
storage and for a3 loading.* The south pool (B) is rectangular and is used for spent fuel storage.
irageof old spent fuef uiL Thefu el transfer camal1 do e fuel betveen the d
gs A-and:B may be isolated from each other by a removable SST gate fitted with areinforced inflatable seal so,'pool'B 'may beisolated from te'Ue nsfrcana by aeioTible gate. The poolsjnormallvycontain _demineralized eatrcontaining
Approximately_2,200 pm boronl
The pools are located in the Auxiliary Building refueling area. The top of each pool is atthe 49'-6 elevation, and the bottom of the pool is at the 608' elevation. The pools are
DP roxiiate 40' deep with fuel occupying the bottom 14'.
The pool liners are designed with leak tight integrity so that stresses caused by sucheffects as thermal expansion, hydrostatic and mechanical loads do not impair the SFPfunctions. Since the coolant in the SFPs is potentially contaminated with radioactivematerial, the SST vidte ocrterlbNi tFoadi ctive 'materials!
Boric acid addition to the SFPs is through a normally closed, manually operateddiaphragm valve, CVC-414. Boric acid comes from the CVCS blender. The manual valveCVC-414 is located in the SFP HX room. Reactor makeup water is supplied via normallyclosed, manually operated valve MU-1009. The emergency makeup to the SFPs isthrough a normally locked closed, manual gate valve, SW-VARM. SWI9 and MU-1009are also located in the SFP HX Room.

[au mn - I- a em ;N. 21IevMr" ; No. 21 I Rev. I I,
I Title Spent Fuel Pool Cooling and Cleanup System (SFP) I Date 07/03/02 I Page 8 of 17
M, M I =1 I0 MIN OTM -lV Manufacturer Nooter Corporation
IFTechnical Manual K-233suMaterial Type 304 SST, ASTM A240
Nominal Plate Thickness 3/16" /1I/4"Isides/bottom
*Height 88'-61 3'6'-' 88'-6'Width 19' 9 14,lLength 17' 3'69" B09' 89
*Total Volume t 2 aln 2,7 538gg;;
*Fuel Transfer Canal Volume Farm5
(south of canal pool) 35il
snsed Wat evel ,.64
3.3 Fuel Transfer CanalThe Fuel Transfer Canal is located just east of the Spent Fuel PoolI. The transfer canalprovides a path for [I transfer between Yol and the Reactor via the fuel transfertube. The Fuel Transfer Canal is the same construction as the SFPs.
A fuel upending rig is at the south end of the canal. The upender is powered fromMCC 1-35D. The upender is normally operated during refueling operations by a FuelHandler.
3.4 Spent Fuel Pool Gates
Two SFP gates are provided. Each SFP gate is designed to withstand the water pressureat a E water level 648'-2" with the adjacent pool dewatered. The SFP gates aresupported in a guide slot mounted in the channel. The gates are lifted vertically byattaching a hoist to the two lifting eyes on the gates. Gate sealing is enhanced throughapplication of air pressure to an inflatable seal on the sides and bottom of the gate.
Sealing is accomplished by inflating the rubber seal to expand it against the SST linerplate. The seals are premolded ethylene propylene fabric reinforced rubber. Inflationconnection fittings are provided at the top of the seal and are the "snap-on" type.Nitrogen is used as a backup to the gate seals. A pressure regulator on the nitrogen bottlemaintains a FO psig pressure available to supply the seals if instrument air is lost. Theseals are designed and constructed to be replaceable at the site.

Im I .I s No. 21 Rev. 1
te 07/03/02 Paae 9 of 17I Title Spent Fuel Pool Cooling and Cleanup System (SFP) I Dal
1 i IManufacturer Nooter CorporationTechnical Manual K-233-26Material Type 304 SST, ASTM A240Gate Width 2' 4"Gate Height 27' 2"Gate Thickness 3/4 "Gate Weight 2700 poundsSeal Manufacturer Press-Ray Corporation
Seal Material Material 60 Durro EPDMCompound No. E603
Inflation Pressure 90 psig
3.5 SFP SkimmersE, ~7dE d t y vo skimmer boxes located at one end (Pool A at north end, Pool B
at south end) to allow particulate matter floating on the pool surface to be drawn off andfiltered out of the water. This filtering provides optical clarity to the water to enhance fuelhandling operations. The flow rate through each skimmer is adjusted manually by raisingor lowering the vertically adjustable gate on each skimmer box. Clean-out provisionsexists for each skimmer box to allow removal of large entrapped particles. All materialsare Type 304 SST.
A threaded T-handle rod is stored at the north end of the pools. This T-handle is used foradjusting the skimmer gate height. Normally in each SFP, one gate is full down and onegate is several inches beneath the SFP water surface.
3.6 SFP Leak Detection System (See Figure KNP-SFP2)A leakage collection and detection system is provided Tor the SFPs by placement ofchannels behind the seam welds. The system is divided into Pi zones to allowlocalization of leaks. dT lti ]Xn a openmanu Pil va
-ctic5i1ies' drain to-i a''ollection trough-which then'drains to the floor drainPipings
3.7 SFP Pumps A and B (See Figure KNP-SFP01 and SFP03)Two single stage horizontal, end suction centrifugal pumps are provided for the SFPSystem. Both SFP pumps are located in the SFP HX room. The SFP pumps provide themotive force for circulating SFP water through the cooling HX and purification flowpaths.

- 3. 66 s o I21 i I Rev. 1
I Title Spent Fuel Pool Cooling and Cleanup System (SFP) I Date 07/03/02 I Page 10 of 17 I
I I IManufacturer Gould Pumps Inc.Technical Manual K-141-3, thru -6Type / Model Centrifugal / 3196Size 3 x 4 - 8GSuction O.D. / Disch OD. 4"/ 3"Rated Capacity / Total Disch Head 450 gpm / 200 ft TDHPump Design Press / Nominal Disch Press 87 psig / 45-50 psigImpeller Size / Material 7-7/16" / 304 SSTPump Casing Material 304 SST, A-298, CF-8MBearings Two roller type, one thrust bearing, one
inline bearingPump Seals Mechanical, John Crane # 9TQPICIMotor Speed / Brake horsepower 3550 rpm /40.0 hpMotor Manufacturer Allis Chalmers
Equipment Number 145-171 145-172rPower Source MCC 1-52B MCC 1-62EControl Switch ES-46521 ES46522
Both SFP Pump A and B have control switches on Mechanical Vertical Panel "A" (SeeFigure KNP-SFP03). Each SFP pump has a three position maintained switch withON/AUTO/OFF positions. These switches must be in the AUTO position to haveautomatic operation of the SFP pumps. The OFF position prevents pump operation.
The control logic for each of the two SFP pumps (See Figure KNP-SFP03) is identical.When a control switch is placed in the OFF position, the 480 VAC motor breaker tripsopen. As long as the switch is left in the OFF position, the pump does not respond toautomatic or manual SI actuation signals.
When either Control Switch ES-46521 or ES46522 is in the AUTO position, the SFPpump starts in response to a trip of the operating SFP pump or an SI sequence step 10actuation signal. Once an SFP pump AUTO starts due to an SI sequence step 10actuation signal or a loss of the ON pump, the pump continues to run until one of thefollowing occurs:# The control switch is manually placed in the OFF position.* The SI RESET pushbutton is operated, and the control switch is turned to the off
position.* An Auto Inhibit signal is received.
When either SFP Pump Control Switch ES46521 or ES46522 is placed in the ONposition, the pump starts and continues to run until an Auto Inhibit signal or Load shed isreceived. At step 10 of the SI or BO Sequence, the SFP Pump restarts.
Each SFP pump has indicating lamps directly above the control switch. The indicatinglamps are red (ON) and green (OFF.)

6-1 I, ysN. 21 Rev. 1
Title Spent Fuel Pool Cooling and Cleanup System (SFP) |Date 07/03/02 Page 11 of 17
3.8 Refueling Water Purification Pump (Figures KNP-SFPO1 and SFP03)The Refueling Water Purification Pump is a single stage, inline centrifugal pump that islocated in the Auxiliary Building basement near the SI pumps. The pump is used tocirculate the RWST water through the SFP demin for cleanup after refueling.
in ,. S I IManufacturer Ingersol Rand Co. (Cameron Pump Div.)Technical manual K-261-5Model Number 1 1/2 VM-15Serial Number A70-8 100Rated Capacity 85 gpmTotal Discharge Head 275 ft at 700 F TDHNominal Discharge Press 125 - 130 psigSuction O.D. / Disch 0.D. 3" / 1-1/2"Impeller Material 316 SSTPump Casing Material 316 SST, A-296, CF-8MBearing Ball Type, in motorSeals Mechanical, John Crane # 9TQPIC1Lubrication GreaseBrake horsepower 11.6 hpMotor Manufacturer Allis ChalmersElectrical Characteristics 460 VAC, 3 phase, 60 HzPower Source MCC 145ASTART/STOP Pushbuttons PB-19515
The refueling water purification pump has a seal water tank that provides the seal waterand back pressure to the mechanical seals. The seal water tank is pressurized bydemineralized water or station air. The pump capacity is nominally 85 gpm at125-130 psig. The pump START/STOP pushbuttons (PB-19515) are mounted locallynear the pump. Red (ON) and green (OFF) indicating lights are located with thepushbuttons.
3.9 SFP Filters A and B (Figure KNP-SFPOI)Two half capacity (50%) filters are provided in the SFP System. The design features ofthe filters include a single unit element sized to fit in a 55 gallon drum for disposal. Thedirection of flow in the filter elements is from the inside to out. This direction of flowcollects the dirt and radioactive contaminants inside the element prior to reaching theouter surface of the filter. Other design features include conical head type bolts to fastendown the removable filter heads. Use of this type of head bolt allows the heads to beremoved without special tools. Also, the filter vent is placed on the side of the filterhousing, allowing the filter element to be removed without disconnecting any piping.

mm - 3- S 6I s No. 21 I Rev. 1I Title Spent Fuel Pool Cooling and Cleanup System (SFP) I Date 07/03/02 I Page 12 of 17
Manufacturer AMF Cuno DivisionTechnical Manual K-214-2, -5Model Number GR-01 DBIInlet Connection / Outlet Conn. 3" Sch 10S/ 3"Filter Housing Material 304 SSTFilter Element Material 347 SSTFilter Particulate Rating 15 micron absoluteDesign Flow Rate 425 gpmPressure Drop (DP) Clean/Dirty 10 psid/35 psidMaximum DP 70 psidFilter Head Gasket Type "0" RingGasket Material Ethylene Propylene
3.10 SFP Heat ExchangerThe SFP heat exchanger is a horizontal U-tube type HX located in the SFP HX room.
|Manufacturer | Struthers Well CorpTechnical Manual K-140-4Type U-12-SH (CEU)
Coolant circulated SW SFP Water (2,100 ppm)Total Flow Rate 550 gpm 850 gpmInlet Temperature 66.0 0 F 1200 FOutlet Temperature 96.00 F 1000 FNumber of Passes 1 2Pressure Drop 8.0 psi 8.0 psiFouling Drop 0.0010 psi 0.0005 psiMaterial Carbon Steel 304 SST
The SFP Heat Exchanger maintains the SFP below m F during normal fuel handlingand storage conditions by means of =lve SW-1601. Valve SW-1601 controls theSW to the SFP heat exchanger and is located in the SFP Heat' Exchang7r Room. VsW~601 sadjustabltElromthe SFP Hx Room.

Sm - -W9 e.W:S ;No. 21 l| Rev. INo. 21 Rev. I
I Title Spent Fuel Pool Cooling and Cleanup System (SFP) I Date 07/03/02 | Page 13 of 17
3.11 SFP Demin Pre- and Post-FiltersEach filter is designed with features similar to the SFP filters with the exception that themaximum flow rate is 80 gpm.
I I I IIManufacturer AMF Cuno DivisionTechnical Manual K-214-2, -5Model Number 1DB 1Inlet Connection/Outlet Conn. 3" Sch 10S/3"Filter Housing Material 304 SSTFilter Element Material 316 SSTFilter Particulate Rating 15 micron absoluteDesign Flow Rate 80 gpmPressure Drop (DP) Clean/Dirty 10 psid/35 psidMaximum DP 70 psidFilter Head Gasket Type "0" RingGasket Material Ethylene Propylene
3.12 SFP DemineralizerThe SFP demin is designed and supplied by the Westinghouse Electric Corporation. Thedemin is filled with nuclear grade resin and used in the SFP purification loop to removefission products that are in the SFP coolant solution.
I 110 RIMM IRW I IIManufacturer Edward E. JohnsonTechnical Manual K-l00-Drawing 541F109 X-KlOO-182Design Pressure/ Temperature 200 psig / 2500 FResin Volume for Flushed Beds 27 ft'Maximum Flow Rate / Minimum Flow 72 gpm / 18 gpmDesign Flow Rate 60 gpm
SI . MEmpty 0.5 psi 4.0 psiWith 27 ft_ 3.3 psi 15.5 psi
The SFP demin is located in the Auxiliary Building mezzanine, demineralizer room. Theresin removes ionic impurities from the SFP water by absorbing the ions on the resinbeads. The design flow through the SFP demin is regulated by Flow Control ValveFPC-204/CV-31293.
The Flow Control Valve FPC-204 is a self contained valve. The Flow Control Valvemaintains a constant purification loop flow of 60 gpm even as system differentialpressures (DPs) change during system operation.

Im 1- 3 l-MS ,s No. 21 I Rev. I II Title Spent Fuel Pool Cooling and Cleanup System (SFP) I Date 07/03/02 | Page 14 of 17
3.13 Control Room ControlsThe following SFP System controls are located on Mechanical Vertical Panel "A".
3.14
3.15
Red (ON)and green (OFF)lights are located with the control switches. One pump is ONand one pump is in AUTO. The AUTO SFP pump starts upon loss of the running pump.
SFP Pump A Control Switch OFF/AUTO/ON
n Pup ES-46522 Three Position MaintainedPPump B Control Switch
Local Controls
Refueling Water PB-19515Purification Pump Pushbuttons START/STOP
Red (START) and green (STOP) indicating lights with the pushbuttons.
Local Indications
SFP Pump A Disch Press 0-200 psig P_- 1073SFP Pump B Disch Press 0-200 psig PI-11074SFP Filter A DP 0-100 psid DPI-11305SFP Filter B DP 0-100 psid DPI-1 1306SFP Demin Pre-Filter DP 0-100 psid )DPI-i 1030SFP Demin Post-Filter DP 0-100 psid DPI-1 1015SFP Demin DP 0- 30 psid DPI-1 1014SFP Heat Exchanger DP 0- 30 psid DPI-1 1055SFP Supply (Return Hdr) Temp 32-2000 F TI-12088SFP A Pool Temp 0-220° F TI-12007SFP B Pool Temp 0-2200 F | TI-12012Refuel Wtr Purf Pump Press 0-200 psig PI-11104

= E- M- . Sys No. 21 |Rev. 1
| Title Spent Fuel Pool Cooling and Cleanup System (SFP) I Date 07/03/02 | Page 15 of 17
3.16 SFP System Alarms
_ _- 7 INOTE- Se-e- JAiarSn Respofnse 61fleeb InzRoomIr-tomtsei6's
SFP A/B Level Higli_____ SPENT FUEL POOL SFP Hx Primnary to Secoind
5 A 3J DP SFP A/B Temperaturej HigiiSFP AB Level Low
3.17 Sequence of Events Recorder (SER)Rep Int Room ER 9 ipeifIcs.
m_ Fuel PooFA LEVEL HIGH
L. Pt Fuel Poofb LEVEL HIGH
157 Spent Fuel Pool A TEMP HIGH158 Spent Fuel Pool B TEMP HIGH159 Spent Fuel Pool A LEVEL LOW
1160 Spent Fuel Pool B LEVEL LOW161 Spent Fuel Pool Heat Exchanger Primary to Secondary DP Low
3.18 System InterrelationshipsSW Supplies - The Service Water (SW) System supplies the cooling medium to the SFPheat exchanger and is the emergency makeup to the SFPs.
Demin Supplies - The Demineralized Water (DW) System supplies a back pressure forthe Refueling Water Purification pump seals and can be used as makeup to the SFPs.
RWST - The RWST is also considered a part of the Emergency Core Cooling Systems(ECCS) including the Safety Injection (SI) System.
RHR HX - The RHR heat exchanger A can be used as an alternate heat exchanger if theSFP heat exchanger fails.
480 Vac Supplies - The 480 VAC Electrical Distribution System supplies power to theSFP pumps and the RWST purification pump.
Station Air - Station Air is used for the following: to inflate the SFP gate seals (withnitrogen as a backup), to pressurize the seal water tank, and for the RWST purificationpump.
Misc Sumps - The SFP Leak detection and collection trough : discharge to theMiscellaneous Sumps and Drains System.

mm I I-m M s No. 21 I Rev. 1 I
I Title Spent Fuel Pool Cooling and Cleanup System (SFP) I Date 07/03/02 I Page 16 of 17 I
- - -. 94.0 Precautions and Limitations
WR&RWVP - The replacement of SFP demineralizer resin requires a Work Request and aRadiation Work Permit or Health Physics coverage.
Spilled Resin -All spilled resin shall be cleaned up and NOT FLUSHED DOWVN FLOORDRAINS. Ensure proper resin and volume is available for replacement.
High Rad Level - All personnel should be made aware of high radiation levels on the flushpiping from the affected bed to the spent resin tank.
5.0 References
1.0 N-SFP-21 E-SFP-21-CL WCR 2946Summary A-SFP-21 E-SFP-21 D 2500
2.0Functions
OPER M-218 Annunciators 470043.0 E-1617, E-1636 P.O.'s K-233, K-141, K-214, K-140
Description FSAR 9.3Design For complete'listing of DCR's associated with System 21, see: _
__ Programs\KNPPL Applications\Physical 'Changes\DCR Database\Sys 214.0
Precautions & Annunciators 47022, 47023, 47030, 47032Limitations
5.0 KNPP Technical SpecificationsReferences6.0 or complete listing of proccedures associated with System 21, see:
Procedures :\Procedures Issued\Proc Index\Sys #217.0A .d See attached FiguresAppendices
5.1 Technical SpecificationsNOTE: Refer to a Controlled Copy of the KNPP Technical Specifications for plant operations.
TS 3.8.a.2 During refueling operations, radiation levels in fuel handling areas, theContainment, and the spent fuel storage pool shall be monitoredcontinuously.
TS 3.8.a.7 Heavy loads, are not to be transported over or placed in either SFP poolwhen spent fuel is stored in that pool.
TS 3.8.a.9.A The SFP Sweep System, shall be operating during fuel handling andwhen any load is carried over the pool if irradiated fuel in the pool hasdecayed less than 30 days
TS 5.4.c The SFP is filled with borated water at a concentration matching that inthe Reactor Refueling Cavity and Refueling Canal during refuelingoperations or whenever fuel is in the pool.
V5 7 rhe eact o eWill6 be icalove~rradiate-d fuel a s mbi s

T SpentU --- P Con Sys No.ITitle Spent Fuel Pool Cooling and Cleanup System (SFP) I Date
21
07/03/02
Rev. 1
Page 17 of 17 *16.0 ProceduresRllEFor c edurdur' associated with.System21 see
):.\ProceduresjIssued oc Index\Sy's#2 1See System Description 32D for details on Solid Radioactive Waste System (RWS).
7.0 Appendices
7.1 Attached Figures
|~ 3;I.!uu KNPP DWG
KNP-SFPOI Spent Fuel Pool Cooling & Cleanup
KNP-SFP02 SFP Leak Detection System ,
KNP-SFP03 SFP Cooling & Cleanup Logic _ -_17____
jt~3he"F-e" (F l n h Svilnii'tb etrevised andiupdated at this time. 'Instead (obs6lee)tcopiesof ..thesigureshave be eniarpedILSTORICAL and t:mporq.rily attached.

mmI M- 1 S S1 System No. 45 Rev. I
Date 07/08/02 Page 1 of 27Title Radiation Monitoring System (RM) I
Author Op's ReviewEric E. Strelch David D. MWelke
Tech Review ApprovedDavid D. MWelke Manaaer of Enalneerina
SC
INDEX
1.0 Summary ......................................... 21.1 Overvie e. . 21.2 System Operation 'Ivs' Plant Mode . . 31.3 Startup . . 41.4 Normal Operation . . 41.5 Shutdown . ................................ 41.6 Special Operations ...................... . 41.7 Abnormal . . 4
2.0 Functions. . . 53.0 Design Description .............................. . 5
3.1 System Design Requirements . . 53.2 Process Radiation Detectors - Liquid . . 73.3 Process Radiation Detectors - Gaseous & Particulate ... 113.4 SPING - 4 Off-Line Stack Gas Monitors .183.5 General & Secondary Area Radiation Monitoring
Subsystems . .183.6 Auxiliary Area Radiation Monitors . .203.7 Tritium Sampling . .213.8 RM System Panels - Mechanical Vertical Panel "C" 223.9 Alarms .233.10 Sequence of Events Records (SER) .243.11 Interlocks .25
4.0 Precautions and Limitations . . 265.0 References.. 26
5.1 Technical Specifications ....... ................ 276.0 Procedures ........................................ 277.0 Appendices ........................................ 27
7.1 Attached Figures .......... ................... 27
h:\documents\ep\nrc cds\eal documentation\system descriptions\sd 45.doc

F-M ".. emNo. 45 1 Rev. 1 1
I Title Radiation Monitoring System (RM) | Date 07/08/02 | Page 2 of 27 |
1.0 Summary
1.1 Overview (See Figures KNP-RMOI, RM02, and RM03)The Radiation Monitoring (RM) System provides continuous radiological surveillance ofcritical plant systems and work areas. The RM System performs the following basicfunctions:+ Warns operating personnel of radiological health hazards which have developed.* Gives early warning of certain plant malfunctions which might lead to a radiological
health hazard or plant damage.* Prevents or minimizes the effects of inadvertent release of radioactivity to the
environment by consequence-limiting automatic responses.* Provides routine monitoring of controlled offsite plant releases.
The RM System is divided into the following subsystems:* Fluid Process RM Subsystem, which monitors various prcesstreams Tliquidand
gas) for indication of radiation levels within those streams. This subsystem includesadditional EJ monitors mounted on the outside of process piping ind ooff-lineVampsijig for greater reliability.
* Area RM Subsystem, which monitors radiation levels in various areas of the plant.This subsystem includes additional channels primarily for localindication and alarm.
* Auxiliary (Aux.) Area RM Subsystem, which monitors radiation levels in theAuxiliary and Reactor Buildings and the Technical Support Center (TSC). This is apost-TMI addition to the plant tEbidin eandGelne ralAt6njic'Systkm's)
Process radiation monitors which monitor "managed releases" to the environment alsoprovide continuous records of actual releases to the environment.
The RM System consists of the following channels:* Process Radiation Monitors: R-I 1 through R-~3, R-31 through R-38, SPING-O0 and
SPING-02,* Area Radiation Monitors: R-I through R-10, ER nRere tid) R-25
through R-30, R-39,+ Aux Area RM Subsystem: Instruments No. 29041 through 29046, 29048 through
29053, and 29055 through 29065, including two wide-range Containment monitors0did In addition, the Aux Area RM includes 5 Beta Air Monitors,
Instruments No. 29066 through 29070.
mhe Nucle~ar Rl-esdarl~ch-a Ch i1§l-(R-k2 throg R23)"a-r-e -c'-n-fii-gu-rie,,d -wviitffi~l-ia' i~tectwhich' feeds' a' pre-amp;, which -provides local indication, which sends*'a' signal to 'theControl Room. In'the Controi Roo'm,' the'signal provides drawer indication recorder and?'PCS trending, annun-ciator'alarms an- d if necessary,-automatic actuation's..- Long termdata' retention uncti ondinthe__RADAC,;J ocatecp i the RA

I "MR-. eE SystemNlNo. 45 1 Rev. I ITitle Radiation Monitoring System (RI) I Date 07/08/02 | Page 3 of 27 |
The two process stack gas monitors (SPING-4) each contain three extended range noblegas channels and normal range particulate, iodine-131 and background channels. TheDAMs and SPING-4 retain the data from each detector channel in local history files via amicrocomputer. Each DAM in the Auxiliary RM System performs backgroundsubtraction, applies conversion factors and retains historical data. If AC power is lost to aDAM, battery backup for up to 8 hours is provided to preserve historical and initializingdata and to allow continued operation. The [] n eW TmiiiIiil lctin e 'arnd
have bi-directional communication with the DAM's via an opticallycoupled data highway system. A failure of a DAM or any detector does not affect otherportions of the RMS. Operator interface with the remainder of the system is provided atthe[] ad e na.
The EJ i r gesj have the capability to connect to a central computer. Highradiation alarms are displayed at the E] Ka7r!Jei;ii. Two recorders in the ControlRoom record data from the wide range Containment monitors. Normal operation is in thefull automatic mode with data displayed on the RS Terminal in accordance withprogrammed requirements. J 7T 2Ihe RadSen7 Terminals 'provide -RMS us of the
poan dhistories ~are aIso provided by the'RadServ
Usually, an indicator-alarm station is mounted adjacent to an area monitor detector. Insome cases, such as the New Fuel Pit Criticality Monitor R-10, the detector is located inan inaccessible location. For these channels the indicator-alarm assembly is installed inan accessible location as close as possible to the detector.
1.2 System Operation versus Plant Modes
Startup The L[ RM System safety related equipment (see Section 3.11, -Normal Interlocks) is required to be operable during a reactor startup andPower plant operations. The RM System must be operable to provide
Shutdown monitoring and interlocks to prevent the inadvertent release ofRefueling radioactivity to the environment.
Casualty See Section 1.7 for RM System operation during casualty operations.EventsInfrequent Not ApplicableOperations
Maintenance can be performed on the RM System while operating atPower. The Control Room Operators must refer to a Controlled Copy
Maintenance of KNPP Technical Specifications to ensure that the LimitingConditions for Operation (LCO's) and Radiological EffluentTechnical Specifications (RET's) are met.
1.3 Startup (OP's# N-RM-45, N-RM45-CL)The Radiation Monitoring (RM) System is normally maintained in an operational statusduring all plant modes. The RM System requires no special procedures for startup otherthan the normal operation checks. See Operations Procedures N-RM-45 andN-RM45-CL for specific lineups.

Title Radiation Monitoring System (RM) I Date
iem No. 45 |Rev. 1
I 07/08/02 Page 4 of 27
1.4 Normal Operation (OP# N-RM-45)During normal plant operation, the RM System is maintained fully operational. The dailycheck and monthly test procedures referenced in the TS assure the necessary RM Systemsurveillance. See also the Surveillance Procedures associated with System 45. Channelsthat provide an automatic control function, fail in a manner that duplicates the high levelalarm condition.
1.5 ShutdownIntentional shutdown of the entire system is not contemplated during the plant life.Shutdown or failures of individual channels are expected to occur, however. Sometimesremoving a channel from service activates that channel alarm, such as R-13 activates theZone SV. Calibrations are normally performed on all channels at regular intervals inaccordance with the ioi.i `rvdezif i rcedi Instrument & ControlProcedures (ICPs).
1.6 Special OperationsSince the RM System is in continuous operation, there are no special operational modes.
Effluent discharges Fhui-id not be conducted if the applicable RM is out of serviceyit t FFr Valuatioa. Containment Vessel Air Particulate Monitor R-l I and
Radio-Gas Monitor R-12 channels are normally set for monitoring the Containmentatmosphere. The vent position is used for monitoring releases to atmosphere inaccordance with Procedure N-RBV-18B. For additional requirements, see SystemDescription 18, entitled, "Reactor Building Ventilation System".
1.7 Abnormal (OP# A-RM-45)Abnormal Procedure A-RM-45 describes the actions to be taken when an abnormalcondition exists in the RM System. Critical channels of the RM System are designed toprovide automatic consequence limiting action in the event of plant system or channelmalfunction. These actions require no immediate Operator intervention.
A loss of coolant accident (LOCA) would render a large part of the RM Systeminoperable or unreliable due to excessive radiation levels or pressure and temperatureexcursions A {1). It may be necessary to maintain the functionalstatus of the following channels for the post-accident period:* Channel R-16 ..... Containment Fan Coil Unit (CFCU) Water Monitor# Channel R-22 ..... Residual Heat Removal (RHR) Pump Pit Monitor* Instrument 29064 . . Containment Hi Level RM IB* Instrument 29065 . . Containment Hi Level RM IA
Abnormal Procedure A-RM-45 provides the symptoms/annunciators, automatic actionsthat occur, and Operator actions necessary to minimize the consequences of a highradiation level or high radioactivity.

S 'stemI Title Radiation Monitoring System (RM) I Date
No. 45 iRev. 1 l07/08/02 Page 5 of 27
2.0 FunctionsThe purpose of the Radiation Monitoring (RM) System is to provide continuous radiologicalsurveillance of critical plant systems and work areas.
The specific functions of the RM System are as follows:* Warns operating personnel of radiological health hazards, such as abnormal radiation fields.+ Provides warning of plant malfunctions which could lead to plant damage and/or radiological
hazards.* Prevents or minimizes inadvertent releases of radioactivity to the environment via automatic
action capability.# Provides monitoring of controlled radiological plant releases.
3.0 Design Description
3.1 System Design RequirementsThe Radiation Monitoring (RM) System is designed to provide reliable informationrequired to meet the four functions specified in the Overview, Section 1.1. The rangesand sensitivities of the individual channels are consistent with meeting the requirementsof Title 10, Code of Federal Regulations (CFR), Parts 10 CFR 20, 10 CFR 50, and 10CFR 70. The channel electronics are of the fail-safe design such that channel failurescause an alarm. For channels R-I through R-t3, channel failures are alarmed andindicated at the corresponding IAT Unit in the RMS Panels, and E: alarmed on the plantannunciator panel located in the Control Room.
The Aux. Area RM System was designed to meet post-TMI Nuclear RegulatoryCommission (NRC) requirements for monitoring radiation levels in the Aux. Bldg. andthe Reactor Containment Bldg. and the TSC.
Specific locations for area monitors were chosen with the following guidelines:* An area monitor should be located in any area where personnel perform regular
duties, once per day or more frequently. A rule of thumb with area monitors is eacharea monitor can effectively survey a 40' line of sight radius.
* An area monitor should be located in any area where personnel perform infrequentduties, but where a significant probability exists for hazardous dose rates.
* An area monitor may be located in an area where personnel perform infrequent dutiesand where there is an insignificant probability of hazardous dose rates, but wherecontinuous, low maintenance surveillance is necessary.
Main radiation monitoring channel circuitry is of the non-saturating design that precludesfalloff in indication in high radiation fields. Noninterruptible power is provided frominverters operating from the 125 VDC power supply. Redundant safeguard channels areisolated electrically and physically in accordance with IEEE Standard 279. Redundantsafeguard channels have independent power sources from the safeguards buses.

= "I i Iystem| Title Radiation Monitoring System (RM) Date
No. 45 Rev. 1 l07/08/02 Page 6 of 27 |
Each RM System channel has been subjected to a minimum 100 hour electrical bum-inperiod by the supplier. Process monitor detectors are located in the process stream suchthat the detectors are not subject to temperatures in excess of maximum specified detectoroperating temperatures.
The process monitor channels are designed to provide information on the following:* Radioactivity concentration levels present in the various systems.* Leakage across closed system boundaries.* Radioactivity concentrations in liquid and gaseous effluent paths that lead to release
from the plant site.
The ion chamber detectors in the Aux Area RM System are seismically qualified as ClassIE equipment following 1.OE+6 R exposure. All electronic channels are seismicallyqualified as Class IE equipment. The wide range Containment monitors P finclude redundant channels whose signals are fed to two recorders in the Control Room.These monitors are Safety Grade IE and qualified under loss-of-coolant accident(LOCA) conditions. These detectors, which are required post-LOCA, have a ratedintegrated lifetime dose of greater than I .OE+9 Rads.
Seven radiation monitoring channels, R-I I thru R-15, R-19 and R-21, actuate or initiateautomatic sequences of engineered safety-related equipment. Four channels, R-16, R-22,and Instruments No. 29064 and 29065, are designed to operate in the Containmentpost-accident environment. R-16 and R-22 are located in the Auxiliary Building (Aux.Bldg). Instruments No. 29064 and 29065 are located inside the Reactor ContainmentBldg.
Containment Vent R-I I 29020 Isolates Containment Vent (CVI)Particulate Monitor I See also Section 4.4
1�
Containment Vent Isolates Containment Vent (CVI)Gaseous Monitor R-12 29021 See also Section 4.4
Aux Bldg Vent Monitor R-13 29010 Isolates normal vent exhaust andAux ldg ent onior R13 2010 shifts to HEPA filters
Aux Bldg Vent Monitor R-14 29007 Isolates normal vent exhaust andContau inBdent M t R-1 2907 shifts to HEPA filters
Containment Sys. Vent R-1 205 Isolates Containment Vent (CVI)Activity Monitor I 2I 2925 See Section 4.4
Each RM channel consists basically of a radiation detector, an amplifier with associatedpower supplies, indicators, and computer-meter outputs. The three basic detectors used inthe RM Systems are:* scintillation detectors,* Geiger-Mueller (GM) tubes, and* Ion chambers.

= * Syitem| Title Radiation Monitoring System (RM) I Date
No. 45 Rev. 107/08/02 Page 7 of 27
The scintillation detectors are plug-in units containing either a thallium activated sodiumiodide (Nal) crystal optically coupled to a photo-multiplier tube, or a beta radiationsensitive plastic scintillator. The GM tubes are standard beta-gamma GM radiationcounter tubes operating on the secondary ionization current principle. The ion chambersare standard ionization chambers which measure current flow produced by ions betweentwo electrodes within a gas-filled enclosure. hei in chamUiTb are us'ed forifuel handling
When exposed to a radiation field, the detector generates a small signal that is amplifiedby an integral preamplifier. This signal is fed into shaping and conversion circuitry and afinal amplifier stage. - 0,l'a 2-second iii6vi-i' avra le'sechforschannels R ingaverage filter is used to red cehvariation in the channThe signal is then transmitted to the readout device.
On high radiation alarm, a channel may be required to initiate a mechanical function suchas valve closure, damper isolation, etc.
All channels are capable of operational verification through the use of radioactive checksources and electronic test signals.
The R-I through R-V channel Indicator-Amplifier-Trip Assemblies (IATs) with alarmindication are located in the main Control Room on Mechanical Vertical Panel "C".Alarms are annunciated when n ldfft'br high radiation condition exists or when thechannel becomes deenergized W Where applicable,alarms are provided to warn if a monitor sampling system malfunctions.
The sensitivities, ranges, temperature requirements, set points, and other designparameters are delineated for most channels on Logic Diagram E-2021.
In the Auxiliary Area RM System, the radiation detectors provide data to six fieldmounted data acquisition modules (DAMs), and to two iL v'iZ iiials. One _:minalis located in the Radiation Protection Office (RPO) and the second terminal is in theRadiological Analysis Facility (RAF) in the Technical Support Center (TSC).
3.2 Process Radiation Detectors - LiquidNOTE: 7iiKNPPia'-D i tit &i-Wii Monitori n g- EKKew
5" for currentChannelspecifics, such as descriptions, range setpolnts, meter 'ales 1
letectortypes, and addItonal 4etailsi
The Liquid Process RM System consists of 15 channels to monitor various processsystems. Ten of the 15 channels are equipped with some level of automatic action uponreceipt of a high radiation alarm. Two of the 15 channels R-I 9 and R-21 actuate or causeautomatic sequencing of ESF equipment. 3 Two channels, R-16 and R-22, aredesigned to operate in a post-LOCA Eoess environment.

N -ym
Title Radiation Monitoring System (RM) I DateNo. 45 I Rev. 1
07/08/02 Page 8 of 27
g I a'
Containment Fan Coil Unit(CFCU) Water Monitor R-16 29024Component Cooling Water -17 29001(CC) System Liquid Monitor ____Or
Waste Disposal (WD) System R-18 29008 kesearcliLiquid Effluent Monitor Co mpaNal /Scint.Steam Generator Blowdown(SGB) Liquid Sample R-19 29005Monitor.
Deleted per DCR 2172Service Water (SW) Monitor R-20 29032
Deleted per DCR 2172
^. SIS S HiSteam Line lA Low Range R-31 29080 GM TubeSteam Line IA High Range R-32 29079 Ion chamberSteam Line IB Low Range R-33 29082 GM TubeSteam Line lB High Range R-34 29081 Eberline Ion chamberAux Bldg Vent Low Range R-35 29078 GM TubeAux Bldg Vent High Range R-36 29077 Ion chamberContainment Bldg Low Range R-37 29076 GM TubeContainment Bldg High Range R-38 29075 Ion chamber
All channels of the Liquid Process RM System use a thallium activated, sodium iodidecrystal (Nal) as the radiation detection element and are sensitive to only gamma radiation.The Nal detector is optically coupled to a photomultiplier tube and is housed in ahermetically sealed container. A preamplifier and Control Room operated check sourceare included in the detector package. (See Figure KNP-RM04.)
The detectors are mounted either directly in the process piping or offline in a parallelflow path, depending on the specific channel. Sufficient lead shielding is provided aroundthe detector to attain the required sensitivity for all detectors during normal plantoperation. For those monitors required to operate following a LOCA (R-16, R-22, andInstruments 29064 and 29065), Figi feterpe'ii-h g retp`F Ieiiom additionalshielding are provided to achieve the specified sensitivity.
The R-31 through R-38 high/low range monitors are actually area type monitors whichhave been installed on the outside of process flow piping. A pair of monitors, one highrange and one low range, are located on the outside of the Containment vent ducting, theAux Bldg Vent ducting, main steam piping IA and lB. Each high/low range detector hasa local readout and a Control Room readout on multipoint strip chart recorders located onthe Radiation Monitoring Control Console. The R-31 through R-38 detectors are allEberline GM Tubes for low range and ion chambers for high range.

TIMM- 0 System No. 45 IRev. 1 I
| Title Radiation Monitoring System (RM) I Date 07/08/02 | Page 9 of 27
3.2.1 Containment Fan Coil Unit (CFCU) Monitor R-16 (See Figure KNP-RM04)This channel monitors the Containment fan coil cooling water (SW) for radiationfollowing a LOCA indicating a leak from the Containment atmosphere into theSW cooling. A sample connection is located on the 10" SW discharge header forthe Containment Fan Coil Units (CFCUs) A and B. The C and D CFCUs have asimilar connection. Sample lines from these connections are run into a commondetector header to provide a representative sample and are monitored by a singleNaT scintillation detector mounted in an in-line type sample volume chamber.Upon indication of a high radiation level, each CFCU is individually taken out ofservice to determine which unit is leaking. This procedure is achieved inside theControl Room by manually selecting the desired CFCU to be tested using SWIsolation Valves SW-903A/MV-32060, SW-903B/MV-32061, SW-903C/MV-32058, or SW-903D/MV-32059 as applicable.
3.2.2 Component Cooling Water (CC) System Monitor R-17Note: See K&PP DrawMihgE-2021 g Erspecifis -to this channef
This channel continuously monitors the CC System for radiation indicative of areactor coolant leak into the CC System. A leak can occur into the CC Systemfrom the Reactor Coolant Pump (RXCP) thermal barriers, the Chemical andVolume Control System (CVCS) letdown heat exchanger, or from the ResidualHeat Removal (RHR) heat exchangers. An in-line T-type monitor is located in theCC pumps 16" discharge header downstream of CC heat exchangers A and B.This channel, R-17, uses a Nal scintillation counter. G aid high radiationlevel alarms E[ actuates Sol Room alarms.
3.2.3 Waste Disposal (WD) System Liquid Effluent Monitor R-18Note: See o
This channel continuously monitors all Waste Disposal System liquid releasesfrom the plant. Monitor R-18 has an in-line detector assembly which is inserted inthe 3-way 2" discharge header near Waste Condensate Pumps IA and 1B.Automatic closure of air operated Valve WD-19/CV-31138 is initiated by thismonitor to prevent further release after a high radiation level is indicated. An Nalscintillation 'counter and sample volume chamber assembly monitors theseeffluent discharges. Remote indication and annunciation are provided on theWaste Disposal System Panel and in the Control Room.

= '. L I J V ITitle Radiation Monitoring System (RIM
System No. 45 Rev. 1
Date 07/08/02 Page 10 of 27
3.2.4 SG Blowdown Sample Monitor R-19 (See Figure KNP-RM04)Note: See jfi§NPPo thisch
This channels monitor the liquid phase of the secondary side of the SGs forradiation. This indication could be used to indicate a possible primary tosecondary Reactor Coolant System (RCS) leak, thus providing backup capabilityfor the condenser air ejector gas monitor nd;&R-43). Sample connections are taken off the 3/8" sample lines from SG's A
and B after the primary and secondary coolers. SG samples are continuouslymonitored by the Nal scintillation counters and a sample volume chamber
Each of the two 3/8" detector sample lines has a manual flow control valve,(BT-35A-1 and BT-35B-l), a check valve, (BT-35A and BT-35B), and rotameterupstream of the common detector header. It is possible to flush the sample volumechamber to the SGBT holdup tanks using demineralized water. See SystemDescriptions 7A/7B for more details on the SGB System operation.
Upon indication of a high radiation level on R-19 E or a high radiation level onCondenser Air Ejector Gas Monitor R-15, the motor operated BlowdownIsolation Valves BT-2A/MV-32077 and BT-3A/MV-32078 for SG A andBT-2B/MV-32079 and BT-3B/MV-32080 for SG B are automatically closed.These motor operated isolation valves are located in the 2" SGB lines.Furthermore, air operated Control Valves BT-31B/CV-31270 andBT-32B/CV-31271, located in the 3/8" sample line for the SG B, areautomatically closed. Similarly, the SG A air operated valves BT-31A/CV-31334and BT-32A/CV-31335 are closed. R-19 E serves as backup to R-15 to divertTurbine Building air ejector discharge vent valve AR-6/CV-31168 to the AuxBldg exhaust duct. Refer to the System Description 09, entitled, "Air RemovalSystem" for more details on AR-6 operation.
After SG isolation as discussed above, manual Valves BT-35A and BT-35B areclosed locally and the normally closed gate Valves BT-36A and BT-36B in thetwo 3/8" sample room lines, branching off the 3/8" radiation detector samplelines, are opened. Following this isolation of the radiation monitor and theopening of these new sample lines to the sample room, the SG liquid sample linesare again opened using the previously mentioned Valves BT-31A, BT-32A,BT-31B, and BT-32B. The SGs can then be manually sampled in the sampleroom and the leaking SG can be identified.
Indication and annunciation -of Channel R-19 is provided at the SecondarySampling Analytical Panel. See System Description 29, entitled, "SecondarySampling" for more details on SG sampling. R-19 also has indication and alarmsin the Control Room.

-A -ih * smI Title Radiation Monitoring System (RM) I Date
No. 45 IRev. 107/08/02 Page 11 of 27
3.2.5 Service Water (SW) Monitor R-20 (See Figure KNP-RM06)Note: See PP Drawing E-2021 for specifics tothis`a~nne
This channel continuously monitors the SW return path from the spent fuel pooland CC heat exchangers. A Nal scintillation counter and sample volume chamberassembly monitors these effluent discharges prior to discharge to the Aux BldgCW 24" Standpipe. An increase above ambient radiation levels could indicate aleak across one of these heat exchangers and selective isolation could then beused to locate the malfunction.
One sample connection is located on the return line from the CC Heat ExchangerA and B. Another sample connection is located on the SW return header from theSpent Fuel Pool (SFP) Heat Exchanger. Sample lines from each of theseconnections have associated manually operated Flow Control Valves SW-1330A,SW-1330B, and SW-1640, respectively. An alarm and indication is providedlocally at the detector and in the Control Room.
,peleted R-4per DCR 2172
3.3 Process Radiation Detectors - Gaseous & Particulate
3.3.1 GeneralThe main process gaseous monitoring system consists of several individualprocess subsystems:1) Containment Vessel and Containment System Vent Monitoring Subsystem,
R-I 1, R-12, and R-21.2) Aux Bldg Vent Monitoring Subsystem, a R-13, and R-14 IvithChad
ampef I!-ters.3) Condenser Air Ejector Monitoring Subsystem, R-1 5.4) RHR Pit Exhaust Air Monitoring Subsystem, R-22.5) Control Room Vent Monitoring Subsystem, R-23.6) '-i41 _ and kV3.
The gaseous process monitors use either GM tubes or scintillation detectors usingthe Nal crystals, or beta sensitive plastic scintillators. The detector assemblies aresimilar to those units already discussed. Each channel assembly contains anintegral preamplifier and a Control Room operated check source.
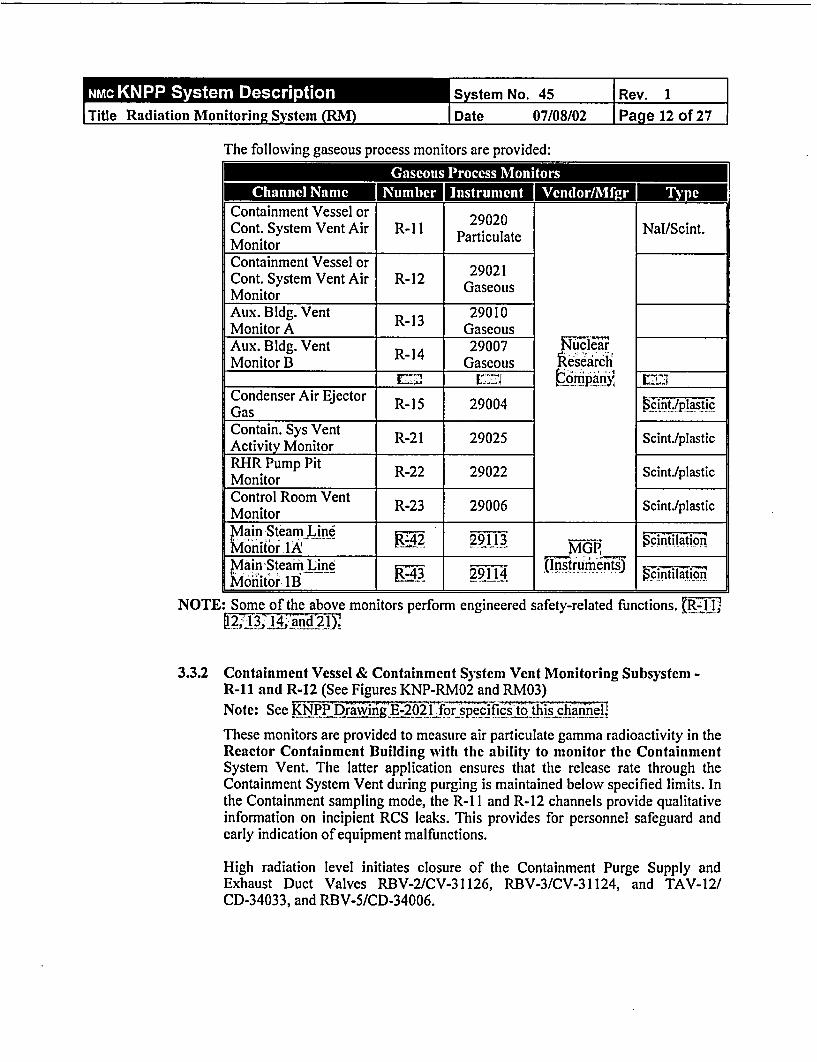
ITitle Radiation Monitoring System (RM) I Dattern No. 45 IRev. Ie 07/08/02 Page 12 of 27
The following gaseous process monitors are provided:
[;_____ _____________- goContainment Vessel orCont. System Vent AirMonitor
R-I1 29020Particulate Nal/Scint.
Containment Vessel or 29021Cont. System Vent Air R-12 GaseousMonitor ____
Aux. Bldg. Vent R-13 29010Monitor A GaseousAux. Bldg. Vent R-14 29007Monitor B Gaseous
Condenser Air Ejector R-15 29004Gas _ _ _
Contain. Sys Vent R-21 29025Activity Monitor
RHR Pump Pit R-22 29022M onitor _ _ _ _ _ _ _ _ _
~e searcli...rIpa~
~Ttn-pljastficq
Scint./plastic
Scinti/plastic
Scint./plasticControl Room VentMonitor R-23 29006
ain Steam LineMonitor IA j 29113
Main Steam Line 9 (ItrumentoM'onitor! lB_______________________
NOTE: Some of the above monitors perform engineered safety-related functions. [R-fl-
3.3.2 Containment Vessel & Containment System Vent Monitoring Subsystem -R-11 and R-12 (See Figures KNP-RM02 and RM03)Note: See kNP 5rawixigE-2021f sT(cifi To this chine 17
These monitors are provided to measure air particulate gamma radioactivity in theReactor Containment Building with the ability to monitor the ContainmentSystem Vent. The latter application ensures that the release rate through theContainment System Vent during purging is maintained below specified limits. Inthe Containment sampling mode, the R-I 1 and R-12 channels provide qualitativeinformation on incipient RCS leaks. This provides for personnel safeguard andearly indication of equipment malfunctions.
High radiation level initiates closure of the Containment Purge Supply andExhaust Duct Valves RBV-2/CV-31126, RBV-3/CV-31124, and TAV-12/CD-34033, and RBV-5/CD-34006.

m-3- 6 M. SemNo. 45 1 Rev. I ITitle Radiation Monitoring System (RM) I Date 07/08/02 | Page 13 of 27 |
Channel R-1 I takes a continuous air sample from either the Containmentatmosphere via Valve AS-3, or the Containment System Vent through ValveAS-20. The channel is purged using the Purge Inlet Valve AS-10. The sample isdrawn from the Containment or discharge ductwork through a closed, sealedsystem monitored by a scintillation counter and filter paper detector assembly.The filter paper collects particulate matter greater than 1 micron in size, on theconstantly moving surface, and is viewed by a photomultiplier Nal scintillationcrystal combination. The sample then passes through Gaseous Detector R-12 andexits the monitor. The sample is returned either to the Containment throughAS-30 when AS-3 is open, or to the Aux. Bldg. Vent Stack through AS-40 whenAS-10 or AS-20 is open.
An isokinetic sampling probe (See Figure KNP-RMO8) is used in the case of theContainment System Vent to assure that a representative sample is drawn. Thenominal maximum flow rate in the Containment System Vent is 33,000 cfm.The controls in the Sampling System are used to hold the sample flow rateconstant I . During times when the vent stream flow rate is lower, theisokinetic tip draws more than its proportionate share and produces a conservativesample.
The detector assembly is in a completely enclosed housing. The detector is ahermetically sealed photomultiplier tube and Nal scintillation crystalcombination. The pulse signal is transmitted to the RMS Drawers in the ControlRoom. Lead shielding is provided to reduce the background level to where it doesnot interfere with the detectors sensitivity. The filter paper mechanism, anelectromechanical assembly which controls the filter paper movement, isprovided as an integral part of the detector unit.
The R-1 I filter paper assembly contains a sprocket and chain mechanism withtwo speed capability. The operating speed is 1" per hour and the fast advance orpaper clear speed is approximately 28" per minute. A paper speed selector switchis located on the Control Room RMS Control Panels. Fixed filter paper operationis also possible. The paper supply lasts a minimum of 25 days when used atnormal operating speed of 1" per hour. The paper only lasts about 2.8 hours whenkept on fast speed
The R-12 Monitor (See Figure KNP-RM04) is provided to measure gaseousgamma radioactivity in the Containment or Containment System Vent. Whensampling the latter, it ensures that the radiation release rate during purging ismaintained below specified limits. High radiation level initiates closure of theContainment Purge Supply and Exhaust Duct Valves RBV-2, RBV-3, RBV-5,and TAV-12.
A continuous air sample is taken from the Containment atmosphere or theContainment System vent, after the air passes through Particulate Monitor R-l l,and draws the sample through a closed, sealed system to the off-line type gasmonitor assembly. The sample is constantly mixed in a shielded volume chamberwhere it is monitored by a GM Tube. The air sample is then returned to theContainment or the Aux. Bldg. Vent System.

= I.4 Li I i| Title Radiation Monitoring System (RW I
System No. 45 IRev. 1Date 07/08/02 Page 14 of 27
Detector Assembly R-12 is in a completely enclosed housing mounted in aconstant volume gas container. The container is a welded steel tank designed forcyclonic flow around the detectors axis i i1 eR to preclude stagnationwithin the sensing volume. The Fletectp is mounted exactly in the center of thetank volume, parallel to the length of the tank. Lead shielding is provided toreduce the background radiation level to a point where it does not interfere withthe detectors sensitivity.
Containment Air Particulate R-1I, and Radioactivity Gas Monitor R-12, haveassemblies common to both channels. The flow control assembly includes a pumpunit and selector valves that provide a representative sample or a "clean" sampleto the detectors.
The sample Pump unit consists of a pump to obtain the air sample, aoTnp-nrojconoiaind indicate the flow rate E] and C] to provide low and
high flow alarms.
Selector Inlet Valves AS-3, AS-10, and AS-20 (See Figure KNP-RM03) areprovided to direct the desired sample to the detector for monitoring and to blockflow when the channel is in maintenance or purging condition. Valve AS-30 andAS-40 are the main sample and auxiliary sample/detector purge outlet valves.These inlet and outlet valves are automatically controlled by operating a sampleselector switch on the R-I I monitor on the RM Control Console. This selectorswitch has three positions, VENT/CNTMT/PURGE. This switch aligns theContainment Vessel or the Containment System Vent sample, or "clean" purgeloops automatically for monitoring. A pressure sensor is provided to protect thesystem from high pressure transients. This unit automatically closes theContainment Inlet and Outlet Valves, AS-3 and AS-30, and stops the samplepump upon a high pressure condition. Status lights on the RM Control Consoleindicate which inlet valve is open.
Control Room Selector Switch ES-46566 is used to select the sample dischargelocation for samples routed through the Main Sample Outlet Valve AS-30.Samples can be sent to the Aux. Bldg. Vent through AS-35/SV-33621 or toContainment through AS-31/SV-33622. Containment Air Sampling Inlet IsolationValves AS-I/CV-31383 and AS-2/CV-31384 and Containment Air SamplingDischarge Valve AS-32/CV-31385 are controlled by Switches ES-46563,ES-46564, and ES-46565 respectively. These switches are three position,CLOSE/AUTO/OPEN, spring return to AUTO from the CLOSE or OPENpositions. These switches are located on the Control Room Mechanical VerticalPanel "B". Valve AS-I is closed on a Train A Containment Isolation Signal andValves AS-2 and AS-32 are closed on a Train B signal.
(See Figure KNP-RM03.) Also located on Monitor R-I I are the control switchesfor the sample pump, 'F/RESET/foAL/ON, and the filter speed selector -PFF/OPERiTTE/FAST. _L.In addition, there is a local START/STOP switchfor the sample pump on the 657' level of the Aux. Bldg.
Channel sampling system indicator lights for HI and LOW sample flow and HIpressure are located on the Monitor R-l I on the RMS Control Console. The F-i7

-Ac em No. 45 1 Rev. 1 1
I Title Radiation Monitoring System (RM) I Date 07/08/02 | Page 15 of 27 |
Upaperalar s sensed~frofm a microswitch on the paper path That is used to sensewhen the paper IolnIeds be repla o 1.-
3.3.3 Containment System Vent Activity Monitor R-21 (See Figure KNP-RM06)Note: See fistti e J I
In addition to the flexibility of utilizing R-11 and R-12 for monitoring theContainment System Vent, another channel is provided, R-21. In order to meetKNPP Technical Specifications (TS) requirements of having two leak detectionsystems in service, one of which must be sensitive to radioactivity, manual ValvesAS-5, AS-2-1, AS-50, AS-51, AS-34, and AS-30-1 are installed to allow R-21 tomonitor Containment samples when R-II/R-12 is out of service. The R-21channel consists of a fixed particulate filter, charcoal filter, a positivedisplacement sample pump, and off-line type radioactivity gas monitor mountedin series. This channel continuously monitors the filtered effluent in theContainment System Vent for activity. The sample pump is controlled by a localthree position switch, IRES C I. A Ti indicating lighton the RM Control Console indicates when the sample pump is ON EI].
The gaseous detector is a beta sensitive plastic scintillation detector mounted in anoff-line sampler. Essentially all the gamma emitting isotopes of interest also emitsbeta radiation. The use of the thin beta sensitive plastic scintillator reduces theshielding requirements around the detector while providing the necessarysensitivity and range. The sample tank design provides a cyclonic air flow aroundthe detector axis to preclude stagnant air within the sensing volume. The detectoroutput is transmitted to the RM System H5?zje r in the Control Room. Anisokinetic nozzle (see Figure KNP-RM08) is provided for sample collection and issimilar to that discussed for the R-I I monitor nm'pliniR
The charcoal filter for this channel is for measuring the accumulation of iodineisotope activity. The particulate filter is for the collection of particulate activitysuch as Cesium-134 and 137. These filters additionally serve to protect thesensitive sample volume chamber of the radio-gas detector.
A high radiation signal from the R-21 monitor provides a closure signal to theContainment Purge Supply and Exhaust Valves RBV-I/CV-31125,RBV-4/CV-31123, RBV-5/CD-34006, and TAV-12/CD-34033.
3.3.4 Aux Bldg Vent Monitoring SubsystemIn order that the Control Room Operators be aware of the amount of activitybeing released from the plant, the Aux. Bldg. Vent Monitoring Subsystem isdesigned to perform the following:* Monitor, indicate and record the radioactivity level of effluent gases
discharged from the Aux. Bldg. Vent to the atmosphere.* Alarm when the radiation level of the effluent gases being discharged exceeds
a preset limit.* Provide automatic initiation of the Aux. Bldg. Special Vent (ASV) System,
the SFP Ventilation System - filtration mode only, and initiate isolation of allducting to the Aux. Bldg. Vent with the exception of the ASV System

Tit RaiaIons Moetri tm]ITitle Radiation Monitoring, System (RM) | Dati
tern No. 45 | Rev. 1a 07/08/02 Page 16 of 27
discharge and the SFP Vent System discharge.* Provide automatic closure of the gas release valve from the gas decay tanks.
3.3.5 Aux Bldg Vent Monitors R-13 and R-14 (See Figure KNP-RM07)Note: See N PP ui-E - spec i i sE F-
The Aux. Bldg. Vent Monitors detect radiation passing through the Aux. Bldg.Vent to the atmosphere. The R-13/R-14 monitors each consists of oire
;ikiipe. The Yors7 detector is a kota se n stil nlla ete dtorZ
Remote indication and alarms are provided adjacent to the Waste DisposalSystem Panel. A high level alarm shuts down normal ventilation fans except theSFP Vent fans. A high level also activates the ASV System, activates the SFPVent System in the filtration mode only, initiates isolation of all ducting to theAux. Bldg. Vent, and closes the gas release valve from the gas decay tanks. If thesignal for high radiation is from R-13, then the R-I 1/R-12 sample discharge isdiverted to the Containment; AS-35/SV-33621 closes and AS-31/SV-33622opens. The Gas Release Valve WG-36/CV-31215 is an unloading valve located inthe 2" discharge header from the gas decay tanks. The 2" Containment VentSystem isolates with LOCA-IOOB/CV-31725 closing and/orLOCA-2B/MV-32146 closing.
flux eBdg Vent Saple R-i3Aection d2leted perDCR 172.
3.3.6 Condenser Air Ejector Gas Monitor R-15Note: See !ccI t &th an
R-15 channel monitors the discharge from the condenser air ejector exhaustheader for gaseous radioactivity which is indicative of a SG tube leak or a primaryto secondary leak. The noncondensible gases are drawn from the Condensers Aand B by the steam jet air ejector and discharged to the Aux. Bldg. Vent forfiltration prior to release. A 3-way control Valve AR-6/CV-31168 is located in the4" condenser air ejector discharge header and is positioned to normally direct thedischarge to the Aux. Bldg. Vent System. AR-6 can be positioned to discharge tothe Turb. Bldg. during initial drawing of a vacuum. An R-15 or R-19 alarm,causes the AR-6 to be directed to the Aux. Bldg. Vent System rather thandischarge to the Turb. Bldg. R-15 serves as a backup to isolate SG blowdown andblowdown sampling. A gamma Fcintilatorjdeteefo1r )iLmotntedji iViai-fldry
used to monitor gaseous radiation levels. Detector Assembly R-15 ispositioned in the 4" condenser air ejector exhaust header. SG sample monitorR-19 E serves as a backup to R-15 to position Valve AR-6 to the Aux. Bldg.Vent System and to isolate SG blowdown.
3.3.7 RHR Pump Pit Monitor R-22 (See Figures KNP-RM06 & RM07)Note: See I j J

=17-Mg W System No. 45 T Rev. I l| Title Radiation Monitoring System (RM) I Date 07/08/02 | Page 17 of 27
Monitor R-22 provides continuous monitoring of the RHR Pump Pits exhaust airfor indication of pump leakage which may contain high gaseous activity and highparticulate activity.
Isokinetic nozzles are located directly in front of the discharge to RHR Fan CoilCoolers A and B. Each sample line has an associated loop flow control valve,flow meter, and hi/low flow alarm switches.
The flow control valves are controlled by a three position maintained,PUiY7I1TSi1 switch. Control Switch ES46117 is located in the Control Room on
Mechanical Vertical Panel "B". Red (OPEN) and green (CLOSED) indicatinglights are located with the control switch. All of the R-22 equipment, along withthe main flow control valve and sample pump, are contained in the RHR MonitorPanel. Local and Control Room control switches, flow alarms, and indicatinglights are identical to those described for R-21 except there are two sample flowlines with different alarm setpoints for R-22. The radio-gas monitor is mountedacross from the cabinet to provide space for additional shielding. Isokineticnozzles are included for the possible future installation of a particulate monitor.
Ja ;gsetious Hecbeta seiia i detectormounted LI' in an off-line sampler. The sample tank design provides a cyclonicair flow around the detector axis to preclude stagnation within the sensingvolume. The detector output is transmitted to the RM D in the ControlRoom.
A high radiation alarm alerts the Control Room Operators so that a timely transferto the standby RHR pump may be made.
3.3.8 Control Room Ventilation Monitor R-23Note: See Li 9
Channel R-23 continuously monitors the Control Room ventilating air intakesupply for indication of airborne activity in the Control Room Ventilation (ACC)System. The detector is a beta sensitive plastic scintillation detector that ismounted on the side of the 14,000 cfm air supply duct.
FZI7 3High alarm circuits actuate the post-accident recirculating fans andnecessary dampers to isolate the Control Room environment. This places the ACCSystem (see System Description 25) in a recirculate mode and the air isrecirculated through the post-accident recirculating filter system. Redundant airintakes are provided to allow for any makeup requirements. The air intakes are theAux. Bldg. Air Conditioning (A/C) Intake and the Aux. Bldg. Vent Systemintake.
If a LOCA occurs, the background radiation field in the vicinity of the detectorcould be so high that Monitor R-23 would provide extremely unreliableinformation as to airborne activity levels in the Control Room.In this case, post LOCA recirculation through the post-accident filter system isinitiated on an Safety Injection (SI) signal or an Steam Exclusion Zone SV Areasignal.

-S - I M aas stem No. 45 I Rev. l
I Title Radiation Monitoring System (RM) I Date 07/08/02 I Page 18 of 27
3.4 SPING4 Off-Line Stack Gas MonitorsThe SPING-4 monitors consist of a self contained microprocessor based radiationdetection system used to monitor for particulate, iodine, and noble gas activity in the air.Two SPING-4 Process Monitors are installed off-line, one in the Containment Bldg. VentStack and one in the Aux. Bldg. Vent Stack. All SPING System detectors are tied to twocentral control consoles (CCCs) for monitoring. Each SPING-4 stack process monitorcontains nine individual detectors. The two SPING4 Process Monitors and associatednine individual detectors are as follows:Channel 01 = Area Monitor "Aux. Bldg. Vent Duct SPING-4"Channel 02 = Area Monitor "Containment Bldg Vent Duct SPING"
mW '-,
01-01 Beta particulate 02-01 Beta particulate01-02 Alpha particulate 02-02 Alpha particulate01-03 Iodine 02-03 Iodine01-04 Iodine Background 02-04 Iodine Background01-05 Lo-range gas 02-05 Lo-range gas01-06 Gamma area monitor 02-06 Gamma area monitor01-07 Mid-range gas 02-07 Mid-range gas01-08 Gas Background 02-08 Gas Background01-09 Hi-range gas 02-09 Hi-range gas
Information from the SPING-4 Process Monitors is available at either of the CCC's.Information from the SPING-4 monitors is also processed at the Radiation ProtectionOffice and the Radiological Analysis Facility in the Technical Support Center (TSC).
3.5Note:
General & Secondary Area Radiation Monitoring SubsystemsSee CNED ihE 2 2forspecifici'iAll channels of the area radiation monitoring use GM tubes as the radiation detectionelement with the exception Ra-nd R-30 which uses ion chamber detectors.Each area radiation detector and integral preamplifier is packaged in a moisture proofassembly.
The following area radiation monitors are provided:
II M I
Control Room Area Monitor R-l 29011Containment Vessel Area R-2 29012Radio-Chem Lab Monitor R-3 29013Charging Pump Area Monitor R-4 29033Fuel Handling Area Monitor R-5 29015Sampling Room Area Monitor R-6 29016Incore Instrument Seal Table R-7 29017Area Monitor ___ 29017Drumming & Waste Disposal R-8 29018
jNuclearAesearch
,torporatioiGM tube
Ion Chamber
GM tube
RCS Letdown Line Area R-9 29019RCS Letdown Line Area R-9 29019

=T..j i]| Title Radiation Monitoring System (RM) I Dal
item No. 45 Rev. 1
te 07/08/02 Paae 19 of 27 3New Fuel Pit (Criticality) R-10 29014 Ion ChamberRadwaste Drumming Room R-25 29034Area Eberline GM tubeSGBT Ion Exchanger Room R-26 29037Spent Resin Storage Tank Rm R-27 29038Compacted Radwaste Drum R-28 29036Drum Storage Area GM tubeSGBT Holdup Tank Room R-29 29035 EberlineContainment Sump C Area R-30 29039 Ion ChamberSludge Interce tor Area R-39 29026 GM tube
The additional area monitors (R-25 through R-30 and R-39) were installed as a result ofneeds identified from experience. These channels provide only local indication. ChannelR-30 has local alarm capability. The local alarm prevents inadvertent entry into a HighRadiation Area when the incore thimbles are withdrawn for refueling or an incoredetector is not in the proper storage location.
The main area radiation monitors are designed to measure gamma activity in thesurrounding air over the range of 0.1 mR/hr to [lb00 R/hr for Channels R-I through R-5ii.
The detector output is amplified and the log count rate is determined by the integralamplifier at the detector. The radiation level is indicated locally near the detector and 7rilleCoio6lRooi. High radiation alarms are displayed in the Control Room and near thedetector location.
A remotely operated, long half-life radiation check source is provided with Channels R-Ithrough R-F. The source strength is sufficient to produce pscale JRl2n
The New Fuel Pit (Criticality) Monitor R-10 is a specialty device which actuates anaudible evacuation alarm [2_J in the New Fuel Pit Area. This monitor meets therequirements of 10 CFR 70.
3.6 Auxiliary Area Radiation Monitors (See Figure KNP-RM05)Note: See g 2Fs fic tistlfiannl:
The original equipment suppliers for the Auxiliary Area Radiation Monitors wereEberline and General Atomic. This system was installed as a result of the lessons learnedafter TMI accident and because of increased NRC requirements. The Aux. AreaRadiation Monitoring consists of 29 channels. The detectors are mostly ion chambers and6 energy compensated GM tubes. Local readout is available at field mounted dataacquisition modules (DAMs) and the two associated CCCs. An additional five portable,cart-mounted beta air monitors can be tied into the system and can be read out at eitherCCC. High radiation alarms are displayed at the two CCCs. Historical data is stored atthe DAMs via a microcomputer. Two recorders in the Control Room are provided for thewide range Containment monitors.
The Aux. Area Radiation Monitoring Subsystem Detectors provide data to the localDAM's. Data is then passed on to the two CCC's. The CCC's have two waycommunications with the DAM's via an optically coupled data highway system. A failure

I - 3- SI stem No. 45 I Rev. 1 II Title Radiation Monitoring System (RM) I Date 07/08/02 | Page 20 of 27 |
of a DAM or any detector does not affect other portions of the system. Each CCC has itsown keyboard, printer, and system status annunciator.The following table lists the DAM locations:
_! ! ' 1
I I MaintenanceStairwell,El.586', near MCC 1-46E |2 _ High Radiation Sample Room (HRSR)3 Maintenance Shop, El. 605'4 Loading Dock5 Stairwell, El. 642', near SPING-46 TSC Electrical Equipment Room

mm -a Ml
.
stem No. 45 I Rev. I 3I Title Radiation Monitoring System (RM) I Date 07/08/02 | Pane 21 of 27
The Aux. Area Monitors include the following monitors and areas:
=1MMMV.,111103-01 I Waste Disposal Panel Area 2904303-02 Post-Accident Sample Room 2904403-03 CC Heat Exchanger Area 2905103-04 Beta Air Monitor - HRSR 2906703-05 Beta Air Monitor - HRSR 2906703-06 Beta Air Monitor Aux. Bldg. 2906903-07 Beta Air - El, 586' 2906903-08 Beta Air Monitor Aux. Bldg. 2907003-09 Beta Air - El, 606' 29070
2
03-10 Containment Hi Level Rad B 2906404-01 Machine Shop 2904904-02 Monitor Room Area 2905004-03 Makeup Demineralizer 29053 304-04 Cold Chem Lab Area 2905504-05 Beta Air Monitor Aux 2906804-06 Bldg. El, 606' 2906805-01 RHR Pump Pit Area 2904505-02 Radwaste Compactor(GM tube) 29046 405-03 Aux. Bldg. Loading Dock 2905206-01 I & C Shop Area (GM tube) 2905606-02 Shield Bldg. Vent Filter 2905706-03 Control Room A/C Vent 29058 506-04 Containment Vent Exhaust Filter 2905906-05 Zone SV Exhaust Filter 2906006-10 Containment Hi Radiation A 2906507-01 RAF Count Room - TSC(GM Tube) 2906207-02 Tech Support Center(GM Tube) 2906307-03 TSC Stairwell (GM Tube) 29061 607-04 Beta Air Monitor TSC 2906607-05 Beta Air TSC El, 586' 2906608-01 Sulfuric Acid Storage Tank (GM Tube) 2904108-02 Containment Spray Pump 29042 108-03 Heating Steam Boiler 29048

mm I- NoXNo. 45 1 Rev. I I
Title Radiation Monitoring System (RM) | Date 07/08/02 | Page 22 of 27 |
3.7 Tritium Sampling
3.7.1 Waste Gas Tanks Tritium SamplerThis sample unit collects a sample of water vapor from the waste gas tanks. Thesample of water is then taken to the lab to be analyzed for tritium. The sampleunit consists of a silica gel sample column to collect the water vapor, a samplepump, and a flow indicator. Flow Indicator FI-18032 measures the air flowthrough the silica gel column. The sample unit is mounted next to the AutomaticGas Analyzer. The sample unit draws a sample from the NVaste Gas Tanks sampleline and discharges to the Automatic Gas Analyzer discharge line.
3.7.2 Containment Vessel Tritium Sampler (See Figure KNP-RM02)This sample unit collects a sample of water vapor from the Containment Vessel.The sample of water is taken to the lab for analysis. The Containment VesselTritium Sampler unit consists of a silica gel sample column to collect water vapor,a sample pump, and a flow indicator. Flow Indicator FI-18033 measures the airflow through the silica gel column. This sample unit is mounted on top of theRadiation Monitors R-11 and R-12 and uses the same Containment penetrationpiping.
3.7.3 Containment System Vent Tritium Sampler (See Figure KNP-RMO2)This sample unit collects a sample of water vapor from the Containment SystemVent discharge. The sample of water is taken to the lab for analysis. TheContainment System Vent Tritium Sampler unit consists of a silica gel samplecolumn to collect water vapor, a sample pump, and a flow indicator. FlowIndicator FI-18034 measures the air flow through the silica gel column. Thissample unit is mounted on top of Radiation Monitor R-21 and draws a samplefrom the vent discharge line and discharges back into the same line.
3.7.4 Aux Bldg Vent Tritium SamplerThis sample unit collects'a sample of water vapor from the Aux. Bldg. Ventdischarge. The sample of water is taken to the lab for analysis. The Aux. Bldg.Vent Tritium Sampler unit consists of a silica gel sample column to collect watervapor, a sample pump, and a flow indicator. Flow Indicator FI-18035 measuresthe air flow through the silica gel column. This sample unit is mounted on top ofRadiation Monitor R-13A and draws a sample from the vent discharge line anddischarges back into the same line.
3.8 RM System Panels - Mechanical Vertical Panel "C" (See Figure KNP-RMOI)The RM System Panels consist of three Control Consoles:. CR-116 the l
,15,1§, 17, 18 and_1 and two multipoint recorders for monitoring R-31 throughR-38.
* CR-1 i t eas~tse~1C61rrbrafloniareaR Sra1,-and 10) onemmultipoini recorder, and two Containment High Range recorders.
CR-l 18 is the u6aie a r cng jJ

mm -I- . e SstemNo45R.1XNo. 45 1 Rev. 1 l| Title Radiation Monitoring System (RM) | Date 07/08/02 | Page 23 of 27 |
. 17 ca trnkM mh neiTV_khruh -~23 e
Additional Process Monitors R-31 through R-38 are connected to the paperless recorders81034 and 81035 hir cti soietha eet t connection Real rTimeBackb6heiR'TK5
eference KNPPDrawing E ;3826. (See Figure KNP-RMO I.)
Each Indicator-Amplifier-Trip (IAT) unit contains the following:* Level amplifier
Log level amplifierPower suppliesTest-calibration circuitry
* Analog radiation level meter indication*Indicating lights for high radiation alarm, alannm channel failure,
,omimalj ppatrion,, process sample flow failure, etc.Bistable circuitry for alarms
* Check source circuitry
The level amplifier amplifies and discriminates the radiation detector output pulses toprovide a discriminated and shaped pulse output to the log level amplifier.
The log level amplifier accepts the shaped pulse of the level amplifier output. The loglevel amplifier performs a log integration to convert the total pulse rate to a logarithmicanalog signal. The signal is then amplified and the resulting output is provided forindication and recording.
Individual power supplies are contained in each drawer/unit for furnishing positive andnegative voltages for transistor circuits. The power supply also supplies the detector highvoltage and relay and alarm lights.
Each IAT has test and calibration circuitry. These circuits provide precalibrated pulsedand/or analog signals to perform channel tests. A solenoid check source is available forchecking and verifying channel operation. The check source energy emissions are similarto the energies being monitored. The check source strength is sufficient to causeapproximately mid-range indication on the indicator.
A radiation level meter (see Figure KNP-RM09) is calibrated logarithmically in countsper minute (cpm). Indicating lights on the IAT unit indicate High Radiation Level alarmsand Loss-of-signal. A common annunciator is actuated on high radiation levels.

mm - "I M emlNo. 45 I Rev. I
I Title Radiation Monitoring System (RM) I Date 07/08/02 j Page 24 of 27
3.9 AlarmsNOTE-: See Alarm Respnse'Sheets iniControl Room for actual Setpoints
47011-B RADIATION INDICATION HIGH47012-B RAD MONITOR -: ' FAILURE47013-A RAD MONITOR SAMPLING FLOW HIGH/LOW47014-B RAD MONITOR CHECK SOURCEACTIVATED47015-B RAD MONITOR POWER SUPPLY FAILUREg7013IA k A IMONITOR SAMPLING FTO WHICH/,LOW
3.10 Sequence of Events Recorder (SER),2.T T
[1N U I See Alarm Respnse Sheets'in'Control Room for actual SetpointsM m IM
49001206 RI CONTROL ROOM RADIATION HIGH49001207 R2-CONTAINMENT RADIATION HIGH
49001209 ROOMRADIATION HIGH49001210 R5 SPENT FUELPOOL'AREA RADIATION HIGH49001211 R6 SAMPLING ROOM RADIATION HIGH49001212 R7 IN-CORE SEAL TABLE AREA RADIATION HIGH
49001214 R9 LETDOWN LINE AREA: RADIATION HIGH49001215 RIO NEW FUEL PIT RADIATION HIGH49001216 U I.,CNTMT AIR PARTICULATE MONITOR RADIATION HIGH49001217 R12 CONTAINMENT GASOUS49001218 R13 AUX-BUIDLING VENT RADIATION HIGH49001219 R14 AUXBUILDING VENT RADIATIONHIGH49001220 RIS CONDENSORAIR EJECTOR RADIATION HIGH49001221 R16 CNTMT-FAN COILS SERVICE WATER RADIATION HIGH49001222 R17 COMPONENT COOLING RADIATION HIGH49001223 R18 LIQUID WASTE DISPOSAL RADIATION;HIGH49001224 RI9 S/G BLOWNDOWN SAMPLE RADIATION HIGH49001225 R20 AUX BUILDING HEAT EXCHANGER SW RADIATION HIGH49001226 R21-CONTAINMENT. STACK-MONITOR RADIATION HIGH49001227 R22 RHR PUMP PIT RADIATION HIGH49001228 R23 CONTROL ROOMIVENTILATION RADIATION HIGH
49001232 RADIATION MONITOR CHECK SOURCE ACTIVATED
49001390 RI iCONTAINMENT VENT FLOW HIGH/LOW49001391 RI3H AUX BLDG SAMPLE FLOW HI/LO49001396 R21 CONTAINMENT SAMPLE FLOW HI/LO49001397 R22-RHR PUMP PIT SAMPLE FLOW HI/LO
______ I

mIN0 ye No. 45 I Rev. I
I Title Radiation Monitoring System (RI) I Date 07/08/02 j Page 25 of 27
Sequence of Events Recorder (SER) (Continued)_ . - I~Ii
49001399 R14 AUX BUILDING SAMPLE FLOW HI/LO49001453 R19 BLOWDOWN FAILURE49001454 R20 SERVICE-WATER FAILURE49001455 R21 CONTAINMENT VENT. FAILURE49001459 R22 RHR PUMP PIT I.. - .FAILURE49001468 R23 CONTROLUROOM VENT FAILURE.49001469 h TRAIN PS-1i00/POWER SUPPLY.FAILURE49001485 R39 SLUDGE FLTR DRM AREA RAD HI49001486 RI CONTROL ROOM AREA FAILURE49001487 R2 CONTAINMENT hREA FAILURE49001488 IAREA'PS-100/POWER SUPPLY-FAILURE49001489 R4'CHARGING PUMP ROOM FAILURE49001490 R5 SPENT FUEL AREA FAILURE49001491 R6 SAMPLING ROOM FAIURE49001492 R7 IN-CORE SEAL TABLE FAILURE
9001493 B TRAIN.PS-I00/POWER SUPPLY,:FAILURE49001494 R9 LETDOWN LINE FAILURE49001495 RIO NEW FUEL PITh: 1 FAILURE49001496 RI 1 .CONTAINMENT.VENT FAILURE49001497 R12 CONTAINMENT VENT FAILURE49001498 R13 AUX BLDG VENTt : FAILURE49001499 R14 AUX BLDG VENTi .I FAILURE49001386 R15 CONDENSER AIR EJECTOR FAILURE49001387 R16'CONTAINMENT FAN COIL FAILURE49001388 R17 COMPONENT COOLING FAILURE49001389 R18 WASTE DISCHARGE FAILURE
3.11 Interlocks* R-1 1 Containment Vent & Purge Particulatc RM:
Actuates a CVI signal on high radiation level. [] for Train B equipment. ContainmentPurge Supply Dampers TAV-12/CD-34033 and RBV-2/CV-31126 close. PurgeExhaust Dampers RBV-3/CV-31124 and RBV-5/CD-34006 also close. Post-LOCAH2 Isolation 1B Valve LOCA-2B/MV-32146 and SA-7003B/MV-32148 close.
* R-12 Containment Vent & Purge Gaseous RM:Actuates a CVI signal on high radiation level. Ed Same dampers as R-1 I are closed.
* R-13 Aux. Bldg. Vent RM:Closes the Waste Gas Discharge Valve WG-36/CV-31215 in the gas discharge line.Shuts down the Aux. Bldg. normal vent supply and exhaust fans. Activates Train A ofthe Aux. Bldg. Special Ventilation (SV) System. Iz Repositions SFP dampers byopening Charcoal Filters A and B inlet and outlet dampers and closing the filterbypass dampers. Shifts Sample Discharge R-I I & R-12 to Containment by closingAS-35/SV-33621 and opening AS-31/SV-33622. Closes Post-LOCA Valves:LOCA- I OOB/CV-31725, and LOCA-20 I B/CV-31727.
* R-14 Aux. Bldg. Vent RM:Performs the same actions as R-13 on the redundant Train B equipment at a highradiation level. E Does not shift R-I I and R-12 Sample Valves.
* R-15 Condenser Air Ejector Gas RM:On a high radiation level M routes the condenser air ejector discharge to the Aux.Bldg. Vent by de-energizing AR-6/CV-31168 if the Turb. Bldg. has been selected.
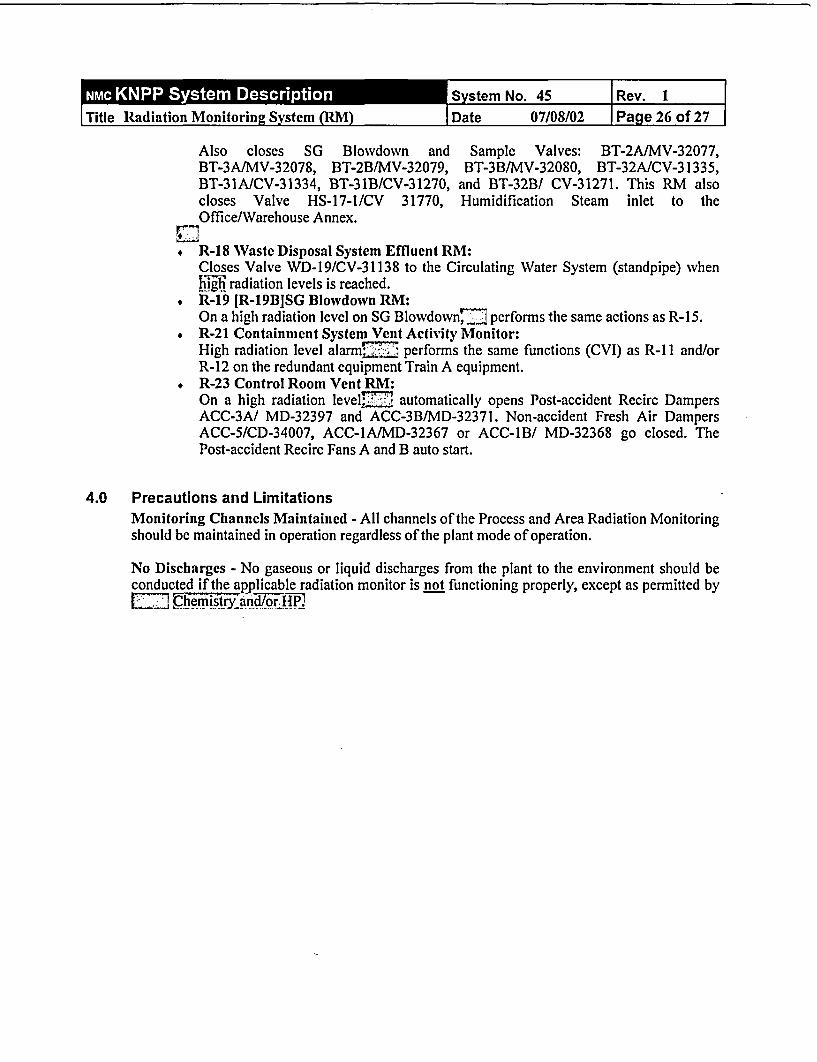
Sm - -MM M stem No. 45 Rev. 1:e 07/08/02 Page 26 of 27I Title Radiation Monitoring System (RM) I Dal
Also closes SG Blowdown andBT-3A/MV-32078, BT-2BIMV-32079,BT-31 A/CV-31334, BT-3 lB/CV-31270,closes Valve HS-17-1/CV 31770,Office/Warehouse Annex.
Sample Valves: BT-2A/MV-32077,BT-3B/MV-32080, BT-32A/CV-31335,
and BT-32B/ CV-31271. This RM alsoHumidification Steam inlet to the
R-18 Waste Disposal System Effluent RM:Closes Valve WD-19/CV-31138 to the Circulating Water System (standpipe) whenEhigi radiation levels is reached.R-19 [R-19B]SG Blowdown RM:On a high radiation level on SG Blowdown=Z performs the same actions as R-15.R-21 Containment System Vent Activity Monitor:High radiation level alarmFT performs the same functions (CVI) as R-1 I and/orR-12 on the redundant equipment Train A equipment.R-23 Control Room Vent RM:On a high radiation levelZ automatically opens Post-accident Recirc DampersACC-3A/ MD-32397 and ACC-3B/MD-32371. Non-accident Fresh Air DampersACC-5/CD-34007, ACC-IAIMD-32367 or ACC-IB/ MD-32368 go closed. ThePost-accident Recirc Fans A and B auto start.
4.0 Precautions and LimitationsMonitoring Channels Maintained - All channels of the Process and Area Radiation Monitoringshould be maintained in operation regardless of the plant mode of operation.
No Discharges - No gaseous or liquid discharges from the plant to the environment should beconducted if the applicable radiation monitor is not functioning properly, except as permitted byrzzheristry.and/or HP*i

0 0 St N. 4RlNo. 45 I Rev. I
I Title Radiation Monitoring System (RM) I Date 07/08/02 j Page 27 of 27
5.0 References
Summary N-RM-45, N-RM-45-CL, A-RM-452.0
FunctionsUSAR 11.2 E-2013, E-2018E-2019, E-2951, E2021
3.0 M-748 I & C Logic Description #45Design Annunciator Response 47023 series, and 47024-15
Description Forassociated DCR's see:DCR 841, DCR 2172, DCR 3182, DCR 2876_____ rograrms\KNPP Applications\Physical Chhnges\DCR Database\Sys 45
4.0Precautions N-RM-45
Limitations
5.0 KNPP Off-Site Dose Calculation Manual (ODCM)R n See Technical Specifications as referencedReferencesOperation Manual53
6.0 For' complete .listing -of .procedures' associated with y stem45,-see.-Procedures h:\Procedures Issuied\Proc Index\Sys 45
7.0 See attached FiguresAppendices
5.1 Technical SpecificationsNOTE: Refer to a Controlled Copy of KNPP Technical Specifications for plant operations.
TS Table3.5-1 #8
Specifies the set point limit for the Containment Purge & Vent Systemdetectors to be operable.
TS Table Requires that the Containment Ventilation Isolation (CVI) signal must be3.5-4, #3.a operable.
TS 3.1.d.5 Provides minimum RCS leak detection systems requirements for when theReactor is critical and above 2% power.
TS 3.8.a.8 Identifies requirements for when the Containment Vent & Purge Systemisolation must be operable during and just prior to refueling.
CUD -CM
e,�Iy,TS
res specifi pres -i e-monitoring: instruments 'to beperable'ior actions implemented and routine surveillance performedJ
specific radiative gas monito rig'iitume'n''be' operationaInimpemented and routine surveillance che ks perfarmed

S. 7-T3 R M.
I
stem No. 45 I Rev. 1
I Title Radiation Monitorin2 System (RM) I Date 07/08/02 | Page 28 of 27
6.0 ProceduresofProcedures speci --,to.Sysem5see.
r~ocedure, ,s Issued\Proc In, dex
7.0 Appendices
7.1 Attached Figures
KNP-RMO1 Mechanical Vertical Panel "C" RM System Control_____ ____ Consoles _ _ _ _ _ _
KNP-RM02 Containment Bldg Vent Radiation Monitoring OPERM-602KNP-RM03 Containment System Vent Air Particulate Monitor R-l I 10KNP-RM04 RM Process Monitors _
KNP-RM05 Aux Area Radiation Monitoring Subsystem E-2951'KNP-RM06 t.' '-j RM Process Channels -KNP-RM07 l 1 RM Area Channels L:2018KNP-RM08 Isokinetic ProbeKNP-RM09 R-1 I Monitor
NOTE: The T'Figures".(drawings) previously associated with the System ' Descriptions will not bere'ised -and 'updated at this? time. Instead ' (obsolte),pies ofjthese.igures have been
Tmped HISTORICAL and tempor'ily attachedJ