Ket qua dan so chu yeu (TA)KH... - ILO
318
-
Upload
khangminh22 -
Category
Documents
-
view
2 -
download
0
Transcript of Ket qua dan so chu yeu (TA)KH... - ILO


ii

iii
INTRODUCTION
The statistics information on population change and family planning implementation has supported the levels and branches in evaluating the implementation of main population indicators, the tendency of change as well as the socio-economic characteristics of the population. From that point, the results have assisted in the policy making, the annual as well as period socio-economic development planning.
In order to provide information data on population and family planning, besides using results from the 2009 Population and Housing Census and the 2014 Intercensal Population and Housing Survey are as basic data, the annual population change and family planning surveys have been conducted aimed at estimating population and family planning indicators at provincial level and whole country, thus meeting the demand on policy making, management, operating social-economic development of the levels, branches and other users.
The 2015 population and change survey was conducted under Decision number 84/QD-TCTK issued on 10th February 2015 by the Director General of the General Statistics Office of Viet Nam. This is the sample survey conducted annually with the purpose of collecting information on population, population changes (birth, death and migration) as well as basic information on contraceptive use and reproductive health of women aged 15-49 years.
The content of the book named “Major Findings of the 1/4/2015 time-point Population Change and Family Planning Survey” consists 4 parts:
- Part I: Design and Implementation of the Survey: Presents the process of organizing the survey; design and estimation of survey sample: sampling frame, determine the sample size and sample allocation, estimated weights; some concepts and definitions of population change and family planning indicators; and some major findings from the survey results;
- Part II: Major Findings: Describes major findings of the survey as well as analyzing on population size and structure, marital status, education, family planning and reproductive health, fertility, mortality, migration and basic characteristics of migrants;
- Part III: Annexes: Presents annexes about auxiliary information to support for the main content of the book;
- Part IV: Tabulated Tables: Provides the most basic tabulated tables to users (detail data could be tabulated by micro data of the survey).

iv
Statistics data in this book was tabulated from the result of the survey with reliable sample size. However, for some indicators in more details could be affected by sampling errors. Therefore, General Statistics Office would like to remind data users paying more attention when using the survey result to analyze.
The 2015 population change and family planning survey has received timely technical and financial support from the United Nations Population Fund (UNFPA). On this occasion, the General Statistics Office would like to expresses our appreciation for the effectively and useful assistants and look forward to receive the support from UNFPA for the following surveys.
The General Statistics Office hopes that this publication will meet the key information demands from socio-economic policy makers, especially from those who are working in the field of population and family planning. We warmly welcome all constructive comments from readers in order to make the better publications in the future.
Comments and detailed information, please contact the following address:
General Statistics Office (Department of Population and Labour Statistics), 6B Hoang Dieu street, Ba Dinh, Ha Noi, Viet Nam.
Tel: + 84 4 38 230 100, 38 230 129, 37 333 846
Email: [email protected], [email protected]
GENERAL STATISTICS OFFICE

v
TABLE OF CONTENTS
Introduction................................................................................................................. iii
Table of contents ........................................................................................................ v
List of abbreviation.................................................................................................... x
PART I: DESIGN AND IMPLEMENTATION OF THE SURVEY .......................... 1
I. SURVEY ORGANIZATION ...................................................................................... 3
1.1. General information about the survey ............................................ 3
1.2. Preparation for the survey .............................................................. 5
1.3. Revising enumeration areas, updating the listing and selecting enumerated household .............................................. 5
1.4. Recruiting and training enumeration force ........................................... 6
1.5. Field-work and supervision of data collection................................ 7
1.6. Data processing and tabulation ...................................................... 8
II. SAMPLE DESIGN AND ESTIMATION................................................................... 8
2.1. Sample frame................................................................................. 8
2.2. Determination of sample size and sample allocation...................... 8
2.3. Estimating the sample generalizing weights................................... 9
III. SOME CONCEPTS AND DEFINITIONS................................................................ 11
IV. SUMMARY OF KEY INDICATORS ...................................................................... 16
PART II: MAJOR FINDINGS..................................................................................... 19
CHAPTER 1: POPULATION SIZE AND STRUCTURE............................................... 21
1.1. Household size and population size ....................................................... 21
1.2. Population structure .................................................................................. 27
CHAPTER 2: MARITAL STATUS................................................................................ 33
2.1. Marriage trends .......................................................................................... 33
2.2. Singulate mean age at marriage .............................................................. 36
2.3. Adolescent marriage ................................................................................. 39

vi
CHAPTER 3: EDUCATION .......................................................................................... 41
3.1. School attendance...................................................................................... 41
3.2. Gross and net school attendance rates ............................................ 43
3.3. Literacy.......................................................................................... 44
3.4. Educational attainment................................................................... 46
3.5. Technical and professional qualifications ...................................... 47
CHAPTER 4: FAMILY PLANNING AND REPRODUCTIVE HEALTH ..................... 49
4.1. Implementation of family planning ................................................ 49
4.2. Reproductive health care................................................................ 56
CHAPTER 5: FERTILITY ............................................................................................. 61
5.1. Total fertility rate........................................................................... 61
5.2. The fertility differential by provinces/cities ................................... 64
5.3. Age specific fertility rate ............................................................... 65
5.4. Crude birth rate .............................................................................. 66
5.5. Sex ratio at birth ............................................................................ 68
5.6. Rate of women aged 15-49 giving the third birth or more .............. 70
5.7. Knowing the sex of foetus before delivery..................................... 72
CHAPTER 6: MORTALITY.......................................................................................... 75
6.1. Crude death rate............................................................................. 76
6.2. Age specific death rate................................................................... 79
6.3. Infant mortality rate ....................................................................... 80
6.4. Under 5 mortality rate.................................................................... 83
6.5. Life expectancy at birth ................................................................. 84
6.6. Cause of death ............................................................................... 86
CHAPTER 7: MIGRATION AND BASIC CHARACTERISTICS OF MIGRANTS ...... 89
7.1. Inter-regional migration ................................................................. 89
7.2. Inter-provincial migration .............................................................. 91
7.3. Urban - rural migration flows ........................................................ 93
7.4. Key characteristics of migrants............................................................... 93

vii
PART III: ANNEXES 97
Annex 1: Questionnaire.................................................................................... 99
Annex 2: Sample allocation of the 1/4/2015 time-point Population Change and Family Planning Survey ......................................... 111
Annex 3: Population density by province/city, 2009 and 2015................ 113
Annex 4: Selected indicators about population structure........................... 114
Annex 5: Selected indicators about nuptiality of the population aged 15 and over ............................................................................ 116
Annex 6: Selected indicators about education ............................................. 118
Annex 7: Selected indicators about highest training level attained within the population aged 15 and over..................................... 121
Annex 8: Selected indicators about family planning implementation..... 124
Annex 9: Selected indicators about fertility ................................................. 126
Annex 10: Selected indicators about mortality............................................ 128
Annex 11: Selected indicators about migration 1 years prior to the survey time point .......................................................................... 130
PART IV: TABULATED TABLES ............................................................................. 133
Table 1: Population by urban/rural residence, sex, socio-economic region and province/city, 1/4/2015 ............................................... 135
Table 2: Population by urban/rural residence, sex, socio-economic region and age group, 1/4/2015..................................................... 138
Table 3: Population aged 15 and over by current marital status, socio-economic region and province/city, 1/4/2015 ............................ 145
Table 4: Population aged 5 and over by currently school attendance, sex, urban/rural residence, socio-economic region and province/city, 1/4/2015 ................................................................... 151
Table 5: Population in the ages of primary school attending primary school by sex, urban/rural residence, socio-economic region and province/city, 1/4/2015............................................................ 160
Table 6: Population in the ages of lower-secondary school attending lower-secondary school by sex, urban/rural residence, socio-economic region and province/city, 1/4/2015 ............................ 169

viii
Table 7: Population in the ages of higher-secondary school attending higher-secondary school by sex, urban/rural residence, socio-economic region and province/city, 1/4/2015 ............................ 178
Table 8: Population in the ages of college/university attending college/university by sex, urban/rural residence, socio-economic region and province/city, 1/4/2015 ............................ 187
Table 9: Population aged 15 and over by literacy, sex, urban/rural residence, socio-economic region and province/city, 1/4/2015 ............................................................................................. 196
Table 10: Currently married women aged 15-49 by the used status of contraceptive method, urban/rural residence, socio-economic region and province/city, 1/4/2015 ............................................... 205
Table 11: Currently married women aged 15-49 by the used status of contraceptive method, age group, urban/rural residence and socio-economic region, 1/4/2015 ........................................... 214
Table 12: Currently married women aged 15-49 are using contraceptives by currently using contraceptives, urban/rural residence, socio-economic region and province/city, 1/4/2015 ................................................................................ 217
Table 13: Currently married women aged 15-49 are using contraceptives by currently using contraceptives, number of children surviving, urban/rural residence and socio-economic region, 1/4/2015 ............................................................................... 226
Table 14: Currently married women aged 15-49 are not using contraceptives by reasons for not using, urban/rural residence, socio-economic region and province/city, 1/4/2015 ............................................................................................. 229
Table 15: Currently married women aged 15-49 by induced abortion and menstrual regulation, urban/rural residence, socio-economic region and province/city, 1/4/2015 ............................ 238
Table 16: Number of women aged 15-49 have given the birth during 24 months prior to the survey by pregnancy check, urban/rural residence, socio-economic region and province/city, 1/4/2015 ................................................................... 244
Table 17: Number of children ever born, number of children surviving, number of children died of women aged 15-49 by urban/rural residence, socio-economic region and province/city, 1/4/2015 ............................................................................................. 250

ix
Table 18: Number of women aged 15-49 by number of children ever born, age of mother, urban/rural residence, socio-economic region and province/city, 1/4/2015 ............................................... 253
Table 19: Number of women aged 15-49 by number of children surviving, age of mother, urban/rural residence, socio-economic region and province/city, 1/4/2015 ........................ 271
Table 20: Number of women aged 15-49 having third and higher order births in 12 months prior to the survey by urban/rural residence, socio-economic region and province/city, 1/4/2015 ............................................................................................. 289
Table 21: Proportion of deaths in 12 months prior to the survey by causes of death, socio-economic region and province/city, 1/4/2015 ............................................................................................. 291
Table 22: Population by region that was place of usual residence on 1/4/2014 and 1/4/2015 and sex...................................................... 293
Table 23: Population by province/city that was place of usual residence on 1/4/2014 and 1/4/2015............................................. 294

x
LIST OF ABBREVIATIONS
Sign/Abbreviation Explanation/Fully written phrase/Name
2009 Census 2009 Population and Housing Census
2014 IPS 1/4/2014 Intercensal Population and Housing Survey
2015 PCS 1/4/2015 Population Change and Family Planning Survey
GSO General Statistics Office
PSO Provincial Statistics Office
EA Enumeration area
SMAM Singulate mean age at marriage
TFR Total fertility rate
ASFR Age specific fertility rate
CBR Crude birth rate
SRB Sex ratio at birth
CDR Crude death rate
ASDR Age specific death rate
IMR Infant mortality rate
U5MR Under 5 mortality rate
e0 Life expectancy at birth
IMR In-migration rate
OMR Out-migration rate
NMR Net migration rate
UNFPA United Nations Population Fund
WHO World Health Organization

1
PART I
DESIGN AND IMPLEMENTATION
OF THE SURVEY

2

3
I. SURVEY ORGANIZATION
The 1/4/2015 time point Population Change and Family Planning Survey (the 2015 PCS) was conducted in accordance with Decision Number 84/QD-TCTK issued on 10th February 2015 by the Director General of the General Statistics Office (GSO). This is the PCS be taken annually under the Programme for National Statistics Survey has been approved by the Prime Minister.
1.1. General information about the survey
1.1.1. Purpose of the survey
Firstly, the aim was to collect information for national representatives, six socio-economic regions and provinces, cities directly under the Central Government (provincial) including urban and rural areas of: (i). Population size, population change; (ii). The use of contraceptive methods, menstrual regulation and abortion.
Secondly, the objective was a basis for synthesis and compilation of national statistical indicators on population and family planning, service levels and branches to assess the situation, plan in the population and family planning field.
1.1.2. Survey respondents
Respondents are the actually usual residents of households (household), excluding those who live in dwellings managed by the army and security force, but including army and police households live in civil residences of communes/wards/towns.
1.1.3. The enumeration units
The enumeration units are households. A household includes either one person living alone or a group of person living in the same dwelling and sharing meals together, regardless of whether they are in blood relation, married, whether they have adoption relationship, or whether they share a common budget (incomes and/or expenses).
The head of household (or, if the head of household was absent, another member of the household with knowledge of all household members) was assigned to provide information about all usual resident members and decades of household. For information that the head of household did not know well, the interviewer was required to ask the household’s other usual residents directly. For questions about reproductive history, family planning and reproductive health, the respondents must interview directly members of households are women aged 15-49.

4
1.1.4. Survey coverage
The 2015 PCS was a sample survey conducted throughout Viet Nam. Sample size is allocated ensure statistical representativeness of data for provincial, including 7,640 localities, equivalent to 305,600 households.
1.1.5. Time point and reference period of survey
The time point of the survey was 0 hour on 1 April 2015. The time required for fieldwork was prolonged to about 20 days, starting from on 1 April 2015 (including travel time).
1.1.6. Survey contents
Content survey was designed on a questionnaire set of 2015 PCS, including household information (the question about the population), information on fertility, family planning and reproductive health of women aged from 15-49 and information on household deaths. All above information was pin together to a file, the outer cover include the identification information and some indicators used for the rapid synthesis. Contents of the survey include the following information:
Part 1: Information on household members:
- For all population: Full names of usual residents; relationship to the head of household; sex; the solar calendar month and year of birth or completed age; ethnicity; faith/religion.
- For persons aged 1 year and over: place of usual residence in the previous year.
- For persons aged 5 years and over: school attendance; educational level; technical and professional qualification attainment; highest grade of general education; total number of years of schooling relating only to all forms of occupational/professional training and tertiary education; masters and PhD; literacy status.
- For persons aged 15 years and over: marital status, month and year when the current marital status occurred.
Part 2: Information on reproductive health of women aged 15-49 years:
Number of children ever born, number of children surviving, number of children died and information on the last birth; Antenatal status and knowing sex of fetus; Contraceptive use, menstrual regulation and induced abortion; Complication occurring after menstrual regulation and induced abortion.

5
Part 3: Information on the household’s deaths
Collecting information on household deaths from the 1st of 2014 Lunar New Year “Giap Ngo” (31/01/2014 as solar calendar) to end of 31/3/2015; Total of deaths; Sex, time and age of the deceased; Cause of death, including the situation of maternal death.
1.1.7. Methods of collecting information
The 2015 PCS was conducted by the face to face interview method. Interviewers had to visit each household to ask household heads or information provider and record adequate answering information in the questionnaire (information on households and household deaths) and women aged 15-49 years (information about fertility, family planning and reproductive health).
In case some information that the house head are unsure, enumerators interviewed directly the actual resident members of the household. For those who are temporarily absent during the survey, enumerators may asked other members in the household, or based on material by relatives or authorities provided for recording questionnaire.
1.2. Preparation for the survey
Preparation for 2015 PCS included: compiling and distributing the survey budget; construction, drafting, printing/photocopying and distributing survey documents (decision, plan, questionnaire, manuals and other survey documents); design sampling and select enumeration areas (EAs); recruiting persons in charge of EA updated listing of households, recruiting interviewers, field-work team leaders and supervisors; checking EAs; update the listing and select the households survey; training for team leaders and enumerators; making and sending the reviewed enumeration areas report; forming and sending the results of updated listing and selected the households surveyed; conducting and supervising survey in the fields.
1.3. Revising enumeration areas, updating the listing and selecting enumerated household
The EA is a residential area delimited in the 2009 Population and Housing Census (2009 Census) then be reviewed and updated in the 2014 IPS and used for the 2015 PCS.
The list of households is used as the sampling frame for selecting households surveyed which is an important tool to help interviewer access household quickly and conveniently and support team leaders to supervise the work of enumerators. The listing is defined as the first step of the survey.

6
The reviewing and updating the household lists was important to avoid missed households, household members, births, deaths, and especially of the migrants of the area. This work was done in late February and early March 2015. Department of Population and Labour Statistics (DPLS) has the detailed instructions on EA review, update lists and choose the households surveyed for the Provincial Statistics Offices (PSO). PSOs assigned the District Statistics Offices (DSO) collaborate with cadres of the hamlet/village/urban hamlet to review, update fully the selected household listing to serve households enumerated steps.
1.4. Recruiting and training enumeration force
1.4.1. Recruiting interviewers and team leaders
Interviewers (enumerators) are the workforce directly implementing the survey, and they play an important role in determining the quality of collected information as well as the success of the survey. Interviewers should be persons who are responsible, and have completed upper secondary education or higher (however, it was possible to recruit persons who had completed lower secondary in some remote areas) and training workshop on survey interviewing. Interviewers who had participated in other recent surveys were mobilized and/or encouraged to participate, and an emphasis was placed on recruiting female interviewers, individuals who are in charge of managing civil and residential registration, population records or other population and family planning tasks were not recruited as interviewers for this survey. PSOs assigned DSOs to recruit enumerators, perform to record into the questionnaires in the EA, check the quality and complete the questionnaires, making quick report and submit the questionnaires as scheduled.
In specific cases, it may be recruited enumerators from elsewhere. PSOs hire local people (the guide) to help enumerators to visit the respondent households. For EAs in mountainous, remote or isolated areas that ethnic people are residing and generally unable to communicate in the national language (Vietnamese), so guides cum interpreters were hired to assist interviews.
Team leaders are responsible for managing directly the daily survey activities of interviewers, determining the adequacy and accuracy of collected information. Therefore, team leaders must be chosen from those who have experience with statistical surveys and high sense of responsibility.
1.4.2. Training in professional knowledge of the survey
The GSO did not organize to train the professional knowledge of the 2015 PCS for Leaders of PSOs and provincial trainers.
PSOs directly train the professional knowledge for team leaders and enumerators (including some spare team leaders and enumerators). Each training

7
organized during 02 days in the second half of March 2015; including time to go to the field for practice, checking and classifying students. The Head of PSOs has the responsibility to organize the conference on training in the professional knowledge based the rule and content of this survey for all enumerators, team leaders and supervisors.
1.5. Field-work and supervision of data collection
The fieldwork was conducted for about 20 days (including time of movement), starting on 1 April 2015. In the first days, team leaders helped enumerators correct errors, especially in system errors in interviewing and recording the questionnaire. PSOs guide DSOs to conduct the survey in the field and to ensure collected information at selected households with quality and in time required.
Enumerators interviewed under the supervision and direct instructions of the team leaders. Team leaders were responsible for checking and correcting mistakes made by interviewers. This was done by team leaders observing interviews, including the interview procedure and recording of responses to the questionnaire (for at least one household per day per interviewer). Team leaders could re-interview some households to check the accuracy of information collected. Moreover, team leaders could require checking 100% of questionnaires completed by interviewers working under his/her management before delivering the filled in questionnaires to the DSOs. This could be done to ensure that all steps required for filling in the questionnaires were followed, there was no presence of logical errors, and identification information was recorded sufficiently and exactly,... as required in the survey instruction handbook.
After checking and editing, filled questionnaires were mailed to the Provincial Statistic Offices, where all questionnaires were reviewed, rechecked, handed over, packaged, and then sent to the regional Statistical Informatics Centers for data processing and tabulation, as directed in the survey plan.
Inspection and supervision activities focused on the process of reviewing the EA, update lists, training in professional knowledge, collecting information in the household and checking questionnaire. The inspection and supervision are defined in detail in the “Manual for instruction of professional knowledge”. Statistical agencies at all levels strengthened inspection and supervision to ensure the quality of the survey data. Supervisors were staffs of statistical office at the central, provincial and district levels. Supervisor must check monitoring and acceptance process of team leaders; checking interviewing process of enumerators, supporting team leaders and enumerators completed tasks.

8
1.6. Data processing and tabulation
Data processing of the 2015 PCS was done by data entry. All the questionnaires were carried out at three Statistical Informatics Centers of GSO (the Ha Noi Statistics Informatics Center zone I acted as the key center; the other two were the Ho Chi Minh City Statistics Informatics Center zone II and the Da Nang Statistics Informatics Center zone III).
Each center independently conducted data processing for questionnaires from selected provinces/cities as assigned by GSO via a linked data processing network (the Da Nang and Ho Chi Minh City centers have access to the Ha Noi Statistics Information Center’s main server).
The DPLS compiled contents and designed the tabulation outputs and provisions aggregating data. Statistic Informatics Center I wrote the program and the receiving results from Statistical Informatics Center II and III to summarize the survey results according to the tabulation output system by the DPLS’ design.
The Ha Noi Statistics Informatics Center zone I in collaboration with the DPLS checked and cleaned the micro data of all of the questionnaires, establishing the databases for 2015 PCS.
II. SAMPLE DESIGN AND ESTIMATION
2.1. Sample frame
The sample of 2015 PCS is the 2 stage stratified sample in order to ensure the presentative of aggregated statistics for the whole country, 6 social economic regions, 63 provinces/cities. Each province/city would constitute a main stratum with two sub-stratums namely urban and rural ones. The sampling frame is based on the 2014 Intercensal Population and Housing Survey’s (2014 IPS) selected enumeration areas.
2.2. Determination of sample size and sample allocation
The 2015 PCS is the sample survey. Sample size is allocated ensure statistical representativeness of data for provincial, including 7,640 EAs, or 305,600 households. The sample is the 2 stage stratified sample and its design is as follows:
Stage 1 (selecting EAs): Each province/city will constitute a main stratum divided into 2 sub stratums (of which, one will be representative for urban areas and the other is for rural areas). At this stage, list of provincial enumeration areas (the master sample frame - taken from the 2014 IPS’s 20% sample) will be divided into 2 independent sub-sample frames (urban and rural), and EAs will be selected

9
by the method of Probability Proportional to Size - PPS. This stage was done by GSO (DPLS). The list of EAs were made by DPLS and were sent to PSOs.
Stage 2 (selecting households): At each selected EA (that is determined in stage 1), after updating and reviewing the EA; making the list of households, 40 households were selected systematically from updated list of households by the software that GSO was provided to PSOs at the 2014 IPS.
2.3. Estimating the sample generalizing weights
2.3.1. Determining design weight (basic weight)
a. Design weight of EAs for the 2014 IPS at the district level
MnM = W
d di
d1di
Of which: 1
diW : Design weight of EAs for the 2014 IPS at the district level;
nd : Number of sample EAs that were allocated for district d in the 2014 IPS;
Md : Number of households of the selected district, according to the 2009 Census;
Mdi : Number of households of EA i, according to the 2009 Census;
b. Design weight of EAs for the 2015 PCS
di
di
pitt/ntp
tt/ntp
1ditt/nt1
pdi m
M
Mn
MW = W
Of which:
1tt/ntpdiW : Design weight of EAs for the 2015 PCS (classified by urban or rural
stratum); 1
diW : Design weight of EAs for the 2014 IPS at the district level;
ntttpn /
: Number of sample EAs of province p, according to the 2015 PCS
(classified by urban or rural stratum); nttt
pM /
: Number of households (of the urban or rural stratum) of province p
according to the 2014 IPS;
piM : Number of households of EA i, according to the 2014 IPS;

10
diM : Number of households of EA i as a result from the 2015 PCS listing;
dim : Number of selected households in EAs i according the result of
household listing of the 2015 PCS (mdi = 40 households/EA).
2.3.2. Adjusting the design weight according to number of non-response households
'di
ditt/nt1pdi
tt/nt2pdi
mm= WW
2tt/ntpdiW : Adjustment weight of EAs at the provincial level (classified by
urban/rural stratum); 1tt/nt
pdiW : Design weight of EAs at the provincial level;
mdi : Number of selected households in EAs i according the result of
household listing of the 2015 PCS (mdi = 40 households/EA); 'dim : Number of actually responed households of EAs i from the 2015 PCS.
2.3.3. Adjusting the general weight according to the population structure taken
from the survey Adjustment weight for provincial sample
'tt/ntp
tt/ntptt/nt2
pditt/nt3pdi
M
M= WW
Of which: 3tt/nt
pdiW : Adjustment weight of EAs of each province (classified by the
urban/rural stratum); 2tt/nt
pdiW : Design weight of EAs of each province (classified by the
urban/rural stratum); nttt
pM / : Urban/rural population of province p according to the population
estimated to April 1, 2015; nttt
pM /' : Urban/rural population of province p to April 1, 2015 according to
the design weight to ( 2tt/ntpdiW ).
DPLS have cooperated closely with the Statistic Informatics Center of Zone 1 to programme, calculate in details and check the accuracy of weights above for all EAs of the survey.

11
III. SOME CONCEPTS AND DEFINITIONS
3.1. Enumeration unit
The enumeration unit of the 2015 PCS is residential household (household). A household includes either one person living alone or a group of people living in the same house and sharing meals, regardless of whether they are related in blood, married, whether they have adoption relationship, or whether they share a common budget (incomes and/or expenses). For the survey, household includes households of persons serving in the army and security forces but residing in the residential areas of selected communes, wards or towns.
3.2. Actual usual residents
Total population is the estimated population generalized from the number of respondents, defined as the actual usual residents of households at the time point of 0:00 hour 1st April 2015. Actual usual residents of households include the following individuals (regardless of whether he/she was registered as a permanent resident or not):
a) Persons who have lived permanently in the household for 6 months or longer at the time point of the survey enumeration;
b) Persons who have recently moved to live in the household within less than 6 months preceding the survey time point, and it is determined that she/he will live permanently in the household, including newborn babies;
c) Persons who live permanently in the household but are currently absent, comprising Vietnamese persons who have been permitted by authorities to go overseas for an assigned duration of time.
3.3. Population size, growth and structure
Average annual growth rate of the population is defined as the percentage increase/decrease on average for a particular population in the observed year as compared to the previous year.
Average annual growth rate of the population in the observed period is defined as the yearly average percentage change (increase or decrease) of a particular population in the observed period.
Sex ratio is defined as the number of males per 100 females in the population.
Sex ratio at birth is defined as the number of male births to 100 female births among total births in the defined period (usually 12 months prior to the time point of the survey).

12
Aging index is defined as the number of persons aged 60 and above per 100 persons aged 15 and below.
Proportion of the population aged 0-14 is defined as the percentage of the population aged 0-14 to total population.
Proportion of population aged 65 and above is defined as the percentage of the population aged 65 and above to total population.
Total dependency ratio is defined as the number of persons aged 15 and below (0-14) and 65 and above per 100 persons aged 15-64.
Young dependency ratio is defined as number of persons aged 15 and below (0-14) per 100 persons aged 15-64.
Old dependency ratio is defined as the number of persons aged 65 and above per 100 persons aged 15-64.
Proportion of the urban population is defined as the percentage of the urban population in the total population. Urban area includes urban districts and wards within cities and towns. All other base administration units (communes) are considered rural areas.
Average annual growth rate of the urban population is defined as the percentage change (increase or decrease) of the urban population observed in a year compared to that of the previous year.
Average annual growth rate of the urban population in the observed period is defined as the yearly average percentage of change (increase or decrease) of the urban population in the observed period.
Population density is defined as the number of persons per square kilometer of land.
3.4. Marriage
Marital status of a person at the time point of the survey can be only one of the following categories:
1. Single (never married) describes a person who has never married or lived with a person of the opposite sex as a married couple or in a union.
2. Currently married describes a person who is recognized by the marriage laws or customs of the locality as married or self-identified as living with a person of the opposite sex as a married couple or in a union.
3. Widow/Widower is a person whose husband or wife has died but the person has not remarried yet.

13
4. Divorced is a person who has married at some time in the past but divorced by law and not remarried yet, for any reason.
5. Separated is a person who has married but is not currently living with her/his partner as husband and wife at present, for any reason.
Singulate mean age at marriage (SMAM) is the average number of years that a person of a given cohort would stay single before getting married for the first time, with the assumption that this cohort’s proportion of single by age is the same as the one collected at the intercensal time point.
3.5. Educational level
Literacy refers to the ability to read, write and understand fully a simple statement in daily life in national, ethnic or foreign languages.
Literacy rate of population aged 15 and above is defined as the percentage of persons aged 15 and above who are able to read and write in the total population aged 15 and above.
Rate of population aged 15 and above who have never attended school is defined as the percentage of persons aged 15 and above who have never attended any school/class in the National Educational System in the total population aged 15 and above.
A person is considered as having “Never attended school” if he/she has never attended any school/class in the National Educational System.
Rate of population aged 15 and above who have graduated/completed any educational level in the National Educational System is defined as the percentage of persons aged 15 and above who have ever attended schools and graduated from this educational level, including those who have ever attended any higher educational level but not completed/graduated from this level, in the total population aged 15 and above.
A person is classified as having “Not completed primary education” if he/she has ever attended primary school but not graduated, including those who have ever attended the last grade of primary level but not graduated.
A person is classified as having “Completed/graduated from primary education” if he/she has ever attended and graduated from primary education, including those who have ever attended lower secondary education but not graduated from this level.
A person is classified as having “Completed/graduated from lower secondary education” if she/he has ever attended and graduated from lower

14
secondary school, including those who have ever attended higher secondary school but not graduated.
A person classified as having “Completed/graduated higher secondary education and higher” if she/he has ever attended and graduated from higher secondary education or attended but not graduated from a higher educational level such as tertiary, master, PhD.
Net school attendance rate at any educational level is defined as the percentage of pupils/students at the right ages of enrolling in this educational level in the National Educational System and attending this level in the total population group(s) of the same ages.
Gross school attendance rate at any educational level is defined as the percentage of pupils/students attending any educational level in the National Educational System in the total population at the right ages of enrolling in this educational level.
3.6. Technical and professional levels
A person is classified as having a technical level of “Short-term training” if the highest technical and qualification level that he/she has participated in and received certificate for was short-term training or vocational training for at least 3 months.
A person is classified as having a technical level of “Mid-term training” if the highest technical and qualification level that he/she has participated in and granted a certificate for was mid-term training (including mid-term professional/vocational training).
A person is classified as having a technical and qualification level of “College” if the highest technical and qualification level that he/she has participated in and granted a degree for was college, including professional/vocational colleges.
A person is classified as having a technical and qualification level of “University and higher” if the highest technical and qualification level that he/she has participated in and was granted a degree for was bachelor, master or PhD.
3.7. Family planning
Information on the implementation of family planning were interviewed and recorded for women aged 15-49 are currently married.
Any contraceptive methods include: IUD, pills, injections, implants, diaphragms, foam/jelly, condoms, male sterilization, female sterilization, periodic abstinence, withdrawal, and others.

15
The contraceptive prevalence rate of any method is defined as the number of currently married women aged 15-49 years using any contraceptive method to total currently married women aged 15-49 years.
Modern contraceptive methods include: IUD, pills, injections, implants, diaphragms, foam/jelly, condoms, male sterilization, female sterilization.
The contraceptive prevalence rate of modern method is defined as the number of currently married women aged 15-49 years using a modern contraceptive method to total currently married women aged 15-49 years.
3.8. Fertility
Crude birth rate is defined as number of live births per 1000 people in the reference period (usually 12 months prior to the time point of the survey).
Total fertility rate is defined as the average number of live births that would be born to a woman by the time she ended childbearing if she were to pass through all her childbearing years conforming to the age-specific fertility rates of the reference period (usually 12 months prior to the time point of the survey).
Age-specific fertility rate is defined as the average number of live births per 1000 women of a particular age (or age group) in the reference period (usually 12 months prior to the time point of the survey).
Replacement rate is defined as the fertility level that a women cohort would have in order to result in just enough female births to “replace” themselves in the population.
3.9. Mortality
Crude death rate is defined as the number of deaths per 1000 people in the reference period (usually 12 months prior to the time point of the survey).
Infant mortality rate is defined as number of infants who die per 1000 live births in the reference period (usually 12 months prior to the time point of the survey).
Under-5 mortality rate is defined as the number of deaths of children under age 5 per 1000 live births in the reference period (usually 12 months prior to the time point of the survey).
Age-specific death rate is defined as the total number of deaths occurring within the reference period (usually 12 months prior to the time point of survey) at a specific age (or in a specific age group) to population at same age or age group, multiplied by 1000.

16
Maternal mortality ratio is defined as the number of deaths of women from causes relating to pregnancy and delivery per 100,000 live births in the reference period (usually 12 months prior to the time point of the survey).
Life expectancy at birth is defined as the average number of years a newborn baby could expect to live if current mortality trends were to continue for the rest of his/her life.
3.10. Migration
In-migration rate is defined as the number of migrants from other territorial units arriving in a specified territorial unit during an observed period per 1000 persons living in that destination (unit).
Out-migration rate is defined as the number of migrants departing from a territorial unit and arriving in other territorial units during an observed period per 1000 persons living in the destination (unit).
Net migration rate is defined as the difference between the in-migration rate and the out-migration rate. This figure has a positive value if the number of in-migrants is greater than the number of out-migrants, and vice versa.
IV. SUMMARY OF KEY INDICATORS
Estimated households in the entire country were 24,627,078 households on 1 April 2015. The number of households with 1 to 4 persons are common in Viet Nam (accounting for 73.7% of all households).
The total estimated population of Viet Nam was 91,465,735 persons, the urban population accounted for 33.72%, the rural population accounted for 66.28%, male population accounted for 49.22% and female population accounted for 50.78% of the total population on 1 April 2015. The population density of Viet Nam was 276 persons/km2, and this is the third highest in Southeast Asia, Viet Nam ranks 14th out of 49 nations and territories in Asia.
The proportion of the population in working ages (15-64) accounted for 68.4%. The dependent proportion of the population (aged under 15 and 65 and above) constituted about 31.6% of the total population. The total dependency ratio stood at 46.1% and aging index was 47.1%.
The proportion of ever-married people aged 15 and above was 77.1% of the entire country, of which the proportion of currently - married accounted for 68.1% of the population aged 15 years and older. The singulate mean age at marriage (SMAM) of both sexes was 24.9 years, 26.9 years for males and 22.8 years for females.

17
There were 22.3% of the population aged 5 and older were attending school. Only 4.1% of the population aged 5 and older have never attended school. The literacy rate of the population aged 15 and above was 94.9%, the literacy rate in urban areas is higher than in rural areas.
People who have graduated lower secondary schools or above in the whole country constitutes 50% of total population aged 5 and above, of which the proportion with university and higher is 7.4% of the total population aged 5 and older. Approximately 84.4% of total population aged 15 and above did not have any technical and professional qualifications.
The any contraceptive prevalence rate reached 75.7%. The modern contraceptive prevalence rate reached 65.0%. The rate of using any contraceptive methods increased from the 15-19 age group and reaches the top at the 35-39 age group.
Among women not using contraceptives, the reason to “want more children” accounted for 42.4%, the reason of “being pregnant” accounted for 14.1%.
There is an inconsiderable difference in the rate of currently married women aged 15-49 who have had abortion or menstrual regulation within 12 months preceding the survey time-point between urban and rural areas (0.42% and 0.41%, respectively).
The rate of obstetrical check-up at least one time for the last birth of the women aged 15-49 was 95.3%. This rate in rural area was 3 percent points lower than that of urban area (94.4% against 97.4%).
According to the 2015 PCS, Total Fertility Rate (TFR) reached 2.10 children per woman. The urban TFR was 1.82 children per woman, lower than figure of the rural areas (2.25 children per woman). Crude Birth Rate (CBR) was 16.2 live births per 1000 people in which, that of urban areas was 15.3 live births/1000 people, lower as compared to that of rural areas (16.7 live births/1000 people).
In the 2015 survey, the Sex Ratio at Birth (SRB) maintained at the quite high level of 112.8 boys/100 girls. Since 2009 to now, even though many warnings on the implications of sex imbalance at birth were given, but this situation has unlikely been improved.
The rate of women giving the third birth or more in the country was 15.8% in 2015. The majority of mothers know the sex of foetus before delivery when their foetus is 15 to 28 weeks old (74.3%). Number of mothers knowing about the sex of foetus before delivery when the foetus is 28 weeks old or more, constituted to the smallest share (1.8%). This suggested that during the period of pregnancy, most women want to know the sex of foetus early. Desire of women to delivery of son is

18
higher than that of girls. Most women know that sex ratio at birth by fetal ultrasound methods, diagnostic tools and modern efficiency.
The Crude Death Rate (CDR) for the entire country in 2015 was 6.81 deaths per 1000 people, of which that of urban areas was 5.83 deaths/1000 people and that of rural areas was 7.31 deaths/1000 people.
The Infant Mortality Rate (IMR) was 14.73 infant deaths/1000 live births. Since 2005 to now, the IMR of Viet Nam has dropped to the lowest value and has achieved to the Millennium Development Goal for the year 2015 (14.8 infant deaths/1000 live births).
There is a considerable decline on the under 5 mortality of whole country (from 56.9‰ in 1999 to 22.4‰ in 2014 and 22.12‰ in 2015). The life expectancy at birth for the population was 73.3 years, while that of males was 70.7 years, lower than that of females of 76.1 years.
Most deaths occurring within the last 12 months prior the time point of survey were due to diseases (83.8%). The proportion of deaths due to any kind of accidents constituted about 7.0%, while that due to “other causes” accounted for 7.9%. Among deaths due to accidents, the proportion of deaths due to traffic accidents accounted for the largest share, 4 times higher than that due to labor accidents (respectively 4.1% and 1.0%).
The number of inter-regional migrants fell by 223,756 people in 2015 compared to 2014. Apart from job opportunities, the geographical movement distance is also regarded as another factor impacting significantly on migration. Most of the migrants made movements to where is nearby their place of previous usual residence. Migration rate of the 20-24 age group was highest, followed by 15-19 and 25-29 age group.

19
PART II
MAJOR FINDINGS

20

21
CHAPTER 1: POPULATION SIZE AND STRUCTURE
1.1. Household size and population size
1.1.1. Household size
According to the results of the 2015 PCS, Viet Nam had 24,627,078 households, an increase of 362,088 households compared to the 2014 IPS.
Table 1.1 shows that household size from one to four persons (small and common family size in Viet Nam) increased from 72.8% in 2014 to 73.7% in 2015 (0.9 percentage points increase). The proportion of small-size households (one to four persons) in the Red River Delta was unchanged in 2015 compared to 2014 (77.0%), whereas the remaining reasons saw the difference. The largest change was seen in North and South Central Coast with 1.8 percentage point higher from 70.6% in 2014 to 72.4% in 2015, followed by Central Highlands with 1.2 percentage point increasing (from 66.9% in 2014 to 68.1% in 2015), and the proportion in this reason was lowest compared to other reasons. This proportion has risen by 1.1 percentage points in Mekong River Delta, 0.8 percentage points in Southeast and 0.5 percentage points in Northern Midlands and Mountains.
The growth in the proportion of small household size in all six socio-economic regions was more concentrated in rural areas, especially in North and South Central Coast (2.1 percentage point increase), Southeast (1.4 percentage point increase); Central Highlands (1.3 percentage point increase); Mekong River Delta (1.0 percentage point increase); Northern Midlands and Mountains (0.7 percentage point increase) and Red River Delta (0.4 percentage point). This shows that people are gradually realizing that transformation from a traditional family model (with large people, multiple generations in one house) into a modern model family (with less people) to adapt with current social model (changing conception of life, equality for women, improving quality of life...).
The increase in the proportion of small household size lead to proportion of households with larger number of people fall in all regions as well as in urban and rural areas. The proportion of household with five to six people has fallen from 22.7% in 2014 to 21.9% in 2015. The proportion of household with seven persons or more has decreased from 4.5% in 2014 to 4.4% in 2015. Besides, the increase in small household size as the result of average persons per household has slightly decrease such as North and South Central Coast, Southeast, Mekong River Delta and more concentrated in rural areas. In the whole country, the average household size was unchanged (3.7 persons/household).

22
Data in Table 1.1 also indicates that for the entire country and the six socio-economic regions, the number of one-person households (single households) and the number of households with seven persons or more accounted for a very small share of the total. Whereas the proportion of households with seven persons and over had tended to decline (from 4.5% in 2014 to 4.4% in 2015), the proportion of households with one person has increased (from 8.1% in 2014 to 8.4% in 2015). The increase in the proportion of households with one person was highest in the North and South Central Coast (0.6 percentage points compared to 2014), followed by the Central Highlands (0.5 percentage points compared to 2014). The number of single households in rural areas increased (8.0% in 2015 compared to 7.6% in 2014). It may be due to young people are often separated when marriage or working away from home, and the rest are mostly over working age people in rural areas.
Table 1.1: Proportion of households by household size and average household size by urban/rural residence and socio-economic region, 1/4/2015
Distribution of household by household size (%)
Residence/Socio-economic region 1 person
2-4 persons
1-4 persons
5-6 persons
7 + persons
Average household
size (persons)
Entire country 8.4 65.2 73.7 21.9 4.4 3.7 Northern Midlands and Mountains 6.1 63.4 69.5 24.5 6.0 3.9 Red River Delta 10.3 66.7 77.0 20.3 2.7 3.5 North and South Central Coast 8.9 63.5 72.4 23.3 4.4 3.7 Central Highlands 5.9 62.3 68.1 25.6 6.3 4.0 Southeast 8.8 67.1 75.9 18.9 5.2 3.6 Mekong River Delta 7.5 65.7 73.3 22.3 4.4 3.7 Urban 9.2 67.0 76.2 19.3 4.5 3.6 Northern Midlands and Mountains 10.1 69.9 80.0 17.7 2.4 3.4 Red River Delta 9.5 67.8 77.3 19.8 2.9 3.5 North and South Central Coast 8.6 65.5 74.1 21.5 4.4 3.7 Central Highlands 7.7 68.2 75.8 20.3 3.8 3.7 Southeast 9.5 67.3 76.7 17.5 5.8 3.6 Mekong River Delta 9.1 64.7 73.9 20.6 5.5 3.7 Rural 8.0 64.3 72.4 23.2 4.4 3.7 Northern Midlands and Mountains 5.0 61.7 66.7 26.3 7.0 4.0 Red River Delta 10.8 66.1 76.8 20.5 2.6 3.4 North and South Central Coast 9.0 62.7 71.7 24.0 4.3 3.7 Central Highlands 5.0 59.5 64.6 28.1 7.4 4.1 Southeast 7.6 66.8 74.4 21.3 4.3 3.7 Mekong River Delta 7.0 66.1 73.1 22.9 4.0 3.7

23
1.1.2. Population size
The total estimated population is the number of usual residents in households at the survey time on 1st April 2015. Table 1.2 shows the population size and average annual growth rate in 1979-2015. The data indicates that the annual growth rate of the population of Viet Nam has declined over time.
Viet Nam is currently the third most populous country in Southeast Asia (after Indonesia and Philippines), the eighth most populous country in Asia, and fourteenth most populous country in the world. The total population of Viet Nam at 0 hour on 1st April 2015 was estimated to be 91,465,735 persons, an increase of about 972,383 persons compared to 1st April 2014. The growth rate of population at 1st April 2015 compared to 1st April 2014 was 1.07%.
Table 1.2: Population size and growth rate, 1979 - 2015
Year of Census or Survey Population
(thousand persons)
Average annual growth rate of
population (%)
1979 52 742 -
1989 64 376 2.10
1999 76 323 1.70
2009 85 847 1.18
2014 90 493 1.06
2015 91 466 1.07
Source: 1979 - 2014: General Statistics Office, "The 1/4/2014 Viet Nam Intercensal Population and Housing Survey: Major findings", Ha Noi, September 2015, Table 1.3, Page 29.
Table 1.3 reveals population size by sex, urban rural areas on 1st April 2014 and 1st April 2015. The total population in whole country was estimated to be 91,465,735 persons at the survey time point on 1st April 2015, the urban population was estimated at 30,840,820 persons, and accounting for 33.72% of the total population, the rural population was 60,624,915 persons, accounting for 66.28%. The male population reached 45,022,831 persons and female population reached 46,442,904 persons, equivalent to 49.22% and 50.78% of total population. Compared to the 1st April 2014 results, the urban population increased by about 0.64 percentage points (0.64 percentage points falling in rural areas) while the proportion of population by sex was little change with 0.09 percentage points decrease and the female population increased with corresponding rate.

24
Table 1.3: Population size by sex, urban/rural residence,
1/4/2014 and 1/4/2015 Unit: Person
Time point of 1/4/2014 Time point of 1/4/2015
Population Percentage Population Percentage
Entire country 90 493 352 100.00 91 465 735 100.00
Male 44 618 668 49.31 45 022 831 49.22
Female 45 874 684 50.69 46 442 904 50.78
Urban 29 939 316 33.08 30 840 820 33.72
Rural 60 554 037 66.92 60 624 915 66.28 Source: 2014: General Statistics Office, "The 1/4/2014 Viet Nam Intercensal Population and Housing Survey:
Major findings", Ha Noi, September 2015, Table 1.4, Page 29.
1.1.3. Population and population growth
Geographic population distribution is an important aspect of development. Regions have concentrated population and high population growth means they are developing with many industrial zones and better living condition. Data in Table 1.4 shows that Southeast had highest population growth rate during last year (2.02%) from 15,721,352 persons in 2014 to 16,042,723 persons in 2015, following by Central Highlands with the second population growth rate (1.49%). This may be due to Southeast is the high rates of in-migration in the entire country and attracting people from other regions.
This reflects somewhat the effects of regional conditions for economic development and geographic characteristics. The most heavily populated region was the Red River Delta (20,870,149 persons), while Central Highlands was the least populated region (5,587,237 persons). About 42.0% of the nation’s population live in the two regions of the Red River Delta and Mekong River Delta, the deltas of two large rivers with fertile land conditions amenable to agricultural production. In contrast, the Northern Midlands and Mountains and Central Highlands, regions of high mountains and hills with difficult transportation conditions and large concentrations of ethnic minority people, were found to hold under a fifth (around 19%) of the nation’s population.
The average annual population growth rate was the lowest in the Mekong River Delta (0.4%), following by North and South Central Coast (0.72%). These regions have large population in the whole country only after the Red River Delta. This may be due to number of out-migrant from these region was larger compared to other regions.

25
Table 1.4: Population and population growth rate by socio-economic region,
1/4/2014 and 1/4/2015
Population (persons) Socio-economic region
1/4/2014 1/4/2015
Population growth rate 1/4/2014 - 1/4/2015
(%)
Entire country 90 493 352 91 465 735 1.07
Northern Midlands and Mountains 11 633 548 11 769 502 1.16
Red River Delta 20 649 605 20 870 149 1.06
North and South Central Coast 19 482 435 19 623 969 0.72
Central Highlands 5 504 560 5 587 237 1.49
Southeast 15 721 352 16 042 723 2.02
Mekong River Delta 17 501 852 17 572 156 0.40
Source: 2014: General Statistics Office, "The 1/4/2014 Viet Nam Intercensal Population and Housing Survey: Major findings", Ha Noi, September 2015, Table 1.5, Page 30.
1.1.4. Urban and rural population
Table 1.5 shows that by the time point of 1st April 2015, 33.7% of Viet Nam’s population lived in urban areas, 0.6 percentage points increasing compared to 2014. The average annual population growth rate in urban areas was 2.97% per year, while it was 0.12% per year in rural areas.
During 2014-2015, Northern Midlands and Mountains had the highest urban population growth rate (7.01%), following by North and South Central Coast (4.58%) and Southeast (3.29%). This may be explained by the fact that the high urbanization trend is happening in these regions, number of rural areas was falling due to they were merged and transformed into urban areas. Over the years, Southeast has still accounted highest urban population share (63.0%), following by Red River Delta (33.9%). This is because Southeast consists urban centers and large industrial zones such as Ho Chi Minh city, Dong Nai, Ba Ria - Vung Tau, Binh Duong, whereas Red River Delta includes big urban centers and industrial zones such as Ha Noi capital, Quang Ninh, Hai Phong, Bac Ninh, Hai Duong, Ninh Binh,… The rural population growth rate in the period of 2014-2015 for some regions was negative due to an increase in the urban population. This could be due to a change in classification of some communes to wards or towns, or an increase in rural to urban migration flow in recent years.

26
Table 1.5: Urban population share and annual population growth rate by socio-economic region, 1/4/2014 - 1/4/2015
Unit: Percentage
Urban population share Annual population
growth rate in 1/4/2014 - 1/4/2015 Socio-economic
1/4/2014 1/4/2015 Urban Rural
Entire country 33.1 33.7 2.97 0.12
Northern Midlands and Mountains 17.0 18.1 7.01 -0.08
Red River Delta 33.8 33.9 1.35 0.91
North and South Central Coast 27.1 28.2 4.58 -0.75
Central Highlands 29.1 29.0 1.23 1.60
Southeast 62.3 63.0 3.29 -0.10
Mekong River Delta 24.7 25.0 1.56 0.02
Source: 2014: General Statistics Office, "The 1/4/2014 Viet Nam Intercensal Population and Housing Survey: Major findings", Ha Noi, September 2015, Table 1.6, Page 31.
1.1.5. Population density
According to the standard population density of the United Nations (35-40 persons per km2), Viet Nam is one of the most densely populated countries in the region and in the world. The 2015 PCS results indicate that Viet Nam’s population density was 276 persons per km2. This is the third highest in Southeast Asia, after only Singapore (6.801 persons per km2) and the Philippines (339 persons per km2), and means Viet Nam ranks 14th out of 49 nations and territories in Asia. Viet Nam’s population density increased by about 3 persons per km2 compared to 1st April 2014.
Table 1.6 shows more clearly the concentration of population by region. Same as 2014, the Red River Delta, with the largest proportion of the population (22.8%) in the country, contains only 6.4% of the nation’s land area, resulting in a population density that was the highest in the country at 991 persons per km2. Compared to 2014, the population density of this region increased by about 10 persons per km2. The Southeast region had the next highest population density at 680 persons per km2 and increasing by 14 persons per km2. Both these two regions saw the increased in population density. It may be due to high in-migration pull because these two regions concentrated many industrial zones should attract the workforce come from other regions. These two regions are also considered changes to the largest population density in the country.
The Central Highlands and the Northern Midlands and Mountains regions had the lowest population density in the nation. These regions together contained

27
19% of the population, yet they cover almost one half of the nation’s land area (over 45%). Both these two regions were mountain areas, difficulty in transportation, less development in economy so those two regions were least change in population density as compared to 2014 (only 1 persons per km2 and 2 persons per km2 increasing).
Table 1.6: Population density by socio-economic region, 2015
Socio-economic region Land area (%)*
Population (%)
Population density
(person/km2)
Differential in 2014 - 2015
(persons)
Entire country 100.0 100.0 276 3
Northern Midlands and Mountains 28.8 12.9 124 2
Red River Delta 6.4 22.8 991 10
North and South Central Coast 29.0 21.5 205 2
Central Highlands 16.5 6.1 102 1
Southeast 7.1 17.5 680 14
Mekong River Delta 12.3 19.2 433 1
Source: (*) Data for area (km2) is extracted from the 2016 Statistical Yearbook of General Statistics Office of Viet Nam.
Annex 3 presents population density by province for 2009 and 2015. Even within a region, population density varied substantially across provinces. In general, provinces with high population densities inevitably contained urban areas, main-point economic zones with industrial zones and convenient in transportation (Ha Noi, Ho Chi Minh City, Bac Ninh, Hai Phong, Binh Duong, Dong Nai,…). Areas with scattered population density are places with difficult geographic characteristics, including remote areas, and where many ethnic minority people live (such as Lai Chau, Dien Bien, Cao Bang, Bac Kan, Kon Tum, Dak Nong,…).
1.2. Population structure
Data on the sex and age structure of a population have played an important role in analysis of population reproduction in general, and in analysis of fertility, mortality, marriage and migration, in particular. Furthermore, this data is also the basis for analyzing the relationship between population and other socio-economic issues, such as management and utility of labour and natural resources, social welfare, and socio-economic development planning. The shift from high fertility and mortality to low and stable fertility and mortality levels over a relatively long period will lead to significant changes in a population’s age and sex structure.

28
1.2.1. Population structure by sex
The sex ratio is an important indicator for research on a population’s sex structure. In addition to demographic factors (men usually have higher mortality rates than women), in the past years, the sex ratio of the Viet Nam’s population was influenced by many objective factors such as war, social development policy and plans, labour export policies (e.g., the industrial sector may attract different proportions of male or female labourers), customs, traditional norms and other cultural factors such as son preferences (e.g., through the use of modern medical technology for prenatal sex selection). However, with the development of society, thinking about son preference, sex selection at birth is no longer a serious problem. The sex ratio of Viet Nam in 2015 was 96.9 males/100 females.
Figure 1.1: Sex ratio of Viet Nam’s population, 1960-2015
Figure 1.2 presents the comparison of sex ratio by socio-economic region. Mostly regions had decline in sex ratio, except for Central Highlands which was lightly increasing from 100.5 males/100 females in 2014 to 100.6 males/100 females in 2015. The lowest sex ratio was in Southeast (94.5 males/100 females with 0.5 percentage points decrease compared to 2014).
Males per 100 females
Year
95.9
94.7 94.2
94.7
96.4
97.6 97.3 96.9

29
Figure 1.2: Sex ratio by urban/rural residence and socio-economic region, 1/4/2015
1.2.2. Population age structure
As mentioned above, similar to “sex” characteristic, “age” is also considered very important mean as researching on the population’s age structure.
Figure 1.3: Population pyramid of Viet Nam, 1/4/2014 and 1/4/2015
Over the past years, in Viet Nam, there has been a significant decline in fertility and a continuous increase in life expectancy at birth thanks to the success of public health work, development of the medical field, and improved living standards. This has led to changes in the Viet Nam’s population age structure,
1/4/2014
Male Female
Percentage
1/4/2015
Male Female
Percentage

30
becoming the aging population. The 2015 Viet Nam population pyramid (Figure 1.3) shows that there were wider bars of all the age group. This shape means that the working age groups are the most crowded, and this presents an advantage for economic development of the country, particularly if labour productivity of this population group is increased. At the same time, this age structure creates pressure for the nation in terms of generating jobs for employment of the middle age groups.
The population structure by age group is also used to calculate the dependency ratio, which reflects the burden on the working age population. The dependency ratio reveals the influence of fertility and mortality on the age structure and the labour force. Table 1.7 presents the dependency ratios from 1989, 1999 and 2009 Censuses and the 2014 IPS and the 2015 PCS.
The data shows that the total dependency ratio in Viet Nam has declined rapidly over time, dropping from 78.2% in 1989 to 63.6% in 1999, 44.7% in 2009 but increasing to 46.1% in 2015. This increasing is due to rising old age dependency ratio from 9.3% in 2009 to 11.1% in 2015. It shows that population aging is happening rapidly with life expectancy increasing, old persons living longer while young age dependency ratio is decreasing. This decline is mainly due to effectiveness of the population and family planning programs to a decline in fertility lead to child dependency ratio fell sharply, from 69.8% in 1989 to 54.2% in 1999, 35.4% in 2009 and 35.1% in 2015.
Table 1.7: Dependency ratio, 1989-2015
Unit: Percentage
Dependency ratio 1989 1999 2009 2014 2015
Young age dependency ratio (0-14) 69.8 54.2 35.4 33.8 35.1
Old age dependency ratio (65+) 8.4 9.4 9.3 10.2 11.1
Total dependency ratio 78.2 63.6 44.7 44.0 46.1
Sources: - 1989: The 1989 Viet Nam Population Census, Completed census results, Vol. 1, Table 1.2, page 16. - 1999: the General Statistics Office, “the 1999 Viet Nam Population and Housing Census”, Completed census results, the Statistics Publishing House, August 2001, Table 1.5, page 20. - 2009: the General Statistics Office, “the 2009 Viet Nam Population and Housing Census: Completed census results”, the Statistics Publishing House, June 2010. - 2014: the General Statistical Office, "the 1/4/2014 Viet Nam Intercensal Population and Housing Survey: Major findings", Ha Noi, September 2015, Table 1.8, Page 35.
Table 1.8 shows that by 2015, the proportion of the population in working
ages (15-64 years) accounted for 68.4% of the total population with 1 percentage point decreasing compared to 2014. The dependent population proportion (below

31
age 15 and from 65 years and older) was 31.6%. The total dependency ratio was 46.1%. This shows that Viet Nam is not only in the period of the “demographic window”, but aging is also occurring so quickly (the elderly dependency ratio increases) make those in the working age increasingly have to "burden" more than those in dependent ages.
Table 1.8: Proportion of population aged under 15, 15-64, 60 and above, 65 and
above and Aging Index, 1989 - 2015 Unit: Percentage
1989 1999 2009 2014 2015
Proportion of population aged under 15 39.2 33.1 24.5 23.5 24.0
Proportion of population aged 15–64 56.1 61.1 69.1 69.4 68.4
Proportion of population aged 60 and above 7.1 8.0 8.7 10.2 11.3
Proportion of population aged 65 and above 4.7 5.8 6.4 7.1 7.6
Ageing Index 18.2 24.3 35.5 43.3 47.1 Source: - 1989: The 1989 Viet Nam Population Census, Completed census results, Vol. 1, Table 1.2, page 16. - 1999: General Statistics Office, “The 1999 Viet Nam Population and Housing Census”, Completed census results, Statistics Publishing House, August 2001, Table 1.5, page 20. - 2009: General Statistics Office, “The 2009 Viet Nam Population and Housing Census: Completed census results”, Statistics Publishing House, June 2010.
- 2014: General Statistics Office, "The 1/4/2014 Viet Nam Intercensal Population and Housing Survey: Major findings", Ha Noi, September 2015, Table 1.9, Page 35.
The period of the “demographic window of opportunity” (also called the “population bonus”) offers a great opportunity to take advantage of quality human resources for economic growth and sustainable development of the country. However, if there is not any interest and suitable development policies, the “demographic window of opportunity” is not only not to bring the positive impacts on the country's development, but also to create the pressure for increased employment, social security, etc. Therefore, taking advantage of the “demographic window” structure requires appropriate policies aimed at improving the quality of human resources to meet the needs of the labour market, enhance labour productivity growth, create jobs for young people, ensure social security for older persons and vulnerable people, and ensure gender equality.
According to the United Nations, the phenomenon of population “ageing” can be viewed through the proportion of older persons (usually aged 65 or older) in a population. The selection of the age defined as “older age” (numerator) is dependent on the particular conditions of each country. It may be based on retirement age, views of the role of the elderly in society, life expectancy at birth,

32
etc. Generally, a population is considered to be “ageing” if the proportion of the population aged 65 and older accounts for 7% to 10% of the total population.
Thus, if bases only on the proportion of elderly (aged 65 and older) in the population, Viet Nam has almost reached an “ageing population”. Table 1.8 shows that the proportion of the population aged 65 and older in 2014 was 7.1%, increasing to 7.6% in 2015. Life expectancy at birth of the population has been increasing, leading to an increase in the proportion of the population aged 65 and older from 4.7% in 1989 to 5.8% in 1999, 6.4% in 2009, 7.1% in 2014 and 7.6% in 2015. Remarkably, the female population is considered to be “ageing” more than the male population, as the inevitable consequences of the post-war era are joined with inherent characteristics of women, such as higher life expectancy at birth compared to men.
Besides indicators such as the proportion of the population under age 15 and the proportion aged 65 and older, another important indicator reflecting population ageing is the Ageing Index. This indicator reflects the structure of the dependent population. Table 1.8 shows the Aging Index of Viet Nam in 1989, 1999, 2009, 2014 and 2015. The Ageing Index increased from 18.2% in 1989 to 24.3% in 1999, 35.5% in 2009, 43.3% in 2014 and 47.1% in 2015. This suggests that the trend of population ageing in Viet Nam has increased quite rapidly over the past three decades. Increased life expectancy at birth and reduced fertility are factors that have led to the ageing of the population. It is projected that ageing in Viet Nam will continue to rise rapidly in the near future and will become a challenge if Viet Nam does not prepare in advance a comprehensive social welfare system for the elderly through reform of social protection systems, expanding coverage of pension insurance and health insurance, and encouraging employers to create jobs and working environments that are suitable with the capacity and health of older persons.

33
CHAPTER 2: MARITAL STATUS
Marriage is one of the important factors in population change, with a direct influence on fertility and migration. In the 2015 PCS, information on current marital status was collected for all persons aged 15 and above. The marital status of a person was categorized as either “Ever married” or “Never married”. The first group includes people who had married at least once by the time point of the survey, including those currently married, widowed, divorced or separated. The second group only includes people who have never been married (were single) at the time point of the survey.
2.1. Marriage trends
Table 2.1 shows the proportion of the population aged 15 and above by marital status, urban/rural residence and socio-economic region. According to the 2015 PCS results, the proportion of ever-married people aged 15 and above in the population of the entire country was quite high, accounting for 77.1%. Of which, the proportion of currently-married people was 68.1%, while the proportion of never-married people aged 15 and above was about one fifth, or approximately 22.9% of the total population aged 15 and over.
Comparing marital status in urban and rural areas, the proportion of the currently married population aged 15 and above in rural areas was 4.4% points higher than that in urban areas (69.6% versus 65.2%). Conversely, the proportion of the never-married population aged 15 and above living in urban areas was 4.5% points higher than that in rural areas (25.9% versus 21.4%). Proportion of the “widowed” people in urban areas was quite lower than in rural areas (about 0.9%). Group of “divorced” in the urban areas is higher than that in the rural areas (about 0.8%). There was no significant differential in the proportion of separated people between urban and rural areas (only about 0.5%). Compare with 2014, proportion of the widowed, divorced and separated groups increase slightly from 0.1% to 0.3%.
Among socio-economic regions, the Northern Midlands and Mountains had the lowest proportion of “single” people, at 17.5%. This region also had the highest proportion of “ever-married” people in the country (82.5%), of which the proportion of currently married people accounted for 74.2% and widowed people 6.6%. Conversely, the Southeast region had the highest proportion of “single” people, at 29.2%. The Southeast also had the lowest proportions of “currently married” people compared to the entire country (61.7%). This reflects differences in customs and social and cultural norms between regions. Due to the traditional

34
and cultural characteristics, marriage is considered common while divorce and separation are rarely accepted in the Northern Midlands and Mountains region. Besides, Southeast is the region where Ho Chi Minh City and Binh Duong is belonged attracting workers from other place to come to work and study. Most of them come from rural areas of neighbouring provinces who left behind the origin places with their desire of finding jobs and getting higher income, thus, they have to face with the pressure of family and income. This may explain why the proportion of “never married” people in this region was the highest in the country (29.2%).
Table 2.1: Proportion of population aged 15 and above by marital status,
urban/rural residence and socio-economic region, 1/4/2015
Unit: Percentage
Marital status Socio-economic regions
Total Never
married Currently married
Widowed Divorced Separated
Entire country 100.0 22.9 68.1 6.8 1.7 0.5 Urban 100.0 25.9 65.2 6.2 2.2 0.5 Rural 100.0 21.4 69.6 7.1 1.4 0.5
Socio-economic region Northern Midlands and Mountains 100.0 17.5 74.2 6.6 1.3 0.4 Red River Delta 100.0 19.7 71.4 7.4 1.2 0.4 North and South Central Coast 100.0 24.6 66.4 7.5 1.1 0.4 Central Highlands 100.0 24.9 67.8 5.5 1.4 0.4 Southeast 100.0 29.2 61.7 5.9 2.6 0.6 Mekong River Delta 100.0 21.9 68.2 6.8 2.5 0.7
Table 2.2 presents the proportion of population aged 15 and above by marital status, sex and age group, reflecting trends in marriage and marital status of men and women. It is clear that women in Viet Nam tend to marry earlier than men; however, at older ages (after age 40) women have fewer opportunities to marry/re-marry compared to men. Data in Table 2.2 also shows that for the population aged under 40, the proportion of “never married” women was always lower than that of men. For example, in the age group of 20-24, the proportion of “ever-married” women was double the proportion among men (46.4% versus 20.9%). However, from the age of 40 and older, marriage is more universal among men; the proportion of married man was higher and the proportion of single men (single/divorced/separated) was much lower than for women. In the 55-59 age group, the proportion of single men accounted for only 1.6%, while the proportion of single women was 6.6% (a difference of 5.0%).

35
Table 2.2: Proportion of population aged 15 and above by marital status, sex
and age group, 1/4/2015
Unit: Percentage
Marital status Age group
Total Never
married Currently married
Widowed Divorced Separated
MALE
Total 15+ 100.0 26.7 69.7 2.1 1.1 0.4
15-19 100.0 97.8 2.2 0.0 0.0 0.0
20-24 100.0 79.1 20.5 0.0 0.3 0.1
25-29 100.0 42.7 55.6 0.1 1.2 0.4
30-34 100.0 16.6 80.9 0.2 1.7 0.6
35-39 100.0 6.9 90.1 0.4 2.0 0.6
40-44 100.0 4.1 93.3 0.5 1.6 0.5
45-49 100.0 3.1 93.7 0.9 1.7 0.6
50-54 100.0 2.1 94.9 1.4 1.2 0.4
55-59 100.0 1.6 94.6 2.4 1.0 0.4
60+ 100.0 0.8 85.9 12.2 0.7 0.4
FEMALE
Total 15+ 100.0 19.4 66.5 11.3 2.2 0.6
15-19 100.0 90.8 9.0 0.0 0.1 0.1
20-24 100.0 53.6 45.0 0.2 0.9 0.4
25-29 100.0 19.5 77.5 0.6 1.9 0.5
30-34 100.0 8.2 87.5 1.2 2.6 0.5
35-39 100.0 5.6 88.3 2.4 3.1 0.5
40-44 100.0 5.1 87.1 3.9 3.3 0.7
45-49 100.0 6.2 83.1 6.7 3.3 0.7
50-54 100.0 6.1 79.6 10.7 2.9 0.7
55-59 100.0 6.6 73.7 15.6 3.2 0.9
60+ 100.0 4.0 47.2 46.4 1.7 0.7
Figure 2.1 shows that a decline in the “never married” population group was most apparent in the age group of 15-29 for females and 20-34 for males. Both men and women in these groups are at the beginning of the age range when people typically marry. In the young age groups, the decline in the female proportion of “never married” was higher and faster than the decline in the male proportion. However, after age 40, this trend reversed again, though the difference between men and women was not significant. This shows that the greatest contribution to the difference in the proportion of “single” men and women in these age groups is not the “never married” groups. In other words, “marriage” is universal in Viet Nam.
As noted above, the “widowed” group was the main source of the difference in the proportion of “single” men and women in the age groups after age 40.

36
The “widowed” variable has a proportional correlation with age; the “widowed” proportion increases with increasing age. Table 2.2 shows that the proportion of widowed women was five times higher than the proportion among males, and the proportion increased faster by age compared to men. The reason for this difference may be that life expectancy at birth for males is usually lower than for females, or because widowed males tend to remarry more often than widowed females.
In Viet Nam, the status of “divorced” is not common, and the proportion of “divorced” people is very low. However, the divorce rate differs by sex. The divorced rate among women was found to be consistently higher than among men in all observed age groups. Similar to “divorced”, being “separated” is not common in Viet Nam. There was no difference in this indicator by sex.
Figure 2.1: Proportion of single population aged 15 and over
by sex and age group, 1/4/2015
2.2. Singulate mean age at marriage
The singulate mean age at (first) marriage (SMAM) in most cases was calculated separately by sex. In this report, this indicator was estimated indirectly from the proportion of the never-married population aged 15 and above, among age groups from 15-19 to 50-54.

37
Table 2.3: Singulate mean age at marriage by sex, 1989-2015
Unit: Year
Year Total Male Female Difference in SMAM
between male and female
1989 23.8 24.4 23.2 1.2
1999 24.1 25.4 22.8 2.6
2009 24.5 26.2 22.8 3.4
2014 24.9 26.8 22.9 3.9
2015 24.9 26.9 22.8 4.1
Sources:
- 1989: The 1989 Viet Nam Population Census: Completed Census Results, Vol. I, Table 3.1, page 233.
- 1999: General Statistics Office, “The 1999 Viet Nam Population and Housing Census: Completed Census Results”, Statistics Publishing House, August 2001, Table 3.1, page 219.
- 2009: General Statistics Office, “The 2009 Viet Nam Population and Housing Census: Major Findings”, Table 3.14, page 48.
- 2014: General Statistics Office, “The 2014 Vietnam Intercensal Population and Housing Survey: Major Findings”, Table 2.3, page 45.
Table 2.3 shows that SMAM increased for men in the period 1989-2015. However, SMAM for men increased to a higher level than for women. This leads to an expanded differential in SMAM by sex; according to the results of the 2014 IPS, the difference in SMAM between male and female was 3.9 years. In 2015, this difference is 4.1 years. After 16 years since the 1999 Census, the SMAM of males increased 1.5 years while the SMAM of females was nearly unchanged. This indicates that males are likely to marry for the first time later than females.
Table 2.4 presents SMAM for men and women by urban/rural residence and socio-economic region in 2015. There was a differential in SMAM by urban/rural residence; the SMAM in urban areas was higher than in rural areas, for both men and women. The results of the 2015 PCS show that SMAM among urban men was higher than among rural men by 1.6 years. This differential among women is 2.4 years, suggesting that urban women are likely to marry later than rural women. The difference in SMAM by sex in rural areas was 0.8 years higher than the difference in urban areas (4.5 years versus 3.7 years). This suggests that rural males are likely to marry later than rural females. In addition, urban men have more opportunities for employment and study compared to urban women.

38
Table 2.4: Singulate mean age at marriage by sex, urban/rural residence and socio-economic region, 1/4/2015
Unit: Years
SMAM Socio-economic region
Male Female
Difference in SMAM between
males and females
Entire country 26.9 22.8 4.1 Urban 28.0 24.3 3.7
Rural 26.4 21.9 4.5
Socio-economic region
Northern Midlands and Mountains 24.4 20.6 3.8 Red River Delta 26.7 22.7 4.1
North and South Central Coast 27.6 22.9 4.8 Central Highlands 26.3 22.5 3.8 Southeast 27.9 24.3 3.7 Mekong River Delta 27.2 22.6 4.5
Table 2.4 summarizes SMAM by region based on the results of the 2015
PCS. The Southeast region had the highest SMAM at 27.9 years for men and 24.3 for women. The region with the lowest SMAM was the Northern Midlands and Mountains, at 24.4 years for men and 20.6 for women. This region contains a high proportion of ethnic minority groups compared to the other regions of the country. The culture, social characteristics and traditions of this region may be factors affecting young people’s decision to marriage early. It is the fact that in areas with higher levels of urbanization and/or better economic and social conditions (the Southeast, North and South Central Coast and the Red River Delta) people tend to marry later.
SMAM among men and women and differences in SMAM between males and females by province are shown in Annex 5. Based on the 2015 PCS results, Khanh Hoa province had the highest male SMAM in the country (29.2 years), followed by Ba Ria - Vung Tau province (28.9 years) and Ho Chi Minh City and Thua Thien Hue province (28.6 years). The lowest male SMAM was in Lai Chau (21.5 years), followed by Son La (22.3 years), Ha Giang (22.4 years). For women, the patterns across provinces were similar.
In 2014, 33 provinces had a marital age gap of 4 years or more, while in 2015 there were 42 provinces. This is an evidence showing that trend of marriage of men is later than women. Differences in SMAM between ma/les and females was highest in Thai Binh province (6.3 years), followed by Ha Tinh province (6.0 years). The lowest gap was found in Ha Giang province at only about 2.2 years (lower than the SMAM gap for the entire country 1.9 years).

39
Table 2.5: Singulate mean age at marriage by sex and highest education attainment,
1/4/2015 Unit: Years
SMAM The highest education level
attainment Total Male Female
Difference in SMAM between male and female
Entire country 24.9 26.9 22.8 4.1
Under primary 22.8 25.5 19.8 5.7
Primary 23.5 26.0 20.6 5.4
Lower secondary 24.0 26.2 21.4 4.8
Higher secondary 25.9 27.9 23.8 4.0
Reviewing SMAM by the highest education attainment shows that there is a
proportional relationship between SMAM and highest education attainment: people with higher education levels are likely to have a higher SMAM, and this is true for both males and females.
In general, differences in SMAM by sex tend to decrease when education attainment levels are higher. Differences in SMAM between males and females who did not complete primary level was 5.7 years in 2015, or about 1.7 years higher than for those who graduated from higher secondary level, and around 1.6 years higher than the difference in SMAM for the national population.
2.3. Adolescent marriage
The 2015 PCS results show that adolescent marriage is still occurring. Table 2.6 presents ever-married adolescent population aged 15-19 by single year of age and SMAM for the group. Data show that early marriage occurred in both adolescent boys and girls. However, the proportion of “marriage at adolescent ages” of girls was higher than boys. The proportion of ever-married women aged 18 in rural areas was 17.7%, and 27.1% at age 19. The same figures in urban areas were 6.2% and 10.2%, respectively. All indicators of women in the table are higher than men. A significant difference in the percentage of the married adolescents by sex was found at the age of 17 and over.
There was a large differential found in adolescent marriage rates by regions. In general, the proportion of adolescent males and females who have ever married was highest in the Northern Midlands and Mountains, followed by the Central Highlands. These two regions have large ethnic minority populations, and the rate and extent of industrialization and economic development have been slower
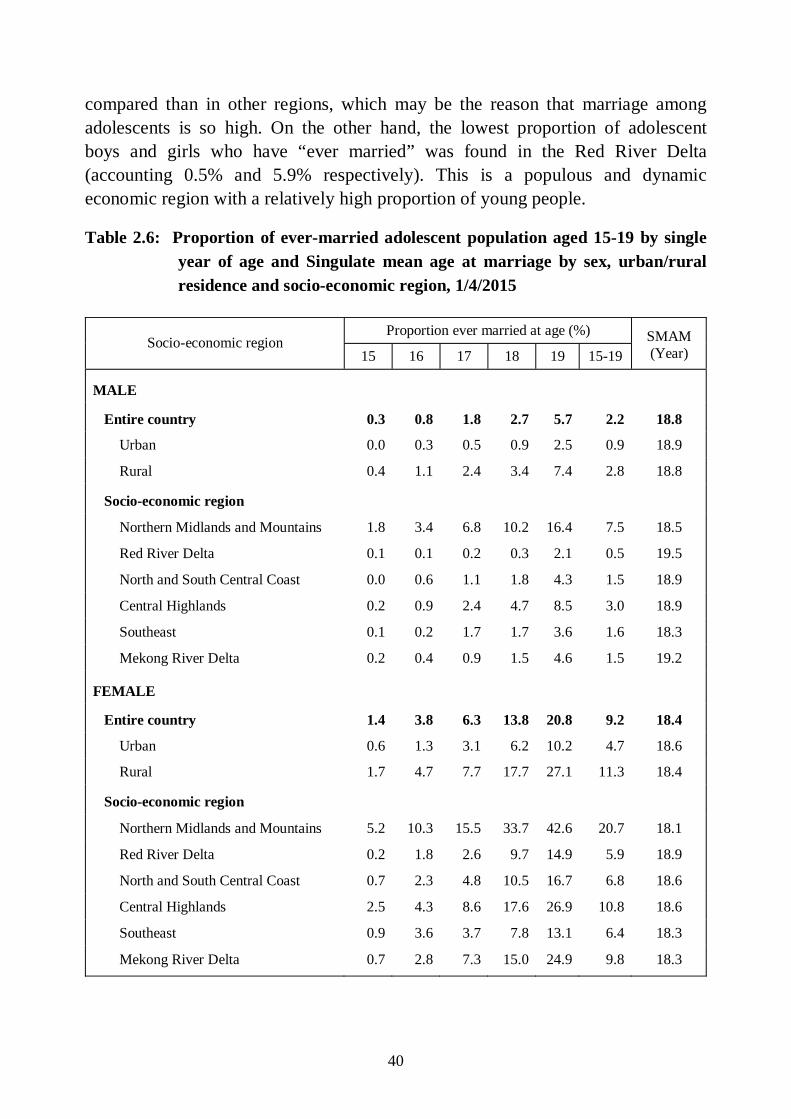
40
compared than in other regions, which may be the reason that marriage among adolescents is so high. On the other hand, the lowest proportion of adolescent boys and girls who have “ever married” was found in the Red River Delta (accounting 0.5% and 5.9% respectively). This is a populous and dynamic economic region with a relatively high proportion of young people.
Table 2.6: Proportion of ever-married adolescent population aged 15-19 by single
year of age and Singulate mean age at marriage by sex, urban/rural
residence and socio-economic region, 1/4/2015
Proportion ever married at age (%) Socio-economic region
15 16 17 18 19 15-19 SMAM (Year)
MALE
Entire country 0.3 0.8 1.8 2.7 5.7 2.2 18.8
Urban 0.0 0.3 0.5 0.9 2.5 0.9 18.9
Rural 0.4 1.1 2.4 3.4 7.4 2.8 18.8
Socio-economic region
Northern Midlands and Mountains 1.8 3.4 6.8 10.2 16.4 7.5 18.5
Red River Delta 0.1 0.1 0.2 0.3 2.1 0.5 19.5
North and South Central Coast 0.0 0.6 1.1 1.8 4.3 1.5 18.9
Central Highlands 0.2 0.9 2.4 4.7 8.5 3.0 18.9
Southeast 0.1 0.2 1.7 1.7 3.6 1.6 18.3
Mekong River Delta 0.2 0.4 0.9 1.5 4.6 1.5 19.2
FEMALE
Entire country 1.4 3.8 6.3 13.8 20.8 9.2 18.4
Urban 0.6 1.3 3.1 6.2 10.2 4.7 18.6
Rural 1.7 4.7 7.7 17.7 27.1 11.3 18.4
Socio-economic region
Northern Midlands and Mountains 5.2 10.3 15.5 33.7 42.6 20.7 18.1
Red River Delta 0.2 1.8 2.6 9.7 14.9 5.9 18.9
North and South Central Coast 0.7 2.3 4.8 10.5 16.7 6.8 18.6
Central Highlands 2.5 4.3 8.6 17.6 26.9 10.8 18.6
Southeast 0.9 3.6 3.7 7.8 13.1 6.4 18.3
Mekong River Delta 0.7 2.8 7.3 15.0 24.9 9.8 18.3

41
CHAPTER 3: EDUCATION
Education plays a very important role in the development of each country and ethnic group, and can have a positive impact on the lives of individuals by contributing to the elimination of hunger, reducing poverty, and enabling people to find better paying jobs. To date, through much effort, Viet Nam has made substantial achievements in the field of education, including eliminating illiteracy and completing universal primary education nationwide, and has made great progress in universalizing lower secondary education. Viet Nam has a well-established National Education System that is reaching uniform standards through a system that covers different levels of education from pre-school through general education and vocational/trade education to university and post-university training. The education system coverage is widespread throughout the entire country, and includes clear objectives for educational development along with the country’s development process.
In order to obtain an overview of education in Viet Nam and education trends, and to meet the requirements of providing information on education in the country, it is necessary to collect and maintain relevant information over time. As was done in the Population Censuses of 1989, 1999, 2009 and the 2014 IPS, the questionnaires used for the 2015 PCS included groups of questions on school attendance, literacy, highest education level attained, and technical and professional qualification levels of the surveyed population.
3.1. School attendance
The schooling situation of the population is reflected in the classifications of “currently attending”, “ever attended” and “never attended” school. “Currently attending” means studying at one of the schools/classes under the National Education System from 3 months or more; “Ever attended” means a person who has previously attended a school/class that belongs the National Education System for 3 months or more but at the time of the survey had stopped attending school; and “Never attended” means those who has never studied in any school/class under the National Education System for 3 months or more.
Data in Table 3.1 shows that over one fifth of total population is attending in any schools (22.3%). During the last 20 years, the proportion of population aged 5 and above who have never attended school has decreased considerably. In 2015, the proportion of this group is only 4.1% of total population aged 5 and above, declining 0.3 percentage points, as compared to that of 2014 and 2.3 times falling than that of 1999 and 1.0 percentage points lower than that of 2009.

42
Table 3.1: Distribution of population aged 5 and above by school attendance
in the 1989-2015 period Unit: Percentage
School attendance 1989 1999 2009 2010 2013 2014 2015
Total 100.0 100.0 100.0 100.0 100.0 100.0 100.0
Currently attending 23.6 27.6 24.7 24.0 23.3 22.6 22.3
Ever attended 58.4 62.6 70.2 71.2 72.9 72.9 73.6
Never attended 18.0 9.8 5.1 4.8 3.8 4.4 4.1
Source: - 1989, 1999, 2009, 2010 and 2013: General Statistics Office, “1/4/2013 PCS: Major findings”, Table 3.1, page 16. - 2014: General Statistics Office, “1/4/2014 IPS: Major findings”, Table 3.1, page 46.
Figure 3.1 indicates that the proportion of female population who have never-attended school is higher than that of males, in another words, females have faced more disadvantages in education than males do. However, the two curve lines are close at younger ages and separated away from each other at older ages, reflecting that the proportional differences of population who have never attended school for both sexes has been narrowed considerably in recent years. This confirms the improvement on school attendance and the decline on educational gap between males and females, regarded as two concomitant tendencies of education in Viet Nam.
Figure 3.1: Proportion of population aged 10 and above who have never-attended school by age group and sex, 1/4/2015

43
3.2. Gross and net school attendance rates
According to Viet Nam’s Education Law, the general education system is divided into three levels, corresponding with specific requirements on duration and ages, as follows: (1) primary education includes grades 1 to 5 and the age for attending grade 1 is exact age 6; (2) lower secondary education consists of grades 6 to 9 and, the requirements that for attending grade 6, the primary education is required to complete and the age for attending is exact 11 (3) upper secondary education comprise grades 10 to 12 and the requirements that for attending grade 10, the lower secondary education is required to complete and the age for attending are exact 15. Apart from the general education, there is also tertiary education including under graduate (college and university) and post graduate (master and PhD). In the analysis of tertiary education below, just the attendance rates of under-graduate education (junior college and university) that in general, the training duration prolongs 3 to 4 years and the starting age for attending is 18, will be mentioned.
The school attendance rate is regarded as an indicator reflecting the input of education. Table 3.2 shows the gross school attendance rate1 and net school attendance rate2 classified by level of schooling. The data indicate that Viet Nam has achieved the universal primary education. For the lower secondary education, the educational universality has reached to 92.2%. For the primary education, there is no urban/rural difference on universal education level. For higher educational level, the urban rural gap on educational universality is found larger and larger. Specifically, at lower and upper secondary education, the urban-rural gaps are 3.8 percent points and 14.1 percent points, respectively while at under-graduate education, the gap reaches to 35.4 percent points.
The data in Table 3.2 presents the inverse tendencies on educational universality level between two large deltas in Viet Nam. While the Mekong River Delta has the lowest gross school attendance rates for both lower and upper secondary education (about 86.3% and 57.5%, respectively - and similar for Central Highlands region), then the Red River Delta occupies the highest ones (98.5% and 86.6%, respectively). This implies that the educational universality for lower and upper secondary education should be a major concern in the Mekong River Delta and Central Highlands region as well.
1 The gross school attendance rate is denoted as number of pupils/students who are attending in a given educational level, regardless of their age per 100 persons at exact ages regulated for attending that educational level. 2 The net school attendance rate is defined as number of pupils/students at exact ages regulated to attend a given educational level, attending that educational level per 100 persons at exact ages regulated to participate that educational level.

44
Table 3.2: Gross and net school attendance rates by level of education, urban/rural
residence and socio-economic region, 1/4/2015 Unit: Percentage
Gross school attendance rate Net school attendance rate
Primary Lower
secondaryUpper
secondaryTertiary Primary
Lower secondary
Upper secondary
Tertiary
Entire country 99.8 92.2 69.7 28.5 97.2 89.9 66.3 21.9
Urban 99.4 94.9 79.7 51.8 97.8 93.4 76.2 40.9
Rural 99.9 91.1 65.6 16.4 96.9 88.4 62.2 12.1
Socio-economic region
Northern Midlands and Mountains 100.5 93.0 64.7 13.6 97.4 89.7 60.7 8.1
Red River Delta 100.1 98.5 86.6 41.6 99.1 97.5 84.5 33.9
North and South Central Coast 98.4 92.8 71.0 27.6 96.3 90.6 67.9 21.6
Central Highlands 98.5 85.9 57.6 10.1 94.1 81.9 53.3 6.7
Southeast 99.8 93.5 70.2 38.6 97.8 91.7 66.3 30.6
Mekong River Delta 100.8 86.3 57.5 21.3 96.7 83.4 53.5 14.8
3.3. Literacy
The question on literacy3 is given for all people who have not graduated primary schools (not completed grade 5) and assuming that all people with higher educational levels are able to read and write. The literacy rate is used to evaluate the literacy of a population. It is one of general measurements reflecting the educational outcomes, defined as the percentage of literate people in a given age out of total population in that age.
Result of the 2015 PCS shows that the literacy rate of population aged 15 and above stands at 94.9%. Literacy rates in urban areas are found higher than those of rural areas due to the development gaps between two areas. Nevertheless, owing to the policies for universal primary education and illiterate elimination in the recent years, the urban rural differential on literacy rates has remained much small, just 4.2 percent points (97.6% in urban areas versus 93.4% in rural areas). The literacy rate of males is higher than that of females in both urban and rural areas. The urban/rural difference on literacy rate for females is larger than that of males (5.5 percent points for females versus 2.7 percent points for males, respectively).
3 Literacy is the ability to read and write a simple paragraph in the daily life in the national language, ethnic minority’s language or foreign language.

45
The Red River Delta is the region with the highest literacy rate (98.2%) while the lowest one, about 89.9%, belongs to the Northern Midlands and Mountains where the urban-rural gap on literacy rate is the largest throughout the country (9.5 percent points), followed by the Central Highlands with the gap of 9.1 percent points. For the remaining regions, the urban - rural gap is less than 3 percent points.
Table 3.3: Literacy rate of population aged 15 and above by sex, urban/rural
residence and socio-economic region, 1/4/2015
Unit: Percentage
Sex/socio-economic region Total Urban Rural Urban - rural differential
Entire country 94.9 97.6 93.4 4.2
Male 96.6 98.4 95.7 2.7
Female 93.2 96.8 91.3 5.5
Socio-economic region
Northern Midlands and Mountains 89.9 97.6 88.1 9.5
Red River Delta 98.2 99.0 97.7 1.3
North and South Central Coast 95.2 97.3 94.4 2.9
Central Highlands 90.4 96.7 87.6 9.1
Southeast 97.3 98.2 95.6 2.6
Mekong River Delta 92.9 94.7 92.3 2.4
Figure 3.2 reveals the literacy rate of population aged 15 and above classified by age group. These data indicate that the literacy rate in Viet Nam have improved significantly in the past few decades. It is found that the higher literacy rates belong to younger age groups as well as the sex gap on literacy rate is narrowed gradually for younger age groups. The two curve lines on literacy rates for males and females are very close at young ages but separated away from each other at age group of 50 or above, revealing that in the past, females were more disadvantaged than males in schooling but this inequality has been relieved considerably in recent years. The data indicate that the achievement on education is reflected not only by the highly increased literate rate but also by the improved gender equality targets.

46
Figure 3.2: Literacy rate of population aged 15 and above
by age group and sex, 1/4/2015
3.4. Educational attainment
Educational attainment has always been regarded as one of the important indicators reflecting the quality of human resources of every nation and ethnic group. In addition to providing information to assess the level of development of countries, education also has an impact on employment, age at marriage, behaviours affecting fertility, and how individuals respond to the problems of life. Therefore, improving educational attainment is not only the responsibility of the community, but also of society and each person. Individuals should be responsible for improving themselves by raising their level of education, and thereby contribute to the general development of the country and society.
The data in Table 3.4 shows that number of people who have graduated lower secondary schools or above in the whole country constitutes 50% of total population aged 5 and above. There is an urban/rural gap on educational level. In 2015, the proportion of urban people who have graduated upper secondary schools and above is 40.6%, twice times higher than that of rural areas, currently standing at 18.2%.
In regional level, Table 3.4 shows that there are considerable disparities in educational attainment. It is worth to note that two regions with the highest levels of socio-economic development are namely Red River Delta and Southeast as compared to the Central Highlands and the Mekong River Delta. In these two regions, number of people who have completed upper secondary or above accounts for 35.5% and 31.5% of total regional population aged 5 and above, respectively. In contrary, these figures are 13.2% and 18.5%, respectively, for Mekong River

47
Delta and the Central Highlands, those are the lowest in the country. These are also the two regions occupying the highest proportion of “Under primary”, including “Never attended” and “Incomplete primary” (30.4% and 36.3% respectively). The Red River Delta and the Southeast are the two regions with high economic development as compared to the Central Highlands and the Mekong River Delta, so these regions attract many qualified workers come to live and work.
Table 3.4: Proportion of population aged 5 and above by educational attainment, urban/rural residence and socio-economic region, 1/4/2015
Unit: Percentage
Residence/socio-economic region Total Never attended
Incomplete primary
Completed primary
Completed lower
secondary
Completed upper
secondary and higher
Entire country 100.0 4.1 20.7 24.9 24.4 25.8
Urban 100.0 2.0 16.5 20.7 20.2 40.6
Rural 100.0 5.2 22.9 27.1 26.6 18.2
Socio-economic region
Northern Midlands and Mountains 100.0 8.1 20.1 22.9 25.4 23.4
Red River Delta 100.0 1.4 14.6 15.9 32.6 35.5
North and South Central Coast 100.0 3.7 19.6 24.7 26.2 25.8
Central Highlands 100.0 7.5 22.9 28.2 22.9 18.5
Southeast 100.0 2.3 18.7 26.4 21.1 31.5
Mekong River Delta 100.0 5.6 30.7 34.6 15.8 13.2
3.5. Technical and professional qualifications
For the 2015 PCS, technical and professional qualifications were divided into four groups: short-term training, trade vocational school/secondary vocational school, trade college/vocational college, and university and higher. The proportion of the population aged 15 and over by technical and professional qualifications is displayed in Table 3.5. In total population aged 15 and over, approximately 84.4% did not have any technical and professional qualifications, an increase of 1.6% points compared to the 2014 IPS. However, the proportion with university and higher education increased in comparing with the 2014 IPS, 7.4% compare to 6.9%.
These changes were similar for males and females. However, there is still a rather large gap by gender and urban/rural areas in the share of the population with technical and professional training at all training levels, with no apparent narrowing of this gap. Specifically, the proportion of the population in urban areas with college or lower levels of education was nearly double the proportion in rural areas. And there is a big gap between urban and rural areas in the groups with university and higher, proportion in urban areas is about 5 times higher than rural (15.3% and 3.3%, respectively).
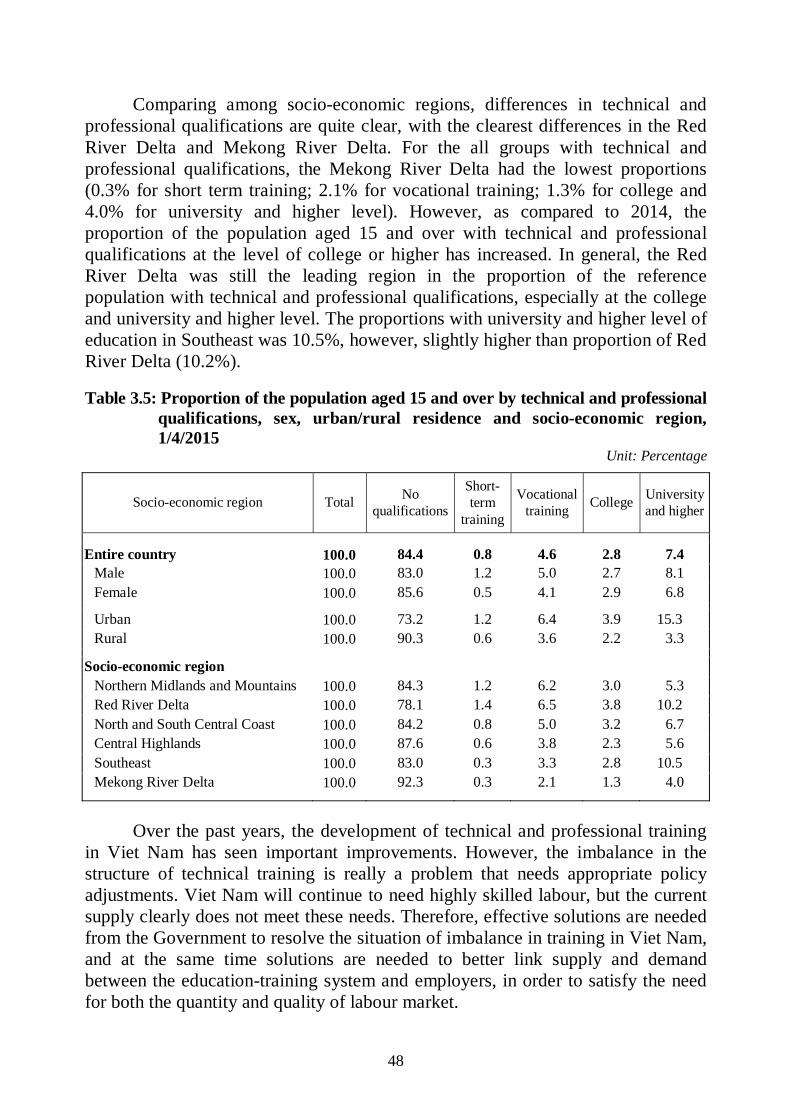
48
Comparing among socio-economic regions, differences in technical and professional qualifications are quite clear, with the clearest differences in the Red River Delta and Mekong River Delta. For the all groups with technical and professional qualifications, the Mekong River Delta had the lowest proportions (0.3% for short term training; 2.1% for vocational training; 1.3% for college and 4.0% for university and higher level). However, as compared to 2014, the proportion of the population aged 15 and over with technical and professional qualifications at the level of college or higher has increased. In general, the Red River Delta was still the leading region in the proportion of the reference population with technical and professional qualifications, especially at the college and university and higher level. The proportions with university and higher level of education in Southeast was 10.5%, however, slightly higher than proportion of Red River Delta (10.2%).
Table 3.5: Proportion of the population aged 15 and over by technical and professional qualifications, sex, urban/rural residence and socio-economic region, 1/4/2015
Unit: Percentage
Socio-economic region Total No
qualifications
Short-term
training
Vocational training
College University and higher
Entire country 100.0 84.4 0.8 4.6 2.8 7.4 Male 100.0 83.0 1.2 5.0 2.7 8.1 Female 100.0 85.6 0.5 4.1 2.9 6.8
Urban 100.0 73.2 1.2 6.4 3.9 15.3 Rural 100.0 90.3 0.6 3.6 2.2 3.3
Socio-economic region Northern Midlands and Mountains 100.0 84.3 1.2 6.2 3.0 5.3 Red River Delta 100.0 78.1 1.4 6.5 3.8 10.2 North and South Central Coast 100.0 84.2 0.8 5.0 3.2 6.7 Central Highlands 100.0 87.6 0.6 3.8 2.3 5.6 Southeast 100.0 83.0 0.3 3.3 2.8 10.5 Mekong River Delta 100.0 92.3 0.3 2.1 1.3 4.0
Over the past years, the development of technical and professional training
in Viet Nam has seen important improvements. However, the imbalance in the structure of technical training is really a problem that needs appropriate policy adjustments. Viet Nam will continue to need highly skilled labour, but the current supply clearly does not meet these needs. Therefore, effective solutions are needed from the Government to resolve the situation of imbalance in training in Viet Nam, and at the same time solutions are needed to better link supply and demand between the education-training system and employers, in order to satisfy the need for both the quantity and quality of labour market.

49
CHAPTER 4: FAMILY PLANNING AND REPRODUCTIVE HEALTH
Family planning focuses only on women of reproductive ages from 15 to 49 years, longer reproductive health care is under the human life cycle: from fetus to puberty, reproductive age and later reproductive years. Reproductive health care is focused on taking care of the structure and function of the reproductive system, but also care about the social impact of human reproductive rights. It is needed to ensure safety for the reproductive system, creating a favorable environment for ensuring reproductive rights are institutionalized by law and policy and consistency of social awareness about this issue in the true sense of power reproductive health.
4.1. Implementation of family planning
4.1.1. The contraceptive prevalence rate (CPR)
Questions on family planning implementation are interviewed and recorded for currently married women aged 15-49 years old. Results of the 2015 PCS show that the contraceptive prevalence rate reached to 75.7%, an decrease of 1.5 percentage points as compared to that of the 2013 PCS. Data taken from the annual PCSs reveal that the contraceptive prevalence rate in Viet Nam has remained at high level.
The modern contraceptive prevalence rate at 1/4/2015 time point reached to 65.0%, decreasing 2.0 percentage points as compared to that of the 2013 PCS. The any contraceptive prevalence rate in rural areas was 3.4 percentage points higher than that of urban areas (76.8% against 73.4%, respectively). In which, the modern contraceptive prevalence rate in rural areas was 3.7 percentage points higher than that of urban areas (66.2% versus 62.5%, respectively) whereas the other contraceptive prevalence rate in rural areas is 0.2 percentage points lower than that of urban areas (10.8% against 10.6%, respectively). There was not much difference in other contraceptive prevalence rate between urban and rural areas.

50
Table 4.1: Contraceptive prevalence rate in the 2002-2015 period Unit: Percentage
Total Urban Rural Survey year Any
method Modern method
Any method
Modern method
Any method
Modern method
2002 76.8 64.7 76.7 59.3 76.9 66.5
2003 75.0 63.3 72.5 56.4 75.8 65.6
2004 75.7 64.6 73.5 58.3 76.4 66.9
2005 76.9 65.8 74.9 59.7 77.6 67.9
2006 78.1 67.2 76.1 61.3 78.8 69.4
2007 79.0 68.2 77.3 62.9 79.6 70.1
2008 79.5 68.8 76.2 62.1 80.8 71.4
2010 78.0 67.5 76.0 63.3 78.8 69.2
2011 78.2 68.6 75.2 63.8 79.5 70.6
2012 76.2 66.6 74.2 63.0 77.2 68.2
2013 77.2 67.0 75.5 64.2 78.0 68.3
2015 75.7 65.0 73.4 62.5 76.8 66.2
Source: 2002- 2013: General Statistics Office. “1/4/2013 PCS: Major findings”, 12-2013, Table 4.1, Page 23.
The modern contraceptive prevalence rate is quite high in the regions that
are difficulty in the socio-economic such as: the North and South Central Coast and the Northern Midlands and Mountains (65.7%) as well as for low educated females including those who have never attended school (71.1%); not completed primary school (70.6%) and completed primary school (68.1%). These figures once again prove that the family planning programs have been supported and paid more attention by the State during the past decade, especially for those in rural areas. These programs have contributed into declining fertility in rural areas, constituting to the fertility decline of the whole country over the last 10 years.

51
Table 4.2: Contraceptive prevalence rate by urban/rural residence and socio-economic region, 1/4/2015
Unit: Percentage
In which: Residence/socio-economic region Any CPR
Modern method Traditional method
Entire country 75.7 65.0 10.7
Urban 73.4 62.5 10.8
Rural 76.8 66.2 10.6
Socio-economic region
Northern Midlands and Mountains 76.3 65.7 10.5
Red River Delta 76.7 66.3 10.4
North and South Central Coast 76.1 65.7 10.4
Central Highlands 76.2 61.3 14.8
Southeast 71.0 61.1 10.0
Mekong River Delta 77.7 66.8 10.8
Educational attainment
Never attended 77.2 71.1 6.0
Incomplete primary 80.6 70.6 9.9
Completed primary 79.4 68.1 11.3
Completed lower secondary 76.7 65.2 11.4
Completed upper secondary and above 70.5 60.1 10.4
4.1.2. Implementation of contraceptive methods by age group of women
As shown in Figure 4.1 and Figure 4.2, the trend of using contraceptive method by age group from 2006 to 2015 are relatively similar. The any contraceptive prevalence rate increases gradually, starting from the age group of 15-19 and reaching to the peak at the age group of 35-39. The data over the years show that the difference on any contraceptive prevalence rate among age groups has been narrowed. Comparing between the age group occupying the highest contraceptive prevalence rate (35-39) and the age group with the lowest rate (15-19) indicates that the gap is also becoming smaller. The difference in modern contraceptive prevalence rate among age groups is also narrowed. The results of the 2015 PCS indicates that the any contraceptive prevalence rate by age group is quite high, reaching to the highest one at the age groups of 35-39 (86.1%) and 40-44 (about 86.0%).

52
Figure 4.1: Contraceptive prevalence rate of any method by age
in the 2006-2015 period
Figure 4.2: Contraceptive prevalence rate of modern methods by age in the 2006-2015 period
4.1.3. Currently used contraceptive methods
The most popular contraceptive method used in Viet Nam is the intra-uterine device (IUD). During the period of 2004-2015, although the rate of using IUD had the gradually declined tendency but remained at a quite high level. However, in 2013, this is the first time in the last decade that the rate of using IUD has declined to below 50%, as compared to that of remaining methods, this ratio further
0
20
40
60
80
100
15-19 20-24 25-29 30-34 35-39 40-44 45-49
Nhóm tuổi
Phần trăm
2006 20082010 20122013 2015
Percentage
Age group
Percentage

53
decreased to 47.9 % in 2015 (decrease of 1.7 percentage point as compared to that of 2013). The percentage of women using contraceptive methods, such as pill, injection and implants has tended to increase with the inconsiderable pace. In 2015, the rate of traditional contraceptive use (period abstinence/withdrawal) was 14.0% that was higher than that of 2004 to 2013 (1.0 percentage point increase as compared to that of 2013).
Table 4.3: Proportion of currently married women aged 15-49 who are currently
using contraceptive method by currently used contraceptive method
in the 2004-2015 periods Unit: Percentage
Contraceptive methods 2004 2005 2006 2007 2008 2010 2011 2012 2013 2015
Entire country 100.0 100.0 100.0 100.0 100.0 100.0 100.0 100.0 100.0 100.0
IUD 55.9 55.3 55.4 55.3 55.8 52.1 53.1 51.9 49.6 47.9
Pill 11.9 12.5 13.2 13.2 13.2 15.5 15.7 16.7 17.6 18.8
Injection 1.1 1.1 1.0 1.1 1.1 1.8 1.7 1.8 2.0 1.7
Implants - - 0.1 0.1 0.2 - - - - 0.4
Diaphragm/foam 0.4 0.3 0.0 0.0 0.0 0.0 0.0 0.1 0.0 0.0
Condom 9.3 9.7 10.1 10.5 10.9 13.1 13.6 13.7 14.7 14.7
Female sterilization 0.4 0.4 0.4 0.4 0.3 0.3 0.2 0.2 0.2 0.1
Male sterilization 6.6 6.2 5.8 5.6 5.0 3.8 3.3 3.0 2.8 2.2
Periodic abstinence/ withdrawal 13.8 13.6 13.2 13.2 13.2 13.1 12.1 12.5 13.0 14.0
Others 0.8 0.8 0.7 0.4 0.2 0.3 0.2 0.2 0.2 0.1
Source: 2004-2013: General Statistics Office. "1/4/2013 PCS: Major findings". 12-2013. Table 4.3. Page 26.
4.1.4. Number of children surviving and currently used contraceptive methods
Figure 4.3 reflects the proportion of women classified by number of children surviving and the currently used contraceptive methods. For currently married women who have no child or only one child surviving, they mainly use the temporary contraceptive methods such as condom, pill or periodic abstinence/withdrawal in order to expand the birth interval or to delay pregnancy for giving birth in a suitable time. For currently married women having three children surviving or more, they mainly use permanent contraceptive methods such as IUD, injection or female/male sterilization.

54
Figure 4.3: Proportion of women using contraception by number of children surviving and currently used contraceptive method, 1/4/2015
Among women using any contraceptive methods, more than half of them have 2 children surviving, accounting for 57.1% and more than 20% of them have 3 children surviving or more. The sterilization rate of those women who have 3 children surviving or more is quite high, of which 44.7% belongs to those women having their partners sterilized and the remaining - female sterilization constitutes about 53.4%.
Table 4.4: Proportion of currently married women aged 15-49 using contraception by currently used contraceptive methods and number of children surviving, 1/4/2015
Unit: Percentage
Of which: Contraceptive methods Total
None 1 child 2
children 3 children and above
Entire country 100.0 0.0 20.9 57.1 21.9
IUD 100.0 0.0 15.3 60.4 24.3
Pill 100.0 0.0 27.3 54.8 17.9
Injection 100.0 0.1 16.2 48.6 35.2
Implants 100.0 0.0 22.6 56.4 21.0
Diaphragm 100.0 0.0 41.0 48.1 10.9
Foam 100.0 0.0 14.4 50.7 35.0
Condom 100.0 0.0 32.5 54.1 13.4
Male sterilization 100.0 0.0 12.3 43.0 44.7
Female sterilization 100.0 0.0 4.9 41.6 53.4
Periodic abstinence/withdrawal 100.0 0.0 23.0 55.9 21.1
Others 100.0 0.0 25.1 46.3 28.6
Number of children surviving

55
4.1.5. Reasons of no used contraceptive methods
According to data of the 2015 PCS, among women who are currently not using any contraceptive method, the reason of “want more children” accounts for 42.4% (declining 4.1 percent points as compared to that of 2013), and the reason of “being pregnant” was 14.1%. Among other reasons (accounting for 43.5% in total), no use of contraception due to “menopause” comprised a relative large proportion (18.4%), for other remainder reasons were 25.1%.
Table 4.5: Rate of no used contraceptive method by three main reasons in the
2001-2015 period
Unit: Percentage
Main reason 2001 2002 2004 2005 2007 2008 2010 2011 2012 2013 2015
Total 100.0 100.0 100.0 100.0 100.0 100.0 100.0 100.0 100.0 100.0 100.0
Being pregnant 12.4 12.8 11.0 11.8 14.2 15.0 12.9 14.2 16.8 13.6 14.1
Want more children 35.9 36.7 38.4 39.2 42.3 42.0 42.9 45.0 43.7 46.5 42.4
Others 51.7 50.5 50.7 49.0 43.5 43.0 44.2 40.8 39.5 39.9 43.5
Source: 2001-2013: General Statistics Office. "1/4/2013 PCS: Major findings". 12-2013. Table 4.5. Page 28. As shown in Table 4.6, the rate of no used contraceptive method in urban
area was 3.4 percentage points higher than that of rural area (26.6% compared to 23.2%). The rate of no used contraceptive method due to the causes including “want more children” and “difficult to get pregnant” or “menopausal” differs considerably between urban and rural areas. For other remaining reasons, there is no difference between urban area and rural area.
Taking consideration on the correlation between the rate of no used contraceptive method and women’s age, there are two opposite tendencies. Young women have the higher rate of no used contraceptive method classified by the reasons of “being pregnant” or “want more children”. While, contrarily, with other reasons such as “difficult to get pregnant/menopausal” or “weak health”, their rate of no used contraceptive method is low at young ages and increases gradually by women’s age.
The relationship between rate of no used contraceptive method and number of children surviving is also found similar to that between the rate of no used contraceptive method and women’ age group. The rate of no used contraceptive method decreases gradually while number of children surviving increases for the categories of “being pregnant” and “want more children”. In contrast, this rate increases along with number of children surviving for other reasons, namely “difficult to get pregnant/menopausal” or “weak health”.

56
Table 4.6: Rate of no used contraceptive method by reason of non-use, urban/rural residence, age group and number of children surviving, 1/4/2015
Unit: Percentage
By reasons of no used contraceptive method
Characteristics
Tot
al
Bei
ng p
regn
ant
Wan
t mor
e ch
ildr
en
Una
war
enes
s
Opp
osed
by
othe
rs
Cos
tly
Hav
e ef
fect
s af
ter
usin
g co
ntra
cept
ives
Wea
k he
alth
Dif
ficu
lt to
get
pr
egna
nt/ m
enop
ausa
l
Not
ava
ilab
le
cont
race
ptio
n
Oth
ers
Not
sta
ted
Entire country 24.3 3.4 10.2 0.2 0.2 0.0 0.6 1.7 4.5 0.2 3.1 0.1
Urban 26.6 3.3 11.8 0.2 0.2 0.0 0.5 1.9 5.2 0.3 3.1 0.1
Rural 23.2 3.5 9.5 0.3 0.2 0.0 0.6 1.6 4.1 0.1 3.2 0.1
Women’s age group 15-19 62.9 14.8 31.9 0.9 0.2 0.0 0.2 1.7 0.8 0.2 11.6 0.6
20-24 45.7 10.4 24.1 0.3 0.2 0.0 0.3 1.4 1.1 0.3 7.4 0.2
25-29 31.4 6.5 16.7 0.2 0.2 0.0 0.5 1.1 0.8 0.2 5.0 0.1
30-34 20.7 3.6 11.1 0.2 0.2 0.0 0.6 1.0 0.8 0.2 2.9 0.1
35-39 13.9 1.2 6.8 0.2 0.3 0.0 0.6 1.5 1.4 0.1 1.6 0.1
40-44 14.0 0.3 4.4 0.3 0.2 0.0 0.8 2.0 4.4 0.2 1.3 0.1
45-49 27.8 0.3 1.5 0.2 0.1 0.0 0.6 3.3 19.7 0.2 1.8 0.1
Number of children surviving 0 child 79.1 11.9 55.9 0.0 0.5 0.0 0.0 3.1 4.7 0.0 2.4 0.5
1 child 37.6 6.2 20.2 0.2 0.1 0.0 0.4 1.8 3.4 0.2 4.8 0.1
2 children 12.0 0.8 1.8 0.2 0.2 0.0 0.7 1.6 4.1 0.2 2.5 0.1
3 children 14.1 0.5 1.0 0.3 0.2 0.0 0.7 2.0 6.6 0.2 2.3 0.1
4 children 17.0 0.4 1.0 0.6 0.4 0.0 0.8 2.7 8.2 0.4 2.5 0.0
5 children + 23.4 0.7 1.3 3.0 0.7 0.0 0.9 3.2 11.0 0.4 2.1 0.1
4.2. Reproductive health care
4.2.1. Induced abortion and menstrual regulation
In Viet Nam, the abortion and menstrual regulation can be conducted both at public and private health facilities. Similar to the contraceptive use, the information on abortion and menstrual regulation has been collected only for currently married women aged 15-49.
According to the data in Table 4.7, there is an inconsiderable difference in the rate of currently married women aged 15-49 who have had abortion or menstrual regulation within 12 months preceding the survey time-point between

57
urban and rural areas. In 2015, the urban rate was 0.42% while that of rural areas was 0.41%. Compared to 2012, the prevalence of induced abortion and menstrual regulation has decreased in recent years. However, this rate had increasing slightly comparison with 2013. In the whole country, the pace of decline in 2015 is 0.1 percent points higher as compared to that of 2013. This is similar to that for both urban and rural areas, (0.02 percent points and 0.15 percent points, respectively).
Table 4.7: Rate of abortion and menstrual regulation by urban/rural residence
in the 2001-2015 period Unit: Percentage
Survey year Entire country Urban Rural
2001 1.3 1.7 1.2
2002 1.1 1.1 1.1
2003 1.7 1.9 1.7
2004 1.2 1.3 1.2
2005 1.0 1.0 1.0
2006 1.1 1.4 0.9
2007 0.7 0.6 0.8
2008 1.0 1.1 0.9
2010 0.8 0.8 0.8
2011 0.6 0.6 0.6
2012 0.5 0.5 0.5
2013 0.3 0.4 0.3
2015 0.4 0.4 0.4 Source: 2001-2013: General Statistics Office. "1/4/2013 PCS: Major findings". 12-2013. Table 4.7. Page 30.
The data in Table 4.8 shows that the Northern Midlands and Mountains is the region with the highest rate of abortion and menstrual regulation (0.75%), followed by the Red River Delta (0.63%). The Central Highlands and the Southeast have the lowest rate of 0.21%. Notably, this rate tend to rise in most regions of the country in 2015 compared to 2013 (except the Southeast decreased 0.01 percentage points), this is opposite with the trend in decreasing rate of abortion/menstrual regulation maintained over the years from 2007 to 2012.
In general, the Northern Midlands and Mountains and the Red River Delta are considered as the regions occupying the permanently higher rate of abortion/menstrual regulation in comparison with that of remaining regions.

58
Table 4.8: Rate of abortion and menstrual regulation by urban/rural residence and socio-economic region in the 2007-2015 periods
Unit: Percentage
Residence/socio-economic region 2007 2008 2010 2011 2012 2013 2015
Entire country 0.7 1.0 0.79 0.59 0.54 0.31 0.41
Urban 0.6 1.1 0.82 0.63 0.54 0.40 0.42
Rural 0.8 0.9 0.78 0.58 0.54 0.26 0.41
Socio-economic region
Northern Midlands and Mountains 1.4 1.5 1.25 0.89 0.81 0.51 0.75
Red River Delta 1.3 1.9 1.11 0.98 0.99 0.46 0.63
North and South Central Coast 0.3 0.4 0.51 0.39 0.43 0.22 0.26
Central Highlands 0.1 0.3 0.50 0.28 0.14 0.13 0.21
Southeast 0.4 0.8 0.53 0.39 0.30 0.22 0.21
Mekong River Delta 0.4 0.5 0.71 0.42 0.30 0.20 0.31
Source: 2001-2013: General Statistics Office. "1/4/2013 PCS: Major findings". 12-2013. Table 4.8. Page 31.
According to the data in Table 4.9, the main reason that currently married women aged 15-49 who have had abortion or menstrual regulation within 12 months preceding the survey time-point is unwanted pregnancy (64.4%). This is similar to that for both urban and rural areas. Over 60% of women aged 25 and older abortion and menstrual regulation was primarily the reason "unwanted pregnancies". A large proportion of women with this problem in the above are women that have 2 children or 3 or more children do not want more children again. The rate of women has had abortion or menstrual regulation "due to the health of the fetus", primarily occurs in young age group 15-19 years (52.3%).

59
Table 4.9: Rate of currently married women aged 15-49 who have had abortion or menstrual regulation by main reason within 12 months prior to the survey, 1/4/2015
Unit: Percentage By main reason of abortion or menstrual regulation
Characteristics Total Health of mother
Health of fetus
Unwanted pregnancies Other
Entire country 100.0 11.0 19.8 64.4 4.8 Urban 100.0 10.2 16.1 65.6 8.1
Rural 100.0 11.4 21.6 63.9 3.1
Women’s age group
15-19 100.0 20.9 52.3 26.8 0.0 20-24 100.0 15.9 27.4 51.2 5.5
25-29 100.0 7.7 20.0 66.9 5.4 30-34 100.0 9.3 17.2 66.6 6.9 35-39 100.0 13.1 14.8 67.5 4.6
40-44 100.0 8.7 25.2 65.4 0.7 45-49 100.0 13.9 10.1 76.0 0.0
Number of children surviving 0 child 100.0 0.0 100.0 0.0 0.0
1 child 100.0 17.5 29.6 43.3 9.6 2 children 100.0 6.2 11.9 80.0 1.9 3 children + 100.0 5.7 14.2 78.5 1.6
4.2.2. Situation on obstetrical care
In Viet Nam, the State encourages, facilitates all pregnant women need to have the periodic and regular obstetrical check-up. In the 2015 PCS, the indicator of obstetrical check-up for the last birth collected information for women 15-49 years old had a baby from April 2013 to the end of March 2015.
The rate of obstetrical check-up at least one time for the last birth was 95.3%. This rate in rural area is 3.0 percent points lower than that of urban area (94.4% against 97.7%, respectively).
The rate of at least one time obstetrical check-up for the last birth varies considerably among regions. The differential between the highest rate (occupied by the Red River Delta) and the lowest rate (found in the Northern Midlands and Mountains) is 10.7 percent points.
Table 4.10 indicates that, as compared to 2006, the rate of at least one time obstetrical check-up for the last birth in the whole country has increased

60
6.2 percent points. In which the pace of increase for rural areas is larger than that of urban area (7.8 percent points in rural areas versus 1.3 percent points in urban areas, respectively) even the fact that this rate of obstetrical checkup in urban area is higher than that of rural area (higher than 3.0 percent points). During the period of 2006-2015, the growth level of the obstetrical check-up rate is much different among socio-economic regions. The Central Highlands is the region with the largest increase (14.3 percent points), while that of the Southeast decrease 0.1 percent points as compared to that of 2006.
Considering the rate of obstetrical check up for 3 times or more in the last birth shows that this rate is the highest in the Red River Delta (93.7%) and the lowest, one again in the Northern Midlands and Mountains (72.1%). The difference on this rate is quite large between urban and rural areas as well as among socio-economic regions. The urban/rural difference is 9.8 percent points (whereas the gap on checkup at least one time stands at 3.0 percent points). The difference between the highest rate (occupied by the Red River Delta) and the lowest rate (belonging to the Northern Midlands and Mountain) is 21.6 percent points. During the period of 2006-2015, the rate of obstetrical checkup for at least 3 times has increased significantly in both urban and rural areas as well as social-economic regions.
Table 4.10: Rate of obstetrical check up for the last birth by times of checkup, urban/rural residence and socio-economic region, 1/4/2006 and 1/4/2015
Unit: Percentage
1/4/2006 1/4/2015 Percent change
2006-2015
Residence/socio-economic region 1 time and
more
3 times and
more
1 time and
more
3 times and
more
1 time and
more
3 times and
more
Entire country 89.1 60.3 95.3 86.3 6.2 26.0
Urban 96.1 78.4 97.4 93.0 1.3 14.6
Rural 86.6 53.8 94.4 83.2 7.8 29.4
Socio-economic region
Northern Midlands and Mountains 73.9 40.8 87.5 72.1 13.6 31.3
Red River Delta 92.3 63.8 98.2 93.7 5.9 29.9
North and South Central Coast 89.8 56.0 97.0 86.0 7.2 30.0
Central Highlands 78.2 37.6 92.5 73.0 14.3 35.4
Southeast 96.6 84.6 96.5 91.6 -0.1 7.0
Mekong River Delta 93.8 65.4 96.7 90.4 2.9 25.0

61
CHAPTER 5: FERTILITY
Fertility is regarded as one important input for developing and implementing various policies especially in term of population and family planning. The fertility related indicators have always been paid attentions from policy makers, managers and researchers. In Vietnam, as the result of limitations on birth registration as well as on referring to the records of birth registration, calculating and estimating fertility indicators are based from the survey results. This chapter will present the level of change and trend in fertility based on collected information on number of births of women aged 15-49 within the last 12 months prior the time point of survey. The data on births within the last 12 months prior the time point of survey may suffer from variety of errors causing the under-estimation on fertility rates. In order to detect this limitation, the indirect estimation techniques will be applied.
5.1. Total fertility rate
Total fertility rate (TFR)4 is one of key measurements reflecting the fertility. TFR is usually estimated indirectly via the techniques Trussell P/F assuming that number of births of women aged 15-49 within 12 months prior the survey may be under-reported as compared to the reality. This omission often happens to those cases that children were died or far away their parents.
Figure 5.1 described the change in TFR of Viet Nam in the 2001-2015 periods. TFR tended declining from 2.23 children/woman in 2004 to 1.99 children/woman in 2011, then increasing during the 2012-2015 periods, from 2.05 children/woman to 2.10 children/woman. This revealed that giving two births became the popular trend. Even though in the early 21st century, (2001-2004), TFR ranged unstably and was above the fertility replacement but since 2005 to now, TFR tended declining and was below the fertility replacement in 20065. The TFR deeply decreasing to below the fertility replacement is regarded as the important achievement of the implementation on the first target of Population and Family Planning Strategy during the 2001-2010 periods6.
4 Total fertility rate (TFR) is defined as average number of live births that a woman would have during her whole life, if during the reproductive period, her age specific birth rates were similar to the age specific birth rate observed in the reference period, usually within the last 12 months prior the survey. 5 “The fertility replacement” is denoted as the fertility level that a cohort of women in average, would have exactly enough number of female children to “replace” them for the population reproduction. 6 Target 1 of Population Strategy in the 2001-2010 period: “Maintaining stably the trend on fertility decline in order to achieve the fertility replacement for the whole country as of 2005 in general, for the remote, isolated and poor areas as of 2010 in particular, aiming at the population size, structure and distribution appropriately with the social economic development as of 2010”.

62
Figure 5.1: Total fertility rate, in the 2001-2015 periods
Table 5.1 indicated that the TFR of Viet Nam was lower than the average TFR of Southeast Asian countries (standing at 2.4 children/woman). The TFR of Viet Nam was just higher than that of four regional countries, namely Brunei (1.6 children/woman), Malaysia (2.0 children/woman), Singapore (1.3 children/women), and Thailand (1.6 children/woman), but much lower than that of remaining countries in the Southeast Asian region.
Table 5.1: Total fertility rate of Southeast Asian Countries, 2015
Unit: Children/Woman
Country TFR Country TFR
Southeast Asia 2.4 Myanmar 2.3
Brunei 1.6 Philippine 2.9
Cambodia 2.7 Singapore 1.3
Indonesia 2.6 Thailand 1.6
Laos 3.1 East Timor 5.7
Malaysia 2.0 Viet Nam 2.1
Source: The 2015 World Population Datasheet, at http://www.prb.org.
The TFR of Viet Nam classified by urban/rural in the 2001-2015 periods was presented in Table 5.2. The TFR of urban areas in 2015 stood at 1.82 children/woman, lower than that of rural areas (about 2.25 children/woman). The differential can be explained by that urban couples could access to sources of
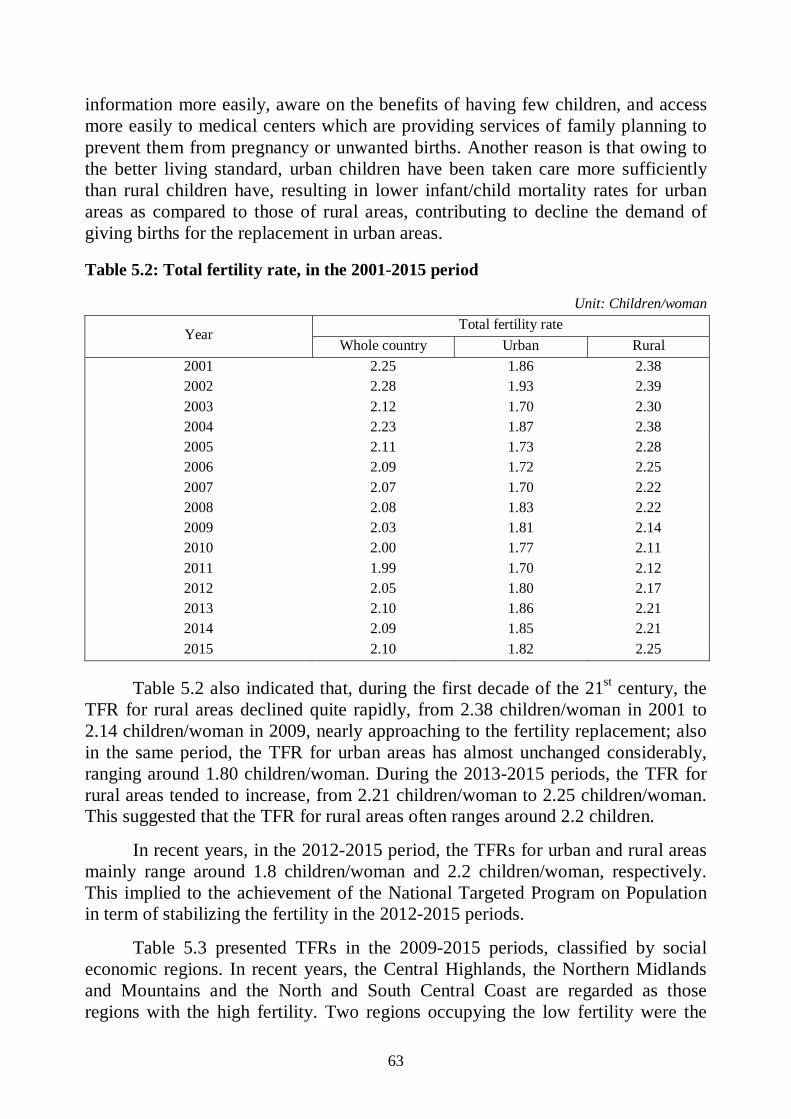
63
information more easily, aware on the benefits of having few children, and access more easily to medical centers which are providing services of family planning to prevent them from pregnancy or unwanted births. Another reason is that owing to the better living standard, urban children have been taken care more sufficiently than rural children have, resulting in lower infant/child mortality rates for urban areas as compared to those of rural areas, contributing to decline the demand of giving births for the replacement in urban areas.
Table 5.2: Total fertility rate, in the 2001-2015 period
Unit: Children/woman
Total fertility rate Year
Whole country Urban Rural 2001 2.25 1.86 2.38 2002 2.28 1.93 2.39 2003 2.12 1.70 2.30 2004 2.23 1.87 2.38 2005 2.11 1.73 2.28 2006 2.09 1.72 2.25 2007 2.07 1.70 2.22 2008 2.08 1.83 2.22 2009 2.03 1.81 2.14 2010 2.00 1.77 2.11 2011 1.99 1.70 2.12 2012 2.05 1.80 2.17 2013 2.10 1.86 2.21 2014 2.09 1.85 2.21 2015 2.10 1.82 2.25
Table 5.2 also indicated that, during the first decade of the 21st century, the TFR for rural areas declined quite rapidly, from 2.38 children/woman in 2001 to 2.14 children/woman in 2009, nearly approaching to the fertility replacement; also in the same period, the TFR for urban areas has almost unchanged considerably, ranging around 1.80 children/woman. During the 2013-2015 periods, the TFR for rural areas tended to increase, from 2.21 children/woman to 2.25 children/woman. This suggested that the TFR for rural areas often ranges around 2.2 children.
In recent years, in the 2012-2015 period, the TFRs for urban and rural areas mainly range around 1.8 children/woman and 2.2 children/woman, respectively. This implied to the achievement of the National Targeted Program on Population in term of stabilizing the fertility in the 2012-2015 periods.
Table 5.3 presented TFRs in the 2009-2015 periods, classified by social economic regions. In recent years, the Central Highlands, the Northern Midlands and Mountains and the North and South Central Coast are regarded as those regions with the high fertility. Two regions occupying the low fertility were the

64
Southeast and the Mekong River Delta. The gap on social economic development was considered as the main cause of fertility differential among regions.
Although the Central Highlands always occupies the high fertility, it was glad in the 2009-2015 periods that its TFR continuously dropped sharply, from 2.65 children/woman in 2009 to just 2.26 children/woman in 2015. This proved the achievement of the Population and Reproductive Health Strategy in the 2011-2020 periods as well as the National Population Targeted Program in the 2012-2015 periods.
Table 5.3: Total fertility rate classified by social economic region, in the 2009-2015
period Unit: children per woman
Social economic region 2009 2010 2011 2012 2013 2014 2015
Whole country 2.03 2.00 1.99 2.05 2.10 2.09 2.10
Northern Midlands and Mountains 2.24 2.22 2.21 2.31 2.18 2.56 2.69
Red River Delta 2.11 2.04 2.06 2.11 2.11 2.30 2.23
North and South Central Coast 2.21 2.21 2.21 2.32 2.37 2.31 2.34
Central Highlands 2.65 2.63 2.58 2.43 2.49 2.30 2.26
Southeast 1.69 1.68 1.59 1.57 1.83 1.56 1.63
Mekong River Delta 1.84 1.80 1.80 1.92 1.92 1.84 1.76
5.2. The fertility differential by provinces/cities
63 provinces/cities throughout the country can be divided into 4 groups of different fertility: namely under the fertility replacement (TFR of less than 2.0 children/woman), around the fertility replacement (TFR ranging from 2.0 to less than 2.2 children/woman), above the fertility replacement (TFR ranging from 2.2 to less than 2.5 children/woman) and the high fertility (TFR of 2.5 children/woman or more).
The first group (TFR of less than 2.0 children/woman) consists of 18 provinces. Most of them belong to the Southeast and the Mekong River Delta. Some provinces are in the Red River Delta. Only one province - Lam Dong of the Central Highlands was classified into this group. Some provinces/cities occupied the very low TFRs, much lower than the fertility replacement, typically: Ho Chi Minh City (1.45 children/woman), Ba Ria - Vung Tau (1.56 children/woman).
12 provinces occupying the fertility ranging around the fertility replacement were classified into the second group, including some provinces in the Red River Delta, typically: Ha Noi (2.04), Hai Phong (2.02), Hai Duong (2.00). This group

65
also included some provinces of the North and South Central Coast such as Da Nang (2.13), Binh Dinh (2.14) and excluded provinces in the Central Highlands.
The third group consisted of 14 provinces. Most of them belong to the Central Highlands such as: Kon Tum (2.49), Gia Lai (2.45), Dak Lak (2.22), Dak Nong (2.36). Some provinces are located in the Red River Delta. Lao Cai and Bac Kan were the only two provinces of the Northern Midlands and Mountains classified into this group that included provinces with the relatively high fertility (2.26 and 2.42, respectively).
The fourth group defined as the group of provinces having the highest fertility (from 2.5 children/woman or more) included 19 provinces. Most provinces are in the Northern Midlands and Mountains while some other provinces belong to the North and South Central Coast. There were no provinces of the Central Highlands, the Southeast and the Mekong River Delta classified into this group.
At the national wide, the province occupying the highest fertility was Lai Chau (3.11 children/woman), while the province with the lowest fertility was Ho Chi Minh City (1.45 children/woman). The reason could be that the couples living in Ho Chi Minh City may access contraceptive methods more conveniently and tended to have fewer children than the couples residing in other regions.
5.3. Age specific fertility rate
Figure 5.2 described the Age Specific Fertility Rate (ASFR)7 of Viet Nam in the 2015 survey classified by urban/rural residence. Although having the similar shape of bell, the curve line on the right presenting for the urban fertility pattern was not only lower but also “longer delay” as compared to that of rural fertility pattern, implying that urban women have given births later and had fewer children than rural women have. In urban area, the highest fertility level belonged to women aged 25-29 (standing at 126 live births/1000 women). In rural area, that was for women aged 20-24 (143 live births/1000 women). As compared to the fertility level of urban women aged 20-24, that of rural areas was nearly twice times higher (143 versus 80, respectively). This can be explained by that rural women have not had so many opportunities of higher education as urban women, resulting in getting marriages and giving births earlier.
7 Age specific birth rate (ASFR)7 indicates how many live births given in average by 1000 women at a specific age (or age group) in the reference period, usually in the last 12 months prior the time point of survey.

66
Figure 5.2: Age Specific Fertility Rate (ASFR)
classified by urban/rural residence, 1/4/2015
5.4. Crude birth rate
In the reality, Crude Birth Rate (CBR)8 is usually used to calculate the natural growth rate of the population. Similarly to TFR, due to the birth under-reporting, the CBR is usually estimated indirectly by the way of multiplying the CBR calculated directly from the survey’s dataset with the Trussell P/F adjustment factor.
Table 5.4 presented the CBRs of Viet Nam in the 2005-2015 periods, classified by urban and rural areas. The CBR of Viet Nam in 2015 was 16.2 live births/1000 people in which, that of urban areas was 15.3 live births/1000 people, lower as compared to that of rural areas (16.7 live births/1000 people).
8 Crude birth rate (CBR) is denoted as average number of live births within the last 12 months prior the time point of survey to 1.000 people as of the time point of survey. It is callsed as “crude”, because this rate is derived from the whole population (that is, including those ones both able and unable to give births).

67
Table 5.4: Crude birth rate classified by urban/rural in the 2005-2015 period
Unit: Live births/1000 people
Year Whole country Urban Rural
2005 18.6 15.6 19.9 2006 17.4 15.3 18.2 2007 16.9 15.9 17.4 2008 16.7 15.8 17.3 2009 17.6 17.3 17.8 2010 17.1 16.4 17.4 2011 16.6 15.3 17.2 2012 16.9 16.0 17.4 2013 17.0 16.2 17.5 2014 17.2 16.7 17.5 2015 16.2 15.3 16.7
However, it is notable that, CBR is an indicator mainly used to calculate the population growth rate rather than to evaluate the change in the fertility pattern as TFR, because of being impacted by both the fertility level and the age and sex structures of the population. For two population groups with the similar age specific fertility rate, then the one suffering the higher proportion of reproductive women will have the higher CBR. So, when comparing CBR of two or more different population groups or of one population group in different periods of time, it is required to omit the differential on age structure among these population groups by the way of using the standardization method.
Table 5.5 presented the standardized CBR of urban/rural areas and social economic region by the age structure of whole country’s women in 2009 (that is, considering the whole country’s women aged 15-49 derived from the completed result of the 2009 Census as the standard one). The result showed obviously that after omitting the change in age structure, the CBR in 2015 increased by 0.7 thousand points as compared to that of 2009, equivalent to 18.8 live births/1000 people versus 18.1 live births/1000 people.
Like TFR, CBRs of social economic regions were different. The Mekong River Delta was the region occupying the lowest fertility throughout the country (15.8 live births/1000 people). The Northern Midlands and Mountains was regarded as the one with the highest fertility (standing at 24.2 live births/1000 people). The large differential in fertility between the Northern Midlands and Mountains and the Mekong River Delta can be identified (8.4 thousand points of differential). The reason was due to the strong migration of reproductive population group, resulting in the uneven age and sex distribution among regions.

68
Table 5.5: Unstandardized CBR and Standardized CBR by the age structure of the whole country’s women in 2009, classified by urban/rural residence and social economic region, 1/4/2009 and 1/4/2015
Unit: Live births/1000 people
1/4/2009 1/4/2015 Residential place/
Social economic region Unstandardized CBR
Standardized CBR
Unstandardized CBR
Standardized CBR
Whole country 17.6 18.1 16.2 18.8
Urban 17.3 15.8 15.3 17.9
Rural 17.8 19.3 16.7 19.2
Social economic region
Northern Midlands and Mountains 19.6 20.5 20.9 24.2
Red River Delta 17.6 18.8 16.2 19.3
North and South Central Coast 16.9 19.6 16.9 18.3
Central Highlands 21.9 23.7 17.3 19.0
Southeast 17.8 14.7 15.1 17.4
Mekong River Delta 16.0 16.4 12.9 15.8
5.5. Sex ratio at birth
The imbalance on sex ratio at birth will result to the surplus of males and the shortage of females in the future. This will not only affect to the individual’s life, family, and clan but also impact negatively to the people and the sustainable development of the country. The sudden increase on Sex Ratio at Birth (SRB)9 of Viet Nam in recent years has become an utmost attention of policy makers, mass media agencies as well as domestic and international researchers.
Table 5.6 introduced the SRBs of Viet Nam since 1999 to now. The data showed that, during the 1999-2005 periods, the trend of change in SRB of Viet Nam was not clear and seemed to range from 104 to 109 boys/100 girls. However, since 2006, the SRB of Viet Nam has started increasing considerably. In the 2015 survey, the SRB maintained at the quite high level of 112.8 boys/100 girls. Since 2009 to now, even though many warnings on the implications of sex imbalance at birth were given, but this situation has unlikely been improved.
9 Sex ratio at birth (SRB) is defined by number of male births to 100 female births within a reporting period, usually one calendar year. The ratio often ranges from 104 to 106/100 and generally stable during the period of time and geographic space among continents, countries, regions and races. Whatever of considerable change in sex ratio out of the normally biological space always reveals the purpose interferes in some extent and this will affect to the natural imbalance and threat to the stability of global population.

69
Table 5.6: Sex ratio at birth, in the 1999-2015 periods
Unit: Number of boys/100 girls
Year Sex ratio at birth Year Sex ratio at birth
1999 107.0 2008 112.1
2000 107.3 2009 110.5
2001 109.0 2010 111.2
2002 107.0 2011 111.9
2003 104.0 2012 112.3
2004 108.0 2013 113.8
2005 106.0 2014 112.2
2006 109.8 2015 112.8
2007 111.6
The sex selection before giving birth reflects the extreme gender inequality. Viet Nam’s and international researchers have also pointed out the future implications resulting from the current sex imbalance. Obviously, the shortage of girls reported in the recent period in variety of countries will cause the shortage of women at all age groups in the future. The population structure in coming decades will be highlighted by the current sex selection, with the dominant males in the long-term period. According to the social scientists, the main impact of sex imbalance will connect to the process of family formation and structure, especially in the marriage system. Young males will be over-numbered as compared to females as the result of the declining proportion of females in the same generation. Consequently, they may have to meet seriously difficulties of partner seeking. The marriage delay of males or increasing the proportion of single people may happen in the future due to the shortage of women at nuptial ages. This will re-impact to the family system in the future, especially when in the reality, these societies have followed the paternal line of descent (bearing the father’s surname) and in the past, majority of males tended to get marriage.
Facing with the above doubtable fact, the Government of Viet Nam has paid more attention on the sex imbalance at birth. The sex selection prior birth is regarded as a direct cause of the sex imbalance at birth. This is an illegal behavior if based on the 2003 Population Law and Decree No 114/2006/ND-CP issued on 03rd October 2006 by the Government. This matter was one again emphasized in the National Strategy on Population and Reproductive Health in the 2011-2020 period, and other relevant policies and documents. Therefore, the statistics tracking to the change in sex ratio at birth is necessary to set up the in time interferes of policies and programs.

70
5.6. Rate of women aged 15-49 giving the third birth or more
Table 5.7 presented the rate of women aged 15-49 giving the third birth or more in Viet Nam in the 2006-2015 periods, classified by urban and rural areas. The data showed that, during the last period of time, the rate of women giving the third birth or more throughout the country has declined gradually year by year, from 18.5% in 2006 to 15.8% in 2015.
In recent years, the rate of urban women giving the third birth has changed inconsiderably while this rate of rural women has declined. This trend has contributed to the decline of giving the third birth throughout the country, creating the chance in population stability, relieving the burden of young generation, and giving advantages to Viet Nam in the implementation of decent and sustainable economic development goals.
The trend of giving the third birth decreased sharply in the 2006-2012 period, from 18.5% to 14.2% and tended to increase up in the 2013-2015 periods, from 14.3% to 15.8%. This result was derived partly from the emendation of Population Law as well as the successive implementation on the target of the Population and Reproductive Health Strategy in the 2011-2020 periods, aiming to curb the population aging predicted in the future.
Table 5.7: Rate of women aged 15-49 giving the third birth or more, classified by urban/rural areas, in the 2006-2015 periods
Unit: Percentage
Residential place 2006 2007 2008 2009 2010 2011 2012 2013 2014 2015
Whole country 18.5 16.7 16.9 16.1 15.1 14.7 14.2 14.3 14.5 15.8
Urban 10.0 9.0 9.7 9.3 9.5 9.8 9.6 9.9 9.2 10.8
Rural 21.4 19.3 19.6 18.9 17.1 16.5 16.3 16.4 16.9 18.0
Figure 5.3 indicated that there was a negative relationship between the level
of education attainment and the rate of women giving the third birth or more: the higher educational level, the lower rate of women giving the third birth or more. The 2015 survey results showed that the percentage rate of women giving the third birth or more for those women who have never attended school was the highest (46.2%); decreased gradually to 32.4% for those women with the under-primary educational level; 24.3% for those women who have graduated from primary schools; and tended declining for those women with the high educational level. In particularly, this rate was the lowest (just about 4.8%) for the group of women who have graduated from colleges or universities.

71
Figure 5.3: Rate of women aged 15-49 giving the third birth or more classified
by the highest educational attainment, 1/4/2015
Table 5.8 described the difference on rate of women giving the third birth or more classified by regions. The data showed that the rate of women aged 15-49 giving the third birth or more was the highest in the Central Highlands (24.5%), followed by the North and South Central Coast (19.3%). The Mekong River Delta and the Southeast were the regions occupying the lowest rate of women aged 15-49 giving the third birth or more (10.3% and 10.5%, respectively); they were also the two regions suffering the lowest TFRs throughout the country. In the Central Highlands, known as the residential place of minority ethnic groups, the accessibility of contraceptive methods as well as of media communication on family planning was limited. This may be one reason of the highest rate of women aged 15-49 giving the third birth or more there.

72
Table 5.8: Rate of women aged 15-49 giving the third birth or more, classified by urban/rural and social economic region, 1/4/2015
Unit: Percentage
Residential place/Social economic region Rate of women aged 15-49 giving
the third birth or more
Whole country 15.8
Urban 10.8
Rural 18.0
Social economic region
Northern Midlands and Mountains 15.1
Red River Delta 17.9
North and South Central Coast 19.3
Central Highlands 24.5
Southeast 10.5
Mekong River Delta 10.3
5.7. Knowing the sex of foetus before delivery
The data in Table 5.9 indicated that majority of mothers know the sex of foetus before delivery when their foetus are 15 to 28 weeks old (74.3%). Number of mothers knowing about the sex of foetus before delivery when the foetus is 28 weeks old or more, constituted to the smallest share (1.8%). This suggested that during the period of pregnancy, most women want to know the sex of foetus early. For the foetus under 15 weeks old, the Red River Delta was the region occupying the highest proportion of women who know the sex of foetus throughout the country (43.5%), and the lowest one was for the Mekong River Delta (3.9%). The reason was that the Red River Delta has had more advantages of medical development than the Mekong River Delta.

73
Table 5.9: Rate of women aged 15-49 knowing the sex of last foetus classified by number of weeks of foetus, 1/4/2015
Unit: Percentage
Residential place/Social economic region Under 15 weeks From 15 weeks
to 28 weeks More than 28 weeks
Whole country 23.9 74.3 1.8
Urban 21.8 76.4 1.8
Rural 24.8 73.4 1.7
Social economic region
Northern Midlands and Mountains 33.2 64.5 2.3
Red River Delta 43.5 55.9 0.6
North and South Central Coast 26.7 71.2 2.1
Central Highlands 12.4 85.3 2.3
Southeast 8.0 89.8 2.2
Mekong River Delta 3.9 94.3 1.8
Figure 5.4 indicated that most women wish to give birth with regardless of
boy or girl. However, this rate reached to the peak value of only 68.6% (occupied by the Southeast) and to the lowest one of 58.9% (occupied by the North and South Central Coast). This proved that more and more women prefer giving either male or female birth, instead of whatever one as that in the past.
The preference of male birth tended to be more popular than that of female birth. Particularly, the highest proportion of women who want to give male birth was for the Red River Delta (30.8%), followed by the North and South Central Coast (29.8%), the Northern Midlands and Mountains (29.2%), whereas the lowest one belonged to the Southeast (19.4%). This revealed to the conception as well as the preference of male birth from the reproductive women. This is regarded as a huge challenge of policy makers in Viet Nam to compile relevant policies, contributing to change in the conception as well as to minimize the sex imbalance at birth in Viet Nam.

74
Figure 5.4: Distribution of women aged 15-49 giving birth within the last 24 months prior the survey classified by mother’s wish on sex of foetus before delivery,
1/4/2015
Most women know the sex of foetus before delivery via the ultrasound method, regarded as an effective and modern diagnosis tool. At the national level, urban/rural and social economic region, the rate of women aged 15-49 giving birth within the last 24 months prior the survey and knowing the sex of foetus via the ultrasound method was more than 97%. While the method of “feel the pulse” or “guess” or “others” accounted for a small share.
Table 5.10: Distribution of women aged 15-49 giving birth within the last 24 months prior the survey, classified by method of knowing the sex of foetus, 1/4/2015
Unit: Percentage
Residential place /Social economic region Ultrasound Feeling the pulse Guessing Others
Whole country 98.1 0.8 1.0 0.1 Urban 97.7 1.1 1.2 0.1 Rural 98.3 0.7 0.9 0.1
Social economic region Northern Midlands and Mountains 98.3 0.7 1.0 0.1 Red River Delta 97.4 1.4 1.2 0.1 North and South Central Coast 98.3 0.5 1.0 0.2 Central Highlands 97.8 1.3 0.9 0.0 Southeast 97.8 0.8 1.1 0.2 Mekong River Delta 99.0 0.4 0.6 0.0

75
CHAPTER 6: MORTALITY
In term of demography, fertility and mortality are considered as two key components of population growth. The current population size and structures of ages and sex are derived from the results of fertility and mortality in the past. The future population size and structures of ages and sex will be determined by the current fertility and mortality. As the fertility was presented in Chapter 5, this chapter will only mention on the mortality.
According to the World Health Organization (WHO), the mortality (or death) can be defined as the permanent loss of all expressions of life at some particular point of time, after the live birth. Like that, the death is occurred only after the event of live birth. A long and healthy life is always regarded as the natural desire of human beings and as an undeniable foundation. However, decreasing the mortality is not an easy task as result of much depending on the environmental, economic, cultural, social, technology… factors. Therefore, the mortality is always considered as the important topic of research for variety of relevant scientific branches, contributing to make policies sufficiently to the improvement on the human beings’ life.
Annual population change and family planning surveys collect information on the deceased, consisting of: age at death, sex, causes of death in order to support for evaluating the mortality in Viet Nam. However, number of deaths is under-reported considerably as compared to the reality due to: (i) the survey information on the deceased could be only collected indirectly (via their household members, local officials, or medical staffs...) and often recalled; (ii) the death is regarded as the sensitive event that the deceased’s relatives don’t want to recall; (iii) the death is the relatively rare event as compared to other demographic events such as birth, migration…. Hence, the mortality estimates will be lower than the reality if some deaths are omitted, as result of making considerable errors. Therefore, the mortality statistics in Viet Nam are not calculated directly from the survey results but based on them to modify and estimate via United Nation’s recommended indirect techniques.
In order to evaluate the completeness of reported deaths for the whole population, the recommended method is the General Growth Balance - GGB method. The basic principle of this method is that evaluating the completeness of reported deaths will be implemented via comparing the age distribution of current population (alive) to the age distribution of the deceased (reported). The method is based on three main assumptions: (1) closed population, that is affected little by migration; (2) the survey coverage of the population and number of the deceased by age is unchanged; (3) information on age of the population and the deceased is

76
accurate. The result showed that the completeness of reporting for males was higher than that for females (48% versus 36%, respectively). It means that 52% of male deaths and 64% of female deaths was not reported. This is also used as a basic for evaluating the mortality within the last 12 months (from 1/4/2014 to the end of 31/3/2015) in Viet Nam.
Omitting events of death usually occurs in the surveys conducted to collect the mortality information. Hence, the results of directly calculating mortality indicators will be lower as compared to the reality. By that, demographers have developed indirect estimation techniques for mortality. However, using these indirect techniques also require the specific accuracy of survey’s dataset. The pioneer of mortality research using this approach is demographer Brass and other scholars, namely Hill and Trussel.
Among indirect estimation techniques, the one used to calculate the child mortality is most successful and popular. By that reason, two most necessary data inputs, including number of live births and number of children surviving of those women in reproductive ages are compulsory to be collected in all population and housing censuses, inter-censal population and housing surveys and population sample surveys.
The above-mentioned technique is also used in annual population change surveys to estimate the infant mortality rate and the under 5 mortality rate. Besides, combining two methods, namely the General Growth Balance - GGB and the assumed cohort of deceased has been applied to evaluate the completeness of deaths for the whole population. Statistics shown in this chapter were calculated by the above-mentioned estimation techniques.
6.1. Crude death rate
6.1.1. Trend of change in crude death rate
Crude Death Rate (CDR)10 is the most simple and basic demographic indicator, reflecting the mortality level of a population. CDR is often impacted by the age and sex distributions of the population. When the proportion of the population aged under 5 (occupying the relatively high mortality rate) declines in the context of low fertility, the CDR can decrease. However, an increase of the elderly population (suffering the high mortality rate) will compensate for the decline in number of infant/child deaths. As the result, CDR could remain unchanged or even increase. As mentioned above, the events of death derived from the survey are often under-reported as compared to that in the reality. Therefore, the indirect estimation techniques were used to evaluate and modify number of reported deaths in this report.
10 Crude Death Rate (CDR) indicates how many deaths occurred among 1000 people during the reference period, often within the last 12 months prior the time point of survey.

77
Table 6.1 presented the adjusted CDRs of Viet Nam classified by urban and rural areas in the 2005-2015 periods. The data in Table 6.1 indicated that the CDR of whole country in 2015 stood at 6.8 deaths/1000 people, of which that of urban areas was 5.8 deaths/1000 people and that of rural areas was 7.3 deaths/1000 people. As compared to 2014, the CDR of whole country in 2015 tended to decline slightly but the urban - rural differential in CDR increased a little bit (from 1.2 thousand points in 2014 to 1.5 thousand points in 2015).
Viet Nam’s population has been aging. However, since 2013, the CDR has declined slightly year by year, while the life expectancy at births continues increasing. This suggested that Viet Nam has been aware of the impacts on population ageing and improved the policies of social security especially for the population group aged under 5 and the group of old population (suffering from the relatively high mortality rates).
Table 6.1: Crude death rate classified by urban/rural residence, in the 2005-2015 periods
Unit: Deaths/1000 people
Year Whole country Urban Rural
2005 5.3 4.2 5.8
2006 5.3 4.8 5.5
2007 5.3 4.7 5.6
2008 5.3 4.8 5.5
2009 6.8 5.5 7.4
2010 6.8 5.5 7.3
2011 6.9 5.8 7.4
2012 7.0 5.9 7.5
2013 7.1 6.3 7.5
2014 6.9 6.0 7.2
2015 6.8 5.8 7.3
6.1.2. Crude death rate classified by urban/rural residence and social economic regions
The CDR for rural areas was 7.31 deaths/1000 people, with 0.07‰ higher as compared to that of 2014, whereas the CDR for urban areas in 2015 stood at 5.83 deaths/1000 people, with 0.22‰ lower than that of 2014, making the CDR of whole country decline slightly.

78
Among 6 social economic regions, two regions occupying the lowest CDRs that also were lower than the national one were the Southeast (5.12 deaths/1000 people) and the Central Highlands (5.44 deaths/1000 people). Two regions with the highest mortality rate were the Northern Midlands and Mountains (7.89 deaths/1000 people) and the Red River Delta (7.44 deaths/1000 people). This could be explained by that the Southeast and the Central Highlands were the regions occupying younger population, as compared with that of other regions. Their proportion of population aged 65 and above accounted for 5.6% and 4.9%, respectively (regarded as the lowest ones throughout the country), while the proportion of population aged 65 and above in the Red River Delta was 9.5%, nearly twice times higher than that of the Central Highlands.
Figure 6.1: Crude death rate classified by social economic region, 1/4/2015
Note: The dotted line presented in Figure 6.1 is the national CDR within 12 months prior the time point of the survey on 1/4/2015: 6.81 deaths/1000 people.
Among the Southeast Asian countries, the CDR of Viet Nam was lower than the average one. It was lower than that of Myanmar, Thailand, and East Timor and higher than that of remaining countries.

79
Figure 6.2: Crude death rate of the Southeast Asian countries, 2015
Source: The 2015 World Population Data Sheet, at http://www.prb.orb/.
6.2. Age specific death rate
The population with the high infant mortality will also occupy the high mortality of old group and vice versa. Presenting values of Age Specific Death Rate (ASDRs) classified by single year of ages or age groups via the curve line, reflecting the age specific mortality, is known as the mortality model.
Figure 6.3 indicated that the ASDR for males was higher than that of females at age 0; declined rapidly for the age group of 1-4; nearly similar for the age group of 5-30; and differed from the ages 30 and above (the morality rates for males started increasing gradually for older age groups, whereas that for females started increasing just after the age 49). From the age 60 and above, the ASDR for both sexes increased more rapidly. The mortality rate for the old group was much higher than that of the young group. The graph expressing age specific death rates of Viet Nam was shaped as J. Comprising to 4 life table models of Coal - Denemy showed that the mortality model of Viet Nam was similar to the North model11.
11 The North model is characterized by the quite low IMR, the quite high child mortality rate and the mortality rate of old people (aged from 50 and above) declining to below the standard level. The expected life expectancy of this model starts from 44.5 year to 74.7 year.

80
Figure 6.3: Age specific death rate classified by age and sex, 2015
6.3. Infant mortality rate
6.3.1. Infant mortality rate classified by urban/rural residence and social economic region
Infant Mortality Rate (IMR) tends to reflect the social economic features as well as the situation of medical services. Therefore, IMR is regarded as one of important indicators in the Millennium Development Goals of Viet Nam and all over the world, and also as one of indicators used to evaluate the national development.
As above mentioned, the events of death is often under-reported especially for those of infants (children under 1) due to the conception and the psychology of deceased’s relatives that don’t want to tell about the deceased’s permanently leaving. Therefore, the United Nations has recommended using indirect estimation techniques. Similarly to population and housing census and other sample surveys, IMR is estimated indirectly via the software QFIVE requiring number of children ever born, number of children surviving and number of women at reproductive ages taken from the survey.
Table 6.2 presented the estimated IMR of Viet Nam in the 2005-2015 periods, classified by urban/rural areas. The data in table 6.2 indicated that the IMR tended to decrease gradually from 17.8 infant deaths/1000 live births in 2005, to 14.7 infant deaths/1000 live births in 2015. Like that, since 2005 to now, the IMR of Viet Nam has dropped to the lowest value and has achieved to the Millennium Development Goal for the year 2015 (14.8 infant deaths/1000 live births). In urban

81
areas, before the year 2009, the IMR fluctuated around the figure of 9.8; then, declined from 9.4 (in 2009) to 8.6 (in 2015). In rural areas, the IMR declined from 20.4 (in 2005) to 17.6 (infant deaths/1000 live births) in 2015. The infant mortality is always much higher in rural areas, reflecting the quite large gap on living standards between urban and rural areas.
Table 6.2: Infant mortality rate classified by urban/rural residence, in the 2005-2015
period
Unit: Infant deaths/1000 live births
Year Whole country Urban Rural
2005 17.8 9.7 20.4
2006 16.0 10.0 18.0
2007 16.0 9.8 18.8
2008 15.0 10.0 15.0
2009 16.0 9.4 18.7
2010 15.8 9.2 18.2
2011 15.5 8.5 18.1
2012 15.4 8.9 18.3
2013 15.3 8.9 18.3
2014 14.9 8.7 17.8
2015 14.7 8.6 17.6
Generally, the regional IMRs were lower than those of 2014 but the differential on living standards will become more clearly when comparing IMRs among social economic regions. The IMRs of the Northern Midlands and Mountains and of the Central Highlands - known as two most difficult regions in Viet Nam - have remained much higher than the national one, 22.0 and 24.8 infant deaths/1000 live births, respectively in 2015. The lowest IMR belonged to the Southeast - about 8.6 per thousands. This revealed that the State would have to pay more investments into these difficult areas, as the way of contributing to improve the living standards there.

82
Table 6.3: Infant mortality rate classified by social economic region, in 2013, 2014 and 2015
Unit: Infant deaths/1000 live births
Residential place/Social economic region 2013 2014 2015
Whole country 15.3 14.9 14.7
Urban 8.9 8.7 8.6
Rural 18.3 17.8 17.6
Social economic region
Northern Midlands and Mountains 23.2 22.4 22.0
Red River Delta 12.2 11.8 11.7
North and South Central Coast 17.0 16.6 16.3
Central Highlands 26.1 25.9 24.8
Southeast 9.1 8.8 8.6
Mekong River Delta 12.0 11.6 11.4
In term of international comparison, at present, the standard IMR is about 50
infant deaths/1000 live births for poor countries and under 7 infant deaths/1000 live births for majority of developed countries. Like that, the IMR of Viet Nam is ranked into the lower average level. As compared to other regional countries, the IMR of Viet Nam is just higher than that of Singapore (1.8‰), Brunei (4‰), Malaysia (7‰), Thailand (11‰) and much lower than that of Laos (68‰), Myanmar (62‰), Timor Leste (45‰), Philippines (23‰).
Figure 6.4: Infant mortality rate of some Southeast Asian Countries, 2015
Unit: Infant deaths/1000 live births
Source: The 2015 World Population Datasheet/Population Reference Bureau.

83
6.3.2. Provincial infant mortality rates
There was a large differential on IMRs between the mountainous provinces (regarded as the main residential areas of minority ethnic groups) and the provinces of other areas. The provinces occupying the high IMRs are located in the Northern Midlands and Mountains such as: Lai Chau (41.9‰), Ha Giang (33.6‰), Dien Bien (33.8‰), Lao Cai (28.8‰), Yen Bai (26.9‰). They were the provinces suffering from the undeveloped economic situation, lack of medical centers and lack of awareness on maternal and child care. Other provinces with the lower IMRs, but still considered as high ones, above 20‰ include: Cao Bang 23.9‰, Dak Lak 24.0‰, Son La 22.9‰. The provinces with the high proportion of urban population such as Ho Chi Minh City, Dong Nai, Ha Noi, Da Nang, Binh Duong,… occupied the low IMRs (about 10‰).
6.4. Under 5 mortality rate
Under 5 mortality rate (U5MR)12 is a significant indicator as IMR. However, IMR relates closely to obstetrical conditions of mother, whereas U5MR reflects more about the nutritious situation and the disease prevention of children. Therefore, it is one of indicators used to evaluate the national development all over the world. Similarly to IMR, U5MR is also estimated indirectly by the software QFIVE. The results of estimation were presented in Table 6.4.
Table 6.4 showed that, even though a considerable decline on the under 5 mortality of whole country (from 56.9‰ in 1999 to 22.4‰ in 2014 and 22.1‰ in 2015), this figure has not approached to the target of the Population and Reproductive Health Strategy in the 2011-2020 periods, which the under 5 mortality rate would be expected to stand at 19.3‰ in 2015. There was a clear differential on under 5 mortality rate between urban areas and rural areas as well as among regions throughout the country. In urban areas, this rate stood at 12.9 while that of rural areas was 26.5 under 5 deaths/1000 live births in 2015. Besides, the regional gap has remained much large. The U5MRs of the Northern Midlands and Mountains and the Central Highlands, two most difficult regions in Viet Nam, have remained quite high, 33.4 and 37.7 under 5 deaths/1000 live births, respectively in 2015. This suggested that it is necessary for Viet Nam to give more efforts on improving the maternal and child health in order to achieve the target of the Population and Reproductive Health Strategy towards the year 2020, in which the under 5 mortality rate would be expected to decrease to 16‰ at most.
12 Under 5 mortality rate (U5MR) is defined as average number of under 5 deaths per 1000 live births within the reference year. This rate is used to measure the child mortality within the first 5 years of life.

84
Table 6.4: Under 5 mortality rate classified by sex, urban/rural residence and social economic region, 1/4/2015
Unit: Under 5 deaths/1000 live births
Residence/Social economic region Total Male Female
Whole country 22.1 28.7 15.1
Urban/Rural
Urban 12.9 17.9 7.7
Rural 26.5 34.1 18.4
Social economic regions
Northern Midlands and Mountains 33.4 42.3 23.8
Red River Delta 17.5 23.0 11.6
North and South Central Coast 24.5 31.7 16.9
Central Highlands 37.7 47.5 27.3
Southeast 12.9 17.9 7.7
Mekong River Delta 17.0 22.4 11.3
6.5. Life expectancy at birth
Life expectancy at birth or the expectation of life at birth (e0) is one aggregated indicator to evaluate the probability of dying of the population. This indicator is derived from the life table, presenting in detail the mortality model of the population under the basic of the infant mortality. The life table is an effective tool to research the mortality level of the population. The life table has been applied into various fields of the reality, especially in term of population projection. As usual, the life table is designed separately for males and females. The data input of the life table is the infant mortality rate.
Average life expectancy depends closely to the national social and economic development, the living standards, the medical achievements, the completeness of disease prevention and treatment system,… Therefore, it is one of prerequisite indicators for evaluating the national development.
The 2015 Life Table of Viet Nam classified by sex was shown in Table 6.5. The data in Table 6.5 indicated that, according to the result of 2015 survey, both the general life expectancy at birth and that of each sex increased to 0.1 year as compared to those of 2014. Particularly, the life expectancy at birth for the population was 73.3 years, while that of males was 70.7 years, lower than that of females (76.1 years). This is appropriate to the context of Viet Nam and majority societies, that is, the mortality of males is often higher than that of females at all ages and as the result, the life expectancy at birth of males is often lower than that of females.

85
Table 6.5: Life table of Viet Nam classified by sex 1/4/2015
Age Lx lx dx qx px mx Tx Ex
MALE 0 97922 100000 1668 0.0167 0.9833 0.0170 7072018 70.7 1 389732 98332 1206 0.0123 0.9877 0.0031 6974096 70.9 5 485733 97126 214 0.0022 0.9978 0.0004 6584364 67.8
10 484709 96913 309 0.0032 0.9968 0.0006 6098630 62.9 15 483248 96603 468 0.0048 0.9952 0.0010 5613922 58.1 20 480944 96135 536 0.0056 0.9944 0.0011 5130674 53.4 25 478276 95599 572 0.0060 0.9940 0.0012 4649730 48.6 30 475476 95027 707 0.0074 0.9926 0.0015 4171454 43.9 35 472081 94320 1021 0.0108 0.9892 0.0022 3695977 39.2 40 467268 93299 1644 0.0176 0.9824 0.0035 3223896 34.6 45 459540 91655 2690 0.0293 0.9707 0.0059 2756629 30.1 50 446875 88965 4323 0.0486 0.9514 0.0097 2297088 25.8 55 426373 84642 6612 0.0781 0.9219 0.0155 1850213 21.9 60 394756 78030 9554 0.1224 0.8776 0.0242 1423841 18.2 65 348709 68476 13000 0.1899 0.8101 0.0373 1029085 15.0 70 285410 55476 16133 0.2908 0.7092 0.0565 680376 12.3 75 205083 39343 16439 0.4179 0.5821 0.0802 394965 10.0
80+ 189883 22903 22903 1.0000 0.0000 0.1206 189883 8.3
FEMALE 0 98848 100000 1268 0.0127 0.9873 0.0128 7605663 76.1 1 394480 98732 243 0.0025 0.9975 0.0006 7506815 76.0 5 492486 98489 87 0.0009 0.9991 0.0002 7112334 72.2
10 492066 98402 116 0.0012 0.9988 0.0002 6619848 67.3 15 491514 98286 175 0.0018 0.9982 0.0004 6127782 62.3 20 490671 98111 235 0.0024 0.9976 0.0005 5636268 57.4 25 489526 97876 303 0.0031 0.9969 0.0006 5145597 52.6 30 488066 97573 421 0.0043 0.9957 0.0009 4656071 47.7 35 486060 97152 639 0.0066 0.9934 0.0013 4168005 42.9 40 483056 96513 1039 0.0108 0.9892 0.0022 3681945 38.1 45 478158 95474 1666 0.0175 0.9825 0.0035 3198889 33.5 50 470274 93808 2614 0.0279 0.9721 0.0056 2720731 29.0 55 457917 91194 4139 0.0454 0.9546 0.0090 2250457 24.7 60 438448 87055 6737 0.0774 0.9226 0.0154 1792541 20.6 65 406704 80318 10751 0.1339 0.8661 0.0264 1354093 16.9 70 355557 69567 15767 0.2266 0.7734 0.0443 947389 13.6 75 278339 53800 18645 0.3466 0.6534 0.0670 591831 11.0
80+ 313493 35154 35154 1.0000 0.0000 0.1121 313493 8.9
Note:
x: Age 0, 1, 5,...,80+
n: Number of years in the group (1, 4, 5, 5, 5,....)
nLx: Number of people - years of surviving from age x to exact age x+n
lx: Number of people surviving at age x
ndx: Numver of deaths between age x and age x+n
nqx: Probability of dying from age x to exact age x+n
npx: Probability of surviving from age x to exact age x+n
nmx: Age specific mortality rate starting age x to age x+n
Tx: Number of people - year of surviving at exact age x and above
ex: Life expectancy at age x

86
As compared to the Southeast Asian countries, Viet Nam’s life expectancy at birth is higher than the average level (standing at 71 years), ranked at 5/11 countries13, just after Singapore (83 years), Brunei (79 years), Malaysia and Thailand (75 years). This is one of achievements on improving the people’s living standards in Viet Nam.
6.6. Cause of death
The 2015 PCS designed some questions for collecting information on cause of death (especially for deaths due to accidents). When the event of death occurs in the household within the period of survey, the household head will be asked for the cause of death of the deceased. The causes of death include: diseases, labour accidents, traffic accidents, other accidents, suicide and other causes.
The data in Table 6.6 indicated that most deaths occurring within the last 12 months prior the time point of survey were due to diseases (83.8%), declining as compared to that of 2013 and 2014. The proportion of deaths due to any kind of accidents constituted about 7.0%, while that due to “other causes” accounted for 7.9%. Among deaths due to accidents, the proportion of deaths due to traffic accidents accounted for the largest share, 4 times higher than that due to labor accidents (respectively 4.1% and 1.0%) and this proportion of males was two times higher than that of females. The trend was similar to urban/rural areas and social economic regions. The Southeast occupied the largest proportion of deaths due to traffic accident (5.9%). For the Central Highlands, this rate remained quite high (accounting for 5.1%) even if being lower than that of previous years. It was double that the proportion of deaths due to suicide increased as compared to that of 2014 and still stood at the quite high level (1.3%).
13 Source: The 2015 World Population Datasheet/Population Reference Bureau.

87
Table 6.6: Proportion of deaths occurring within the last 12 months prior the time point of survey classified by cause of death, sex and social economic region, 1/4/2015
Unit: Percentage
Cause of death Sex/Residential place/
Social economic region Total
DiseaseLabor
accidentTraffic
accidentOther
accidents Suicide Others
BOTH SEXES
Whole country 100.0 83.8 1.0 4.1 1.9 1.3 7.9
Urban 100.0 85.2 0.5 3.9 1.3 1.1 8.1
Rural 100.0 83.3 1.3 4.2 2.1 1.4 7.8
Social economic region
Northern Midland and Mountains 100.0 83.0 0.9 4.6 2.8 1.8 7.0
Red River Delta 100.0 83.7 0.8 3.3 1.2 1.1 9.9
North and South Central Coast 100.0 81.8 1.3 4.0 2.1 1.7 9.1
Central Highlands 100.0 78.8 3.6 5.1 4.7 1.2 6.5
Southeast 100.0 80.6 0.3 5.9 0.8 0.8 11.6
Mekong River Delta 100.0 90.3 1.0 3.5 1.8 1.0 2.5
MALE
Whole country 100.0 83.3 1.5 5.2 2.3 1.2 6.5
Urban 100.0 86.0 0.6 5.4 1.3 0.7 5.9
Rural 100.0 82.2 1.9 5.1 2.7 1.4 6.8
Social economic region
Northern Midland and Mountains 100.0 81.9 1.2 5.8 3.3 1.8 6.0
Red River Delta 100.0 84.0 1.3 4.7 1.5 0.5 8.0
North and South Central Coast 100.0 81.6 2.0 4.7 2.6 1.5 7.6
Central Highlands 100.0 76.4 4.5 6.9 4.2 1.6 6.4
Southeast 100.0 83.2 0.4 6.0 1.3 1.0 8.2
Mekong River Delta 100.0 87.4 1.3 4.9 2.4 1.3 2.6
FEMALE
Whole country 100.0 84.7 0.3 2.2 1.1 1.4 10.2
Urban 100.0 83.6 0.3 1.3 1.2 1.7 11.8
Rural 100.0 85.2 0.3 2.6 1.1 1.3 9.6
Social economic region
Northern Midland and Mountains 100.0 85.0 0.2 2.2 1.8 2.0 8.8
Red River Delta 100.0 83.2 0.0 1.0 0.6 2.1 13.1
North and South Central Coast 100.0 82.3 0.1 2.6 1.3 1.9 11.7
Central Highlands 100.0 83.4 1.9 1.7 5.9 0.6 6.6
Southeast 100.0 75.8 0.2 5.9 0.0 0.5 17.6
Mekong River Delta 100.0 94.7 0.5 1.2 0.7 0.6 2.4

88

89
CHAPTER 7:
MIGRATION AND BASIC CHARACTERISTICS OF MIGRANTS
The population of a territorial unit depends not only on fertility and mortality of this territorial unit, but also on the change of movements, known as migration. Migration is denoted as the change of residence place of an individual from one territorial unit to another one in a given time period. In other words, this is the change in residence over some period of time. Due to the impact of migration to the socio-economic development, migration has been paid attention not only by managers, policy makers, plan makers, but also by the whole society.
To determine the size and growth rate of the local population, it is necessary to take into account the influence of factors including: the crude birth rate, crude death rate, and in/out migration rates. Among the factors affecting it, the collection of data on migration is very difficult due to the nature of migration option. Normally, in-migration and out-migration flows are not similar among localities. They only focus on some particular localities or regions. In the 2015 PCS, the sample size only represented for provincial level. Therefore, the migration rates are also aggregated to provincial, regional and national levels.
7.1. Inter-regional migration
The 2015 PCS results show that the number of migrants, in-migration rates, out-migration rate one year prior to the survey in all regions has decreased significantly. As compared to the 2014 IPS, the number of inter-regional migrants fell by 223,756 people (the number of inter-regional migrants was 565,181 persons in 2014). The Southeast saw the lowest decreasing in the inter-regional rate of in-migration (5.7 per thousand points), the Central Highlands was the second region decreasing (5.4 per thousand points). Out-migration rate of these two regions also fell more than other regions.
There are two areas with positive net-migration rate was the Central Highlands and the South East in 2014, whereas Southeast is the only region with positive net-migration rate in 2015 although this rate was decreased 1.5 percentage thousands points compared to 2014. Due to have huge employment opportunity so the Southeast is the region with the largest number of in-migrants in the country (nearly 206 thousand people). The Central Highlands is the region with positive net migration rate in 2014 (+1.6‰), in 2015 it became the region with negative net migration rate (-1.1‰).
The Mekong River Delta has become the first rank region on the highest out-migrants throughout the country (more than 114 thousand people). The North

90
and South Central Coast ranked second with more than 86 thousand people and the Southeast is the 3rd ranks region (about 50 thousand people).
Table 7.1: Inter-regional migration in the 2015 PCS
Number of migrants 1 year prior to 1/4/2015
Migration rate 1 year prior to 1/4/2015
Socio-economic region
Total population
as of
1/4/2015
Number of in-
migrants from other
regions
Number of out-
migrants to other regions
Number of net
migrants
In-migra-
tion rate
(‰)
Out-migra-
tion rate
(‰)
Net- migra-
tion rate
(‰)
Entire country 91 465 735 341 425 341 425 0 3.7 3.7 0.0
Northern Midlands and Mountains 11 769 502 13 328 34 854 -21 526 1.1 3.0 -1.8
Red River Delta 20 870 149 37 900 38 074 -174 1.8 1.8 0.0
North and South Central Coast 19 623 969 51 929 86 343 -34 414 2.6 4.4 -1.8
Central Highlands 5 587 237 12 691 18 721 -6 030 2.3 3.4 -1.1
Southeast 16 042 723 205 910 49 143 156 767 12.8 3.1 9.8
Mekong River Delta 17 572 156 19 667 114 288 -94 621 1.1 6.5 -5.4
Table 7.2 shows that apart from job opportunities, the movement distance is also regarded as another factor impacting significantly on migration. Most migrants made movements to where is nearby their place of previous usual residence. Majority of residents of the Mekong River Delta chose the Southeast as their destination place (98%), while migrants from the Northern Midlands and Mountains made movements to the Red River Delta.
Table 7.2: Place of usual residence at time-point of 1/4/2014 and 1/4/2015 by socio-economic region
Unit: Persons
Place of usual residence at time-point of 1/4/2014
Place of usual residence at time-point of 1/4/2015
Tot
al
Nor
ther
n M
idla
nds
and
Mou
ntai
ns
Red
Riv
er D
elta
Nor
th a
nd S
outh
C
entr
al C
oast
Cen
tral
H
ighl
ands
Sout
heas
t
Mek
ong
Riv
er
Del
ta
Total 341 425 34 854 38 074 86 343 18 721 49 143 114 288
Northern Midlands and Mountains 13 328 - 9 999 1 906 175 1 216 31
Red River Delta 37 900 22 184 - 11 118 891 2 896 811
North and South Central Coast 51 929 5 256 15 105 - 4 913 25 555 1 100
Central Highlands 12 691 531 1 802 5 970 - 3 806 582
Southeast 205 910 4 943 10 676 66 205 12 321 - 111 764
Mekong River Delta 19 667 1 941 492 1 144 421 15 670 -

91
7.2. Inter-provincial migration
Annex 11 indicates the inter-provincial migration rates within 1 year precedings the reference period of the 2015 PCS.
The survey results show that 12 provinces had positive net-migration rate and this figure was decreased by 2 provinces compared to 2014. The remaining provinces were negative net migration rate. Despite positive net migration rate has fallen relatively more (about 10 points per thousand) but Binh Duong has remained the top rank of highest positive net-migration rate. Dak Nong is dropped to the third place instead of the second one of 2014 (net-migration rate decreased 37 per thousand, the net migration rate was dropped the lowest), that is replaced by Dong Nai (net-migration rate 14.1 per thousand) in 2015. Third ranked as Bac Ninh with a net-migration rate 12.8‰. Provinces with high net migration rate still consist industrial zones, training schools and this is showed that employment, training, learning has a lot of influence on migration issues.
The province with the highest negative net migration rates were Lai Chau (-15‰), An Giang (nearly -9.6‰) and Phu Yen (-7.9‰).
Although net migration rate of 1.09 per thousand points decrease compared to 2014, Dien Bien continues to be the only province in the Northern Midlands and Mountains with positive net migration rate according to the results of survey 2015 PCS, the other provinces in the region were negative net migration. In 2015, the Southeast has 2 provinces with negative net migration rate is Binh Phuoc and Tay Ninh, all of provinces in Mekong River Delta have negative net migration rate.

92
Map 7.1: Inter-provincial net migration rate, 1/4/2015
Unit: Per thousand
-8 -3 0 3
R1. Northern Midlands and Mountains 02. Ha Giang 04. Cao Bang 06. Bac Kan 08. Tuyen Quang 10. Lao Cai 11. Dien Bien 12. Lai Chau 14. Son La 15. Yen Bai 17. Hoa Binh 19. Thai Nguyen 20. Lang Son 24. Bac Giang 25. Phu Tho R2. Red River Delta 01. Ha Noi 22. Quang Ninh 26. Vinh Phuc 27. Bac Ninh 30. Hai Duong 31. Hai Phong 33. Hung Yen 34. Thai Binh 35. Ha Nam 36. Nam Dinh 37. Ninh Binh R3. North and South Central Coast 38. Thanh Hoa 40. Nghe An 42. Ha Tinh 44. Quang Binh 45. Quang Tri 46. Thua Thien Hue 48. Da Nang 49. Quang Nam 51. Quang Ngai 52. Binh Dinh 54. Phu Yen 56. Khanh Hoa 58. Ninh Thuan 60. Binh Thuan
R4. Central Highlands 62. Kon Tum 64. Gia Lai 66. Dak Lak 67. Dak Nong 68. Lam Dong
R5. Southeast 70. Binh Phuoc 72. Tay Ninh 74. Binh Duong 75. Dong Nai 77. Ba Ria-Vung Tau 79. Ho Chi Minh City R6. Mekong River Delta 80. Long An 82. Tien Giang 83. Ben Tre 84. Tra Vinh 86. Vinh Long 87. Dong Thap 89. An Giang 91. Kien Giang 92. Can Tho 93. Hau Giang 94. Soc Trang 95. Bac Lieu 96. Ca Mau
12
11
10
02 04
0608
14 25 26
19 20
24 22
33 30
31 01
1734
36 37
27
38
40
42
44
45
46
48
49
51
52
54
56
62
64
66
68 58
60
70
75
77
72 74
79 80 82
83
87 89
92
93 94
86 84
96
91
95
67
15
35

93
7.3. Urban - rural migration flows
Compared to 2014, the 2015 PCS survey results show that urban - urban migration flow rose 5.5%, still accounts for the largest share (38.1%) of migration flows (Table 7.3). In 2015, urban - rural migration flows areas fell by 4.8% compared to 2014 and it shows that the pressure of population and employment in urban areas is huge. The rural - urban and rural - rural migration flows are almost no change compared with the previous year.
Table 7.3: Place of usual residence at the time-point of 1/4/2014 and 1/4/2015 by urban/rural residence
Usual residence place at 1/4/2014 Proportion (%) Usual residence place at 1/4/2015 Total Urban Rural Total Urban Rural
Total 1 371 685 691 799 679 886 100.0 50.4 49.6 Urban 828 166 522 223 305 944 60.4 38.1 22.3 Rural 543 519 169 577 373 942 39.6 12.4 27.3
Table 7.4 shows that the phenomenon on feminized migration has maintained in many years. Number of female migrants is much larger than males. The biggest gap belongs to the rural-rural migration flow (261,274 females versus 112,668 males). However, the differential on migration rate between males and females has been gradually narrowed in all migration flows.
Table 7.4: Migration flows by sex, 1/4/2015
Number of migrants Percentage (%) Migration flow
Male Female Male Female
Rural - Urban 131 114 174 829 42.9 57.1 Urban - Urban 231 981 290 241 44.4 55.6 Rural - Rural 112 668 261 274 30.1 69.9 Urban - Rural 80 536 89 041 47.5 52.5
Total 556 300 815 386 40.6 59.4
7.4. Key characteristics of migrants
Figure 7.1 presents the migration rate by age group and sex. Migration rate of the 20-24 age group was highest, followed by 15-19 and 25-29 age group. For the 20-24 age group, migration rates for both men and women was the highest compared to other age groups. However compared to 2014, the gap between the migration rate of men and women in this age group fell from 18.9 to 5.1 per thousand points in 2015. The gap between the migration rate of men and women achieves the greatest value in the 15-19 age group (7.6 per thousand points).

94
The gap between migration rates of men and women of the remaining age groups is almost negligible.
Figure 7.1: Age and sex specific migration rate, 1/4/2015
The people who have graduated secondary schools occupy the highest
migration rate, followed by those who have technical and qualification. The lowest rate belongs to those who have not completed primary. The migration rate for those female with completed upper secondary and technical and professional qualification are higher than those for male counterpart.
Table 7.5: Migration rate of population aged 5 and above in 1 year preceding the
survey by sex and educational level, 1/4/2015 Unit: Per thousand
Educational level Total Male Female
Total 5.7 5.4 6.1
Never attended 2.9 4.0 2.4
Not completed primary 2.0 2.2 1.9
Completed primary 4.2 4.1 4.3
Completed lower secondary 5.6 5.8 5.5
Completed upper secondary 12.2 9.7 14.8
Technical and professional qualification 9.2 7.7 10.9
As compared to 2014, the 2015 PCS survey results show that the migration rates of all categories in marital status increased (17 points per thousand). The never-married is highest group (14.2‰). Similar to previous years, the group who had a wife/husband (including those who were widowed) always have migration rates much lower than those “free” (including those who never-married or
Percentage
Age group

95
divorced/separated). The largest gap between the migration rate of men and women are separated groups (5.8 per thousand points), the widowed is lowest group (migration rate of men and women are nearly equal 1.8‰).
Table 7.6: Migration rate of population aged 15 and above during 1 year preceding the survey by sex and marital status, 1/4/2015
Unit: Per thousand
Marital status Total Male Female
Total 6.6 6.3 7.0
Never-married 14.2 13.3 15.3
Currently married 4.6 3.7 5.4
Widowed 1.8 1.8 1.8
Divorced 6.4 7.3 6.0
Separated 9.1 5.6 11.4
Table 7.7 reflects most important decisions leading to migration. The reasons for migration may include pull and push factors. Starting new jobs accounted for the largest proportion of the total reasons (24.6%), following by looking for work (24.1%) and follow family/retirement (19.3%). Similar to the 2014 survey, the proportion of male migrants due to start a new job is still the highest (30.6%). The results of 2015 differed from that of 2014 for women, job-related reasons accounted for the highest proportion (21.4%), while the reason to re-married accounted for the highest proportion in 2014 (31.0%).
Table 7.7: Proportion of population aged 1 year and older migrant 1 year prior to the survey 1/04/2015 by gender and reasons for migration
Unit: Percentage
Reason for migrant Total Male Female
Total 100.0 100.0 100.0
Job search 24.1 27.4 21.4
Starting a new job 24.6 30.6 19.5
Losing your job/Could not find a job 2.4 2.8 2.1
Follow family/retirement 19.3 19.2 19.3
Married 10.7 2.7 17.6
Moving house 3.6 4.0 3.2
Improving living conditions 1.9 1.7 2.1
Schooling 10.2 7.8 12.2
Others 3.2 3.9 2.6

96

97
PART III
ANNEXES

98

99
MINISTRY OF PLANNING AND INVESTMENT GENERAL STATISTICS OFFICE
____________________________ ________________________ QUESTIONNAIRE OF THE 1/4/2015 TIME-POINT
POPULATION CHANGE AND FAMILY PLANNING SURVEY
Information collected in this survey is implemented by the Decision No 84/QD-TCTK dated 10 February 2015 of the General Statistics Office's Director General;
To be used and kept strictly confidential by the regulations of the Statistics Law
SAMPLE DIGITS TO FILL INTO BOX PLACE “X” INTO THE SMALL BOX TO INDICATE THE RESPECTIVE ANSWER
IDENTIFICATION
PROVINCE/CITY: ___________________________________________________________________
DISTRICT/QUARTER/TOWN/PROVINCIAL CITY:______________________________________
COMMUNE/WARD/DISTRICT TOWN: ________________________________________
ENUMERATION AREA NUMBER:.....................................................................................................
NAME OF ENUMERATION AREA: ______________________________________________________________
URBAN/RURAL (URBAN = 1; RURAL = 2):........................................................................................................
HOUSEHOLD NUMBER:....................................................................................................................
FULL NAME OF HOUSEHOLD HEAD:___________________________________________________________
ADDRESS OF THE HOUSEHOLD:______________________________________________________________
HOME TELEPHONE/MOBILE PHONE: __________________________________________________________
RESULTS
NUMBER OF USUAL RESIDENTS IN THE HOUSEHOLD ................................................................. .....
NUMBER OF MALES: ..............................................................................................................
NUMBER OF FEMALES:..........................................................................................................
THIS IS SET IN SETS OF THE HOUSEHOLD
CERTIFICATION
RESPONDENT
FULL NAME SIGNATURE
ENUMERATOR
TEAM LEADER
X
Annex 1:

100
PART 1: INFORMATION OF HOUSEHOLD MEMBERS
SERIAL NUMBER
QUESTIONS
SERIAL NUMBER.
SERIAL NUMBER.
QUESTIONS 1, 2 AND 3 ARE INTERVIEWED AND RECORDED HORIZONTALLY
1. Please let me know the full name of each person usually residing in the household, starting at the head of household? (APPLICATION OF INTERVIEW PROCESS FOR DETERMINATION OF USUAL RESIDENTS)
_________________________
_________________________
_________________________
_________________________
2. What is [NAME]’s relationship to the head of household?
H.H HEAD...............................1
SPOUSE .................................2
NATURAL CHILD...................3
PARENTS ...............................4
OTHER FAMILY RELATION.......5
NO FAMILY RELATION..............6
H.H HEAD...............................1
SPOUSE .................................2
NATURAL CHILD...................3
PARENTS...............................4
OTHER FAMILY RELATION.......5
NO FAMILY RELATION .............6
3. Is [NAME] male or female? MALE ....1 FEMALE.. 2 MALE... .1 FEMALE.. 2
ASK AND RECORD FOR EACH PERSON FROM QUESTION 4 ONWARDS (BY COLUMN)
4. In what solar calendar month and year was [NAME] born?
MONTH .....
YEAR........ Q 6
YEAR NOT STATED ...9998
MONTH .....
YEAR........ Q 6
YEAR NOT STATED... 9998
5. At present, what is [NAME]’s age as of his/her last birthday?
(IF AGE IS 95 OR MORE, WRITE ’95)’ COMPLETED AGE............... COMPLETED AGE...............
6. To what ethnic group does [NAME] belong? KINH ..................................1
OTHER ETHNIC GROUP 2
NAME OF ETHNIC GROUP
KINH ..................................1
OTHER ETHNIC GROUP 2
NAME OF ETHNIC GROUP
7. Does [NAME] follow any faith/religion?
IF YES: What is [NAME]’s faith/religion?
YES...................................1
NAME OF RELIGION
NO.....................................2
YES ..................................1
NAME OF RELIGION
NO ....................................2
8. CHECK QUESTION 4 OR QUESTION 5: ASK FOR PERSONS AGED 1 OR ABOVE (BORN BEFORE APRIL 2014)
9. How long did [NAME] reside usually in ward, district town or commune?
UNDER 1 MONTH............... 1
1 TO UNDER 6 MONTHS ....2
6 TO UNDER 12 MONTHS 3
12 MONTHS TO UNDER 5 YEARS. 4
5 YEARS AND ABOVE ....... 5
Q13
UNDER 1 MONTH ...............1
1 TO UNDER 6 MONTHS.... 2
6 TO UNDER 12 MONTHS.3
12 MONTHS TO UNDER 5 YEARS.4
5 YEARS AND ABOVE ........5
Q13

101
SERIAL NUMBER..
SERIAL NUMBER. .
SERIAL NUMBER.
SERIAL NUMBER.
QUESTIONS 1, 2 AND 3 ARE INTERVIEWED AND RECORDED HORIZONTALLY
_________________________
_________________________
_________________________
_________________________
_________________________
_________________________
_________________________
_________________________
H.H HEAD .............................. 1
SPOUSE................................. 2
NATURAL CHILD .................. 3
PARENTS .............................. 4
OTHER FAMILY RELATION ...... 5
NO FAMILY RELATION............. 6
H.H HEAD...............................1
SPOUSE.................................2
NATURAL CHILD...................3
PARENTS...............................4
OTHER FAMILY RELATION.......5
NO FAMILY RELATION .............6
H.H HEAD...............................1
SPOUSE .................................2
NATURAL CHILD...................3
PARENTS...............................4
OTHER FAMILY RELATION.......5
NO FAMILY RELATION .............6
H.H HEAD .............................. 1
SPOUSE ................................ 2
NATURAL CHILD.................. 3
PARENTS .............................. 4
OTHER FAMILY RELATION ...... 5
NO FAMILY RELATION............. 6
MALE... 1 FEMALE 2 MALE...1 FEMALE 2 MALE...1 FEMALE 2 MALE ...1 FEMALE 2
ASK AND RECORD FOR EACH PERSON FROM QUESTION 4 ONWARDS (BY COLUMN)
MONTH .....
YEAR........ Q 6
YEAR NOT STATED... 9998
MONTH .....
YEAR........ Q 6
YEAR NOT STATED... 9998
MONTH .....
YEAR........ Q 6
YEAR NOT STATED...9998
MONTH .....
YEAR........ Q 6
YEAR NOT STATED...9998
COMPLETED AGE............... COMPLETED AGE............... COMPLETED AGE............... COMPLETED AGE...............
KINH................................. .1
OTHER ETHNIC GROUP 2
NAME OF ETHNIC GROUP
KINH ..................................1
OTHER ETHNIC GROUP 2
NAME OF ETHNIC GROUP
KINH ..................................1
OTHER ETHNIC GROUP 2
NAME OF ETHNIC GROUP
KINH ..................................1
OTHER ETHNIC GROUP 2
NAME OF ETHNIC GROUP
YES .................................. 1
NAME OF RELIGION
NO .................................... 2
YES ..................................1
NAME OF RELIGION
NO ....................................2
YES...................................1
NAME OF RELIGION
NO ....................................2
YES...................................1
NAME OF RELIGION
NO ....................................2
8. CHECK QUESTION 4 OR QUESTION 5: ASK FOR PERSONS AGED 1 OR ABOVE (BORN BEFORE APRIL 2014)
UNDER 1 MONTH ............... 1
1 TO UNDER 6 MONTHS.... 2
6 TO UNDER 12 MONTHS.3
12 MONTHS TO UNDER 5 YEARS.4
5 YEARS AND ABOVE........ 5
Q13
UNDER 1 MONTH ...............1
1 TO UNDER 6 MONTHS.... 2
6 TO UNDER 12 MONTHS.3
12 MONTHS TO UNDER 5 YEARS.4
5 YEARS AND ABOVE ........5
Q13
UNDER 1 MONTH................1
1 TO UNDER 6 MONTHS....2
6 TO UNDER 12 MONTHS.3
12 MONTHS TO UNDER 5 YEARS.4
5 YEARS AND ABOVE ........5
Q13
UNDER 1 MONTH................1
1 TO UNDER 6 MONTHS ....2
6 TO UNDER 12 MONTHS .3
12 MONTHS TO UNDER 5 YEARS.4
5 YEARS AND ABOVE ........5
Q13

102
PART 1: INFORMATION OF HOUSEHOLD MEMBERS (CONT.)
NAME AND NUMBER
QUESTIONS
_________________
_________________
10. One year ago (on 1/4/2014), where did [NAME] reside ussually?
NAME OF PROVINCE/CITY
NAME OF PROVINCE/CITY
11. Was the above-mentioned place of usual residence of [NAME] a ward, a district town or a commune one year ago?
WARD/DISTRICT TOWN....1
COMMUNE .........................2
WARD/DISTRICT TOWN....1
COMMUNE .........................2
12. What is main reason that [NAME] moved into the household?
LOOKING FOR JOB .............. 1
START NEW JOB................... 2
JOB LOSING/COULD NOT
FIND JOB..................................3
FOLLOWING FAMILY/RETIRED .. 4
GETTING MARRIED............... 5
REPLACE HOUSE.................. 6
IMPROVE LIVING CONDITIONS 7
SCHOOLINGS ....................... 8
OTHER_________________ 9
(SPECIFY)
LOOKING FOR JOB .............. 1
START NEW JOB................... 2
JOB LOSING/COULD NOT
FIND JOB..................................3
FOLLOWING FAMILY/RETIRED .. 4
GETTING MARRIED .............. 5
REPLACE HOUSE ................. 6
IMPROVE LIVING CONDITIONS 7
SCHOOLINGS ....................... 8
OTHER _________________ 9
(SPECIFY)
13. CHECK QUESTION 4 OR QUESTION 5: ASK FOR PERSONS AGED 5 OR ABOVE (BORN BEFORE APRIL 2010)
14. Did [NAME] ever attend any school/class from 3 months or above?
YES............................1
NO..............................2 Q21
YES ...........................1
NO..............................2 Q21
15. At present, is [NAME] attending any school/class from 3 months or above?
YES .................... 1
NO ...................... 2 Q17
YES .................... 1
NO ...................... 2 Q17
16. What is the grade of education/training that [NAME] is attending?
ABBREVIATION: PROF. PROFESSIONAL
PRE-SCHOOL..........................01
PRIMARY .................................02
LOWER SECONDARY............03
UPPER SECONDARY.............04
PRIMARY JOB TRAINING ......05
MID-LEVEL JOB TRAINING....06
MID-LEVEL PROF TRAINING.07
TRADE COLLEGE...................08
PROF. COLLEGE ....................09
UNIVERSITY............................10
MASTER...................................11
DOCTOR..................................12
PRE-SCHOOL .........................01
PRIMARY.................................02
LOWER SECONDARY............03
UPPER SECONDARY.............04
PRIMARY JOB TRAINING ......05
MID-LEVEL JOB TRAINING ...06
MID-LEVEL PROF TRAINING 07
TRADE COLLEGE...................08
PROF. COLLEGE ....................09
UNIVERSITY............................10
MASTER ..................................11
DOCTOR..................................12

103
_________________
_________________
_________________
_________________
NAME OF PROVINCE/CITY
NAME OF PROVINCE/CITY
NAME OF PROVINCE/CITY
NAME OF PROVINCE/CITY
WARD/DISTRICT TOWN... 1
COMMUNE......................... 2
WARD/DISTRICT TOWN ... 1
COMMUNE......................... 2
WARD/DISTRICT TOWN ...1
COMMUNE.........................2
WARD/DISTRICT TOWN... 1
COMMUNE......................... 2
LOOKING FOR JOB .............. 1
START NEW JOB................... 2
JOB LOSING/COULD NOT
FIND JOB..................................3
FOLLOWING FAMILY/RETIRED .. 4
GETTING MARRIED............... 5
REPLACE HOUSE.................. 6
IMPROVE LIVING CONDITIONS 7
SCHOOLINGS ....................... 8
OTHER _________________ 9
(SPECIFY)
LOOKING FOR JOB .............. 1
START NEW JOB................... 2
JOB LOSING/COULD NOT
FIND JOB..................................3
FOLLOWING FAMILY/RETIRED .. 4
GETTING MARRIED .............. 5
REPLACE HOUSE ................. 6
IMPROVE LIVING CONDITIONS 7
SCHOOLINGS ....................... 8
OTHER_________________ 9
(SPECIFY)
LOOKING FOR JOB .............. 1
START NEW JOB................... 2
JOB LOSING/COULD NOT
FIND JOB..................................3
FOLLOWING FAMILY/RETIRED .. 4
GETTING MARRIED .............. 5
REPLACE HOUSE ................. 6
IMPROVE LIVING CONDITIONS 7
SCHOOLINGS ....................... 8
OTHER _________________9
(SPECIFY)
LOOKING FOR JOB ..............1
START NEW JOB ...................2
JOB LOSING/COULD NOT
FIND JOB..................................3
FOLLOWING FAMILY/RETIRED ..4
GETTING MARRIED...............5
REPLACE HOUSE..................6
IMPROVE LIVING CONDITIONS 7
SCHOOLINGS ........................8
OTHER__________________9
(SPECIFY)
13. CHECK QUESTION 4 OR QUESTION 5: ASK FOR PERSONS AGED 5 OR ABOVE (BORN BEFORE APRIL 2010)
YES............................1
NO..............................2 Q21
YES ...........................1
NO..............................2 Q21
YES ...........................1
NO..............................2 Q21
YES......................... ..1
NO..............................2 Q21
YES.....................1
NO.......................2 Q17
YES.....................1
NO.......................2 Q17
YES.....................1
NO.......................2 Q17
YES.....................1
NO.......................2 Q17
PRE-SCHOOL......................... 01
PRIMARY .................................02
LOWER SECONDARY............03
UPPER SECONDARY.............04
PRIMARY JOB TRAINING ......05
MID-LEVEL JOB TRAINING....06
MID-LEVEL PROF TRAINING.07
TRADE COLLEGE...................08
PROF. COLLEGE ....................09
UNIVERSITY............................10
MASTER...................................11
DOCTOR..................................12
PRE-SCHOOL .........................01
PRIMARY.................................02
LOWER SECONDARY............03
UPPER SECONDARY.............04
PRIMARY JOB TRAINING ......05
MID-LEVEL JOB TRAINING....06
MID-LEVEL PROF TRAINING 07
TRADE COLLEGE...................08
PROF. COLLEGE ....................09
UNIVERSITY............................10
MASTER ..................................11
DOCTOR..................................12
PRE-SCHOOL .........................01
PRIMARY.................................02
LOWER SECONDARY............03
UPPER SECONDARY.............04
PRIMARY JOB TRAINING......05
MID-LEVEL JOB TRAINING ...06
MID-LEVEL PROF TRAINING 07
TRADE COLLEGE...................08
PROF. COLLEGE....................09
UNIVERSITY............................10
MASTER ..................................11
DOCTOR..................................12
PRE-SCHOOL......................... 01
PRIMARY ................................ 02
LOWER SECONDARY ........... 03
UPPER SECONDARY ............ 04
PRIMARY JOB TRAINING...... 05
MID-LEVEL JOB TRAINING... 06
MID-LEVEL PROF TRAINING 07
TRADE COLLEGE .................. 08
PROF. COLLEGE.................... 09
UNIVERSITY ........................... 10
MASTER.................................. 11
DOCTOR ................................. 12

104
PART 1: INFORMATION OF HOUSEHOLD MEMBERS (CONT.)
NAME AND NUMBER
QUESTIONS
_________________
_________________
17. What is the highest grade of education/training that [NAME] has completed or graduated?
WITH CERTIFICATION OF PRIMARY JOB TRAINING, ONLY COUNT FROM 3 MONTHS OR ABOVE
ABBREVIATION:
PROF. PROFESSIONAL
UNDER PRIMARY...................01
PRIMARY ................................02
LOWER SECONDARY............03
UPPER SECONDARY.............04
PRIMARY JOB TRAINING ......05
MID-LEVEL JOB TRAINING ...06
MID-LEVEL PROF TRAINING 07
TRADE COLLEGE...................08
PROF. COLLEGE ....................09
UNIVERSITY............................10
MASTER ..................................11
DOCTOR..................................12
UNDER PRIMARY...................01
PRIMARY ................................02
LOWER SECONDARY............03
UPPER SECONDARY.............04
PRIMARY JOB TRAINING ......05
MID-LEVEL JOB TRAINING ...06
MID-LEVEL PROF TRAINING 07
TRADE COLLEGE...................08
PROF. COLLEGE....................09
UNIVERSITY............................10
MASTER ..................................11
DOCTOR..................................12
18. What is the highest grade of general education that [NAME] has completed?
GRADE IS CONVERTED INTO 12-YEAR GENERAL EDUCATION LEVEL.
GENERAL GRADE....
GENERAL GRADE....
19. What are total years of attended all of the trade, vocational training, university, master and Phd (doctor) that [NAME] has completed (if any)?
IF [NAME] HAS NOT ATTENDED ABOVE TRAINING OR ONLY ATTENDED 01 KIND OF SHORT-TERM TRAINING, RECORD “00”)
NUMBER OF YEARS
NUMBER OF YEARS
20. CHECK QUESTION 17: QUESTION 17=01 (UNDER PRIMARY) Q 21; OTHERWISE Q22.
21. At present, can [NAME] read and write? YES ..................................1
NO ....................................2
YES .................................. 1
NO .................................... 2
22. CHECK QUESTION 4 OR QUESTION 5: ASK FOR PERSONS AGED 15 OR ABOVE (BORN BEFORE APRIL 2000)
23. What is the currently marital status of [NAME]?
NEVER MARRIED ...............1 NEXT PERSON
CURRENTLY MARRIED.......2
WIDOWED..........................3
DIVORCED.........................4
SEPARATED ......................5
NEVER MARRIED ...............1 NEXT PERSON
CURRENTLY MARRIED....... 2
WIDOWED ......................... 3
DIVORCED......................... 4
SEPARATED ...................... 5
24. What is solar month and year is that the above-mentioned marital status was occurred?
MONTH ....
YEAR ........ NEXT PERSON
YEAR NOT STATED... 9998
MONTH ....
YEAR ........ NEXT PERSON
YEAR NOT STATED... 9998

105
_________________
_________________
_________________
_________________
UNDER PRIMARY .................. 01
PRIMARY ................................ 02
LOWER SECONDARY ........... 03
UPPER SECONDARY ............ 04
PRIMARY JOB TRAINING...... 05
MID-LEVEL JOB TRAINING ... 06
MID-LEVEL PROF TRAINING 07
TRADE COLLEGE .................. 08
PROF. COLLEGE.................... 09
UNIVERSITY ........................... 10
MASTER.................................. 11
DOCTOR ................................. 12
UNDER PRIMARY...................01
PRIMARY ................................ 02
LOWER SECONDARY............ 03
UPPER SECONDARY ............ 04
PRIMARY JOB TRAINING...... 05
MID-LEVEL JOB TRAINING ... 06
MID-LEVEL PROF TRAINING 07
TRADE COLLEGE................... 08
PROF. COLLEGE.................... 09
UNIVERSITY ........................... 10
MASTER .................................. 11
DOCTOR ................................. 12
UNDER PRIMARY .................. 01
PRIMARY ............................... 02
LOWER SECONDARY ........... 03
UPPER SECONDARY............ 04
PRIMARY JOB TRAINING...... 05
MID-LEVEL JOB TRAINING... 06
MID-LEVEL PROF TRAINING 07
TRADE COLLEGE .................. 08
PROF. COLLEGE ................... 09
UNIVERSITY........................... 10
MASTER.................................. 11
DOCTOR ................................. 12
UNDER PRIMARY .................. 01
PRIMARY ............................... 02
LOWER SECONDARY ........... 03
UPPER SECONDARY ............ 04
PRIMARY JOB TRAINING...... 05
MID-LEVEL JOB TRAINING... 06
MID-LEVEL PROF TRAINING 07
TRADE COLLEGE .................. 08
PROF. COLLEGE ................... 09
UNIVERSITY ........................... 10
MASTER.................................. 11
DOCTOR ................................. 12
GENERAL GRADE....
GENERAL GRADE....
GENERAL GRADE....
GENERAL GRADE....
NUMBER OF YEARS.
NUMBER OF YEARS.
NUMBER OF YEARS
NUMBER OF YEARS
20. CHECK QUESTION 17: QUESTION 17=01 (UNDER PRIMARY) Q 21; OTHERWISE Q22.
YES ..................................1
NO ....................................2
YES...................................1
NO ....................................2
YES .................................. 1
NO .................................... 2
YES .................................. 1
NO .................................... 2
22. CHECK QUESTION 4 OR QUESTION 5: ASK FOR PERSONS AGED 15 OR ABOVE (BORN BEFORE APRIL 2000)
NEVER MARRIED ...............1 NEXT PERSON
CURRENTLY MARRIED.......2
WIDOWED..........................3
DIVORCED.........................4
SEPARATED ......................5
NEVER MARRIED .............. 1 NEXT PERSON
CURRENTLY MARRIED.......2
WIDOWED..........................3
DIVORCED .........................4
SEPARATED.......................5
NEVER MARRIED ...............1 NEXT PERSON
CURRENTLY MARRIED....... 2
WIDOWED ......................... 3
DIVORCED......................... 4
SEPARATED ...................... 5
NEVER MARRIED ...............1 NEXT PERSON
CURRENTLY MARRIED....... 2
WIDOWED ......................... 3
DIVORCED......................... 4
SEPARATED ...................... 5
MONTH ....
YEAR ........ NEXT PERSON
YEAR NOT STATED... 9998
MONTH ....
YEAR ........ NEXT PERSON
YEAR NOT STATED... 9998
MONTH ....
YEAR ........ NEXT PERSON
YEAR NOT STATED... 9998
MONTH ....
YEAR ........ NEXT PERSON
YEAR NOT STATED... 9998

106
PART 2: INFORMATION ON BIRTH HISTORY OF WOMEN AGED 15 - 49
25. CHECK QUESTIONS 3, 4 AND 5 TO DETERMINE WOMEN AGED 15-49 (BORN FROM 1/4/1965 TO 31/3/2000). IF YES, WRITE NAME AND ORDER NUMBER OF WOMEN IN PART 1 INTO SPECIFIED LINES AND 2 SPECIFIED LARGE BOXES (EACH WOMEN IS RECORDED INTO ONE COLUMN).
YES................1
NO .................2 PART 3: INFORMATION ON THE
DECEASED OF THE HOUSEHOLD
NAME AND NUMBER
QUESTIONS
_________________
_________________
_________________
26. Have you ever given birth?
GIVEN BIRTH ..............1
NOT GIVEN BIRTH......2
Q 43
GIVEN BIRTH...............1
NOT GIVEN BIRTH......2
Q 43
GIVEN BIRTH .............. 1
NOT GIVEN BIRTH ..... 2
Q 43
27. Total sons and total daughters to whom you have given birth?
TOTAL OF SONS......... TOTAL OF DAUGHTERS
TOTAL OF SONS......... TOTAL OF DAUGHTERS
TOTAL OF SONS........ TOTAL OF DAUGHTERS
28. Number of sons and number of daughters to whom you have given birth who are currently living with you?
NUMBER OF SONS....... NUMBER OF DAUGHTERS.
NUMBER OF SONS....... NUMBER OF DAUGHTERS.
NUMBER OF SONS....... NUMBER OF DAUGHTERS.
29. Number of sons and number of daughters to whom you have given birth who are currently living elsewhere?
NUMBER OF SONS....... NUMBER OF DAUGHTERS.
NUMBER OF SONS....... NUMBER OF DAUGHTERS.
NUMBER OF SONS....... NUMBER OF DAUGHTERS.
30. Have you ever given birth who were born alive but later died? IF YES: Number of dead sons and daughters?
NUMBER OF SONS....... NUMBER OF DAUGHTERS.
NUMBER OF SONS....... NUMBER OF DAUGHTERS.
NUMBER OF SONS....... NUMBER OF DAUGHTERS.
31. CHECK: Q 27 = Q 28 + Q 29 + Q30. IF FALSE, RE-ASK FOR CONSISTENCY.
32. In what solar calendar month and year have you given the last birth?
MONTH....
YEAR.....
MONTH....
YEAR.....
MONTH....
YEAR ....
33. How many sons and daughters did you have at the last birth?
NUMBER OF SONS..........
NUMBER OF DAUGHTER
NUMBER OF SONS..........
NUMBER OF DAUGHTER
NUMBER OF SONS .........
NUMBER OF DAUGHTER
34. CHECK QUESTION 32, IF YEAR OF BIRTH IS 2014 OR 2015 Q 35; OTHER Q 36.
35. Number of sons and daughters to whom you have ever given birth from 4/2014 to 3/2015?
NUMBER OF SONS..........
NUMBER OF DAUGHTER
NUMBER OF SONS..........
NUMBER OF DAUGHTER
NUMBER OF SONS .........
NUMBER OF DAUGHTER
36. CHECK Q32: GIVING BIRTH FROM 4/2013 TO 3/2015 Q 37; OTHER QUESTION 43.
37. During the pregnancy period of the last child birth, did you have obstetrical check? If YES: How many times did you have?
YES .............................1 NO ...............................2
YES..............................1 NO ...............................2
YES ............................. 1 NO............................... 2

107
NAME AND NUMBER
QUESTIONS
_________________
_________________
_________________
38. Did you know the sex of foetus before birth delivery?
YES......................... 1
NO........................... 2 Q41
YES......................... 1
NO........................... 2 Q41
YES .........................1
NO ...........................2 Q41
39. How many weeks of the foetus did you know the sex of foetus?
NUMBER OF WEEKS .
DO NOT KNOW................. 98
NUMBER OF WEEKS .
DO NOT KNOW.................98
NUMBER OF WEEKS..
DO NOT KNOW ................ 98
40. By what method did you know the sex of foetus?
ULTRASOUND .................. 1
PULSE FEELING............... 2
GUESS .............................. 3
OTHER ______________ 4
(SPECIFY)
ULTRASOUND ..................1
PULSE FEELING...............2
GUESS...............................3
OTHER _______________4
(SPECIFY)
ULTRASOUND.................. 1
PULSE FEELING .............. 2
GUESS .............................. 3
OTHER ______________ 4
(SPECIFY)
41. During the pregnancy period of the last child birth, did you want to son or daughter or both of them?
SON ....................................1
DAUGHTER....................... 2
BOTH ................................. 3
SON ........ ...........................1
DAUGHTER....................... 2
BOTH ................................. 3
SON ....................................1
DAUGHTER .......................2
BOTH..................................3
42. For the last child birth, where did you give birth delivery?
HEALTH FACILITY .................. 1
AT HOME WITH HELP OF
HEALTH WORKER ................. 2
AT HOME WITHOUT HELP OF HEALTH WORKER.................. 3
ELSEWHERE ____________ 4
(SPECIFY)
HEALTH FACILITY .................. 1
AT HOME WITH HELP OF
HEALTH WORKER ................. 2
AT HOME WITHOUT HELP OF HEALTH WORKER.................. 3
ELSEWHERE _____________4
(SPECIFY)
HEALTH FACILITY .................. 1
AT HOME WITH HELP OF
HEALTH WORKER ................. 2
AT HOME WITHOUT HELP OF HEALTH WORKER.................. 3
ELSEWHERE ____________ 4
(SPECIFY)
43. CHECK QUESTION 23: IF Q23 = 2 Q44; OTHER Q50.
44. At present, are you or your husband currently using any contraceptive methods?
YES......................... 1
NO........................... 2 Q46
CÓ........................... 1
KHÔNG................... 2 C46
CÓ ...........................1
KHÔNG ...................2 C46
45. Which method is that? IUD......................................... 01
PILL ....................................... 02
INJECTION............................ 03
IMPLANTS............................. 04
DIAPHRAGM......................... 05
FOAM .................................... 06
CONDOM .............................. 07
MALE STERILIZATION......... 08
FEMALE STERILIZATION.... 09
PERIODIC ABSTINENCE..... 10
WITHDRAWAL .................. 11
OTHER ________________ 12
(SPECIFY)
Q47
IUD ........................................ 01
PILL ....................................... 02
INJECTION ........................... 03
IMPLANTS ............................ 04
DIAPHRAGM ........................ 05
FOAM .................................... 06
CONDOM.............................. 07
MALE STERILIZATION ........ 08
FEMALE STERILIZATION.... 09
PERIODIC ABSTINENCE .... 10
WITHDRAWAL.................. 11
OTHER ________________ 12
(SPECIFY)
Q47
IUD......................................... 01
PILL ....................................... 02
INJECTION ........................... 03
IMPLANTS ............................ 04
DIAPHRAGM......................... 05
FOAM .................................... 06
CONDOM .............................. 07
MALE STERILIZATION ........ 08
FEMALE STERILIZATION.... 09
PERIODIC ABSTINENCE..... 10
WITHDRAWAL .................. 11
OTHER ________________ 12
(SPECIFY)
Q47

108
NAME AND NUMER
QUESTIONS
_________________
_________________
_________________
46. What is the main reason that you or your husband is not using any contraceptive method?
BEING PREGNANT ............... 01
WANT MORE CHILDREN ..... 02
LACK OF KNOWLEDGE ....... 03
OPPOSITED BY RELATIVES04
COSTLY ................................. 05
SIDE EFFECT ........................ 06
WEAK HEALTH...................... 07
DIFFICULT TO GET PREGNANT /
MENOPAUSE.......................... 08
CONTRACEPTIVE METHOD
IS NOT AVAILABLE.............. 09
OTHER _______________10
(SPECIFY)
BEING PREGNANT............... 01
WANT MORE CHILDREN ..... 02
LACK OF KNOWLEDGE ....... 03
OPPOSITED BY RELATIVES04
COSTLY ................................. 05
SIDE EFFECT........................ 06
WEAK HEALTH ..................... 07
DIFFICULT TO GET PREGNANT /
MENOPAUSE ......................... 08
CONTRACEPTIVE METHOD
IS NOT AVAILABLE.............. 09
OTHER _______________10
(SPECIFY)
BEING PREGNANT............... 01
WANT MORE CHILDREN ..... 02
LACK OF KNOWLEDGE ....... 03
OPPOSITED BY RELATIVES04
COSTLY ................................. 05
SIDE EFFECT........................ 06
WEAK HEALTH...................... 07
DIFFICULT TO GET PREGNANT /
MENOPAUSE ......................... 08
CONTRACEPTIVE METHOD
IS NOT AVAILABLE.............. 09
OTHER _______________10
(SPECIFY)
47. During the last 12 months, have you ever had any menstrual regulation or induced abortion?
YES...............................1
NO.................................2 Q50
YES...............................1
NO ................................2 Q50
YES...............................1
NO ................................2 Q50
48. What was the main reason that you have had menstrual regulation or induced abortion during the last 12 months?
MOTHER’S HEALTH
CONCERNS............................. 1
FOETUS’ HEALTH
CONCERNS............................. 2
UNWANTED PREGNANCY. 3
OTHER _________________ 4
(SPECIFY)
MOTHER’S HEALTH
CONCERNS............................. 1
FOETUS’ HEALTH
CONCERNS............................. 2
UNWANTED PREGNANCY .3
OTHER __________________4
(SPECIFY)
MOTHER’S HEALTH
CONCERNS............................. 1
FOETUS’ HEALTH
CONCERNS............................. 2
UNWANTED PREGNANCY 3
OTHER _________________ 4
(SPECIFY)
49. Did you have any complications after the abortion or menstrual regulation?
IF YES:
What complication is that?
NO COMPLICATION........1
HYSTERECTOMY ...........2
BLEEDING .......................3
INFECTION ......................4
BLED VAGINA .................5
OTHER ______________6
(SPECIFY)
NO COMPLICATION........1
HYSTERECTOMY ...........2
BLEEDING .......................3
INFECTION ......................4
BLED VAGINA..................5
OTHER ______________ 6
(SPECIFY)
NO COMPLICATION ....... 1
HYSTERECTOMY........... 2
BLEEDING....................... 3
INFECTION...................... 4
BLED VAGINA ................. 5
OTHER ______________ 6
(SPECIFY)
50. IF THERE ARE OTHER RESPONDENTS QUESTION 26; NO OTHER RESPONDENTS ANY MORE PART 3: INFORMATION ON THE DECEASED OF THE HOUSEHOLD

109
PART 3: INFORMATION ON THE DECEASED OF THE HOUSEHOLD
51. From the 1st of 2014 Lunar New Year (31/01/2014 as solar calendar) to end of 31/3/2015, were there any usual residents of your household died (including infants)?
YES ...............1
NO......... 2 FINALIZE THE COVER PAGE
SERIAL NUMBER
QUESTIONS
THE DECEASED .
THE DECEASED .
THE DECEASED .
52. Please let me know the full-name of each deceased?
53. Is [NAME] male or female? MALE .......................... 1
FEMALE...................... 2
MALE...........................1
FEMALE ......................2
MALE .......................... 1
FEMALE...................... 2
54. In what solar month and year was [NAME] born?
MONTH ..............
YEAR ..
Q 56
YEAR NOT STATED 9998
MONTH ..............
YEAR..
Q 56
YEAR NOT STATED 9998
MONTH ..............
YEAR ..
Q 56
YEAR NOT STATED 9998
55. What was the solar completed age of [NAME] when he/she died?
IF AGE IS 95 OR ABOVE, WRITE ‘95’
COMPLETED AGE......
COMPLETED AGE......
COMPLETED AGE......
56. In what solar month and year did [NAME] die?
MONTH................
YEAR ..................2 0 1
MONTH ...............
YEAR.................. 2 0 1
MONTH ...............
YEAR..................2 0 1
57. Of what reason did [NAME] die?
DISEASES........................1
WORK ACCIDENT...........2
TRAFFIC ACCIDENT....... 3
OTHER ACCIDENT..........4
SUICIDE ...........................5
OTHER _____________ 6
(SPECIFY)
DISEASES ........................1
WORK ACCIDENT ...........2
TRAFFIC ACCIDENT .......3
OTHER ACCIDENT..........4
SUICIDE........................... 5
OTHER _____________ 6
(SPECIFY)
DISEASES ....................... 1
WORK ACCIDENT........... 2
TRAFFIC ACCIDENT ...... 3
OTHER ACCIDENT ......... 4
SUICIDE...........................5
OTHER _____________ 6
(SPECIFY)
58. Where did [NAME] die? HEALTH FACILITY........... 1
AT HOME ........................ 2
AT HOME OF OTHER ..... 3
AT WORK PLACE............ 4
OTHER______________ 5
(SPECIFY)
HEALTH FACILITY........... 1
AT HOME ......................... 2
AT HOME OF OTHER...... 3
AT WORK PLACE ............ 4
OTHER ______________5
(SPECIFY)
HEALTH FACILITY ...........1
AT HOME .........................2
AT HOME OF OTHER ......3
AT WORK PLACE.............4
OTHER ______________5
(SPECIFY)
59. CHECK IF Q 53=02; Q 54, 55 AND 56 (AGE OF DECEASED FROM 15-49); Q57=1 OR Q57=6: BEING WOMEN AGED 15-49 DIE OF DISEASE OR OTHER CAUSES, ASK QUESTION 60. OTHERWISE, MOVE TO QUESTION 61.
60. In which case did [NAME] die?
DURING THE PREGNANCY PERIOD.... 1 AFTER MISCARRIAGE/ ABORTIONS/STILLBIRTH 2 GIVING BIRTH.. ............... 3
42 DAYS OF AFTER BIRTH DELIVERY 4 OTHER______________ 5 (SPECIFY)
DURING THE PREGNANCY PERIOD .... 1 AFTER MISCARRIAGE/ ABORTIONS/STILLBIRTH 2 GIVING BIRTH.................. 3
42 DAYS OF AFTER BIRTH DELIVERY 4 OTHER _____________ 5 (SPECIFY)
DURING THE PREGNANCY PERIOD ....1 AFTER MISCARRIAGE/ ABORTIONS/STILLBIRTH 2 GIVING BIRTH................. 3
42 DAYS OF AFTER BIRTH DELIVERY 4 OTHER _____________ 5 (SPECIFY)
61. IF THERE ARE OTHER DECEASEDS QUESTION 52; NO OTHER DECEASEDS ANY MORE FINALIZE THE COVER PAGE

110
INTERVIEW PROCESS FOR DETERMINATION OF
ACTUALLY USUAL RESIDENTS IN THE HOUSEHOLD
1. Please tell me, who are usually residing in your household for 6 months or more, include persons who working in army and police sectors (write full name of each person in a paper sheet). 2. In your household, are there any one who has just moved in for less than 6 months? (if any, include name of each person in a paper sheet).
3. Are there any newborn babies in your household (only babies is less than six months of age), born before 0 hour 1 April 2015 and living usually in the household? (if any, include name of each of the children in a paper sheet).
4. Please tell me out of these persons, are there any persons who are? (if any, exclude name of each person in a paper sheet).
- Foreigners who do not become Vietnamese citizen, overseas Vietnamese visiting home family? - General school pupils living far from home for school attendant, visitor? - Persons who have been living for less than 6 months and not intend to reside usually in the household? 5. Are there any one who were usually living in your household but are temporarily absent? (if any, include them in.) - Persons who have left home for less than 6 months to go for work in other place and for study inside Viet Nam territory? - In-patient being treated in hospital? - Visitors, pupils staying far from home for school attendant, tourists, etc; (including persons who are going to catch fishes on the sea, going on the ocean vessels, going on trading afar, going on missions)? - Persons who are going on missions, study, going on working, etc in overseas within authorized time duration? - Persons those are imprisoned by army and police? 6. Are there any one who were usually living in your household but were died after 0 hour 1 April 2015 to now? (if any, include them in.) Read the list of household actually usual residents to the household head to certify, and then fill them in the questionnaire.

111
Annex 2: SAMPLE ALLOCATION OF THE 1/4/2015 TIME-POINT
POPULATION CHANGE AND FAMILY PLANNING SURVEY
Province code Name of province Total Urban Rural
WHOLE COUNTRY 7 640 3 043 4 597
1 Ha Noi 160 94 66
2 Ha Giang 120 32 88
4 Cao Bang 120 41 79
6 Bac Kan 120 30 90
8 Tuyen Quang 120 32 88
10 Lao Cai 120 50 70
11 Dien Bien 120 42 78
12 Lai Chau 120 40 80
14 Son La 120 36 84
15 Yen Bai 120 44 76
17 Hoa Binh 120 37 83
19 Thai Nguyen 120 55 65
20 Lang Son 120 43 77
22 Quang Ninh 120 85 35
24 Bac Giang 120 22 98
25 Phu Tho 120 35 85
26 Vinh Phuc 120 48 72
27 Bac Ninh 120 46 74
30 Hai Duong 120 39 81
31 Hai Phong 120 76 44
33 Hung Yen 120 27 93
34 Thai Binh 120 21 99
35 Ha Nam 120 20 100
36 Nam Dinh 120 37 83
37 Ninh Binh 120 38 82
38 Thanh Hoa 120 25 95
40 Nghe An 120 31 89
42 Ha Tinh 120 33 87

112
Annex 2: (Continued)
Province code Name of province Total Urban Rural
44 Quang Binh 120 34 86
45 Quang Tri 120 53 67
46 Thua Thien Hue 120 65 55
48 Da Nang 120 111 9
49 Quang Nam 120 38 82
51 Quang Ngai 120 32 88
52 Binh Dinh 120 52 68
54 Phu Yen 120 44 76
56 Khanh Hoa 120 70 50
58 Ninh Thuan 120 66 54
60 Binh Thuan 120 69 51
62 Kon Tum 120 62 58
64 Gia Lai 120 57 63
66 Dak Lak 120 49 71
67 Dak Nong 120 33 87
68 Lam Dong 120 70 50
70 Binh Phuoc 120 36 84
72 Tay Ninh 120 32 88
74 Binh Duong 120 55 65
75 Dong Nai 120 62 58
77 Ba Ria - Vung Tau 120 82 38
79 Ho Chi Minh City 160 145 15
80 Long An 120 37 83
82 Tien Giang 120 30 90
83 Ben Tre 120 22 98
84 Tra Vinh 120 33 87
86 Vinh Long 120 33 87
87 Dong Thap 120 38 82
89 An Giang 120 54 66
91 Kien Giang 120 51 69
92 Can Tho 120 96 24
93 Hau Giang 120 40 80
94 Soc Trang 120 41 79
95 Bac Lieu 120 50 70
96 Ca Mau 120 42 78

113
Annex 3:
POPULATION DENSITY BY PROVINCE/CITY, 2009 AND 2015
Unit: Person/km2
Province/city 2009 2015 Province/city 2009 2015
ENTIRE COUNTRY 259 276
I. Northern Midlands and Mountains 116 124
III. North and South Central Coast
02. Ha Giang 91 101 49. Quang Nam 136 142
04. Cao Bang 76 78 51. Quang Ngai 236 242
06. Bac Kan 61 64 52. Binh Dinh 246 251
08. Tuyen Quang 124 129 54. Phu Yen 170 176
10. Lao Cai 96 105 56. Khanh Hoa 222 231
11. Dien Bien 51 57 58. Ninh Thuan 168 177
12. Lai Chau 41 47 60. Binh Thuan 150 155
14. Son La 76 83 IV. Central Highlands 93 102 15. Yen Bai 107 115 62. Kon Tum 44 51
17. Hoa Binh 171 178 64. Gia Lai 82 90
19. Thai Nguyen 318 336 66. Dak Lak 132 141
20. Lang Son 88 91 67. Dak Nong 75 90
24. Bac Giang 406 425 68. Lam Dong 121 130
25. Phu Tho 372 387 V. Southeast 594 680
II. Red River Delta 930 991 70. Binh Phuoc 127 137
01. Ha Noi 1 926 2 161 72. Tay Ninh 263 275
22. Quang Ninh 188 198 74. Binh Duong 550 716
26. Vinh Phuc 813 850 75. Dong Nai 421 489 27. Bac Ninh 1 245 1 396 77. Ba Ria - Vung Tau 501 537
30. Hai Duong 1 030 1 070 79. Ho Chi Minh City 3 399 3 868
31. Hai Phong 1 207 1 283 VI. Mekong River Delta 423 433 33. Hung Yen 1 222 1 256 80. Long An 320 330
34. Thai Binh 1 142 1 139 82. Tien Giang 672 688
35. Ha Nam 913 930 83. Ben Tre 532 535
36. Nam Dinh 1 105 1 119 84. Tra Vinh 436 441
37. Ninh Binh 647 684 86. Vinh Long 695 687
III. North and South Central Coast 196 205 87. Dong Thap 493 498
38. Thanh Hoa 305 315 89. An Giang 606 610
40. Nghe An 177 185 91. Kien Giang 265 277
42. Ha Tinh 204 210 92. Can Tho 847 884
44. Quang Binh 105 108 93. Hau Giang 473 480
45. Quang Tri 126 131 94. Soc Trang 389 396
46. Thua Thien Hue 215 226 95. Bac Lieu 331 357 48. Da Nang 691 796 96. Ca Mau 226 230
Source: 2009: The Central Census Steering Committee, "The 2009 Viet Nam Population and Housing Census: Completed Results", The World Publishing House, 6-2010.

114
Annex 4:
SELECTED INDICATORS ABOUT POPULATION STRUCTURE
Code Administrative unit
Urban share of
population (%)
Sex ratio (males/
100 females)
Total dependency
ratio (%)
Ageing index (%)
Proportion of
population aged
15-64 (%)
ENTIRE COUNTRY 33.7 96.9 46.1 47.1 68.4 Urban 33.7 94.5 41.7 50.1 70.6 Rural 98.2 48.5 45.8 67.3
Socio-economic regions R1 Northern Midlands and Mountains 18.1 98.2 50.5 34.7 66.4 R2 Red River Delta 33.9 96.2 49.1 58.8 67.1 R3 North and South Central Coast 28.2 97.3 48.3 52.8 67.4 R4 Central Highlands 29.0 100.6 50.9 25.8 66.3 R5 Southeast 63.0 94.5 38.0 40.8 72.5 R6 Mekong River Delta 25.0 97.8 43.9 50.3 69.5
Provinces/cities 01 Ha Noi 47.7 97.7 48.1 50.1 67.5 02 Ha Giang 15.0 101.0 61.4 19.8 62.0 04 Cao Bang 23.1 95.7 47.7 38.5 67.7 06 Bac Kan 16.6 102.6 41.6 38.7 70.6 08 Tuyen Quang 13.5 97.5 49.6 37.8 66.9 10 Lao Cai 22.9 102.3 50.9 24.3 66.3 11 Dien Bien 15.1 100.5 61.2 18.4 62.0 12 Lai Chau 17.3 100.4 66.7 14.7 60.0 14 Son La 13.7 99.9 56.1 20.5 64.1 15 Yen Bai 20.4 99.3 51.5 33.9 66.0 17 Hoa Binh 14.5 97.0 46.4 37.4 68.3 19 Thai Nguyen 33.1 97.5 45.8 51.6 68.6 20 Lang Son 19.6 101.2 41.3 38.6 70.8 22 Quang Ninh 61.2 100.6 46.6 48.0 68.2 24 Bac Giang 11.3 96.0 47.4 44.9 67.9 25 Phu Tho 18.6 93.6 50.5 52.7 66.4 26 Vinh Phuc 23.3 96.2 49.8 46.0 66.8 27 Bac Ninh 28.3 94.5 52.9 45.0 65.4 30 Hai Duong 23.8 97.6 43.9 70.7 69.5 31 Hai Phong 46.7 95.3 46.1 58.9 68.4 33 Hung Yen 13.1 96.3 51.6 62.3 66.0 34 Thai Binh 10.4 91.8 51.4 87.8 66.1 35 Ha Nam 15.5 94.9 50.7 65.7 66.3 36 Nam Dinh 18.3 94.0 53.5 72.7 65.2 37 Ninh Binh 20.1 94.8 54.0 68.1 64.9 38 Thanh Hoa 15.5 95.6 48.7 60.3 67.2

115
Annex 4: (Continued)
Code Administrative unit
Urban share of
population (%)
Sex ratio (males/
100 females)
Total dependency
ratio (%)
Ageing index (%)
Proportion of
population aged
15-64 (%)
40 Nghe An 15.1 100.8 48.6 46.7 67.3 42 Ha Tinh 17.4 97.3 53.4 66.8 65.2 44 Quang Binh 19.6 98.7 52.0 47.6 65.8 45 Quang Tri 29.2 97.6 58.5 47.3 63.1 46 Thua Thien Hue 48.6 94.8 48.6 55.6 67.3 48 Da Nang 87.3 97.1 43.1 43.1 69.9 49 Quang Nam 22.8 93.0 49.1 59.1 67.1 51 Quang Ngai 16.3 96.5 48.0 64.9 67.6 52 Binh Dinh 31.0 95.5 50.1 57.6 66.6 54 Phu Yen 28.7 102.0 47.5 47.9 67.8 56 Khanh Hoa 44.9 96.8 41.4 46.7 70.7 58 Ninh Thuan 36.2 99.9 47.0 35.0 68.0 60 Binh Thuan 39.3 99.4 44.3 39.7 69.3 62 Kon Tum 35.4 100.7 59.3 20.3 62.8 64 Gia Lai 29.7 98.9 57.1 22.5 63.7 66 Dak Lak 24.3 101.9 46.6 28.7 68.2 67 Dak Nong 15.2 105.8 52.7 17.9 65.5 68 Lam Dong 39.0 98.3 47.0 32.5 68.0 70 Binh Phuoc 21.5 100.1 46.8 30.0 68.1 72 Tay Ninh 21.3 96.1 41.9 45.8 70.5 74 Binh Duong 76.9 94.1 33.3 27.1 75.0 75 Dong Nai 34.7 97.7 41.7 33.8 70.6 77 Ba Ria - Vung Tau 50.9 99.6 41.1 39.1 70.9 79 Ho Chi Minh City 82.0 91.9 36.0 48.3 73.5 80 Long An 18.0 96.5 42.6 53.0 70.1 82 Tien Giang 15.9 95.1 44.1 55.2 69.4 83 Ben Tre 10.3 96.0 43.4 67.0 69.8 84 Tra Vinh 17.5 96.0 45.5 51.0 68.7 86 Vinh Long 16.9 95.5 42.5 57.7 70.2 87 Dong Thap 17.8 99.3 40.6 49.1 71.1 89 An Giang 30.3 97.0 46.9 50.0 68.1 91 Kien Giang 27.3 100.9 47.5 39.5 67.8 92 Can Tho 66.7 97.7 42.6 50.3 70.1 93 Hau Giang 24.4 99.6 42.0 51.3 70.4 94 Soc Trang 30.6 97.6 43.4 47.1 69.7 95 Bac Lieu 26.4 99.5 41.9 48.9 70.5 96 Ca Mau 22.6 101.0 44.7 42.5 69.1

116
Annex 5: SELECTED INDICATORS ABOUT NUPTIALITY
OF THE POPULATION AGED 15 AND OVER
Singulate mean age at marriage-SMAM (Year)
Proportion of population aged 15 and over by (%)
Code Administrative unit
Total Male Female
Difference in SMAM between male and female
Single Currently married
Widowed/ divorced/ separated
ENTIRE COUNTRY 24.9 26.9 22.8 4.1 22.9 68.1 9.0 Urban 26.1 28.0 24.3 3.7 25.9 65.2 8.9 Rural 24.3 26.4 21.9 4.5 21.4 69.6 9.0 Socio-economic regions R1 Northern Midlands
and Mountains 22.6 24.4 20.6 3.8 17.5 74.2 8.3 R2 Red River Delta 24.7 26.7 22.7 4.1 19.7 71.4 8.9 R3 North and South Central
Coast 25.4 27.6 22.9 4.8 24.6 66.4 9.0 R4 Central Highlands 24.5 26.3 22.5 3.8 24.9 67.8 7.3 R5 Southeast 26.1 27.9 24.3 3.7 29.2 61.7 9.1 R6 Mekong River Delta 25.0 27.2 22.6 4.5 21.9 68.2 9.9
Provinces/cities 01 Ha Noi 25.2 26.8 23.7 3.2 22.2 69.6 8.2 02 Ha Giang 21.3 22.4 20.2 2.2 17.1 75.6 7.3 04 Cao Bang 22.3 23.8 20.7 3.1 16.9 73.5 9.6 06 Bac Kan 23.4 25.4 21.1 4.4 18.4 73.2 8.4 08 Tuyen Quang 22.6 25.0 20.1 4.9 16.8 74.6 8.6 10 Lao Cai 22.2 23.9 20.4 3.6 19.0 73.9 7.1 11 Dien Bien 21.4 22.7 20.0 2.7 18.5 74.6 6.8 12 Lai Chau 20.3 21.5 19.0 2.4 16.1 76.8 7.1 14 Son La 20.8 22.3 19.3 2.9 15.6 77.8 6.5 15 Yen Bai 22.4 24.6 20.0 4.6 17.6 74.1 8.3 17 Hoa Binh 23.0 25.1 20.7 4.5 16.6 74.8 8.7 19 Thai Nguyen 24.3 26.3 22.2 4.1 19.1 71.6 9.3 20 Lang Son 23.9 25.7 21.7 4.0 19.5 71.7 8.8 22 Quang Ninh 25.0 27.4 22.5 5.0 19.6 71.9 8.5 24 Bac Giang 23.3 25.3 21.3 4.0 17.4 74.6 8.0 25 Phu Tho 23.6 25.9 21.3 4.6 17.0 73.3 9.7 26 Vinh Phuc 23.6 25.2 21.8 3.5 19.4 71.8 8.9 27 Bac Ninh 23.4 24.9 21.9 3.0 17.7 73.9 8.4 30 Hai Duong 25.2 27.3 23.1 4.2 20.5 70.6 8.8 31 Hai Phong 25.1 27.1 23.1 3.9 19.6 70.8 9.7 33 Hung Yen 23.6 25.8 21.3 4.5 17.6 72.6 9.9 34 Thai Binh 24.7 27.8 21.4 6.3 17.2 72.6 10.2 35 Ha Nam 25.0 27.3 22.5 4.8 20.8 70.0 9.2 36 Nam Dinh 23.9 26.5 21.2 5.3 15.9 74.8 9.3 37 Ninh Binh 24.3 26.9 21.4 5.5 17.3 73.2 9.5 38 Thanh Hoa 23.7 26.0 21.3 4.7 18.1 72.5 9.4

117
Annex 5: (Continued)
Singulate mean age at marriage-SMAM (Year)
Proportion of population aged 15 and over by (%)
Code Administrative unit
Total Male Female
Difference in SMAM between male and female
Single Currently married
Widowed/ divorced/ separated
40 Nghe An 24.9 27.0 22.6 4.5 24.7 67.1 8.1 42 Ha Tinh 25.1 27.9 22.0 6.0 21.7 68.8 9.6 44 Quang Binh 25.8 28.2 23.2 4.9 25.6 65.8 8.6 45 Quang Tri 24.9 27.6 22.1 5.5 23.4 66.9 9.7 46 Thua Thien Hue 26.5 28.6 24.2 4.4 30.1 61.7 8.2 48 Da Nang 26.2 28.2 24.2 4.0 29.0 63.3 7.7 49 Quang Nam 25.5 28.1 22.7 5.4 27.5 62.9 9.6 51 Quang Ngai 25.6 28.0 22.8 5.2 26.0 64.5 9.5 52 Binh Dinh 25.9 28.5 23.0 5.5 23.3 66.8 9.9 54 Phu Yen 25.2 27.6 22.3 5.4 23.4 67.8 8.8 56 Khanh Hoa 27.0 29.2 24.8 4.4 29.5 61.1 9.4 58 Ninh Thuan 26.0 28.1 23.6 4.6 28.5 63.0 8.5 60 Binh Thuan 26.2 28.2 23.9 4.3 27.8 63.0 9.2 62 Kon Tum 24.0 25.6 22.3 3.3 26.0 67.0 7.1 64 Gia Lai 23.3 24.9 21.6 3.4 22.3 70.4 7.3 66 Dak Lak 23.3 24.9 21.6 3.4 25.9 66.3 7.8 67 Dak Nong 24.1 26.0 22.2 3.8 23.5 70.7 5.8 68 Lam Dong 25.3 27.6 22.9 4.6 26.3 66.2 7.4 70 Binh Phuoc 23.3 24.9 21.6 3.4 23.0 67.4 9.7 72 Tay Ninh 25.2 27.5 22.8 4.7 23.7 63.9 12.4 74 Binh Duong 24.4 25.6 23.2 2.4 27.6 65.2 7.2 75 Dong Nai 26.4 28.2 24.6 3.7 29.0 63.1 8.0 77 Ba Ria - Vung Tau 26.8 28.9 24.7 4.1 26.7 64.1 9.2 79 Ho Chi Minh City 26.7 28.6 24.9 3.7 31.4 59.1 9.4 80 Long An 25.1 27.0 23.1 3.9 22.0 68.0 10.0 82 Tien Giang 24.7 26.8 22.5 4.3 20.7 68.8 10.5 83 Ben Tre 25.3 27.7 22.7 5.0 19.2 69.3 11.5 84 Tra Vinh 24.5 26.8 22.0 4.8 20.2 69.4 10.5 86 Vinh Long 25.3 27.6 22.8 4.7 20.4 69.3 10.3 87 Dong Thap 25.3 27.2 23.1 4.1 23.5 66.6 9.8 89 An Giang 24.6 26.7 22.4 4.4 21.2 67.8 11.1 91 Kien Giang 24.4 26.7 22.0 4.7 21.2 69.4 9.5 92 Can Tho 25.1 27.5 22.5 5.1 23.6 66.8 9.6 93 Hau Giang 25.7 28.1 23.1 5.0 23.9 66.7 9.5 94 Soc Trang 25.7 28.1 23.1 5.0 24.6 66.5 8.9 95 Bac Lieu 25.4 27.4 23.2 4.2 24.9 66.9 8.2 96 Ca Mau 24.6 26.5 22.4 4.2 21.1 70.8 8.1

118
Annex 6: SELECTED INDICATORS ABOUT EDUCATION
Literacy rate of population aged 15 and over (%)
Gross attendance rate (%) Net attendance rate (%)
Code Administrative unit Total Male Female Primary Lower-
secondary Higher-
secondary
College and
UniversityPrimary Lower-
secondaryHigher-
secondary
College and
University
ENTIRE COUNTRY 94.9 96.6 93.2 99.8 92.2 69.7 28.5 97.2 89.9 66.3 21.9 Urban 97.6 98.4 96.8 99.4 94.9 79.7 51.8 97.8 93.4 76.2 40.9 Rural 93.4 95.7 91.3 99.9 91.1 65.6 16.4 96.9 88.4 62.2 12.1 Socio-economic regions
R1 Northern Midlands and Mountains 89.9 93.7 86.3 100.5 93.0 64.7 13.6 97.4 89.7 60.7 8.1 R2 Red River Delta 98.2 99.2 97.2 100.1 98.5 86.6 41.6 99.1 97.5 84.5 33.9 R3 North and South Central Coast 95.2 96.9 93.6 98.4 92.8 71.0 27.6 96.3 90.6 67.9 21.6 R4 Central Highlands 90.4 93.1 87.7 98.5 85.9 57.6 10.1 94.1 81.9 53.3 6.7 R5 Southeast 97.3 98.1 96.5 99.8 93.5 70.2 38.6 97.8 91.7 66.3 30.6 R6 Mekong River Delta 92.9 94.9 91.0 100.8 86.3 57.5 21.3 96.7 83.4 53.5 14.8
Provinces/cities 01 Ha Noi 98.5 99.3 97.8 100.4 98.6 89.5 60.2 99.4 97.6 87.1 49.6 02 Ha Giang 74.8 83.0 66.7 98.8 81.3 42.6 4.6 93.2 76.4 37.7 1.3 04 Cao Bang 85.5 89.8 81.4 103.9 86.6 57.0 7.7 97.5 80.8 50.4 1.6 06 Bac Kan 93.9 96.0 91.9 101.4 96.2 69.2 10.4 97.1 90.0 62.2 4.6 08 Tuyen Quang 94.5 96.2 92.9 100.8 96.4 74.9 8.6 98.6 94.0 72.7 3.8 10 Lao Cai 83.3 88.2 78.4 99.5 92.7 49.4 10.3 97.5 91.1 46.9 5.1 11 Dien Bien 75.1 87.1 63.3 99.3 88.0 49.4 6.9 97.3 84.1 45.5 3.9 12 Lai Chau 59.1 72.2 46.4 99.7 83.3 38.4 9.9 95.1 77.2 33.1 1.6 14 Son La 77.7 88.3 67.4 101.8 88.4 48.0 7.2 96.0 81.4 42.4 3.1 15 Yen Bai 89.0 93.0 85.0 100.3 92.7 58.3 9.7 97.4 89.5 54.4 2.9 17 Hoa Binh 96.8 98.1 95.5 100.7 96.6 75.6 7.4 98.9 95.1 71.7 3.5 19 Thai Nguyen 98.4 99.0 97.7 100.6 98.5 83.4 53.2 98.7 97.0 80.1 41.1 20 Lang Son 96.6 98.0 95.4 101.4 96.6 77.1 7.0 98.6 92.7 71.1 3.4

119
Annex 6: (Continued)
Literacy rate of population aged 15 and over (%)
Gross attendance rate (%) Net attendance rate (%)
Code Administrative unit Total Male Female Primary Lower-
secondary Higher-
secondary
College and
UniversityPrimary Lower-
secondaryHigher-
secondary
College and
University
22 Quang Ninh 96.8 97.9 95.6 101.2 97.5 85.8 24.8 99.1 96.6 84.3 17.6 24 Bac Giang 97.7 98.8 96.7 100.4 99.4 80.6 7.1 98.6 96.8 78.0 3.6 25 Phu Tho 97.8 98.8 96.9 99.8 98.1 78.2 20.4 98.8 97.5 76.7 14.8 26 Vinh Phuc 97.8 99.1 96.6 100.7 97.4 83.0 28.1 99.5 97.0 81.0 21.9 27 Bac Ninh 97.5 98.7 96.5 100.0 99.1 86.6 21.6 99.1 97.2 83.2 15.8 30 Hai Duong 98.2 99.3 97.2 98.6 98.4 83.6 32.7 97.8 96.8 82.0 27.1 31 Hai Phong 98.2 99.3 97.3 99.2 98.8 84.8 45.3 99.0 97.8 83.9 35.7 33 Hung Yen 98.0 98.9 97.2 99.7 99.6 80.9 32.5 98.8 97.5 77.4 28.4 34 Thai Binh 98.4 99.3 97.7 100.1 98.3 90.3 20.4 99.4 97.9 89.3 17.9 35 Ha Nam 98.2 99.3 97.2 100.4 98.4 83.4 23.6 99.4 97.6 81.5 19.7 36 Nam Dinh 98.0 99.3 96.9 99.6 98.9 86.2 15.6 99.1 98.2 84.2 12.1 37 Ninh Binh 97.8 99.0 96.7 100.0 97.6 85.0 11.4 98.7 96.0 81.0 8.2 38 Thanh Hoa 96.0 97.4 94.6 101.1 95.7 77.6 18.6 99.0 92.8 74.2 12.5 40 Nghe An 96.9 98.0 96.0 98.6 94.7 67.3 30.0 96.6 92.5 64.9 25.2 42 Ha Tinh 97.6 98.7 96.6 96.5 93.9 81.9 15.0 95.1 91.6 78.7 10.3 44 Quang Binh 97.1 98.3 96.1 100.4 97.0 74.1 14.5 98.3 95.0 71.4 8.0 45 Quang Tri 92.2 95.7 88.9 100.4 94.5 77.9 10.8 98.1 92.0 74.9 2.8 46 Thua Thien Hue 92.6 96.5 88.9 96.0 92.8 65.6 49.0 94.2 89.3 62.3 38.9 48 Da Nang 97.5 98.8 96.4 95.3 92.9 84.3 62.9 94.5 92.3 80.8 51.9 49 Quang Nam 94.8 97.0 92.8 94.0 89.3 69.0 29.4 91.8 87.5 66.7 23.7 51 Quang Ngai 93.7 96.5 91.0 99.4 96.7 74.4 30.0 97.1 93.4 69.5 24.5 52 Binh Dinh 96.1 97.5 94.8 96.5 90.8 69.7 25.7 93.8 89.1 66.1 20.4 54 Phu Yen 93.2 95.6 90.8 100.1 93.8 72.6 26.4 98.0 91.6 70.4 19.3 56 Khanh Hoa 94.8 96.6 93.1 98.4 90.8 65.9 27.7 96.5 89.5 63.8 23.4 58 Ninh Thuan 87.5 89.6 85.5 96.4 79.2 54.2 9.1 93.0 77.1 49.5 5.7

120
Annex 6 (Continued)
Literacy rate of population aged 15 and over (%)
Gross attendance rate (%) Net attendance rate (%)
Code Administrative unit Total Male Female Primary Lower-
secondary Higher-
secondary
College and
UniversityPrimary Lower-
secondaryHigher-
secondary
College and
University
60 Binh Thuan 93.3 94.4 92.3 100.5 88.9 55.2 13.7 98.2 86.7 52.3 10.7 62 Kon Tum 87.9 91.9 83.9 95.9 85.4 46.6 11.9 93.7 81.7 43.7 8.3 64 Gia Lai 84.0 88.0 80.1 99.7 79.0 45.5 5.1 93.7 74.4 42.5 2.8 66 Dak Lak 92.9 95.0 90.8 96.7 88.9 63.4 9.3 92.4 84.7 57.7 5.9 67 Dak Nong 93.7 95.6 91.7 104.1 89.3 66.0 5.7 97.7 84.2 59.2 2.5 68 Lam Dong 92.6 94.7 90.6 97.5 88.6 62.8 18.6 95.1 86.1 59.7 13.7 70 Binh Phuoc 93.4 95.4 91.4 100.7 88.9 62.9 12.6 97.5 86.1 57.5 7.0 72 Tay Ninh 93.3 95.1 91.7 99.1 90.1 56.4 8.7 97.8 89.1 53.6 4.6 74 Binh Duong 97.3 98.1 96.6 99.4 86.3 49.9 26.1 96.5 84.1 47.0 19.6 75 Dong Nai 97.1 98.1 96.1 100.0 92.4 70.9 31.9 97.8 89.9 66.0 25.6 77 Ba Ria - Vung Tau 96.8 97.6 96.1 100.3 94.8 72.8 24.9 98.0 92.9 69.5 19.9 79 Ho Chi Minh City 98.3 98.8 97.9 99.8 96.6 78.2 52.6 98.1 95.3 74.4 42.4 80 Long An 95.2 96.9 93.6 100.6 92.7 69.9 15.8 98.3 90.8 65.8 10.8 82 Tien Giang 94.9 96.5 93.3 100.3 91.4 60.3 27.1 98.7 89.7 57.2 17.9 83 Ben Tre 94.6 96.6 92.7 99.3 93.1 68.0 13.9 97.8 91.8 65.3 7.3 84 Tra Vinh 88.3 92.2 84.6 100.6 86.8 61.7 22.2 96.8 83.9 57.8 14.2 86 Vinh Long 93.7 95.3 92.2 99.0 92.6 74.9 35.0 98.0 91.2 71.0 25.4 87 Dong Thap 93.6 95.1 92.2 99.9 89.3 53.2 21.5 96.7 86.8 50.0 16.5 89 An Giang 90.5 92.6 88.5 101.0 84.6 53.7 21.8 96.8 81.8 51.2 16.2 91 Kien Giang 91.3 93.6 89.0 102.5 83.0 51.8 12.7 96.7 78.7 47.9 7.0 92 Can Tho 94.2 95.5 93.0 99.0 87.0 61.0 37.5 96.9 85.0 57.7 27.6 93 Hau Giang 94.3 96.1 92.5 102.5 86.4 52.2 17.4 97.5 82.8 47.9 10.8 94 Soc Trang 88.5 92.3 84.8 100.2 76.9 47.9 18.2 93.0 72.6 42.1 12.1 95 Bac Lieu 94.1 95.5 92.7 103.2 79.7 49.1 19.5 94.5 75.3 42.2 14.8 96 Ca Mau 95.6 96.9 94.3 102.6 80.2 47.5 17.8 94.8 75.8 40.7 11.9

121
Annex 7: SELECTED INDICATORS ABOUT HIGHEST TRAINING LEVEL ATTAINED WITHIN THE POPULATION
AGED 15 AND OVER
Proportion of population by education level (%) Proportion of population by professional
and technical qualifications (%) Code Administrative unit
Never attended
Not completed primary
Completed primary
Completed lower-
secondary
Completed higher-
secondary
Completed short-term
training
Completed vocational
Completed college
Completed bachelor
and higher
ENTIRE COUNTRY 4.6 11.8 22.9 29.5 15.5 0.8 4.6 2.8 7.4 Urban 2.2 7.6 18.0 24.0 21.4 1.2 6.4 3.9 15.3 Rural 5.9 14.0 25.5 32.4 12.4 0.6 3.6 2.2 3.3 Socio-economic regions
R1 Northern Midlands and Mountains 9.7 9.6 20.6 31.3 13.1 1.2 6.2 3.0 5.3 R2 Red River Delta 1.6 4.8 12.3 38.9 20.5 1.4 6.5 3.8 10.2 R3 North and South Central Coast 4.2 10.8 22.3 31.6 15.3 0.8 5.0 3.2 6.7 R4 Central Highlands 9.0 11.4 26.6 29.2 11.3 0.6 3.8 2.3 5.6 R5 Southeast 2.5 10.3 24.8 25.0 20.4 0.3 3.3 2.8 10.5 R6 Mekong River Delta 6.3 24.1 34.6 19.1 8.3 0.3 2.1 1.3 4.0
Provinces/cities 01 Ha Noi 1.3 4.0 10.9 28.3 24.4 1.5 8.0 4.1 17.4 02 Ha Giang 24.3 13.7 21.7 20.7 8.6 0.4 4.7 1.8 4.1 04 Cao Bang 13.7 12.7 20.8 21.3 12.3 1.8 8.9 3.2 5.3 06 Bac Kan 5.6 11.5 26.6 29.6 13.3 0.4 5.3 2.6 5.1 08 Tuyen Quang 5.0 10.8 21.6 31.9 16.3 1.2 5.9 2.8 4.5 10 Lao Cai 16.3 10.6 19.7 29.0 9.2 1.1 6.1 2.5 5.6 11 Dien Bien 25.1 12.1 21.5 21.5 5.3 0.9 5.7 3.0 4.9 12 Lai Chau 39.7 11.0 17.2 17.7 3.2 0.7 4.8 1.9 3.9 14 Son La 22.1 10.9 19.3 24.1 10.3 1.3 5.0 2.3 4.7 15 Yen Bai 10.2 9.3 20.8 32.7 11.1 1.7 6.7 2.6 5.1 17 Hoa Binh 2.7 8.9 24.9 33.7 13.8 1.5 6.7 3.0 4.8 19 Thai Nguyen 1.4 6.2 17.1 35.8 17.0 2.3 6.9 4.6 8.8 20 Lang Son 2.8 12.4 24.9 29.9 15.0 0.9 6.1 3.3 4.7

122
Annex 7 (Continued)
Proportion of population by education level (%) Proportion of population by professional and
technical qualifications (%) Code Administrative unit
Never attended
Not completed primary
Completed primary
Completed lower-
secondary
Completed higher-
secondary
Completed short-term
training
Completed vocational
Completed college
Completed bachelor
and higher
22 Quang Ninh 2.9 6.7 14.3 29.1 17.0 5.5 10.1 4.6 9.7 24 Bac Giang 2.1 7.4 22.0 39.0 14.9 0.9 5.2 3.3 5.3 25 Phu Tho 2.1 6.7 16.3 40.1 17.5 1.2 7.7 2.9 5.4 26 Vinh Phuc 1.8 5.8 16.3 38.9 21.7 0.8 5.1 3.6 6.0 27 Bac Ninh 1.9 8.0 17.3 37.4 16.7 1.3 5.7 4.0 7.7 30 Hai Duong 1.4 3.8 9.4 48.5 22.5 0.7 5.1 3.0 5.6 31 Hai Phong 1.6 4.4 12.1 35.6 23.2 1.2 7.4 3.8 10.6 33 Hung Yen 1.5 5.8 12.4 46.3 19.7 1.3 4.8 3.3 4.8 34 Thai Binh 1.1 3.6 11.1 56.2 17.6 0.6 3.3 2.7 3.7 35 Ha Nam 1.7 4.7 12.9 48.9 16.1 1.2 4.8 4.5 5.2 36 Nam Dinh 1.7 6.3 14.8 50.2 12.8 0.7 5.1 3.6 4.8 37 Ninh Binh 2.1 5.1 13.2 48.3 13.3 1.5 7.3 3.3 6.0 38 Thanh Hoa 3.4 8.0 18.5 36.0 16.5 1.3 6.6 3.2 6.4 40 Nghe An 2.6 5.7 15.3 38.7 21.2 1.4 5.7 3.4 6.0 42 Ha Tinh 2.0 5.0 14.2 43.2 18.5 1.3 6.3 3.6 5.9 44 Quang Binh 2.6 7.6 19.5 38.6 14.4 1.1 6.7 2.6 7.1 45 Quang Tri 7.6 10.3 22.0 31.0 11.5 1.1 6.0 3.0 7.6 46 Thua Thien Hue 6.5 14.4 26.1 21.9 14.8 0.5 3.8 2.9 9.0 48 Da Nang 2.2 6.0 15.1 25.0 24.5 0.5 5.5 5.2 16.0 49 Quang Nam 3.6 14.6 25.2 29.3 13.9 0.3 3.9 3.8 5.4 51 Quang Ngai 5.8 13.2 26.1 29.7 11.9 0.5 4.3 3.5 5.0 52 Binh Dinh 3.2 14.8 29.3 30.3 11.1 0.4 3.0 2.2 5.7 54 Phu Yen 5.8 14.4 27.7 28.0 10.8 0.4 4.1 3.0 5.8 56 Khanh Hoa 4.8 12.3 28.6 25.3 13.9 0.4 3.9 3.5 7.3 58 Ninh Thuan 11.3 21.7 30.4 18.6 7.1 0.2 3.1 2.3 5.3

123
Annex 7 (Continued)
Proportion of population by education level (%) Proportion of population by professional and
technical qualifications (%) Code Administrative unit
Never attended
Not completed primary
Completed primary
Completed lower-
secondary
Completed higher-
secondary
Completed short-term
training
Completed vocational
Completed college
Completed bachelor
and higher
60 Binh Thuan 6.3 19.2 34.1 21.5 8.0 0.4 3.5 2.5 4.5 62 Kon Tum 10.8 13.8 25.6 26.5 9.3 0.5 3.9 2.7 6.9 64 Gia Lai 15.9 13.1 27.1 25.2 7.8 0.9 3.7 1.7 4.6 66 Dak Lak 6.1 10.8 26.2 30.9 12.7 0.6 4.3 2.5 5.8 67 Dak Nong 6.4 10.5 29.8 32.6 10.6 0.3 3.5 2.0 4.3 68 Lam Dong 6.6 10.3 25.7 30.4 14.1 0.4 3.5 2.5 6.5 70 Binh Phuoc 6.5 14.3 32.0 27.4 9.9 0.4 3.0 1.9 4.5 72 Tay Ninh 6.0 20.3 35.4 21.7 8.0 0.4 2.9 1.4 3.9 74 Binh Duong 2.3 12.0 28.5 27.2 18.2 0.5 3.4 2.5 5.3 75 Dong Nai 2.7 10.3 25.3 28.4 20.3 0.3 3.4 2.9 6.4 77 Ba Ria - Vung Tau 2.7 12.3 28.2 24.6 14.4 0.6 5.0 3.2 8.9 79 Ho Chi Minh City 1.6 7.9 21.2 23.6 24.5 0.3 3.1 3.1 14.8 80 Long An 4.1 21.1 35.5 22.6 8.6 0.3 2.4 1.8 3.7 82 Tien Giang 4.2 23.1 34.8 21.2 8.1 0.6 3.1 1.8 3.1 83 Ben Tre 4.8 26.6 33.5 19.7 7.7 0.2 2.7 1.4 3.5 84 Tra Vinh 10.6 23.9 31.2 18.0 8.4 0.1 1.9 1.3 4.6 86 Vinh Long 5.2 21.0 33.0 20.1 11.7 0.5 2.3 1.7 4.6 87 Dong Thap 5.6 23.9 35.9 19.8 8.0 0.1 1.7 1.3 3.7 89 An Giang 8.8 28.5 31.9 15.5 7.5 0.5 2.2 1.0 4.1 91 Kien Giang 8.0 24.0 34.4 19.2 6.9 0.2 1.9 1.2 4.1 92 Can Tho 5.0 20.6 31.1 19.0 11.5 0.5 2.9 1.9 7.5 93 Hau Giang 4.9 24.7 38.5 19.4 7.6 0.1 1.2 0.7 2.7 94 Soc Trang 10.4 26.8 34.5 16.0 7.2 0.2 1.4 1.0 2.6 95 Bac Lieu 4.6 22.5 39.5 19.9 8.1 0.3 1.4 0.7 3.1 96 Ca Mau 3.9 23.4 39.2 19.3 7.6 0.1 1.7 0.6 4.0

124
Annex 8:
SELECTED INDICATORS ABOUT FAMILY PLANNING IMPLEMENTATION
Any contraceptive prevalence rate (%)
Modern contraceptive prevalence rate (%)
Other contraceptive prevalence rate (%) Code Administrative unit
Total Urban Rural Total Urban Rural Total Urban Rural
ENTIRE COUNTRY 75.7 73.4 76.8 65.0 62.5 66.2 10.7 10.8 10.6
Socio-economic regions
R1 Northern Midlands and Mountains 76.3 73.8 76.8 65.7 60.8 66.7 10.5 12.9 10.1
R2 Red River Delta 76.7 76.0 77.1 66.3 64.9 67.0 10.4 11.0 10.1
R3 North and South Central Coast 76.1 75.1 76.5 65.7 64.0 66.4 10.4 11.1 10.1
R4 Central Highlands 76.2 78.2 75.3 61.3 60.8 61.5 14.8 17.3 13.8
R5 Southeast 71.0 69.0 74.4 61.1 60.2 62.4 10.0 8.8 11.9
R6 Mekong River Delta 77.7 75.4 78.4 66.8 63.9 67.7 10.8 11.5 10.6
Provinces/cities
01 Ha Noi 76.0 76.0 76.0 68.5 67.8 69.0 7.6 8.3 6.9
02 Ha Giang 73.1 70.4 73.5 70.5 62.8 71.9 2.6 7.5 1.7
04 Cao Bang 80.6 74.1 82.5 77.5 67.4 80.5 3.0 6.6 2.0
06 Bac Kan 82.9 80.8 83.3 79.0 76.1 79.5 3.9 4.7 3.7
08 Tuyen Quang 76.5 68.7 77.5 64.4 58.3 65.2 12.1 10.3 12.3
10 Lao Cai 76.5 76.0 76.7 69.9 59.0 73.1 6.6 17.0 3.6
11 Dien Bien 74.5 78.3 73.8 67.7 68.9 67.4 6.8 9.4 6.3
12 Lai Chau 73.8 75.5 73.4 70.6 61.3 72.7 3.1 14.2 0.6
14 Son La 76.0 75.0 76.2 69.3 66.2 69.8 6.7 8.8 6.4
15 Yen Bai 76.3 77.1 76.2 63.6 60.4 64.4 12.7 16.7 11.8
17 Hoa Binh 83.5 80.1 84.0 71.0 64.7 72.0 12.5 15.2 12.0
19 Thai Nguyen 77.4 73.1 79.3 60.5 55.0 63.1 16.8 18.2 16.1
20 Lang Son 75.4 72.3 76.1 69.5 63.2 71.0 5.8 9.0 5.1
22 Quang Ninh 80.2 78.6 82.8 65.8 65.7 65.9 14.4 12.9 16.8
24 Bac Giang 75.5 72.5 75.8 60.5 57.4 60.9 14.9 15.0 14.9
25 Phu Tho 72.3 68.8 73.0 53.6 56.3 53.0 18.7 12.3 20.0
26 Vinh Phuc 76.7 76.0 76.9 69.8 69.9 69.8 6.9 6.1 7.1
27 Bac Ninh 73.4 74.1 73.2 54.2 51.9 55.2 19.2 22.2 18.0
30 Hai Duong 75.1 75.4 75.0 67.8 66.7 68.1 7.2 8.4 6.9
31 Hai Phong 77.5 73.9 80.5 63.9 58.9 68.1 13.6 15.0 12.4
33 Hung Yen 75.3 73.9 75.6 63.7 61.3 64.1 11.6 12.6 11.5
34 Thai Binh 79.1 79.8 79.0 69.0 59.7 70.1 10.0 20.1 8.9
35 Ha Nam 78.6 75.1 79.2 72.8 70.6 73.2 5.7 4.5 6.0
36 Nam Dinh 78.9 77.9 79.2 65.3 64.5 65.5 13.6 13.3 13.7
37 Ninh Binh 75.3 73.8 75.6 60.2 59.1 60.5 15.0 14.7 15.1
38 Thanh Hoa 79.6 76.2 80.3 67.6 60.3 69.0 11.8 15.6 11.1

125
Annex 8 (Continued)
Any contraceptive prevalence rate (%)
Modern contraceptive prevalence rate (%)
Other contraceptive prevalence rate (%) Code Administrative unit
Total Urban Rural Total Urban Rural Total Urban Rural
40 Nghe An 73.3 76.9 72.7 67.3 69.8 66.8 6.1 7.1 5.9
42 Ha Tinh 67.1 69.7 66.5 61.6 63.5 61.2 5.4 6.3 5.3
44 Quang Binh 75.9 77.6 75.5 65.7 64.5 66.0 10.2 13.1 9.4
45 Quang Tri 76.7 78.1 76.1 61.6 60.7 61.9 15.1 17.4 14.1
46 Thua Thien Hue 74.1 74.1 74.1 61.4 64.8 58.2 12.7 9.3 15.9
48 Da Nang 70.2 69.3 76.5 56.6 55.7 63.0 13.6 13.6 13.6
49 Quang Nam 74.3 73.2 74.6 65.9 66.8 65.6 8.4 6.4 9.0
51 Quang Ngai 78.6 78.2 78.7 71.4 69.8 71.7 7.2 8.4 7.0
52 Binh Dinh 78.9 76.0 80.2 65.7 65.4 65.9 13.2 10.6 14.4
54 Phu Yen 79.6 79.3 79.7 64.1 69.8 61.9 15.4 9.5 17.7
56 Khanh Hoa 76.1 75.4 76.6 62.3 62.9 61.9 13.7 12.5 14.7
58 Ninh Thuan 75.7 77.0 75.0 64.9 63.9 65.4 10.9 13.1 9.6
60 Binh Thuan 81.2 80.1 81.9 72.3 71.7 72.7 8.9 8.4 9.2
62 Kon Tum 71.3 78.5 66.8 62.9 67.4 60.2 8.4 11.1 6.7
64 Gia Lai 74.2 79.0 72.1 60.2 64.1 58.5 14.0 14.9 13.6
66 Dak Lak 76.9 79.2 76.2 59.9 53.9 61.9 17.0 25.3 14.3
67 Dak Nong 76.9 76.2 77.1 61.7 60.3 62.0 15.2 15.9 15.1
68 Lam Dong 78.8 76.8 80.0 64.0 62.2 65.0 14.8 14.5 15.0
70 Binh Phuoc 77.8 75.2 78.5 68.5 63.1 69.9 9.3 12.1 8.5
72 Tay Ninh 76.1 73.4 76.8 68.3 64.3 69.3 7.8 9.1 7.5
74 Binh Duong 74.6 74.0 77.0 62.1 61.3 65.0 12.5 12.7 12.0
75 Dong Nai 70.8 69.7 71.4 54.5 57.2 53.1 16.2 12.5 18.2
77 Ba Ria - Vung Tau 76.1 74.8 77.5 66.5 66.1 67.0 9.5 8.7 10.4
79 Ho Chi Minh City 67.8 66.5 72.7 60.4 59.6 63.7 7.3 6.9 9.1
80 Long An 78.3 78.8 78.2 71.5 72.0 71.4 6.8 6.8 6.8
82 Tien Giang 81.8 80.2 82.1 65.5 63.7 65.8 16.3 16.5 16.3
83 Ben Tre 77.9 74.6 78.2 60.6 58.4 60.8 17.3 16.2 17.5
84 Tra Vinh 75.6 68.7 77.1 56.1 49.0 57.6 19.5 19.8 19.5
86 Vinh Long 76.9 70.4 78.1 63.9 57.1 65.2 13.0 13.3 13.0
87 Dong Thap 79.1 74.4 80.1 72.5 67.2 73.6 6.7 7.3 6.5
89 An Giang 79.6 78.9 79.8 71.9 68.7 73.2 7.7 10.2 6.6
91 Kien Giang 74.5 72.7 75.2 62.8 59.2 64.2 11.7 13.5 11.0
92 Can Tho 74.2 74.2 74.1 61.8 60.6 64.4 12.3 13.6 9.8
93 Hau Giang 81.1 81.9 80.8 72.4 72.2 72.4 8.7 9.7 8.4
94 Soc Trang 77.0 73.7 78.5 70.5 67.2 72.0 6.5 6.4 6.5
95 Bac Lieu 77.3 74.9 78.1 71.0 69.8 71.4 6.3 5.1 6.7
96 Ca Mau 74.6 74.9 74.4 64.9 62.4 65.6 9.7 12.6 8.9

126
Annex 9: SELECTED INDICATORS ABOUT FERTILITY
Rate of women aged 15-49 having third and higher order births (%) Code Administrative unit
Total fertility rate(Children/
woman)
Crude birth rate
(Live births/ 1000 persons) Total Urban Rural
ENTIRE COUNTRY 2.10 16.20 15.83 10.77 18.04 Urban 1.82 15.30 10.77 Rural 2.25 16.65 18.04
Socio-economic regions R1 Northern Midlands and Mountains 2.69 20.87 15.12 7.26 16.63R2 Red River Delta 2.23 16.21 17.94 13.26 20.01R3 North and South Central Coast 2.34 16.89 19.32 14.56 20.97R4 Central Highlands 2.26 17.30 24.46 14.97 27.34R5 Southeast 1.63 15.13 10.53 8.09 14.11R6 Mekong River Delta 1.76 12.91 10.33 8.08 11.07
Provinces/cities 01 Ha Noi 2.04 16.35 17.65 13.53 20.6202 Ha Giang 2.93 23.68 27.18 11.39 29.5004 Cao Bang 2.52 19.32 11.24 2.93 13.6706 Bac Kan 2.42 18.69 7.31 7.40 7.2908 Tuyen Quang 2.74 20.48 11.92 4.79 12.8110 Lao Cai 2.26 18.59 14.59 6.42 17.1111 Dien Bien 2.81 23.42 29.28 7.93 32.0912 Lai Chau 3.11 25.31 26.35 10.45 29.2514 Son La 2.82 23.71 19.59 11.71 20.6115 Yen Bai 2.76 20.94 14.81 5.20 16.7917 Hoa Binh 2.84 21.03 9.17 7.50 9.3419 Thai Nguyen 2.52 18.99 9.99 6.60 11.6920 Lang Son 2.38 18.78 7.49 7.98 7.3622 Quang Ninh 2.20 15.44 12.30 8.65 17.2724 Bac Giang 2.77 21.18 12.17 6.57 12.6725 Phu Tho 2.61 19.08 12.11 6.50 13.4926 Vinh Phuc 2.25 17.68 13.37 11.12 14.0627 Bac Ninh 2.72 22.07 24.88 17.73 27.6030 Hai Duong 2.00 14.45 15.17 19.70 14.2331 Hai Phong 2.02 15.20 9.87 10.97 8.9133 Hung Yen 2.40 16.81 13.93 9.95 14.4734 Thai Binh 2.39 13.34 25.84 20.77 26.4535 Ha Nam 2.22 15.17 23.83 18.32 24.6436 Nam Dinh 2.81 16.56 23.23 15.55 24.5237 Ninh Binh 2.76 17.66 18.88 10.06 21.2438 Thanh Hoa 2.75 18.76 12.99 4.38 14.65

127
Annex 9 (Continued)
Rate of women aged 15-49 having third and higher order births (%) Code Administrative unit
Total fertility rate(Children/
woman)
Crude birth rate
(Live births/ 1000 persons) Total Urban Rural
40 Nghe An 2.69 20.70 23.10 17.14 24.0642 Ha Tinh 2.65 16.60 23.96 26.76 23.3744 Quang Binh 2.52 17.46 27.82 19.07 29.8945 Quang Tri 2.94 18.34 25.82 20.03 28.6246 Thua Thien Hue 2.26 15.78 24.97 24.18 25.6848 Da Nang 2.13 17.55 12.61 11.68 17.9149 Quang Nam 2.17 15.67 19.78 12.50 21.3851 Quang Ngai 1.93 13.50 17.04 11.01 18.3452 Binh Dinh 2.14 13.88 22.08 17.28 24.0954 Phu Yen 2.05 14.35 14.95 15.37 14.8356 Khanh Hoa 1.75 13.64 12.34 7.53 14.9658 Ninh Thuan 2.23 16.72 19.29 7.05 25.4760 Binh Thuan 2.04 15.36 21.52 20.38 22.1662 Kon Tum 2.49 19.60 27.03 7.83 34.1264 Gia Lai 2.45 19.72 27.28 17.82 30.2266 Dak Lak 2.22 16.76 21.04 16.96 21.9967 Dak Nong 2.36 17.69 35.35 14.75 39.1668 Lam Dong 1.98 14.37 18.59 13.12 21.2470 Binh Phuoc 2.05 15.67 15.42 13.29 15.9272 Tay Ninh 1.88 15.10 8.38 8.80 8.2874 Binh Duong 1.59 18.59 11.88 10.82 15.1875 Dong Nai 2.02 17.66 14.90 10.65 16.9977 Ba Ria - Vung Tau 1.56 12.53 18.19 12.28 24.2679 Ho Chi Minh City 1.45 13.69 6.79 6.22 8.9880 Long An 1.61 12.28 7.64 7.85 7.6082 Tien Giang 1.62 11.84 7.38 0.00 8.6983 Ben Tre 1.97 12.34 9.32 4.22 9.7384 Tra Vinh 2.04 14.52 8.28 3.12 9.3486 Vinh Long 1.61 11.34 9.08 7.51 9.3587 Dong Thap 1.61 12.32 11.93 7.89 12.6089 An Giang 1.73 12.46 13.25 11.83 13.7991 Kien Giang 2.05 14.80 12.50 10.56 13.1592 Can Tho 1.88 14.32 10.28 8.48 14.1793 Hau Giang 1.64 12.14 10.61 9.31 11.0394 Soc Trang 1.72 12.86 11.23 8.53 13.2295 Bac Lieu 1.67 12.89 12.00 7.41 13.3596 Ca Mau 1.80 13.69 8.28 5.53 8.99

128
Annex 10: SELECTED INDICATORS ABOUT MORTALITY
Life expectancy at birth (Year)
Code Administrative unit
Crude death rate
(Deaths/ 1000
persons)
Infant mortality
rate (Infant deaths/
1000 live births)
Under five mortality
rate (Under five
deaths/ 1000 live births)
Total Male Female
ENTIRE COUNTRY 6.81 14.73 22.12 73.3 70.7 76.1 Urban 5.83 8.59 12.95 76.0 73.4 78.7 Rural 7.31 17.60 26.49 72.2 69.6 75.0
Socio-economic regions R1 Northern Midlands and Mountains 7.89 22.01 33.36 70.8 68.0 73.7 R2 Red River Delta 7.44 11.68 17.47 74.5 72.1 77.1 R3 North and South Central Coast 7.11 16.30 24.52 72.7 70.1 75.5 R4 Central Highlands 5.44 24.78 37.69 69.9 67.1 72.9 R5 Southeast 5.12 8.58 12.94 76.0 73.4 78.7 R6 Mekong River Delta 7.00 11.39 17.03 74.7 72.2 77.2
Provinces/cities 01 Ha Noi 7.27 10.16 15.18 75.2 72.8 77.7 02 Ha Giang 7.27 33.59 51.80 67.4 64.5 70.4 04 Cao Bang 12.78 23.90 36.32 70.2 67.4 73.1 06 Bac Kan 8.88 17.61 26.50 72.2 69.6 75.0 08 Tuyen Quang 8.02 18.57 27.99 71.9 69.2 74.7 10 Lao Cai 5.13 28.76 44.02 68.7 65.8 71.8 11 Dien Bien 6.09 33.78 52.11 67.3 64.5 70.4 12 Lai Chau 8.70 41.85 65.86 65.2 62.3 68.4 14 Son La 6.40 22.85 34.67 70.5 67.7 73.5 15 Yen Bai 7.91 26.93 41.08 69.2 66.4 72.3 17 Hoa Binh 10.44 17.39 26.16 72.3 69.7 75.1 19 Thai Nguyen 8.31 14.72 22.11 73.3 70.7 76.1 20 Lang Son 10.43 18.30 27.57 72.0 69.3 74.8 22 Quang Ninh 8.23 15.08 22.66 73.2 70.6 75.9 24 Bac Giang 5.22 15.32 23.02 73.1 70.5 75.8 25 Phu Tho 9.04 15.07 22.64 73.2 70.6 75.9 26 Vinh Phuc 6.43 12.89 19.33 74.0 71.5 76.7 27 Bac Ninh 6.26 12.83 19.23 74.1 71.5 76.7 30 Hai Duong 7.76 11.72 17.54 74.5 72.1 77.1 31 Hai Phong 7.09 12.00 17.96 74.4 71.9 77.0 33 Hung Yen 7.18 12.24 18.33 74.3 71.8 76.9 34 Thai Binh 10.04 10.27 15.34 75.2 72.8 77.7 35 Ha Nam 6.24 12.03 18.00 74.4 71.9 77.0 36 Nam Dinh 7.28 12.55 18.81 74.2 71.7 76.8 37 Ninh Binh 7.11 14.34 21.53 73.5 70.9 76.2 38 Thanh Hoa 9.12 15.47 23.25 73.0 70.4 75.8

129
Annex 10 (Continued)
Life expectancy at birth (Year)
Code Administrative unit
Crude death rate
(Deaths/ 1000
persons)
Infant mortality
rate (Infant deaths/
1000 live births)
Under five mortality
rate (Under five
deaths/ 1000 live
births)
Total Male Female
40 Nghe An 7.72 16.80 25.28 72.5 69.9 75.3 42 Ha Tinh 7.65 17.12 25.75 72.4 69.8 75.2 44 Quang Binh 5.15 16.97 25.53 72.5 69.9 75.2 45 Quang Tri 6.73 31.88 49.04 67.8 65.0 70.9 46 Thua Thien Hue 5.83 19.99 30.20 71.4 68.7 74.3 48 Da Nang 6.54 8.83 13.20 75.9 73.5 78.4 49 Quang Nam 6.45 16.64 25.02 72.6 70.0 75.4 51 Quang Ngai 7.04 17.86 26.88 72.1 69.5 74.9 52 Binh Dinh 5.66 15.12 22.72 73.2 70.6 75.9 54 Phu Yen 6.94 15.17 22.79 73.1 70.6 75.9 56 Khanh Hoa 6.14 13.99 21.01 73.6 71.0 76.3 58 Ninh Thuan 6.37 16.37 24.62 72.7 70.1 75.5 60 Binh Thuan 6.56 12.53 18.78 74.2 71.7 76.8 62 Kon Tum 5.36 38.07 59.30 66.2 63.3 69.3 64 Gia Lai 7.10 26.26 40.02 69.4 66.6 72.4 66 Dak Lak 4.98 23.98 36.44 70.1 67.3 73.1 67 Dak Nong 3.92 25.69 39.12 69.6 66.8 72.6 68 Lam Dong 5.02 16.34 24.57 72.7 70.1 75.5 70 Binh Phuoc 6.29 14.05 21.08 73.6 71.0 76.3 72 Tay Ninh 7.80 11.77 17.61 74.5 72.0 77.1 74 Binh Duong 3.84 8.96 13.39 75.8 73.4 78.3 75 Dong Nai 5.55 7.66 11.55 76.4 73.9 79.2 77 Ba Ria - Vung Tau 4.47 8.15 12.29 76.2 73.6 78.9 79 Ho Chi Minh City 4.85 7.73 12.29 76.2 73.6 78.9 80 Long An 8.48 9.55 14.27 75.5 73.1 78.0 82 Tien Giang 6.06 9.12 13.64 75.7 73.3 78.2 83 Ben Tre 9.12 9.80 14.64 75.4 73.0 77.9 84 Tra Vinh 7.43 12.29 18.41 74.3 71.8 76.9 86 Vinh Long 6.55 10.12 15.11 75.2 72.8 77.8 87 Dong Thap 7.30 11.86 17.76 74.5 72.0 77.1 89 An Giang 7.54 14.37 21.57 73.4 70.9 76.2 91 Kien Giang 7.08 12.56 18.81 74.2 71.7 76.8 92 Can Tho 7.29 9.29 13.89 75.6 73.2 78.2 93 Hau Giang 6.40 10.07 15.04 75.3 72.9 77.8 94 Soc Trang 4.76 13.10 19.65 73.9 71.4 76.6 95 Bac Lieu 6.80 12.12 18.15 74.4 71.9 77.0 96 Ca Mau 5.44 11.30 16.89 74.7 72.3 77.3

130
Annex 11: SELECTED INDICATORS ABOUT MIGRATION 1 YEAR PRIOR
TO THE SURVEY TIME POINT
In-migration rate (In-migrants per 1000 persons)
Out-migration rate (Out-migrants per
1000 persons)
Net-migration rate (Net-migrants per thousand persons) Code Administrative unit
Total Male Female Total Male Female Total Male Female
Socio-economic regions 3.7 3.6 3.9 3.7 3.6 3.9 0.0 0.0 0.0R1 Northern Midlands and
Mountains 1.1 0.9 1.3 3.0 2.2 3.7 -1.8 -1.2 -2.4R2 Red River Delta 1.8 1.3 2.3 1.8 1.8 1.8 0.0 -0.5 0.4R3 North and South Central Coast 2.6 2.9 2.4 4.4 4.2 4.6 -1.8 -1.3 -2.2R4 Central Highlands 2.3 2.1 2.5 3.4 2.8 3.9 -1.1 -0.7 -1.4R5 Southeast 12.8 12.6 13.0 3.1 3.5 2.6 9.8 9.1 10.4R6 Mekong River Delta 1.1 1.2 1.1 6.5 6.2 6.8 -5.4 -5.1 -5.7
Provinces/cities 5.5 5.1 5.8 5.5 5.1 5.8 0.0 0.0 0.001 Ha Noi 4.7 3.5 5.8 4.1 4.1 4.2 0.6 -0.5 1.602 Ha Giang 1.1 1.1 1.1 2.7 1.2 4.2 -1.5 0.0 -3.004 Cao Bang 4.0 4.9 3.1 4.0 2.4 5.6 -0.1 2.5 -2.506 Bac Kan 2.2 2.5 1.9 2.5 1.2 3.8 -0.3 1.3 -1.908 Tuyen Quang 1.4 0.7 2.1 3.8 3.5 4.2 -2.4 -2.7 -2.1
10 Lao Cai 1.9 1.5 2.3 4.8 3.7 6.0 -2.9 -2.1 -3.711 Dien Bien 2.0 1.8 2.3 1.4 0.5 2.3 0.6 1.3 0.012 Lai Chau 1.6 1.4 1.9 16.7 13.0 20.4 -15.1 -11.7 -18.514 Son La 0.6 0.3 0.9 1.9 0.9 2.8 -1.3 -0.6 -1.915 Yen Bai 2.2 1.1 3.4 3.3 2.3 4.4 -1.1 -1.2 -1.0
17 Hoa Binh 1.8 1.9 1.7 3.4 2.7 4.0 -1.6 -0.8 -2.419 Thai Nguyen 3.5 2.0 4.9 4.9 3.7 6.0 -1.4 -1.7 -1.120 Lang Son 2.4 2.2 2.5 5.3 4.1 6.6 -2.9 -1.8 -4.022 Quang Ninh 1.7 1.5 1.8 3.6 2.9 4.4 -2.0 -1.4 -2.524 Bac Giang 3.1 1.9 4.2 4.2 3.2 5.2 -1.1 -1.3 -1.025 Phu Tho 2.7 1.3 3.9 3.4 1.8 5.0 -0.8 -0.5 -1.0
26 Vinh Phuc 2.8 0.9 4.7 4.3 4.8 3.8 -1.4 -3.9 0.927 Bac Ninh 16.0 14.4 17.5 3.2 1.1 5.1 12.8 13.3 12.430 Hai Duong 1.4 1.1 1.6 2.4 2.4 2.4 -1.0 -1.3 -0.831 Hai Phong 2.9 2.4 3.3 1.4 0.7 2.1 1.4 1.6 1.233 Hung Yen 3.5 3.6 3.4 4.6 3.9 5.3 -1.1 -0.3 -1.9
34 Thai Binh 0.5 0.7 0.3 4.7 5.4 4.0 -4.2 -4.7 -3.735 Ha Nam 2.6 2.4 2.9 5.9 6.7 5.1 -3.2 -4.3 -2.236 Nam Dinh 0.6 0.4 0.9 3.7 3.7 3.7 -3.0 -3.3 -2.737 Ninh Binh 5.6 5.8 5.3 4.5 3.5 5.5 1.1 2.4 -0.238 Thanh Hoa 3.5 3.9 3.1 7.2 6.5 7.9 -3.7 -2.5 -4.8

131
Annex 11 (Continued)
In-migration rate (In-migrants per 1000 persons)
Out-migration rate (Out-migrants per
1000 persons)
Net-migration rate (Net-migrants per thousand persons) Code Administrative unit
Total Male Female Total Male Female Total Male Female
40 Nghe An 10.1 11.6 8.7 5.4 5.2 5.7 4.7 6.4 3.042 Ha Tinh 3.9 5.0 2.8 8.2 7.5 9.0 -4.3 -2.4 -6.244 Quang Binh 3.2 2.6 3.8 6.6 6.3 6.8 -3.4 -3.7 -3.145 Quang Tri 4.7 4.1 5.4 7.4 7.3 7.5 -2.6 -3.2 -2.1
46 Thua Thien Hue 3.0 2.1 3.8 8.4 8.7 8.1 -5.4 -6.6 -4.348 Da Nang 11.6 9.2 14.0 6.7 7.6 5.8 4.9 1.5 8.249 Quang Nam 2.5 1.6 3.4 6.3 6.3 6.3 -3.8 -4.8 -2.951 Quang Ngai 1.5 1.0 1.9 3.1 2.8 3.3 -1.6 -1.8 -1.452 Binh Dinh 2.3 2.9 1.6 3.3 3.0 3.7 -1.1 -0.1 -2.0
54 Phu Yen 1.4 1.3 1.5 9.3 8.3 10.3 -7.9 -7.0 -8.856 Khanh Hoa 1.6 1.8 1.4 4.9 5.3 4.5 -3.3 -3.5 -3.158 Ninh Thuan 1.8 2.0 1.6 5.3 2.8 7.8 -3.5 -0.8 -6.260 Binh Thuan 1.0 0.6 1.3 3.1 3.1 3.0 -2.1 -2.5 -1.762 Kon Tum 3.9 4.4 3.4 1.9 0.7 3.1 2.0 3.7 0.364 Gia Lai 1.7 1.6 1.8 2.3 2.1 2.4 -0.6 -0.5 -0.6
66 Dak Lak 2.5 2.3 2.7 4.5 3.5 5.5 -2.0 -1.3 -2.867 Dak Nong 3.8 3.4 4.3 4.9 4.4 5.4 -1.1 -1.0 -1.168 Lam Dong 3.9 3.3 4.4 5.3 5.1 5.5 -1.4 -1.8 -1.170 Binh Phuoc 3.1 3.3 2.9 3.6 3.5 3.7 -0.5 -0.2 -0.872 Tay Ninh 1.8 1.8 1.8 4.2 2.9 5.6 -2.4 -1.1 -3.7
74 Binh Duong 52.0 49.4 54.5 10.0 11.6 8.5 42.0 37.8 46.075 Dong Nai 20.4 21.8 18.9 6.2 5.9 6.6 14.1 16.0 12.377 Ba Ria - Vung Tau 6.0 6.2 5.8 5.3 7.2 3.4 0.7 -1.0 2.479 Ho Chi Minh City 10.4 9.9 10.8 5.7 6.3 5.2 4.6 3.6 5.580 Long An 4.5 4.3 4.6 6.5 5.1 7.9 -2.0 -0.7 -3.3
82 Tien Giang 4.3 4.3 4.4 5.3 5.5 5.1 -1.0 -1.3 -0.783 Ben Tre 3.7 3.6 3.7 7.4 6.4 8.4 -3.7 -2.7 -4.784 Tra Vinh 2.8 2.9 2.7 5.5 4.8 6.2 -2.7 -1.9 -3.586 Vinh Long 2.5 2.4 2.7 7.7 9.0 6.5 -5.2 -6.6 -3.987 Dong Thap 1.8 1.7 1.8 9.1 6.8 11.4 -7.3 -5.1 -9.589 An Giang 2.1 1.5 2.7 11.8 12.0 11.6 -9.6 -10.4 -8.8
91 Kien Giang 2.0 1.7 2.4 9.9 9.2 10.6 -7.9 -7.5 -8.292 Can Tho 3.1 2.2 4.0 7.7 5.6 9.9 -4.6 -3.3 -5.993 Hau Giang 1.8 1.1 2.5 6.1 4.9 7.3 -4.2 -3.7 -4.794 Soc Trang 1.0 0.4 1.6 6.2 5.5 6.9 -5.2 -5.1 -5.395 Bac Lieu 1.3 1.1 1.5 7.6 7.0 8.1 -6.3 -5.9 -6.6
96 Ca Mau 0.5 0.6 0.5 7.7 8.7 6.7 -7.2 -8.1 -6.2

132

133
PART IV
TABULATED TABLES

134

135
Table 1
POPULATION BY URBAN/RURAL RESIDENCE, SEX, SOCIO-ECONOMIC REGION AND PROVINCE/CITY, 1/4/2015
Unit: Person
Total Urban Rural Code Administrative unit
Total Male Female Total Male Female Total Male Female
ENTIRE COUNTRY 91 465 735 45 022 831 46 442 904 30 840 820 14 982 874 15 857 946 60 624 916 30 039 957 30 584 959
Socio-economic regions
R1 Northern Midlands and Mountains 11 769 502 5 830 422 5 939 079 2 127 201 1 037 650 1 089 551 9 642 301 4 792 772 4 849 529
R2 Red River Delta 20 870 149 10 233 545 10 636 604 7 064 608 3 451 241 3 613 367 13 805 541 6 782 304 7 023 237
R3 North and South Central Coast 19 623 969 9 677 080 9 946 889 5 524 810 2 706 749 2 818 061 14 099 159 6 970 331 7 128 828
R4 Central Highlands 5 587 237 2 802 015 2 785 222 1 620 329 802 027 818 302 3 966 908 1 999 988 1 966 920
R5 Southeast 16 042 723 7 793 173 8 249 550 10 114 656 4 861 523 5 253 133 5 928 067 2 931 650 2 996 417
R6 Mekong River Delta 17 572 156 8 686 596 8 885 560 4 389 216 2 123 684 2 265 532 13 182 940 6 562 912 6 620 028
Provinces/cities
01 Ha Noi 7 185 763 3 551 366 3 634 397 3 427 783 1 681 422 1 746 361 3 757 980 1 869 944 1 888 036
02 Ha Giang 798 662 401 225 397 437 119 611 58 627 60 984 679 051 342 597 336 454
04 Cao Bang 521 815 255 160 266 655 120 719 56 964 63 755 401 096 198 196 202 900
06 Bac Kan 311 623 157 829 153 794 51 720 24 942 26 778 259 903 132 887 127 016
08 Tuyen Quang 758 652 374 571 384 081 102 244 49 066 53 178 656 408 325 505 330 903
10 Lao Cai 672 173 339 948 332 225 154 181 75 956 78 225 517 992 263 992 254 000
11 Dien Bien 545 340 273 356 271 984 82 314 40 241 42 073 463 026 233 115 229 911
12 Lai Chau 422 644 211 730 210 914 73 118 36 030 37 088 349 526 175 700 173 826
14 Son La 1 178 368 588 821 589 546 161 161 80 007 81 154 1 017 207 508 815 508 392
15 Yen Bai 790 406 393 838 396 568 161 380 80 036 81 344 629 026 313 802 315 224
17 Hoa Binh 822 576 404 919 417 657 119 502 59 058 60 444 703 074 345 861 357 213
19 Thai Nguyen 1 186 240 585 617 600 623 392 703 190 381 202 322 793 537 395 236 398 301
20 Lang Son 756 861 380 768 376 093 148 406 73 235 75 171 608 455 307 533 300 922
22 Quang Ninh 1 208 326 606 119 602 207 739 718 366 973 372 745 468 608 239 146 229 462

136
Table 1 (Continued) Unit: Person
Total Urban Rural Code Administrative unit
Total Male Female Total Male Female Total Male Female
24 Bac Giang 1 636 797 801 671 835 126 185 627 89 178 96 449 1 451 170 712 493 738 677
25 Phu Tho 1 367 345 660 969 706 376 254 515 123 929 130 586 1 112 830 537 041 575 789
26 Vinh Phuc 1 051 339 515 574 535 765 245 113 117 712 127 401 806 226 397 862 408 364
27 Bac Ninh 1 148 758 558 212 590 546 325 420 157 899 167 521 823 338 400 314 423 024
30 Hai Duong 1 771 657 875 099 896 558 422 440 209 630 212 810 1 349 217 665 468 683 748
31 Hai Phong 1 958 975 955 700 1 003 275 915 359 441 037 474 322 1 043 616 514 662 528 954
33 Hung Yen 1 162 786 570 471 592 315 151 744 72 618 79 126 1 011 042 497 854 513 188
34 Thai Binh 1 789 056 856 199 932 857 185 357 89 224 96 133 1 603 699 766 976 836 723
35 Ha Nam 801 873 390 508 411 365 124 348 58 529 65 819 677 525 331 979 345 546
36 Nam Dinh 1 849 348 895 837 953 511 337 568 163 853 173 715 1 511 780 731 983 779 797
37 Ninh Binh 942 268 458 459 483 809 189 758 92 343 97 415 752 510 366 117 386 393
38 Thanh Hoa 3 509 641 1 714 984 1 794 657 545 684 269 133 276 551 2 963 957 1 445 851 1 518 106
40 Nghe An 3 057 296 1 534 471 1 522 825 461 649 228 023 233 626 2 595 647 1 306 448 1 289 199
42 Ha Tinh 1 259 777 621 398 638 379 219 374 103 755 115 619 1 040 403 517 643 522 760
44 Quang Binh 871 735 432 922 438 813 170 589 84 271 86 318 701 146 348 651 352 495
45 Quang Tri 619 056 305 821 313 235 180 595 89 564 91 031 438 461 216 257 222 204
46 Thua Thien Hue 1 138 475 554 071 584 404 553 483 268 554 284 929 584 992 285 516 299 475
48 Da Nang 1 023 500 504 095 519 405 893 334 440 269 453 065 130 166 63 826 66 340
49 Quang Nam 1 478 182 712 174 766 008 337 315 165 014 172 301 1 140 867 547 160 593 707
51 Quang Ngai 1 245 170 611 398 633 772 203 293 96 369 106 924 1 041 877 515 029 526 848
52 Binh Dinh 1 518 364 741 695 776 669 471 063 227 989 243 074 1 047 301 513 706 533 595
54 Phu Yen 891 877 450 250 441 627 256 295 127 670 128 625 635 582 322 580 313 002
56 Khanh Hoa 1 203 196 591 918 611 278 539 989 264 142 275 847 663 207 327 776 335 431
58 Ninh Thuan 594 473 297 090 297 383 215 249 106 279 108 970 379 224 190 811 188 413
60 Binh Thuan 1 213 227 604 793 608 434 476 898 235 718 241 180 736 329 369 075 367 254

137
Table 1 (Continued) Unit: Person
Total Urban Rural Code Administrative unit
Total Male Female Total Male Female Total Male Female
62 Kon Tum 492 935 247 307 245 628 174 443 87 493 86 950 318 492 159 813 158 679
64 Gia Lai 1 392 479 692 332 700 147 413 319 203 121 210 198 979 160 489 211 489 949
66 Dak Lak 1 848 565 932 999 915 566 449 090 224 168 224 922 1 399 475 708 832 690 643
67 Dak Nong 583 642 300 027 283 615 88 742 44 820 43 922 494 900 255 207 239 693
68 Lam Dong 1 269 616 629 350 640 266 494 735 242 425 252 310 774 881 386 925 387 956
70 Binh Phuoc 941 438 470 961 470 477 202 112 101 189 100 923 739 326 369 772 369 554
72 Tay Ninh 1 109 682 543 783 565 899 235 931 114 033 121 897 873 751 429 750 444 001
74 Binh Duong 1 928 537 935 070 993 467 1 483 511 715 860 767 651 445 026 219 210 225 816
75 Dong Nai 2 888 898 1 427 861 1 461 037 1 001 400 488 669 512 731 1 887 498 939 192 948 306
77 Ba Ria - Vung Tau 1 069 295 533 481 535 814 543 841 267 763 276 078 525 454 265 718 259 736
79 Ho Chi Minh City 8 104 873 3 882 017 4 222 856 6 647 861 3 174 008 3 473 853 1 457 012 708 009 749 003
80 Long An 1 482 820 728 337 754 483 267 328 126 018 141 310 1 215 492 602 319 613 173
82 Tien Giang 1 725 522 840 974 884 548 274 635 128 054 146 581 1 450 887 712 921 737 966
83 Ben Tre 1 263 334 618 678 644 656 130 645 62 001 68 644 1 132 689 556 677 576 012
84 Tra Vinh 1 033 285 506 208 527 077 180 656 87 140 93 516 852 629 419 068 433 561
86 Vinh Long 1 044 140 510 170 533 970 176 053 84 670 91 383 868 087 425 500 442 587
87 Dong Thap 1 683 527 838 892 844 635 299 118 142 722 156 396 1 384 409 696 170 688 239
89 An Giang 2 157 679 1 062 471 1 095 209 652 965 314 794 338 171 1 504 714 747 676 757 038
91 Kien Giang 1 757 142 882 519 874 623 480 014 235 584 244 430 1 277 128 646 935 630 193
92 Can Tho 1 245 584 615 479 630 105 831 250 405 992 425 258 414 334 209 487 204 847
93 Hau Giang 769 918 384 093 385 825 188 029 93 319 94 710 581 889 290 775 291 114
94 Soc Trang 1 309 964 647 131 662 833 400 849 194 266 206 582 909 115 452 865 456 250
95 Bac Lieu 880 955 439 437 441 517 232 212 113 372 118 840 648 743 326 065 322 678
96 Ca Mau 1 218 286 612 206 606 080 275 462 135 751 139 711 942 824 476 455 466 369

138
Table 2
POPULATION BY URBAN/RURAL RESIDENCE, SEX, SOCIO-ECONOMIC REGION AND AGE GROUP, 1/4/2015
Unit: Person
Total Urban Rural
Cod
e
Age group Total Male Female Total Male Female Total Male Female
ENTIRE COUNTRY 91 465 735 45 022 831 46 442 904 30 840 820 14 982 874 15 857 946 60 624 916 30 039 957 30 584 959
0 1 445 980 779 364 666 616 436 074 237 325 198 749 1 009 905 542 039 467 867
1-4 6 090 238 3 180 677 2 909 561 1 902 696 1 012 710 889 986 4 187 542 2 167 967 2 019 575
5-9 7 391 296 3 828 449 3 562 847 2 358 481 1 225 109 1 133 372 5 032 815 2 603 341 2 429 475
10-14 7 016 917 3 634 830 3 382 087 2 151 629 1 120 690 1 030 939 4 865 288 2 514 140 2 351 148
15-17 3 971 004 2 047 950 1 923 053 1 138 334 582 205 556 129 2 832 670 1 465 745 1 366 924
18-19 2 558 177 1 301 022 1 257 156 871 515 425 207 446 308 1 686 662 875 815 810 848
20-24 7 198 499 3 669 876 3 528 623 2 455 316 1 172 714 1 282 602 4 743 184 2 497 162 2 246 021
25-29 7 418 650 3 750 866 3 667 784 2 589 463 1 238 613 1 350 850 4 829 187 2 512 253 2 316 934
30-34 7 417 681 3 638 862 3 778 819 2 689 139 1 282 782 1 406 357 4 728 543 2 356 080 2 372 462
35-39 6 839 038 3 376 032 3 463 006 2 414 676 1 169 685 1 244 991 4 424 362 2 206 347 2 218 015
40-44 6 663 741 3 312 115 3 351 626 2 342 896 1 152 951 1 189 945 4 320 844 2 159 163 2 161 681
45-49 6 078 571 3 040 599 3 037 972 2 131 401 1 055 529 1 075 872 3 947 170 1 985 070 1 962 100
50-54 6 118 219 2 862 480 3 255 738 2 136 362 1 011 879 1 124 483 3 981 857 1 850 601 2 131 255
55-59 4 912 612 2 288 489 2 624 123 1 790 293 838 122 952 171 3 122 319 1 450 367 1 671 953
60-64 3 411 752 1 564 548 1 847 204 1 200 369 545 327 655 042 2 211 383 1 019 221 1 192 162
65-69 2 147 916 940 180 1 207 737 746 633 330 883 415 751 1 401 283 609 297 791 986
70-74 1 542 738 620 324 922 415 525 643 216 620 309 023 1 017 095 403 703 613 392
75-79 1 290 290 504 743 785 547 410 626 164 859 245 766 879 665 339 884 539 781
80-84 1 041 932 379 290 662 643 296 289 111 615 184 674 745 644 267 675 477 969
85+ 910 482 302 135 608 347 252 985 88 049 164 936 657 498 214 087 443 411

139
Table 2 (Continued) Unit: Person
Total Urban Rural
Cod
e
Age group Total Male Female Total Male Female Total Male Female
R1 Northern Midlands and Mountains 11 769 502 5 830 422 5 939 079 2 127 201 1 037 650 1 089 551 9 642 301 4 792 772 4 849 529
0 239 362 129 852 109 509 38 853 20 873 17 980 200 508 108 979 91 529
1-4 962 708 489 487 473 220 153 520 82 537 70 983 809 188 406 950 402 237
5-9 1 048 260 540 761 507 499 172 557 90 481 82 076 875 703 450 280 425 423
10-14 939 803 482 692 457 112 148 665 77 356 71 308 791 139 405 335 385 803
15-17 528 012 270 195 257 817 73 621 37 768 35 853 454 391 232 427 221 964
18-19 311 136 160 416 150 720 37 489 18 904 18 585 273 647 141 512 132 135
20-24 960 405 496 848 463 557 130 890 63 829 67 061 829 515 433 019 396 496
25-29 1 025 199 532 165 493 033 160 984 74 990 85 994 864 215 457 176 407 039
30-34 967 356 481 920 485 436 180 649 86 598 94 051 786 707 395 322 391 385
35-39 856 039 425 348 430 692 163 443 78 649 84 794 692 596 346 698 345 898
40-44 799 932 395 393 404 539 155 819 75 201 80 618 644 113 320 192 323 921
45-49 714 853 354 534 360 319 141 881 68 960 72 921 572 972 285 574 287 398
50-54 749 127 350 888 398 239 160 932 75 531 85 401 588 195 275 356 312 839
55-59 560 100 265 428 294 672 142 660 69 928 72 732 417 441 195 501 221 940
60-64 347 706 159 620 188 086 90 951 43 121 47 830 256 754 116 499 140 256
65-69 231 706 98 645 133 061 64 988 27 710 37 278 166 717 70 934 95 783
70-74 174 811 70 700 104 110 41 166 18 325 22 841 133 644 52 375 81 270
75-79 136 497 53 242 83 255 28 843 11 391 17 452 107 654 41 851 65 803
80-84 116 773 42 306 74 468 21 621 8 621 13 000 95 153 33 685 61 468
85+ 99 718 29 982 69 736 17 670 6 877 10 793 82 048 23 105 58 944

140
Table 2 (Continued)
Unit: Person
Total Urban Rural
Cod
e
Age group Total Male Female Total Male Female Total Male Female
R2 Red River Delta 20 870 149 10 233 545 10 636 604 7 064 608 3 451 241 3 613 367 13 805 541 6 782 304 7 023 237
0 331 876 184 444 147 432 101 774 54 512 47 262 230 102 129 932 100 170
1-4 1 466 963 784 886 682 077 489 335 268 323 221 012 977 629 516 564 461 065
5-9 1 657 800 873 374 784 425 584 972 305 936 279 036 1 072 828 567 438 505 390
10-14 1 434 129 738 320 695 809 468 763 238 284 230 479 965 366 500 036 465 330
15-17 813 563 420 997 392 566 237 184 117 543 119 641 576 379 303 455 272 924
18-19 517 598 253 132 264 467 190 331 89 044 101 287 327 267 164 088 163 179
20-24 1 504 552 762 471 742 081 513 843 242 789 271 054 990 709 519 682 471 027
25-29 1 572 436 782 463 789 973 536 366 255 517 280 849 1 036 070 526 946 509 124
30-34 1 615 480 782 831 832 649 597 017 277 981 319 036 1 018 463 504 850 513 613
35-39 1 416 683 681 290 735 393 513 025 249 030 263 995 903 658 432 260 471 398
40-44 1 471 629 719 368 752 262 502 281 243 594 258 687 969 348 475 773 493 575
45-49 1 281 983 647 338 634 645 396 317 200 302 196 015 885 666 447 036 438 630
50-54 1 555 070 732 830 822 240 498 438 243 022 255 416 1 056 632 489 808 566 824
55-59 1 353 947 645 260 708 687 474 162 231 440 242 721 879 785 413 819 465 966
60-64 895 777 420 734 475 043 309 754 148 532 161 222 586 023 272 202 313 821
65-69 606 653 267 197 339 456 227 552 99 337 128 215 379 101 167 859 211 241
70-74 426 476 189 855 236 621 158 770 73 636 85 134 267 706 116 219 151 487
75-79 376 314 160 428 215 886 121 356 59 823 61 532 254 958 100 605 154 353
80-84 302 583 107 092 195 491 79 818 33 153 46 664 222 765 73 939 148 827
85+ 268 635 79 235 189 400 63 550 19 443 44 107 205 086 59 793 145 293

141
Table 2 (Continued) Unit: Person
Total Urban Rural
Cod
e
Age group Total Male Female Total Male Female Total Male Female
R3 North and South Central Coast 19 623 969 9 677 080 9 946 889 5 524 810 2 706 749 2 818 061 14 099 159 6 970 331 7 128 828
0 323 668 174 032 149 635 83 271 44 867 38 404 240 397 129 166 111 231
1-4 1 285 288 678 256 607 032 340 804 181 500 159 304 944 484 496 757 447 728
5-9 1 530 081 797 697 732 384 427 210 226 283 200 927 1 102 872 571 414 531 458
10-14 1 546 318 798 034 748 284 409 600 211 574 198 026 1 136 719 586 460 550 259
15-17 967 914 502 006 465 908 236 752 125 092 111 661 731 162 376 914 354 248
18-19 595 478 307 634 287 844 160 208 82 324 77 884 435 269 225 310 209 960
20-24 1 638 954 855 909 783 045 471 188 231 658 239 530 1 167 766 624 251 543 515
25-29 1 455 945 759 645 696 300 411 483 202 586 208 897 1 044 462 557 059 487 403
30-34 1 378 249 686 699 691 550 412 806 198 575 214 231 965 443 488 124 477 319
35-39 1 362 646 669 226 693 420 405 334 199 295 206 039 957 312 469 931 487 380
40-44 1 436 798 706 795 730 003 417 369 202 828 214 541 1 019 429 503 967 515 461
45-49 1 334 904 660 798 674 106 414 308 204 384 209 924 920 596 456 414 464 182
50-54 1 287 485 592 158 695 327 379 738 180 471 199 267 907 747 411 687 496 060
55-59 1 006 557 474 066 532 491 302 966 143 881 159 085 703 591 330 186 373 406
60-64 763 475 349 541 413 934 216 083 99 390 116 694 547 392 250 152 297 240
65-69 498 103 217 513 280 590 138 516 60 502 78 014 359 588 157 012 202 576
70-74 363 506 141 085 222 421 97 514 39 066 58 448 265 992 102 019 163 973
75-79 317 385 120 430 196 956 82 959 30 830 52 129 234 426 89 599 144 827
80-84 277 096 102 205 174 891 60 960 22 528 38 432 216 137 79 677 136 459
85+ 254 118 83 349 170 769 55 742 19 117 36 625 198 376 64 232 134 144

142
Table 2 (Continued) Unit: Person
Total Urban Rural
Cod
e
Age group Total Male Female Total Male Female Total Male Female
R4 Central Highlands 5 587 237 2 802 015 2 785 222 1 620 329 802 027 818 302 3 966 908 1 999 988 1 966 920
0 93 309 47 959 45 351 21 808 11 435 10 373 71 501 36 523 34 977
1-4 405 051 209 463 195 588 102 874 53 581 49 293 302 177 155 881 146 295
5-9 551 507 278 083 273 424 143 284 72 577 70 706 408 223 205 506 202 717
10-14 560 954 289 221 271 733 138 116 72 955 65 160 422 838 216 265 206 573
15-17 345 647 181 647 164 000 82 860 43 799 39 061 262 787 137 849 124 938
18-19 182 863 98 557 84 306 41 451 21 204 20 247 141 412 77 353 64 059
20-24 449 413 233 465 215 948 117 587 56 691 60 896 331 826 176 773 155 052
25-29 429 903 220 165 209 739 126 063 61 749 64 314 303 840 158 415 145 425
30-34 432 188 205 881 226 307 124 993 57 816 67 178 307 195 148 066 159 129
35-39 418 984 205 180 213 805 126 119 61 018 65 101 292 865 144 162 148 703
40-44 391 926 203 943 187 984 133 000 67 146 65 854 258 926 136 797 122 129
45-49 351 512 180 978 170 534 121 985 63 442 58 543 229 527 117 536 111 991
50-54 323 912 152 577 171 335 113 725 54 406 59 318 210 187 98 171 112 016
55-59 235 232 114 821 120 411 84 577 41 910 42 668 150 655 72 911 77 744
60-64 140 734 66 668 74 066 50 287 24 556 25 730 90 447 42 111 48 336
65-69 89 003 40 568 48 435 27 769 13 650 14 119 61 234 26 918 34 315
70-74 64 807 28 083 36 724 21 140 8 489 12 651 43 667 19 594 24 073
75-79 49 640 19 349 30 290 16 878 6 418 10 459 32 762 12 931 19 831
80-84 38 074 13 835 24 239 13 792 4 705 9 087 24 282 9 130 15 152
85+ 32 578 11 574 21 004 12 020 4 478 7 542 20 558 7 096 13 462

143
Table 2 (Continued) Unit: Person
Total Urban Rural
Cod
e
Age group Total Male Female Total Male Female Total Male Female
R5 Southeast 16 042 723 7 793 173 8 249 550 10 114 656 4 861 523 5 253 133 5 928 067 2 931 650 2 996 417
0 231 479 126 254 105 225 135 922 77 397 58 524 95 557 48 856 46 701
1-4 957 797 490 860 466 937 576 346 301 299 275 047 381 451 189 561 191 889
5-9 1 207 284 623 852 583 431 698 268 359 516 338 752 509 015 264 336 244 679
10-14 1 117 007 593 360 523 647 651 834 348 145 303 690 465 173 245 216 219 957
15-17 581 642 295 000 286 642 332 335 169 633 162 702 249 307 125 367 123 940
18-19 494 517 246 059 248 458 318 719 153 289 165 430 175 798 92 769 83 028
20-24 1 410 717 680 923 729 794 908 699 423 502 485 197 502 017 257 421 244 597
25-29 1 543 992 746 142 797 850 1 001 433 468 208 533 225 542 559 277 934 264 625
30-34 1 564 091 740 244 823 847 1 008 924 478 808 530 116 555 167 261 435 293 731
35-39 1 337 514 656 116 681 399 850 468 406 261 444 207 487 046 249 854 237 192
40-44 1 226 660 614 869 611 790 786 320 391 557 394 764 440 339 223 313 217 027
45-49 1 100 593 538 006 562 587 717 026 351 745 365 281 383 567 186 261 197 306
50-54 1 011 826 476 716 535 110 664 892 312 170 352 722 346 935 164 547 182 388
55-59 825 521 379 543 445 978 536 875 243 151 293 724 288 646 136 392 152 254
60-64 530 802 235 087 295 715 351 964 150 522 201 441 178 838 84 565 94 274
65-69 293 198 129 584 163 614 185 010 85 125 99 885 108 188 44 459 63 729
70-74 212 909 77 331 135 578 136 537 51 000 85 537 76 372 26 331 50 041
75-79 167 571 59 551 108 020 106 010 37 309 68 701 61 561 22 242 39 319
80-84 123 677 45 489 78 188 79 060 28 314 50 746 44 617 17 175 27 443
85+ 103 927 38 186 65 741 68 014 24 570 43 444 35 913 13 616 22 297

144
Table 2 (Continued) Unit: Person
Total Urban Rural
Cod
e
Age group Total Male Female Total Male Female Total Male Female
R6 Mekong River Delta 17 572 156 8 686 596 8 885 560 4 389 216 2 123 684 2 265 532 13 182 940 6 562 912 6 620 028
0 226 286 116 822 109 464 54 446 28 240 26 206 171 840 88 582 83 258
1-4 1 012 432 527 725 484 707 239 818 125 471 114 346 772 614 402 253 370 360
5-9 1 396 365 714 681 681 684 332 191 170 316 161 875 1 064 174 544 366 519 809
10-14 1 418 706 733 204 685 502 334 652 172 376 162 276 1 084 054 560 828 523 226
15-17 734 226 378 104 356 122 175 582 88 371 87 211 558 643 289 733 268 910
18-19 456 585 235 223 221 362 123 316 60 441 62 875 333 269 174 782 158 486
20-24 1 234 458 640 260 594 198 313 107 154 244 158 864 921 350 486 017 435 334
25-29 1 391 174 710 286 680 888 353 134 175 563 177 571 1 038 040 534 723 503 317
30-34 1 460 318 741 288 719 030 364 750 183 005 181 745 1 095 568 558 283 537 285
35-39 1 447 172 738 874 708 299 356 287 175 432 180 855 1 090 885 563 442 527 443
40-44 1 336 795 671 747 665 048 348 106 172 625 175 481 988 689 499 121 489 568
45-49 1 294 726 658 945 635 781 339 884 166 695 173 189 954 843 492 250 462 593
50-54 1 190 798 557 311 633 487 318 637 146 278 172 358 872 161 411 033 461 128
55-59 931 255 409 371 521 884 249 054 107 813 141 241 682 201 301 558 380 643
60-64 733 258 332 897 400 361 181 330 79 205 102 125 551 928 253 692 298 236
65-69 429 254 186 673 242 581 102 798 44 559 58 239 326 456 142 114 184 342
70-74 300 230 113 270 186 960 70 516 26 104 44 412 229 714 87 165 142 548
75-79 242 884 91 743 151 141 54 581 19 087 35 494 188 303 72 656 115 647
80-84 183 728 68 364 115 364 41 038 14 294 26 744 142 690 54 069 88 621
85+ 151 506 59 808 91 697 35 989 13 564 22 425 115 517 46 244 69 272

145
Table 3
POPULATION AGED 15 AND OVER BY CURRENT MARITAL STATUS, SOCIO-ECONOMIC REGION AND PROVINCE/CITY, 1/4/2015
Unit: Person
Marital status
Cod
e
Administrative unit Population
aged 15 and over Single
Currently married
Widowed Divorced Not
stated
ENTIRE COUNTRY 69 521 305 15 942 481 47 319 248 4 733 914 1 521 883 3 779
Socio-economic regions
R1 Northern Midlands and Mountains
8 579 369 1 502 551 6 365 680 566 769 143 223 1 146
R2 Red River Delta 15 979 382 3 152 420 11 400 094 1 175 291 249 857 1 720
R3 North and South Central Coast 14 938 614 3 672 698 9 916 668 1 123 932 224 771 545
R4 Central Highlands 3 976 416 990 549 2 694 926 220 183 70 692 66
R5 Southeast 12 529 157 3 663 397 7 724 468 733 857 407 375 60
R6 Mekong River Delta 13 518 367 2 960 866 9 217 412 913 882 425 965 242
Provinces/cities
01 Ha Noi 5 459 182 1 209 133 3 801 156 355 419 92 938 536
02 Ha Giang 532 120 90 969 402 248 32 935 5 847 121
04 Cao Bang 389 552 65 785 286 319 32 385 4 980 83
06 Bac Kan 238 965 43 853 174 823 16 367 3 767 155
08 Tuyen Quang 558 139 93 903 416 058 37 938 10 167 73
10 Lao Cai 477 125 90 788 352 687 26 754 6 896
11 Dien Bien 361 720 67 087 269 866 17 463 7 272 32
12 Lai Chau 269 315 43 353 206 699 15 342 3 884 37
14 Son La 807 902 126 126 628 916 39 389 13 471
15 Yen Bai 574 210 101 005 425 181 37 017 10 874 133
17 Hoa Binh 613 803 101 756 458 822 43 769 9 456
19 Thai Nguyen 911 164 173 921 652 606 64 318 20 238 81
20 Lang Son 582 112 113 693 417 091 43 477 7 802 49
22 Quang Ninh 917 000 179 751 658 947 59 794 18 441 67
24 Bac Giang 1 232 860 215 042 919 503 78 503 19 620 192
25 Phu Tho 1 030 388 175 270 754 863 81 113 18 952 190
26 Vinh Phuc 788 568 152 725 565 875 59 265 10 639 64
27 Bac Ninh 847 402 150 162 626 261 57 673 13 153 153
30 Hai Duong 1 405 254 288 324 992 251 103 527 20 775 377
31 Hai Phong 1 512 101 295 736 1 070 251 109 305 36 728 81
33 Hung Yen 889 855 156 254 645 430 76 899 11 034 238
34 Thai Binh 1 409 007 242 837 1 022 805 129 922 13 443
35 Ha Nam 615 706 128 095 431 115 48 596 7 848 52
36 Nam Dinh 1 417 102 224 842 1 060 469 116 299 15 339 153
37 Ninh Binh 718 203 124 561 525 534 58 592 9 516
38 Thanh Hoa 2 691 307 486 451 1 951 145 219 004 34 257 450
40 Nghe An 2 302 787 569 784 1 546 067 161 864 25 072

146
Table 3 (Continued) Unit: Person
Marital status
Cod
e
Administrative unit Population
aged 15 and over Single
Currently married
Widowed Divorced Not
stated
42 Ha Tinh 961 154 208 361 660 892 82 296 9 605
44 Quang Binh 648 457 165 990 426 843 45 146 10 478
45 Quang Tri 448 764 104 896 300 288 36 432 7 106 42
46 Thua Thien Hue 869 451 261 461 536 577 61 384 10 029
48 Da Nang 784 131 227 701 496 265 46 063 14 050 52
49 Quang Nam 1 133 180 311 159 712 677 95 929 13 415
51 Quang Ngai 971 488 252 682 626 634 78 649 13 523
52 Binh Dinh 1 158 475 270 082 773 756 95 069 19 568
54 Phu Yen 675 951 158 048 458 102 47 850 11 951
56 Khanh Hoa 935 867 275 630 572 056 64 843 23 338
58 Ninh Thuan 440 011 125 263 277 332 27 816 9 600
60 Binh Thuan 917 589 255 190 578 033 61 588 22 778
62 Kon Tum 331 227 86 029 221 792 18 532 4 874
64 Gia Lai 953 769 213 003 671 259 50 828 18 631 48
66 Dak Lak 1 356 050 351 106 899 543 80 353 25 048
67 Dak Nong 401 566 94 508 283 767 19 006 4 267 18
68 Lam Dong 933 804 245 903 618 565 51 464 17 872
70 Binh Phuoc 690 067 158 464 464 835 43 978 22 730 60
72 Tay Ninh 855 464 202 679 547 056 65 569 40 160
74 Binh Duong 1 517 091 418 572 988 637 66 123 43 759
75 Dong Nai 2 189 800 634 694 1 380 729 120 986 53 391
77 Ba Ria - Vung Tau 820 632 219 119 526 279 50 902 24 332
79 Ho Chi Minh City 6 456 102 2 029 868 3 816 931 386 300 223 003
80 Long An 1 154 653 254 450 785 170 80 574 34 459
82 Tien Giang 1 339 499 276 705 921 830 88 385 52 465 114
83 Ben Tre 998 227 191 688 692 168 75 444 38 927
84 Tra Vinh 789 227 159 107 547 507 56 478 26 096 39
86 Vinh Long 813 751 166 153 563 868 58 400 25 330
87 Dong Thap 1 314 455 309 363 875 955 89 401 39 736
89 An Giang 1 641 167 347 200 1 112 483 125 429 56 055
91 Kien Giang 1 302 169 275 894 903 067 83 992 39 216
92 Can Tho 964 486 227 252 644 170 62 253 30 811
93 Hau Giang 598 552 142 917 398 981 39 637 17 017
94 Soc Trang 1 004 798 247 190 667 993 64 981 24 634
95 Bac Lieu 678 804 169 118 454 169 38 110 17 318 89
96 Ca Mau 918 579 193 831 650 050 50 797 23 901

147
Table 3 (Continued) Unit: Person
Marital status
Cod
e
Administrative unit Population
aged 15 and over Single
Currently married
Widowed Divorced Not
stated
MALE 33 599 512 8 973 432 23 419 028 692 821 513 318 913
Socio-economic regions
R1 Northern Midlands and Mountains 4 187 631 910 137 3 154 649 76 510 46 112 223
R2 Red River Delta 7 652 521 1 756 117 5 646 803 167 719 81 531 351
R3 North and South Central Coast 7 229 060 2 101 016 4 903 877 153 398 70 544 225
R4 Central Highlands 1 977 290 584 314 1 339 544 29 985 23 447
R5 Southeast 5 958 846 1 922 054 3 801 217 105 404 130 171
R6 Mekong River Delta 6 594 164 1 699 794 4 572 938 159 805 161 513 114
Provinces/cities
01 Ha Noi 2 636 740 664 169 1 888 997 53 843 29 731
02 Ha Giang 265 387 56 061 199 688 7 049 2 589
04 Cao Bang 189 544 41 050 141 980 4 534 1 980
06 Bac Kan 119 418 28 257 86 897 2 731 1 502 31
08 Tuyen Quang 272 931 57 519 207 278 4 787 3 347
10 Lao Cai 239 283 56 666 175 844 4 163 2 610
11 Dien Bien 179 298 41 331 133 368 2 491 2 108
12 Lai Chau 132 747 27 081 102 063 2 206 1 397
14 Son La 397 393 76 369 311 907 5 340 3 777
15 Yen Bai 283 241 63 859 211 127 4 694 3 561
17 Hoa Binh 299 926 64 878 227 129 5 318 2 601
19 Thai Nguyen 440 828 102 615 323 435 8 000 6 778
20 Lang Son 287 554 71 880 206 563 5 798 3 313
22 Quang Ninh 457 455 112 583 327 255 10 655 6 895 67
24 Bac Giang 593 773 124 386 454 991 8 932 5 272 192
25 Phu Tho 486 310 98 185 372 380 10 467 5 278
26 Vinh Phuc 373 675 84 960 279 446 6 438 2 831
27 Bac Ninh 397 412 80 485 307 569 6 408 2 950
30 Hai Duong 673 897 161 570 491 859 13 623 6 720 125
31 Hai Phong 725 661 165 243 530 611 16 182 13 625
33 Hung Yen 422 628 87 844 319 792 11 174 3 659 159
34 Thai Binh 658 741 128 605 504 911 20 344 4 881
35 Ha Nam 293 884 71 012 213 110 7 297 2 465
36 Nam Dinh 668 010 125 854 523 814 12 906 5 436
37 Ninh Binh 344 417 73 792 259 439 8 849 2 337
38 Thanh Hoa 1 289 537 288 522 964 382 27 911 8 497 225
40 Nghe An 1 125 252 335 086 764 891 19 083 6 192

148
Table 3 (Continued) Unit: Person
Marital status
Cod
e
Administrative unit Population
aged 15 and over Single
Currently married
Widowed DivorcedNot
stated
42 Ha Tinh 467 732 125 381 326 349 12 568 3 434
44 Quang Binh 314 098 94 156 210 306 6 863 2 773
45 Quang Tri 217 392 61 086 148 328 5 710 2 268
46 Thua Thien Hue 418 555 140 833 265 390 8 986 3 346
48 Da Nang 377 966 121 240 244 867 6 978 4 881
49 Quang Nam 533 317 164 140 352 378 11 834 4 965
51 Quang Ngai 467 724 140 985 310 900 11 355 4 484
52 Binh Dinh 553 115 151 963 382 983 12 169 6 000
54 Phu Yen 336 084 97 200 227 360 7 487 4 037
56 Khanh Hoa 457 006 155 457 282 573 10 579 8 397
58 Ninh Thuan 217 118 73 501 137 244 3 582 2 791
60 Binh Thuan 454 166 151 469 285 924 8 295 8 478
62 Kon Tum 164 384 49 772 109 749 3 233 1 630
64 Gia Lai 467 695 122 400 333 260 6 793 5 242
66 Dak Lak 679 279 212 747 447 090 10 847 8 595
67 Dak Nong 204 536 58 657 141 163 3 002 1 714
68 Lam Dong 461 397 140 738 308 283 6 110 6 266
70 Binh Phuoc 341 205 95 111 231 785 5 824 8 485
72 Tay Ninh 412 673 118 398 270 676 9 361 14 238
74 Binh Duong 719 642 211 067 486 942 9 247 12 386
75 Dong Nai 1 067 572 355 163 678 347 17 688 16 374
77 Ba Ria - Vung Tau 402 773 124 760 261 564 8 183 8 266
79 Ho Chi Minh City 3 014 979 1 017 555 1 871 904 55 099 70 421
80 Long An 558 272 143 318 388 549 12 974 13 431
82 Tien Giang 640 917 151 291 457 705 12 814 18 993 114
83 Ben Tre 480 732 111 119 343 371 11 769 14 473
84 Tra Vinh 379 763 91 390 270 107 8 914 9 352
86 Vinh Long 390 967 92 519 277 304 10 282 10 862
87 Dong Thap 648 297 179 007 434 262 18 499 16 529
89 An Giang 798 768 198 288 555 377 23 774 21 329
91 Kien Giang 643 185 163 072 449 495 14 872 15 746
92 Can Tho 469 730 127 404 320 146 11 624 10 556
93 Hau Giang 295 318 84 098 197 847 7 259 6 114
94 Soc Trang 494 499 144 804 329 378 11 691 8 626
95 Bac Lieu 334 972 96 641 226 132 6 333 5 866
96 Ca Mau 458 743 116 843 323 266 8 998 9 636
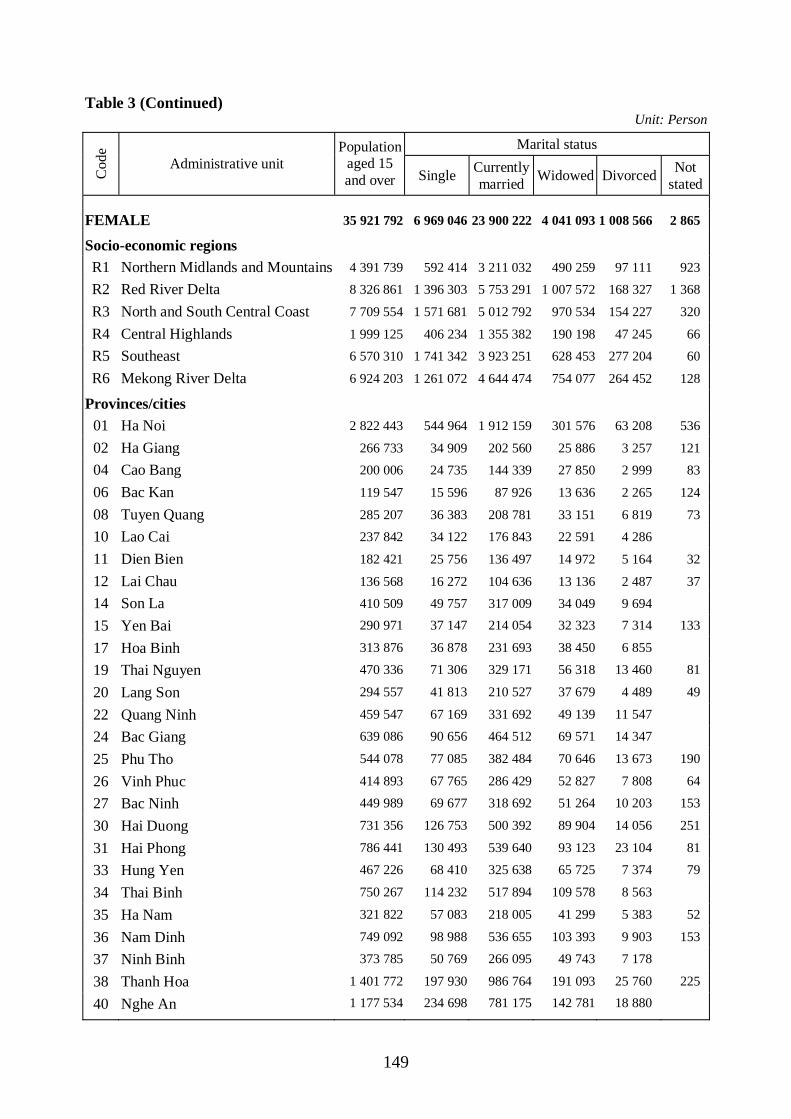
149
Table 3 (Continued) Unit: Person
Marital status
Cod
e
Administrative unit Population
aged 15 and over Single
Currently married
Widowed DivorcedNot
stated
FEMALE 35 921 792 6 969 046 23 900 222 4 041 093 1 008 566 2 865
Socio-economic regions
R1 Northern Midlands and Mountains 4 391 739 592 414 3 211 032 490 259 97 111 923
R2 Red River Delta 8 326 861 1 396 303 5 753 291 1 007 572 168 327 1 368
R3 North and South Central Coast 7 709 554 1 571 681 5 012 792 970 534 154 227 320
R4 Central Highlands 1 999 125 406 234 1 355 382 190 198 47 245 66
R5 Southeast 6 570 310 1 741 342 3 923 251 628 453 277 204 60
R6 Mekong River Delta 6 924 203 1 261 072 4 644 474 754 077 264 452 128
Provinces/cities
01 Ha Noi 2 822 443 544 964 1 912 159 301 576 63 208 536
02 Ha Giang 266 733 34 909 202 560 25 886 3 257 121
04 Cao Bang 200 006 24 735 144 339 27 850 2 999 83
06 Bac Kan 119 547 15 596 87 926 13 636 2 265 124
08 Tuyen Quang 285 207 36 383 208 781 33 151 6 819 73
10 Lao Cai 237 842 34 122 176 843 22 591 4 286
11 Dien Bien 182 421 25 756 136 497 14 972 5 164 32
12 Lai Chau 136 568 16 272 104 636 13 136 2 487 37
14 Son La 410 509 49 757 317 009 34 049 9 694
15 Yen Bai 290 971 37 147 214 054 32 323 7 314 133
17 Hoa Binh 313 876 36 878 231 693 38 450 6 855
19 Thai Nguyen 470 336 71 306 329 171 56 318 13 460 81
20 Lang Son 294 557 41 813 210 527 37 679 4 489 49
22 Quang Ninh 459 547 67 169 331 692 49 139 11 547
24 Bac Giang 639 086 90 656 464 512 69 571 14 347
25 Phu Tho 544 078 77 085 382 484 70 646 13 673 190
26 Vinh Phuc 414 893 67 765 286 429 52 827 7 808 64
27 Bac Ninh 449 989 69 677 318 692 51 264 10 203 153
30 Hai Duong 731 356 126 753 500 392 89 904 14 056 251
31 Hai Phong 786 441 130 493 539 640 93 123 23 104 81
33 Hung Yen 467 226 68 410 325 638 65 725 7 374 79
34 Thai Binh 750 267 114 232 517 894 109 578 8 563
35 Ha Nam 321 822 57 083 218 005 41 299 5 383 52
36 Nam Dinh 749 092 98 988 536 655 103 393 9 903 153
37 Ninh Binh 373 785 50 769 266 095 49 743 7 178
38 Thanh Hoa 1 401 772 197 930 986 764 191 093 25 760 225
40 Nghe An 1 177 534 234 698 781 175 142 781 18 880

150
Table 3 (Continued) Unit: Person
Marital status
Cod
e
Administrative unit Population
aged 15 and over Single
Currently married
Widowed Divorced Not
stated
42 Ha Tinh 493 422 82 980 334 543 69 728 6 171
44 Quang Binh 334 360 71 834 216 537 38 283 7 706
45 Quang Tri 231 372 43 811 151 959 30 722 4 838 42
46 Thua Thien Hue 450 896 120 628 271 187 52 398 6 683
48 Da Nang 406 164 106 461 251 398 39 085 9 168 52
49 Quang Nam 599 864 147 019 360 299 84 095 8 451
51 Quang Ngai 503 764 111 697 315 734 67 294 9 039
52 Binh Dinh 605 360 118 119 390 773 82 901 13 567
54 Phu Yen 339 867 60 848 230 743 40 363 7 913
56 Khanh Hoa 478 860 120 173 289 483 54 263 14 941
58 Ninh Thuan 222 895 51 763 140 088 24 234 6 810
60 Binh Thuan 463 423 103 721 292 109 53 293 14 300
62 Kon Tum 166 843 36 256 112 044 15 299 3 244
64 Gia Lai 486 073 90 603 337 999 44 035 13 388 48
66 Dak Lak 676 770 138 359 452 453 69 506 16 452
67 Dak Nong 197 031 35 851 142 604 16 004 2 554 18
68 Lam Dong 472 408 105 165 310 282 45 354 11 607
70 Binh Phuoc 348 861 63 353 233 050 38 153 14 245 60
72 Tay Ninh 442 790 84 281 276 380 56 208 25 921
74 Binh Duong 797 449 207 505 501 696 56 875 31 373
75 Dong Nai 1 122 228 279 531 702 382 103 298 37 017
77 Ba Ria - Vung Tau 417 858 94 359 264 715 42 718 16 066
79 Ho Chi Minh City 3 441 124 1 012 313 1 945 028 331 201 152 582
80 Long An 596 381 111 132 396 621 67 600 21 028
82 Tien Giang 698 583 125 414 464 126 75 571 33 472
83 Ben Tre 517 496 80 569 348 798 63 675 24 454
84 Tra Vinh 409 464 67 717 277 400 47 564 16 744 39
86 Vinh Long 422 784 73 633 286 564 48 118 14 469
87 Dong Thap 666 157 130 356 441 693 70 902 23 206
89 An Giang 842 399 148 912 557 106 101 655 34 726
91 Kien Giang 658 985 112 822 453 572 69 121 23 470
92 Can Tho 494 755 99 847 324 024 50 629 20 255
93 Hau Giang 303 233 58 819 201 133 32 378 10 903
94 Soc Trang 510 299 102 386 338 615 53 290 16 008
95 Bac Lieu 343 833 72 477 228 038 31 777 11 452 89
96 Ca Mau 459 837 76 988 326 785 41 799 14 265

151
Table 4
POPULATION AGED 5 AND OVER BY CURRENTLY SCHOOL ATTENDANCE, SEX, URBAN/RURAL RESIDENCE, SOCIO-ECONOMIC REGION AND PROVINCE/CITY, 1/4/2015
Unit: Person
Population aged 5 and over Currently attending Ever attended Never attended
Cod
e
Administrative unit Total Male Female Total Male Female Total Male Female Total Male Female
ENTIRE COUNTRY 83 929 517 41 062 790 42 866 727 18 734 618 9 555 272 9 179 346 61 764 363 30 369 562 31 394 801 3 430 537 1 137 956 2 292 581
Socio-economic regions
R1 Northern Midlands and Mountains 10 567 432 5 211 083 5 356 349 2 430 715 1 250 909 1 179 806 7 275 973 3 696 822 3 579 151 860 744 263 352 597 392
R2 Red River Delta 19 071 309 9 264 214 9 807 095 4 356 268 2 231 720 2 124 547 14 448 069 6 969 456 7 478 613 266 973 63 038 203 935
R3 North and South Central Coast 18 015 013 8 824 791 9 190 222 4 106 065 2 091 826 2 014 239 13 251 198 6 521 053 6 730 145 657 750 211 912 445 838
R4 Central Highlands 5 088 877 2 544 594 2 544 283 1 305 370 651 752 653 618 3 401 920 1 753 883 1 648 037 381 587 138 959 242 628
R5 Southeast 14 853 448 7 176 059 7 677 389 3 175 806 1 623 560 1 552 246 11 333 953 5 427 826 5 906 127 343 689 124 673 219 016
R6 Mekong River Delta 16 333 438 8 042 049 8 291 389 3 360 394 1 705 505 1 654 889 12 053 250 6 000 522 6 052 728 919 793 336 022 583 772
Provinces/cities
01 Ha Noi 6 551 817 3 202 461 3 349 356 1 655 412 842 901 812 511 4 818 674 2 341 078 2 477 596 77 731 18 482 59 249
02 Ha Giang 702 343 351 342 351 000 180 115 93 263 86 852 384 515 210 747 173 768 137 713 47 333 90 380
04 Cao Bang 472 765 230 899 241 866 98 368 48 080 50 288 319 089 164 070 155 020 55 308 18 749 36 558
06 Bac Kan 283 998 143 250 140 748 56 855 29 957 26 897 213 442 108 622 104 820 13 702 4 671 9 031
08 Tuyen Quang 679 899 334 611 345 288 152 739 75 020 77 719 498 398 250 317 248 081 28 762 9 274 19 489
10 Lao Cai 604 426 304 621 299 806 149 218 77 231 71 987 375 660 198 885 176 775 79 549 28 506 51 043
11 Dien Bien 480 558 239 826 240 732 133 920 70 066 63 854 253 629 144 884 108 746 93 009 24 876 68 133
12 Lai Chau 366 894 183 618 183 276 106 104 56 455 49 649 150 035 90 509 59 526 110 755 36 655 74 100
14 Son La 1 042 032 519 517 522 515 265 611 142 995 122 615 591 039 328 465 262 574 185 383 48 057 137 326
15 Yen Bai 708 824 350 974 357 849 161 379 82 580 78 799 486 285 249 162 237 123 61 160 19 232 41 928
17 Hoa Binh 742 344 363 768 378 576 158 628 79 893 78 735 566 447 278 788 287 659 17 268 5 087 12 182
19 Thai Nguyen 1 080 740 529 729 551 011 249 611 127 738 121 873 817 764 398 282 419 482 13 365 3 709 9 657
20 Lang Son 689 755 345 098 344 657 141 053 72 913 68 140 532 483 268 123 264 360 16 220 4 062 12 158
22 Quang Ninh 1 104 466 552 859 551 606 250 229 128 086 122 143 825 898 415 752 410 146 28 339 9 022 19 317

152
Table 4 (Continued) Unit: Person
Population aged 5 and over Currently attending Ever attended Never attended
Cod
e
Administrative unit Total Male Female Total Male Female Total Male Female Total Male Female
24 Bac Giang 1 478 406 722 198 756 208 315 571 162 988 152 583 1 136 466 551 713 584 753 26 369 7 497 18 871
25 Phu Tho 1 234 448 591 631 642 817 261 544 131 729 129 816 950 721 454 257 496 464 22 183 5 645 16 537
26 Vinh Phuc 948 995 457 215 491 780 220 985 111 905 109 080 713 340 342 204 371 137 14 670 3 106 11 564
27 Bac Ninh 1 030 607 496 388 534 219 242 461 127 483 114 978 771 281 364 983 406 298 16 866 3 922 12 943
30 Hai Duong 1 638 295 799 865 838 430 331 229 173 506 157 723 1 286 354 621 035 665 319 20 712 5 324 15 388
31 Hai Phong 1 789 266 865 472 923 794 387 189 191 970 195 219 1 375 569 668 003 707 566 26 508 5 499 21 008
33 Hung Yen 1 056 141 512 654 543 487 229 341 119 540 109 801 813 508 389 237 424 271 13 292 3 878 9 414
34 Thai Binh 1 659 010 789 345 869 665 333 653 171 218 162 435 1 308 694 614 446 694 248 16 663 3 681 12 982
35 Ha Nam 736 960 356 023 380 937 162 200 81 810 80 390 563 744 271 825 291 919 11 016 2 388 8 628
36 Nam Dinh 1 693 914 814 709 879 204 360 980 190 102 170 878 1 307 791 620 395 687 396 25 143 4 213 20 930
37 Ninh Binh 861 839 417 223 444 617 182 589 93 200 89 389 663 217 320 499 342 717 16 033 3 523 12 510
38 Thanh Hoa 3 195 167 1 553 988 1 641 179 670 337 349 099 321 238 2 430 317 1 175 293 1 255 024 94 513 29 596 64 918
40 Nghe An 2 766 293 1 371 003 1 395 289 634 761 328 118 306 643 2 068 409 1 021 619 1 046 790 63 123 21 267 41 856
42 Ha Tinh 1 151 291 562 548 588 744 253 530 127 198 126 332 876 859 428 987 447 872 20 902 6 363 14 539
44 Quang Binh 797 387 393 460 403 926 196 157 101 198 94 959 583 541 286 820 296 721 17 689 5 442 12 246
45 Quang Tri 565 805 278 560 287 246 151 638 78 525 73 113 378 671 190 287 188 384 35 496 9 748 25 748
46 Thua Thien Hue 1 050 741 511 017 539 724 264 565 130 131 134 435 727 869 368 078 359 791 58 307 12 808 45 499
48 Da Nang 939 185 459 104 480 081 239 502 122 469 117 033 681 162 331 139 350 022 18 521 5 495 13 026
49 Quang Nam 1 360 508 649 298 711 209 296 018 148 217 147 801 1 020 695 489 181 531 514 43 795 11 900 31 895
51 Quang Ngai 1 160 376 564 246 596 130 267 808 134 858 132 951 833 608 413 506 420 102 58 959 15 882 43 078
52 Binh Dinh 1 408 353 684 187 724 166 314 564 160 381 154 183 1 053 122 511 270 541 852 40 666 12 535 28 131
54 Phu Yen 826 227 416 742 409 485 197 877 105 464 92 413 586 331 297 089 289 242 42 018 14 189 27 829
56 Khanh Hoa 1 122 536 550 076 572 460 247 928 123 162 124 766 826 144 409 913 416 230 48 465 17 001 31 464
58 Ninh Thuan 547 288 272 147 275 141 121 126 58 901 62 225 371 706 189 887 181 819 54 456 23 360 31 096
60 Binh Thuan 1 123 856 558 415 565 441 250 253 124 106 126 147 812 764 407 983 404 781 60 839 26 327 34 512

153
Table 4 (Continued) Unit: Person
Population aged 5 and over Currently attending Ever attended Never attended
Cod
e
Administrative unit Total Male Female Total Male Female Total Male Female Total Male Female
62 Kon Tum 441 889 221 049 220 840 123 201 60 782 62 419 280 748 147 163 133 585 37 940 13 104 24 836
64 Gia Lai 1 254 474 619 672 634 802 324 737 161 617 163 120 769 070 398 667 370 403 160 667 59 387 101 280
66 Dak Lak 1 698 565 856 325 842 240 418 380 210 877 207 502 1 190 907 612 925 577 982 89 279 32 523 56 756
67 Dak Nong 526 588 268 919 257 670 151 631 78 000 73 631 347 798 181 431 166 367 27 159 9 487 17 672
68 Lam Dong 1 167 360 578 629 588 731 287 421 140 475 146 947 813 397 413 696 399 700 66 542 24 458 42 084
70 Binh Phuoc 864 617 430 957 433 660 211 527 107 066 104 460 604 463 306 112 298 351 48 627 17 779 30 848
72 Tay Ninh 1 029 629 502 763 526 866 201 620 101 110 100 510 772 764 381 315 391 449 55 245 20 338 34 907
74 Binh Duong 1 766 342 849 161 917 181 318 773 158 361 160 412 1 407 549 674 881 732 668 40 020 15 920 24 100
75 Dong Nai 2 654 833 1 307 110 1 347 722 617 934 317 085 300 849 1 973 454 968 643 1 004 811 63 445 21 383 42 062
77 Ba Ria - Vung Tau 986 575 490 271 496 304 217 273 113 265 104 008 744 159 366 739 377 420 25 143 10 268 14 876
79 Ho Chi Minh City 7 551 452 3 595 797 3 955 655 1 608 679 826 673 782 006 5 831 564 2 730 138 3 101 427 111 209 38 986 72 223
80 Long An 1 385 607 676 804 708 803 287 399 145 090 142 309 1 046 326 513 875 532 451 51 882 17 838 34 044
82 Tien Giang 1 605 889 777 712 828 177 332 521 164 906 167 615 1 215 284 594 262 621 022 58 084 18 545 39 539
83 Ben Tre 1 183 041 578 800 604 241 228 859 119 048 109 811 904 441 445 095 459 346 49 741 14 656 35 084
84 Tra Vinh 952 978 464 803 488 175 198 274 100 949 97 325 668 980 335 895 333 085 85 724 27 958 57 765
86 Vinh Long 974 504 474 614 499 890 205 543 106 125 99 418 724 035 351 969 372 066 44 926 16 520 28 406
87 Dong Thap 1 574 672 781 948 792 724 316 080 160 736 155 345 1 179 298 588 706 590 592 79 293 32 505 46 788
89 An Giang 1 992 590 977 601 1 014 989 408 250 203 991 204 259 1 429 178 711 540 717 638 155 162 62 071 93 091
91 Kien Giang 1 613 533 806 948 806 585 346 001 178 939 167 062 1 147 115 582 906 564 209 120 418 45 103 75 315
92 Can Tho 1 152 696 566 629 586 067 239 208 122 014 117 194 860 888 424 484 436 403 52 600 20 131 32 469
93 Hau Giang 717 226 356 922 360 304 142 681 73 121 69 560 542 692 272 502 270 189 31 853 11 299 20 555
94 Soc Trang 1 223 397 603 500 619 897 248 119 124 048 124 070 865 516 441 878 423 638 109 762 37 574 72 189
95 Bac Lieu 823 655 408 776 414 879 167 127 85 401 81 725 620 847 308 952 311 895 35 681 14 423 21 258
96 Ca Mau 1 133 650 566 993 566 657 240 332 121 137 119 195 848 651 428 457 420 194 44 667 17 398 27 269

154
Table 4 (Continued) Unit: Person
Population aged 5 and over Currently attending Ever attended Never attended
Cod
e
Administrative unit Total Male Female Total Male Female Total Male Female Total Male Female
URBAN 28.502.050 13 732 839 14 769 211 6 452 903 3 274 225 3 178 679 21 480 897 10 265 702 11 215 194 568 249 192 912 375 338
Socio-economic regions
R1 Northern Midlands and Mountains 1 934 828 934 240 1 000 587 444 339 227 500 216 839 1 451 768 695 914 755 853 38 721 10 826 27 895
R2 Red River Delta 6 473 500 3 128 406 3 345 093 1 585 452 794 227 791 225 4 837 525 2 321 750 2 515 775 50 523 12 430 38 093
R3 North and South Central Coast 5 100 735 2 480 383 2 620 352 1 217 861 624 345 593 516 3 763 689 1 818 084 1 945 605 119 185 37 954 81 231
R4 Central Highlands 1 495 647 737 010 758 636 365 801 184 481 181 319 1 090 613 539 661 550 952 39 233 12 868 26 365
R5 Southeast 9 402 388 4 482 827 4 919 562 1 969 086 1 004 824 964 262 7 288 063 3 425 173 3 862 890 145 240 52 830 92 409
R6 Mekong River Delta 4 094 952 1 969 972 2 124 980 870 365 438 848 431 517 3 049 239 1 465 120 1 584 119 175 348 66 004 109 344
Provinces/cities
01 Ha Noi 3 139 960 1 520 963 1 618 997 825 346 411 976 413 370 2 298 734 1 105 192 1 193 542 15 880 3 795 12 085
02 Ha Giang 108 156 52 504 55 652 25 009 12 766 12 244 75 452 37 060 38 392 7 696 2 679 5 017
04 Cao Bang 109 691 51 476 58 214 21 823 10 344 11 479 84 568 40 025 44 543 3 300 1 107 2 193
06 Bac Kan 46 915 22 379 24 537 9 931 4 934 4 997 35 929 17 201 18 728 1 056 244 811
08 Tuyen Quang 93 107 44 521 48 586 18 971 9 442 9 529 73 012 34 843 38 169 1 125 237 888
10 Lao Cai 140 343 69 244 71 099 31 739 16 526 15 214 105 590 51 831 53 760 3 014 887 2 126
11 Dien Bien 74 300 35 888 38 412 18 903 9 350 9 553 52 734 25 961 26 773 2 663 577 2 086
12 Lai Chau 63 997 31 297 32 701 18 480 9 463 9 016 41 149 20 439 20 710 4 369 1 395 2 974
14 Son La 145 460 71 510 73 951 33 785 17 549 16 236 107 393 53 280 54 114 4 282 681 3 601
15 Yen Bai 147 269 72 004 75 264 30 510 16 343 14 167 114 140 54 956 59 184 2 618 705 1 913
17 Hoa Binh 109 369 53 365 56 004 24 018 12 829 11 189 84 427 40 196 44 231 924 341 583
19 Thai Nguyen 358 142 171 510 186 632 93 473 47 009 46 464 262 058 123 825 138 233 2 611 676 1 935
20 Lang Son 136 041 66 703 69 338 28 690 15 573 13 118 106 152 50 955 55 197 1 199 175 1 023
22 Quang Ninh 679 396 335 132 344 264 154 130 77 654 76 476 516 678 254 940 261 738 8 589 2 539 6 050

155
Table 4 (Continued) Unit: Person
Population aged 5 and over Currently attending Ever attended Never attended
Cod
e
Administrative unit Total Male Female Total Male Female Total Male Female Total Male Female
24 Bac Giang 170 176 80 910 89 266 39 102 19 786 19 315 129 407 60 633 68 774 1 667 491 1 176
25 Phu Tho 231 860 110 929 120 931 49 907 25 588 24 319 179 756 84 712 95 045 2 197 630 1 568
26 Vinh Phuc 221 812 104 426 117 386 55 462 25 964 29 498 164 107 77 953 86 153 2 244 509 1 735
27 Bac Ninh 293 200 141 656 151 545 71 395 37 889 33 506 217 991 102 632 115 359 3 814 1 134 2 680
30 Hai Duong 395 357 193 413 201 944 89 671 46 904 42 767 302 595 145 870 156 725 3 090 639 2 452
31 Hai Phong 837 373 399 420 437 953 189 788 91 359 98 429 640 212 306 574 333 638 7 374 1 487 5 886
33 Hung Yen 138 204 65 724 72 480 31 960 15 848 16 112 104 489 49 408 55 081 1 756 468 1 287
34 Thai Binh 172 314 82 094 90 219 35 473 18 181 17 292 136 277 63 635 72 642 564 278 286
35 Ha Nam 114 066 53 283 60 783 27 313 13 021 14 292 85 509 39 994 45 516 1 244 268 976
36 Nam Dinh 309 200 148 801 160 399 66 355 35 248 31 106 238 778 112 731 126 048 4 068 823 3 245
37 Ninh Binh 172 617 83 494 89 123 38 560 20 183 18 376 132 156 62 821 69 335 1 902 490 1 412
38 Thanh Hoa 496 090 241 904 254 185 111 676 61 335 50 341 377 571 177 859 199 712 6 842 2 710 4 132
40 Nghe An 419 646 204 940 214 706 108 557 57 250 51 307 308 063 146 457 161 606 3 026 1 233 1 793
42 Ha Tinh 199 977 93 285 106 692 45 259 22 049 23 210 152 058 70 451 81 607 2 660 785 1 875
44 Quang Binh 156 195 76 117 80 077 37 565 19 196 18 368 117 076 56 457 60 619 1 554 464 1 090
45 Quang Tri 164 869 81 396 83 473 42 273 22 407 19 867 117 658 57 859 59 799 4 937 1 130 3 807
46 Thua Thien Hue 510 326 246 886 263 440 135 891 64 403 71 488 357 217 179 354 177 863 17 218 3 129 14 089
48 Da Nang 819 990 400 734 419 255 211 361 107 605 103 756 593 096 288 288 304 808 15 532 4 841 10 691
49 Quang Nam 313 130 151 458 161 672 71 108 37 081 34 027 235 657 112 427 123 230 6 365 1 950 4 415
51 Quang Ngai 188 572 89 158 99 413 49 263 24 469 24 794 136 658 64 105 72 553 2 650 584 2 066
52 Binh Dinh 436 081 209 857 226 223 98 472 50 375 48 097 328 585 156 852 171 733 9 024 2 630 6 394
54 Phu Yen 240 356 119 239 121 116 59 650 32 356 27 294 176 781 85 839 90 942 3 924 1 044 2 881
56 Khanh Hoa 509 620 248 196 261 424 112 596 57 906 54 690 384 498 186 468 198 030 12 526 3 821 8 705
58 Ninh Thuan 198 617 97 280 101 337 42 957 21 071 21 886 143 697 71 338 72 358 11 963 4 870 7 093
60 Binh Thuan 447 270 219 932 227 339 91 231 46 840 44 391 335 075 164 329 170 746 20 964 8 763 12 202

156
Table 4 (Continued) Unit: Person
Population aged 5 and over Currently attending Ever attended Never attended
Cod
e
Administrative unit Total Male Female Total Male Female Total Male Female Total Male Female
62 Kon Tum 159 198 80 059 79 139 40 168 21 295 18 872 114 878 57 233 57 645 4 152 1 531 2 621
64 Gia Lai 378 583 185 651 192 932 94 240 47 321 46 919 269 273 133 439 135 834 15 070 4 891 10 178
66 Dak Lak 415 944 205 851 210 093 99 530 49 334 50 196 310 434 154 273 156 161 5 980 2 243 3 737
67 Dak Nong 80 311 40 112 40 199 20 621 10 906 9 715 58 136 28 762 29 375 1 553 443 1 110
68 Lam Dong 461 611 225 338 236 273 111 242 55 624 55 618 337 892 165 955 171 937 12 478 3 759 8 718
70 Binh Phuoc 186 176 92 725 93 451 44 102 23 256 20 846 137 301 67 712 69 589 4 772 1 756 3 016
72 Tay Ninh 219 798 105 564 114 234 45 149 22 452 22 697 168 940 81 647 87 293 5 709 1 466 4 244
74 Binh Duong 1 362 423 650 059 712 363 229 577 111 906 117 671 1 105 524 526 242 579 282 27 322 11 912 15 411
75 Dong Nai 926 214 447 810 478 404 223 798 114 321 109 477 683 713 327 321 356 392 18 703 6 168 12 535
77 Ba Ria - Vung Tau 501 456 245 578 255 878 108 211 56 216 51 994 380 876 184 233 196 643 12 369 5 128 7 241
79 Ho Chi Minh City 6 206 322 2 941 091 3 265 231 1 318 249 676 673 641 577 4 811 709 2 238 018 2 573 691 76 364 26 400 49 963
80 Long An 252 605 118 786 133 819 52 136 27 018 25 118 194 828 90 172 104 656 5 641 1 596 4 044
82 Tien Giang 256 532 118 996 137 537 53 451 25 816 27 635 196 176 90 532 105 644 6 905 2 648 4 257
83 Ben Tre 122 173 57 810 64 362 23 255 12 171 11 084 95 542 44 979 50 562 3 376 660 2 716
84 Tra Vinh 166 663 79 883 86 781 34 521 17 849 16 672 124 757 59 372 65 384 7 386 2 662 4 724
86 Vinh Long 165 885 78 928 86 957 35 939 19 905 16 034 124 374 57 359 67 015 5 572 1 664 3 908
87 Dong Thap 280 516 132 931 147 585 60 942 29 508 31 434 208 823 99 427 109 396 10 751 3 996 6 755
89 An Giang 608 336 291 385 316 950 128 800 62 179 66 621 443 169 214 020 229 149 36 366 15 187 21 180
91 Kien Giang 446 168 216 534 229 634 93 942 47 824 46 118 331 413 161 337 170 076 20 813 7 374 13 439
92 Can Tho 774 228 376 696 397 532 169 406 87 075 82 331 579 250 279 830 299 420 25 572 9 791 15 781
93 Hau Giang 174 249 86 907 87 342 34 712 17 818 16 893 131 608 66 194 65 414 7 928 2 894 5 034
94 Soc Trang 373 010 180 006 193 004 80 358 40 391 39 967 265 079 129 426 135 654 27 573 10 189 17 384
95 Bac Lieu 218 045 105 854 112 191 42 828 21 487 21 341 166 561 80 710 85 851 8 656 3 657 5 000
96 Ca Mau 256 542 125 256 131 286 60 075 29 807 30 268 187 658 91 762 95 896 8 808 3 686 5 122

157
Table 4 (Continued) Unit: Person
Population aged 5 and over Currently attending Ever attended Never attended
Cod
e
Administrative unit Total Male Female Total Male Female Total Male Female Total Male Female
RURAL 55 427 468 27 329 952 28 097 516 12 281 714 6 281 047 6 000 667 40 283 466 20 103 860 20 179 606 2 862 287 945 045 1 917 243
Socio-economic regions
R1 Northern Midlands and Mountains 8 632 604 4 276 842 4 355 762 1 986 376 1 023 409 962 967 5 824 205 3 000 908 2 823 298 822 023 252 526 569 497
R2 Red River Delta 12 597 810 6 135 808 6 462 002 2 770 816 1 437 493 1 333 323 9 610 544 4 647 706 4 962 838 216 450 50 608 165 842
R3 North and South Central Coast 12 914 278 6 344 409 6 569 869 2 888 204 1 467 481 1 420 723 9 487 509 4 702 969 4 784 540 538 565 173 959 364 606
R4 Central Highlands 3 593 230 1 807 584 1 785 647 939 570 467 271 472 299 2 311 307 1 214 222 1 097 085 342 354 126 091 216 263
R5 Southeast 5 451 059 2 693 232 2 757 827 1 206 720 618 736 587 983 4 045 890 2 002 653 2 043 237 198 449 71 842 126 607
R6 Mekong River Delta 12 238 486 6 072 077 6 166 409 2 490 029 1 266 657 1 223 372 9 004 011 4 535 402 4 468 609 744 446 270 018 474 427
Provinces/cities
01 Ha Noi 3 411 857 1 681 498 1 730 360 830 066 430 925 399 141 2 519 940 1 235 886 1 284 054 61 851 14 687 47 164
02 Ha Giang 594 186 298 838 295 348 155 106 80 498 74 608 309 063 173 687 135 376 130 018 44 654 85 364
04 Cao Bang 363 074 179 423 183 652 76 545 37 736 38 810 234 522 124 045 110 477 52 008 17 642 34 365
06 Bac Kan 237 083 120 872 116 211 46 924 25 024 21 900 177 513 91 422 86 091 12 646 4 426 8 220
08 Tuyen Quang 586 792 290 089 296 702 133 768 65 579 68 189 425 386 215 474 209 912 27 637 9 037 18 601
10 Lao Cai 464 083 235 377 228 706 117 479 60 705 56 774 270 069 147 054 123 016 76 535 27 618 48 917
11 Dien Bien 406 257 203 938 202 320 115 016 60 716 54 300 200 895 118 923 81 972 90 346 24 299 66 047
12 Lai Chau 302 896 152 322 150 575 87 624 46 992 40 633 108 886 70 070 38 816 106 386 35 260 71 126
14 Son La 896 572 448 007 448 565 231 826 125 447 106 379 483 646 275 185 208 461 181 100 47 376 133 725
15 Yen Bai 561 555 278 970 282 585 130 869 66 237 64 631 372 145 194 206 177 939 58 541 18 527 40 014
17 Hoa Binh 632 975 310 403 322 572 134 611 67 065 67 546 482 020 238 593 243 427 16 344 4 746 11 598
19 Thai Nguyen 722 598 358 218 364 380 156 138 80 729 75 409 555 706 274 456 281 249 10 754 3 033 7 721
20 Lang Son 553 714 278 395 275 319 112 363 57 341 55 022 426 331 217 168 209 163 15 021 3 887 11 134
22 Quang Ninh 425 070 217 727 207 343 96 099 50 432 45 667 309 220 160 812 148 408 19 750 6 483 13 267

158
Table 4 (Continued) Unit: Person
Population aged 5 and over Currently attending Ever attended Never attended
Cod
e
Administrative unit Total Male Female Total Male Female Total Male Female Total Male Female
24 Bac Giang 1 308 230 641 288 666 942 276 470 143 202 133 268 1 007 059 491 080 515 979 24 701 7 006 17 695
25 Phu Tho 1 002 588 480 702 521 885 211 638 106 141 105 497 770 964 369 546 401 419 19 985 5 015 14 970
26 Vinh Phuc 727 183 352 789 374 394 165 524 85 942 79 582 549 234 264 250 284 983 12 426 2 597 9 829
27 Bac Ninh 737 407 354 733 382 674 171 065 89 594 81 472 553 290 262 351 290 939 13 052 2 788 10 264
30 Hai Duong 1 242 938 606 452 636 486 241 558 126 602 114 956 983 759 475 165 508 594 17 621 4 685 12 937
31 Hai Phong 951 892 466 052 485 840 197 401 100 611 96 790 735 357 361 429 373 928 19 134 4 012 15 122
33 Hung Yen 917 937 446 930 471 007 197 381 103 692 93 689 709 019 339 829 369 191 11 536 3 409 8 127
34 Thai Binh 1 486 697 707 251 779 446 298 180 153 037 145 143 1 172 417 550 811 621 606 16 099 3 403 12 696
35 Ha Nam 622 894 302 740 320 153 134 887 68 789 66 098 478 234 231 831 246 403 9 772 2 120 7 652
36 Nam Dinh 1 384 713 665 908 718 805 294 625 154 854 139 771 1 069 012 507 664 561 348 21 076 3 390 17 686
37 Ninh Binh 689 222 333 728 355 494 144 029 73 017 71 012 531 061 257 678 273 382 14 132 3 033 11 099
38 Thanh Hoa 2 699 078 1 312 084 1 386 994 558 660 287 764 270 897 2 052 746 997 434 1 055 312 87 671 26 886 60 785
40 Nghe An 2 346 647 1 166 064 1 180 583 526 204 270 868 255 336 1 760 346 875 162 885 184 60 097 20 034 40 063
42 Ha Tinh 951 315 469 263 482 052 208 271 105 149 103 122 724 801 358 536 366 265 18 243 5 578 12 664
44 Quang Binh 641 192 317 343 323 849 158 592 82 002 76 590 466 465 230 363 236 102 16 134 4 978 11 156
45 Quang Tri 400 937 197 164 203 773 109 365 56 118 53 246 261 013 132 428 128 585 30 559 8 618 21 942
46 Thua Thien Hue 540 415 264 131 276 284 128 675 65 728 62 947 370 651 188 724 181 928 41 089 9 679 31 410
48 Da Nang 119 196 58 370 60 826 28 141 14 864 13 277 88 066 42 851 45 214 2 989 654 2 335
49 Quang Nam 1 047 378 497 841 549 538 224 910 111 136 113 774 785 039 376 754 408 284 37 430 9 950 27 480
51 Quang Ngai 971 804 475 088 496 717 218 545 110 389 108 156 696 950 349 401 347 549 56 309 15 298 41 011
52 Binh Dinh 972 273 474 329 497 943 216 093 110 006 106 087 724 537 354 418 370 119 31 643 9 905 21 738
54 Phu Yen 585 871 297 502 288 369 138 227 73 107 65 119 409 551 211 250 198 301 38 094 13 145 24 949
56 Khanh Hoa 612 916 301 880 311 036 135 332 65 256 70 076 441 646 223 445 218 201 35 939 13 180 22 759
58 Ninh Thuan 348 671 174 867 173 804 78 169 37 829 40 339 228 009 118 548 109 461 42 493 18 490 24 003
60 Binh Thuan 676 586 338 484 338 102 159 022 77 266 81 756 477 689 243 654 234 036 39 875 17 564 22 310

159
Table 4 (Continued) Unit: Person
Population aged 5 and over Currently attending Ever attended Never attended
Cod
e
Administrative unit Total Male Female Total Male Female Total Male Female Total Male Female
62 Kon Tum 282 692 140 990 141 701 83 033 39 486 43 546 165 871 89 931 75 940 33 788 11 573 22 215
64 Gia Lai 875 892 434 021 441 871 230 497 114 296 116 201 499 797 265 229 234 568 145 597 54 496 91 101
66 Dak Lak 1 282 621 650 474 632 147 318 850 161 543 157 307 880 472 458 651 421 821 83 299 30 280 53 019
67 Dak Nong 446 278 228 807 217 471 131 010 67 094 63 916 289 662 152 669 136 992 25 606 9 044 16 562
68 Lam Dong 705 749 353 291 352 458 176 180 84 851 91 329 475 505 247 742 227 763 54 064 20 698 33 366
70 Binh Phuoc 678 441 338 232 340 209 167 424 83 810 83 614 467 162 238 400 228 762 43 855 16 022 27 832
72 Tay Ninh 809 831 397 198 412 632 156 471 78 658 77 813 603 824 299 668 304 156 49 536 18 872 30 664
74 Binh Duong 403 919 199 102 204 817 89 196 46 455 42 741 302 025 148 639 153 386 12 698 4 008 8 690
75 Dong Nai 1 728 619 859 301 869 318 394 136 202 764 191 372 1 289 741 641 321 648 419 44 742 15 215 29 527
77 Ba Ria - Vung Tau 485 120 244 694 240 426 109 062 57 048 52 014 363 283 182 506 180 777 12 774 5 139 7 635
79 Ho Chi Minh City 1 345 130 654 706 690 424 290 430 150 001 140 429 1 019 855 492 119 527 736 34 845 12 585 22 260
80 Long An 1 133 002 558 017 574 985 235 263 118 072 117 191 851 499 423 704 427 795 46 241 16 242 29 999
82 Tien Giang 1 349 357 658 717 690 640 279 070 139 090 139 980 1 019 107 503 730 515 377 51 179 15 897 35 282
83 Ben Tre 1 060 868 520 989 539 879 205 604 106 877 98 727 808 899 400 116 408 783 46 365 13 996 32 369
84 Tra Vinh 786 314 384 920 401 394 163 753 83 100 80 653 544 223 276 523 267 701 78 338 25 297 53 041
86 Vinh Long 808 618 395 685 412 933 169 604 86 219 83 384 599 661 294 610 305 051 39 354 14 856 24 497
87 Dong Thap 1 294 156 649 017 645 139 255 139 131 228 123 911 970 475 489 280 481 195 68 542 28 509 40 033
89 An Giang 1 384 255 686 216 698 039 279 450 141 812 137 638 986 009 497 520 488 489 118 796 46 884 71 912
91 Kien Giang 1 167 365 590 414 576 951 252 059 131 116 120 944 815 701 421 569 394 132 99 605 37 729 61 875
92 Can Tho 378 468 189 934 188 535 69 802 34 939 34 863 281 637 144 654 136 983 27 029 10 340 16 688
93 Hau Giang 542 978 270 015 272 963 107 970 55 303 52 667 411 083 206 308 204 775 23 925 8 405 15 520
94 Soc Trang 850 387 423 493 426 894 167 760 83 657 84 104 600 437 312 452 287 985 82 190 27 385 54 805
95 Bac Lieu 605 610 302 922 302 688 124 299 63 914 60 384 454 286 228 242 226 045 27 025 10 766 16 259
96 Ca Mau 877 108 441 737 435 371 180 257 91 330 88 927 660 993 336 695 324 298 35 858 13 712 22 146
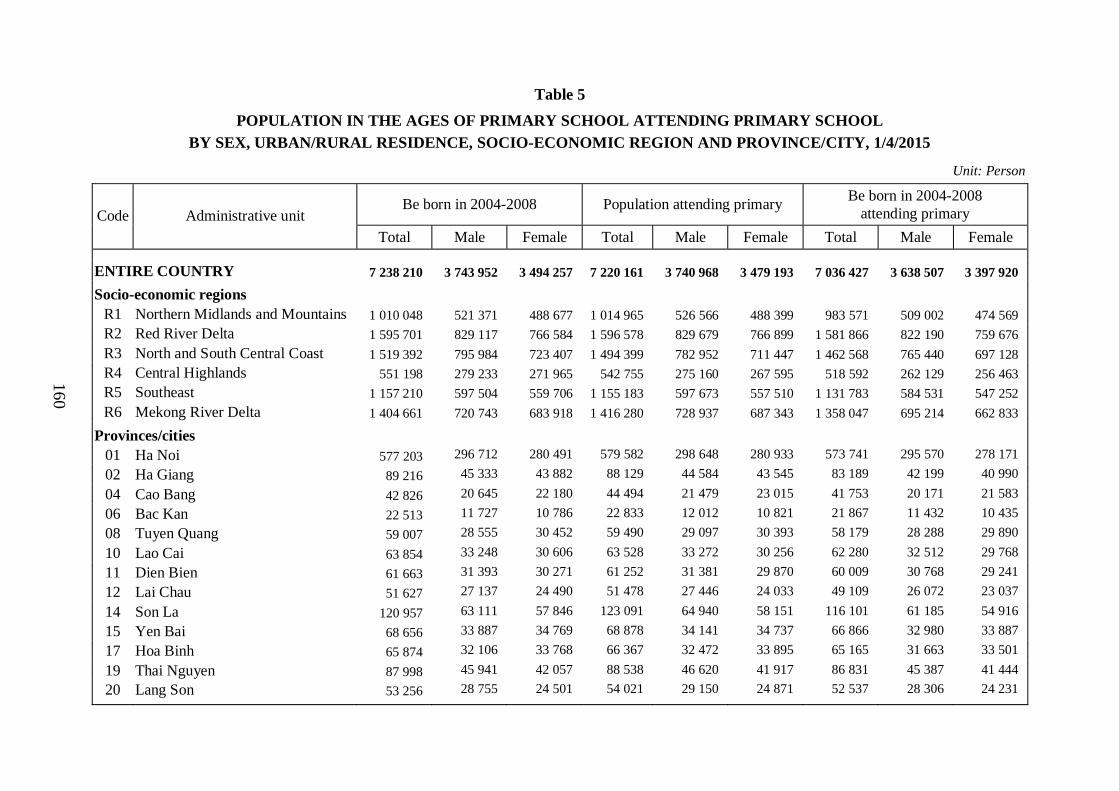
160
Table 5
POPULATION IN THE AGES OF PRIMARY SCHOOL ATTENDING PRIMARY SCHOOL BY SEX, URBAN/RURAL RESIDENCE, SOCIO-ECONOMIC REGION AND PROVINCE/CITY, 1/4/2015
Unit: Person
Be born in 2004-2008 Population attending primary Be born in 2004-2008
attending primary Code Administrative unit
Total Male Female Total Male Female Total Male Female
ENTIRE COUNTRY 7 238 210 3 743 952 3 494 257 7 220 161 3 740 968 3 479 193 7 036 427 3 638 507 3 397 920
Socio-economic regions
R1 Northern Midlands and Mountains 1 010 048 521 371 488 677 1 014 965 526 566 488 399 983 571 509 002 474 569
R2 Red River Delta 1 595 701 829 117 766 584 1 596 578 829 679 766 899 1 581 866 822 190 759 676
R3 North and South Central Coast 1 519 392 795 984 723 407 1 494 399 782 952 711 447 1 462 568 765 440 697 128
R4 Central Highlands 551 198 279 233 271 965 542 755 275 160 267 595 518 592 262 129 256 463
R5 Southeast 1 157 210 597 504 559 706 1 155 183 597 673 557 510 1 131 783 584 531 547 252
R6 Mekong River Delta 1 404 661 720 743 683 918 1 416 280 728 937 687 343 1 358 047 695 214 662 833
Provinces/cities
01 Ha Noi 577 203 296 712 280 491 579 582 298 648 280 933 573 741 295 570 278 171
02 Ha Giang 89 216 45 333 43 882 88 129 44 584 43 545 83 189 42 199 40 990
04 Cao Bang 42 826 20 645 22 180 44 494 21 479 23 015 41 753 20 171 21 583
06 Bac Kan 22 513 11 727 10 786 22 833 12 012 10 821 21 867 11 432 10 435
08 Tuyen Quang 59 007 28 555 30 452 59 490 29 097 30 393 58 179 28 288 29 890
10 Lao Cai 63 854 33 248 30 606 63 528 33 272 30 256 62 280 32 512 29 768
11 Dien Bien 61 663 31 393 30 271 61 252 31 381 29 870 60 009 30 768 29 241
12 Lai Chau 51 627 27 137 24 490 51 478 27 446 24 033 49 109 26 072 23 037
14 Son La 120 957 63 111 57 846 123 091 64 940 58 151 116 101 61 185 54 916
15 Yen Bai 68 656 33 887 34 769 68 878 34 141 34 737 66 866 32 980 33 887
17 Hoa Binh 65 874 32 106 33 768 66 367 32 472 33 895 65 165 31 663 33 501
19 Thai Nguyen 87 998 45 941 42 057 88 538 46 620 41 917 86 831 45 387 41 444
20 Lang Son 53 256 28 755 24 501 54 021 29 150 24 871 52 537 28 306 24 231

161
Table 5 (Continued) Unit: Person
Be born in 2004-2008 Population attending primary Be born in 2004-2008
attending primary Code Administrative unit
Total Male Female Total Male Female Total Male Female
22 Quang Ninh 92 949 46 219 46 729 94 089 46 714 47 375 92 110 45 968 46 143
24 Bac Giang 120 450 64 248 56 201 120 920 65 024 55 896 118 806 63 560 55 246
25 Phu Tho 102 151 55 284 46 867 101 945 54 947 46 998 100 877 54 478 46 400
26 Vinh Phuc 84 349 45 995 38 354 84 954 46 221 38 733 83 922 45 703 38 219
27 Bac Ninh 95 258 52 228 43 031 95 239 51 994 43 245 94 407 51 588 42 819
30 Hai Duong 118 183 63 618 54 566 116 569 62 594 53 975 115 641 61 913 53 728
31 Hai Phong 141 798 71 130 70 667 140 669 70 531 70 138 140 410 70 366 70 045
33 Hung Yen 87 596 47 018 40 578 87 356 46 993 40 363 86 522 46 435 40 087
34 Thai Binh 123 175 64 264 58 911 123 318 64 549 58 770 122 475 64 125 58 350
35 Ha Nam 61 378 30 926 30 452 61 631 30 816 30 815 61 020 30 720 30 300
36 Nam Dinh 139 611 74 564 65 047 139 002 74 253 64 749 138 394 73 796 64 598
37 Ninh Binh 74 200 36 443 37 757 74 169 36 366 37 803 73 223 36 007 37 216
38 Thanh Hoa 246 320 133 980 112 340 248 980 135 847 113 133 243 774 132 617 111 157
40 Nghe An 233 073 124 311 108 762 229 883 122 160 107 723 225 203 120 566 104 637
42 Ha Tinh 93 962 47 265 46 697 90 663 45 604 45 059 89 359 44 767 44 592
44 Quang Binh 71 170 38 429 32 741 71 465 38 790 32 675 69 935 37 826 32 109
45 Quang Tri 58 026 30 011 28 014 58 240 29 993 28 247 56 936 29 282 27 654
46 Thua Thien Hue 86 620 45 446 41 173 83 134 43 767 39 366 81 565 42 794 38 771
48 Da Nang 78 871 42 005 36 866 75 166 39 915 35 251 74 509 39 618 34 891
49 Quang Nam 114 647 58 696 55 951 107 781 54 963 52 819 105 288 53 370 51 918
51 Quang Ngai 95 011 48 080 46 930 94 448 48 014 46 434 92 215 46 491 45 723
52 Binh Dinh 123 888 64 698 59 189 119 596 62 303 57 293 116 179 60 234 55 944
54 Phu Yen 71 524 38 244 33 280 71 588 38 373 33 215 70 085 37 528 32 557
56 Khanh Hoa 92 194 45 723 46 470 90 720 45 111 45 609 88 936 44 084 44 852
58 Ninh Thuan 51 471 26 179 25 292 49 605 25 243 24 362 47 864 24 315 23 549

162
Table 5 (Continued) Unit: Person
Be born in 2004-2008 Population attending primary Be born in 2004-2008
attending primary Code Administrative unit
Total Male Female Total Male Female Total Male Female
60 Binh Thuan 102 615 52 916 49 700 103 128 52 868 50 260 100 720 51 946 48 774
62 Kon Tum 56 834 29 411 27 424 54 521 28 192 26 329 53 278 27 411 25 867
64 Gia Lai 151 457 75 101 76 356 151 078 75 031 76 046 141 889 70 850 71 038
66 Dak Lak 163 218 83 653 79 565 157 753 80 589 77 163 150 880 76 425 74 455
67 Dak Nong 63 524 32 955 30 569 66 121 34 158 31 963 62 040 32 229 29 811
68 Lam Dong 116 165 58 114 58 051 113 284 57 190 56 094 110 505 55 214 55 292
70 Binh Phuoc 86 436 44 695 41 741 87 073 45 247 41 827 84 267 43 566 40 701
72 Tay Ninh 88 309 45 885 42 423 87 479 45 708 41 772 86 379 44 864 41 515
74 Binh Duong 125 289 65 553 59 737 124 527 65 452 59 075 120 900 63 732 57 167
75 Dong Nai 234 276 122 876 111 401 234 228 122 893 111 334 229 080 120 268 108 812
77 Ba Ria - Vung Tau 84 649 44 907 39 742 84 891 45 078 39 813 82 940 43 819 39 120
79 Ho Chi Minh City 538 250 273 588 264 662 536 985 273 295 263 690 528 218 268 281 259 936
80 Long An 115 260 58 092 57 168 115 979 58 335 57 644 113 251 56 506 56 744
82 Tien Giang 132 462 67 561 64 901 132 920 67 276 65 644 130 779 66 589 64 190
83 Ben Tre 88 950 48 094 40 856 88 297 47 644 40 653 86 949 46 892 40 058
84 Tra Vinh 83 748 42 733 41 015 84 213 43 268 40 945 81 052 41 336 39 716
86 Vinh Long 79 252 42 277 36 975 78 437 41 497 36 941 77 690 41 173 36 517
87 Dong Thap 129 514 66 893 62 620 129 325 67 450 61 875 125 294 64 625 60 669
89 An Giang 180 492 89 507 90 984 182 364 90 309 92 054 174 731 86 382 88 349
91 Kien Giang 154 261 82 006 72 255 158 167 85 037 73 130 149 153 79 202 69 951
92 Can Tho 96 446 48 874 47 572 95 484 48 024 47 461 93 452 47 132 46 320
93 Hau Giang 59 229 30 566 28 663 60 734 31 946 28 788 57 767 29 942 27 825
94 Soc Trang 108 979 54 936 54 043 109 225 56 279 52 946 101 302 51 271 50 031
95 Bac Lieu 71 017 37 099 33 918 73 317 38 165 35 152 67 088 34 866 32 222
96 Ca Mau 105 053 52 104 52 949 107 818 53 708 54 110 99 540 49 298 50 242

163
Table 5 (Continued) Unit: Person
Be born in 2004-2008 Population attending primary Be born in 2004-2008
attending primary Code Administrative unit
Total Male Female Total Male Female Total Male Female
URBAN 2 292 658 1 191 557 1 101 102 2 279 084 1 183 993 1 095 090 2 241 975 1 164 533 1 077 442
Socio-economic regions
R1 Northern Midlands and Mountains 164 800 86 269 78 531 165 627 86 822 78 805 162 643 85 147 77 496
R2 Red River Delta 554 130 284 942 269 188 553 004 284 264 268 740 549 766 282 569 267 198
R3 North and South Central Coast 425 329 226 787 198 542 419 497 223 325 196 172 412 465 219 821 192 644
R4 Central Highlands 141 854 72 782 69 073 136 961 69 967 66 994 134 579 68 679 65 900
R5 Southeast 673 513 350 262 323 252 669 634 348 118 321 516 658 904 343 355 315 549
R6 Mekong River Delta 333 032 170 515 162 517 334 360 171 496 162 864 323 618 164 963 158 655
Provinces/cities
01 Ha Noi 269 715 137 362 132 353 269 452 137 478 131 974 268 405 136 939 131 466
02 Ha Giang 10 035 4 991 5 045 10 170 4 993 5 176 9 688 4 752 4 936
04 Cao Bang 9 305 4 508 4 798 9 433 4 557 4 876 9 211 4 436 4 775
06 Bac Kan 4 282 2 221 2 062 4 242 2 187 2 055 4 158 2 149 2 009
08 Tuyen Quang 7 695 4 079 3 616 7 649 4 081 3 568 7 577 4 009 3 568
10 Lao Cai 12 158 6 306 5 852 12 167 6 331 5 836 12 104 6 286 5 818
11 Dien Bien 7 778 3 961 3 817 7 715 3 944 3 772 7 701 3 929 3 772
12 Lai Chau 6 870 3 580 3 290 6 889 3 618 3 271 6 800 3 571 3 229
14 Son La 13 615 7 488 6 127 13 869 7 548 6 320 13 517 7 422 6 095
15 Yen Bai 11 432 6 232 5 201 11 262 6 088 5 174 11 208 6 062 5 146
17 Hoa Binh 9 569 5 247 4 323 9 603 5 256 4 347 9 505 5 182 4 323
19 Thai Nguyen 27 605 13 899 13 707 27 902 14 242 13 660 27 284 13 848 13 436
20 Lang Son 10 377 5 928 4 450 10 744 6 075 4 669 10 255 5 829 4 425
22 Quang Ninh 58 292 28 514 29 777 58 436 28 581 29 855 57 709 28 331 29 378
24 Bac Giang 15 345 7 529 7 816 15 353 7 655 7 698 15 165 7 529 7 636

164
Table 5 (Continued) Unit: Person
Be born in 2004-2008 Population attending primary Be born in 2004-2008
attending primary Code Administrative unit
Total Male Female Total Male Female Total Male Female
25 Phu Tho 18 731 10 301 8 430 18 628 10 246 8 382 18 471 10 142 8 328
26 Vinh Phuc 19 653 10 407 9 246 19 585 10 336 9 249 19 432 10 259 9 173
27 Bac Ninh 28 206 14 969 13 237 28 162 14 961 13 201 27 882 14 781 13 101
30 Hai Duong 30 489 16 778 13 711 29 751 16 002 13 749 29 329 15 827 13 502
31 Hai Phong 69 133 34 746 34 388 69 043 34 656 34 388 68 784 34 490 34 294
33 Hung Yen 10 768 5 438 5 330 10 899 5 527 5 371 10 768 5 438 5 330
34 Thai Binh 14 651 7 984 6 667 14 795 8 129 6 667 14 651 7 984 6 667
35 Ha Nam 10 996 5 247 5 749 10 996 5 247 5 749 10 996 5 247 5 749
36 Nam Dinh 26 483 15 430 11 053 26 179 15 280 10 899 26 179 15 280 10 899
37 Ninh Binh 15 743 8 067 7 676 15 705 8 067 7 638 15 630 7 992 7 638
38 Thanh Hoa 40 843 23 458 17 385 41 489 23 755 17 735 40 040 22 966 17 074
40 Nghe An 35 259 20 246 15 013 35 179 19 919 15 260 34 720 19 805 14 916
42 Ha Tinh 17 230 7 936 9 294 16 984 7 847 9 138 16 884 7 847 9 037
44 Quang Binh 13 463 7 838 5 625 13 510 7 912 5 598 13 254 7 731 5 523
45 Quang Tri 17 395 9 438 7 957 17 489 9 507 7 982 17 193 9 302 7 891
46 Thua Thien Hue 40 859 20 806 20 053 40 275 20 572 19 702 39 612 20 296 19 316
48 Da Nang 67 224 36 120 31 104 64 542 34 492 30 050 63 885 34 195 29 689
49 Quang Nam 25 877 13 729 12 148 24 833 13 074 11 759 24 323 12 747 11 575
51 Quang Ngai 17 841 8 937 8 905 17 700 8 892 8 808 17 429 8 710 8 719
52 Binh Dinh 38 770 19 862 18 908 37 699 19 174 18 526 37 121 18 786 18 335
54 Phu Yen 20 265 10 981 9 285 20 232 11 066 9 166 19 906 10 868 9 039
56 Khanh Hoa 37 800 19 916 17 884 37 854 20 022 17 833 37 321 19 747 17 574
58 Ninh Thuan 18 031 9 096 8 935 17 472 8 899 8 573 17 085 8 715 8 370
60 Binh Thuan 34 473 18 428 16 046 34 238 18 194 16 044 33 692 18 106 15 586

165
Table 5 (Continued) Unit: Person
Be born in 2004-2008 Population attending primary Be born in 2004-2008
attending primary Code Administrative unit
Total Male Female Total Male Female Total Male Female
62 Kon Tum 16 200 8 647 7 552 15 809 8 473 7 336 15 588 8 327 7 261
64 Gia Lai 38 693 19 824 18 868 38 268 19 690 18 578 37 626 19 397 18 230
66 Dak Lak 38 320 19 374 18 946 34 229 16 789 17 440 33 787 16 595 17 193
67 Dak Nong 8 452 4 655 3 797 8 648 4 770 3 878 8 341 4 580 3 761
68 Lam Dong 40 190 20 281 19 909 40 007 20 246 19 762 39 236 19 780 19 456
70 Binh Phuoc 16 817 9 613 7 204 17 050 9 699 7 352 16 615 9 498 7 117
72 Tay Ninh 18 113 9 275 8 838 18 216 9 377 8 839 18 062 9 275 8 787
74 Binh Duong 86 940 45 028 41 912 85 647 44 256 41 392 83 375 43 561 39 815
75 Dong Nai 84 903 44 750 40 153 84 192 44 552 39 640 83 181 44 113 39 068
77 Ba Ria - Vung Tau 42 113 22 166 19 947 41 797 21 748 20 049 41 087 21 461 19 626
79 Ho Chi Minh City 424 627 219 430 205 197 422 731 218 487 204 244 416 584 215 447 201 136
80 Long An 18 950 9 909 9 040 18 796 9 862 8 934 18 467 9 647 8 820
82 Tien Giang 20 502 10 125 10 376 20 168 10 050 10 118 20 042 9 924 10 118
83 Ben Tre 8 903 4 799 4 104 8 949 4 940 4 009 8 808 4 799 4 009
84 Tra Vinh 12 827 7 008 5 820 12 798 7 012 5 787 12 308 6 635 5 674
86 Vinh Long 12 135 6 505 5 630 12 014 6 506 5 508 11 895 6 387 5 508
87 Dong Thap 20 528 10 360 10 168 20 482 10 485 9 997 20 086 10 142 9 944
89 An Giang 51 679 25 905 25 773 51 269 25 480 25 789 50 327 25 055 25 272
91 Kien Giang 38 633 20 514 18 119 39 917 21 178 18 739 38 079 20 148 17 931
92 Can Tho 62 017 31 940 30 077 62 105 31 971 30 133 60 885 31 194 29 691
93 Hau Giang 13 962 7 389 6 573 14 005 7 474 6 531 13 472 7 149 6 323
94 Soc Trang 32 023 15 994 16 030 32 685 16 486 16 199 30 436 15 078 15 358
95 Bac Lieu 16 927 8 610 8 317 16 896 8 573 8 323 15 940 8 049 7 891
96 Ca Mau 23 946 11 456 12 490 24 275 11 479 12 796 22 872 10 758 12 115

166
Table 5 (Continued) Unit: Person
Be born in 2004-2008 Population attending primary Be born in 2004-2008
attending primary Code Administrative unit
Total Male Female Total Male Female Total Male Female
RURAL 4 945 551 2 552 396 2 393 156 4 941 077 2 556 975 2 384 102 4 794 452 2 473 974 2 320 478
Socio-economic regions
R1 Northern Midlands and Mountains 845 248 435 102 410 146 849 338 439 744 409 594 820 928 423 856 397 072
R2 Red River Delta 1 041 571 544 174 497 396 1 043 574 545 415 498 159 1 032 100 539 622 492 478
R3 North and South Central Coast 1 094 063 569 197 524 866 1 074 902 559 627 515 275 1 050 102 545 618 504 484
R4 Central Highlands 409 344 206 452 202 893 405 794 205 193 200 601 384 014 193 451 190 563
R5 Southeast 483 696 247 242 236 454 485 549 249 555 235 994 472 879 241 177 231 703
R6 Mekong River Delta 1 071 629 550 228 521 401 1 081 920 557 441 524 479 1 034 429 530 251 504 178
Provinces/cities
01 Ha Noi 307 488 159 350 148 138 310 129 161 170 148 959 305 335 158 630 146 705
02 Ha Giang 79 180 40 342 38 838 77 959 39 590 38 369 73 501 37 447 36 054
04 Cao Bang 33 520 16 138 17 382 35 061 16 922 18 139 32 542 15 735 16 808
06 Bac Kan 18 231 9 506 8 724 18 591 9 825 8 766 17 710 9 283 8 426
08 Tuyen Quang 51 312 24 476 26 836 51 841 25 016 26 825 50 601 24 279 26 322
10 Lao Cai 51 695 26 941 24 754 51 361 26 941 24 420 50 176 26 227 23 949
11 Dien Bien 53 885 27 432 26 453 53 536 27 438 26 099 52 308 26 839 25 469
12 Lai Chau 44 757 23 557 21 200 44 589 23 828 20 762 42 309 22 502 19 808
14 Son La 107 343 55 623 51 719 109 222 57 392 51 830 102 584 53 763 48 821
15 Yen Bai 57 224 27 655 29 569 57 616 28 053 29 563 55 659 26 918 28 740
17 Hoa Binh 56 305 26 859 29 445 56 764 27 216 29 548 55 660 26 481 29 179
19 Thai Nguyen 60 392 32 042 28 350 60 636 32 379 28 257 59 547 31 540 28 008
20 Lang Son 42 879 22 828 20 052 43 277 23 075 20 202 42 283 22 477 19 806
22 Quang Ninh 34 657 17 705 16 952 35 653 18 133 17 520 34 402 17 637 16 765
24 Bac Giang 105 105 56 719 48 386 105 567 57 369 48 198 103 640 56 030 47 610

167
Table 5 (Continued) Unit: Person
Be born in 2004-2008 Population attending primary Be born in 2004-2008
attending primary Code Administrative unit
Total Male Female Total Male Female Total Male Female
25 Phu Tho 83 420 44 983 38 437 83 317 44 701 38 616 82 407 44 335 38 071
26 Vinh Phuc 64 696 35 588 29 107 65 369 35 885 29 484 64 491 35 445 29 046
27 Bac Ninh 67 052 37 258 29 794 67 076 37 032 30 044 66 525 36 807 29 718
30 Hai Duong 87 694 46 839 40 855 86 818 46 591 40 226 86 312 46 086 40 226
31 Hai Phong 72 664 36 385 36 280 71 626 35 875 35 750 71 626 35 875 35 750
33 Hung Yen 76 827 41 580 35 247 76 458 41 466 34 992 75 754 40 997 34 757
34 Thai Binh 108 525 56 280 52 245 108 523 56 420 52 103 107 824 56 141 51 683
35 Ha Nam 50 382 25 679 24 703 50 635 25 569 25 065 50 024 25 473 24 551
36 Nam Dinh 113 128 59 135 53 994 112 823 58 973 53 850 112 215 58 516 53 699
37 Ninh Binh 58 457 28 376 30 081 58 464 28 299 30 165 57 593 28 015 29 578
38 Thanh Hoa 205 478 110 522 94 955 207 491 112 092 95 399 203 734 109 651 94 083
40 Nghe An 197 814 104 065 93 748 194 704 102 241 92 463 190 483 100 762 89 721
42 Ha Tinh 76 733 39 330 37 403 73 679 37 757 35 922 72 475 36 921 35 555
44 Quang Binh 57 707 30 591 27 116 57 955 30 878 27 077 56 681 30 095 26 586
45 Quang Tri 40 630 20 573 20 057 40 751 20 486 20 266 39 744 19 980 19 763
46 Thua Thien Hue 45 761 24 641 21 121 42 859 23 195 19 664 41 954 22 499 19 455
48 Da Nang 11 647 5 886 5 762 10 624 5 423 5 201 10 624 5 423 5 201
49 Quang Nam 88 770 44 967 43 803 82 949 41 889 41 060 80 965 40 622 40 342
51 Quang Ngai 77 170 39 144 38 026 76 747 39 122 37 626 74 786 37 782 37 004
52 Binh Dinh 85 118 44 837 40 281 81 897 43 130 38 767 79 058 41 448 37 610
54 Phu Yen 51 259 27 263 23 996 51 357 27 307 24 049 50 178 26 660 23 518
56 Khanh Hoa 54 394 25 807 28 587 52 866 25 090 27 776 51 615 24 336 27 278
58 Ninh Thuan 33 440 17 083 16 357 32 133 16 344 15 789 30 779 15 600 15 179
60 Binh Thuan 68 142 34 488 33 654 68 890 34 674 34 216 67 027 33 839 33 188

168
Table 5 (Continued) Unit: Person
Be born in 2004-2008 Population attending primary Be born in 2004-2008
attending primary Code Administrative unit
Total Male Female Total Male Female Total Male Female
62 Kon Tum 40 635 20 763 19 871 38 712 19 719 18 993 37 690 19 084 18 606
64 Gia Lai 112 764 55 276 57 488 112 810 55 341 57 468 104 262 51 454 52 809
66 Dak Lak 124 898 64 279 60 619 123 524 63 800 59 723 117 093 59 831 57 262
67 Dak Nong 55 072 28 300 26 772 57 473 29 388 28 085 53 699 27 649 26 050
68 Lam Dong 75 975 37 833 38 142 73 276 36 944 36 332 71 269 35 434 35 835
70 Binh Phuoc 69 619 35 082 34 537 70 023 35 548 34 475 67 652 34 068 33 584
72 Tay Ninh 70 196 36 611 33 585 69 263 36 331 32 932 68 317 35 589 32 728
74 Binh Duong 38 350 20 525 17 825 38 879 21 196 17 683 37 524 20 171 17 353
75 Dong Nai 149 373 78 126 71 248 150 036 78 341 71 695 145 899 76 155 69 744
77 Ba Ria - Vung Tau 42 536 22 741 19 795 43 093 23 330 19 763 41 853 22 358 19 495
79 Ho Chi Minh City 113 623 54 159 59 464 114 255 54 809 59 446 111 634 52 834 58 800
80 Long An 96 310 48 183 48 127 97 183 48 472 48 710 94 784 46 860 47 924
82 Tien Giang 111 960 57 436 54 524 112 752 57 226 55 526 110 736 56 665 54 072
83 Ben Tre 80 047 43 296 36 751 79 348 42 704 36 644 78 142 42 093 36 049
84 Tra Vinh 70 920 35 725 35 195 71 415 36 257 35 158 68 744 34 702 34 042
86 Vinh Long 67 117 35 772 31 345 66 424 34 991 31 432 65 794 34 785 31 009
87 Dong Thap 108 986 56 533 52 452 108 842 56 964 51 878 105 208 54 483 50 725
89 An Giang 128 813 63 602 65 211 131 095 64 829 66 266 124 404 61 327 63 077
91 Kien Giang 115 627 61 492 54 136 118 250 63 859 54 391 111 073 59 054 52 019
92 Can Tho 34 429 16 934 17 495 33 380 16 052 17 327 32 567 15 938 16 629
93 Hau Giang 45 268 23 177 22 091 46 729 24 472 22 257 44 294 22 793 21 501
94 Soc Trang 76 956 38 942 38 013 76 540 39 793 36 747 70 866 36 193 34 673
95 Bac Lieu 54 089 28 488 25 601 56 421 29 592 26 829 51 148 26 818 24 331
96 Ca Mau 81 107 40 648 40 459 83 543 42 228 41 314 76 668 38 540 38 127

169
Table 6
POPULATION IN THE AGES OF LOWER-SECONDARY SCHOOL ATTENDING LOWER-SECONDARY SCHOOL BY SEX, URBAN/RURAL RESIDENCE, SOCIO-ECONOMIC REGION AND PROVINCE/CITY, 1/4/2015
Unit: Person
Be born in 2000-2003 Population attending
lower-secondary Be born in 2000-2003
attending lower-secondary Code Administrative unit
Total Male Female Total Male Female Total Male Female
ENTIRE COUNTRY 5 643 279 2 923 002 2 720 278 5 205 798 2 683 156 2 522 642 5 072 879 2 604 304 2 468 575
Socio-economic regions
R1 Northern Midlands and Mountains 746 799 386 075 360 724 694 836 365 619 329 217 669 538 349 319 320 218
R2 Red River Delta 1 148 631 593 446 555 185 1 131 375 585 240 546 135 1 119 457 578 326 541 130
R3 North and South Central Coast 1 249 413 640 858 608 554 1 160 029 592 587 567 442 1 131 641 575 913 555 727
R4 Central Highlands 456 685 235 418 221 267 392 500 197 002 195 498 374 206 186 468 187 738
R5 Southeast 899 437 479 081 420 356 840 805 444 773 396 032 824 864 434 734 390 130
R6 Mekong River Delta 1 142 315 588 124 554 191 986 253 497 934 488 318 953 175 479 543 473 632
Provinces/cities
01 Ha Noi 392 884 203 195 189 690 387 283 200 371 186 912 383 575 198 512 185 063
02 Ha Giang 59 855 30 480 29 375 48 684 26 170 22 514 45 753 24 245 21 508
04 Cao Bang 31 294 16 151 15 143 27 097 14 368 12 729 25 294 13 307 11 987
06 Bac Kan 16 542 8 802 7 740 15 914 8 665 7 249 14 894 7 920 6 974
08 Tuyen Quang 46 989 24 451 22 538 45 300 23 417 21 883 44 188 22 831 21 357
10 Lao Cai 49 676 25 041 24 635 46 037 23 241 22 796 45 256 22 922 22 335
11 Dien Bien 43 398 22 313 21 085 38 185 20 951 17 234 36 501 19 851 16 650
12 Lai Chau 33 641 17 543 16 098 28 033 15 252 12 781 25 971 13 962 12 010
14 Son La 86 253 45 343 40 910 76 258 42 803 33 455 70 238 38 591 31 648
15 Yen Bai 51 396 26 526 24 870 47 634 25 120 22 515 45 975 23 935 22 039
17 Hoa Binh 47 552 24 531 23 022 45 948 23 559 22 389 45 237 23 063 22 174
19 Thai Nguyen 63 002 33 675 29 327 62 034 32 727 29 307 61 140 32 528 28 612
20 Lang Son 41 775 22 379 19 396 40 339 21 607 18 732 38 727 20 468 18 258

170
Table 6 (Continued) Unit: Person
Be born in 2000-2003 Population attending
lower-secondary Be born in 2000-2003
attending lower-secondary Code Administrative unit
Total Male Female Total Male Female Total Male Female
22 Quang Ninh 72 487 38 100 34 387 70 660 37 276 33 384 70 024 36 953 33 071
24 Bac Giang 99 227 50 673 48 553 98 600 50 337 48 263 96 044 48 655 47 389
25 Phu Tho 76 200 38 167 38 033 74 774 37 402 37 372 74 320 37 043 37 277
26 Vinh Phuc 55 727 26 791 28 936 54 292 26 301 27 991 54 030 26 227 27 803
27 Bac Ninh 67 151 34 456 32 695 66 542 34 051 32 491 65 282 33 251 32 031
30 Hai Duong 87 161 46 493 40 668 85 764 46 049 39 715 84 391 44 800 39 591
31 Hai Phong 98 909 50 708 48 201 97 742 49 831 47 911 96 741 49 482 47 258
33 Hung Yen 61 384 32 287 29 097 61 118 31 999 29 119 59 822 31 170 28 652
34 Thai Binh 100 760 51 786 48 975 99 074 51 153 47 922 98 657 51 014 47 644
35 Ha Nam 47 347 24 426 22 922 46 574 24 068 22 506 46 214 23 815 22 400
36 Nam Dinh 110 436 56 529 53 908 109 248 55 950 53 299 108 487 55 493 52 994
37 Ninh Binh 54 384 28 676 25 708 53 078 28 192 24 886 52 233 27 609 24 625
38 Thanh Hoa 195 101 96 981 98 119 186 658 92 922 93 737 180 985 89 411 91 573
40 Nghe An 180 696 95 011 85 685 171 106 89 748 81 359 167 072 87 643 79 429
42 Ha Tinh 75 816 37 510 38 306 71 162 35 834 35 328 69 425 34 649 34 776
44 Quang Binh 63 898 33 535 30 363 61 986 32 502 29 484 60 725 31 584 29 141
45 Quang Tri 47 746 25 341 22 405 45 141 23 912 21 229 43 919 23 209 20 710
46 Thua Thien Hue 79 068 39 913 39 155 73 413 37 011 36 402 70 595 35 353 35 241
48 Da Nang 58 602 29 517 29 085 54 464 27 617 26 847 54 111 27 264 26 847
49 Quang Nam 89 432 45 677 43 754 79 820 40 620 39 200 78 217 39 898 38 320
51 Quang Ngai 75 201 38 920 36 281 72 683 37 430 35 254 70 232 35 801 34 430
52 Binh Dinh 105 667 54 464 51 202 95 949 49 277 46 673 94 117 48 137 45 980
54 Phu Yen 66 698 36 381 30 317 62 565 33 961 28 604 61 101 33 236 27 865
56 Khanh Hoa 80 144 40 229 39 915 72 800 36 019 36 781 71 697 35 329 36 369
58 Ninh Thuan 46 015 23 576 22 439 36 430 17 576 18 854 35 459 17 107 18 351

171
Table 6 (Continued) Unit: Person
Be born in 2000-2003 Population attending
lower-secondary Be born in 2000-2003
attending lower-secondary Code Administrative unit
Total Male Female Total Male Female Total Male Female
60 Binh Thuan 85 330 43 803 41 527 75 850 38 159 37 691 73 985 37 291 36 694
62 Kon Tum 42 561 21 435 21 125 36 364 17 316 19 047 34 761 16 417 18 344
64 Gia Lai 119 826 61 577 58 249 94 653 47 743 46 910 89 093 44 753 44 340
66 Dak Lak 147 838 78 602 69 235 131 385 67 986 63 399 125 194 64 258 60 937
67 Dak Nong 50 479 26 093 24 387 45 071 23 513 21 558 42 503 21 945 20 559
68 Lam Dong 95 981 47 710 48 271 85 028 40 443 44 585 82 654 39 096 43 559
70 Binh Phuoc 72 627 37 464 35 163 64 589 32 829 31 760 62 561 31 595 30 967
72 Tay Ninh 67 168 34 185 32 983 60 541 30 074 30 467 59 852 29 635 30 217
74 Binh Duong 91 271 48 475 42 796 78 759 39 940 38 819 76 801 39 067 37 734
75 Dong Nai 181 092 91 227 89 864 167 358 84 288 83 070 162 797 81 611 81 186
77 Ba Ria - Vung Tau 67 141 35 019 32 122 63 674 33 394 30 280 62 393 32 438 29 955
79 Ho Chi Minh City 420 139 232 712 187 428 405 884 224 249 181 636 400 460 220 389 180 071
80 Long An 92 526 47 801 44 726 85 729 43 128 42 601 84 038 42 615 41 423
82 Tien Giang 110 357 57 081 53 277 100 899 50 749 50 149 98 984 49 801 49 183
83 Ben Tre 80 124 41 788 38 336 74 608 38 039 36 569 73 517 37 516 36 001
84 Tra Vinh 62 595 32 090 30 505 54 304 26 808 27 496 52 527 25 809 26 718
86 Vinh Long 64 922 33 213 31 709 60 131 30 024 30 107 59 230 29 629 29 601
87 Dong Thap 104 218 54 090 50 127 93 046 48 243 44 803 90 471 46 211 44 260
89 An Giang 132 627 68 950 63 677 112 221 58 058 54 163 108 431 55 931 52 500
91 Kien Giang 128 728 67 048 61 681 106 873 53 805 53 068 101 324 50 443 50 882
92 Can Tho 73 099 38 632 34 467 63 572 32 789 30 783 62 160 32 422 29 738
93 Hau Giang 49 814 25 709 24 104 43 015 21 298 21 717 41 265 20 499 20 766
94 Soc Trang 89 528 44 248 45 280 68 879 32 888 35 992 64 986 30 454 34 533
95 Bac Lieu 64 033 32 331 31 703 51 041 25 596 25 446 48 190 24 224 23 965
96 Ca Mau 89 743 45 142 44 600 71 935 36 509 35 425 68 051 33 989 34 062

172
Table 6 (Continued) Unit: Person
Be born in 2000-2003 Population attending
lower-secondary Be born in 2000-2003
attending lower-secondary Code Administrative unit
Total Male Female Total Male Female Total Male Female
URBAN 1 721 334 895 058 826 276 1 634 173 847 973 786 200 1 606 942 831 291 775 651
Socio-economic regions
R1 Northern Midlands and Mountains 117 417 60 770 56 647 114 091 59 276 54 815 112 299 58 071 54 228
R2 Red River Delta 372 548 190 807 181 741 367 637 187 908 179 729 364 712 186 585 178 127
R3 North and South Central Coast 323 869 165 165 158 704 306 896 156 793 150 102 301 421 153 533 147 888
R4 Central Highlands 112 167 58 570 53 597 104 511 53 901 50 610 101 709 51 980 49 730
R5 Southeast 524 129 280 258 243 871 499 587 266 569 233 017 491 784 261 331 230 454
R6 Mekong River Delta 271 205 139 489 131 716 241 451 123 526 117 925 235 017 119 793 115 224
Provinces/cities
01 Ha Noi 177 285 92 340 84 945 175 913 91 745 84 167 174 393 90 993 83 399
02 Ha Giang 7 103 3 835 3 268 6 203 3 461 2 743 6 034 3 320 2 714
04 Cao Bang 5 804 3 112 2 693 5 430 2 964 2 466 5 307 2 891 2 416
06 Bac Kan 2 425 1 245 1 181 2 437 1 245 1 192 2 340 1 184 1 157
08 Tuyen Quang 5 141 2 403 2 738 4 951 2 284 2 667 4 905 2 260 2 645
10 Lao Cai 8 629 4 406 4 223 8 493 4 334 4 159 8 424 4 265 4 159
11 Dien Bien 4 424 2 183 2 241 4 456 2 200 2 256 4 378 2 137 2 241
12 Lai Chau 4 313 2 171 2 142 4 192 2 166 2 026 4 002 2 039 1 964
14 Son La 9 030 4 456 4 575 8 862 4 490 4 372 8 478 4 232 4 246
15 Yen Bai 8 927 4 817 4 110 8 875 4 820 4 055 8 788 4 732 4 055
17 Hoa Binh 6 648 3 863 2 785 6 523 3 738 2 785 6 501 3 716 2 785
19 Thai Nguyen 21 538 11 339 10 199 20 977 11 018 9 958 20 693 10 956 9 737
20 Lang Son 8 991 4 732 4 259 8 600 4 513 4 086 8 478 4 416 4 061
22 Quang Ninh 42 335 21 977 20 358 41 329 21 333 19 996 41 010 21 215 19 795
24 Bac Giang 11 721 5 787 5 933 11 475 5 727 5 748 11 353 5 605 5 748

173
Table 6 (Continued) Unit: Person
Be born in 2000-2003 Population attending
lower-secondary Be born in 2000-2003
attending lower-secondary Code Administrative unit
Total Male Female Total Male Female Total Male Female
25 Phu Tho 12 722 6 422 6 300 12 618 6 318 6 300 12 618 6 318 6 300
26 Vinh Phuc 12 608 6 170 6 438 12 269 5 969 6 301 12 218 5 969 6 250
27 Bac Ninh 20 086 10 271 9 816 19 677 9 956 9 721 19 537 9 909 9 627
30 Hai Duong 20 036 11 269 8 767 19 281 10 838 8 443 18 907 10 587 8 320
31 Hai Phong 47 548 22 232 25 316 47 047 21 900 25 146 46 952 21 900 25 052
33 Hung Yen 9 138 4 670 4 468 8 891 4 536 4 355 8 891 4 536 4 355
34 Thai Binh 9 682 4 359 5 323 9 394 4 142 5 252 9 394 4 142 5 252
35 Ha Nam 6 803 3 103 3 701 6 767 3 067 3 701 6 767 3 067 3 701
36 Nam Dinh 16 253 8 329 7 924 16 408 8 485 7 924 16 099 8 329 7 770
37 Ninh Binh 10 772 6 088 4 684 10 661 5 937 4 724 10 545 5 937 4 608
38 Thanh Hoa 27 099 13 334 13 766 26 419 12 850 13 569 25 330 12 390 12 941
40 Nghe An 24 861 13 066 11 795 24 403 12 952 11 452 24 191 12 837 11 354
42 Ha Tinh 11 925 5 459 6 465 11 773 5 509 6 264 11 572 5 410 6 162
44 Quang Binh 10 513 5 337 5 176 10 468 5 294 5 174 10 259 5 156 5 103
45 Quang Tri 11 341 6 051 5 290 10 954 5 819 5 135 10 753 5 663 5 090
46 Thua Thien Hue 32 749 16 081 16 668 31 550 15 619 15 931 30 610 15 070 15 539
48 Da Nang 50 196 24 761 25 436 47 261 23 601 23 660 46 908 23 248 23 660
49 Quang Nam 18 815 10 269 8 546 17 416 9 601 7 814 17 287 9 472 7 814
51 Quang Ngai 11 749 6 024 5 726 11 479 5 840 5 639 11 344 5 753 5 591
52 Binh Dinh 28 009 14 324 13 685 26 420 13 619 12 801 25 906 13 362 12 544
54 Phu Yen 18 346 9 619 8 727 17 775 9 296 8 479 17 476 9 127 8 349
56 Khanh Hoa 32 998 17 072 15 926 31 023 16 143 14 880 30 594 15 870 14 724
58 Ninh Thuan 14 436 7 550 6 886 12 577 6 416 6 161 12 396 6 346 6 050
60 Binh Thuan 30 831 16 219 14 612 27 376 14 232 13 145 26 795 13 827 12 968

174
Table 6 (Continued) Unit: Person
Be born in 2000-2003 Population attending
lower-secondary Be born in 2000-2003
attending lower-secondary Code Administrative unit
Total Male Female Total Male Female Total Male Female
62 Kon Tum 12 141 6 659 5 482 11 042 5 985 5 058 10 860 5 838 5 022
64 Gia Lai 29 351 15 235 14 117 27 393 13 938 13 455 26 474 13 445 13 029
66 Dak Lak 31 025 16 653 14 372 28 591 15 444 13 147 27 755 14 731 13 025
67 Dak Nong 6 252 3 236 3 016 5 910 2 975 2 936 5 687 2 844 2 843
68 Lam Dong 33 399 16 787 16 611 31 575 15 560 16 016 30 932 15 121 15 811
70 Binh Phuoc 14 840 7 627 7 213 13 890 7 084 6 806 13 619 6 891 6 728
72 Tay Ninh 14 913 7 658 7 254 14 198 7 101 7 097 14 146 7 049 7 097
74 Binh Duong 63 136 33 160 29 976 53 261 26 217 27 044 52 099 25 989 26 111
75 Dong Nai 62 808 30 879 31 929 59 302 29 103 30 199 58 156 28 565 29 591
77 Ba Ria - Vung Tau 31 099 15 899 15 200 29 270 15 150 14 120 28 858 14 782 14 076
79 Ho Chi Minh City 337 334 185 035 152 299 329 666 181 915 147 751 324 906 178 056 146 850
80 Long An 17 312 8 785 8 528 16 529 8 634 7 895 16 142 8 420 7 721
82 Tien Giang 16 607 8 914 7 693 15 462 8 177 7 285 15 329 8 110 7 220
83 Ben Tre 7 261 4 091 3 170 6 851 3 722 3 128 6 803 3 722 3 081
84 Tra Vinh 9 973 5 168 4 805 9 211 4 564 4 648 8 960 4 469 4 491
86 Vinh Long 10 403 5 599 4 804 9 478 4 989 4 489 9 439 4 949 4 489
87 Dong Thap 16 439 8 185 8 254 15 675 7 711 7 964 15 388 7 541 7 847
89 An Giang 37 708 19 128 18 580 33 766 17 215 16 551 32 916 16 785 16 131
91 Kien Giang 31 212 15 631 15 581 26 187 13 092 13 095 25 291 12 489 12 802
92 Can Tho 49 408 26 136 23 271 45 432 23 489 21 944 44 348 23 122 21 227
93 Hau Giang 11 431 6 150 5 281 10 156 5 315 4 842 9 832 5 126 4 707
94 Soc Trang 28 137 14 031 14 106 22 855 11 552 11 303 21 755 10 638 11 117
95 Bac Lieu 15 123 7 914 7 209 12 709 6 573 6 136 12 222 6 304 5 919
96 Ca Mau 20 191 9 758 10 433 17 139 8 493 8 646 16 591 8 119 8 472

175
Table 6 (Continued) Unit: Person
Be born in 2000-2003 Population attending
lower-secondary Be born in 2000-2003
attending lower-secondary Code Administrative unit
Total Male Female Total Male Female Total Male Female
RURAL 3 921 945 2 027 943 1 894 002 3 571 625 1 835 182 1 736 443 3 465 937 1 773 012 1 692 925
Socio-economic regions
R1 Northern Midlands and Mountains 629 383 325 305 304 077 580 745 306 343 274 402 557 239 291 249 265 990
R2 Red River Delta 776 082 402 638 373 444 763 738 397 333 366 406 754 745 391 742 363 003
R3 North and South Central Coast 925 544 475 693 449 851 853 133 435 794 417 339 830 220 422 380 407 839
R4 Central Highlands 344 518 176 848 167 670 287 988 143 101 144 888 272 496 134 488 138 008
R5 Southeast 375 308 198 823 176 485 341 218 178 204 163 015 333 079 173 403 159 676
R6 Mekong River Delta 871 110 448 635 422 475 744 802 374 409 370 393 718 158 359 750 358 408
Provinces/cities
01 Ha Noi 215 599 110 855 104 744 211 370 108 625 102 745 209 182 107 518 101 663
02 Ha Giang 52 751 26 644 26 107 42 481 22 709 19 771 39 719 20 925 18 794
04 Cao Bang 25 489 13 039 12 450 21 667 11 404 10 262 19 986 10 416 9 571
06 Bac Kan 14 116 7 557 6 559 13 477 7 420 6 057 12 553 6 736 5 817
08 Tuyen Quang 41 848 22 048 19 800 40 349 21 133 19 216 39 283 20 571 18 712
10 Lao Cai 41 048 20 635 20 413 37 544 18 908 18 636 36 832 18 657 18 175
11 Dien Bien 38 974 20 130 18 844 33 729 18 751 14 978 32 124 17 714 14 409
12 Lai Chau 29 328 15 373 13 956 23 841 13 086 10 755 21 969 11 923 10 046
14 Son La 77 223 40 888 36 335 67 396 38 313 29 083 61 761 34 359 27 402
15 Yen Bai 42 469 21 709 20 760 38 759 20 300 18 459 37 187 19 203 17 984
17 Hoa Binh 40 905 20 668 20 237 39 425 19 821 19 603 38 736 19 347 19 389
19 Thai Nguyen 41 464 22 337 19 127 41 057 21 709 19 349 40 447 21 572 18 875
20 Lang Son 32 784 17 647 15 137 31 739 17 094 14 645 30 249 16 052 14 197
22 Quang Ninh 30 151 16 123 14 028 29 331 15 943 13 388 29 014 15 738 13 277
24 Bac Giang 87 506 44 886 42 620 87 125 44 610 42 515 84 691 43 050 41 641

176
Table 6 (Continued) Unit: Person
Be born in 2000-2003 Population attending
lower-secondary Be born in 2000-2003
attending lower-secondary Code Administrative unit
Total Male Female Total Male Female Total Male Female
25 Phu Tho 63 478 31 745 31 733 62 156 31 085 31 072 61 702 30 725 30 977
26 Vinh Phuc 43 119 20 621 22 498 42 023 20 332 21 690 41 812 20 259 21 553
27 Bac Ninh 47 064 24 185 22 879 46 865 24 094 22 770 45 745 23 342 22 404
30 Hai Duong 67 125 35 224 31 900 66 483 35 212 31 271 65 485 34 213 31 271
31 Hai Phong 51 361 28 477 22 884 50 696 27 931 22 764 49 789 27 582 22 207
33 Hung Yen 52 246 27 617 24 629 52 228 27 463 24 764 50 932 26 635 24 297
34 Thai Binh 91 078 47 426 43 652 89 681 47 011 42 669 89 264 46 872 42 392
35 Ha Nam 40 544 21 323 19 221 39 807 21 001 18 806 39 447 20 748 18 699
36 Nam Dinh 94 183 48 199 45 984 92 840 47 465 45 375 92 388 47 164 45 224
37 Ninh Binh 43 612 22 588 21 024 42 417 22 254 20 163 41 688 21 671 20 017
38 Thanh Hoa 168 001 83 647 84 354 160 239 80 072 80 168 155 654 77 022 78 633
40 Nghe An 155 835 81 945 73 890 146 703 76 796 69 907 142 881 74 806 68 075
42 Ha Tinh 63 892 32 051 31 841 59 389 30 326 29 064 57 853 29 239 28 614
44 Quang Binh 53 385 28 198 25 187 51 518 27 208 24 310 50 466 26 428 24 038
45 Quang Tri 36 405 19 290 17 115 34 187 18 093 16 094 33 166 17 546 15 620
46 Thua Thien Hue 46 319 23 832 22 487 41 862 21 391 20 471 39 985 20 283 19 702
48 Da Nang 8 405 4 756 3 649 7 203 4 016 3 187 7 203 4 016 3 187
49 Quang Nam 70 617 35 409 35 208 62 404 31 019 31 385 60 930 30 425 30 505
51 Quang Ngai 63 452 32 896 30 556 61 204 31 589 29 615 58 888 30 049 28 839
52 Binh Dinh 77 658 40 140 37 518 69 529 35 657 33 872 68 210 34 774 33 436
54 Phu Yen 48 352 26 762 21 590 44 790 24 665 20 125 43 625 24 109 19 516
56 Khanh Hoa 47 146 23 157 23 989 41 778 19 876 21 902 41 104 19 459 21 645
58 Ninh Thuan 31 579 16 026 15 553 23 853 11 160 12 693 23 063 10 761 12 302
60 Binh Thuan 54 499 27 585 26 915 48 474 23 927 24 547 47 190 23 463 23 727

177
Table 6 (Continued) Unit: Person
Be born in 2000-2003 Population attending
lower-secondary Be born in 2000-2003
attending lower-secondary Code Administrative unit
Total Male Female Total Male Female Total Male Female
62 Kon Tum 30 420 14 776 15 644 25 321 11 332 13 989 23 901 10 579 13 323
64 Gia Lai 90 475 46 342 44 132 67 260 33 805 33 455 62 618 31 307 31 311
66 Dak Lak 116 813 61 950 54 863 102 794 52 542 50 252 97 439 49 527 47 912
67 Dak Nong 44 228 22 857 21 371 39 160 20 538 18 622 36 816 19 101 17 716
68 Lam Dong 62 582 30 923 31 659 53 453 24 884 28 569 51 722 23 975 27 747
70 Binh Phuoc 57 787 29 837 27 950 50 699 25 745 24 954 48 943 24 704 24 239
72 Tay Ninh 52 255 26 526 25 729 46 343 22 973 23 370 45 706 22 586 23 120
74 Binh Duong 28 135 15 315 12 820 25 498 13 723 11 775 24 702 13 078 11 624
75 Dong Nai 118 284 60 349 57 935 108 055 55 185 52 871 104 641 53 046 51 595
77 Ba Ria - Vung Tau 36 042 19 119 16 923 34 405 18 245 16 160 33 535 17 656 15 878
79 Ho Chi Minh City 82 806 47 677 35 129 76 218 42 334 33 885 75 554 42 334 33 221
80 Long An 75 214 39 016 36 198 69 200 34 494 34 706 67 897 34 195 33 702
82 Tien Giang 93 751 48 167 45 584 85 437 42 573 42 864 83 655 41 691 41 964
83 Ben Tre 72 863 37 698 35 165 67 757 34 317 33 441 66 714 33 794 32 920
84 Tra Vinh 52 622 26 922 25 700 45 093 22 244 22 849 43 567 21 340 22 227
86 Vinh Long 54 519 27 614 26 905 50 653 25 035 25 618 49 792 24 680 25 112
87 Dong Thap 87 778 45 906 41 873 77 371 40 532 36 839 75 083 38 670 36 413
89 An Giang 94 919 49 822 45 097 78 455 40 843 37 612 75 514 39 146 36 368
91 Kien Giang 97 517 51 417 46 100 80 686 40 713 39 973 76 033 37 954 38 080
92 Can Tho 23 692 12 495 11 196 18 140 9 300 8 839 17 812 9 300 8 511
93 Hau Giang 38 382 19 559 18 823 32 858 15 983 16 875 31 433 15 373 16 059
94 Soc Trang 61 392 30 218 31 174 46 024 21 335 24 689 43 231 19 816 23 415
95 Bac Lieu 48 910 24 416 24 494 38 332 19 023 19 310 35 968 17 921 18 047
96 Ca Mau 69 552 35 385 34 167 54 796 28 016 26 780 51 460 25 871 25 589

178
Table 7
POPULATION IN THE AGES OF HIGHER-SECONDARY SCHOOL ATTENDING HIGHER-SECONDARY SCHOOL BY SEX, URBAN/RURAL RESIDENCE, SOCIO-ECONOMIC REGION AND PROVINCE/CITY, 1/4/2015
Unit: Person
Be born in 1997-1999 Population attending
higher-secondary Be born in 1997-1999
attending higher-secondary Code Administrative unit
Total Male Female Total Male Female Total Male Female
ENTIRE COUNTRY 3 955 738 2 037 447 1 918 292 2 755 914 1 354 822 1 401 093 2 621 246 1 271 114 1 350 132
Socio-economic regions
R1 Northern Midlands and Mountains 520 842 266 257 254 584 336 730 168 514 168 216 316 385 154 209 162 175
R2 Red River Delta 815 735 421 791 393 944 706 580 354 076 352 504 689 256 343 652 345 604
R3 North and South Central Coast 970 268 503 901 466 367 689 087 336 297 352 790 658 865 319 040 339 825
R4 Central Highlands 338 988 177 513 161 476 195 287 92 304 102 982 180 611 84 222 96 389
R5 Southeast 592 752 300 102 292 650 416 104 205 375 210 730 392 709 188 401 204 309
R6 Mekong River Delta 717 153 367 883 349 270 412 126 198 255 213 871 383 420 181 590 201 830
Provinces/cities
01 Ha Noi 262 883 139 025 123 858 235 210 119 807 115 403 229 075 115 664 113 410
02 Ha Giang 38 962 21 099 17 864 16 581 8 873 7 708 14 693 7 739 6 954
04 Cao Bang 24 355 11 874 12 481 13 888 6 222 7 665 12 269 5 227 7 042
06 Bac Kan 13 078 6 615 6 463 9 051 4 619 4 432 8 128 3 931 4 197
08 Tuyen Quang 32 123 14 332 17 791 24 068 10 655 13 413 23 350 10 063 13 286
10 Lao Cai 33 768 17 872 15 896 16 665 8 738 7 927 15 828 8 205 7 623
11 Dien Bien 30 999 16 942 14 057 15 306 8 550 6 756 14 104 7 634 6 470
12 Lai Chau 22 638 11 570 11 068 8 694 4 803 3 891 7 494 3 879 3 614
14 Son La 56 899 30 463 26 436 27 301 15 600 11 701 24 144 13 203 10 941
15 Yen Bai 36 216 18 435 17 780 21 107 10 850 10 257 19 696 10 015 9 680
17 Hoa Binh 32 744 17 301 15 443 24 753 13 381 11 372 23 491 12 274 11 217
19 Thai Nguyen 44 106 23 340 20 766 36 787 18 967 17 820 35 349 18 062 17 287 20 Lang Son 34 205 16 935 17 270 26 379 12 096 14 283 24 310 10 846 13 464

179
Table 7 (Continued) Unit: Person
Be born in 1997-1999 Population attending
higher-secondary Be born in 1997-1999
attending higher-secondary Code Administrative unit
Total Male Female Total Male Female Total Male Female
22 Quang Ninh 49 004 25 408 23 595 42 058 21 366 20 692 41 287 20 825 20 462
24 Bac Giang 71 622 36 406 35 216 57 731 27 931 29 799 55 846 26 546 29 300
25 Phu Tho 49 127 23 074 26 053 38 419 17 228 21 190 37 682 16 584 21 098
26 Vinh Phuc 46 122 22 295 23 827 38 290 18 276 20 013 37 351 17 818 19 533
27 Bac Ninh 48 276 25 355 22 920 41 821 20 497 21 325 40 187 19 412 20 775
30 Hai Duong 72 795 37 861 34 935 60 840 31 364 29 476 59 693 30 896 28 797
31 Hai Phong 68 614 33 796 34 818 58 213 28 404 29 810 57 600 28 136 29 463
33 Hung Yen 47 067 21 829 25 238 38 090 17 058 21 033 36 408 15 921 20 487
34 Thai Binh 72 993 37 819 35 174 65 923 33 065 32 858 65 147 32 710 32 437
35 Ha Nam 33 191 16 186 17 005 27 666 12 803 14 863 27 043 12 443 14 600
36 Nam Dinh 78 306 42 412 35 894 67 474 35 669 31 805 65 926 35 037 30 889
37 Ninh Binh 36 484 19 804 16 680 30 995 15 768 15 226 29 541 14 791 14 750
38 Thanh Hoa 156 884 80 680 76 204 121 740 59 850 61 890 116 420 56 543 59 877
40 Nghe An 147 576 77 676 69 900 99 377 49 414 49 962 95 752 47 103 48 648
42 Ha Tinh 67 413 34 772 32 641 55 190 27 428 27 762 53 063 26 185 26 878
44 Quang Binh 45 242 22 976 22 266 33 543 15 649 17 894 32 295 15 030 17 265
45 Quang Tri 36 560 18 836 17 724 28 482 14 266 14 217 27 396 13 442 13 954
46 Thua Thien Hue 59 382 32 170 27 211 38 944 18 872 20 072 37 009 17 848 19 161
48 Da Nang 41 942 21 640 20 302 35 353 17 585 17 768 33 873 16 774 17 099
49 Quang Nam 72 520 36 740 35 780 50 009 25 105 24 905 48 335 23 867 24 468
51 Quang Ngai 65 624 34 701 30 922 48 849 23 980 24 869 45 593 22 264 23 330
52 Binh Dinh 74 703 38 602 36 101 52 065 23 530 28 535 49 374 22 477 26 897
54 Phu Yen 45 753 24 381 21 372 33 237 16 508 16 729 32 189 15 851 16 338
56 Khanh Hoa 57 761 31 184 26 577 38 064 19 603 18 461 36 852 19 040 17 812
58 Ninh Thuan 35 773 17 743 18 030 19 383 8 304 11 079 17 705 7 432 10 273

180
Table 7 (Continued) Unit: Person
Be born in 1997-1999 Population attending
higher-secondary Be born in 1997-1999
attending higher-secondary Code Administrative unit
Total Male Female Total Male Female Total Male Female
60 Binh Thuan 63 136 31 799 31 337 34 852 16 203 18 649 33 009 15 183 17 826
62 Kon Tum 30 087 15 653 14 434 14 029 6 280 7 749 13 145 5 825 7 320
64 Gia Lai 84 046 42 088 41 959 38 281 17 252 21 029 35 738 16 056 19 682
66 Dak Lak 117 266 64 456 52 810 74 332 35 819 38 513 67 667 31 803 35 864
67 Dak Nong 33 771 17 733 16 037 22 279 11 010 11 269 19 986 9 689 10 297
68 Lam Dong 73 819 37 584 36 235 46 366 21 944 24 422 44 075 20 849 23 226
70 Binh Phuoc 48 997 24 298 24 699 30 842 14 942 15 900 28 195 13 286 14 908
72 Tay Ninh 44 713 23 294 21 419 25 217 11 822 13 395 23 945 11 000 12 945
74 Binh Duong 65 094 31 403 33 691 32 477 15 733 16 744 30 601 14 239 16 362
75 Dong Nai 124 874 63 364 61 510 88 546 43 549 44 997 82 424 38 970 43 454
77 Ba Ria - Vung Tau 49 016 25 339 23 677 35 677 17 462 18 215 34 074 16 290 17 784
79 Ho Chi Minh City 260 059 132 404 127 655 203 344 101 865 101 479 193 471 94 615 98 856
80 Long An 64 272 32 111 32 161 44 939 21 459 23 479 42 305 19 728 22 576
82 Tien Giang 70 295 35 674 34 621 42 406 19 808 22 598 40 189 18 154 22 035
83 Ben Tre 53 324 27 021 26 303 36 283 17 540 18 743 34 797 16 793 18 004
84 Tra Vinh 41 495 21 626 19 869 25 582 12 057 13 524 23 971 11 083 12 888
86 Vinh Long 37 516 18 816 18 700 28 102 13 048 15 054 26 652 12 032 14 620
87 Dong Thap 72 456 38 093 34 363 38 563 18 157 20 406 36 260 17 064 19 196
89 An Giang 82 514 42 951 39 563 44 302 21 696 22 607 42 245 20 521 21 724
91 Kien Giang 74 719 38 452 36 267 38 699 17 724 20 975 35 821 15 980 19 841
92 Can Tho 45 710 23 747 21 963 27 864 14 466 13 399 26 376 13 669 12 708
93 Hau Giang 31 825 15 827 15 998 16 599 7 907 8 692 15 240 7 076 8 165
94 Soc Trang 55 882 28 028 27 854 26 793 12 920 13 873 23 540 11 295 12 245
95 Bac Lieu 37 546 20 469 17 077 18 447 9 804 8 644 15 857 8 297 7 560
96 Ca Mau 49 600 25 069 24 531 23 546 11 668 11 878 20 167 9 898 10 268

181
Table 7 (Continued) Unit: Person
Be born in 1997-1999 Population attending
higher-secondary Be born in 1997-1999
attending higher-secondary Code Administrative unit
Total Male Female Total Male Female Total Male Female
URBAN 1 140 504 583 744 556 760 908 597 450 111 458 486 868 903 425 876 443 027
Socio-economic regions
R1 Northern Midlands and Mountains 72 557 37 539 35 018 64 682 33 210 31 472 62 230 31 449 30 781
R2 Red River Delta 237 770 117 589 120 181 220 943 107 086 113 857 215 971 104 398 111 573
R3 North and South Central Coast 235 939 125 540 110 399 189 048 96 113 92 935 182 044 92 206 89 838
R4 Central Highlands 81 369 43 174 38 195 62 802 31 454 31 347 59 638 29 546 30 091
R5 Southeast 339 096 173 011 166 085 256 794 128 572 128 222 242 881 118 812 124 068
R6 Mekong River Delta 173 774 86 892 86 883 114 328 53 676 60 652 106 140 49 465 56 676
Provinces/cities
01 Ha Noi 107 505 53 370 54 136 102 678 49 800 52 878 100 102 48 483 51 619
02 Ha Giang 4 767 2 565 2 202 3 686 2 085 1 601 3 502 1 927 1 575
04 Cao Bang 3 663 1 767 1 896 2 850 1 317 1 533 2 780 1 271 1 509
06 Bac Kan 1 562 720 843 1 335 586 749 1 267 530 737
08 Tuyen Quang 2 895 1 429 1 465 2 797 1 357 1 441 2 679 1 260 1 419
10 Lao Cai 5 526 3 165 2 362 4 835 2 656 2 179 4 681 2 549 2 133
11 Dien Bien 3 182 1 495 1 687 3 096 1 438 1 658 2 956 1 328 1 627
12 Lai Chau 2 590 1 403 1 187 2 339 1 310 1 029 2 026 1 049 976
14 Son La 5 459 2 746 2 714 4 241 2 114 2 127 4 020 1 990 2 030
15 Yen Bai 5 984 3 109 2 876 5 472 2 850 2 622 5 305 2 742 2 563
17 Hoa Binh 4 217 2 217 2 000 4 248 2 250 1 998 4 002 2 051 1 951
19 Thai Nguyen 11 942 6 554 5 388 10 917 5 993 4 924 10 445 5 721 4 723
20 Lang Son 5 717 3 033 2 684 5 158 2 810 2 347 4 983 2 711 2 272
22 Quang Ninh 27 640 12 862 14 778 26 063 12 152 13 911 25 481 11 703 13 777
24 Bac Giang 6 683 3 542 3 140 6 195 3 117 3 079 6 073 2 994 3 079

182
Table 7 (Continued) Unit: Person
Be born in 1997-1999 Population attending
higher-secondary Be born in 1997-1999
attending higher-secondary Code Administrative unit
Total Male Female Total Male Female Total Male Female
25 Phu Tho 8 370 3 795 4 574 7 512 3 326 4 186 7 512 3 326 4 186
26 Vinh Phuc 9 435 4 433 5 002 8 429 3 915 4 514 8 281 3 882 4 399
27 Bac Ninh 12 002 6 451 5 551 10 135 5 141 4 994 10 000 5 097 4 902
30 Hai Duong 16 251 8 484 7 766 14 394 7 505 6 889 14 131 7 415 6 716
31 Hai Phong 27 194 12 781 14 413 24 771 11 374 13 397 24 325 11 107 13 219
33 Hung Yen 5 621 2 615 3 005 5 039 2 263 2 776 4 887 2 188 2 699
34 Thai Binh 6 881 3 558 3 324 6 298 3 195 3 103 6 227 3 123 3 103
35 Ha Nam 4 904 2 225 2 679 4 145 1 736 2 409 4 145 1 736 2 409
36 Nam Dinh 13 334 7 051 6 283 12 478 6 588 5 890 12 108 6 362 5 746
37 Ninh Binh 7 002 3 758 3 245 6 513 3 417 3 096 6 285 3 302 2 983
38 Thanh Hoa 18 818 11 000 7 817 17 304 10 107 7 197 16 343 9 625 6 718
40 Nghe An 15 659 8 960 6 699 13 140 7 350 5 790 12 801 7 235 5 565
42 Ha Tinh 9 124 4 617 4 507 8 721 4 362 4 358 8 520 4 161 4 358
44 Quang Binh 6 976 3 259 3 717 5 859 2 602 3 257 5 499 2 422 3 077
45 Quang Tri 9 529 5 217 4 313 8 266 4 496 3 770 7 994 4 314 3 679
46 Thua Thien Hue 26 512 13 964 12 548 19 521 9 374 10 147 18 971 9 044 9 927
48 Da Nang 35 434 18 447 16 987 30 962 15 510 15 452 29 673 14 795 14 878
49 Quang Nam 14 616 8 312 6 305 11 152 5 966 5 186 10 839 5 710 5 129
51 Quang Ngai 9 634 4 624 5 010 8 845 4 219 4 626 8 616 4 081 4 535
52 Binh Dinh 18 523 9 573 8 951 14 019 6 976 7 043 13 761 6 785 6 976
54 Phu Yen 12 554 7 172 5 382 10 450 5 790 4 661 10 072 5 620 4 452
56 Khanh Hoa 23 832 12 985 10 847 19 489 9 956 9 533 18 854 9 637 9 217
58 Ninh Thuan 10 913 5 357 5 556 6 750 2 852 3 898 6 350 2 588 3 762
60 Binh Thuan 23 814 12 055 11 759 14 570 6 553 8 018 13 751 6 188 7 563

183
Table 7 (Continued) Unit: Person
Be born in 1997-1999 Population attending
higher-secondary Be born in 1997-1999
attending higher-secondary Code Administrative unit
Total Male Female Total Male Female Total Male Female
62 Kon Tum 8 933 5 007 3 925 6 453 3 429 3 024 6 218 3 284 2 934
64 Gia Lai 21 033 10 452 10 581 15 840 7 268 8 571 14 993 6 871 8 122
66 Dak Lak 23 235 12 766 10 469 18 659 9 538 9 121 17 352 8 759 8 593
67 Dak Nong 3 945 2 066 1 879 3 165 1 687 1 478 2 979 1 594 1 386
68 Lam Dong 24 222 12 882 11 340 18 685 9 531 9 154 18 095 9 039 9 057
70 Binh Phuoc 8 727 4 231 4 496 6 567 3 081 3 486 5 881 2 677 3 204
72 Tay Ninh 8 972 4 515 4 457 6 514 2 972 3 542 6 255 2 820 3 435
74 Binh Duong 47 597 23 225 24 371 21 959 11 095 10 865 20 778 10 151 10 628
75 Dong Nai 34 908 17 849 17 059 28 034 13 970 14 064 26 205 12 805 13 400
77 Ba Ria - Vung Tau 22 237 11 751 10 487 16 860 8 463 8 397 16 133 7 976 8 157
79 Ho Chi Minh City 216 655 111 441 105 214 176 859 88 991 87 868 167 628 82 383 85 245
80 Long An 10 101 5 239 4 861 8 231 3 947 4 284 7 513 3 728 3 786
82 Tien Giang 10 445 5 109 5 336 7 196 3 258 3 938 7 122 3 184 3 938
83 Ben Tre 4 712 2 250 2 462 4 240 2 060 2 180 3 956 1 920 2 036
84 Tra Vinh 7 240 3 926 3 314 5 086 2 435 2 651 4 712 2 219 2 492
86 Vinh Long 5 864 2 820 3 044 4 852 2 248 2 604 4 537 2 014 2 522
87 Dong Thap 12 262 6 131 6 131 8 520 3 841 4 679 8 052 3 732 4 321
89 An Giang 26 323 12 899 13 424 16 124 7 180 8 943 15 278 6 749 8 530
91 Kien Giang 21 736 10 223 11 513 13 553 5 872 7 680 12 541 5 275 7 266
92 Can Tho 30 375 15 194 15 180 20 197 10 080 10 117 19 496 9 728 9 768
93 Hau Giang 7 742 3 635 4 107 4 435 1 933 2 502 4 136 1 723 2 413
94 Soc Trang 16 461 8 256 8 206 9 353 4 285 5 068 7 966 3 568 4 398
95 Bac Lieu 9 689 5 208 4 481 5 149 2 499 2 650 4 709 2 224 2 485
96 Ca Mau 10 823 6 000 4 823 7 392 4 037 3 355 6 121 3 400 2 721

184
Table 7 (Continued) Unit: Person
Be born in 1997-1999 Population attending
higher-secondary Be born in 1997-1999
attending higher-secondary Code Administrative unit
Total Male Female Total Male Female Total Male Female
RURAL 2 815 234 1 453 703 1 361 531 1 847 317 904 711 942 606 1 752 343 845 238 907 105
Socio-economic regions
R1 Northern Midlands and Mountains 448 285 228 719 219 566 272 048 135 304 136 743 254 155 122 761 131 394
R2 Red River Delta 577 965 304 202 273 763 485 637 246 991 238 646 473 285 239 254 234 032
R3 North and South Central Coast 734 329 378 361 355 968 500 039 240 184 259 855 476 821 226 834 249 987
R4 Central Highlands 257 620 134 339 123 280 132 485 60 850 71 635 120 973 54 675 66 297
R5 Southeast 253 656 127 090 126 566 159 310 76 803 82 507 149 829 69 588 80 240
R6 Mekong River Delta 543 379 280 991 262 388 297 798 144 579 153 219 277 280 132 125 145 154
Provinces/cities
01 Ha Noi 155 378 85 655 69 722 132 532 70 007 62 525 128 973 67 182 61 791
02 Ha Giang 34 195 18 534 15 662 12 895 6 788 6 107 11 191 5 812 5 378
04 Cao Bang 20 692 10 107 10 585 11 038 4 906 6 132 9 489 3 956 5 533
06 Bac Kan 11 515 5 895 5 621 7 716 4 033 3 684 6 861 3 401 3 460
08 Tuyen Quang 29 228 12 902 16 326 21 270 9 298 11 973 20 670 8 803 11 867
10 Lao Cai 28 241 14 707 13 534 11 830 6 082 5 748 11 147 5 656 5 491
11 Dien Bien 27 817 15 447 12 370 12 209 7 112 5 098 11 149 6 306 4 843
12 Lai Chau 20 048 10 167 9 881 6 355 3 493 2 862 5 468 2 830 2 638
14 Son La 51 440 27 718 23 722 23 060 13 486 9 574 20 124 11 213 8 911
15 Yen Bai 30 231 15 327 14 905 15 635 8 000 7 635 14 391 7 273 7 117
17 Hoa Binh 28 527 15 084 13 443 20 504 11 130 9 374 19 489 10 223 9 267
19 Thai Nguyen 32 165 16 787 15 378 25 870 12 974 12 896 24 905 12 340 12 564
20 Lang Son 28 489 13 903 14 586 21 222 9 286 11 936 19 327 8 136 11 192
22 Quang Ninh 21 364 12 546 8 818 15 995 9 214 6 781 15 806 9 121 6 685
24 Bac Giang 64 939 32 864 32 076 51 536 24 815 26 721 49 773 23 552 26 221

185
Table 7 (Continued) Unit: Person
Be born in 1997-1999 Population attending
higher-secondary Be born in 1997-1999
attending higher-secondary Code Administrative unit
Total Male Female Total Male Female Total Male Female
25 Phu Tho 40 757 19 278 21 479 30 907 13 902 17 004 30 170 13 258 16 912
26 Vinh Phuc 36 686 17 861 18 825 29 861 14 362 15 499 29 070 13 936 15 134
27 Bac Ninh 36 274 18 904 17 370 31 686 15 356 16 331 30 188 14 315 15 873
30 Hai Duong 56 545 29 376 27 169 46 446 23 859 22 586 45 562 23 481 22 081
31 Hai Phong 41 420 21 016 20 404 33 443 17 029 16 413 33 274 17 029 16 245
33 Hung Yen 41 447 19 214 22 233 33 051 14 795 18 257 31 521 13 733 17 788
34 Thai Binh 66 112 34 262 31 851 59 625 29 870 29 755 58 920 29 586 29 334
35 Ha Nam 28 287 13 961 14 325 23 521 11 067 12 453 22 898 10 707 12 191
36 Nam Dinh 64 972 35 361 29 611 54 996 29 081 25 915 53 818 28 675 25 143
37 Ninh Binh 29 481 16 046 13 435 24 482 12 351 12 131 23 256 11 489 11 767
38 Thanh Hoa 138 066 69 680 68 387 104 437 49 743 54 694 100 078 46 918 53 159
40 Nghe An 131 917 68 717 63 200 86 237 42 064 44 173 82 951 39 868 43 083
42 Ha Tinh 58 289 30 155 28 134 46 469 23 066 23 403 44 543 22 024 22 519
44 Quang Binh 38 266 19 717 18 549 27 684 13 047 14 637 26 796 12 608 14 188
45 Quang Tri 27 030 13 619 13 411 20 216 9 769 10 446 19 403 9 128 10 275
46 Thua Thien Hue 32 870 18 207 14 663 19 423 9 498 9 925 18 038 8 803 9 234
48 Da Nang 6 508 3 193 3 315 4 390 2 075 2 315 4 200 1 979 2 220
49 Quang Nam 57 903 28 428 29 475 38 858 19 138 19 719 37 496 18 157 19 339
51 Quang Ngai 55 990 30 077 25 913 40 004 19 761 20 242 36 978 18 183 18 795
52 Binh Dinh 56 180 29 029 27 150 38 046 16 554 21 492 35 613 15 692 19 920
54 Phu Yen 33 199 17 209 15 989 22 787 10 718 12 069 22 117 10 231 11 885
56 Khanh Hoa 33 929 18 199 15 730 18 575 9 647 8 928 17 997 9 403 8 594
58 Ninh Thuan 24 860 12 386 12 474 12 633 5 452 7 181 11 355 4 844 6 511
60 Binh Thuan 39 322 19 744 19 578 20 282 9 650 10 631 19 258 8 995 10 263

186
Table 7 (Continued) Unit: Person
Be born in 1997-1999 Population attending
higher-secondary Be born in 1997-1999
attending higher-secondary Code Administrative unit
Total Male Female Total Male Female Total Male Female
62 Kon Tum 21 154 10 645 10 509 7 577 2 851 4 726 6 927 2 540 4 386
64 Gia Lai 63 013 31 636 31 377 22 441 9 983 12 458 20 745 9 185 11 560
66 Dak Lak 94 031 51 689 42 341 55 673 26 281 29 392 50 315 23 045 27 271
67 Dak Nong 29 825 15 667 14 158 19 114 9 323 9 791 17 006 8 095 8 911
68 Lam Dong 49 597 24 701 24 895 27 681 12 412 15 269 25 980 11 811 14 169
70 Binh Phuoc 40 270 20 067 20 203 24 275 11 861 12 414 22 314 10 609 11 705
72 Tay Ninh 35 741 18 780 16 961 18 703 8 850 9 853 17 690 8 180 9 510
74 Binh Duong 17 497 8 178 9 319 10 518 4 639 5 879 9 823 4 088 5 734
75 Dong Nai 89 966 45 515 44 451 60 512 29 580 30 933 56 219 26 165 30 054
77 Ba Ria - Vung Tau 26 778 13 588 13 190 18 817 8 999 9 817 17 941 8 314 9 627
79 Ho Chi Minh City 43 404 20 963 22 441 26 485 12 874 13 611 25 843 12 232 13 611
80 Long An 54 171 26 871 27 300 36 708 17 513 19 195 34 791 16 001 18 790
82 Tien Giang 59 850 30 565 29 285 35 210 16 550 18 660 33 067 14 969 18 097
83 Ben Tre 48 612 24 771 23 841 32 043 15 480 16 563 30 841 14 873 15 968
84 Tra Vinh 34 255 17 700 16 555 20 496 9 623 10 874 19 260 8 864 10 396
86 Vinh Long 31 652 15 996 15 656 23 251 10 801 12 450 22 116 10 018 12 098
87 Dong Thap 60 193 31 961 28 232 30 042 14 316 15 727 28 207 13 332 14 876
89 An Giang 56 191 30 052 26 139 28 178 14 515 13 663 26 966 13 772 13 194
91 Kien Giang 52 983 28 228 24 754 25 146 11 852 13 295 23 280 10 705 12 576
92 Can Tho 15 335 8 552 6 783 7 668 4 386 3 282 6 881 3 941 2 940
93 Hau Giang 24 083 12 192 11 891 12 164 5 974 6 190 11 104 5 352 5 752
94 Soc Trang 39 420 19 772 19 648 17 440 8 635 8 805 15 574 7 727 7 847
95 Bac Lieu 27 858 15 261 12 596 13 298 7 305 5 993 11 148 6 074 5 074
96 Ca Mau 38 777 19 069 19 708 16 154 7 632 8 523 14 045 6 498 7 547

187
Table 8
POPULATION IN THE AGES OF COLLEGE/UNIVERSITY ATTENDING COLLEGE/UNIVERSITY BY SEX, URBAN/RURAL RESIDENCE, SOCIO-ECONOMIC REGION AND PROVINCE/CITY, 1/4/2015
Unit: Person
Be born in 1993-1996 Population attending
college/university Be born in 1993-1996
attending college/university Code Administrative unit
Total Male Female Total Male Female Total Male Female
ENTIRE COUNTRY 5 252 791 2 656 306 2 596 484 1 499 338 692 560 806 778 1 152 948 505 115 647 832
Socio-economic regions
R1 Northern Midlands and Mountains 668 876 343 645 325 232 90 848 41 057 49 790 54 439 23 370 31 069
R2 Red River Delta 1 068 627 525 802 542 825 444 747 200 638 244 109 362 239 155 819 206 420
R3 North and South Central Coast 1 211 059 627 871 583 187 334 238 155 377 178 861 261 666 114 531 147 136
R4 Central Highlands 356 332 189 571 166 761 36 098 16 321 19 777 23 895 10 217 13 678
R5 Southeast 1 031 044 492 853 538 191 397 851 183 797 214 054 315 426 138 161 177 265
R6 Mekong River Delta 916 853 476 564 440 289 195 557 95 370 100 187 135 282 63 018 72 264
Provinces/cities
01 Ha Noi 455 278 220 138 235 140 274 291 126 959 147 331 225 770 99 144 126 626
02 Ha Giang 54 851 28 546 26 305 2 516 1 389 1 127 737 270 467
04 Cao Bang 30 211 16 681 13 530 2 333 701 1 632 490 197 292
06 Bac Kan 18 242 9 875 8 366 1 892 813 1 079 837 300 537
08 Tuyen Quang 38 735 20 132 18 602 3 319 795 2 524 1 471 261 1 209
10 Lao Cai 47 193 25 184 22 009 4 870 2 580 2 291 2 392 1 128 1 263
11 Dien Bien 37 369 19 625 17 744 2 589 980 1 609 1 472 510 961
12 Lai Chau 29 675 15 549 14 126 2 949 1 320 1 629 483 149 334
14 Son La 76 370 38 854 37 516 5 505 2 973 2 532 2 369 1 044 1 324
15 Yen Bai 44 649 23 559 21 090 4 317 2 326 1 991 1 275 713 562
17 Hoa Binh 40 325 21 713 18 612 2 997 1 204 1 793 1 397 538 859
19 Thai Nguyen 68 195 32 726 35 469 36 313 16 111 20 203 28 062 11 739 16 323
20 Lang Son 42 577 23 331 19 246 2 988 1 164 1 824 1 449 564 885

188
Table 8 (Continued) Unit: Person
Be born in 1993-1996 Population attending
college/university Be born in 1993-1996
attending college/university Code Administrative unit
Total Male Female Total Male Female Total Male Female
22 Quang Ninh 59 489 30 322 29 167 14 777 7 507 7 270 10 499 4 781 5 718
24 Bac Giang 78 347 38 134 40 213 5 585 2 354 3 232 2 819 953 1 865
25 Phu Tho 62 138 29 735 32 403 12 674 6 349 6 325 9 188 5 002 4 186
26 Vinh Phuc 61 389 29 274 32 115 17 265 6 688 10 577 13 438 4 684 8 754
27 Bac Ninh 55 402 25 434 29 969 11 973 5 826 6 147 8 771 4 384 4 387
30 Hai Duong 96 431 47 780 48 652 31 513 12 953 18 560 26 098 10 699 15 399
31 Hai Phong 90 828 43 304 47 523 41 188 16 784 24 405 32 460 12 333 20 127
33 Hung Yen 60 895 30 938 29 957 19 775 9 782 9 992 17 320 8 417 8 904
34 Thai Binh 57 017 30 575 26 442 11 640 4 462 7 178 10 192 4 059 6 133
35 Ha Nam 40 419 20 667 19 752 9 523 4 756 4 767 7 981 3 767 4 213
36 Nam Dinh 56 032 27 567 28 465 8 767 3 288 5 479 6 789 2 444 4 345
37 Ninh Binh 35 447 19 805 15 642 4 036 1 634 2 403 2 922 1 108 1 814
38 Thanh Hoa 174 511 95 053 79 458 32 525 17 479 15 046 21 742 11 694 10 048
40 Nghe An 222 233 111 758 110 476 66 714 29 524 37 190 55 929 23 493 32 435
42 Ha Tinh 61 423 33 104 28 318 9 211 4 556 4 655 6 300 2 514 3 786
44 Quang Binh 53 638 27 898 25 740 7 796 2 563 5 233 4 273 920 3 353
45 Quang Tri 28 651 17 018 11 633 3 084 1 540 1 544 805 260 545
46 Thua Thien Hue 90 644 42 937 47 707 44 399 18 180 26 218 35 252 13 543 21 709
48 Da Nang 79 285 40 135 39 150 49 870 24 914 24 956 41 133 19 104 22 029
49 Quang Nam 93 953 46 491 47 462 27 632 11 825 15 807 22 250 8 774 13 476
51 Quang Ngai 78 363 39 603 38 760 23 484 10 376 13 108 19 178 7 899 11 278
52 Binh Dinh 71 374 36 537 34 837 18 309 9 366 8 943 14 538 6 895 7 643
54 Phu Yen 49 478 28 340 21 138 13 076 7 352 5 724 9 549 5 491 4 058
56 Khanh Hoa 82 974 42 642 40 333 22 957 10 660 12 297 19 437 8 728 10 708
58 Ninh Thuan 40 809 21 325 19 483 3 695 1 582 2 113 2 345 934 1 411

189
Table 8 (Continued) Unit: Person
Be born in 1993-1996 Population attending
college/university Be born in 1993-1996
attending college/university Code Administrative unit
Total Male Female Total Male Female Total Male Female
60 Binh Thuan 83 724 45 030 38 694 11 486 5 459 6 027 8 937 4 281 4 656
62 Kon Tum 36 189 18 357 17 832 4 301 1 706 2 595 3 020 1 040 1 979
64 Gia Lai 87 727 43 670 44 056 4 460 2 420 2 040 2 442 1 361 1 082
66 Dak Lak 120 651 66 443 54 208 11 180 5 115 6 065 7 145 3 072 4 073
67 Dak Nong 35 927 20 156 15 771 2 055 1 074 981 902 459 443
68 Lam Dong 75 838 40 944 34 894 14 103 6 006 8 097 10 386 4 285 6 101
70 Binh Phuoc 56 398 30 093 26 305 7 124 2 817 4 307 3 966 1 510 2 455
72 Tay Ninh 55 212 26 576 28 636 4 777 1 752 3 025 2 564 647 1 917
74 Binh Duong 156 980 65 537 91 443 41 033 17 009 24 024 30 772 11 473 19 298
75 Dong Nai 197 524 97 602 99 922 63 038 30 472 32 566 50 657 22 940 27 717
77 Ba Ria - Vung Tau 54 219 29 584 24 635 13 498 6 661 6 837 10 803 5 128 5 675
79 Ho Chi Minh City 510 711 243 460 267 251 268 381 125 086 143 295 216 664 96 462 120 202
80 Long An 74 999 39 456 35 543 11 886 5 844 6 043 8 117 3 610 4 507
82 Tien Giang 83 846 40 072 43 774 22 723 9 187 13 536 14 990 5 726 9 264
83 Ben Tre 46 616 24 365 22 251 6 498 3 208 3 291 3 419 1 564 1 856
84 Tra Vinh 47 888 25 306 22 581 10 652 4 971 5 680 6 818 2 866 3 952
86 Vinh Long 45 753 25 085 20 668 16 026 8 993 7 033 11 643 6 671 4 973
87 Dong Thap 95 809 49 857 45 952 20 621 10 505 10 116 15 814 7 789 8 026
89 An Giang 111 455 57 287 54 168 24 270 10 945 13 325 18 087 7 696 10 392
91 Kien Giang 91 377 48 305 43 072 11 599 5 963 5 635 6 431 3 387 3 045
92 Can Tho 68 040 34 163 33 877 25 497 12 252 13 246 18 776 8 798 9 978
93 Hau Giang 42 334 21 981 20 353 7 382 3 850 3 532 4 587 2 076 2 511
94 Soc Trang 81 894 42 722 39 172 14 903 8 374 6 529 9 903 5 330 4 573
95 Bac Lieu 54 842 28 596 26 246 10 702 4 986 5 716 8 126 3 440 4 686
96 Ca Mau 71 998 39 368 32 630 12 798 6 293 6 505 8 571 4 067 4 504

190
Table 8 (Continued) Unit: Person
Be born in 1993-1996 Population attending
college/university Be born in 1993-1996
attending college/university Code Administrative unit
Total Male Female Total Male Female Total Male Female
URBAN 1 803 825 861 046 942 779 935 018 431 260 503 758 737 270 325 515 411 755
Socio-economic regions
R1 Northern Midlands and Mountains 81 478 39 835 41 643 46 496 20 269 26 227 28 356 11 654 16 702
R2 Red River Delta 386 345 180 299 206 046 268 722 120 775 147 947 222 685 96 362 126 324
R3 North and South Central Coast 342 346 169 669 172 677 177 020 81 838 95 182 140 716 61 674 79 042
R4 Central Highlands 84 461 42 422 42 039 23 911 10 378 13 533 17 055 7 025 10 030
R5 Southeast 665 275 307 771 357 504 327 908 153 965 173 943 259 743 116 339 143 403
R6 Mekong River Delta 243 920 121 050 122 870 90 961 44 036 46 925 68 715 32 462 36 253
Provinces/cities
01 Ha Noi 223 605 104 606 119 000 189 426 85 731 103 695 158 178 69 330 88 848
02 Ha Giang 4 154 2 330 1 824 1 349 669 680 419 153 266
04 Cao Bang 3 506 1 710 1 796 1 327 357 970 333 72 261
06 Bac Kan 1 441 689 752 520 215 304 286 80 206
08 Tuyen Quang 2 460 1 185 1 275 1 151 410 741 496 170 325
10 Lao Cai 5 598 2 818 2 779 2 307 1 067 1 240 1 049 461 588
11 Dien Bien 2 812 1 444 1 369 1 160 437 723 495 194 301
12 Lai Chau 3 020 1 692 1 328 2 414 1 028 1 386 307 63 244
14 Son La 7 759 3 848 3 911 2 963 1 293 1 670 1 820 737 1 084
15 Yen Bai 3 028 1 770 1 258 1 160 511 649 142 142
17 Hoa Binh 3 353 1 795 1 558 1 312 462 850 557 169 388
19 Thai Nguyen 25 692 11 811 13 881 23 576 10 553 13 023 17 767 7 380 10 387
20 Lang Son 4 221 2 319 1 903 958 472 487 317 170 147
22 Quang Ninh 28 254 14 381 13 873 10 144 5 491 4 653 7 260 3 792 3 467
24 Bac Giang 5 940 2 527 3 414 1 793 792 1 001 1 162 469 694

191
Table 8 (Continued) Unit: Person
Be born in 1993-1996 Population attending
college/university Be born in 1993-1996
attending college/university Code Administrative unit
Total Male Female Total Male Female Total Male Female
25 Phu Tho 8 493 3 898 4 595 4 506 2 003 2 503 3 206 1 394 1 812
26 Vinh Phuc 16 593 6 111 10 482 8 771 2 485 6 286 7 651 2 148 5 503
27 Bac Ninh 14 262 6 532 7 730 5 505 3 008 2 498 4 118 2 228 1 891
30 Hai Duong 27 006 12 870 14 136 16 195 6 999 9 196 14 535 6 111 8 424
31 Hai Phong 42 288 19 225 23 063 25 971 11 378 14 593 20 714 8 477 12 237
33 Hung Yen 7 638 3 381 4 257 3 444 1 428 2 016 2 618 964 1 655
34 Thai Binh 5 654 2 763 2 891 1 463 885 578 1 390 885 505
35 Ha Nam 5 202 2 697 2 506 2 251 1 099 1 152 1 800 783 1 016
36 Nam Dinh 10 799 5 015 5 784 4 209 1 582 2 627 3 466 1 186 2 280
37 Ninh Binh 5 044 2 720 2 325 1 342 688 654 955 458 497
38 Thanh Hoa 18 794 10 193 8 601 10 018 5 710 4 307 6 433 3 836 2 597
40 Nghe An 33 379 15 152 18 227 24 966 10 893 14 073 20 968 8 889 12 080
42 Ha Tinh 8 078 3 624 4 454 1 772 861 911 1 227 561 666
44 Quang Binh 8 676 4 317 4 360 3 102 1 025 2 077 1 691 439 1 252
45 Quang Tri 7 879 4 518 3 361 993 385 608 293 90 203
46 Thua Thien Hue 48 822 22 163 26 659 32 554 13 031 19 523 25 766 9 661 16 105
48 Da Nang 69 367 34 453 34 914 46 651 22 973 23 678 38 636 17 711 20 924
49 Quang Nam 22 785 11 511 11 274 10 890 4 617 6 273 8 938 3 344 5 595
51 Quang Ngai 9 331 4 033 5 298 5 981 2 701 3 280 4 666 2 020 2 646
52 Binh Dinh 24 718 12 158 12 560 11 577 5 554 6 023 9 405 4 467 4 938
54 Phu Yen 12 852 7 131 5 721 6 826 3 835 2 990 5 368 2 853 2 515
56 Khanh Hoa 33 680 17 525 16 155 14 108 6 669 7 439 11 848 5 409 6 439
58 Ninh Thuan 11 514 5 767 5 747 2 133 907 1 226 1 182 433 750
60 Binh Thuan 32 470 17 124 15 346 5 451 2 676 2 774 4 295 1 963 2 332

192
Table 8 (Continued) Unit: Person
Be born in 1993-1996 Population attending
college/university Be born in 1993-1996
attending college/university Code Administrative unit
Total Male Female Total Male Female Total Male Female
62 Kon Tum 9 368 5 213 4 155 2 732 1 220 1 512 1 940 829 1 111
64 Gia Lai 19 818 9 564 10 254 2 472 1 114 1 357 1 266 596 670
66 Dak Lak 22 506 11 119 11 387 6 279 2 414 3 865 4 219 1 485 2 734
67 Dak Nong 4 724 2 519 2 205 621 306 314 341 215 126
68 Lam Dong 28 045 14 007 14 039 11 808 5 323 6 484 9 289 3 900 5 390
70 Binh Phuoc 9 868 5 138 4 730 1 868 702 1 166 930 293 637
72 Tay Ninh 9 452 4 935 4 517 1 576 529 1 047 786 105 681
74 Binh Duong 133 870 54 073 79 797 38 101 16 024 22 077 28 770 10 981 17 790
75 Dong Nai 65 036 32 316 32 720 29 536 14 637 14 899 23 229 10 561 12 668
77 Ba Ria - Vung Tau 26 377 13 951 12 426 9 456 4 880 4 576 7 757 3 847 3 910
79 Ho Chi Minh City 420 672 197 358 223 314 247 371 117 193 130 177 198 271 90 552 107 719
80 Long An 13 334 6 463 6 871 4 280 2 346 1 933 2 844 1 531 1 314
82 Tien Giang 13 737 6 310 7 427 6 083 2 257 3 826 4 857 1 846 3 011
83 Ben Tre 4 482 2 000 2 481 1 251 609 642 634 229 405
84 Tra Vinh 9 588 4 738 4 849 3 785 1 625 2 160 2 358 889 1 469
86 Vinh Long 10 368 6 400 3 968 5 204 3 430 1 774 3 973 2 644 1 329
87 Dong Thap 20 308 9 703 10 605 9 467 4 793 4 674 7 997 3 893 4 104
89 An Giang 37 450 17 916 19 534 15 529 6 609 8 920 12 746 5 227 7 520
91 Kien Giang 25 819 12 909 12 910 5 410 3 024 2 386 3 447 2 214 1 233
92 Can Tho 45 485 22 274 23 211 21 853 10 585 11 268 16 570 7 801 8 770
93 Hau Giang 10 341 5 261 5 081 2 557 1 253 1 305 1 565 688 877
94 Soc Trang 24 704 12 689 12 015 6 332 3 388 2 943 4 995 2 594 2 402
95 Bac Lieu 13 516 6 856 6 660 4 633 2 064 2 568 3 650 1 493 2 156
96 Ca Mau 14 788 7 530 7 258 4 579 2 053 2 526 3 078 1 414 1 665

193
Table 8 (Continued) Unit: Person
Be born in 1993-1996 Population attending
college/university Be born in 1993-1996
attending college/university Code Administrative unit
Total Male Female Total Male Female Total Male Female
RURAL 3 448 966 1 795 261 1 653 705 564 319 261 300 303 020 415 677 179 600 236 077
Socio-economic regions
R1 Northern Midlands and Mountains 587 399 303 810 283 588 44 351 20 788 23 563 26 083 11 716 14 367
R2 Red River Delta 682 282 345 503 336 779 176 025 79 864 96 162 139 554 59 457 80 097
R3 North and South Central Coast 868 713 458 202 410 510 157 217 73 539 83 679 120 950 52 857 68 093
R4 Central Highlands 271 871 147 149 124 722 12 187 5 943 6 244 6 840 3 192 3 648
R5 Southeast 365 769 185 082 180 687 69 943 29 832 40 111 55 683 21 822 33 862
R6 Mekong River Delta 672 933 355 514 317 419 104 596 51 334 53 262 66 566 30 556 36 010
Provinces/cities
01 Ha Noi 231 672 115 532 116 140 84 864 41 228 43 637 67 592 29 814 37 778
02 Ha Giang 50 697 26 216 24 481 1 168 720 448 318 118 200
04 Cao Bang 26 705 14 970 11 735 1 006 344 662 157 126 31
06 Bac Kan 16 800 9 186 7 614 1 372 598 774 551 219 332
08 Tuyen Quang 36 274 18 947 17 327 2 167 384 1 783 975 91 884
10 Lao Cai 41 596 22 366 19 230 2 563 1 513 1 051 1 343 668 675
11 Dien Bien 34 557 18 182 16 375 1 429 543 886 977 316 661
12 Lai Chau 26 655 13 858 12 798 535 292 243 176 86 90
14 Son La 68 612 35 006 33 605 2 542 1 680 862 548 308 240
15 Yen Bai 41 621 21 789 19 832 3 157 1 815 1 342 1 133 571 562
17 Hoa Binh 36 972 19 918 17 054 1 685 742 943 840 369 471
19 Thai Nguyen 42 504 20 915 21 588 12 737 5 557 7 179 10 295 4 359 5 936
20 Lang Son 38 355 21 013 17 343 2 029 692 1 337 1 132 394 738
22 Quang Ninh 31 234 15 941 15 294 4 633 2 016 2 617 3 240 989 2 251
24 Bac Giang 72 407 35 607 36 799 3 792 1 562 2 231 1 656 485 1 171

194
Table 8 (Continued) Unit: Person
Be born in 1993-1996 Population attending
college/university Be born in 1993-1996
attending college/university Code Administrative unit
Total Male Female Total Male Female Total Male Female
25 Phu Tho 53 645 25 837 27 808 8 169 4 346 3 822 5 982 3 608 2 374
26 Vinh Phuc 44 796 23 162 21 634 8 494 4 203 4 291 5 787 2 536 3 251
27 Bac Ninh 41 140 18 902 22 238 6 468 2 818 3 649 4 653 2 157 2 496
30 Hai Duong 69 426 34 910 34 516 15 318 5 954 9 364 11 563 4 588 6 975
31 Hai Phong 48 540 24 080 24 460 15 217 5 406 9 811 11 746 3 857 7 889
33 Hung Yen 53 257 27 556 25 700 16 330 8 354 7 976 14 702 7 453 7 249
34 Thai Binh 51 363 27 812 23 551 10 177 3 577 6 600 8 802 3 174 5 628
35 Ha Nam 35 217 17 971 17 247 7 272 3 657 3 615 6 181 2 984 3 197
36 Nam Dinh 45 233 22 552 22 681 4 558 1 705 2 853 3 323 1 258 2 066
37 Ninh Binh 30 403 17 085 13 318 2 694 946 1 748 1 967 650 1 317
38 Thanh Hoa 155 717 84 860 70 856 22 507 11 768 10 739 15 309 7 859 7 450
40 Nghe An 188 854 96 606 92 248 41 749 18 631 23 117 34 961 14 605 20 356
42 Ha Tinh 53 344 29 480 23 864 7 439 3 695 3 744 5 074 1 953 3 120
44 Quang Binh 44 961 23 581 21 380 4 694 1 539 3 156 2 582 481 2 101
45 Quang Tri 20 773 12 500 8 272 2 091 1 155 936 512 170 341
46 Thua Thien Hue 41 821 20 774 21 047 11 845 5 150 6 695 9 486 3 881 5 604
48 Da Nang 9 919 5 682 4 236 3 219 1 941 1 278 2 497 1 393 1 104
49 Quang Nam 71 168 34 980 36 188 16 741 7 207 9 534 13 311 5 430 7 881
51 Quang Ngai 69 032 35 570 33 462 17 503 7 675 9 829 14 512 5 879 8 633
52 Binh Dinh 46 656 24 379 22 277 6 732 3 812 2 920 5 133 2 428 2 705
54 Phu Yen 36 625 21 209 15 417 6 250 3 517 2 733 4 181 2 638 1 543
56 Khanh Hoa 49 294 25 116 24 178 8 849 3 991 4 858 7 589 3 320 4 269
58 Ninh Thuan 29 295 15 559 13 736 1 562 676 886 1 162 501 661
60 Binh Thuan 51 254 27 906 23 348 6 035 2 782 3 253 4 642 2 318 2 324

195
Table 8 (Continued) Unit: Person
Be born in 1993-1996 Population attending
college/university Be born in 1993-1996
attending college/university Code Administrative unit
Total Male Female Total Male Female Total Male Female
62 Kon Tum 26 822 13 145 13 677 1 568 486 1 082 1 080 211 869
64 Gia Lai 67 908 34 106 33 802 1 988 1 305 683 1 176 765 411
66 Dak Lak 98 145 55 324 42 821 4 901 2 701 2 200 2 926 1 586 1 339
67 Dak Nong 31 203 17 636 13 566 1 434 768 666 561 244 317
68 Lam Dong 47 793 26 938 20 855 2 295 683 1 612 1 097 385 712
70 Binh Phuoc 46 530 24 955 21 575 5 256 2 116 3 140 3 036 1 218 1 819
72 Tay Ninh 45 760 21 642 24 118 3 201 1 223 1 978 1 779 542 1 237
74 Binh Duong 23 110 11 465 11 646 2 932 985 1 947 2 001 492 1 509
75 Dong Nai 132 488 65 286 67 202 33 502 15 834 17 668 27 428 12 379 15 049
77 Ba Ria - Vung Tau 27 841 15 633 12 208 4 042 1 781 2 260 3 046 1 281 1 765
79 Ho Chi Minh City 90 039 46 101 43 938 21 010 7 893 13 118 18 393 5 909 12 484
80 Long An 61 665 32 993 28 672 7 607 3 497 4 109 5 273 2 079 3 194
82 Tien Giang 70 109 33 762 36 347 16 640 6 930 9 710 10 133 3 881 6 252
83 Ben Tre 42 134 22 365 19 770 5 248 2 599 2 649 2 785 1 335 1 451
84 Tra Vinh 38 300 20 568 17 732 6 867 3 346 3 520 4 459 1 977 2 483
86 Vinh Long 35 386 18 685 16 701 10 822 5 562 5 260 7 670 4 026 3 644
87 Dong Thap 75 502 40 155 35 347 11 154 5 712 5 442 7 817 3 895 3 922
89 An Giang 74 006 39 371 34 635 8 741 4 336 4 405 5 341 2 469 2 872
91 Kien Giang 65 557 35 396 30 162 6 189 2 940 3 249 2 984 1 172 1 811
92 Can Tho 22 556 11 889 10 667 3 644 1 667 1 978 2 206 997 1 209
93 Hau Giang 31 993 16 721 15 272 4 825 2 597 2 228 3 022 1 388 1 634
94 Soc Trang 57 190 30 033 27 157 8 571 4 986 3 585 4 908 2 737 2 171
95 Bac Lieu 41 326 21 740 19 586 6 069 2 922 3 147 4 476 1 947 2 529
96 Ca Mau 57 209 31 837 25 372 8 220 4 240 3 979 5 492 2 653 2 839

196
Table 9
POPULATION AGED 15 AND OVER BY LITERACY, SEX, URBAN/RURAL RESIDENCE, SOCIO-ECONOMIC REGION AND PROVINCE/CITY, 1/4/2015
Unit: Person
Population aged 15 and over Literate Illiterate Not stated
Cod
e
Administrative unit Total Male Female Total Male Female Total Male Female Total Male Female
ENTIRE COUNTRY 69 521 304 33 599 511 35 921 793 65 873 766 32 430 790 33 442 975 3 558 913 1 136 540 2 422 374 88 625 32 181 56 444
Socio-economic regions
R1 Northern Midlands and Mountains 8 579 369 4 187 630 4 391 739 7 702 420 3 919 063 3 783 356 864 184 263 262 600 922 12 766 5 305 7 461
R2 Red River Delta 15 979 381 7 652 520 8 326 861 15 670 803 7 582 592 8 088 211 294 363 64 837 229 526 14 214 5 091 9 123
R3 North and South Central Coast 14 938 613 7 229 060 7 709 553 14 202 772 7 000 569 7 202 203 714 129 220 238 493 891 21 712 8 253 13 459
R4 Central Highlands 3 976 416 1 977 290 1 999 126 3 590 125 1 839 352 1 750 772 382 774 136 551 246 224 3 517 1 387 2 130
R5 Southeast 12 529 157 5 958 846 6 570 311 12 163 879 5 836 171 6 327 709 342 204 115 050 227 154 23 073 7 625 15 448
R6 Mekong River Delta 13 518 367 6 594 164 6 924 203 12 543 766 6 253 043 6 290 723 961 258 336 602 624 656 13 343 4 519 8 824
Provinces/cities
01 Ha Noi 5 459 182 2 636 739 2 822 443 5 376 169 2 618 191 2 757 978 79 955 17 292 62 663 3 058 1 256 1 802
02 Ha Giang 532 119 265 386 266 733 396 884 219 482 177 402 133 510 45 011 88 499 1 726 893 832
04 Cao Bang 389 551 189 544 200 006 332 270 169 813 162 458 56 567 19 350 37 217 714 382 332
06 Bac Kan 238 964 119 417 119 547 223 964 114 371 109 593 14 524 4 804 9 720 476 242 234
08 Tuyen Quang 558 139 272 931 285 208 527 306 262 449 264 858 30 655 10 390 20 264 178 92 86
10 Lao Cai 477 125 239 283 237 843 397 244 210 907 186 336 79 796 28 333 51 463 86 42 43
11 Dien Bien 361 719 179 298 182 421 271 615 156 221 115 394 89 966 23 046 66 920 139 31 108
12 Lai Chau 269 314 132 747 136 568 159 134 95 817 63 318 109 993 36 830 73 163 187 100 87
14 Son La 807 901 397 393 410 509 627 292 350 614 276 678 180 343 46 635 133 709 266 144 122
15 Yen Bai 574 210 283 240 290 971 510 596 263 273 247 323 63 375 19 859 43 516 239 108 131
17 Hoa Binh 613 802 299 925 313 876 593 418 294 210 299 207 19 709 5 609 14 100 675 106 569
19 Thai Nguyen 911 165 440 828 470 337 895 238 436 172 459 066 14 920 4 293 10 626 1 007 363 645
20 Lang Son 582 112 287 555 294 558 561 397 281 108 280 289 19 470 5 850 13 621 1 245 597 648
22 Quang Ninh 917 001 457 455 459 546 887 042 447 877 439 165 29 448 9 432 20 016 512 146 366

197
Table 9 (Continued) Unit: Person
Population aged 15 and over Literate Illiterate Not stated
Cod
e
Administrative unit Total Male Female Total Male Female Total Male Female Total Male Female
24 Bac Giang 1 232 859 593 773 639 086 1 203 754 586 338 617 415 28 528 7 338 21 190 577 97 480
25 Phu Tho 1 030 388 486 310 544 078 1 002 307 478 288 524 019 22 828 5 914 16 915 5 252 2 109 3 144
26 Vinh Phuc 788 568 373 675 414 894 770 403 370 050 400 353 17 676 3 400 14 277 489 225 264
27 Bac Ninh 847 402 397 411 449 990 825 995 392 020 433 975 21 211 5 314 15 896 196 77 119
30 Hai Duong 1 405 255 673 898 731 357 1 377 609 668 483 709 126 24 972 4 484 20 488 2 673 931 1 743
31 Hai Phong 1 512 101 725 661 786 441 1 483 453 719 425 764 029 26 854 5 421 21 433 1 794 815 979
33 Hung Yen 889 854 422 629 467 225 870 287 417 592 452 695 17 394 4 507 12 887 2 172 530 1 643
34 Thai Binh 1 409 007 658 740 750 267 1 386 714 654 213 732 501 22 008 4 527 17 481 285 285
35 Ha Nam 615 706 293 884 321 822 602 817 291 252 311 565 10 874 2 030 8 844 2 015 602 1 413
36 Nam Dinh 1 417 101 668 010 749 091 1 388 694 662 895 725 799 27 970 4 823 23 146 438 292 146
37 Ninh Binh 718 202 344 418 373 784 701 620 340 595 361 025 16 001 3 606 12 395 582 217 365
38 Thanh Hoa 2 691 307 1 289 536 1 401 771 2 574 888 1 253 035 1 321 853 108 325 33 183 75 143 8 094 3 318 4 776
40 Nghe An 2 302 786 1 125 252 1 177 534 2 227 511 1 100 262 1 127 249 70 128 22 791 47 338 5 147 2 199 2 947
42 Ha Tinh 961 154 467 731 493 423 938 415 461 667 476 748 22 642 6 064 16 577 97 97
44 Quang Binh 648 458 314 098 334 360 629 318 308 423 320 895 18 519 5 419 13 100 621 256 366
45 Quang Tri 448 764 217 392 231 373 413 318 207 974 205 344 35 040 9 288 25 752 407 130 277
46 Thua Thien Hue 869 451 418 555 450 896 804 730 403 920 400 810 64 473 14 635 49 838 248 248
48 Da Nang 784 130 377 966 406 165 764 662 373 402 391 260 19 222 4 469 14 753 246 95 151
49 Quang Nam 1 133 181 533 317 599 864 1 072 627 516 893 555 734 59 029 15 918 43 111 1 525 506 1 019
51 Quang Ngai 971 488 467 725 503 764 909 256 451 175 458 081 61 436 16 306 45 130 797 243 553
52 Binh Dinh 1 158 475 553 115 605 360 1 112 177 539 037 573 141 44 902 13 573 31 329 1 396 506 890
54 Phu Yen 675 951 336 084 339 867 629 247 321 187 308 060 45 966 14 897 31 069 737 737
56 Khanh Hoa 935 867 457 007 478 860 886 177 440 916 445 261 48 492 15 727 32 766 1 198 364 834
58 Ninh Thuan 440 011 217 117 222 894 384 642 194 246 190 396 54 818 22 605 32 213 550 265 285
60 Binh Thuan 917 589 454 166 463 423 855 804 428 432 427 372 61 136 25 363 35 773 649 372 278

198
Table 9 (Continued) Unit: Person
Population aged 15 and over Literate Illiterate Not stated
Cod
e
Administrative unit Total Male Female Total Male Female Total Male Female Total Male Female
62 Kon Tum 331 227 164 384 166 843 290 926 151 065 139 860 40 023 13 262 26 760 278 56 222
64 Gia Lai 953 768 467 695 486 073 800 454 411 347 389 107 152 494 56 070 96 425 820 279 541
66 Dak Lak 1 356 049 679 279 676 770 1 259 279 645 204 614 075 95 909 33 716 62 193 861 359 502
67 Dak Nong 401 567 204 536 197 031 375 871 195 283 180 587 25 165 8 894 16 271 531 358 173
68 Lam Dong 933 805 461 397 472 408 863 595 436 452 427 143 69 183 24 608 44 575 1 027 336 691
70 Binh Phuoc 690 067 341 205 348 862 644 052 325 456 318 597 45 405 15 610 29 796 610 140 470
72 Tay Ninh 855 464 412 673 442 790 797 922 392 424 405 499 56 882 20 113 36 769 659 137 522
74 Binh Duong 1 517 091 719 643 797 449 1 473 769 705 273 768 495 40 225 13 302 26 923 3 098 1 067 2 031
75 Dong Nai 2 189 800 1 067 572 1 122 227 2 120 309 1 045 147 1 075 162 63 967 19 853 44 114 5 524 2 572 2 951
77 Ba Ria - Vung Tau 820 632 402 773 417 859 794 022 392 923 401 099 26 223 9 801 16 422 388 49 338
79 Ho Chi Minh City 6 456 103 3 014 980 3 441 123 6 333 805 2 974 948 3 358 857 109 503 36 373 73 130 12 795 3 659 9 136
80 Long An 1 154 653 558 273 596 380 1 098 187 540 261 557 926 55 500 17 457 38 044 966 555 410
82 Tien Giang 1 339 499 640 916 698 583 1 270 280 618 582 651 698 68 776 22 224 46 553 443 110 333
83 Ben Tre 998 228 480 732 517 496 943 255 464 150 479 106 54 053 16 414 37 639 919 169 751
84 Tra Vinh 789 228 379 764 409 463 696 436 349 920 346 516 92 722 29 775 62 948 70 70
86 Vinh Long 813 751 390 968 422 784 761 634 372 546 389 088 51 406 18 351 33 055 712 71 640
87 Dong Thap 1 314 455 648 299 666 156 1 227 767 615 318 612 449 83 749 31 948 51 801 2 939 1 033 1 906
89 An Giang 1 641 167 798 767 842 399 1 484 278 739 047 745 231 155 903 59 417 96 486 986 303 683
91 Kien Giang 1 302 169 643 184 658 985 1 187 379 601 904 585 475 113 611 41 050 72 561 1 179 230 949
92 Can Tho 964 486 469 730 494 756 907 588 448 071 459 517 55 933 21 330 34 603 965 329 636
93 Hau Giang 598 551 295 318 303 233 563 995 283 843 280 152 33 962 11 383 22 580 594 93 501
94 Soc Trang 1 004 798 494 499 510 298 887 252 455 623 431 629 115 354 37 973 77 380 2 192 903 1 289
95 Bac Lieu 678 804 334 972 343 832 638 163 319 720 318 443 39 954 14 957 24 998 686 295 392
96 Ca Mau 918 579 458 742 459 837 877 553 444 059 433 494 40 334 14 325 26 009 692 359 334

199
Table 9 (Continued) Unit: Person
Population aged 15 and over Literate Illiterate Not stated
Cod
e
Administrative unit Total Male Female Total Male Female Total Male Female Total Male Female
URBAN 23 991 940 11 387 040 12 604 900 23 385 734 11 198 114 12 187 620 578 228 179 152 399 077 27 977 9 775 18 203
Socio-economic regions
R1 Northern Midlands and Mountains 1 613 607 766 404 847 203 1 573 788 755 571 818 216 38 746 10 547 28 199 1 073 286 788
R2 Red River Delta 5 419 765 2 584 186 2 835 579 5 360 129 2 569 691 2 790 437 53 331 11 517 41 814 6 306 2 978 3 328
R3 North and South Central Coast 4 263 926 2 042 526 2 221 400 4 143 930 2 007 620 2 136 310 116 624 33 722 82 902 3 372 1 183 2 189
R4 Central Highlands 1 214 247 591 478 622 769 1 173 564 578 534 595 030 39 791 12 616 27 176 892 329 563
R5 Southeast 8 052 285 3 775 166 4 277 120 7 891 061 3 725 155 4 165 907 147 621 46 255 101 367 13 603 3 757 9 846
R6 Mekong River Delta 3 428 110 1 627 281 1 800 829 3 243 262 1 561 543 1 681 720 182 115 64 495 117 620 2 732 1 243 1 489
Provinces/cities
01 Ha Noi 2 630 918 1 257 972 1 372 946 2 610 664 1 252 895 1 357 768 17 921 3 821 14 100 2 333 1 256 1 077
02 Ha Giang 88 104 42 532 45 572 80 384 39 892 40 492 7 696 2 641 5 056 24 24
04 Cao Bang 92 138 42 793 49 344 88 778 41 600 47 178 3 266 1 122 2 144 94 71 23
06 Bac Kan 38 947 18 259 20 688 38 060 18 072 19 989 886 187 699
08 Tuyen Quang 78 292 36 910 41 382 77 435 36 745 40 690 857 165 692
10 Lao Cai 116 668 56 945 59 723 113 318 55 938 57 380 3 307 1 008 2 299 43 43
11 Dien Bien 60 560 28 945 31 615 57 884 28 389 29 495 2 660 556 2 104 16 16
12 Lai Chau 50 971 24 611 26 360 46 403 23 204 23 199 4 568 1 407 3 161
14 Son La 119 676 57 723 61 954 115 277 57 031 58 246 4 400 692 3 708
15 Yen Bai 124 038 59 323 64 715 121 477 58 730 62 747 2 532 593 1 939 30 30
17 Hoa Binh 91 575 43 507 48 068 90 727 43 264 47 463 849 244 605
19 Thai Nguyen 302 691 142 821 159 871 299 803 142 028 157 775 2 609 683 1 926 279 110 170
20 Lang Son 114 168 54 690 59 478 112 787 54 415 58 373 1 328 275 1 053 52 52
22 Quang Ninh 564 859 276 972 287 887 555 570 274 308 281 263 8 873 2 518 6 354 416 146 270
24 Bac Giang 140 252 65 839 74 413 138 266 65 228 73 037 1 986 610 1 376

200
Table 9 (Continued) Unit: Person
Population aged 15 and over Literate Illiterate Not stated
Cod
e
Administrative unit Total Male Female Total Male Female Total Male Female Total Male Female
25 Phu Tho 195 526 91 505 104 020 193 189 91 036 102 153 1 802 365 1 437 535 105 430
26 Vinh Phuc 184 760 85 459 99 300 181 680 84 733 96 946 2 810 573 2 237 270 153 117
27 Bac Ninh 238 724 112 501 126 223 234 026 111 133 122 892 4 650 1 368 3 282 48 48
30 Hai Duong 337 402 161 202 176 201 333 158 160 721 172 437 3 546 212 3 334 699 269 430
31 Hai Phong 704 289 334 050 370 238 695 237 332 002 363 235 7 423 1 233 6 189 1 629 815 814
33 Hung Yen 115 571 53 918 61 652 113 067 53 246 59 822 2 041 474 1 566 462 198 264
34 Thai Binh 144 966 67 992 76 974 144 402 67 714 76 688 564 278 286
35 Ha Nam 94 034 43 461 50 572 92 498 43 146 49 352 1 088 175 913 448 140 308
36 Nam Dinh 261 158 122 491 138 668 258 639 121 967 136 673 2 519 524 1 995
37 Ninh Binh 143 086 68 168 74 918 141 188 67 827 73 361 1 898 341 1 557
38 Thanh Hoa 415 504 198 126 217 379 408 165 195 648 212 517 5 875 1 827 4 048 1 465 650 814
40 Nghe An 351 602 167 366 184 235 348 378 166 248 182 130 3 223 1 118 2 106
42 Ha Tinh 166 316 77 146 89 170 163 513 76 400 87 112 2 803 745 2 058
44 Quang Binh 129 073 61 400 67 673 127 336 60 899 66 437 1 665 465 1 199 73 36 37
45 Quang Tri 132 860 64 156 68 704 128 273 63 191 65 082 4 519 920 3 599 68 45 22
46 Thua Thien Hue 429 462 206 995 222 466 413 211 203 655 209 556 16 141 3 340 12 801 110 110
48 Da Nang 687 017 331 257 355 760 671 542 327 347 344 195 15 324 3 910 11 414 151 151
49 Quang Nam 263 417 124 937 138 481 256 409 123 381 133 028 6 951 1 556 5 395 58 58
51 Quang Ngai 156 011 72 526 83 486 153 001 72 026 80 975 2 918 454 2 464 92 46 47
52 Binh Dinh 363 855 172 652 191 203 355 479 170 282 185 197 8 175 2 299 5 876 201 71 130
54 Phu Yen 198 689 97 231 101 458 194 273 96 128 98 145 4 217 1 103 3 114 199 199
56 Khanh Hoa 432 942 208 584 224 357 420 463 205 258 215 204 11 865 3 128 8 737 614 198 417
58 Ninh Thuan 163 136 79 202 83 934 150 547 74 177 76 370 12 430 4 978 7 452 159 47 112
60 Binh Thuan 374 042 180 950 193 092 353 341 172 980 180 361 20 518 7 879 12 639 183 91 92

201
Table 9 (Continued) Unit: Person
Population aged 15 and over Literate Illiterate Not stated
Cod
e
Administrative unit Total Male Female Total Male Female Total Male Female Total Male Female
62 Kon Tum 127 815 63 221 64 594 123 450 61 700 61 750 4 214 1 465 2 749 151 56 94
64 Gia Lai 302 893 146 563 156 329 288 686 142 098 146 588 14 020 4 370 9 651 186 96 91
66 Dak Lak 337 979 165 608 172 371 330 299 163 226 167 074 7 433 2 268 5 165 247 115 132
67 Dak Nong 63 858 31 287 32 570 62 248 30 690 31 558 1 550 579 971 59 18 42
68 Lam Dong 381 703 184 798 196 905 368 880 180 819 188 061 12 574 3 934 8 640 248 44 204
70 Binh Phuoc 151 687 73 697 77 991 146 953 72 239 74 714 4 412 1 372 3 040 323 85 237
72 Tay Ninh 183 534 86 926 96 608 176 978 85 137 91 840 6 454 1 789 4 665 102 102
74 Binh Duong 1 189 049 561 155 627 894 1 159 205 551 313 607 892 27 091 8 924 18 167 2 754 918 1 836
75 Dong Nai 762 334 365 072 397 262 743 691 359 152 384 540 17 946 5 558 12 388 697 362 335
77 Ba Ria - Vung Tau 420 244 203 281 216 963 407 699 198 459 209 240 12 350 4 773 7 577 195 49 146
79 Ho Chi Minh City 5 345 437 2 485 035 2 860 402 5 256 535 2 458 854 2 797 681 79 369 23 839 55 530 9 533 2 342 7 191
80 Long An 212 758 98 186 114 571 207 126 97 112 110 014 5 583 1 026 4 557 49 49
82 Tien Giang 216 146 98 222 117 925 208 965 95 843 113 122 7 182 2 379 4 803
83 Ben Tre 105 307 48 781 56 527 101 825 47 934 53 891 3 435 846 2 589 47 47
84 Tra Vinh 141 519 66 301 75 219 134 250 63 808 70 441 7 270 2 492 4 777
86 Vinh Long 141 269 65 874 75 395 134 802 63 927 70 874 6 387 1 947 4 440 81 81
87 Dong Thap 238 050 111 900 126 149 226 734 108 225 118 508 11 044 3 565 7 479 272 110 162
89 An Giang 510 687 241 608 269 079 472 359 226 947 245 412 37 923 14 500 23 424 405 161 244
91 Kien Giang 368 225 176 172 192 053 348 297 169 280 179 017 19 802 6 892 12 910 126 126
92 Can Tho 649 786 311 982 337 804 620 440 300 658 319 782 28 725 11 101 17 624 621 224 398
93 Hau Giang 146 312 72 055 74 258 138 483 69 323 69 160 7 799 2 732 5 067 31 31
94 Soc Trang 306 840 146 661 160 179 277 058 135 927 141 130 28 938 10 193 18 745 844 540 304
95 Bac Lieu 183 927 88 481 95 446 173 928 84 715 89 213 9 827 3 650 6 178 172 117 54
96 Ca Mau 207 282 101 058 106 224 198 997 97 842 101 155 8 200 3 174 5 027 84 42 42

202
Table 9 (Continued) Unit: Person
Population aged 15 and over Literate Illiterate Not stated
Cod
e
Administrative unit Total Male Female Total Male Female Total Male Female Total Male Female
RURAL 45 529 364 22 212 471 23 316 893 42 488 031 21 232 676 21 255 355 2 980 685 957 388 2 023 297 60 647 22 406 38 241
Socio-economic regions
R1 Northern Midlands and Mountains 6 965 763 3 421 226 3 544 536 6 128 632 3 163 492 2 965 140 825 438 252 715 572 723 11 693 5 019 6 673
R2 Red River Delta 10 559 616 5 068 334 5 491 282 10 310 675 5 012 901 5 297 774 241 032 53 320 187 712 7 909 2 113 5 796
R3 North and South Central Coast 10 674 687 5 186 534 5 488 153 10 058 842 4 992 949 5 065 893 597 505 186 515 410 990 18 340 7 070 11 270
R4 Central Highlands 2 762 169 1 385 812 1 376 357 2 416 561 1 260 819 1 155 742 342 983 123 935 219 048 2 625 1 059 1 567
R5 Southeast 4 476 871 2 183 680 2 293 191 4 272 818 2 111 016 2 161 802 194 583 68 796 125 787 9 470 3 869 5 602
R6 Mekong River Delta 10 090 257 4 966 883 5 123 374 9 300 504 4 691 500 4 609 003 779 143 272 107 507 036 10 611 3 276 7 334
Provinces/cities
01 Ha Noi 2 828 264 1 378 767 1 449 497 2 765 505 1 365 295 1 400 210 62 035 13 472 48 563 725 725
02 Ha Giang 444 015 222 854 221 161 316 500 179 591 136 909 125 814 42 370 83 443 1 702 893 808
04 Cao Bang 297 413 146 751 150 662 243 493 128 212 115 280 53 301 18 228 35 073 620 311 309
06 Bac Kan 200 017 101 158 98 859 185 904 96 299 89 604 13 637 4 617 9 021 476 242 234
08 Tuyen Quang 479 846 236 021 243 825 449 871 225 704 224 167 29 798 10 225 19 572 178 92 86
10 Lao Cai 360 457 182 337 178 120 283 925 154 969 128 956 76 489 27 326 49 164 42 42
11 Dien Bien 301 159 150 353 150 806 213 731 127 832 85 899 87 306 22 490 64 816 122 31 92
12 Lai Chau 218 343 108 135 110 208 112 731 72 612 40 119 105 424 35 423 70 002 187 100 87
14 Son La 688 225 339 670 348 555 512 016 293 584 218 432 175 944 45 942 130 001 266 144 122
15 Yen Bai 450 172 223 916 226 255 389 119 204 543 184 577 60 843 19 266 41 577 209 108 101
17 Hoa Binh 522 226 256 418 265 808 502 691 250 947 251 744 18 860 5 365 13 495 675 106 569
19 Thai Nguyen 608 474 298 007 310 467 595 435 294 143 301 291 12 311 3 611 8 700 728 253 475
20 Lang Son 467 945 232 865 235 080 448 610 226 693 221 917 18 142 5 575 12 567 1 193 597 596
22 Quang Ninh 352 142 180 483 171 659 331 472 173 569 157 903 20 575 6 914 13 661 96 96
24 Bac Giang 1 092 607 527 935 564 672 1 065 488 521 110 544 378 26 542 6 728 19 814 577 97 480

203
Table 9 (Continued) Unit: Person
Population aged 15 and over Literate Illiterate Not stated
Cod
e
Administrative unit Total Male Female Total Male Female Total Male Female Total Male Female
25 Phu Tho 834 862 394 805 440 057 809 118 387 252 421 866 21 026 5 549 15 478 4 718 2 004 2 714
26 Vinh Phuc 603 809 288 215 315 593 588 723 285 317 303 407 14 866 2 827 12 040 219 72 147
27 Bac Ninh 608 678 284 911 323 767 591 969 280 887 311 082 16 561 3 947 12 614 148 77 71
30 Hai Duong 1 067 853 512 697 555 156 1 044 451 507 763 536 689 21 427 4 272 17 155 1 975 662 1 313
31 Hai Phong 807 813 391 611 416 202 788 216 387 423 400 793 19 431 4 188 15 243 165 165
33 Hung Yen 774 283 368 710 405 573 757 220 364 346 392 873 15 354 4 033 11 321 1 710 331 1 379
34 Thai Binh 1 264 041 590 748 673 293 1 242 312 586 499 655 813 21 444 4 249 17 195 285 285
35 Ha Nam 521 673 250 423 271 250 510 319 248 106 262 213 9 786 1 855 7 931 1 568 462 1 105
36 Nam Dinh 1 155 943 545 519 610 424 1 130 055 540 928 589 126 25 451 4 300 21 151 438 292 146
37 Ninh Binh 575 117 276 250 298 867 560 432 272 768 287 664 14 103 3 265 10 838 582 217 365
38 Thanh Hoa 2 275 803 1 091 411 1 184 393 2 166 723 1 057 387 1 109 336 102 451 31 356 71 095 6 629 2 668 3 961
40 Nghe An 1 951 185 957 886 993 299 1 879 133 934 014 945 119 66 905 21 673 45 232 5 147 2 199 2 947
42 Ha Tinh 794 838 390 586 404 252 774 902 385 267 389 635 19 838 5 319 14 520 97 97
44 Quang Binh 519 385 252 698 266 687 501 982 247 524 254 458 16 854 4 954 11 900 548 220 328
45 Quang Tri 315 905 153 235 162 669 285 044 144 783 140 261 30 521 8 368 22 153 339 85 255
46 Thua Thien Hue 439 989 211 559 228 430 391 519 200 265 191 254 48 332 11 294 37 037 139 139
48 Da Nang 97 114 46 709 50 404 93 120 46 055 47 065 3 898 559 3 339 95 95
49 Quang Nam 869 764 408 381 461 383 816 218 393 512 422 706 52 078 14 363 37 715 1 468 506 962
51 Quang Ngai 815 477 395 199 420 278 756 255 379 149 377 106 58 518 15 852 42 666 704 198 506
52 Binh Dinh 794 620 380 463 414 157 756 698 368 755 387 944 36 727 11 274 25 453 1 195 435 760
54 Phu Yen 477 261 238 853 238 408 434 974 225 059 209 915 41 750 13 795 27 955 538 538
56 Khanh Hoa 502 925 248 422 254 503 465 714 235 658 230 057 36 627 12 599 24 029 583 166 417
58 Ninh Thuan 276 875 137 915 138 960 234 096 120 069 114 026 42 388 17 627 24 760 392 218 173
60 Binh Thuan 543 547 273 216 270 331 502 463 255 452 247 011 40 618 17 484 23 134 466 281 186

204
Table 9 (Continued) Unit: Person
Population aged 15 and over Literate Illiterate Not stated
Cod
e
Administrative unit Total Male Female Total Male Female Total Male Female Total Male Female
62 Kon Tum 203 412 101 163 102 249 167 476 89 365 78 111 35 809 11 798 24 011 128 128
64 Gia Lai 650 876 321 132 329 744 511 768 269 249 242 519 138 474 51 700 86 774 634 183 451
66 Dak Lak 1 018 070 513 671 504 399 928 980 481 979 447 001 88 476 31 449 57 028 614 244 370
67 Dak Nong 337 709 173 248 164 461 313 622 164 593 149 029 23 615 8 315 15 300 472 340 132
68 Lam Dong 552 102 276 599 275 503 494 715 255 633 239 082 56 609 20 674 35 935 778 292 486
70 Binh Phuoc 538 380 267 509 270 871 497 099 253 216 243 883 40 994 14 238 26 756 287 55 232
72 Tay Ninh 671 930 325 747 346 183 620 945 307 286 313 659 50 428 18 324 32 104 557 137 420
74 Binh Duong 328 042 158 487 169 555 314 564 153 960 160 604 13 134 4 378 8 756 344 149 195
75 Dong Nai 1 427 465 702 500 724 965 1 376 618 685 995 690 622 46 020 14 294 31 726 4 827 2 211 2 617
77 Ba Ria - Vung Tau 400 389 199 492 200 896 386 323 194 464 191 859 13 873 5 028 8 845 193 193
79 Ho Chi Minh City 1 110 665 529 945 580 721 1 077 269 516 094 561 175 30 134 12 534 17 600 3 262 1 317 1 945
80 Long An 941 895 460 086 481 809 891 060 443 149 447 912 49 917 16 431 33 487 917 507 410
82 Tien Giang 1 123 353 542 694 580 658 1 061 315 522 739 538 576 61 594 19 845 41 750 443 110 333
83 Ben Tre 892 920 431 951 460 969 841 430 416 215 425 215 50 618 15 567 35 051 872 169 703
84 Tra Vinh 647 708 313 464 334 245 562 186 286 112 276 074 85 452 27 282 58 170 70 70
86 Vinh Long 672 482 325 094 347 388 626 832 308 618 318 214 45 019 16 405 28 615 631 71 559
87 Dong Thap 1 076 406 536 398 540 007 1 001 033 507 093 493 940 72 706 28 383 44 323 2 667 923 1 744
89 An Giang 1 130 480 557 159 573 321 1 011 919 512 100 499 819 117 980 44 917 73 062 581 142 439
91 Kien Giang 933 944 467 012 466 932 839 082 432 624 406 458 93 809 34 158 59 651 1 053 230 823
92 Can Tho 314 699 157 748 156 951 287 148 147 413 139 735 27 208 10 229 16 978 343 105 238
93 Hau Giang 452 239 223 263 228 976 425 512 214 519 210 992 26 164 8 651 17 513 564 93 471
94 Soc Trang 697 958 347 838 350 119 610 194 319 695 290 499 86 416 27 780 58 636 1 348 363 985
95 Bac Lieu 494 877 246 490 248 386 464 235 235 006 229 229 30 127 11 307 18 820 515 177 337
96 Ca Mau 711 297 357 684 353 612 678 555 346 217 332 339 32 133 11 151 20 982 608 317 291

205
Table 10
CURRENTLY MARRIED WOMEN AGED 15-49 BY THE USED STATUS OF CONTRACEPTIVE METHOD, URBAN/RURAL RESIDENCE, SOCIO-ECONOMIC REGION AND PROVINCE/CITY, 1/4/2015
Unit: Person
Divided by status contraceptive users
Currently using contraception Code Administrative unit
Total currently married
women aged 15-49
Not use of contraception Total
Modern methods
Others Not stated
Not stated whether to use contraception
or not
ENTIRE COUNTRY 16 528 281 4 015 379 12 498 368 10 730 340 1 765 773 2 256 14 533
Socio-economic regions R1 Northern Midlands and Mountains 2 351 877 557 102 1 790 973 1 542 771 247 699 503 3 802 R2 Red River Delta 3 693 331 857 012 2 828 450 2 444 813 382 945 693 7 869 R3 North and South Central Coast 3 377 238 806 406 2 567 970 2 217 396 349 514 1 060 2 862 R4 Central Highlands 1 017 227 242 567 774 660 623 715 150 946 R5 Southeast 2 888 886 837 168 2 051 717 1 763 867 287 850 R6 Mekong River Delta 3 199 722 715 124 2 484 598 2 137 779 346 819
Provinces/cities 01 Ha Noi 1 269 117 303 115 961 867 865 940 95 566 362 4 135 02 Ha Giang 160 492 43 213 117 159 113 043 4 116 120 04 Cao Bang 104 973 20 344 84 513 81 314 3 176 23 116 06 Bac Kan 63 974 10 855 52 599 50 131 2 448 20 520 08 Tuyen Quang 151 983 35 720 116 135 97 770 18 364 129 10 Lao Cai 137 489 32 252 105 187 96 095 9 092 50 11 Dien Bien 107 953 27 553 80 368 73 014 7 354 31 12 Lai Chau 86 794 22 764 63 971 61 278 2 693 59 14 Son La 253 231 60 711 192 452 175 455 16 997 68 15 Yen Bai 159 413 37 671 121 523 101 242 20 281 220 17 Hoa Binh 168 239 27 703 140 395 119 410 20 938 47 141 19 Thai Nguyen 222 957 50 401 172 190 134 772 37 340 78 366 20 Lang Son 153 257 37 660 115 251 106 348 8 904 346 22 Quang Ninh 226 771 44 532 180 874 148 251 32 530 94 1 364

206
Table 10 (Continued) Unit: Person
Divided by status contraceptive users
Currently using contraception Code Administrative unit
Total currently married
women aged 15-49
Not use of contraception Total
Modern methods
Others Not stated
Not stated whether to use contraception
or not
24 Bac Giang 325 194 79 426 244 551 196 058 48 302 191 1 217 25 Phu Tho 255 927 70 829 184 680 136 842 47 694 143 419 26 Vinh Phuc 200 503 46 731 153 700 139 952 13 747 73 27 Bac Ninh 219 817 58 358 161 383 119 191 42 192 76 30 Hai Duong 308 197 76 454 230 761 208 332 22 192 237 981 31 Hai Phong 342 299 77 041 265 004 218 533 46 472 253 33 Hung Yen 209 649 51 652 157 750 133 394 24 356 247 34 Thai Binh 297 083 62 128 234 746 204 984 29 762 209 35 Ha Nam 134 368 28 785 105 473 97 765 7 708 109 36 Nam Dinh 321 261 67 594 253 281 209 536 43 745 386 37 Ninh Binh 164 267 40 621 123 610 98 936 24 674 36 38 Thanh Hoa 644 054 130 636 510 556 433 649 75 906 1 001 2 862 40 Nghe An 528 729 140 941 387 788 355 661 32 128 42 Ha Tinh 205 218 67 556 137 662 126 484 11 178 44 Quang Binh 142 488 34 307 108 181 93 648 14 532 45 Quang Tri 102 696 23 944 78 752 63 211 15 542 46 Thua Thien Hue 177 636 46 000 131 636 109 134 22 502 48 Da Nang 177 907 53 003 124 904 100 756 24 148 49 Quang Nam 242 980 62 531 180 449 160 024 20 426 51 Quang Ngai 208 586 44 621 163 965 148 922 15 043 52 Binh Dinh 263 222 55 639 207 583 172 950 34 634 54 Phu Yen 165 010 33 722 131 288 105 753 25 477 59 56 Khanh Hoa 201 757 48 275 153 482 125 766 27 716 58 Ninh Thuan 104 028 25 243 78 785 67 474 11 312 60 Binh Thuan 212 925 39 987 172 938 153 966 18 972

207
Table 10 (Continued) Unit: Person
Divided by status contraceptive users
Currently using contraception Code Administrative unit
Total currently married
women aged 15-49
Not use of contraception Total
Modern methods
Others Not stated
Not stated whether to use contraception
or not
62 Kon Tum 86 021 24 710 61 310 54 121 7 189
64 Gia Lai 261 211 67 469 193 741 157 132 36 610
66 Dak Lak 335 186 77 283 257 903 200 837 57 065
67 Dak Nong 111 322 25 672 85 650 68 688 16 962
68 Lam Dong 223 488 47 432 176 056 142 937 33 119
70 Binh Phuoc 173 988 38 663 135 325 119 157 16 167
72 Tay Ninh 199 385 47 588 151 797 136 275 15 522
74 Binh Duong 418 401 106 223 312 178 259 672 52 506
75 Dong Nai 515 292 150 634 364 658 281 041 83 617
77 Ba Ria - Vung Tau 190 404 45 563 144 841 126 664 18 177
79 Ho Chi Minh City 1 391 416 448 496 942 920 841 058 101 862
80 Long An 278 122 60 420 217 702 198 882 18 820
82 Tien Giang 319 549 58 119 261 430 209 240 52 190
83 Ben Tre 228 327 50 483 177 845 138 257 39 588
84 Tra Vinh 190 552 46 432 144 119 106 919 37 201
86 Vinh Long 188 421 43 519 144 902 120 367 24 534
87 Dong Thap 311 689 65 077 246 612 225 866 20 746
89 An Giang 386 972 79 120 307 851 278 243 29 608
91 Kien Giang 323 656 82 441 241 215 203 334 37 881
92 Can Tho 223 249 57 672 165 577 138 059 27 518
93 Hau Giang 137 146 25 964 111 183 99 253 11 929
94 Soc Trang 227 700 52 340 175 360 160 576 14 784
95 Bac Lieu 154 411 35 030 119 380 109 653 9 727
96 Ca Mau 229 930 58 508 171 422 149 129 22 293

208
Table 10 (Continued) Unit: Person
Divided by status contraceptive users
Currently using contraception Code Administrative unit
Total currently married
women aged 15-49
Not use of contraception Total
Modern methods
Others Not stated
Not stated whether to use contraception
or not
URBAN 5 453 063 1 449 484 3 998 197 3 407 139 590 369 689 5 382
Socio-economic regions R1 Northern Midlands and Mountains 402 708 105 465 296 620 244 446 52 054 121 622
R2 Red River Delta 1 232 771 295 186 933 303 797 521 135 545 237 4 282 R3 North and South Central Coast 952 172 236 911 714 783 609 142 105 309 331 478
R4 Central Highlands 296 319 64 652 231 667 180 265 51 402 R5 Southeast 1 795 720 557 028 1 238 692 1 081 293 157 399
R6 Mekong River Delta 773 374 190 241 583 132 494 472 88 661
Provinces/cities
01 Ha Noi 584 485 139 426 442 373 394 287 48 086 2 686
02 Ha Giang 24 452 7 247 17 205 15 360 1 845 04 Cao Bang 23 799 6 160 17 614 16 015 1 577 23 24
06 Bac Kan 10 132 1 934 8 151 7 678 473 47 08 Tuyen Quang 18 134 5 674 12 438 10 566 1 872 21
10 Lao Cai 31 131 7 457 23 625 18 343 5 282 50 11 Dien Bien 16 381 3 560 12 822 11 280 1 542
12 Lai Chau 15 766 3 870 11 896 9 664 2 232 14 Son La 32 464 8 117 24 347 21 493 2 854
15 Yen Bai 30 942 7 063 23 761 18 620 5 141 118 17 Hoa Binh 22 198 4 392 17 666 14 272 3 348 47 141
19 Thai Nguyen 69 555 18 667 50 771 38 165 12 606 117 20 Lang Son 28 666 7 942 20 724 18 131 2 593
22 Quang Ninh 138 798 29 501 108 520 90 687 17 833 777 24 Bac Giang 34 912 9 598 25 261 20 020 5 241 52

209
Table 10 (Continued) Unit: Person
Divided by status contraceptive users
Currently using contraception Code Administrative unit
Total currently married
women aged 15-49
Not use of contraception Total
Modern methods
Others Not stated
Not stated whether to use contraception
or not
25 Phu Tho 44 175 13 784 30 339 24 840 5 448 51 52
26 Vinh Phuc 46 508 11 149 35 358 32 513 2 845
27 Bac Ninh 62 451 16 181 46 270 32 417 13 853
30 Hai Duong 70 530 17 251 52 954 46 840 5 877 237 325
31 Hai Phong 156 894 40 933 115 708 92 222 23 486 253
33 Hung Yen 27 841 7 275 20 567 17 056 3 511
34 Thai Binh 30 927 6 244 24 613 18 406 6 207 70
35 Ha Nam 20 923 5 202 15 664 14 734 930 57
36 Nam Dinh 59 231 13 083 46 071 38 179 7 892 77
37 Ninh Binh 34 183 8 941 25 206 20 180 5 026 36
38 Thanh Hoa 104 386 24 717 79 191 62 691 16 169 331 478
40 Nghe An 77 445 17 868 59 577 54 054 5 523
42 Ha Tinh 37 207 11 257 25 950 23 617 2 333
44 Quang Binh 29 811 6 667 23 144 19 239 3 905
45 Quang Tri 32 201 7 061 25 140 19 552 5 588
46 Thua Thien Hue 86 895 22 538 64 357 56 295 8 061
48 Da Nang 155 778 47 813 107 965 86 823 21 142
49 Quang Nam 56 545 15 167 41 378 37 768 3 609
51 Quang Ngai 35 886 7 806 28 080 25 062 3 018
52 Binh Dinh 83 248 20 011 63 236 54 434 8 803
54 Phu Yen 46 305 9 574 36 731 32 321 4 410
56 Khanh Hoa 88 947 21 898 67 049 55 953 11 096
58 Ninh Thuan 37 647 8 676 28 971 24 045 4 926
60 Binh Thuan 79 871 15 858 64 013 57 286 6 727

210
Table 10 (Continued) Unit: Person
Divided by status contraceptive users
Currently using contraception Code Administrative unit
Total currently married
women aged 15-49
Not use of contraception Total
Modern methods
Others Not stated
Not stated whether to use contraception
or not
62 Kon Tum 32 798 7 046 25 752 22 105 3 646
64 Gia Lai 78 795 16 555 62 241 50 486 11 755
66 Dak Lak 83 002 17 304 65 698 44 715 20 982
67 Dak Nong 17 784 4 235 13 549 10 717 2 832
68 Lam Dong 83 940 19 512 64 428 52 242 12 186
70 Binh Phuoc 36 829 9 143 27 686 23 228 4 458
72 Tay Ninh 39 056 10 395 28 661 25 126 3 535
74 Binh Duong 329 866 85 900 243 965 202 115 41 851
75 Dong Nai 179 999 54 605 125 394 102 902 22 492
77 Ba Ria - Vung Tau 99 398 25 057 74 341 65 672 8 670
79 Ho Chi Minh City 1 110 573 371 927 738 645 662 251 76 394
80 Long An 46 649 9 868 36 781 33 607 3 174
82 Tien Giang 48 174 9 537 38 636 30 700 7 937
83 Ben Tre 21 527 5 458 16 069 12 577 3 492
84 Tra Vinh 32 947 10 297 22 651 16 141 6 509
86 Vinh Long 30 038 8 885 21 152 17 154 3 998
87 Dong Thap 53 505 13 674 39 831 35 932 3 899
89 An Giang 111 824 23 556 88 268 76 810 11 458
91 Kien Giang 87 285 23 796 63 489 51 675 11 814
92 Can Tho 147 647 38 120 109 527 89 407 20 120
93 Hau Giang 34 565 6 273 28 292 24 952 3 341
94 Soc Trang 69 507 18 293 51 214 46 735 4 479
95 Bac Lieu 37 937 9 515 28 422 26 490 1 932
96 Ca Mau 51 769 12 969 38 799 32 292 6 507

211
Table 10 (Continued) Unit: Person
Divided by status contraceptive users
Currently using contraception Code Administrative unit
Total currently married
women aged 15-49
Not use of contraception Total
Modern methods
Others Not stated
Not stated whether to use contraception
or not
RURAL 11 075 217 2 565 895 8 500 171 7 323 201 1 175 403 1 567 9 151
Socio-economic regions R1 Northern Midlands and Mountains 1 949 169 451 637 1 494 353 1 298 325 195 645 382 3 180
R2 Red River Delta 2 460 560 561 826 1 895 148 1 647 292 247 400 456 3 586
R3 North and South Central Coast 2 425 066 569 495 1 853 187 1 608 254 244 204 729 2 384
R4 Central Highlands 720 908 177 914 542 993 443 449 99 544
R5 Southeast 1 093 166 280 140 813 025 682 574 130 451
R6 Mekong River Delta 2 426 348 524 883 1 901 465 1 643 307 258 158
Provinces/cities 01 Ha Noi 684 632 163 689 519 495 471 653 47 480 362 1 448
02 Ha Giang 136 040 35 966 99 954 97 683 2 271 120
04 Cao Bang 81 174 14 184 66 898 65 299 1 599 91
06 Bac Kan 53 842 8 921 44 447 42 453 1 974 20 473
08 Tuyen Quang 133 850 30 046 103 696 87 204 16 492 108
10 Lao Cai 106 359 24 796 81 563 77 752 3 811 11 Dien Bien 91 571 23 993 67 546 61 734 5 812 31
12 Lai Chau 71 028 18 894 52 075 51 614 461 59
14 Son La 220 767 52 594 168 105 153 962 14 143 68
15 Yen Bai 128 472 30 608 97 762 82 622 15 140 102
17 Hoa Binh 146 040 23 311 122 729 105 138 17 591
19 Thai Nguyen 153 402 31 734 121 419 96 606 24 734 78 249
20 Lang Son 124 591 29 717 94 527 88 217 6 311 346
22 Quang Ninh 87 973 15 032 72 354 57 563 14 697 94 587
24 Bac Giang 290 282 69 828 219 290 176 038 43 060 191 1 165

212
Table 10 (Continued) Unit: Person
Divided by status contraceptive users
Currently using contraception Code Administrative unit
Total currently married
women aged 15-49
Not use of contraception Total
Modern methods
Others Not stated
Not stated whether to use contraception
or not
25 Phu Tho 211 752 57 044 154 340 112 002 42 246 93 367
26 Vinh Phuc 153 995 35 581 118 341 107 439 10 902 73
27 Bac Ninh 157 366 42 177 115 113 86 774 28 339 76
30 Hai Duong 237 667 59 203 177 807 161 492 16 315 656
31 Hai Phong 185 404 36 108 149 296 126 311 22 986
33 Hung Yen 181 808 44 377 137 184 116 338 20 845 247
34 Thai Binh 266 156 55 884 210 133 186 578 23 555 139
35 Ha Nam 113 445 23 584 89 809 83 031 6 778 52
36 Nam Dinh 262 030 54 511 207 210 171 357 35 853 309
37 Ninh Binh 130 085 31 680 98 405 78 756 19 649
38 Thanh Hoa 539 669 105 920 431 365 370 958 59 737 670 2 384
40 Nghe An 451 284 123 073 328 211 301 607 26 604
42 Ha Tinh 168 011 56 300 111 711 102 866 8 845
44 Quang Binh 112 677 27 640 85 037 74 410 10 627
45 Quang Tri 70 495 16 883 53 612 43 658 9 954
46 Thua Thien Hue 90 741 23 462 67 279 52 839 14 441
48 Da Nang 22 129 5 190 16 939 13 933 3 006
49 Quang Nam 186 436 47 364 139 071 122 255 16 816
51 Quang Ngai 172 700 36 815 135 885 123 859 12 025
52 Binh Dinh 179 974 35 628 144 347 118 516 25 831
54 Phu Yen 118 706 24 149 94 557 73 431 21 067 59
56 Khanh Hoa 112 810 26 377 86 433 69 813 16 620
58 Ninh Thuan 66 381 16 567 49 814 43 428 6 386
60 Binh Thuan 133 054 24 129 108 925 96 680 12 245

213
Table 10 (Continued) Unit: Person
Divided by status contraceptive users
Currently using contraception Code Administrative unit
Total currently married
women aged 15-49
Not use of contraception Total
Modern methods
Others Not stated
Not stated whether to use contraception
or not
62 Kon Tum 53 222 17 664 35 558 32 015 3 543
64 Gia Lai 182 415 50 915 131 501 106 646 24 855
66 Dak Lak 252 184 59 979 192 205 156 122 36 083
67 Dak Nong 93 538 21 437 72 101 57 971 14 130
68 Lam Dong 139 548 27 920 111 628 90 695 20 933
70 Binh Phuoc 137 159 29 520 107 639 95 930 11 709
72 Tay Ninh 160 329 37 193 123 136 111 149 11 987
74 Binh Duong 88 535 20 323 68 212 57 557 10 655
75 Dong Nai 335 293 96 029 239 264 178 139 61 125
77 Ba Ria - Vung Tau 91 006 20 507 70 499 60 992 9 507
79 Ho Chi Minh City 280 843 76 569 204 274 178 807 25 467
80 Long An 231 473 50 552 180 921 165 275 15 646
82 Tien Giang 271 375 48 582 222 793 178 540 44 253
83 Ben Tre 206 800 45 025 161 776 125 680 36 095
84 Tra Vinh 157 604 36 136 121 469 90 778 30 691
86 Vinh Long 158 383 34 633 123 750 103 214 20 536
87 Dong Thap 258 184 51 403 206 780 189 933 16 847
89 An Giang 275 148 55 564 219 583 201 433 18 150
91 Kien Giang 236 371 58 645 177 726 151 659 26 067
92 Can Tho 75 602 19 551 56 051 48 652 7 398
93 Hau Giang 102 581 19 691 82 890 74 302 8 589
94 Soc Trang 158 192 34 047 124 146 113 841 10 305
95 Bac Lieu 116 474 25 516 90 958 83 164 7 795
96 Ca Mau 178 161 45 538 132 623 116 837 15 785

214
Table 11 CURRENTLY MARRIED WOMEN AGED 15-49 BY THE USED STATUS OF CONTRACEPTIVE METHOD,
AGE GROUP, URBAN/RURAL RESIDENCE AND SOCIO-ECONOMIC REGION, 1/4/2015 Unit: Person
Divided by status contraceptive users
Currently using contraception Administrative unit
Total currently married
women aged 15-49
Not use of contraception Total
Modern methods
Others Not stated
Not stated whether to use contraception
or not
ENTIRE COUNTRY 16 528 281 4 015 379 12 498 368 10 730 340 1 765 773 2 256 14 533 15-19 285 347 179 527 104 398 89 472 14 926 1 423 20-24 1 587 893 725 472 858 575 728 131 130 444 3 846 25-29 2 843 000 891 822 1 947 990 1 686 420 261 227 343 3 188 30-34 3 307 880 683 347 2 623 733 2 295 352 327 685 696 801 35-39 3 058 971 424 807 2 632 976 2 284 738 347 766 472 1 188 40-44 2 919 216 409 065 2 508 462 2 125 813 382 299 350 1 689 45-49 2 525 973 701 339 1 822 235 1 520 414 301 426 395 2 399
URBAN 5 453 063 1 449 484 3 998 197 3 407 139 590 369 689 5 382 15-19 45 097 26 382 18 567 16 282 2 285 148 20-24 394 833 185 638 207 709 175 883 31 826 1 486 25-29 926 370 324 327 600 737 517 482 83 008 248 1 306 30-34 1 176 983 284 927 891 346 776 933 114 413 710 35-39 1 058 304 184 242 873 539 751 190 122 028 321 523 40-44 993 519 169 392 823 752 692 737 130 968 47 374 45-49 857 957 274 576 582 546 476 632 105 841 73 835
RURAL 11 075 217 2 565 895 8 500 171 7 323 201 1 175 403 1 567 9 151 15-19 240 250 153 144 85 831 73 190 12 641 1 275 20-24 1 193 060 539 834 650 866 552 248 98 618 2 360 25-29 1 916 630 567 495 1 347 252 1 168 938 178 219 95 1 883 30-34 2 130 897 398 420 1 732 387 1 518 419 213 272 696 91 35-39 2 000 667 240 565 1 759 437 1 533 548 225 737 151 665 40-44 1 925 697 239 673 1 684 710 1 433 076 251 331 302 1 314 45-49 1 668 016 426 764 1 239 689 1 043 782 195 585 322 1 563

215
Table 11 (Continued) Unit: Person
Divided by status contraceptive users
Currently using contraception Administrative unit
Total currently married
women aged 15-49
Not use of contraception Total
Modern methods Others Not stated
Not stated whether to use contraception
or not
R1. Northern Midlands and Mountains 2 351 877 557 102 1 790 973 1 542 771 247 699 503 3 802 15-19 84 053 57 010 26 534 23 494 3 039 510 20-24 321 408 136 428 183 863 156 065 27 799 1 117 25-29 436 748 116 196 319 925 279 110 40 720 95 627 30-34 449 522 76 614 372 715 326 262 46 433 20 192 35-39 391 725 44 602 346 822 301 531 45 198 93 300 40-44 360 019 42 376 317 284 266 739 50 419 126 359 45-49 308 403 83 876 223 830 189 569 34 091 169 698
R2. Red River Delta 3 693 331 857 012 2 828 450 2 444 813 382 945 693 7 869 15-19 38 442 24 996 12 756 10 829 1 927 689 20-24 333 526 169 439 161 722 132 986 28 736 2 365 25-29 670 145 212 738 455 056 387 522 67 451 82 2 351 30-34 758 045 135 475 621 961 547 504 74 002 456 609 35-39 666 285 80 019 586 127 512 404 73 568 155 139 40-44 677 932 81 514 595 756 512 557 83 199 663 45-49 548 956 152 830 395 072 341 011 54 061 1 054
R3. North and South Central Coast 3 377 238 806 406 2 567 970 2 217 396 349 514 1 060 2 862 15-19 49 931 32 238 17 469 14 452 3 017 224 20-24 321 978 149 415 172 199 145 155 27 044 365 25-29 545 377 182 218 362 950 313 710 49 074 166 210 30-34 622 430 136 636 485 794 425 076 60 498 220 35-39 626 046 86 538 538 760 470 397 68 138 224 749 40-44 645 764 82 336 562 760 480 585 81 951 224 667 45-49 565 712 137 027 428 037 368 020 59 791 226 648

216
Table 11 (Continued) Unit: Person
Divided by status contraceptive users
Currently using contraception Administrative unit
Total currently married
women aged 15-49
Not use of contraception Total
Modern methods Others Not stated
Not stated whether to use contraception
or not
R4. Central Highlands 1 017 227 242 567 774 660 623 715 150 946 15-19 26 120 16 189 9 931 8 584 1 347 20-24 110 982 47 449 63 533 51 356 12 177 25-29 168 626 52 099 116 527 95 565 20 962 30-34 204 682 38 993 165 689 136 045 29 644 35-39 194 470 23 866 170 604 139 937 30 668 40-44 165 440 25 202 140 238 111 169 29 070 45-49 146 907 38 769 108 138 81 059 27 079
R5. Southeast 2 888 886 837 168 2 051 717 1 763 867 287 850 15-19 32 979 14 701 18 278 14 995 3 283 20-24 221 971 106 081 115 890 98 956 16 934 25-29 507 346 180 592 326 754 284 078 42 676 30-34 658 530 182 391 476 138 415 751 60 387 35-39 556 674 109 847 446 827 389 242 57 585 40-44 488 580 100 636 387 944 329 136 58 808 45-49 422 807 142 921 279 886 231 708 48 178
R6. Mekong River Delta 3 199 722 715 124 2 484 598 2 137 779 346 819 15-19 53 823 34 393 19 430 17 117 2 313 20-24 278 028 116 660 161 368 143 614 17 754 25-29 514 758 147 979 366 779 326 435 40 344 30-34 614 671 113 237 501 434 444 713 56 721 35-39 623 771 79 936 543 835 471 226 72 608 40-44 581 481 77 002 504 479 425 627 78 852 45-49 533 189 145 916 387 273 309 047 78 226

217
Table 12 CURRENTLY MARRIED WOMEN AGED 15-49 ARE USING CONTRACEPTIVES BY CURRENTLY USING CONTRACEPTIVES,
URBAN/RURAL RESIDENCE, SOCIO-ECONOMIC REGION AND PROVINCE/CITY, 1/4/2015 Unit: Person
By currently using contraception
Cod
e
Administrative unit
Total currently married
women aged 15-49 using
contraception
IUD Pill Injec-tions/
Implants
Diaph-ragm/ Foam
CondomMale
Sterili-zation
Female Sterili-zation
Periodic Abstin-
ence
Withd-rawal
Others Not
stated
ENTIRE COUNTRY 12 498 368 5 987 780 2 344 754 269 127 4 740 1 831 893 16 207 275 839 1 021 418 729 925 14 429 2 256
Socio-economic regions R1 Northern Midlands and Mountains 1 790 973 924 300 321 779 53 534 291 194 249 2 520 46 098 142 348 103 630 1 721 503 R2 Red River Delta 2 828 450 1 494 076 321 142 23 286 1 462 574 181 1 334 29 331 211 183 170 269 1 494 693 R3 North and South Central Coast 2 567 970 1 385 071 294 249 69 068 846 387 141 4 207 76 814 155 430 190 069 4 015 1 060 R4 Central Highlands 774 660 308 363 149 453 43 779 340 96 604 1 250 23 925 85 141 64 129 1 676 R5 Southeast 2 051 717 817 459 478 334 36 662 1 341 382 702 1 804 45 566 192 935 90 580 4 335 R6 Mekong River Delta 2 484 598 1 058 511 779 797 42 797 460 197 016 5 092 54 105 234 381 111 249 1 189
Provinces/cities 01 Ha Noi 961 867 493 442 119 028 6 381 897 241 166 366 4 660 57 269 38 005 292 362 02 Ha Giang 117 159 63 030 30 897 9 643 6 342 3 131 2 932 1 156 27 04 Cao Bang 84 513 56 062 12 779 6 387 3 985 31 2 069 1 732 1 412 32 23 06 Bac Kan 52 599 33 404 9 150 1 910 3 938 76 1 654 1 701 651 96 20 08 Tuyen Quang 116 135 61 066 20 139 2 637 152 10 165 355 3 256 12 839 5 425 101 10 Lao Cai 105 187 53 290 17 513 5 314 42 12 524 240 7 171 5 591 3 457 44 11 Dien Bien 80 368 44 619 12 230 2 955 12 135 78 997 3 199 4 092 63 12 Lai Chau 63 971 43 605 10 705 2 507 2 728 79 1 655 1 547 1 146 14 Son La 192 452 115 314 38 644 6 928 10 677 191 3 701 10 258 6 740 15 Yen Bai 121 523 52 670 24 351 4 735 12 425 336 6 726 12 289 7 913 78 17 Hoa Binh 140 395 61 990 31 483 3 661 14 292 523 7 461 8 285 12 653 47 19 Thai Nguyen 172 190 78 100 27 444 1 455 24 936 182 2 655 22 220 14 654 466 78 20 Lang Son 115 251 65 252 25 135 3 227 11 103 151 1 480 5 332 3 571 22 Quang Ninh 180 874 68 101 21 914 3 878 186 52 287 242 1 643 20 857 11 604 68 94

218
Table 12 (Continued) Unit: Person
By currently using contraception
Cod
e
Administrative unit
Total currently married
women aged 15-49 using
contraception
IUD Pill Injec-tions/
Implants
Diaph-ragm/ Foam
CondomMale
Sterili-zation
Female Sterili-zation
Periodic Abstin-
ence
Withd-rawal
Others Not stated
24 Bac Giang 244 551 121 495 28 893 1 580 97 42 769 0 1 224 26 294 21 195 813 191 25 Phu Tho 184 680 74 402 32 417 597 26 230 277 2 919 28 129 19 565 143 26 Vinh Phuc 153 700 92 310 25 752 544 35 19 331 181 1 798 5 412 8 262 73 27 Bac Ninh 161 383 72 065 16 788 79 26 582 150 3 527 27 979 14 213 30 Hai Duong 230 761 129 998 35 471 1 975 40 039 90 760 8 768 13 298 126 237 31 Hai Phong 265 004 118 006 27 049 982 72 69 533 2 890 23 994 22 300 177 33 Hung Yen 157 750 99 923 6 654 82 24 668 2 067 16 140 8 062 154 34 Thai Binh 234 746 141 356 31 492 2 753 147 24 735 141 4 360 12 757 17 005 35 Ha Nam 105 473 72 975 7 324 929 52 15 545 940 4 228 3 481 36 Nam Dinh 253 281 139 905 16 675 3 318 74 43 851 164 5 548 21 255 21 886 603 37 Ninh Binh 123 610 65 994 12 995 2 365 16 444 1 137 12 524 12 151 38 Thanh Hoa 510 556 327 423 26 586 3 120 66 171 206 10 143 45 228 30 307 371 1 001 40 Nghe An 387 788 256 011 35 500 10 488 44 870 8 792 11 663 19 902 563 42 Ha Tinh 137 662 101 422 5 831 2 928 12 532 3 770 5 748 5 247 182 44 Quang Binh 108 181 69 567 9 717 3 562 56 8 604 2 143 5 775 8 610 147 45 Quang Tri 78 752 36 243 10 083 1 784 12 992 128 1 981 4 890 10 149 503 46 Thua Thien Hue 131 636 47 594 17 063 5 910 33 944 436 4 187 5 410 16 847 245 48 Da Nang 124 904 44 073 14 074 1 383 48 37 928 430 2 819 10 476 13 470 202 49 Quang Nam 180 449 85 108 22 694 10 739 552 37 017 693 3 221 8 059 12 082 284 51 Quang Ngai 163 965 96 976 11 160 1 288 82 29 070 510 9 836 6 567 8 301 175 52 Binh Dinh 207 583 109 207 30 030 5 465 62 22 981 507 4 696 10 000 24 351 283 54 Phu Yen 131 288 57 265 16 834 4 550 23 405 118 3 580 8 157 16 307 1 013 59 56 Khanh Hoa 153 482 36 268 47 756 8 770 25 690 324 6 958 18 807 8 909 58 Ninh Thuan 78 785 31 555 16 956 3 355 46 11 836 566 3 159 5 448 5 864 60 Binh Thuan 172 938 86 358 29 966 5 726 20 099 289 11 528 9 202 9 723 47

219
Table 12 (Continued) Unit: Person
By currently using contraception
Cod
e
Administrative unit
Total currently married
women aged 15-49 using
contraception
IUD Pill Injec-tions/
Implants
Diaph-ragm/ Foam
CondomMale
Sterili-zation
Female Sterili-zation
Periodic Abstin-
ence
Withd-rawal
Others Not stated
62 Kon Tum 61 310 17 592 15 270 10 103 76 9 687 310 1 083 3 977 3 120 92 64 Gia Lai 193 741 69 792 44 440 16 420 19 957 93 6 430 16 569 19 620 421 66 Dak Lak 257 903 108 306 48 670 7 891 122 28 293 367 7 189 34 631 21 782 653 67 Dak Nong 85 650 39 328 14 271 3 317 36 9 363 32 2 340 10 517 6 036 409 68 Lam Dong 176 056 73 345 26 803 6 049 105 29 304 448 6 884 19 447 13 571 101 70 Binh Phuoc 135 325 57 344 35 145 6 244 56 16 169 383 3 817 8 797 6 814 556 72 Tay Ninh 151 797 70 432 40 774 3 502 74 13 856 192 7 446 7 643 7 422 457 74 Binh Duong 312 178 111 356 86 115 5 154 53 416 225 3 404 30 921 21 093 491 75 Dong Nai 364 658 150 105 59 302 3 222 59 044 376 8 992 61 174 22 088 355 77 Ba Ria - Vung Tau 144 841 69 212 31 284 1 714 21 178 3 276 12 592 5 447 139 79 Ho Chi Minh City 942 920 359 010 225 713 16 826 1 212 219 039 627 18 630 71 809 27 716 2 337 80 Long An 217 702 130 326 45 642 2 650 156 15 185 258 4 664 11 974 6 846 82 Tien Giang 261 430 90 442 95 902 2 608 16 247 512 3 528 36 937 15 187 65 83 Ben Tre 177 845 66 863 54 840 2 020 12 981 365 1 188 30 704 8 884 84 Tra Vinh 144 119 57 933 34 895 2 531 108 8 566 104 2 781 28 294 8 838 69 86 Vinh Long 144 902 60 786 42 701 1 494 12 388 177 2 822 18 797 5 738 87 Dong Thap 246 612 118 754 69 221 7 959 21 544 844 7 544 12 620 8 068 58 89 An Giang 307 851 96 482 136 346 9 935 25 596 339 9 545 17 255 12 065 288 91 Kien Giang 241 215 124 566 51 352 2 718 20 067 570 4 060 27 539 10 343 92 Can Tho 165 577 68 633 44 784 2 376 118 16 835 535 4 779 15 038 12 420 60 93 Hau Giang 111 183 52 052 36 161 2 070 6 192 480 2 299 8 858 3 071 94 Soc Trang 175 360 82 366 61 271 2 731 10 986 415 2 806 8 829 5 640 315 95 Bac Lieu 119 380 44 472 49 393 2 081 11 160 2 548 5 499 3 967 261 96 Ca Mau 171 422 64 836 57 289 1 624 78 19 269 492 5 542 12 037 10 181 75

220
Table 12 (Continued) Unit: Person
By currently using contraception
Cod
e
Administrative unit
Total currently married
women aged 15-49 using
contraception
IUD Pill Injec-tions/
Implants
Diaph-ragm/ Foam
CondomMale
Sterili-zation
Female Sterili-zation
Periodic Abstin-
ence
Withd-rawal
Others Not stated
URBAN 3 998 197 1 622 464 745 131 58 427 3 190 902 396 3 981 71 550 367 373 217 332 5 665 689
Socio-economic regions R1 Northern Midlands and
Mountains 296 620 125 620 45 981 4 618 61 824 132 6 272 33 971 17 864 218 121 R2 Red River Delta 933 303 368 473 123 523 9 491 1 410 285 239 176 9 209 82 236 52 771 538 237 R3 North and South Central Coast 714 783 320 247 88 788 10 954 174 170 842 905 17 232 52 600 51 769 940 331 R4 Central Highlands 231 667 95 074 26 874 4 366 181 48 501 327 4 942 33 026 18 267 109 R5 Southeast 1 238 692 480 173 290 806 21 056 1 212 264 831 1 227 21 987 102 892 51 103 3 404 R6 Mekong River Delta 583 132 232 877 169 160 7 943 212 71 158 1 213 11 908 62 647 25 557 456
Provinces/cities 01 Ha Noi 442 373 174 636 63 935 4 633 897 148 509 1 677 29 891 17 903 292 02 Ha Giang 17 205 7 014 5 029 942 1 942 432 1 476 342 27 04 Cao Bang 17 614 9 245 3 534 990 1 513 734 997 580 23 06 Bac Kan 8 151 4 893 1 326 128 1 215 116 350 123 08 Tuyen Quang 12 438 5 655 1 772 137 2 759 244 1 521 351 10 Lao Cai 23 625 9 109 2 858 241 4 945 23 1 167 3 249 2 033 11 Dien Bien 12 822 7 820 1 240 31 1 823 12 355 624 918 12 Lai Chau 11 896 6 131 1 340 111 1 652 15 415 1 438 795 14 Son La 24 347 14 121 3 129 820 2 886 537 1 939 915 15 Yen Bai 23 761 7 838 2 248 307 7 372 28 826 3 629 1 483 28 17 Hoa Binh 17 666 6 297 3 371 431 3 981 191 1 949 1 399 47 19 Thai Nguyen 50 771 19 470 7 347 132 10 813 54 349 7 692 4 876 37 20 Lang Son 20 724 8 558 4 598 244 4 441 289 1 502 1 091 22 Quang Ninh 108 520 38 043 11 210 1 620 186 38 501 49 1 078 11 716 6 048 68 24 Bac Giang 25 261 9 876 2 495 52 7 347 249 3 626 1 490 125

221
Table 12 (Continued) Unit: Person
By currently using contraception
Cod
e
Administrative unit
Total currently married
women aged 15-49 using
contraception
IUD Pill Injec-tions/
Implants
Diaph-ragm/ Foam
CondomMale
Sterili-zation
Female Sterili-zation
Periodic Abstin-
ence
Withd-rawal
Others Not stated
25 Phu Tho 30 339 9 593 5 694 51 9 135 367 3 979 1 469 51 26 Vinh Phuc 35 358 18 735 7 882 189 35 5 163 37 472 1 421 1 424 27 Bac Ninh 46 270 13 834 5 422 11 905 1 257 10 222 3 631 30 Hai Duong 52 954 24 093 9 832 599 12 227 90 1 699 4 178 237 31 Hai Phong 115 708 37 352 11 797 821 72 41 035 1 144 14 155 9 153 177 33 Hung Yen 20 567 11 341 1 011 4 124 580 1 563 1 948 34 Thai Binh 24 613 10 863 3 321 865 147 3 139 71 4 283 1 924 35 Ha Nam 15 664 9 155 1 330 382 3 497 370 680 251 36 Nam Dinh 46 071 19 708 4 711 73 74 11 326 2 287 3 925 3 967 37 Ninh Binh 25 206 10 715 3 070 308 5 814 273 2 683 2 343 38 Thanh Hoa 79 191 37 462 4 437 20 012 780 9 605 6 404 160 331 40 Nghe An 59 577 34 798 3 928 2 733 11 702 893 1 873 3 447 204 42 Ha Tinh 25 950 16 309 1 162 390 5 331 425 1 120 1 213 44 Quang Binh 23 144 12 018 2 698 876 3 327 320 1 401 2 468 36 45 Quang Tri 25 140 9 654 2 689 181 6 490 537 2 056 3 532 46 Thua Thien Hue 64 357 21 435 9 595 1 047 22 398 228 1 592 1 816 6 140 105 48 Da Nang 107 965 37 689 12 125 1 021 48 33 706 154 2 079 9 997 10 942 202 49 Quang Nam 41 378 18 493 5 373 689 63 12 787 115 249 2 222 1 388 51 Quang Ngai 28 080 14 273 1 348 8 682 759 1 466 1 552 52 Binh Dinh 63 236 34 140 7 181 704 62 11 463 181 703 3 782 4 959 62 54 Phu Yen 36 731 16 601 4 710 916 9 197 897 2 275 2 010 126 56 Khanh Hoa 67 049 21 509 17 693 1 368 11 805 90 3 487 7 706 3 390 58 Ninh Thuan 28 971 13 122 4 976 300 4 473 45 1 129 2 721 2 204 60 Binh Thuan 64 013 32 744 10 874 728 9 468 92 3 380 4 560 2 120 47

222
Table 12 (Continued) Unit: Person
By currently using contraception
Cod
e
Administrative unit
Total currently married
women aged 15-49 using
contraception
IUD Pill Injec-tions/
Implants
Diaph-ragm/ Foam
CondomMale
Sterili-zation
Female Sterili-zation
Periodic Abstin-
ence
Withd-rawal
Others Not stated
62 Kon Tum 25 752 10 003 3 810 886 76 6 985 58 286 2 044 1 603 64 Gia Lai 62 241 27 789 7 673 2 022 11 601 1 400 6 052 5 652 51 66 Dak Lak 65 698 25 851 7 045 292 10 562 123 841 15 217 5 765 67 Dak Nong 13 549 6 621 1 266 253 2 298 280 1 766 1 008 58 68 Lam Dong 64 428 24 810 7 079 912 105 17 054 146 2 134 7 947 4 239 70 Binh Phuoc 27 686 11 404 7 370 739 3 358 82 276 2 108 2 266 84 72 Tay Ninh 28 661 14 195 5 395 154 4 042 51 1 289 1 986 1 499 51 74 Binh Duong 243 965 88 958 65 611 2 097 42 923 225 2 300 24 516 16 895 439 75 Dong Nai 125 394 57 562 15 188 2 408 24 820 241 2 682 16 761 5 376 355 77 Ba Ria - Vung Tau 74 341 33 573 17 809 936 12 008 1 345 5 892 2 639 139 79 Ho Chi Minh City 738 645 274 481 179 434 14 724 1 212 177 680 627 14 094 51 629 22 429 2 337 80 Long An 36 781 20 145 7 715 858 55 4 570 53 211 2 348 826 82 Tien Giang 38 636 13 586 11 650 466 3 996 64 938 6 453 1 419 65 83 Ben Tre 16 069 6 181 3 806 147 2 393 49 3 181 311 84 Tra Vinh 22 651 8 435 4 802 376 39 2 026 32 432 4 701 1 809 86 Vinh Long 21 152 5 924 6 430 82 4 244 40 435 3 179 820 87 Dong Thap 39 831 18 821 9 935 1 137 4 850 1 190 2 765 1 076 58 89 An Giang 88 268 25 373 37 181 785 10 089 180 3 203 7 946 3 512 91 Kien Giang 63 489 32 325 10 502 313 7 691 844 8 770 3 044 92 Can Tho 109 527 43 567 27 836 1 168 118 13 959 425 2 336 12 061 7 999 60 93 Hau Giang 28 292 10 991 9 788 643 2 861 152 517 2 494 847 94 Soc Trang 51 214 20 921 18 537 713 5 721 178 666 3 055 1 181 243 95 Bac Lieu 28 422 12 185 9 907 857 2 948 593 966 936 30 96 Ca Mau 38 799 14 425 11 073 400 5 810 91 493 4 730 1 777

223
Table 12 (Continued) Unit: Person
By currently using contraception
Cod
e
Administrative unit
Total currently married
women aged 15-49 using
contraception
IUD Pill Injec-tions/
Implants
Diaph-ragm/ Foam
CondomMale
Sterili-zation
Female Sterili-zation
Periodic Abstin-
ence
Withd-rawal
Others Not stated
RURAL 8 500 171 4 365 316 1 599 623 210 700 1 550 929 497 12 226 204 289 654 046 512 594 8 764 1 567
Socio-economic regions R1 Northern Midlands and
Mountains 1 494 353 798 680 275 799 48 917 291 132 424 2 388 39 827 108 377 85 765 1 502 382 R2 Red River Delta 1 895 148 1 125 602 197 620 13 796 52 288 942 1 158 20 121 128 946 117 498 956 456 R3 North and South Central Coast 1 853 187 1 064 824 205 460 58 114 672 216 300 3 302 59 581 102 830 138 300 3 074 729 R4 Central Highlands 542 993 213 289 122 579 39 414 158 48 103 922 18 984 52 115 45 863 1 567 R5 Southeast 813 025 337 286 187 528 15 606 129 117 871 577 23 578 90 043 39 477 931 R6 Mekong River Delta 1 901 465 825 634 610 637 34 853 248 125 857 3 879 42 198 171 734 85 691 733
Provinces/cities 01 Ha Noi 519 495 318 807 55 093 1 748 92 657 366 2 983 27 378 20 102 362 02 Ha Giang 99 954 56 016 25 868 8 701 4 399 2 699 1 456 814 04 Cao Bang 66 898 46 817 9 245 5 397 2 472 31 1 336 735 832 32 06 Bac Kan 44 447 28 511 7 824 1 782 2 723 76 1 538 1 351 528 96 20 08 Tuyen Quang 103 696 55 411 18 368 2 500 152 7 406 355 3 013 11 317 5 074 101 10 Lao Cai 81 563 44 182 14 655 5 073 42 7 579 217 6 004 2 343 1 424 44 11 Dien Bien 67 546 36 798 10 991 2 925 10 312 67 642 2 575 3 174 63 12 Lai Chau 52 075 37 474 9 365 2 396 1 075 64 1 239 109 351 14 Son La 168 105 101 193 35 515 6 108 7 791 191 3 163 8 318 5 825 15 Yen Bai 97 762 44 831 22 103 4 427 5 053 307 5 900 8 660 6 430 50 17 Hoa Binh 122 729 55 694 28 112 3 229 10 311 523 7 270 6 337 11 254 19 Thai Nguyen 121 419 58 631 20 097 1 322 14 123 128 2 306 14 528 9 777 429 78 20 Lang Son 94 527 56 694 20 536 2 982 6 662 151 1 191 3 831 2 480 22 Quang Ninh 72 354 30 058 10 704 2 259 13 786 193 564 9 141 5 556 94 24 Bac Giang 219 290 111 619 26 399 1 527 97 35 422 974 22 667 19 705 688 191

224
Table 12 (Continued) Unit: Person
By currently using contraception
Cod
e
Administrative unit
Total currently married
women aged 15-49 using
contraception
IUD Pill Injec-tions/
Implants
Diaph-ragm/ Foam
CondomMale
Sterili-zation
Female Sterili-zation
Periodic Abstin-
ence
Withd-rawal
Others Not stated
25 Phu Tho 154 340 64 809 26 722 547 17 095 277 2 552 24 150 18 095 93 26 Vinh Phuc 118 341 73 576 17 870 354 14 169 144 1 327 3 991 6 838 73 27 Bac Ninh 115 113 58 231 11 366 79 14 677 150 2 270 17 757 10 582 30 Hai Duong 177 807 105 905 25 639 1 376 27 812 760 7 069 9 120 126 31 Hai Phong 149 296 80 654 15 252 161 28 498 1 746 9 839 13 147 33 Hung Yen 137 184 88 582 5 642 82 20 544 1 488 14 577 6 115 154 34 Thai Binh 210 133 130 493 28 170 1 888 21 596 141 4 289 8 474 15 082 35 Ha Nam 89 809 63 820 5 994 547 52 12 049 569 3 548 3 230 36 Nam Dinh 207 210 120 197 11 965 3 245 32 525 164 3 260 17 331 17 919 603 37 Ninh Binh 98 405 55 279 9 925 2 057 10 630 865 9 841 9 808 38 Thanh Hoa 431 365 289 961 22 150 3 120 46 159 206 9 362 35 622 23 904 211 670 40 Nghe An 328 211 221 213 31 571 7 755 33 168 7 899 9 790 16 455 359 42 Ha Tinh 111 711 85 113 4 669 2 538 7 201 3 345 4 628 4 034 182 44 Quang Binh 85 037 57 549 7 019 2 686 56 5 277 1 823 4 374 6 142 111 45 Quang Tri 53 612 26 589 7 393 1 603 6 502 128 1 443 2 834 6 617 503 46 Thua Thien Hue 67 279 26 159 7 467 4 863 11 546 208 2 595 3 594 10 707 140 48 Da Nang 16 939 6 384 1 949 362 4 222 276 740 479 2 527 49 Quang Nam 139 071 66 615 17 321 10 050 488 24 230 578 2 972 5 838 10 695 284 51 Quang Ngai 135 885 82 703 9 812 1 288 82 20 388 510 9 076 5 101 6 749 175 52 Binh Dinh 144 347 75 067 22 850 4 761 11 519 326 3 994 6 218 19 392 221 54 Phu Yen 94 557 40 664 12 124 3 634 14 208 118 2 683 5 882 14 297 888 59 56 Khanh Hoa 86 433 14 759 30 062 7 401 13 885 234 3 471 11 101 5 519 58 Ninh Thuan 49 814 18 433 11 981 3 055 46 7 363 521 2 030 2 726 3 660 60 Binh Thuan 108 925 53 614 19 093 4 998 10 631 196 8 148 4 643 7 602

225
Table 12 (Continued) Unit: Person
By currently using contraception
Cod
e
Administrative unit
Total currently married
women aged 15-49 using
contraception
IUD Pill Injec-tions/
Implants
Diaph-ragm/ Foam
CondomMale
Sterili-zation
Female Sterili-zation
Periodic Abstin-
ence
Withd-rawal
Others Not stated
62 Kon Tum 35 558 7 589 11 460 9 217 2 701 252 797 1 933 1 518 92 64 Gia Lai 131 501 42 003 36 767 14 398 8 356 93 5 029 10 517 13 968 370 66 Dak Lak 192 205 82 455 41 625 7 598 122 17 731 244 6 348 19 414 16 016 653 67 Dak Nong 72 101 32 708 13 005 3 064 36 7 066 32 2 060 8 751 5 028 351 68 Lam Dong 111 628 48 534 19 724 5 137 12 250 301 4 750 11 500 9 332 101 70 Binh Phuoc 107 639 45 940 27 776 5 506 56 12 811 301 3 540 6 689 4 548 472 72 Tay Ninh 123 136 56 237 35 379 3 348 74 9 814 140 6 157 5 657 5 923 407 74 Binh Duong 68 212 22 398 20 504 3 057 10 494 1 104 6 405 4 198 52 75 Dong Nai 239 264 92 543 44 114 814 34 223 135 6 310 44 413 16 712 77 Ba Ria - Vung Tau 70 499 35 639 13 475 778 9 170 1 931 6 700 2 807 79 Ho Chi Minh City 204 274 84 529 46 280 2 103 41 359 4 536 20 180 5 288 80 Long An 180 921 110 181 37 927 1 792 101 10 615 205 4 453 9 626 6 020 82 Tien Giang 222 793 76 857 84 253 2 143 12 251 448 2 590 30 485 13 768 83 Ben Tre 161 776 60 682 51 034 1 873 10 587 365 1 138 27 523 8 572 84 Tra Vinh 121 469 49 499 30 093 2 156 69 6 540 72 2 348 23 593 7 029 69 86 Vinh Long 123 750 54 862 36 271 1 412 8 144 137 2 388 15 618 4 918 87 Dong Thap 206 780 99 934 59 286 6 821 16 694 844 6 354 9 856 6 991 89 An Giang 219 583 71 108 99 165 9 150 15 507 160 6 343 9 309 8 554 288 91 Kien Giang 177 726 92 241 40 851 2 405 12 376 570 3 216 18 769 7 298 92 Can Tho 56 051 25 066 16 948 1 208 2 876 111 2 443 2 977 4 421 93 Hau Giang 82 890 41 061 26 372 1 427 3 331 329 1 782 6 364 2 225 94 Soc Trang 124 146 61 445 42 735 2 018 5 266 238 2 140 5 774 4 460 71 95 Bac Lieu 90 958 32 287 39 486 1 223 8 212 1 955 4 533 3 031 231 96 Ca Mau 132 623 50 411 46 216 1 224 78 13 459 401 5 048 7 307 8 404 75

226
Table 13 CURRENTLY MARRIED WOMEN AGED 15-49 ARE USING CONTRACEPTIVES BY CURRENTLY USING CONTRACEPTIVES,
NUMBER OF CHILDREN SURVIVING, URBAN/RURAL RESIDENCE AND SOCIO-ECONOMIC REGION, 1/4/2015 Unit: Person
By currently using contraception
Administrative unit
Total currently married
women aged 15-49 using
contraception
IUD Pill Injec-tions/
Implants
Diaph-ragm/ Foam
Condom Male
Sterili-zation
Female Sterili-zation
Periodic Abstin-
ence
Withd-rawal
Others Not
stated
ENTIRE COUNTRY Total 12 498 368 5 987 780 2 344 754 269 127 4 740 1 831 893 16 207 275 839 1 021 418 729 925 14 429 2 256
0 child 2 592 655 467 111 867 124 274 93 1 child 2 599 112 914 795 631 706 46 735 1 773 584 913 1 972 13 586 231 032 169 124 3 451 23 2 children 7 094 336 3 610 970 1 268 935 134 591 2 297 974 339 6 861 114 739 577 892 395 780 6 370 1 563 3 children 2 046 692 1 113 787 315 945 53 790 460 187 480 3 831 92 201 153 270 122 653 2 832 444 4 children 494 879 248 864 73 016 20 800 209 41 628 1 991 37 602 41 766 27 894 883 226 5 children and over 177 859 87 376 26 103 12 785 11 331 1 312 17 438 11 143 10 161 211 Not stated 82 897 11 332 28 583 315 31 335 240 149 6 042 4 220 682
URBAN Total 3 998 197 1 622 464 745 131 58 427 3 190 902 396 3 981 71 550 367 373 217 332 5 665 689
0 child 849 396 136 58 62 23 132 40 1 child 1 033 941 308 307 236 906 16 142 1 479 306 387 695 4 568 94 946 62 360 2 127 23 2 children 2 377 805 1 062 014 406 891 33 137 1 367 491 806 2 055 35 910 220 638 121 052 2 351 584 3 children 435 943 204 414 69 436 6 758 289 66 528 488 20 292 40 064 27 004 587 82 4 children 75 474 33 267 11 045 1 409 55 11 692 406 6 573 7 136 3 871 19 5 children and over 22 414 8 978 3 127 770 2 644 279 4 086 1 558 973 Not stated 51 773 5 088 17 590 152 23 276 57 98 2 898 2 031 581
RURAL Total 8 500 171 4 365 316 1 599 623 210 700 1 550 929 497 12 226 204 289 654 046 512 594 8 764 1 567
0 child 1 743 259 331 53 805 101 142 53 1 child 1 565 171 606 489 394 800 30 593 295 278 526 1 277 9 019 136 085 106 764 1 324 2 children 4 716 531 2 548 956 862 044 101 453 931 482 533 4 806 78 829 357 254 274 728 4 020 979 3 children 1 610 750 909 373 246 509 47 031 171 120 952 3 343 71 909 113 205 95 649 2 246 362 4 children 419 405 215 597 61 971 19 391 153 29 936 1 585 31 029 34 631 24 024 863 226 5 children and over 155 445 78 398 22 976 12 015 8 687 1 033 13 352 9 585 9 188 211 Not stated 31 125 6 244 10 993 163 8 060 183 50 3 143 2 188 101

227
Table 13 (Continued) Unit: Person
By currently using contraception
Administrative unit
Total currently married women
aged 15-49 using
contraception
IUD Pill Injec-tions/
Implants
Diaph-ragm/ Foam
Condom Male
Sterili-zation
Female Sterili-zation
Periodic Abstin-
ence
Withd-rawal
Others Not
stated
R1. Northern Midlands and Mountains Total 1 790 973 924 300 321 779 53 534 291 194 249 2 520 46 098 142 348 103 630 1 721 503
0 child 409 55 31 16 106 124 37 40 1 child 325 708 128 147 70 599 6 925 62 146 370 2 376 31 045 23 718 360 23 2 children 1 084 708 570 099 193 873 27 964 291 111 980 1 248 24 624 90 048 63 031 1 069 480 3 children 263 061 153 763 40 331 10 015 14 924 656 13 008 17 005 13 196 163 4 children 75 890 46 299 11 363 4 408 2 913 192 4 564 3 640 2 415 96 5 children and over 38 521 25 326 4 859 4 154 1 119 55 1 338 495 1 144 32 Not stated 2 676 611 723 52 1 062 64 78 85
R2. Red River Delta Total 2 828 450 1 494 076 321 142 23 286 1 462 574 181 1 334 29 331 211 183 170 269 1 494 693
0 child 119 119 1 child 403 227 114 344 57 762 4 104 555 159 465 141 689 32 830 33 045 292 2 children 1 857 408 1 024 445 212 176 14 671 833 345 305 872 17 618 134 231 106 263 745 249 3 children 473 642 300 423 45 783 3 613 74 55 412 149 7 498 32 925 26 866 457 444 4 children 73 837 44 708 4 378 898 8 994 101 3 213 8 732 2 813 5 children and over 13 390 8 766 748 1 258 72 313 1 674 559 Not stated 6 827 1 271 296 3 747 791 723
R3. North and South Central Coast Total 2 567 970 1 385 071 294 249 69 068 846 387 141 4 207 76 814 155 430 190 069 4 015 1 060
0 child 179 134 22 22 1 child 435 207 179 292 58 002 7 060 138 117 866 513 2 338 32 575 36 675 747 2 children 1 339 719 763 614 149 978 33 209 449 192 590 1 012 22 523 79 696 94 071 1 742 834 3 children 565 747 325 980 61 347 17 837 161 54 743 1 050 31 918 29 984 41 742 987 4 children 162 409 87 421 17 322 6 720 98 14 820 1 043 13 090 9 850 11 459 361 226 5 children and over 57 923 27 354 6 125 4 132 4 710 532 6 923 2 914 5 055 178 Not stated 6 785 1 275 1 453 111 2 412 57 22 388 1 067

228
Table 13 (Continued) Unit: Person
By currently using contraception
Administrative unit
Total currently married women
aged 15-49 using
contraception
IUD Pill Injec-tions/
Implants
Diaph-ragm/ Foam
Condom Male
Sterili-zation
Female Sterili-zation
Periodic Abstin-
ence
Withd-rawal
Others Not
stated
R4. Central Highlands Total 774 660 308 363 149 453 43 779 340 96 604 1 250 23 925 85 141 64 129 1 676
0 child 163 90 37 36 1 child 126 927 39 682 28 402 6 799 55 24 780 35 594 15 639 10 680 261 2 children 369 237 157 079 66 621 15 886 231 49 788 322 6 560 41 549 30 601 599 3 children 176 952 75 675 31 670 10 555 53 15 859 462 9 276 17 390 15 478 534 4 children 65 267 23 670 13 650 6 278 3 856 158 4 635 7 653 5 188 180 5 children and over 34 025 11 746 8 605 4 224 1 518 272 2 860 2 616 2 183 Not stated 2 090 511 416 803 259 101
R5. Southeast Total 2 051 717 817 459 478 334 36 662 1 341 382 702 1 804 45 566 192 935 90 580 4 335
0 child 1 095 114 114 704 110 53 1 child 617 153 195 957 162 192 10 898 899 152 530 419 2 864 56 543 33 250 1 601 2 children 1 080 955 485 820 240 638 19 479 313 170 133 1 011 19 144 101 311 41 245 1 860 3 children 240 933 108 635 48 538 4 696 74 29 209 254 14 277 23 958 11 059 233 4 children 50 195 17 595 7 781 1 408 56 7 920 51 6 036 6 184 3 105 59 5 children and over 14 852 4 760 1 765 58 2 179 69 3 244 2 210 566 Not stated 46 535 4 576 17 306 122 20 027 2 619 1 302 581
R6. Mekong River Delta Total 2 484 598 1 058 511 779 797 42 797 460 197 016 5 092 54 105 234 381 111 249 1 189
0 child 627 233 210 58 57 69 1 child 690 890 257 372 254 750 10 949 126 68 128 494 4 726 62 400 31 756 189 2 children 1 362 310 609 914 405 648 23 381 179 104 543 2 396 24 270 131 057 60 568 355 3 children 326 357 149 312 88 276 7 073 99 17 332 1 261 16 223 32 008 14 312 458 4 children 67 282 29 170 18 523 1 088 55 3 126 447 6 064 5 707 2 914 187 5 children and over 19 147 9 423 4 000 217 546 311 2 760 1 233 655 Not stated 17 984 3 087 8 389 30 3 284 183 62 1 907 1 042
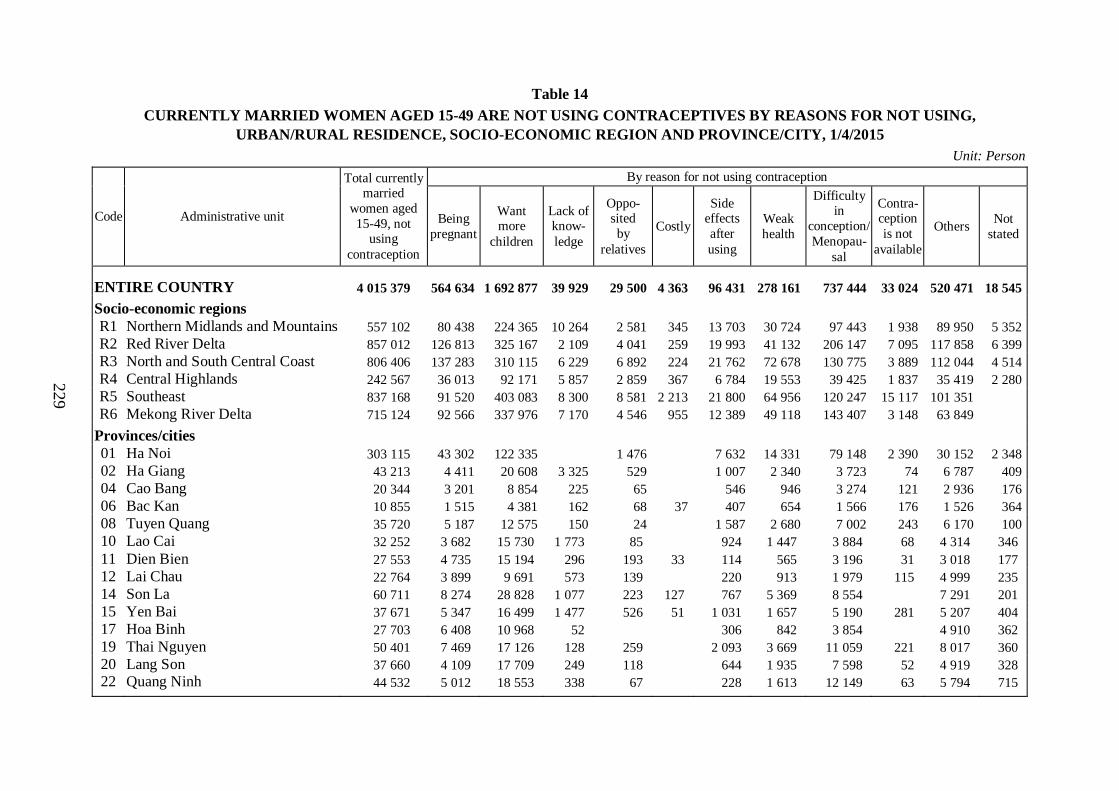
229
Table 14
CURRENTLY MARRIED WOMEN AGED 15-49 ARE NOT USING CONTRACEPTIVES BY REASONS FOR NOT USING, URBAN/RURAL RESIDENCE, SOCIO-ECONOMIC REGION AND PROVINCE/CITY, 1/4/2015
Unit: Person
By reason for not using contraception
Code Administrative unit
Total currently married
women aged 15-49, not
using contraception
Being pregnant
Want more
children
Lack of know-ledge
Oppo-sited by
relatives
Costly
Side effects after using
Weak health
Difficulty in
conception/ Menopau-
sal
Contra-ception is not
available
Others Not
stated
ENTIRE COUNTRY 4 015 379 564 634 1 692 877 39 929 29 500 4 363 96 431 278 161 737 444 33 024 520 471 18 545
Socio-economic regions R1 Northern Midlands and Mountains 557 102 80 438 224 365 10 264 2 581 345 13 703 30 724 97 443 1 938 89 950 5 352 R2 Red River Delta 857 012 126 813 325 167 2 109 4 041 259 19 993 41 132 206 147 7 095 117 858 6 399 R3 North and South Central Coast 806 406 137 283 310 115 6 229 6 892 224 21 762 72 678 130 775 3 889 112 044 4 514 R4 Central Highlands 242 567 36 013 92 171 5 857 2 859 367 6 784 19 553 39 425 1 837 35 419 2 280 R5 Southeast 837 168 91 520 403 083 8 300 8 581 2 213 21 800 64 956 120 247 15 117 101 351 R6 Mekong River Delta 715 124 92 566 337 976 7 170 4 546 955 12 389 49 118 143 407 3 148 63 849
Provinces/cities 01 Ha Noi 303 115 43 302 122 335 1 476 7 632 14 331 79 148 2 390 30 152 2 348 02 Ha Giang 43 213 4 411 20 608 3 325 529 1 007 2 340 3 723 74 6 787 409 04 Cao Bang 20 344 3 201 8 854 225 65 546 946 3 274 121 2 936 176 06 Bac Kan 10 855 1 515 4 381 162 68 37 407 654 1 566 176 1 526 364 08 Tuyen Quang 35 720 5 187 12 575 150 24 1 587 2 680 7 002 243 6 170 100 10 Lao Cai 32 252 3 682 15 730 1 773 85 924 1 447 3 884 68 4 314 346 11 Dien Bien 27 553 4 735 15 194 296 193 33 114 565 3 196 31 3 018 177 12 Lai Chau 22 764 3 899 9 691 573 139 220 913 1 979 115 4 999 235 14 Son La 60 711 8 274 28 828 1 077 223 127 767 5 369 8 554 7 291 201 15 Yen Bai 37 671 5 347 16 499 1 477 526 51 1 031 1 657 5 190 281 5 207 404 17 Hoa Binh 27 703 6 408 10 968 52 306 842 3 854 4 910 362 19 Thai Nguyen 50 401 7 469 17 126 128 259 2 093 3 669 11 059 221 8 017 360 20 Lang Son 37 660 4 109 17 709 249 118 644 1 935 7 598 52 4 919 328 22 Quang Ninh 44 532 5 012 18 553 338 67 228 1 613 12 149 63 5 794 715

230
Table 14 (Continued) Unit: Person
By reason for not using contraception
Code Administrative unit
Total currently married
women aged 15-49, not
using contraception
Being pregnant
Want more
children
Lack of know-ledge
Oppo-sited by
relatives
Costly
Side effects after using
Weak health
Difficulty in
conception/ Menopau-
sal
Contra-ception is not
available
Others Not stated
24 Bac Giang 79 426 12 645 24 574 545 72 97 2 305 4 993 16 774 290 15 954 1 176 25 Phu Tho 70 829 9 557 21 627 231 281 1 750 2 715 19 789 265 13 900 715 26 Vinh Phuc 46 731 6 561 20 214 223 419 35 1 941 3 667 7 351 71 6 141 108 27 Bac Ninh 58 358 11 951 17 283 73 195 844 13 537 123 14 278 74 30 Hai Duong 76 454 5 677 32 527 251 326 127 2 680 5 409 17 327 334 10 389 1 407 31 Hai Phong 77 041 13 825 26 854 84 201 97 1 806 3 226 19 161 11 702 85 33 Hung Yen 51 652 7 191 18 602 74 246 920 2 821 13 478 161 7 563 594 34 Thai Binh 62 128 9 033 24 689 1 368 2 851 13 393 542 9 758 493 35 Ha Nam 28 785 3 094 12 663 69 452 1 611 2 571 3 514 214 4 312 285 36 Nam Dinh 67 594 13 069 19 106 923 777 1 135 1 683 17 719 3 118 10 063 37 Ninh Binh 40 621 8 098 12 339 73 74 477 2 117 9 369 79 7 706 289 38 Thanh Hoa 130 636 24 467 51 314 170 1 095 1 465 8 206 28 579 581 13 248 1 510 40 Nghe An 140 941 27 831 56 154 2 155 3 144 1 932 6 452 12 779 1 414 28 892 188 42 Ha Tinh 67 556 13 265 21 662 326 296 3 166 7 260 7 421 13 840 320 44 Quang Binh 34 307 4 999 13 755 318 208 55 603 3 419 4 287 144 6 520 45 Quang Tri 23 944 4 210 8 073 153 43 22 495 2 647 4 595 42 3 665 46 Thua Thien Hue 46 000 9 215 17 171 265 275 424 6 882 7 429 56 3 888 394 48 Da Nang 53 003 7 651 20 067 491 397 1 537 5 226 9 185 512 7 677 261 49 Quang Nam 62 531 9 492 19 636 628 381 5 619 6 265 11 389 356 8 213 552 51 Quang Ngai 44 621 6 939 17 633 83 169 90 1 731 4 339 8 082 250 5 045 260 52 Binh Dinh 55 639 8 184 23 329 287 129 1 573 7 262 8 033 67 6 238 535 54 Phu Yen 33 722 5 688 12 903 530 162 58 745 2 444 6 508 243 4 205 237 56 Khanh Hoa 48 275 6 328 22 285 379 212 1 292 3 785 9 551 132 4 146 165 58 Ninh Thuan 25 243 3 535 8 830 265 289 205 2 114 6 427 3 485 93 60 Binh Thuan 39 987 5 479 17 304 178 93 975 6 377 6 510 92 2 980

231
Table 14 (Continued) Unit: Person
By reason for not using contraception
Code Administrative unit
Total currently married
women aged 15-49, not
using contraception
Being pregnant
Want more
children
Lack of know-ledge
Oppo-sited by
relatives
Costly
Side effects after using
Weak health
Difficulty in
conception/ Menopau-
sal
Contra-ception is not
available
Others Not stated
62 Kon Tum 24 710 3 578 9 885 1 474 1 278 379 2 186 2 955 326 2 648 64 Gia Lai 67 469 9 615 25 753 2 236 682 2 059 4 321 8 420 674 12 656 1 053 66 Dak Lak 77 283 12 455 27 504 1 226 410 330 1 664 4 783 16 454 11 592 866 67 Dak Nong 25 672 3 759 10 789 214 90 37 766 3 011 3 500 594 2 694 219 68 Lam Dong 47 432 6 607 18 240 707 400 1 915 5 251 8 097 243 5 829 143 70 Binh Phuoc 38 663 5 407 17 080 572 544 1 907 3 833 5 664 159 3 497 72 Tay Ninh 47 588 5 371 21 462 320 425 53 281 4 467 10 697 291 4 221 74 Binh Duong 106 223 15 883 60 421 505 227 51 1 176 6 651 8 197 51 13 061 75 Dong Nai 150 634 17 681 63 030 1 915 1 840 984 6 124 17 205 24 416 2 169 15 271 77 Ba Ria - Vung Tau 45 563 3 502 22 827 342 98 1 078 4 358 6 252 1 726 5 379 79 Ho Chi Minh City 448 496 43 676 218 262 4 647 5 448 1 125 11 233 28 441 65 020 10 721 59 922 80 Long An 60 420 6 558 31 315 253 364 172 1 273 5 768 10 643 379 3 696 82 Tien Giang 58 119 11 972 25 201 123 237 66 2 933 11 715 227 5 645 83 Ben Tre 50 483 7 096 20 346 87 88 483 3 629 12 375 430 5 949 84 Tra Vinh 46 432 6 771 18 167 68 37 141 310 3 348 10 384 69 7 137 86 Vinh Long 43 519 4 642 20 506 409 258 150 1 353 3 607 10 960 149 1 486 87 Dong Thap 65 077 8 004 29 029 500 575 112 766 5 547 15 197 113 5 235 89 An Giang 79 120 10 442 34 808 737 981 1 184 4 788 19 036 545 6 598 91 Kien Giang 82 441 10 020 37 333 1 519 801 115 2 339 5 345 18 550 603 5 816 92 Can Tho 57 672 7 663 29 006 172 553 2 142 4 345 8 563 229 4 999 93 Hau Giang 25 964 2 724 16 329 142 44 189 1 466 3 772 1 298 94 Soc Trang 52 340 6 591 26 190 1 633 63 237 441 3 077 7 615 6 493 95 Bac Lieu 35 030 2 717 17 981 427 182 28 113 1 963 6 212 53 5 353 96 Ca Mau 58 508 7 366 31 764 1 102 362 1 729 3 302 8 385 352 4 145

232
Table 14 (Continued) Unit: Person
By reason for not using contraception
Code Administrative unit
Total currently married
women aged 15-49, not
using contraception
Being pregnant
Want more
children
Lack of know-ledge
Oppo-sited by
relatives
Costly
Side effects after using
Weak health
Difficulty in
conception/ Menopau-
sal
Contra-ception is not
available
Others Not stated
URBAN 1 449 484 178 993 640 997 10 628 9 541 2 411 29 868 102 283 281 442 17 331 170 866 5 124
Socio-economic regions R1 Northern Midlands and Mountains 105 465 12 936 39 129 493 236 2 833 6 784 26 134 150 15 801 971 R2 Red River Delta 295 186 43 006 120 359 325 253 132 3 965 14 872 77 016 1 044 31 705 2 509 R3 North and South Central Coast 236 911 33 747 93 800 1 087 1 334 22 6 120 21 451 45 816 1 450 30 623 1 461 R4 Central Highlands 64 652 11 535 22 504 444 370 1 599 5 760 12 415 247 9 595 183 R5 Southeast 557 028 55 474 274 753 6 606 6 461 2 162 12 300 41 779 78 508 13 981 65 004 R6 Mekong River Delta 190 241 22 296 90 452 1 672 887 95 3 050 11 638 41 554 460 18 138
Provinces/cities 01 Ha Noi 139 426 19 888 59 000 1 974 8 161 37 109 553 11 122 1 619 02 Ha Giang 7 247 910 2 912 82 49 287 155 1 475 1 212 165 04 Cao Bang 6 160 848 2 247 240 325 1 638 817 45 06 Bac Kan 1 934 340 736 12 14 49 133 412 177 61 08 Tuyen Quang 5 674 706 2 024 24 348 579 1 445 47 500 10 Lao Cai 7 457 1 054 2 973 254 289 1 521 25 1 247 94 11 Dien Bien 3 560 683 1 494 17 48 201 689 427 12 Lai Chau 3 870 778 1 303 49 25 39 208 655 795 18 14 Son La 8 117 900 4 035 164 32 33 636 1 277 1 040 15 Yen Bai 7 063 1 118 2 385 55 85 376 1 723 28 1 265 28 17 Hoa Binh 4 392 981 1 435 93 209 873 757 45 19 Thai Nguyen 18 667 2 147 6 037 545 1 630 5 191 49 2 955 112 20 Lang Son 7 942 1 108 3 217 19 23 569 1 884 1 046 77 22 Quang Ninh 29 501 2 895 12 549 134 67 228 1 036 9 373 63 2 882 274 24 Bac Giang 9 598 616 4 130 61 72 570 689 2 270 1 128 63

233
Table 14 (Continued) Unit: Person
By reason for not using contraception
Code Administrative unit
Total currently married
women aged 15-49, not
using contraception
Being pregnant
Want more
children
Lack of know-ledge
Oppo-sited by
relatives
Costly
Side effects after using
Weak health
Difficulty in
conception/ Menopau-
sal
Contra-ception is not
available
Others Not stated
25 Phu Tho 13 784 747 4 201 53 217 786 5 082 2 436 262 26 Vinh Phuc 11 149 1 469 4 816 38 78 35 192 804 2 176 1 504 38 27 Bac Ninh 16 181 3 067 5 452 47 313 3 544 44 3 714 30 Hai Duong 17 251 1 576 9 776 73 89 708 3 489 78 1 297 166 31 Hai Phong 40 933 7 620 13 651 84 97 809 1 640 11 051 5 897 85 33 Hung Yen 7 275 962 2 663 121 528 1 752 1 119 129 34 Thai Binh 6 244 1 222 2 746 144 433 1 120 510 70 35 Ha Nam 5 202 510 2 969 69 35 127 458 451 453 130 36 Nam Dinh 13 083 1 870 3 875 196 462 4 924 227 1 529 37 Ninh Binh 8 941 1 928 2 863 39 329 2 026 79 1 677 38 Thanh Hoa 24 717 3 810 10 151 170 162 1 054 6 866 136 2 206 162 40 Nghe An 17 868 2 333 7 709 98 106 566 2 301 4 756 42 Ha Tinh 11 257 1 556 3 241 47 661 1 226 1 405 3 076 44 44 Quang Binh 6 667 1 237 2 528 38 374 1 097 37 1 357 45 Quang Tri 7 061 1 404 2 372 68 22 68 470 1 452 1 206 46 Thua Thien Hue 22 538 4 535 7 754 56 275 217 2 799 4 168 56 2 284 394 48 Da Nang 47 813 5 991 18 506 396 397 1 537 4 580 8 620 512 7 013 261 49 Quang Nam 15 167 2 210 5 619 64 184 1 518 1 769 2 254 258 1 225 68 51 Quang Ngai 7 806 1 575 2 483 46 630 1 873 1 199 52 Binh Dinh 20 011 1 679 8 780 64 129 358 2 800 4 251 67 1 563 320 54 Phu Yen 9 574 1 738 3 365 256 685 1 855 243 1 311 120 56 Khanh Hoa 21 898 2 766 10 663 43 52 710 1 856 4 440 51 1 317 58 Ninh Thuan 8 676 1 062 3 233 90 69 161 806 1 895 1 267 93 60 Binh Thuan 15 858 1 851 7 397 88 93 321 1 835 3 339 92 843

234
Table 14 (Continued) Unit: Person
By reason for not using contraception
Code Administrative unit
Total currently married
women aged 15-49, not
using contraception
Being pregnant
Want more
children
Lack of know-ledge
Oppo-sited by
relatives
Costly
Side effects after using
Weak health
Difficulty in
conception/ Menopau-
sal
Contra-ception is not
available
Others Not stated
62 Kon Tum 7 046 1 418 2 537 207 149 117 791 973 19 836 64 Gia Lai 16 555 3 102 5 669 100 100 288 1 002 3 084 140 3 068 66 Dak Lak 17 304 3 774 5 285 519 977 4 037 2 575 136 67 Dak Nong 4 235 663 1 866 37 18 75 659 573 39 306 68 Lam Dong 19 512 2 578 7 146 100 103 599 2 332 3 748 49 2 809 47 70 Binh Phuoc 9 143 1 133 5 030 38 77 115 806 1 430 37 478 72 Tay Ninh 10 395 1 507 5 048 54 155 53 779 1 918 155 728 74 Binh Duong 85 900 12 370 51 434 455 227 1 100 4 546 5 503 10 266 75 Dong Nai 54 605 5 075 24 906 1 071 555 984 808 6 408 9 474 1 526 3 799 77 Ba Ria - Vung Tau 25 057 1 642 13 509 342 493 2 096 2 569 1 542 2 864 79 Ho Chi Minh City 371 927 33 747 174 826 4 647 5 448 1 125 9 785 27 143 57 614 10 721 46 870 80 Long An 9 868 1 061 5 200 53 162 67 52 645 2 009 53 565 82 Tien Giang 9 537 1 455 3 085 66 603 3 195 1 134 83 Ben Tre 5 458 645 1 664 46 240 1 824 1 040 84 Tra Vinh 10 297 945 4 849 37 36 488 2 406 1 536 86 Vinh Long 8 885 1 078 4 408 124 40 610 2 264 360 87 Dong Thap 13 674 1 321 6 472 167 232 820 3 624 113 925 89 An Giang 23 556 2 818 10 282 427 175 1 927 5 730 2 197 91 Kien Giang 23 796 3 427 10 322 64 664 1 696 6 351 1 273 92 Can Tho 38 120 4 892 18 821 172 336 1 599 2 238 6 485 117 3 460 93 Hau Giang 6 273 594 4 167 285 706 520 94 Soc Trang 18 293 1 819 9 026 635 63 58 1 237 2 742 2 712 95 Bac Lieu 9 515 641 4 590 30 125 28 553 2 198 53 1 296 96 Ca Mau 12 969 1 600 7 565 123 122 295 2 020 124 1 121

235
Table 14 (Continued) Unit: Person
By reason for not using contraception
Code Administrative unit
Total currently married
women aged 15-49, not
using contraception
Being pregnant
Want more
children
Lack of know-ledge
Oppo-sited by
relatives
Costly
Side effects after using
Weak health
Difficulty in
conception/ Menopau-
sal
Contra-ception is not
available
Others Not stated
RURAL 2 565 895 385 641 1 051 880 29 301 19 959 1 952 66 563 175 878 456 002 15 693 349 605 13 421
Socio-economic regions R1 Northern Midlands and Mountains 451 637 67 502 185 237 9 771 2 345 345 10 871 23 940 71 309 1 788 74 148 4 381 R2 Red River Delta 561 826 83 807 204 808 1 783 3 787 127 16 028 26 261 129 131 6 051 86 153 3 890 R3 North and South Central Coast 569 495 103 537 216 314 5 142 5 559 202 15 642 51 228 84 959 2 439 81 421 3 053 R4 Central Highlands 177 914 24 478 69 667 5 413 2 489 367 5 185 13 793 27 011 1 590 25 825 2 098 R5 Southeast 280 140 36 046 128 330 1 694 2 120 51 9 500 23 177 41 739 1 136 36 347 R6 Mekong River Delta 524 883 70 271 247 524 5 498 3 659 860 9 338 37 480 101 853 2 688 45 711
Provinces/cities 01 Ha Noi 163 689 23 414 63 335 1 476 5 658 6 169 42 039 1 837 19 031 729 02 Ha Giang 35 966 3 501 17 696 3 243 480 720 2 185 2 249 74 5 576 244 04 Cao Bang 14 184 2 353 6 607 225 65 307 621 1 636 121 2 119 131 06 Bac Kan 8 921 1 175 3 645 151 54 37 358 521 1 153 176 1 349 303 08 Tuyen Quang 30 046 4 481 10 551 150 1 239 2 100 5 557 196 5 670 100 10 Lao Cai 24 796 2 628 12 757 1 773 85 670 1 158 2 363 42 3 067 252 11 Dien Bien 23 993 4 052 13 700 278 193 33 66 363 2 507 31 2 592 177 12 Lai Chau 18 894 3 121 8 389 525 113 181 705 1 325 115 4 204 217 14 Son La 52 594 7 374 24 794 913 191 127 734 4 733 7 277 6 251 201 15 Yen Bai 30 608 4 229 14 113 1 422 526 51 946 1 282 3 467 253 3 943 376 17 Hoa Binh 23 311 5 427 9 533 52 213 633 2 982 4 153 317 19 Thai Nguyen 31 734 5 323 11 088 128 259 1 548 2 039 5 868 171 5 062 248 20 Lang Son 29 717 3 001 14 492 249 99 621 1 366 5 714 52 3 873 251 22 Quang Ninh 15 032 2 117 6 004 204 577 2 776 2 912 441 24 Bac Giang 69 828 12 029 20 444 484 97 1 736 4 304 14 504 290 14 826 1 113

236
Table 14 (Continued) Unit: Person
By reason for not using contraception
Code Administrative unit
Total currently married
women aged 15-49, not
using contraception
Being pregnant
Want more
children
Lack of know-ledge
Oppo-sited by
relatives
Costly
Side effects after using
Weak health
Difficulty in
conception/ Menopau-
sal
Contra-ception is not
available
Others Not stated
25 Phu Tho 57 044 8 809 17 425 178 281 1 533 1 929 14 707 265 11 464 453 26 Vinh Phuc 35 581 5 092 15 398 185 341 1 748 2 863 5 175 71 4 637 71 27 Bac Ninh 42 177 8 884 11 831 73 148 531 9 993 79 10 563 74 30 Hai Duong 59 203 4 101 22 751 251 254 127 2 592 4 701 13 838 256 9 092 1 241 31 Hai Phong 36 108 6 205 13 203 201 997 1 587 8 110 5 805 33 Hung Yen 44 377 6 229 15 939 74 246 799 2 294 11 726 161 6 443 465 34 Thai Binh 55 884 7 811 21 944 1 224 2 418 12 273 542 9 249 424 35 Ha Nam 23 584 2 584 9 695 417 1 484 2 112 3 063 214 3 859 156 36 Nam Dinh 54 511 11 199 15 232 923 777 939 1 222 12 795 2 891 8 533 37 Ninh Binh 31 680 6 170 9 476 73 74 438 1 788 7 343 6 029 289 38 Thanh Hoa 105 920 20 657 41 163 1 095 1 304 7 152 21 713 445 11 042 1 348 40 Nghe An 123 073 25 498 48 445 2 155 3 047 1 826 5 885 10 478 1 414 24 137 188 42 Ha Tinh 56 300 11 709 18 421 279 296 2 505 6 034 6 016 10 764 276 44 Quang Binh 27 640 3 762 11 227 318 170 55 603 3 044 3 190 108 5 163 45 Quang Tri 16 883 2 806 5 701 85 43 427 2 177 3 143 42 2 459 46 Thua Thien Hue 23 462 4 680 9 417 209 207 4 083 3 261 1 604 48 Da Nang 5 190 1 660 1 561 95 646 565 664 49 Quang Nam 47 364 7 282 14 017 565 198 4 101 4 496 9 135 98 6 988 484 51 Quang Ngai 36 815 5 364 15 150 83 169 90 1 685 3 710 6 209 250 3 846 260 52 Binh Dinh 35 628 6 505 14 548 223 1 216 4 462 3 782 4 675 215 54 Phu Yen 24 149 3 950 9 538 530 162 58 489 1 759 4 653 2 894 116 56 Khanh Hoa 26 377 3 562 11 622 335 160 582 1 929 5 111 82 2 829 165 58 Ninh Thuan 16 567 2 473 5 597 175 220 44 1 308 4 532 2 218 60 Binh Thuan 24 129 3 628 9 907 90 654 4 542 3 171 2 137

237
Table 14 (Continued) Unit: Person
By reason for not using contraception
Code Administrative unit
Total currently married
women aged 15-49, not
using contraception
Being pregnant
Want more
children
Lack of know-ledge
Oppo-sited by
relatives
Costly
Side effects after using
Weak health
Difficulty in
conception/ Menopau-
sal
Contra-ception is not
available
Others Not stated
62 Kon Tum 17 664 2 160 7 348 1 267 1 129 262 1 396 1 982 307 1 812 64 Gia Lai 50 915 6 513 20 084 2 136 582 1 771 3 319 5 336 534 9 588 1 053 66 Dak Lak 59 979 8 680 22 219 1 226 410 330 1 145 3 806 12 417 9 017 730 67 Dak Nong 21 437 3 096 8 922 177 72 37 692 2 353 2 926 555 2 388 219 68 Lam Dong 27 920 4 029 11 094 607 296 1 316 2 920 4 349 194 3 019 96 70 Binh Phuoc 29 520 4 275 12 050 534 467 1 792 3 027 4 234 122 3 019 72 Tay Ninh 37 193 3 864 16 415 266 270 281 3 689 8 779 136 3 493 74 Binh Duong 20 323 3 513 8 987 50 51 77 2 105 2 695 51 2 794 75 Dong Nai 96 029 12 606 38 124 844 1 285 5 316 10 797 14 942 643 11 473 77 Ba Ria - Vung Tau 20 507 1 859 9 318 98 586 2 262 3 684 185 2 515 79 Ho Chi Minh City 76 569 9 929 43 436 1 449 1 298 7 405 13 052 80 Long An 50 552 5 497 26 115 200 202 106 1 220 5 123 8 633 326 3 131 82 Tien Giang 48 582 10 518 22 116 123 237 2 330 8 520 227 4 512 83 Ben Tre 45 025 6 451 18 682 87 88 437 3 389 10 552 430 4 909 84 Tra Vinh 36 136 5 825 13 319 68 141 275 2 860 7 978 69 5 602 86 Vinh Long 34 633 3 564 16 098 285 218 150 1 353 2 997 8 696 149 1 125 87 Dong Thap 51 403 6 683 22 557 333 575 112 534 4 727 11 573 4 310 89 An Giang 55 564 7 624 24 526 310 981 1 010 2 861 13 306 545 4 401 91 Kien Giang 58 645 6 593 27 010 1 455 801 115 1 675 3 650 12 199 603 4 543 92 Can Tho 19 551 2 771 10 186 217 542 2 106 2 078 111 1 539 93 Hau Giang 19 691 2 130 12 162 142 44 189 1 181 3 066 778 94 Soc Trang 34 047 4 772 17 163 998 237 383 1 840 4 872 3 781 95 Bac Lieu 25 516 2 076 13 391 397 57 113 1 410 4 014 4 057 96 Ca Mau 45 538 5 766 24 199 1 102 239 1 607 3 008 6 365 228 3 024

238
Table 15
CURRENTLY MARRIED WOMEN AGED 15-49 BY INDUCED ABORTION AND MENSTRUAL REGULATION, URBAN/RURAL RESIDENCE,
SOCIO-ECONOMIC REGION AND PROVINCE/CITY, 1/4/2015
Unit: Person
Of which
Cod
e
Administrative unit Total currently married women
aged 15-49
Abortion and Menstrual regulation
No Abortion and Menstrual
regulation Not stated
ENTIRE COUNTRY 16 528 281 67 562 16 445 606 15 113
Socio-economic regions R1 Northern Midlands and Mountains 2 351 877 17 529 2 330 135 4 214
R2 Red River Delta 3 693 331 23 132 3 662 162 8 037 R3 North and South Central Coast 3 377 238 8 751 3 365 624 2 862
R4 Central Highlands 1 017 227 2 104 1 015 123 R5 Southeast 2 888 886 5 975 2 882 910 R6 Mekong River Delta 3 199 722 10 070 3 189 652
Provinces/cities 01 Ha Noi 1 269 117 9 109 1 255 873 4 135 02 Ha Giang 160 492 1 424 158 948 120 04 Cao Bang 104 973 350 104 477 146
06 Bac Kan 63 974 155 63 248 571 08 Tuyen Quang 151 983 2 106 149 748 129
10 Lao Cai 137 489 1 005 136 408 77 11 Dien Bien 107 953 1 831 106 090 31 12 Lai Chau 86 794 417 86 294 83
14 Son La 253 231 1 682 251 412 137 15 Yen Bai 159 413 1 094 158 102 217 17 Hoa Binh 168 239 1 420 166 678 141
19 Thai Nguyen 222 957 931 221 660 366 20 Lang Son 153 257 863 152 022 372 22 Quang Ninh 226 771 833 224 574 1 364
24 Bac Giang 325 194 1 655 322 225 1 314 25 Phu Tho 255 927 2 596 252 821 510 26 Vinh Phuc 200 503 934 199 497 73
27 Bac Ninh 219 817 1 735 218 007 76 30 Hai Duong 308 197 1 505 305 710 981 31 Hai Phong 342 299 4 048 337 997 253
33 Hung Yen 209 649 1 040 208 194 415 34 Thai Binh 297 083 1 121 295 753 209 35 Ha Nam 134 368 1 098 133 160 109
36 Nam Dinh 321 261 761 320 114 386 37 Ninh Binh 164 267 947 163 284 36 38 Thanh Hoa 644 054 4 673 636 519 2 862

239
Table 15 (Continued) Unit: Person
Of which
Cod
e
Administrative unit Total currently married women
aged 15-49
Abortion and Menstrual regulation
No Abortion and Menstrual
regulation Not stated
40 Nghe An 528 729 483 528 246
42 Ha Tinh 205 218 440 204 778
44 Quang Binh 142 488 305 142 182
45 Quang Tri 102 696 87 102 609
46 Thua Thien Hue 177 636 383 177 252
48 Da Nang 177 907 404 177 503
49 Quang Nam 242 980 100 242 881
51 Quang Ngai 208 586 260 208 326
52 Binh Dinh 263 222 289 262 933
54 Phu Yen 165 010 415 164 595
56 Khanh Hoa 201 757 457 201 300
58 Ninh Thuan 104 028 133 103 895
60 Binh Thuan 212 925 321 212 604
62 Kon Tum 86 021 202 85 818
64 Gia Lai 261 211 247 260 963
66 Dak Lak 335 186 880 334 306
67 Dak Nong 111 322 268 111 054
68 Lam Dong 223 488 507 222 981
70 Binh Phuoc 173 988 321 173 666
72 Tay Ninh 199 385 677 198 709
74 Binh Duong 418 401 994 417 407
75 Dong Nai 515 292 808 514 484
77 Ba Ria - Vung Tau 190 404 443 189 961
79 Ho Chi Minh City 1 391 416 2 733 1 388 683
80 Long An 278 122 754 277 368
82 Tien Giang 319 549 925 318 624
83 Ben Tre 228 327 999 227 328
84 Tra Vinh 190 552 373 190 179
86 Vinh Long 188 421 599 187 821
87 Dong Thap 311 689 1 256 310 433
89 An Giang 386 972 1 575 385 397
91 Kien Giang 323 656 1 225 322 431
92 Can Tho 223 249 912 222 337
93 Hau Giang 137 146 368 136 778
94 Soc Trang 227 700 270 227 430
95 Bac Lieu 154 411 215 154 196
96 Ca Mau 229 930 599 229 330

240
Table 15 (Continued) Unit: Person
Of which
Cod
e
Administrative unit Total currently married women
aged 15-49
Abortion and Menstrual regulation
No Abortion and Menstrual
regulation Not stated
URBAN 5 453 063 22 666 5 424 883 5 514
Socio-economic regions
R1 Northern Midlands and Mountains 402 708 3 602 398 439 666
R2 Red River Delta 1 232 771 9 171 1 219 230 4 369
R3 North and South Central Coast 952 172 2 436 949 258 478
R4 Central Highlands 296 319 776 295 543
R5 Southeast 1 795 720 4 067 1 791 653
R6 Mekong River Delta 773 374 2 613 770 760
Provinces/cities
01 Ha Noi 584 485 4 026 577 772 2 686
02 Ha Giang 24 452 627 23 825
04 Cao Bang 23 799 68 23 706 24
06 Bac Kan 10 132 12 10 078 42
08 Tuyen Quang 18 134 149 17 963 21
10 Lao Cai 31 131 274 30 780 77
11 Dien Bien 16 381 87 16 295
12 Lai Chau 15 766 159 15 607
14 Son La 32 464 387 32 077
15 Yen Bai 30 942 139 30 688 115
17 Hoa Binh 22 198 837 21 221 141
19 Thai Nguyen 69 555 186 69 252 117
20 Lang Son 28 666 71 28 570 25
22 Quang Ninh 138 798 182 137 839 777
24 Bac Giang 34 912 192 34 668 52
25 Phu Tho 44 175 414 43 710 52
26 Vinh Phuc 46 508 346 46 161
27 Bac Ninh 62 451 502 61 949
30 Hai Duong 70 530 624 69 581 325
31 Hai Phong 156 894 2 270 154 371 253
33 Hung Yen 27 841 266 27 489 87
34 Thai Binh 30 927 146 30 711 70
35 Ha Nam 20 923 428 20 438 57
36 Nam Dinh 59 231 150 59 004 77
37 Ninh Binh 34 183 232 33 915 36
38 Thanh Hoa 104 386 941 102 967 478
40 Nghe An 77 445 115 77 330

241
Table 15 (Continued) Unit: Person
Of which
Cod
e
Administrative unit Total currently married women
aged 15-49
Abortion and Menstrual regulation
No Abortion and Menstrual
regulation Not stated
42 Ha Tinh 37 207 78 37 129
44 Quang Binh 29 811 34 29 777
45 Quang Tri 32 201 45 32 156
46 Thua Thien Hue 86 895 168 86 727
48 Da Nang 155 778 305 155 473
49 Quang Nam 56 545 56 545
51 Quang Ngai 35 886 35 886
52 Binh Dinh 83 248 190 83 058
54 Phu Yen 46 305 173 46 131
56 Khanh Hoa 88 947 206 88 741
58 Ninh Thuan 37 647 45 37 603
60 Binh Thuan 79 871 136 79 736
62 Kon Tum 32 798 19 32 779
64 Gia Lai 78 795 157 78 639
66 Dak Lak 83 002 265 82 736
67 Dak Nong 17 784 129 17 655
68 Lam Dong 83 940 206 83 734
70 Binh Phuoc 36 829 40 36 789
72 Tay Ninh 39 056 39 056
74 Binh Duong 329 866 661 329 205
75 Dong Nai 179 999 583 179 416
77 Ba Ria - Vung Tau 99 398 51 99 347
79 Ho Chi Minh City 1 110 573 2 733 1 107 840
80 Long An 46 649 52 46 596
82 Tien Giang 48 174 132 48 042
83 Ben Tre 21 527 49 21 477
84 Tra Vinh 32 947 235 32 712
86 Vinh Long 30 038 242 29 796
87 Dong Thap 53 505 283 53 223
89 An Giang 111 824 618 111 206
91 Kien Giang 87 285 58 87 226
92 Can Tho 147 647 468 147 179
93 Hau Giang 34 565 272 34 294
94 Soc Trang 69 507 63 69 445
95 Bac Lieu 37 937 52 37 884
96 Ca Mau 51 769 88 51 680

242
Table 15 (Continued) Unit: Person
Of which
Cod
e
Administrative unit Total currently married women
aged 15-49
Abortion and Menstrual regulation
No Abortion and Menstrual
regulation Not stated
RURAL 11 075 217 44 896 11 020 723 9 599
Socio-economic regions
R1 Northern Midlands and Mountains 1 949 169 13 926 1 931 696 3 547
R2 Red River Delta 2 460 560 13 961 2 442 931 3 668
R3 North and South Central Coast 2 425 066 6 315 2 416 366 2 384
R4 Central Highlands 720 908 1 328 719 580
R5 Southeast 1 093 166 1 908 1 091 257
R6 Mekong River Delta 2 426 348 7 457 2 418 892
Provinces/cities
01 Ha Noi 684 632 5 083 678 100 1 448
02 Ha Giang 136 040 797 135 123 120
04 Cao Bang 81 174 282 80 771 122
06 Bac Kan 53 842 143 53 170 529
08 Tuyen Quang 133 850 1 957 131 785 108
10 Lao Cai 106 359 731 105 628
11 Dien Bien 91 571 1 744 89 796 31
12 Lai Chau 71 028 258 70 687 83
14 Son La 220 767 1 294 219 336 137
15 Yen Bai 128 472 955 127 415 102
17 Hoa Binh 146 040 583 145 457
19 Thai Nguyen 153 402 745 152 408 249
20 Lang Son 124 591 792 123 452 347
22 Quang Ninh 87 973 652 86 735 587
24 Bac Giang 290 282 1 463 287 558 1 262
25 Phu Tho 211 752 2 182 209 112 458
26 Vinh Phuc 153 995 587 153 336 73
27 Bac Ninh 157 366 1 232 156 058 76
30 Hai Duong 237 667 882 236 129 656
31 Hai Phong 185 404 1 779 183 626
33 Hung Yen 181 808 775 180 705 328
34 Thai Binh 266 156 976 265 042 139
35 Ha Nam 113 445 670 112 723 52
36 Nam Dinh 262 030 611 261 110 309
37 Ninh Binh 130 085 715 129 369
38 Thanh Hoa 539 669 3 732 533 552 2 384
40 Nghe An 451 284 368 450 916

243
Table 15 (Continued) Unit: Person
Of which
Cod
e
Administrative unit Total currently married women
aged 15-49
Abortion and Menstrual regulation
No Abortion and Menstrual
regulation Not stated
42 Ha Tinh 168 011 363 167 649
44 Quang Binh 112 677 271 112 406
45 Quang Tri 70 495 42 70 453
46 Thua Thien Hue 90 741 215 90 526
48 Da Nang 22 129 99 22 030
49 Quang Nam 186 436 100 186 336
51 Quang Ngai 172 700 260 172 440
52 Binh Dinh 179 974 99 179 875
54 Phu Yen 118 706 242 118 464
56 Khanh Hoa 112 810 251 112 559
58 Ninh Thuan 66 381 88 66 293
60 Binh Thuan 133 054 185 132 869
62 Kon Tum 53 222 183 53 039
64 Gia Lai 182 415 91 182 325
66 Dak Lak 252 184 615 251 570
67 Dak Nong 93 538 138 93 400
68 Lam Dong 139 548 301 139 247
70 Binh Phuoc 137 159 281 136 877
72 Tay Ninh 160 329 677 159 653
74 Binh Duong 88 535 333 88 202
75 Dong Nai 335 293 225 335 068
77 Ba Ria - Vung Tau 91 006 392 90 614
79 Ho Chi Minh City 280 843 280 843
80 Long An 231 473 701 230 772
82 Tien Giang 271 375 792 270 583
83 Ben Tre 206 800 950 205 851
84 Tra Vinh 157 604 138 157 467
86 Vinh Long 158 383 357 158 026
87 Dong Thap 258 184 974 257 210
89 An Giang 275 148 957 274 191
91 Kien Giang 236 371 1 166 235 204
92 Can Tho 75 602 444 75 158
93 Hau Giang 102 581 96 102 485
94 Soc Trang 158 192 207 157 985
95 Bac Lieu 116 474 163 116 311
96 Ca Mau 178 161 511 177 650

244
Table 16
NUMBER OF WOMEN AGED 15-49 HAVE GIVEN THE BIRTH DURING 24 MONTHS PRIOR TO THE SURVEY BY PREGNANCY CHECK, URBAN/RURAL RESIDENCE,
SOCIO-ECONOMIC REGION AND PROVINCE/CITY, 1/4/2015 Unit: Person
By pregnancy check status
Number of pregnancy check times
Cod
e
Administrative unit
Total women
aged 15-49 have given the birth
during 24 months
prior to the survey
Did not
check at the last
preg-nancy
1-2 times
3-4 times
5-6 times
7 times and over
Not stated
Not stated preg-nancy check
whether or not
ENTIRE COUNTRY 2 834 181 103 622 254 195 978 620 765 664 685 431 28 665 17 986
Socio-economic regions
R1 Northern Midlands and Mountains 461 505 54 922 70 432 174 893 95 307 59 103 2 389 4 459
R2 Red River Delta 662 618 5 872 29 726 174 346 209 089 227 143 5 773 10 667
R3 North and South Central Coast 627 846 12 152 68 501 299 182 162 276 76 195 6 880 2 662
R4 Central Highlands 182 502 10 761 35 649 82 996 36 993 13 137 2 835 131
R5 Southeast 461 647 9 526 22 335 85 740 128 621 208 598 6 758 68
R6 Mekong River Delta 438 063 10 388 27 550 161 462 133 378 101 254 4 030
Provinces/cities
01 Ha Noi 226 707 1 810 10 722 39 679 61 842 103 177 3 541 5 936
02 Ha Giang 35 150 10 503 9 857 9 253 3 031 1 968 346 192
04 Cao Bang 18 887 1 630 3 468 8 344 3 585 1 436 91 332
06 Bac Kan 10 994 516 1 988 4 976 2 014 865 185 450
08 Tuyen Quang 28 660 416 3 177 15 152 6 204 3 463 48 200
10 Lao Cai 25 183 5 763 5 122 7 894 2 616 3 498 68 221
11 Dien Bien 24 797 7 579 7 678 6 113 2 339 1 041 48
12 Lai Chau 20 378 5 881 5 415 5 818 1 540 1 498 202 24
14 Son La 51 902 15 108 14 665 14 705 4 668 2 169 266 320
15 Yen Bai 31 322 5 172 4 701 10 096 5 824 4 908 191 429
17 Hoa Binh 31 956 322 4 079 15 925 7 621 3 827 76 106
19 Thai Nguyen 40 945 579 1 673 17 542 10 524 10 262 365
20 Lang Son 25 676 597 2 948 12 449 5 757 3 126 75 724
22 Quang Ninh 38 694 578 3 461 14 786 10 367 9 056 445
24 Bac Giang 65 112 668 2 885 27 523 25 680 6 833 607 916
25 Phu Tho 50 540 188 2 774 19 102 13 902 14 209 186 179
26 Vinh Phuc 39 212 646 1 681 15 781 11 547 9 370 73 115
27 Bac Ninh 48 018 564 1 719 10 534 15 565 19 363 123 150
30 Hai Duong 50 251 1 041 3 697 15 422 12 648 14 409 638 2 396
31 Hai Phong 61 244 88 1 834 18 107 19 929 20 326 510 451
33 Hung Yen 39 198 286 762 9 743 14 942 12 593 208 665
34 Thai Binh 47 187 273 1 086 19 808 17 676 7 995 212 137
35 Ha Nam 24 123 111 1 427 8 035 8 775 5 143 260 373
36 Nam Dinh 58 608 252 2 094 14 898 27 035 14 328
37 Ninh Binh 29 376 223 1 245 7 552 8 763 11 383 210
38 Thanh Hoa 123 623 450 10 242 64 562 33 565 12 036 974 1 795

245
Table 16 (Continued) Unit: Person
By pregnancy check status
Number of pregnancy check times
Cod
e
Administrative unit
Total women
aged 15-49 have given the birth during 24 months
prior to the survey
Did not
check at the last preg-nancy
1-2 times
3-4 times
5-6 times
7 times and over
Not stated
Not stated preg-nancy check
whether or not
40 Nghe An 118 186 1 453 13 802 53 601 31 216 15 776 1 606 732
42 Ha Tinh 42 176 777 4 988 19 417 10 790 5 555 649
44 Quang Binh 29 690 269 5 908 18 771 3 574 962 115 91
45 Quang Tri 21 733 797 3 077 10 755 5 237 1 802 65
46 Thua Thien Hue 33 981 364 3 106 16 186 10 737 3 419 168
48 Da Nang 34 031 296 972 8 878 12 204 11 363 318
49 Quang Nam 42 396 2 147 5 144 22 595 8 553 3 075 881
51 Quang Ngai 31 429 981 3 913 15 527 7 711 2 834 464
52 Binh Dinh 41 465 1 491 2 252 20 753 12 299 4 141 529
54 Phu Yen 24 508 482 2 740 12 301 6 366 2 297 279 43
56 Khanh Hoa 32 119 1 045 2 622 9 870 10 061 8 308 213
58 Ninh Thuan 18 981 1 275 3 979 7 759 3 238 2 252 478
60 Binh Thuan 33 529 326 5 756 18 206 6 725 2 375 141
62 Kon Tum 18 545 1 887 4 531 7 527 2 911 1 379 311
64 Gia Lai 52 398 3 996 13 810 22 931 8 548 2 579 535
66 Dak Lak 56 945 3 005 9 726 26 585 12 593 3 918 986 131
67 Dak Nong 19 435 884 3 620 10 976 3 065 744 146
68 Lam Dong 35 179 989 3 962 14 977 9 877 4 518 856
70 Binh Phuoc 29 060 738 1 870 11 304 9 549 5 542 57
72 Tay Ninh 29 787 918 1 886 13 966 8 419 4 323 208 68
74 Binh Duong 72 218 2 624 1 715 9 562 21 719 35 831 767
75 Dong Nai 91 294 2 364 8 130 24 732 30 878 24 017 1 173
77 Ba Ria - Vung Tau 27 861 1 151 1 055 5 407 10 125 9 259 865
79 Ho Chi Minh City 211 426 1 732 7 679 20 770 47 931 129 627 3 688
80 Long An 35 533 1 176 1 870 11 559 12 391 8 095 441
82 Tien Giang 42 607 238 179 5 887 12 918 23 385
83 Ben Tre 27 905 906 1 448 8 789 8 368 7 733 661
84 Tra Vinh 28 138 454 1 801 11 324 9 619 4 872 67
86 Vinh Long 25 714 243 1 114 7 812 9 835 6 710
87 Dong Thap 38 564 1 168 2 630 15 916 11 559 6 585 706
89 An Giang 54 691 903 3 591 24 061 15 548 10 208 380
91 Kien Giang 49 317 875 3 038 22 111 15 965 7 203 125
92 Can Tho 35 170 105 871 7 086 13 180 13 614 314
93 Hau Giang 17 221 271 731 6 800 7 083 2 230 106
94 Soc Trang 31 915 2 261 4 137 12 099 6 273 6 640 506
95 Bac Lieu 20 010 905 2 298 11 710 3 464 1 291 343
96 Ca Mau 31 280 883 3 844 16 308 7 176 2 687 382

246
Table 16 (Continued) Unit: Person
By pregnancy check status
Number of pregnancy check times
Cod
e
Administrative unit
Total women
aged 15-49 have given the birth during 24 months
prior to the survey
Did not
check at the last preg-nancy
1-2 times
3-4 times
5-6 times
7 times and over
Not stated
Not stated preg-nancy check
whether or not
URBAN 888 388 13 422 38 476 202 820 252 373 365 484 9 733 6 080
Socio-economic regions
R1 Northern Midlands and Mountains 75 473 1 215 4 192 20 073 22 515 26 283 278 918
R2 Red River Delta 210 482 1 505 8 000 31 707 56 166 106 327 2 954 3 824
R3 North and South Central Coast 166 043 2 162 10 000 63 802 52 796 34 144 1 801 1 338
R4 Central Highlands 44 728 577 3 615 18 663 13 638 7 727 507
R5 Southeast 281 733 6 059 7 626 35 497 72 153 157 417 2 979
R6 Mekong River Delta 109 928 1 903 5 043 33 078 35 105 33 585 1 214
Provinces/cities
01 Ha Noi 100 197 765 5 282 7 283 22 604 59 112 2 457 2 693
02 Ha Giang 4 384 448 250 1 298 1 560 800 28
04 Cao Bang 4 483 24 217 1 654 1 806 729 52
06 Bac Kan 1 938 49 104 647 710 334 36 57
08 Tuyen Quang 3 205 23 99 845 1 544 694
10 Lao Cai 5 710 44 341 1 309 1 167 2 774 24 52
11 Dien Bien 3 048 27 294 618 1 259 833 16
12 Lai Chau 3 410 150 281 626 1 059 1 294
14 Son La 6 356 170 1 186 2 391 1 372 1 053 184
15 Yen Bai 5 747 28 659 827 1 195 2 952 29 58
17 Hoa Binh 3 869 91 1 118 1 281 1 355 24
19 Thai Nguyen 13 687 153 117 3 446 3 524 6 172 275
20 Lang Son 4 544 100 262 2 010 1 110 959 26 78
22 Quang Ninh 21 837 117 464 6 379 6 587 8 032 257
24 Bac Giang 5 778 190 1 301 3 029 1 001 123 134
25 Phu Tho 9 315 102 1 982 1 899 5 332
26 Vinh Phuc 8 603 197 461 3 196 3 040 1 668 40
27 Bac Ninh 12 722 88 564 2 588 4 044 5 392 46
30 Hai Duong 8 614 148 359 2 758 2 187 2 929 233
31 Hai Phong 29 130 88 412 3 909 8 088 15 849 334 451
33 Hung Yen 4 670 33 983 1 489 2 030 45 90
34 Thai Binh 4 082 1 377 1 706 927 72
35 Ha Nam 3 474 229 962 1 372 852 60
36 Nam Dinh 10 674 68 153 1 754 3 418 5 280
37 Ninh Binh 6 480 76 519 1 631 4 254
38 Thanh Hoa 21 240 981 6 414 8 255 4 375 321 895
40 Nghe An 17 817 871 8 913 4 449 3 096 125 364

247
Table 16 (Continued) Unit: Person
By pregnancy check status
Number of pregnancy check times
Cod
e
Administrative unit
Total women
aged 15-49 have given the birth during 24 months
prior to the survey
Did not
check at the last preg-nancy
1-2 times
3-4 times
5-6 times
7 times and over
Not stated
Not stated preg-nancy check
whether or not
42 Ha Tinh 7 104 51 367 2 383 3 186 1 118
44 Quang Binh 5 331 37 491 3 018 1 288 461 36
45 Quang Tri 6 557 157 845 2 795 1 995 744 22
46 Thua Thien Hue 16 238 227 1 234 7 991 5 060 1 629 98
48 Da Nang 29 482 200 883 6 850 10 517 10 983 48
49 Quang Nam 8 669 131 854 4 010 2 453 774 447
51 Quang Ngai 5 143 138 134 1 587 1 660 1 581 43
52 Binh Dinh 12 998 503 833 5 197 4 275 1 876 314
54 Phu Yen 5 789 121 566 2 193 1 774 931 159 43
56 Khanh Hoa 11 857 369 375 2 842 3 865 4 361 43
58 Ninh Thuan 6 442 92 583 2 655 1 746 1 232 134
60 Binh Thuan 11 376 136 984 6 954 2 274 982 47
62 Kon Tum 5 464 78 777 2 144 1 646 781 38
64 Gia Lai 12 468 292 1 223 5 791 3 298 1 693 171
66 Dak Lak 12 316 62 571 5 336 3 778 2 448 121
67 Dak Nong 3 046 39 192 1 778 812 187 37
68 Lam Dong 11 434 106 851 3 615 4 104 2 619 139
70 Binh Phuoc 5 975 71 270 1 710 1 791 2 133
72 Tay Ninh 5 450 246 101 2 350 1 981 770
74 Binh Duong 55 391 2 569 927 6 176 18 148 27 103 468
75 Dong Nai 29 969 1 064 2 184 5 968 11 060 9 172 521
77 Ba Ria - Vung Tau 13 324 378 473 2 447 4 911 4 928 187
79 Ho Chi Minh City 171 624 1 732 3 671 16 845 34 262 113 312 1 803
80 Long An 5 667 163 231 2 059 1 556 1 319 340
82 Tien Giang 6 723 66 405 1 456 4 796
83 Ben Tre 2 380 46 47 235 904 1 096 51
84 Tra Vinh 4 628 42 117 1 766 1 651 1 051
86 Vinh Long 3 909 41 41 1 228 1 431 1 167
87 Dong Thap 6 666 115 174 2 437 2 144 1 624 172
89 An Giang 15 321 162 496 5 550 4 109 4 919 85
91 Kien Giang 12 497 62 308 3 583 4 699 3 721 125
92 Can Tho 23 013 431 4 474 8 880 9 125 104
93 Hau Giang 4 719 124 146 1 575 1 779 1 037 58
94 Soc Trang 12 861 891 1 718 4 183 3 318 2 693 59
95 Bac Lieu 4 586 213 384 2 625 1 168 195
96 Ca Mau 6 958 45 884 2 957 2 010 842 220

248
Table 16 (Continued) Unit: Person
By pregnancy check status
Number of pregnancy check times
Cod
e
Administrative unit
Total women
aged 15-49 have given the birth during 24 months
prior to the survey
Did not
check at the last preg-nancy
1-2 times
3-4 times
5-6 times
7 times and over
Not stated
Not stated preg-nancy check
whether or not
RURAL 1 945 794 90 199 215 719 775 800 513 290 319 947 18 932 11 907
Socio-economic regions
R1 Northern Midlands and Mountains 386 032 53 707 66 240 154 821 72 792 32 820 2 111 3 541
R2 Red River Delta 452 136 4 367 21 726 142 639 152 923 120 817 2 819 6 843
R3 North and South Central Coast 461 803 9 990 58 501 235 380 109 479 42 051 5 078 1 324
R4 Central Highlands 137 774 10 184 32 034 64 333 23 355 5 410 2 328 131
R5 Southeast 179 914 3 467 14 709 50 243 56 468 51 181 3 779 68
R6 Mekong River Delta 328 135 8 485 22 508 128 384 98 273 67 669 2 816
Provinces/cities
01 Ha Noi 126 510 1 045 5 439 32 396 39 238 44 065 1 084 3 244
02 Ha Giang 30 766 10 055 9 607 7 955 1 471 1 167 346 164
04 Cao Bang 14 405 1 606 3 251 6 690 1 779 707 91 280
06 Bac Kan 9 057 467 1 884 4 329 1 303 531 149 393
08 Tuyen Quang 25 456 393 3 079 14 306 4 661 2 769 48 200
10 Lao Cai 19 473 5 720 4 782 6 585 1 450 724 44 169
11 Dien Bien 21 749 7 551 7 384 5 495 1 080 207 31
12 Lai Chau 16 968 5 731 5 134 5 192 481 204 202 24
14 Son La 45 546 14 938 13 479 12 314 3 296 1 116 266 136
15 Yen Bai 25 575 5 144 4 042 9 269 4 629 1 957 161 371
17 Hoa Binh 28 087 322 3 988 14 808 6 339 2 472 52 106
19 Thai Nguyen 27 259 426 1 556 14 096 7 000 4 090 90
20 Lang Son 21 132 497 2 687 10 439 4 647 2 167 49 646
22 Quang Ninh 16 857 461 2 997 8 407 3 781 1 023 188
24 Bac Giang 59 334 668 2 695 26 222 22 651 5 832 484 782
25 Phu Tho 41 226 188 2 672 17 120 12 003 8 878 186 179
26 Vinh Phuc 30 609 449 1 220 12 585 8 506 7 701 73 74
27 Bac Ninh 35 296 476 1 155 7 947 11 520 13 972 77 150
30 Hai Duong 41 637 893 3 338 12 663 10 461 11 480 638 2 163
31 Hai Phong 32 114 1 422 14 198 11 841 4 477 176
33 Hung Yen 34 529 253 762 8 759 13 454 10 563 163 575
34 Thai Binh 43 105 273 1 086 18 431 15 970 7 068 139 137
35 Ha Nam 20 649 111 1 198 7 074 7 403 4 291 260 313
36 Nam Dinh 47 933 184 1 941 13 144 23 617 9 048
37 Ninh Binh 22 896 223 1 169 7 034 7 133 7 129 210
38 Thanh Hoa 102 383 450 9 261 58 147 25 310 7 661 653 900
40 Nghe An 100 369 1 453 12 932 44 688 26 767 12 680 1 481 368

249
Table 16 (Continued) Unit: Person
By pregnancy check status
Number of pregnancy check times
Cod
e
Administrative unit
Total women
aged 15-49 have given the birth during 24 months
prior to the survey
Did not
check at the last preg-nancy
1-2 times
3-4 times
5-6 times
7 times and over
Not stated
Not stated preg-nancy check
whether or not
42 Ha Tinh 35 072 726 4 621 17 034 7 604 4 437 649
44 Quang Binh 24 359 232 5 417 15 753 2 286 501 115 55
45 Quang Tri 15 177 640 2 232 7 960 3 243 1 058 43
46 Thua Thien Hue 17 743 137 1 872 8 195 5 676 1 791 71
48 Da Nang 4 549 96 89 2 029 1 687 379 269
49 Quang Nam 33 727 2 016 4 290 18 586 6 100 2 301 435
51 Quang Ngai 26 286 843 3 779 13 939 6 051 1 252 421
52 Binh Dinh 28 467 988 1 419 15 556 8 024 2 265 215
54 Phu Yen 18 719 360 2 174 10 108 4 592 1 365 119
56 Khanh Hoa 20 262 676 2 247 7 028 6 196 3 947 169
58 Ninh Thuan 12 539 1 183 3 396 5 104 1 492 1 020 344
60 Binh Thuan 22 153 191 4 772 11 252 4 452 1 393 93
62 Kon Tum 13 081 1 809 3 754 5 383 1 264 598 272
64 Gia Lai 39 930 3 703 12 587 17 140 5 250 886 364
66 Dak Lak 44 629 2 943 9 155 21 249 8 815 1 470 866 131
67 Dak Nong 16 389 845 3 428 9 198 2 253 557 109
68 Lam Dong 23 745 883 3 111 11 363 5 772 1 899 717
70 Binh Phuoc 23 085 667 1 600 9 593 7 759 3 409 57
72 Tay Ninh 24 337 672 1 784 11 615 6 437 3 553 208 68
74 Binh Duong 16 827 55 788 3 385 3 571 8 728 299
75 Dong Nai 61 325 1 301 5 947 18 763 19 818 14 844 652
77 Ba Ria - Vung Tau 14 538 773 581 2 961 5 214 4 331 678
79 Ho Chi Minh City 39 803 4 008 3 925 13 669 16 315 1 885
80 Long An 29 865 1 014 1 639 9 500 10 834 6 776 101
82 Tien Giang 35 883 238 112 5 482 11 462 18 589
83 Ben Tre 25 526 859 1 402 8 553 7 465 6 637 609
84 Tra Vinh 23 510 412 1 684 9 558 7 968 3 822 67
86 Vinh Long 21 804 202 1 072 6 583 8 404 5 543
87 Dong Thap 31 897 1 053 2 456 13 479 9 415 4 960 534
89 An Giang 39 370 741 3 095 18 511 11 439 5 289 295
91 Kien Giang 36 820 813 2 730 18 528 11 266 3 482
92 Can Tho 12 157 105 440 2 612 4 300 4 490 210
93 Hau Giang 12 501 147 585 5 226 5 304 1 193 48
94 Soc Trang 19 054 1 370 2 419 7 916 2 956 3 947 447
95 Bac Lieu 15 425 693 1 913 9 085 2 296 1 095 343
96 Ca Mau 24 322 838 2 959 13 351 5 166 1 846 162

250
Table 17
NUMBER OF CHILDREN EVER BORN, NUMBER OF CHILDREN SURVIVING, NUMBER OF CHILDREN DIED OF WOMEN AGED 15-49 BY URBAN/RURAL RESIDENCE, SOCIO-ECONOMIC REGION AND PROVINCE/CITY, 1/4/2015
Unit: Person
Number of children ever born Number of children surviving Number of children died
Cod
e
Administrative unit Total Urban Rural Total Urban Rural Total Urban Rural
ENTIRE COUNTRY 33 546 421 9 941 222 23 605 199 33 116 738 9 878 701 23 238 037 429 683 62 520 367 163
Socio-economic regions
R1 Northern Midlands and Mountains 4 921 559 739 011 4 182 548 4 822 377 731 025 4 091 352 99 182 7 986 91 196
R2 Red River Delta 7 452 635 2 287 570 5 165 065 7 387 117 2 277 805 5 109 311 65 519 9 765 55 754
R3 North and South Central Coast 7 519 254 1 929 843 5 589 411 7 399 244 1 912 206 5 487 038 120 010 17 637 102 373
R4 Central Highlands 2 464 367 627 736 1 836 632 2 418 067 621 084 1 796 983 46 301 6 652 39 649
R5 Southeast 5 184 224 2 983 023 2 201 201 5 155 946 2 974 605 2 181 341 28 278 8 418 19 860
R6 Mekong River Delta 6 004 381 1 374 039 4 630 343 5 933 988 1 361 976 4 572 012 70 393 12 062 58 331
Provinces/cities
01 Ha Noi 2 472 761 1 050 247 1 422 514 2 457 080 1 047 730 1 409 350 15 681 2 517 13 165
02 Ha Giang 370 256 45 978 324 278 361 152 45 069 316 083 9 104 909 8 195
04 Cao Bang 207 932 41 677 166 256 203 156 40 714 162 442 4 776 962 3 814
06 Bac Kan 118 394 17 970 100 424 116 641 17 863 98 778 1 753 107 1 646
08 Tuyen Quang 311 387 32 280 279 107 304 853 32 165 272 688 6 534 115 6 419
10 Lao Cai 300 187 57 923 242 263 294 953 57 267 237 686 5 233 656 4 577
11 Dien Bien 262 821 30 651 232 170 255 432 30 315 225 117 7 390 337 7 053
12 Lai Chau 220 818 31 208 189 610 211 068 30 613 180 455 9 750 595 9 155
14 Son La 568 467 61 180 507 286 550 211 60 169 490 042 18 256 1 011 17 245
15 Yen Bai 337 675 55 339 282 336 330 482 54 849 275 634 7 193 491 6 702
17 Hoa Binh 326 353 40 222 286 132 320 060 39 825 280 235 6 293 396 5 897
19 Thai Nguyen 430 490 124 967 305 524 424 566 123 986 300 580 5 924 981 4 943
20 Lang Son 286 713 51 167 235 546 282 786 50 716 232 070 3 927 451 3 476
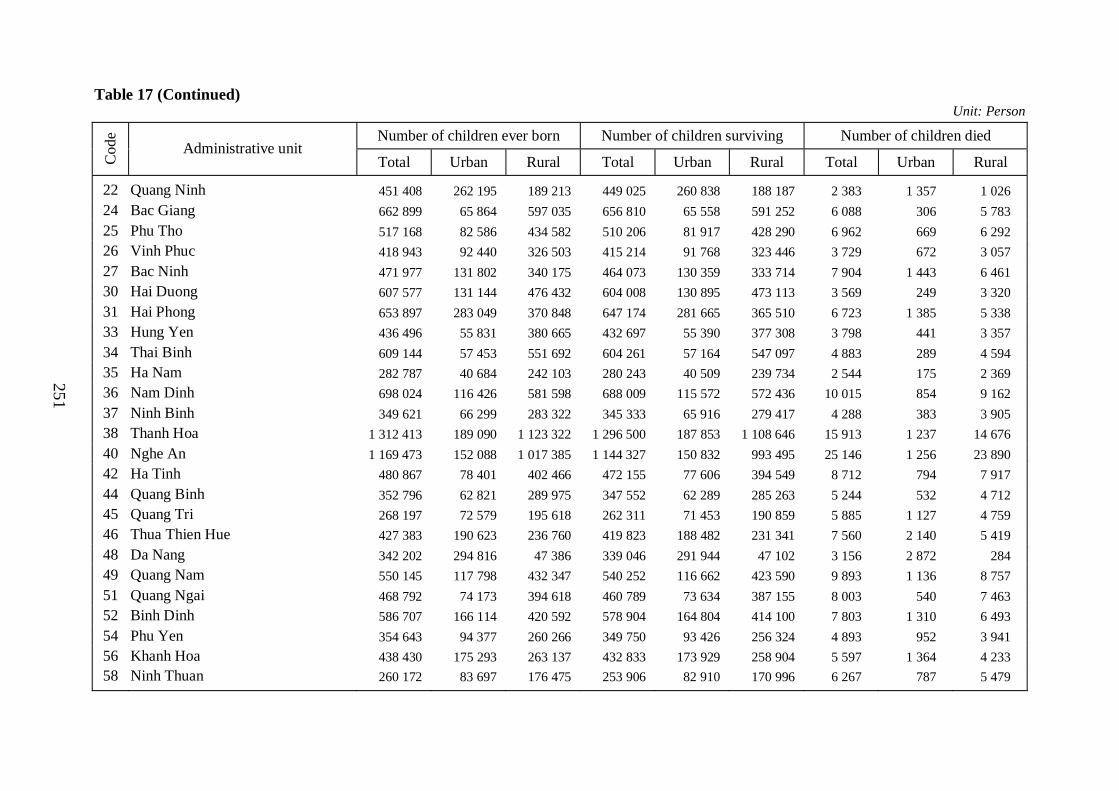
251
Table 17 (Continued) Unit: Person
Number of children ever born Number of children surviving Number of children died
Cod
e
Administrative unit Total Urban Rural Total Urban Rural Total Urban Rural
22 Quang Ninh 451 408 262 195 189 213 449 025 260 838 188 187 2 383 1 357 1 026
24 Bac Giang 662 899 65 864 597 035 656 810 65 558 591 252 6 088 306 5 783
25 Phu Tho 517 168 82 586 434 582 510 206 81 917 428 290 6 962 669 6 292
26 Vinh Phuc 418 943 92 440 326 503 415 214 91 768 323 446 3 729 672 3 057
27 Bac Ninh 471 977 131 802 340 175 464 073 130 359 333 714 7 904 1 443 6 461
30 Hai Duong 607 577 131 144 476 432 604 008 130 895 473 113 3 569 249 3 320
31 Hai Phong 653 897 283 049 370 848 647 174 281 665 365 510 6 723 1 385 5 338
33 Hung Yen 436 496 55 831 380 665 432 697 55 390 377 308 3 798 441 3 357
34 Thai Binh 609 144 57 453 551 692 604 261 57 164 547 097 4 883 289 4 594
35 Ha Nam 282 787 40 684 242 103 280 243 40 509 239 734 2 544 175 2 369
36 Nam Dinh 698 024 116 426 581 598 688 009 115 572 572 436 10 015 854 9 162
37 Ninh Binh 349 621 66 299 283 322 345 333 65 916 279 417 4 288 383 3 905
38 Thanh Hoa 1 312 413 189 090 1 123 322 1 296 500 187 853 1 108 646 15 913 1 237 14 676
40 Nghe An 1 169 473 152 088 1 017 385 1 144 327 150 832 993 495 25 146 1 256 23 890
42 Ha Tinh 480 867 78 401 402 466 472 155 77 606 394 549 8 712 794 7 917
44 Quang Binh 352 796 62 821 289 975 347 552 62 289 285 263 5 244 532 4 712
45 Quang Tri 268 197 72 579 195 618 262 311 71 453 190 859 5 885 1 127 4 759
46 Thua Thien Hue 427 383 190 623 236 760 419 823 188 482 231 341 7 560 2 140 5 419
48 Da Nang 342 202 294 816 47 386 339 046 291 944 47 102 3 156 2 872 284
49 Quang Nam 550 145 117 798 432 347 540 252 116 662 423 590 9 893 1 136 8 757
51 Quang Ngai 468 792 74 173 394 618 460 789 73 634 387 155 8 003 540 7 463
52 Binh Dinh 586 707 166 114 420 592 578 904 164 804 414 100 7 803 1 310 6 493
54 Phu Yen 354 643 94 377 260 266 349 750 93 426 256 324 4 893 952 3 941
56 Khanh Hoa 438 430 175 293 263 137 432 833 173 929 258 904 5 597 1 364 4 233
58 Ninh Thuan 260 172 83 697 176 475 253 906 82 910 170 996 6 267 787 5 479

252
Table 17 (Continued) Unit: Person
Number of children ever born Number of children surviving Number of children died
Cod
e
Administrative unit Total Urban Rural Total Urban Rural Total Urban Rural
60 Binh Thuan 507 035 177 972 329 063 501 096 176 382 324 714 5 940 1 590 4 349
62 Kon Tum 224 098 68 454 155 644 217 738 67 227 150 510 6 361 1 227 5 134
64 Gia Lai 647 179 170 859 476 320 633 756 169 218 464 537 13 423 1 641 11 782
66 Dak Lak 801 502 178 184 623 318 787 060 176 315 610 745 14 441 1 869 12 572
67 Dak Nong 273 257 36 628 236 629 268 920 36 077 232 843 4 337 551 3 786
68 Lam Dong 518 332 173 610 344 722 510 593 172 246 338 347 7 739 1 364 6 375
70 Binh Phuoc 386 575 77 586 308 988 381 993 76 837 305 156 4 582 750 3 832
72 Tay Ninh 392 710 74 784 317 926 388 559 74 275 314 284 4 151 509 3 642
74 Binh Duong 680 651 504 065 176 586 677 096 502 462 174 634 3 555 1 603 1 952
75 Dong Nai 1 050 024 340 339 709 685 1 042 485 338 425 704 060 7 538 1 914 5 625
77 Ba Ria - Vung Tau 389 985 186 289 203 696 386 631 184 981 201 650 3 354 1 308 2 046
79 Ho Chi Minh City 2 284 280 1 799 960 484 320 2 279 181 1 797 624 481 557 5 098 2 335 2 763
80 Long An 512 923 78 182 434 741 508 391 77 491 430 900 4 532 691 3 841
82 Tien Giang 593 563 86 873 506 690 585 530 85 670 499 860 8 033 1 203 6 830
83 Ben Tre 410 074 35 682 374 392 405 764 35 451 370 313 4 310 231 4 079
84 Tra Vinh 346 330 54 610 291 720 341 856 54 349 287 507 4 474 261 4 213
86 Vinh Long 332 633 50 511 282 123 329 327 50 107 279 221 3 306 404 2 902
87 Dong Thap 578 267 90 448 487 818 571 719 89 941 481 778 6 548 507 6 040
89 An Giang 731 404 203 126 528 278 721 802 200 976 520 826 9 601 2 150 7 451
91 Kien Giang 658 715 167 015 491 700 645 798 164 317 481 481 12 917 2 697 10 219
92 Can Tho 401 764 253 753 148 011 398 200 251 621 146 579 3 564 2 132 1 432
93 Hau Giang 257 506 59 712 197 794 255 142 59 350 195 792 2 365 362 2 003
94 Soc Trang 441 424 130 725 310 699 436 554 130 072 306 482 4 870 653 4 217
95 Bac Lieu 300 898 70 167 230 731 299 168 69 825 229 344 1 730 343 1 387
96 Ca Mau 438 880 93 235 345 645 434 737 92 808 341 929 4 143 428 3 716

253
Table 18
NUMBER OF WOMEN AGED 15-49 BY NUMBER OF CHILDREN EVER BORN, AGE OF MOTHER, URBAN/RURAL RESIDENCE, SOCIO-ECONOMIC REGION
AND PROVINCE/CITY, 1/4/2015 Unit: Person
Number of women aged 15-49 by children ever born Administrative unit/age group
of mother
Number of women aged 15-49 have
given the birth 1 child
2 children
3 children
4 children
5 children and over
Not stated
Number of children ever born
ENTIRE COUNTRY
Total 16 629 100 4 693 497 8 388 271 2 572 054 682 084 291 829 1 365 33 546 421
15-19 168 472 151 964 15 581 701 227 186 135
20-24 1 271 219 934 873 310 251 23 785 2 153 156 1 636 142
25-29 2 665 227 1 334 004 1 153 630 154 574 18 752 4 267 4 202 488
30-34 3 346 600 956 103 1 889 731 409 059 70 769 20 937 6 357 835
35-39 3 217 195 538 811 1 909 838 586 225 134 789 47 450 83 6 917 810
40-44 3 140 560 427 210 1 750 100 686 968 191 022 84 863 399 7 232 298
45-49 2 819 827 350 532 1 359 140 710 743 264 372 134 156 883 7 013 714
URBAN
Total 5 457 123 1 876 331 2 868 711 567 407 110 456 34 072 146 9 941 222
15-19 27 302 25 454 1 631 68 149 29 515
20-24 287 662 235 803 48 311 3 263 229 57 343 413
25-29 823 958 517 252 281 915 22 321 2 252 217 1 158 153
30-34 1 170 063 454 684 626 704 78 353 8 814 1 508 1 986 291
35-39 1 110 197 265 053 692 185 126 481 20 485 5 993 2 142 155
40-44 1 073 794 203 162 660 207 168 409 32 122 9 895 2 211 530
45-49 964 147 174 922 557 758 168 512 46 406 16 403 146 2 070 166
RURAL
Total 11 171 976 2 817 166 5 519 560 2 004 648 571 627 257 756 1 219 23 605 199
15-19 141 170 126 510 13 950 633 78 156 620
20-24 983 556 699 070 261 940 20 522 1 924 100 1 292 729
25-29 1 841 270 816 752 871 715 132 253 16 500 4 050 3 044 335
30-34 2 176 537 501 419 1 263 027 330 706 61 955 19 429 4 371 544
35-39 2 106 998 273 758 1 217 653 459 744 114 304 41 457 83 4 775 656
40-44 2 066 766 224 048 1 089 893 518 559 158 900 74 968 399 5 020 769
45-49 1 855 680 175 610 801 382 542 231 217 966 117 753 738 4 943 548
R1. Northern Midlands and Mountains Total 2 374 622 597 719 1 273 577 337 096 104 713 60 819 697 4 921 559
15-19 49 660 41 383 7 718 520 39 58 535
20-24 274 532 172 926 89 701 10 007 1 798 100 390 056
25-29 428 324 173 714 210 245 32 974 8 896 2 495 742 032
30-34 461 594 93 254 288 781 55 513 15 535 8 511 946 014
35-39 417 750 47 621 265 857 71 255 20 284 12 652 83 946 241
40-44 392 888 38 575 238 381 77 427 23 216 15 109 180 928 385
45-49 349 874 30 246 172 894 89 400 34 946 21 953 435 910 297

254
Table 18 (Continued)
Unit: Person
Number of women aged 15-49 by children ever born Administrative unit/age group
of mother
Number of women aged 15-49 have
given the birth 1 child
2 children
3 children
4 children
5 children and over
Not stated
Number of children ever born
R2. Red River Delta Total 3 715 029 824 392 2 187 122 583 994 98 877 19 977 668 7 452 635
15-19 20 056 18 742 1 230 83 21 452
20-24 256 558 188 068 66 285 2 104 101 327 354
25-29 630 424 271 727 316 233 40 753 1 664 47 1 033 344
30-34 773 708 148 180 503 067 112 009 10 330 121 1 532 343
35-39 703 548 75 561 464 963 135 238 25 158 2 627 1 525 320
40-44 725 292 66 209 472 846 150 085 28 759 7 173 219 1 615 999
45-49 605 444 55 904 362 496 143 721 32 865 10 009 448 1 396 824
R3. North and South Central Coast Total 3 433 085 829 336 1 583 280 699 698 226 062 94 710 7 519 254
15-19 31 426 28 993 2 285 149 34 158
20-24 258 254 195 205 58 755 4 136 158 325 755
25-29 511 658 262 632 214 352 31 248 2 913 513 799 422
30-34 635 401 150 923 364 582 97 274 17 796 4 825 1 267 970
35-39 660 069 77 069 364 618 163 207 41 560 13 614 1 536 767
40-44 697 839 61 269 330 961 202 760 72 322 30 527 1 789 972
45-49 638 438 53 245 247 728 201 073 91 162 45 231 1 765 210
R4. Central Highlands
Total 1 031 937 224 104 439 985 223 814 85 091 58 942 2 464 367
15-19 16 860 15 725 998 98 39 18 169
20-24 95 704 67 250 26 118 2 300 37 126 533
25-29 162 163 65 497 75 859 17 651 2 490 666 283 493
30-34 208 853 37 739 108 823 43 293 13 595 5 403 468 756
35-39 204 767 16 613 99 872 56 663 20 651 10 969 531 351
40-44 179 945 11 416 75 244 54 671 21 035 17 580 514 483
45-49 163 644 9 863 53 071 49 139 27 246 24 324 521 582
R5. Southeast Total 2 874 827 1 114 622 1 344 361 317 339 74 550 23 955 5 184 224
15-19 19 855 18 314 1 541 21 396
20-24 162 275 134 256 25 646 2 313 60 192 726
25-29 446 469 281 701 150 101 13 087 1 363 217 627 701
30-34 646 206 293 470 302 919 43 388 5 650 780 1 056 137
35-39 584 573 166 664 326 447 74 433 12 765 4 265 1 115 631
40-44 531 806 122 104 292 748 90 466 20 484 6 005 1 093 980
45-49 483 643 98 113 244 959 93 653 34 229 12 689 1 076 654

255
Table 18 (Continued)
Unit: Person
Number of women aged 15-49 by children ever born Administrative unit/age group
of mother
Number of women aged 15-49 have
given the birth 1 child
2 children
3 children
4 children
5 children and over
Not stated
Number of children ever born
R6. Mekong River Delta Total 3 199 599 1 103 324 1 559 947 410 114 92 790 33 425 6 004 381
15-19 30 615 28 806 1 809 32 425
20-24 223 896 177 168 43 746 2 925 57 273 719
25-29 486 190 278 734 186 840 18 862 1 425 329 716 496
30-34 620 838 232 537 321 558 57 582 7 864 1 297 1 086 615
35-39 646 487 155 282 388 081 85 429 14 371 3 324 1 262 500
40-44 612 789 127 636 339 920 111 559 25 207 8 468 1 289 479
45-49 578 783 103 160 277 992 133 757 43 924 19 950 1 343 148
01. Ha Noi Total 1 271 292 310 193 758 951 169 954 26 347 5 528 319 2 472 761
15-19 4 789 4 434 355 5 145
20-24 75 862 59 494 16 012 355 92 585
25-29 226 180 104 197 107 314 14 331 337 363 168
30-34 281 060 64 606 178 422 34 713 3 319 538 866
35-39 253 466 32 086 170 777 40 651 9 181 772 536 173
40-44 241 487 24 214 165 381 43 827 6 050 2 015 522 143
45-49 188 448 21 162 120 689 36 076 7 461 2 742 319 414 680
02. Ha Giang Total 156 717 35 022 71 280 27 916 12 355 10 145 370 256
15-19 5 075 4 006 868 162 39 6 385
20-24 22 431 11 077 9 497 1 458 399 36 041
25-29 32 060 10 332 13 795 5 234 2 418 281 64 861
30-34 28 619 4 278 14 451 5 291 2 392 2 208 70 889
35-39 24 472 2 217 12 096 5 332 2 426 2 401 65 994
40-44 23 965 1 689 12 347 5 140 1 940 2 850 66 473
45-49 20 095 1 422 8 227 5 299 2 741 2 405 59 615
04. Cao Bang Total 104 368 34 914 49 039 12 430 4 617 3 345 22 207 932
15-19 2 540 2 187 320 32 2 924
20-24 12 668 8 535 3 508 625 17 425
25-29 18 233 9 443 6 780 1 731 248 31 29 342
30-34 19 207 6 754 9 233 1 829 1 021 371 36 846
35-39 18 232 3 798 10 382 2 387 1 041 624 39 352
40-44 17 003 2 555 10 053 2 645 969 780 39 029
45-49 16 485 1 642 8 763 3 180 1 339 1 539 22 43 014

256
Table 18 (Continued)
Unit: Person
Number of women aged 15-49 by children ever born Administrative unit/age group
of mother
Number of women aged 15-49 have
given the birth 1 child
2 children
3 children
4 children
5 children and over
Not stated
Number of children ever born
06. Bac Kan
Total 65 069 22 485 34 501 6 156 1 359 569 118 394
15-19 1 102 1 031 71 1 174
20-24 7 060 5 257 1 661 124 18 9 058
25-29 10 912 6 420 3 895 415 134 48 16 244
30-34 12 010 4 393 6 775 618 128 97 20 849
35-39 12 457 2 644 8 504 1 051 150 108 23 965
40-44 11 482 1 462 7 737 1 860 287 137 24 381
45-49 10 047 1 278 5 858 2 089 660 162 22 723
08. Tuyen Quang
Total 155 760 40 313 86 314 21 216 5 404 2 512 311 387
15-19 3 684 3 163 521 4 205
20-24 17 178 11 609 5 371 147 50 22 995
25-29 28 326 10 896 15 594 1 679 158 47 751
30-34 29 460 6 937 18 730 3 148 490 155 56 578
35-39 29 680 2 658 20 452 4 782 1 291 498 65 713
40-44 24 919 2 263 14 980 5 768 1 316 592 57 904
45-49 22 512 2 788 10 668 5 691 2 099 1 267 56 240
10. Lao Cai
Total 135 934 31 816 66 066 23 281 9 706 5 064 300 187
15-19 3 405 2 736 669 4 074
20-24 18 243 10 308 6 895 997 43 27 262
25-29 23 960 8 835 11 578 2 583 729 235 43 832
30-34 27 705 4 759 15 641 4 667 1 950 686 61 402
35-39 22 184 1 975 12 946 4 550 1 750 963 53 582
40-44 21 037 1 731 10 338 5 022 2 364 1 582 55 904
45-49 19 399 1 471 7 999 5 462 2 869 1 599 54 130
11. Dien Bien
Total 108 899 24 703 47 717 19 034 8 783 8 661 262 821
15-19 4 360 3 396 898 65 5 387
20-24 15 969 7 752 6 008 1 821 328 61 26 844
25-29 21 343 6 591 9 603 3 012 1 641 497 43 971
30-34 21 504 3 269 11 778 3 307 1 400 1 750 52 114
35-39 18 901 1 661 9 362 4 446 1 961 1 471 50 182
40-44 15 493 1 190 6 547 3 275 1 819 2 662 47 469
45-49 11 329 844 3 520 3 108 1 634 2 222 36 853

257
Table 18 (Continued)
Unit: Person
Number of women aged 15-49 by children ever born Administrative unit/age group
of mother
Number of women aged 15-49 have
given the birth 1 child
2 children
3 children
4 children
5 children and over
Not stated
Number of children ever born
12. Lai Chau
Total 86 378 16 703 35 794 16 523 9 535 7 822 220 818
15-19 4 024 3 178 823 23 4 892
20-24 13 408 5 981 6 019 1 088 299 21 22 584
25-29 17 882 4 273 9 574 2 915 704 416 37 264
30-34 16 518 1 719 7 932 3 759 1 887 1 222 43 246
35-39 13 329 825 5 187 3 307 2 111 1 899 40 204
40-44 11 544 472 3 981 3 022 2 148 1 920 37 432
45-49 9 673 255 2 278 2 410 2 387 2 344 35 195
14. Son La
Total 253 839 56 965 126 164 42 605 16 943 11 163 568 467
15-19 10 783 8 536 2 065 183 13 213
20-24 38 232 19 039 16 315 2 362 516 60 821
25-29 48 967 13 188 26 634 6 690 1 710 745 97 366
30-34 48 672 7 876 28 263 8 278 3 005 1 249 107 841
35-39 41 854 3 208 23 776 9 055 2 971 2 844 106 209
40-44 35 748 3 758 17 725 8 682 3 421 2 162 91 068
45-49 29 583 1 361 11 386 7 354 5 319 4 163 91 949
15. Yen Bai
Total 161 652 41 474 87 127 20 932 6 755 5 258 106 337 675
15-19 3 773 3 085 632 56 4 517
20-24 17 605 11 242 5 781 475 107 24 657
25-29 30 791 13 077 14 466 2 500 592 156 52 763
30-34 31 316 6 639 20 005 2 939 1 205 528 63 191
35-39 27 772 3 490 18 524 3 694 1 072 993 62 294
40-44 24 401 2 147 15 195 4 456 1 341 1 262 59 235
45-49 25 992 1 794 12 524 6 813 2 437 2 319 106 71 018
17. Hoa Binh
Total 172 104 47 014 100 773 20 088 3 339 793 97 326 353
15-19 2 973 2 841 132 3 105
20-24 18 610 13 735 4 661 214 23 700
25-29 29 812 13 388 15 602 768 54 47 110
30-34 33 610 7 704 22 525 3 118 157 105 63 264
35-39 31 020 3 842 22 186 4 089 690 214 64 310
40-44 29 655 3 194 20 887 4 693 725 157 62 833
45-49 26 423 2 311 14 780 7 206 1 713 316 97 62 031

258
Table 18 (Continued)
Unit: Person
Number of women aged 15-49 by children ever born Administrative unit/age group
of mother
Number of women aged 15-49 have
given the birth 1 child
2 children
3 children
4 children
5 children and over
Not stated
Number of children ever born
19. Thai Nguyen
Total 230 268 64 514 137 598 22 504 4 247 1 154 251 430 490
15-19 1 482 1 401 81 1 562
20-24 20 247 16 015 4 093 83 55 24 673
25-29 37 906 19 111 17 826 883 86 57 842
30-34 43 709 10 253 30 659 2 627 170 80 134
35-39 44 182 6 439 31 822 5 120 719 83 88 317
40-44 43 370 6 010 30 840 5 234 1 036 167 83 88 374
45-49 39 371 5 284 22 278 8 557 2 266 901 86 89 590
20. Lang Son
Total 153 621 50 804 79 574 17 301 4 753 1 140 49 286 713
15-19 2 324 2 076 248 2 572
20-24 13 671 10 956 2 715 16 387
25-29 26 951 15 491 10 586 823 51 39 334
30-34 30 043 9 834 17 714 2 220 275 53 021
35-39 27 980 5 693 17 681 3 714 766 125 55 888
40-44 28 373 3 895 17 643 5 319 1 316 200 61 405
45-49 24 278 2 858 12 986 5 226 2 345 814 49 58 107
22. Quang Ninh
Total 232 217 56 457 139 417 29 373 6 202 629 140 451 408
15-19 2 186 1 934 252 2 437
20-24 17 236 12 301 4 486 348 101 22 722
25-29 36 539 17 842 16 478 2 017 201 57 653
30-34 45 323 10 137 29 944 4 650 592 86 343
35-39 41 216 6 097 28 277 5 701 1 045 96 84 416
40-44 48 487 4 228 33 754 8 662 1 652 101 91 104 834
45-49 41 230 3 918 26 227 7 993 2 612 432 49 93 004
24. Bac Giang
Total 327 939 70 924 193 799 50 462 10 781 1 877 97 662 899
15-19 1 867 1 568 298 2 165
20-24 35 484 24 621 10 574 289 46 635
25-29 55 213 22 969 30 075 1 974 194 89 817
30-34 62 909 8 935 44 708 8 587 680 126 831
35-39 61 585 4 268 42 610 12 042 2 340 324 136 697
40-44 59 638 4 560 39 187 12 736 2 862 196 97 133 765
45-49 51 243 4 003 26 345 14 834 4 705 1 356 126 988

259
Table 18 (Continued)
Unit: Person
Number of women aged 15-49 by children ever born Administrative unit/age group
of mother
Number of women aged 15-49 have
given the birth 1 child
2 children
3 children
4 children
5 children and over
Not stated
Number of children ever born
25. Phu Tho
Total 262 074 60 068 157 830 36 648 6 137 1 317 75 517 168
15-19 2 268 2 177 91 2 359
20-24 23 724 16 798 6 602 324 30 973
25-29 45 968 19 699 24 236 1 767 266 74 535
30-34 56 311 9 905 40 368 5 123 774 140 109 809
35-39 44 100 4 902 30 331 7 685 994 188 93 535
40-44 46 260 3 650 30 923 9 576 1 670 442 103 113
45-49 43 444 2 938 25 280 12 172 2 433 546 75 102 844
26. Vinh Phuc
Total 201 318 41 550 112 844 38 438 6 458 2 027 418 943
15-19 2 227 2 084 143 2 370
20-24 19 004 13 351 5 471 181 24 838
25-29 37 695 12 424 21 721 3 335 216 66 733
30-34 39 882 5 757 25 587 8 366 172 82 717
35-39 35 007 2 559 22 545 8 296 1 390 218 79 224
40-44 36 014 2 808 22 403 8 123 2 054 626 83 507
45-49 31 488 2 567 14 975 10 136 2 627 1 183 79 555
27. Bac Ninh
Total 219 668 43 167 115 160 49 764 9 600 1 976 471 977
15-19 1 288 1 244 44 1 332
20-24 22 726 14 407 7 832 487 31 532
25-29 42 619 15 466 22 068 4 906 134 47 75 086
30-34 46 158 5 561 28 236 11 143 1 097 121 100 532
35-39 39 304 2 378 22 074 11 821 2 731 300 94 488
40-44 35 486 2 342 20 125 10 559 1 998 463 84 723
45-49 32 086 1 770 14 781 10 848 3 640 1 046 84 283
30. Hai Duong
Total 309 674 66 466 194 536 42 642 5 652 251 128 607 577
15-19 1 124 1 124 1 124
20-24 20 353 15 152 4 987 213 25 766
25-29 50 765 24 601 24 323 1 841 78 770
30-34 59 761 10 855 42 928 5 722 256 114 901
35-39 55 383 3 653 39 608 10 409 1 713 120 947
40-44 65 992 5 600 44 933 13 057 2 149 125 128 143 858
45-49 56 297 5 480 37 756 11 400 1 534 126 122 212

260
Table 18 (Continued)
Unit: Person
Number of women aged 15-49 by children ever born Administrative unit/age group
of mother
Number of women aged 15-49 have
given the birth 1 child
2 children
3 children
4 children
5 children and over
Not stated
Number of children ever born
31. Hai Phong
Total 345 513 88 662 211 381 40 035 4 809 627 653 897
15-19 1 302 1 218 84 1 385
20-24 24 199 18 809 5 210 180 29 768
25-29 58 684 28 782 28 476 1 427 90 014
30-34 77 863 16 828 53 113 7 247 674 147 494
35-39 61 374 9 215 43 259 8 058 843 123 276
40-44 66 419 7 185 47 447 10 525 1 180 80 138 779
45-49 55 673 6 625 33 793 12 598 2 111 546 123 181
33. Hung Yen
Total 210 681 38 875 125 448 40 022 4 945 1 310 81 436 496
15-19 1 521 1 281 156 83 1 843
20-24 19 255 12 905 6 350 25 605
25-29 36 057 12 459 20 803 2 794 62 449
30-34 39 230 4 627 26 979 6 867 757 82 216
35-39 37 577 2 785 23 765 10 215 729 83 84 457
40-44 41 886 2 397 26 901 10 520 1 707 360 96 471
45-49 35 156 2 421 20 493 9 541 1 751 868 81 83 455
34. Thai Binh
Total 300 764 57 867 186 891 47 887 7 412 707 609 144
15-19 1 114 1 114 1 114
20-24 14 652 10 267 4 385 19 038
25-29 40 225 17 572 20 362 2 292 65 170
30-34 57 372 11 530 36 870 8 549 422 112 607
35-39 61 360 6 256 42 034 11 139 1 861 71 131 608
40-44 67 678 7 740 43 345 13 298 2 909 386 148 246
45-49 58 363 3 388 39 894 12 610 2 220 251 131 361
35. Ha Nam
Total 136 803 29 714 74 904 26 207 5 304 674 282 787
15-19 1 119 1 066 53 1 172
20-24 10 561 7 647 2 800 113 13 587
25-29 22 197 8 531 11 808 1 751 107 37 828
30-34 28 169 4 457 17 734 5 271 706 58 564
35-39 25 620 2 883 15 659 5 882 1 092 104 56 734
40-44 27 492 2 520 15 322 7 354 2 078 218 64 627
45-49 21 645 2 608 11 528 5 836 1 321 353 50 275

261
Table 18 (Continued)
Unit: Person
Number of women aged 15-49 by children ever born Administrative unit/age group
of mother
Number of women aged 15-49 have
given the birth 1 child
2 children
3 children
4 children
5 children and over
Not stated
Number of children ever born
36. Nam Dinh
Total 321 527 57 837 176 314 67 908 15 159 4 309 698 024
15-19 2 348 2 205 143 2 492
20-24 21 444 15 221 6 070 153 27 820
25-29 50 398 17 652 28 438 3 712 597 88 050
30-34 65 153 9 210 40 853 13 576 1 514 137 701
35-39 62 723 5 290 38 896 14 829 2 793 915 143 316
40-44 64 404 4 577 35 163 17 745 5 265 1 654 157 933
45-49 55 056 3 682 26 752 17 892 4 990 1 740 140 713
37. Ninh Binh
Total 165 572 33 603 91 276 31 764 6 990 1 938 349 621
15-19 1 039 1 039 1 039
20-24 11 266 8 513 2 680 73 14 093
25-29 29 064 12 201 14 443 2 346 74 48 421
30-34 33 736 4 612 22 402 5 903 820 70 403
35-39 30 518 2 360 18 070 8 237 1 782 69 70 681
40-44 29 947 2 597 18 072 6 415 1 716 1 146 70 880
45-49 30 002 2 281 15 608 8 790 2 599 724 74 105
38. Thanh Hoa
Total 653 942 163 928 353 089 110 710 21 762 4 452 1 312 413
15-19 6 136 5 915 220 6 356
20-24 61 068 46 724 13 693 652 76 064
25-29 104 098 52 144 46 351 5 447 156 161 811
30-34 124 830 25 261 81 889 16 365 1 315 243 394
35-39 118 855 14 029 77 325 22 995 4 126 380 256 068
40-44 127 964 12 854 78 570 29 041 6 869 631 288 181
45-49 110 991 7 002 55 041 36 211 9 296 3 441 280 539
40. Nghe An
Total 527 151 126 406 238 369 109 485 36 122 16 769 1 169 473
15-19 6 315 5 760 555 6 870
20-24 50 214 35 863 12 951 1 401 65 965
25-29 94 078 42 573 43 960 6 530 1 015 154 142
30-34 97 312 19 962 54 018 17 371 4 341 1 621 205 755
35-39 93 228 9 512 49 612 24 797 6 542 2 765 225 336
40-44 103 316 6 598 46 326 31 831 9 958 8 604 281 938
45-49 82 688 6 139 30 947 27 556 14 267 3 779 229 466

262
Table 18 (Continued)
Unit: Person
Number of women aged 15-49 by children ever born Administrative unit/age group
of mother
Number of women aged 15-49 have
given the birth 1 child
2 children
3 children
4 children
5 children and over
Not stated
Number of children ever born
42. Ha Tinh
Total 203 652 41 572 82 386 53 033 20 250 6 411 480 867
15-19 359 359 359
20-24 14 730 11 313 3 418 18 148
25-29 31 630 15 611 14 115 1 904 49 553
30-34 37 370 6 925 21 376 7 617 1 141 311 78 646
35-39 38 417 2 253 16 629 14 002 4 328 1 204 101 093
40-44 42 006 2 503 16 222 14 364 6 771 2 147 116 990
45-49 39 139 2 607 10 626 15 148 8 009 2 749 116 078
44. Quang Binh
Total 148 160 30 364 62 051 34 839 13 984 6 922 352 796
15-19 926 890 36 962
20-24 10 204 8 012 1 867 325 12 720
25-29 20 765 10 105 9 092 1 358 161 50 33 254
30-34 27 763 5 197 16 290 4 872 1 186 219 58 230
35-39 31 897 2 630 15 409 9 444 3 352 1 062 80 707
40-44 28 856 1 703 11 303 9 688 4 212 1 951 81 003
45-49 27 749 1 827 8 055 9 154 5 073 3 640 85 919
45. Quang Tri
Total 106 572 20 289 42 115 24 760 11 506 7 902 268 197
15-19 1 145 1 036 109 1 254
20-24 6 379 4 625 1 477 235 42 8 453
25-29 14 546 7 089 5 930 1 145 169 214 24 256
30-34 18 492 3 576 9 985 3 215 1 018 698 40 930
35-39 23 448 1 344 10 636 7 000 2 593 1 874 64 340
40-44 23 148 1 486 8 266 7 099 4 089 2 208 68 018
45-49 19 414 1 133 5 712 6 066 3 595 2 908 60 944
46. Thua Thien Hue
Total 178 284 40 249 68 860 39 785 20 183 9 207 427 383
15-19 952 762 138 52 1 245
20-24 11 083 8 902 2 037 144 13 409
25-29 24 031 13 616 8 783 1 387 244 36 321
30-34 30 692 7 630 16 637 5 168 923 335 61 773
35-39 35 672 4 098 16 261 10 402 4 430 480 88 140
40-44 37 749 2 668 13 733 10 780 7 465 3 104 108 830
45-49 38 104 2 572 11 271 11 904 7 069 5 288 117 666

263
Table 18 (Continued)
Unit: Person
Number of women aged 15-49 by children ever born Administrative unit/age group
of mother
Number of women aged 15-49 have
given the birth 1 child
2 children
3 children
4 children
5 children and over
Not stated
Number of children ever born
48. Da Nang
Total 177 628 54 709 89 676 26 588 5 157 1 498 342 202
15-19 1 269 1 219 50 1 417
20-24 10 100 8 802 1 157 89 51 11 590
25-29 26 986 17 817 8 371 747 51 37 005
30-34 35 559 12 207 20 168 2 751 433 62 530
35-39 33 954 6 125 20 777 5 795 1 004 253 70 343
40-44 34 116 4 780 20 785 6 867 1 132 552 74 394
45-49 35 645 3 760 18 418 10 338 2 436 694 84 923
49. Quang Nam
Total 249 982 61 952 109 367 55 409 16 415 6 839 550 145
15-19 2 286 2 034 252 2 538
20-24 18 419 13 411 4 537 471 23 898
25-29 39 086 20 181 15 647 2 784 474 61 723
30-34 42 122 10 796 22 979 6 157 1 440 751 84 736
35-39 45 140 4 746 23 848 12 702 3 141 704 106 959
40-44 50 105 5 279 21 169 16 539 5 018 2 100 129 342
45-49 52 823 5 505 20 933 16 757 6 342 3 285 140 949
51. Quang Ngai
Total 213 171 50 438 95 638 48 072 14 489 4 534 468 792
15-19 2 182 2 012 170 2 353
20-24 13 813 10 312 3 329 172 17 487
25-29 30 488 16 196 12 237 1 892 45 117 47 114
30-34 36 786 9 770 21 755 4 426 664 171 70 068
35-39 40 378 5 133 22 703 9 875 2 140 527 91 531
40-44 45 931 2 736 19 766 17 417 5 316 696 119 785
45-49 43 593 4 279 15 678 14 290 6 323 3 023 120 454
52. Binh Dinh
Total 267 575 57 886 127 451 60 841 16 886 4 510 586 707
15-19 1 190 946 244 1 433
20-24 13 257 10 475 2 718 64 16 168
25-29 29 935 16 955 11 598 1 320 62 44 359
30-34 53 029 12 914 31 070 7 891 1 040 113 103 455
35-39 57 827 6 966 32 859 15 640 2 045 317 129 371
40-44 58 241 4 612 27 757 19 058 5 497 1 317 146 334
45-49 54 096 5 019 21 205 16 933 8 178 2 762 145 586

264
Table 18 (Continued)
Unit: Person
Number of women aged 15-49 by children ever born Administrative unit/age group
of mother
Number of women aged 15-49 have
given the birth 1 child
2 children
3 children
4 children
5 children and over
Not stated
Number of children ever born
54. Phu Yen
Total 167 302 39 320 85 026 31 441 8 205 3 311 354 643
15-19 1 498 1 400 98 1 595
20-24 12 273 8 598 3 459 216 16 164
25-29 23 045 11 507 9 623 1 788 126 36 622
30-34 31 760 7 348 19 003 4 864 544 62 123
35-39 36 622 4 306 23 328 7 571 1 191 226 79 755
40-44 33 303 3 038 17 515 9 137 2 732 881 81 324
45-49 28 802 3 122 11 999 7 865 3 611 2 205 77 060
56. Khanh Hoa
Total 209 524 60 415 95 857 35 506 12 346 5 401 438 430
15-19 2 329 2 110 219 2 548
20-24 12 957 9 695 3 179 84 16 303
25-29 28 740 17 154 9 830 1 756 42 082
30-34 36 340 12 276 17 749 4 861 1 267 187 68 361
35-39 40 051 8 031 22 210 6 374 1 908 1 528 87 828
40-44 46 101 6 347 23 054 10 905 4 245 1 548 111 179
45-49 43 006 4 802 19 615 11 526 4 926 2 137 110 129
58. Ninh Thuan
Total 107 717 25 837 43 777 20 621 9 534 7 948 260 172
15-19 2 000 1 757 243 2 243
20-24 8 451 6 125 2 258 69 10 846
25-29 14 745 6 874 6 410 1 151 178 131 24 517
30-34 19 169 5 221 9 357 3 266 1 041 284 39 620
35-39 21 163 2 606 10 503 5 399 1 678 977 52 140
40-44 21 073 1 961 9 022 5 601 2 297 2 192 58 725
45-49 21 117 1 293 5 984 5 136 4 341 4 363 72 081
60. Binh Thuan
Total 222 425 55 972 89 618 48 606 19 223 9 006 507 035
15-19 2 840 2 792 48 2 984
20-24 15 304 12 349 2 676 279 18 539
25-29 29 487 14 812 12 405 2 039 231 46 664
30-34 44 175 11 838 22 307 8 452 1 443 135 88 347
35-39 43 416 5 289 22 514 11 212 3 084 1 317 103 155
40-44 45 930 4 705 17 473 14 434 6 722 2 597 123 932
45-49 41 272 4 186 12 244 12 189 7 696 4 956 123 415

265
Table 18 (Continued)
Unit: Person
Number of women aged 15-49 by children ever born Administrative unit/age group
of mother
Number of women aged 15-49 have
given the birth 1 child
2 children
3 children
4 children
5 children and over
Not stated
Number of children ever born
62. Kon Tum
Total 87 020 19 456 36 834 15 490 5 906 9 333 224 098
15-19 1 929 1 705 194 30 2 183
20-24 9 757 6 393 2 995 333 37 13 528
25-29 15 861 5 862 7 279 2 002 504 213 29 512
30-34 17 541 2 732 9 082 3 120 1 498 1 109 42 604
35-39 16 226 1 159 7 545 4 074 1 285 2 163 46 995
40-44 13 633 1 023 5 844 3 100 1 195 2 472 43 849
45-49 12 072 582 3 896 2 831 1 387 3 376 45 429
64. Gia Lai
Total 266 636 61 459 104 872 57 550 24 835 17 921 647 179
15-19 7 513 7 195 319 7 832
20-24 30 783 20 653 9 224 905 41 817
25-29 44 976 17 628 20 631 5 942 775 79 816
30-34 54 503 8 497 26 415 12 842 4 878 1 871 129 375
35-39 51 777 3 458 21 867 15 093 6 607 4 752 145 021
40-44 42 270 2 482 16 402 12 571 5 997 4 819 125 391
45-49 34 813 1 547 10 013 10 197 6 577 6 479 117 925
66. Dak Lak
Total 340 222 72 577 144 829 77 464 30 117 15 235 801 502
15-19 3 573 3 269 237 68 3 946
20-24 29 411 22 748 6 600 63 36 136
25-29 47 699 20 340 22 217 4 660 238 244 80 926
30-34 69 065 13 757 37 535 13 170 3 627 976 147 847
35-39 69 429 5 604 34 398 19 774 7 831 1 822 175 346
40-44 61 026 3 059 25 496 20 570 7 226 4 675 171 082
45-49 60 019 3 801 18 346 19 160 11 194 7 518 186 220
67. Dak Nong
Total 111 796 20 842 47 955 26 965 9 469 6 565 273 257
15-19 1 437 1 200 198 39 1 751
20-24 9 347 5 492 3 155 700 13 903
25-29 18 719 6 541 9 619 1 936 415 209 34 323
30-34 24 918 3 801 12 266 6 323 1 582 945 58 770
35-39 21 796 1 694 10 520 6 164 2 079 1 339 57 074
40-44 19 403 1 172 7 584 6 374 2 285 1 988 56 207
45-49 16 175 941 4 613 5 468 3 069 2 084 51 228

266
Table 18 (Continued)
Unit: Person
Number of women aged 15-49 by children ever born Administrative unit/age group
of mother
Number of women aged 15-49 have
given the birth 1 child
2 children
3 children
4 children
5 children and over
Not stated
Number of children ever born
68. Lam Dong
Total 226 263 49 770 105 495 46 346 14 764 9 888 518 332
15-19 2 407 2 356 51 2 458
20-24 16 406 11 963 4 144 299 21 149
25-29 34 908 15 126 16 113 3 111 558 58 916
30-34 42 826 8 953 23 525 7 838 2 009 502 90 160
35-39 45 538 4 698 25 541 11 557 2 849 893 106 914
40-44 43 613 3 681 19 918 12 057 4 332 3 626 117 954
45-49 40 564 2 993 16 203 11 483 5 018 4 867 120 780
70. Binh Phuoc
Total 181 960 45 867 86 945 34 613 11 203 3 331 386 575
15-19 2 202 2 078 123 2 325
20-24 14 805 11 419 3 089 237 60 18 547
25-29 28 104 13 127 13 112 1 690 174 45 121
30-34 35 294 8 160 21 328 4 884 748 175 69 446
35-39 37 317 5 255 19 832 8 889 2 671 669 85 676
40-44 34 366 3 300 16 968 9 239 3 626 1 233 86 356
45-49 29 872 2 527 12 492 9 673 3 926 1 254 79 104
72. Tay Ninh
Total 211 361 70 404 109 018 25 754 4 505 1 680 392 710
15-19 2 146 2 015 131 2 277
20-24 14 845 11 585 3 053 207 18 312
25-29 35 718 19 634 14 343 1 597 143 53 686
30-34 43 550 15 216 24 076 3 611 527 120 76 963
35-39 39 799 8 566 24 996 5 830 406 77 673
40-44 36 029 6 329 23 480 4 810 1 079 331 73 690
45-49 39 275 7 059 18 939 9 699 2 349 1 229 90 109
74. Binh Duong
Total 398 733 172 310 181 036 37 777 5 776 1 834 680 651
15-19 3 824 3 824 3 824
20-24 32 082 27 000 4 617 464 37 628
25-29 83 488 55 359 26 484 1 334 312 113 574
30-34 96 913 43 753 47 801 4 797 514 47 156 040
35-39 74 395 19 514 44 164 8 557 1 257 903 143 054
40-44 60 659 12 339 33 459 13 237 1 150 473 126 391
45-49 47 373 10 521 24 511 9 387 2 543 411 100 140

267
Table 18 (Continued)
Unit: Person
Number of women aged 15-49 by children ever born Administrative unit/age group
of mother
Number of women aged 15-49 have
given the birth 1 child
2 children
3 children
4 children
5 children and over
Not stated
Number of children ever born
75. Dong Nai
Total 517 904 160 086 236 089 85 071 26 444 10 215 1 050 024
15-19 3 897 3 249 647 4 544
20-24 30 601 24 992 5 144 465 36 675
25-29 80 834 48 365 29 365 2 886 217 116 839
30-34 113 084 38 840 57 081 13 739 3 085 339 208 254
35-39 102 093 19 415 57 099 21 129 4 040 410 215 208
40-44 97 111 13 722 48 761 24 244 7 759 2 625 229 333
45-49 90 284 11 502 37 991 22 608 11 559 6 624 239 169
77. Ba Ria - Vung Tau
Total 193 377 57 240 93 552 29 634 9 475 3 477 389 985
15-19 967 967 967
20-24 8 279 6 993 1 286 9 566
25-29 29 409 17 325 10 625 1 361 98 43 050
30-34 40 861 14 452 22 510 3 313 486 99 71 854
35-39 38 655 6 098 22 797 7 802 1 577 381 83 311
40-44 39 442 7 015 20 132 8 765 2 658 872 89 203
45-49 35 763 4 388 16 202 8 392 4 656 2 125 92 034
79. Ho Chi Minh City
Total 1 371 491 608 714 637 721 104 490 17 147 3 418 2 284 280
15-19 6 819 6 181 639 7 458
20-24 61 662 52 266 8 457 939 71 998
25-29 188 915 127 890 56 172 4 218 636 255 430
30-34 316 502 173 047 130 122 13 043 290 473 579
35-39 292 316 107 815 157 559 22 226 2 814 1 902 510 709
40-44 264 200 79 399 149 948 30 170 4 212 471 489 007
45-49 241 076 62 117 134 824 33 894 9 196 1 045 476 097
80. Long An
Total 279 392 94 788 146 252 30 170 6 402 1 779 512 923
15-19 1 262 1 062 199 1 461
20-24 18 519 15 493 2 820 206 21 752
25-29 40 053 22 871 16 190 909 83 58 310
30-34 54 772 20 849 29 801 3 300 768 54 93 692
35-39 57 752 13 922 37 371 5 600 662 198 109 100
40-44 53 523 10 818 32 808 7 692 1 805 400 109 243
45-49 53 511 9 774 27 063 12 462 3 084 1 128 119 364

268
Table 18 (Continued)
Unit: Person
Number of women aged 15-49 by children ever born Administrative unit/age group
of mother
Number of women aged 15-49 have
given the birth 1 child
2 children
3 children
4 children
5 children and over
Not stated
Number of children ever born
82. Tien Giang
Total 325 099 115 114 162 531 38 334 7 521 1 599 593 563
15-19 2 244 2 136 108 2 352
20-24 22 211 18 584 3 388 238 26 075
25-29 47 214 28 819 16 875 1 519 67 127
30-34 64 117 24 223 34 867 4 423 603 109 641
35-39 63 097 16 712 38 652 6 715 906 112 118 347
40-44 63 475 14 926 35 696 10 496 1 882 475 127 909
45-49 62 742 9 715 32 945 14 942 4 129 1 011 142 113
83. Ben Tre
Total 232 192 90 270 113 485 22 169 5 178 1 090 410 074
15-19 1 802 1 718 85 1 887
20-24 12 196 10 404 1 707 85 14 073
25-29 30 341 18 379 11 218 661 83 43 128
30-34 41 608 19 767 19 412 2 257 171 66 048
35-39 49 724 16 428 28 090 4 502 704 88 931
40-44 46 523 12 693 26 914 5 309 1 127 481 89 358
45-49 49 999 10 881 26 060 9 355 3 093 609 106 649
84. Tra Vinh
Total 188 030 67 561 92 024 21 998 4 330 2 117 346 330
15-19 1 380 1 380 1 380
20-24 12 376 10 500 1 671 206 14 458
25-29 29 266 18 085 10 080 1 033 69 41 619
30-34 37 725 14 389 20 619 2 334 382 64 160
35-39 37 534 9 968 22 034 4 669 684 180 71 716
40-44 33 064 6 031 19 597 5 437 1 406 593 70 411
45-49 36 685 7 210 18 023 8 319 1 789 1 344 82 586
86. Vinh Long
Total 188 550 70 717 96 628 17 615 2 439 1 151 332 633
15-19 1 365 1 009 356 1 721
20-24 9 968 7 695 2 059 214 12 456
25-29 26 139 15 973 9 416 750 37 055
30-34 39 099 17 734 19 258 1 988 77 41 62 812
35-39 37 492 10 999 23 026 3 099 326 42 67 861
40-44 36 939 8 725 22 891 4 182 775 366 72 061
45-49 37 548 8 582 19 621 7 382 1 261 702 78 667

269
Table 18 (Continued)
Unit: Person
Number of women aged 15-49 by children ever born Administrative unit/age group
of mother
Number of women aged 15-49 have
given the birth 1 child
2 children
3 children
4 children
5 children and over
Not stated
Number of children ever born
87. Dong Thap
Total 314 257 109 136 156 874 39 791 6 699 1 758 578 267
15-19 3 106 2 988 118 3 223
20-24 21 158 17 191 3 765 203 25 328
25-29 46 347 28 835 16 400 844 268 65 239
30-34 61 381 22 969 32 186 5 945 281 106 301
35-39 62 290 14 018 39 865 7 620 676 111 119 869
40-44 63 081 13 745 36 185 11 214 1 839 98 127 605
45-49 56 894 9 391 28 356 13 965 3 634 1 549 130 701
89. An Giang
Total 393 382 147 364 177 013 51 992 12 840 4 173 731 404
15-19 4 927 4 772 155 5 081
20-24 28 902 22 520 6 227 155 35 439
25-29 63 857 38 614 21 220 3 872 151 93 575
30-34 73 442 28 644 35 126 8 573 724 374 129 382
35-39 78 119 20 874 43 807 10 445 2 508 484 152 371
40-44 76 544 18 078 38 985 14 584 3 643 1 255 161 795
45-49 67 591 13 861 31 493 14 363 5 965 1 909 153 759
91. Kien Giang
Total 322 040 93 104 153 557 53 643 14 963 6 774 658 715
15-19 3 728 3 414 314 4 042
20-24 25 870 18 570 6 574 727 33 897
25-29 50 928 24 873 22 537 3 078 440 80 940
30-34 65 546 19 064 35 135 9 685 1 599 64 125 102
35-39 64 972 12 327 36 176 13 218 2 590 661 138 115
40-44 58 791 8 137 30 646 14 099 4 282 1 627 137 957
45-49 52 206 6 720 22 175 12 836 6 054 4 421 138 661
92. Can Tho
Total 220 639 81 468 105 299 28 295 3 613 1 965 401 764
15-19 2 042 1 924 118 2 160
20-24 16 494 13 263 3 007 167 57 20 061
25-29 34 686 19 022 14 024 1 499 83 58 52 187
30-34 38 529 16 076 19 410 2 713 169 161 64 573
35-39 44 928 11 350 25 929 6 720 601 329 87 526
40-44 44 599 10 179 24 239 8 786 1 004 390 91 030
45-49 39 361 9 654 18 572 8 410 1 755 971 84 227

270
Table 18 (Continued)
Unit: Person
Number of women aged 15-49 by children ever born Administrative unit/age group
of mother
Number of women aged 15-49 have
given the birth 1 child
2 children
3 children
4 children
5 children and over
Not stated
Number of children ever born
93. Hau Giang
Total 135 932 44 457 68 760 17 270 4 050 1 396 257 506
15-19 1 347 1 347 1 347
20-24 9 064 6 886 2 149 30 11 272
25-29 21 769 11 993 9 160 523 92 32 253
30-34 25 688 9 251 14 243 1 896 297 44 616
35-39 27 201 6 286 16 488 3 834 353 239 53 374
40-44 25 766 4 842 14 506 5 119 1 127 171 54 673
45-49 25 098 3 853 12 212 5 868 2 179 985 59 973
94. Soc Trang
Total 224 494 73 861 104 291 32 612 9 299 4 432 441 424
15-19 2 777 2 578 199 2 976
20-24 17 241 13 408 3 272 561 21 636
25-29 34 635 19 693 13 467 1 291 122 63 51 298
30-34 42 677 14 761 21 101 5 390 992 433 79 342
35-39 46 580 9 789 28 199 6 508 1 684 400 94 715
40-44 42 252 8 971 20 982 8 650 2 088 1 561 93 505
45-49 38 333 4 660 17 071 10 212 4 414 1 976 97 951
95. Bac Lieu
Total 152 208 45 409 75 963 22 284 6 769 1 782 300 898
15-19 1 446 1 446 1 446
20-24 11 626 9 217 2 320 89 14 124
25-29 23 754 12 060 10 558 1 048 30 58 36 728
30-34 31 197 9 822 16 647 3 560 997 171 58 695
35-39 31 443 4 523 20 385 4 889 1 433 214 66 792
40-44 28 215 4 628 15 478 6 420 1 318 372 62 259
45-49 24 526 3 713 10 574 6 279 2 992 967 60 854
96. Ca Mau
Total 223 383 70 074 107 270 33 942 8 688 3 410 438 880
15-19 3 189 3 032 157 3 347
20-24 18 270 13 438 4 787 45 23 147
25-29 37 202 19 516 15 695 1 835 156 57 035
30-34 45 059 14 989 23 751 5 517 802 82 250
35-39 45 354 8 087 28 059 7 610 1 243 355 93 783
40-44 40 019 5 865 20 993 9 572 2 912 677 91 675
45-49 34 290 5 147 13 827 9 363 3 575 2 377 87 643
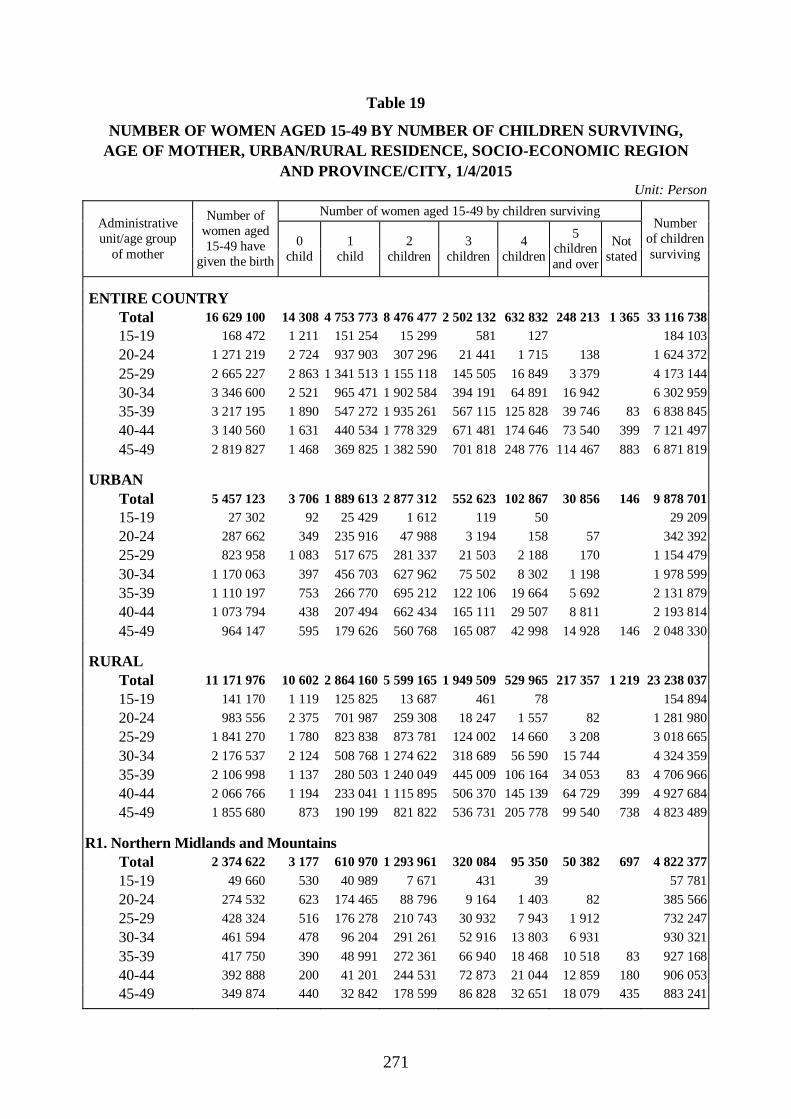
271
Table 19
NUMBER OF WOMEN AGED 15-49 BY NUMBER OF CHILDREN SURVIVING, AGE OF MOTHER, URBAN/RURAL RESIDENCE, SOCIO-ECONOMIC REGION
AND PROVINCE/CITY, 1/4/2015 Unit: Person
Number of women aged 15-49 by children surviving Administrative unit/age group
of mother
Number of women aged 15-49 have
given the birth
0 child
1 child
2 children
3 children
4 children
5 children and over
Not stated
Number of children surviving
ENTIRE COUNTRY Total 16 629 100 14 308 4 753 773 8 476 477 2 502 132 632 832 248 213 1 365 33 116 738
15-19 168 472 1 211 151 254 15 299 581 127 184 103
20-24 1 271 219 2 724 937 903 307 296 21 441 1 715 138 1 624 372
25-29 2 665 227 2 863 1 341 513 1 155 118 145 505 16 849 3 379 4 173 144
30-34 3 346 600 2 521 965 471 1 902 584 394 191 64 891 16 942 6 302 959
35-39 3 217 195 1 890 547 272 1 935 261 567 115 125 828 39 746 83 6 838 845
40-44 3 140 560 1 631 440 534 1 778 329 671 481 174 646 73 540 399 7 121 497
45-49 2 819 827 1 468 369 825 1 382 590 701 818 248 776 114 467 883 6 871 819
URBAN
Total 5 457 123 3 706 1 889 613 2 877 312 552 623 102 867 30 856 146 9 878 701
15-19 27 302 92 25 429 1 612 119 50 29 209
20-24 287 662 349 235 916 47 988 3 194 158 57 342 392
25-29 823 958 1 083 517 675 281 337 21 503 2 188 170 1 154 479
30-34 1 170 063 397 456 703 627 962 75 502 8 302 1 198 1 978 599
35-39 1 110 197 753 266 770 695 212 122 106 19 664 5 692 2 131 879
40-44 1 073 794 438 207 494 662 434 165 111 29 507 8 811 2 193 814
45-49 964 147 595 179 626 560 768 165 087 42 998 14 928 146 2 048 330
RURAL Total 11 171 976 10 602 2 864 160 5 599 165 1 949 509 529 965 217 357 1 219 23 238 037
15-19 141 170 1 119 125 825 13 687 461 78 154 894
20-24 983 556 2 375 701 987 259 308 18 247 1 557 82 1 281 980
25-29 1 841 270 1 780 823 838 873 781 124 002 14 660 3 208 3 018 665
30-34 2 176 537 2 124 508 768 1 274 622 318 689 56 590 15 744 4 324 359
35-39 2 106 998 1 137 280 503 1 240 049 445 009 106 164 34 053 83 4 706 966
40-44 2 066 766 1 194 233 041 1 115 895 506 370 145 139 64 729 399 4 927 684
45-49 1 855 680 873 190 199 821 822 536 731 205 778 99 540 738 4 823 489
R1. Northern Midlands and Mountains Total 2 374 622 3 177 610 970 1 293 961 320 084 95 350 50 382 697 4 822 377
15-19 49 660 530 40 989 7 671 431 39 57 781
20-24 274 532 623 174 465 88 796 9 164 1 403 82 385 566
25-29 428 324 516 176 278 210 743 30 932 7 943 1 912 732 247
30-34 461 594 478 96 204 291 261 52 916 13 803 6 931 930 321
35-39 417 750 390 48 991 272 361 66 940 18 468 10 518 83 927 168
40-44 392 888 200 41 201 244 531 72 873 21 044 12 859 180 906 053
45-49 349 874 440 32 842 178 599 86 828 32 651 18 079 435 883 241

272
Table 19 (Continued) Unit: Person
Number of women aged 15-49 by children surviving Administrative unit/age group
of mother
Number of women aged 15-49 have
given the birth
0 child
1 child
2 children
3 children
4 children
5 children and over
Not stated
Number of children surviving
R2. Red River Delta Total 3 715 029 1 439 834 881 2 208 067 564 095 90 261 15 619 668 7 387 117
15-19 20 056 18 826 1 230 21 286
20-24 256 558 332 188 418 65 603 2 104 101 326 339
25-29 630 424 521 272 932 316 158 39 355 1 458 1 029 145
30-34 773 708 92 149 719 506 628 107 777 9 491 1 524 270
35-39 703 548 151 76 723 470 543 131 069 23 006 2 056 1 513 559
40-44 725 292 223 67 965 480 220 144 849 26 037 5 779 219 1 597 653
45-49 605 444 119 60 297 367 685 138 941 30 169 7 784 448 1 374 865
R3. North and South Central Coast
Total 3 433 085 2 385 846 295 1 604 547 690 069 208 875 80 915 7 399 244
15-19 31 426 138 28 990 2 197 52 50 33 737
20-24 258 254 848 196 093 57 830 3 367 116 322 315
25-29 511 658 270 265 130 214 636 28 730 2 422 469 792 712
30-34 635 401 633 152 879 368 913 93 311 16 120 3 546 1 253 508
35-39 660 069 57 79 209 370 524 160 066 39 436 10 778 1 515 964
40-44 697 839 271 64 992 337 783 202 454 65 849 26 491 1 756 955
45-49 638 438 168 59 002 252 665 202 090 84 882 39 632 1 724 053
R4. Central Highlands
Total 1 031 937 1 528 227 192 449 095 219 266 82 733 52 122 2 418 067
15-19 16 860 271 15 602 851 98 39 17 751
20-24 95 704 353 67 314 25 965 2 035 37 125 496
25-29 162 163 329 65 887 76 458 16 734 2 306 450 280 478
30-34 208 853 184 38 516 110 371 42 177 12 856 4 748 462 458
35-39 204 767 226 16 695 103 227 55 636 19 461 9 522 521 891
40-44 179 945 146 12 301 77 217 54 126 20 411 15 744 503 222
45-49 163 644 19 10 876 55 007 48 462 27 623 21 657 506 769
R5. Southeast
Total 2 874 827 2 296 1 118 166 1 349 128 313 275 69 860 22 102 5 155 946
15-19 19 855 18 314 1 541 21 396
20-24 162 275 122 134 433 25 347 2 313 60 192 305
25-29 446 469 658 281 113 151 091 12 094 1 295 217 625 845
30-34 646 206 819 292 992 303 260 43 305 5 213 616 1 053 419
35-39 584 573 443 167 171 327 283 73 283 12 302 4 092 1 111 587
40-44 531 806 49 123 942 294 282 89 088 19 019 5 427 1 085 825
45-49 483 643 205 100 201 246 324 93 193 31 971 11 749 1 065 569

273
Table 19 (Continued) Unit: Person
Number of women aged 15-49 by children surviving Administrative unit/age group
of mother
Number of women aged 15-49 have
given the birth
0 child
1 child
2 children
3 children
4 children
5 children and over
Not stated
Number of children surviving
R6. Mekong River Delta Total 3 199 599 3 483 1 116 269 1 571 680 395 342 85 752 27 073 5 933 988
15-19 30 615 272 28 533 1 809 32 152
20-24 223 896 446 177 179 43 756 2 459 57 272 349
25-29 486 190 569 280 173 186 033 17 661 1 425 329 712 717
30-34 620 838 314 235 160 322 152 54 704 7 407 1 101 1 078 984
35-39 646 487 624 158 484 391 323 80 122 13 155 2 779 1 248 676
40-44 612 789 741 130 134 344 296 108 092 22 286 7 241 1 271 789
45-49 578 783 516 106 606 282 311 132 304 41 479 15 567 1 317 322
01. Ha Noi
Total 1 271 292 259 312 495 764 937 163 820 25 059 4 403 319 2 457 080
15-19 4 789 4 434 355 5 145
20-24 75 862 59 875 15 632 355 92 205
25-29 226 180 259 104 204 107 404 13 976 337 362 288
30-34 281 060 64 817 179 485 33 439 3 319 537 380
35-39 253 466 32 454 172 483 39 320 8 437 772 532 986
40-44 241 487 24 462 167 209 42 117 6 050 1 649 518 312
45-49 188 448 22 248 122 370 34 613 6 916 1 982 319 408 764
02. Ha Giang
Total 156 717 349 35 872 72 121 27 691 11 935 8 750 361 152
15-19 5 075 40 4 005 829 162 39 6 305
20-24 22 431 44 11 381 9 315 1 333 358 35 443
25-29 32 060 107 10 461 13 757 5 280 2 256 199 63 951
30-34 28 619 80 4 365 14 634 5 397 2 352 1 792 69 132
35-39 24 472 78 2 287 12 497 5 181 2 358 2 071 64 095
40-44 23 965 1 793 12 731 4 904 1 896 2 641 64 636
45-49 20 095 1 581 8 357 5 434 2 676 2 047 57 590
04. Cao Bang
Total 104 368 311 35 451 49 524 11 887 4 470 2 702 22 203 156
15-19 2 540 67 2 120 320 32 2 857
20-24 12 668 61 8 474 3 542 591 17 330
25-29 18 233 30 9 559 6 736 1 629 279 29 034
30-34 19 207 55 6 812 9 353 1 739 911 337 36 246
35-39 18 232 23 3 935 10 410 2 324 1 011 530 38 702
40-44 17 003 21 2 642 10 233 2 509 973 624 38 050
45-49 16 485 54 1 909 8 930 3 063 1 297 1 210 22 40 937

274
Table 19 (Continued) Unit: Person
Number of women aged 15-49 by children surviving Administrative unit/age group
of mother
Number of women aged 15-49 have
given the birth
0 child
1 child
2 children
3 children
4 children
5 children and over
Not stated
Number of children surviving
06. Bac Kan
Total 65 069 119 22 815 34 690 5 848 1 188 410 116 641
15-19 1 102 1 031 71 1 174
20-24 7 060 54 5 274 1 627 87 18 8 860
25-29 10 912 20 6 456 3 915 339 134 48 16 092
30-34 12 010 16 4 426 6 743 639 129 57 20 687
35-39 12 457 29 2 641 8 549 1 052 112 74 23 713
40-44 11 482 1 525 7 898 1 731 240 87 23 929
45-49 10 047 1 461 5 887 2 001 555 144 22 187
08. Tuyen Quang
Total 155 760 316 41 293 87 596 19 966 4 878 1 711 304 853
15-19 3 684 3 163 521 4 205
20-24 17 178 101 11 665 5 215 147 50 22 738
25-29 28 326 69 11 038 15 631 1 431 158 47 222
30-34 29 460 49 7 181 18 769 2 963 450 49 55 650
35-39 29 680 2 752 20 851 4 659 1 019 400 64 659
40-44 24 919 49 2 536 15 418 5 360 1 161 395 56 169
45-49 22 512 48 2 957 11 193 5 406 2 040 868 54 210
10. Lao Cai
Total 135 934 181 32 539 67 222 22 377 9 068 4 547 294 953
15-19 3 405 2 736 669 4 074
20-24 18 243 128 10 350 6 851 871 43 26 837
25-29 23 960 9 011 11 637 2 431 687 195 43 299
30-34 27 705 25 4 797 16 015 4 395 1 910 563 60 506
35-39 22 184 27 2 098 13 273 4 365 1 499 922 52 511
40-44 21 037 1 857 10 765 4 635 2 302 1 477 54 870
45-49 19 399 1 689 8 013 5 680 2 627 1 390 52 855
11. Dien Bien
Total 108 899 254 25 524 49 078 17 791 8 588 7 664 255 432
15-19 4 360 100 3 330 898 32 5 222
20-24 15 969 31 7 966 6 062 1 605 244 61 26 185
25-29 21 343 31 6 793 9 767 2 806 1 544 402 42 933
30-34 21 504 31 3 378 12 112 3 011 1 416 1 556 51 063
35-39 18 901 1 813 9 697 4 242 1 856 1 294 48 866
40-44 15 493 13 1 209 6 945 3 142 1 744 2 438 45 791
45-49 11 329 47 1 035 3 597 2 952 1 785 1 913 35 372

275
Table 19 (Continued) Unit: Person
Number of women aged 15-49 by children surviving Administrative unit/age group
of mother
Number of women aged 15-49 have
given the birth
0 child
1 child
2 children
3 children
4 children
5 children and over
Not stated
Number of children surviving
12. Lai Chau
Total 86 378 225 17 390 37 115 16 572 8 992 6 083 211 068
15-19 4 024 78 3 163 760 23 4 751
20-24 13 408 106 6 015 6 162 916 189 21 21 948
25-29 17 882 21 4 602 9 544 2 810 624 281 36 137
30-34 16 518 21 1 861 8 305 3 761 1 555 1 015 41 398
35-39 13 329 860 5 532 3 297 2 194 1 446 38 582
40-44 11 544 591 4 312 3 036 2 127 1 478 35 169
45-49 9 673 297 2 499 2 731 2 304 1 841 33 084
14. Son La
Total 253 839 481 58 955 130 115 39 955 15 234 9 099 550 211
15-19 10 783 134 8 402 2 065 183 13 080
20-24 38 232 99 19 540 15 916 2 285 394 59 800
25-29 48 967 65 13 729 27 131 6 163 1 334 545 94 543
30-34 48 672 63 8 468 28 786 7 754 2 651 949 104 863
35-39 41 854 3 208 25 061 8 566 2 697 2 322 102 455
40-44 35 748 64 4 078 18 934 7 710 3 186 1 777 87 660
45-49 29 583 57 1 530 12 223 7 294 4 972 3 507 87 810
15. Yen Bai
Total 161 652 268 42 084 88 687 19 724 6 358 4 424 106 330 482
15-19 3 773 111 2 974 688 4 350
20-24 17 605 11 391 5 687 420 107 24 453
25-29 30 791 50 13 311 14 282 2 400 592 156 52 328
30-34 31 316 78 6 611 20 452 2 708 994 473 62 190
35-39 27 772 28 3 620 18 898 3 526 862 838 60 794
40-44 24 401 2 197 15 728 4 082 1 341 1 052 57 598
45-49 25 992 1 980 12 951 6 589 2 462 1 904 106 68 769
17. Hoa Binh
Total 172 104 232 48 398 102 202 17 963 2 795 418 97 320 060
15-19 2 973 2 841 132 3 105
20-24 18 610 13 791 4 661 158 23 588
25-29 29 812 13 597 15 659 556 46 582
30-34 33 610 58 7 933 22 757 2 756 106 62 137
35-39 31 020 44 3 969 22 769 3 492 641 105 63 075
40-44 29 655 52 3 619 21 175 4 134 571 103 61 222
45-49 26 423 77 2 647 15 050 6 867 1 476 209 97 60 351
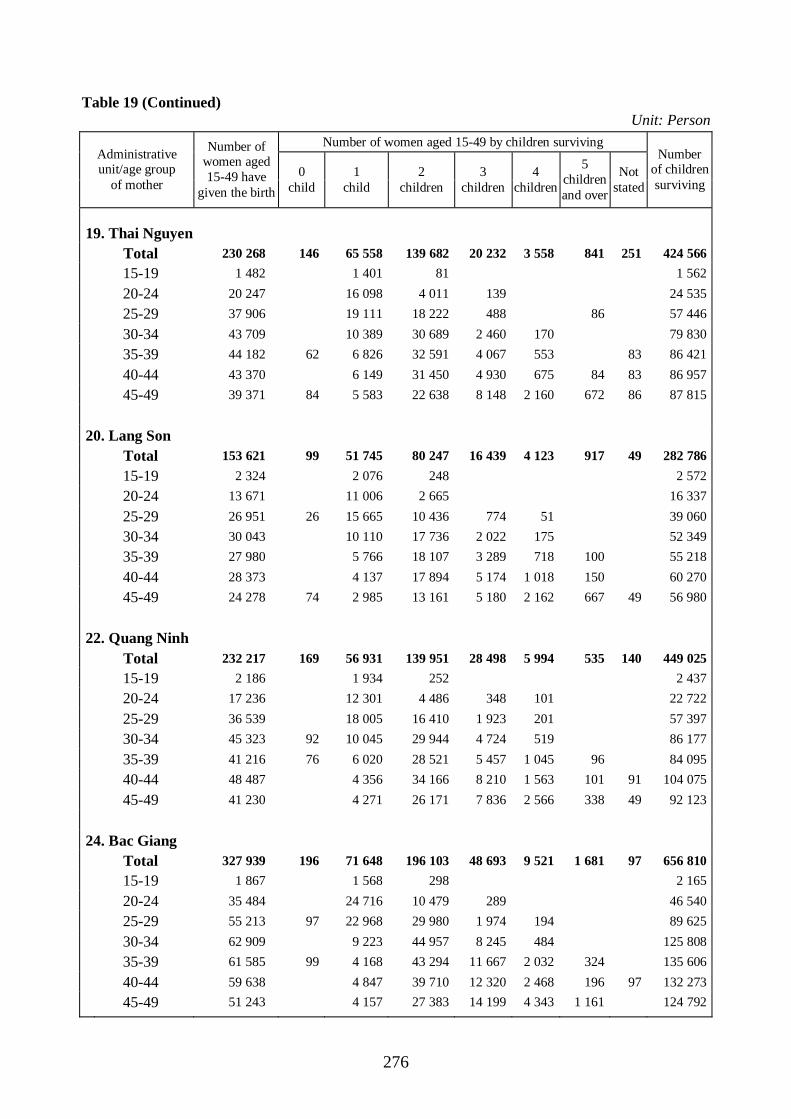
276
Table 19 (Continued) Unit: Person
Number of women aged 15-49 by children surviving Administrative unit/age group
of mother
Number of women aged 15-49 have
given the birth
0 child
1 child
2 children
3 children
4 children
5 children and over
Not stated
Number of children surviving
19. Thai Nguyen Total 230 268 146 65 558 139 682 20 232 3 558 841 251 424 566
15-19 1 482 1 401 81 1 562
20-24 20 247 16 098 4 011 139 24 535
25-29 37 906 19 111 18 222 488 86 57 446
30-34 43 709 10 389 30 689 2 460 170 79 830
35-39 44 182 62 6 826 32 591 4 067 553 83 86 421
40-44 43 370 6 149 31 450 4 930 675 84 83 86 957
45-49 39 371 84 5 583 22 638 8 148 2 160 672 86 87 815
20. Lang Son
Total 153 621 99 51 745 80 247 16 439 4 123 917 49 282 786
15-19 2 324 2 076 248 2 572
20-24 13 671 11 006 2 665 16 337
25-29 26 951 26 15 665 10 436 774 51 39 060
30-34 30 043 10 110 17 736 2 022 175 52 349
35-39 27 980 5 766 18 107 3 289 718 100 55 218
40-44 28 373 4 137 17 894 5 174 1 018 150 60 270
45-49 24 278 74 2 985 13 161 5 180 2 162 667 49 56 980
22. Quang Ninh
Total 232 217 169 56 931 139 951 28 498 5 994 535 140 449 025
15-19 2 186 1 934 252 2 437
20-24 17 236 12 301 4 486 348 101 22 722
25-29 36 539 18 005 16 410 1 923 201 57 397
30-34 45 323 92 10 045 29 944 4 724 519 86 177
35-39 41 216 76 6 020 28 521 5 457 1 045 96 84 095
40-44 48 487 4 356 34 166 8 210 1 563 101 91 104 075
45-49 41 230 4 271 26 171 7 836 2 566 338 49 92 123
24. Bac Giang
Total 327 939 196 71 648 196 103 48 693 9 521 1 681 97 656 810
15-19 1 867 1 568 298 2 165
20-24 35 484 24 716 10 479 289 46 540
25-29 55 213 97 22 968 29 980 1 974 194 89 625
30-34 62 909 9 223 44 957 8 245 484 125 808
35-39 61 585 99 4 168 43 294 11 667 2 032 324 135 606
40-44 59 638 4 847 39 710 12 320 2 468 196 97 132 273
45-49 51 243 4 157 27 383 14 199 4 343 1 161 124 792

277
Table 19 (Continued) Unit: Person
Number of women aged 15-49 by children surviving Administrative unit/age group
of mother
Number of women aged 15-49 have
given the birth
0 child
1 child
2 children
3 children
4 children
5 children and over
Not stated
Number of children surviving
25. Phu Tho
Total 262 074 61 698 159 580 34 945 4 641 1 134 75 510 206
15-19 2 268 2 177 91 2 359
20-24 23 724 16 798 6 602 324 30 973
25-29 45 968 19 977 24 047 1 852 91 73 993
30-34 56 311 10 649 39 954 5 067 501 140 108 461
35-39 44 100 5 047 30 833 7 213 916 91 92 469
40-44 46 260 4 019 31 337 9 206 1 341 357 101 460
45-49 43 444 3 030 26 716 11 283 1 793 546 75 100 490
26. Vinh Phuc
Total 201 318 41 994 114 449 37 273 5 828 1 774 415 214
15-19 2 227 2 084 143 2 370
20-24 19 004 13 351 5 471 181 24 838
25-29 37 695 12 500 21 787 3 271 137 66 435
30-34 39 882 5 757 26 024 7 990 111 82 218
35-39 35 007 2 559 22 994 8 104 1 133 218 78 480
40-44 36 014 2 919 22 867 7 956 1 718 555 82 280
45-49 31 488 2 823 15 162 9 771 2 730 1 001 78 593
27. Bac Ninh
Total 219 668 123 43 787 118 042 48 490 7 987 1 239 464 073
15-19 1 288 1 244 44 1 332
20-24 22 726 14 559 7 680 487 31 380
25-29 42 619 123 15 419 22 068 4 875 135 74 720
30-34 46 158 5 561 28 705 10 796 1 097 99 744
35-39 39 304 2 496 22 958 11 361 2 341 147 92 597
40-44 35 486 2 415 20 937 10 169 1 673 292 83 099
45-49 32 086 2 094 15 650 10 802 2 742 799 81 202
30. Hai Duong
Total 309 674 119 67 829 194 641 41 436 5 270 251 128 604 008
15-19 1 124 1 124 1 124
20-24 20 353 15 152 4 987 213 25 766
25-29 50 765 24 601 24 323 1 841 78 770
30-34 59 761 10 974 43 069 5 462 256 114 522
35-39 55 383 3 778 39 900 9 992 1 713 120 404
40-44 65 992 6 066 45 120 12 659 1 894 125 128 142 485
45-49 56 297 119 6 134 37 241 11 270 1 408 126 120 937

278
Table 19 (Continued) Unit: Person
Number of women aged 15-49 by children surviving Administrative unit/age group
of mother
Number of women aged 15-49 have
given the birth
0 child
1 child
2 children
3 children
4 children
5 children and over
Not stated
Number of children surviving
31. Hai Phong
Total 345 513 87 89 665 214 248 37 439 3 672 402 647 174
15-19 1 302 1 218 84 1 385
20-24 24 199 18 809 5 210 180 29 768
25-29 58 684 29 032 28 225 1 427 89 763
30-34 77 863 16 913 53 796 6 818 335 146 300
35-39 61 374 9 383 44 093 7 389 509 121 772
40-44 66 419 87 7 601 48 117 9 788 745 80 136 580
45-49 55 673 6 708 34 723 11 837 2 083 321 121 605
33. Hung Yen
Total 210 681 45 39 742 126 519 38 572 4 658 1 063 81 432 697
15-19 1 521 1 364 156 1 677
20-24 19 255 45 12 860 6 350 25 560
25-29 36 057 12 540 20 967 2 550 62 123
30-34 39 230 4 870 27 146 6 456 757 81 561
35-39 37 577 2 785 24 028 10 036 645 83 84 112
40-44 41 886 2 524 27 359 10 136 1 507 360 95 559
45-49 35 156 2 798 20 513 9 395 1 748 621 81 82 106
34. Thai Binh
Total 300 764 411 58 689 187 859 46 454 6 776 574 604 261
15-19 1 114 1 114 1 114
20-24 14 652 136 10 131 4 385 18 902
25-29 40 225 139 17 899 19 895 2 292 64 565
30-34 57 372 11 811 36 589 8 549 422 112 326
35-39 61 360 6 398 42 403 10 700 1 788 71 130 883
40-44 67 678 136 7 743 44 152 12 908 2 487 253 146 205
45-49 58 363 3 595 40 434 12 005 2 078 251 130 267
35. Ha Nam
Total 136 803 30 192 75 674 25 674 4 688 574 280 243
15-19 1 119 1 066 53 1 172
20-24 10 561 7 647 2 800 113 13 587
25-29 22 197 8 583 11 812 1 751 51 37 666
30-34 28 169 4 542 17 756 5 304 567 58 233
35-39 25 620 2 883 15 880 5 761 1 045 51 56 362
40-44 27 492 2 573 15 679 7 213 1 809 218 63 895
45-49 21 645 2 898 11 694 5 532 1 216 305 49 329

279
Table 19 (Continued) Unit: Person
Number of women aged 15-49 by children surviving Administrative unit/age group
of mother
Number of women aged 15-49 have
given the birth
0 child
1 child
2 children
3 children
4 children
5 children and over
Not stated
Number of children surviving
36. Nam Dinh
Total 321 527 79 59 192 179 445 65 840 13 800 3 172 688 009
15-19 2 348 2 205 143 2 492
20-24 21 444 79 15 292 5 920 153 27 591
25-29 50 398 17 806 28 595 3 401 597 87 585
30-34 65 153 9 600 41 671 12 520 1 362 135 950
35-39 62 723 5 498 39 176 14 570 2 861 617 142 093
40-44 64 404 4 645 36 328 17 556 4 674 1 201 154 978
45-49 55 056 4 145 27 611 17 641 4 306 1 353 137 321
37. Ninh Binh
Total 165 572 147 34 364 92 301 30 599 6 530 1 631 345 333
15-19 1 039 1 039 1 039
20-24 11 266 73 8 440 2 680 73 14 020
25-29 29 064 12 345 14 670 2 050 47 833
30-34 33 736 4 827 22 442 5 721 747 69 860
35-39 30 518 74 2 469 18 106 8 379 1 489 69 775
40-44 29 947 2 661 18 286 6 137 1 918 944 70 186
45-49 30 002 2 583 16 117 8 239 2 376 687 72 620
38. Thanh Hoa
Total 653 942 650 166 868 355 966 108 569 18 320 3 570 1 296 500
15-19 6 136 5 915 220 6 356
20-24 61 068 423 46 936 13 255 454 74 809
25-29 104 098 52 814 46 130 4 998 156 160 692
30-34 124 830 25 261 83 141 15 552 876 241 704
35-39 118 855 14 405 77 972 22 397 3 930 151 254 013
40-44 127 964 227 13 267 79 920 28 539 5 380 631 283 831
45-49 110 991 8 269 55 328 36 628 7 978 2 789 275 095
40. Nghe An
Total 527 151 91 130 079 243 848 106 723 32 313 14 096 1 144 327
15-19 6 315 5 760 555 6 870
20-24 50 214 91 36 417 12 485 1 221 65 050
25-29 94 078 43 023 44 073 6 148 833 152 947
30-34 97 312 20 872 54 598 16 622 3 960 1 260 202 251
35-39 93 228 9 688 51 489 23 286 6 922 1 843 220 538
40-44 103 316 7 327 48 143 31 802 8 286 7 759 274 758
45-49 82 688 6 992 32 507 27 643 12 312 3 234 221 913

280
Table 19 (Continued) Unit: Person
Number of women aged 15-49 by children surviving Administrative unit/age group
of mother
Number of women aged 15-49 have
given the birth
0 child
1 child
2 children
3 children
4 children
5 children and over
Not stated
Number of children surviving
42. Ha Tinh
Total 203 652 320 42 460 84 412 52 433 18 472 5 555 472 155
15-19 359 359 359
20-24 14 730 11 408 3 323 18 053
25-29 31 630 15 706 14 113 1 811 49 366
30-34 37 370 227 6 925 21 676 7 184 1 173 184 77 442
35-39 38 417 2 437 16 875 14 171 4 091 844 99 521
40-44 42 006 2 834 17 284 14 005 5 831 2 054 114 050
45-49 39 139 93 2 792 11 141 15 262 7 378 2 473 113 363
44. Quang Binh
Total 148 160 171 30 431 63 724 34 373 13 465 5 996 347 552
15-19 926 890 36 962
20-24 10 204 55 7 957 1 927 265 12 606
25-29 20 765 60 10 103 9 130 1 261 161 50 33 039
30-34 27 763 5 197 16 550 4 830 1 019 167 57 698
35-39 31 897 57 2 684 15 724 9 241 3 240 952 79 786
40-44 28 856 1 774 11 707 9 675 4 029 1 672 79 608
45-49 27 749 1 827 8 650 9 102 5 015 3 155 83 853
45. Quang Tri
Total 106 572 42 20 591 43 187 24 811 11 617 6 324 262 311
15-19 1 145 1 080 65 1 210
20-24 6 379 4 625 1 603 151 8 285
25-29 14 546 7 089 5 930 1 189 169 171 24 127
30-34 18 492 42 3 576 10 139 3 170 1 101 464 40 264
35-39 23 448 1 429 10 900 7 079 2 538 1 500 62 722
40-44 23 148 1 574 8 485 7 179 4 070 1 840 66 635
45-49 19 414 1 217 6 065 6 043 3 740 2 349 59 068
46. Thua Thien Hue
Total 178 284 41 617 69 246 40 298 19 026 8 098 419 823
15-19 952 762 138 52 1 193
20-24 11 083 8 902 2 037 144 13 409
25-29 24 031 13 756 8 786 1 245 244 36 040
30-34 30 692 7 990 16 611 4 975 854 263 60 867
35-39 35 672 4 153 16 800 10 422 3 817 480 86 812
40-44 37 749 2 871 13 779 11 248 7 412 2 440 106 732
45-49 38 104 3 183 11 095 12 213 6 699 4 915 114 770

281
Table 19 (Continued) Unit: Person
Number of women aged 15-49 by children surviving Administrative unit/age group
of mother
Number of women aged 15-49 have
given the birth
0 child
1 child
2 children
3 children
4 children
5 children and over
Not stated
Number of children surviving
48. Da Nang
Total 177 628 55 570 90 154 25 950 4 609 1 346 339 046
15-19 1 269 1 219 50 1 417
20-24 10 100 8 802 1 157 89 51 11 590
25-29 26 986 17 868 8 471 595 51 36 801
30-34 35 559 12 262 20 262 2 652 384 62 276
35-39 33 954 6 219 20 939 5 643 950 202 69 838
40-44 34 116 4 972 20 732 7 077 837 497 73 556
45-49 35 645 4 227 18 593 9 894 2 285 646 83 568
49. Quang Nam
Total 249 982 192 63 358 111 289 54 260 15 406 5 478 540 252
15-19 2 286 2 034 252 2 538
20-24 18 419 192 13 219 4 641 367 23 602
25-29 39 086 20 644 15 582 2 649 210 60 597
30-34 42 122 10 796 23 908 5 452 1 484 482 83 316
35-39 45 140 5 039 23 998 12 549 3 061 494 105 512
40-44 50 105 5 573 21 466 16 513 5 045 1 509 127 004
45-49 52 823 6 052 21 441 16 730 5 607 2 992 137 683
51. Quang Ngai
Total 213 171 131 51 462 97 059 47 332 13 799 3 387 460 789
15-19 2 182 2 012 170 2 353
20-24 13 813 88 10 402 3 236 88 17 137
25-29 30 488 16 366 12 442 1 517 45 117 46 568
30-34 36 786 10 117 21 840 4 073 586 171 69 213
35-39 40 378 5 133 23 125 9 825 1 855 439 90 475
40-44 45 931 43 2 938 20 177 17 341 4 825 606 117 991
45-49 43 593 4 494 16 069 14 489 6 488 2 053 117 053
52. Binh Dinh
Total 267 575 219 59 097 129 138 59 877 15 174 4 070 578 904
15-19 1 190 946 244 1 433
20-24 13 257 10 580 2 614 64 16 064
25-29 29 935 109 16 846 11 711 1 207 62 44 137
30-34 53 029 111 12 981 31 311 7 473 1 154 102 637
35-39 57 827 7 158 33 465 15 051 1 836 317 128 171
40-44 58 241 5 017 28 401 18 918 4 700 1 205 143 747
45-49 54 096 5 569 21 393 17 228 7 358 2 547 142 715

282
Table 19 (Continued) Unit: Person
Number of women aged 15-49 by children surviving Administrative unit/age group
of mother
Number of women aged 15-49 have
given the birth
0 child
1 child
2 children
3 children
4 children
5 children and over
Not stated
Number of children surviving
54. Phu Yen
Total 167 302 65 40 040 85 867 30 969 7 700 2 661 349 750
15-19 1 498 1 400 98 1 595
20-24 12 273 8 656 3 461 156 16 046
25-29 23 045 11 628 9 726 1 565 126 36 278
30-34 31 760 65 7 339 19 253 4 714 389 61 541
35-39 36 622 4 456 23 641 7 488 875 161 78 568
40-44 33 303 3 159 17 633 9 126 2 688 697 80 294
45-49 28 802 3 402 12 056 7 920 3 621 1 803 75 426
56. Khanh Hoa
Total 209 524 161 61 459 96 293 35 337 11 342 4 931 432 833
15-19 2 329 2 110 219 2 548
20-24 12 957 9 695 3 179 84 16 303
25-29 28 740 56 17 239 9 914 1 531 41 661
30-34 36 340 52 12 372 17 731 5 054 996 135 67 653
35-39 40 051 8 333 22 212 6 357 1 622 1 528 86 696
40-44 46 101 6 773 23 129 10 769 4 129 1 301 109 315
45-49 43 006 53 4 938 19 907 11 544 4 596 1 967 108 657
58. Ninh Thuan
Total 107 717 112 26 535 44 302 20 219 9 562 6 987 253 906
15-19 2 000 45 1 755 200 2 154
20-24 8 451 6 147 2 236 69 10 824
25-29 14 745 7 047 6 459 975 132 131 24 075
30-34 19 169 45 5 307 9 487 3 203 843 284 38 899
35-39 21 163 2 783 10 636 5 168 1 750 826 51 263
40-44 21 073 2 069 9 094 5 685 2 274 1 951 57 421
45-49 21 117 22 1 426 6 190 5 119 4 564 3 795 69 270
60. Binh Thuan
Total 222 425 230 56 728 90 061 48 919 18 070 8 417 501 096
15-19 2 840 93 2 747 2 747
20-24 15 304 12 349 2 676 279 18 539
25-29 29 487 45 15 002 12 169 2 039 231 46 384
30-34 44 175 91 11 883 22 406 8 357 1 303 135 87 747
35-39 43 416 5 289 22 748 11 389 2 949 1 042 102 048
40-44 45 930 4 845 17 833 14 579 6 345 2 328 122 014
45-49 41 272 4 613 12 229 12 275 7 242 4 912 121 618

283
Table 19 (Continued) Unit: Person
Number of women aged 15-49 by children surviving Administrative unit/age group
of mother
Number of women aged 15-49 have
given the birth
0 child
1 child
2 children
3 children
4 children
5 children and over
Not stated
Number of children surviving
62. Kon Tum
Total 87 020 151 19 833 37 854 14 775 6 098 8 309 217 738
15-19 1 929 35 1 724 139 30 2 093
20-24 9 757 31 6 471 2 946 272 37 13 327
25-29 15 861 5 920 7 332 1 941 546 122 29 200
30-34 17 541 2 811 9 441 2 819 1 567 902 41 709
35-39 16 226 18 1 178 7 984 3 739 1 294 2 014 45 633
40-44 13 633 48 1 096 5 947 3 023 1 227 2 293 42 451
45-49 12 072 19 631 4 065 2 951 1 428 2 978 43 325
64. Gia Lai
Total 266 636 1 049 61 608 107 341 56 149 24 744 15 746 633 756
15-19 7 513 235 7 053 226 7 504
20-24 30 783 233 20 510 9 228 812 41 401
25-29 44 976 224 17 690 20 777 5 510 775 78 874
30-34 54 503 184 8 686 27 106 12 376 4 371 1 779 126 786
35-39 51 777 172 3 367 22 744 14 766 6 612 4 116 142 288
40-44 42 270 2 660 16 817 12 607 6 018 4 169 122 454
45-49 34 813 1 643 10 444 10 078 6 967 5 681 114 447
66. Dak Lak
Total 340 222 69 73 874 148 569 76 529 28 023 13 159 787 060
15-19 3 573 3 269 237 68 3 946
20-24 29 411 22 814 6 535 63 36 071
25-29 47 699 69 20 395 22 698 4 179 238 120 79 881
30-34 69 065 13 945 37 778 13 223 3 265 854 146 502
35-39 69 429 5 604 35 875 19 854 6 628 1 468 171 833
40-44 61 026 3 628 26 335 20 183 6 630 4 250 167 387
45-49 60 019 4 220 19 112 18 959 11 262 6 466 181 442
67. Dak Nong
Total 111 796 108 21 524 48 310 26 390 9 526 5 936 268 920
15-19 1 437 1 200 198 39 1 751
20-24 9 347 37 5 609 3 112 589 13 601
25-29 18 719 36 6 700 9 493 1 893 389 209 33 962
30-34 24 918 3 920 12 419 6 122 1 644 812 58 107
35-39 21 796 35 1 695 10 723 6 033 2 076 1 235 56 296
40-44 19 403 1 283 7 701 6 368 2 291 1 760 54 983
45-49 16 175 1 117 4 663 5 386 3 086 1 921 50 221

284
Table 19 (Continued) Unit: Person
Number of women aged 15-49 by children surviving Administrative unit/age group
of mother
Number of women aged 15-49 have
given the birth
0 child
1 child
2 children
3 children
4 children
5 children and over
Not stated
Number of children surviving
68. Lam Dong
Total 226 263 151 50 353 107 021 45 423 14 342 8 972 510 593
15-19 2 407 2 356 51 2 458
20-24 16 406 52 11 911 4 144 299 21 097
25-29 34 908 15 181 16 158 3 211 358 58 561
30-34 42 826 9 154 23 627 7 636 2 009 401 89 355
35-39 45 538 4 851 25 901 11 245 2 852 689 105 842
40-44 43 613 99 3 635 20 418 11 945 4 245 3 272 115 946
45-49 40 564 3 265 16 721 11 088 4 880 4 610 117 334
70. Binh Phuoc
Total 181 960 176 46 294 87 675 34 586 10 642 2 586 381 993
15-19 2 202 2 078 123 2 325
20-24 14 805 11 419 3 089 237 60 18 547
25-29 28 104 58 13 069 13 177 1 625 174 44 997
30-34 35 294 59 8 219 21 326 4 946 685 58 68 799
35-39 37 317 5 428 20 069 8 722 2 600 497 84 620
40-44 34 366 3 419 17 050 9 196 3 644 1 057 85 526
45-49 29 872 59 2 662 12 840 9 860 3 478 974 77 179
72. Tay Ninh
Total 211 361 218 71 121 109 613 25 291 3 713 1 406 388 559
15-19 2 146 2 015 131 2 277
20-24 14 845 69 11 656 2 913 207 18 103
25-29 35 718 51 19 653 14 484 1 454 76 53 286
30-34 43 550 15 279 24 013 3 611 527 120 76 847
35-39 39 799 8 834 25 156 5 527 282 76 855
40-44 36 029 6 538 23 615 4 781 896 197 72 685
45-49 39 275 98 7 146 19 301 9 710 1 932 1 088 88 506
74. Binh Duong Total 398 733 593 173 074 180 746 37 006 5 675 1 640 677 096
15-19 3 824 3 824 3 824
20-24 32 082 53 26 947 4 617 464 37 576
25-29 83 488 322 55 037 26 484 1 334 312 113 252
30-34 96 913 43 753 47 851 4 847 461 155 843
35-39 74 395 218 19 615 44 040 8 411 1 207 903 142 272
40-44 60 659 12 938 33 402 12 695 1 198 426 125 202
45-49 47 373 10 959 24 351 9 254 2 497 311 99 127

285
Table 19 (Continued) Unit: Person
Number of women aged 15-49 by children surviving Administrative unit/age group
of mother
Number of women aged 15-49 have
given the birth
0 child
1 child
2 children
3 children
4 children
5 children and over
Not stated
Number of children surviving
75. Dong Nai
Total 517 904 565 160 857 237 296 84 873 24 738 9 575 1 042 485
15-19 3 897 3 249 647 4 544
20-24 30 601 25 102 5 034 465 36 565
25-29 80 834 226 48 139 29 365 2 886 217 116 613
30-34 113 084 114 38 840 57 186 13 737 2 868 339 207 590
35-39 102 093 224 19 191 57 667 20 781 3 821 410 214 197
40-44 97 111 13 936 49 306 24 314 7 150 2 404 227 308
45-49 90 284 12 399 38 091 22 690 10 900 6 205 235 669
77. Ba Ria - Vung Tau
Total 193 377 98 58 181 93 654 29 134 8 833 3 477 386 631
15-19 967 967 967
20-24 8 279 7 042 1 237 9 517
25-29 29 409 17 325 10 625 1 361 98 43 050
30-34 40 861 14 498 22 761 3 121 382 99 71 407
35-39 38 655 6 288 22 793 7 616 1 577 381 82 935
40-44 39 442 49 7 141 20 295 8 574 2 511 872 88 494
45-49 35 763 49 4 919 15 943 8 462 4 265 2 125 90 261
79. Ho Chi Minh City
Total 1 371 491 646 608 638 640 145 102 385 16 258 3 418 2 279 181
15-19 6 819 6 181 639 7 458
20-24 61 662 52 266 8 457 939 71 998
25-29 188 915 127 890 56 957 3 434 636 254 646
30-34 316 502 646 172 402 130 122 13 043 290 472 934
35-39 292 316 107 815 157 559 22 226 2 814 1 902 510 709
40-44 264 200 79 969 150 613 29 527 3 620 471 486 610
45-49 241 076 62 117 135 798 33 217 8 899 1 045 474 826
80. Long An
Total 279 392 54 95 994 146 821 29 534 5 410 1 580 508 391
15-19 1 262 1 062 199 1 461
20-24 18 519 15 592 2 721 206 21 653
25-29 40 053 23 073 15 989 909 83 58 108
30-34 54 772 20 901 29 999 3 051 768 54 93 391
35-39 57 752 14 366 37 138 5 445 607 198 108 390
40-44 53 523 10 870 33 316 8 007 1 031 299 107 653
45-49 53 511 54 10 130 27 460 11 916 2 921 1 030 117 734

286
Table 19 (Continued) Unit: Person
Number of women aged 15-49 by children surviving Administrative unit/age group
of mother
Number of women aged 15-49 have
given the birth
0 child
1 child
2 children
3 children
4 children
5 children and over
Not stated
Number of children surviving
82. Tien Giang
Total 325 099 310 116 739 163 945 36 670 6 348 1 086 585 530
15-19 2 244 2 136 108 2 352
20-24 22 211 18 584 3 388 238 26 075
25-29 47 214 28 999 16 803 1 412 66 840
30-34 64 117 24 465 34 961 4 201 490 108 950
35-39 63 097 62 17 214 38 723 6 304 682 112 116 859
40-44 63 475 72 15 283 36 500 9 652 1 554 413 125 587
45-49 62 742 175 10 059 33 461 14 863 3 623 561 138 867
83. Ben Tre
Total 232 192 90 91 666 114 130 20 640 4 576 1 090 405 764
15-19 1 802 1 718 85 1 887
20-24 12 196 10 488 1 623 85 13 989
25-29 30 341 18 635 11 008 615 83 42 826
30-34 41 608 20 077 19 188 2 170 171 65 651
35-39 49 724 90 16 428 28 705 3 886 616 87 957
40-44 46 523 12 958 27 083 5 137 865 481 88 396
45-49 49 999 11 362 26 439 8 747 2 842 609 105 057
84. Tra Vinh
Total 188 030 69 68 323 93 507 20 404 4 078 1 648 341 856
15-19 1 380 1 380 1 380
20-24 12 376 10 500 1 738 139 14 392
25-29 29 266 18 261 9 903 1 033 69 41 442
30-34 37 725 69 14 525 20 479 2 270 382 63 821
35-39 37 534 10 105 22 539 4 163 615 112 70 730
40-44 33 064 6 069 20 177 5 068 1 296 454 69 364
45-49 36 685 7 483 18 671 7 731 1 716 1 083 80 726
86. Vinh Long
Total 188 550 335 71 470 96 879 16 449 2 591 825 329 327
15-19 1 365 1 009 356 1 721
20-24 9 968 149 7 546 2 059 214 12 307
25-29 26 139 75 15 897 9 487 680 36 909
30-34 39 099 17 994 19 068 1 955 41 41 62 448
35-39 37 492 71 11 361 23 060 2 632 326 42 66 890
40-44 36 939 40 8 754 23 068 3 935 815 326 71 623
45-49 37 548 8 909 19 781 7 033 1 408 416 77 428

287
Table 19 (Continued) Unit: Person
Number of women aged 15-49 by children surviving Administrative unit/age group
of mother
Number of women aged 15-49 have
given the birth
0 child
1 child
2 children
3 children
4 children
5 children and over
Not stated
Number of children surviving
87. Dong Thap
Total 314 257 387 110 435 157 912 38 168 6 139 1 216 571 719
15-19 3 106 2 988 118 3 223
20-24 21 158 108 17 299 3 548 203 25 004
25-29 46 347 58 28 928 16 248 844 268 65 029
30-34 61 381 110 23 081 32 295 5 670 226 105 583
35-39 62 290 14 237 40 295 7 083 565 111 118 890
40-44 63 081 111 14 018 36 544 10 693 1 618 98 126 145
45-49 56 894 9 884 28 865 13 676 3 462 1 007 127 845
89. An Giang
Total 393 382 690 148 894 178 309 50 285 11 733 3 472 721 802
15-19 4 927 4 772 155 5 081
20-24 28 902 22 520 6 227 155 35 439
25-29 63 857 84 38 604 21 146 3 872 151 93 418
30-34 73 442 28 961 34 968 8 415 857 241 128 775
35-39 78 119 159 21 411 44 392 9 638 2 035 484 149 763
40-44 76 544 159 18 494 39 664 13 644 3 477 1 105 158 925
45-49 67 591 288 14 132 31 757 14 561 5 364 1 491 150 401
91. Kien Giang Total 322 040 348 94 775 156 134 52 027 13 987 4 769 645 798
15-19 3 728 110 3 303 314 3 932
20-24 25 870 109 18 517 6 716 528 33 532
25-29 50 928 25 379 22 593 2 516 440 79 872
30-34 65 546 19 251 35 670 9 261 1 363 123 829
35-39 64 972 12 817 37 176 12 026 2 536 416 135 592
40-44 58 791 128 8 425 30 811 14 308 3 849 1 270 135 628
45-49 52 206 7 082 22 854 13 388 5 800 3 082 133 414
92. Can Tho
Total 220 639 392 82 588 104 799 27 816 3 194 1 851 398 200
15-19 2 042 1 924 118 2 160
20-24 16 494 13 263 3 067 107 57 20 001
25-29 34 686 164 19 198 13 858 1 325 83 58 51 510
30-34 38 529 60 16 182 19 471 2 486 169 161 64 120
35-39 44 928 109 11 672 25 604 6 720 494 329 86 771
40-44 44 599 59 10 523 24 098 8 668 862 390 90 165
45-49 39 361 9 827 18 583 8 510 1 586 856 83 473

288
Table 19 (Continued) Unit: Person
Number of women aged 15-49 by children surviving Administrative unit/age group
of mother
Number of women aged 15-49 have
given the birth
0 child
1 child
2 children
3 children
4 children
5 children and over
Not stated
Number of children surviving
93. Hau Giang
Total 135 932 29 44 973 69 268 16 641 3 822 1 200 255 142
15-19 1 347 29 1 318 1 318
20-24 9 064 6 886 2 149 30 11 272
25-29 21 769 12 040 9 160 475 92 32 157
30-34 25 688 9 425 14 100 1 866 297 44 411
35-39 27 201 6 332 16 722 3 652 354 141 52 850
40-44 25 766 5 019 14 695 4 870 1 010 171 54 012
45-49 25 098 3 952 12 441 5 749 2 069 887 59 121
94. Soc Trang
Total 224 494 388 74 233 105 635 31 463 8 779 3 996 436 554
15-19 2 777 76 2 502 199 2 900
20-24 17 241 80 13 328 3 413 421 21 416
25-29 34 635 78 19 691 13 467 1 214 122 63 51 067
30-34 42 677 15 280 21 277 4 844 843 433 77 978
35-39 46 580 77 9 713 28 438 6 269 1 747 336 94 336
40-44 42 252 76 9 004 21 590 8 215 2 103 1 263 91 944
45-49 38 333 4 715 17 252 10 501 3 964 1 902 96 913
95. Bac Lieu
Total 152 208 222 45 569 76 252 21 890 6 612 1 663 299 168
15-19 1 446 57 1 389 1 389
20-24 11 626 9 217 2 320 89 14 124
25-29 23 754 109 11 951 10 558 1 048 30 58 36 618
30-34 31 197 9 910 16 670 3 449 997 171 58 496
35-39 31 443 56 4 524 20 466 4 840 1 344 214 66 454
40-44 28 215 4 771 15 545 6 269 1 259 372 61 846
45-49 24 526 3 806 10 692 6 196 2 983 849 60 240
96. Ca Mau
Total 223 383 170 70 609 108 087 33 356 8 483 2 678 434 737
15-19 3 189 3 032 157 3 347
20-24 18 270 13 438 4 787 45 23 147
25-29 37 202 19 516 15 812 1 718 156 56 918
30-34 45 059 75 15 109 24 006 5 067 802 81 531
35-39 45 354 8 305 28 065 7 464 1 235 285 93 193
40-44 40 019 95 5 946 21 203 9 627 2 548 599 90 500
45-49 34 290 5 264 14 056 9 434 3 742 1 794 86 102

289
Table 20
NUMBER OF WOMEN AGED 15-49 HAVING THIRD AND HIGHER ORDER BIRTHS IN 12 MONTHS PRIOR TO THE SURVEY BY URBAN/RURAL RESIDENCE,
SOCIO-ECONOMIC REGION AND PROVINCE/CITY, 1/4/2015 Unit: Person
Total females aged 15-49 have given the birth in 12 months
prior to the survey
Total females aged 15-49 having third and higher order births
in 12 months prior to the surveyCod
e
Administrative unit
Total Urban Rural Total Urban Rural
ENTIRE COUNTRY 1 433 827 436 815 997 012 226 930 47 032 179 897
Socio-economic regions
R1 Northern Midlands and Mountains
238 684 38 583 200 101 36 085 2 799 33 286
R2 Red River Delta 327 106 100 209 226 897 58 694 13 292 45 402
R3 North and South Central Coast 320 277 82 441 237 837 61 881 12 006 49 875
R4 Central Highlands 93 622 21 815 71 807 22 899 3 265 19 633
R5 Southeast 234 331 139 442 94 890 24 670 11 280 13 390
R6 Mekong River Delta 219 805 54 325 165 480 22 701 4 390 18 311
Provinces/cities
01 Ha Noi 111 948 46 840 65 109 19 759 6 335 13 423
02 Ha Giang 18 346 2 353 15 994 4 987 268 4 719
04 Cao Bang 9 877 2 231 7 646 1 110 65 1 045
06 Bac Kan 5 664 972 4 692 414 72 342
08 Tuyen Quang 14 961 1 665 13 296 1 783 80 1 703
10 Lao Cai 12 175 2 874 9 301 1 776 185 1 591
11 Dien Bien 12 438 1 444 10 995 3 642 114 3 528
12 Lai Chau 10 413 1 605 8 808 2 744 168 2 576
14 Son La 27 079 3 115 23 964 5 305 365 4 940
15 Yen Bai 16 090 2 752 13 338 2 383 143 2 239
17 Hoa Binh 16 817 1 630 15 187 1 541 122 1 419
19 Thai Nguyen 21 799 7 304 14 495 2 177 482 1 695
20 Lang Son 13 813 2 853 10 960 1 034 228 806
22 Quang Ninh 17 940 10 340 7 600 2 207 895 1 312
24 Bac Giang 33 886 2 780 31 106 4 124 183 3 941
25 Phu Tho 25 326 5 006 20 320 3 067 325 2 741
26 Vinh Phuc 18 148 4 303 13 845 2 426 479 1 947
27 Bac Ninh 24 606 6 786 17 820 6 122 1 203 4 919
30 Hai Duong 25 003 4 322 20 681 3 793 851 2 942
31 Hai Phong 29 077 13 586 15 491 2 870 1 490 1 380
33 Hung Yen 19 092 2 282 16 809 2 659 227 2 432
34 Thai Binh 23 295 2 501 20 795 6 019 519 5 500
35 Ha Nam 11 926 1 522 10 404 2 842 279 2 563
36 Nam Dinh 29 899 4 307 25 591 6 945 670 6 275
37 Ninh Binh 16 172 3 419 12 753 3 053 344 2 709
38 Thanh Hoa 64 194 10 366 53 827 8 340 454 7 886

290
Table 20 (Continued) Unit: Person
Total females aged 15-49 have given the birth in 12 months prior
to the survey
Total females aged 15-49 having third and higher order births
in 12 months prior to the surveyCod
e
Administrative unit
Total Urban Rural Total Urban Rural
40 Nghe An 61 609 8 573 53 036 14 229 1 469 12 760
42 Ha Tinh 20 329 3 542 16 787 4 871 948 3 923
44 Quang Binh 14 915 2 862 12 053 4 149 546 3 603
45 Quang Tri 11 043 3 608 7 435 2 851 723 2 128
46 Thua Thien Hue 17 469 8 294 9 176 4 362 2 006 2 357
48 Da Nang 17 343 14 755 2 587 2 187 1 723 463
49 Quang Nam 22 428 4 034 18 394 4 436 504 3 932
51 Quang Ngai 16 369 2 889 13 480 2 790 318 2 472
52 Binh Dinh 20 135 5 958 14 177 4 445 1 030 3 415
54 Phu Yen 12 383 2 784 9 599 1 852 428 1 424
56 Khanh Hoa 15 976 5 623 10 353 1 972 423 1 548
58 Ninh Thuan 9 624 3 229 6 396 1 856 228 1 629
60 Binh Thuan 16 460 5 924 10 536 3 542 1 207 2 335
62 Kon Tum 9 374 2 528 6 846 2 534 198 2 336
64 Gia Lai 26 379 6 251 20 128 7 196 1 114 6 082
66 Dak Lak 30 055 5 663 24 391 6 323 961 5 362
67 Dak Nong 9 994 1 561 8 433 3 532 230 3 302
68 Lam Dong 17 820 5 812 12 009 3 313 763 2 551
70 Binh Phuoc 14 392 2 736 11 655 2 219 364 1 855
72 Tay Ninh 16 227 2 930 13 298 1 359 258 1 101
74 Binh Duong 34 691 26 287 8 404 4 120 2 845 1 275
75 Dong Nai 49 577 16 377 33 200 7 385 1 745 5 640
77 Ba Ria - Vung Tau 12 941 6 563 6 378 2 354 806 1 547
79 Ho Chi Minh City 106 503 84 548 21 955 7 233 5 262 1 971
80 Long An 17 578 2 894 14 685 1 344 227 1 117
82 Tien Giang 19 723 2 968 16 755 1 457 1 457
83 Ben Tre 15 044 1 139 13 905 1 402 48 1 354
84 Tra Vinh 14 584 2 476 12 107 1 208 77 1 131
86 Vinh Long 11 565 1 654 9 911 1 050 124 926
87 Dong Thap 20 149 2 884 17 265 2 403 228 2 176
89 An Giang 25 936 7 099 18 837 3 437 840 2 597
91 Kien Giang 25 266 6 357 18 909 3 158 671 2 487
92 Can Tho 17 237 11 779 5 458 1 773 999 773
93 Hau Giang 9 082 2 241 6 841 963 209 755
94 Soc Trang 16 440 6 997 9 443 1 845 597 1 248
95 Bac Lieu 11 001 2 502 8 499 1 320 185 1 134
96 Ca Mau 16 199 3 334 12 865 1 341 184 1 156

291
Table 21
PROPORTION OF DEATHS IN 12 MONTHS PRIOR TO THE SURVEY BY CAUSES OF DEATH, SOCIO-ECONOMIC REGION AND PROVINCE/CITY,
1/4/2015
Unit: Percentage
Cause of death
Cod
e
Administrative unit Total Diseases
Accident at work
Traffic accident
Other accident
Suicide Others
ENTIRE COUNTRY 100.0 83.8 1.0 4.1 1.9 1.3 7.9
Socio-economic regions
R1 Northern Midlands and Mountains 100.0 83.0 0.9 4.6 2.8 1.8 7.0
R2 Red River Delta 100.0 83.7 0.8 3.3 1.2 1.1 9.9
R3 North and South Central Coast 100.0 81.8 1.3 4.0 2.1 1.7 9.1
R4 Central Highlands 100.0 78.8 3.6 5.1 4.7 1.2 6.5
R5 Southeast 100.0 80.6 0.3 5.9 0.8 0.8 11.6
R6 Mekong River Delta 100.0 90.3 1.0 3.5 1.8 1.0 2.5
Provinces/cities
01 Ha Noi 100.0 82.2 0.0 4.5 0.0 2.2 11.1
02 Ha Giang 100.0 80.9 2.5 4.2 2.0 3.3 7.2
04 Cao Bang 100.0 88.1 0.8 0.6 4.3 4.6 1.6
06 Bac Kan 100.0 89.6 2.0 1.1 1.1 0.8 5.4
08 Tuyen Quang 100.0 90.3 0.0 2.8 4.1 0.0 2.7
10 Lao Cai 100.0 81.2 0.0 4.6 0.0 3.2 11.1
11 Dien Bien 100.0 80.4 4.5 5.2 1.6 4.9 3.4
12 Lai Chau 100.0 86.4 0.0 5.8 2.7 4.1 1.0
14 Son La 100.0 81.7 0.0 3.7 3.9 3.1 7.7
15 Yen Bai 100.0 87.0 0.0 1.5 1.3 1.4 8.7
17 Hoa Binh 100.0 84.2 3.2 1.0 2.2 1.5 7.9
19 Thai Nguyen 100.0 82.7 0.0 4.0 5.5 0.0 7.8
20 Lang Son 100.0 83.7 0.0 4.9 3.7 3.8 3.9
22 Quang Ninh 100.0 77.2 3.9 3.9 2.2 1.2 11.6
24 Bac Giang 100.0 83.2 0.0 5.1 3.9 0.0 7.8
25 Phu Tho 100.0 73.7 1.3 12.5 0.0 0.0 12.5
26 Vinh Phuc 100.0 94.3 1.9 3.8 0.0 0.0 0.0
27 Bac Ninh 100.0 86.3 1.1 6.8 3.8 0.0 2.0
30 Hai Duong 100.0 81.6 1.5 2.6 0.8 0.0 13.4
31 Hai Phong 100.0 93.4 0.0 1.2 1.1 1.1 3.1
33 Hung Yen 100.0 81.9 0.0 1.8 1.7 0.0 14.6
34 Thai Binh 100.0 74.8 0.0 2.5 3.2 0.7 18.8
35 Ha Nam 100.0 76.7 3.4 1.2 1.7 1.9 15.0
36 Nam Dinh 100.0 88.6 2.0 2.8 1.0 0.0 5.7
37 Ninh Binh 100.0 90.3 0.0 1.0 1.8 1.6 5.4
38 Thanh Hoa 100.0 71.8 0.0 1.9 2.3 2.5 21.4

292
Table 21 (Continued) Unit: Percentage
Cause of death
Cod
e
Administrative unit Total Diseases
Accident at work
Traffic accident
Other accident
Suicide Others
40 Nghe An 100.0 69.5 2.8 7.1 2.8 2.8 14.9
42 Ha Tinh 100.0 93.6 0.0 1.7 0.0 1.6 3.2
44 Quang Binh 100.0 90.3 0.0 5.5 0.0 2.0 2.2
45 Quang Tri 100.0 86.4 1.8 6.3 0.9 4.6 0.0
46 Thua Thien Hue 100.0 88.4 1.8 5.0 3.4 0.0 1.5
48 Da Nang 100.0 95.7 0.0 1.4 0.0 0.0 2.9
49 Quang Nam 100.0 89.4 0.0 7.0 3.6 0.0 0.0
51 Quang Ngai 100.0 83.2 3.3 1.6 1.6 0.0 10.2
52 Binh Dinh 100.0 87.0 5.0 2.7 0.0 2.0 3.3
54 Phu Yen 100.0 88.8 1.6 4.5 1.6 0.0 3.4
56 Khanh Hoa 100.0 90.3 0.0 3.2 5.4 0.0 1.1
58 Ninh Thuan 100.0 76.9 5.0 9.0 3.1 3.1 3.0
60 Binh Thuan 100.0 93.3 0.0 2.9 2.0 1.8 0.0
62 Kon Tum 100.0 72.7 0.0 13.2 2.1 2.0 9.9
64 Gia Lai 100.0 75.6 3.0 2.6 7.2 0.0 11.6
66 Dak Lak 100.0 87.2 2.3 4.7 3.5 2.3 0.0
67 Dak Nong 100.0 73.6 2.4 4.1 8.0 2.6 9.3
68 Lam Dong 100.0 76.0 8.5 6.6 2.8 0.8 5.3
70 Binh Phuoc 100.0 82.5 1.1 3.3 5.0 1.7 6.4
72 Tay Ninh 100.0 86.5 1.4 2.8 2.3 0.0 7.0
74 Binh Duong 100.0 90.4 0.0 7.3 1.1 0.0 1.2
75 Dong Nai 100.0 81.3 0.0 4.8 0.0 2.5 11.4
77 Ba Ria - Vung Tau 100.0 78.1 1.6 8.5 1.8 3.1 6.8
79 Ho Chi Minh City 100.0 77.1 0.0 6.9 0.0 0.0 16.0
80 Long An 100.0 83.6 0.0 6.9 3.4 1.4 4.8
82 Tien Giang 100.0 94.4 0.0 1.9 0.0 3.7 0.0
83 Ben Tre 100.0 92.7 1.3 2.6 0.0 1.3 2.0
84 Tra Vinh 100.0 91.5 1.5 0.0 2.5 0.0 4.6
86 Vinh Long 100.0 88.9 1.7 6.5 1.9 1.0 0.0
87 Dong Thap 100.0 87.2 0.9 6.5 1.5 0.8 3.2
89 An Giang 100.0 95.9 0.0 2.4 0.0 1.7 0.0
91 Kien Giang 100.0 93.0 2.5 1.6 1.5 0.0 1.4
92 Can Tho 100.0 93.3 0.0 1.2 2.2 0.0 3.4
93 Hau Giang 100.0 88.4 0.0 4.8 6.8 0.0 0.0
94 Soc Trang 100.0 78.3 2.1 8.2 6.0 1.7 3.7
95 Bac Lieu 100.0 85.4 0.0 3.3 0.0 0.0 11.3
96 Ca Mau 100.0 92.0 4.0 0.0 2.0 0.0 2.0

293
Table 22
POPULATION BY REGION THAT WAS PLACE OF USUAL RESIDENCE ON 1/4/2014 AND 1/4/2015 AND SEX
Unit: Person
Place of usual residence at 1/4/2014
Cod
e
Place of usual residence at 1/4/2015Population in-migrated by region
Northern Midlands and
Mountains
Red River Delta
North and South Central
Coast
Central Highlands
Southeast Mekong
River Delta
ENTIRE COUNTRY 341 425 34 855 38 074 86 343 18 721 49 143 114 288
R1 Northern Midlands and Mountains 13 328 9 999 1 906 175 1 216 31
R2 Red River Delta 37 900 22 184 11 118 891 2 896 811
R3 North and South Central Coast 51 929 5 256 15 105 4 913 25 555 1 100
R4 Central Highlands 12 691 531 1 802 5 970 3 806 582
R5 Southeast 205 910 4 943 10 676 66 205 12 321 111 764
R6 Mekong River Delta 19 667 1 941 492 1 144 421 15 670
MALE 161 044 12 635 18 439 40 634 7 923 27 431 53 983
R1 Northern Midlands and Mountains 5 445 3 956 605 145 709 31
R2 Red River Delta 13 726 7 822 3 456 390 1 813 245
R3 North and South Central Coast 27 684 2 119 7 707 2 536 14 792 530
R4 Central Highlands 5 849 287 797 2 627 1 996 142
R5 Southeast 98 272 1 788 5 571 33 164 4 713 53 035
R6 Mekong River Delta 10 068 619 408 782 139 8 121
FEMALE 180 381 22 219 19 635 45 708 10 800 21 714 60 305
R1 Northern Midlands and Mountains 7 883 6 043 1 301 31 507
R2 Red River Delta 24 174 14 361 7 662 501 1 084 566
R3 North and South Central Coast 24 245 3 137 7 398 2 377 10 764 570
R4 Central Highlands 6 842 244 1 005 3 342 1 810 440
R5 Southeast 107 638 3 155 5 105 33 041 7 608 58 729
R6 Mekong River Delta 9 599 1 322 84 362 283 7 549

294
Table 23
POPULATION BY PROVINCE/CITY THAT WAS PLACE OF USUAL RESIDENCE ON 1/4/2014 AND 1/4/2015
Unit: Person
Place of usual residence at 1/4/2014
Cod
e Place of usual residence at
1/4/2015
Number of in-
migrant Ha Noi
Ha Giang
Cao Bang
Bac Kan
Tuyen Quang
Lao Cai
Dien Bien
Lai Chau
Sơn La
Yen Bai
Hoa Binh
Thai Nguyen
Lang Son
Quang Ninh
Bac Giang
Phu Tho
Total of out-migrants 502 890 29 615 2 128 2 107 768 2 904 3 232 762 7 060 2 194 2 619 2 778 5 802 4 013 4 383 6 879 4 679
01 Ha Noi 33 646 368 1 067 544 524 259 454 1 052 678 557 541 1 387
02 Ha Giang 907 82 40 220 22 77 26 164
04 Cao Bang 2 063 447 23 127 32 29 732 54 31 83
06 Bac Kan 680 19 85 74 206 55 19 18
08 Tuyen Quang 1 083 98 100 50 120 99 144 53 99 128
10 Lao Cai 1 269 337 25 84 22 409 23 42 172
11 Dien Bien 1 113 322 30 211 15 15 50
12 Lai Chau 689 163 27 107 206 26 37 22
14 Son La 719 64 21 62 62 62
15 Yen Bai 1 774 165 51 53 201 51 136 99 82 82 275
17 Hoa Binh 1 462 511 24 106 240 52 25 77 57
19 Thai Nguyen 4 159 505 270 244 494 89 52 190 191 358 495 83
20 Lang Son 1 802 225 100 76 50 49 226 200
22 Quang Ninh 1 997 513 118 193 217
24 Bac Giang 5 029 1 118 95 162 96 197 66 99 967 426 195
25 Phu Tho 3 649 628 91 104 387 95 372 234 183 93 94
26 Vinh Phuc 2 981 759 149 75 305 75 39 38 185 641
27 Bac Ninh 18 371 4 082 575 492 345 206 346 391 663 2 860 278 3 111 399
30 Hai Duong 2 403 398 254 540 245
31 Hai Phong 5 601 530 331 164 178 201 84 86 1 403 175

295
Table 23 (Continued) Unit: Person
Place of usual residence at 1/4/2014
Cod
e Place of usual residence at
1/4/2015
Number of in-
migrant Ha Noi
Ha Giang
Cao Bang
Bac Kan
Tuyen Quang
Lao Cai
Dien Bien
Lai Chau
Sơn La
Yen Bai
Hoa Binh
Thai Nguyen
Lang Son
Quang Ninh
Bac Giang
Phu Tho
33 Hung Yen 4 087 906 121 133 249 435 322 282 82
34 Thai Binh 856 300 139
35 Ha Nam 2 115 782 52 105 35 52 52
36 Nam Dinh 1 195 239
37 Ninh Binh 5 254 1 849 37 70 216 37 73 145
38 Thanh Hoa 12 286 4 010 208 215 217
40 Nghe An 31 007 6 542 184 1 432 1 819 180 184
42 Ha Tinh 4 912 583 50 162 95 54
44 Quang Binh 2 775 92 35 127 54
45 Quang Tri 2 939 22 110
46 Thua Thien Hue 3 403 208 56
48 Da Nang 11 920 527 146 106 48
49 Quang Nam 3 684
51 Quang Ngai 1 841
52 Binh Dinh 3 426
54 Phu Yen 1 255 41
56 Khanh Hoa 1 927 212 84
58 Ninh Thuan 1 054
60 Binh Thuan 1 186
62 Kon Tum 1 910 74 30 19 49
64 Gia Lai 2 356 48
66 Dak Lak 4 581 64 123 122
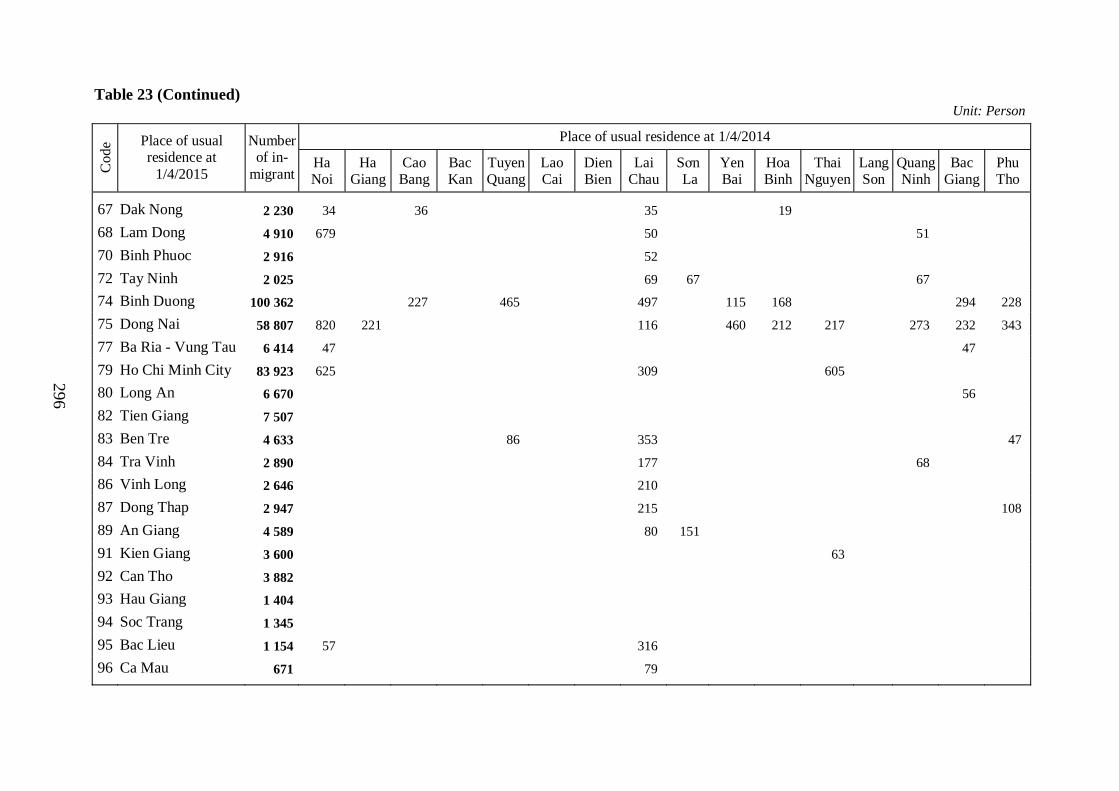
296
Table 23 (Continued) Unit: Person
Place of usual residence at 1/4/2014
Cod
e Place of usual residence at
1/4/2015
Number of in-
migrant Ha Noi
Ha Giang
Cao Bang
Bac Kan
Tuyen Quang
Lao Cai
Dien Bien
Lai Chau
Sơn La
Yen Bai
Hoa Binh
Thai Nguyen
Lang Son
Quang Ninh
Bac Giang
Phu Tho
67 Dak Nong 2 230 34 36 35 19
68 Lam Dong 4 910 679 50 51
70 Binh Phuoc 2 916 52
72 Tay Ninh 2 025 69 67 67
74 Binh Duong 100 362 227 465 497 115 168 294 228
75 Dong Nai 58 807 820 221 116 460 212 217 273 232 343
77 Ba Ria - Vung Tau 6 414 47 47
79 Ho Chi Minh City 83 923 625 309 605
80 Long An 6 670 56
82 Tien Giang 7 507
83 Ben Tre 4 633 86 353 47
84 Tra Vinh 2 890 177 68
86 Vinh Long 2 646 210
87 Dong Thap 2 947 215 108
89 An Giang 4 589 80 151
91 Kien Giang 3 600 63
92 Can Tho 3 882
93 Hau Giang 1 404
94 Soc Trang 1 345
95 Bac Lieu 1 154 57 316
96 Ca Mau 671 79

297
Table 23 (Continued) Unit: Person
Place of usual residence at 1/4/2014
Cod
e Place of usual residence at
1/4/2015 Vinh Phuc
Bac Ninh
Hai Duong
Hai Phong
Hung Yen
Thai Binh
Hà Nam
Nam Dinh
Ninh Binh
Thanh Hoa
Nghe An
Ha Tinh
Quang Binh
Quang Tri
Thua Thien Hue
Da Nang
Total of out-migrants 4 500 3 661 4 190 2 822 5 338 8 397 4 710 6 808 4 257 25 180 16 524 10 349 5 717 4 565 9 560 6 888
01 Ha Noi 2 280 2 241 1 130 919 2 736 3 273 3 031 2 163 752 4 898 797 799
02 Ha Giang 39 54 47 27
04 Cao Bang 82 63 53
06 Bac Kan 18 19 19 36 18 11 18 19
08 Tuyen Quang 49 49 23 22 47
10 Lao Cai 12 22 20 77
11 Dien Bien 97 153 105 15 101
12 Lai Chau 14 39 13
14 Son La 63 65 75 61 30
15 Yen Bai 178 51 78 51
17 Hoa Binh 105 162 26 24
19 Thai Nguyen 57 161 37 84 46 248 289 133
20 Lang Son 172 100 150 25 136 25 120 97
22 Quang Ninh 61 331 65 237 61 135 67
24 Bac Giang 370 208 292 192 99 96 95 193
25 Phu Tho 372 89 98 51 154 242
26 Vinh Phuc 187 76 149 76 102
27 Bac Ninh 104 442 836 292 76 91 995 456 90
30 Hai Duong 127 223 108
31 Hai Phong 185 187 927 608 542

298
Table 23 (Continued) Unit: Person
Place of usual residence at 1/4/2014
Cod
e Place of usual residence at
1/4/2015 Vinh Phuc
Bac Ninh
Hai Duong
Hai Phong
Hung Yen
Thai Binh
Hà Nam
Nam Dinh
Ninh Binh
Thanh Hoa
Nghe An
Ha Tinh
Quang Binh
Quang Tri
Thua Thien Hue
Da Nang
33 Hung Yen 126 286 294 76 254 151
34 Thai Binh 276
35 Ha Nam 71 52 55 144 104 180 225 51
36 Nam Dinh 155 271 152 73
37 Ninh Binh 110 75 38 111 67 563 490 143 73
38 Thanh Hoa 221 221 212 224 165 765 637
40 Nghe An 182 179 184 184 193 877 2 975 389 1 277
42 Ha Tinh 192 162 54 796 250 47 90 273
44 Quang Binh 34 92 114 701 522
45 Quang Tri 65 46 256 196 625 971
46 Thua Thien Hue 69 56 331 156 1 060 197
48 Da Nang 53 48 505 294 624 349 1 000 639
49 Quang Nam 124 94 1 069
51 Quang Ngai 86 422
52 Binh Dinh 326 218 110
54 Phu Yen 102
56 Khanh Hoa 51 259 49 90 263 54 53
58 Ninh Thuan 209
60 Binh Thuan 86 43 85
62 Kon Tum 18 91 19 206 192 39 30 17 37
64 Gia Lai 51 51 90 271 46
66 Dak Lak 128 130 65 250 121 445 318

299
Table 23 (Continued) Unit: Person
Place of usual residence at 1/4/2014
Cod
e Place of usual residence at
1/4/2015 Vinh Phuc
Bac Ninh
Hai Duong
Hai Phong
Hung Yen
Thai Binh
Hà Nam
Nam Dinh
Ninh Binh
Thanh Hoa
Nghe An
Ha Tinh
Quang Binh
Quang Tri
Thua Thien Hue
Da Nang
67 Dak Nong 74 51 17 158 51 132
68 Lam Dong 308 489 259 40 51
70 Binh Phuoc 44 98 176 78 117
72 Tay Ninh 68 68 131 133
74 Binh Duong 732 51 1 135 200 728 10 149 5 508 2 168 1 811 437 370
75 Dong Nai 122 357 248 1 048 1 468 1 623 4 697 1 361 1 554 342 760 460
77 Ba Ria - Vung Tau 297 187 100 345 326 158 97 51
79 Ho Chi Minh City 664 305 581 1 114 275 887 310 1 004 5 377 297
80 Long An
82 Tien Giang 134 111
83 Ben Tre
84 Tra Vinh 38 57 38
86 Vinh Long 75
87 Dong Thap 57
89 An Giang
91 Kien Giang 111
92 Can Tho 108
93 Hau Giang
94 Soc Trang
95 Bac Lieu 26
96 Ca Mau

300
Table 23 (Continued) Unit: Person
Place of usual residence at 1/4/2014
Cod
e Place of usual residence at
1/4/2015 Quang Nam
Quang Ngai
Binh Dinh
Phu Yen
Khanh Hoa
Ninh Thuan
Binh Thuan
Kon Tum
Gia Lai
Dak Lak
Dak Nong
Lam Dong
Binh Phuoc
Tay Ninh
Binh Duong
Dong Nai
Ba Ria - Vung
Tau
Total of out-migrants 9 319 3 816 5 058 8 283 5 888 3 156 3 725 933 3 151 8 350 2 856 6 728 3 384 4 707 19 363 17 988 5 649
01 Ha Noi 280 259
02 Ha Giang 82
04 Cao Bang 31 123 52 23
06 Bac Kan 12 37
08 Tuyen Quang
10 Lao Cai 25
11 Dien Bien
12 Lai Chau 13 22
14 Son La 124
15 Yen Bai 142 29
17 Hoa Binh 53
19 Thai Nguyen 57
20 Lang Son 51
22 Quang Ninh
24 Bac Giang 62
25 Phu Tho 94 178
26 Vinh Phuc
27 Bac Ninh 89 238 78 310 73
30 Hai Duong 252 256
31 Hai Phong

301
Table 23 (Continued) Unit: Person
Place of usual residence at 1/4/2014
Cod
e Place of usual residence at
1/4/2015 Quang Nam
Quang Ngai
Binh Dinh
Phu Yen
Khanh Hoa
Ninh Thuan
Binh Thuan
Kon Tum
Gia Lai
Dak Lak
Dak Nong
Lam Dong
Binh Phuoc
Tay Ninh
Binh Duong
Dong Nai
Ba Ria - Vung
Tau
33 Hung Yen 44 0 85
34 Thai Binh
35 Ha Nam 51
36 Nam Dinh 151
37 Ninh Binh 77 153 292 84
38 Thanh Hoa 436 2 819 452
40 Nghe An 108 187 184 185 369 186 4 585 2 809 934
42 Ha Tinh 92 85 93 279 727
44 Quang Binh 70 62 221 95 35 55 55 113
45 Quang Tri 44 42 43 65
46 Thua Thien Hue 488 56 56 53 69 124 56
48 Da Nang 4 769 562 551 49 98 433 604 53
49 Quang Nam 659 62 124 115 352 401
51 Quang Ngai 47 215 86 45 88 46
52 Binh Dinh 190 250 104 251 125 106
54 Phu Yen 117 292 59 58
56 Khanh Hoa 50 314 52 126
58 Ninh Thuan 89 217 45 23 23 70 23 90 112
60 Binh Thuan 332 43 46 461
62 Kon Tum 268 130 160 18 198 113 30 18
64 Gia Lai 429 104 138 184 87 192 49 48
66 Dak Lak 129 67 244 490 66 183 512

302
Table 23 (Continued) Unit: Person
Place of usual residence at 1/4/2014
Cod
e Place of usual residence at
1/4/2015 Quang Nam
Quang Ngai
Binh Dinh
Phu Yen
Khanh Hoa
Ninh Thuan
Binh Thuan
Kon Tum
Gia Lai
Dak Lak
Dak Nong
Lam Dong
Binh Phuoc
Tay Ninh
Binh Duong
Dong Nai
Ba Ria - Vung
Tau
67 Dak Nong 58 140 20 57 69 671 178 123 95 33 38
68 Lam Dong 198 299 141 143 89 625 203 48 148 303
70 Binh Phuoc 174 38 187 294 57 118
72 Tay Ninh 133 68
74 Binh Duong 527 456 1 537 2 718 662 1 291 455 227 228 1 571 1 381 608 728 6 558 1 373
75 Dong Nai 153 111 1 595 1 385 384 608 248 504 126 1 944 765 536 3 414 1 525
77 Ba Ria - Vung Tau 490 192 105 211 209 712
79 Ho Chi Minh City 2 822 626 1 488 2 222 1 565 900 1 902 303 1 818 912 2 138 839 2 719 3 668 5 659 407
80 Long An 102 207 104 54 54
82 Tien Giang 221 111 65 333
83 Ben Tre 48 257 53 83 220
84 Tra Vinh 145 77 199 137
86 Vinh Long 68 63 41 113
87 Dong Thap 107 402
89 An Giang 917
91 Kien Giang 66 257
92 Can Tho
93 Hau Giang 184 30
94 Soc Trang 78
95 Bac Lieu
96 Ca Mau 79

303
Table 23 (Continued) Unit: Person
Place of usual residence at 1/4/2014
Cod
e Place of usual residence at
1/4/2015 Ho Chi
Minh City Long An
Tien Giang
Ben Tre
Tra Vinh
Vinh Long
Dong Thap
An Giang
Kien Giang
Can Tho
Hau Giang
Soc Trang
Bac Lieu
Ca Mau
Total of out-migrants 46 590 9 691 9 172 9 329 5 700 8 073 15 286 25 378 17 415 9 643 4 665 8 123 6 686 9 399
01 Ha Noi 276 381
02 Ha Giang 26
04 Cao Bang 46 31
06 Bac Kan
08 Tuyen Quang
10 Lao Cai
11 Dien Bien
12 Lai Chau
14 Son La 30
15 Yen Bai 50
17 Hoa Binh
19 Thai Nguyen 76
20 Lang Son
22 Quang Ninh
24 Bac Giang
25 Phu Tho 90
26 Vinh Phuc 64 62
27 Bac Ninh 309 141
30 Hai Duong
31 Hai Phong

304
Table 23 (Continued) Unit: Person
Place of usual residence at 1/4/2014 Code
Place of usual residence at
1/4/2015 Ho Chi
Minh City Long An
Tien Giang
Bến Tre
Trà Vinh
Vinh Long
Dong Thap
An Giang
Kien Giang
Can Tho
Hau Giang
Soc Trang
Bac Lieu
Ca Mau
33 Hung Yen 239
34 Thai Binh 142
35 Ha Nam 104
36 Nam Dinh 155
37 Ninh Binh 324 228
38 Thanh Hoa 1 484
40 Nghe An 4 311 182 184
42 Ha Tinh 737 92
44 Quang Binh 296
45 Quang Tri 454
46 Thua Thien Hue 308 57
48 Da Nang 463
49 Quang Nam 393 289
51 Quang Ngai 719 88
52 Binh Dinh 1 640 106
54 Phu Yen 528 57
56 Khanh Hoa 270
58 Ninh Thuan 153
60 Binh Thuan 47 43
62 Kon Tum 155
64 Gia Lai 524 44
66 Dak Lak 988 133

305
Table 23 (Continued) Unit: Person
Place of usual residence at 1/4/2014
Code Place of usual residence at
1/4/2015
Ho Chi Minh City
Long An
Tien Giang
Ben Tre
Tra Vinh
Vinh Long
Dong Thap
An Giang
Kien Giang
Can Tho
Hau Giang
Soc Trang
Bac Lieu
Ca Mau
67 Dak Nong 126 16
68 Lam Dong 397 142 51 50 51 96
70 Binh Phuoc 283 39 452 213 116 178 119 84
72 Tay Ninh 613 68 51 133 133 68 155
74 Binh Duong 9 605 1 177 715 1 397 2 307 1 140 6 743 9 187 6 908 1 794 2 329 3 990 2 905 4 563
75 Dong Nai 7 085 1 092 637 1 548 1 244 1 582 2 340 4 564 2 448 1 013 326 955 1 423 2 317
77 Ba Ria - Vung Tau 1 113 95 298 151 237 287 418 94 98 47
79 Ho Chi Minh City 4 887 5 730 3 966 616 3 268 1 942 7 910 4 844 4 519 618 1 229 1 418 635
80 Long An 2 676 371 316 201 106 605 1 222 100 54 101 105 237
82 Tien Giang 1 736 1 697 753 221 402 668 223 653 66 111
83 Ben Tre 1 927 136 273 176 594 205 90 85
84 Tra Vinh 908 128 68 79 176 80 38 135 144 196
86 Vinh Long 240 70 188 199 41 876 77 68 41 159 59 59
87 Dong Thap 1 028 109 98 229 440 57 98
89 An Giang 1 248 84 166 631 883 429
91 Kien Giang 1 209 253 267 441 610 122 201
92 Can Tho 527 161 74 228 340 538 129 707 565 279 225
93 Hau Giang 282 175 637 96
94 Soc Trang 57 143 71 298 378 321
95 Bac Lieu 147 26 26 52 92 26 85 301
96 Ca Mau 42 90 132 133 43 72

306
Publishing responsibility: Director - Editor-in-chief MA. DO VAN CHIEN
Editor: NGOC LAN Prepress: MAI ANH - DUNG THANG Print correction: EDITORIAL BOARD
Print out 210 copies, size 20.5 29cm at Statistical Publishing House - New Science and Technology Printing Joint-stock Company - Address: 181 Lac Long Quan Street, Tay Ho district, Ha Noi. License of publish No: 3009-2016/CXBIPH/04-36/TK by the Authority of Publication, Printing and Distribution issued on 08/9/2016 Publishing decision No. 156/QD-NXBTK dated 31/10/2016 of Director - Editor-in-chief Finishing printing and submitting in October 2016.
The book is published at: STATISTICAL PUBLISHING HOUSE
Address: 86 Thuy Khue str., Tay Ho dis., Hanoi Tel.: (04) 38 471 483; Fax: (04) 38 474 185 Website: nxbthongke.com.vn Email: [email protected]